Embed Size (px)
Citation preview

John Keells Holdings PLC l Three months ended 30th June 2014Interim condensed financial statements
Integrated

“When the architect of the Waterfront Integrated Resort Cecil Balmond first visited the site, he visualised a property that represented the vigour of John Keells Holdings and the spirit of a new Sri Lanka. His first impression, on the left, transformed over the next few months into an iconic structure that stands majestic against the Colombo skyline, as shown in the artist’s impressions above.”
“For a growing major city and its main building project, an icon has to stamp a contemporary mark that projects to the future. The strong backdrop and cantilever forms of the Waterfront Integrated Resort provide that dynamic and powerful ambition, that JKH and Sri Lanka subscribe to.”
- Cecil Balmond
1 l John Keells Holdings PLC l www.keells.com Interim condensed financial statements l 1
Chairman’s Message Financial Information
Chairman’s Message
Dear Stakeholder, The Group profit before tax (PBT) for the first quarter of the financial year 2014/15 at Rs.3.06 billion was an increase of 39 per cent over the PBT of Rs.2.20 billion recorded in the corresponding period of the previous financial year. The profit attributable to the equity holders of the parent for the first quarter of the financial year 2014/15 at Rs.2.15 billion reflects a 35 per cent increase over the previous financial year.
The revenue for the first quarter of the financial year 2014/15 of Rs.21.28 billion was an increase of 7 per cent over the Rs.19.86 billion recorded during the same period last year.
The Company PBT for the first quarter of the financial year 2014/15 at Rs. 2.96 billion was an increase of 31 per cent over the PBT of Rs. 2.27 billion recorded during the same period last year.
Transportation The Transportation industry group PBT of Rs.529 million in the first quarter of 2014/15 was a decrease of 29 per cent over the first quarter of the previous financial year [2013/14 Q1: Rs. 748 million]. The decline in PBT is mainly attributed to the lower contribution from the bunkering business due to significant reductions in margins consequent to an increase in the number of active suppliers in Colombo. The Port business too experienced a reduction in volumes compared to the first quarter of the previous financial year, following the realignment of services as discussed in my previous messages. However, the volumes are expected to stabilize from here on. Both DHL Keells and Maersk Lanka witnessed an improved performance compared to the corresponding period of the last financial year due to growth in the active customer base and higher volumes.
Leisure The Leisure industry group PBT of Rs.659 million in the first quarter of 2014/15 was an increase of 43 per cent over the first quarter of the previous financial year [2013/14 Q1: Rs.461 million]. The Sri Lankan Resorts sector experienced an improvement in occupancies across all its properties, aided by the 24 per cent increase in tourist arrivals compared to the corresponding period in the previous financial year. The Maldivian Resorts sector witnessed an improved performance primarily due to achievement of higher average room rates. The Destination Management business had a breakthrough in the Chinese market by initiating a weekly charter which commenced in July.
PropertyThe Property industry group PBT of Rs.218 million in the first quarter of 2014/15 was an increase of 53 per cent over the first quarter of the previous financial year [2013/14 Q1: Rs.142 million]. The growth in PBT is mainly on account of the revenue recognition cycle of the “OnThree20” development. The demand for residential apartments, predominantly luxury condominiums, remained steady in the quarter under review, with both “7th Sense” on Gregory’s Road and “OnThree20” selling 80 per cent and 92 per cent of apartment units to-date respectively. The construction of the “Waterfront Project” is in progress with piling work commencing in the quarter under review. The pre-sales in both residential and commercial spaces have been encouraging.
Consumer Foods and RetailThe Consumer Foods and Retail industry group PBT of Rs.472 million in the first quarter of 2014/15 was an increase of 89 per cent over the first quarter of the previous financial year [2013/14 Q1: Rs.249 million]. Both the frozen confectionery and the beverage businesses recorded encouraging results compared to the corresponding period of the previous financial year. The improved performance was mainly attributed to increased volumes on account of positive consumer sentiment and the evolving product offerings. Keells Food Products witnessed an increase in volumes and profitability and the overall performance was in line with expectations. The Retail sector recorded a better quarter compared to the previous year, driven by an increase in same store sales growth and a notable contribution from the newly opened outlets.
Financial Services The Financial Services industry group PBT of Rs.332 million in the first quarter of 2014/15 was an increase of 28 per cent over the first quarter of the previous financial year [2013/14 Q1: Rs.259 million]. The improved performance is attributed to the Banking and Insurance verticals of the industry group. Increased focus on managing non-performing loans and other operational costs helped Nations Trust Bank to overcome the impact of subdued credit growth witnessed throughout the banking industry. The performance of Union Assurance was in line with expectations, with the general insurance business focusing on containing underwriting losses towards minimizing the negative impact on overall profitability, whilst the life business focused on enhancing market share. The Stock Broking
2 l John Keells Holdings PLC l www.keells.com
Chairman’s Message
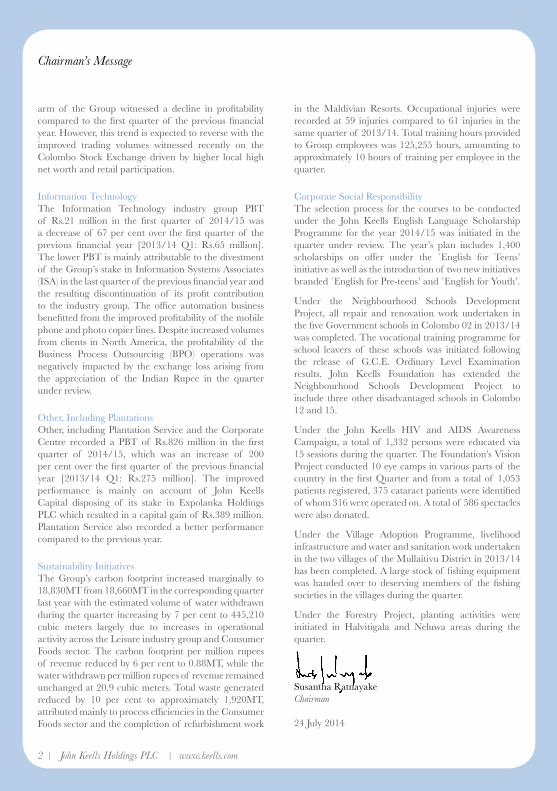
arm of the Group witnessed a decline in profitability compared to the first quarter of the previous financial year. However, this trend is expected to reverse with the improved trading volumes witnessed recently on the Colombo Stock Exchange driven by higher local high net worth and retail participation.
Information TechnologyThe Information Technology industry group PBT of Rs.21 million in the first quarter of 2014/15 was a decrease of 67 per cent over the first quarter of the previous financial year [2013/14 Q1: Rs.65 million]. The lower PBT is mainly attributable to the divestment of the Group’s stake in Information Systems Associates (ISA) in the last quarter of the previous financial year and the resulting discontinuation of its profit contribution to the industry group. The office automation business benefitted from the improved profitability of the mobile phone and photo copier lines. Despite increased volumes from clients in North America, the profitability of the Business Process Outsourcing (BPO) operations was negatively impacted by the exchange loss arising from the appreciation of the Indian Rupee in the quarter under review.
Other, Including Plantations Other, including Plantation Service and the Corporate Centre recorded a PBT of Rs.826 million in the first quarter of 2014/15, which was an increase of 200 per cent over the first quarter of the previous financial year [2013/14 Q1: Rs.275 million]. The improved performance is mainly on account of John Keells Capital disposing of its stake in Expolanka Holdings PLC which resulted in a capital gain of Rs.389 million. Plantation Service also recorded a better performance compared to the previous year.
Sustainability InitiativesThe Group’s carbon footprint increased marginally to 18,830MT from 18,660MT in the corresponding quarter last year with the estimated volume of water withdrawn during the quarter increasing by 7 per cent to 445,210 cubic meters largely due to increases in operational activity across the Leisure industry group and Consumer Foods sector. The carbon footprint per million rupees of revenue reduced by 6 per cent to 0.88MT, while the water withdrawn per million rupees of revenue remained unchanged at 20.9 cubic meters. Total waste generated reduced by 10 per cent to approximately 1,920MT, attributed mainly to process efficiencies in the Consumer Foods sector and the completion of refurbishment work
in the Maldivian Resorts. Occupational injuries were recorded at 59 injuries compared to 61 injuries in the same quarter of 2013/14. Total training hours provided to Group employees was 125,255 hours, amounting to approximately 10 hours of training per employee in the quarter.
Corporate Social ResponsibilityThe selection process for the courses to be conducted under the John Keells English Language Scholarship Programme for the year 2014/15 was initiated in the quarter under review. The year’s plan includes 1,400 scholarships on offer under the `English for Teens’ initiative as well as the introduction of two new initiatives branded `English for Pre-teens’ and `English for Youth’.
Under the Neighbourhood Schools Development Project, all repair and renovation work undertaken in the five Government schools in Colombo 02 in 2013/14 was completed. The vocational training programme for school leavers of these schools was initiated following the release of G.C.E. Ordinary Level Examination results. John Keells Foundation has extended the Neighbourhood Schools Development Project to include three other disadvantaged schools in Colombo 12 and 15.
Under the John Keells HIV and AIDS Awareness Campaign, a total of 1,332 persons were educated via 15 sessions during the quarter. The Foundation’s Vision Project conducted 10 eye camps in various parts of the country in the first Quarter and from a total of 1,053 patients registered, 375 cataract patients were identified of whom 316 were operated on. A total of 586 spectacles were also donated.
Under the Village Adoption Programme, livelihood infrastructure and water and sanitation work undertaken in the two villages of the Mullaitivu District in 2013/14 has been completed. A large stock of fishing equipment was handed over to deserving members of the fishing societies in the villages during the quarter.
Under the Forestry Project, planting activities were initiated in Halvitigala and Neluwa areas during the quarter.
Susantha RatnayakeChairman
24 July 2014

Chairman’s Message Financial Information
2 l John Keells Holdings PLC l www.keells.com Interim condensed financial statements l 3
Consolidated Income Statement
For the three months ended 30th June Note 2014 2013 Change % Restated Continuing Operations Sale of goods 12,259,061 11,321,732 8 Rendering of services 9,023,640 8,533,330 6 Revenue 21,282,701 19,855,062 7 Cost of sales (15,906,171) (14,769,588) 8 Gross profit 5,376,530 5,085,474 6 Other operating income 368,534 151,427 143 Distribution expenses (798,226) (820,337) (3)Administrative expenses (2,637,367) (2,338,947) 13 Other operating expenses (805,427) (733,372) 10 Results from operating activities 1,504,044 1,344,245 12 Finance cost (226,716) (367,476) (38)Finance income 2,214,319 1,431,378 55 Net finance income 1,987,603 1,063,902 87 Change in insurance contract liabilities 8 (1,117,530) (926,371) 21 Share of results of equity accounted investees 681,077 717,946 (5) Profit before tax 3,055,194 2,199,722 39 Tax expense 9 (694,800) (454,473) 53 Profit for the period 2,360,394 1,745,249 35 Attributable to : Equity holders of the parent 2,146,264 1,586,397 35 Non-controlling interest 214,130 158,852 35 2,360,394 1,745,249 35
LKR LKR
Earnings per share Basic 2.17 1.79 Diluted 2.12 1.78 Dividend per share 1.50 1.50
Note : All values are in LKR ‘000s, unless otherwise stated. Figures in brackets indicate deductions. The above figures are not audited.

4 l John Keells Holdings PLC l www.keells.com
Consolidated Statement of Comprehensive Income
For the three months ended 30th June Note 2014 2013 Restated Profit for the period 2,360,394 1,745,249 Other comprehensive income Currency translation of foreign operations (35,974) 245,962 Revaluation of land and buildings - (1,865)Share of other comprehensive income of equity-accounted investees (20,458) 206,750
Net (loss) / gain on available-for-sale financial assets (42,404) 36,293 Net (loss) / gain on available-for-sale financial assets reclassified to profit and loss (222,411) - (264,815) 36,293 Tax on other comprehensive income 9 - - Other comprehensive income for the period, net of tax (321,247) 487,140 Total comprehensive income for the period, net of tax 2,039,147 2,232,389 Attributable to : Equity holders of the parent 1,829,355 2,029,704 Non-controlling interest 209,792 202,685 2,039,147 2,232,389
Note : All values are in LKR ‘000s, unless otherwise stated. Figures in brackets indicate deductions. The above figures are not audited.

Chairman’s Message Financial Information
4 l John Keells Holdings PLC l www.keells.com Interim condensed financial statements l 5
Consolidated Statement of Financial Position
As at 30.06.2014 31.03.2014 Restated ASSETS Non-current assets Property, plant and equipment 47,188,163 47,473,493 Lease rentals paid in advance 8,901,324 9,096,488 Investment property 4,440,227 4,440,227 Intangible assets 2,592,162 2,472,254 Investments in associates and joint ventures 15,405,673 14,851,370 Other non current financial assets 22,598,190 21,077,133 Deferred tax assets 152,696 142,369 Other non current assets 20,901,123 19,711,329 122,179,558 119,264,663 Current assets Inventories 6,498,474 6,966,020 Trade and other receivables 10,325,594 12,494,738Amounts due from related parties 12,736 331,323 Other current assets 3,283,663 2,827,940 Short term investments 54,731,372 54,551,545 Cash in hand and at bank 4,386,137 5,967,088 79,237,976 83,138,654 Total assets 201,417,534 202,403,317 EQUITY AND LIABILITIES Equity attributable to equity holders of the parent Stated capital 49,783,378 49,748,814 Revenue reserves 52,118,576 51,300,652 Other components of equity 21,599,656 21,844,690 123,501,610 122,894,156 Non-controlling interest 11,187,546 11,615,980 Total equity 134,689,156 134,510,136 Non-current liabilities Insurance contract liabilities 21,387,561 20,273,009 Borrowings 8,857,083 9,968,646 Deferred tax liabilities 1,357,541 1,328,479 Employee benefit liabilities 1,600,601 1,538,772 Other deferred liabilities 98,770 89,540 Other non-current liabilities 491,048 392,519 33,792,604 33,590,965 Current liabilities Trade and other payables 13,106,735 14,715,073 Amounts due to related parties 270 78,779 Income tax payable 1,111,597 923,508 Short term borrowings 9,744,889 9,751,976 Current portion of borrowings 3,533,906 3,664,399 Other current liabilities 2,715,044 2,383,493 Bank overdrafts 2,723,333 2,784,988 32,935,774 34,302,216 Total equity and liabilities 201,417,534 202,403,317
LKR LKR
Net assets per share 124.69 124.07 Note : All values are in LKR ‘000s, unless otherwise stated. The above figures are not audited. I certify that the financial statements comply with the requirements of the Companies Act No.7 of 2007.
M J S Rajakariar Group Financial Controller The Board of Directors is responsible for the preparation and presentation of these financial statements.
S C Ratnayake J R F Peiris Chairman Group Finance Director 24 July 2014

6 l John Keells Holdings PLC l www.keells.com
Consolidated Statement of Cash Flows
For the three months ended 30th June Note 2014 2013 Restated CASH FLOWS FROM OPERATING ACTIVITIES Profit before working capital changes A 1,470,866 1,428,347 (Increase) / Decrease in inventories 467,546 (84,592)(Increase) / Decrease in trade and other receivables 2,453,714 1,136,553 (Increase) / Decrease in other current assets (615,235) 314,267 (Increase) / Decrease in other non-current assets (1,189,794) (676,467)Increase / (Decrease) in trade and other payables (1,588,318) (853,094)Increase / (Decrease) in other current liabilities 362,247 255,682 Increase / (Decrease) in insurance contract liabilities 1,114,552 877,280 Cash generated from operations 2,475,578 2,397,976 Finance income received 1,970,304 1,350,415 Finance costs paid (223,309) (359,953)Tax paid (231,811) (1,184,914)Gratuity paid (21,526) (33,117)Net cash flow from operating activities 3,969,236 2,170,407 CASH FLOWS FROM/(USED IN) INVESTING ACTIVITIES Purchase and construction of property, plant and equipment (585,088) (491,886)Purchase of intangible assets (26,544) (19,672)Increase in interest in associates (21,040) -Addition to investment property - (21,885)Proceeds from sale of property, plant and equipment and intangible assets 17,802 6,351 Proceeds from sale of financial instruments - fair valued through profit or loss 140,451 180,760 Purchase of financial instruments - fair valued through profit or loss (215,447) (160,249)(Purchase) / disposal of short term investments (net) (11,457,758) (85,668)(Purchase) / disposal of other non current financial assets (net) (1,785,872) 1,311,264 Net cash flow from / (used in) investing activities (13,933,496) 719,015 CASH FLOWS FROM/(USED IN) FINANCING ACTIVITIES Proceeds from issue of shares 34,564 75,280 Direct cost on issue of shares - (707)Dividend paid to equity holders of parent (1,485,620) (1,286,460)Dividend paid to shareholders with non-controlling interest (480,946) (446,253)Proceeds from long term borrowings 232,881 1,447,174 Repayment of long term borrowings (1,445,770) (1,271,362)Proceeds from/(repayment of) other financial liabilities (net) (7,087) 664,546 Net cash flow from / (used in) financing activities (3,151,978) (817,782) NET INCREASE / (DECREASE) IN CASH AND CASH EQUIVALENTS (13,116,238) 2,071,640 CASH AND CASH EQUIVALENTS AT THE BEGINNING 30,736,086 16,777,731 CASH AND CASH EQUIVALENTS AT THE END 17,619,848 18,849,371 ANALYSIS OF CASH AND CASH EQUIVALENTS Favorable balances Short term investments 15,957,044 20,186,188 Cash in hand and at bank 4,386,137 3,937,001 Unfavorable balances Bank overdrafts (2,723,333) (5,273,818)Total Cash and cash equivalents 17,619,848 18,849,371 Note : All values are in LKR ‘000s, unless otherwise stated. Figures in brackets indicate deductions. The above figures are not audited.
Chairman’s Message Financial Information
6 l John Keells Holdings PLC l www.keells.com Interim condensed financial statements l 7
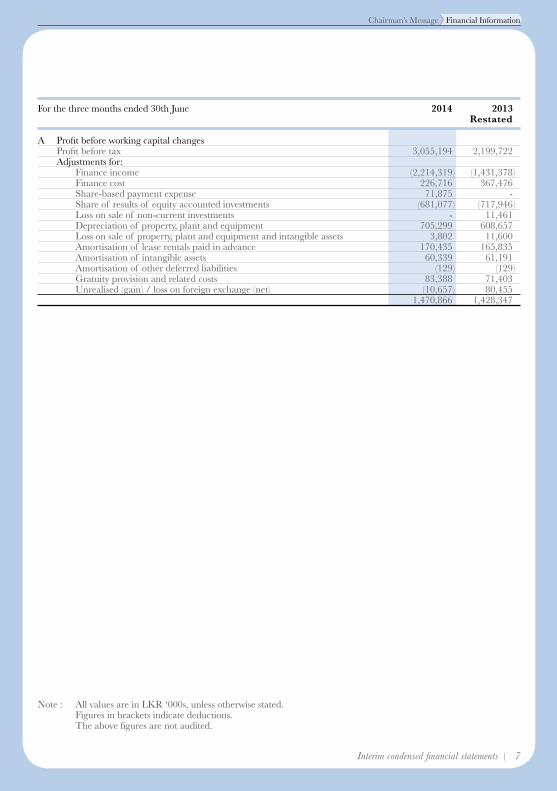
For the three months ended 30th June 2014 2013 Restated A Profit before working capital changes Profit before tax 3,055,194 2,199,722 Adjustments for: Finance income (2,214,319) (1,431,378) Finance cost 226,716 367,476 Share-based payment expense 71,875 - Share of results of equity accounted investments (681,077) (717,946) Loss on sale of non-current investments - 11,461 Depreciation of property, plant and equipment 705,299 608,657 Loss on sale of property, plant and equipment and intangible assets 3,802 11,600 Amortisation of lease rentals paid in advance 170,435 165,835 Amortisation of intangible assets 60,339 61,191 Amortisation of other deferred liabilities (129) (129) Gratuity provision and related costs 83,388 71,403 Unrealised (gain) / loss on foreign exchange (net) (10,657) 80,455 1,470,866 1,428,347
Note : All values are in LKR ‘000s, unless otherwise stated. Figures in brackets indicate deductions. The above figures are not audited.
8 l John Keells Holdings PLC l www.keells.com
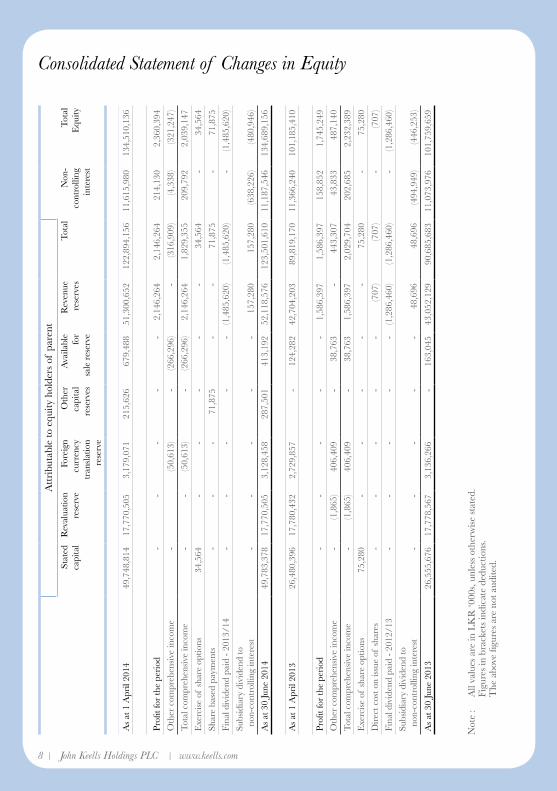
Consolidated Statement of Changes in EquityA
ttri
buta
ble
to e
quity
hol
ders
of
pare
nt S
tate
d c
apita
l R
eval
uatio
n r
eser
ve
For
eign
cu
rren
cy
tran
slatio
n r
eser
ve
Oth
er
cap
ital
res
erve
s
Ava
ilabl
e fo
r s
ale
rese
rve
Rev
enue
r
eser
ves
Tot
al
Non
-co
ntro
lling
in
tere
st
Tot
al
Equ
ity
As
at 1
Apr
il 20
1449
,748
,814
17
,770
,505
3
,179
,071
2
15,6
26
679
,488
51
,300
,652
1
22,8
94,1
56
11,6
15,9
80
134
,510
,136
Profi
t for
the
peri
od -
- -
- -
2,1
46,2
64
2,1
46,2
64
214
,130
2
,360
,394
Oth
er c
ompr
ehen
sive
inco
me
- (5
0,61
3) -
(266
,296
) -
(316
,909
) (4
,338
) (3
21,2
47)
Tot
al c
ompr
ehen
sive
inco
me
- -
(50,
613)
- (2
66,2
96)
2,1
46,2
64
1,8
29,3
55
209
,792
2
,039
,147
Exe
rcis
e of
sha
re o
ptio
ns 3
4,56
4 -
- -
- -
34,
564
- 3
4,56
4
Shar
e ba
sed
paym
ents
- -
- 7
1,87
5 -
- 7
1,87
5 -
71,
875
Fina
l div
iden
d pa
id -
2013
/14
- -
- -
- (1
,485
,620
) (1
,485
,620
) -
(1,4
85,6
20)
Subs
idia
ry d
ivid
end
to
non
-con
trol
ling
inte
rest
- -
- -
- 1
57,2
80
157
,280
(6
38,2
26)
(480
,946
)
As
at 3
0 Ju
ne 2
014
49,7
83,3
78
17,7
70,5
05
3,1
28,4
58
287
,501
4
13,1
92
52,1
18,5
76
123
,501
,610
11
,187
,546
1
34,6
89,1
56
As
at 1
Apr
il 20
1326
,480
,396
17
,780
,432
2
,729
,857
-
124
,282
42
,704
,203
8
9,81
9,17
0 11
,366
,240
1
01,1
85,4
10
Profi
t for
the
peri
od -
- -
- -
1,5
86,3
97
1,5
86,3
97
158
,852
1
,745
,249
Oth
er c
ompr
ehen
sive
inco
me
- (1
,865
) 4
06,4
09
- 3
8,76
3 -
443
,307
4
3,83
3 4
87,1
40
Tot
al c
ompr
ehen
sive
inco
me
- (1
,865
) 4
06,4
09
- 3
8,76
3 1
,586
,397
2
,029
,704
2
02,6
85
2,2
32,3
89
Exe
rcis
e of
sha
re o
ptio
ns 7
5,28
0 -
- -
- -
75,
280
- 7
5,28
0
Dir
ect c
ost o
n is
sue
of s
hare
s -
- -
- -
(707
) (7
07)
- (7
07)
Fina
l div
iden
d pa
id -
2012
/13
- -
- -
- (1
,286
,460
) (1
,286
,460
) -
(1,2
86,4
60)
Subs
idia
ry d
ivid
end
to
non
-con
trol
ling
inte
rest
- -
- -
- 4
8,69
6 4
8,69
6 (4
94,9
49)
(446
,253
)
As
at 3
0 Ju
ne 2
013
26,5
55,6
76
17,7
78,5
67
3,1
36,2
66
- 1
63,0
45
43,0
52,1
29
90,
685,
683
11,0
73,9
76
101
,759
,659
Not
e :
All
valu
es a
re in
LK
R ‘0
00s,
unle
ss o
ther
wis
e st
ated
.
Figu
res
in b
rack
ets
indi
cate
ded
uctio
ns.
T
he a
bove
figu
res
are
not a
udite
d.

Chairman’s Message Financial Information
8 l John Keells Holdings PLC l www.keells.com Interim condensed financial statements l 9
Company Income Statement
For the three months ended 30th June Note 2014 2013 Change % Continuing Operations Rendering of services 209,352 181,687 15 Revenue 209,352 181,687 15
Cost of sales (116,058) (99,008) 17 Gross profit 93,294 82,679 13 Dividend income 2,212,745 2,191,598 1 Other operating income 3,859 2,350 64 Administrative expenses (323,069) (295,253) 9 Other operating expenses (10,277) (9,574) 7 Results from operating activities 1,976,552 1,971,800 0 Finance cost (65,637) (90,959) (28)Finance income 1,051,558 384,722 173 Net finance income 985,921 293,763 236
Profit before tax 2,962,473 2,265,563 31 Tax expense 9 (114,372) (32,532) 252 Profit for the period 2,848,101 2,233,031 28 LKR LKR
Dividend per share 1.50 1.50
Note : All values are in LKR ‘000s, unless otherwise stated. Figures in brackets indicate deductions. The above figures are not audited.

10 l John Keells Holdings PLC l www.keells.com
Company Statement of Comprehensive Income
For the three months ended 30th June Note 2014 2013 Profit for the period 2,848,101 2,233,031 Other comprehensive income Net (loss)/gain on available-for-sale financial assets (77,017) 43,481 Net (loss) / gain on available-for-sale financial assets reclassified to profit and loss (222,411) - (299,428) 43,481 Tax on other comprehensive income 9 - - Other comprehensive income for the period, net of tax (299,428) 43,481 Total comprehensive income for the period, net of tax 2,548,673 2,276,512
Note : All values are in LKR ‘000s, unless otherwise stated. Figures in brackets indicate deductions. The above figures are not audited.
Chairman’s Message Financial Information
10 l John Keells Holdings PLC l www.keells.com Interim condensed financial statements l 11
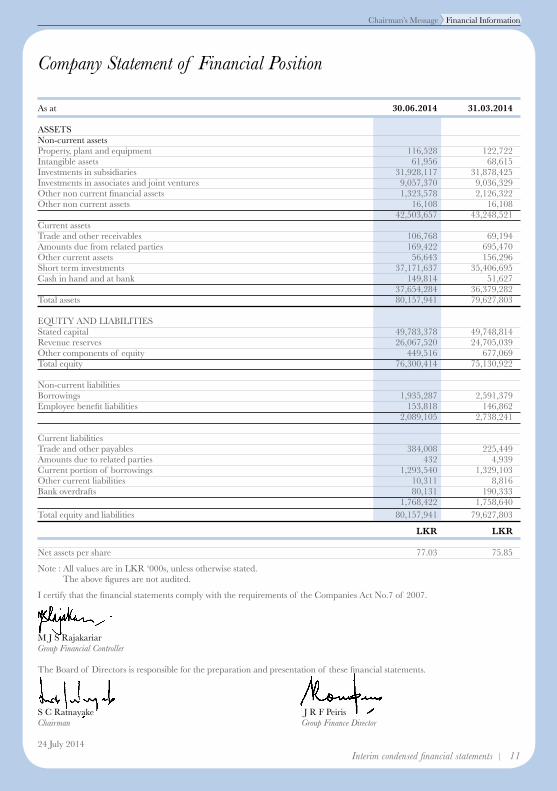
Company Statement of Financial Position
As at 30.06.2014 31.03.2014 ASSETS Non-current assets Property, plant and equipment 116,528 122,722 Intangible assets 61,956 68,615 Investments in subsidiaries 31,928,117 31,878,425 Investments in associates and joint ventures 9,057,370 9,036,329 Other non current financial assets 1,323,578 2,126,322 Other non current assets 16,108 16,108 42,503,657 43,248,521 Current assets Trade and other receivables 106,768 69,194 Amounts due from related parties 169,422 695,470 Other current assets 56,643 156,296 Short term investments 37,171,637 35,406,695 Cash in hand and at bank 149,814 51,627 37,654,284 36,379,282 Total assets 80,157,941 79,627,803 EQUITY AND LIABILITIES Stated capital 49,783,378 49,748,814 Revenue reserves 26,067,520 24,705,039 Other components of equity 449,516 677,069 Total equity 76,300,414 75,130,922 Non-current liabilities Borrowings 1,935,287 2,591,379 Employee benefit liabilities 153,818 146,862 2,089,105 2,738,241 Current liabilities Trade and other payables 384,008 225,449 Amounts due to related parties 432 4,939 Current portion of borrowings 1,293,540 1,329,103 Other current liabilities 10,311 8,816 Bank overdrafts 80,131 190,333 1,768,422 1,758,640 Total equity and liabilities 80,157,941 79,627,803 LKR LKR
Net assets per share 77.03 75.85 Note : All values are in LKR ‘000s, unless otherwise stated. The above figures are not audited. I certify that the financial statements comply with the requirements of the Companies Act No.7 of 2007.
M J S Rajakariar Group Financial Controller The Board of Directors is responsible for the preparation and presentation of these financial statements.
S C Ratnayake J R F Peiris Chairman Group Finance Director 24 July 2014

12 l John Keells Holdings PLC l www.keells.com
Company Statement of Cash Flows
For the three months ended 30th June Note 2014 2013 Restated CASH FLOWS FROM OPERATING ACTIVITIES Profit before tax 2,962,473 2,265,563 Finance income (1,051,558) (384,722) Dividend income (2,212,745) (2,191,598) Finance cost 65,637 90,959 Depreciation of property, plant and equipment 6,870 6,041 Profit on sale of property, plant and equipment - (4) Amortisation of intangible assets 6,659 5,961 Share based payment expenses 22,185 - Provision for impairment losses - 118,613 Gratuity provision and related costs 6,954 6,198 Profit before working capital changes (193,525) (82,989) (Increase) / Decrease in trade and other receivables (128,347) (36,885)(Increase) / Decrease in other current assets 34,829 (2,165)Increase / (Decrease) in trade and other payables 154,053 10,747 Increase / (Decrease) in other current liabilities 1,495 (97,376)Cash generated from operations (131,495) (208,668) Finance income received 614,533 384,722 Finance cost paid (97,200) (87,552)Dividend received 2,817,611 2,218,061 Tax paid (46,141) (33,461)Gratuity paid - (2,519)Net cash flow from operating activities 3,157,308 2,270,583 CASH FLOWS FROM/ (USED IN) INVESTING ACTIVITIES Purchase and construction of property, plant and equipment (676) (769)Purchase of intangible assets - (14,099)Increase in interest in associates (21,040) - Proceeds from sale of Property, plant and equipment - 4 (Purchase) / disposal of short term investments (net) (9,476,557) 4,469,699 (Purchase) / disposal of other non current financial assets (net) 892,327 (20,431)Net cash flow from/(used in) investing activities (8,605,946) 4,434,404 CASH FLOWS FROM / (USED IN) FINANCING ACTIVITIES Proceeds from issue of shares 34,564 75,280 Dividend paid (1,485,620) (1,286,460)Repayment of long term borrowings (651,546) (640,475)Net cash flow from / (used in) financing activities (2,102,602) (1,851,655) NET (DECREASE) / INCREASE IN CASH AND CASH EQUIVALENTS (7,551,240) 4,853,332 CASH AND CASH EQUIVALENTS AT THE BEGINNING 14,756,634 5,433,342 CASH AND CASH EQUIVALENTS AT THE END 7,205,394 10,286,674 ANALYSIS OF CASH & CASH EQUIVALENTS Favorable balances Short term investments 7,135,711 11,423,035 Cash in hand and at bank 149,814 586,128 7,285,525 12,009,163 Unfavorable balances Bank overdrafts (80,131) (1,722,489) 7,205,394 10,286,674
Note : All values are in LKR ‘000s, unless otherwise stated. Figures in brackets indicate deductions. The above figures are not audited.

Chairman’s Message Financial Information
12 l John Keells Holdings PLC l www.keells.com Interim condensed financial statements l 13
Company Statement of Changes in Equity
Stated capital
Other capitalreserves
Available for
sale reserve
Revenue reserves
Total Equity
As at 1 April 2014 49,748,814 215,626 461,443 24,705,039 75,130,922
Profit for the period - - - 2,848,101 2,848,101
Other comprehensive income - - (299,428) - (299,428)
Total comprehensive income - - (299,428) 2,848,101 2,548,673
Exercise of share options 34,564 - - - 34,564
Share based payments - 71,875 - - 71,875
Final dividend paid - 2013/14 - - - (1,485,620) (1,485,620)
As at 30 June 2014 49,783,378 287,501 162,015 26,067,520 76,300,414
As at 1 April 2013 26,480,396 - 83,457 20,221,756 46,785,609
Profit for the period - - - 2,233,031 2,233,031
Other comprehensive income - - 43,481 - 43,481
Total comprehensive income - - 43,481 2,233,031 2,276,512
Exercise of share options 75,280 - - - 75,280
Final dividend paid - 2012/13 - - - (1,286,460) (1,286,460)
As at 30 June 2013 26,555,676 - 126,938 21,168,327 47,850,941
Note : All values are in LKR ‘000s, unless otherwise stated. Figures in brackets indicate deductions. The above figures are not audited.
14 l John Keells Holdings PLC l www.keells.com
Notes to the Interim Condensed Financial Statements
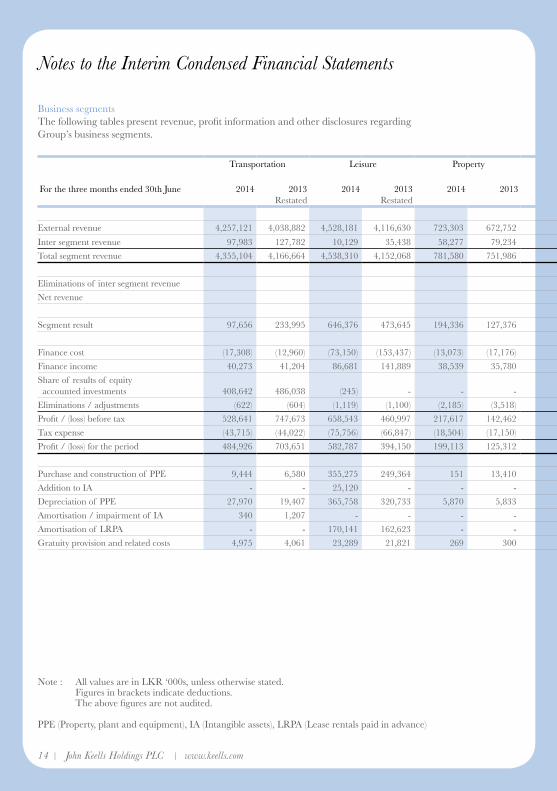
Business segmentsThe following tables present revenue, profit information and other disclosures regarding Group’s business segments.
Transportation Leisure Property Consumer Foods & Retail
Financial Services Information Technology Others Group Total
For the three months ended 30th June 2014 2013Restated
2014 2013Restated
2014 2013 2014 2013 2014 2013 2014 2013Restated
2014 2013 2014 2013Restated
External revenue 4,257,121 4,038,882 4,528,181 4,116,630 723,303 672,752 7,164,373 6,154,518 2,250,406 2,229,523 1,514,486 1,811,918 844,831 830,839 21,282,701 19,855,062
Inter segment revenue 97,983 127,782 10,129 35,438 58,277 79,234 95,502 91,660 97,444 26,998 36,456 77,461 142,221 141,510 538,012 580,083
Total segment revenue 4,355,104 4,166,664 4,538,310 4,152,068 781,580 751,986 7,259,875 6,246,178 2,347,850 2,256,521 1,550,942 1,889,379 987,052 972,349 21,820,713 20,435,145
Eliminations of inter segment revenue (538,012) (580,083)
Net revenue 21,282,701 19,855,062
Segment result 97,656 233,995 646,376 473,645 194,336 127,376 482,463 251,964 28,471 31,579 19,091 (13,908) (136,340) (108,237) 1,332,053 996,414
Finance cost (17,308) (12,960) (73,150) (153,437) (13,073) (17,176) (26,889) (42,734) - (1) (4,284) (18,412) (92,012) (122,756) (226,716) (367,476)
Finance income 40,273 41,204 86,681 141,889 38,539 35,780 19,565 43,104 30,376 27,435 6,982 3,421 1,054,039 389,197 1,276,455 682,030
Share of results of equity accounted investments 408,642 486,038 (245) - - - - - 272,680 200,480 - 20,662 - 10,766 681,077 717,946
Eliminations / adjustments (622) (604) (1,119) (1,100) (2,185) (3,518) (3,000) (3,000) - - (749) 72,820 - 106,210 (7,675) 170,808
Profit / (loss) before tax 528,641 747,673 658,543 460,997 217,617 142,462 472,139 249,334 331,527 259,493 21,040 64,583 825,687 275,180 3,055,194 2,199,722
Tax expense (43,715) (44,022) (75,756) (66,847) (18,504) (17,150) (134,616) (64,679) (112,838) (65,933) (15,295) (11,585) (294,076) (184,257) (694,800) (454,473)
Profit / (loss) for the period 484,926 703,651 582,787 394,150 199,113 125,312 337,523 184,655 218,689 193,560 5,745 52,998 531,611 90,923 2,360,394 1,745,249
Purchase and construction of PPE 9,444 6,580 355,275 249,364 151 13,410 177,736 126,224 24,998 44,406 12,233 24,447 5,251 27,455 585,088 491,886
Addition to IA - - 25,120 - - - 454 2,268 - - 970 3,305 - 14,099 26,544 19,672
Depreciation of PPE 27,970 19,407 365,758 320,733 5,870 5,833 194,848 168,071 40,151 37,841 40,658 26,637 30,044 30,135 705,299 608,657
Amortisation / impairment of IA 340 1,207 - - - - 2,893 3,974 47,066 47,066 3,378 2,983 6,662 5,961 60,339 61,191
Amortisation of LRPA - - 170,141 162,623 - - - - - - - - 294 3,212 170,435 165,835
Gratuity provision and related costs 4,975 4,061 23,289 21,821 269 300 26,159 24,171 8,990 8,132 3,914 2,942 15,792 9,976 83,388 71,403
Note : All values are in LKR ‘000s, unless otherwise stated. Figures in brackets indicate deductions. The above figures are not audited.
PPE (Property, plant and equipment), IA (Intangible assets), LRPA (Lease rentals paid in advance)

Chairman’s Message Financial Information
14 l John Keells Holdings PLC l www.keells.com Interim condensed financial statements l 15
Business segmentsThe following tables present revenue, profit information and other disclosures regarding Group’s business segments.
Transportation Leisure Property Consumer Foods & Retail
Financial Services Information Technology Others Group Total
For the three months ended 30th June 2014 2013Restated
2014 2013Restated
2014 2013 2014 2013 2014 2013 2014 2013Restated
2014 2013 2014 2013Restated
External revenue 4,257,121 4,038,882 4,528,181 4,116,630 723,303 672,752 7,164,373 6,154,518 2,250,406 2,229,523 1,514,486 1,811,918 844,831 830,839 21,282,701 19,855,062
Inter segment revenue 97,983 127,782 10,129 35,438 58,277 79,234 95,502 91,660 97,444 26,998 36,456 77,461 142,221 141,510 538,012 580,083
Total segment revenue 4,355,104 4,166,664 4,538,310 4,152,068 781,580 751,986 7,259,875 6,246,178 2,347,850 2,256,521 1,550,942 1,889,379 987,052 972,349 21,820,713 20,435,145
Eliminations of inter segment revenue (538,012) (580,083)
Net revenue 21,282,701 19,855,062
Segment result 97,656 233,995 646,376 473,645 194,336 127,376 482,463 251,964 28,471 31,579 19,091 (13,908) (136,340) (108,237) 1,332,053 996,414
Finance cost (17,308) (12,960) (73,150) (153,437) (13,073) (17,176) (26,889) (42,734) - (1) (4,284) (18,412) (92,012) (122,756) (226,716) (367,476)
Finance income 40,273 41,204 86,681 141,889 38,539 35,780 19,565 43,104 30,376 27,435 6,982 3,421 1,054,039 389,197 1,276,455 682,030
Share of results of equity accounted investments 408,642 486,038 (245) - - - - - 272,680 200,480 - 20,662 - 10,766 681,077 717,946
Eliminations / adjustments (622) (604) (1,119) (1,100) (2,185) (3,518) (3,000) (3,000) - - (749) 72,820 - 106,210 (7,675) 170,808
Profit / (loss) before tax 528,641 747,673 658,543 460,997 217,617 142,462 472,139 249,334 331,527 259,493 21,040 64,583 825,687 275,180 3,055,194 2,199,722
Tax expense (43,715) (44,022) (75,756) (66,847) (18,504) (17,150) (134,616) (64,679) (112,838) (65,933) (15,295) (11,585) (294,076) (184,257) (694,800) (454,473)
Profit / (loss) for the period 484,926 703,651 582,787 394,150 199,113 125,312 337,523 184,655 218,689 193,560 5,745 52,998 531,611 90,923 2,360,394 1,745,249
Purchase and construction of PPE 9,444 6,580 355,275 249,364 151 13,410 177,736 126,224 24,998 44,406 12,233 24,447 5,251 27,455 585,088 491,886
Addition to IA - - 25,120 - - - 454 2,268 - - 970 3,305 - 14,099 26,544 19,672
Depreciation of PPE 27,970 19,407 365,758 320,733 5,870 5,833 194,848 168,071 40,151 37,841 40,658 26,637 30,044 30,135 705,299 608,657
Amortisation / impairment of IA 340 1,207 - - - - 2,893 3,974 47,066 47,066 3,378 2,983 6,662 5,961 60,339 61,191
Amortisation of LRPA - - 170,141 162,623 - - - - - - - - 294 3,212 170,435 165,835
Gratuity provision and related costs 4,975 4,061 23,289 21,821 269 300 26,159 24,171 8,990 8,132 3,914 2,942 15,792 9,976 83,388 71,403
Note : All values are in LKR ‘000s, unless otherwise stated. Figures in brackets indicate deductions. The above figures are not audited.
PPE (Property, plant and equipment), IA (Intangible assets), LRPA (Lease rentals paid in advance)

16 l John Keells Holdings PLC l www.keells.com
Notes to the Interim Condensed Financial Statements
Business segmentsThe following table presents segment assets and liabilities of the Group’s business segments.
Transportation Leisure Property Consumer Foods & Retail Financial Services Information Technology Others Group Total
As at 30.06.2014 31.03.2014Restated
30.06.2014 31.03.2014Restated
30.06.2014 31.03.2014 30.06.2014 31.03.2014 30.06.2014 31.03.2014 30.06.2014 31.03.2014Restated
30.06.2014 31.03.2014 30.06.2014 31.03.2014Restated
Business segments
Segment non-current assets 1,084,133 1,087,108 45,711,608 45,916,203 27,019,336 25,864,331 7,379,774 7,374,589 22,524,069 20,211,147 427,475 503,647 5,652,931 6,485,657 109,799,326 107,442,682
Investments in associates 11,296,814 10,913,879 380,924 381,168 - - - - 3,727,935 3,556,323 - - - 15,405,673 14,851,370
Deferred tax assets 152,696 142,369
Goodwill 950,884 950,884
Eliminations / adjustments (4,129,021) (4,122,642)
Total non-current assets 122,179,558 119,264,663
Segment current assets 4,338,456 6,726,272 12,002,744 14,431,207 9,479,306 10,011,165 4,529,411 4,876,636 9,942,809 10,647,628 3,240,030 3,718,748 38,543,943 37,392,777 82,076,699 87,804,433
Other current assets * 3,283,663 2,827,940
Eliminations / adjustments (6,122,386) (7,493,719)
Total current assets 79,237,976 83,138,654
Total assets 201,417,534 202,403,317
Segment non-current liabilities 135,761 131,069 9,055,345 9,437,859 2,996,855 2,931,215 938,423 951,150 21,607,182 20,485,312 156,264 165,287 2,209,365 2,843,992 37,099,195 36,945,884
Deferred tax liabilities 1,357,541 1,328,479
Eliminations / adjustments (4,664,132) (4,683,398)
Total non-current liabilities 33,792,604 33,590,965
Segment current liabilities 2,337,527 4,529,549 8,862,368 10,003,869 9,792,990 9,697,864 4,372,031 4,523,464 5,874,897 5,499,273 1,020,956 1,271,843 2,323,719 2,161,300 34,584,489 37,687,162
Income tax liabilities 1,111,597 923,508
Other current liabilities * 2,715,044 2,383,493
Eliminations / adjustments (5,475,356) (6,691,947)
Total current liabilities 32,935,774 34,302,216
Total liabilities 66,728,378 67,893,181
Total segment assets 5,422,589 7,813,380 57,714,352 60,347,410 36,498,642 35,875,496 11,909,185 12,251,225 32,466,878 30,858,775 3,667,505 4,222,395 44,196,874 43,878,434 191,876,025 195,247,115
Total segment liabilities 2,473,288 4,660,618 17,917,713 19,441,728 12,789,845 12,629,079 5,310,454 5,474,614 27,482,079 25,984,585 1,177,220 1,437,130 4,533,084 5,005,292 71,683,684 74,633,046
* Balance mainly comprises from tax refunds / other tax payables.
Note : All values are in LKR ‘000s, unless otherwise stated. Figures in brackets indicate deductions. The above figures are not audited.

Chairman’s Message Financial Information
16 l John Keells Holdings PLC l www.keells.com Interim condensed financial statements l 17
Business segmentsThe following table presents segment assets and liabilities of the Group’s business segments.
Transportation Leisure Property Consumer Foods & Retail Financial Services Information Technology Others Group Total
As at 30.06.2014 31.03.2014Restated
30.06.2014 31.03.2014Restated
30.06.2014 31.03.2014 30.06.2014 31.03.2014 30.06.2014 31.03.2014 30.06.2014 31.03.2014Restated
30.06.2014 31.03.2014 30.06.2014 31.03.2014Restated
Business segments
Segment non-current assets 1,084,133 1,087,108 45,711,608 45,916,203 27,019,336 25,864,331 7,379,774 7,374,589 22,524,069 20,211,147 427,475 503,647 5,652,931 6,485,657 109,799,326 107,442,682
Investments in associates 11,296,814 10,913,879 380,924 381,168 - - - - 3,727,935 3,556,323 - - - 15,405,673 14,851,370
Deferred tax assets 152,696 142,369
Goodwill 950,884 950,884
Eliminations / adjustments (4,129,021) (4,122,642)
Total non-current assets 122,179,558 119,264,663
Segment current assets 4,338,456 6,726,272 12,002,744 14,431,207 9,479,306 10,011,165 4,529,411 4,876,636 9,942,809 10,647,628 3,240,030 3,718,748 38,543,943 37,392,777 82,076,699 87,804,433
Other current assets * 3,283,663 2,827,940
Eliminations / adjustments (6,122,386) (7,493,719)
Total current assets 79,237,976 83,138,654
Total assets 201,417,534 202,403,317
Segment non-current liabilities 135,761 131,069 9,055,345 9,437,859 2,996,855 2,931,215 938,423 951,150 21,607,182 20,485,312 156,264 165,287 2,209,365 2,843,992 37,099,195 36,945,884
Deferred tax liabilities 1,357,541 1,328,479
Eliminations / adjustments (4,664,132) (4,683,398)
Total non-current liabilities 33,792,604 33,590,965
Segment current liabilities 2,337,527 4,529,549 8,862,368 10,003,869 9,792,990 9,697,864 4,372,031 4,523,464 5,874,897 5,499,273 1,020,956 1,271,843 2,323,719 2,161,300 34,584,489 37,687,162
Income tax liabilities 1,111,597 923,508
Other current liabilities * 2,715,044 2,383,493
Eliminations / adjustments (5,475,356) (6,691,947)
Total current liabilities 32,935,774 34,302,216
Total liabilities 66,728,378 67,893,181
Total segment assets 5,422,589 7,813,380 57,714,352 60,347,410 36,498,642 35,875,496 11,909,185 12,251,225 32,466,878 30,858,775 3,667,505 4,222,395 44,196,874 43,878,434 191,876,025 195,247,115
Total segment liabilities 2,473,288 4,660,618 17,917,713 19,441,728 12,789,845 12,629,079 5,310,454 5,474,614 27,482,079 25,984,585 1,177,220 1,437,130 4,533,084 5,005,292 71,683,684 74,633,046
* Balance mainly comprises from tax refunds / other tax payables.
Note : All values are in LKR ‘000s, unless otherwise stated. Figures in brackets indicate deductions. The above figures are not audited.
18 l John Keells Holdings PLC l www.keells.com
Notes to the Interim Condensed Financial Statements
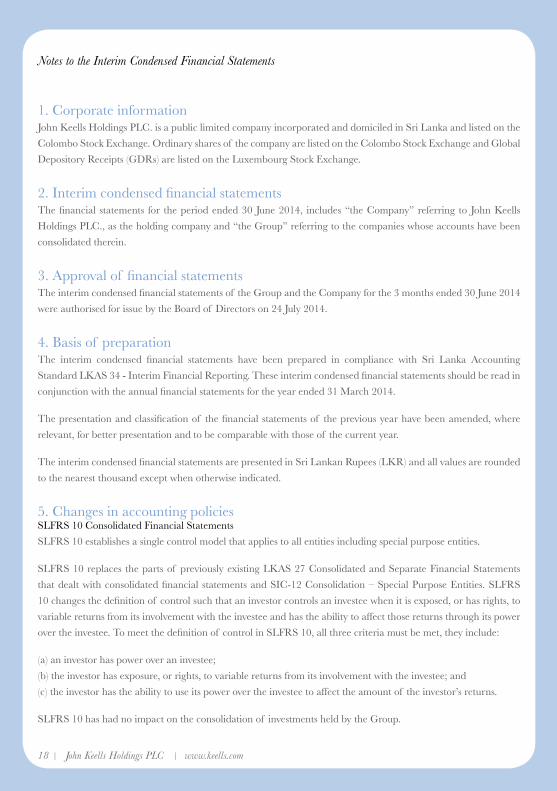
1. Corporate informationJohn Keells Holdings PLC. is a public limited company incorporated and domiciled in Sri Lanka and listed on the
Colombo Stock Exchange. Ordinary shares of the company are listed on the Colombo Stock Exchange and Global
Depository Receipts (GDRs) are listed on the Luxembourg Stock Exchange.
2. Interim condensed financial statementsThe financial statements for the period ended 30 June 2014, includes “the Company” referring to John Keells
Holdings PLC., as the holding company and “the Group” referring to the companies whose accounts have been
consolidated therein.
3. Approval of financial statementsThe interim condensed financial statements of the Group and the Company for the 3 months ended 30 June 2014
were authorised for issue by the Board of Directors on 24 July 2014.
4. Basis of preparationThe interim condensed financial statements have been prepared in compliance with Sri Lanka Accounting
Standard LKAS 34 - Interim Financial Reporting. These interim condensed financial statements should be read in
conjunction with the annual financial statements for the year ended 31 March 2014.
The presentation and classification of the financial statements of the previous year have been amended, where
relevant, for better presentation and to be comparable with those of the current year.
The interim condensed financial statements are presented in Sri Lankan Rupees (LKR) and all values are rounded
to the nearest thousand except when otherwise indicated.
5. Changes in accounting policiesSLFRS 10 Consolidated Financial Statements
SLFRS 10 establishes a single control model that applies to all entities including special purpose entities.
SLFRS 10 replaces the parts of previously existing LKAS 27 Consolidated and Separate Financial Statements
that dealt with consolidated financial statements and SIC-12 Consolidation – Special Purpose Entities. SLFRS
10 changes the definition of control such that an investor controls an investee when it is exposed, or has rights, to
variable returns from its involvement with the investee and has the ability to affect those returns through its power
over the investee. To meet the definition of control in SLFRS 10, all three criteria must be met, they include:
(a) an investor has power over an investee;
(b) the investor has exposure, or rights, to variable returns from its involvement with the investee; and
(c) the investor has the ability to use its power over the investee to affect the amount of the investor’s returns.
SLFRS 10 has had no impact on the consolidation of investments held by the Group.

Chairman’s Message Financial Information
18 l John Keells Holdings PLC l www.keells.com Interim condensed financial statements l 19
SLFRS 11 Joint Arrangements
SLFRS 11 replaces LKAS 31 Interests in Joint Ventures and SIC-13 Jointly-controlled Entities — Non-monetary
Contributions by Venturers. SLFRS 11 removes the option to account for jointly controlled entities (JCEs) using
proportionate consolidation. Instead, JCEs that meet the definition of a joint venture under SLFRS 11 must be
accounted for using the equity method.
The application of this new standard impacts the financial position of the Group by replacing proportionate
consolidation of the joint ventures with the equity method of accounting.
SLFRS 11 is effective for annual periods beginning on or after 1 January 2014. The effect of SLFRS 11 is described
in more detail in Note 7, which includes quantification of the effect on the financial statements.
SLFRS 12 Disclosure of Interests in Other Entities
SLFRS 12 sets out the requirements for disclosures relating to an entity’s interests in subsidiaries, joint arrangements,
associates and structured entities. None of these disclosure requirements are applicable to the interim condensed
consolidated financial statements, unless significant events and transactions in the interim period require that they
are disclosed. Accordingly, the Group has not made any such disclosures.
SLFRS 13 Fair Value Measurement
SLFRS 13 establishes a single source of guidance under SLFRS for all fair value measurements. SLFRS 13 does
not change when an entity is required to use fair value, but rather provides guidance on how to measure fair value
under SLFRS when fair value is required or permitted. The application of SLFRS 13 has not materially impacted
the fair value measurements carried out by the Group.
6. Operating Segments For management purposes, the Group is organised into business units based on their products and services and has
seven reportable operating segments as follows:
Transportation
Leisure
Property
Consumer Foods & Retail
Financial Services
Information Technology
Others
20 l John Keells Holdings PLC l www.keells.com
Notes to the Interim Condensed Financial Statements
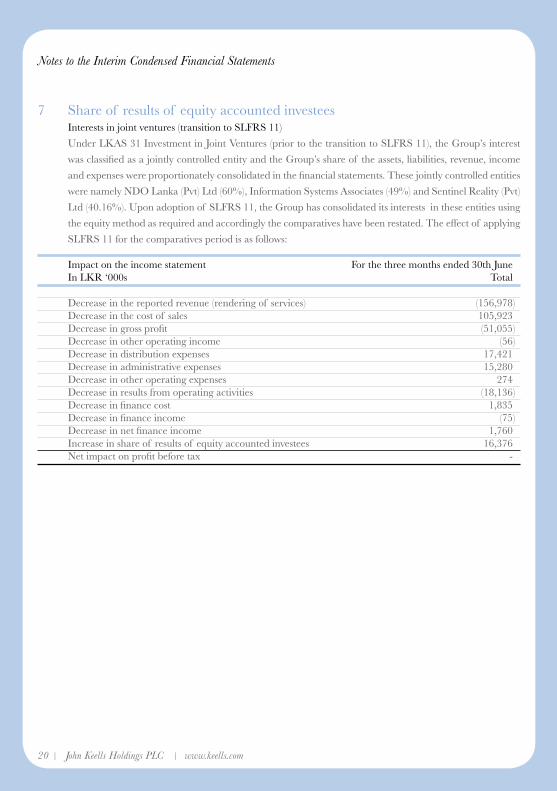
7 Share of results of equity accounted investees Interests in joint ventures (transition to SLFRS 11)
Under LKAS 31 Investment in Joint Ventures (prior to the transition to SLFRS 11), the Group’s interest
was classified as a jointly controlled entity and the Group’s share of the assets, liabilities, revenue, income
and expenses were proportionately consolidated in the financial statements. These jointly controlled entities
were namely NDO Lanka (Pvt) Ltd (60%), Information Systems Associates (49%) and Sentinel Reality (Pvt)
Ltd (40.16%). Upon adoption of SLFRS 11, the Group has consolidated its interests in these entities using
the equity method as required and accordingly the comparatives have been restated. The effect of applying
SLFRS 11 for the comparatives period is as follows:
Impact on the income statement For the three months ended 30th June In LKR ‘000s Total
Decrease in the reported revenue (rendering of services) (156,978) Decrease in the cost of sales 105,923 Decrease in gross profit (51,055) Decrease in other operating income (56) Decrease in distribution expenses 17,421 Decrease in administrative expenses 15,280 Decrease in other operating expenses 274 Decrease in results from operating activities (18,136) Decrease in finance cost 1,835 Decrease in finance income (75) Decrease in net finance income 1,760 Increase in share of results of equity accounted investees 16,376 Net impact on profit before tax -

Chairman’s Message Financial Information
20 l John Keells Holdings PLC l www.keells.com Interim condensed financial statements l 21
Impact on the statement of financial position As at 31.03.2014 In LKR ‘000 s Total
Decrease in property, plant and equipment (62,174) Increase in equity accounted investments 57,005 Decrease in other non-current financial assets (10,694) Decrease in deferred tax assets (4,448) Decrease in other non current assets (530) Decrease in trade and other receivables (102,518) Increase in amounts due from related parties (17,855) Decrease in short term investments (1,142) Decrease in other current assets (8,956) Decrease in cash in hand and at bank (17,821) Decrease in employee benefit liability 3,012 Decrease in trade and other payables 55,529 Increase in amounts due to related parties 32,724 Decrease in income tax liabilities 340 Decrease in other current liabilities (8,234) Decrease in bank overdraft 85,762 Net impact on equity - There is no material impact on interim condensed consolidated statement of cash flows or the basic and
diluted EPS.
8 Change in life insurance contract liabilities The results of Union Assurance PLC’s life business segment is consolidated line by line into the Group’s
consolidated income statement. The change in life insurance contract liabilities represents the transfer to
the Life Fund, the difference between all income and expenditure attributable to life policy holders during
the period.
9 Tax expense
For the three months ended 30th June Group Company In LKR ‘000s 2014 2013 2014 2013
Income statement
Current income tax 674,839 463,204 114,372 32,532
Deferred tax 19,961 (8,731) - -
Other comprehensive Income Deferred tax - - - - 694,800 454,473 114,372 32,532

22 l John Keells Holdings PLC l www.keells.com
Notes to the Interim Condensed Financial Statements
10 Related party transactions
For the three months ended 30th June Group Company In LKR ‘000s 2014 2013 2014 2013
Transactions with related parties Subsidiaries (Purchases) / sale of goods - - 220 996 (Receiving) / rendering of services - - 166,995 155,381 (Purchases) / sale of property plant & equipment - - Loans given - - - - Interest received / (paid) - - - - Rent received / (paid) - - (9,118) (29,012) Guarantees received / (paid) - - - - Joint Ventures (Receiving) / rendering of services 244 15,628 - - Associates (Purchases) / sale of goods 627 1,903 - - (Receiving) / rendering of services 1,685 10,527 976 900 Interest received / (paid) 33,962 43,897 69 19,386 Loans taken - - - - Leases taken - - - - Key management personnel (KMP) (Receiving) / rendering of services - - - - Close family members of KMP (Receiving) / rendering of services - - - - Companies controlled and jointly controlled by KMP and their close family members of KMP (Purchases) / sale of goods - - - - Post employment benefit plan Contributions to the provident fund 55,824 52,043 11,675 10,901
Chairman’s Message Financial Information
22 l John Keells Holdings PLC l www.keells.com Interim condensed financial statements l 23
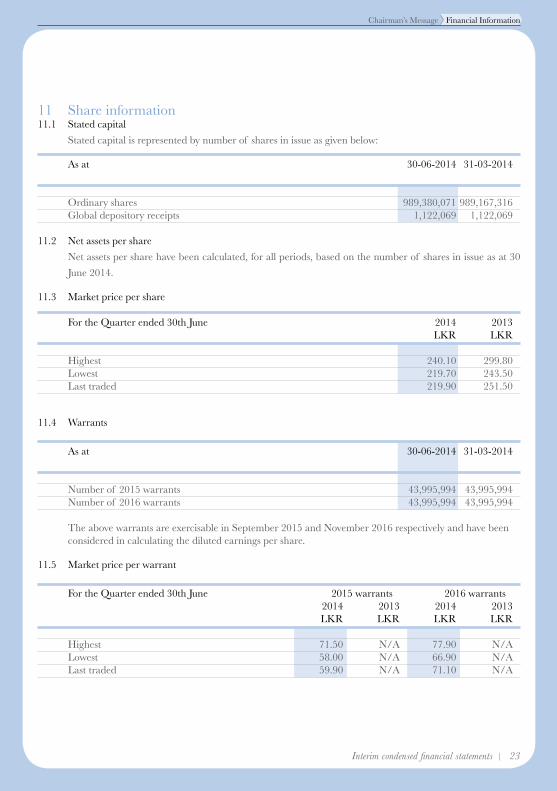
11 Share information11.1 Stated capital
Stated capital is represented by number of shares in issue as given below:
As at 30-06-2014 31-03-2014
Ordinary shares 989,380,071 989,167,316 Global depository receipts 1,122,069 1,122,069
11.2 Net assets per share
Net assets per share have been calculated, for all periods, based on the number of shares in issue as at 30
June 2014.
11.3 Market price per share
For the Quarter ended 30th June 2014 2013 LKR LKR
Highest 240.10 299.80 Lowest 219.70 243.50 Last traded 219.90 251.50
11.4 Warrants
As at 30-06-2014 31-03-2014
Number of 2015 warrants 43,995,994 43,995,994 Number of 2016 warrants 43,995,994 43,995,994
The above warrants are exercisable in September 2015 and November 2016 respectively and have been considered in calculating the diluted earnings per share.
11.5 Market price per warrant
For the Quarter ended 30th June 2015 warrants 2016 warrants 2014 2013 2014 2013 LKR LKR LKR LKR
Highest 71.50 N/A 77.90 N/A Lowest 58.00 N/A 66.90 N/A Last traded 59.90 N/A 71.10 N/A
24 l John Keells Holdings PLC l www.keells.com
Notes to the Interim Condensed Financial Statements
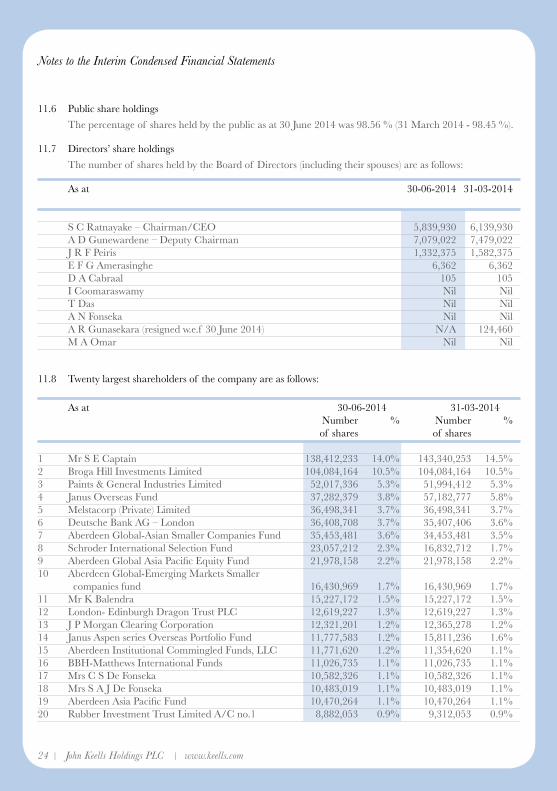
11.6 Public share holdings
The percentage of shares held by the public as at 30 June 2014 was 98.56 % (31 March 2014 - 98.45 %).
11.7 Directors’ share holdings
The number of shares held by the Board of Directors (including their spouses) are as follows:
As at 30-06-2014 31-03-2014
S C Ratnayake – Chairman/CEO 5,839,930 6,139,930 A D Gunewardene – Deputy Chairman 7,079,022 7,479,022 J R F Peiris 1,332,375 1,582,375 E F G Amerasinghe 6,362 6,362 D A Cabraal 105 105 I Coomaraswamy Nil Nil T Das Nil Nil A N Fonseka Nil Nil A R Gunasekara (resigned w.e.f 30 June 2014) N/A 124,460 M A Omar Nil Nil
11.8 Twenty largest shareholders of the company are as follows:
As at 30-06-2014 31-03-2014 Number % Number % of shares of shares
1 Mr S E Captain 138,412,233 14.0% 143,340,253 14.5%2 Broga Hill Investments Limited 104,084,164 10.5% 104,084,164 10.5%3 Paints & General Industries Limited 52,017,336 5.3% 51,994,412 5.3%4 Janus Overseas Fund 37,282,379 3.8% 57,182,777 5.8%5 Melstacorp (Private) Limited 36,498,341 3.7% 36,498,341 3.7%6 Deutsche Bank AG – London 36,408,708 3.7% 35,407,406 3.6%7 Aberdeen Global-Asian Smaller Companies Fund 35,453,481 3.6% 34,453,481 3.5%8 Schroder International Selection Fund 23,057,212 2.3% 16,832,712 1.7%9 Aberdeen Global Asia Pacific Equity Fund 21,978,158 2.2% 21,978,158 2.2%10 Aberdeen Global-Emerging Markets Smaller companies fund 16,430,969 1.7% 16,430,969 1.7%11 Mr K Balendra 15,227,172 1.5% 15,227,172 1.5%12 London- Edinburgh Dragon Trust PLC 12,619,227 1.3% 12,619,227 1.3%13 J P Morgan Clearing Corporation 12,321,201 1.2% 12,365,278 1.2%14 Janus Aspen series Overseas Portfolio Fund 11,777,583 1.2% 15,811,236 1.6%15 Aberdeen Institutional Commingled Funds, LLC 11,771,620 1.2% 11,354,620 1.1%16 BBH-Matthews International Funds 11,026,735 1.1% 11,026,735 1.1%17 Mrs C S De Fonseka 10,582,326 1.1% 10,582,326 1.1%18 Mrs S A J De Fonseka 10,483,019 1.1% 10,483,019 1.1%19 Aberdeen Asia Pacific Fund 10,470,264 1.1% 10,470,264 1.1%20 Rubber Investment Trust Limited A/C no.1 8,882,053 0.9% 9,312,053 0.9%
Chairman’s Message Financial Information
24 l John Keells Holdings PLC l www.keells.com Interim condensed financial statements l 25
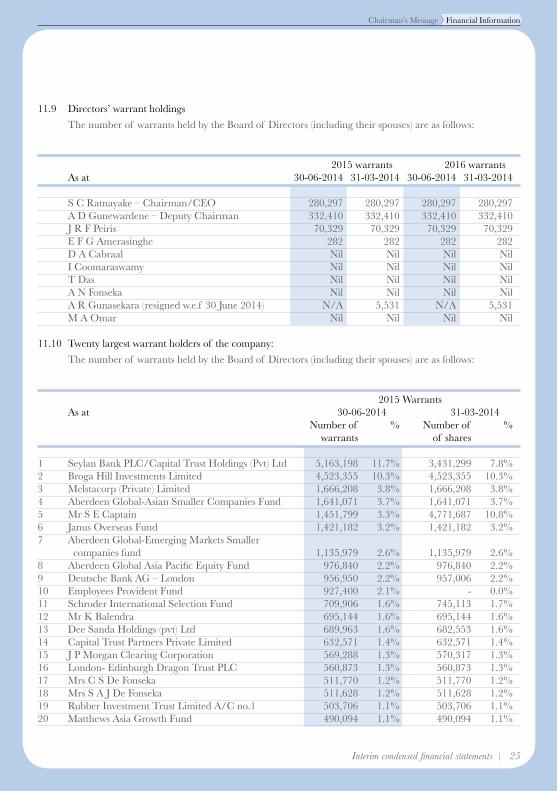
11.9 Directors’ warrant holdings
The number of warrants held by the Board of Directors (including their spouses) are as follows:
2015 warrants 2016 warrants As at 30-06-2014 31-03-2014 30-06-2014 31-03-2014
S C Ratnayake – Chairman/CEO 280,297 280,297 280,297 280,297 A D Gunewardene – Deputy Chairman 332,410 332,410 332,410 332,410 J R F Peiris 70,329 70,329 70,329 70,329 E F G Amerasinghe 282 282 282 282 D A Cabraal Nil Nil Nil Nil I Coomaraswamy Nil Nil Nil Nil T Das Nil Nil Nil Nil A N Fonseka Nil Nil Nil Nil A R Gunasekara (resigned w.e.f 30 June 2014) N/A 5,531 N/A 5,531 M A Omar Nil Nil Nil Nil
11.10 Twenty largest warrant holders of the company:
The number of warrants held by the Board of Directors (including their spouses) are as follows:
2015 Warrants As at 30-06-2014 31-03-2014 Number of % Number of % warrants of shares
1 Seylan Bank PLC/Capital Trust Holdings (Pvt) Ltd 5,163,198 11.7% 3,431,299 7.8%2 Broga Hill Investments Limited 4,523,355 10.3% 4,523,355 10.3%3 Melstacorp (Private) Limited 1,666,208 3.8% 1,666,208 3.8%4 Aberdeen Global-Asian Smaller Companies Fund 1,641,071 3.7% 1,641,071 3.7%5 Mr S E Captain 1,451,799 3.3% 4,771,687 10.8%6 Janus Overseas Fund 1,421,182 3.2% 1,421,182 3.2%7 Aberdeen Global-Emerging Markets Smaller companies fund 1,135,979 2.6% 1,135,979 2.6%8 Aberdeen Global Asia Pacific Equity Fund 976,840 2.2% 976,840 2.2%9 Deutsche Bank AG – London 956,950 2.2% 957,006 2.2%10 Employees Provident Fund 927,400 2.1% - 0.0%11 Schroder International Selection Fund 709,906 1.6% 745,113 1.7%12 Mr K Balendra 695,144 1.6% 695,144 1.6%13 Dee Sanda Holdings (pvt) Ltd 689,963 1.6% 682,553 1.6%14 Capital Trust Partners Private Limited 632,571 1.4% 632,571 1.4%15 J P Morgan Clearing Corporation 569,288 1.3% 570,317 1.3%16 London- Edinburgh Dragon Trust PLC 560,873 1.3% 560,873 1.3%17 Mrs C S De Fonseka 511,770 1.2% 511,770 1.2%18 Mrs S A J De Fonseka 511,628 1.2% 511,628 1.2%19 Rubber Investment Trust Limited A/C no.1 503,706 1.1% 503,706 1.1%20 Matthews Asia Growth Fund 490,094 1.1% 490,094 1.1%

26 l John Keells Holdings PLC l www.keells.com
Notes to the Interim Condensed Financial Statements
11.11 Twenty largest warrant holders of the company:
2016 Warrants As at 30-06-2014 31-03-2014 Number of % Number of % warrants of shares
1 Broga Hill Investments Limited 4,523,355 10.3% 4,523,355 10.3%2 Sampath Bank PLC/Capital Trust Holdings (Pvt) Ltd 3,640,857 8.3% 458,679 1.0%3 Melstacorp (Private) Limited 1,666,208 3.8% 1,666,208 3.8%4 Aberdeen Global-Asian Smaller Companies Fund 1,641,071 3.7% 1,641,071 3.7%5 Janus Overseas Fund 1,421,182 3.2% 1,421,182 3.2%6 Aberdeen Global-Emerging Markets Smaller companies fund 1,135,979 2.6% 1,135,979 2.6%7 Mr S E Captain 1,019,629 2.3% 3,585,861 8.2%8 J.B.Cocoshell (pvt) Ltd 987,403 2.2% 655,509 1.5%9 Aberdeen Global Asia Pacific Equity Fund 976,840 2.2% 976,840 2.2%10 Deutsche Bank AG – London 956,950 2.2% 957,006 2.2%11 Ceylon Investment PLC 822,504 1.9% 822,504 1.9%12 Schroder International Selection Fund 709,906 1.6% 745,113 1.7%13 Mr K Balendra 695,144 1.6% 695,144 1.6%14 Rubber Investment Trust Limited A/C no.1 603,706 1.4% 603,706 1.4%15 Mr R S Captain 595,067 1.4% 39,175 0.1%16 Ms L A Captain 591,610 1.3% - 0.0%17 J P Morgan Clearing Corporation 569,288 1.3% 570,317 1.3%18 London- Edinburgh Dragon Trust PLC 560,873 1.3% 560,873 1.3%19 Mrs C S De Fonseka 511,770 1.2% 511,770 1.2%20 Mrs S A J De Fonseka 511,628 1.2% 511,628 1.2%
12 Dividends paid
Company For the Quarter ended 30th June 2014 2013 LKR’000s
Final dividend for 2013/14 LKR 1.50 (2012/13 LKR 1.50 ) 1,485,620 1,286,460
13 Contingencies, capital and other commitments There has been no significant change in the nature of the contingencies and other commitments, which
were disclosed in the annual report for the year ended 31 March 2014.
14 Events after the reporting period There have been no events subsequent to the reporting date, which require disclosure in the interim
condensed financial statements.

Corporate Information
Name of CompanyJohn Keells Holdings PLC
Legal FormPublic Limited Liability CompanyIncorporated in Sri Lanka in 1979Ordinary Shares listed on theColombo Stock ExchangeGDRs listed on the LuxembourgStock Exchange
Company Registration No.PQ 14
DirectorsS C Ratnayake – ChairmanA D Gunewardene – Deputy ChairmanJ R F PeirisE F G AmerasingheD A CabraalI CoomaraswamyT DasA N FonsekaM A OmarM P Perera
Senior Independent DirectorE F G Amerasinghe
Audit CommitteeA N Fonseka - ChairmanD A CabraalI Coomaraswamy M P Perera
Human Resources and Compensation CommitteeE F G Amerasinghe – ChairmanI CoomaraswamyA N FonsekaM A Omar
Nominations CommitteeT Das – ChairmanE F G AmerasingheD A CabraalM A OmarM P PereraS C Ratnayake
Related Party Transactions Review CommitteeA N Fonseka – ChairmanE F G AmerasingheD A CabraalJ R F PeirisM P PereraS C Ratnayake
BankersBank of CeylonCitibank N.ACommercial BankDeutsche Bank A.GDFCC BankDFCC Vardhana BankHatton National BankHongkong & Shanghai BankingCorporationMuslim Commercial BankNations Trust BankNational Savings BankPan Asia Banking CorporationPeople’s BankSampath BankSeylan BankStandard Chartered Bank
Depository for GDRsCitibank N.ANew York
Registered office of the Company117, Sir Chittampalam A GardinerMawatha, Colombo 2, Sri LankaInternet: www.keells.comEmail: [email protected]
Secretaries and RegistrarsKeells Consultants (Pvt) Limited117, Sir Chittampalam A GardinerMawatha,Colombo 2, Sri LankaTelephone : +94 11 230 6245Facsimile : +94 11 243 9037
Investor RelationsJohn Keells Holdings PLC117, Sir Chittampalam A GardinerMawatha, Colombo 2, Sri LankaTelephone : +94 11 230 6165 +94 11 230 6000Facsimile : +94 11 230 6160Email: [email protected]
Group Sustainability and Enterprise Risk ManagementJohn Keells Holdings PLC117, Sir Chittampalam A GardinerMawatha, Colombo 2, Sri LankaTelephone : +94 11 230 6182Facsimile : +94 11 230 6249Email: [email protected]
Contact for Media Corporate Communications DivisionJohn Keells Holdings PLC117, Sir Chittampalam A GardinerMawatha, Colombo 2, Sri LankaTelephone : +94 11 230 6191Email: [email protected]
AuditorsErnst & YoungChartered AccountantsP.O. Box 101Colombo, Sri Lanka

www.keells.com

![Articles - Ludus-Opuscularmm.ludus-opuscula.org/PDF_Files/Lin_Digital_9_31(5_2016)_low.pdf · Articles Digital root patterns of ... Cecil Balmond and Arup [6], Balmond used a simple](https://img.pdfslide.us/doc/110x75/5b91616c09d3f211298b85f5/articles-ludus-52016lowpdf-articles-digital-root-patterns-of-cecil.jpg)