Embed Size (px)
Citation preview

John Keells Holdings PLC l Year ended 31st March 2015Interim condensed financial statements
Integrated

“When the architect of the Waterfront Integrated Resort Cecil Balmond first visited the site, he visualised a property that represented the vigour of John Keells Holdings and the spirit of a new Sri Lanka. His first impression, on the left, transformed over the next few months into an iconic structure that stands majestic against the Colombo skyline, as shown in the artist’s impressions above.”
“For a growing major city and its main building project, an icon has to stamp a contemporary mark that projects to the future. The strong backdrop and cantilever forms of the Waterfront Integrated Resort provide that dynamic and powerful ambition, that JKH and Sri Lanka subscribe to.”
- Cecil Balmond

Financial Information
Interim condensed financial statements l 1
Consolidated Income Statement
Quarter ended 31st March Year ended 31st March 2015 2014 Change 2015 2014 Change Note Restated % Restated % Sale of goods 16,565,680 15,361,031 8 54,837,835 50,375,911 10Rendering of services 6,100,975 7,138,560 (15) 36,744,384 36,330,515 1Revenue 22,666,655 22,499,591 1 91,582,219 86,706,426 6 Cost of sales (15,925,344) (15,805,729) 1 (66,191,331) (62,711,967) 6 Gross profit 6,741,311 6,693,862 1 25,390,888 23,994,459 6Other operating income 1,812,049 1,325,642 37 3,076,893 2,491,700 23Distribution expenses (665,532) (672,132) (1) (3,212,685) (3,062,125) 5Administrative expenses (1,911,669) (2,327,198) (18) (10,088,749) (10,128,389) -Other operating expenses (605,818) (634,117) (4) (3,091,162) (3,055,439) 1 Results from operating activities 5,370,341 4,386,057 22 12,075,185 10,240,206 18 Finance cost (126,587) (239,509) (47) (668,174) (1,217,006) (45)Finance income 1,449,300 1,700,662 (15) 8,122,497 5,770,875 41Net finance income 1,322,713 1,461,153 (9) 7,454,323 4,553,869 64Change in insurance contract liabilities 8 (810,649) (969,937) (16) (3,799,000) (3,033,057) 25 Change in fair value of investment property 48,666 470,292 (90) 48,666 470,292 (90)Share of results of equity accounted investments 984,969 857,927 15 3,296,139 3,089,123 7 Profit before tax 6,916,040 6,205,492 11 19,075,313 15,320,433 25 Tax expense 9 (1,214,315) (1,051,455) 15 (3,329,776) (2,362,106) 41 Profit for the period 5,701,725 5,154,037 11 15,745,537 12,958,327 22 Attributable to : Equity holders of the parent 5,222,496 4,681,485 12 14,348,193 11,721,806 22 Non-controlling interest 479,229 472,552 1 1,397,344 1,236,521 13 5,701,725 5,154,037 11 15,745,537 12,958,327 22
LKR LKR LKR LKR
Earnings per share Basic 5.24 4.73 14.44 12.61 Diluted 5.13 4.63 14.15 12.33 Dividend per share 1.00 1.00 3.50 3.50
Note : All values are in LKR ‘000s, unless otherwise stated. Figures in brackets indicate deductions. The figures relating to the fourth quarter are not audited.
2 l John Keells Holdings PLC l www.keells.com
Consolidated Statement of Comprehensive Income
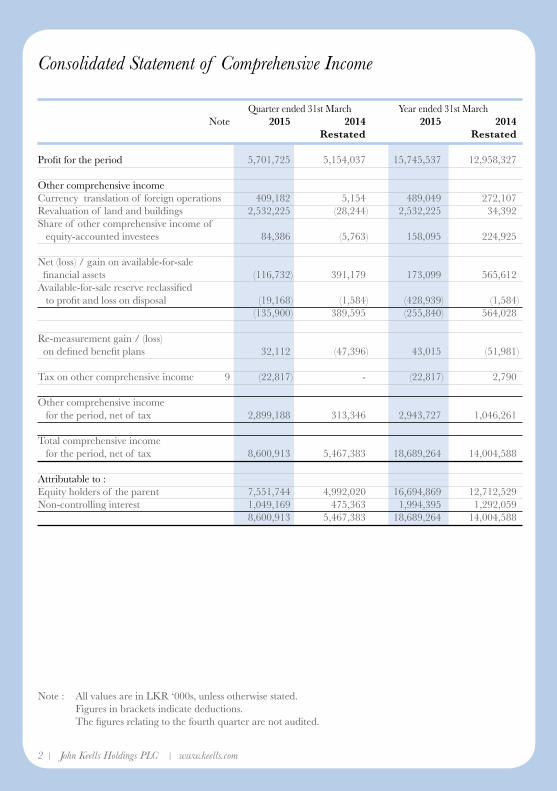
Quarter ended 31st March Year ended 31st March Note 2015 2014 2015 2014 Restated Restated Profit for the period 5,701,725 5,154,037 15,745,537 12,958,327 Other comprehensive income Currency translation of foreign operations 409,182 5,154 489,049 272,107 Revaluation of land and buildings 2,532,225 (28,244) 2,532,225 34,392 Share of other comprehensive income of equity-accounted investees 84,386 (5,763) 158,095 224,925 Net (loss) / gain on available-for-sale financial assets (116,732) 391,179 173,099 565,612 Available-for-sale reserve reclassified to profit and loss on disposal (19,168) (1,584) (428,939) (1,584) (135,900) 389,595 (255,840) 564,028 Re-measurement gain / (loss) on defined benefit plans 32,112 (47,396) 43,015 (51,981) Tax on other comprehensive income 9 (22,817) - (22,817) 2,790 Other comprehensive income for the period, net of tax 2,899,188 313,346 2,943,727 1,046,261 Total comprehensive income for the period, net of tax 8,600,913 5,467,383 18,689,264 14,004,588 Attributable to : Equity holders of the parent 7,551,744 4,992,020 16,694,869 12,712,529 Non-controlling interest 1,049,169 475,363 1,994,395 1,292,059 8,600,913 5,467,383 18,689,264 14,004,588
Note : All values are in LKR ‘000s, unless otherwise stated. Figures in brackets indicate deductions. The figures relating to the fourth quarter are not audited.

Financial Information
2 l John Keells Holdings PLC l www.keells.com Interim condensed financial statements l 3
Consolidated Statement of Financial Position
As at 31.03.2015 31.03.2014 Restated ASSETS Non-current assets Property, plant and equipment 49,562,595 47,406,292 Lease rentals paid in advance 8,709,033 9,096,488 Investment property 4,608,941 4,440,227 Intangible assets 2,719,457 2,472,254 Investments in associates & joint ventures 16,345,490 15,049,407 Other non current financial assets 19,708,688 21,068,778 Deferred tax assets 108,585 131,683 Other non current assets 25,830,029 19,709,673 127,592,818 119,374,802
Current assets Inventories 5,588,916 6,966,020 Trade and other receivables 10,269,689 12,146,573 Amounts due from related parties 185,085 334,096 Other current assets 2,398,142 2,601,091 Short term investments 67,540,668 54,359,578 Cash in hand and at bank 4,510,526 5,799,053 90,493,026 82,206,411 Total assets 218,085,844 201,581,213 EQUITY AND LIABILITIES Equity attributable to equity holders of the parent Stated capital 50,702,701 49,748,814 Revenue reserves 62,593,948 51,303,646 Other components of equity 24,501,278 21,844,690 137,797,927 122,897,150 Non-controlling interest 12,278,883 11,420,940 Total equity 150,076,810 134,318,090
Non-current liabilities Insurance contract liabilities 23,931,966 20,273,009 Interest bearing loans and borrowings 4,899,576 9,968,646 Deferred tax liabilities 1,625,394 1,328,479 Employee benefit liabilities 1,494,711 1,502,246 Other deferred liabilities 103,297 89,540 Other non-current liabilities 781,967 392,519 32,836,911 33,554,439
Current liabilities Trade and other payables 11,267,339 14,236,381 Amounts due to related parties 26,488 14,142 Income tax payable 1,592,079 908,100 Short term borrowings 12,622,740 9,751,976 Interest bearing loans and borrowings 4,459,213 3,664,399 Other current liabilities 3,251,881 2,380,149 Bank overdrafts 1,952,383 2,753,537 35,172,123 33,708,684
Total equity and liabilities 218,085,844 201,581,213
LKR LKR
Net assets per share 138.15 123.21 Note : All values are in LKR ‘000s, unless otherwise stated. I certify that the financial statements comply with the requirements of the Companies Act No.7 of 2007.
M J S Rajakariar Group Financial Controller The Board of Directors is responsible for the preparation and presentation of these financial statements.
S C Ratnayake J R F Peiris Chairman Group Finance Director 26 May 2015

4 l John Keells Holdings PLC l www.keells.com
Consolidated Statement of Cash Flows
For the year ended 31st March Note 2015 2014 Restated CASH FLOWS FROM OPERATING ACTIVITIES Profit before working capital changes A 11,387,283 10,613,970 (Increase) / Decrease in inventories 1,377,104 (240,350)(Increase) / Decrease in trade and other receivables (71,986) 237,830 (Increase) / Decrease in other current assets (368,770) 335,392 (Increase) / Decrease in other non-current assets (6,120,356) (10,908,060)Increase / (Decrease) in trade and other payables 2,244,620 (199,145)Increase / (Decrease) in other current liabilities 1,030,600 687,402 Increase / (Decrease) in insurance contract liabilities 3,658,957 2,884,515 Cash generated from operations 13,137,452 3,411,554 Finance income received 7,413,741 5,163,796 Finance costs paid (654,546) (1,203,377)Dividend received 2,396,850 2,823,453 Tax paid (1,294,454) (1,994,282)Gratuity paid (144,335) (159,416)Net cash flow from operating activities 20,854,708 8,041,728 CASH FLOWS FROM/(USED IN) INVESTING ACTIVITIES Purchase and construction of property, plant and equipment (2,999,475) (3,798,836)Purchase of intangible assets (280,490) (46,215)Addition to investment property (3,101) (22,604)Purchase of lease rights (167,000) - Increase in interest in associates (113,090) (31,840)Proceeds from sale of property, plant and equipment and intangible assets 265,000 228,222 Proceeds from demolition on property, plant and equipment - 37,613 Proceeds from the sale of non-current investments B 3,460,528 - Proceeds from the sale of interests in associates - 2,072,519 Proceeds from sale of financial instruments - fair valued through profit or loss 506,063 302,978 Purchase of financial instruments - fair valued through profit or loss (754,733) (958,758)(Purchase) / disposal of short term investments (net) 3,025,319 (15,810,326)(Purchase) / disposal of other non current financial assets (net) (4,194,367) (1,683,227)Net cash flow from / (used in) investing activities (1,255,346) (19,710,474) CASH FLOWS FROM/(USED IN) FINANCING ACTIVITIES Proceeds from issue of shares 953,887 23,268,418 Proceeds from non-controlling interests on issue of rights in subsidiaries - 425 Direct cost on issue of shares (3,139) (227,885)Acquisition of non-controlling interest - (57,000)Dividend paid to equity holders of parent (3,475,947) (3,266,718)Dividend paid to shareholders with non-controlling interest (793,276) (598,347)Proceeds from long term borrowings 1,014,970 3,067,078 Repayment of long term borrowings (5,405,012) (4,638,230)Proceeds from/(repayment of) other financial liabilities (net) 2,870,764 7,898,209 Net cash flow from / (used in) financing activities (4,837,753) 25,445,950 NET INCREASE / (DECREASE) IN CASH AND CASH EQUIVALENTS 14,761,609 13,777,204 CASH AND CASH EQUIVALENTS AT THE BEGINNING 30,407,536 16,630,332 CASH AND CASH EQUIVALENTS AT THE END 45,169,145 30,407,536 ANALYSIS OF CASH AND CASH EQUIVALENTS Favorable balances Short term investments 42,611,002 27,362,020 Cash in hand and at bank 4,510,526 5,799,053 Unfavorable balances Bank overdrafts (1,952,383) (2,753,537)Total Cash and cash equivalents 45,169,145 30,407,536
Note : All values are in LKR ‘000s, unless otherwise stated. Figures in brackets indicate deductions.

Financial Information
4 l John Keells Holdings PLC l www.keells.com Interim condensed financial statements l 5
For the year ended 31st March 2015 2014 Restated A Profit before working capital changes Profit before tax 19,075.313 15,320,433 Adjustments for: Finance income (8,122,497) (5,770,875) Finance cost 668,174 1,217,006 Share-based payment expense 347,092 215,626 Change in fair value of investment property (48,666) (470,292) Share of results of equity accounted investments (3,296,139) (3,089,123) Profit/(Loss) on sale of non-current investments (1,221,460) (820,926) Depreciation of property, plant and equipment 2,767,323 2,568,510 Provision for impairment losses 10,561 195,471 (Profit)/Loss on sale of property, plant and equipment and intangible assets (91,935) 40,957 Amortisation of lease rentals paid in advance 714,115 679,809 Amortisation of intangible assets 234,198 239,315 Amortisation of other deferred liabilities (512) (512) Gratuity provision and related costs 286,373 262,204 Unrealised (gain) / loss on foreign exchange (net) 65,319 26,381 Unrealised (profit) / loss on sale of goods to associates 24 (14) 11,387,283 10,613,970
B Union Assurance General Limited In compliance with the requirements of the Regulation of Insurance Industry Act No 3 of 2011, Union Assurance PLC (UAPLC), a subsidiary of the Group has completed the segregation of its long term and general insurance business by the transfer of the general insurance business to a newly formed company, Union Assurance General Ltd. (UAGL) on 1 January 2015. Immediately after the aforesaid segregation, UAPLC disposed 78% of its stake in UAGL to Fairfax Asia Ltd. Value recognised In LKR’000s on disposal ASSETS Property, plant and equipment 112,944 Other non current financial assets 5,338,016 Trade and other receivables 2,471,880 Deferred tax assets 29,204 Deferred acquition cost 167,017 Cash in hand and at bank 274,694 LIABILITIES Insurance contract liability (3,653,048) Trade and other payables (1,158,820) Deferred revenue (130,328) Employee benefit liabilities (106,561) Current tax liabilities (141,518) Bank overdraft (70,842) Total identifiable net assets 3,132,638 Transferred to investments in equity accounted investees (689,718) Profit on disposal of general insurance business 1,221,460 Cash consideration received 3,664,380 Cash and cash equivalents disposed (203,852) Net cash inflow on disposal of non current investments 3,460,528 Note : All values are in LKR ‘000s, unless otherwise stated. Figures in brackets indicate deductions.

6 l John Keells Holdings PLC l www.keells.com
Consolidated Statement of Changes in Equity
Att
ribu
tabl
e to
equ
ity h
olde
rs o
f pa
rent
Sta
ted
cap
ital
Rev
alua
tion
res
erve
F
orei
gn
curr
ency
tr
ansla
tion
res
erve
Oth
er
cap
ital
res
erve
s
Ava
ilabl
e fo
r s
ale
rese
rve
Rev
enue
r
eser
ves
Tot
al
Non
-co
ntro
lling
in
tere
st
Tot
al
equ
ity
As
at 1
Apr
il 20
14 (R
esta
ted)
49,
748,
814
17
,770
,505
3
,179
,071
2
15,6
26
679
,488
5
1,30
3,64
6 1
22,8
97,1
50
11,
420,
940
134
,318
,090
Profi
t for
the
peri
od -
- -
- -
14,
348,
193
14,
348,
193
1,3
97,3
44
15,
745,
537
Oth
er c
ompr
ehen
sive
inco
me
- 1
,986
,971
5
91,4
25
- (2
63,8
35)
32,
115
2,3
46,6
76
597
,051
2
,943
,727
T
otal
com
preh
ensi
ve in
com
e -
1,9
86,9
71
591
,425
-
(263
,835
) 1
4,38
0,30
8 1
6,69
4,86
9 1
,994
,395
1
8,68
9,26
4 E
xerc
ise
of s
hare
opt
ions
953
,887
-
- -
- -
953
,887
-
953
,887
D
irec
t cos
t on
issu
e of
sha
res
- -
- -
- (2
,877
) (2
,877
) (2
62)
(3,1
39)
Rea
lisat
ion
of r
eval
uatio
n re
serv
e -
(5,0
65)
- -
- 5
,065
-
- -
Shar
e ba
sed
paym
ents
- -
- 3
47,0
92
- -
347
,092
-
347
,092
Fi
nal d
ivid
end
paid
- 20
13/1
4 -
- -
- -
(1,4
85,6
20)
(1,4
85,6
20)
- (1
,485
,620
)In
teri
m d
ivid
end
paid
- 20
14/1
5 -
- -
- -
(1,9
90,3
27)
(1,9
90,3
27)
- (1
,990
,327
)Su
bsid
iary
div
iden
d to
non
-co
ntro
lling
inte
rest
- -
- -
- 3
51,0
26
351
,026
(1
,144
,302
) (7
93,2
76)
Acq
uisi
tion,
dis
posa
l and
cha
nges
in
non
-con
trol
ling
inte
rest
" -
- -
- -
32,
727
32,
727
8,1
12
40,
839
As
at 3
1 M
arch
201
5 5
0,70
2,70
1
19,7
52,4
11
3,7
70,4
96
562
,718
4
15,6
53
62,
593,
948
137
,797
,927
1
2,27
8,88
3 1
50,0
76,8
10
As
at 1
Apr
il 20
13 (R
esta
ted)
26,
480,
396
17
,780
,432
2
,729
,857
-
124
,282
4
2,70
4,20
3 8
9,81
9,17
0 1
1,15
9,81
3 1
00,9
78,9
83
Profi
t for
the
peri
od (R
esta
ted)
- -
- -
- 1
1,72
1,80
6 1
1,72
1,80
6 1
,236
,521
1
2,95
8,32
7 O
ther
com
preh
ensi
ve in
com
e (R
esta
ted)
- (9
,927
) 4
49,2
14
- 5
55,2
06
(3,7
70)
990
,723
5
5,53
8 1
,046
,261
T
otal
com
preh
ensi
ve in
com
e -
(9,9
27)
449
,214
-
555
,206
1
1,71
8,03
6 1
2,71
2,52
9 1
,292
,059
1
4,00
4,58
8 Is
sue
of r
ight
s 2
3,09
7,89
7 2
3,09
7,89
7 2
3,09
7,89
7 D
irec
t cos
t on
issu
e of
sha
res
- -
- -
- (2
19,1
01)
(219
,101
) (8
,784
) (2
27,8
85)
Exe
rcis
e of
sha
re o
ptio
ns 1
70,5
21
- -
- -
- 1
70,5
21
- 1
70,5
21
Shar
e ba
sed
paym
ents
- -
- 2
15,6
26
- -
215
,626
-
215
,626
Fi
nal d
ivid
end
paid
- 20
12/1
3 -
- -
- -
(1,2
86,4
60)
(1,2
86,4
60)
- (1
,286
,460
)In
teri
m d
ivid
end
paid
- 20
13/1
4 -
- -
- -
(1,9
80,2
58)
(1,9
80,2
58)
- (1
,980
,258
)Su
bsid
iary
div
iden
d to
non
-co
ntro
lling
inte
rest
(Res
tate
d) -
- -
- -
404
,132
4
04,1
32
(1,0
02,4
79)
(598
,347
)A
cqui
sitio
n, d
ispo
sal a
nd c
hang
es in
n
on-c
ontr
ollin
g in
tere
st -
- -
- -
(36,
906)
(36,
906)
(19,
669)
(56,
575)
As
at 3
1 M
arch
201
4 (R
esta
ted)
49,
748,
814
17
,770
,505
3
,179
,071
2
15,6
26
679
,488
5
1,30
3,64
6 1
22,8
97,1
50
11,
420,
940
134
,318
,090
Not
e :
All
valu
es a
re in
LK
R ‘0
00s,
unle
ss o
ther
wis
e st
ated
.
Figu
res
in b
rack
ets
indi
cate
ded
uctio
ns.

Financial Information
6 l John Keells Holdings PLC l www.keells.com Interim condensed financial statements l 7
Company Income Statement
A
ttri
buta
ble
to e
quity
hol
ders
of
pare
nt
Sta
ted
cap
ital
Rev
alua
tion
res
erve
F
orei
gn
curr
ency
tr
ansla
tion
res
erve
Oth
er
cap
ital
res
erve
s
Ava
ilabl
e fo
r s
ale
rese
rve
Rev
enue
r
eser
ves
Tot
al
Non
-co
ntro
lling
in
tere
st
Tot
al
equ
ity
As
at 1
Apr
il 20
14 (R
esta
ted)
49,
748,
814
17
,770
,505
3
,179
,071
2
15,6
26
679
,488
5
1,30
3,64
6 1
22,8
97,1
50
11,
420,
940
134
,318
,090
Profi
t for
the
peri
od -
- -
- -
14,
348,
193
14,
348,
193
1,3
97,3
44
15,
745,
537
Oth
er c
ompr
ehen
sive
inco
me
- 1
,986
,971
5
91,4
25
- (2
63,8
35)
32,
115
2,3
46,6
76
597
,051
2
,943
,727
T
otal
com
preh
ensi
ve in
com
e -
1,9
86,9
71
591
,425
-
(263
,835
) 1
4,38
0,30
8 1
6,69
4,86
9 1
,994
,395
1
8,68
9,26
4 E
xerc
ise
of s
hare
opt
ions
953
,887
-
- -
- -
953
,887
-
953
,887
D
irec
t cos
t on
issu
e of
sha
res
- -
- -
- (2
,877
) (2
,877
) (2
62)
(3,1
39)
Rea
lisat
ion
of r
eval
uatio
n re
serv
e -
(5,0
65)
- -
- 5
,065
-
- -
Shar
e ba
sed
paym
ents
- -
- 3
47,0
92
- -
347
,092
-
347
,092
Fi
nal d
ivid
end
paid
- 20
13/1
4 -
- -
- -
(1,4
85,6
20)
(1,4
85,6
20)
- (1
,485
,620
)In
teri
m d
ivid
end
paid
- 20
14/1
5 -
- -
- -
(1,9
90,3
27)
(1,9
90,3
27)
- (1
,990
,327
)Su
bsid
iary
div
iden
d to
non
-co
ntro
lling
inte
rest
- -
- -
- 3
51,0
26
351
,026
(1
,144
,302
) (7
93,2
76)
Acq
uisi
tion,
dis
posa
l and
cha
nges
in
non
-con
trol
ling
inte
rest
" -
- -
- -
32,
727
32,
727
8,1
12
40,
839
As
at 3
1 M
arch
201
5 5
0,70
2,70
1
19,7
52,4
11
3,7
70,4
96
562
,718
4
15,6
53
62,
593,
948
137
,797
,927
1
2,27
8,88
3 1
50,0
76,8
10
As
at 1
Apr
il 20
13 (R
esta
ted)
26,
480,
396
17
,780
,432
2
,729
,857
-
124
,282
4
2,70
4,20
3 8
9,81
9,17
0 1
1,15
9,81
3 1
00,9
78,9
83
Profi
t for
the
peri
od (R
esta
ted)
- -
- -
- 1
1,72
1,80
6 1
1,72
1,80
6 1
,236
,521
1
2,95
8,32
7 O
ther
com
preh
ensi
ve in
com
e (R
esta
ted)
- (9
,927
) 4
49,2
14
- 5
55,2
06
(3,7
70)
990
,723
5
5,53
8 1
,046
,261
T
otal
com
preh
ensi
ve in
com
e -
(9,9
27)
449
,214
-
555
,206
1
1,71
8,03
6 1
2,71
2,52
9 1
,292
,059
1
4,00
4,58
8 Is
sue
of r
ight
s 2
3,09
7,89
7 2
3,09
7,89
7 2
3,09
7,89
7 D
irec
t cos
t on
issu
e of
sha
res
- -
- -
- (2
19,1
01)
(219
,101
) (8
,784
) (2
27,8
85)
Exe
rcis
e of
sha
re o
ptio
ns 1
70,5
21
- -
- -
- 1
70,5
21
- 1
70,5
21
Shar
e ba
sed
paym
ents
- -
- 2
15,6
26
- -
215
,626
-
215
,626
Fi
nal d
ivid
end
paid
- 20
12/1
3 -
- -
- -
(1,2
86,4
60)
(1,2
86,4
60)
- (1
,286
,460
)In
teri
m d
ivid
end
paid
- 20
13/1
4 -
- -
- -
(1,9
80,2
58)
(1,9
80,2
58)
- (1
,980
,258
)Su
bsid
iary
div
iden
d to
non
-co
ntro
lling
inte
rest
(Res
tate
d) -
- -
- -
404
,132
4
04,1
32
(1,0
02,4
79)
(598
,347
)A
cqui
sitio
n, d
ispo
sal a
nd c
hang
es in
n
on-c
ontr
ollin
g in
tere
st -
- -
- -
(36,
906)
(36,
906)
(19,
669)
(56,
575)
As
at 3
1 M
arch
201
4 (R
esta
ted)
49,
748,
814
17
,770
,505
3
,179
,071
2
15,6
26
679
,488
5
1,30
3,64
6 1
22,8
97,1
50
11,
420,
940
134
,318
,090
Not
e :
All
valu
es a
re in
LK
R ‘0
00s,
unle
ss o
ther
wis
e st
ated
.
Figu
res
in b
rack
ets
indi
cate
ded
uctio
ns.
Quarter ended 31st March Year ended 31st March Note 2015 2014 Change % 2015 2014 Change% Rendering of services 276,999 210,029 32 926,336 808,504 15 Revenue 276,999 210,029 32 926,336 808,504 15 Cost of sales (112,417) (111,116) 1 (473,597) (417,240) 14 Gross profit 164,582 98,913 66 452,739 391,264 16 Dividend income 4,810,323 2,490,995 93 8,843,908 6,527,675 35 Other operating income 10,770 700,582 (98) 71,049 720,161 (90) Administrative expenses (407,700) (221,451) 84 (1,346,059) (1,037,794) 30 Other operating expenses (9,761) (8,468) 15 (36,919) (34,417) 7 Results from operating activities 4,568,214 3,060,571 49 7,984,718 6,566,889 22 Finance cost (20,557) (48,344) (57) (100,890) (252,094) (60) Finance income 718,503 685,839 5 3,772,223 2,002,105 88 Net finance income 697,946 637,495 9 3,671,333 1,750,011 110 Profit before tax 5,266,160 3,698,066 42 11,656,051 8,316,900 40 Tax expense 9 (142,526) (237,011) (40) (517,238) (419,727) 23 Profit for the period 5,123,634 3,461,055 48 11,138,813 7,897,173 41
LKR LKR LKR LKR Dividend per share 1.00 1.00 3.50 3.50
Note : All values are in LKR ‘000s, unless otherwise stated. Figures in brackets indicate deductions. The figures relating to the fourth quarter are not audited.

8 l John Keells Holdings PLC l www.keells.com
Company Statement of Comprehensive Income
Quarter ended 31st March Year ended 31st March Note 2015 2014 2015 2014
Profit for the period 5,123,634 3,461,055 11,138,813 7,897,173 Other comprehensive income Net (loss)/gain on available-for-sale financial assets 9,595 218,551 124,058 377,986 Available-for-sale reserve reclassified to profit and loss on disposal (11,050) - (420,821) - (1,455) 218,551 (296,763) 377,986 Re-measurement gain/(loss) on defined benefit plans 5,415 1,314 5,415 1,314 Tax on other comprehensive income 9 - - - - Other comprehensive income for the period, net of tax 3,960 219,865 (291,348) 379,300 Total comprehensive income for the period, net of tax 5,127,594 3,680,920 10,847,465 8,276,473
Note : All values are in LKR ‘000s, unless otherwise stated. Figures in brackets indicate deductions. The figures relating to the fourth quarter are not audited.
Financial Information
8 l John Keells Holdings PLC l www.keells.com Interim condensed financial statements l 9
Company Statement of Financial Position
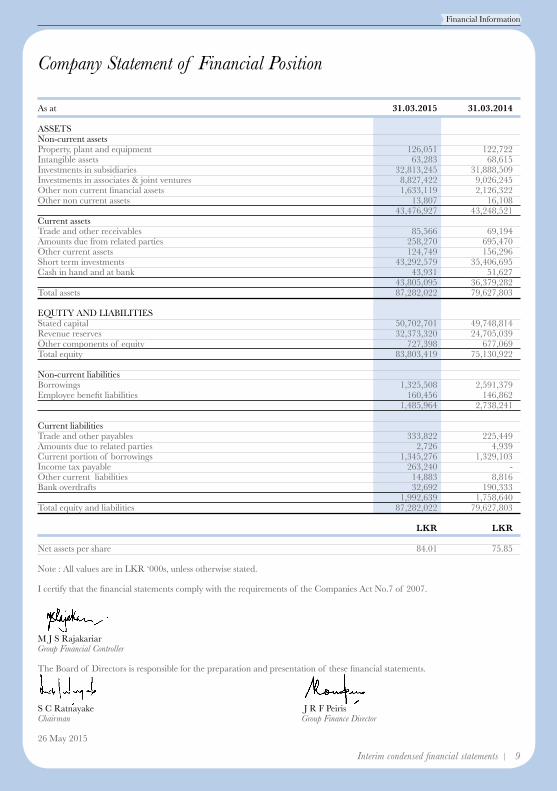
As at 31.03.2015 31.03.2014 ASSETS Non-current assets Property, plant and equipment 126,051 122,722 Intangible assets 63,283 68,615 Investments in subsidiaries 32,813,245 31,888,509 Investments in associates & joint ventures 8,827,422 9,026,245 Other non current financial assets 1,633,119 2,126,322 Other non current assets 13,807 16,108 43,476,927 43,248,521 Current assets Trade and other receivables 85,566 69,194 Amounts due from related parties 258,270 695,470 Other current assets 124,749 156,296 Short term investments 43,292,579 35,406,695 Cash in hand and at bank 43,931 51,627 43,805,095 36,379,282 Total assets 87,282,022 79,627,803 EQUITY AND LIABILITIES Stated capital 50,702,701 49,748,814 Revenue reserves 32,373,320 24,705,039 Other components of equity 727,398 677,069 Total equity 83,803,419 75,130,922 Non-current liabilitiesBorrowings 1,325,508 2,591,379 Employee benefit liabilities 160,456 146,862 1,485,964 2,738,241 Current liabilities Trade and other payables 333,822 225,449 Amounts due to related parties 2,726 4,939 Current portion of borrowings 1,345,276 1,329,103 Income tax payable 263,240 - Other current liabilities 14,883 8,816 Bank overdrafts 32,692 190,333 1,992,639 1,758,640 Total equity and liabilities 87,282,022 79,627,803
LKR LKR
Net assets per share 84.01 75.85
Note : All values are in LKR ‘000s, unless otherwise stated. I certify that the financial statements comply with the requirements of the Companies Act No.7 of 2007.
M J S Rajakariar Group Financial Controller The Board of Directors is responsible for the preparation and presentation of these financial statements.
S C Ratnayake J R F Peiris Chairman Group Finance Director 26 May 2015

10 l John Keells Holdings PLC l www.keells.com
Company Statement of Cash Flows
For the year ended 31st March Note 2015 2014 CASH FLOWS FROM OPERATING ACTIVITIES Profit before tax 11,656,051 8,316,900 Finance income (3,772,223) (2,002,105) Dividend income (8,843,908) (6,527,675) Finance cost 100,890 252,094 Profit on sale of non current investments (47,900) (688,235) Depreciation of property, plant and equipment 30,434 23,477 Loss on sale of property, plant and equipment and intangible assets (804) (6) Amortisation of intangible assets 23,008 25,050 Share based payment expenses 111,092 66,555 Provision for impairment losses 311,913 220,525 Gratuity provision and related costs 24,907 23,182 Profit before working capital changes (406,540) (290,238) (Increase) / Decrease in trade and other receivables (27,111) 1,411,770 (Increase) / Decrease in other current assets 9,777 (27,956)(Increase) / Decrease in other non-current assets 2,302 (5,799)Increase / (Decrease) in trade and other payables 106,155 (12,759)Increase / (Decrease) in other current liabilities 6,067 (96,662)Cash generated from operations (309,350) 978,356 Finance income received 2,632,685 1,435,581 Finance expenses paid (112,218) (263,286)Dividend received 9,361,361 6,010,515 Tax paid (218,598) (149,472)Gratuity paid (5,898) (9,081)Net cash flow from operating activities 11,347,982 8,002,613 CASH FLOWS FROM/ (USED IN) INVESTING ACTIVITIES Purchase and construction of property, plant and equipment (38,763) (70,988)Purchase of intangible assets (17,676) (19,661)Increase in interest in subsidiaries (688,835) (5,391,697)Increase in interest in associates (113,090) (31,840)Proceeds from sale of Property, plant and equipment 5,803 104 Proceeds from sale of interest in associates - 1,588,235 Proceeds from sale of interest in associates 48,000 - (Purchase) / disposal of short term investments (net) 5,085,895 (13,273,680)(Purchase) / disposal of other non current financial assets (net) 1,205,164 (37,683)Net cash flow from/(used in) investing activities 5,486,498 (17,237,210) CASH FLOWS FROM / (USED IN) FINANCING ACTIVITIES Proceeds from issue of shares 953,887 23,268,418 Direct cost on issue of shares - (148,486)Dividend paid (3,475,947) (3,266,718)Repayment of long term borrowings (1,311,510) (1,295,326)Net cash flow from / (used in) financing activities (3,833,570) 18,557,888 NET (DECREASE) / INCREASE IN CASH AND CASH EQUIVALENTS 13,000,910 9,323,291 CASH AND CASH EQUIVALENTS AT THE BEGINNING 14,756,634 5,433,343 CASH AND CASH EQUIVALENTS AT THE END 27,757,544 14,756,634 ANALYSIS OF CASH & CASH EQUIVALENTS Favorable balances Short term investments 27,746,305 14,895,340 Cash in hand and at bank 43,931 51,627 27,790,236 14,946,967 Unfavorable balances Bank overdrafts (32,692) (190,333) 27,757,544 14,756,634
Note : All values are in LKR ‘000s, unless otherwise stated. Figures in brackets indicate deductions.

Financial Information
10 l John Keells Holdings PLC l www.keells.com Interim condensed financial statements l 11
Company Statement of Changes in Equity
Stated Other Available Revenue Total capital capital for reserves Equity reserve sale reserve As at 1 April 2014 49,748,814 215,626 461,443 24,705,039 75,130,922 Profit for the period - - - 11,138,813 11,138,813 Other comprehensive income - - (296,763) 5,415 (291,348)Total comprehensive income - - (296,763) 11,144,228 10,847,465 Exercise of share option 953,887 - - - 953,887 Share based payments - 347,092 - - 347,092 Final dividend paid - 2013/14 - - - (1,485,620) (1,485,620)Interim dividend paid - 2014/15 - - - (1,990,327) (1,990,327)As at 31 March 2015 50,702,701 562,718 164,680 32,373,320 83,803,419 As at 1 April 2013 26,480,396 - 83,457 20,221,756 46,785,609 Profit for the period - - - 7,897,173 7,897,173 Other comprehensive income - - 377,986 1,314 379,300 Total comprehensive income - - 377,986 7,898,487 8,276,473 Issue of rights 23,097,897 - - - 23,097,897 Direct cost on issue of shares - - - (148,486) (148,486)Exercise of share option 170,521 - - - 170,521 Share based payments - 215,626 - - 215,626 Final dividend paid - 2012/13 - - - (1,286,460) (1,286,460)Interim dividend paid - 2013/14 - - - (1,980,258) (1,980,258) As at 31 March 2014 49,748,814 215,626 461,443 24,705,039 75,130,922
Note : All values are in LKR ‘000s, unless otherwise stated. Figures in brackets indicate deductions.

12 l John Keells Holdings PLC l www.keells.com
Business segmentsThe following tables present revenue, profit information and other disclosures regarding Group’s business segments.
Transportation Leisure Property Consumer Foods & Retail
Financial Services Information Technology Others Group Total
For the Quarter ended 31st March 2015 2014Restated
2015 2014Restated
2015 2014 2015 2014 2015 2014 2015 2014Restated
2015 2014 2015 2014Restated
External revenue 1,191,795 2,027,537 7,375,426 7,240,879 1,935,651 1,542,502 7,966,291 6,720,036 1,450,568 2,332,613 1,836,000 1,580,006 910,924 1,056,018 22,666,655 22,499,591
Inter segment revenue 107,302 133,094 11,027 12,588 25,708 56,610 56,441 99,474 27,410 24,332 52,993 69,781 (4,088) (78,656) 276,793 317,223
Total segment revenue 1,299,097 2,160,631 7,386,453 7,253,467 1,961,359 1,599,112 8,022,732 6,819,510 1,477,978 2,356,945 1,888,993 1,649,787 906,836 977,362 22,943,448 22,816,814
Eliminations of inter segment revenue (276,793) (317,223)
Net revenue 22,666,655 22,499,591
Segment results (55,813) (50,625) 2,262,030 2,286,019 651,932 414,422 912,722 878,881 60,652 128,264 113,270 137,179 (305,968) 541,069 3,638,825 4,335,209
Finance cost (11,082) (15,891) (43,623) (88,695) (38,431) (12,479) 2,091 (26,560) (6) (2,215) (2,534) (12,567) (33,002) (81,102) (126,587) (239,509)
Finance income 14,602 38,536 81,054 98,479 92,104 36,767 18,428 26,565 35,954 34,324 8,744 7,071 718,247 678,501 969,133 920,243
Change in fair value of investment property - - - - 4,823 390,636 8,975 71,796 - - - - 34,868 7,860 48,666 470,292
Share of results of equity accounted investments
716,390 587,324 7,677 - - - - - 260,902 253,925 - 8,931 - 7,747 984,969 857,927
Eliminations / adjustments (23,135) 3,018 (17,295) 1,098 (130,001) 18,559 4,415 (352,955) 1,221,460 651 (2,541) (19,124) 348,131 210,083 1,401,034 (138,670)
Profit / (loss) before tax 640,962 562,362 2,289,843 2,296,901 580,427 847,905 946,631 597,727 1,578,962 414,949 116,939 121,490 762,276 1,364,158 6,916,040 6,205,492
Tax expense (14,868) (12,855) (277,380) (300,799) (31,431) (7,537) (281,818) (117,987) (42,831) (103,137) (26,916) (27,651) (539,071) (481,489) (1,214,315) (1,051,455)
Profit / (loss) for the period 626,094 549,507 2,012,463 1,996,102 548,996 840,368 664,813 479,740 1,536,131 311,812 90,023 93,839 223,205 882,669 5,701,725 5,154,037
Purchase and construction of PPE (2,264) (15,381) 327,494 345,472 198,308 1,764 173,465 691,402 36,645 (24,049) 22,412 18,236 10,066 29,894 766,126 1,047,338
Addition to IA 3,000 6,803 42,295 - - - (20,730) 52 - 4,594 2,096 (372) 3,350 5,872 30,011 16,949
Depreciation of PPE 2,385 1,322 407,633 334,283 (6,847) 10,384 193,651 163,442 31,085 39,717 44,743 25,518 24,245 28,521 696,895 603,187
Amortisation / impairment of IA (6,085) - - - - - 2,852 (578) 47,066 48,633 2,090 (936) 5,769 6,362 51,692 53,481
Amortisation of LRPA - - 201,719 170,203 - - - - - - - - 295 295 202,014 170,498
Gratuity provision and related costs (3,648) (895) 20,584 10,114 263 (6,582) (11,806) (4,249) 4,776 8,353 4,284 5,221 6,601 18,478 21,054 30,440
Note : All values are in LKR ‘000s, unless otherwise stated. Figures in brackets indicate deductions. The above figures are not audited.
In addition to segment results, information such as finance costs / income, tax expenses has been allocated to segments for better presentation.PPE (Property, plant and equipment), IA (Intangible assets), LRPA (Lease rentals paid in advance)
Notes to the Interim Condensed Financial Statements

Financial Information
12 l John Keells Holdings PLC l www.keells.com Interim condensed financial statements l 13
Business segmentsThe following tables present revenue, profit information and other disclosures regarding Group’s business segments.
Transportation Leisure Property Consumer Foods & Retail
Financial Services Information Technology Others Group Total
For the Quarter ended 31st March 2015 2014Restated
2015 2014Restated
2015 2014 2015 2014 2015 2014 2015 2014Restated
2015 2014 2015 2014Restated
External revenue 1,191,795 2,027,537 7,375,426 7,240,879 1,935,651 1,542,502 7,966,291 6,720,036 1,450,568 2,332,613 1,836,000 1,580,006 910,924 1,056,018 22,666,655 22,499,591
Inter segment revenue 107,302 133,094 11,027 12,588 25,708 56,610 56,441 99,474 27,410 24,332 52,993 69,781 (4,088) (78,656) 276,793 317,223
Total segment revenue 1,299,097 2,160,631 7,386,453 7,253,467 1,961,359 1,599,112 8,022,732 6,819,510 1,477,978 2,356,945 1,888,993 1,649,787 906,836 977,362 22,943,448 22,816,814
Eliminations of inter segment revenue (276,793) (317,223)
Net revenue 22,666,655 22,499,591
Segment results (55,813) (50,625) 2,262,030 2,286,019 651,932 414,422 912,722 878,881 60,652 128,264 113,270 137,179 (305,968) 541,069 3,638,825 4,335,209
Finance cost (11,082) (15,891) (43,623) (88,695) (38,431) (12,479) 2,091 (26,560) (6) (2,215) (2,534) (12,567) (33,002) (81,102) (126,587) (239,509)
Finance income 14,602 38,536 81,054 98,479 92,104 36,767 18,428 26,565 35,954 34,324 8,744 7,071 718,247 678,501 969,133 920,243
Change in fair value of investment property - - - - 4,823 390,636 8,975 71,796 - - - - 34,868 7,860 48,666 470,292
Share of results of equity accounted investments
716,390 587,324 7,677 - - - - - 260,902 253,925 - 8,931 - 7,747 984,969 857,927
Eliminations / adjustments (23,135) 3,018 (17,295) 1,098 (130,001) 18,559 4,415 (352,955) 1,221,460 651 (2,541) (19,124) 348,131 210,083 1,401,034 (138,670)
Profit / (loss) before tax 640,962 562,362 2,289,843 2,296,901 580,427 847,905 946,631 597,727 1,578,962 414,949 116,939 121,490 762,276 1,364,158 6,916,040 6,205,492
Tax expense (14,868) (12,855) (277,380) (300,799) (31,431) (7,537) (281,818) (117,987) (42,831) (103,137) (26,916) (27,651) (539,071) (481,489) (1,214,315) (1,051,455)
Profit / (loss) for the period 626,094 549,507 2,012,463 1,996,102 548,996 840,368 664,813 479,740 1,536,131 311,812 90,023 93,839 223,205 882,669 5,701,725 5,154,037
Purchase and construction of PPE (2,264) (15,381) 327,494 345,472 198,308 1,764 173,465 691,402 36,645 (24,049) 22,412 18,236 10,066 29,894 766,126 1,047,338
Addition to IA 3,000 6,803 42,295 - - - (20,730) 52 - 4,594 2,096 (372) 3,350 5,872 30,011 16,949
Depreciation of PPE 2,385 1,322 407,633 334,283 (6,847) 10,384 193,651 163,442 31,085 39,717 44,743 25,518 24,245 28,521 696,895 603,187
Amortisation / impairment of IA (6,085) - - - - - 2,852 (578) 47,066 48,633 2,090 (936) 5,769 6,362 51,692 53,481
Amortisation of LRPA - - 201,719 170,203 - - - - - - - - 295 295 202,014 170,498
Gratuity provision and related costs (3,648) (895) 20,584 10,114 263 (6,582) (11,806) (4,249) 4,776 8,353 4,284 5,221 6,601 18,478 21,054 30,440
Note : All values are in LKR ‘000s, unless otherwise stated. Figures in brackets indicate deductions. The above figures are not audited.
In addition to segment results, information such as finance costs / income, tax expenses has been allocated to segments for better presentation.PPE (Property, plant and equipment), IA (Intangible assets), LRPA (Lease rentals paid in advance)

14 l John Keells Holdings PLC l www.keells.com
Business segmentsThe following tables present revenue, profit information and other disclosures regarding Group’s business segments.
Transportation Leisure Property Consumer Foods & Retail Financial Services Information Technology Others Group Total
For the year ended 31st March 2015 2014Restated
2015 2014Restated
2015 2014 2015 2014 2015 2014 2015 2014Restated
2015 2014 2015 2014Restated
External revenue 13,132,235 14,196,308 23,246,050 22,548,460 5,689,160 4,172,329 29,757,094 25,413,808 9,077,133 9,474,976 7,212,451 7,246,020 3,468,096 3,654,525 91,582,219 86,706,426
Inter segment revenue 431,615 422,187 44,275 63,101 198,102 255,751 337,800 361,485 108,548 100,792 173,906 288,225 478,977 346,336 1,773,223 1,837,877 Total segment revenue 13,563,850 14,618,495 23,290,325 22,611,561 5,887,262 4,428,080 30,094,894 25,775,293 9,185,681 9,575,768 7,386,357 7,534,245 3,947,073 4,000,861 93,355,442 88,544,303
Eliminations of inter segment revenue (1,773,223) (1,837,877)Net revenue 91,582,219 86,706,426
Segment results 304,238 468,211 5,425,961 5,464,242 1,527,750 832,910 2,486,755 1,664,034 972,866 930,894 352,617 333,265 (767,588) 287,547 10,302,599 9,981,103
Finance cost (53,088) (65,744) (231,617) (477,839) (122,249) (71,576) (67,849) (152,042) (215) (2,219) (11,947) (78,285) (181,209) (369,301) (668,174) (1,217,006)Finance income 128,648 172,820 319,420 449,847 242,019 113,852 74,869 106,073 119,932 105,391 31,735 19,277 3,779,319 2,011,765 4,695,942 2,979,025 Change in fair value of investment property - - - - 4,823 390,636 8,975 71,796 - - - - 34,868 7,860 48,666 470,292 Share of results of equity accounted investments
2,130,541 2,015,713 12,262 (191) - - - - 1,153,336 958,070 - 60,585 - 54,946 3,296,139 3,089,123
Eliminations / adjustments (25,000) 1,209 (20,651) (2,204) (136,554) 26,936 (4,585) (361,955) 1,221,460 651 (2,541) (19,124) 368,012 372,383 1,400,141 17,896 Profit / (loss) before tax 2,485,339 2,592,209 5,505,375 5,433,855 1,515,789 1,292,758 2,498,165 1,327,906 3,467,379 1,992,787 369,864 315,718 3,233,402 2,365,200 19,075,313 15,320,433 Tax expense (150,316) (135,041) (650,007) (609,826) (88,730) (1,855) (693,973) (322,681) (448,264) (356,445) (90,269) (70,709) (1,208,217) (865,549) (3,329,776) (2,362,106)
Profit / (loss) for the period 2,335,023 2,457,168 4,855,368 4,824,029 1,427,059 1,290,903 1,804,192 1,005,225 3,019,115 1,636,342 279,595 245,009 2,025,185 1,499,651 15,745,537 12,958,327
Purchase and construction of PPE 84,414 413,994 1,707,795 1,500,197 199,529 11,667 708,555 1,360,650 103,726 193,448 96,248 114,582 99,208 204,298 2,999,475 3,798,836 Addition to IA 6,000 6,803 248,332 - - - 1,486 4,690 - 4,594 6,996 10,467 17,676 19,661 280,490 46,215 Depreciation of PPE 96,801 77,365 1,440,358 1,304,229 10,490 22,628 779,190 731,020 152,408 158,474 171,012 155,382 117,064 119,412 2,767,323 2,568,510 Amortisation / impairment of IA 817 1,207 - - - - 11,616 11,192 188,263 189,759 10,494 12,108 23,008 25,049 234,198 239,315 Amortisation of LRPA - - 712,940 678,634 - - - - - - - - 1,175 1,175 714,115 679,809 Gratuity provision and related costs 11,245 10,483 90,999 76,622 1,069 942 73,118 68,399 41,624 43,362 19,006 17,656 49,312 44,740 286,373 262,204
Note : All values are in LKR ‘000s, unless otherwise stated. Figures in brackets indicate deductions.
In addition to segment results, information such as finance costs / income, tax expenses has been allocated to segments for better presentation.PPE (Property, plant and equipment), IA (Intangible assets), LRPA (Lease rentals paid in advance)
Notes to the Interim Condensed Financial Statements

Financial Information
14 l John Keells Holdings PLC l www.keells.com Interim condensed financial statements l 15
Business segmentsThe following tables present revenue, profit information and other disclosures regarding Group’s business segments.
Transportation Leisure Property Consumer Foods & Retail Financial Services Information Technology Others Group Total
For the year ended 31st March 2015 2014Restated
2015 2014Restated
2015 2014 2015 2014 2015 2014 2015 2014Restated
2015 2014 2015 2014Restated
External revenue 13,132,235 14,196,308 23,246,050 22,548,460 5,689,160 4,172,329 29,757,094 25,413,808 9,077,133 9,474,976 7,212,451 7,246,020 3,468,096 3,654,525 91,582,219 86,706,426
Inter segment revenue 431,615 422,187 44,275 63,101 198,102 255,751 337,800 361,485 108,548 100,792 173,906 288,225 478,977 346,336 1,773,223 1,837,877 Total segment revenue 13,563,850 14,618,495 23,290,325 22,611,561 5,887,262 4,428,080 30,094,894 25,775,293 9,185,681 9,575,768 7,386,357 7,534,245 3,947,073 4,000,861 93,355,442 88,544,303
Eliminations of inter segment revenue (1,773,223) (1,837,877)Net revenue 91,582,219 86,706,426
Segment results 304,238 468,211 5,425,961 5,464,242 1,527,750 832,910 2,486,755 1,664,034 972,866 930,894 352,617 333,265 (767,588) 287,547 10,302,599 9,981,103
Finance cost (53,088) (65,744) (231,617) (477,839) (122,249) (71,576) (67,849) (152,042) (215) (2,219) (11,947) (78,285) (181,209) (369,301) (668,174) (1,217,006)Finance income 128,648 172,820 319,420 449,847 242,019 113,852 74,869 106,073 119,932 105,391 31,735 19,277 3,779,319 2,011,765 4,695,942 2,979,025 Change in fair value of investment property - - - - 4,823 390,636 8,975 71,796 - - - - 34,868 7,860 48,666 470,292 Share of results of equity accounted investments
2,130,541 2,015,713 12,262 (191) - - - - 1,153,336 958,070 - 60,585 - 54,946 3,296,139 3,089,123
Eliminations / adjustments (25,000) 1,209 (20,651) (2,204) (136,554) 26,936 (4,585) (361,955) 1,221,460 651 (2,541) (19,124) 368,012 372,383 1,400,141 17,896 Profit / (loss) before tax 2,485,339 2,592,209 5,505,375 5,433,855 1,515,789 1,292,758 2,498,165 1,327,906 3,467,379 1,992,787 369,864 315,718 3,233,402 2,365,200 19,075,313 15,320,433 Tax expense (150,316) (135,041) (650,007) (609,826) (88,730) (1,855) (693,973) (322,681) (448,264) (356,445) (90,269) (70,709) (1,208,217) (865,549) (3,329,776) (2,362,106)
Profit / (loss) for the period 2,335,023 2,457,168 4,855,368 4,824,029 1,427,059 1,290,903 1,804,192 1,005,225 3,019,115 1,636,342 279,595 245,009 2,025,185 1,499,651 15,745,537 12,958,327
Purchase and construction of PPE 84,414 413,994 1,707,795 1,500,197 199,529 11,667 708,555 1,360,650 103,726 193,448 96,248 114,582 99,208 204,298 2,999,475 3,798,836 Addition to IA 6,000 6,803 248,332 - - - 1,486 4,690 - 4,594 6,996 10,467 17,676 19,661 280,490 46,215 Depreciation of PPE 96,801 77,365 1,440,358 1,304,229 10,490 22,628 779,190 731,020 152,408 158,474 171,012 155,382 117,064 119,412 2,767,323 2,568,510 Amortisation / impairment of IA 817 1,207 - - - - 11,616 11,192 188,263 189,759 10,494 12,108 23,008 25,049 234,198 239,315 Amortisation of LRPA - - 712,940 678,634 - - - - - - - - 1,175 1,175 714,115 679,809 Gratuity provision and related costs 11,245 10,483 90,999 76,622 1,069 942 73,118 68,399 41,624 43,362 19,006 17,656 49,312 44,740 286,373 262,204
Note : All values are in LKR ‘000s, unless otherwise stated. Figures in brackets indicate deductions.
In addition to segment results, information such as finance costs / income, tax expenses has been allocated to segments for better presentation.PPE (Property, plant and equipment), IA (Intangible assets), LRPA (Lease rentals paid in advance)
Notes to the Interim Condensed Financial Statements
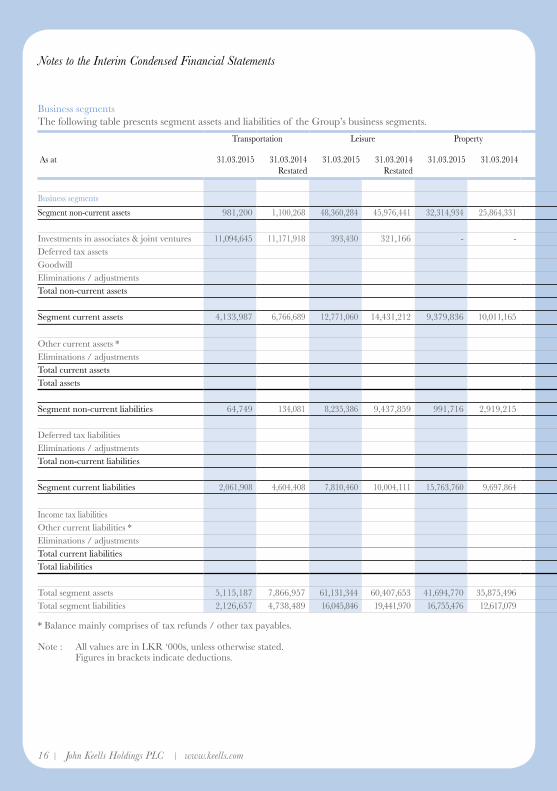
Business segmentsThe following table presents segment assets and liabilities of the Group’s business segments.
Transportation Leisure Property Consumer Foods & Retail Financial Services Information Technology Others Group Total
As at 31.03.2015 31.03.2014Restated
31.03.2015 31.03.2014Restated
31.03.2015 31.03.2014 31.03.2015 31.03.2014 31.03.2015 31.03.2014 31.03.2015 31.03.2014Restated
31.03.2015 31.03.2014 31.03.2015 31.03.2014Restated
Business segments
Segment non-current assets 981,200 1,100,268 48,360,284 45,976,441 32,314,934 25,864,331 7,064,186 7,132,322 20,182,923 21,523,066 362,223 482,619 6,074,330 6,485,657 115,340,080 108,564,704
Investments in associates & joint ventures 11,094,645 11,171,918 393,430 321,166 - - - - 4,857,415 3,556,323 - - - - 16,345,490 15,049,407 Deferred tax assets 108,585 131,683 Goodwill 950,884 950,884 Eliminations / adjustments (5,152,221) (5,321,876)Total non-current assets 127,592,818 119,374,802
Segment current assets 4,133,987 6,766,689 12,771,060 14,431,212 9,379,836 10,011,165 5,750,740 4,876,636 12,442,273 10,647,628 3,326,917 3,718,748 44,427,769 37,392,777 92,232,582 87,844,855
Other current assets * 2,398,142 2,601,091 Eliminations / adjustments (4,137,698) (8,239,535)Total current assets 90,493,026 82,206,411 Total assets 218,085,844 201,581,213
Segment non-current liabilities 64,749 134,081 8,235,386 9,437,859 991,716 2,919,215 797,540 951,150 24,047,005 20,485,312 128,221 165,287 1,603,704 2,855,992 35,868,321 36,948,896
Deferred tax liabilities 1,625,394 1,328,479 Eliminations / adjustments (4,656,804) (4,722,936)Total non-current liabilities 32,836,911 33,554,439
Segment current liabilities 2,061,908 4,604,408 7,810,460 10,004,111 15,763,760 9,697,864 4,276,661 4,523,464 1,324,250 5,499,273 1,319,775 1,271,843 1,952,257 2,161,300 34,509,071 37,762,263
Income tax liabilities 1,592,079 908,100 Other current liabilities * 3,251,881 2,380,149 Eliminations / adjustments (4,180,908) (7,341,828)Total current liabilities 35,172,123 33,708,684 Total liabilities 68,009,034 67,263,123
Total segment assets 5,115,187 7,866,957 61,131,344 60,407,653 41,694,770 35,875,496 12,814,926 12,008,958 32,625,196 32,170,694 3,689,140 4,201,367 50,502,099 43,878,434 207,572,662 196,409,559 Total segment liabilities 2,126,657 4,738,489 16,045,846 19,441,970 16,755,476 12,617,079 5,074,201 5,474,614 25,371,255 25,984,585 1,447,996 1,437,130 3,555,961 5,017,292 70,377,392 74,711,159
* Balance mainly comprises of tax refunds / other tax payables.
Note : All values are in LKR ‘000s, unless otherwise stated. Figures in brackets indicate deductions.
16 l John Keells Holdings PLC l www.keells.com

Financial Information
Interim condensed financial statements l 17
Business segmentsThe following table presents segment assets and liabilities of the Group’s business segments.
Transportation Leisure Property Consumer Foods & Retail Financial Services Information Technology Others Group Total
As at 31.03.2015 31.03.2014Restated
31.03.2015 31.03.2014Restated
31.03.2015 31.03.2014 31.03.2015 31.03.2014 31.03.2015 31.03.2014 31.03.2015 31.03.2014Restated
31.03.2015 31.03.2014 31.03.2015 31.03.2014Restated
Business segments
Segment non-current assets 981,200 1,100,268 48,360,284 45,976,441 32,314,934 25,864,331 7,064,186 7,132,322 20,182,923 21,523,066 362,223 482,619 6,074,330 6,485,657 115,340,080 108,564,704
Investments in associates & joint ventures 11,094,645 11,171,918 393,430 321,166 - - - - 4,857,415 3,556,323 - - - - 16,345,490 15,049,407 Deferred tax assets 108,585 131,683 Goodwill 950,884 950,884 Eliminations / adjustments (5,152,221) (5,321,876)Total non-current assets 127,592,818 119,374,802
Segment current assets 4,133,987 6,766,689 12,771,060 14,431,212 9,379,836 10,011,165 5,750,740 4,876,636 12,442,273 10,647,628 3,326,917 3,718,748 44,427,769 37,392,777 92,232,582 87,844,855
Other current assets * 2,398,142 2,601,091 Eliminations / adjustments (4,137,698) (8,239,535)Total current assets 90,493,026 82,206,411 Total assets 218,085,844 201,581,213
Segment non-current liabilities 64,749 134,081 8,235,386 9,437,859 991,716 2,919,215 797,540 951,150 24,047,005 20,485,312 128,221 165,287 1,603,704 2,855,992 35,868,321 36,948,896
Deferred tax liabilities 1,625,394 1,328,479 Eliminations / adjustments (4,656,804) (4,722,936)Total non-current liabilities 32,836,911 33,554,439
Segment current liabilities 2,061,908 4,604,408 7,810,460 10,004,111 15,763,760 9,697,864 4,276,661 4,523,464 1,324,250 5,499,273 1,319,775 1,271,843 1,952,257 2,161,300 34,509,071 37,762,263
Income tax liabilities 1,592,079 908,100 Other current liabilities * 3,251,881 2,380,149 Eliminations / adjustments (4,180,908) (7,341,828)Total current liabilities 35,172,123 33,708,684 Total liabilities 68,009,034 67,263,123
Total segment assets 5,115,187 7,866,957 61,131,344 60,407,653 41,694,770 35,875,496 12,814,926 12,008,958 32,625,196 32,170,694 3,689,140 4,201,367 50,502,099 43,878,434 207,572,662 196,409,559 Total segment liabilities 2,126,657 4,738,489 16,045,846 19,441,970 16,755,476 12,617,079 5,074,201 5,474,614 25,371,255 25,984,585 1,447,996 1,437,130 3,555,961 5,017,292 70,377,392 74,711,159
* Balance mainly comprises of tax refunds / other tax payables.
Note : All values are in LKR ‘000s, unless otherwise stated. Figures in brackets indicate deductions.
16 l John Keells Holdings PLC l www.keells.com

18 l John Keells Holdings PLC l www.keells.com
Notes to the Interim Condensed Financial Statements
1 Corporate information John Keells Holdings PLC. is a public limited company incorporated and domiciled in Sri Lanka and
listed on the Colombo Stock Exchange. Ordinary shares of the company are listed on the Colombo Stock Exchange and Global Depository Receipts (GDRs) are listed on the Luxembourg Stock Exchange.
2 Interim condensed financial statements The financial statements for the period ended 31 March 2015, includes “the Company” referring to John
Keells Holdings PLC., as the holding company and “the Group” referring to the companies whose accounts have been consolidated therein.
3 Approval of fianancial statements The interim condensed financial statements of the Group and the Company for the 12 months ended 31
March 2015 were authorised for issue by the Board of Directors on 26 May 2015.
4 Basis of preparation The interim condensed financial statements have been prepared in compliance with Sri Lanka Accounting
Standard LKAS 34 - Interim Financial Reporting. These interim condensed financial statements should be read in conjunction with the annual financial statements for the year ended 31 March 2014, and changes to the accounting policies as given in note 5 to these financial statements.
The presentation and classification of the financial statements of the previous year have been amended, where relevant, for better presentation and to be comparable with those of the current year.
The interim condensed financial statements are presented in Sri Lankan Rupees (LKR) and all values are rounded to the nearest thousand except when otherwise indicated.
5 Changes in accounting policies SLFRS 10 Consolidated Financial Statements SLFRS 10 establishes a single control model that applies to all entities including special purpose entities.
SLFRS 10 replaces the parts of previously existing LKAS 27 Consolidated and Separate Financial Statements that dealt with consolidated financial statements and SIC-12 Consolidation – Special Purpose Entities. SLFRS 10 changes the definition of control such that an investor controls an investee, has exposure or rights, to variable returns from its involvement with the investee and has the ability to affect those returns through its power over the investee. To meet the definition of control in SLFRS 10, all three criteria must be met, including:
(a) an investor has power over an investee;
(b) the investor has exposure or rights to variable returns from its involvement with the investee; and
(c) the investor has the ability to use its power over the investee to affect the amount of the investor’s returns.SLFRS 10 has had no impact on the consolidation of investments held by the Group.

Financial Information
18 l John Keells Holdings PLC l www.keells.com Interim condensed financial statements l 19
SLFRS 11 Joint Arrangements
SLFRS 11 replaces LKAS 31 Interests in Joint Ventures and SIC-13 Jointly-controlled Entities
Non-monetary Contributions by Venturers. SLFRS 11 removes the option to account for jointly controlled
entities (JCEs) using proportionate consolidation. Instead, JCEs that meet the definition of a joint venture
under SLFRS 11 must be accounted for using the equity method.
The application of this new standard impacted the financial position of the Group, whereby proportionate
consolidation of the joint ventures was replaced with the equity method of accounting.
SLFRS 11 is effective for annual periods beginning on or after 1 January 2014. The effect of SLFRS 11 is
described in more detail in Note 7, which includes quantification of the effect on the financial statements.
SLFRS 12 Disclosure of Interests in Other Entities
SLFRS 12 sets out the requirements for disclosures relating to an entity’s interests in subsidiaries, joint
arrangements, associates and structured entities. None of these disclosure requirements are applicable for
the interim condensed consolidated financial statements, unless significant events and transactions in the
interim period requires that they are disclosed. No significant events and transactions took place during the
interim period and accordingly, the Group has not made any such disclosures.
SLFRS 13 Fair Value Measurement
SLFRS 13 establishes a single source of guidance under SLFRS for all fair value measurements. SLFRS
13 does not change when an entity is required to use fair value, but rather provides guidance on how to
measure fair value under SLFRS when fair value is required or permitted. The application of SLFRS 13
has not materially impacted the fair value measurements carried out by the Group.
6 Operating Segments For management purposes, the Group is organised into business units based on their products and services
and has seven reportable operating segments as follows:
Transportation
Leisure
Property
Consumer Foods & Retail
Financial Services
Information Technology
Others
20 l John Keells Holdings PLC l www.keells.com
Notes to the Interim Condensed Financial Statements
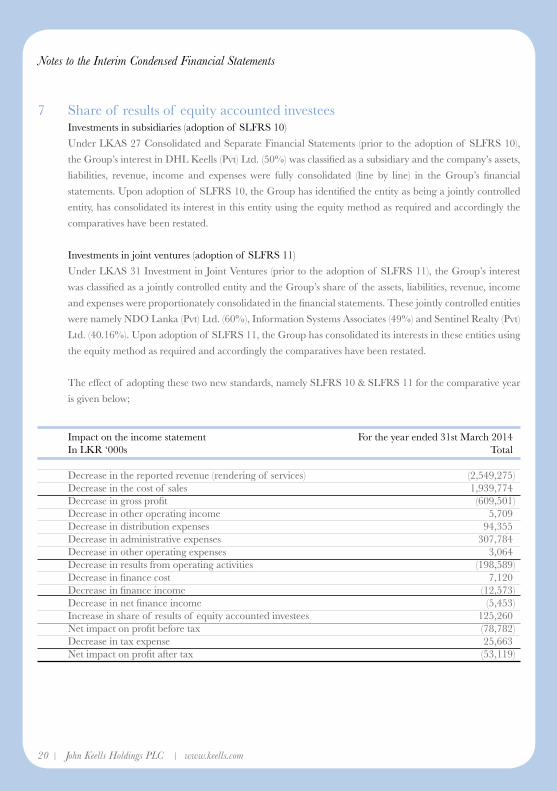
7 Share of results of equity accounted investees Investments in subsidiaries (adoption of SLFRS 10)
Under LKAS 27 Consolidated and Separate Financial Statements (prior to the adoption of SLFRS 10),
the Group’s interest in DHL Keells (Pvt) Ltd. (50%) was classified as a subsidiary and the company’s assets,
liabilities, revenue, income and expenses were fully consolidated (line by line) in the Group’s financial
statements. Upon adoption of SLFRS 10, the Group has identified the entity as being a jointly controlled
entity, has consolidated its interest in this entity using the equity method as required and accordingly the
comparatives have been restated.
Investments in joint ventures (adoption of SLFRS 11)
Under LKAS 31 Investment in Joint Ventures (prior to the adoption of SLFRS 11), the Group’s interest
was classified as a jointly controlled entity and the Group’s share of the assets, liabilities, revenue, income
and expenses were proportionately consolidated in the financial statements. These jointly controlled entities
were namely NDO Lanka (Pvt) Ltd. (60%), Information Systems Associates (49%) and Sentinel Realty (Pvt)
Ltd. (40.16%). Upon adoption of SLFRS 11, the Group has consolidated its interests in these entities using
the equity method as required and accordingly the comparatives have been restated.
The effect of adopting these two new standards, namely SLFRS 10 & SLFRS 11 for the comparative year
is given below;
Impact on the income statement For the year ended 31st March 2014 In LKR ‘000s Total
Decrease in the reported revenue (rendering of services) (2,549,275) Decrease in the cost of sales 1,939,774 Decrease in gross profit (609,501) Decrease in other operating income 5,709 Decrease in distribution expenses 94,355 Decrease in administrative expenses 307,784 Decrease in other operating expenses 3,064 Decrease in results from operating activities (198,589) Decrease in finance cost 7,120 Decrease in finance income (12,573) Decrease in net finance income (5,453) Increase in share of results of equity accounted investees 125,260 Net impact on profit before tax (78,782) Decrease in tax expense 25,663 Net impact on profit after tax (53,119)

Financial Information
20 l John Keells Holdings PLC l www.keells.com Interim condensed financial statements l 21
Impact on the statement of financial position As at 31.03.2014 In LKR ‘000 s Total
Decrease in property, plant and equipment (129,374) Increase in equity accounted investments 252,045 Decrease in other non-current financial assets (19,050) Decrease in deferred tax assets (15,134) Decrease in other non current assets (2,186) Decrease in trade and other receivables (417,217) Decrease in amounts due from related parties (17,855) Decrease in short term investments (193,109) Decrease in other current assets (235,805) Decrease in cash in hand and at bank (118,446) Decrease in non controlling intererst 195,040 Decrease in employee benefit liability 39,539 Decrease in trade and other payables 500,758 Decrease in amounts due to related parties 32,724 Decrease in income tax liabilities 15,748 Increase in other current liabilities (4,890) Decrease in bank overdraft 117,212 Net impact on equity -
There is no material impact on the interim condensed consolidated statement of cash flows or the basic and
diluted EPS.
8 Change in life insurance contract liabilities The results of Union Assurance PLC’s life business segment is consolidated line by line into the Group’s
consolidated income statement. The change in life insurance contract liabilities represents the transfer to
the Life Fund, the difference between all income and expenditure attributable to life policy holders during
the period.
9 Tax expense
For the year ended 31st March Group Company In LKR ‘000s 2015 2014 2015 2014
Income statement Current income tax 3,035,888 2,169,082 517,238 419,727 Deferred tax 293,888 193,024 - - 3,329,776 2,362,106 517,238 419,727 Other comprehensive income Deferred tax 22,817 (2,790) - - 22,817 (2,790) - -

22 l John Keells Holdings PLC l www.keells.com
Notes to the Interim Condensed Financial Statements
10 Related party transactions
For the year ended 31st March Group Company In LKR ‘000s 2015 2014 2015 2014
Transactions with related parties Subsidiaries (Purchases) / sale of goods - - (1,280) (2,899) (Receiving) / rendering of services - - 582,664 455,919 (Purchases) / sale of property plant & equipment - - Loans given - - - - Interest received / (paid) - - - - Rent received / (paid) - - (34,759) (63,049) Guarantees received / (paid) - - - - Joint Ventures (Receiving) / rendering of services 54,770 273,001 212,739 176,559 Associates (Purchases) / sale of goods 24,063 6,531 - - (Receiving) / rendering of services 43,769 33,961 6,228 3,929 Interest received / (paid) 57,975 168,299 69 44,104 Loans taken - - - - Leases taken - - - - Key management personnel (KMP) (Purchases) / sale of goods - - - - Close family members of KMP (Purchases) / sale of goods - - - - Companies controlled and jointly controlled by KMP and their close family members of KMP (Purchases) / sale of goods - - - - Post employment benefit plan Contributions to the provident fund 232,437 222,286 50,077 47,368

Financial Information
22 l John Keells Holdings PLC l www.keells.com Interim condensed financial statements l 23
11 Share information11.1 Stated capital
Stated capital is represented by number of shares in issue as given below:
As at 31-03-2015 31-12-2014
Ordinary shares 996,364,422 996,258,328 Global depository receipts 1,122,069 1,122,069
11.2 Net assets per share
Net assets per share have been calculated, for all periods, based on the number of shares in issue as at 31
March 2015.
11.3 Market price per share
For the quarter ended 31st March 2015 2014 LKR LKR
Highest 250.30 250.40 Lowest 195.00 206.00 Last traded 199.40 227.00
11.4 Warrants
As at 31-03-2015 31-12-2014
Number of 2015 warrants 43,995,994 43,995,994 Number of 2016 warrants 43,995,994 43,995,994
The above warrants are exercisable in November 2015 and November 2016 respectively and have been considered in calculating the diluted earnings per share.
11.5 Market price per warrant
For the Quarter ended 31st March 2015 warrants 2016 warrants 2015 2014 2015 2014 LKR LKR LKR LKR
Highest 80.50 90.50 85.40 98.20 Lowest 16.00 55.20 27.10 58.80 Last traded 20.80 68.60 32.10 71.90

24 l John Keells Holdings PLC l www.keells.com
Notes to the Interim Condensed Financial Statements
11.6 Public share holdings
The percentage of shares held by the public as at 31 March 2015 was 98.49%
(31 December 2014 – 98.49%). The number of public shareholders as at 31 March 2015 was 9,917
(31 December 2014 – 8,461).
11.7 Directors’ share holdings
The number of shares held by the Board of Directors (including their spouses) are as follows:
As at 31-03-2015 31-12-2014
S C Ratnayake – Chairman/CEO 6,000,360 6,000,360 A D Gunewardene – Deputy Chairman 7,298,898 7,298,898 J R F Peiris 1,745,082 1,745,082 E F G Amerasinghe 6,362 6,362 D A Cabraal 105 105 I Coomaraswamy Nil Nil T Das Nil Nil A N Fonseka Nil Nil M A Omar Nil Nil M P Perera (appointed w.e.f 1 July 2014) Nil Nil
11.8 Twenty largest shareholders of the company are as follows:
As at 31-03-2015 31-12-2014 Number % Number % of shares of shares
1 Mr S E Captain 110,775,563 11.1% 127,492,897 12.8%2 Broga Hill Investments Limited 104,084,164 10.4% 104,084,164 10.4%3 Paints & General Industries Limited 66,913,811 6.7% 65,426,487 6.6%4 Melstacorp (Private) Limited 36,498,341 3.7% 36,498,341 3.7%5 Aberdeen Global-Asian Smaller Companies Fund 35,822,854 3.6% 35,422,854 3.6%6 Schroder International Selection Fund 34,504,417 3.5% 30,365,659 3.0%7 Deutsche Bank AG – London 30,065,961 3.0% 36,985,226 3.7%8 Aberdeen Global Asia Pacific Equity Fund 21,978,158 2.2% 21,978,158 2.2%9 Aberdeen Institutional Commingled Funds, LLC 15,569,620 1.6% 13,169,620 1.3%10 Aberdeen Global-Emerging Markets Smaller companies fund 15,342,272 1.5% 15,342,272 1.5%11 Mr K Balendra 15,227,172 1.5% 15,227,172 1.5%12 London- Edinburgh Dragon Trust PLC 12,619,227 1.3% 12,619,227 1.3%13 All Country Fund 11,362,207 1.1% 8,311,107 0.8%14 Aberdeen Asia Pacific Equity Fund 10,470,264 1.0% 10,470,264 1.0%15 Mrs C S De Fonseka 10,051,585 1.0% 10,774,836 1.1%16 Mrs S A J De Fonseka 9,868,701 1.0% 10,598,019 1.1%17 Employees Trust Fund 8,817,681 0.9% 5,656,666 0.6%18 Aberdeen Global Frontier Markets Equity Fund 8,636,653 0.9% 8,436,653 0.8%19 CF Ruffer Total Return Fund 8,540,000 0.9% 8,540,000 0.9%20 Employees Provident Fund 8,435,708 0.8% 8,335,708 0.8%

Financial Information
24 l John Keells Holdings PLC l www.keells.com Interim condensed financial statements l 25
11.9 Directors’ warrant holdings
The number of warrants held by the Board of Directors (including their spouses) are as follows:
2015 warrants 2016 warrants As at 31-03-2015 31-12-2014 31-03-2015 31-12-2014
S C Ratnayake – Chairman/CEO 280,297 280,297 280,297 280,297 A D Gunewardene – Deputy Chairman 332,410 332,410 332,410 332,410 J R F Peiris 70,329 70,329 70,329 70,329 E F G Amerasinghe 282 282 282 282 D A Cabraal Nil Nil Nil Nil I Coomaraswamy Nil Nil Nil Nil T Das Nil Nil Nil Nil A N Fonseka Nil Nil Nil Nil M A Omar Nil Nil Nil Nil M P Perera (appointed w.e.f 1 July 2014) Nil Nil Nil Nil
11.10 Twenty largest warrant holders of the company:
2015 Warrants As at 31-03-2015 31-12-2014 Number of % Number of % warrants warrants
1 Seylan Bank PLC/Capital Trust Holdings (Pvt) Ltd 8,957,364 20.4% 9,653,473 21.9%2 Broga Hill Investments Limited 4,523,355 10.3% 4,523,355 10.3%3 Melstacorp (Private) Limited 1,666,208 3.8% 1,666,208 3.8%4 Aberdeen Global-Asian Smaller Companies Fund 1,641,071 3.7% 1,641,071 3.7%5 Aberdeen Global-Emerging Markets Smaller companies fund 1,135,979 2.6% 1,135,979 2.6%6 Dee Sanda Holdings (pvt) Ltd 1,000,119 2.3% 980,119 2.2%7 Aberdeen Asia Pacific Equity Fund 976,840 2.2% 976,840 2.2%8 Deutsche Bank AG – London 956,950 2.2% 956,950 2.2%9 Employees Trust Fund 726,227 1.7% - 0.0%10 Schroder International Selection Fund 709,906 1.6% 709,906 1.6%11 Mr K Balendra 695,144 1.6% 695,144 1.6%12 London- Edinburgh Dragon Trust PLC 560,873 1.3% 560,873 1.3%13 Sampath Bank PLC/Capital Trust Holdings (Pvt) Ltd 518,152 1.2% 100,500 0.2%14 Aberdeen Global Asia Pacific Equity Fund 465,361 1.1% 465,361 1.1%15 Mr C K Sangakkara 438,331 1.0% 398,559 0.9%16 Aberdeen Institutional Commingled Funds, LLC 433,909 1.0% 433,909 1.0%17 Aberdeen Global Frontier Markets Equity Fund 374,975 0.9% 374,975 0.9%18 Rosewood (Pvt) Limited 354,429 0.8% 454,428 1.0%19 Ms L V C Samarasinha 316,883 0.7% 316,883 0.7%20 Mr A D Gunewardene 313,588 0.7% 313,588 0.7%

26 l John Keells Holdings PLC l www.keells.com
Notes to the Interim Condensed Financial Statements
11.11 Twenty largest warrant holders of the company:
2016 Warrants As at 31-03-2015 31-12-2014 Number of % Number of % warrants warrants
1 Seylan Bank PLC/Capital Trust Holdings (Pvt) Ltd 6,151,503 14.0% 6,722,732 15.3%2 Broga Hill Investments Limited 4,523,355 10.3% 4,523,355 10.3%3 Melstacorp (Private) Limited 1,666,208 3.8% 1,666,208 3.8%4 Aberdeen Global-Asian Smaller Companies Fund 1,641,071 3.7% 1,641,071 3.7%5 J.B. Cocoshell (Pvt) Ltd 1,226,423 2.8% 1,126,423 2.6%6 Aberdeen Global-Emerging Markets Smaller companies fund 1,135,979 2.6% 1,135,979 2.6%7 Aberdeen Global Asia Pacific Equity Fund 976,840 2.2% 976,840 2.2%8 Deutsche Bank AG – London 956,950 2.2% 956,950 2.2%9 Trading Partners (Pvt) Ltd 843,122 1.9% 893,452 2.0%10 Schroder International Selection Fund 709,906 1.6% 709,906 1.6%11 Mr K Balendra 695,144 1.6% 695,144 1.6%12 London- Edinburgh Dragon Trust PLC 560,873 1.3% 560,873 1.3%13 Sampath Bank PLC/Capital Trust Holdings (Pvt) Ltd 549,262 1.2% 1,134,719 2.6%14 Mrs S A J De Fonseka 469,814 1.1% 511,628 1.2%15 Aberdeen Asia Pacific Equity Fund 465,361 1.1% 465,361 1.1%16 Mrs C S De Fonseka 447,669 1.0% 511,770 1.2%17 Aberdeen Institutional Commingled Funds 433,909 1.0% 433,909 1.0%18 Aberdeen Global Frontier Markets Equity Fund 374,975 0.9% 374,975 0.9%19 Merchant Bank of Sri Lanka Ltd 359,213 0.8% 210,497 0.5%
20 Mr B.M. Amarasekera 350,000 0.8% 350,000 0.8%
12 Dividends paid
Company For the year ended 31st March 2015 2014 LKR’000s
Final dividend for 2013/14 LKR 1.50 (2012/13 LKR 1.50 ) 1,485,620 1,286,460 Interim dividend for 2014/15 LKR 2.00 (2013/14 LKR 2.00) 1,990,327 1,980,258

Financial Information
26 l John Keells Holdings PLC l www.keells.com Interim condensed financial statements l 27
13 Contingencies, capital and other commitments There has been no significant change in the nature of the contingencies and other commitments, which
were disclosed in the annual report for the year ended 31 March 2014, except for the following:
Union Assurance PLC (UAPLC) Income Tax Assessments received for years of assessments 2010/11 and 2011/2012 The Department of Inland Revenue has raised assessments on Union Assurance PLC for the years
of assessment 2010/ 11 and 2011/12, assessing the Life insurance business to pay income taxes of LKR 132million and LKR 475 million respectively. The company has filed valid appeals against these assessments. Having discussed with independent legal and tax experts and based on information available, the Directors are of the view that the Company has followed due process and acted in accordance with the prevailing laws in its tax submissions for years of assessment 2010 /11 and 2011/12 and therefore, the above assessments have no rationale or basis in law.
14 Events after the reporting period Super Gains Tax An imposition of a Super Gains Tax has been recommended for the approval of Parliament per a Bill
dated 27 March 2015. Since the Bill had not been approved by the parliament as at the reporting date, being 31 March 2015, the Group has not provided for the potential liability in the Financial Statements for the year ended 31 March 2015.
Final dividend The Board of Directors of the Company has declared a final dividend of LKR 1.50 per share for the
financial year ended 31 March 2015. As required by section 56 (2) of the Companies Act no 07 of 2007, the board of directors has confirmed that the Company satisfies the solvency test in accordance with section 57 of the companies Act No.07 of 2007, and has obtained a certificate from auditors, prior to declaring a final dividend which is to be paid on the 15 June 2015.
In accordance with LKAS 10, Events after the reporting period, the final dividend has not been recognised as a liability in the financial statements as at 31 March 2015.
Subdivision of shares The Board of Directors of the Company also resolved to recommend the increase in the number of
shares in issue by way of a share subdivision of the Company’s shares whereby seven (7) existing shares will be sub divided into eight (8). Accordingly, the price and quantity of the 2015 and 2016 Warrants too will be adjusted to reflect the aforementioned subdivision of shares. The proposed subdivision is subject to the approval of the Colombo Stock Exchange and shareholders of the Company at an extraordinary general meeting.

28 l John Keells Holdings PLC l www.keells.com

Corporate Information
Name of CompanyJohn Keells Holdings PLC
Legal FormPublic Limited Liability CompanyIncorporated in Sri Lanka in 1979Ordinary Shares listed on theColombo Stock ExchangeGDRs listed on the LuxembourgStock Exchange
Company Registration No.PQ 14
DirectorsS C Ratnayake – ChairmanA D Gunewardene – Deputy ChairmanJ R F PeirisE F G AmerasingheD A CabraalI CoomaraswamyT DasA N FonsekaM A OmarM P Perera
Senior Independent DirectorE F G Amerasinghe
Audit CommitteeA N Fonseka - ChairmanD A CabraalI Coomaraswamy M P Perera
Human Resources and Compensation CommitteeE F G Amerasinghe – ChairmanI CoomaraswamyA N FonsekaM A Omar
Nominations CommitteeT Das – ChairmanE F G AmerasingheD A CabraalM A OmarM P PereraS C Ratnayake
Related Party Transactions Review CommitteeA N Fonseka – ChairmanE F G AmerasingheD A CabraalM P PereraS C Ratnayake
BankersBank of CeylonCitibank N.ACommercial BankDeutsche Bank A.GDFCC BankDFCC Vardhana BankHatton National BankHongkong & Shanghai BankingCorporationMuslim Commercial BankNations Trust BankNational Savings BankPan Asia Banking CorporationPeople’s BankSampath BankSeylan BankStandard Chartered Bank
Depository for GDRsCitibank N.ANew York
Registered office of the Company117, Sir Chittampalam A GardinerMawatha, Colombo 2, Sri LankaInternet: www.keells.comEmail: [email protected]
Secretaries and RegistrarsKeells Consultants (Pvt) Limited117, Sir Chittampalam A GardinerMawatha,Colombo 2, Sri LankaTelephone : +94 11 230 6245Facsimile : +94 11 243 9037
Investor RelationsJohn Keells Holdings PLC117, Sir Chittampalam A GardinerMawatha, Colombo 2, Sri LankaTelephone : +94 11 230 6165 +94 11 230 6000Facsimile : +94 11 230 6160Email: [email protected]
Group Sustainability and Enterprise Risk ManagementJohn Keells Holdings PLC117, Sir Chittampalam A GardinerMawatha, Colombo 2, Sri LankaTelephone : +94 11 230 6182Facsimile : +94 11 230 6249Email: [email protected]
Contact for Media Corporate Communications DivisionJohn Keells Holdings PLC117, Sir Chittampalam A GardinerMawatha, Colombo 2, Sri LankaTelephone : +94 11 230 6191Email: [email protected]
AuditorsErnst & YoungChartered AccountantsP.O. Box 101Colombo, Sri Lanka

www.keells.com

![Articles - Ludus-Opuscularmm.ludus-opuscula.org/PDF_Files/Lin_Digital_9_31(5_2016)_low.pdf · Articles Digital root patterns of ... Cecil Balmond and Arup [6], Balmond used a simple](https://img.pdfslide.us/doc/110x75/5b91616c09d3f211298b85f5/articles-ludus-52016lowpdf-articles-digital-root-patterns-of-cecil.jpg)


![SF 2006[Balmond] Introduction](https://img.pdfslide.us/doc/110x75/55cf91ee550346f57b91e3c3/sf-2006balmond-introduction.jpg)