Embed Size (px)
Citation preview

Proceedings of the ASME 2014 International Design Engineering Technical Conferences &Computers and Information in Engineering Conference
IDETC/CIE 2014August 17-20, 2014, Buffalo, New York, USA
DETC2014-35270
INTEGRATED DECISION MAKING INELECTRIC VEHICLE AND CHARGING STATION LOCATION NETWORK DESIGN
Namwoo Kang∗Design Science
University of MichiganAnn Arbor, MI
Email: [email protected]
Fred M. FeinbergStephen M. Ross School of Business
University of MichiganAnn Arbor, MI
Email: [email protected]
Panos Y. PapalambrosMechanical EngineeringUniversity of Michigan
Ann Arbor, MIEmail: [email protected]
ABSTRACTA major barrier in consumer adoption of electric vehicles
(EVs) is ‘range anxiety,’ the concern that the vehicle will runout of power at an inopportune time. Range anxiety is causedby the current relatively low electric-only operational range andsparse public charging station infrastructure. Range anxiety maybe significantly mitigated if EV manufacturers and charging sta-tion operators work in partnership using a cooperative businessmodel to balance EV performance and charging station cover-age. This model is in contrast to a sequential decision makingmodel where manufacturers bring new EVs to the market firstand charging station operators decide on charging station de-ployment given EV specifications and market demand. This pa-per proposes an integrated decision making framework to assessprofitability of a cooperative business models based on a multi-disciplinary optimization model that combines marketing, engi-neering, and operations. This model is demonstrated in a casestudy involving battery electric vehicle design and direct-currentfast charging station location network in the State of Michigan.The expected benefits can motive both government and privateenterprise actions.
1. INTRODUCTIONIn the Electric vehicle (EV) market one can identify five
key players besides the comsumers themselves [1]: OriginalEquipment Manufacturers (OEMs) assemble vehicles and sell
∗Address all correspondence to this author.
them to consumers; battery manufacturers supply batteries toOEMs; utilities supply electricity to charging stations; chargingstation manufacturers supply Electric Vehicle Supply Equipment(EVSE) to utilities; and governments support all related activitiesthrough a variety of policies.
EVs face several consumer adoption barriers such as vehicleoperating range, vehicle cost, perceived safety, unusual emer-gency situations, reliability, vehicle size and performance, in-frastructure support, long charging time, high charging cost, andlong payback period expectations [1, 2]. The individual mar-ket players mentioned above are expending significant effort toovercome such barriers. In this paper, we adopt the argumentthat to overcome these barriers effectively, the market playersmust use a holistic approach to develop cooperatively integratedbusiness models rather than just pursue their individual businessmodels [3]. In this spirit, we present a mathematical formula-tion of an integrated decision-making (optimization) frameworkthat can support an integrated business model. Some of the mar-ket players are already cooperating in the market using businessto business (B2B) models. For example, cooperation of OEMsand battery manufacturers or cooperation of utilities and charg-ing station manufacturers are common. In the current study weaddress a cooperative business model between two groups: EVmanufacturers (i.e., OEMs and battery manufacturers) and charg-ing station operators (i.e., utilities and charging station manufac-turers).
A major barrier to consumer adoption is range anxiety. Theconsumer perception of its importance depends not only on the
1 Copyright c© 2014 by ASME
actual operating range determined by the design of the vehicleand its battery (vs. that of a conventional fuel vehicle) but also onthe availability of charging stations and required charging timeswhen the consumer plans a particular, possibly long, trip. Thus,consumers hesitate to buy EVs due to range anxiety, EV manu-facturers hesitate to develop and produce EVs due to small mar-ket demand, and charging station operators hesitate to invest incharging infrastructure for the same reason [4].
Addressing range anxiety requires coordination of engineer-ing business decisions by EV manufacturers and operation busi-ness decisions by charging station operators. For example, ashort range vehicle in a market with ample charging stations mayinduce less range anxiety than a long range vehicle in a mar-ket with sparse charging stations. Interestingly, research showsthat the average daily driving range in the US is less than 20miles [5, 6], and so range anxiety may be due more to a psycho-logical need for security in an occasional long trip. Appealingto consumers through, say, joint advertising, for both EV per-formances and public charging stations coverage as a ‘bundle’could be more effective in EV technology adoption. This ap-proach could also address the issue of high initial vehicle costdue to a large battery pack that accounts for almost half of totalconsumer vehicle cost [7].
EV manufacturers and charging station operators can part-ner to identify optimal ‘system’ balance between vehicle perfor-mance and charging station infrastructure to maximize marketshare or profit for both parties. A cooperative example in the USis the EV project supported by the U.S. Department of Energy en-gaging partners such as ECOtality, Nissan LEAF, and ChevroletVolt in major states [8]; the ChargePoint program supported byCoulomb Technologies is a cooperation among Chevrolet, Ford,and Smart USA [9]; Reliant Energy is working with Nissan inHouston, and Southern California Edison is working with Fordin California. Such cooperations typically focus only on fundingfor installation of EVSEs in target EV markets rather than thebroader cooperation suggested here.
In this study, we consider a charging infrastructure with di-rect current (DC) fast charging stations for commuting betweenmajor cities or trips longer than the range offered by a typical EVin the current market. EVs generally use three types of chargingmodes (or stations), Level 1, Level 2, and DC fast. It takes atleast three hours to recharge a battery using Levels 1 or 2, whileDC fast can recharge a battery to 80% capacity (for safety rea-sons) within 30 minutes. DC fast charging stations are consid-ered promising for a future public charging infrastructure, butthere were only154 stations in the US as of 2012 [10]. The prof-itability of a DC fast charger station infrastructure investment isuncertain and such investments have not been made [11].
This paper presents an integrated decision making frame-work combining EV design and charging station location net-work design problems. EV manufactures decide on vehicle priceand attributes such as range, charging time, MPGe (miles per
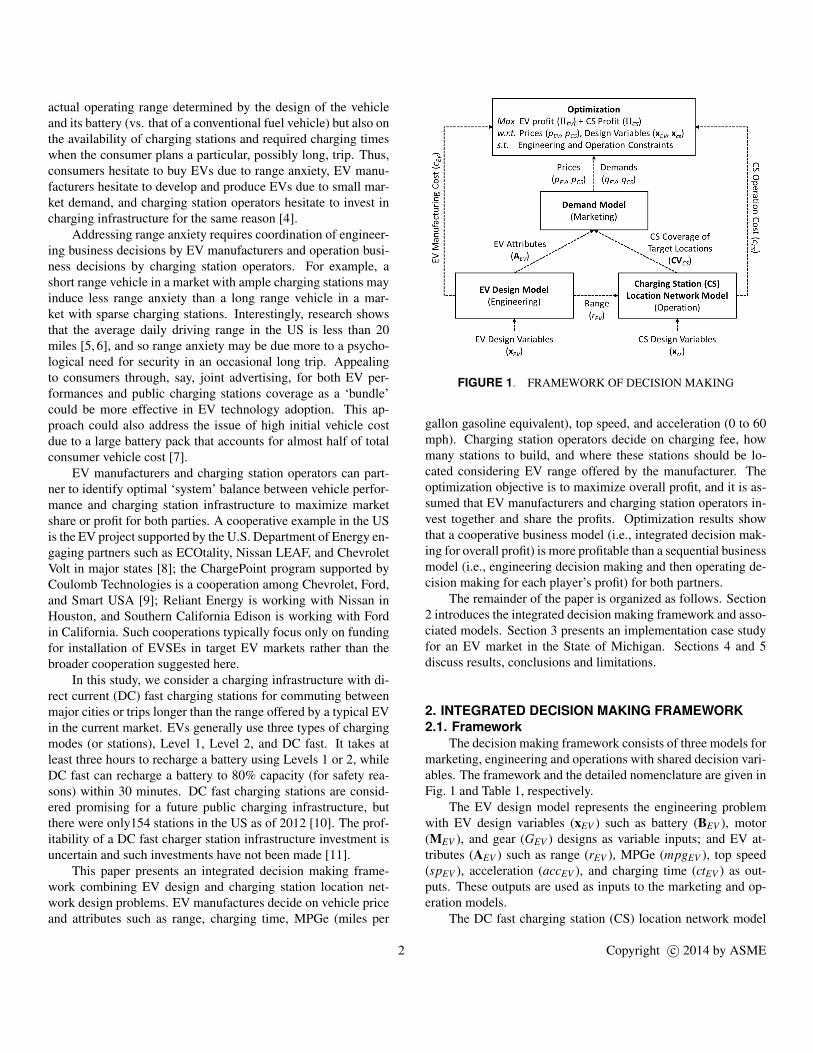
FIGURE 1. FRAMEWORK OF DECISION MAKING
gallon gasoline equivalent), top speed, and acceleration (0 to 60mph). Charging station operators decide on charging fee, howmany stations to build, and where these stations should be lo-cated considering EV range offered by the manufacturer. Theoptimization objective is to maximize overall profit, and it is as-sumed that EV manufacturers and charging station operators in-vest together and share the profits. Optimization results showthat a cooperative business model (i.e., integrated decision mak-ing for overall profit) is more profitable than a sequential businessmodel (i.e., engineering decision making and then operating de-cision making for each player’s profit) for both partners.
The remainder of the paper is organized as follows. Section2 introduces the integrated decision making framework and asso-ciated models. Section 3 presents an implementation case studyfor an EV market in the State of Michigan. Sections 4 and 5discuss results, conclusions and limitations.
2. INTEGRATED DECISION MAKING FRAMEWORK2.1. Framework
The decision making framework consists of three models formarketing, engineering and operations with shared decision vari-ables. The framework and the detailed nomenclature are given inFig. 1 and Table 1, respectively.
The EV design model represents the engineering problemwith EV design variables (xEV ) such as battery (BEV ), motor(MEV ), and gear (GEV ) designs as variable inputs; and EV at-tributes (AEV ) such as range (rEV ), MPGe (mpgEV ), top speed(spEV ), acceleration (accEV ), and charging time (ctEV ) as out-puts. These outputs are used as inputs to the marketing and op-eration models.
The DC fast charging station (CS) location network model
2 Copyright c© 2014 by ASME

TABLE 1. NOMENCLATURE FOR SYSTEM DESIGN
Models Variables and Responses
Profitoptimizationand demandmodels
ΠEV : EV profit
ΠCS: CS profit
pEV : EV price
pCS: Charging fee
qEV : EV demand
qCS: CS demand
cEV : EV manufacturing cost
cCS: CS operations cost
cEC: Electricity cost
EV designmodel
xEV : EV design variables
BEV : Battery design variables
MEV : Motor design variables
GEV : Gear ratio
AEV : EV attributes
rEV : Range
mpgEV : MPGe
spEV : Top speed
accEV : Acceleration
ctEV : charging time
CS locationnetwork
xCS: CS design variables
LCS: CS locations
NCS: Number of CS
CVCS: CS coverage of target locations
represents the operations problem with CS design variables (xCS)such as number (NCS) of stations and location (LCS) of stations asvariable inputs, EV range (rEV ) as input from engineering, andcharging station coverage (CVCS) as the output. This output isused as input to the marketing model. Coverage is defined asthe percentage of possible paths a consumer can drive from herorigin (i.e., home) without running out of power by using DC fastcharging stations.
The marketing model predicts EV and charging station de-mands (qEV , qCS) using the EV attributes (AEV ) from the engi-neering model and charging station coverage (CVCS) from the op-erations model as inputs, as well as EV price (pEV ) and charging
fee (pCS) as variable inputs.
The optimization objective is to maximize overall profit(ΠEV +ΠCS) from EVs and charging stations with respect to thevariables: EV price (pEV ), charging fee (pCS), EV design (xEV ),and charging station design (xCS).
The overall optimization equation is stated as follows.
maxx
ΠEV +ΠCS
= (pEV − cEV )qEV +(pCS− cEC)qCS− cCS(1)
with respect to
x = [pEV , pCS,xEV ,xCS]xEV = [BEV ,MEV ,GEV ]
xCS = [LCS,NCS](2)
subject to
lb≤ x≤ ub (3)
g(AEV )≤ 0 (4)
where
AEV = [rEV ,mpgEV ,spEV ,accEV ,ctEV ] (5)
[cEV ,cCS] = fc(xEV ,xCS) (6)
[qEV ,qCS] = fq(pEV , pCS,AEV ,CVCS) (7)
AEV = fEV (xEV ) (8)
CVCS = fCS(xCS,rEV ) (9)
where x in (2) are decision variables, (3) are boundary con-straints, and (4) are inequality constraints for EV attributes asshown in Table 3 in detail. Furthermore, fc, fq, fEV , and fCS are
3 Copyright c© 2014 by ASME
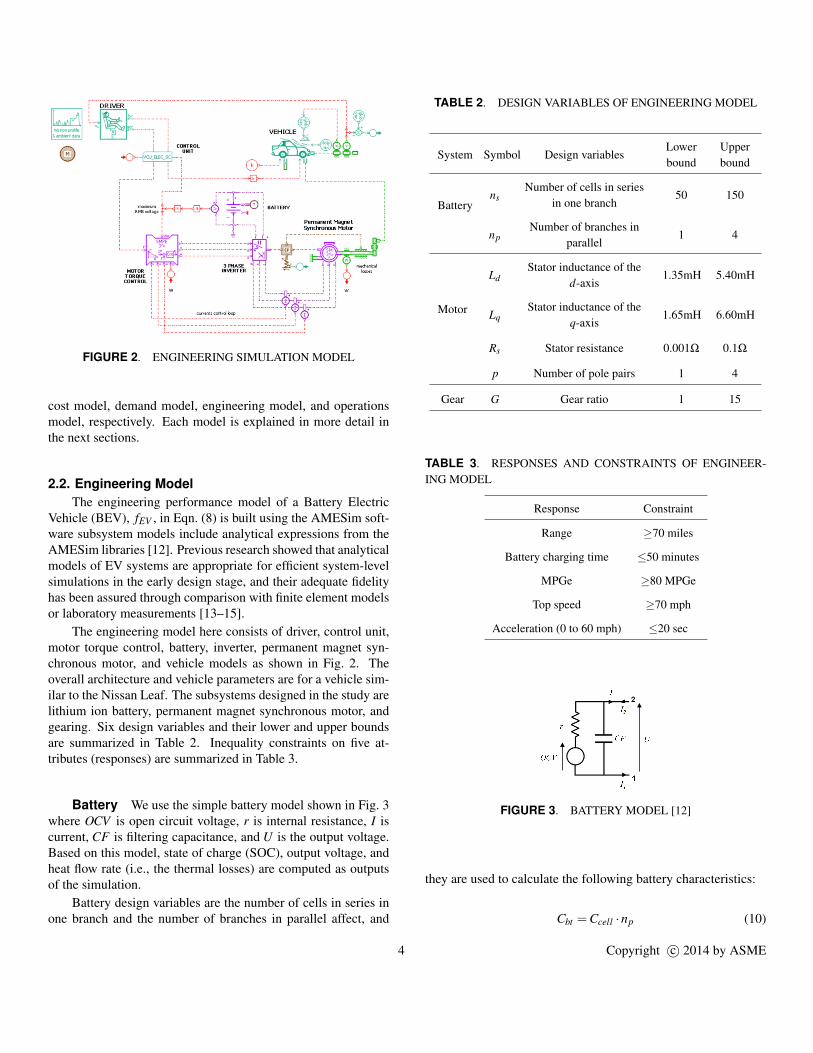
FIGURE 2. ENGINEERING SIMULATION MODEL
cost model, demand model, engineering model, and operationsmodel, respectively. Each model is explained in more detail inthe next sections.
2.2. Engineering ModelThe engineering performance model of a Battery Electric
Vehicle (BEV), fEV , in Eqn. (8) is built using the AMESim soft-ware subsystem models include analytical expressions from theAMESim libraries [12]. Previous research showed that analyticalmodels of EV systems are appropriate for efficient system-levelsimulations in the early design stage, and their adequate fidelityhas been assured through comparison with finite element modelsor laboratory measurements [13–15].
The engineering model here consists of driver, control unit,motor torque control, battery, inverter, permanent magnet syn-chronous motor, and vehicle models as shown in Fig. 2. Theoverall architecture and vehicle parameters are for a vehicle sim-ilar to the Nissan Leaf. The subsystems designed in the study arelithium ion battery, permanent magnet synchronous motor, andgearing. Six design variables and their lower and upper boundsare summarized in Table 2. Inequality constraints on five at-tributes (responses) are summarized in Table 3.
Battery We use the simple battery model shown in Fig. 3where OCV is open circuit voltage, r is internal resistance, I iscurrent, CF is filtering capacitance, and U is the output voltage.Based on this model, state of charge (SOC), output voltage, andheat flow rate (i.e., the thermal losses) are computed as outputsof the simulation.
Battery design variables are the number of cells in series inone branch and the number of branches in parallel affect, and
TABLE 2. DESIGN VARIABLES OF ENGINEERING MODEL
System Symbol Design variablesLowerbound
Upperbound
Batteryns
Number of cells in seriesin one branch
50 150
npNumber of branches in
parallel1 4
Motor
LdStator inductance of the
d-axis1.35mH 5.40mH
LqStator inductance of the
q-axis1.65mH 6.60mH
Rs Stator resistance 0.001Ω 0.1Ω
p Number of pole pairs 1 4
Gear G Gear ratio 1 15
TABLE 3. RESPONSES AND CONSTRAINTS OF ENGINEER-ING MODEL
Response Constraint
Range ≥70 miles
Battery charging time ≤50 minutes
MPGe ≥80 MPGe
Top speed ≥70 mph
Acceleration (0 to 60 mph) ≤20 sec
FIGURE 3. BATTERY MODEL [12]
they are used to calculate the following battery characteristics:
Cbt =Ccell ·np (10)
4 Copyright c© 2014 by ASME
CFbt =CFcell ·np
ns(11)
OCVbt = OCVcell ·ns (12)
rbt = rcell ·ns
np(13)
Here ns and np are the number of cells in series in one branch andthe number of branches in parallel, respectively; Cbt is capacityof battery, Ccell is capacity of a cell, CFbt is filtering capacitanceof battery, CFcell is filtering capacitance of a cell, OCVbt is opencircuit voltage of battery, OCVcell is open circuit voltage of a cell,rbt is internal resistance of battery, and rcell is internal resistanceof a cell. Since OCVcell and rcell are affected by SOC, OCVcelland rcell are computed by linear interpolation of available ex-periment data. All battery cell parameter values in the aboveequations are based on Nissan Leaf battery cell tests [16].
From the battery characteristics above, SOC, output voltage,and heat flow rate are computed:
dSOCdt
= 100 · I2
Cbt(14)
dUdt
=I2− U−OCVbt
rbt
CFbt(15)
dh =(U−OCVbt)
2
rbt(16)
where U is the output voltage and dh is heat flow rate based onJoule’s losses.
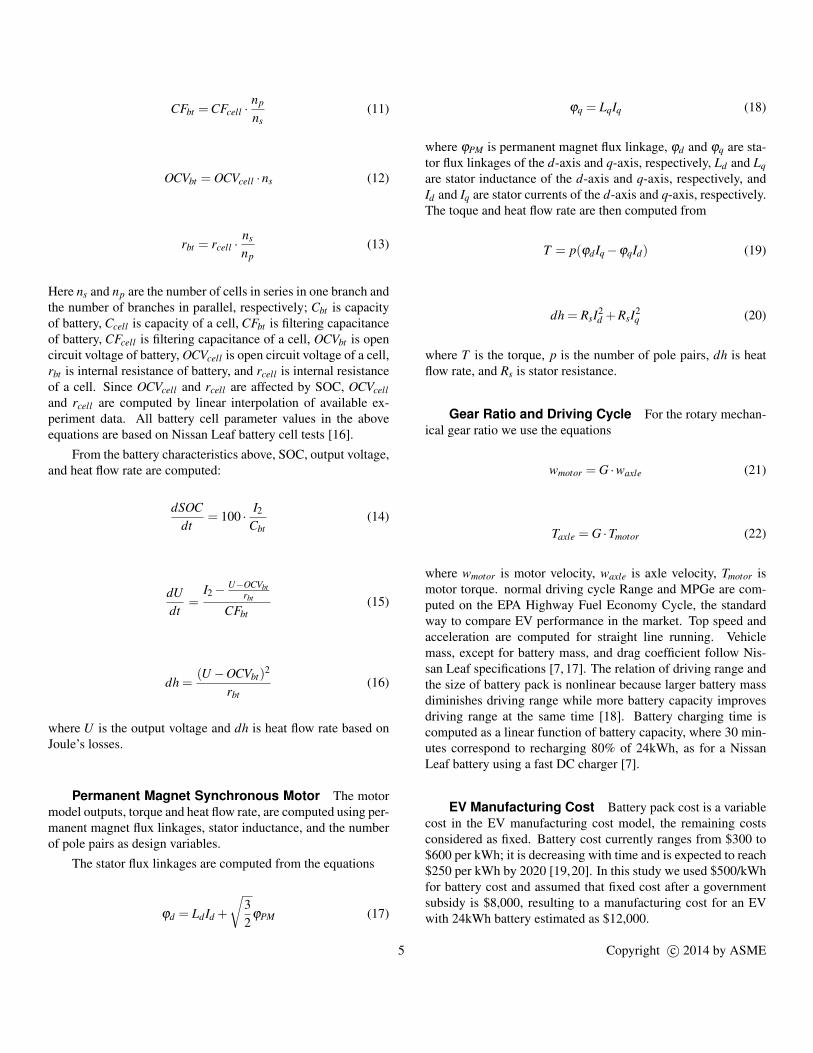
Permanent Magnet Synchronous Motor The motormodel outputs, torque and heat flow rate, are computed using per-manent magnet flux linkages, stator inductance, and the numberof pole pairs as design variables.
The stator flux linkages are computed from the equations
ϕd = LdId +
√32
ϕPM (17)
ϕq = LqIq (18)
where ϕPM is permanent magnet flux linkage, ϕd and ϕq are sta-tor flux linkages of the d-axis and q-axis, respectively, Ld and Lqare stator inductance of the d-axis and q-axis, respectively, andId and Iq are stator currents of the d-axis and q-axis, respectively.The toque and heat flow rate are then computed from
T = p(ϕdIq−ϕqId) (19)
dh = RsI2d +RsI2
q (20)
where T is the torque, p is the number of pole pairs, dh is heatflow rate, and Rs is stator resistance.
Gear Ratio and Driving Cycle For the rotary mechan-ical gear ratio we use the equations
wmotor = G ·waxle (21)
Taxle = G ·Tmotor (22)
where wmotor is motor velocity, waxle is axle velocity, Tmotor ismotor torque. normal driving cycle Range and MPGe are com-puted on the EPA Highway Fuel Economy Cycle, the standardway to compare EV performance in the market. Top speed andacceleration are computed for straight line running. Vehiclemass, except for battery mass, and drag coefficient follow Nis-san Leaf specifications [7, 17]. The relation of driving range andthe size of battery pack is nonlinear because larger battery massdiminishes driving range while more battery capacity improvesdriving range at the same time [18]. Battery charging time iscomputed as a linear function of battery capacity, where 30 min-utes correspond to recharging 80% of 24kWh, as for a NissanLeaf battery using a fast DC charger [7].
EV Manufacturing Cost Battery pack cost is a variablecost in the EV manufacturing cost model, the remaining costsconsidered as fixed. Battery cost currently ranges from $300 to$600 per kWh; it is decreasing with time and is expected to reach$250 per kWh by 2020 [19,20]. In this study we used $500/kWhfor battery cost and assumed that fixed cost after a governmentsubsidy is $8,000, resulting to a manufacturing cost for an EVwith 24kWh battery estimated as $12,000.
5 Copyright c© 2014 by ASME
2.3. Operation Model
Two different types of charging station coverage are used inthe study: Path coverage, a charging station attribute in the con-sumer demand model; and flow coverage, an objective of locationmodeling. Path coverage is defined as the percentage of possiblepaths (i.e., round trips) a consumer can drive without running outof power. We assume that consumers fully charge the EV in theirhome before driving to a destination. Possible paths are definedas combinations of paths from a city to another city in a state orcountry. For example, if the coverage is 100%, a consumer candrive from one of the select cities to any other select city with-out concern for running out of power; if the coverage is 50%, aconsumer can drive only 50% of the paths between cites withoutbeing concerned. Flow coverage is defined as the percentage oftotal traffic flows that can be recharged. Since each possible pathhas different amount of traffic flow, a path with more flow shouldhave more relative weight on charging station location decisions.Maximizing flow coverage is the overall desirable goal. How-ever, a consumer cares about his vehicle recharge need ratherthan the total recharged flow volume. This is why flow coveragemust be mapped into path coverage (i.e., every path has the sameweight) to be used in the consumer demand model.
Location Network Model A location model for fast DCcharging stations, fCS, is established using practices in geograph-ical analysis. Hodgson (1990) first proposed the Flow Cap-turing Location-allocation Model (FCLM) [21]. In this study,we adopt a variant called the Flow Refueling Location Model(FRLM) [22–27] that has been widely used to find optimal loca-tion of refueling facilities for alternative-fuel vehicles with lim-ited range.
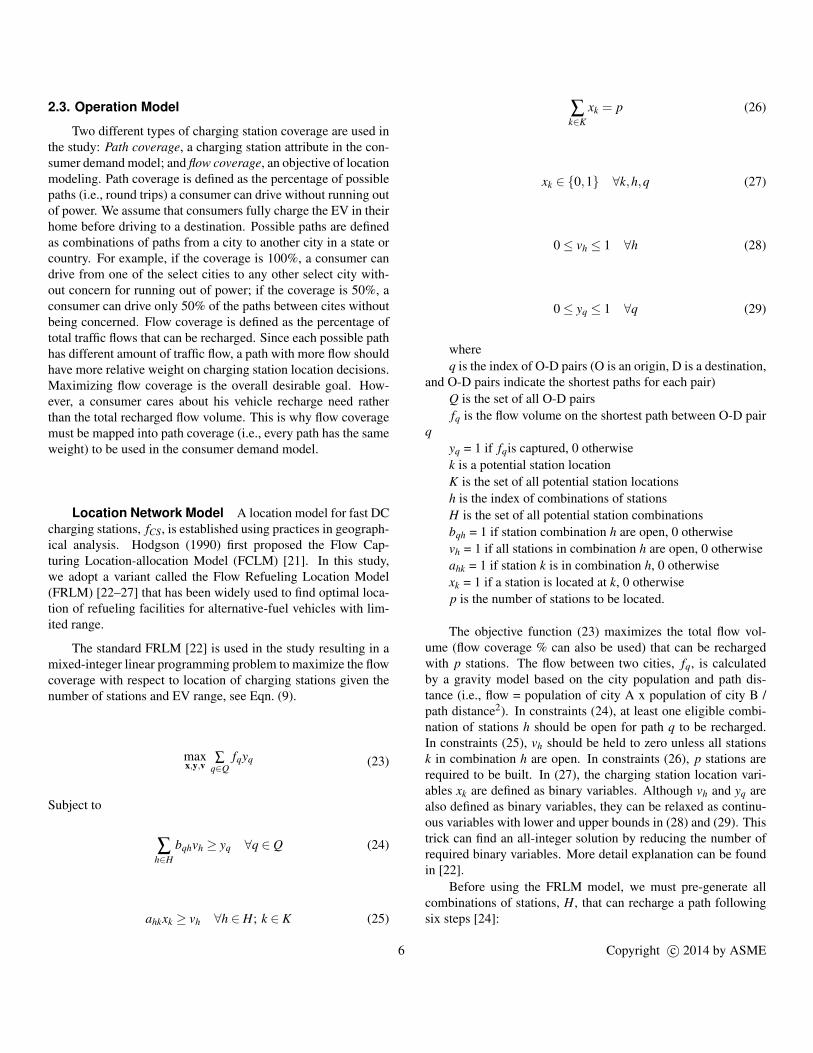
The standard FRLM [22] is used in the study resulting in amixed-integer linear programming problem to maximize the flowcoverage with respect to location of charging stations given thenumber of stations and EV range, see Eqn. (9).
maxx,y,v
∑q∈Q
fqyq (23)
Subject to
∑h∈H
bqhvh ≥ yq ∀q ∈ Q (24)
ahkxk ≥ vh ∀h ∈ H; k ∈ K (25)
∑k∈K
xk = p (26)
xk ∈ 0,1 ∀k,h,q (27)
0≤ vh ≤ 1 ∀h (28)
0≤ yq ≤ 1 ∀q (29)
whereq is the index of O-D pairs (O is an origin, D is a destination,
and O-D pairs indicate the shortest paths for each pair)Q is the set of all O-D pairsfq is the flow volume on the shortest path between O-D pair
qyq = 1 if fqis captured, 0 otherwisek is a potential station locationK is the set of all potential station locationsh is the index of combinations of stationsH is the set of all potential station combinationsbqh = 1 if station combination h are open, 0 otherwisevh = 1 if all stations in combination h are open, 0 otherwiseahk = 1 if station k is in combination h, 0 otherwisexk = 1 if a station is located at k, 0 otherwisep is the number of stations to be located.
The objective function (23) maximizes the total flow vol-ume (flow coverage % can also be used) that can be rechargedwith p stations. The flow between two cities, fq, is calculatedby a gravity model based on the city population and path dis-tance (i.e., flow = population of city A x population of city B /path distance2). In constraints (24), at least one eligible combi-nation of stations h should be open for path q to be recharged.In constraints (25), vh should be held to zero unless all stationsk in combination h are open. In constraints (26), p stations arerequired to be built. In (27), the charging station location vari-ables xk are defined as binary variables. Although vh and yq arealso defined as binary variables, they can be relaxed as continu-ous variables with lower and upper bounds in (28) and (29). Thistrick can find an all-integer solution by reducing the number ofrequired binary variables. More detail explanation can be foundin [22].
Before using the FRLM model, we must pre-generate allcombinations of stations, H, that can recharge a path followingsix steps [24]:
6 Copyright c© 2014 by ASME

1. Generate the shortest path for all O-D pairs q, and establishan empty master list of all combinations h.
2. Generate a temporary list of all station combinations h ofnodes on path q.
3. Remove station combinations that cannot recharge an EV ofthe given on path q.
4. If any combination h is still on the list for path q:Add it to the master list of station combinations if it is notalready there.Record bqh=1 if station combination h can recharge path qand 0 otherwise.Record ahk=1 if station k is in combination h, or 0 otherwise.
5. Repeat Steps 2-5 for all paths q.
For this location problem, Lim and Kuby (2010) have shownthat use of a genetic algorithm (GA) can have better performanceto find global optimum than a mixed-integer linear programming(MILP) solution algorithm. It the present study, we use GAs tosolve the location optimization problem with variables being thenumber of stations, station locations, and EV range, and outputthe optimal flow coverage. This optimal flow coverage is con-verted into path coverage and used as a charging station attributein the consumer demand model (see Section 2.4).
Fast DC Charging Station Cost The cost of fast DCcharging station infrastructure can be decomposed into variablecost, such as electricity cost, and fixed cost such as installation,equipment and maintenance cost. Electricity cost varies accord-ing to the charging time from 8 to 17 cents per kWh [28]. Herewe used 10 cents per kWh. Fixed costs depend on the conditionof stations. Here we used $75,000 for installation and equipmentcosts, and $5,500 for maintenance cost for one year [11]. Weevaluate profit and costs over a five-year period. We assume thattwo chargers are installed per charging station.
2.4. Marketing ModelHierarchical Bayesian (HB) choice-based conjoint [30,31] is
used for building a heterogeneous marketing demand model, fM .Choice data are gathered using choice-based conjoint analysis.Individual-level discrete utility functions are estimated using theHB choice model. Spline curves are fitted to the individual-levelposterior modes for each conjoint part-worth. Market demandis then calculated with choice probabilities based on individual-level utility functions and market potential.
The individual level discrete utility vi j is a linear function ofdiscrete levels of attributes and defined as,
vi j =K
∑k=1
Lk
∑l=1
βiklz jkl (30)
where z jkl are binary dummy variables indicating alternative jpossesses attribute k at level l, and βikl are the part-worth coeffi-cients of attribute k at level l for individual i [32].
The HB choice model has two levels. At the upper level,an individual’s part-worths, βi, have a multivariate normal distri-bution, βi ∼ N(θ ,Λ), where θ is a vector of means of the dis-tribution of individuals and Λ is the covariance matrix of thatdistribution. At the lower level, choice probabilities for a logitmodel are used:
Pi j =evi j
∑j′∈J
evi j′(31)
where Pi j indicates probability individual i chooses option j froma set of alternatives J. Markov Chain Monte Carlo (MCMC) isused to estimate the individual’s part-worth. The utility functionin Eqn. (30) based on the HB choice model cannot be used forcontinuous design decisions because the function is discrete. Wecalculate interpolated values of discrete part-worths using cubicsplines so that choice probabilities for continuous design deci-sions can be estimated.
Market demand is calculated based on individual levelchoice probabilities as
q j =1I
I
∑i=1
sPi j (32)
where q j is market demand of option j, s is the potential mar-ket size, and I is total number of individuals. This averaging ofindividual market demands is used for optimization. However,when we compare demands of different design decisions, eachindividual level market demand should be compared. More de-tail description of marketing demand models for design decisionscan be found in [33, 34].
EV demand is computed with Eqn. (32) using the attributesand levels of EV and charging station shown in Table 4, selectedbased on previous research and the current EV market [35].
Public charging station demand is estimated sequentiallybased on EV demand. This is because EV drivers are potentialconsumers of charging stations during the EV and charging sta-tion life cycles. Many scenarios of charging behavior can be con-sidered [29]. Here we estimate fast charging events based on ob-served data of EV users from a particular EV project [6], whichshowed that the mean number of charging events per vehicle-day driven is 1.05, and 18% of charging events are away froma home location. We assume that 30% of charging events awayfrom home would take place in the fast DC charging stations.We estimate charging station demand over five years to evaluateprofitability of the infrastructure investment. While the average
7 Copyright c© 2014 by ASME
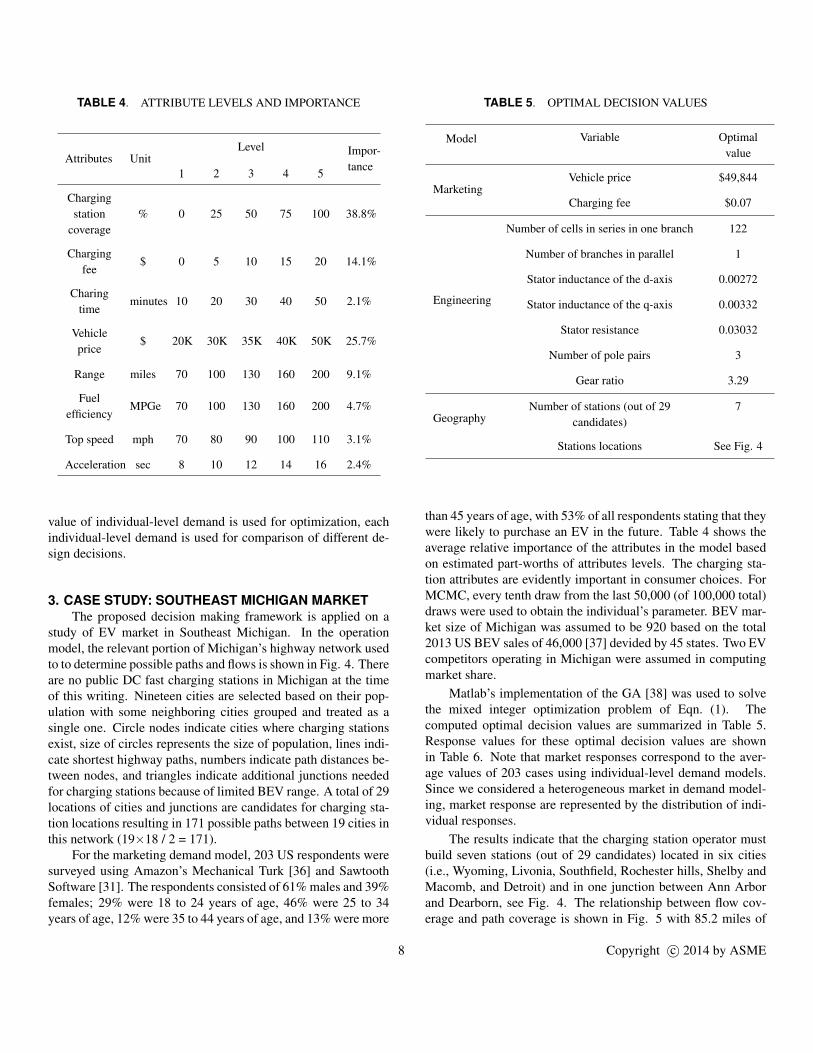
TABLE 4. ATTRIBUTE LEVELS AND IMPORTANCE
Attributes UnitLevel Impor-
tance1 2 3 4 5
Chargingstation
coverage% 0 25 50 75 100 38.8%
Chargingfee
$ 0 5 10 15 20 14.1%
Charingtime
minutes 10 20 30 40 50 2.1%
Vehicleprice
$ 20K 30K 35K 40K 50K 25.7%
Range miles 70 100 130 160 200 9.1%
Fuelefficiency
MPGe 70 100 130 160 200 4.7%
Top speed mph 70 80 90 100 110 3.1%
Acceleration sec 8 10 12 14 16 2.4%
value of individual-level demand is used for optimization, eachindividual-level demand is used for comparison of different de-sign decisions.
3. CASE STUDY: SOUTHEAST MICHIGAN MARKETThe proposed decision making framework is applied on a
study of EV market in Southeast Michigan. In the operationmodel, the relevant portion of Michigan’s highway network usedto to determine possible paths and flows is shown in Fig. 4. Thereare no public DC fast charging stations in Michigan at the timeof this writing. Nineteen cities are selected based on their pop-ulation with some neighboring cities grouped and treated as asingle one. Circle nodes indicate cities where charging stationsexist, size of circles represents the size of population, lines indi-cate shortest highway paths, numbers indicate path distances be-tween nodes, and triangles indicate additional junctions neededfor charging stations because of limited BEV range. A total of 29locations of cities and junctions are candidates for charging sta-tion locations resulting in 171 possible paths between 19 cities inthis network (19×18 / 2 = 171).
For the marketing demand model, 203 US respondents weresurveyed using Amazon’s Mechanical Turk [36] and SawtoothSoftware [31]. The respondents consisted of 61% males and 39%females; 29% were 18 to 24 years of age, 46% were 25 to 34years of age, 12% were 35 to 44 years of age, and 13% were more
TABLE 5. OPTIMAL DECISION VALUES
Model Variable Optimalvalue
MarketingVehicle price $49,844
Charging fee $0.07
Engineering
Number of cells in series in one branch 122
Number of branches in parallel 1
Stator inductance of the d-axis 0.00272
Stator inductance of the q-axis 0.00332
Stator resistance 0.03032
Number of pole pairs 3
Gear ratio 3.29
GeographyNumber of stations (out of 29
candidates)7
Stations locations See Fig. 4
than 45 years of age, with 53% of all respondents stating that theywere likely to purchase an EV in the future. Table 4 shows theaverage relative importance of the attributes in the model basedon estimated part-worths of attributes levels. The charging sta-tion attributes are evidently important in consumer choices. ForMCMC, every tenth draw from the last 50,000 (of 100,000 total)draws were used to obtain the individual’s parameter. BEV mar-ket size of Michigan was assumed to be 920 based on the total2013 US BEV sales of 46,000 [37] devided by 45 states. Two EVcompetitors operating in Michigan were assumed in computingmarket share.
Matlab’s implementation of the GA [38] was used to solvethe mixed integer optimization problem of Eqn. (1). Thecomputed optimal decision values are summarized in Table 5.Response values for these optimal decision values are shownin Table 6. Note that market responses correspond to the aver-age values of 203 cases using individual-level demand models.Since we considered a heterogeneous market in demand model-ing, market response are represented by the distribution of indi-vidual responses.
The results indicate that the charging station operator mustbuild seven stations (out of 29 candidates) located in six cities(i.e., Wyoming, Livonia, Southfield, Rochester hills, Shelby andMacomb, and Detroit) and in one junction between Ann Arborand Dearborn, see Fig. 4. The relationship between flow cov-erage and path coverage is shown in Fig. 5 with 85.2 miles of
8 Copyright c© 2014 by ASME
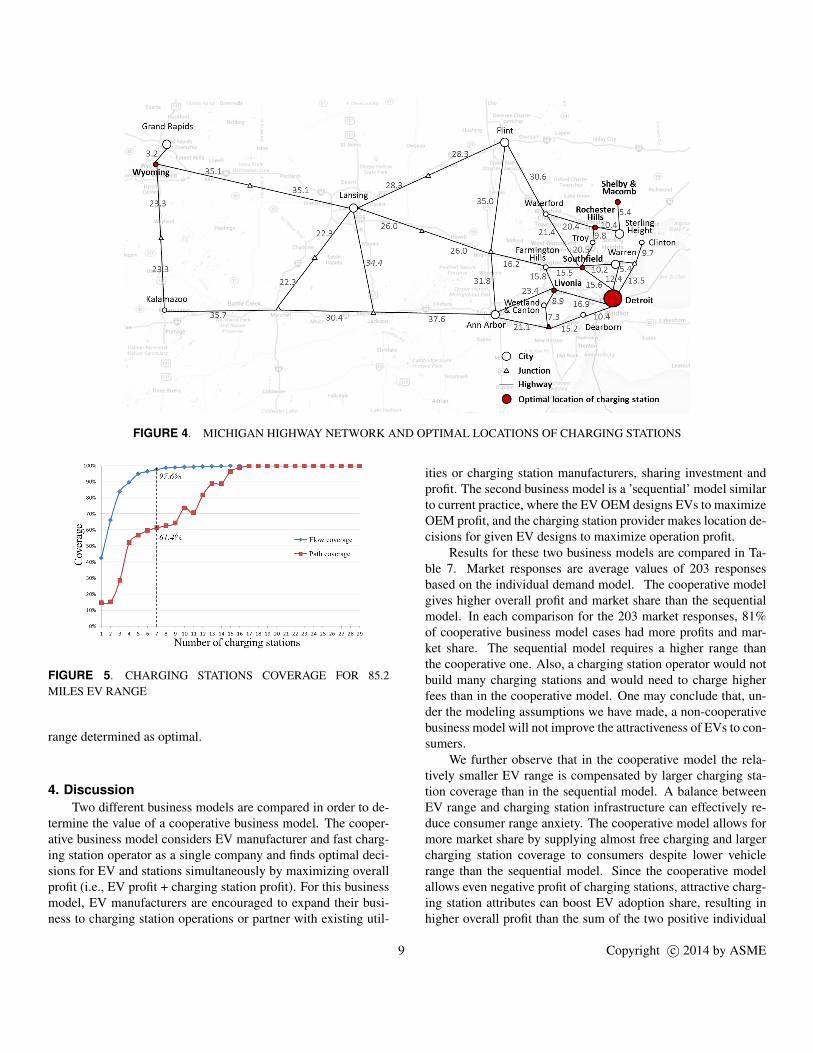
FIGURE 4. MICHIGAN HIGHWAY NETWORK AND OPTIMAL LOCATIONS OF CHARGING STATIONS
FIGURE 5. CHARGING STATIONS COVERAGE FOR 85.2MILES EV RANGE
range determined as optimal.
4. DiscussionTwo different business models are compared in order to de-
termine the value of a cooperative business model. The cooper-ative business model considers EV manufacturer and fast charg-ing station operator as a single company and finds optimal deci-sions for EV and stations simultaneously by maximizing overallprofit (i.e., EV profit + charging station profit). For this businessmodel, EV manufacturers are encouraged to expand their busi-ness to charging station operations or partner with existing util-
ities or charging station manufacturers, sharing investment andprofit. The second business model is a ’sequential’ model similarto current practice, where the EV OEM designs EVs to maximizeOEM profit, and the charging station provider makes location de-cisions for given EV designs to maximize operation profit.
Results for these two business models are compared in Ta-ble 7. Market responses are average values of 203 responsesbased on the individual demand model. The cooperative modelgives higher overall profit and market share than the sequentialmodel. In each comparison for the 203 market responses, 81%of cooperative business model cases had more profits and mar-ket share. The sequential model requires a higher range thanthe cooperative one. Also, a charging station operator would notbuild many charging stations and would need to charge higherfees than in the cooperative model. One may conclude that, un-der the modeling assumptions we have made, a non-cooperativebusiness model will not improve the attractiveness of EVs to con-sumers.
We further observe that in the cooperative model the rela-tively smaller EV range is compensated by larger charging sta-tion coverage than in the sequential model. A balance betweenEV range and charging station infrastructure can effectively re-duce consumer range anxiety. The cooperative model allows formore market share by supplying almost free charging and largercharging station coverage to consumers despite lower vehiclerange than the sequential model. Since the cooperative modelallows even negative profit of charging stations, attractive charg-ing station attributes can boost EV adoption share, resulting inhigher overall profit than the sum of the two positive individual
9 Copyright c© 2014 by ASME

TABLE 6. RESPONSES OF OPTIMAL DECISIONS
Response Values
Market
Overall profit $19.25M
EV profit $20.43M
Station profit -$1.18M
Market share 65.0%
EVattributes
Vehicle price $49,844
Range 85.2miles
MPGe 190.1
Top speed 94.7mph
Acceleration 19.0sec
Chargingstationattribute
Charging fee $0.07
Charging time 19.2m
Path coverage 61.4%
Flow coverage 97.6%
Note: Market response shown in this table is the mean of marketresponse distribution.
profits from EV and charging stations in the sequential model.This is an example of examining a product-service system in anintegrated business model [39].
5. CONCLUSIONThe proposed integrated decision making framework allows
quantification of the tradeoffs among various business modelsfor the EV market. A cooperative business model presents moreadvantages than the existing non-cooperative business model.The results clearly depend on the modeling assumptions made;however, these are generally sufficiently plausible to support thecase for a cooperative approach to improve consumer adoptionof EVs.
In future work, the reliability of the results should be ex-plored through parametric and sensitivity analysis. SoutheastMichigan residents should be surveyed to build the marketingmodel for representing consumer preferences of the target mar-ket. The charging station coverage for each city also should beconsidered rather than a single coverage value for all cities. Per-haps most interestingly, a government policy model should beintegrated in the proposed framework to explore quantitativelyhow government incentives and regulations affect market deci-
TABLE 7. COMPARISON OF TWO BUSINESS MODELS
Cooperativebusiness model
Sequentialbusiness model
Market
Total profit $19.25M $6.94M
EV profit $20.43M $6.75M
Station profit -$1.18M $0.19M
Market share 65.0% 22.5%
EVattributes
Vehicle price $49,844 $49,977
Range 85.2miles 107.5miles
MPGe 190.1 195.16
Top speed 94.7mph 116.4mph
Acceleration 19.0sec 15.9sec
Chargingstationattributes
Number ofchargingstations
7 1
Charging fee $0.07 $20
Charging time 19.2m 23.6m
Path coverage 61.4% 16.4%
Flow coverage 97.6% 43.0%
Note: Market response shown in this table is the mean of marketresponse distribution.
sions.
ACKNOWLEDGMENTThis research was partially supported by a Graham Institute
Doctoral Fellowship at the University of Michigan. This supportis gratefully acknowledged. The authors would also like to thankAlparslan Emrah Bayrak and Swetha Viswanatha for their helpwith building the engineering model and gathering data for thecase study.
REFERENCES[1] L.L. Vardera. The Electric Vehicle Market in the USA. Fin-
pro USA, Stamford, 2010.[2] O. Egbue and S. Long. Barriers to widespread adoption of
electric vehicles: An analysis of consumer attitudes and per-ceptions. Energy Policy, 48:717-729, 2012.
[3] F. Kley, C. Lerch, and D. Dallinger. New business models for
10 Copyright c© 2014 by ASME
electric cars-A holistic approach. Energy Policy, 39(6): 3392-3403, 2011.
[4] M. Melaina and J. Bremson. Refueling availability for alter-native fuel vehicle markets: sufficient urban station coverage.Energy Policy, 36:3233-3241, 2008.
[5] N.S. Pearre, et al. Electric vehicles: How much range is re-quired for a days driving?. Transportation Research Part C:Emerging Technologies, 19(6):1171-1184, 2011.
[6] J. Smart and S. Schey. Battery Electric Vehicle Driving andCharging Behavior Observed Early in The EV project. SAEInt. J. Alt. power, 5(1), 2012.
[7] Nissan Leaf. URL www.en.wikipedia.org/wiki/Nissan Leaf,January, 2014.
[8] The EV project. URL www.theevproject.com, January,2014.
[9] Charge Point. URL www.chargepoint.com, January, 2014.[10] A. Young. Number of Electric Car Fast Charge Stations.
URL http://www.ibtimes.com/ number-electric-car-fast-charge-stations-worldwide-seen-hitting-199000-after-2020-there-were-1800-ev, January, 2014.
[11] A. Schroeder and T. Traber. The economics of fast charg-ing infrastructure for electric vehicles. Energy Policy, 43:136-144, 2012.
[12] AMESim. URL www.lmsintl.com/LMS-Imagine-Lab-AMESim, January, 2014.
[13] H.L. Chan. A new battery model for use with battery energystorage systems and electric vehicles power systems. In PowerEngineering Society Winter Meeting, pages 470-475, IEEE,2000.
[14] S.T. Lee and L.M. Tolbert. Analytical method of torquecalculation for interior permanent magnet synchronous ma-chines. In Energy Conversion Congress and Exposition, pages173-177, IEEE, 2009.
[15] S. Tenner, S. Gunther, and W. Hofmann. Loss minimizationof electric drive systems using a DC/DC converter and an op-timized battery voltage in automotive applications. In VehiclePower and Propulsion Conference (VPPC), pages 1-7, IEEE,2011.
[16] Advanced Vehicle Testing Activity. US De-partment of Energy. 2011 Nissan Leaf - Be-ginning of Test Battery Testing Results. URLhttp://www1.eere.energy.gov/vehiclesandfuels/avta/ lightduty/fsev/fsev reports.html, January, 2014.
[17] Advanced Vehicle Testing Activity. US Department ofEnergy. 2011 Nissan Leaf - Baseline Testing Results. URLhttp://www1.eere.energy.gov/vehiclesandfuels/avta/pdfs/fsev/2011 nissan leaf fs.pdf, January, 2014.
[18] O. Karabasoglu and J.J. Michalek. Influence of driving pat-terns on life cycle cost and emissions of hybrid and plug-in electric vehicle powertrains. Energy Policy, 60:445-461,2013.
[19] E. Traut, C. Hendrickson, E. Klampfl, Y. Liu and J.J.
Michalek. Optimal design and allocation of electrified ve-hicles and dedicated charging infrastructure for minimumlife cycle greenhouse gas emissions and cost. Energy Policy,51:524-534, 2012.
[20] L. Henry and G. Lovellette. Will Electric Cars TransformThe US Vehicle Market?. Belfer Center Discussion Paper.2011.
[21] M.J. Hodgson. A Flow-Capturing Location-AllocationModel. Geographical Analysis, 22(3):270-279, 1990.
[22] M. Kuby and S. Lim. The flow-refueling location problemfor alternative-fuel vehicles. Socio-Economic Planning Sci-ences, 39(2):125-145, 2005.
[23] M. Kuby, S. Lim, and C. Upchurch. Dispersion of NodesAdded to a Network. Geographical Analysis, 37(4):383-409,2005.
[24] M. Kuby and S. Lim. Location of Alternative-Fuel StationsUsing the Flow-Refueling Location Model and Dispersion ofCandidate Sites on Arcs. Networks and Spatial Economics,7(2):129-152, 2007.
[25] C. Upchurch, M. Kuby, and S. Lim. A Model for Locationof Capacitated Alternative-Fuel Stations. Geographical Anal-ysis, 41(1):85-106, 2009.
[26] S. Lim and M. Kuby. Heuristic algorithms for sitingalternative-fuel stations using the Flow-Refueling Loca-tion Model. European Journal of Operational Research,204(1):51-61, 2010.
[27] J.G. Kim and M. Kuby. The deviation-flow refueling lo-cation model for optimizing a network of refueling stations.International Journal of Hydrogen Energy, 37(6), 5406-5420,2012.
[28] Electricity pricing. URL http://en.wikipedia.org/wiki/ Elec-tricity pricing, January, 2014.
[29] S.B. Peterson and J.J. Michalek. Cost-effectiveness of plug-in hybrid electric vehicle battery capacity and charging infras-tructure investment for reducing US gasoline consumption.Energy Policy, 52:429-438, 2012.
[30] P.E. Rossi, G.M. Allenby, and R.E. McCulloch. Bayesianstatistics and marketing. Hoboken, NJ, Wiley, 2005.
[31] B. Orme. The CBC/HB system for hierarchical Bayes esti-mation version 5.0 Technical Paper. In Technical Paper Series.Sawtooth Software, 2009.
[32] P.E. Green and A.M. Krieger. Individualized hybrid modelsfor conjoint analysis. Management Science, 42(6):850-867,1996.
[33] J.J. Michalek, P. Ebbes, F. Adiguzel, F. Feinberg, and P.Y.Papalambros. Enhancing Marketing with Engineering: Opti-mal Product Line Design for Heterogeneous Markets. Inter-national Journal of Research in Marketing, 28(1):1-12, 2010.
[34] W. Chen, C. Hoyle, and H.J. Wassenaar. Decision-BasedDesign: Integrating Consumer Preferences into EngineeringDesign. London, Springer, 2012.
[35] M.K. Hidrue, G.R. Parsons, W. Kempton, and M.P. Gard-
11 Copyright c© 2014 by ASME

ner. Willingness to pay for electric vehicles and their at-tributes. Resource and Energy Economics, 33(3):686-705,2011.
[36] Amazon. Amazon Mechanical Turk. URLwww.mturk.com, January, 2014.
[37] BEV Sales in US in 2013. URL http://insideevs.com/bev-sales-up-241-in-us-in-2013/, January, 2014.
[38] MathWorks. Matlab R2013a. URL http://www.mathworks.com/help/gads/mixed-integer-optimization.html,January, 2014.
[39] N. Kang, F.M. Feinberg, and P.Y. Papalambros. Enterprise-driven Product Service Systems Design. In Proceedings of the19th International Conference on Engineering Design, 2013.
12 Copyright c© 2014 by ASME