Embed Size (px)
Citation preview
Deep Design: Product Aesthetics for Heterogeneous MarketsYanxin Pan
University of [email protected]
Alexander BurnapUniversity of [email protected]
Je�rey HartleyGeneral Motors Corporation
Richard GonzalezUniversity of Michigan
Panos Y. PapalambrosUniversity of Michigan
ABSTRACTAesthetic appeal is a primary driver of customer consideration forproducts such as automobiles. Product designers must accordinglyconvey design a�ributes (e.g., ‘Sportiness’), a challenging proposi-tion given the subjective nature of aesthetics and heterogeneousmarket segments with potentially di�erent aesthetic preferences.We introduce a scalable deep learning approach that predicts howcustomers across di�erent market segments perceive aesthetic de-signs and provides a visualization that can aid in product design.We tested this approach using a large-scale product design andcrowdsourced customer data set with a Siamese neural networkarchitecture containing a pair of conditional generative adversarialnetworks. �e results show that the model predicts aesthetic de-sign a�ributes of customers in heterogeneous market segments andprovides a visualization of these aesthetic perceptions. �is sug-gests that the proposed deep learning approach provides a scalablemethod for understanding customer aesthetic perceptions.
KEYWORDSProduct Aesthetics; Heterogeneous Markets; Deep Learning; Crowd-sourcing; Automobile Design
ACM Reference format:Yanxin Pan, Alexander Burnap, Je�rey Hartley, Richard Gonzalez, and PanosY. Papalambros. 2017. Deep Design: Product Aesthetics for HeterogeneousMarkets. In Proceedings of KDD ’17, Halifax, NS, Canada, August 13-17, 2017,10 pages.DOI: 10.1145/3097983.3098176
1 INTRODUCTIONAesthetic appeal is of critical importance for product design, asit not only a�racts customer a�ention, but assists in conveyingdesign a�ributes (e.g., ‘luxurious,’ ‘sporty,’ ‘well-proportioned’) thatare meaningful to the customer [1, 8]. Conveying these aesthetica�ributes is particularly important for the automotive industry, asunderpinned by the most respected industry assessments (e.g., J.D.
Permission to make digital or hard copies of all or part of this work for personal or classroom use is granted without fee provided that copies are not made or distributed for pro�t or commercial advantage and that copies bear this notice and the full citation on the �rst page. Copyrights for components of this work owned by others than the author(s) must be honored. Abstracting with credit is permi�ed. To copy otherwise, or republish, to post on servers or to redistribute to lists, requires prior speci�c permission and/or a fee. Request permissions from [email protected] ’17, August 13-17, 2017, Halifax, NS, Canada© 2017 Copyright held by the owner/author(s). Publication rights licensed to ACM. 978-1-4503-4887-4/17/08. . . $15.00DOI: 10.1145/3097983.3098176
Power Initial �ality Study [42], J.D. Power APEAL Study [9]) andinternal con�dential studies at General Motors.
Speci�cally, exterior styling is always in the top two or threereasons for purchase, year a�er year. It is also a prominent reasonfor not considering a vehicle for purchase or for rejecting it as a�nalist. �is pa�ern has been found not just in developed markets,such as the US, but in emerging markets such as India [19]. Un-derstanding these aesthetic preferences remains an important andongoing challenge for product designers.
�e major challenge behind this understanding is the “hetero-geneity” of diverse customers across various markets and the in-herent subjectivity of their aesthetic perceptions. �is challengeis especially vital for customer-centered product designs such asautomobiles, as these designs require product di�erentiation acrossmarket segments. �is challenge is further exacerbated given theglobalized nature of modern automobile design, with customerso�en geographically and culturally distant from the designers. Ac-cordingly, product designers use a variety of qualitative and quan-titative methods to assess aesthetic preferences across market seg-ments, with examples including design theme clinics, focus groups,customer surveys, design reviews, and Kansei engineering [20].�e primary goal of these methods is to understand the reasons“why” the customer perceives a design concept as being aestheti-cally appealing or unappealing. Ideally, a designer could identifyspeci�c regions of the physical product design that contribute to thecustomer’s perception of design a�ributes. Identi�cation of theseregions, called “salient design regions” [10], can provide valuableinsight during the design process.
While these methods may capture in-depth customer rationalefor aesthetic perceptions, they have two main drawbacks. First,customers o�en cannot articulate accurately why they like or dislikea design [22, 40]. Second, they are not scalable due to being laborand resource intensive, particularly as multinational enterpriseso�en deal with hundreds or thousands of heterogeneous markets.
In this work, we aim to understand perceptions of aesthetic de-sign a�ributes across customers from heterogeneous markets, andto do this at the scale consistent with a global company. Speci�cally,we aim to answer three fundamental questions in the context ofproduct design:
(1) Does the product design achieve the desired aesthetic de-sign a�ributes for a given market segment?
(2) What are the product’s salient design regions for a givendesign a�ribute?
(3) How do salient design regions di�er across di�erent marketsegments?
KDD 2017 Applied Data Science Paper KDD’17, August 13–17, 2017, Halifax, NS, Canada
1961
We propose a deep learning approach for prediction of aestheticdesign a�ributes for a given customer, that allows interpretation ofthe reasons “why” a design is perceived as appealing or unappeal-ing. �is approach uses a deep learning architecture that capturesthe heterogeneity of customer perceptions across aesthetic designa�ributes. Moreover, this approach has the capacity to analyzelarge-scale data, such that customer heterogeneity may be accu-rately modeled across market segments. Importantly, this approachenables visual interpretation of results by identifying regions of theproduct design that are relevant for a given design a�ribute.
We conduct an study to test this deep learning approach using179,000 2D images of vehicles in the last decade, 3,302 customerpro�les as well as 33,020 data points of customer perceptions ofaesthetic design a�ributes crowdsourced using an online web appli-cation. Our results show that we are indeed able to predict diversecustomer perceptions over design a�ributes, as well as visuallyinterpret the reasons underlying customer perceptions.
�e main contribution of this research is providing an approachto interpreting aesthetic design appeal for design concepts acrossheterogeneous markets. �is approach is scalable to hundreds orthousands of markets, an important consideration for multinationalenterprises engaged in product design. Methodological contribu-tions include a novel deep Siamese neural network architectureusing conditional generative adversarial networks, trained usingmultimodal data including 2D images, numerical labels, and large-scale crowdsourced aesthetic response data.
�e rest of this paper is structured as follows: Section 2 discussesprevious e�orts that quantitatively analyze product aesthetics. Sec-tion 3 introduces the research approach as well as the deep learningmodel and its interpretation algorithm. Section 4 details the experi-mental setup, describes the data sets and presents results showingaesthetic perceptions across market segments. Section 5 discusseshow this work contributes to the product design, as well as itslimitations and future directions. Section 6 provides an overallconclusion.
2 RELATEDWORKWe review related work from the engineering and product designcommunities, as well as recent advances in deep learning for aes-thetic styling.
2.1 Product Design Aesthetics�e engineering and product design communities have studiedfactors a�ecting the styling a�ributes of designs using both experi-mental approaches and modeling approaches.
Experimental approaches to understand implicit customer per-ceptions of aesthetic design a�ributes o�en employ eye-tracking.�e earliest pioneering work with such eye-tracking dates backto 1935, when an experiment recorded eye-gaze �xation acrossregions in artistic pictures [5]. Eye-tracking methods have beensuccessfully applied in various domains such as optimizing thelayout of product placement in advertisements [11], web page lay-outs [4, 45], and consumer choice under pressure [37]. For productdesign speci�cally, eye-tracking has been applied to design repre-sentations [17, 35], relations with vehicle face components [10, 46],and design diagram assessment [39].
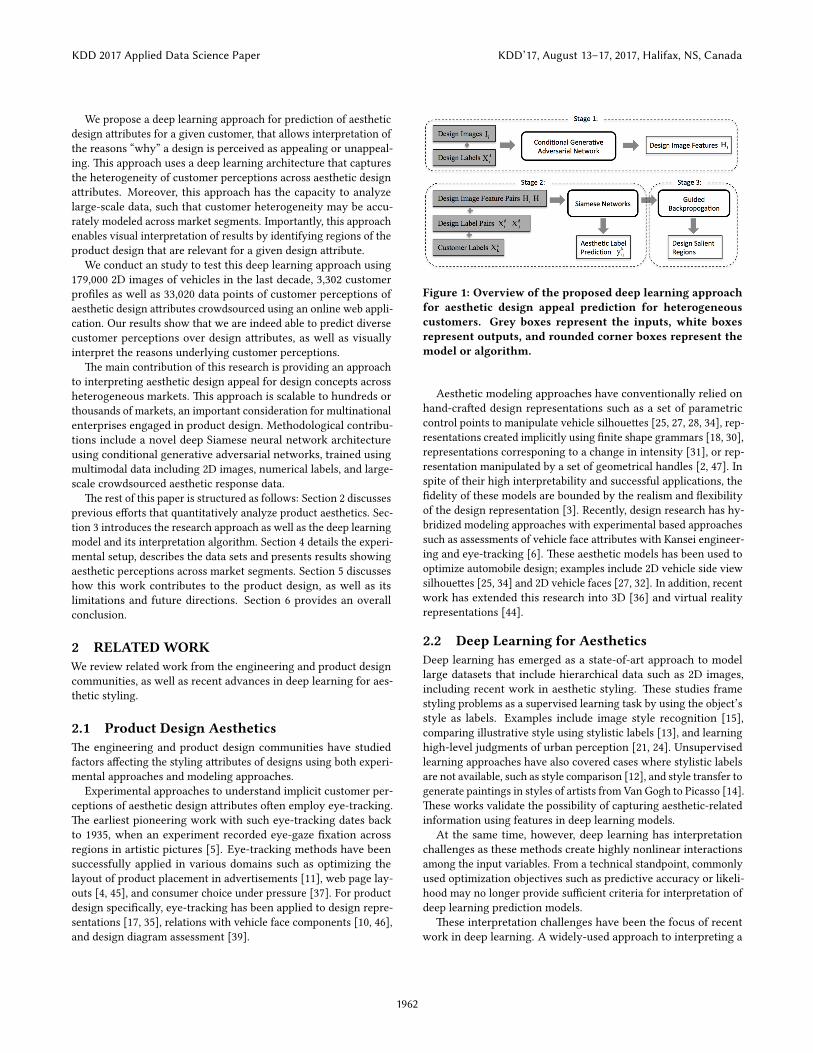
Figure 1: Overview of the proposed deep learning approachfor aesthetic design appeal prediction for heterogeneouscustomers. Grey boxes represent the inputs, white boxesrepresent outputs, and rounded corner boxes represent themodel or algorithm.
Aesthetic modeling approaches have conventionally relied onhand-cra�ed design representations such as a set of parametriccontrol points to manipulate vehicle silhoue�es [25, 27, 28, 34], rep-resentations created implicitly using �nite shape grammars [18, 30],representations corresponing to a change in intensity [31], or rep-resentation manipulated by a set of geometrical handles [2, 47]. Inspite of their high interpretability and successful applications, the�delity of these models are bounded by the realism and �exibilityof the design representation [3]. Recently, design research has hy-bridized modeling approaches with experimental based approachessuch as assessments of vehicle face a�ributes with Kansei engineer-ing and eye-tracking [6]. �ese aesthetic models has been used tooptimize automobile design; examples include 2D vehicle side viewsilhoue�es [25, 34] and 2D vehicle faces [27, 32]. In addition, recentwork has extended this research into 3D [36] and virtual realityrepresentations [44].
2.2 Deep Learning for AestheticsDeep learning has emerged as a state-of-art approach to modellarge datasets that include hierarchical data such as 2D images,including recent work in aesthetic styling. �ese studies framestyling problems as a supervised learning task by using the object’sstyle as labels. Examples include image style recognition [15],comparing illustrative style using stylistic labels [13], and learninghigh-level judgments of urban perception [21, 24]. Unsupervisedlearning approaches have also covered cases where stylistic labelsare not available, such as style comparison [12], and style transfer togenerate paintings in styles of artists from Van Gogh to Picasso [14].�ese works validate the possibility of capturing aesthetic-relatedinformation using features in deep learning models.
At the same time, however, deep learning has interpretationchallenges as these methods create highly nonlinear interactionsamong the input variables. From a technical standpoint, commonlyused optimization objectives such as predictive accuracy or likeli-hood may no longer provide su�cient criteria for interpretation ofdeep learning prediction models.
�ese interpretation challenges have been the focus of recentwork in deep learning. A widely-used approach to interpreting a
KDD 2017 Applied Data Science Paper KDD’17, August 13–17, 2017, Halifax, NS, Canada
1962
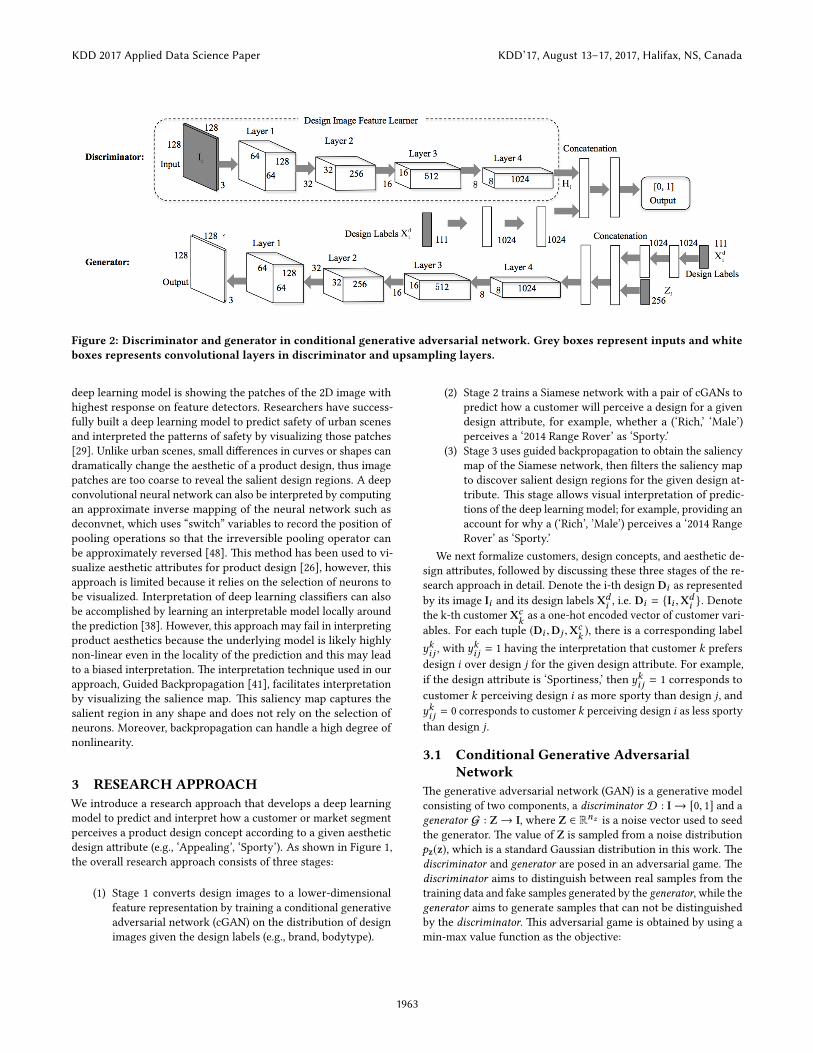
Figure 2: Discriminator and generator in conditional generative adversarial network. Grey boxes represent inputs and whiteboxes represents convolutional layers in discriminator and upsampling layers.
deep learning model is showing the patches of the 2D image withhighest response on feature detectors. Researchers have success-fully built a deep learning model to predict safety of urban scenesand interpreted the pa�erns of safety by visualizing those patches[29]. Unlike urban scenes, small di�erences in curves or shapes candramatically change the aesthetic of a product design, thus imagepatches are too coarse to reveal the salient design regions. A deepconvolutional neural network can also be interpreted by computingan approximate inverse mapping of the neural network such asdeconvnet, which uses “switch” variables to record the position ofpooling operations so that the irreversible pooling operator canbe approximately reversed [48]. �is method has been used to vi-sualize aesthetic a�ributes for product design [26], however, thisapproach is limited because it relies on the selection of neurons tobe visualized. Interpretation of deep learning classi�ers can alsobe accomplished by learning an interpretable model locally aroundthe prediction [38]. However, this approach may fail in interpretingproduct aesthetics because the underlying model is likely highlynon-linear even in the locality of the prediction and this may leadto a biased interpretation. �e interpretation technique used in ourapproach, Guided Backpropagation [41], facilitates interpretationby visualizing the salience map. �is saliency map captures thesalient region in any shape and does not rely on the selection ofneurons. Moreover, backpropagation can handle a high degree ofnonlinearity.
3 RESEARCH APPROACHWe introduce a research approach that develops a deep learningmodel to predict and interpret how a customer or market segmentperceives a product design concept according to a given aestheticdesign a�ribute (e.g., ‘Appealing’, ‘Sporty’). As shown in Figure 1,the overall research approach consists of three stages:
(1) Stage 1 converts design images to a lower-dimensionalfeature representation by training a conditional generativeadversarial network (cGAN) on the distribution of designimages given the design labels (e.g., brand, bodytype).
(2) Stage 2 trains a Siamese network with a pair of cGANs topredict how a customer will perceive a design for a givendesign a�ribute, for example, whether a (‘Rich,’ ‘Male’)perceives a ‘2014 Range Rover’ as ‘Sporty.’
(3) Stage 3 uses guided backpropagation to obtain the saliencymap of the Siamese network, then �lters the saliency mapto discover salient design regions for the given design at-tribute. �is stage allows visual interpretation of predic-tions of the deep learning model; for example, providing anaccount for why a (‘Rich’, ’Male’) perceives a ‘2014 RangeRover’ as ‘Sporty.’
We next formalize customers, design concepts, and aesthetic de-sign a�ributes, followed by discussing these three stages of the re-search approach in detail. Denote the i-th design Di as representedby its image Ii and its design labels Xd
i , i.e. Di = {Ii ,Xdi }. Denote
the k-th customer Xck as a one-hot encoded vector of customer vari-
ables. For each tuple (Di ,Dj ,Xck ), there is a corresponding label
yki j , with yki j = 1 having the interpretation that customer k prefersdesign i over design j for the given design a�ribute. For example,if the design a�ribute is ‘Sportiness,’ then yki j = 1 corresponds tocustomer k perceiving design i as more sporty than design j, andyki j = 0 corresponds to customer k perceiving design i as less sportythan design j.
3.1 Conditional Generative AdversarialNetwork
�e generative adversarial network (GAN) is a generative modelconsisting of two components, a discriminator D : I→ [0, 1] and agenerator G : Z→ I, where Z ∈ Rnz is a noise vector used to seedthe generator. �e value of Z is sampled from a noise distributionpz(z), which is a standard Gaussian distribution in this work. �ediscriminator and generator are posed in an adversarial game. �ediscriminator aims to distinguish between real samples from thetraining data and fake samples generated by the generator, while thegenerator aims to generate samples that can not be distinguishedby the discriminator. �is adversarial game is obtained by using amin-max value function as the objective:
KDD 2017 Applied Data Science Paper KDD’17, August 13–17, 2017, Halifax, NS, Canada
1963
minG
maxD
(EI∼pI (I ) [logD (I)]+
EZ∼pz(z) [log (1 − D (G (Z)))]) (1)
Our work extends conventional generative adversarial networkswith a conditional architecture, termed a conditional generativeadversarial network (cGAN). In this architecture, there is a set ofvariables Xd that are believed to be relevant to the image I, and thecGAN aims to capture the relationship between the image and thisexternal information. �e generator G and discriminator D in thecGAN model can be rede�ned as following:
G : (Z × Xd ) → I
D : (I × Xd ) → [0, 1](2)
�e generator G de�nes a conditional distribution pд(I|Xd ), en-abling conditioning of the generative model with contextual infor-mation Xd . In this work, Xd are the design labels of an automobile,such as brand, body type, color, and viewpoints. By varying thevalue of Xd in the generator, the design labels of the generatedsample can be explicitly controlled. More importantly, conditioningon design labels will prompt the model to focus on learning the fea-tures describing the appearance of the design instead of the knownsemantic features of the the design labels. �ese design labels aredetailed in Table 1. In this way, the features extracted from cGANare more relevant to our later predictive task of capturing aestheticappeal as will be discussed later.
Similar to the GAN, the generator G and discriminator D incGAN are posed in an adversarial game by a minmax value function:
minG
maxD
(E(I,Xd )∼pI (I,Xd )
[logD
(I,Xd
)]+
EXd∼pXd ,z∼pz(z)[log
(1 − D
(G
(Z,Xd
),Xd
))] ) (3)
Conventionally, the discriminator aims to assign a positive labelto the training samples (Ii ,Xd
i ), and a negtive label to generatedsamples G(Zi ,Xd
i ), i = 1, 2, . . . ,n. �e objective function of aconventional discriminator is:
JD = −1n
( n∑i=1
logD(Ii ,Xdi )+
n∑i=1
log(1 − D(G(Zi ,Xdi ),X
di ))
) (4)
We extend this formulation by forcing the discriminator to cap-ture the link between the design images and their design labels bymodifying the loss function [33]. Speci�cally, we penalize the dis-criminator when it assigns a positive label to an incorrect trainingsample (Ii ,Xd
r ), where r is randomly drawn from [1, 2, . . . ,n] andr , i .
JD = −1n(n∑i=1
logD(Ii ,Xdi ) +
12 (
n∑i=1
log(1 − D(Ii ,Xdr ))
+
n∑i=1
log(1 − D(G(Zi ,Xdi ),X
di ))))
(5)
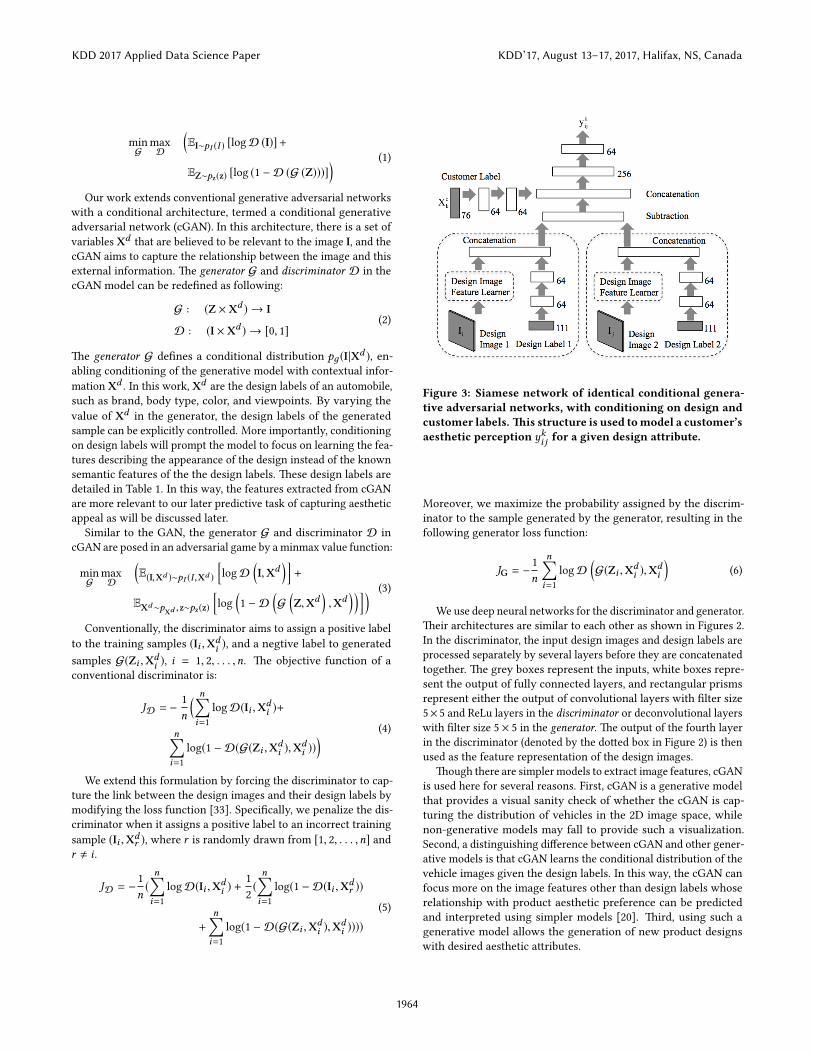
Figure 3: Siamese network of identical conditional genera-tive adversarial networks, with conditioning on design andcustomer labels. �is structure is used tomodel a customer’saesthetic perception yki j for a given design attribute.
Moreover, we maximize the probability assigned by the discrim-inator to the sample generated by the generator, resulting in thefollowing generator loss function:
JG = −1n
n∑i=1
logD(G(Zi ,Xd
i ),Xdi
)(6)
We use deep neural networks for the discriminator and generator.�eir architectures are similar to each other as shown in Figures 2.In the discriminator, the input design images and design labels areprocessed separately by several layers before they are concatenatedtogether. �e grey boxes represent the inputs, white boxes repre-sent the output of fully connected layers, and rectangular prismsrepresent either the output of convolutional layers with �lter size5× 5 and ReLu layers in the discriminator or deconvolutional layerswith �lter size 5 × 5 in the generator. �e output of the fourth layerin the discriminator (denoted by the do�ed box in Figure 2) is thenused as the feature representation of the design images.
�ough there are simpler models to extract image features, cGANis used here for several reasons. First, cGAN is a generative modelthat provides a visual sanity check of whether the cGAN is cap-turing the distribution of vehicles in the 2D image space, whilenon-generative models may fall to provide such a visualization.Second, a distinguishing di�erence between cGAN and other gener-ative models is that cGAN learns the conditional distribution of thevehicle images given the design labels. In this way, the cGAN canfocus more on the image features other than design labels whoserelationship with product aesthetic preference can be predictedand interpreted using simpler models [20]. �ird, using such agenerative model allows the generation of new product designswith desired aesthetic a�ributes.
KDD 2017 Applied Data Science Paper KDD’17, August 13–17, 2017, Halifax, NS, Canada
1964
3.2 Siamese NetworkSiamese neural networks are a class of neural network architec-tures that contain two or more identical subnetworks [7]. �eseidentical subnetworks share the same architecture as well as thesame parameters and weights. Siamese neural networks are com-mon for modeling similarity or a relation between two comparableinputs, for example, verifying handwri�en signatures. �e Siamesestructure o�ers several technical advantages, including requiringfewer parameters to estimate so is less likely to over�t the data.
�e structure of the Siamese network used in this work is givenin Figure 3. �e “design image feature learner,” or the feature rep-resentation given by the bo�om four layers of the discriminatorfrom the cGAN (see in Figure 2), are used as the Siamese network’ssubnetworks. �is 2D image feature representation is then con-nected with a feature representation of the design labels. A�ersubtracting between concatenated 2D image and design label fea-tures, the result is then concatenated with features of customerlabels. �is concatenated feature vector is then passed throughtwo fully connected layers before the binary prediction task. �eobjective we used to train the entire model is the cross entropy Jsofthis task.
Js = −1n
( ∑i, j,k
yki j log(σ (f (Ii , Ij ,Xdi ,X
dj ,X
ck )))+
(1 − yki j ) log(1 − σ (f (Ii , Ij ,Xdi ,X
dj ,X
ck )))
) (7)
where σ (·) is the sigmoid function, and f (·) represents the Siamesenetwork.
3.3 Guided BackpropagationGuided backpropagation computes a saliency map for a trainedneural network [41]. �is saliency map is used to visualize whichpixels/regions of an input image are most important for a a neuralnetwork’s prediction. �e key idea behind guided backpropagationis to compute the gradient of the neural network’s prediction withrespect to the input image with �xed weights. �is determineswhich pixels in the design image are sensitive to the predictionlabel, or in other words, which pixels can signi�cantly a�ect theprediction even with small perturbations.
Compared with other visualization methods, guided backprop-agation has the ability to produce sharp visualizations of salientimage regions. �is sharpness is particularly important for our taskas shapes and edges of product designs are a major contributor toa customer’s aesthetic perception [23]. Accordingly, we use guidedbackpropagation to visualize the trained Siamese network fromSection 3.2. �is allows interpretation of which regions of a designmost contribute to a customer’s perceptual response over aestheticdesign a�ributes.
Guided backpropagation is an extension of conventional back-propagation. �e primary di�erence is how the gradient is back-propagated through “neurons,” in which we always assume as linearrecti�er units, y(x) =max(x , 0) = x · [x > 0], where [·] is the indi-cator function. In conventional backpropagation, the gradient ofthe recti�er’s output with respect to its input is de�ned as follows:dydx y(x) = [x > 0]. Backpropagation of the error signal δi throughthe recti�er is δi−1 = δi · [x > 0]. Instead, in guided backpropaga-tion, the error signal is δi−1 = δi · [x > 0] · [δi > 0] when passing
Table 1: Design labels
Label Names Dim. Label ValueYear 15 2000-2014Make 48 Land Rover, Nissan, etc.Model 23 Range Rover Sport, Rogue Select, etc.Body type 20 SUV, Sedan, etc.View Point 2 [sinθ , cosθ ], where θ is the angle.Color 3 RGB
Table 2: Customer labels
Label Names Dim. Label ValueAge 1 0 - 99Gender 3 Female, Male, Prefer not to say.Income Level 20 $0 - $200,000+House Region 5 Metropolitan, Suburban, etc.Family Size 10 0 - 20Current Car Brand 48 Audi, Cadiliac, BMW, etc.
through the recti�er. �is results in guided backpropagation onlypassing positive error to positive inputs, such that the error signalis guided not only by the input from the layer below the recti�er,but also by the error signal from layers above the recti�er.
Based on the obtained saliency map, we de�ne salient regionsby thresholding on saliency map values. �is threshold is a hy-perparameter chosen by designers, who have domain expertise inthis area. A higher threshold results in salient regions with higherlevels of sensitivity, while lower thresholds allow more holisticvisualization of salient regions.
4 STUDYWe conducted a study to test whether the deep learning research ap-proach introduced in Section 3 can be used to understand aestheticperceptions of customers in heterogeneous markets. Speci�cally,we aim to capture customer perceptions of four pairs of aestheticdesign a�ributes: ‘Sporty’ vs. ’Conservative’, ’Luxurious’ vs. ’Basic’,’Innovative’ vs. ’Traditional’, and ’Appealing’ vs. ’Unappealing’, forthe sport utility vehicles (SUV) designed on the U.S. market from2010 to 2014, followed by visual interpretation of salient regions ofthese SUVs according to customer perceptions of sportiness.
4.1 DataFour data sources are used from di�erent modalities: (i) 2D de-sign images, (ii) design labels (e.g., bodytype), (iii) customer labelscrowdsourced using an online interactive web application, and (iv)aesthetic perception data for a given customer and set of designs.
4.1.1 Design Data. �e full design data set consists of 2D imagesand design labels corresponding to semantic information aboutthese images. �is data set contains 179,702 2D images of vehicledesigns on the U.S. market from 2000 to 2014. Each design imagehas corresponding design labels as listed in Table 1. �e full designdata set was used to train the conditional generative adversarialnetwork described in subsection 3.1.
KDD 2017 Applied Data Science Paper KDD’17, August 13–17, 2017, Halifax, NS, Canada
1965
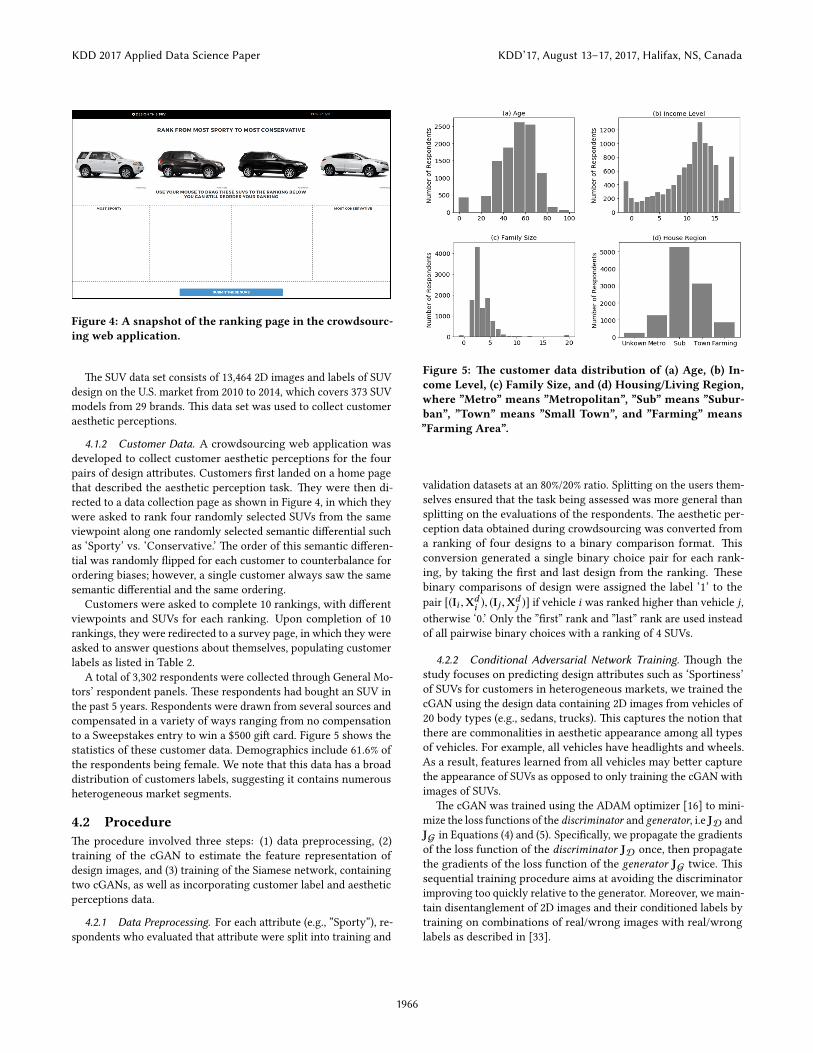
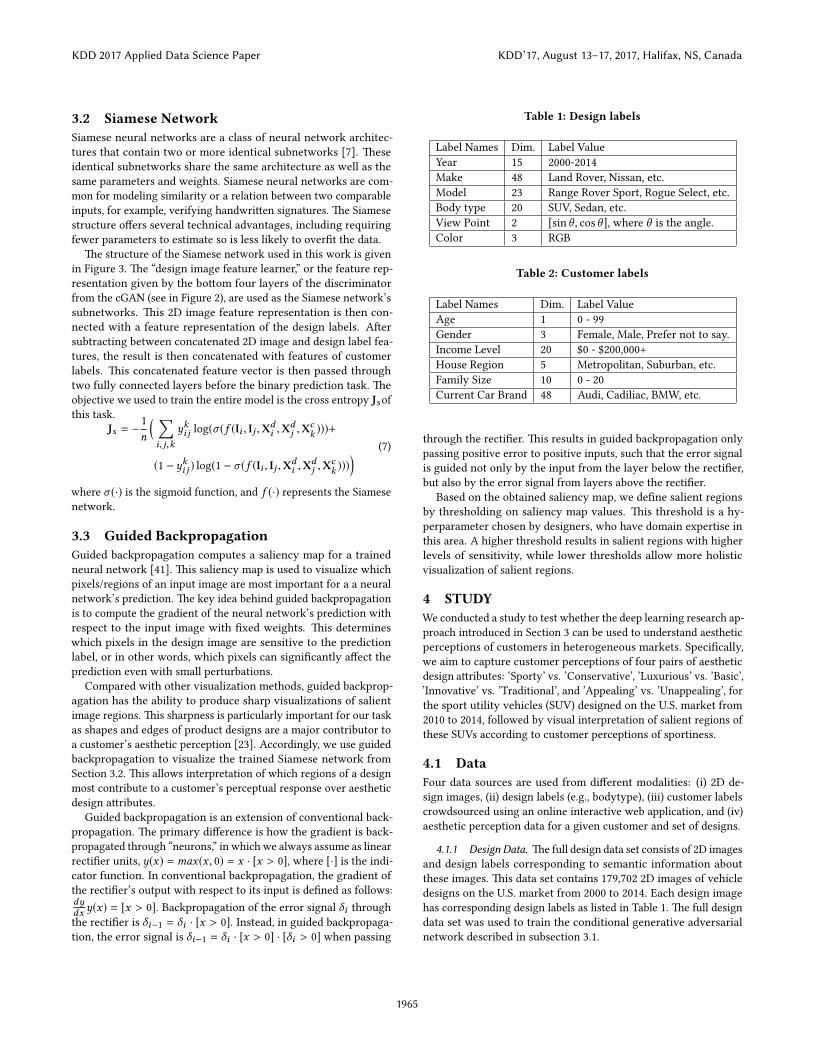
Figure 4: A snapshot of the ranking page in the crowdsourc-ing web application.
�e SUV data set consists of 13,464 2D images and labels of SUVdesign on the U.S. market from 2010 to 2014, which covers 373 SUVmodels from 29 brands. �is data set was used to collect customeraesthetic perceptions.
4.1.2 Customer Data. A crowdsourcing web application wasdeveloped to collect customer aesthetic perceptions for the fourpairs of design a�ributes. Customers �rst landed on a home pagethat described the aesthetic perception task. �ey were then di-rected to a data collection page as shown in Figure 4, in which theywere asked to rank four randomly selected SUVs from the sameviewpoint along one randomly selected semantic di�erential suchas ‘Sporty’ vs. ‘Conservative.’ �e order of this semantic di�eren-tial was randomly �ipped for each customer to counterbalance forordering biases; however, a single customer always saw the samesemantic di�erential and the same ordering.
Customers were asked to complete 10 rankings, with di�erentviewpoints and SUVs for each ranking. Upon completion of 10rankings, they were redirected to a survey page, in which they wereasked to answer questions about themselves, populating customerlabels as listed in Table 2.
A total of 3,302 respondents were collected through General Mo-tors’ respondent panels. �ese respondents had bought an SUV inthe past 5 years. Respondents were drawn from several sources andcompensated in a variety of ways ranging from no compensationto a Sweepstakes entry to win a $500 gi� card. Figure 5 shows thestatistics of these customer data. Demographics include 61.6% ofthe respondents being female. We note that this data has a broaddistribution of customers labels, suggesting it contains numerousheterogeneous market segments.
4.2 Procedure�e procedure involved three steps: (1) data preprocessing, (2)training of the cGAN to estimate the feature representation ofdesign images, and (3) training of the Siamese network, containingtwo cGANs, as well as incorporating customer label and aestheticperceptions data.
4.2.1 Data Preprocessing. For each a�ribute (e.g., ”Sporty”), re-spondents who evaluated that a�ribute were split into training and
Figure 5: �e customer data distribution of (a) Age, (b) In-come Level, (c) Family Size, and (d) Housing/Living Region,where ”Metro” means ”Metropolitan”, ”Sub” means ”Subur-ban”, ”Town” means ”Small Town”, and ”Farming” means”Farming Area”.
validation datasets at an 80%/20% ratio. Spli�ing on the users them-selves ensured that the task being assessed was more general thanspli�ing on the evaluations of the respondents. �e aesthetic per-ception data obtained during crowdsourcing was converted froma ranking of four designs to a binary comparison format. �isconversion generated a single binary choice pair for each rank-ing, by taking the �rst and last design from the ranking. �esebinary comparisons of design were assigned the label ‘1’ to thepair [(Ii ,Xd
i ), (Ij ,Xdj )] if vehicle i was ranked higher than vehicle j ,
otherwise ‘0.’ Only the ”�rst” rank and ”last” rank are used insteadof all pairwise binary choices with a ranking of 4 SUVs.
4.2.2 Conditional Adversarial Network Training. �ough thestudy focuses on predicting design a�ributes such as ‘Sportiness’of SUVs for customers in heterogeneous markets, we trained thecGAN using the design data containing 2D images from vehicles of20 body types (e.g., sedans, trucks). �is captures the notion thatthere are commonalities in aesthetic appearance among all typesof vehicles. For example, all vehicles have headlights and wheels.As a result, features learned from all vehicles may be�er capturethe appearance of SUVs as opposed to only training the cGAN withimages of SUVs.
�e cGAN was trained using the ADAM optimizer [16] to mini-mize the loss functions of the discriminator and generator, i.e JD andJG in Equations (4) and (5). Speci�cally, we propagate the gradientsof the loss function of the discriminator JD once, then propagatethe gradients of the loss function of the generator JG twice. �issequential training procedure aims at avoiding the discriminatorimproving too quickly relative to the generator. Moreover, we main-tain disentanglement of 2D images and their conditioned labels bytraining on combinations of real/wrong images with real/wronglabels as described in [33].
KDD 2017 Applied Data Science Paper KDD’17, August 13–17, 2017, Halifax, NS, Canada
1966
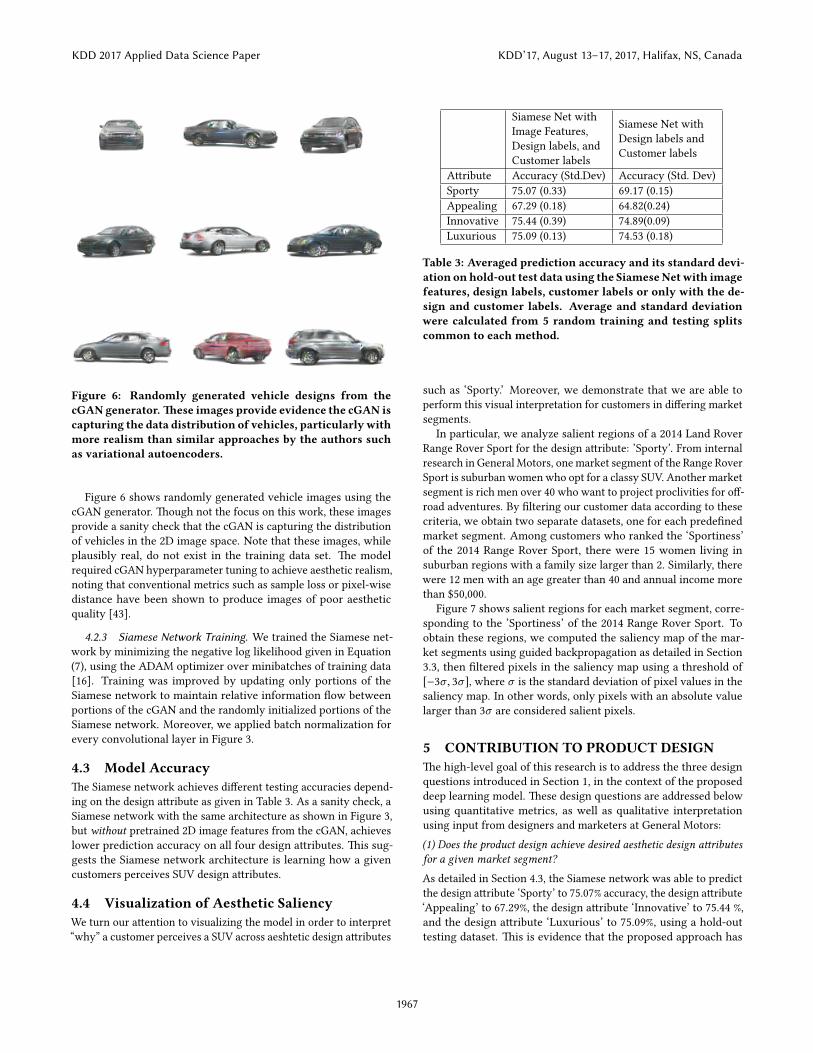
Figure 6: Randomly generated vehicle designs from thecGAN generator. �ese images provide evidence the cGAN iscapturing the data distribution of vehicles, particularlywithmore realism than similar approaches by the authors suchas variational autoencoders.
Figure 6 shows randomly generated vehicle images using thecGAN generator. �ough not the focus on this work, these imagesprovide a sanity check that the cGAN is capturing the distributionof vehicles in the 2D image space. Note that these images, whileplausibly real, do not exist in the training data set. �e modelrequired cGAN hyperparameter tuning to achieve aesthetic realism,noting that conventional metrics such as sample loss or pixel-wisedistance have been shown to produce images of poor aestheticquality [43].
4.2.3 Siamese Network Training. We trained the Siamese net-work by minimizing the negative log likelihood given in Equation(7), using the ADAM optimizer over minibatches of training data[16]. Training was improved by updating only portions of theSiamese network to maintain relative information �ow betweenportions of the cGAN and the randomly initialized portions of theSiamese network. Moreover, we applied batch normalization forevery convolutional layer in Figure 3.
4.3 Model Accuracy�e Siamese network achieves di�erent testing accuracies depend-ing on the design a�ribute as given in Table 3. As a sanity check, aSiamese network with the same architecture as shown in Figure 3,but without pretrained 2D image features from the cGAN, achieveslower prediction accuracy on all four design a�ributes. �is sug-gests the Siamese network architecture is learning how a givencustomers perceives SUV design a�ributes.
4.4 Visualization of Aesthetic SaliencyWe turn our a�ention to visualizing the model in order to interpret“why” a customer perceives a SUV across aeshtetic design a�ributes
Siamese Net withImage Features,Design labels, andCustomer labels
Siamese Net withDesign labels andCustomer labels
A�ribute Accuracy (Std.Dev) Accuracy (Std. Dev)Sporty 75.07 (0.33) 69.17 (0.15)Appealing 67.29 (0.18) 64.82(0.24)Innovative 75.44 (0.39) 74.89(0.09)Luxurious 75.09 (0.13) 74.53 (0.18)
Table 3: Averaged prediction accuracy and its standard devi-ation onhold-out test data using the SiameseNetwith imagefeatures, design labels, customer labels or only with the de-sign and customer labels. Average and standard deviationwere calculated from 5 random training and testing splitscommon to each method.
such as ‘Sporty.’ Moreover, we demonstrate that we are able toperform this visual interpretation for customers in di�ering marketsegments.
In particular, we analyze salient regions of a 2014 Land RoverRange Rover Sport for the design a�ribute: ’Sporty’. From internalresearch in General Motors, one market segment of the Range RoverSport is suburban women who opt for a classy SUV. Another marketsegment is rich men over 40 who want to project proclivities for o�-road adventures. By �ltering our customer data according to thesecriteria, we obtain two separate datasets, one for each prede�nedmarket segment. Among customers who ranked the ‘Sportiness’of the 2014 Range Rover Sport, there were 15 women living insuburban regions with a family size larger than 2. Similarly, therewere 12 men with an age greater than 40 and annual income morethan $50,000.
Figure 7 shows salient regions for each market segment, corre-sponding to the ’Sportiness’ of the 2014 Range Rover Sport. Toobtain these regions, we computed the saliency map of the mar-ket segments using guided backpropagation as detailed in Section3.3, then �ltered pixels in the saliency map using a threshold of[−3σ , 3σ ], where σ is the standard deviation of pixel values in thesaliency map. In other words, only pixels with an absolute valuelarger than 3σ are considered salient pixels.
5 CONTRIBUTION TO PRODUCT DESIGN�e high-level goal of this research is to address the three designquestions introduced in Section 1, in the context of the proposeddeep learning model. �ese design questions are addressed belowusing quantitative metrics, as well as qualitative interpretationusing input from designers and marketers at General Motors:(1) Does the product design achieve desired aesthetic design a�ributesfor a given market segment?
As detailed in Section 4.3, the Siamese network was able to predictthe design a�ribute ‘Sporty’ to 75.07% accuracy, the design a�ribute‘Appealing’ to 67.29%, the design a�ribute ‘Innovative’ to 75.44 %,and the design a�ribute ‘Luxurious’ to 75.09%, using a hold-outtesting dataset. �is is evidence that the proposed approach has
KDD 2017 Applied Data Science Paper KDD’17, August 13–17, 2017, Halifax, NS, Canada
1967
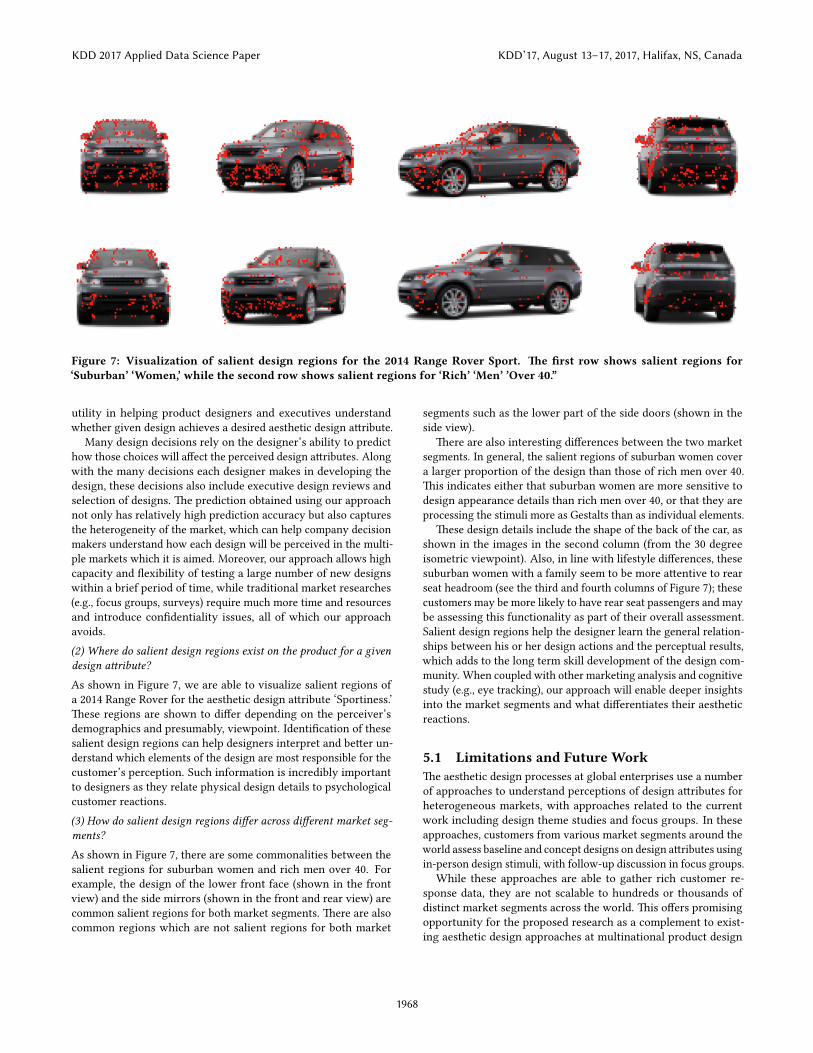
Figure 7: Visualization of salient design regions for the 2014 Range Rover Sport. �e �rst row shows salient regions for‘Suburban’ ‘Women,’ while the second row shows salient regions for ‘Rich’ ‘Men’ ’Over 40.”
utility in helping product designers and executives understandwhether given design achieves a desired aesthetic design a�ribute.
Many design decisions rely on the designer’s ability to predicthow those choices will a�ect the perceived design a�ributes. Alongwith the many decisions each designer makes in developing thedesign, these decisions also include executive design reviews andselection of designs. �e prediction obtained using our approachnot only has relatively high prediction accuracy but also capturesthe heterogeneity of the market, which can help company decisionmakers understand how each design will be perceived in the multi-ple markets which it is aimed. Moreover, our approach allows highcapacity and �exibility of testing a large number of new designswithin a brief period of time, while traditional market researches(e.g., focus groups, surveys) require much more time and resourcesand introduce con�dentiality issues, all of which our approachavoids.(2) Where do salient design regions exist on the product for a givendesign a�ribute?
As shown in Figure 7, we are able to visualize salient regions ofa 2014 Range Rover for the aesthetic design a�ribute ‘Sportiness.’�ese regions are shown to di�er depending on the perceiver’sdemographics and presumably, viewpoint. Identi�cation of thesesalient design regions can help designers interpret and be�er un-derstand which elements of the design are most responsible for thecustomer’s perception. Such information is incredibly importantto designers as they relate physical design details to psychologicalcustomer reactions.(3) How do salient design regions di�er across di�erent market seg-ments?
As shown in Figure 7, there are some commonalities between thesalient regions for suburban women and rich men over 40. Forexample, the design of the lower front face (shown in the frontview) and the side mirrors (shown in the front and rear view) arecommon salient regions for both market segments. �ere are alsocommon regions which are not salient regions for both market
segments such as the lower part of the side doors (shown in theside view).
�ere are also interesting di�erences between the two marketsegments. In general, the salient regions of suburban women covera larger proportion of the design than those of rich men over 40.�is indicates either that suburban women are more sensitive todesign appearance details than rich men over 40, or that they areprocessing the stimuli more as Gestalts than as individual elements.
�ese design details include the shape of the back of the car, asshown in the images in the second column (from the 30 degreeisometric viewpoint). Also, in line with lifestyle di�erences, thesesuburban women with a family seem to be more a�entive to rearseat headroom (see the third and fourth columns of Figure 7); thesecustomers may be more likely to have rear seat passengers and maybe assessing this functionality as part of their overall assessment.Salient design regions help the designer learn the general relation-ships between his or her design actions and the perceptual results,which adds to the long term skill development of the design com-munity. When coupled with other marketing analysis and cognitivestudy (e.g., eye tracking), our approach will enable deeper insightsinto the market segments and what di�erentiates their aestheticreactions.
5.1 Limitations and Future Work�e aesthetic design processes at global enterprises use a numberof approaches to understand perceptions of design a�ributes forheterogeneous markets, with approaches related to the currentwork including design theme studies and focus groups. In theseapproaches, customers from various market segments around theworld assess baseline and concept designs on design a�ributes usingin-person design stimuli, with follow-up discussion in focus groups.
While these approaches are able to gather rich customer re-sponse data, they are not scalable to hundreds or thousands ofdistinct market segments across the world. �is o�ers promisingopportunity for the proposed research as a complement to exist-ing aesthetic design approaches at multinational product design
KDD 2017 Applied Data Science Paper KDD’17, August 13–17, 2017, Halifax, NS, Canada
1968
companies. Advancing this deep learning approach into practice,however, requires overcoming a number of limitations.
First, in contrast to many machine learning tasks focused onincreasing prediction accuracy, such as optimal ad placement for ad-vertising companies such as Google, understanding the underlyingfactors a�ecting heterogeneous use perceptions are most impor-tant for this work. For example, how the ordering of perceptualstimuli a�ect the construction of customer preferences, which maysuggest the layout of such information presenting design optionsto customers. �is provides an opportunity for machine learningalgorithms such as the one used here to inform design process.
�is work may thus provide a test bed for design-speci�c andpsychological questions, such as di�erences between binary choiceand partial ranking tasks under various mediums. �is may beparticularly relevant given the ongoing shi� to internet-based in-formation seeking of customers. Important in this direction areconsistency metrics that measure the di�erence between the salientregions of known similar customers. Such metrics have provenchallenging, due to the mismatch between common quantitativemetrics for model evaluation and the realism of designs encodedusing generative models [43].
Second, the prediction accuracy of the current work must beincreased before designers may have full con�dence in predictedanswers to aesthetic design questions. Increasing this predictionaccuracy may take a number of directions. Collecting more cus-tomer data may signi�cantly improve accuracy, both by simplyhaving more data, but perhaps more importantly, by having morecustomer variables. One can imagine customer variables, such as‘hobbies’ and ‘environmental consciousness,’ may provide a muchricher representation of customers with regards to their aestheticpreferences.
Architectural changes to this deep learning approach, beyondthe Siamese network, may provide additional opportunities forimproved accuracy. While details are not reported, a number ofsimilar approaches were a�empted before the current architecturewas selected. Pretrained neural networks did not result in usefulimage features, and in fact, reduced aesthetic prediction accuracybelow baseline levels due to the increase in parameters. Similarly,generative approaches such as the use of variational autoencodersdid not improve prediction accuracies. �e authors suggest thisis likely due to the low realism of the current state-of-the-art ofgenerative modeling. In this direction, recent results in stackingmultiscale generative adversarial networks has shown impressivecapture of the underlying data distribution [49]. Moreover, chang-ing the prediction task itself to be�er capture the human perceptionprocess will likely improve accuracy; for example, changing to aranking output task.
�ird, validation of the proposed deep learning approach requiresadditional study. High prediction accuracy does not necessarilylead to valid answers to design questions [43]. For example, learnedfeature representations may lead to highly distributed encodingsthat are e�cient for separation of data in the feature space ratherthan localized encodings that more representative of human percep-tions over design. A possible direction to validate our approach is tocross-reference �ndings from design theme clinics and focus groups,or use experiment-based methods such as eye-tracking [17, 35]. �e
generalizability of the proposed approach can be validated by thestudies on other products besides vehicles.
�ere are many interesting future directions. For example, thegenerative model used in our approach provides a possibility ofusing the deep learning model to generate new designs with thedesired aesthetic a�ributes.
6 CONCLUSIONAesthetic appeal is of critical importance to customer-centric prod-uct designs such as automobiles. �is creates an ongoing challengefor designers that aim to understand the factors in�uencing a cus-tomer’s aesthetic perception over design a�ributes. Exacerbatingthis challenge is the scale at which such an understanding is under-taken, with global enterprises designing for hundreds or thousandsof heterogeneous market segments.
We have introduced a research approach to predict and interpretcustomer perceptions of design a�ributes for heterogeneous mar-kets. Speci�cally, we build on recent advances in deep learning anddevelop a Siamese neural network containing a pair of conditionalgenerative adversarial networks. �is model takes as input 2Ddesign images and associated labels, customer data correspondingto heterogeneous market segments, and the perceptions of thesecustomers across aesthetic design a�ributes.
A study was conducted to assess the utility of this research ap-proach. A dataset consisting of automotive vehicles from 2000-2014,as well as customer data collected using an online crowdsourcingweb application, was used to train the Siamese network. Our resultsshow that this research approach is indeed able to predict designa�ributes across customers belonging to heterogeneous marketsegments. Further, we show visual interpretation of customer per-ceptions of design a�ributes for various market segments.
While this approach shows that the proposed research approachis viable in the context of scalable understanding of customer per-ceptions to aesthetic product design, a number of limitations mustbe overcome before this approach may be advanced to practice. Atthe same time, many of these limitations may be mitigated by recentadvances in other areas of deep learning, as well as complementaryapproaches already used at multinational design enterprises.
ACKNOWLEDGMENTS�is research has been partially supported by General Motors Cor-poration, and the National Science Foundation under Grant No.CMMI-1266184. �is support is gratefully acknowledged. We alsoacknowledge General Motors Corporation for valuable insights andaccess to data used in this study.
REFERENCES[1] Daniel E. Berlyne. 1971. Aesthetics and Psychobiology. Appleton-Century-Cro�s,
East Norwalk, CT, US. h�p://doi.apa.org/psycinfo/1973-00821-000[2] Alexander Burnap, Je�rey Hartley, Yanxin Pan, Richard Gonzalez, and Panos Y.
Papalambros. 2016. Balancing design freedom and brand recognition in theevolution of automotive brand styling. Design Science Journal 2, 9 (2016).
[3] Alexander Burnap, Ye Liu, Yanxin Pan, Honglak Lee, Richard Gonzalez, andPanos Y. Papalambros. 2016. Estimating and Exploring the Product Form DesignSpace Using Deep Generative Models. (Aug. 2016), V02AT03A013. DOI:h�p://dx.doi.org/10.1115/DETC2016-60091
[4] Georg Buscher, Edward Cutrell, and Meredith Ringel Morris. 2009. What do yousee when you’re sur�ng?: using eye tracking to predict salient regions of webpages. In Proceedings of the SIGCHI conference on human factors in computingsystems. ACM, 21–30.
KDD 2017 Applied Data Science Paper KDD’17, August 13–17, 2017, Halifax, NS, Canada
1969
[5] Guy �omas Buswell. 1935. How people look at pictures: a study of the psychol-ogy and perception in art. (1935).
[6] Y.-M. Chang, C.-P. Chu, and M.-Y. Ma. 2013. Exploring the Visual CognitiveFeatures on the Design of Car Based on the �eory of Eye-Tracking Technology.Przegl�d Elektrotechniczny 89, 1b (2013), 143–146.
[7] Sumit Chopra, Raia Hadsell, and Yann LeCun. 2005. Learning a similarity metricdiscriminatively, with application to face veri�cation. In Computer Vision andPa�ern Recognition, 2005. CVPR 2005. IEEE Computer Society Conference on, Vol. 1.IEEE, 539–546.
[8] Del Coates. 2003. Watches Tell More �an Time: Product Design, Information, andthe �est for Elegance. McGraw-Hill London.
[9] Joseph Dobrian. 2016. 2016 U.S. APEAL Study: Safety Features ScoreBig, Boosting New-Vehicle Appeal. h�p://www.jdpower.com/cars/articles/jd-power-studies/2016-us-apeal-study-results. (2016).
[10] Ping Du and Erin F. MacDonald. 2014. Eye-Tracking Data Predict Importance ofProduct Features and Saliency of Size Change. Journal of Mechanical Design 136,8 (2014), 081005.
[11] Andrew T. Duchowski. 2002. A breadth-�rst survey of eye-tracking applications.Behavior Research Methods, Instruments, & Computers 34, 4 (2002), 455–470.
[12] Takahiko Furuya, Shigeru Kuriyama, and Ryutarou Ohbuchi. 2015. An unsuper-vised approach for comparing styles of illustrations. In Content-Based MultimediaIndexing (CBMI), 2015 13th International Workshop on. IEEE, 1–6.
[13] Elena Garces, Aseem Agarwala, Diego Gutierrez, and Aaron Hertzmann. 2014.A similarity measure for illustration style. ACM Transactions on Graphics (TOG)33, 4 (2014), 93.
[14] Leon A. Gatys, Alexander S. Ecker, and Ma�hias Bethge. 2015. A neural algorithmof artistic style. arXiv preprint arXiv:1508.06576 (2015).
[15] Sergey Karayev, Ma�hew Trentacoste, Helen Han, Aseem Agarwala, TrevorDarrell, Aaron Hertzmann, and Holger Winnemoeller. 2013. Recognizing imagestyle. arXiv preprint arXiv:1311.3715 (2013).
[16] Diederik Kingma and Jimmy Ba. 2014. Adam: A method for stochastic optimiza-tion. arXiv preprint arXiv:1412.6980 (2014).
[17] Brandeis H. Marshall, Shweta Sareen, John A. Springer, and Tahira Reid. 2014. Eyetracking data understanding for product representation studies. In Proceedingsof the 3rd annual conference on Research in information technology. ACM, 3–8.
[18] Jay P McCormack, Jonathan Cagan, and Craig M Vogel. 2004. Speaking the Buicklanguage: capturing, understanding, and exploring brand identity with shapegrammars. Design Studies 25, 1 (Jan. 2004), 1–29. DOI:h�p://dx.doi.org/10.1016/S0142-694X(03)00023-1
[19] General Motors. 2014. General Motors Internal Research.[20] Mitsuo Nagamachi. 1995. Kansei engineering: a new ergonomic consumer-
oriented technology for product development. International Journal of IndustrialErgonomics 15, 1 (1995), 3–11.
[21] Nikhil Naik, Jade Philipoom, Ramesh Raskar, and Cesar Hidalgo. 2014.Streetscore-predicting the perceived safety of one million streetscapes. In Proceed-ings of the IEEE Conference on Computer Vision and Pa�ern Recognition Workshops.779–785.
[22] Richard E Nisbe� and Timothy D Wilson. 1977. Telling more than we can know:Verbal reports on mental processes. Psychological review 84, 3 (1977), 231.
[23] Gunay Orbay, Luoting Fu, and Levent Burak Kara. 2015. Deciphering the in�u-ence of product shape on consumer judgments through geometric abstraction.Journal of Mechanical Design 137, 8 (2015), 081103.
[24] Vicente Ordonez and Tamara L Berg. 2014. Learning high-level judgments ofurban perception. In European Conference on Computer Vision. Springer, 494–510.
[25] Seth Orsborn, Jonathan Cagan, and Peter Boatwright. 2009. �antifying Aes-thetic Form Preference in a Utility Function. Journal of Mechanical Design 131, 6(2009), 061001. DOI:h�p://dx.doi.org/10.1115/1.3116260
[26] Yanxin Pan, Alexander Burnap, Ye Liu, Honglak Lee, Richard Gonzalez, andPanos Papalambros. 2016. A �antitative Model for Identifying Regions ofDesign Visual A�raction and Application to Automobile Styling. In Proceedingsof the 2016 Internation Design Conference. Dubrovnik, Croatia.
[27] Jean-Franois Petiot and Antoine Dagher. 2010. Preference-Oriented Form De-sign: Application to Cars� Headlights. International Journal on InteractiveDesign and Manufacturing 5, 1 (Oct. 2010), 17–27. DOI:h�p://dx.doi.org/10.1007/s12008-010-0105-5
[28] Emilie Poirson, Jean-Franois Petiot, Ludivine Boivin, and David Blumenthal.2013. Eliciting user perceptions using assessment tests based on an interactivegenetic algorithm. Journal of Mechanical Design 135, 3 (2013), 031004.
[29] Lorenzo Porzi, Samuel Rota Bulo, Bruno Lepri, and Elisa Ricci. 2015. Predictingand understanding urban perception with convolutional neural networks. InProceedings of the 23rd ACM international conference on Multimedia. ACM, 139–148.
[30] Michael J. Pugliese and Jonathan Cagan. 2002. Capturing a rebel: modelingthe Harley-Davidson brand through a motorcycle shape grammar. Research inEngineering Design 13, 3 (2002), 139–156.
[31] Daniele �ercia, Neil Keith O’Hare, and Henrie�e Cramer. 2014. Aestheticcapital: what makes london look beautiful, quiet, and happy?. In Proceedingsof the 17th ACM conference on Computer supported cooperative work & social
computing. ACM, 945–955.[32] Charlie Ranscombe, Ben Hicks, Glen Mullineux, and Baljinder Singh. 2012. Visu-
ally decomposing vehicle images: Exploring the in�uence of di�erent aestheticfeatures on consumer perception of brand. Design Studies 33, 4 (2012), 319–341.
[33] Sco� Reed, Zeynep Akata, Xinchen Yan, Lajanugen Logeswaran, Bernt Schiele,and Honglak Lee. 2016. Generative adversarial text to image synthesis. InProceedings of �e 33rd International Conference on Machine Learning, Vol. 3.
[34] Tahira N. Reid, Richard D. Gonzalez, and Panos Y. Papalambros. 2010. �anti�-cation of Perceived Environmental Friendliness for Vehicle Silhoue�e Design.Journal of Mechanical Design 132, 10 (2010), 101010. DOI:h�p://dx.doi.org/10.1115/1.4002290
[35] Tahira N. Reid, Erin F. MacDonald, and Ping Du. 2013. Impact of product designrepresentation on customer judgment. Journal of Mechanical Design 135, 9 (2013),091008.
[36] Yi Ren, Alexander Burnap, and Panos Papalambros. 2013. �anti�cation ofperceptual design a�ributes using a crowd. In DS 75-6: Proceedings of the 19thInternational Conference on Engineering Design (ICED13), Design for Harmonies,Vol. 6: Design Information and Knowledge, Seoul, Korea, 19-22.08. 2013.
[37] Elena Reutskaja, Rosemarie Nagel, Colin F Camerer, and Antonio Rangel. 2011.Search dynamics in consumer choice under time pressure: An eye-tracking study.�e American Economic Review 101, 2 (2011), 900–926.
[38] Marco Tulio Ribeiro, Sameer Singh, and Carlos Guestrin. 2016. Why Should ITrust You?: Explaining the Predictions of Any Classi�er. In Proceedings of the22nd ACM SIGKDD International Conference on Knowledge Discovery and DataMining. ACM, 1135–1144.
[39] Anne Ruckpaul, �omas Frstenhfer, and Sven Ma�hiesen. 2015. Combinationof Eye Tracking and �ink-Aloud Methods in Engineering Design Research.In Design Computing and Cognition ’14, John S. Gero and Sean Hanna (Eds.).Springer International Publishing, Cham, 81–97.
[40] David H Silvera, Robert A Josephs, and R Brian Giesler. 2002. Bigger is be�er:�e in�uence of physical size on aesthetic preference judgments. Journal ofBehavioral Decision Making 15, 3 (2002), 189–202.
[41] Jost Tobias Springenberg, Alexey Dosovitskiy, �omas Brox, and Martin Ried-miller. 2014. Striving for simplicity: �e all convolutional net. arXiv preprintarXiv:1412.6806 (2014).
[42] John Tews. 2016. J.D. Power Initial quality Study 2016. h�p://www.jdpower.com/press-releases/2016-us-initial-quality-study-iqs. (2016).
[43] Lucas �eis, Aaron van den Oord, and Ma�hias Bethge. 2015. A note on theevaluation of generative models. arXiv preprint arXiv:1511.01844 (2015).
[44] Noah Tovares, Peter Boatwright, and Jonathan Cagan. 2014. Experiential Con-joint Analysis: An Experience-Based Method for Eliciting, Capturing, and Mod-eling Consumer Preference. Journal of Mechanical Design 136, 10 (2014), 101404.
[45] Qiuzhen Wang, Sa Yang, Manlu Liu, Zike Cao, and Qingguo Ma. 2014. An eye-tracking study of website complexity from cognitive load perspective. Decisionsupport systems 62 (2014), 1–10.
[46] Sonja Windhager, Florian Hutzler, Claus-Christian Carbon, Elisabeth Oberza-ucher, Katrin Schaefer, Truls �orstensen, Helmut Leder, and Karl Grammer.2010. Laying eyes on headlights: Eye movements suggest facial features in cars.Collegium antropologicum 34, 3 (2010), 1075–1080.
[47] M. E. Yumer, Siddhartha Chaudhuri, J. K. Hodgins, and Levent Burak Kara. 2015.Semantic Shape Editing Using Deformation Handles. ACM Transactions onGraphics (Proceedings of SIGGRAPH 2015) 34, 4 (2015).
[48] Ma�hew D Zeiler and Rob Fergus. 2014. Visualizing and understanding convolu-tional networks. In European conference on computer vision. Springer, 818–833.
[49] Han Zhang, Tao Xu, Hongsheng Li, Shaoting Zhang, Xiaolei Huang, Xiao-gang Wang, and Dimitris Metaxas. 2016. StackGAN: Text to Photo-realisticImage Synthesis with Stacked Generative Adversarial Networks. arXiv preprintarXiv:1612.03242 (2016).
KDD 2017 Applied Data Science Paper KDD’17, August 13–17, 2017, Halifax, NS, Canada
1970