Embed Size (px)
Citation preview
Abstract
The German government has set a varierty of ambitous goals regarding energy efficiency. From todays standpoint
it is unlikely, that those goals can be reached. Hence additonal efforts are necessary to identify and evaluate
further energy saving potentials based on a better understanding of system effects related to energy efficicency
meassures. To perfom such an analysis including the system effects we developed a detailed energy demand
model and a new heuristic optimiziation approach. To validate our model we have applied the approach to analyse
the energy saving potentials in the German plastics processing industry. A case study for a manufacturer using
injection moulding to produce technical components is presented. With our model we calculated an economic
energy saving potential of 11.9 to 15.4 %. The integrated assessment of energy efficiency measures enabled the
consideration of the dynamic system behaviour as well as interactions between energy efficiency measures.
1. Introduction
In the context of the German energy transition the German government has set a variety of ambitious goals.
Regarding energy efficiency these are i. a. the reduction of the primary energy consumption by 50 % until 2050
compared to 2008 as well as an annual increase of the final energy productivity by 2.1 % from 2008 until 2050
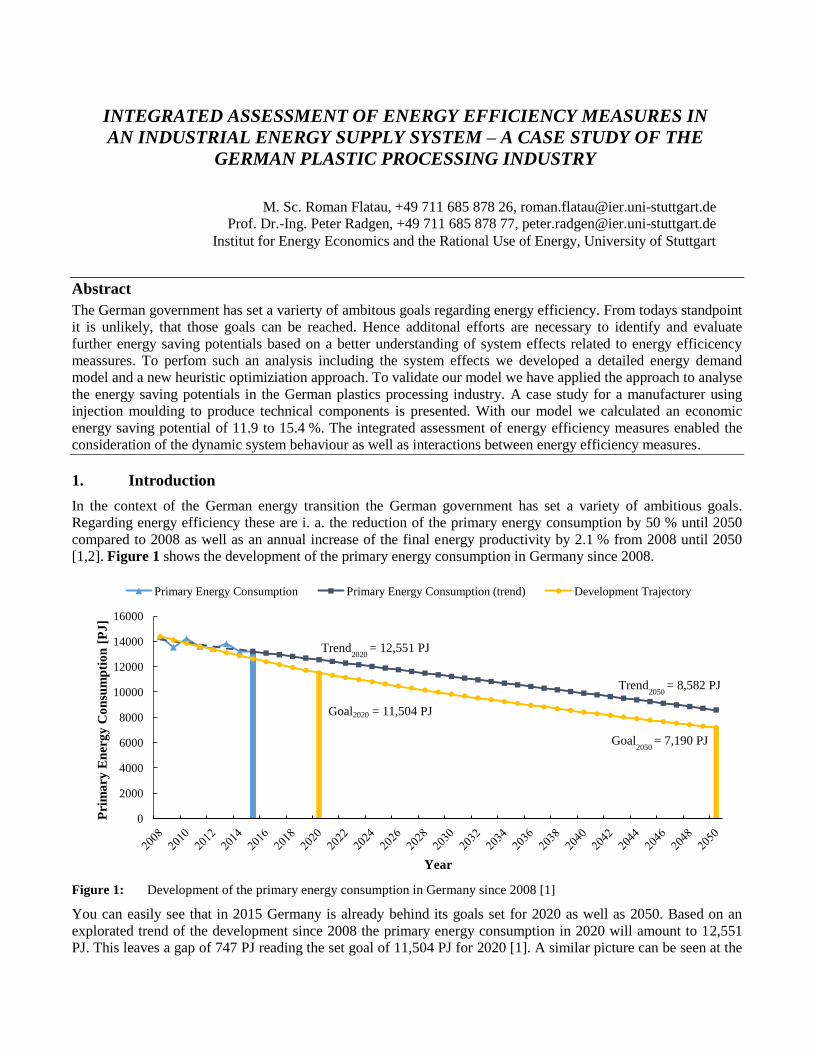
[1,2]. Figure 1 shows the development of the primary energy consumption in Germany since 2008.
Figure 1: Development of the primary energy consumption in Germany since 2008 [1]
You can easily see that in 2015 Germany is already behind its goals set for 2020 as well as 2050. Based on an
explorated trend of the development since 2008 the primary energy consumption in 2020 will amount to 12,551
PJ. This leaves a gap of 747 PJ reading the set goal of 11,504 PJ for 2020 [1]. A similar picture can be seen at the
0
2000
4000
6000
8000
10000
12000
14000
16000
Pri
ma
ry E
ner
gy
Co
nsu
mp
tio
n [
PJ
]
Year
Primary Energy Consumption Primary Energy Consumption (trend) Development Trajectory
INTEGRATED ASSESSMENT OF ENERGY EFFICIENCY MEASURES IN
AN INDUSTRIAL ENERGY SUPPLY SYSTEM – A CASE STUDY OF THE
GERMAN PLASTIC PROCESSING INDUSTRY
M. Sc. Roman Flatau, +49 711 685 878 26, [email protected]
Prof. Dr.-Ing. Peter Radgen, +49 711 685 878 77, [email protected]
Institut for Energy Economics and the Rational Use of Energy, University of Stuttgart
Trend2050
= 8,582 PJ
Goal2050
= 7,190 PJ
Trend2020
= 12,551 PJ
Goal2020 = 11,504 PJ
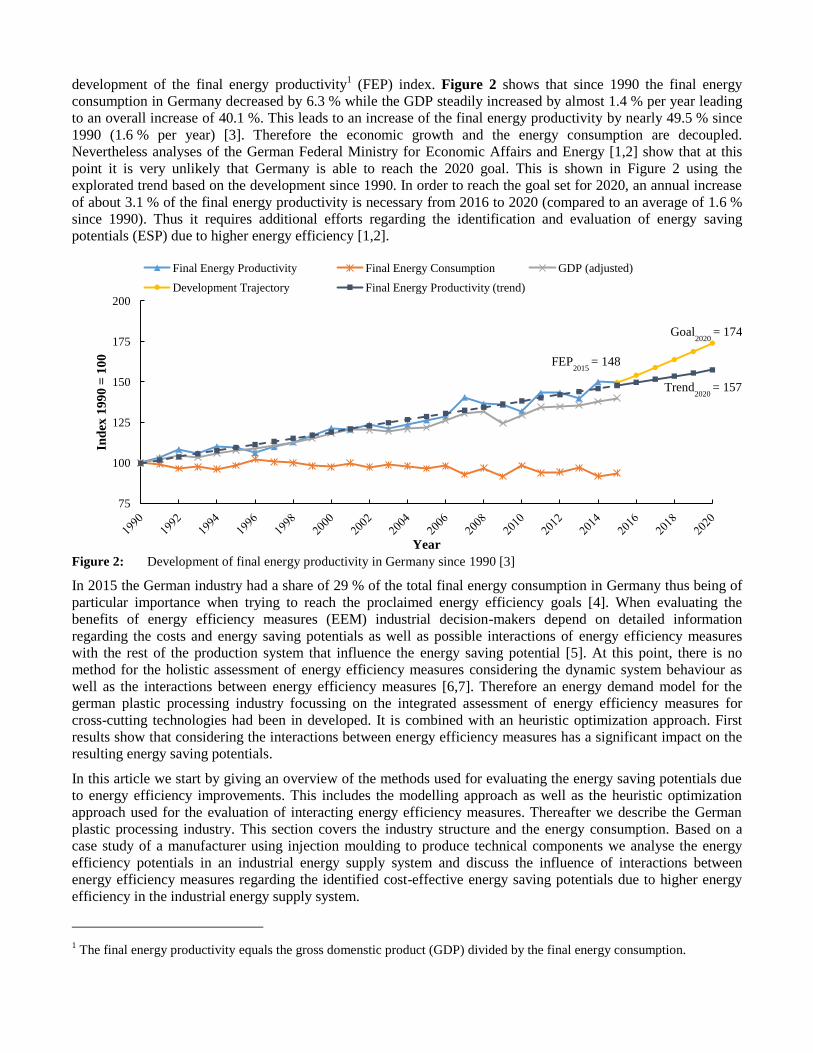
development of the final energy productivity1 (FEP) index. Figure 2 shows that since 1990 the final energy
consumption in Germany decreased by 6.3 % while the GDP steadily increased by almost 1.4 % per year leading
to an overall increase of 40.1 %. This leads to an increase of the final energy productivity by nearly 49.5 % since
1990 (1.6 % per year) [3]. Therefore the economic growth and the energy consumption are decoupled.
Nevertheless analyses of the German Federal Ministry for Economic Affairs and Energy [1,2] show that at this
point it is very unlikely that Germany is able to reach the 2020 goal. This is shown in Figure 2 using the
explorated trend based on the development since 1990. In order to reach the goal set for 2020, an annual increase
of about 3.1 % of the final energy productivity is necessary from 2016 to 2020 (compared to an average of 1.6 %
since 1990). Thus it requires additional efforts regarding the identification and evaluation of energy saving
potentials (ESP) due to higher energy efficiency [1,2].
Figure 2: Development of final energy productivity in Germany since 1990 [3]
In 2015 the German industry had a share of 29 % of the total final energy consumption in Germany thus being of
particular importance when trying to reach the proclaimed energy efficiency goals [4]. When evaluating the
benefits of energy efficiency measures (EEM) industrial decision-makers depend on detailed information
regarding the costs and energy saving potentials as well as possible interactions of energy efficiency measures
with the rest of the production system that influence the energy saving potential [5]. At this point, there is no
method for the holistic assessment of energy efficiency measures considering the dynamic system behaviour as
well as the interactions between energy efficiency measures [6,7]. Therefore an energy demand model for the
german plastic processing industry focussing on the integrated assessment of energy efficiency measures for
cross-cutting technologies had been in developed. It is combined with an heuristic optimization approach. First
results show that considering the interactions between energy efficiency measures has a significant impact on the
resulting energy saving potentials.
In this article we start by giving an overview of the methods used for evaluating the energy saving potentials due
to energy efficiency improvements. This includes the modelling approach as well as the heuristic optimization
approach used for the evaluation of interacting energy efficiency measures. Thereafter we describe the German
plastic processing industry. This section covers the industry structure and the energy consumption. Based on a
case study of a manufacturer using injection moulding to produce technical components we analyse the energy
efficiency potentials in an industrial energy supply system and discuss the influence of interactions between
energy efficiency measures regarding the identified cost-effective energy saving potentials due to higher energy
efficiency in the industrial energy supply system.
1 The final energy productivity equals the gross domenstic product (GDP) divided by the final energy consumption.
75
100
125
150
175
200
Ind
ex 1
99
0 =
10
0
Year
Final Energy Productivity Final Energy Consumption GDP (adjusted)
Development Trajectory Final Energy Productivity (trend)
Trend2020
= 157
Goal2020
= 174
FEP2015
= 148
2. Method
For the evaluation of the energy saving potential in an industrial energy supply system a model-based approach in
combination with an heuristic optimization algorithm ist used. The topology of the model is described in section
2.1. Thereafter the heuristic optimization approach is presented (section 2.2). In section 2.3 the calculation of the
energy conservation cost curves is outlined.
2.1 Model describtion
The model developed for this analysis is a deterministic, technology-oriented bottom-up energy demand model
using a modular hierarchy structure, non-linear programming and a heuristic optimization approach. The scope of
the energy demand model is the German plastic processing industry. Typicall plastic goods (i. a. frames, technical
components) are produced in sector-specific production processes (i. a. extrusion, injection moulding). The
demand for final energy is derived from the production of those goods. Industrial production processes are
commonly described in an hierarchical structure [8]. Within the scope of this study we mainly distinguish
between the production process itself, including the core processes that are directly involved in the processing or
handling of the granulate (e. g. transport, drying, blending, extrusion, injection moulding), and the industrial
energy supply system, including all the cross-cutting technologies which are providing usefull energy to the
production process (e. g. cooling, heating, hydraulic, mechanical work). The following cross-cutting technologies
are implemented in the energy demand model: electric motors, pumps, ventilation, compressed air, lighting,
cooling (process and air conditioning) and space heating. The modular structure allows a relatively easy
adaptation when the model should be applied to different industrial production processes. In order to reflect the
heterogeneous structure of the plastic processing industry, representative companies with individual production
processes are represented in the model. Based on the production process and the production quantity for a specific
good the product specific synthetic load profiles for useful energy (and consequently the demand for final energy)
are calculated endogeniously. The evaluation of the energy consumption of an industrial production process
requires the analysis of the production schedule [6] as well as spare capacities, as those determine the utilitsation
of the different cross-cutting technologies in the industrial energy supply system. Therefore, the energy demand
model uses a high time resolution considering partial as well as full load operation. As the efficiency of most
cross-cutting technologies decreases at part load operation, generic energy efficiency diagrams had been derived
via an broad literature review and are implemented in the energy demand model. Furthermore the energy
consumption (as well as the energy saving potential of the identified energy efficiency measures) of the cross-
cutting technologies is influenced by the used control concept. Therefore the most common control systems for
the previously mentioned cross-cutting technologies are implemented in the energy demand model (e. g. for a
pump one can choose between throttle control, bypass control, on-off control and using a frequency inverter for
speed control).
2.2 Heuristic optimization approach
The evalutation of interacting energy efficiency measures is a combinatorial optimization problem with discrete
decision variables. Richard Karp showed in 1972 that this type of problem is ƝƤ-Ƈ (ƝƤ-complete), meaning that
there is probably no efficienct way to locate the optimal solution [9]. Therefore the following heuristic
optimization approach is developed. Theoretically it is necessary to evaluate all permutations of energy efficiency
measures to identify the optimal combination of measures to be applied. Due to limited computing resources, this
is only possible for a limited number of energy efficiency measures. Therefore the described energy demand
model uses an heuristic optimization approach considering technical restrictions, path-dependencies and strategic
decision making. Those permutations for which the energy efficiency measures do not interact in the first place,
measures that are not technically feasible or that make no sense from a strategic perspective are eliminated by
predefining certain bundles of energy efficiency measures.
The first step of the heuristic is the decomposition of the system (in this case an industrial energy supply system)
into non-interacting sub-systems. This might be a compressed air system without a connection to a process
cooling system. Afterwards each sub-system is optimized by pre-defining different bundles of energy efficiency
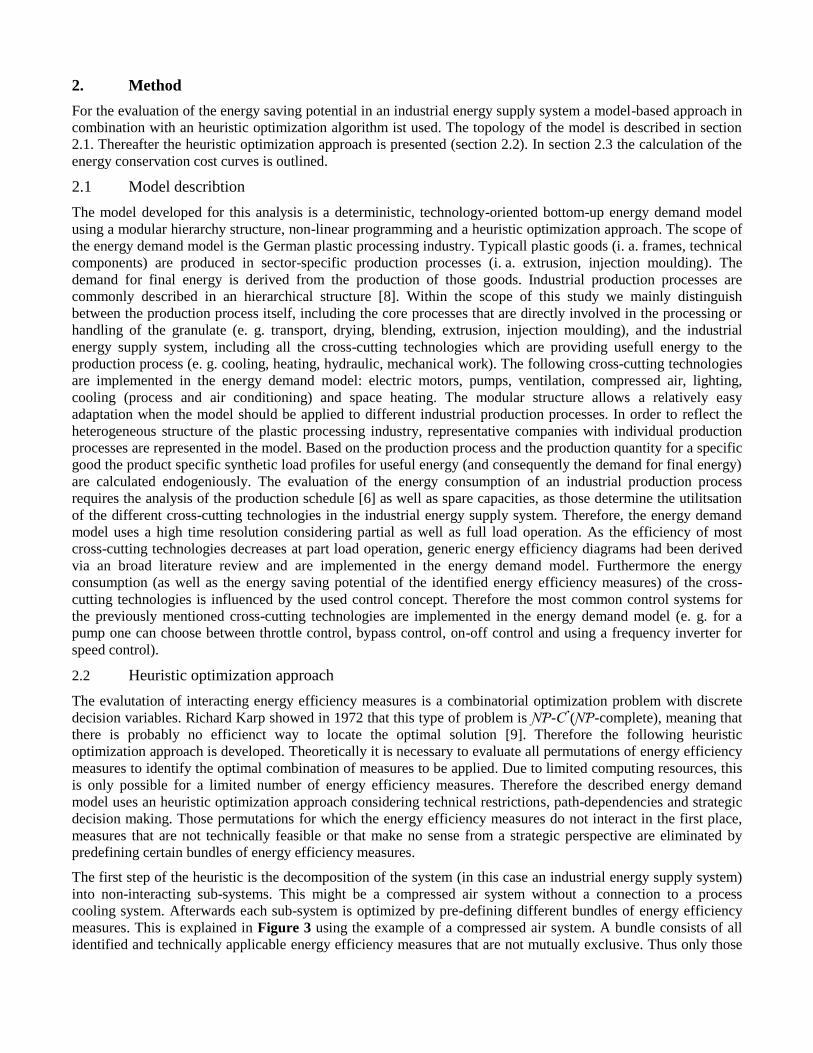
measures. This is explained in Figure 3 using the example of a compressed air system. A bundle consists of all
identified and technically applicable energy efficiency measures that are not mutually exclusive. Thus only those
combinations are eliminated, that can not be combined anyway. In case of the compressed air system example
there are two bundles MA and MB. They both consist of seven energy efficiency measures but differ in the energy
efficiency class of the electric motor as one can either implement an IE3 or an IE4 motor but not both at the same
time. Within each bundle the seven energy efficiency measures are allocated to the three different levels: (1)
demand reduction, (2) increasing efficiency and (3) using waste heat. In the example below, the 2. level consists
the efficiency of the compressor and the efficiency of the electric motor. For each level, all permutations are
evaluated and the optimal soluation, e. g. in terms of the maxium accumulated net present value (NPV) of the
energy efficiency measures, is implemented. Afterwards the remaining permutations are evaluated. The one
leading to the optimal solution is implemented and so forth. The direction of the calculation is in opposite
direction to the physical energy flow. Using the previously described approach the number of permutations is
drastically reduced. Instead of 10,080 permutations (2 bundles with 7 EEM) there are only 14 permutations. Thus
the number of permutations is reduced to less than one percent. Due to the integrated evaluation of the energy
efficiency measures within a sub-system the interactions are still accounted for. The definition of bundles and
levels only defines the order of evaluation.
Figure 3: Application of the heuristic optimization approach using the example of a compressed air station.
2.3 Calculation of energy conservation cost curve
Conservation cost curves are a common tool to visualize the results of the evaluation of energy efficiency
measures. They were mainly developed by Alan Meier at Lawrence Berkeley Laboratory in the 1980s [9]. The
following notations for the calculation of the marginal energy conservation costs ( ) are adapted from [10-
14]. The marginal energy conservation cost are calculated by dividing the annual changes of the total expenditures
( ) by the annual energy saving potential ( ) (see equation (1)).
(1)
Electric
motor
Compressor
station
Direction of calculation
Energy consumption
Level 3 Level 2 Level 1
Bundle Waste heat Efficiency (motor) Efficiency (compressor) Demand
EEMA Waste heat recovery for
space heating
New motor IE3, frequency
inverter
New compressor, proper
sizing of the motor
Reduce pressure loss, proper
sizing of the compressor
EEMB Waste heat recovery for
space heating
New motor IE4, frequency
inverter
New compressor, proper
sizing of the motor
Reduce pressure loss, proper
sizing of the compressor
Direction of physical energy flow
Choose 1.
bundle
Optimize
demand
Optimize
efficiency
Choose 1.
efficiency
Optimize waste
heat
Implement
optimal system
YesMore level of efficiency?
Choose next
efficiency
Choose next
bundle
YesMore bundles?
NoNo
Start
optimization
End
optimization
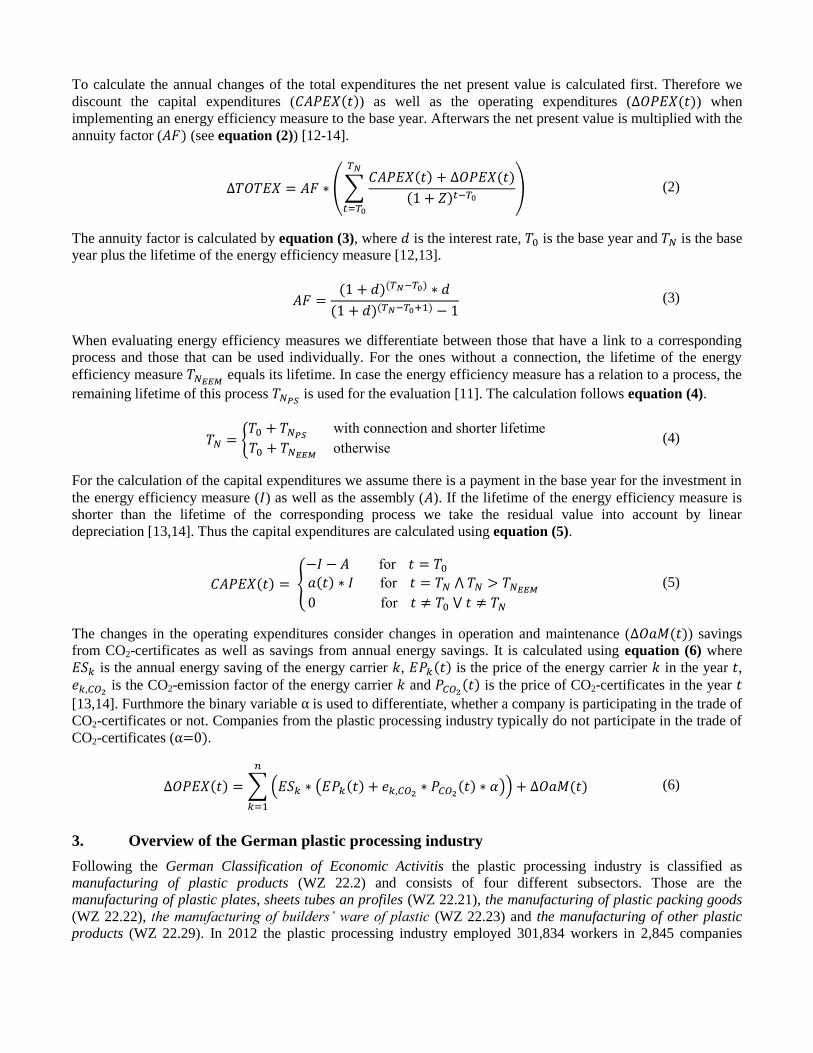
To calculate the annual changes of the total expenditures the net present value is calculated first. Therefore we
discount the capital expenditures ( ) as well as the operating expenditures ( ) when
implementing an energy efficiency measure to the base year. Afterwars the net present value is multiplied with the
annuity factor ( (see equation (2)) [12-14].
(2)
The annuity factor is calculated by equation (3), where is the interest rate, is the base year and is the base
year plus the lifetime of the energy efficiency measure [12,13].
(3)
When evaluating energy efficiency measures we differentiate between those that have a link to a corresponding
process and those that can be used individually. For the ones without a connection, the lifetime of the energy
efficiency measure equals its lifetime. In case the energy efficiency measure has a relation to a process, the
remaining lifetime of this process is used for the evaluation [11]. The calculation follows equation (4).
(4)
For the calculation of the capital expenditures we assume there is a payment in the base year for the investment in
the energy efficiency measure ( ) as well as the assembly ( ). If the lifetime of the energy efficiency measure is
shorter than the lifetime of the corresponding process we take the residual value into account by linear
depreciation [13,14]. Thus the capital expenditures are calculated using equation (5).
(5)
The changes in the operating expenditures consider changes in operation and maintenance ( ) savings
from CO2-certificates as well as savings from annual energy savings. It is calculated using equation (6) where
is the annual energy saving of the energy carrier , is the price of the energy carrier in the year , is the CO2-emission factor of the energy carrier and is the price of CO2-certificates in the year
[13,14]. Furthmore the binary variable α is used to differentiate, whether a company is participating in the trade of
CO2-certificates or not. Companies from the plastic processing industry typically do not participate in the trade of
CO2-certificates (α .
(6)
3. Overview of the German plastic processing industry
Following the German Classification of Economic Activitis the plastic processing industry is classified as
manufacturing of plastic products (WZ 22.2) and consists of four different subsectors. Those are the
manufacturing of plastic plates, sheets tubes an profiles (WZ 22.21), the manufacturing of plastic packing goods
(WZ 22.22), the manufacturing of builders’ ware of plastic (WZ 22.23) and the manufacturing of other plastic
products (WZ 22.29). In 2012 the plastic processing industry employed 301,834 workers in 2,845 companies
leading to an average company size of about 106 employees. These companies generated a total turnover of 56.1
billion EUR. 35.3 % of the sales volume was exported (see Table 1).
Most companies in the German plastic processing industry are belonging to the subsector manufacturing of other
plastic products. With an average of 34.8 mio. EUR in 2012 the highest turnover per company is obtained in the
manufacturing of plastic plates, sheets, tubes and profiles. This equals an average turnover per employee of
185,932 EUR. The manufacturing of plastic plates, sheets, tubes and profiles has the highest (255,684 EUR) and
the manufacturing of other plastic products has the lowest (152,085 EUR) turnover per employee.
About 92 % of the companies have less than 250 employees. Thus most of the companies in the plastic processing
industry are small and medium-sized enterprises (SME) [15]. The companies are typically family businesses with
little public recognition. With an average ratio of material expenses2 of 45 % the plastic processing industry is
highly sensitive to volatile raw material prices. Since the year 2000 the turnover of the sector developed nearly
parallel to the overall turnover of the German industry [15].
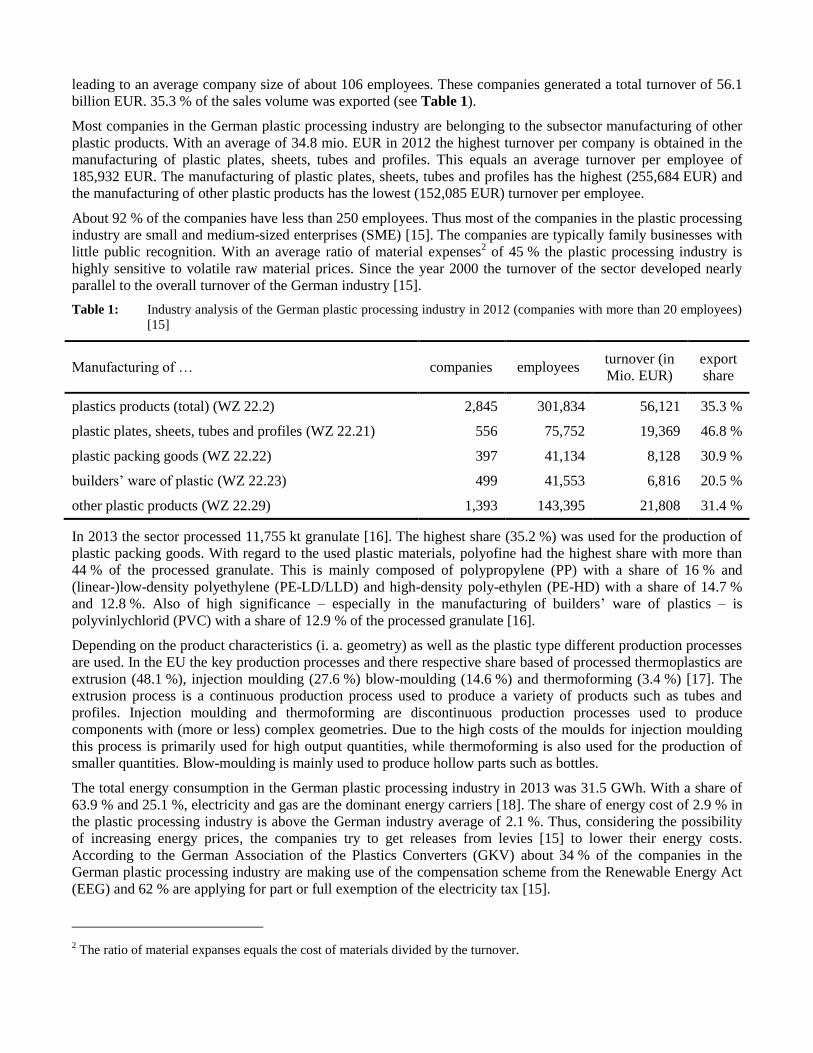
Table 1: Industry analysis of the German plastic processing industry in 2012 (companies with more than 20 employees)
[15]
M u u g … companies employees turnover (in
Mio. EUR)
export
share
plastics products (total) (WZ 22.2) 2,845 301,834 56,121 35.3 %
plastic plates, sheets, tubes and profiles (WZ 22.21) 556 75,752 19,369 46.8 %
plastic packing goods (WZ 22.22) 397 41,134 8,128 30.9 %
bu ’ p (WZ 22.23) 499 41,553 6,816 20.5 %
other plastic products (WZ 22.29) 1,393 143,395 21,808 31.4 %
In 2013 the sector processed 11,755 kt granulate [16]. The highest share (35.2 %) was used for the production of
plastic packing goods. With regard to the used plastic materials, polyofine had the highest share with more than
44 % of the processed granulate. This is mainly composed of polypropylene (PP) with a share of 16 % and
(linear-)low-density polyethylene (PE-LD/LLD) and high-density poly-ethylen (PE-HD) with a share of 14.7 %
and 12.8 %. Also of high significance – especially in the manufacturing of builders’ ware of plastics – is
polyvinlychlorid (PVC) with a share of 12.9 % of the processed granulate [16].
Depending on the product characteristics (i. a. geometry) as well as the plastic type different production processes
are used. In the EU the key production processes and there respective share based of processed thermoplastics are
extrusion (48.1 %), injection moulding (27.6 %) blow-moulding (14.6 %) and thermoforming (3.4 %) [17]. The
extrusion process is a continuous production process used to produce a variety of products such as tubes and
profiles. Injection moulding and thermoforming are discontinuous production processes used to produce
components with (more or less) complex geometries. Due to the high costs of the moulds for injection moulding
this process is primarily used for high output quantities, while thermoforming is also used for the production of
smaller quantities. Blow-moulding is mainly used to produce hollow parts such as bottles.
The total energy consumption in the German plastic processing industry in 2013 was 31.5 GWh. With a share of
63.9 % and 25.1 %, electricity and gas are the dominant energy carriers [18]. The share of energy cost of 2.9 % in
the plastic processing industry is above the German industry average of 2.1 %. Thus, considering the possibility
of increasing energy prices, the companies try to get releases from levies [15] to lower their energy costs.
According to the German Association of the Plastics Converters (GKV) about 34 % of the companies in the
German plastic processing industry are making use of the compensation scheme from the Renewable Energy Act
(EEG) and 62 % are applying for part or full exemption of the electricity tax [15].
2 The ratio of material expanses equals the cost of materials divided by the turnover.
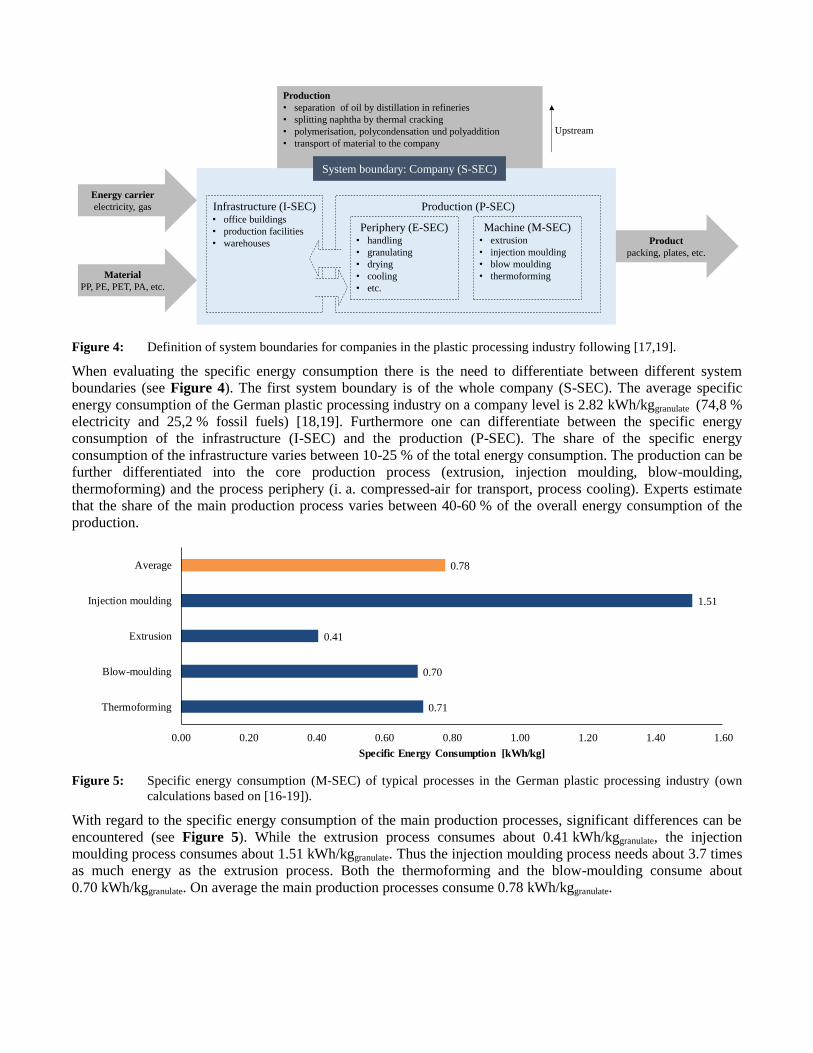
Figure 4: Definition of system boundaries for companies in the plastic processing industry following [17,19].
When evaluating the specific energy consumption there is the need to differentiate between different system
boundaries (see Figure 4). The first system boundary is of the whole company (S-SEC). The average specific
energy consumption of the German plastic processing industry on a company level is 2.82 kWh/kggranulate (74,8 %
electricity and 25,2 % fossil fuels) [18,19]. Furthermore one can differentiate between the specific energy
consumption of the infrastructure (I-SEC) and the production (P-SEC). The share of the specific energy
consumption of the infrastructure varies between 10-25 % of the total energy consumption. The production can be
further differentiated into the core production process (extrusion, injection moulding, blow-moulding,
thermoforming) and the process periphery (i. a. compressed-air for transport, process cooling). Experts estimate
that the share of the main production process varies between 40-60 % of the overall energy consumption of the
production.
Figure 5: Specific energy consumption (M-SEC) of typical processes in the German plastic processing industry (own
calculations based on [16-19]).
With regard to the specific energy consumption of the main production processes, significant differences can be
encountered (see Figure 5). While the extrusion process consumes about 0.41 kWh/kggranulate, the injection
moulding process consumes about 1.51 kWh/kggranulate. Thus the injection moulding process needs about 3.7 times
as much energy as the extrusion process. Both the thermoforming and the blow-moulding consume about
0.70 kWh/kggranulate. On average the main production processes consume 0.78 kWh/kggranulate.
Product
packing, plates, etc.
Periphery (E-SEC)• handling
• granulating
• drying
• cooling
• etc.
Machine (M-SEC)• extrusion
• injection moulding
• blow moulding
• thermoforming
Production (P-SEC)Infrastructure (I-SEC)• office buildings
• production facilities
• warehouses
Energy carrier
electricity, gas
Material
PP, PE, PET, PA, etc.
Production
• separation of oil by distillation in refineries
• splitting naphtha by thermal cracking
• polymerisation, polycondensation und polyaddition
• transport of material to the company
System boundary: Company (S-SEC)
Upstream
0.71
0.70
0.41
1.51
0.78
0.00 0.20 0.40 0.60 0.80 1.00 1.20 1.40 1.60
Thermoforming
Blow-moulding
Extrusion
Injection moulding
Average
Specific Energy Consumption [kWh/kg]
4. Case study for an injection moulding manufacturer
The previously presented approach for the integrated assessment of energy efficiency measures is used to evaluate
the energy saving potentials of a manufacturer producing technical components using injection moulding.
Therefore the production process is described in section 4.1. The following section 4.2 focuses on the
identification of energy saving potentials and the impact of interactions between energy efficiency measures.
Thereafter a sensitivity analysis is conducted to examine the impact of varying input parameters on the identified
economic energy saving potential (section 4.3). To conclude with, the results from section 4.2 are used to estimate
the economic energy saving potential of manufacturers producing technical components using injection moulding
in Germany (section 4.4).
4.1 Describtion of the typical injection moulding manufacturer
For the evaluation of interacting energy efficiency measures a case study of the German plastic processing
industry is conducted. The hereinafter decribed manufacturer represents a generic injection moulding
manufacturer producing technical components. The characterisation is based on an extensive literature review
[4,15-27] as well as the results of several non-published energy audits from the plastic processing industry.
Furthermore, to validate the plausibility, expert interviews with energy consultants specialised on the plastic
processing industry were conducted. The manufacturer processes 1,845 t of polypropylene per year. With an
average component-weight of 0.12 kg this leads to a total production of 15.57 mio. parts per year. The production
operates on a two-shift schedule for 5 days a week. The overall final energy consumption of an average factory is
8,026 MWh/a (F-SEC: 4.35 kWh/kgPP). About 86.2 % of the final energy consumption is electricity. The
remaining 13.8 % are natural gas used for space heating. While 15.9 % of the final energy consumption is used
for infrastructure purposes, the largest share is used in the production process. The energy demand model captures
76.2 % of the total final energy consumption (72.6 % of electricity and 99.0 % of natural gas). Not implemented
within the model are i. a. information and communication technologies (ICT) as well as small-scale consumers
such as drilling-, milling- and grinding machines. 26.7 % of the electricity consumption is used for hydraulics of
the injection moulding machines, 6.8 % for process cooling and air conditioning and 7.7 % for compressed air.
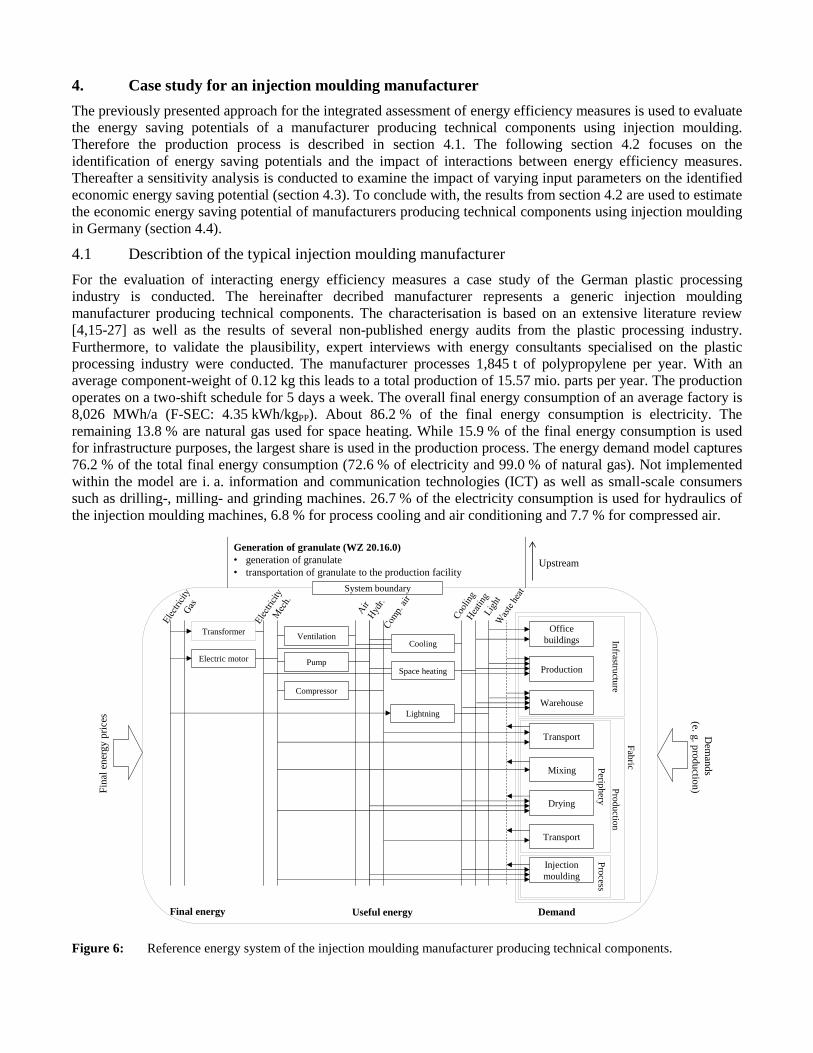
Figure 6: Reference energy system of the injection moulding manufacturer producing technical components.
Electric motor
Compressor
Cooling
Space heatingPump
Ventilation
Lightning
Fin
al e
ner
gy p
rice
s
Final energy
Generation of granulate (WZ 20.16.0)
• generation of granulate
• transportation of granulate to the production facilityUpstream
System boundary
Transformer Office
buildings
Production
Warehouse
Transport
Mixing
Drying
Transport
Injection
moulding
Perip
hery
Pro
cess
Pro
du
ction
Infrastru
cture
Fab
ric
Useful energy Demand
Dem
ands
(e. g. p
roductio
n)
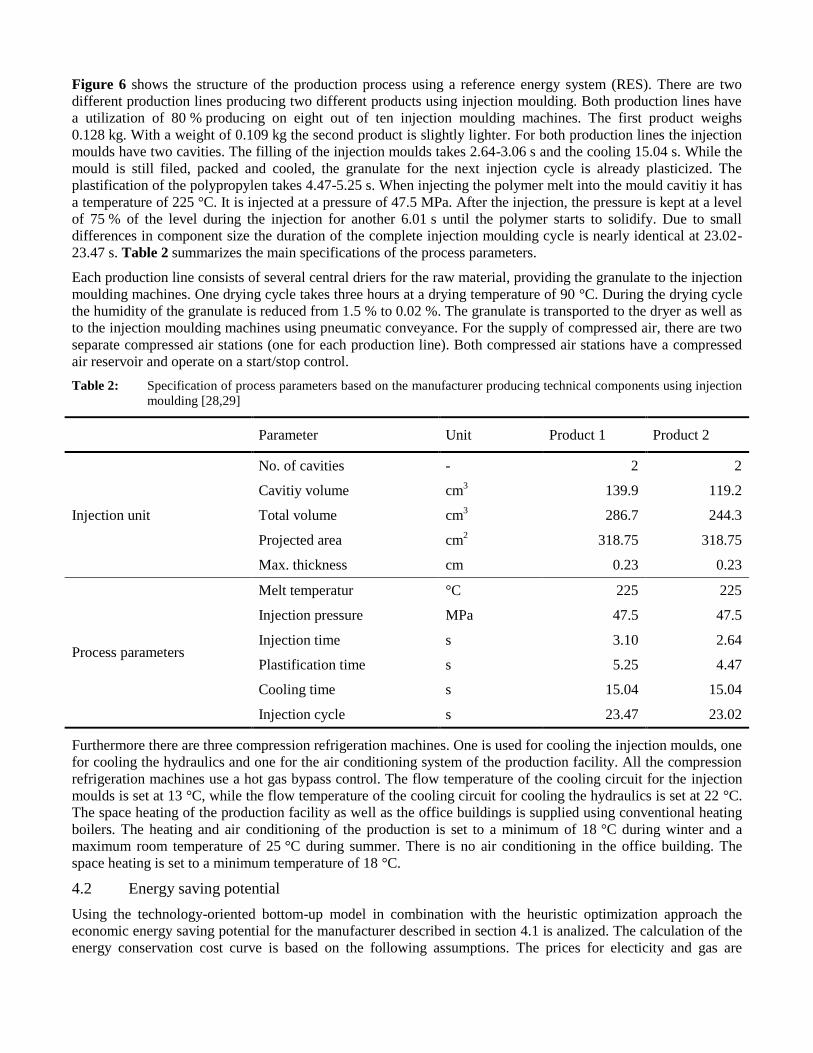
Figure 6 shows the structure of the production process using a reference energy system (RES). There are two
different production lines producing two different products using injection moulding. Both production lines have
a utilization of 80 % producing on eight out of ten injection moulding machines. The first product weighs
0.128 kg. With a weight of 0.109 kg the second product is slightly lighter. For both production lines the injection
moulds have two cavities. The filling of the injection moulds takes 2.64-3.06 s and the cooling 15.04 s. While the
mould is still filed, packed and cooled, the granulate for the next injection cycle is already plasticized. The
plastification of the polypropylen takes 4.47-5.25 s. When injecting the polymer melt into the mould cavitiy it has
a temperature of 225 °C. It is injected at a pressure of 47.5 MPa. After the injection, the pressure is kept at a level
of 75 % of the level during the injection for another 6.01 s until the polymer starts to solidify. Due to small
differences in component size the duration of the complete injection moulding cycle is nearly identical at 23.02-
23.47 s. Table 2 summarizes the main specifications of the process parameters.
Each production line consists of several central driers for the raw material, providing the granulate to the injection
moulding machines. One drying cycle takes three hours at a drying temperature of 90 °C. During the drying cycle
the humidity of the granulate is reduced from 1.5 % to 0.02 %. The granulate is transported to the dryer as well as
to the injection moulding machines using pneumatic conveyance. For the supply of compressed air, there are two
separate compressed air stations (one for each production line). Both compressed air stations have a compressed
air reservoir and operate on a start/stop control.
Table 2: Specification of process parameters based on the manufacturer producing technical components using injection
moulding [28,29]
Parameter Unit Product 1 Product 2
Injection unit
No. of cavities - 2 2
Cavitiy volume cm3 139.9 119.2
Total volume cm3 286.7 244.3
Projected area cm2
318.75 318.75
Max. thickness cm 0.23 0.23
Process parameters
Melt temperatur °C 225 225
Injection pressure MPa 47.5 47.5
Injection time s 3.10 2.64
Plastification time s 5.25 4.47
Cooling time s 15.04 15.04
Injection cycle s 23.47 23.02
Furthermore there are three compression refrigeration machines. One is used for cooling the injection moulds, one
for cooling the hydraulics and one for the air conditioning system of the production facility. All the compression
refrigeration machines use a hot gas bypass control. The flow temperature of the cooling circuit for the injection
moulds is set at 13 °C, while the flow temperature of the cooling circuit for cooling the hydraulics is set at 22 °C.
The space heating of the production facility as well as the office buildings is supplied using conventional heating
boilers. The heating and air conditioning of the production is set to a minimum of 18 °C during winter and a
maximum room temperature of 25 °C during summer. There is no air conditioning in the office building. The
space heating is set to a minimum temperature of 18 °C.
4.2 Energy saving potential
Using the technology-oriented bottom-up model in combination with the heuristic optimization approach the
economic energy saving potential for the manufacturer described in section 4.1 is analized. The calculation of the
energy conservation cost curve is based on the following assumptions. The prices for electicity and gas are
15.02 EUR/MWhel [30] and 3.37 EUR/MWhth [31]. Additionally, the energy carrier price is set to increase by
1.0 % per year with regard to the prior year. This is based on the assumption of increasing energy demand on
international energy markets as well as the changes in the structure of the energy system and the resulting changes
of the energy system costs [32]. Lastly we use an interest rate of 15 % [13].
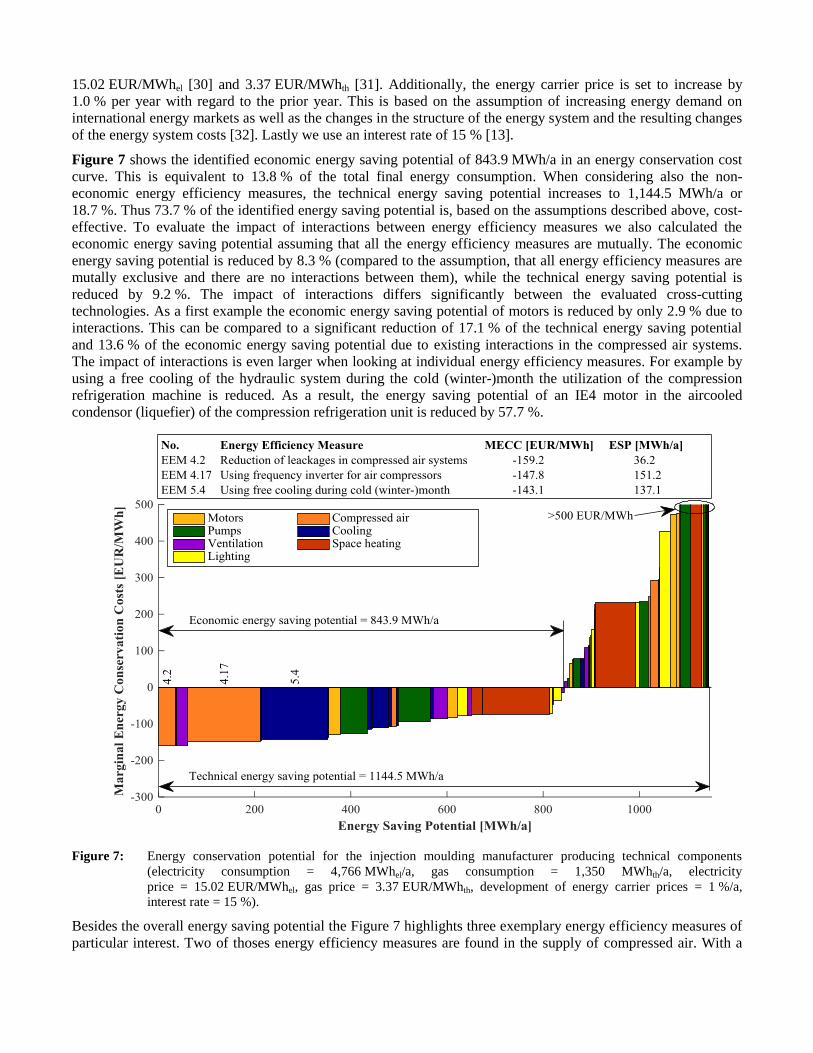
Figure 7 shows the identified economic energy saving potential of 843.9 MWh/a in an energy conservation cost
curve. This is equivalent to 13.8 % of the total final energy consumption. When considering also the non-
economic energy efficiency measures, the technical energy saving potential increases to 1,144.5 MWh/a or
18.7 %. Thus 73.7 % of the identified energy saving potential is, based on the assumptions described above, cost-
effective. To evaluate the impact of interactions between energy efficiency measures we also calculated the
economic energy saving potential assuming that all the energy efficiency measures are mutually. The economic
energy saving potential is reduced by 8.3 % (compared to the assumption, that all energy efficiency measures are
mutally exclusive and there are no interactions between them), while the technical energy saving potential is
reduced by 9.2 %. The impact of interactions differs significantly between the evaluated cross-cutting
technologies. As a first example the economic energy saving potential of motors is reduced by only 2.9 % due to
interactions. This can be compared to a significant reduction of 17.1 % of the technical energy saving potential
and 13.6 % of the economic energy saving potential due to existing interactions in the compressed air systems.
The impact of interactions is even larger when looking at individual energy efficiency measures. For example by
using a free cooling of the hydraulic system during the cold (winter-)month the utilization of the compression
refrigeration machine is reduced. As a result, the energy saving potential of an IE4 motor in the aircooled
condensor (liquefier) of the compression refrigeration unit is reduced by 57.7 %.
Figure 7: Energy conservation potential for the injection moulding manufacturer producing technical components
(electricity consumption = 4,766 MWhel/a, gas consumption = 1,350 MWhth/a, electricity
price = 15.02 EUR/MWhel, gas price = 3.37 EUR/MWhth, development of energy carrier prices = 1 %/a,
interest rate = 15 %).
Besides the overall energy saving potential the Figure 7 highlights three exemplary energy efficiency measures of
particular interest. Two of thoses energy efficiency measures are found in the supply of compressed air. With a
cumulated energy saving potential of 187.4 MWh/a, reducing leackages and using a frequency inverter accounts
for 22.2 % of the identified economic energy saving potential. Without a frequency inverter the compressor starts
when the pressure drops below the lower pressure limit and stops when the upper pressure limit is reached. If the
demand for compressed air increases the duration of the compressor operation increases as well but still goes back
to idleling when the upper pressure limit is reached. When using a frequency inverter the behaviour of the
compressor changes. If the demand for compressed air is comparably low, the compressor is still working in an
on/off behaviour. When the demand for compressed air exceeds about 25 % of the nominal capacity, the
compressor starts at full power until the upper pressure limit is reached and afterwards operats in a need oriented
way to keep the pressure at a constant level between the upper and the lower pressure limit. Thereby the
electricity consumption of the compressor station is reduced by 27.2 %.
Additionally 16,2 % of the economic energy saving potential can be saved by using free cooling during the cold
(winter-)month. The demand for cooling the injection moulds as well as the hydraulics is nearly constant. The
process cooling is supplied at an average energy efficient ratio (EER) of 1.4 using compression refrigeration
machines. When the outside temperature drops below 14 °C, the compression refrigeration machine for cooling
the hydraulics is turned of and the free cooling is used instead. Additionally the compression refrigeration
machine cooling the injection moulds is turned of at an outside temperature below 5 °C. The average EER of the
free cooling is nearly eight times higher than the EER of the compression refrigeration machines, thus being far
more efficient. As a result 40.1 % of the final energy consumption used for process cooling can be saved. Thereof
58.6 % can be allocated to the cooling of the hydraulics and 41,4 % to the cooling of the injection moulds. As
expected the higher share of the total energy saving potenantial by using free cooling is saved for the cooling of
the hydraulics due to the higher fluid temperature. This complies with the estimations of manufacturers for
refrigeration systems who indicate savings up to 80 % of the final energy consumption of the refrigeration system
when using free cooling for the hydraulics or the injection moulds (depending on the fluid temperature) [33].
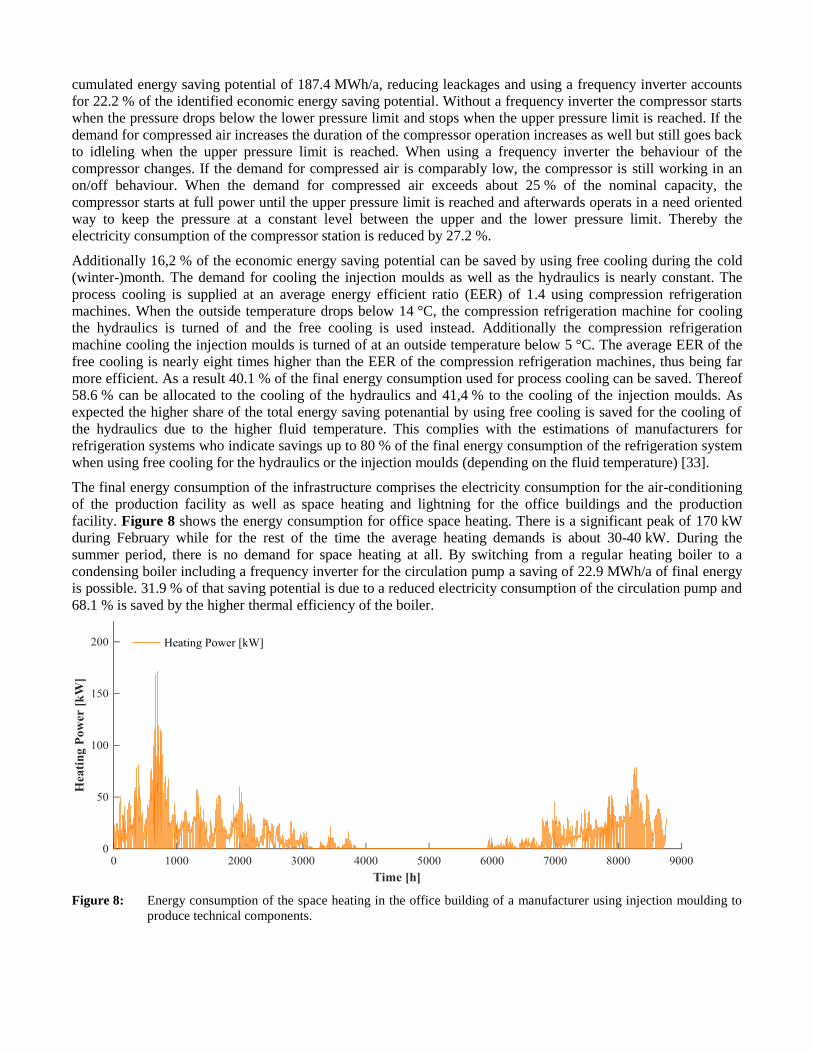
The final energy consumption of the infrastructure comprises the electricity consumption for the air-conditioning
of the production facility as well as space heating and lightning for the office buildings and the production
facility. Figure 8 shows the energy consumption for office space heating. There is a significant peak of 170 kW
during February while for the rest of the time the average heating demands is about 30-40 kW. During the
summer period, there is no demand for space heating at all. By switching from a regular heating boiler to a
condensing boiler including a frequency inverter for the circulation pump a saving of 22.9 MWh/a of final energy
is possible. 31.9 % of that saving potential is due to a reduced electricity consumption of the circulation pump and
68.1 % is saved by the higher thermal efficiency of the boiler.
Figure 8: Energy consumption of the space heating in the office building of a manufacturer using injection moulding to
produce technical components.
4.3 Sensitivity analysis
In the following section a sensitivity analysis is conducted to analyse the impact of the assumptions on the
identified economic energy saving potential. The key parameter variations are the interest rate, the energy carrier
prices and the future development of the energy carrier prices. As for the interest rate, most of the studies focusing
on the industry sector use a value of 15 % [12,13,34,35]. Nonetheless many companies are using higher rates for
the evaluation of possible investments. Therefore we also analyse the effect of an interest rate of 30 % as
suggested by [13] as this reflects an “[…] IRR […] equivalent to a payback time of three years with a life time of
ten years […]” [13]. Furthermore, an interest rate of 5 % is chosen as the low value in the sensitivity analysis. For
the energy carriers we assume, that the price might by 15 % higher or lower than the assumed value in section 4.1.
Lastly, for the future development of the energy carrier prices we differentiate between a high increase of the
energy prices by 2 % per year and no increase at all as the lower end for the sensitivity analysis.
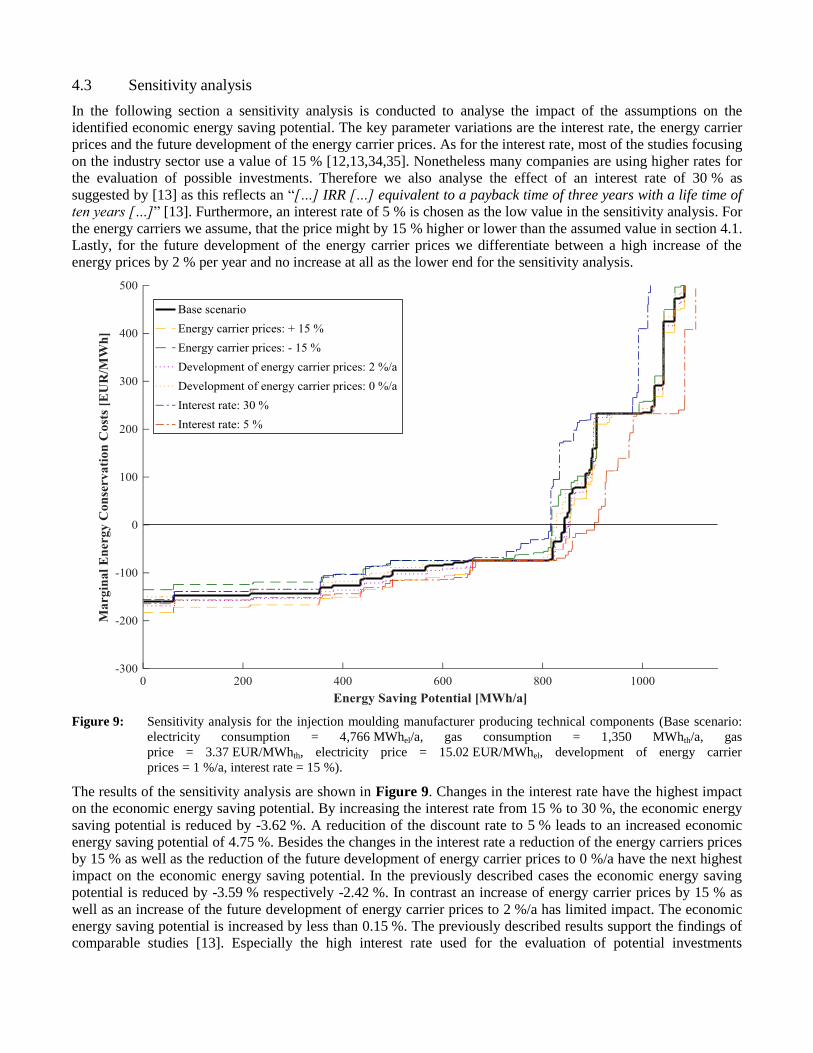
Figure 9: Sensitivity analysis for the injection moulding manufacturer producing technical components (Base scenario:
electricity consumption = 4,766 MWhel/a, gas consumption = 1,350 MWhth/a, gas
price = 3.37 EUR/MWhth, electricity price = 15.02 EUR/MWhel, development of energy carrier
prices = 1 %/a, interest rate = 15 %).
The results of the sensitivity analysis are shown in Figure 9. Changes in the interest rate have the highest impact
on the economic energy saving potential. By increasing the interest rate from 15 % to 30 %, the economic energy
saving potential is reduced by -3.62 %. A reducition of the discount rate to 5 % leads to an increased economic
energy saving potential of 4.75 %. Besides the changes in the interest rate a reduction of the energy carriers prices
by 15 % as well as the reduction of the future development of energy carrier prices to 0 %/a have the next highest
impact on the economic energy saving potential. In the previously described cases the economic energy saving
potential is reduced by -3.59 % respectively -2.42 %. In contrast an increase of energy carrier prices by 15 % as
well as an increase of the future development of energy carrier prices to 2 %/a has limited impact. The economic
energy saving potential is increased by less than 0.15 %. The previously described results support the findings of
comparable studies [13]. Especially the high interest rate used for the evaluation of potential investments
influences the economic energy saving potential and is therefore one of the key barriers towards the
implementation of energy efficiency measures. The correlation between the interest rate and the economic energy
saving potential amounts to -0.98. As for the energy carrier prices and the future development of the energy
carrier prices the correlation decreases (compared to the interest rate) to 0.89 and 0.88. Similar results where
found by Brunke and Blesl when they investigated the energy conservation potential of the german iron and steel
industry using a plant-specific bottom-up approach [13]. They found a correlation of -0.95 between the interest
rate and the energy conservation potential and a correlation of 0.89 between the electricity price and the electricity
conservation potential for the german iron and steel industry [13].
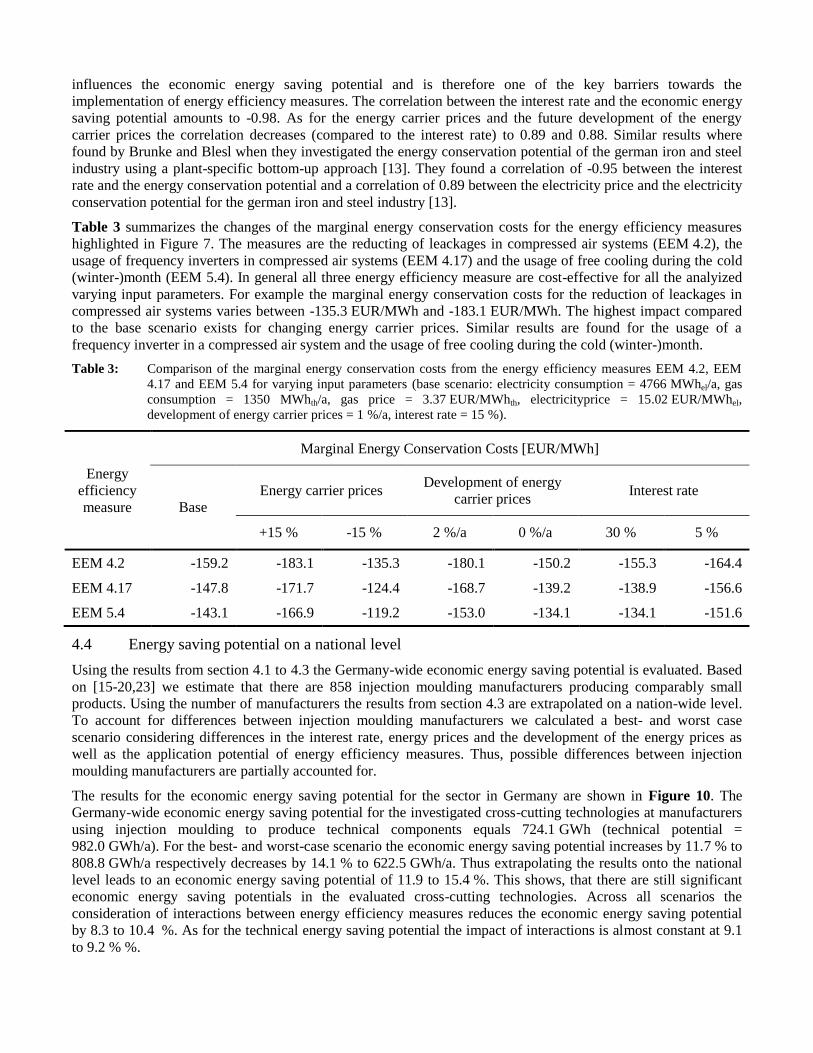
Table 3 summarizes the changes of the marginal energy conservation costs for the energy efficiency measures
highlighted in Figure 7. The measures are the reducting of leackages in compressed air systems (EEM 4.2), the
usage of frequency inverters in compressed air systems (EEM 4.17) and the usage of free cooling during the cold
(winter-)month (EEM 5.4). In general all three energy efficiency measure are cost-effective for all the analyized
varying input parameters. For example the marginal energy conservation costs for the reduction of leackages in
compressed air systems varies between -135.3 EUR/MWh and -183.1 EUR/MWh. The highest impact compared
to the base scenario exists for changing energy carrier prices. Similar results are found for the usage of a
frequency inverter in a compressed air system and the usage of free cooling during the cold (winter-)month.
Table 3: Comparison of the marginal energy conservation costs from the energy efficiency measures EEM 4.2, EEM
4.17 and EEM 5.4 for varying input parameters (base scenario: electricity consumption = 4766 MWhel/a, gas
consumption = 1350 MWhth/a, gas price = 3.37 EUR/MWhth, electricityprice = 15.02 EUR/MWhel,
development of energy carrier prices = 1 %/a, interest rate = 15 %).
Energy
efficiency
measure
Marginal Energy Conservation Costs [EUR/MWh]
Base
Energy carrier prices Development of energy
carrier prices Interest rate
+15 % -15 % 2 %/a 0 %/a 30 % 5 %
EEM 4.2 -159.2 -183.1 -135.3 -180.1 -150.2 -155.3 -164.4
EEM 4.17 -147.8 -171.7 -124.4 -168.7 -139.2 -138.9 -156.6
EEM 5.4 -143.1 -166.9 -119.2 -153.0 -134.1 -134.1 -151.6
4.4 Energy saving potential on a national level
Using the results from section 4.1 to 4.3 the Germany-wide economic energy saving potential is evaluated. Based
on [15-20,23] we estimate that there are 858 injection moulding manufacturers producing comparably small
products. Using the number of manufacturers the results from section 4.3 are extrapolated on a nation-wide level.
To account for differences between injection moulding manufacturers we calculated a best- and worst case
scenario considering differences in the interest rate, energy prices and the development of the energy prices as
well as the application potential of energy efficiency measures. Thus, possible differences between injection
moulding manufacturers are partially accounted for.
The results for the economic energy saving potential for the sector in Germany are shown in Figure 10. The
Germany-wide economic energy saving potential for the investigated cross-cutting technologies at manufacturers
using injection moulding to produce technical components equals 724.1 GWh (technical potential =
982.0 GWh/a). For the best- and worst-case scenario the economic energy saving potential increases by 11.7 % to
808.8 GWh/a respectively decreases by 14.1 % to 622.5 GWh/a. Thus extrapolating the results onto the national
level leads to an economic energy saving potential of 11.9 to 15.4 %. This shows, that there are still significant
economic energy saving potentials in the evaluated cross-cutting technologies. Across all scenarios the
consideration of interactions between energy efficiency measures reduces the economic energy saving potential
by 8.3 to 10.4 %. As for the technical energy saving potential the impact of interactions is almost constant at 9.1
to 9.2 % %.
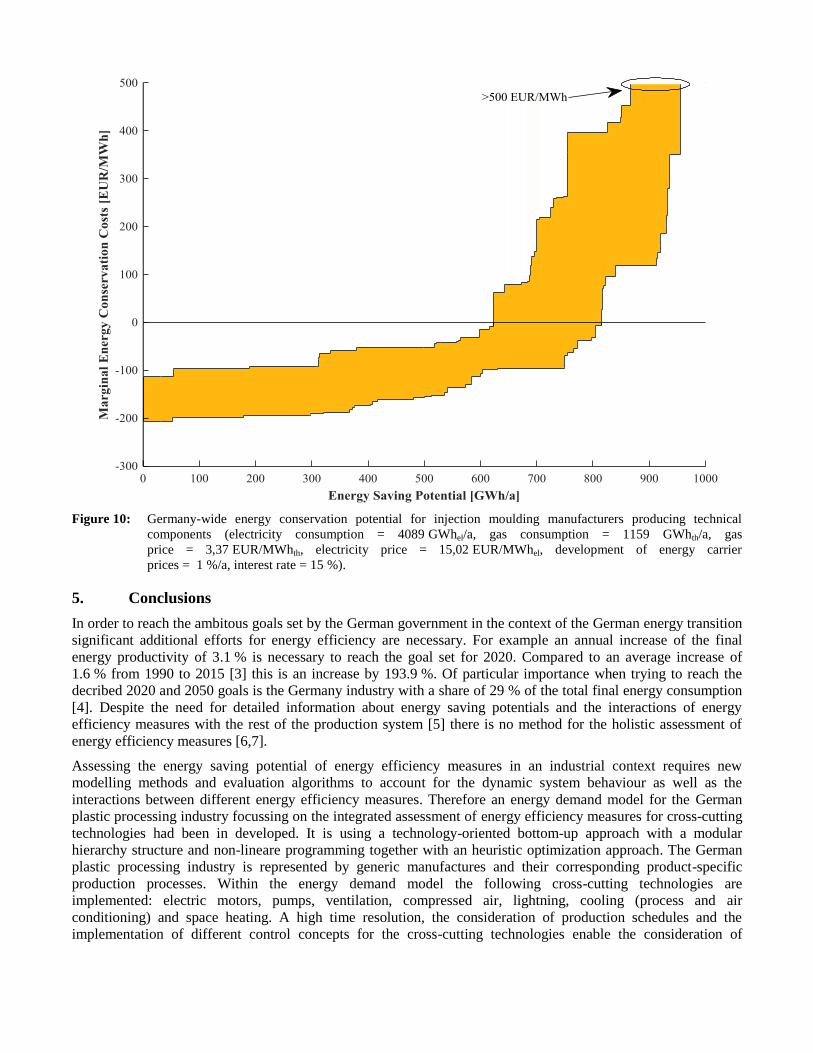
Figure 10: Germany-wide energy conservation potential for injection moulding manufacturers producing technical
components (electricity consumption = 4089 GWhel/a, gas consumption = 1159 GWhth/a, gas
price = 3,37 EUR/MWhth, electricity price = 15,02 EUR/MWhel, development of energy carrier
prices = 1 %/a, interest rate = 15 %).
5. Conclusions
In order to reach the ambitous goals set by the German government in the context of the German energy transition
significant additional efforts for energy efficiency are necessary. For example an annual increase of the final
energy productivity of 3.1 % is necessary to reach the goal set for 2020. Compared to an average increase of
1.6 % from 1990 to 2015 [3] this is an increase by 193.9 %. Of particular importance when trying to reach the
decribed 2020 and 2050 goals is the Germany industry with a share of 29 % of the total final energy consumption
[4]. Despite the need for detailed information about energy saving potentials and the interactions of energy
efficiency measures with the rest of the production system [5] there is no method for the holistic assessment of
energy efficiency measures [6,7].
Assessing the energy saving potential of energy efficiency measures in an industrial context requires new
modelling methods and evaluation algorithms to account for the dynamic system behaviour as well as the
interactions between different energy efficiency measures. Therefore an energy demand model for the German
plastic processing industry focussing on the integrated assessment of energy efficiency measures for cross-cutting
technologies had been in developed. It is using a technology-oriented bottom-up approach with a modular
hierarchy structure and non-lineare programming together with an heuristic optimization approach. The German
plastic processing industry is represented by generic manufactures and their corresponding product-specific
production processes. Within the energy demand model the following cross-cutting technologies are
implemented: electric motors, pumps, ventilation, compressed air, lightning, cooling (process and air
conditioning) and space heating. A high time resolution, the consideration of production schedules and the
implementation of different control concepts for the cross-cutting technologies enable the consideration of

dynamic system behaviour due to changes in utilization. As the evaluation of interacting energy efficiency
measures requires the evaluation of different combinations as well as the order of implementation (ergo all
permutations), a new heuristic optimization approach is used to reduce the computation time. The heuristic
optimization approach considers technical restrictions, path-dependencies and strategic decision making to
eliminate unfavourable permutations. The objective function of the heuristic is the identification of the
permutation leading to the maximum accumulated net present value of the evaluated energy efficiency measures.
The presented method for the integrated assessment of energy efficiency measures is used for the evaluation of
the energy saving potential of an industrial energy supply system in the German plastic processing industry but is
also applicable for the evaluation of different systems.
Based on a case study for a generic manufacturer producing technical components using injection moulding the
economic energy saving potential as well as the impact of interactions between energy efficiency measures is
evaluated. The results from the conducted case-study show, that there is still a significant economic energy saving
potential of 13.8 % for the evaluated cross-cutting technologies. Almost 74 % of the identified technical energy
saving potential is cost-effective. By considering the interactions between energy efficiency measures the
economic energy saving potential is reduced by 8.3 % compared to the assumption, that all energy efficiency
measures are mutually exclusive and there are not interactions between them. The impact of interactions differs
significantly between the investigated cross-cutting technologies. Especially when evaluating individual energy
efficiency measures the changes of the energy saving potential due to interactions amounts for up to 50 %. Thus,
neglegting interactions when evaluating energy efficiency measures might lead to a signification overestimation
of the energy saving potential and thereby can lead to disappointments with energy saving investments. In the
sensitivity analysis the impact of different energy carrier prices, the price development for energy carriers and the
interest rate on the economic energy saving potential was analysed. The highest correlation (-0.98) was found
between the interest rate and the economic energy saving potential. This supports the results from previous studies
that severe requirements for the evaluation of investment opportunities hinder the implementation of energy
efficiency measures.
With regard to the German plastic processing industry further research is necessary to evaluate the impact of
different product sizes and therefore different injection cycling times on the identified economic energy saving
potential. Furthermore additional research is recommended to evaluate the economic energy saving potential for
other production processes (extrusion, blow-moulding, thermoforming) in a similar way.
References
[1] BMWi (2014): Ein gutes Stück Arbeit, Die Energie der Zukunft, Vierter Monitoring - Bericht zur
Energiewende. Berlin.
[2] BMWi (2014): Ein gutes Stück Arbeit, Mehr aus Energie Machen, Nationaler Aktionsplan
Energieeffizienz. Berlin
[3] Umweltbundesamt (2016): Energieproduktivität, https://www.umweltbundesamt.de/daten/energie-als-
ressource/energieproduktivitaet#textpart-1, zuletzt geprüft: 05.02.2017
[4] AGEB (2016): Anwendungsbilanzen für die Endenergiesektoren in Deutschland in den Jahren 2013 bis
2015. Hg. v. AG Energiebilanzen e. V., BMWi Projektnummer: 072/15, Berlin.
[5] Trianni, A., Cagno, E., De Donatis, A. (2014): A framework to characterize energy efficiency measures. In:
Applied Energy 118 (2014), pp. 207-220.
[6] Herrmann et al. (2011): Energy oriented simulation of manufacuring systems – Concept and application. In:
CIRP Annals – Manufaturing Technology 60, pp. 45-48.
[7] Fleiter (2009): Costs and potentials of energy savings in European indsutry – a critical assessment of the
concept on conservation supply curves. In: ECEEE 2009 Summer Study, Panel 5 – Energy Efficiency in
Industry, pp. 1261-12723.
[8] Mousavi et al. (2016): A hierarchical framework for concurrent assessment of energy and water efficiency
in manufacturing systems. In: Journal of Cleaner Production 133, pp. 88-98.
[9] Karp (1972): Reducibility among combinatorial problems. University of California at Berkeley.
[10] Meier (1982): Supply Curves of Conserved Energy. In: Lawrence Berkeley National Laboratory,
University of California.
[11] Meier et al. (1983): Supply Curves of Conserved Energy: The potential for conservation in California´s
residential sector. In: Lawrence Berkeley National Laboratory, University of California.
[12] Beer et al. (2009): CO2-Verminderung in Deutschland – Teil I: Methodik und Zusammenfassung.
Forschungsstelle für Energiewirtschaft (FfE), 2. überarbeitete Auflage.
[13] Brunke, Blesl (2014): A plant-specific bottom-up approach for assessing the cost-effective energy
conservation potential and its ability to compensate rising energy-related costs in the German iron and steel
industry. In: Energy Policy 67, pp. 431-446.
[14] Brunke, Blesl (2014): Energy conservation measures for the German cement industry and their ability to
compensate for rising energy-related production costs. In: Journal of Cleaner Production 82, pp. 94-111.
[15] Dispan (2013): Kunststoffverarbeitung in Deutschland – Branchenreport 2013. In: Informationsdienst des
IMU Instituts – Heft 4/2013.
[16] Consultic (2015): Produktion, Verarbeitung und Verwertung von Kunststoffen in Deutschland 2015 -
Kurzfassung -. i. A. v. BKV GmbH, PlasticsEurope e. V., IK Industrievereinigung Kunststoffverpackungen
e. V., VDMA Verband Deutscher Maschinen- und Anlagenbau e. V. Fachverband Kunststoff- und
Gummimaschinen, bvse-Bundesverband Sekundärrohstoffe und Entsorgung e. V..
[17] EUROMAP (2011): Energy efficiency of plastics and rubber machines in Europe, Ried (Österreich).
[18] Statistisches Bundesamt (2013): Erhebung über die Energieverwendung der Betriebe des Verarb. Gewerbes
sowie des Bergbaus und der Gewinnung von Steinen und Erden, Deutschland.
[19] Urbanek und Saal (2011): Energy efficiency of plastics and rubber machines in Europe, EUROMAP Study,
Urbanek Innovation Consulting, Ried (Österreich).
[20] RECIPE (2005): Reduced energy consumption in plastics engineering, 2005 European benchmarking
survey of energy consumption and adoption of best practice.
[21] Puttinger (1997): Energiekennzahlen und -sparpotenziale in der Kunststoffverarbeitung.
Wirtschaftskammer O. Ö., Ökologische Betriebsberatung & O. Ö. Energiesparverband.
[22] Öko-Institut und Fraunhofer ISI (2014): Klimaschutzszenario 2050, 1. Modellierungsrunde, Berlin.
[23] DESTATIS (2013): Produktion des verarbeitenden Gewerbes sowie des Bergbaus und der Gewinnung von
Steinen und Erden, Wiesbaden.
[24] Trautmann et al. (2002): Rationelle Energienutzung in der kunststoffverarbeitenden Industrie: Leitfaden für
die betriebliche Praxis, 1. Aufl. Braunschweig, Wiesbaden, Vieweg 2002.
[25] Weiß (2016): Energieeffizienz und Abwärmenutzung in der Kunststoffverarbeitung. Dissertation,
Universität Duisburg-Essen.
[26] Bertrand et al. (2012): Energy Audit Summary Report, CRP HENRI TUDOR Audit no. 63 – LU03.
EINSTEIN-II (ProjectNo. IEE/09/702/SI2.558239)
[27] Krajnc (2012): Energy Audit Summary report Audit No. 57, C.I.B. S.r.l. EINSTEIN-II (ProjectNo.
IEE/09/702/SI2.558239)
[28] Spina (2004): Injection moulding of automotive components: comparison between hot runner systems for a
case study. Journal of Materials Processing Technologiy, Vol. 155-156, pp. 1497-1504.
[29] Madan et al. (2013): Characterizing energy consumption of the injection molding process. Proceedings of
the ASME 2013 International Manufacturing Science and Engineering Conference MSEC2013. Wisconsin,
USA.
[30] BDEW (2013): BDEW-Strompreisanalyse November 2013: Haushalte und Industrie. Bundes-verband der
Energie- und Wasserwirtschaft e. V. Berlin, 20.11.2013
[31] BMWi (2014): Bundesministerium für Wirtschaft und Energie. Zahlen und Fakten Energiedaten: Nationale
und Internationale Entwicklung. Stand 03.03.2014.
[32] Schlesinger et al. (2014): Entwicklung der Energiemärkte – Energiereferenzprognose: Endbericht Projekt
Nr. 57/12. Studie im Auftrag des Bundesminis-teriums für Wirtschaft und Technologie.
Energiewirtschaftliches Institut an der Universität zu Köln; Gesellschaft für wirtschaftliche
Strukturforschung:; Prognos AG. Basel, Köln, Osnabrück, 2014
[33] Rüßmann (2012): Kühltechnik- und Wärme-Rückgewinnung für Kunststoff-Maschinen, Die nötige
Temperatur an der richtigen Stelle. PLASTVERARBEITER, Das Portal für den Kunststoffverarbeiter.
http://www.plastverarbeiter.de/35908/die-noetige-temperatur-an-der-richtigen-stelle/, zuletzt geprüft:
23.06.2017.
[34] Hasanbeigi et al. (2013): A bottom-up model to estimate the energy efficiency improvement and CO2
emission reduction potentials in the Chinese iron and steel industry. Energy 50, pp. 315–325.
[35] Fleiter (2012): The adoption of energy-efficient technologies by firms. An integrated analysis of the
technology, behavior and policy dimensions. Doktorarbeit. Fraunhofer Institute for Systems and
Innovation Research ISI, Karlsruhe.