Embed Size (px)
Citation preview

DOE/PO-OQ22
Insular Area Energy Vulnerability
May 1994
U.S. Department of EnergyWashington, DC 20585
-rTHii £>OCt»M^ BB t IHlA
Printed with soy ink on recycled paper

DISCLAIMER
This report was prepared as an account of work sponsored by an agency of the United States Government. Neither the United States Government nor any agency thereof, nor any of their employees, makes any warranty, express or implied, or assumes any legal liability or responsibility for the accuracy, completeness, or usefulness of any information, apparatus, product, or process disclosed, or represents that its use would not infringe privately owned rights. Reference herein to any specific commercial product, process, or service by trade name, trademark, manufacturer, or otherwise does not necessarily constitute or imply its endorsement, recommendation, or favoring by the United States Government or any agency thereof. The views and opinions of authors expressed herein do not necessarily state or reflect those of the United States Government or any agency thereof.
DISCLAIM ER
Portions of this document may be illegible in electronic image
products. Images are produced from the best available
original document.

Insular Area Energy Vulnerability
Table of Contents
Report to CongressU.S. Department of Energy
Technical Appendices:
I. Puerto Rico and the U.S. Virgin IslandsMathtech, Inc.
II. U.S. Pacific IslandsEast-West Center

Report to Congress
on
Insular Area Energy Vulnerability
Submitted in Response to Section 1406 of the Energy Policy Act of 1992
(Public Law 102-486)
U.S. Department of Energy
May 1994
U.S. Department of Energy Insular Area Energy Vulnerability Study
EXECUTIVE SUMMARY
PURPOSE OF THE STUDY
This report was prepared in response to Section 1406 of the Energy Policy Act of 1992 (Public Law 102-486), which directed the Department of Energy (DOE) to "conduct a study of the implications of the unique vulnerabilities of the insular areas to an oil supply disruption," and to "outline how the insular areas shall gain access to vital oil supplies during times of national emergency. ” The Act defines the insular areas to be the U.S. Virgin Islands and Puerto Rico in the Caribbean, and Guam, American Samoa, the Commonwealth of the Northern Mariana Islands (CNMI), and Palau in the Pacific.
STUDY DESIGN
In the study, "unique vulnerabilities" were defined as susceptibility to: (1) more frequent or more likely interruptions of oil supplies compared to the U.S. Mainland, and/or (2) disproportionately larger or more likely economic losses in the event of an oil supply disruption. In order to assess unique vulnerabilities, the study examined the insular areas' experience during past global disruptions of oil supplies and during local emergencies caused by natural disasters. The effects of several possible future global disruptions and local emergencies were also analyzed. Analyses were based on historical data, simulations using energy and economic models, and interviews with officials in the insular governments and the energy industry.
FACTORS CONTRIBUTING TO INSULAR AREA ENERGY VULNERABILITY
The insular areas are geographically and economically diverse and range in population from 3.5 million people in Puerto Rico to 15,000 in Palau. However, they share several common characteristics that render them uniquely vulnerable to oil supply disruptions.
• The insular areas are almost entirely dependent upon petroleum for their primary energy needs. In comparison, petroleum provided only 41 percent of overall U.S. Mainland energy in 1992.
• The insular areas must import 100 percent of their petroleum, compared to 41 percent import dependence on the Mainland.
• Petroleum is used for nearly all electricity generation in the insular areas, whereas the Mainland generates only 3 percent of its electricity using petroleum.
• Some of the insular areas produce much of their potable water by desalinization using petroleum fuels and electricity.
• The insular economies are highly dependent on tourism, and tourism is adversely affected by economic downturns that typically follow global oil supply disruptions.
• The insular areas spend a substantially larger share of their income on imported petroleum than does the Mainland. In 1991, insular area expenditures on imported
Executive Summary i

U.S. Department of Energy Insular Area Energy Vulnerability Study
petroleum as a percent of Gross Domestic Product (GDP) ranged from 5% to 12% compared to 0.8% for the Mainland.
FINDINGS: OIL SUPPLY INTERRUPTIONS
Despite the existence of unique vulnerabilities to oil supply disruptions, none of the insular areas has experienced petroleum supply shortages since World War II, including during the oil crises of 1973-74, 1979-80 and 1990-91. According to historical data and reports from island government and oil industry officials, the oil companies serving the islands and large oil users such as the electric power authorities maintained adequate inventories to meet all petroleum requirements.
A future "worst case" global oil disruption could cause temporary oil supply difficulties in the Pacific islands and Puerto Rico. During this time, the islands would need to rely on available inventories until regional supply imbalances were rectified. The islands are unlikely to experience actual oil supply shortages for the following reasons:
• The global oil market is now highly interconnected electronically. Compared to the 1970s and early 1980s, oil companies are much more able to identify and respond quickly to supply imbalances worldwide.
• Large global oil supply disruptions would be addressed worldwide by releases of U.S. and allied strategic oil stocks.
• Four major oil companies supply products to the Pacific islands. Their resources, together with on-island oil inventories maintained by the electric power authorities, should be adequate to handle any short term or local oil supply disruptions.
• The U.S. Virgin Islands is home to and is served by one of the world's largest petroleum refineries. In addition, the Virgin Islands and Puerto Rico are located in the midst of an active oil trading region and a short distance from the U.S. Gulf Coast and the Strategic Petroleum Reserve (SPR). These islands have ready access to oil supplies both from local inventories and nearby suppliers.
• The insular areas are frequently subjected to natural disasters such as hurricanes, typhoons and earthquakes. While these disasters have caused extensive damage to homes, buildings, electric power distribution systems and other infrastructure, they have not caused interruptions in oil supplies on the islands.
FINDINGS: ECONOMIC IMPACTS
The primary vulnerability of the insular areas to global oil supply disruptions is their susceptibility to larger economic losses from sudden, large petroleum price increases. Oil supply disruptions can be expected to have larger economic impacts in the insular areas because imported oil has a much larger role in their economies and there are currently no substitute fuels; the economies are small and less diversified than in the Mainland; and most of the islands rely heavily on tourism, which tends to decline significantly during and after global oil disruptions.
UExecutive Summary

U.S. Department of Energy Insular Area Energy Vulnerability Study
The data for Puerto Rico illustrate the economic effects of the global oil disruptions of 1973-74, 1979-80 and 1990-91 compared to the U.S. Mainland:
• The GDP growth rate declined more in Puerto Rico than in the Mainland during the 1973-74 and 1979-80 oil crises.
• The unemployment rate increased more than in the Mainland during all three disruptions.
• The inflation rate increased more than in the Mainland during the 1973-74 and 1979-80 disruptions.
Simulations of future global oil disruptions using energy and economic models also projected larger economic impacts in Puerto Rico compared to the Mainland, including larger GDP losses and larger terms of trade losses. Inflation rate increases are larger in Puerto Rico only for severe disruptions; for smaller disruptions, inflation increases are comparable or less than the Mainland.
Historical economic data are incomplete or not available for the other insular areas, especially the Pacific islands. Suitable macroeconomic models are also lacking. Thus, it is not possible to assess economic effects as comprehensively as for Puerto Rico. However, it is predicted that terms of trade losses would be larger in the other islands than on the Mainland. GDP losses are projected to be larger in the U.S. Virgin Islands than on the Mainland. GDP losses and inflation increases should also be larger in the Pacific islands, but this cannot be determined conclusively from available data.
ACCESS TO VITAL OIL SUPPLIES IN AN EMERGENCY
In view of the above findings, it is highly unlikely the insular areas would require additional oil supplies during an oil crisis because shortages are highly unlikely. Furthermore, additional oil supplies would not solve the economic problems in the insular areas that are caused by increased oil prices during disruptions. Indeed, the best defense against increased oil prices in a global oil emergency would be to rely on a release of the U.S. SPR (and strategic stocks held by the allies) to dampen world oil prices. This is the current U.S. Government policy.
Nevertheless, to fulfill the Congressional mandate, DOE analyzed a wide range of options that might provide additional oil supplies in an emergency and/or reduce the economic effects of increased oil prices. The options could be adopted singly or in combination.
The following options could be implemented by the island governments without Federal assistance:
• Increase the on-island commercial oil inventories held by the oil companies and large oil users such as the electric power authorities.
• Develop island-owned and -controlled petroleum product reserves on Puerto Rico and Guam to serve the Caribbean and Pacific territories, respectively.
• Develop bilateral or multilateral mutual support agreements with neighboring islands and oil suppliers.
HiExecutive Summary
U.S. Department of Energy Insular Area Energy Vulnerability Study
• Establish and maintain sets of rolling futures contracts covering designated volumes of crude oil, gasoline and other products, in order to hedge against sudden price increases.
• Establish standby lines of credit with financial institutions to provide additional financial liquidity during oil emergencies.
Because little or no Federal role would be required, the islands are free to decide among these options based on their relative advantages and disadvantages as summarized in the main report.
Three other options were examined that would require action or financial assistance by the U.S. Government. These were:
• Provide the insular areas with emergency access to U.S. military petroleum supplies stored on the islands.
• Guarantee the insular areas priority access to the U.S. SPR.
• Develop a Federally-owned and -controlled petroleum product reserve in the Caribbean and the Pacific.
DOE found that access to military supplies could be valuable in the Pacific, where military inventories are large, but not in the Caribbean where they are small. Guaranteed access to the SPR would have small benefit. Federally-owned reserves in the Caribbean and Pacific, under current policies, would provide some additional supply security, but at substantial cost and with little benefit to the island economies during an emergency.
OPTIONS FOR IMPROVING EMERGENCY PREPAREDNESS AND REDUCINGVULNERABILITIES
The insular areas could reduce their energy and economic vulnerabilities to oil supply disruptions. Several options were examined, all of which could be pursued by the island governments with little or no Federal assistance:
• Enhance energy emergency planning and response capabilities and institutions.
• Increase energy conservation and energy efficiency.
• Diversify the mix of fossil fuels used.
• Increase the use of renewable energy sources.
• Define the size of potential oil and gas reserves (Puerto Rico only)
• Enhance the petroleum refining and distribution system (Puerto Rico only)
• Reduce petroleum system physical vulnerability (Puerto Rico only).
Executive Summary iv

U.S. Department of Energy Insular Area Energy Vulnerability Study
These options were based on an initial review of petroleum and electric power systems in the Caribbean and Pacific islands. A more detailed analysis by the island governments is warranted.
Executive Summary v


U.S. Department of Energy Insular Area Energy Vulnerability Study
TABLE OF CONTENTS
Section Title Page
EXECUTIVE SUMMARY........................... ......................................................................................... i
1 INTRODUCTION ............ 11.1 Background.................................................................................................... 11-2 Requirement of the Energy Policy Act (EPACT) of 1992 ............................................. 11.3 Study Design: DOE's Response to the EPACT Requirement ........................................ 2
2 CARIBBEAN: ENERGY/ECONOMY PROFILES.....................................................................42.1 Overview of Caribbean Petroleum Market....................................................................... 4
2.1.1 Market Geographical Scope................. 42.1.2 Regional Petroleum Trade Flows, Production and Demand............................... 52.1.3 Regional Refining Capacities .............................................................................. 72.1.4 Regional Petroleum Storage and Inventories ......................................................82.1.5 Regional Developments.........................................................................................9
2.2 Puerto Rico....................................................................................... 102.2.1 Overview . ....................................................................................................... 102.2.2 Energy Profile .................................................................................................. 12
2.3 U.S;„VirjjnJslandg....................................................................................................... 192.3.1 Overview............................................................................. 192.3.2 Energy Profile ..................................................................................... 20
3 PACIFIC: ENERGY/ECONOMY PROFILES....................................................................... 263.1 Overview of Pacific Petroleum Market................................ 26
3.1.1 Market Geographical Scope........................... 263.1.2 Regional Petroleum Trade Flows, Production and Demand......................... 263.1.3 Regional Refining Capacities ........................... 313.1.4 Regional Petroleum Inventories.......................................... 31
3.2 The Pacific Islands ....................................................................................................... 313.2.1 Overview . ............................................... 313.2.2 Energy Profile.................................................................................................. 33
4 ASSESSMENT OF UNIQUE ENERGY VULNERABILITIES ............................... 404.1 Intipduction...................................................... 404.2 Factors That Contribute to Unique Energy Vulnerabilities.......... ............................. 40
4.2.1 Petroleum Supply System Vulnerabilities........................................................ 404.2.2 Electric Power System Vulnerabilities................. 414.2.3 Transportation System Vulnerabilities............................................................ 434.2.4 Water Supply System Vulnerabilities .................... 444.2.5 Economic Vulnerabilities................................................................................. 444.2.6 Implications of Unique Vulnerabilities .......................................................... 45
4.3 Methodology........................... 464.4 Findings: Supply Impacts of Oil Supply Disruptions.................... 47
4.4.1 Past Global Oil Disruptions............................................... 47
viiTable of Contents

U.S. Department of Energy Insular Area Energy Vulnerability Study
4.4.2 Future Global Oil Supply Disruptions............................................................ 504.4.3 Local Disruptions ............................................................................................. 53
4.5 Findings: Economic Impacts of Oil Supply Disruptions ............ 554.5.1 Measurement of Economic Losses ........................................ ........................ 554.5.2 Data Sources .............................................. 564.5.3 Past Global Oil Supply Disruptions............................................................. 574.5.4 Potential Global Supply Disruptions..................................................... .. 59
4.6 Summary of Kev Vulnerabilities and their Implications . ......................................... 61
5 OPTIONS FOR ACCESSING VITAL OIL SUPPLIES IN AN EMERGENCY................. 635.1 Introduction: Scope of Response Options Evaluated ................................................ 635.2 Increase in Commercial Stocks .............................. 635.3 Island-Owned Product Reserve ........................................................................... 645.4 Regional Support Alliances......................... 675.5 Oil Futures Market Hedging ....................... 685.6 Standby Line of Credit ........................................................ 685.7 Emergency Access to U.S. Military Petroleum Supplies........................................... 685.8 Guaranteed Insular Area Access to the SPR.......................................................... .. . 695.9 Island Component of the Federal SPR.......................................... 705.10 Concluding Comments........................................... 70
6 OPTIONS FOR IMPROVING EMERGENCY PREPAREDNESS AND REDUCINGENERGY VULNERABILITY................................................................................................... 716.1 Institutional Preparedness........................................ 71
6.1.1 The Caribbean Islands ................................................................................... 716.1.2 The Pacific Islands........................................................................................... 72
6.2 Increased Energy Conservation and Efficiency............................................... 736.2.1 The Caribbean Islands ................................................................................... 736.2.2 The Pacific Islands........................................................................................... 74
6.3 Fossil Fuel Diversification................................................................. 756.3.1 Puerto Rico ..................................................................................................... 756.3.2 U.S. Virgin Islands........................................................................................... 766.3.3 U.S. Pacific Islands ............................... ............................. .......................... 76
6.4 Renewable Energy......................... 766.5 Definition and Development of Potential Oil and Gas Reserves (Puerto Rico) .... 776.6 Refining Sector Enhancement (Puerto Rico)....................................................... 786.7 Options for Reducing Petroleum System Vulnerability (Puerto Rico)....................... 796.8 Concluding Comments.............................. 80
APPENDIX I: U.S. Department of Energy SECP/EES/ICP Funding to the Insular Areas.......... A-l
APPENDIX II: List of Officials Interviewed............................................................ ........................ A-2
viaTable of Contents

U.S. Department of Energy Insular Area Energy Vulnerability Study
TABLES
Table Description Page
1 Main Crude Oil Flows Within and Through the Caribbean 1990 6
2 Main Caribbean Areas - Refining Capacity 1992 8
3 Puerto Rico Economic/Demographic Situation 11
4 Puerto Rico Petroleum Demand, Production and Import Dependency 1992 15
5 Puerto Rico Petroleum Imports (gross) 1992 16
6 PREPA Power Statistics 17
7 U.S.V.I. Economic/Demographic Situation 18
8 Estimated U.S.V.I. Total Petroleum Demand 1992 21
9 WAPA Electric Power Statistics 24
10 Asia-Pacific Petroleum Product Balances 1991-2000 27
11 U.S. Pacific Islands Land Area, Population, GDP 32
12 U.S. Pacific Islands Oil Imports 33
13 U.S. Pacific Islands Petroleum Demand and End Use 34
14 U.S. Pacific Islands Petroleum Storage 37
15 U.S. Pacific Islands Electric Power 38
16 Oil Import Bills as a Percentage of GDP 45
17 Potential Global Energy Disruptions 50
18 Economic Effects of Past Global Oil Supply Disruptions: Caribbean 58
19 Economic Effects of Potential Future Global Oil Supply Disruptions: Caribbean 60
20 Economic Effects of Potential Future Global Oil Supply Disruptions: Pacific 61
Table of Contents a

U.S. Department of Energy Insular Area Energy Vulnerability Study
FIGURES
Figure Description Era
1 Puerto Rico Petroleum Demand 1992 14
2 U.S.V.I. Petroleum Demand 1992 22
3 Pacific Petroleum Flows 30
4 U.S. Pacific Islands Petroleum Product Demand 36
5 PREPA Fuel Cost 1989 - 1992 42
6 U.S.V.I. Peak Electric Loads 43
7 Puerto Rico Refinery Stocks 1988 - 1992 48
8 Puerto Rico vs. U.S. Prices 1989 - 1992 49
Table of Contents x

U.S. Department of Energy Insular Area Energy Vulnerability Study
1 INTRODUCTION
1.1 Background
The Department of Energy (DOE) has been engaged in a wide range of Congressionally- mandated energy programs and other activities to assist the insular areas in implementing conservation and renewable energy technologies. Funds and technical assistance have been provided to the insular areas under the Institutional Conservation Program (10 CFR, part 455) and the State Energy Conservation Plans (10 CFR, part 420), both of which are authorized by the Energy Policy and Conservation Act (P.L. 94-163), as amended by Title III of the National Energy Conservation Policy Act (P.L. 95-619) and the State Energy Efficiency Programs Improvement Act of 1990 (P.L. 101-440).
In addition. Section 604 of the Omnibus Territories Act of 1980 (P.L. 96-597) required the Secretary of Energy to "prepare a comprehensive energy plan with emphasis on indigenous renewable sources of energy for Puerto Rico, the Virgin Islands, Guam, American Samoa, the Northern Mariana Islands, the Federated States of Micronesia, the Marshal Islands and Palau." A report, the Territorial Energy Assessment, which included the energy plan for each island, was submitted to the Congress in December 1982. The focus of the energy plans was to identify the indigenous energy resources for each island and assess the technical and economic feasibility of exploiting the resources as an alternative to imported oil for electric power generation and other uses. In the ensuing years, DOE has also provided financial and technical assistance to the insular areas for the development of solar. Ocean Thermal Energy Conversion (OTEC) and other renewable energy technologies.1
1.2 Bgaairment.of fhe„E.ii,grgy„Pollcy, Act ,.(EPA,CTj. ofJJ92
Section 1406 of the Energy Policy Act of 1992 (P.L. 102-486) requires the Secretary of Energy to conduct a study that:
(1) assesses the implications of the unique vulnerabilities of the insular areas to an oil supply disruption; and
(2) outlines how the insular areas shall gain access to vital oil supplies during times of national emergency.
The Act defines the insular areas to include Puerto Rico and the Virgin Islands in the Caribbean and American Samoa, Commonwealth of the Northern Mariana Islands (CNMI), Guam and Palau in the Pacific.
Funding for the insular areas under those programs is shown in Appendix I.
Section 1: Introduction 1

U.S. Department of Energy Insular Area Energy Vulnerability Study
1.3 Study Design; .DOE's Response to jAe EPACll Regiiirement
DOE, in response to the EPACT requirement, undertook a study to evaluate each insular area's unique vulnerability to oil supply disruptions and to present options for supplementing oil supplies in an emergency. DOE expanded the scope of the Congressional requirement to include examining options for reducing the islands' vulnerability to oil supply disruptions in the long run.
The regional oil markets provide the essential context in which to assess the energy vulnerabilities of the islands. The four Pacific islands are part of the Asia-Pacific oil market. This has certain characteristics that are different from those of the Caribbean oil market of which the two Caribbean islands are part. For this reason, the six islands are divided into Pacific and Caribbean groups. The Pacific group includes American Samoa, the CNMI, Guam and Palau. The Caribbean group includes Puerto Rico and the Virgin Islands.
All oil-consuming nations, including the islands, are vulnerable to supply disruptions because the world oil market has been, and will continue to be, dominated by a handful of producers who are capable of reducing world oil supplies abruptly, thereby raising oil prices sharply. Since a sudden large interruption in oil supplies, coupled with a sudden large increase in oil prices, could have detrimental effects on the economies, and sometimes on human lives, oil consumers remain vulnerable as long as they remain dependent on oil for fuel supplies. Oil supplies can also be interrupted by such natural disasters as hurricanes and earthquakes.
For the purpose of the study, the unique vulnerability of an island to oil supply disruptions was defined as:
In comparison to the U.S. Mainland:
(1) higher likelihood of the occurrence of interrupted oil supplies; and/or
(2) disproportionately larger economic losses in the event of an oil supply disruption.
The disruption can result from either a global oil supply disruption or a natural disaster. The term national emergency is defined as any emergency where economic losses are large and human lives are threatened, with or without Presidential declaration.
The study was carried out in close cooperation with insular governments, including energy and economic planning offices, electric power authorities and oil industry representatives.2
Sections 2 and 3 of this report are overviews of the insular areas, their demography and economies, their energy sectors and the regional petroleum markets within which they operate. Section 4 presents DOE's assessment of the unique energy vulnerabilities of the insular areas and their implications.
Appendix II lists the insular officials interviewed for the study.
Section 1: Introduction 2

U.S. Department of Energy Insular Area Energy Vulnerability Study
Sections 5 and 6 review options available to the insular areas for reducing their energy vulnerability. The options considered concentrate on actions the islands can take themselves and which supplement measures the U.S. Government and its allies might take from which the insular areas would expect to benefit. Section 5 focusses on means to enhance physical oil availability and/or to reduce the cost impacts of oil supply disruptions. Section 6 offers ways to improve emergency preparedness in the islands and to reduce energy vulnerability over the medium and long term.
This Summary Report is based in part on two separately available DOE contractor reports: Insular Area Energy Vulnerability: Puerto Rico and the U.S. Virgin Islands, prepared by Mathtech, Inc., (Princeton, NJ) with assistance from EnSys Energy & Systems, Inc. and consultants; and Energy Vulnerability Assessment of the U.S. Pacific Islands, prepared by the East-West Center (Honolulu, HI). The views expressed in the contractor reports do not necessarily represent the views of DOE.
Section 1: Introduction 3

U.S. Department of Energy Insular Area Energy Vulnerability Study
2 CARIBBEAN: ENERGY/ECONOMY PROFILES
This section of the report reviews the Caribbean petroleum market and then describes key characteristics of the economies and energy sectors of Puerto Rico and the U.S. Virgin Islands.
2.1 Qvgn3ew_of^aribbeanJfetrfileHm Market
2.1.1 Market Geographical Scope
Puerto Rico and the U.S. Virgin Islands are components in a 65 million barrel per day (bpd) global petroleum market. They are most affected, however, by their Caribbean regional market which consumes over 12 million bpd. From a petroleum industry perspective, the Caribbean market includes the regions interconnected by the Caribbean itself, the Atlantic and, via the Panama Canal, the Eastern Pacific Ocean, namely:
• the central Caribbean islands including Puerto Rico and the U.S. Virgin Islands,
• the southern Caribbean islands of Trinidad and the Netherlands Antilles,
• South America, notably the northern producing nations of Venezuela,Colombia and Ecuador and, more peripherally, Brazil, Argentina and Peru,
• Panama and the other Central American countries,• Mexico,• the Gulf Coast region of the USA (PADD IIP),• the East Coast region of the USA (PADD I),• West Africa, notably Nigeria, Angola, Gabon and other oil producing
nations.
Puerto Rico and the U.S. Virgin Islands occupy a central location within this "Greater Caribbean" market region and are situated "short haul" distance from key points:
• less than 500 nautical miles from Venezuela, Trinidad and the Netherlands Antilles,
• 1000 miles from Colombia,• 1500 miles from the U.S. East Coast and from Ecuador (via Panama),• 1800 miles from Mexico and the U.S. Gulf Coast.
West African ports are 4,500 nautical miles away, still not a great distance in comparison to the 6,000 to 11,000 mile voyages common for deliveries from the Persian Gulf to major markets.Steaming times from Venezuela, Netherlands Antilles and Trinidad are 2 to 3 days. From other ports in the region, they are generally less than 7 days for tanker movements, 11 days for barges.
Petroleum Administration for Defense District.
Section 2: Caribbean: Energy/Economy Profiles 4

U.S. Department of Energy Insular Area Energy Vulnerability Study
2.1.2 Regional Petroleum Trade Flows, Production and Demand
Puerto Rico and the U.S.V.I. sit astride major crude and products trade flows within and through the Caribbean region. These include:
• crude oil movements into the U.S. Gulf and East coasts and into Caribbean island refineries and transhipment terminals;
• products movements from Venezuela, Netherlands Antilles, Mexico, Bahamas and other regional export refining and trans-shipment locations into the U.S. East and Gulf Coasts; also lesser movements from the U.S. Gulf Coast to Mexico, the Caribbean and Central America.
This situation affords Puerto Rico and the U.S.V.I. a wide range of choice in terms of selection of crude and non-crude feedstocks, intermediate and finished product supplies, many of which are obtainable at short notice by virtue of proximity to the sources.
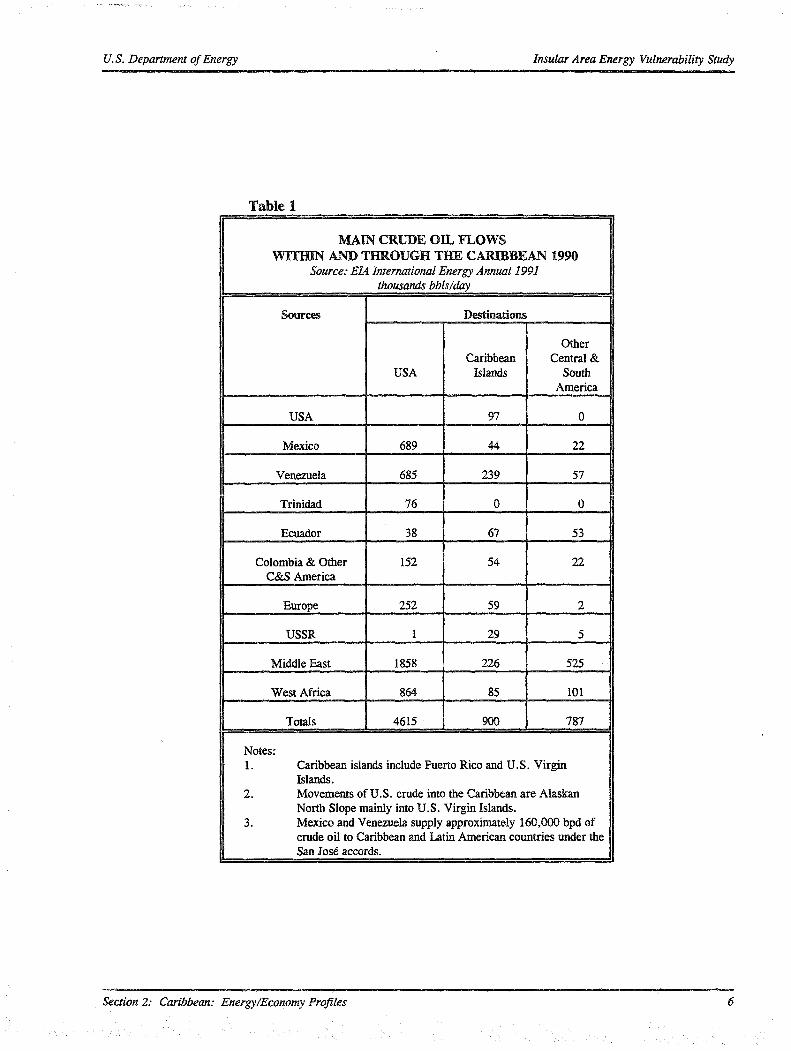
As shown in Table 1, the Caribbean islands are supplied with crude primarily from Venezuela and other regional producers, but with substantial volumes from the Middle East and West Africa. (Much of the Middle East and West African crude goes into the Hess Virgin Islands refinery.) Alaskan crude oil has traditionally flowed into the U.S. Virgin Islands and Puerto Rico at a total rate of 100,000-120,000 bpd. This is likely to decline or cease, however, as Alaskan production declines.The main crude oil flows into Central and South America come from the major local producers. The exception is Brazil's large intake of Middle Eastern crude. Total daily crude oil flow in and through the Caribbean market is approximately 6 million bbls. By comparison, non-refinery petroleum product consumption in Puerto Rico/U.S. Virgin Islands equates to less than 3%/0.2% of this crude flow.
Petroleum product flows through the region are also substantial, totalling around 3 million bpd. Of this, 1.1 million bpd is trade between the U.S. A. and other countries in the region. The major flows are of imports into the U.S.A., principally from Venezuela, the U.S. Virgin Islands and Mexico.
Venezuela and Mexico dominate regional trade with the U.S.A., exporting over 1.8 million bpd of crude and products. Colombia, Ecuador, Trinidad and the U.S. Virgin Islands are the other main suppliers to the U.S.A., exporting over 0.5 million bpd of crude and products. The U.S.A. exports over 200,000 bpd of products to the region, primarily from Gulf Coast refineries.
Total production of crude oil and natural gas liquids in the Caribbean market (including U.S. PADD's III and I) is 10.5 million bpd (1991). The major producers are U.S. PADD III (3.35 mm bpd), Mexico (3.125 mm bpd), Venezuela (2.5 mm bpd), Colombia (0.4 mm bpd), Ecuador (0.3 mm bpd) and Trinidad (0.15 mm bpd). Total production from Argentina and Brazil exceeds 1 million bpd but these countries take little part in international markets.
Total refined products demand in the Caribbean energy market, as defined earlier, exceeds 12 million bpd. Puerto Rico/U.S. Virgin Islands non-refinery demand (167,000 bpd/9,000 bpd) thus comprises a very small proportion (1.4%/ 0.1%) of this total.
Section 2: Caribbean: Energy/Economy Profiles 5
U.S. Department of Energy Insular Area Energy Vulnerability Study
Table 1
MAIN CRUDE OIL FLOWSWITHIN AND THROUGH THE CARIBBEAN 1990
Source: EIA International Energy Annual 1991 thousands bbls/day
Sources Destinations
USACaribbean
Islands
Other Central &
South America
USA 97 0
Mexico 689 44 22
Venezuela 685 239 57
Trinidad 76 0 0
Ecuador 38 67 53
Colombia & Other C&S America
152 54 22
Europe 252 59 2
USSR 1 29 5
Middle East 1858 226 525
West Africa 864 85 101
Totals 4615 900 787
Notes:1. Caribbean islands include Puerto Rico and U.S. Virgin
Islands.2. Movements of U.S. crude into the Caribbean are Alaskan
North Slope mainly into U.S. Virgin Islands.3. Mexico and Venezuela supply approximately 160,000 bpd of
crude oil to Caribbean and Latin American countries under the San Jose accords.
Section 2: Caribbean: Energy/Economy Profiles 6

U.S. Department of Energy Insular Area Energy Vulnerability Study
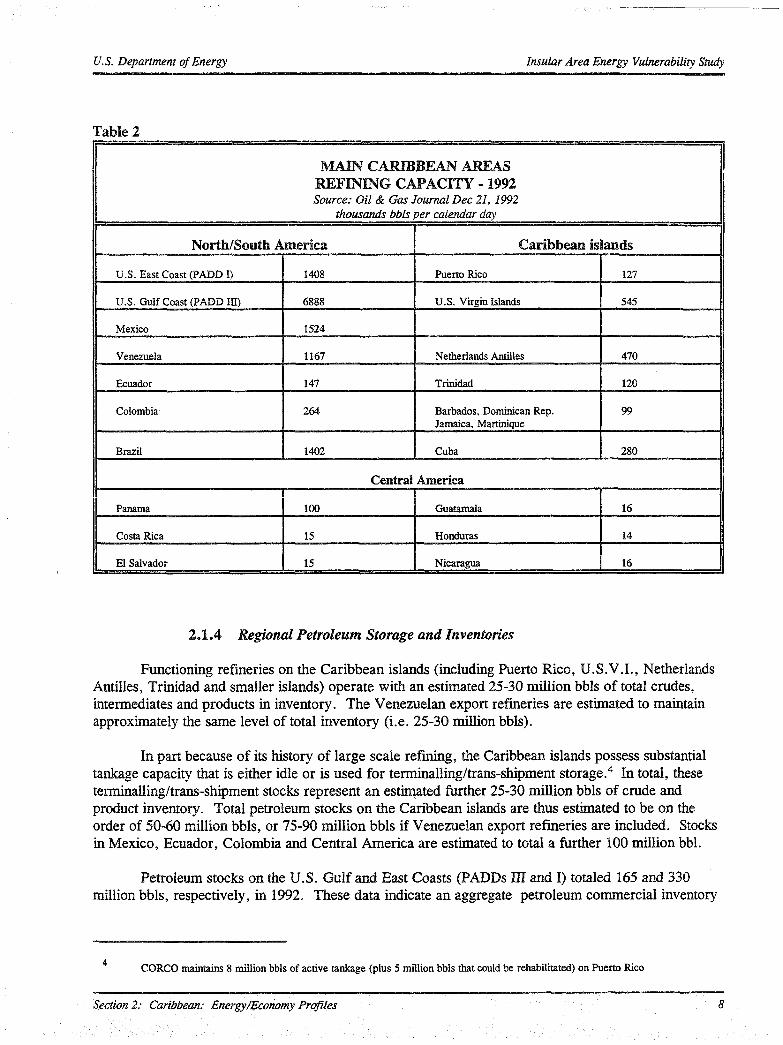
2.1.3 Regional Refining Capacities
Total Caribbean market refining capacity exceeds 14.5 million bpd. Of this, approximately 2 million bpd is geared to exports, providing significant opportunity to compete with local Puerto Rico/U.S. Virgin Islands refineries for their local demand but, also, substantial regional options for supply of refined product.
The distribution of refining capacity in the Caribbean energy market reflects the diverse nature of the countries making up the region, from small developing nations to oil producing exporters to major importers (U.S. East and Gulf Coasts). In terms of size and upgrading complexity, U.S. Gulf and East Coast refineries dominate the region, with total capacity of 8.3 million bpd, as shown in Table 2. However, this capacity is overwhelmingly geared to meeting Mainland product demand; product exports total 500,000 bpd, only 6% of nominal refining capacity.
Nonetheless, the sheer scale of this U.S. Mainland refining system means that even small changes that modify export or import patterns could have a significant impact on crude and product volumes being offered into or demanded from the Caribbean market. One such change could be a trend toward increasing exports of conventional gasoline and distillates from the U.S. as a result of the EPA's reformulated fuels regulations. A parallel larger trend is likely to be increased imports into the U.S.A. of reformulated gasoline and distillates as non-U.S. refiners are attracted by the high prices of these premium products and as U.S. refining capacity continues to contract in the face of rising environmental and safety costs.
The Caribbean islands themselves contain a mix of smaller refineries geared primarily to local demand (Barbados, Dominican Republic, Jamaica, Martinique, Cuba, Puerto Rico) and of large refineries that have traditionally served the U.S. as well as local markets (U.S. Virgin Islands, Netherlands Antilles, Trinidad). Most other countries in the region operate refineries geared to local demand. The major exception is Venezuela. Petroleos de Venezuela (PdVsa) owns 4 major refineries, with a combined capacity of 1.167 million bpcd, which in 1990 exported 639,000 bpd of products (over half to the U.S. A.). PdVsa also leases the 320,000 bpd Refineria Isla refinery on Curasao, but would appear to be running this at around 200,000 bpd. PdVsa, in addition, owns 480,000 bpd of U.S. refining capacity, placing it tenth among U.S. refiners. The U.S. facilities provide consistent outlets for Venezuela's heavier crude oils. These are not always saleable in the open market since they require specialized processing.
Section 2: Caribbean: Energy/Economy Profiles 7
U.S. Department of Energy Insular Area Energy Vulnerability Study
Table 2
MAIN CARIBBEAN AREASREFINING CAPACITY -1992Source: Oil & Gas Journal Dec 21, 1992
thousands bbls per calendar day
North/South America Caribbean is ands
U.S. East Coast (PADD I) 1408 Puerto Rico 127
U.S. Gulf Coast (PADD ID) 6888 U.S. Virgin Islands 545
Mexico 1524
Venezuela 1167 Netherlands Antilles 470
Ecuador 147 Trinidad 120
Colombia 264 Barbados, Dominican Rep.Jamaica, Martinique
99
Brazil 1402 Cuba 280
Central America
Panama 100 Guatemala 16
Costa Rica 15 Honduras 14
El Salvador 15 Nicaragua 16
2.1.4 Regional Petroleum Storage and Inventories
Functioning refineries on the Caribbean islands (including Puerto Rico, U.S.V.I., Netherlands Antilles, Trinidad and smaller islands) operate with an estimated 25-30 million bbls of total crudes, intermediates and products in inventory. The Venezuelan export refineries are estimated to maintain approximately the same level of total inventory (i.e. 25-30 million bbls).
In part because of its history of large scale refining, the Caribbean islands possess substantial tankage capacity that is either idle or is used for terminalling/trans-shipment storage.4 In total, these terminalling/trans-shipment stocks represent an estimated further 25-30 million bbls of crude and product inventory. Total petroleum stocks on the Caribbean islands are thus estimated to be on the order of 50-60 million bbls, or 75-90 million bbls if Venezuelan export refineries are included. Stocks in Mexico, Ecuador, Colombia and Central America are estimated to total a further 100 million bbl.
Petroleum stocks on the U.S. Gulf and East Coasts (PADDs III and I) totaled 165 and 330 million bbls, respectively, in 1992. These data indicate an aggregate petroleum commercial inventory
CORCO maintains 8 million bbls of active tankage (plus 5 million bbls that could be rehabilitated) on Puerto Rico
Section 2: Caribbean: Energy/Economy Profiles 8

U.S. Department of Energy Insular Area Energy Vulnerability Study
within the Caribbean Basin market5 of at least 650-700 million bbls. This figure nearly doubles if the U.S. SPR is included.
The commercial stocks are, however, under private control; they are "operational" or exist primarily to exploit market opportunities or to meet contractual demands. The degree to which they could be made available during an emergency is, therefore, open to question barring any pre-negotiated contingency supply arrangements.
2.1.5 Regional Developments
The Greater Caribbean region is one of the most active areas in the world today in terms of petroleum developments. These center on:
• increasing privatization,• growing exploration and production,• refinery upgrading,• improving export potential for crude and clean products,• compliance with new environmental standards,
and will shape the future of production, refining and trade in the region.
It is estimated that Latin American economies may have to spend $98-180 billion by 2000 to keep their total reserves/production ratio at its current level; also that Latin America and the Caribbean will seek external capital totalling $40-50 billion in the next five years. Depending on the rate of economic growth the region sustains, petroleum demand growth may out-strip growth in supply, reducing the volumes of crude oil available for export.
Venezuela, Colombia, Ecuador, Mexico and other regional producers all have active E&P programs geared to maintaining and expanding crude output. In Venezuela and Ecuador, the trend is toward increased heavy crude production. In Venezuela, this includes production of Orimulsion, a heavy crude/water mix suitable for use as a heavy fuel oil. Colombia recently announced a major find of light crude oil (the Cusiana field).
In the refining sector, the region is undergoing a steady resurgence in its role as an offshore refining center for the U.S.A. In the 1960's and 1970's, the emphasis was on producing residual fuel. Today, it is on upgrading residual fuel, notably from heavy crude oils, into clean and "reformulated" light products geared to the U.S. market. Again, PdVsa is playing a lead role. Other major refinery additions include the 75,000 bpd cat cracker project at Hess U.S. Virgin Islands. This project will substantially raise the refinery's output of light products including reformulated gasoline.
The Caribbean energy market is characterized by a mix of private and national oil companies involved in all stages of the petroleum industry. The two leading players are both integrated national oil companies, namely Petroleos Mexicanos (PEMEX) and Petroleos de Venezuela (PdVsa). From limited beginnings, both corporations have emerged to join the ranks of the world's largest oil companies. 1992 gross revenues for each company were close to $21 billion.
Including the Caribbean Islands, Venezuelan export refineries, U.S. East and Gulf Coasts, Mexico, Colombia, Ecuador, Central America, but omitting West Africa.
Section 2: Caribbean: Energy/Economy Profiles 9

U.S. Depanmem of Energy Insular Area Energy Vulnerability Study
PEMEX is the world's sixth-largest producer of oil. Approximately half of crude oil output is consumed domestically, the other half exported. The company is Mexico's largest exporter, accounting for $8 billion/year in export earnings in recent years. Stated goals under a recent corporate re-structuring include increasing petroleum exports and improving product quality. In terms of refining and marketing, PEMEX's primary focus continues to be on satisfying domestic demand for finished products.
PdVsa has developed into a major, integrated oil company with substantial oil and gas reserves and international as well as domestic refining, storage, transport and marketing activities. Traditionally operating as a monopoly, PdVsa has acknowledged that foreign investment will be needed for it to reach its goal of raising crude production capacity to 4 million bpd by 2000. Under a new ten-year business development plan, PdVsa is targeting new growth markets in Asia and Latin America in order to place the 3.1 million bpd of crude and products it expects to export by 2003. Total investment to implement this plan is estimated by PdVsa at $47 billion.
In August 1993, Venezuela's Congress also approved the $5.6 billion Cristobel Colon LNG project. Exports are expected to begin in 1999 and could reach 6 million metric tons per year, with the U.S. Northeast and Europe targeted as the primary markets. The Puerto Rico/U.S. Virgin Islands area will thus be along the route for export shipments and a short distance from the export facility.
A relative unknown in the Caribbean energy picture is Cuba. The then Soviet Union curtailed supplies to Cuba in the late 1980's after decades of providing crude oil, part of which the Cuban government re-sold to gain hard currency. The loss of Soviet Union oil supplies has since spurred initiatives in Cuba (which consumes 230,000 bpd of oil) to attract E&P investment and expand its refining activity.
Overall, the numerous actual and potential developments in the Caribbean energy market present a changing environment for Puerto Rico/U.S. Virgin Islands energy and emergency planning. They represent both challenges and opportunities, from shifts in future regional crude supplies and competition from export refineries to the potential for processing deals to cover regional refining shortages. Future energy planning within Puerto Rico/U.S. Virgin Islands needs to track and be set in the context of these regional developments.
2.2 PuerteJUco
2.2.1 Overview
Puerto Rico is located in the Caribbean Sea approximately 1000 miles east-southeast of Miami, Florida and less than 500 miles east-northeast of Venezuela. The island is approximately 100 miles long and 35 miles wide. Many of the island's 3.5 million people are concentrated in the San Juan metropolitan area which is located on the northeastern coast of the island. Other large population concentrations are on the south and west coasts, leaving a lightly developed, mountainous interior where elevations exceed 4000 feet.
The relationship between Puerto Rico and the United States is in the nature of a compact which was established over a two year period in the early 1950s, following a long period of territorial status commencing in 1898 when Spain relinquished sovereignty over Puerto Rico to the United States.Under the terms of the compact and other federal statutes, citizens of Puerto Rico are also citizens of
Section 2: Caribbean: Energy/Economy Profiles 10

U.S. Department of Energy Insular Area Energy Vulnerability Study
the United States. However, they do not vote for President, are not represented in the U.S. Senate, but are represented in the House of Representatives by a non-voting Resident Commissioner. The currency of Puerto Rico is the U.S. dollar, the official language is Spanish (although English is widely taught and spoken as a second language), and Puerto Rico citizens are exempt from Federal taxes on income earned in Puerto Rico, except Social Security taxes. On November 14, 1993 the citizens of Puerto Rico voted to retain their commonwealth status, narrowly defeating a bid for statehood.
Under its constitution, the Commonwealth of Puerto Rico has executive, legislative and judicial branches of government. Both the Governor and members of the bicameral legislature are popularly elected to four-year terms. The government has powers similar to those of U.S. state governments and additionally has responsibility for local police and fire protection, education, public health and welfare programs and economic development.
Table 3 compares Puerto Rico and the U.S. on several demographic and economic indicators. The 1990 population of Puerto Rico was 3,522,037 which is larger than 26 of the 50 states. In addition, the population density is higher than all 50 states except New Jersey. The rate of population growth has fallen over the past two decades, mirroring the pattern in the Mainland U.S. As shown in the table, the population of Puerto Rico grew by 17.9 percent between 1970 and 1980. From 1980 to 1990 population growth was 10.4 percent.
Puerto Rico Economic/Demographic Situation
Indicator Puerto Rico U.S. Mainland
Population, 1990 (1,000s) 3,528 P.R. > 26 states
per square mile, 1990 1,028 P.R. > 49 states
% change, 1980-1990 10.4% 9.8%
% change, 1970-1980 17.9% 11.4%
. ■ - . - .
Real GDP per capita, annual % change 1980-90 2.9% 1.6%
Personal income per capita, 1992 $6,360 $19,805
Unemployment rate, 1992 16.5% 1.47r
% Aged > 25 with high school diploma, 1990 49.7% 75.2%
% with bachelor's degree or higher 14.3% 20.3%
% Exports to U.S., 1992 87.5% N/A
% Imports from U.S., 1992 67.7% N/A
Section 2: Caribbean: Energy/Economy Profiles 11

U.S. Department of Energy Insular Area Energy Vulnerability Study
Over the past two decades, the Puerto Rico economy has grown faster than the U.S. economy, aided in part by tax incentives and other development initiatives provided by the U.S. and Puerto Rico governments. The manufacturing sector, led by the chemical/pharmaceutical industries, has been the major engine of growth. Companies have been attracted to Puerto Rico in part by a provision in the U.S. Internal Revenue Code. Section 936 of the Code allows U.S. corporations that meet certain requirements to reduce their U.S. corporate income tax by the amount of tax attributable to income derived within Puerto Rico.6 This tax benefit has had a substantial positive impact on the Puerto Rico economy, as documented in a recent study by the Puerto Rico Planning Board. Nonetheless, unemployment remains stubbornly high, and Puerto Rico's per capita personal income is well below the lowest of the 50 U.S. states. The lower incomes constrain the rate at which the Commonwealth can promote economic development and improve public infrastructure.
Puerto Rico's economy is highly integrated with the U.S. economy. In 1992, 87.5 percent of Puerto Rico’s exports went to the U.S., and 67.7 percent of its imports originated in the U.S. Thus, fluctuations in the Mainland economy are felt quickly in Puerto Rico.
Trade between the Mainland and Puerto Rico is considered domestic commerce and is therefore subject to the requirements of Section 27 of the Merchant Marine Act of 1920, commonly known as the Jones Act. Under the Jones Act, all shipments between domestic ports must be carried by ships built and registered in the U.S. and owned by U.S. citizens. This requirement would also apply to shipments of petroleum during an emergency unless waived by the Secretary of the Treasury in the interest of national defense.
2.2.2 Energy Profile
Introduction
Puerto Rico’s economy is nearly totally dependent on petroleum. All crude oil and some refined petroleum products are imported. The importing, refining, and marketing of petroleum in Puerto Rico is accomplished by private companies, including subsidiaries or affiliates of multinational oil companies. The Puerto Rico Electric Power Authority purchases fuel from local refineries and also imports fuel directly.
Virtually all electric power in Puerto Rico is generated and sold by the Puerto Rico Electric Power Authority (PREPA), which is a public corporation and instrumentality of the Government. PREPA is among the largest municipal electric utilities in the United States.
Aside from small amounts of hydroelectric power, coal, solar energy and bagasse (cane waste), no sources of energy other than petroleum are currently used in Puerto Rico. Coal, liquefied natural gas, and other energy sources are under active consideration for electric power generation but have not been adopted to date.
Petroleum Demand, Supply, Sources
Puerto Rico petroleum demand has fluctuated over the last ten years but has shown a steady increase since 1990. In 1992, total island demand for petroleum products was 176,000 barrels per day
Legislation recentiy enacted by the U.S. government included a phased reduction of Section 936 tax benefits beginning in 1994.
Section 2: Caribbean: Energy/Economy Profiles 12
U.S. Department of Energy Insular Area Energy Vulnerability Study
(bpd). Of this, approximately 9,000 bpd constituted fuels consumed internally by the island's petroleum refineries.
Non-refinery demand of 167,000 bpd is dominated by two products - gasoline and residual fuel. This is illustrated in Figure 1. Motor gasoline consumption of 53,200 bpd in 1992 (32% of total non-refinery demand) reflects Puerto Rico's high dependence on the automobile for personal transportation. Residual fuel consumption, 61,600 bpd (37%) outside refineries in 1992, comprises principally fuel burned by PREPA. Distillates are the other principal component (25%) of island economy demand, comprising diesel/No.2 consumed mainly by PREPA, and jet fuel, whose consumption has grown in line with traffic expansion at San Juan's Luis Munoz Marin International Airport.
Wholesale gasoline sales are subject to price regulations administered by Puerto Rico's Department of Consumer Affairs (DOCA)7. The regulations limit the wholesale gross margins to specific amounts which are adjusted quarterly. Controls on wholesale margins apply only to products refined in Puerto Rico; wholesale margins on imported products are uncontrolled. Puerto Rico has a standby petroleum allocation program (Regulation 660) that was put into place more than a decade ago. It would not be used during an emergency except under extreme conditions.
The Department of Consumer Affairs rescinded controls on retail margins during 1993.
Section 2: Caribbean: Energy/Economy Profiles 13

U.S. Department of Energy Insular Area Energy Vulnerability Study
Puerto Rico Petroleum Demand -1992(excluding consumption by refineries)
Gasoline 32.5%
Figure 1
Section 2: Caribbean: Energy/Economy Profiles 14

U.S. Department of Energy Insular Area Energy Vulnerability Study
Since 1988, production from Puerto Rico's refineries has ranged between 100,000 and 220,000 bpd, depending on which refineries have been operating. In 1992, production was 143,700 bpd, including 20,000 bpd of petrochemicals and 8,600 bpd of lubricating oils, essentially all of which were exported. As shown in Table 4, island refineries supplied 63 percent of non-refinery product demand. The largest import dependencies were for residual and diesel fuels supplied to PREPA.
Table 4
Puerto Rico Petroleum Demand, Production and Import Dependency - 1992
KeyFuels Products
Non Refinery Demand (bpd)
Island Refinery Production (bpd)
Net Product Imports (bpd)
Product Import Dependency (% )
LPG 5,000 2,100 2,900 58%
Gasoline(motor & aviation)
54,200 45,300 8,900 16%
Jet/kero 14,100 11,300 2,800 20%
Diesel/No2 26,900 14,000 12,900 48%
Residual Fuel 61,600 32,900 33,600 55%
Other* 4,900
Total** 166,700 105,600 61,100 36.6%
* includes refinery gas, lubes & waxes, solvents/misc., and asphalt.** refinery demand is an additional 9600 bpd gas, coke, resid
As shown in Table 5, about 80 percent of Puerto Rico’s refinery feedstock and product imports comes from regional suppliers. Highest reliance is on Venezuela which provides nearly half of Puerto Rico's total petroleum imports.
Section 2: Caribbean: Energy/Economy Profiles 15

U.S. Department of Energy Insular Area Energy Vulnerability Study
Table 5
Puerto Rico Petroleum Imports (gross) - 1992
COUNTRY OF ORIGIN CRUDE OIL MBPD
NON-CRUDEMBPD
PRODUCTMBPD
TOTALMBPD
TOTAL%
VENEZUELA/NETH ANTILLES
31.5 29.6 36.6 97.6 46.5%
COLOMBIA 25.3 12.3 37.5 17.9%
ECUADOR 11.8 1.2 12.9 6.2%
MEXICO 9.6 4.1 13.7 6.5%
SAUDI ARABIA 5.5 5.5 2.6%
INDIA 4.6 4.6 2.2%
UK 4.4 1.1 5.4 2.6%
US Mainland 7.3 7.3 3.5%
USVI 0.5 0.5 0.2%
OTHER 6.0 8.0 11.0 25.0 11.9%
TOTAL 89.6 46.5 73.9 210.0 100%
Note: Data are taken from EIA sources with adjustments. Entries may not add to totals due to rounding.
Petroleum Refining
Under various tax and federal oil import quota incentives, Puerto Rico developed a substantial refining and petrochemicals sector in the 1960's and early 1970's. Changed economic conditions and oil price shocks have since led to a period of instability with refineries closing and re-starting. Investment has been limited. Operating capacity has ranged from 143,000 bpd to 265,000 bpd since 1988. Today, four refineries are operating with a combined capacity of 185,000 bpd. Three of the refineries are located along the island's south coast while the fourth is in metropolitan San Juan on the north.
Puerto Rico's refineries are generally dissimilar to those on the U.S. Mainland:
• they produce a relatively high proportion of non-fuels products (lubricating oils, waxes and petrochemicals) and take in a high proportion of non-crude feedstocks
• they are small, average capacity is roughly half that of Mainland refineries
• they are simple (specialty operations aside), possessing very little upgrading capacity
Section 2: Caribbean: Energy/Economy Profiles 16

U.S. Department of Energy Insular Area Energy Vulnerability Study
Petroleum Storage and Distribution
Because of its history of extensive refining and petrochemicals activity, Puerto Rico possesses a substantial amount of tankage, nearly 30 million bbls, of which 24 million is in service and 6 million would need repair before it could be put back into service. Over 80 percent of this tankage is located at refinery and PREPA sites along the south coast of the island. Consistent with the decline in island processing activity, the tankage is under-utilized. Current island inventories of petroleum are estimated at 10 million bbls.
Distribution of products around the island is primarily by barge and truck with one short pipeline delivering jet fuel to San Juan airport. Transportation of crude oil and petroleum products between Puerto Rico and the U.S. is subject to Jones Act provisions requiring the use of U.S. built and registered tankers.
Electric Power
PREPA produces and sells virtually all of Puerto Rico's electricity, and it supplies all of the power used by the island's refineries. In the fiscal year ending June 30, 1992 PREPA had 1.2 million customers, sold 13.6 billion kilowatt hours (kWh) of electricity, and had a system peak demand of 2,437 megawatts (MW). Table 6 provides some summary statistics regarding PREPA.
Table 6PREPA Electric Power Statistics
Statistic/Fiscal Year FY 1992 FY 1997 Annual Growth
Dependable Capacity, MW 4,219 5,231 4.30%
Peak Demand, MW 2,463 2,903 3.29%
Capacity Margin 42.2% 45 9%
Load Factor: Puerto Rico 75%
Florida 55%
Electric Demand, millions of kWh 13,615 1S.0/S 3.33%. ..
■■
Average Revenue/kWh: Puerto Rico 8.98C 10.59'-
U S Main! inn 6.79c
| I
Petroleum used, millions of bbls27.3 | 32.5 3.49%
Over all customer classes combined, average revenue per kWh in Puerto Rico in fiscal year 1992 was 8.98 cents compared to 6.79 cents in the U.S. Direct and indirect subsidies lower the cost of electricity for residential customers while raising it for commercial and industrial customers. The
Section 2: Caribbean: Energy/Economy Profiles 17

U.S. Department of Energy Insular Area Energy Vulnerability Study
relatively high cost of electricity in Puerto Rico is viewed as a hindrance to industrial development because it makes Puerto Rico less able to compete for new manufacturing jobs compared to many areas of the U S. Mainland.
PREPA's generating facilities are 98 percent oil fired and have a total dependable capacity of 4,219 MW. There are four major power plant sites, two of which are located in the metropolitan area of San Juan, and two others, on the south coast, which are 32 and 48 miles, respectively, outside of San Juan. Smaller power plants are located at several sites around the island. Eighteen steam-electric generators contribute three-fourths (3,080 MW) of the generating capacity and oil-fired combustion turbines contribute nearly one-fourth (1,037 MW). The balance (102 MW) is provided by small hydro units and diesel plants. The major steam-electric plants bum No. 6 residual fuel oil, and the combined- cycle units and the smaller gas turbines bum No. 2 distillate fuel oil. The combined-cycle units are being converted to bum No. 6 fuel oil, which is less expensive, and three of the eight had been converted as of mid-1992 but were still burning No. 2 fuel oil at that time.
As of June 1992, PREPA was obtaining approximately 53 percent of its fuel oil under renewable one year contracts. A second major source was a two year contract with Venezuela which provides PREPA with up to 30 percent of its fuel oil requirements. The balance of fuel oil supplies were obtained from contracts of less than one year in duration and spot market purchases.
Fuel oil refined off the island is shipped to Puerto Rico by ocean-going tankers and barges and off-loaded at docks close to the power plants. Further distribution, and shipments from local refineries, is done by barge, pipeline or truck.
PREPA owns storage facilities at its power plants and elsewhere with a total capacity of 2.8 million barrels. PREPA also has a five year contract effective Febmary 1993 to lease storage facilities at the now closed Commonwealth Oil Refining Corporation (CORCO) refinery on the south coast of Puerto Rico. PREPA customarily maintains a 25 day supply of fuel oil in storage facilities at the power plants and elsewhere. In fiscal year 1992, PREPA used an average of 74,800 bpd of fuel oil. Thus, a 25 day supply would be just under 1.9 million barrels, or well within the available storage capacity. PREPA states that it has never had to curtail service to customers due to a shortage of fuel.
Section 2: Caribbean: Energy/Economy Profiles 18

U.S. Department of Energy Insular Area Energy Vulnerability Study
2.3 U.S. Virgin Islands
2.3.1 Overview
The United States Virgin Islands are located in the Caribbean Sea approximately 1100 miles east-southeast of Miami, Florida and less than 500 miles east-northeast of Venezuela. Puerto Rico lies about 50 miles to the west. The largest of the U.S. Virgin Islands is St. Croix at 84 square miles. The next largest is St. Thomas (32 square miles), followed by St. John (28 square miles). Most of the other 65 islands are uninhabited.
The U.S. Virgin Islands were acquired by the United States from Denmark in 1917 and since 1954 have been an unincorporated territory of the United States. Under U.S. law, citizens of the U.S. Virgin Islands are also citizens of the United States. However, they do not vote for President, are not represented in the U.S. Senate, but are represented in the House of Representatives by a delegate who does not vote. The currency of the U.S. Virgin Islands is the U.S. dollar, and the official language is English. Virgin Island citizens are exempt from Federal taxes on income earned in the U.S. Virgin Islands, except Social Security taxes.
Under its constitution, the U.S. Virgin Islands has executive, legislative and judicial branches of government. The Governor is elected for a four-year term and the fifteen members of the unicameral legislature are elected to two-year terms. The government has powers similar to those of U.S. state governments and additionally has responsibility' for local police and fire protection, education, public health and welfare programs and economic development.
Table 7 compares the U.S. Virgin Islands and the U.S. on several demographic and economic indicators. The 1990 population of the U.S. Virgin Islands was 101,809 which is smaller than any of the 50 states. However, the U.S. Virgin Islands has a population density that exceeds all but three states. Total population increased by less than 1 percent between 1980 and 1990 compared to a 9.8 percent growth rate for the U.S. The U.S. Virgin Islands grew more rapidly in the 1970's (28.5%). This rapid rate of growth was a difficult burden for the public and private providers of housing, water, electric power and other services.
Over the past two decades, the U.S. Virgin Islands economy grew faster than the U.S. economy, aided in part by tax incentives and other development initiatives provided by the U.S. and Virgin Islands governments. The tourism sector has been the major source of growth. Hurricane Hugo caused major devastation to the U.S. Virgin Islands, particularly St. Croix, in September 1989, and the physical destruction is still visible in some areas. Nonetheless, unemployment in recent years has been quite low, by U.S. Mainland standards, largely due to out-migration. Per capita personal income in the U.S. Virgin Islands is 63 percent of the U.S. average, which is' lower than any of the 50 states but highest among the U.S. territories. The lower incomes constrain the U.S. Virgin Islands' efforts to enhance local public services and infrastructure.
Section 2: Caribbean: Energy/Economy Profiles 19

U.S. Department of Energy Insular Area Energy Vulnerability Study
Table 7
U.S.V.I. Economic/Demographic Situation
Indicator U.S.V.I. U.S. Mainland
Population, 1990 (1,000's) 101.8 V.I. < 50 states
per square mile, 1990 761 V.I. > 47 states
% change, 1980-1990 5.4% 9.8%
S chanac. 1970-1980 28.5% 11.4%
1Real GTP per capita, annual % change 1980-89 1.8% 1.6%
Personal income per capita, 1989 $11,052 $17,738
Unemployment rate, 1992 3.6% 7.4%
'c Aged > 25 with .> 12 years of school. 1980 50.1% 66.5%
% Exports to U.S., 1992 86.1% N/A
% Imports from U.S., 1992 56.7% N/A
The U.S. Virgin Islands's economy is highly integrated with the U.S. economy. In 1992,86.1 percent of the U.S. Virgin Islands's exports went to the U.S., and 56.7 percent of its imports originated in the U.S. Thus, fluctuations in the Mainland economy are felt quickly in U.S. Virgin Islands. Refined petroleum products (from the Hess Oil Virgin Islands Corporation refinery) dominate exports and comprised 77.0 percent of total U.S. Virgin Islands exports in 1992.
2.3.2 Energy Profile
Introduction
The U.S. Virgin Islands's economy is nearly totally dependent on petroleum, and all crude oil and some refined petroleum products are imported. Hess Oil operates a 545,000 barrel per day refinery on St. Croix which provides some products locally and exports the remainder. Other private companies, principally subsidiaries or affiliates of multinational oil companies, are involved in importing and marketing petroleum products in the U.S. Virgin Islands. Aside from some coal used by the Virgin Islands Alumina Company (VIALCO), and a limited but growing use of solar energy, no other sources of energy are currently used. Other energy sources are under active consideration but have not been adopted to date.
Virgin Islands Water and Power Authority (WAPA) is the only electric utility in the U.S. Virgin Islands. It supplies most of the electric power and 65 percent of the potable water for the islands, except for certain industrial facilities that generate some or all of their own power.
Section 2: Caribbean: Energy/Economy Profiles 20

U.S. Department of Energy Insular Area Energy Vulnerability Study
Petroleum Demand and Supply
Total U.S, Virgin Islands demand for petroleum in 1992 is estimated at 36,000 bpd. However, as shown in Table 8, about 75 percent of this consumption is fuel used by the Hess refinery and only 25 percent (9,000 bpd) is island economy demand. Residual and distillate fuels used for power generation (4,500 bpd) comprise half of the island economy's demand. The balance is principally gasoline and jet fuel for island transportation and air traffic, respectively. The shares of each fuel type used by the island economy are shown in Figure 2.
Table 8
Estimated U.S.V.I. 1992 Total Petroleum Demand (1,000's bpd)
Product Refinery Island Economy Total
Fuel Bunkers WAPA Otheri
LPG 4.7 0.4 5.1
Gasoline i.9 1.9
Aviation Fuel & Kerosene 1.5 1.5
Distillate 2 0 1.6 0.5 4.1
Residual U’.i 1.0 2.9 16.0
Lubes 0 1 0.1
Refinery Gas 7.2 7.2
Total 24.0 3.0 4.5 4.4 35.9
1. Data taken from several sources including: HLA, EEMIS, Economic Research Associates reports.2. Discrepancies exist between these sources, e.g. 1991 EIA International Energy Annual indicates total U.S.V.I. demand at 55,000 bpd.
Although the U.S. Virgin Islands government does not allow Hess to participate in retail operations on the islands, the bulk of island supplies come from the Hess St. Croix refinery. Hess supplies 100 percent of WAPA's needs, 100 percent of most other fuels and 80-85 percent of island gasoline, the balance being imported from Puerto Rico.
Section 2: Caribbean: Energy/Economy Profiles 21

U.S. Department of Energy Insular Area Energy Vulnerability Study
U.S.V.I. Petroleum Demand -1992Economy Demand
Figure 2
Petroleum Refining
The Hess St. Croix refinery has a rated capacity of 545,000 bpd, making it one of the largest in the Western Hemisphere. Recent throughputs have been in the range of 350,000-400,000 bpd. Much of Hess St. Croix output of finished and intermediate products is supplied into Hess' Mainland refining and marketing system. A current $1 billion project to install a 90,000 bpd fluid catalytic cracker and ancillary units will raise the refinery's output of gasoline geared to U.S. markets.
The Hess refinery has traditionally run about 100,000 bpd of Alaskan crude. The balance of supplies come from multiple sources, but comprise mainly better quality crudes from the Persian Gulf and West Africa.
Section 2: Caribbean: Energy/Economy Profiles 22

U.S. Department of Energy Insular Area Energy Vulnerability Study
Petroleum Storage and Distribution
Details of Hess' refinery storage capacity are proprietary. It is estimated, however, that total refinery inventories average 12-15 million bbls. Once the cat cracker is on line, these may rise to 15-20 million bbls.
Petroleum product distribution within the U.S. Virgin Islands is entirely by barge inter-island and by truck on-island.
Electric Power
The Virgin Islands Water and Power Authority (WAPA), an instrumentality of the U.S. Virgin Islands government, is the only electric utility serving the islands. A limited number of industrial facilities, including Hess and VIALCO, generate some or all of their electric power requirements, and others have emergency backup generators. Otherwise, WAPA provides all electric power for the territory.
WAPA also supplies 65 percent of the potable water supply for the islands from desalinization plants co-located and jointly operated with the electric generating facilities. The WAPA production system was designed for optimum efficiency when the ratio of electric to water production falls within a certain range. Currently, water demand has reached a sufficiently high level that water production requirements force frequent operation outside that range.
In the fiscal year ending June 30, 1993 WAPA had about 45,000 electric customers, sold 539 million kilowatt hours (kWh) of electricity, and supplied a system peak demand of about 102 megawatts (MW). Some salient statistics on WAPA electric power are shown in Table 9.
Section 2: Caribbean: Energy/Economy Profiles 23

U.S. Department of Energy Insular Area Energy Vulnerability Study
Table 9
WAPA Electric Power Statistics
Statistic/FY F/Y 1992 F/Y 2000 Annual Growth
Dependable Capacity, MW St. Croix 66.7 96.7 4.64%
St. Thomas/St. John 103.7 136.7 3.45%
Peak Demand, MW: St. Croix 37.3 44.9 2.32%
St. Thomas/St. John 63.3 85.9 3.82%
Capacity Margin, MW* St. Croix 44.1% 53.6%
St. Thomas/St. John 39.0% 37.2%
- 5
Electric Demand, million kWh St. Croix 211 278 3.45%
St. Thomas/St. John 328 420 3.09%
Average Revenue/kWh: U.S.V.I. 15.54C
U.S. Mainland 6.79C
Petroleum used, millions of bbls 1.69 2.19 3.24%
*FY 1992 capacity was deemed inadequate when the criterion used was the two largest units out of service
WAPA's generating facilities are 100 percent oil fired and had a total capacity of 170.4 MW at the end of June, 1991. There are two major power plant sites. One site, on St. Thomas, has101.2 MW of capacity that serves St. Thomas, and via underwater cable, St. John and two other islands. St. John also has a 2.5 MW diesel generator for emergency power. The second site, on St. Croix, has 66.7 MW of capacity which serves only St. Croix. Due to the depth and topography of the ocean floor, engineers have determined that it is not feasible to interconnect the St. Thomas and St. Croix systems by underwater electric cable. Therefore, the two islands operate as separate systems. This forces WAPA to use smaller generator sizes and maintain more reserve capacity than with a combined system.
The average revenue per kWh from customers in the U.S. Virgin Islands is higher than the U.S. average, 11.5 cents vs. 6.4 cents (data are for FY 1989 prior to Hurricane Hugo). The higher cost of electricity in the U.S. Virgin Islands is caused by several factors, including: the complete dependence on petroleum fuels due to the current unavailability of lower cost fuels; the need to use small generating units, which are less efficient than larger ones; and the need to maintain extra reserve capacity due to the absence of neighboring electric utilities which could supply electricity in an emergency.
All of the net electric energy generated by WAPA in 1992 was produced by burning oil.The steam-electric plants bum No. 6 residual fuel oil, and the combustion turbines bum No. 2 distillate fuel oil. WAPA annually solicits bids for fuel oil from fuel oil suppliers. As a result of a
Section 2: Caribbean: Energy/Economy Profiles 24

U.S. Department of Energy Insular Area Energy Vulnerability Study
1965 agreement between the government of the U.S. Virgin Islands and Hess Oil Virgin Islands Corporation (an affiliate of Amerada Hess Corporation), WAPA receives fuel oil from Hess at prices below those submitted by other potential fuel oil suppliers. This agreement was last amended in 1990 and expires in 2013. Under the agreement, Hess must annually submit bids containing a maximum price which shall not exceed the lower of: (i) Hess' average landed monthly crude oil cost or (ii) the published Exxon New York Contract Cargo price per barrel, less $2.00.
As part of the above agreement, Hess agrees to maintain sufficient fuel in its storage facilities to ensure that there are adequate supplies to meet local fuel needs of the U.S. Virgin Islands, including WAPA. (WAPA's average fuel oil consumption in fiscal year 1992 was 4,630 barrels per day) In addition, WAPA has storage capacity at its St. Thomas plant for over a month's supply of No. 2 and No. 6 fuel oil. As a general rule, about two week's supply is kept on hand with more storage utilized during the storm season. The fuel oil is delivered to the St. Thomas power plant site by barge from the Hess oil refinery on St. Croix. WAPA has comparable storage facilities at its St. Croix plant which also receives its fuel by barge from the Hess refinery. WAPA has proposed in its budget to add further storage at. both plants.
Section 2: Caribbean: Energy/Economy Profiles 25

U.S. Department of Energy Insular Area Energy Vulnerability Study
3 PACIFIC: ENERGY/ECONOMY PROFILES
This section of the report reviews the Pacific petroleum market and then describes key characteristics of the economies and energy sectors of the U.S. Pacific islands.
3.1 Overview of Pacific Petroljemn.Markpt
3.1.1 Market Geographical Scope
The U.S. Pacific islands are components in a 65 million barrel per day global petroleum market. They are most affected, however, by their Pacific regional market. From a petroleum industry perspective, this market covers huge geographical distances and encompasses:
• the many scattered Pacific islands themselves.• Australia and New Zealand• Phillipines, Malaysia, Indonesia, Singapore and Brunei• Continental East and South Asia, including India, Pakistan, Bangladesh, Korea,
Thailand, Myanmar (Burma), Vietnam, Laos and Cambodia• China and Taiwan• Japan• the Pacific coastal regions of Canada and the U.S.A., including Alaska.• more peripherally Mexico, Colombia and other Pacific-facing nations in Latin
America.
Located centrally within this region, American Samoa, Guam, the Commonwealth of the Northern Mariana Islands, and Palau are very small energy markets located between the world's two largest oil consuming markets. North America and the Asia-Pacific region. North America, including Mexico, consumes 29.7% and the Asia-Pacific region consumes 23.3% of global oil production. By contrast, the four island entities consume 0.04% (26,400 bpd) of the world's total demand for oil. In addition, the Asia-Pacific region has the world's highest growth rate in demand for petroleum products.
The primary supply source for Guam, CNMI and Palau is Singapore and that for American Samoa is Hawaii. Because of the vastness of the region, the U.S. Pacific islands are significantly greater distances from secondary or alternative supply sources, such as may have to be relied on in an emergency.
3.1.2 Regional Petroleum Trade Flows, Production and Demand
The Pacific region, including China but excluding Canada and the U.S.A., produces nearly 7 million barrels per day of crude oil and natural gas liquids. China, Indonesia, Malaysia and Australia are the dominant producers. (Inclusion of Canada and the U.S. West Coast plus Alaska would raise the total to 11.6 million barrels per day.) The region is the center of considerable exploration and development activity. Nevertheless while current production equates to 11 percent of the global total, current proven reserves equate to only 4 percent. Barring major new discoveries, regional production is therefore projected to decline.
Section 3: Pacific: Energy/Economy Profiles 26

U.S. Department of Energy Insular Area Energy Vulnerability Study
Table 10
Asia-Pacific Petroleum Product Balances 1991-2000 (000 b/d)
1991 Production Imports/a Exports/a DemandProduct Import
Dependency
LPG 514 615 52 1,095Gasoline 2,233 249 184 2,298Naphtha 808 432 190 1,014Kero / Jet 1,438 279 310 1,442Diesel 3,592 616 457 3,759Feuel Oil fb 2,795 691 611 2,891Others 598 82 75 600
Total 11,978 2,964 1,879 13,099 22.6%Transp. Fuel 7.263 1.144 952 7.499 15.3%a. Intra-region trade is included.b. Excludes direct burning of crude oil in china and Japan
1995 Production Imports/a Exports/a DemandProductImport
LPG 1,219 491 389 1,321
Dependency
Gasoline 1,068 493 110 1,451Naphtha 2,873 146 191 2,828Kero / Jet 1,775 185 203 1,757Diesel 3,944 1,103 224 4,823Feuel Oil lb 3,377 320 423 3,274Others 499 277 47 648
Total 14,755 3,015 1,587 16,102 18.7%Transo. Fuels 6,786 1.781 536 8.031 22.2%
2000 Production Imports/a Exports/a DemandImiurtImport
LPG 1,358 540 363 1,536
Dependency
Gasoline 1,032 724 78 1,678Naphtha 3,560 153 235 3,477Kero / Jet 2,048 158 182 2,024Diesel 4,819 1,509 263 6,065Feuel Oil fb 3,636 232 513 3,355Others 580 188 53 715
Total 17,033 3,504 1,687 18,850 18.6%Transp. Fuels 7,899 2,391 523 9,767 24.5%
Section 3: Pacific: Energy/Economy Profiles 27

U.S. Department of Energy Insular Area Energy Vulnerability Study
There are no oil producers in the Pacific islands except for Papua New Guinea, which is currently producing 135,000 bpd. However, production is slated to fall sharply to roughly 50,000 bpd by tbft end of the decade.
Regional demand, again including China but excluding the U.S.A. and Canada, is currently close to 15 million barrels per day. Spurred by high economic growth rates, this is projected to exceed 19 million barrels per day by the year 2000. Demand for gasoline and distillates (jet fuel, kerosene and diesel) is expected to grow most rapidly (4-5 percent per annum 1995-2000). The effect of this increasing demand has been the expansion of refining capacity in the Asia-Pacific region. The increasing demand for transport and other light and middle distillates is especially important to the Pacific islands because these are also the major fuels consumed in the islands region. With expanded refinery capacity, these petroleum products should be in sufficient supply to meet demand in the islands.
Even if petroleum demand in the U.S. Pacific islands continues to grow quickly, at around 26,000 bpd today it will still represent only a tiny fraction (0.2 percent) of total regional demand. This implies that the region should be able to accommodate the U.S. Pacific islands' demand under nearly all possible scenarios.
Traditionally, trade flows through the region have been dominated by movements of several million barrels per day of crude oil from the Persian Gulf into Japan and nearby countries such as Korea. Secondary flows have included:
• exports of high quality crude oils from regional producers (notably Malaysia, Indonesia and Australia) into the U.S. West Coast
• exports of Chinese crude to various regions
• movement of Mexican crude to Japan
• limited exports of Alaskan crude oil into the region
• product exports from the Middle East into the region
As Pacific product demand continues to grow and regional production falls, regional imports of both crude and products will grow, principally from the Middle East. Regional exports of crude oils will be curtailed, with the possible exception of movements of premium quality Indonesian/Malaysian crude oils into the U.S. West Coast. Import dependence in the region is expected to grow from 50 percent in 1992 to 64 percent in 2000. However, the Persian Gulf will supply over 90% of the region's imports by the year 2000. Thus, increasing import dependence also means increasing dependence on the Persian Gulf.
Despite the long distances, limited trade of reformulated fuels from Pacific refining centers into the U.S. West may develop, together with some counter-trade of conventional fuels into the Pacific from U.S. West Coast refiners.
Small size and distance from energy sources are the two most prominent parameters which define the energy markets in the Pacific islands. Guam, the Commonwealth of the Northern
Section 3: Pacific: Energy/Economy Profiles 28

U.S. Department of Energy Insular Area Energy Vulnerability Study
Mariana Islands, and Palau are more than 3,000 miles west of Hawaii, itself a very small market (140,000 bpd), while American Samoa is more than 2,000 miles south of Honolulu. As a result, oil supply is expensive and logistically complex.
Figure 3 shows a schematic of crude and product flows through the islands region. Demand for petroleum products is indicated in the Figure, with American Samoa consuming 3,400 bpd,Guam 18,700 bpd, the Commonwealth of the Northern Mariana Islands 3,600 bpd, and Palau consumes 700 bpd. American Samoa is supplied from Hawaii, which receives primarily crude and some products from the U.S. West Coast (Alaska North Slope) and Southeast Asia and Australia. Hawaii has two refineries, including the 95,000 bpd refinery owned by the supplier to American Samoa, BHP.
Supply to the other islands is through Singapore. Guam serves as the trans-shipment point for the Federated States of Micronesia and the Republic of the Marshall Islands, in addition to serving Palau and the Commonwealth of the Northern Mariana Islands. The voyage time between Guam and Saipan is only one day.
Section 3: Pacific: Energy/Economy Profiles 29

Section 3: Pacific: Energy/Economy Profiles
Domestic 570Supply
Asian 150
Middle 123 lEast
Domestic 40Supply
Asian 40 JMiddle 30 1East
Asian 364
Middle 936 -4
Australia843 suppled167 exported0
M<jbaT otal Shell
BP.
Mew Zealand110 supplied 28 exported
South Pacific islands(34.1 Total Demand)Papua New Guinea-11,5“Fiji-4.2French Polynesia- 6.0 New Caledonia- 8.1 Others* 4.3 "Excludes 120 MBD
_ Crude Production
MobiShe!
EastShell
Singapore1,300 suppled 890 exported
B.P.
Mobil, Shel, ExxonBHP/PRI
( cnimS V^3.6 Total Demand/
(Guam \18.7 Total Pernancy-
I Mobilf ^ RMI \l 0.6 T otal Demand I
Mobl
MobilShell
MobilShett
FSM0.9 Total Demand ^
f Pcilau \ |u}.? Total Demand!4
Asia 8s LatinAmerica
277DomesticSupply
2.700
U. S. West Coast3,000 supplied 1,290 exported
Includes Hawaii's 140 supply
BHP/PRI
AmericanSamoa
.3.4 Total Demand
UjO
Figure 3 C
rude and Product Oil Flow in the Pacific Island R
egion, 1991-92('000 Barrels per D
ay)

U.S. Department of Energy Insular Area Energy Vulnerability Study
3.1.3 Regional Refining Capacities
The Pacific region has been and continues to be the focus of rapid growth in refining capacity, particularly in the "Tiger" economies, most notably Singapore and South Korea. In 1991, total regional refinery output was just under 12 million barrels per day. Year 2000 output is projected to be 17 million barrels per day. This will meet most of the growth in regional petroleum demand, and leave the region reliant predominantly on crude oil rather than product from external sources.
No refining capacity exists in the U.S. Pacific islands except for the closed GORCO refinery on Guam. Papua New Guinea is planning to build a 30,000 bpd refinery to meet domestic demand and to supply exports. These could comprise an additional supply source for the U.S. Pacific islands.
3.1.4 Regional Petroleum Inventories
Petroleum inventories in Pacific region refineries are estimated to total of the order of 450 million barrels today. These will increase in line with growing refinery capacity. Additional inventories available at crude export centers, product distribution terminals and at strategic storage sites (such as in Korea and Japan) raise the inventory total to possibly 600 million barrels. Inclusion of Western Canada, the U.S. West Coast and Alaska will raise this figure still further.
Total storage in the U.S. Pacific islands exceeds 6 million barrels as discussed in detail in Section 3.2.2.
3.2 The Pacific Islands
3.2.1 Overview
The U.S. Pacific islands are small scattered islands in the Pacific Ocean with a total population of around 250,000, living in an aggregate land area of approximately 656 square miles. Guam, the Commonwealth of the Northern Mariana Islands (CNMI) and Palau are more than 3,000 miles west of Hawaii and American Samoa is well over 2,000 miles south.
Table 11 shows the key demographic and economic data of these islands. The largest among them is Guam with a land area of 212 square miles and a population of close to 140,000. Palau has almost the same land area as Guam, but with only 15,122 inhabitants. Similarly, the CNMI has a land area slightly smaller than Guam, but its population (43,345) is only one third of Guam's. American Samoa has the least land area, and with 50,900 inhabitants, it has the highest population density among the four islands. Population growth on Guam and Palau has averaged around 1 to 2 percent per year over the past 10 years, with a slightly higher growth rate of 2 to 3 percent for American Samoa. On the other hand, the CNMFs population has increased by over 10 percent per year over the same period.
Section 3: Pacific: Energy/Economy Profiles 31

U.S. Department of Energy Insular Area Energy Vulnerability Study
Table 11
U.S. Pacific IslandsLand, Area, Population, Gross Domestic Product (GDP)
Area Total GDPIsland (square miles) Population ($ Millions)
American Samoa 76 50,900 [1990] $297 [1992]
Guam 212 139,371 [1991] $1,859 [1990]
CNMI 177 43,345 [1990] $1,175 [1990]
Palau 191 15,122 [1990] $50 [1990]
All four islands are scarce in natural resources, have limited industrial bases, and are open economies based largely on trade with Asian countries and the U.S. Mainland, and on tourism. The islands currently import the vast majority of food and all medicine, machinery and other manufactured goods and thus remain vulnerable to fluctuations in Asian economies, which in the case of Guam, the CNMI, and Palau are their main trading partners. Because the islands use U.S. currency and receive considerable funding from the U.S. Federal Government, fluctuations in the U.S. dollar and the U.S. Mainland economy also have major impacts on the island economies. Tourism is the main industry for Guam, CNMI and Palau, although the construction industry (and garment industry for the CNMI) has in recent years become an important sector of their economies. Tuna canning remains the main industry for American Samoa.
The CNMFs economy has expanded at an extraordinary rate of 24 percent per year (in current dollars) between 1980 and 1990. Its total Gross Domestic Product (GDP) for 1991 was close to $1.2 billion, the highest among the U.S. Pacific islands. Guam has also experienced rapid economic growth over the past decade, albeit at a lower rate, and a slowdown in the economy in recent years due to a slump in the tourism industry. Guam's total GDP for 1990 was close to $1.9 billion. But because of much larger population, Guam's per capita GDP is considerably less than that of the CNMI. Palau's economy grew at 6 percent per year, while American Samoa's economy grew at a much slower rate of 2 percent per year over the same period, with the total GDPs in 1990 of $188 million and $50 million respectively, and roughly the same in terms of per capita GDP.8
Through employment and dispersal of Federal funds, the public sector plays a key role in all of the island economies. In particular, government expenditure is a large component of the economies of American Samoa and Palau, and of the total government expenditure, about one half is Federal
oGuam uses total payroll employment as its primary economic indicator. GIF, or gross island product, figures have not been
computed for Guam and American Samoa since 1985.
Section 3: Pacific: Energy/Economy Profiles 32

U.S. Department of Energy Insular Area Energy Vulnerability Study
contributions. Even for Guam and the CNMI, where the economies are driven largely by private sectors, U.S. Federal funding constitutes a significant component of their total government spending.
The performance of the island economies since 1980 compares favorably to economic growth in other Pacific island nations and the United States. Despite the recent slowdown, the outlook for the economies to the year 2000 is bright with growth rates projected to moderate for Guam and the CNMI, increase sharply for Palau as a result of the signing of the Compact with the United States, and remain at a solid 2 to 3 percent level for American Samoa.
3.2.2 Energy Profile
The U.S. Pacific islands are totally dependent on imported petroleum as their source of energy. Together they consumed 9.7 million barrels (mmb), or 26,340 barrels per day (bpd) of refined petroleum products in 1992. In comparison, the entire Pacific islands region consumed a little over 200,000 bpd of crude oil and products, and the world, about 65 million bpd.
For Guam, the CNMI, and Palau, the source for oil product imports is Singapore. There is no operating refinery on the U.S. Pacific islands. Four commercial oil suppliers. Shell, Mobil, Exxon and Broken Hill Proprietary Petroleum Americas (BHPPA), ship petroleum products from Singapore to Guam, for transshipment of oil in the northern Pacific region. This voyage takes nine to ten days. Shell and Mobil then ship their petroleum products to the CNMI (less than one day from Guam) and to Palau (a two to three day voyage from Guam). The sole supplier of petroleum fuels in American Samoa is BHPPA. BHPPA ships petroleum products from Hawaii, which sources crude from Alaskan North Slope and Asia, primarily from Indonesia. BHPPA owns a 95,000 bpd refinery in Hawaii.
Oil import bills, and as the percentage of the value of total imports to the islands, are shown in Table 12. More than twenty percent of total import cost for the CNMI and Palau is for imported oil. In comparison, oil imports comprised 12 percent of the value of total U.S. imports in 1990 and 10 percent in 1991.
Table 12
U.S. Pacific Islands |Oil Imports |
Island Value Total Imports Fuel Imports as %(year) (thousands) (thousands) of Total Imports
American Samoa(1990) $34,896 $360,300 10%
Guam (1991) $140,582 n.a. n.a.
CNMI (1991) $81,800 $392,400 21%
Palau (1989) $5,900 $24,600 24%
Section 3: Pacific: Energy/Economy Profiles 33

U.S. Department of Energy Insular Area Energy Vulnerability Study
Petroleum Demand
Table 13 shows for each island its petroleum demand, projected growth rate, and end use. In 1992, Guam consumed 6.8 mmb of petroleum product at a rate of 18,360 bpd; the CNMI, 1.4 mmb at 3,753 bpd; American Samoa, 1.3 mmb at 3,364 bpd; and Palau, 0.3 mmb at 720 bpd. Petroleum demand by the islands is expected to increase at an average annual growth rate of 6 percent to reach 15.3 million barrels by the year 2000. The wide range in petroleum demand growth rates, from 1.2 percent for American Samoa to 12.5 percent for the CNMI, basically reflects the range in the expected economic growth rates of the individual islands.
As shown in Table 13, the islands consume around 90 percent of the imported petroleum products in the transport and electricity sectors combined. In Guam and the CNMI, around 50 percent of the fuel is used for transportation and slightly over 40 percent for electric power generation, while in Palau, close to 60 percent is used for transportation and a little over 30 percent for electric power generation. American Samoa consumes over two thirds of its imported oil in the transportation sector, some of which goes to fuel the large fishing fleet that services the local tuna canneries. Only 16 percent of total fuel is used for electric power generation, however. The cannery operations also require fuel for food processing.
Table 13
U.S. Pacific IslandsPetroleum Demand and End Use
Petroleum Demand Estimated Sector End UseInsular (bbls per day) AnnualArea
1992 2000GrowthRate Transport Electricity Other
AmericanSamoa 3,364 3,532 1.2% 69% 16% 15%
Guam 18,360 27,400 4.9% 47% 43% 10%
CNMI 3,753 9,630 12.5% 52% 41% 7%
Palau 720 1,490 9.5% 56% 33% 10%
Figure 4 shows the breakdown of petroleum demand into products. By far the largest share of the product demand in the islands is for diesel fuel; close to 74 percent in American Samoa and 65 percent in Palau, where the diesel is used for both transport and electricity generation. In Guam and the CNMI, the leading fuel for electric power generation is residual fuel oil. The high demand for jet fuel both in Guam (25.7 percent) and the CNMI (32.6 percent) reflects the large tourism industries in these islands. The share of gasoline demand is surprisingly high in Palau because it has comparatively fewer vehicles and a much smaller road network than in the other islands. However,
Section 3: Pacific: Energy/Economy Profiles 34

U.S. Department of Energy Insular Area Energy Vulnerability Study
gasoline is also used for household-size, portable electricity generators and small boats that are common on the island.
It is apparent that the Pacific islands are heavily dependent on refined products including motor gasoline, jet fuel and diesel, and are experiencing high demand growth rates similar to the recent trend in Asia's demand for the same products. These refined products are currently supplied from Singapore and Hawaii. Continued "local" supply of these products to the islands will depend not only on the availability of crude oil, but also on maintenance of refinery capacity in the Asia- Pacific region sufficient to keep pace with the growing regional demand for petroleum products. Residual fuel oil is used to generate 90 percent of electric power in Guam, and 50 percent of electric power in the CNMI. Clearly, the ability to use less refined fuel or crude in an oil crisis is an advantage because it broadens supply sources.
Section 3: Pacific: Energy/Economy Profiles 35

U.S. Department of Energy Insular Area Energy Vulnerability Study
Figure 4 U.S. Pacific Islands Petroleum Product Demand, 1992
&
Section 3: Pacific: Energy/Economy Profiles 36

U.S. Department of Energy Insular Area Energy Vulnerability Study
Petroleum Storage Capacity
The U.S. Pacific islands currently possess a combined petroleum storage capacity of over 6 million barrels, well in excess of normal storage capacity required to meet the combined oil demand of 26,340 bpd. As is shown in Table 14, Guam alone has as much as 5.5 million barrel of storage capacity, which includes Shell Guam's 4 million barrel tank farm at the GORCO facilities. Only a portion of the storage is actually used. The existence of excess capacity is due in part to Guam serving historically as the transshipment point for the CNMI, Palau, the Federated States of Micronesia and the Marshall Islands, but principally because of its historical role as a regional storage facility for the U.S. military.
Palau had developed its storage capacity with the intent of becoming a transshipment point for surrounding islands, but the required business failed to materialize. As a result, Palau also has considerable storage capacity of 220,000 barrels, of which 144,000 barrel storage is at the Aimeliik power plant owned by the government. American Samoa has 175,000 barrel storage capacity, of which 168,000 barrel capacity is at the Etulei Tank Farm. The American Samoa government and BHPPA are currently planning to expand capacity by replacing some of the old and deteriorating tanks at the tank farm. The CNMI has 285,000 barrel capacity, most of which is located on the island of Saipan.
Table 14
U.S. Pacific IslandsPetroleum Storage
(in thousand barrels)
American Samoa 175
CNMI 285
Guam 5,500
Palau 220
Electricity
The electricity sectors in the islands have a total installed capacity of 472 megawatts and service approximately 58,000 customers as shown in Table 15. The largest utility is the Guam Power Authority (GPA) with 307 MW of installed capacity providing power to over 36,000 customers. GPA is an autonomous government utility that consumes 2.7 million barrels of residual fuel oil a year and 240,000 barrels of diesel to generate 1,500.6 million kWh of electricity. Recent forecasts show GPA's load growth to average 7 percent per year to the year 2000.
The Commonwealth Utilities Corporation (CUC) in the CNMI is the next largest utility with 120 megawatts of installed capacity. This corporation is also an independent government agency, which consumes 460,000 barrels of fuel annually (56 percent residual fuel oil, 44 percent diesel) to
Section 3: Pacific: Energy/Economy Profiles 37
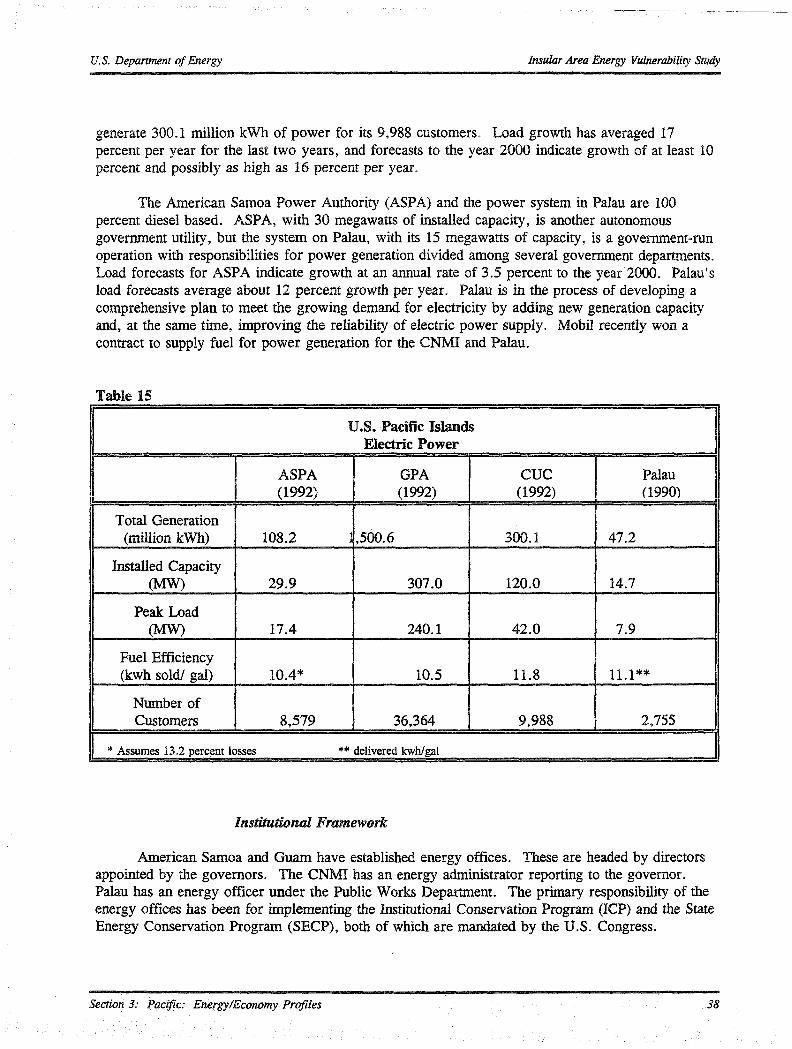
U.S. Department of Energy Insular Area Energy Vulnerability Study
generate 300.1 million kWh of power for its 9,988 customers. Load growth has averaged 17 percent per year for the last two years, and forecasts to the year 2000 indicate growth of at least 10 percent and possibly as high as 16 percent per year.
The American Samoa Power Authority (ASPA) and the power system in Palau are 100 percent diesel based. ASPA, with 30 megawatts of installed capacity, is another autonomous government utility, but the system on Palau, with its 15 megawatts of capacity, is a government-run operation with responsibilities for power generation divided among several govermnent departments. Load forecasts for ASPA indicate growth at an annual rate of 3.5 percent to the year 2000. Palau’s load forecasts average about 12 percent growth per year. Palau is in the process of developing a comprehensive plan to meet the growing demand for electricity by adding new generation capacity and, at the same time, improving the reliability of electric power supply. Mobil recently won a contract to supply fuel for power generation for the CNMI and Palau.
Table 15
U.S. Pacific IslandsElectric Power
ASPA(1992)
GPA(1992)
CUC(1992)
Palau(1990)
Total Generation (million kWh) 108.2 1 ,500.6 300.1 47.2
Installed Capacity (MW) 29.9 307.0 120.0 14.7
Peak Load (MW) 17.4 240.1 42.0 7.9
Fuel Efficiency (kwh sold/ gal) 10.4* 10.5 11.8 11.1**
Number of Customers 8,579 36,364 9,988 2,755
* Assumes 13.2 percent losses ** delivered kwh/gal
Institutional Framework
American Samoa and Guam have established energy offices. These are headed by directors appointed by the governors. The CNMI has an energy administrator reporting to the governor. Palau has an energy officer under the Public Works Department. The primary responsibility of the energy offices has been for implementing the Institutional Conservation Program (ICP) and the State Energy Conservation Program (SECP), both of which are mandated by the U.S. Congress.
Section 3: Pacific: Energy/Economy Profiles 38

U.S. Department of Energy Insular Area Energy Vulnerability Study
The utilities in American Samoa (ASPA) and the CNMI (CUC) are responsible for electricity, water and sewage services. In addition, ASPA is responsible for petroleum supply and distribution, including oversight of the oil company which supplies and manages the tank farm. Guam Power Authority (GPA) is responsible for electricity services on Guam, and the Public Works Department provides electricity services and oversees petroleum supply in Palau.
Section 3: Pacific: Energy/Economy Profiles 39

U.S. Department of Energy Insular Area Energy Vulnerability Study
4 ASSESSMENT OF UNIQUE ENERGY VULNERABILITIES
4.1 Introduction
Assessment of the unique energy vulnerabilities of the insular areas was the core task of this DOE study. This section first delineates the islands' unique vulnerabilities, essentially the factors in their energy and economy make-up that indicate a potentially greater risk versus the Mainland of interruptions in physical oil supplies and/or susceptibility to a higher level of economic damage from oil supply disruptions. The methodologies used by the DOE study team to assess the implications of the islands' unique vulnerabilities are then outlined; in brief, a combination of approaches to analyze both the islands' past record in global and local disruptions and their prospects under potential future disruptions. A primary goal here was to ascertain whether, in fact, the existence of additional vulnerabilities relative to the Mainland does lead to greater loss of oil supplies and/or impacts on the island economies. The section concludes by summarizing the key findings from the vulnerability assessment, notably that, while concerns are most often raised over access to physical oil supplies, it is actual and potential damage to island economies that is the primary consequence of their unique energy/economy vulnerability.
4.2 Factors That Contribute to Unique Energy Vulnerabilities
The insular areas have energy-related vulnerabilities that are unique or more severe than exist on the U.S. Mainland. These vulnerabilities affect the petroleum supply systems, electric power systems, transportation systems, and the water supply systems in the U.S. Virgin Islands and the U.S. Pacific islands. Ultimately, these vulnerabilities become vulnerabilities of the islands' economies. Each vulnerability category is described below.
4.2.1 Petroleum Supply System Vulnerabilities
The petroleum supply systems of the insular areas are more vulnerable to supply disruptions than is the Mainland system for the following reasons:
• The islands all rely on petroleum for virtually 100 percent of their energy needs whereas, in the U.S. Mainland, oil supplies only 40.6 percent of total energy needs.9
• In all the islands, 100 percent of petroleum supplies must be imported (vs. 40.7% in the U.S. Mainland10).
• All petroleum entering the islands must arrive by sea in tankers and barges. Unlike the U.S. Mainland, the islands have no land access to petroleum supplies. During an emergency, the islands have no guarantee that tankers will be available to deliver supplies required.
• The Pacific islands are all located thousands of miles away from the sources of fuel supplies.
Source EIA, Annual Energy Review, 1992.
10 Source, EIA Petroleum Supply Annual, 1992.
Section 4: Energy Vulnerabilities 40

U.S. Department of Energy Insular Area Energy Vulnerability Study
• Currently, all fuel supplies for Guam, the CNMI and Palau come from one source, Singapore; similarly, American Samoa receives all its petroleum supplies from Hawaii.
• Puerto Rico and several of the other islands have no deepwater ports and, thus, are not accessible by larger oil tankers. The largest ship that can deliver crude oil or product to Puerto Rico is 80,000 deadweight tons. It is estimated that about 75 percent of the available world tanker fleet capacity is in ships exceeding 80,000 dwt. Lightering and offshore mooring are feasible but costlier alternatives for handling larger oil tankers.
• The docks in all the Caribbean and Pacific islands are a critical link in the islands’ petroleum supply system. The docks are essential for receiving all petroleum imports, and they are important in Puerto Rico and the U.S. Virgin Islands for intraisland petroleum distribution via barges. In contrast, the U.S. Mainland has an extensive petroleum pipeline network to distribute petroleum. An accident at the docks or in related locations such as the San Juan Bay shipping channel in Puerto Rico could inhibit petroleum resupply. As in many Mainland areas, policies that allow public access to the docks compromise dock security.
• The islands are subject to frequent natural disasters, such as typhoons, earthquakes and cyclones that could interrupt supplies to and on the islands.
• In Puerto Rico, the petroleum refineries are 100 percent dependent on the island electric utility company, PREPA, for electric power. In comparison, for both economy and reliability reasons, the average Mainland refinery buys 73 percent of its power needs and generates 27 percent on-site.
• In Puerto Rico, the refining sector is struggling economically to maintain profitable operations. One plausible scenario is that all refineries could shut down in the next few years. Loss of additional refinery capacity would further reduce on-island petroleum inventories. Mainland refineries are also struggling with changing market conditions and regulations, but unlike Puerto Rico no plausible scenario would include a total shutdown.
4.2.2 Electric Power System Vulnerabilities
The electric power systems on the islands are more vulnerable to oil supply disruptions than is the Mainland system for the following reasons:
• They produce 98-100 percent of their electricity using petroleum. None can switch fuels away from petroleum during an emergency. In comparison, in the 48 contiguous states only three percent of all electricity is generated from oil. Most areas of the Mainland have a wider range of energy sources available, such as coal, nuclear energy, natural gas and hydro which provide lower, more stable electricity prices and greater ability to switch fuels when needed. Figure 5 illustrates the volatility of insular area fuel costs for electric generation.
Section 4: Energy Vulnerabilities 41

U.S. Department of Energy Insular Area Energy Vulnerability Study
Ail petroleum used for electric power generation must be imported. No insular area produces any crude oil.
PREPA (Puerto Rico), WAPA (U.S.V.I.) and the Pacific utilities are island electric systems. They do not have neighboring electric systems that can supply them electric power during an emergency. As a result, to achieve levels of reliability comparable to the U.S. Mainland, they must maintain larger capacity margins than U.S. Mainland utilities, which increases electricity costs.
In comparison with U.S. Mainland utilities, most of the island utilities' electric load is served by a distribution system that is above ground where it is more vulnerable to disturbances such as hurricanes. Limited financial resources have prevented more rapid implementation of underground distribution. Figure 6 illustrates the impact of Hurricane Hugo in September 1989 on peak electric loads in the U.S. Virgin Islands.
PREPA's annual load factor is 75 percent (for comparison, the State of Florida average is 55 percent), which means that average electrical demand is 75 percent of the peak annual demand. This high load factor makes it more difficult to take units out of service for scheduled maintenance.
PREPA Fuel Cost 1989-1992
Persian Gulf Crisis 40% Increase
ceKTOSTMaMswrWinter
as Apr Oct Jan SO Apr Oct Jan 91 Apr Oct Jan 92 Apr
Figure 5
Section 4: Energy Vulnerabilities 42
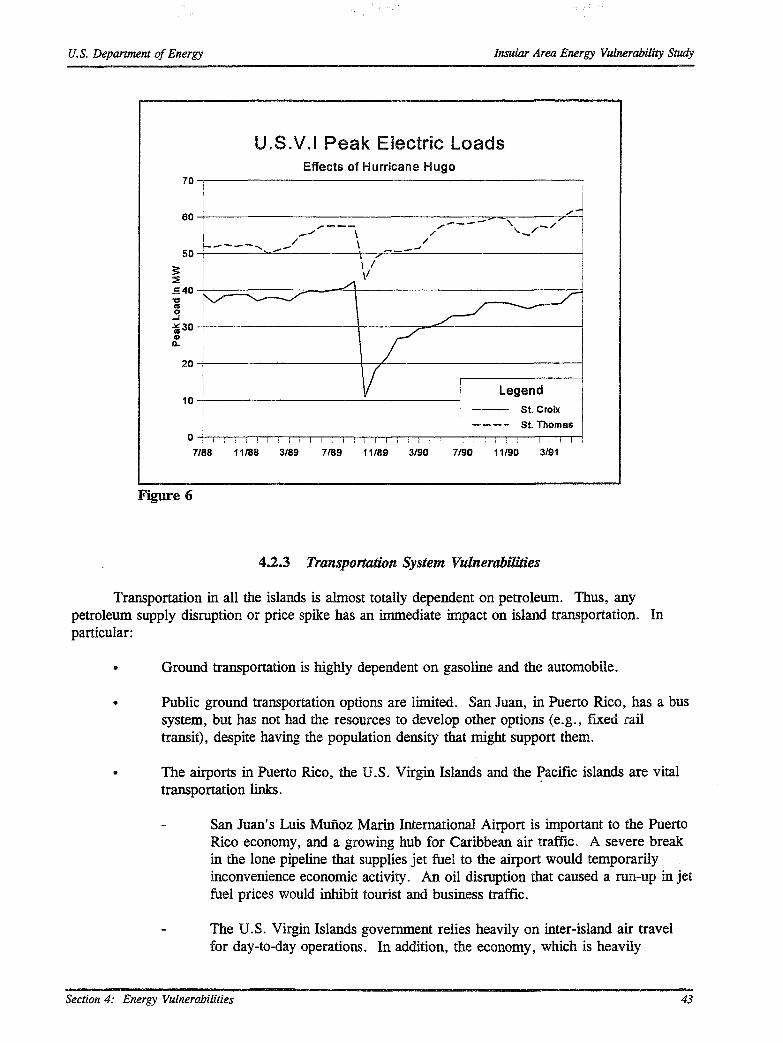
U.S. Department of Energy Insular Area Energy Vulnerability Study
U.S.V.I Peak Electric LoadsEffects of Hurricane Hugo
LegendSt. Croix St. Thomas
11/88 11/89 11/90
Figure 6
4.2.3 Transportation System Vulnerabilities
Transportation in all the islands is almost totally dependent on petroleum. Thus, any petroleum supply disruption or price spike has an immediate impact on island transportation. In particular:
Ground transportation is highly dependent on gasoline and the automobile.
Public ground transportation options are limited. San Juan, in Puerto Rico, has a bus system, but has not had the resources to develop other options (e.g., fixed rail transit), despite having the population density that might support them.
The airports in Puerto Rico, the U.S. Virgin Islands and the Pacific islands are vital transportation links.
San Juan's Luis Munoz Marin International Airport is important to the Puerto Rico economy, and a growing hub for Caribbean air traffic. A severe break in the lone pipeline that supplies jet fuel to the airport would temporarily inconvenience economic activity. An oil disruption that caused a run-up in jet fuel prices would inhibit tourist and business traffic.
The U.S. Virgin Islands government relies heavily on inter-island air travel for day-to-day operations. In addition, the economy, which is heavily
Section 4: Energy Vulnerabilities 43

U.S. Department of Energy Insular Area Energy Vulnerability Study
dependent on tourism, would be adversely affected by disruption of jet fuel supplies or prices.
The Pacific islands would be similarly adversely affected by disruption in jet fuel supplies or prices.
4.2.4 Water Supply System Vulnerabilities
The U.S. Virgin Islands have very limited water resources. The predominant source of water supply is desalination of sea water by WAPA, which supplies approximately 65 percent of total water used in the U.S. Virgin Islands. WAPA's desalination facilities and electric generation facilities are co-located and rely exclusively upon petroleum. Thus, a substantial portion of the water supply is vulnerable to petroleum disruptions and price spikes.
A similar situation exists in the Pacific islands, where a significant percentage of electricity generation is required for water supply pumping and distribution, sewage treatment and disposal.
4.2.5 Economic Vulnerabilities
With the possible exception of relatively industrialized Puerto Rico, the island economies are dramatically smaller, simpler, and less diversified than the economy of the U.S. Mainland. For instance, all the smaller islands have little in the way of manufacturing or service industries.11 They are heavily reliant on tourism, which is subject to wide fluctuations in activity, especially to declines during and after global oil emergencies.
In addition, all the economies are highly inter-linked with the U.S. Mainland economy or, in the case of certain Pacific islands, to Japan and other Pacific economies. In 1992, Puerto Rico sent 87.5% of its exports to the U.S. Mainland and received 66% of its imports from the Mainland.Thus, recessions on the Mainland and Japan have a large impact on the insular areas.
Petroleum imports play a much larger role in the island economies than they do in the Mainland economy. As illustrated in Table 16, the Mainland's petroleum imports bill has a value equivalent to 0.8% of GDP. For Puerto Rico, the corresponding figure is 5.1%, for the U.S.Virgin Islands 6.5%. For the Pacific islands, the cost of petroleum imports equates to 7-12% of GDP.
The Hess refinery is clearly an exception for the U.S. Virgin Islands. However, this large refinery dwarfs other non-tourist industry on the islands.
Section 4: Energy Vulnerabilities 44

U.S. Department of Energy Insular Area Energy Vulnerability Study
Table 16
Oil Import Bills as % of GDP
U.S. Mainland 0.8%
Puerto Rico 5.1%
U.S.V.I. 6.5%
American Samoa 11.8%
CNMI 6.9%
Guam 7.6%
Palau 11.8%
The economic vulnerabilities of the insular areas can be summarized as follows:
• The insular areas are vulnerable to greater wealth losses during oil supply disruptions than the U.S. Mainland. This is because the proportionate oil import bills of the insular areas are an order of magnitude greater than the U.S. Mainland's.
• Most of the insular areas' economies12 are tourism based, which renders them extremely vulnerable to recessions that result from global oil supply disruptions. Tourism expenditures tend to decline disproportionately relative to other expenditures during recessions.
• Those economies (American Samoa and Puerto Rico) that are not tourism based are also vulnerable to recessions, because their almost-exclusive dependence upon petroleum and lack of substitute fuels will push the cost of their goods relatively higher than other economies, placing them at a competitive disadvantage.
4.2.6 Implications of Unique Vulnerabilities
In total, the insular areas exhibit a significant number of energy vulnerability characteristics that mark them out from the U.S. Mainland. These unique vulnerabilities relate to both security of physical energy supply and susceptibility to economic damage.
The implication of these heightened vulnerabilities is that a higher degree - or frequency - of physical supply dislocation or of economic damage (versus the Mainland) might be expected to result from petroleum supply disruptions. Much of the impetus from island governments for special energy security treatment stems from an awareness and concern over these unique vulnerabilities. The thrust of DOE’s energy vulnerability assessment was to identify - and to the extent possible to quantify - the actual vulnerabilities of island energy supplies and economies relative to the Mainland.
The economies which are not primarily tourism based are American Samoa and Puerto Rico. However, tourism is an important sector for Puerto Rico and is becoming more important for American Samoa.
Section 4: Energy Vulnerabilities 45

U.S. Department of Energy Insular Area Energy Vulnerability Study
4.3 Methodology
The previous subsection identified the factors that contribute to the insular area energy vulnerabilities. In order to assess the energy vulnerabilities, both in terms of supply interruptions and economic losses, a combination of approaches was employed:
• Detailed historical data on petroleum and electricity supply, demand, flows, inventories and pricing were examined and compared with Mainland data for periods covering recent oil supply disruptions13.
• Island economy data were similarly evaluated and compared with Mainland data.
• Reports by island authorities on their economies, energy sectors and the impacts of past global and local emergencies were examined.
• Scenarios were developed for possible future global oil disruptions of different magnitudes and locations. The impact of these disruptions on the islands was estimated.
• Scenarios were developed for possible future local energy disruptions of different types and locations. The impacts of these disruptions were estimated.
• Island energy emergency response plans were reviewed.
• The physical vulnerabilities of the island petroleum and electricity supply systems were assessed through on-site inspection of facilities (principally in Puerto Rico).
• Extensive interviews were conducted with island government personnel responsible for energy and emergency planning, and with industry personnel in the islands' refining, distribution, petroleum storage and electric utility sectors. These interviews served several purposes including:
relating first hand knowledge of experiences in prior emergencies
gaining perspectives on energy/economy outlooks, plans and potential for enhancing energy security
gaining insights into the adequacy of island governments' energy and emergency institutions.
During the course of the study, substantial amounts of energy and economy data were obtained from island governments, energy organizations and from the Energy Information Administration. The reader should be aware however that complete data were not available for any of the islands. The assessment therefore had to be completed in the face of data gaps which were minor only in the case of Puerto Rico. These gaps related principally to detailed petroleum supply, demand and price data
Details of the work undertaken by the DOE study team can be found in die two contractor reports referenced in Section 1.
Section 4: Energy Vulnerabilities 46

U.S. Department of Energy Insular Area Energy Vulnerability Study
and to selected economic statistics. Where "hard" data were not available, either estimates were developed or reliance was placed on island reports, on the views of island officials and on the experience and judgement of the DOE study team.
4.4 Findings; Supply Impacts of Oil Supply Disroptions
This section presents the study team's findings with respect to the oil and electricity supply impacts of global disruptions, both past and prospective, and of local disasters.
4.4.1 Past Global Oil Disruptions
Energy supplies in Puerto Rico, the U.S. Virgin Islands and the Pacific islands were disrupted on several occasions in recent years. The disruptions considered here included the Persian Gulf crisis in 1990-91 which caused a major, temporary increase in world and insular oil prices; and the two global oil disruptions of the 1970s which were evaluated to a lesser extent because of the significant changes in world and regional oil markets since then.
The following summarizes the main findings from examination of actual past global oil disruptions and local disasters:
• No physical supply interruptions resulted during the global oil supply disruptions of 1973, 1979-80 and 1990-91.
• Oil companies present on the islands were able to maintain adequate oil inventories during global and local disruptions, although levels did fluctuate.
Figure 7 illustrates changes in total refinery stocks on Puerto Rico before, during and after the 1990-91 Middle East crisis and Hurricane Hugo.
• Gasoline and distillate inventories are most likely to drop sharply in local disruptions.
This phenomenon was evident from data on Puerto Rico and the U.S. Virgin Islands.It may be due to temporary panic purchasing and hoarding and to the island power authority needing to consume a higher proportion of distillate/diesel fuel under unstable load conditions.
• Residual fuel inventories tend to be maintained or rise in both global and local disruptions (high sulfur resid tends to surplus).
In both local and global disruptions, island electricity consumption tends to decline and, with it, demand for residual fuel for power generation. Consequently, residual fuel inventories tend to rise. In addition, evidence from the 1990-91 Persian Gulf Crisis and from simulations of potential disruptions indicates that high sulfur residual fuel tends to become an unwanted product in disruptions and therefore tends to surplus.
• Inventory drops are short-lived, at least in Puerto Rico and the U.S. Virgin Islands, since these islands have multiple sources of supply.
Section 4: Energy Vulnerabilities 47
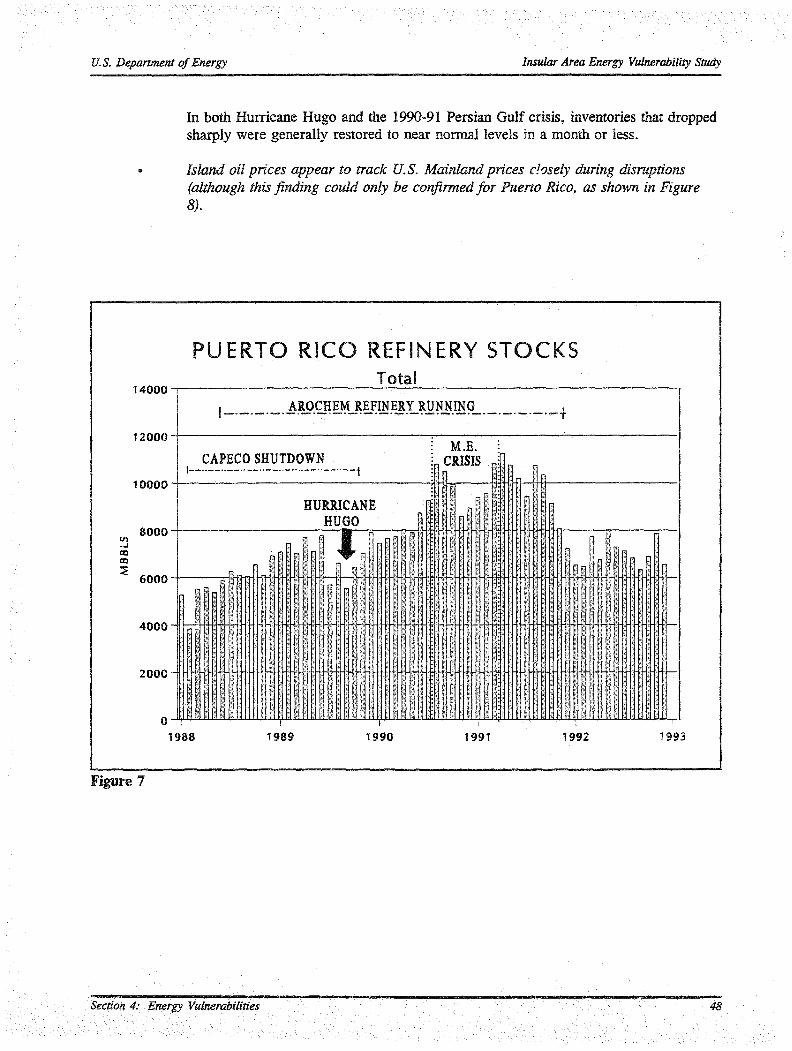
U.S. Department of Energy Insular Area Energy Vulnerability Study
In both Hurricane Hugo and the 1990-91 Persian Gulf crisis, inventories that dropped sharply were generally restored to near normal levels in a month or less.
Island oil prices appear to track U.S. Mainland prices closely during disruptions (although this finding could only be confirmed for Puerto Rico, as shown in Figure8).
14000
PUERTO RICO REFINERY STOCKSTotal
12000
10000
8000
oaas2
6000
4000
2000
AR0CHEM REFINERY RUNNING -+
CAPEC0 SHUTDOWN,------------------------------------- 1
HURRICANEHUGO
J
M.E.CRISIS
1988 1989 1990 1991 1992 1993
Figure 7
Section 4: Energy Vulnerabilities 48

U.S. Department of Energy Insular Area Energy Vulnerability Study
P.R. vs U.S. PRICES 1989 - 1992CRUDE OIL
40.00
30.00
20.00
10.00
-10.00MAY SEP MAY SEPMAY SEP MAY
Legend
PR AVC IMPORT DIFFERENCE PR-US
US AVC IMPORT
Figure 8
Section 4: Energy Vulnerabilities 49

U.S. Department of Energy Insular Area Energy Vulnerability Study
4.4.2 Future Global Oil Supply Disruptions
Potential future global oil disruption scenarios were developed to examine the impacts on the insular areas of different levels and types of crude loss and refining capacity loss. The scenarios are summarized in Table 17 and described further below.
• Global I represents a geographically widespread loss of medium and higher quality crude oils affecting producers in the Middle East, North Africa and the Pacific. PR/USVI refiners would be impacted directly by the lost Middle Eastern crudes and indirectly (through crude oil diversion) by the loss of high quality African and Pacific crudes.
• Global II represents a loss of crude oil supplies from regions on which the U.S. Virgin Islands and, especially, Puerto Rico refineries are heavily dependent, namely Latin America and secondarily West Africa. Impacts on PR/USVI refining throughputs would be expected to be substantial.
• Global HI represents a situation akin to the 1990-91 Persian Gulf Crisis, but with the net loss of crude supply after production surges remaining larger than was the case in 1990/91. Impacts on PR/USVI refineries would be expected to be limited.
Table 17
Potential Global Energy Disruptions
Cases Examined (all Year 2000)
Case (MMbpd) I n m
Crisis Duration Months 6 6 6
Crude Loss Regions Mid East, N. Africa Latin Am., W. Africa Similar to 1990-91Far East Persian Gulf Crisis
Crude Loss Volume 9 6 4.3
U.S. SPR Draw 3.5 1.5 0
Foreign SPR Draw 1 0 0
Net Supply Loss 4.5 4.5 2.3(2.0 Saudi surge production)
Crude Price (BAU $22.90)- High Stock Build ($/Bbl) $50 $50 $36- Low Stock Build ($/Bbl) $35 $35 $26
Case Variants .5 Europe .5 Europe PR+USVI- Refining Loss MMbpd .5 P.G. .5 P.G. total loss
Variants of Global I and II incorporating refinery capacity losses were designed to examine the impacts on light product supply of loss of sophisticated capacity in the Middle East and Europe. In Global III, the variant was designed to explore the impact of an essentially total simultaneous
Section 4: Energy Vulnerabilities 50

U.S. Department of Energy Insular Area Energy Vulnerability Study
loss of Puerto Rico and U.S. Virgin Islands refineries, e.g., through accidents and natural disaster. The implication of this variant is that petroleum product may have to be supplied entirely from off- island sources. All three disruption scenarios were set in the year 2000.
The analysis of the impacts of the global oil disruption scenarios was based in part on several models, including:
• DOE/EIA’s Disruption Impact Simulator (PIS') Model. This projects overall market conditions, including world oil price, for a postulated disruption away from an underlying business as usual scenario. The model also projects impacts on the U.S. economy.
• EnSvs’ World Oil Refining Logistics and Supply (WORLD) Model. This model integrates and simulates the activities and economics of the world-regional petroleum supply system. It outputs projected regional crude and product flows, refinery utilizations and detailed crude and product prices from base assumptions regarding disrupted supply, demand, refining capacity, transportation and the "marker" crude price.
• The Puerto Rico Planning Board Macroeconomic Model. This model consists of an econometric model linked to an input-output model. The model was used to simulate specific impacts on the Puerto Rico economy of the three global disruption scenarios, using results from DIS and WORLD simulations. No macroeconomic model was available for any of the other insular areas. The Puerto Rico Planning Board model captures key effects needed for vulnerability analysis including impacts of world oil price level, interactions between the energy sector and other economy sectors and interactions between the Puerto Rico economy and the (disrupted) U.S. Mainland economy.
• The Virgin Islands Energy Office (VIEO) Jobs Impact Model. This model simulates the effect of various developments in the U.S. Virgin Island economy on island employment. GDP effects were estimated outside the model based on the predicted employment changes.
EIA, the Puerto Rico Planning Board and the VIEO assisted in this effort.
The prime purpose behind the analysis of potential year 2000 disruption scenarios was to gain a sense of how the Caribbean and Pacific insular areas could be impacted (relative to the Mainland) in disruptions of a world regional petroleum supply system that will have changed significantly from that obtaining today; also to explore disruptions of high severity by historical standards, as well as lesser disruptions similar to the 1990-91 Middle East crisis.
The key implications of the three year 2000 disruptions for the insular areas are as follows:
• Global 1: A major disruption among Pacific and Middle East supplies could disproportionately impact the Pacific islands.
Section 4: Energy Vulnerabilities 51

U.S. Department of Energy Insular Area Energy Vulnerability Study
Simulation results indicate that the world's major export refining centers, notably Southern Europe, the Caribbean and Singapore would suffer heavier losses in refining throughputs than refineries in the major producing and consuming regions. With their near total reliance on supplies from Singapore, (whose refiners run predominantly Pacific and Middle Eastern crude oils), the Pacific islands would be acutely affected early in the crisis until the world system adjusts and the islands’ suppliers seek replacement sources of product.
Refinery throughputs in Puerto Rico and the U.S. Virgin Islands are indicated as being seriously affected, in part because of re-allocation of Latin American crude to the Pacific basin. However, given the variety of refining supply sources available at short distance in both producing countries and in the highly flexible U.S. Mainland refining system, Puerto Rico should be available to obtain sufficient alternative supplies such that it suffers supply loss no worse than the Mainland. The presence of the huge stocks at Hess' St. Croix refinery should act as a more-than-adequate buffer for the U.S. Virgin Islands, and possibly for Puerto Rico as well.
Global II: A major to medium scale disruption among Latin American and West African producers would severely impact the Caribbean islands, at least initially, but have relatively little impact on the Pacific islands.
Simulation results indicate a sustained fall-off in Caribbean refining throughputs of more than 25 percent versus under 6 percent for the Pacific region and under 10 percent for the U.S. Mainland. Southern European and North African refiners are also indicated as being severely affected. This situation points to potentially severe initial difficulties for Puerto Rico and U.S. Virgin Islands refiners in maintaining output.
Puerto Rico's suppliers will need to seek alternative supplies from the U.S. Mainland or otherwise from long-haul sources such as Northern Europe, the Persian Gulf or probably the Pacific. The substantial inventories at Hess St. Croix refinery should buffer the U.S. Virgin Islands and potentially Puerto Rico. Nonetheless, the results indicate a risk of initial supply difficulties for Puerto Rico, especially if its refining sector further declines so that business-as-usual stocks held on the island are reduced.
The Pacific region is projected as being relatively less affected under this disruption. Some reallocation of crude oils would take place in the region, but the scenario does not include any loss in supplies of the regional and Middle Eastern crude oils that are the primary sources of products sold into the Pacific insular areas.
Global III: A small to medium scale disruption similar in nature to the 1990-91 Middle East crisis will have moderate and relatively evenly distributed supply impacts. Puerto Rico may be affected least in terms of crude oil supplies but none of the islands, Pacific or Caribbean should suffer supply loss greater than the U.S.Mainland.
Addition of remote refining capacity losses to the scenarios has little impact as the world's refining system will anyway be operating at reduced throughputs because of the disruption.
Section 4: Energy Vulnerabilities 52

U.S. Department of Energy Insular Area Energy Vulnerability Study
• A combination of simultaneous global oil disruption with major outages of local refineries in Puerto Rico and the U.S. Virgin Islands (e.g., through ’’back-to-back” hurricanes during a global disruption) can be accommodated on a global basis but could have serious supply consequences for Puerto Rico in particular.
Even with sustained serious damage, the high Hess refinery inventories should be sufficient to supply the U.S. Virgin Islands. Puerto Rico would need to seek most supplies from outside the island but will have access to a range of short-haul sources including Venezuela, Caribbean export refineries, the U.S. Mainland.
In evaluating the prospects for island oil supply interruptions under possible future disruptions, the following should also be borne in mind:
• While the 1990-91 Middle East Crisis represents the most recent and in many ways most pertinent crisis from which to draw insights, many of the events that occurred during the crisis fell into place fortuitously, to the benefit of consumers worldwide. Significant problems that could have developed did not and, while the initial gross supply loss was 4.3 million barrels per day, the average supply loss over the duration of the crisis was only 450,000 barrels per day.
• The large (9 million bpd) and medium (6 million bpd) disruption scenarios represent larger initial losses than occurred in recent actual disruptions but nonetheless are considered plausible for planning purposes.
Conversely:
Today's oil market is highly integrated and responds very rapidly: local supply/price dislocations are short-lived.
Today, the petroleum crude and products market functions as a fast-moving, open commodities market with real-time computer-based trading and information systems linking several market centers and virtually all market players worldwide, including - for instance - the refiners and distributors on Puerto Rico and the U.S. Virgin Islands. Under this situation, the market reacts rapidly. Consequently, any local supply and price dislocations, such as might occur on the islands, would be transmitted to the market and resolved quickly.
Petroleum prices in the islands will move with the market, barring special supply relationships (e.g. the Hess-WAPA arrangement).
With their almost total dependence on open-market petroleum for energy supplies, Puerto Rico, the U.S. Virgin Islands and the Pacific islands will find their crude oil and product prices inevitably move with the market, i.e., the islands will be price takers subject to the full force of market price fluctuations.
Section 4: Energy Vulnerabilities 53

U.S. Department of Energy Insular Area Energy Vulnerability Study
4.4.3 Local Disruptions
All four Pacific islands are frequently subjected to severe natural disasters including typhoons, earthquakes and cyclones. The Caribbean islands are also prone to hurricanes and are at some risk from earthquakes.
Although these natural disasters have caused extensive damages to the island homes, commercial buildings, and in particular, electric power facilities including power plants, electric poles and power lines, they have not caused interruptions in oil supplies on the islands.
Historical experience and this analysis indicate that, following these types of local emergencies, the petroleum industry on Puerto Rico, the U.S. Virgin Islands and the Pacific islands can restore product flows to consumers in 30 days or less.
This is done by:
• Restoring damaged facilities
• Drawing down on-island commercial inventories
• Acquiring products from other areas.
There is no history of prolonged shortages of petroleum products in any previous on-isiand emergency. Even after Hurricane Hugo, which devastated St. Croix and caused the Hess St. Croix refinery to be shut down for 30 days, Hess reportedly maintained its supply commitments for delivery of petroleum products in the islands and the Mainland.
The principal vulnerabilities associated with local emergencies are not petroleum supplies.They are:
• Logistical problems in transporting products around the islands
Loading or off-loading crude oil and refined products in the event of damage to the docks or blockage of shipping channels.
Moving jet fuel to San Juan's Luis Munoz Marin International Airport in the event of damage to the Catano pipeline.
• Damage to island electric power distribution systems from hurricanes and other causes.
PREPA, WAPA and the Pacific islands electric/water utilities depend on petroleum for virtually all of their generation facilities. They can obtain supplies in a local emergency by:
• Using commercial oil inventories (their own and the oil industry's)
• Acquiring fuel off-island from various suppliers.
In addition, during local emergencies such as hurricanes, electricity demand declines due to damage at homes and businesses, which further reduces the utilities' need for petroleum.
Section 4: Energy Vulnerabilities 54

U.S. Department of Energy Insular Area Energy Vulnerability Study
The U.S. Virgin Island's long-term contractual relationship with Amerada Hess provides a unique level of oil supply security to the territory that is not available in other insular areas. This relationship offers the equivalent of a commercial strategic products reserve.
• The size of the Hess operation relative to U.S. Virgin Islands' oil demand insures a large on-island petroleum products inventory.
• Hess is contractually committed to meeting the U.S. Virgin Islands' essential petroleum requirements in an emergency.
• Hess has consistently met these commitments.
• Products are supplied on advantageous price terms.
Although Hess has no special arrangements with Puerto Rico, the Hess refinery's proximity to Puerto Rico puts its massive inventories and throughput within less than a day's shipment by barge.
4.5 Findings: Economic Impacts of Oil Supply Disruptions
4.5.1 Measurement of Economic Losses
Global oil supply disruptions adversely affect the economies of oil consuming areas such as the U.S. territories. Losses in GDP and terms of trade are widely used measures of economic impact. Other indicators are changes in inflation and unemployment rates.
Global oil disruptions generally cause GDP losses because the sudden increase in oil prices pushes the production cost of many goods and services higher than the price many consumers are willing to pay, which causes a decline in real consumption expenditures. The disruption usually also creates a more unfavorable investment climate, which leads to a decline in investment expenditures. This process occurs worldwide. Hence, foreign demand for goods and services produced in the U.S. Mainland and insular areas declines. Consumption expenditures, investment expenditures and sales of goods to other countries are all major components of GDP. As these fall, so does GDP.
GDP losses tend to be larger in the insular areas because of their total dependence on imported petroleum. In addition, most of the insular areas' economies (except American Samoa's and Puerto Rico's) are heavily tourism based, and tourism is disproportionately affected in the worldwide recessions that tend to follow global oil supply disruptions.
Oil disruptions also generally cause a transfer of wealth from net oil consuming economies to net oil producing economies. This loss is measured by the terms of trade loss. When oil consumers pay more for petroleum products in an oil disruption, they have less money to spend on other items. Hence, the oil price increase is equivalent to a wealth loss for oil consumers. This wealth that oil consumers lose is transferred to oil producers, who are receiving higher prices for their oil. Roughly, the terms of trade loss can be measured by changes in an economy's oil import bill. An economy that is relatively more dependent upon imports for oil consumption will suffer a relatively greater terms of trade loss in global oil supply disruptions.
Terms of trade losses resulting from a global oil supply disruption are proportionally larger in the insular areas than the U.S. Mainland for two reasons. First, the insular areas cannot currently use
Section 4: Energy Vulnerabilities 55

U.S. Department of Energy Insular Area Energy Vulnerability Study
other forms of energy in place of oil during a global oil supply disruption, hence their oil consumption will decrease proportionately less than will the U.S, Mainland's. This fact as well as the fact that oil demand is generally inelastic implies that the insular areas’ oil expenditures increase proportionately more than does the U.S. Mainland's, during a global oil supply disruption. Second, unlike the U.S. Mainland, all insular area oil must be imported, which means that oil import expenditures will increase proportionately more than the U.S. Mainland’s.
4.5.2 Data Sources
Data on the economic effects of past global oil supply disruptions were obtained from several sources. U.S. Mainland economic data were obtained from the Economic Report of the President. Puerto Rico economic data were obtained from the Informe Economico Al Gdbemado. These data included the Puerto Rico real GDP14, unemployment rate, and the IFO15, which is similar to the U.S. Mainland's CPI. The U.S.V.I.'s Bureau of Economic Analysis provided real Gross Territorial Product (GTP)16 and unemployment rate figures. Specific U.S.V.I. inflation data were unavailable.
Data on the impacts of past oil crises on the U.S. Pacific islands were unavailable because data have been collected only for the last several years. However, in order to provide a reasonable basis for assessment, the effects of the 1973-74 and 1979-80 oil crises on Fiji, Tonga and Vanuatu were analyzed based on a study of these economies which utilized a social accounting matrix (SAM) model. While the independent island nations have economies which are not as monetized as the U.S. Pacific islands, there are a number of similarities including the openness of the economies, concentration of economic activity in but a few sectors, and dependence on oil imports for commercial energy. All of the Pacific islands are "price-takers" subject to external events which they are unable to control. The results of the 1973-74 and 1979-80 analyses thus provided order of magnitude indications as to how the U.S. Pacific islands could be impacted by oil price shocks. These indications were corroborated by the limited data which were available, as well as by comments from government and private sector officials including on-island banks.
The effects of future global oil supply disruptions were estimated through a variety of models. The effects on U.S. GDP, terms of trade loss, and total economic loss were calculated by the Energy Information Administration's DIS model for CY 2000. The assumptions for the DIS model were formulated by the T-3 Working Group, which consisted of staff from the Council of Economic Advisors, the Office of Management and Budget, and the Department of the Treasury. The effects on Puerto Rico GDP were calculated by the Puerto Rico Planning Board's macroeconomic model for FY17 2000. The Puerto Rico terms of trade effect was calculated in a spreadsheet model developed for this study. The U.S.V.I. GTP was calculated using the VIEO jobs-impact model18. Although changes in GDP as a result of the crisis were unavailable for the Pacific islands, terms of trade loss as a
Puerto Rico GDP was deflated by the Puerto Rico Planning Board’s GDP deflator, whose base year was 1954.
IFO stand for Indice de Familia Obrera, or the Index of Working Families.
Virgin Island GTP was deflated by the U.S. mainland GDP deflator.
This is Puerto Rico fiscal year, which ends June 30.
The VIEO jobs impact model was adapted by Skip Laitner from the U.S. Forest Service Implan model, an input-output model that measures environmental impacts.
Section 4: Energy Vulnerabilities 56
U.S. Department of Energy Insular Area Energy Vulnerability Study
percent of GDP was available, and was calculated by dividing the change in the estimated BAU 2000 oil import bill by estimated BAU 2000 GDP for each island.
4.5.3 Past Global Oil Supply Disruptions
Where data were available, we calculated several indicators of the economic effect of past and potential global oil disruptions: GDP losses, proportionate terms of trade losses, inflationary effects, and a comparison of unemployment changes of past global oil supply disruptions.
The economic effects of past oil supply disruptions are shown in Table 18. The data capture what occurred in the recessions that resulted after the oil supply disruption. Data shown are average annual compounded growth rates, change in the growth rates, peak unemployment rates and changes from the pre-disruption unemployment rates, inflation rate and change in the inflation rate.
Section 4: Energy Vulnerabilities 57

U.S. Department of Energy Insular Area Energy Vulnerability Study
Table 18
Economic Effects of Past Global Oil Supply Disruptions: Caribbean
1973-74
Disruption
1979-80 1990-91
GDP Growth Rate
U.S. Mainland -0.72% -2.18% 0.72%
Puerto Rico -1.30% -1.30% 3.01%
U.S.V.I. 2.79% -4.72% -18.51%
Change from Pre-Crisis GDP Growth Rate
U.S. Mainland -5.8% -4.7% -1.8%
Puerto Rico -6.25% -13.98% -0.5%
U.S.V.I. -4.51% -6.94% -23.9%
Peak Unemployment Rate
U.S. Mainland 8.5% 9.7% 7.4%
Puerto Rico 20.0% 23.5% 16.5%
U.S.V.I. 10.8% 8.2% 2.8%
Change from Pre-Crisis Unemployment Rate
U.S. Mainland 2.9% 3.9% 1.9%
Puerto Rico 8.3% 6.0% 2.2%
U.S.V.I. 6.2% 2.6% 0%
Inflation Rate
U.S. Mainland 9.6% 11.2% 4.7%
Puerto Rico 14.2% 9.1% 4.1%
Change from Pre-Crisis Inflation Rate
U.S. Mainland 3.6% 0.5% 0.4%
Puerto Rico 11.0% 4.1% 0.2%
Section 4: Energy Vulnerabilities 58

U.S. Department of Energy Insular Area Energy Vulnerability Study
Several conclusions may be drawn from this table:
• The 1973-74, 1979-80 oil crises affected the Puerto Rico economy more adversely than the U.S. Mainland economy. The economic impact was moderately more severe in Puerto Rico in the 1973-74 crisis and much more severe in the 1979-80 crisis.
• The 1990-91 Persian Gulf crisis had a slight, if any, long term economic impact in Puerto Rico. A larger impact likely resulted from the U.S. recession that independently began in the third quarter of CY 1990. The Puerto Rico economy appears to have been no more severely impacted than the U.S. Mainland economy as a result of the crisis.
• The Virgin Islands economy appears to have suffered sharper impacts from past global oil crises than the U.S. Mainland. Economic activity is affected later than on the U.S. Mainland, and recovery appears to be somewhat faster. Tourism, the most important industry in the Virgin Islands, declines contemporaneously with U.S. economic recessions, but the overall economy tends to show the effects a year later. This is a result of incidental employment declines and large increases in inflation.The economic effects of the Persian Gulf crisis are obscured by the economic aftereffects of the post-Hurricane Hugo rebuilding effort. The U.S.V.I. economy expanded greatly in 1990 as a result of extensive rebuilding, and slowed when these rebuilding efforts declined in 1991.
The data on the economic effects of past disruptions on the Pacific areas were very limited. Most information then, is anecdotal. Still, some patterns are apparent. These can be summarized as follows:
• Inflationary effects of the 1979-80 oil supply disruptions appear to have been much worse in the Pacific areas than in the U.S. Mainland. This is illustrated by Guam's experience, which is the only area that has past disruption inflation data. The Guam inflation rate averaged about 20% in 1980 and 1981, while the U.S. inflation rate averaged about 11% during this period. Inflation immediately before and after this crisis were comparable between the U.S. Mainland and Guam.
• Guam, the CNMI and Palau also suffered a large drop in revenues from the tourism industry, which is the main industry for these islands. This would ordinarily lead to a decline in island GDP.
• All Pacific island economies, including the American Samoa economy, have also suffered from the U.S. Mainland recessions that have resulted from past global oil supply disruptions.
4.5.4 Potential Global Supply Disruptions
Table 19 presents the impacts upon U.S. and Puerto Rico GDP, terms of trade, and inflation under a variety of global disruption scenarios relative to a business as usual base case for the year 2000. The scenarios were defined and described fully above.
Section 4: Energy Vulnerabilities 59

U.S. Department of Energy Insular Area Energy Vulnerability Study
Table 19
Economic Effects of Potential Future Global Oil Supply Disruptions: Caribbean
ScenarioBAU2000
Glo
Low
ball
High
Global IIILow | High
GDP $ Change
U.S. Mainland (trillions of 1987 $) 6.05 6.01 5.979 6.038 6.007
Puerto Rico (billions of 1991 $) 44.1 43.727 43.096 43.981 43.68
U.S.V.I. (billions of 1987 $) 1.480 1.459 1.436 1.474 1.457
GDP % Change
U.S. Mainland -0.68% -1.19% -0.22% -0.72%
Puerto Rico -0.91% -2.34% -0.34% -1.02%
U.S.V.I. -1.43% -2.97% -0.004 -1.54%
Terms of Trade Change
U.S. Mainland (billions of 1987 $) -35.51 -81.8 -12.61 -53.42
Puerto Rico (millions of 1991 $) -467.5 -989.1 -134.6 -508.3
Terms of Trade Change as % of BAU 2000 GD 3
U.S. Mainland -0.59% -1.35% -0.21% -0.88%
Puerto Rico -1.06% -2.24% -0.31% -1.15%
Total Economic Loss1
U.S. Mainland (billions of 1987 $) -86.09 -182.09 -33.63 -123.16
Puerto Rico (millions of 1991 $) -870.5 -2023.1 -283.6 -958.3
Total Economic Loss as % of B AU 2000 GDP
U.S. Mainland -1.42% -3.01% -0.56% -0.88%
Puerto Rico -1.97% -4.58% -0.64% -2.17%
Effect on inflation
U.S. Mainland 1.01% 1.79% 0.33% 1.08%
Puerto Rico 0.92% 2.35% 0 1.02%
Notes: 1. For the U.S. Mainland, Total Economic Loss is defined as (GDP Loss + Terms of Trade Loss - SPR Revenues). For Puerto Rico, Total Economic Loss is defined as (GDP Loss + Terms of Trade Loss).
Section 4: Energy Vulnerabilities 60

U.S. Department of Energy Insular Area Energy Vulnerability Study
As can be seen in Table 19, the Puerto Rico and U.S.V.I. economy are more adversely affected by potential global oil supply disruptions. For small disruptions, such as the Global HI Low disruption, there is little difference in economic effects between the U.S. Mainland and the Caribbean insular areas. However, in a very severe disruption such as Global I High, the adverse economic impacts are much greater in Puerto Rico and the U.S.V.I. than in the U.S. Mainland.
The effects of future global oil supply disruptions on the terms of trade in the Pacific areas are shown in Table 20. The data were obtained from the East-West center's analysis of global oil supply disruptions. For the Pacific areas they considered the Global I scenario, which they assumed would lead to a doubling of oil prices for the islands. The U.S. Mainland data presented here are from the Global I High sub-scenario, which implies a greater than doubling of oil prices for the U.S. Mainland. Even so, the terms of trade losses are much greater than the U.S. Mainland.
Table 20
Effects of Future Global Oil Supply Disruptions: Pacific
Scenario (Year 2000) Doubling of Oil Prices
Terms of Trade Loss as % of BAU 2000 GDP GDP Imports Change
U.S. Mainland (billions of 1987 $) -1.35%
American Samoa 362 68 io oor“1.0.0 /V
CNMI 3,048 200 -6.6%
Guam 4,400 295 -6.7%
Palau 130 21 -16.2%
As can be seen in Table 20, the terms of trade impact is much more severe in the Pacific insular areas than in the U.S. Mainland. For the larger economies, namely the CNMI and Guam, the terms of trade impact is five to seven times larger than the U.S. Mainland. The terms of trade impact in the smaller economies is even more severe.
4.6 Summary of Key Vulnerabilities and their Implications
It is clear all the insular areas possess unique or incremental energy vulnerabilities relative to the U.S. Mainland. The central finding from DOE's assessment of these vulnerabilities is, however, that these have not led to greater supply losses but they do cause greater economic losses versus the Mainland.
• Despite the existence of unique energy vulnerabilities, historical data together with reports from island government and industry officials do not point to any past shortages in island oil supplies.
• A future "worst case" global oil disruption could cause temporary oil supply difficulties in the Pacific islands and Puerto Rico. During this time, the islands would needto rely on available inventories until regional supply imbalances were rectified. The
Section 4: Energy Vulnerabilities 61

U.S. Department of Energy Insular Area Energy Vulnerability Study
islands would be unlikely to experience actual oil supply shortages due to the availability of on-island inventories, responses of oil companies serving the islands, and releases of strategic oil stocks by the U.S. and other IEA countries.
The U.S. Virgin Islands enjoy a unique supply situation among the insular areas by virtue of the on-island existence of a huge oil refinery coupled with associated supply agreements.
Puerto Rico's refining sector constitutes an important inventory security buffer; however, this would largely disappear if the island's refining sector declines.
The principal consequence of the islands' unique energy vulnerabilities is the occurrence of higher economic losses than the Mainland whenever disruptions happen.These heightened economic impacts occur because oil - and therefore oil price - plays a greater role in the island economies and because these economies are small, lack the diversity of the Mainland and are heavily reliant on tourism which tends to decline severely during and after disruptions.
Section 4: Energy Vulnerabilities 62

U.S. Department of Energy Insular Area Energy Vulnerability Study
5 OPTIONS FOR ACCESSING VITAL OIL SUPPLIES IN AN EMERGENCY
5.1 Introduction: Scope of Response Options Evaluated
Experience has shown that local emergencies are unlikely to cause a sustained major oil supply disruption in the islands. The most likely effect of hurricanes, typhoons and earthquakes on oil supply systems is damage to docks and oil storage facilities and to electric power facilities that serve them. This damage would create problems for distributing available oil supplies. However, island dock and storage facilities have survived severe storms relatively unscathed.
The analysis of past global disruptions has shown that the islands have consistently maintained continuous supplies. Analysis of possible future global disruptions does indicate that the islands could suffer supply interruptions under severe conditions, particularly early on in a disruption. The principal negative consequence of oil supply disruptions is, however, that the islands suffer heavy economic losses from the high oil prices obtaining during the disruption.
Given these impacts of possible local emergencies and global disruptions, efforts to increase energy security in the U.S. insular areas need to focus on: (1) methods for coping with temporary shortages that can occur until local petroleum distribution problems are resolved, or new regional supply-demand balances are established; and (2) ways to mitigate the price increases from global oil disruptions.
In recognition of the requirements of the Energy Policy Act of 1992, this section concentrates on options to enhance "access to vital oil supplies". Section 6 focusses on means to improve energy emergency preparedness and to reduce energy vulnerability over the longer term.
Several of the options considered would improve physical "wet barrel" oil supplies without alleviating oil price - and therefore economy - impacts. Others, such as conservation and fuel diversification, would restructure energy demand so as to reduce the role of petroleum on the islands. Further options, notably an island-owned oil reserve and revolving oil futures contracts, would secure additional physical supplies and help mitigate disruption price effects.
It should be noted that both Puerto Rico and the U.S. Virgin Islands have energy emergency response plans approved or under development. These plans contain a variety of response measures, such as demand management, that the island governments could implement in an energy emergency.It should also be noted that the options considered here are incremental to SPR drawdown, IEA response measures and possible additional actions such as relaxation of monetary policy. The islands would all benefit from the supply and prices impacts of these national/intemational measures.
5.2 Increase in Commercial Stocks
Puerto Rico and the Pacific islands could increase on-island inventories available for an emergency by requiring the petroleum companies on the islands to maintain excess inventories.19 Some European countries have followed this approach in connection with their participation in the International Energy Agency. In order to avoid putting island refiners and distributors at a
There would be little benefit from a hypothetical U.S. Virgin Islands' government requirement that Hess maintain excess inventories because Hess’ normal inventories of 12-15 million barrels vastly exceed the 9,000 bpd U.S. Virgin Islands' demand.
Section 5: Options for Accessing Vital Oil Supplies 63

U.S. Department of Energy Insular Area Energy Vulnerability Study
competitive disadvantage compared to off-island suppliers, the island government would probably want to compensate companies for the additional cost, which might be paid for by a tax on island oil users. Pacific islands consumers would also tend to bear the cost of increased inventories. The increased stocks approach has the following advantages and disadvantages:
• Advantages:
Stocks can be released upon the order of the island government; no Presidential action is required as would be the case with a Federally-owned island SPR.
Products remain within the industry supply system which facilitates rapid access and inventory turnover.
All of the costs are passed along to oil users.
• Disadvantages:
Each island would need to establish a program for compensating companies and monitoring company compliance with inventory requirements. This could be complicated and/or costly.
Some of the international oil companies that have participated in the European countries' mandatory stock programs have argued that government held reserves are better than mandatory excess commercial reserves because government reserves:
Are more credibleHave greater positive psychological impactAfford greater supply flexibilitySpread costs among all taxpayers not just oil users.
Puerto Rico and the Pacific islands would need to assess whether the advantages outweigh the disadvantages in their own situation.
5.3 Island-Owned ProducLReserve
Another option examined was the concept of an on-island strategic products reserve that would be owned and controlled by the islands. Such a reserve could be developed by Puerto Rico alone or by Puerto Rico and the U.S. Virgin Islands together, or by Guam or the Pacific islands acting together. Compared to, say, Hawaii, where construction and land costs are high, the concept of an island reserve is of interest in the insular areas, in part because of the existence on Puerto Rico (at the closed CORCO refinery) and on Guam (at the Shell Guam closed GORCO refinery) of several million barrels of surplus petroleum tankage.
The concept of an island-owned reserve could be implemented in several ways. One possible implementation includes the following elements:
• Financing
Section 5: Options for Accessing Vital Oil Supplies 64

U.S. Department of Energy Insular Area Energy Vulnerability Study
An island government authority would issue tax-exempt revenue bonds to pay for the reserve.
A dedicated tax would be levied on participating islands' oil consumption to pay the principal and interest on the bonds.
Storage
Storage capacity would be leased from private companies on the basis of lowest bid cost for storage and inventory turnover.
The CORCO refinery on Puerto Rico's south coast has tankage available, and CORCO officials expressed serious interest in the concept. Shell Guam officials are also understood to be interested in examining schemes for utilizing their surplus tankage
Operation
The reserve would be operated by a petroleum company under contract to the island government.
Upon order of the island government during an emergency, oil from the reserve would
either be released at zero price into island markets. Reserve oil wouldcombine with other oil supplies purchased at market prices so that the effective price to oil users would be a weighted average below the market price.
OL be sold into the market at the highest obtainable price and then the sales revenue rebated to oil users, possibly as a reduced or negative sales tax20.
Both options would have the equivalent effect of lowering the average price of oil to island users.
Under the zero price system an allocation or set-aside system would be used to distribute the reserve among interested parties.
Price controls would be applied to prevent the reserve oil from rising to market prices (under the zero price system) and to prevent windfall profits by oil companies
Export controls would be needed to prevent reserve oil from being exported and re-imported as market oil.
Benefits
Either option would require considerably more analysis to assess its administrative feasibility and market impacts.
Section 5: Options for Accessing Vital Oil Supplies 65

U.S. Department of Energy Insular Area Energy Vulnerability Study
During an oil disruption, product prices would reflect a weighted average of zero-priced supplies from the reserve and market-priced supplies from the open market. This would mitigate the impact of the usual price spike on the island economies (although not the impact of a slowdown in the U.S. Mainland economy).
During the period of reserve build-up, the tax on oil consumption would encourage further conservation efforts by oil users.
Issues
Operation of the reserve would require a complex administrative system that may prove unworkable. In particular, it would require some or all of emergency price controls, allocation, and export controls. All of these elements would need to be available only on a standby basis. On Puerto Rico, the Governor could still proceed with previously announced intentions to dismantle the island's current system of gasoline price controls.
Detailed analysis is required to assess whether the beneficial impact of the reserve in a disruption would exceed the cost of creating and maintaining the reserve, although such initial indications for Puerto Rico are that the net benefits could be positive. (See below.)
Environmental risks associated with a local reserve, and liabilities assumed by the island government, would need to be assessed.
The economics of an island-owned products reserve depends on numerous factors, including: the size of the reserve, the number of years the reserve is in place before a disruption, the magnitude and duration of the oil price increases during the disruption, the price of oil when the reserve is being filled, interest rates, annual costs for leasing storage capacity, the rate of growth in real oil prices over time, the administrative cost burden of price controls and allocation during the disruption, and the economic benefit to the insular economies from mitigating oil price spikes.
As part of this study, numerous cases were examined for an island-owned reserve on Puerto Rico. These employed a range of values for the above factors.21 It was found that for a 5 million barrel reserve, benefits exceeded costs under a wide range of reasonable parameter values. This finding appears to be due to the following factors:
• The ready availability of a large amount of existing storage tankage that could be leased on a long term basis for 15 to 20 cents per barrel per month including inventory turnover. This is at the low end of storage costs estimated in earlier studies.
• The relatively low current price of oil, enabling reserve acquisition at modest cost and the possibility of real growth in reserve "business-as-usual” value.
Environmental risks and administrative costs were not assessed as part of the study.
Section 5: Options for Accessing Vital Oil Supplies 66

U.S. Department of Energy Insular Area Energy Vulnerability Study
• The presumed use of tax-exempt revenue bonds to finance the reserve. This lowers the real discount rate for the island to about 3 percent, compared to a 10 percent real discount rate for a Federal SPR.
• Use of a comprehensive measure of economic benefits that includes both the improvement in GDP and the improvement in the terms of trade that result from lower island oil prices. This is the approach adopted by a Federal interagency working group for estimating the economic benefits of the U.S. SPR.
The tax on island oil consumption required to finance the reserve would be on the order of 1 to 2 cents per gallon depending on the reserve size and the other factors mentioned earlier. Environmental risks and administrative costs were not considered in the above analysis. Sufficient data were not readily available for a parallel analysis for the Pacific islands. However, it was estimated that a similar 1 to 2 cents per gallon tax would be required to finance a reserve on Guam, assuming existing Shell company tanks were utilized.
5.4 Regional Support Alliances
The location of the huge Hess refinery on St. Croix, and the special relationship that has been negotiated between Hess and the U.S. Virgin Islands' government, provides the U.S. Virgin Islands with a level of security that is unmatched among the other insular areas. While it is unlikely that Puerto Rico could match that arrangement, benefits could flow from bilateral or multilateral mutual support agreements that Puerto Rico might negotiate with other Caribbean islands cr suppliers.Possible candidates include the U.S. Virgin Islands (Hess Oil), Trinidad (TRINTOC), Mexico (PEMEX), and Venezuela (PdVSa).
These agreements could take the form of guarantees to supply certain volumes of crude and/or products under defined emergency circumstances, including both global disruptions and local disasters. In essence, such agreements would be insurance policies and would likely include an initial or continuing cost.
Similar agreements could be considered by the Pacific islands.
Papua New Guinea (PNG) is currently producing 135,000 bpd of crude, which is being refined in Australia, the U.S. West Coast, in Japan, and other Pacific countries. (PNG is planning to build a 30,000 bpd refinery at Port Moresby. Refined products would be for domestic consumption and for exports to other Pacific islands.) As with other oil-exporting nations, PNG would like to receive the highest value for the exploitation of its national resources. However, if market prices are paid for PNG crude, then it might be possible to initiate discussions on some type of guaranteed supply arrangement between PNG and all of the Pacific islands. The supply agreement would stipulate that in the event of an oil crisis (and crises would have to be well-defined), PNG would guarantee access to supply of crude (that presumably could continue to be refined in Australia) or of products. PNG may be willing to consider this arrangement if all of the Pacific islands (independent nations and territories) jointly make the proposal. However, PNG may also wish to consider some type of reciprocal arrangement whereby its access to certain goods or services would be guaranteed. This could include preferential status for trade, official lending, or other assistance mechanisms provided by the United States. It should also be noted that the PNG crude is of very high quality and would be a very good match to the configuration of the now closed GORCO refinery on Guam.
Section 5: Options for Accessing Vital Oil Supplies 67

U.S. Department of Energy Insular Area Energy Vulnerability Study
Other Asia-Pacific nations such as the Philippines and Japan might also be able to offer alternatives to supply from Singapore. Both nations have major refining facilities which could be utilized to process crudes provided via alternative suppliers. Additional assessment of this option by the islands may be warranted.
5.5 Oil Futures Market Hedging
The petroleum futures markets that have evolved in the last ten to fifteen years provide oil producers, processors, traders and consumers with a variety of "paper barrel" mechanisms to hedge against the uncertainty inherent in the market. For consumers in particular, they provide a way to lock in future supplies at a known cost.
It is conceivable that island governments could establish and maintain a set of rolling futures contracts covering designated volumes of gasoline and other products. Futures contracts generally run out a maximum of twelve months into the future and the timing of disruptions is, by their nature, uncertain. Therefore, the total volume of each product to be covered would have to be divided into, say 6 or 12 contracts, each expiring in a different month. This would provide coverage of 10/12 or 11/12 of the product volume at undisrupted prices at all points in time.
The effect of exercising the contracts in an emergency would be to both provide "wet" barrels and mitigate the effects of oil price increases. The value of this option would depend on the level of transaction costs associated with maintaining and turning over multiple futures contracts.
5.6 Standby Line of Credit
The U.S. Virgin Islands reported that one difficulty they experience during oil disruptions is a cash flow problem at their electric power authority (WAPA), which suddenly may need to pay considerably more for petroleum but which requires a longer period of time to raise electric rates to recover the higher costs. Nor apparently is WAPA able to maintain large enough cash reserves to resolve the problem. The same problem may exist with the other island electric utilities.
One option that might be explored to deal with this problem would be to negotiate a standby line of credit with a financial institution. The line of credit may (or may not) carry a monthly fee, in addition to interest costs, but would provide additional liquidity in times of emergency.
5.7 Emergency Access Jo U^S._MiMtary.Petroleum„Suj^lies
The Defense Department's Director of Military Support (DOMS) recently issued for the Secretary of the Army a draft DOD Manual for Civil Emergencies, 3025.1 M which provides policy guidance for DOD elements on assisting during civil emergencies. The new DOMS' policy document may allow the U.S. Caribbean and Pacific islands short-term access to military fuel supplies, electric power and equipment during major emergencies. Under this program, insular governments could arrange with DOD officials to access military resources on a short term emergency basis. Such access could be granted after regional and local military commands have assessed their own mission requirements and determined what immediate assistance they could provide.
The U.S. military has substantial storage capacity for petroleum products on the U.S. Pacific islands, including Hawaii and Guam. Storage capacity on Hawaii is estimated to be about 4.7 million barrels, principally jet fuel (JP-5 and JP-8) and diesel marine fuel (F-76), as well as No.2 diesel and gasoline. Estimated storage capacity on Guam is 2.7 million barrels, principally jet fuel and diesel
Section 5: Options for Accessing Vital Oil Supplies 68

U.S. Department of Energy Insular Area Energy Vulnerability Study
marine fuel, as well as gasoline. Actual inventories are estimated to average about 70 percent of capacity. U.S. Pacific island petroleum demand (excluding Hawaii) averages about 26,000 bpd. On American Samoa and Palau, the demand is principally diesel, gasoline and jet fuel. Guam and CNMI also use diesel, jet and gasoline, but additionally rely heavily on residual fuel for power generation. With some adjustment and/or retro-fitting, the residual-fired generators could run on the military's diesel marine fuel. Thus, the inventory of U.S. military supplies could provide the islands with a huge buffer stock of gasoline, jet fuel and fuel for power generation until other supplies could be acquired on the open market.
Under current policy, the military would need to be reimbursed for fuel supplies it provided. Reimbursements could come from the local government or from the Federal Emergency Management Agency (FEMA) in the event of a major local disaster.
The option of accessing military supplies could be effective in addressing the islands' vulnerability to a temporary shortage since the supplies (and equipment) could be made available relatively quickly. Thus, the military supplies would provide a back-up option in the event the local oil industry was having temporary difficulty with resupply. The main uncertainty would be whether the crisis situation were one in which the military might need to hold all supplies for its own requirements. This likelihood cannot be known in advance.
Additionally, because the military would require reimbursement, access to military supplies may not mitigate the high oil prices during a disruption. That is, if reimbursement would be based on the oil's original (undisrupted) cost, the islands would receive a substantial price benefit. However, if reimbursement would be based on replacement cost, and oil markets were still in a disrupted state, then the islands would be paying for the oil at disrupted prices and no price mitigation would occur.
The U.S. military also maintains an inventory of petroleum products in Puerto Rico and the U.S. Virgin Islands. An analysis was conducted to determine whether access to these supplies in an emergency might benefit these insular areas. Discussions with the Department of Defense indicated that the military has 36,000 barrels of petroleum storage capacity in Puerto Rico and 500 barrels in the U.S. Virgin Islands. Actual inventories are reportedly maintained at about 70 percent of capacity. These quantities are clearly too small to be of any significant value during a global oil emergency. Puerto Rico's daily petroleum demand is nearly 170,000 barrels excluding refinery demand.
5.8 Guaranteed Insular Area Access to the SPR
During the last session of Congress, two bills, H.R. 2314 and S. 836, were introduced that would have guaranteed the insular areas access to SPR crude oil. These bills did not pass but would have guaranteed the U.S. insular areas (including Hawaii) access to the SPR. The bills stipulated that the price paid for the petroleum be the market rate. Also under the proposal, the U.S. Pacific islands would have priority status at SPR docking facilities. However, the islands would be responsible for chartering tankers and refining the crude. The bills would not guarantee transport or processing.
Analysis indicates that guaranteeing access to the SPR might not be effective in addressing the U.S. insular areas' main vulnerabilities. As noted previously, the islands' vulnerabilities are the temporary shortages of petroleum supplies that could accompany a disruption, and the economic impacts of high oil prices. The proposal may not help with temporary shortages because of the time required before refined products would reach the islands. Oil released from the SPR to the islands could be exchanged for product in the Asia-Pacific market. However, the refined product would not reach the islands immediately after the onset of the disruption due to the time required for the initial
Section 5: Options for Accessing Vital Oil Supplies 69
US Department of Energy Insular Area Energy Vulnerability Study
sale and delivery of the SPR crude oil to the exchange partner(s) and for concluding exchange arrangements. Direct deliveries of SPR crude oil to the islands would require even more time; current procedures require a minimum of 15 days for DOE to announce the sale of SPR crude, for companies to submit bids, and for DOE to review the bids and award contracts. An additional 15 to 30 days would be required for the SPR crude to be transported to a refinery, refined, and for the products to be transported to the islands and then locally distributed. Thus petroleum from the SPR may take longer to reach the islands than petroleum supplied by the companies serving the islands.
The release of the SPR would have the effect of lowering global oil prices. However, because the preferential SPR crude for the insular areas would still be sold at the prevailing bid price, this option would not mitigate the disruption price spike any more than without the guarantee. Thus it could increase physical supply to the islands but would not reduce their primary vulnerability to economic losses due to higher oil prices.
Finally, establishing special arrangements for these islands to have guaranteed access to the SPR during an emergency could interfere with efficient execution of SPR sales and distribution procedures.
5.9 Island Component of the Federal SPR
The objectives of an SPR on Puerto Rico, Guam or Hawaii would be (1) to provide local supplies of crude or petroleum products over a given time period until other supplies become available and (2) to mitigate short-term petroleum price increases. However, a Federal SPR on the islands would not accomplish either goal. It is reasonable to assume that an island component of the Federal SPR would have to operate according to existing SPR drawdown procedures. This means that release of the island SPR would require a Presidential decision, and the oil would be sold to the highest bidders. Under these conditions, an island component of the Federal SPR would provide little benefit to the islands, compared to the current, centrally stored reserves. In particular:
• The sales process would require a minimum of 15 days before oil could be delivered from the reserve. Additional time would be required for distribution of products to end users, or, if crude were stored, for transportation, refining and distribution to end users. Thus, the reserve would not help with temporary shortages.
» The size of the reserve would be too small to have any effect on world oil prices. Nor would it have much effect on island oil prices because the winning bids would be close to world prices except for transportation cost differences.
• The reserve may not significantly increase on-island supplies available during an emergency if some successful bidders reallocate their supplies elsewhere.
• The costs of establishing and maintaining Federal SPRs, especially product reserves would be high.
5.10 Concluding Comments
The options described above provide a range of alternatives for Puerto Rico, the U.S. Virgin Islands and the U.S. Pacific islands to consider as additional responses to emergencies. The Department does not presume to recommend a "best" option but has attempted to assess the strengths and weaknesses of each so that the island governments can evaluate each one from their own perspectives.
Section 5: Options for Accessing Vital Oil Supplies 70

U.S. Department of Energy Insular Area Energy Vulnerability Study
6 OPTIONS FOR IMPROVING EMERGENCY PREPAREDNESS AND REDUCING ENERGY VULNERABILITY
The preceding section described response options that could be applied during an energy emergency. This section identifies strategies that could be followed to prepare more effectively for emergencies and to reduce vulnerability to emergencies. The following range of strategies is discussed:
• Enhanced Institutional Preparedness
• Increased Energy Conservation & Efficiency
• Fuel Diversification
• Definition of Potential Oil and Gas Reserves (Puerto Rico only)
• Petroleum Refining and Distribution System Enhancement (Puerto Rico only)
• Reduced Petroleum System Physical Vulnerability (Puerto Rico only)
Each is discussed in turn below.
6.1 Institutional Preparedness
6.1.1 The Caribbean Islands
Puerto Rico and the U.S. Virgin Islands are currently working on their energy problems generally and energy vulnerability in particular. While this report was in preparation, Puerto Rico independently formed an interagency task force charged with recommending short, medium and long term strategies for island energy supplies and institutions. The U.S. Virgin Islands was pursuing leadership initiatives in establishing renewable energy as a viable alternative for island energy supplies. The Department wishes to reinforce these efforts by suggesting additional continuing steps to strengthen the institutions responsible for energy and energy emergencies. The following steps might be considered:
Puerto Rico:
• Designating or re-establishing an organization with clear responsibility for energy emergency planning and response. To encourage industry cooperation, this organization should be separate from the institution responsible for gasoline price regulation if those regulations are continued.22
• Completing and adopting an energy emergency plan.
In November 1993 the Puerto Rico legislature enacted a reorganization bill that would among other things establish an energy organization along these lines. The Governor was expected to sign the bill.
Section 6: Options for Reducing Vulnerability 71

U.S. Department of Energy Insular Area Energy Vulnerability Study
. Fostering coordination between government and the energy industry in energy emergency planning, testing and response.
• Developing an integrated energy planning capability.
• Developing and maintaining energy data sufficient to support plan development and implementation.
U.S. Virgin Islands:
• Continuing to develop and conduct simulation exercises for their energy emergency plan.
• Fostering increased coordination between the government and Amerada Hess in energy emergency planning, testing and response.
• Continuing to develop and maintain energy data sufficient to support energy emergency planning and plan implementation.
6.1.2 The Pacific Islands
All the U.S. Pacific islands have energy offices. However, they were created primarily to improve energy conservation and explore the potential of renewable energy technologies. As a result, the scope of their mandate is too limited to provide adequate long-term energy and energy emergency planning. The island energy offices also do not gather basic energy data on a regular basis, although Guam's energy office is currently strengthening its data gathering efforts as a result of the Typhoon Omar emergency in 1992. Several improvements can be made to strengthen the offices' energy emergency preparedness and comprehensive energy planning. The following steps might be considered:
Clearly delineating and expanding responsibilities of the energy offices and the electric utilities to include long-term energy planning and energy emergency planning and response.
Creating and regularly updating an energy database for each island territory that contains basic information on petroleum imports, petroleum consumption by sector, and electricity consumption. The island governments could work with the oil companies and local electric utilities to achieve this goal.
Developing an integrated energy planning capability.23
Hawaii is currently developing the Hawaii Energy Strategy (HES), including integrated energy resource planning. When the study is completed, it could serve as a model for energy planning for the insular areas.
Section 6: Options for Reducing Vulnerability 72

U.S. Department of Energy Insular Area Energy Vulnerability Study
• Completing and adopting an energy emergency plan, and gathering sufficient data to support the adoption and implementation of the energy emergency plan. (Only American Samoa has an energy emergency plan)
• Fostering coordination between government and the energy industry in energy emergency planning, testing and response.
• Developing energy demand management programs that could be implemented in an energy emergency.
• Establishing an "economic buffer fund" that could be used to blunt the effects of higher oil prices in energy supply disruptions. Activation of the fund in an energy emergency could partially offset the deleterious economic effects of higher oil prices by increasing aggregate demand in the territorial economies. However, this may be less effective
6.2 Increased Energy Conservation and Efficiency
6.2.1 The Caribbean Islands
Electric power plants and motor vehicles consume 2/3 of the petroleum used in Puerto Rico and somewhat more than that in the U.S. Virgin Islands. Increased energy conservation and efficiency in these uses could slow the growth in oil demand and, thus, contribute to reduced dependency on petroleum. Some options the islands may wish to consider are:
Electric power:
• Demand side management (DSM) - is yielding measurable savings in kw and kwh among U.S. Mainland electric utilities. There may be opportunities for PREPA and WAPA to expand their DSM initiatives.
• Cogeneration - Cogeneration offers increased energy efficiency compared to separate production of electricity and steam/heat. Puerto Rico's Generation Task Force is currently considering cogeneration as well as other electric power options for PREPA. WAPA's co-production of electricity and desalinized water is an existing form of cogeneration.
Transportation:
• Mass transit - The San Juan metropolitan area may be suitable for increased use of mass transit.
Mass transit would reduce petroleum use per passenger-mile.
Some mass transit options could also rely on non-petroleum energy sourcessuch as electricity or natural gas.
Van pooling is a low cost option
Section 6: Options for Reducing Vulnerability 73

U.S. Department of Energy Insular Area Energy Vulnerability Study
• Vehicle fuel economy - Both Puerto Rico and the U.S. Virgin Islands may want to consider the following options to increase vehicle fuel economy:24
Higher fuel economy standards for new automobiles
Vehicle inspection programs
Higher sales tax on new vehicles with lower fuel economy (widespread in Europe and adopted in Maryland but implementation delayed by the Bush Administration)
"Clunker" buy-back program (used in California)
Carburetor retrofit program for older cars
6.2.2 The Pacific Islands
The most feasible area in which to pursue conservation and efficiency measures is in electric generation. Electric power plants consume between 16% and 43% of total petroleum used in the U.S. Pacific islands.25 The other major uses of petroleum include diesel fuel for marine transport, especially in American Samoa, and jet fuel. Further efficiency improvements in marine and air transport are likely to be limited. Gasoline use for ground transportation comprises a fairly small share of total petroleum demand. The relatively low use of ground transportation vehicles implies that only a small energy savings would be achieved by employing auto efficiency incentives that are commonly used in the U.S. Mainland. However, increased energy conservation and efficiency improvements in electric generation and consumption are feasible. If implemented, these improvements could slow the growth in oil demand and thus contribute to reduced dependency on petroleum. Some options the islands may wish to consider are:
• Electric pricing - eliminate the substantial subsidies for electricity to encourage conservation.
• Demand side management (DSM) - is yielding measurable savings in kw and kwh among U.S. Mainland electric utilities. There may be opportunities for utilities in the U.S. Pacific islands to formulate DSM initiatives. Guam has already implemented some DSM programs, and it could expand its initiatives to achieve further energy savings.
• Cogeneration - Cogeneration offers increased energy efficiency compared to separate production of electricity and steam/heat. Possible application sites include the tuna canneries on American Samoa, and hotels on Guam and the CNMI.
These options would also reduce vehicle emissions.
By island, composition is as follows: American Samoa, 16%; CNMI, 41%; Guam, 43%; and Palau, 33%.
Section 6: Options for Reducing Vulnerability 74

U.S. Department of Energy Insular Area Energy Vulnerability Study
6.3 Fossfl Fuel Diversification
Puerto Rico, the U.S. Virgin Islands and the U.S. Pacific islands recognize that they can best reduce their petroleum dependency and vulnerability by following a long term program to diversify their energy supply. This section offers some suggestions on possible strategies. Two broad strategies are discussed: one involving diversification among fossil fuels; the second relying on renewable energy forms. Elements of both strategies could also be combined.
6.3.1 Puerto Rico
PREPA's fuel mix heavily influences the future viability of Puerto Rico's refineries and the island’s future petroleum dependency. PREPA fuel demand comprises over 45 percent of nonrefinery petroleum consumption on Puerto Rico. To comply with tightening EPA emissions standards, PREPA is shifting to lower sulfur, lower metals residual fuel oil. This adversely impacts Puerto Rico refiners' economics. They are able to supply residual fuel at 2+% sulfur but cannot do so at 1 % sulfur or lower without switching to high cost crude oils or blendstocks, or investing in new process facilities. The most likely outcome, already evident in island import-export data, is that island refiners will have to export high sulfur residual and import low sulfur to satisfy PREPA. The effect is twofold: (1) an uneconomic double haul of residual fuel and (2) the investment to produce low sulfur residual or otherwise meet PREPA's emission goals is, effectively, exported elsewhere.
Recognizing the adverse impact on island refiners, PREPA could consider alternatives to residual fuel sulfur reduction. One option would be scrubbing of power station stack gasses to remove sulfur and nitrous oxides. This would enable local residual fuel supplies to be maintained and would lower the price paid for residual fuel under both business-as-usual and disruptions. Consideration should be given to the broadly projected widening of the gap between low and high sulfur residual fuel prices as shifts from high to low sulfur residual fuel are mandated in Europe, the Far East and elsewhere over the next five to ten years.26
Further steps, such as those for co-generation facilities already under consideration, would reduce Puerto Rico's dependency on petroleum through using coal, Orimulsion or liquefied natural gas (LNG) as fuels for power generation. All of these options reduce vulnerability to petroleum supply and price disruptions since prices of these three fuels are not so directly tied to crude oil prices and move less sharply in disruptions.
Introduction of LNG in particular opens up a range of options for reducing vulnerability while maintaining island refinery economics and complying with environmental targets. Since LNG is a clean-burning fuel, PREPA burning a 50/50 mix of LNG and 2% sulfur residual fuel would generate emissions comparable to those from 1 % sulfur residual. Island refiners would be able to economically supply the 2% sulfur residual fuel and island vulnerability to petroleum price disruptions would be cut.
Puerto Rico could evaluate the benefits of expanding an initial LNG project - based, say, on the South Coast - to other markets in Puerto Rico. Construction of a trans-island pipeline (probably to
Recent studies have suggested that the price differential between low and high sulfur residual fuel could widen to $4-6 per barrel by the year 2000 compared to $1-3 now.
Section 6: Options for Reducing Vulnerability 75

U.S. Department of Energy Insular Area Energy Vulnerability Study
move LNG in re-gasified form) would provide access to gas by power stations and industrial users in San Juan and potentially elsewhere. An island gas transmission system would also tie in to local gas supplies should any reserves be identified through future exploration on-shore or offshore Puerto Rico.
Additional potential for LNG could exist in the form of compressed natural gas for island busses, trucks, and potentially automobiles, reducing both petroleum dependency and also pollution, especially in the greater San Juan area. Fuel cells for dispersed electric power generation could represent a further application, reducing PREPA's need for investment in new central power stations.
Worldwide LNG trade is currently in a growth phase, increasing potential sources of supply. The recent announcement of a major LNG project on the coast of Venezuela, less than 500 miles from Puerto Rico, presents an opportunity for obtaining supplies at prices competitive with residual fuel on an environmental quality basis.
6.3.2 U.S. Virgin Islands
The small scale of electric power generation, its division between two islands (St. Thomas and St. Croix), and the ready availability of fuels from a large on-island oil refinery leave little meaning in the U.S. Virgin Islands considering diversification from petroleum to other fossil fuels.
6.3.3 U.S. Pacific Islands
Like the U.S. Virgin Islands, the Pacific islands' energy sectors lack the size to consider large- scale diversification to alternative fossil fuels. Guam and the CNMI, however, may consider coal for electricity generation.27
6.4 Renewable Energy
Renewable energy technologies could play a growing role in meeting future energy needs of Puerto Rico, the U.S. Virgin Islands and the U.S. Pacific islands. Renewables could displace imported oil used for electricity generation and other purposes and reduce energy costs. Each of the U.S. insular areas contains a mix of renewable energy resources that could be exploited by equipment now available from U.S. manufacturers.
The most promising options include:
• Solar residential hot water heating
Has shown considerable promise in Guam and the U.S. Virgin Islands and is economically competitive in all of the other insular areas where electric and gas water heaters are used.
In fact, the Guam Power authority (GPA) considered building a coal plant in 1991, but rejected it because it did not suit their need to secure additional generation in the near term. It may reconsider the coal option at the end of the 1990's for long run electric base load needs.
Section 6: Options for Reducing Vulnerability 76
U.S. Department of Energy Insular Area Energy Vulnerability Study
• Photovoltaic systems
Potential for meeting power needs in eco-tourism facilities;
Reverse osmosis water desalination in the U.S. Virgin Islands, CNMI and American Samoa;
External lighting for hotels, stores and homes;
Electric power for homes on remote islands, particularly smaller, outer islands in the CNMI, American Samoa and Palau.
Dispersed applications such as irrigation pumping and telecommunications repeater stations;
• Biomass
In all insular areas, the use of municipal solid waste as a fuel for biomass power systems;
In Puerto Rico, the recovery of landfill gas (methane) for use as a fuel;
Tuna sludge gasification for use as a fuel in electricity generation (American Samoa only);
• Hydroelectric
Mini- and micro-hydro applications in American Samoa, Guam and Palau.
Other technologies that could be investigated in the future are:
• Utility scale wind energy;
• Solar thermal electric generation;
• Deep ocean water commercial air conditioning, particularly for large concentrations of tourism facilities;
• Geothermal in American Samoa
• Ocean thermal energy conversion (OTEC).
Section 6: Options for Reducing Vulnerability 77

U.S. Department of Energy Insular Area Energy Vulnerability Study
6.5 Definition and Development of Potential Oil and Gas Reserves (Puerto Rico)
Between 1959 and the mid 1980's, Puerto Rico was the object of sporadic hydrocarbon exploration and production activity. At least three wells were drilled, all "dry." However, offshore geologic structures were identified and onshore gas pockets and oil seepages found.
A study commissioned in 1986 estimated 8 percent of Puerto Rico's onshore areas and 40 percent of its offshore areas up to 3,000 feet water depth had potential for oil and gas resources. The study also pointed to a dearth of exploration data and recommended a phased drilling program directed initially toward gathering data to confirm which specific areas could be prospective. Until 1994, PREPA holds an exclusive exploration license onshore and offshore Puerto Rico.
Puerto Rico may wish to consider options for re-establishing interest in its oil and gas potential, recognizing that :
• Private exploration and production (E&P) companies generally bear the primary risk and cost
• Exploration techniques have advanced substantially in the period since Puerto Rico's E&P program was active
• Improvements in offshore production techniques have greatly enhanced the economics of small, "marginal" fields.
The identification and development of even modest oil or gas reserves would reduce dependency on imported oil and enhance island balance of payments and employment. It would also support the viability of island refineries.
6.6 Refining Sector Enhancement (Puerto Rico)
Puerto Rico's petroleum security is directly linked to the health of its refining sector.Numerous developments in the petroleum markets of North and Latin America present a rapidly changing scene for the island refineries. These include new threats as well as possible new opportunities. Ultimately, the island refineries will grow or decline based on their competitive economics.
Puerto Rico's refining outlook hinges on the following competitive advantages and disadvantages versus other regional refiners:
Advantages
• Petrochemicals and lubes boost value added• Efficiently run: Mainland manning and service factors• Well depreciated (low capital carrying charge)• Internal Revenue Code Section 936 treatment of profits
Section 6: Options for Reducing Vulnerability 78

U.S. Department of Energy Insular Area Energy Vulnerability Study
Disadvantages
• Small, lack economies of scale• Simple, limited upgrading capability• Subject to full EPA environmental and safety standards• No access to low-cost fuel• High electric power cost (165 % of Mainland)• Ports are limited draft; no VLCC access• Jones Act constrains export trade to Mainland (also provides potential
protection against USGC exports)• Little/no local integration on unfinished products• Limited local market
Puerto Rico faces the prospect that while its island refining sector might expand, with attendant increases in on-island sources and petroleum inventories up to 13 million bbls (compared to 10 million bbls at present), it could easily decline further or even shut down totally in terms of fuels products operations. In the latter case, on-island inventories could halve to 4-5 million bbls.
Puerto Rico may want to evaluate the option of pro-actively supporting its refining and petrochemicals sector to avoid potential further decline and to maintain energy security, employment and government revenues.
Several options exist which between them could revitalize the sector, improve its efficiency and benefit consumers. These include:
• Seeking out and supporting new processing/supply/partnership arrangements• Reviewing fiscal regimes and incentives for investment• Maintaining/upgrading ports (hence access to larger lower-cost vessels)• Minimizing costs of meeting environmental targets• Promoting in-refinery steam/power generation• Reducing refiners' cost of purchased power• Reviewing refinery integration options• Reducing intra-island distribution costs, e.g. through reactivation of the existing South-
North petroleum products pipeline from Guayanilla to Catafio.
Analysis of the factors influencing island refining competitiveness and of the costs and benefits of enhancement options, including their combined impacts is a necessary first step.
6.7 Options for Reducing Petroleum System Vulnerability (Puerto Rico)
The study team had the opportunity to examine a number of the major petroleum facilities on Puerto Rico and to discuss operation of the petroleum systems with the operating companies. The following suggestions are offered as possible actions that could be taken to increase the physical security of petroleum supplies:
Section 6: Options for Reducing Vulnerability 79

U.S. Department of Energy Insular Area Energy Vulnerability Study
• The Ports Authority could enhance security at the oil terminals it owns and leases to the oil companies. This may require cooperation between the Ports Authority and the oil companies to modify the law on public access to certain docks.
• PREPA and the oil companies could formalize arrangements for priority restoration of electric power to petroleum facilities during an emergency.
• The oil companies could assess the adequacy of communications likely to be available during emergencies.
• The Ports Authority, in collaboration with island refiners and distributors could assess the logistics of supplying petroleum to the San Juan area in the event of blockage or closure of the San Juan Bay shipping channel as occurred a few years ago.
• The Department of Natural Resources and the oil companies could assess the feasibility of restoring and using the South-North petroleum products pipeline from Guayanilla to Catano to provide additional capacity for moving products into the San Juan area during both normal and emergency conditions.
• The Ports Authority, in collaboration with island refiners and distributors could assess the logistics of supplying jet fuel to San Juan's Luis Munoz Marin International Airport during emergencies, including a major disruption of the Catano pipeline.
6.8 CoMMdmg.Comments
This section described a wide range of options for enhancing emergency preparedness and reducing energy system vulnerability. The options were based on an initial review of petroleum and electric power systems in the Caribbean and Pacific islands. A more detailed analysis is warranted.
Section 6: Options for Reducing Vulnerability 80

U.S. Department of Energy Insular Area Energy Vulnerability Study
APPENDIX I
U.S. Department of Energy SECP/EES/ICP Funding to Insular Areas
(1973-1993)
AmericanSamoa Guam
NorthernMariana
Republic of Palau
PuertoRico
U.S. Virgin Islands
SECP/EES(1976-1993)
$3,074,471 $3,173,222 $2,528,927 $2,117,541 $7,480,106 $3,260,432
ICP(1979-1993)
$3,504,844 $3,729,712 $1,202,887 $0 $13,364,910 $4,075,442
OtherPrograms
$ 382,456 $ 199,150 $ 452,204 $ 9,800 $0 $0
TOTAL $6,961,771 7,102,084 $4,184,018 $2,127,341 $20,845,016 $7,335,874
Notes: SHOP: State Energy Conservation PlanEES: Energy Extension ServiceICP:Institutional Conservation Program
Appendix I A-l

U.S. Department of Energy Insular Area Energy Vulnerability Study
APPENDIX IILIST OF OFFICIALS INTERVIEWED
PUERTO RICO
Department of Natural Resources
Mr. Pedro Gelabert, Secretary Mr. Juan A. Mendez, Under SecretaryMs. Carmen Reveron, Special Technical Assistant to the Secretary
Planning Board
Ms. Norma E. Burgos Andujar, M.P.A., PresidentEng. Jose R. Caballero Mercado, Associate MemberDr. Wanda I. Marrero, Director, Economic and Social Planning AreaMr. Jose M. Velez Alicea, Executive Director, Economic Planning and Evaluation
Department of Consumer Affairs
Ms. Nitzia Amadeo, Director, Division of Planning and Economic Studies
Economic Development Administration
Dr. Leonard Shapiro, Assistant Administrator
State Civil Defense Agency
Mr. Epifanio Jimenez Melendez, State Director
Puerto Rico Electric Power Authority
Eng. Angel L. Rivera, Director, Planning and Environmental Protection Mr. Luis Cruz, Head, Planning & Research Division Ms. Magdalena Rodriguez, Civil Defense Coordinator
Ports Authority
Ms. Barbara Colon, Chief, Administrative DivisionMr. Miguel A. Maldonado Rodriguez, Chief, Tariff & Rates Department
Petroleum Industry
Caribbean Petroleum Corporation
Mr. Wilfredo Rodriguez, Managing Director
Appendix II A-2
U.S. Department of Energy Insular Area Energy Vulnerability Study
Commonwealth Oil Refining Company
Mr. Roberto Graticas, Senior Vice PresidentMr. Farid Chehab, Vice President, Marketing and Business Development
Esso Standard Oil Company (Puerto Rico)
Mr. Juan A. Juanet R., Vice President & Operations and Administration Manager, Central Caribbean DivisionMr. Otto M. Bustelo Carriga, Esq., Manager, Law Department, Central Caribbean Division
Gulf Chemical Corporation
Mr. J. Richard Perkins, Managing Director & Chief Operating Officer
Peerless Oil & Chemicals
Mr. Edward A. Maciula, Manager, Caribbean Operations
Phillips Petroleum
Mr. Alberto Sola, Operations Manager
Shell Oil Company— Puerto Rico
Mr. Wilhelm J. Thate, President
Sun Oil—Puerto Rico
Mr. John Shea, Refinery ManagerMr. Jose Antonio Morales, Operations ManagerMr. X. F. McLeod Matos, Manager, Health, Safety and Emergency Response
Local Consultants
Dr. Fernando Zalacain, President, Econometrica, Inc.Dr. Juan J. Rigau, Director, Juan J. Rigau & Associates
Appendix II A-3
U.S. Department of Energy Insular Area Energy Vulnerability Study
U.S. VIRGIN ISLANDS
Virgin Islands Energy Office
Ms. Claudette Young-Hinds, Director Ms. Rena Francis, Program Monitor Mr. Alphonse Javois, EEMIS
Virgin Islands Territory Emergency Management Agency
Mr. Elroy D. Harrison, Acting Director
Department of Economic Development and Agriculture
Mr. Dan Inveen, Chief Economist, Bureau of Economic Research
Virgin Islands Water and Power Authority
Mr. Alberto Bruno-Vega, Executive DirectorMr. Donald C. Francois, Chief Operating Officer, Director, Planning, Engineering and Environmental AffairsMr. Glenn Rothgeb, Director of Plant Production and Maintenance Mr. Seymour Blackman, Chief Engineer
Petroleum Industry
Amerada Hess
Mr. Leon Hess, Chairman
Appendix II A-4

U.S. Department of Energy Insular Area Energy Vulnerability Study
AMERICAN SAMOA
Office of the Governor
Honorable A.P. Lutali, Governor Honorable Peter Sunia, Lieutenant Governor Mr. A1 Ripene, Chief of Staff
Treasurer's Office
Ms. Meloma Afuola
Territorial Energy Management Coordinating Office
Mr. Rene L.F. Clemens, Commander, Department of Public Safety
Territorial Energy Office
Mr. Reupena Tagaloa, DirectorMr. Jerome Laupapa, Program ManagerMr. Eugene Smith, Engineer - Fuel Operations
Economic Development and Planning Office
Mr. Alexander ZodkcalMr. Thomas Graham Paterson, Economic Development Planner
American Samoa Environmental Protection Agency
Mr. Togipa Tansaga, Director
American Samoa Power Authority
Mr. Abe Make, Executive Director Mr. Perelini S. Perelini, Chief Engineer
VCA Samoa Packing Company
Mr. Michael P. Macready, General Manager
Appendix II A-5

U.S. Department of Energy Insular Area Energy Vulnerability Study
Petroleum Industry
Broken Hill Petroleum
Mr. Paul Stevenson Mr. William Sword
Port of American Samoa
Mr. Sila Poasa, Director
Office of Tourism
Mr. Pati Sala
Legislature
Mr. Charlie Tautolo, SpeakerMs. Fiasili Puni E. Haleck, Representative District 9Mr. Talanega F. Letumu, Representative District 5
Appendix II A-6

U.S. Department of Energy Insular Area Energy Vulnerability Study
GUAM
Office of the Governor
Honorable Joseph A. Ada, Governor Honorable Frank F. Bias, Lieutenant Governor
Guam Economic Development Authority
Mr. Charles Crisostomo, General Manager Mr. Vicente Blaz Mr. Lujan
Bureau of Planning
Mr. Mike Cruz , Acting Director (6/14/93)Mr. Peter Guerrero, Director (3/5/93)Ms. Terry Perez
Bank of Guam
Mr. Joe Bradley, Chief Economist
Department of Commerce
Mr. James Hutcherson, Senior Economist Ms. Pamela Bergman,Planner
Petroleum Industry
Mobil Oil Guam
Mr. Lee Hernandez, Acting General Manager Mr. E.F. Keiser, Jr., President Mr. Steven Rice, Manager Field Operations Mr. Leo Campos, Commercial Sales Manager Mr. Ernie L. Ramos, Planning Manager Mr. Eric Magarida, Manager Sales Mr. Walter Ulickas, Branch Manager
Exxon Oil Company
Mr. James B. McDonald, Assistant Branch Manager
Shell Guam
Mr. Tony Nicholson, President/General Manager Mr. Peter Short, Sales Manager
Appendix II A-7

U.S. Department of Energy Insular Area Energy Vulnerability Study
BHP Petroleum
Mr. Glen Leon Guerrero, Manager
Guam Power Authority
Mr. John Benavente, General ManagerMr. Henry Pangelinan, Acting General ManagerMr. Raymond C. Camacho, Assistant General ManagerMr. Bruce Pecon, ComptrollerMr. Deony L. Tamondong, Internal AuditorMr. Elroy HaraMr. Roland Demagajist
Guam Energy Office
Mr. Mike Brown, DirectorMs. Jennifer Sgambelluri, Deputy DirectorMs. Lorilee M.T. Crisostomo, Program Coordinator
Guam Visitors Bureau
Mr. Mike Carlson, Deputy General Manager
Port Authority of Guam
Mr. Peter A. Leon Guerrro, General Manager Mr. Frank L. San Nicolas, Deputy General Manager
Appendix II A-8

U.S. Department of Energy Insular Area Energy Vulnerability Study
COMMONWEALTH OF THE NORTHERN MARIANA ISLANDS
Office of the Governor
Honorable Lorenzo De Leon Guerrero, Governor Honorable Benjamin T. Manglona, Lieutenant Governor Mr. Tim Bruce, Special Counsel to the Governor
Commonwealth Energy Office
Ms. Joycelyn Deleon Guerrero, Administrator
Office of Planning and Budget
Mr. William H. Stewart, Economist
Department of Commerce and Labor
Mr. John S. Borja, Chief of Statistics Mr. Sid Ogarto, Division of Statistics Mr. Ike Teregeyo, Division of Statistics Mr. Tom Torres, Division of Statistics
Department of Public Works
Ms. Elizabeth H. Salas-Dalajadia, Director (6/15/93)Mr. Manual Chargualaf, Director (10/27/93)
Planning and BudgetMr. Frank Rosario, Special Assistant
Commonwealth Utilities Corporation
Mr. Ramon Guerrero, Executive DirectorMs. Velma M. Palacios, Deputy Executive DirectorMr. Pete Sasamoto, Special Advisor to the BoardMr. Roger Kitchingham, Superintendents for Power GenerationMr. Peter Lord
Petroleum Industry
Shell Marianas
Mr. Bill Hartman, Terminal Manager
Appendix II A-9

U.S. Department of Energy Insular Area Energy Vulnerability Study
Mobil Micronesia
Mr. Johanes Temengil, Manager North Complex Operations
Commonwealth Ports Authority
Mr. Roman T. Tudela, Executive Director
Saipan Harbour
Mr. Jose LG Diaz, Superintendent
Appendix II A-10

U.S. Department of Energy Insular Area Energy Vulnerability Study
PALAU
Administration
Mr. Thomas Ramengesau, Vice President and Minister of Administration
Ministry of Resources and Development
Mr. Marcelino Melairei, MinisterMr. Richard Mangham, Assistant to the Minister
Ministry of Commerce and Trade
Mr. George Ngirarsaol, Minister
National Planning
Mr. Koichi Wong, National Planner
Palau National Master Development Plan
Dr. Don Townsend, Team Leader
Department of Commerce and Labor
Mr. Tom Torres, Division of Statistics
Bureau of Public Works
Mr. August Remoket, DirectorMr. Gregorio Decherong, Manager, Energy Programs
Division of Revenue and Taxation
Mr. Marino Rechesengel, Chief
Bureau of National Treasury
Mr. Andres Ucherbelau, Director
Appendix II A-Il

U.S. Department of Energy Insular Area Energy Vulnerability Study
Petroleum Industry
Aimeltik Bulk Fuel Depot
Mr. Lorenzo Mamis, Supervisor
Belau (Shell) Petroleum Products, Inc
Mr. Toshio Nakamura, President
Mobil Oil Micronesia, Inc.
Mr. Lucas Salii, Sales Manager, Acting Superintendent
Mobil West Complex Operations
Mr. Fred Lewis, Manager
Palau Power Authority
Mr. Stephen Swords, Power Distribution
Appendix II A-12