Embed Size (px)
Citation preview

Dissertationes Forestales 45
Burnt area mapping in insular Southeast Asia using medium resolution satellite imagery
Jukka Miettinen
Department of Forest Resource Management Faculty of Agriculture and Forestry
University of Helsinki
Academic dissertation
To be presented, with the permission of the Faculty of Agriculture and Forestry of the University of Helsinki, for public
criticism in Auditorium 2, Building of Forest Sciences, Latokartanonkaari 9, Helsinki, on October 26th 2007 at 12 o’clock noon.
2
Title of dissertation: Burnt area mapping in insular Southeast Asia using medium resolution satellite imagery Author: Jukka Miettinen Dissertationes Forestales 45 Thesis Supervisors: Professor Timo Tokola Faculty of Forestry, University of Joensuu, Finland Head of Research Liew Soo Chin Centre for Remote Imaging Sensing and Processing, National University of Singapore Professor Florian Siegert GeoBio Centre, Ludwig-Maximilians University, Munich, Germany Pre-examiners: Professor Håkan Olsson Department of Forest Resource Management, Swedish University of Agricultural Sciences Professor José Miguel Cardoso Pereira Department of Forest Engineering, Technical University of Lisbon, Portugal Opponent: Dr. Thomas Theis Nielsen Department of Geography and Geology, University of Copenhagen, Denmark Cover image: Large burnt areas in the wetlands of Central Kalimantan, Indonesia, clearly visible in a medium resolution (250-500m) satellite image captured by the Moderate Resolution Imaging Spectroradiometer (MODIS) on 04/11/2006. (Surface reflectance product, RGB: 2.14µm, 0.86µm, 0.67µm) ISSN 1795-7389 ISBN 978-951-651-178-1 (PDF) ISBN 978-951-651-179-8 (paperback) Printers: Helsinki University Printing House, Helsinki 2007 Publishers: Finnish Society of Forest Science Finnish Forest Research Institute Faculty of Agriculture and Forestry of the University of Helsinki Faculty of Forestry of the University of Joensuu Editorial Office: Finnish Society of Forest Science Unioninkatu 40A, FI-00170 Helsinki, Finland http://www.metla.fi/dissertationes

3
Miettinen, J. 2007. Burnt area mapping in insular Southeast Asia using medium resolution satellite imagery. Dissertationes Forestales 45. 45 p. Available at http://www.metla.fi/dissertationes/df45.htm Yearly biomass burning affects humid tropical insular Southeast Asia and causes a variety of effects ranging from human health problems and economic losses to ecological destruction and large carbon emissions. Burnt area mapping in this region using medium resolution (250-500m) satellite imagery is characterized by persisting cloud cover, wide range of land cover types, vast amount of wetland areas and highly varying fire regimes. The objective of this study was to deepen understanding of three major aspects affecting the implementation and limits of medium resolution burnt area mapping in insular Southeast Asia: 1) fire-induced spectral changes, 2) most suitable multitemporal compositing methods and 3) burn scars patterns and size distribution. The results revealed a high variation in fire-induced spectral changes depending on the pre-fire greenness of burnt area, which consequently had a strong effect on the best indicators of burning among wavelengths and multi-band indices in different areas. Therefore, it was concluded that this variation needs to be taken into account in change detection based burnt area mapping algorithms in order to maximize the potential of medium resolution satellite data. Minimum near infrared (MODIS band 2, 0.86µm) compositing method was found to be the most suitable for burnt area mapping purposes using Moderate Resolution Imaging Spectroradiometer (MODIS) data. Due to persisting cloud cover a compositing period no shorter than one month was recommended. In general, medium resolution burnt area mapping was found to be usable in the wetlands of insular Southeast Asia, whereas in other areas the usability was seriously jeopardized by the small size of burn scars. The suitability of medium resolution data for burnt area mapping in wetlands is important since recently Southeast Asian wetlands have become a major point of interest in many fields of science due to yearly occurring wild fires that not only degrade these unique ecosystems but also create regional haze problem and release globally significant amounts of carbon into the atmosphere due to burning peat. Finally, super-resolution MODIS images were tested as a potential solution to the problem of small burn scars. However, the test failed to improve the detection of small scars. Therefore, super-resolution technique was not considered to be applicable to regional level burnt area mapping in insular Southeast Asia.
Keywords: burn scars, burnt area monitoring
4
ACKNOWLEDGEMENTS This study was conducted at the Department of Forest Resource Management, at the University of Helsinki, Finland, Centre for Remote Imaging, Sensing and Processing (CRISP), at the National University of Singapore, Singapore and GeoBio Centre, Lugwig-Maximilians University and Remote Sensing Solutions (RSS) GmbH, Munich, Germany. It was financed by the Finnish Cultural Foundation and Helsingin Sanomain 100-vuotissäätiö. I am grateful to these institutions and foundations for providing the research facilities and funding that made this study possible.
In Finland I would like to thank my principal supervisor Professor Timo Tokola who guided me through this process until the end regardless of his re-location to the University of Joensuu, Finland, in the middle of this project. In addition, I would like to thank Professor Annika Kangas for good cooperation in planning the courses taken during my graduate studies. Everything went smoothly, regardless of my prolonged periods of absence. And finally I would like to thank Juhani Saastamoinen for flexibility and understanding during the final stages of the preparation of our common manuscript when we all had to work long hours to get the work done before the deadline of my PhD thesis.
In Singapore I would like to thank Director Kwoh Leong Keong for giving me the opportunity to conduct research in CRISP and Head of Research Liew Soo Chin for supervising my studies during the stay in Singapore. In addition, I want to thank all the researchers and other staff in CRISP for providing a nice research atmosphere. Special thanks go to Chia Aik Song for our endless conversations regarding Southeast Asian vegetation fires, and for tirelessly correcting the English language in my article manuscripts together with his wife Diane.
In Munich I would like to express my gratitude to Professor Florian Siegert for providing research facilities and supervision during our short but intensive cooperation that resulted in two articles, one of which is part of this study. I also want to thank Andreas Langner, Olaf Kranz, Huang Shengli and everybody else who worked in RSS during my stay for accepting me into their group both on and off duty.
Finally I want to thank Professors Håkan Olsson and José M. C. Pereira for their careful review of the thesis manuscript.
And last but certainly not least, I would like to thank my parents, sisters and their families for continuous unconditional support and encouragement during this project.
In Helsinki, September 2007 Jukka Miettinen
5
LIST OF ORIGINAL ARTICLES This doctoral thesis is based on the following three articles and two submitted manuscripts which are referred to in the extended summary using their Roman numerals. The extended summary presents the main approaches and findings of this study, while full details can be found in the articles and manuscripts.
I Miettinen, J. 2007. Variability of fire-induced changes in MODIS surface reflectance by land cover type in Borneo. International Journal of Remote Sensing (In press).
II Miettinen, J., Langner, A. & Siegert, F. 2007. Burnt area estimation for
the year 2005 in Borneo using multi-resolution satellite imagery. International Journal of Wildland Fire 16: 45-53.
III Miettinen, J. & Liew, S.C. 2007. Comparison of multitemporal
compositing methods for burnt area detection in Southeast Asian conditions. International Journal of Remote Sensing (In press).
IV Miettinen, J. & Liew, S.C. Variability of burn scar patterns in Southeast
Asia and its effect on burnt area mapping with medium resolution satellite imagery. International Journal of Applied Earth Observation and Geoinformation (Submitted manuscript).
V Miettinen, J., Saastamoinen, J. & Tokola, T. Usability of super-
resolution MODIS images for burn scar detection in Southeast Asia. Photogrammetric Engineering and Remote Sensing (Submitted manuscript).
Miettinen was the responsible author and carried out all stages of the abovementioned studies with the exceptions listed in the following. In article II Siegert participated in the planning phase and introduced the methodology of estimating burnt area using active fire detections into the study. In addition, Siegert and Langner checked and refined the high resolution reference burnt area maps produced by Miettinen and finally revised the manuscript on several occasions. In articles III and IV Liew participated in the planning of the studies and selection of the methods for analysing the data and revised the manuscripts before submissions. Article V was initiated by Tokola. Miettinen did not participate in the development and execution of the super-resolution image processing. This was entirely taken care of by Saastamoinen and Tokola, who also wrote the corresponding sections in the manuscript, contributed to the selection of analytical methods and reviewed the whole manuscript before submission.

6
TABLE OF CONTENTS ABSTRACT .................................................................................................3 ACKNOWLEDGEMENTS …………………………………………….…4 LIST OF ORIGINAL ARTICLES ………………………………………...5 TABLE OF CONTENTS ………………………………………………….6 ABBREVIATIONS ……………………………………………….…....… 7 INTRODUCTION …….………….……………………………….…....… 9
Vegetation fires in tropical regions ................................................................................ 9 Monitoring of the occurrence and effects of vegetation fires ......................................... 9
General ..................................................................................................................... 9 Active fire detection ................................................................................................. 10 Burnt area mapping ................................................................................................. 10
Characteristics of insular Southeast Asia as a fire region ............................................. 14 Climate and nature .................................................................................................. 14 Fires in insular Southeast Asia ............................................................................... 16 Special features from the burnt area detection point of view ................................. 17
Objective and structure of the study ............................................................................. 18 MATERIALS AND METHODS ............................................................... 18
Satellite data .................................................................................................................. 18 Medium and coarse resolution data ........................................................................ 18 High resolution reference data ............................................................................... 20
Land cover and soil maps ............................................................................................. 21 Data analysis ................................................................................................................. 23
Analysis on fire-induced spectral changes (I) ........................................................ 23 Evaluation of multitemporal compositing methods (III) ........................................ 26 Investigation of burn scar patterns and size distribution (IV) ................................ 27 Assessment of the usability of super-resolution MODIS images (V) ...................... 28
MAIN RESULTS AND DISCUSSION ..................................................... 28
Fire-induced spectral changes (I, II, IV) ...................................................................... 28 Multitemporal compositing for burnt area mapping (III) ............................................. 32 Variability of fire regimes and its effect on burnt area mapping (II, IV) ..................... 34 Usability of the super-resolution images (V) ................................................................ 38
CONCLUSIONS ........................................................................................ 39 REFERENCES ........................................................................................... 41
7
ABBREVIATIONS
ATSR Along Track Scanning Radiometer AVHRR Advanced Very High Resolution Radiometer ERS Earth Resource Satellite ETM+ Enhanced Thematic Mapper Plus EVI Enhanced Vegetation Index GEMI Global Environment Monitoring Index GLC2000 Global Land Cover 2000 HRG High Resolution Geometric HRV High Resolution Visible HRVIR High Resolution Visible and Infrared MODIS Moderate Resolution Imaging Spectroradiometer NBR Normalized Burn Ratio NDVI Normalized Difference Vegetation Index NDWI Normalized Difference Water Index NIR Near infrared NOAA National Oceanic and Atmospheric Administration SPOT Satellite Pour l’Observation de la Terre SWIR Shortwave infrared TIR Thermal infrared

8

9
INTRODUCTION Vegetation fires in tropical regions It has been estimated that vegetation fires affected 350 Mha worldwide in the year 2000 (Tansey et al. 2004). Up to 70% of the world’s vegetation fires occur in tropical regions (Dwyer et al. 2000), where fire is an essential and frequently occurring part of ecosystem dynamics in some ecosystems (e.g. savanna), but can be disastrous in others (e.g. humid tropical evergreen forest). During the past decades, vegetation fires in tropical regions have attracted growing amount of attention and are becoming an increasingly important global environmental issue.
The current fire frequency in the tropics is considered to be extraordinarily high in long-term historical perspective, due to anthropogenic biomass burning (Bird and Cali 1998). The majority of fires in tropical regions are man-made (Dwyer et al. 1999). Ignition sources include e.g. land management (agricultural field preparation, land clearance, pasture land treatment etc.), deliberate ignition in land tenure conflicts, hunting, negligence (cigarette stumps, camp fires etc.) and pest control (Andreae 1991, Qadri 2001, Suyanto 2006). In addition, even prescribed fires often develop into uncontrolled wild fires, especially in dry grasslands/savanna and in drained peatlands (Rieley and Page 2005).
The effects of fires vary considerably depending on the region they occur in. Ecosystems in the dry tropics are typically better adapted to fires and the effects are less dramatic from the ecological point of view compared to humid tropical regions where fire in natural conditions is rare (Sanford et al. 1985, Goldammer 2006) and ecosystems have not adapted to it. Nevertheless, total or partial destruction of vegetation cover by fire always affects species composition and nutrient flux in a variety of ways (Dwyer et al. 1999) and causes a wide range of secondary effects including local human health problems, economic losses and globally significant emissions of trace gasses and aerosol particles that play important roles in atmospheric chemistry and climate (Crutzen and Andreae 1990, Qadri 2001). Biomass burning has been estimated to contribute up to 40% of the annual carbon released into the atmosphere by human activities (Levine 1996a, Page et al. 2002, Cochrane 2003). Since rising carbon dioxide concentration in the atmosphere has been generally seen as one of the causes of global climate change, vegetation fires in the tropical regions can hardly be seen as regional problems anymore. Monitoring of the occurrence and effects of vegetation fires General Large scale (from regional to global level) estimation of burnt area/biomass is needed to quantify the effects of vegetation fires. Regardless of the increasing interest in and understanding of the effects of biomass burning in both the regional and global levels, quantitative large scale burnt area mapping results are hard to come by in the tropical areas (FAO 2006). This hinders reliable operational estimations of the regional and global effects

10
of vegetation fires. Estimation of burnt area is considered to be one of the factors providing the greatest uncertainty in calculating the amount of burnt biomass and emitted gases at the regional and global levels (Levine 1996b). Until recently, large scale estimates have been mainly based on extrapolation of smaller scale results or use of national statistics, which may have been inaccurate due to insufficient resources (Tansey et al. 2004). Recently an increasing amount of effort has been put into investigating suitable materials and methods for large scale burnt area mapping and to produce global estimates of the amount of burnt surface using satellite data (e.g. Tansey et al. 2004, Roy et al. 2005, Silva et al. 2005, Giglio et al. 2006).
Large scale assessments of the occurrence and effects of fires have been conducted mainly with ERS ATSR, NOAA AVHRR, SPOT VEGETATION and Terra/Aqua MODIS satellite sensors. These sensors have a high temporal resolution (almost daily) due to wide viewing swaths (512km-3000km), while their spatial resolution varies between 250m (two bands in MODIS) and around 1km (all other sensors) and they include varying amounts of spectral bands of varying widths. Two fundamentally different approaches can be used to estimate the occurrence and effects of fires: active fire detection and burnt area mapping. This study concentrates on burnt area mapping. Active fire detection is merely briefly presented in order to highlight the major differences between these two approaches. Active fire detection Active fire detection (i.e. hotspot detection) is based on the detection of the TIR radiation emitted by fires. Hotspot detection is typically performed on a daily basis and it can be considered as the most suitable and effective way to determine the seasonality, timing and interannual variation of fires (Eva and Lambin 1998a). However, hotspot detection has some major disadvantages including e.g. a possible bias caused by the combination of regional burning practices and fixed overpass times of the satellites (Eva and Lambin 2000), and even more severely, problems with cloud cover that may be especially harmful in the humid tropical areas that often remain covered by clouds for extended periods of time.
In addition, compared to burn scar mapping, hotspot detection holds less potential for estimation of the effects of the fires due to its inability to measure the total area affected by fire let alone the proportion of burnt surface in the fire affected area. A pixel 1km2 in size can be saturated by a fire no larger than 0.001km2 leading to great uncertainty about the size of the burn scar created by the detected fire. Nevertheless, due to great need for information on the effects of vegetation fires and the lack of more reliable data, the possibilities to use hotspots to estimate the extent of burnt area has been tested both globally (e.g. Giglio et al. 2006) and regionally (e.g. Eva and Lambin 1998a, Stolle et al. 2004) with varying success. Burnt area mapping Burnt area mapping, on the other hand, aims at detecting and delineating scars left by fires using their spectral signature and/or fire-induced spectral changes. It provides us with means to measure the extent of burnt areas and potentially the proportions of burnt surface in fire affected areas. This information can further be used in conjunction with other data (e.g. pre-fire maps of land cover, soil/peat, biomass etc.) to estimate the effects of the fires (e.g. carbon release, effects on ecosystems, economic losses etc.). During the last ten years, large scale burnt area mapping has been widely studied with coarse (~1000m) and medium
11
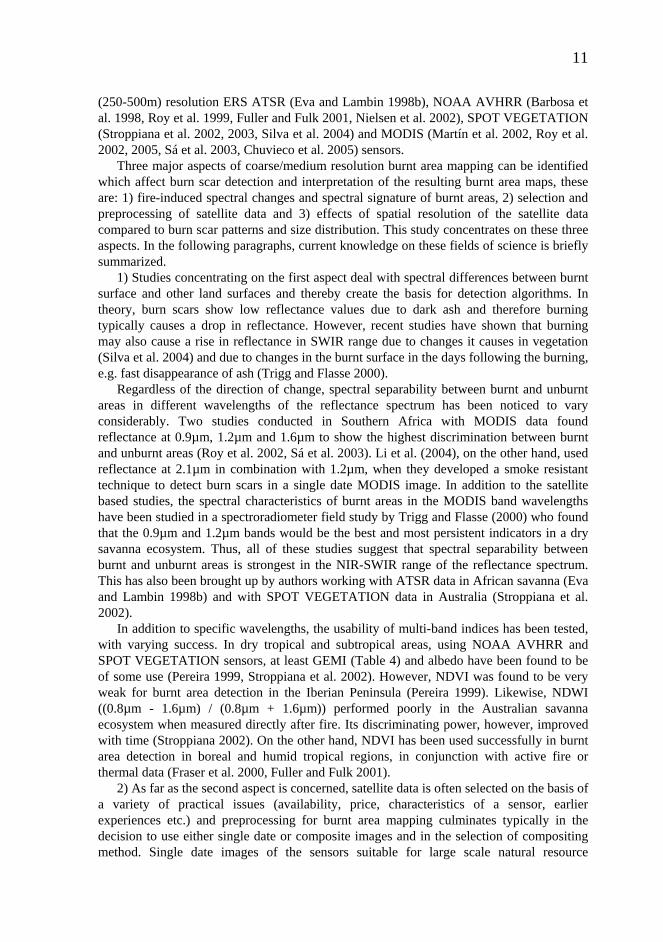
(250-500m) resolution ERS ATSR (Eva and Lambin 1998b), NOAA AVHRR (Barbosa et al. 1998, Roy et al. 1999, Fuller and Fulk 2001, Nielsen et al. 2002), SPOT VEGETATION (Stroppiana et al. 2002, 2003, Silva et al. 2004) and MODIS (Martín et al. 2002, Roy et al. 2002, 2005, Sá et al. 2003, Chuvieco et al. 2005) sensors.
Three major aspects of coarse/medium resolution burnt area mapping can be identified which affect burn scar detection and interpretation of the resulting burnt area maps, these are: 1) fire-induced spectral changes and spectral signature of burnt areas, 2) selection and preprocessing of satellite data and 3) effects of spatial resolution of the satellite data compared to burn scar patterns and size distribution. This study concentrates on these three aspects. In the following paragraphs, current knowledge on these fields of science is briefly summarized.
1) Studies concentrating on the first aspect deal with spectral differences between burnt surface and other land surfaces and thereby create the basis for detection algorithms. In theory, burn scars show low reflectance values due to dark ash and therefore burning typically causes a drop in reflectance. However, recent studies have shown that burning may also cause a rise in reflectance in SWIR range due to changes it causes in vegetation (Silva et al. 2004) and due to changes in the burnt surface in the days following the burning, e.g. fast disappearance of ash (Trigg and Flasse 2000).
Regardless of the direction of change, spectral separability between burnt and unburnt areas in different wavelengths of the reflectance spectrum has been noticed to vary considerably. Two studies conducted in Southern Africa with MODIS data found reflectance at 0.9µm, 1.2µm and 1.6µm to show the highest discrimination between burnt and unburnt areas (Roy et al. 2002, Sá et al. 2003). Li et al. (2004), on the other hand, used reflectance at 2.1µm in combination with 1.2µm, when they developed a smoke resistant technique to detect burn scars in a single date MODIS image. In addition to the satellite based studies, the spectral characteristics of burnt areas in the MODIS band wavelengths have been studied in a spectroradiometer field study by Trigg and Flasse (2000) who found that the 0.9µm and 1.2µm bands would be the best and most persistent indicators in a dry savanna ecosystem. Thus, all of these studies suggest that spectral separability between burnt and unburnt areas is strongest in the NIR-SWIR range of the reflectance spectrum. This has also been brought up by authors working with ATSR data in African savanna (Eva and Lambin 1998b) and with SPOT VEGETATION data in Australia (Stroppiana et al. 2002).
In addition to specific wavelengths, the usability of multi-band indices has been tested, with varying success. In dry tropical and subtropical areas, using NOAA AVHRR and SPOT VEGETATION sensors, at least GEMI (Table 4) and albedo have been found to be of some use (Pereira 1999, Stroppiana et al. 2002). However, NDVI was found to be very weak for burnt area detection in the Iberian Peninsula (Pereira 1999). Likewise, NDWI ((0.8µm - 1.6µm) / (0.8µm + 1.6µm)) performed poorly in the Australian savanna ecosystem when measured directly after fire. Its discriminating power, however, improved with time (Stroppiana 2002). On the other hand, NDVI has been used successfully in burnt area detection in boreal and humid tropical regions, in conjunction with active fire or thermal data (Fraser et al. 2000, Fuller and Fulk 2001).
2) As far as the second aspect is concerned, satellite data is often selected on the basis of a variety of practical issues (availability, price, characteristics of a sensor, earlier experiences etc.) and preprocessing for burnt area mapping culminates typically in the decision to use either single date or composite images and in the selection of compositing method. Single date images of the sensors suitable for large scale natural resource
12
monitoring cover large areas and frequently have clouds, cloud shadows and other atmospheric disturbances (e.g. haze, cloud edge reflections etc.). Multitemporal compositing aims at reducing the amount of atmospheric disturbances by building one composite image using data from several single date images. Multitemporal composite images have been tested and used for burnt area mapping from regional to global level (e.g. Fernández et al. 1997, Barbosa et al. 1998, Fuller and Fulk 2001, Stroppiana et al. 2002, Sousa et al. 2003, Zhang et al. 2003, Silva et al. 2004, 2005).
In the optimal case, a composite image produced for burnt area mapping would include all burn scars that have appeared in the region during the compositing period, but would have a minimal amount of atmospheric effects and other artefacts. However, these two objectives often counteract each other. Mainly two features of newly burnt areas have been found useful in multi-temporal compositing: a) new burn scars have low NIR reflectance due to dark ash and absence of green vegetation and b) dark ash and sometimes exposed soil also cause the area to heat up in sunlight, causing higher thermal infrared emission than before the fire. These features enable the selection of burn scars into the final composite image, but selection of low NIR values may cause problems with cloud shadows.
This was first noticed by Barbosa et al. (1998), who considered minimum value albedo to be the best compositing method for burnt area mapping purposes with AVHRR data in African savannas but identified cloud shadows as a problem. In order to avoid this problem, Stroppiana et al. (2002) developed a method for SPOT VEGETATION data in Northern Australia that selected the observation with the third lowest NIR value, assuming that same pixel would not have cloud cover more than twice during the compositing period. Sousa et al. (2003), on the other hand, recommended a method that selected the candidate with the highest surface temperature among the three lowest NIR observations. Recently Chuvieco et al. (2005) compared compositing methods with both AVHRR and MODIS sensor data of the Iberian Peninsula and went even further by concluding that maximum surface temperature alone was the best compositing criterion for burnt area detection.
3) Finally, regardless of the methods a burnt area map is produced with, understanding of the burning regimes in the area covered is essential to be able to correctly interpret the map. In this context the relationship between the size of burn scars and the spatial resolution of the remote sensing data plays an important role. In general terms spatial resolution can be understood as the minimum size of a feature that can be detected by a remote sensing system. Spatial resolution is mainly determined by the size of a ground resolution cell which is the area in ground that is seen by the sensor at one particular moment but it is also affected by other factors such as contrast between features, illumination etc. (Harris 1987, Lillesand et al. 1987). The pixel size of a satellite image is typically close to the size of the ground resolution cell. This is because a significantly smaller pixel size would not make the image more detailed but would only increase the file size, whereas a significantly greater pixel size would lead to unnecessary loss of details. This has lead to almost synonymous use of the terms spatial resolution and pixel size in parts of the remote sensing literature.
In the context of this thesis, it is important to note the following two points: a) In this study the terms resolution and spatial resolution are used both to describe the properties of sensors referring to the approximate size of the ground resolution cell at nadir and as synonyms for pixel size in image data that is sampled to a pixel size similar to the smallest ground resolution cell size of the data used in the image. In case the image includes data with different ground resolution cell sizes at nadir, this is brought up clearly. b) The MODIS sensor is a scanner with a very wide swath, which leads to significant decrease in
13
the effective spatial resolution (i.e. increase in ground resolution cell size) towards the edges of the scanning swath (Wolfe et al. 1998). Nevertheless, the spatial resolutions of the MODIS products are referred to according to the size of the ground resolution cell at nadir.
The abovementioned two points mean that in some cases the spectral information recorded in one pixel in the images used in this study is detected from a larger ground resolution cell than the pixel size. This variation in the effective spatial resolution is taken into consideration throughout this thesis and further discussed in connection with materials, methods and results of this study.
In general it can be said that low spatial resolution (250m-1000m) restricts the capability to detect small burn scars and therefore questions the reliability of large scale burnt area mapping in areas where small burn scars strongly contribute to the total burnt area. The effects of burn scar patterns in coarse resolution burnt area mapping were first studied by Eva and Lambin (1998a) using NOAA AVHRR data in Africa. They confirmed that large proportion of sub-pixel size/fragmented burns scars lead to significant underestimation of total burnt area, but also noticed that the dominance of large burn scars caused slight overestimation. In addition, forest land cover type was noticed to have significantly smaller burn scars than woodlands and savannas, suggesting potential variation in the accuracy of coarse resolution burnt area mapping by land cover type. This has been later confirmed by Stroppiana et al. (2003) in Australia and by Silva et al. (2005) in an extensive study over the African continent. Both of these studies witnessed significant differences in burnt area mapping accuracy of 1km resolution SPOT VEGETATION data between land cover types. The biggest underestimations were found in forested areas (-80% and -73% respectively).
Both Eva and Lambin (1998a) and Silva et al. (2005) suggested calibration of coarse resolution burnt area results by high resolution satellite data. This approach enables estimation of total burnt area but the exact locations of burn scars are not known and therefore further monitoring of the development of burn scars (e.g. regeneration) in the months/years following the fire is not possible. In any case, in order to reliably calibrate the amount of burnt area, it is important to thoroughly understand the variation of fire regimes in the region to be able to obtain a representative high resolution sample including all fire regimes.
In addition to the three aspects presented above, increasing amount of studies concentrate on sub-pixel level estimation of burnt area proportion and combustion completeness. However, this approach was restricted beyond the scope of this study. Throughout this study, burnt areas used as references and pixels detected as burnt were considered fully burnt. This was done mainly for two reasons. First of all, reliable and systematic burnt area field data needed for large scale sub-pixel level studies is extremely hard to get in Southeast Asia due to the remoteness of many of the worst burning areas and somewhat delicate nature of fire as a policy issue. Secondly, basic studies at the pixel level were felt to be most needed at his point and sub-pixel level approaches were left for future studies to explore.

14
Characteristics of insular Southeast Asia as a fire region Climate and nature In this study insular Southeast Asia refers to an area situated between 9° S and 8° N latitude and between 95° E and 125° E longitude, and is consisted of the Malaysian peninsula and four major islands: Sumatra, Borneo, Java and Sulawesi (also known as the Greater Sunda Islands). This area is shared by four nations (Brunei, Indonesia, Malaysia and Singapore) and is home to around 210 million people. It must be noted, however, that more than half of the population lives in the island of Java. In the two main study years (2005 and 2006) altogether nearly 160000 MODIS hotspots were detected by the MODIS Rapid Response System (Web Fire Mapper, http://maps.geog.umd.edu/, accessed Jan 2007) in the five major land masses listed above. Of these hotspots 89% were detected in the islands of Sumatra and Borneo (46% and 43% respectively). This highlights the severity of the fire situation in these two areas. Therefore, all the study areas in this study were selected in these two islands. In order to further illustrate the spatial distribution of fire activity in this region, hotspot density (number of hotspots in a 5km radius) was calculated using all the MODIS detected hotspots during 2005 and 2006 (Figure 1).
Insular Southeast Asia has a relatively stable humid tropical climate. In general, the weather is hot and humid all year round, with a drier period of two-three months that in the majority of the areas occurs between June and October. The worst burning season closely follows the drier period. Of all the MODIS hotspots in the study region during 2005-2006, nearly 80% were detected between June and October. However, even during this period rainfall exceeds evaporation in large parts of the region. High humidity levels are also connected to persistent cloud cover, which is particularly harmful for optical remote sensing.
Insular Southeast Asia has originally been covered mostly by tropical evergreen dipterocarp forests and has the highest biodiversity of all tropical regions of the world (Whitmore 1984). Perhaps the most unique feature of this region is the high amount of tropical peat soil. More than 60% of global tropical peatland (around 22Mha) can be found in insular Southeast Asia (Rieley and Page 2005). The peat soils are mainly located in the Southern coastal regions of Borneo and along the Eastern coast of Sumatra. Peat swamp forests and other wetland ecosystems are considered highly valuable from the nature conservation point of view due to their unique flora and fauna. In addition, e.g. heath forests in poor soils and various mountain forest types in higher mountains can be found to a smaller extent.
However, nowadays the majority of the natural vegetation has been either converted to agroecosystems or degraded while deforestation and land cover change continues to take place at a high rate (Fuller et al. 2004, Kauppi et al. 2006, Langner et al. in press). This increases fire occurrence mainly for three reasons. 1) Fire is extensively used for land clearance and agricultural field preparation (by both small-holder farmers and plantation companies), which also frequently results in wild fires during dry spells (Bowen et al 2001,
Figure 1 (facing page). Hotspot density in the study region in 2005 and 2006, calculated as the number of MODIS detected active fires in a 5km radius. White colour refers to no hotspots and blue refers to existence of hotspots, darkest blue areas having the highest hotspot density.


16
Chokkalingam et al. 2006, Simorangkin 2006). 2) Degraded and logged over forests are more susceptible to fire than natural forests due to drier microclimate and increased amount of dry material (Cochrane 2001, Siegert et al. 2001). 3) Drained peatland becomes extremely susceptible to fire during drier periods (Rieley and Page 2005).
Fires in insular Southeast Asia
Most of the tropical and subtropical fire regions have clearly seasonal climates with long and distinct dry seasons (Northern Australia, Southern Africa, Sahel, Mediterranean region etc.). Insular Southeast Asia, on the other hand, is a humid tropical region with a relatively stable climate around the year. Undisturbed humid tropical forests are considered to be very resistant to fire (Uhl et al. 1988, Uhl and Kaufmann 1990) and the rare fires mainly take place during extraordinary dry periods (Sanford et al. 1985, Goldammer 2006). However, human activities tend to disturb these ecosystems and make them more vulnerable to fire by opening the canopy and thus accelerating the drying and increasing the amount of dry fire prone material (Cochrane 2003). This does not only increase the risk of fire but also causes fires to become more severe and more destructive (Siegert et al. 2001).
In Southeast Asia vegetation fires have been documented since the late 19th century (mainly during El Niño phenomena, most notably 1982-1983 and 1997-1998), but the use of fire in land clearing escalated in the 1990s (Goldammer 2006). Since then, annual biomass burning has taken place to a varying extent. Continuing degradation and fragmentation of natural ecosystems by logging and conversion to agroecosystems, combined with extensive drainage of wetlands, have increased fire susceptibility dramatically (Cochrane 2001, Siegert et al. 2001, Rieley and Page 2005) and led to a cycle of recurrent fires further degrading the ecosystems (Cochrane and Schulze 1999, Goldammer 1999).
The use of fire is strongly connected to land management (by both small-holder farmers and plantation companies) but even though ignition is usually deliberate, unattended fires also often result in wild fires during dry spells (Bowen et al 2001, Chokkalingam et al. 2006, Simorangkin 2006). Intentional and unintentional burning has become an annual problem especially in drained peatlands and on some occasions has resulted in catastrophic fire episodes producing huge emissions of carbon dioxide (e.g. Page et al. 2002, Heil et al. 2006). This is likely to continue during the following years since peatland areas are currently under conversion to plantations in both Borneo and Sumatra. Fire is considered as the cheapest, and most of all the simplest, way to carry out land clearance and preparation in these areas due to its pest controlling effects and difficult working conditions for heavy machinery (Simorangkin 2006).
The effects of fires and problems connected to yearly biomass burning in insular Southeast Asia can be divided into two categories: 1) forest degradation and deforestation (including the loss of products and services, timber, non-timber forest products, biodiversity, soil erosion, and flood control) and 2) smoke haze pollution (including carbon emissions and related impacts) (Tacconi et al. 2006). The effects are exacerbated by the considerable numbers of fires taking place in peatland and other wetland areas. Fires in wetland areas not only disturb unique ecosystems but cause particularly bad haze and globally significant carbon emissions which increase carbon concentration in the atmosphere and thereby contribute to climate change. It has been estimated that over 60% of the carbon released into the atmosphere during the 1997-1998 fire episode (triggered by an extraordinarily strong El Niño phenomenon) came from burning peat (Heil et al. 2006).

17
Special features from the burnt area detection point of view
Gregoire et al. (2003) pointed out that the most suitable methods to map burnt areas may differ from one ecosystem and main vegetation type to another. There are some ecologic, anthropogenic and climatic characteristics in insular Southeast Asia that together may affect regional level burnt area mapping. First of all the variety of ecosystems and land cover types in the region is wide, ranging from pristine evergreen broadleaf forests, more or less degraded forests, “man made” savannas and vast dried peatlands to large scale plantations and small-holder agriculture. Furthermore, fires on wetlands are a typical feature of biomass burning in this region. The heterogeneity of fire-induced spectral changes caused by variation in pre-fire vegetation has been brought up recently (Pereira 2003, Silva et al. 2004) but has not been studied in insular Southeast Asia from the medium resolution burnt area detection point of view.
Secondly, anthropogenic reasons for using fire are numerous in Southeast Asia and result in a variety of different types of burn scars, each type possessing their own characteristics (Bowen et al 2001, Qadri 2001, Chokkalingam et al. 2006, Simorangkin 2006). Burning regimes vary from small-holder burning that causes small burn scars (typically smaller than 0.25 km2), to large scale land clearance fires and wildfires which commonly burn areas in excess of tens of square kilometres (Nicolas 1998, Bowen et al. 2001). This variability may affect the selection of the most suitable methods to monitor the occurrence and effects of fires in this region since the patterns and size distribution of burn scars have a direct effect on the reliability of medium/coarse resolution burnt area mapping.
Thirdly, cloud conditions in the humid tropical regions are difficult for natural resource monitoring using optical remote sensing. The cloud cover is potentially less disturbing for burnt area detection than for active fire detection (due to fire scars that persist for several weeks) but it certainly also complicates burnt area detection in the form of longer detection intervals and a wide variety of cloud related artefacts in the images. Authors developing global burnt area detection systems have pointed out the difficult cloud situation in Southeast Asia and how it has hampered burnt area estimation (Tansey et al. 2004, Giglio et al. 2006).
Regardless of the abovementioned characteristics and even though several studies have detected severe burning on a smaller scale within the region (Liew et al. 1998, Siegert and Hoffmann 2000, Page et al. 2002, Miettinen and Liew 2005), large scale medium resolution burnt area mapping in insular Southeast Asia is still weakly studied and global fire assessments suffer from a lack of burnt area data from this region (FAO 2006). The large majority of the studies presented earlier in the burnt area mapping-section had been conducted with data from dry tropical or subtropical regions during the dry season. Due to combined effects of the characteristics listed above, burnt area mapping conditions in insular Southeast Asia may differ significantly from those of drier tropical regions. The amount of burnt area in this region is in danger of being significantly underestimated in global burnt area estimations if the mapping is performed with methods that do not take into consideration the special features of this humid tropical region.
18
Objective and structure of the study The objective of this study was to deepen understanding of 1) fire-induced spectral changes, 2) multitemporal compositing for burnt area mapping and 3) limits of medium resolution burnt area mapping in insular Southeast Asia. These three aspects that directly affect the implementation of medium resolution burnt area mapping were analysed keeping in mind the special characteristics of climate, land cover/ecosystems and fire regimes in this region.
Rationally the study was divided into three phases. In the first phase (I, II) fire-induced spectral changes and their variation by land cover types were analysed in order to find out the best indicators for burning to be used in burnt area detection algorithms. The second phase (III) aimed at developing the most suitable multitemporal compositing method for burnt area mapping in this region in order to provide optimal material for large scale burnt area mapping. The third phase (IV, V) concentrated in the variation of burn scar patterns and size distribution by land cover and soil type and its effect in regional medium resolution burnt area mapping. The goal of the third phase was to evaluate the usability and limits of medium resolution optical burnt area mapping and enable correct interpretation of the results. In addition, possibilities to overcome problems connected to small burn scars using super-resolution images were assessed during this final stage of the study.
Together all these sections were expected to 1) improve our capabilities to produce regional burnt area maps with medium resolution satellite data in insular Southeast Asia in order to be able to better serve the increasing need of high quality burnt area maps as input to further studies estimating regional and global effects of vegetation fires in this region and 2) help scientists working with the data to correctly interpret the results and, if necessary, complement burnt area maps produced using medium resolution satellite data with alternative materials and methods in some parts or all over the region. MATERIALS AND METHODS Satellite data Medium and coarse resolution data
All medium and coarse resolution (250-1000m) data used in this study were acquired by the MODIS sensor. It was decided to use MODIS data since it offers higher spatial and spectral resolution compared to other satellite sensors commonly used in large scale burnt area detection (e.g. NOAA AVHRR and SPOT VEGETATION), and since it is readily available free of charge. Especially the higher spatial resolution was considered to be valuable since small burn scars were expected to play an important role in this region. The MODIS sensor can be found aboard the Terra and Aqua satellites. The orbit of Terra around the Earth is timed so that it passes from north to south across the equator in the morning (around 10:30), while Aqua passes south to north over the equator in the afternoon (around 13:30). Corresponding night passes occur around 22:30 and 1.30 in the night. The sensor has 36 spectral bands, with varying spatial resolution between 250m and 1000m. It is designed to gather data to improve understanding of global dynamics and processes occurring on the land, in the oceans and in the lower atmosphere.
19
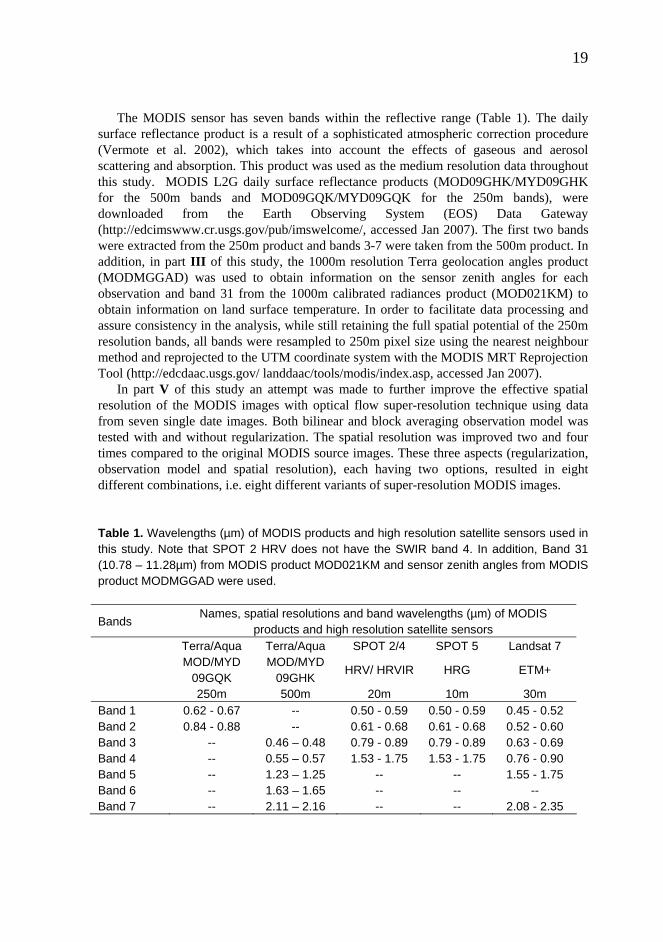
The MODIS sensor has seven bands within the reflective range (Table 1). The daily
surface reflectance product is a result of a sophisticated atmospheric correction procedure (Vermote et al. 2002), which takes into account the effects of gaseous and aerosol scattering and absorption. This product was used as the medium resolution data throughout this study. MODIS L2G daily surface reflectance products (MOD09GHK/MYD09GHK for the 500m bands and MOD09GQK/MYD09GQK for the 250m bands), were downloaded from the Earth Observing System (EOS) Data Gateway (http://edcimswww.cr.usgs.gov/pub/imswelcome/, accessed Jan 2007). The first two bands were extracted from the 250m product and bands 3-7 were taken from the 500m product. In addition, in part III of this study, the 1000m resolution Terra geolocation angles product (MODMGGAD) was used to obtain information on the sensor zenith angles for each observation and band 31 from the 1000m calibrated radiances product (MOD021KM) to obtain information on land surface temperature. In order to facilitate data processing and assure consistency in the analysis, while still retaining the full spatial potential of the 250m resolution bands, all bands were resampled to 250m pixel size using the nearest neighbour method and reprojected to the UTM coordinate system with the MODIS MRT Reprojection Tool (http://edcdaac.usgs.gov/ landdaac/tools/modis/index.asp, accessed Jan 2007).
In part V of this study an attempt was made to further improve the effective spatial resolution of the MODIS images with optical flow super-resolution technique using data from seven single date images. Both bilinear and block averaging observation model was tested with and without regularization. The spatial resolution was improved two and four times compared to the original MODIS source images. These three aspects (regularization, observation model and spatial resolution), each having two options, resulted in eight different combinations, i.e. eight different variants of super-resolution MODIS images.
Table 1. Wavelengths (µm) of MODIS products and high resolution satellite sensors used in this study. Note that SPOT 2 HRV does not have the SWIR band 4. In addition, Band 31 (10.78 – 11.28µm) from MODIS product MOD021KM and sensor zenith angles from MODIS product MODMGGAD were used.
Bands Names, spatial resolutions and band wavelengths (µm) of MODIS
products and high resolution satellite sensors Terra/Aqua Terra/Aqua SPOT 2/4 SPOT 5 Landsat 7 MOD/MYD
09GQK MOD/MYD
09GHK HRV/ HRVIR HRG ETM+
250m 500m 20m 10m 30m Band 1 0.62 - 0.67 -- 0.50 - 0.59 0.50 - 0.59 0.45 - 0.52 Band 2 0.84 - 0.88 -- 0.61 - 0.68 0.61 - 0.68 0.52 - 0.60 Band 3 -- 0.46 – 0.48 0.79 - 0.89 0.79 - 0.89 0.63 - 0.69 Band 4 -- 0.55 – 0.57 1.53 - 1.75 1.53 - 1.75 0.76 - 0.90 Band 5 -- 1.23 – 1.25 -- -- 1.55 - 1.75 Band 6 -- 1.63 – 1.65 -- -- -- Band 7 -- 2.11 – 2.16 -- -- 2.08 - 2.35

20
In the first two parts of this study (I and II) clouds and haze were removed from the MODIS images by accepting only pixels which had blue band (band 3) reflectance between 0 and 0.08 (reflectance scale 0-1). The blue band has the shortest wavelength among all the MODIS reflective bands and is therefore the most sensitive to clouds and haze. Later (III, IV and V) the cloud removal method was improved by developing a method that was based on bands 1, 3 and 7 (Table 1). A pixel was considered valid only if 1) the reflectance at band 3 was 0-0.08 and 2) the reflectance at band 1 was between 0.25·rb7 and 0.75·rb7 (where rb7 is the reflectance at band 7). The first rule eliminated thick clouds and haze, while the second rule effectively removed lighter haze, cloud shadows and varying artefacts caused by cloud edge reflection. The theory behind the second rule (i.e. strong correlation between bands 1 and 7 in clear atmospheric conditions) was presented by Kaufmann et al. (1997).
In addition to the abovementioned medium and coarse resolution data, the MODIS detected active fires i.e. hot spots were used to 1) locate burnt areas using groups of hotspots and confirm the appearance of burn scars during high resolution reference burnt area classification (I, II, III and IV) and 2) locate study sites in the most fire affected areas (IV). Due to the fact that the MODIS sensor can be found onboard two satellites (Terra and Aqua) it passes over insular Southeast Asia four times a day. This enabled good coverage of the fire activity, bearing in mind of course the limitations of hotspot detection presented in the introduction.
The hotspots were produced by the MODIS Rapid Response System (Web Fire Mapper, http://maps.geog.umd.edu/, accessed Jan 2007) using the version 4 contextual fire detection algorithm for MODIS (Giglio et al. 2003). The algorithm uses a combination of an absolute threshold test (threshold 360K for day, 320K for night at 4µm bands 21 and 22, 1000m resolution) and a series of contextual tests which look for the characteristic signature of an active fire using both the 4µm bands (21 and 22) and the 11µm band (31). In addition it incorporates cloud and water masking and several false alarm rejection tests (including e.g. sun glint rejection). A validation study of this algorithm in the Southeast Asian conditions with 17 high resolution (20m) SPOT images (Liew et al. 2003) found a commission error of 26.8% (false alarms) and omission error of 34.2% (undetected fires). False alarms were mainly attributed to hot surfaces after fire, while fires were left undetected especially in dense vegetation. High resolution reference data Altogether 21 high resolution satellite images were used in this study as burnt area reference data: one SPOT 2 HRV, three Landsat 7 ETM+, four SPOT 5 HRG and thirteen SPOT 4 HRVIR images (Table 1). In parts I and III, due to the lack of sufficient high resolution data, burnt reference areas were visually delineated directly on the 250m MODIS images using groups of detected active fires as confirmation of burning. High resolution images (one SPOT 2 HRV, one SPOT 4 HRVIR and two Landsat 7 ETM+) were used to visually check a sample of the reference areas after the delineation. No corrections were made to the reference areas on the basis of this visual evaluation since only a sample of the areas could be checked and some of the images were acquired so much later than the corresponding MODIS image that any systematic comparison of the two would have been problematic (due to expanded burn scars etc.). The visual check was merely performed to give an idea of the consistency of the reference areas and to help in the interpretation of the results.
21
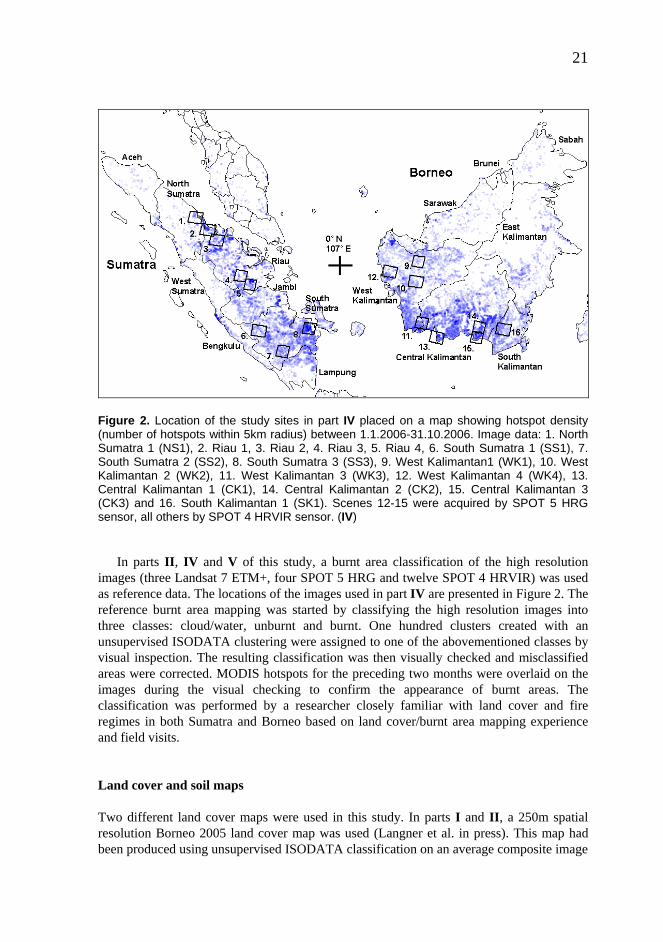
Figure 2. Location of the study sites in part IV placed on a map showing hotspot density (number of hotspots within 5km radius) between 1.1.2006-31.10.2006. Image data: 1. North Sumatra 1 (NS1), 2. Riau 1, 3. Riau 2, 4. Riau 3, 5. Riau 4, 6. South Sumatra 1 (SS1), 7. South Sumatra 2 (SS2), 8. South Sumatra 3 (SS3), 9. West Kalimantan1 (WK1), 10. West Kalimantan 2 (WK2), 11. West Kalimantan 3 (WK3), 12. West Kalimantan 4 (WK4), 13. Central Kalimantan 1 (CK1), 14. Central Kalimantan 2 (CK2), 15. Central Kalimantan 3 (CK3) and 16. South Kalimantan 1 (SK1). Scenes 12-15 were acquired by SPOT 5 HRG sensor, all others by SPOT 4 HRVIR sensor. (IV)
In parts II, IV and V of this study, a burnt area classification of the high resolution images (three Landsat 7 ETM+, four SPOT 5 HRG and twelve SPOT 4 HRVIR) was used as reference data. The locations of the images used in part IV are presented in Figure 2. The reference burnt area mapping was started by classifying the high resolution images into three classes: cloud/water, unburnt and burnt. One hundred clusters created with an unsupervised ISODATA clustering were assigned to one of the abovementioned classes by visual inspection. The resulting classification was then visually checked and misclassified areas were corrected. MODIS hotspots for the preceding two months were overlaid on the images during the visual checking to confirm the appearance of burnt areas. The classification was performed by a researcher closely familiar with land cover and fire regimes in both Sumatra and Borneo based on land cover/burnt area mapping experience and field visits.
Land cover and soil maps Two different land cover maps were used in this study. In parts I and II, a 250m spatial resolution Borneo 2005 land cover map was used (Langner et al. in press). This map had been produced using unsupervised ISODATA classification on an average composite image

22
Table 2. Description of the land cover types used in part I. (I) Land cover Description 1. Forest Primary and secondary forests (including mainly lowland evergreen, peat
swamp, upper dipterocarp and mountain forests). MODIS reflectance primarily a combination of green vegetation and shadow signature.
2. Regrowth Young secondary growth or heavily degraded forest. Typically bushes,
ferns and young trees. MODIS reflectance primarily from green vegetation.
3. Mosaic Mosaic of small-holder farms, small plantations and patches of forest.
MODIS reflectance primarily from green vegetation mixed with varying amount of soil signature.
4. Agriculture Mainly agricultural area, probably includes also significant amount of
grassland. MODIS reflectance primarily a mixture from green and senescent vegetation and soil.
5. New plantations
Large newly cleared areas. MODIS reflectance primarily from senescent vegetation and soil, with remaining patches of green vegetation.
of 60 MODIS images between January and June 2005. The map had altogether 11 land cover classes and the accuracy had been estimated using visual interpretation of 650 points in Landsat 7 ETM+ images. The results had shown an overall accuracy of 84.8% with a kappa coefficient of 0.83. In part I the land cover types were grouped into five major types that were considered to describe the variation of fire-induced changes caused by the pre-fire vegetation characteristics in this region (Table 2). Please note that the reflectance in agricultural areas (land cover type four) is seasonally highly variable.
In order to get coverage for both Sumatra and Borneo in part IV of this study, Global Land Cover GLC2000 Southeast Asia (SEA) map was selected (Stibig et al. 2003a). This map was part of the GLC2000 project where regional maps were produced with the help of local experts using regional methods (Bartholome and Belward 2005). The SEA 1km resolution land cover map was produced with SPOT 4 VEGETATION data (acquired between 1998-2000) using unsupervised clustering and was validated to have over 80% accuracy on forest/non-forest level (Stibig et al. 2003b). In this part of the study, six land cover types were created by combining some of the ten land cover types of the GLC2000 SEA map found in the study sites (Table 3).
The soil information used in part IV was derived from two different soil maps. For Borneo an Indonesia Soil map by the National Coordination Agency for Survey and Mapping from the year 1975 (scale 1:7 300 000) was used (Selvaradjou et al. 2005). For Sumatra the best available soil maps were considered to be the 1:5 000 000 scale maps published by Laumonier (1997). They were based on a 1979 revised version (published by Bogor Soil Research Institute) of the classification by Dudal and Soepraptohardjo (1957). All of these maps were downloaded in digital format from the European Digital Archive of the Soil Maps of Asia (http://eusoils.jrc.it/esdb_archive/ EuDASM/asia/index.htm, accessed Jan 2007).
23
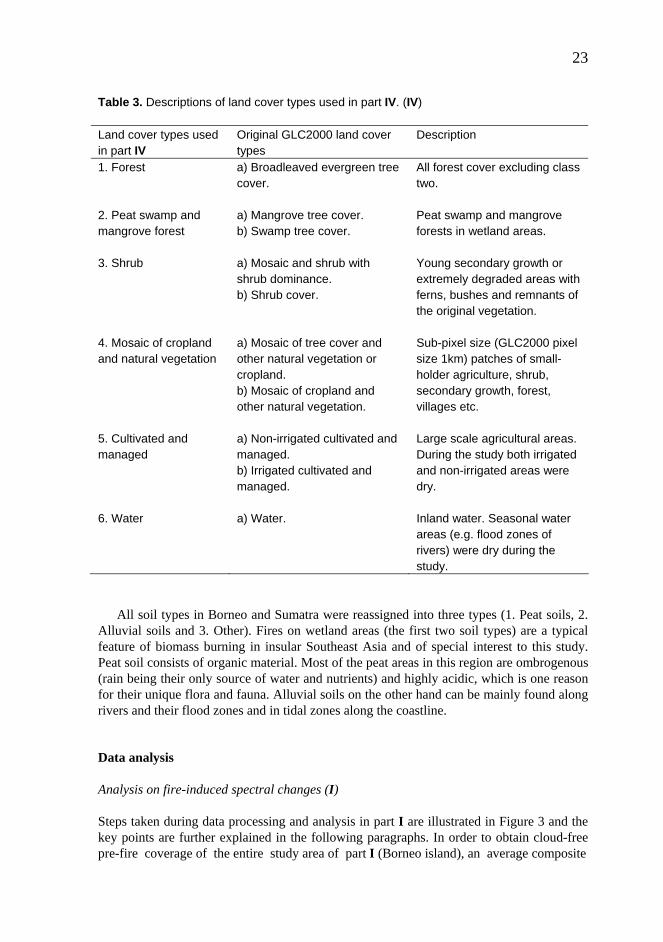
Table 3. Descriptions of land cover types used in part IV. (IV) Land cover types used in part IV
Original GLC2000 land cover types
Description
1. Forest a) Broadleaved evergreen tree cover.
All forest cover excluding class two.
2. Peat swamp and mangrove forest
a) Mangrove tree cover. b) Swamp tree cover.
Peat swamp and mangrove forests in wetland areas.
3. Shrub a) Mosaic and shrub with
shrub dominance. b) Shrub cover.
Young secondary growth or extremely degraded areas with ferns, bushes and remnants of the original vegetation.
4. Mosaic of cropland and natural vegetation
a) Mosaic of tree cover and other natural vegetation or cropland. b) Mosaic of cropland and other natural vegetation.
Sub-pixel size (GLC2000 pixel size 1km) patches of small-holder agriculture, shrub, secondary growth, forest, villages etc.
5. Cultivated and managed
a) Non-irrigated cultivated and managed. b) Irrigated cultivated and managed.
Large scale agricultural areas. During the study both irrigated and non-irrigated areas were dry.
6. Water a) Water. Inland water. Seasonal water
areas (e.g. flood zones of rivers) were dry during the study.
All soil types in Borneo and Sumatra were reassigned into three types (1. Peat soils, 2.
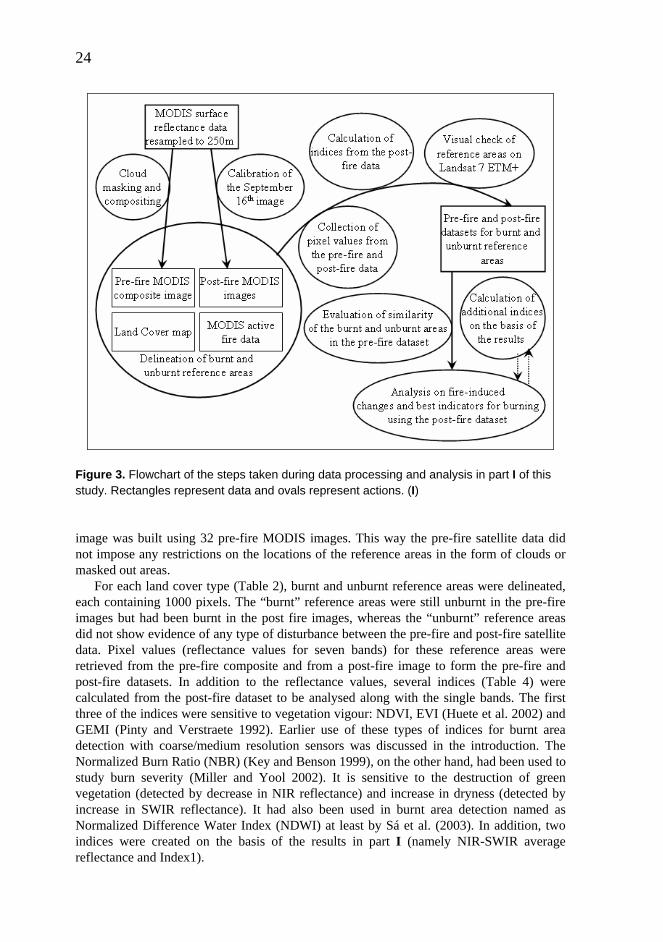
Alluvial soils and 3. Other). Fires on wetland areas (the first two soil types) are a typical feature of biomass burning in insular Southeast Asia and of special interest to this study. Peat soil consists of organic material. Most of the peat areas in this region are ombrogenous (rain being their only source of water and nutrients) and highly acidic, which is one reason for their unique flora and fauna. Alluvial soils on the other hand can be mainly found along rivers and their flood zones and in tidal zones along the coastline. Data analysis Analysis on fire-induced spectral changes (I) Steps taken during data processing and analysis in part I are illustrated in Figure 3 and the key points are further explained in the following paragraphs. In order to obtain cloud-free pre-fire coverage of the entire study area of part I (Borneo island), an average composite
24
Figure 3. Flowchart of the steps taken during data processing and analysis in part I of this study. Rectangles represent data and ovals represent actions. (I)
image was built using 32 pre-fire MODIS images. This way the pre-fire satellite data did not impose any restrictions on the locations of the reference areas in the form of clouds or masked out areas.
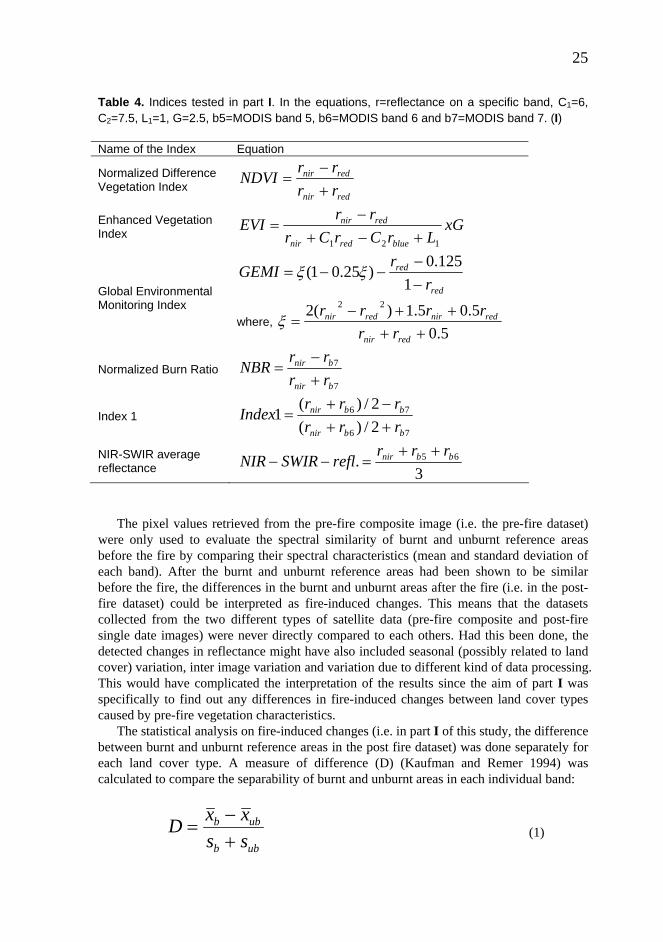
For each land cover type (Table 2), burnt and unburnt reference areas were delineated, each containing 1000 pixels. The “burnt” reference areas were still unburnt in the pre-fire images but had been burnt in the post fire images, whereas the “unburnt” reference areas did not show evidence of any type of disturbance between the pre-fire and post-fire satellite data. Pixel values (reflectance values for seven bands) for these reference areas were retrieved from the pre-fire composite and from a post-fire image to form the pre-fire and post-fire datasets. In addition to the reflectance values, several indices (Table 4) were calculated from the post-fire dataset to be analysed along with the single bands. The first three of the indices were sensitive to vegetation vigour: NDVI, EVI (Huete et al. 2002) and GEMI (Pinty and Verstraete 1992). Earlier use of these types of indices for burnt area detection with coarse/medium resolution sensors was discussed in the introduction. The Normalized Burn Ratio (NBR) (Key and Benson 1999), on the other hand, had been used to study burn severity (Miller and Yool 2002). It is sensitive to the destruction of green vegetation (detected by decrease in NIR reflectance) and increase in dryness (detected by increase in SWIR reflectance). It had also been used in burnt area detection named as Normalized Difference Water Index (NDWI) at least by Sá et al. (2003). In addition, two indices were created on the basis of the results in part I (namely NIR-SWIR average reflectance and Index1).
25
Table 4. Indices tested in part I. In the equations, r=reflectance on a specific band, C1=6, C2=7.5, L1=1, G=2.5, b5=MODIS band 5, b6=MODIS band 6 and b7=MODIS band 7. (I) Name of the Index Equation
Normalized Difference Vegetation Index
rednir
rednir
rrrr
NDVI+−
=
Enhanced Vegetation Index xG
LrCrCrrr
EVIbluerednir
rednir
121 +−+−
=
Global Environmental Monitoring Index
red
red
rr
GEMI−−
−−=1
125.0)25.01( ξξ
where, 5.0
5.05.1)(2 22
++++−
=rednir
rednirrednir
rrrrrr
ξ
Normalized Burn Ratio 7
7
bnir
bnir
rrrr
NBR+−
=
Index 1 76
76
2/)(2/)(
1bbnir
bbnir
rrrrrr
Index++−+
=
NIR-SWIR average reflectance 3
. 65 bbnir rrrreflSWIRNIR
++=−−
The pixel values retrieved from the pre-fire composite image (i.e. the pre-fire dataset)
were only used to evaluate the spectral similarity of burnt and unburnt reference areas before the fire by comparing their spectral characteristics (mean and standard deviation of each band). After the burnt and unburnt reference areas had been shown to be similar before the fire, the differences in the burnt and unburnt areas after the fire (i.e. in the post-fire dataset) could be interpreted as fire-induced changes. This means that the datasets collected from the two different types of satellite data (pre-fire composite and post-fire single date images) were never directly compared to each others. Had this been done, the detected changes in reflectance might have also included seasonal (possibly related to land cover) variation, inter image variation and variation due to different kind of data processing. This would have complicated the interpretation of the results since the aim of part I was specifically to find out any differences in fire-induced changes between land cover types caused by pre-fire vegetation characteristics.
The statistical analysis on fire-induced changes (i.e. in part I of this study, the difference between burnt and unburnt reference areas in the post fire dataset) was done separately for each land cover type. A measure of difference (D) (Kaufman and Remer 1994) was calculated to compare the separability of burnt and unburnt areas in each individual band:
ubb
ubb
ssxxD
+−
= (1)

26
where ix and i are the mean and standard deviation of burnt and unburnt areas respectively. This measure normalises the difference in the means with the sum of the standard deviations. Kaufman and Remer (1994) interpreted D > 1.0 to indicate good separability and D < 1.0 poor separability. In this study, however, more important than the value in one band (or index), was the ranking of the bands (and indices) according to their separability between burnt and unburnt areas. The sign of the D-value indicated whether burning had caused a drop (negative) or rise (positive) in the reflectance in the respective wavelength or index value.
s
Evaluation of multitemporal compositing methods (III)
Altogether, 102 daily images were selected to be used (52 from the Central Kalimantan study area and 50 from Riau) in part III of this study (Figure 4). A first set of monthly MODIS composites were created (July, August and September 2005 for both of the study areas) using six different compositing methods. In all the methods the resulting composite image consisted of a stack of seven reflective bands and a sensor zenith angle value. The six compositing algorithms are listed below by the criterion to select a stack of data from a particular single date image among the valid candidates. Abbreviations for each method and the original spatial resolution at the nadir of the band(s) used in the selection criteria are given in parenthesis.
1. Maximum NDVI (MaxNDVI, 250m) 2. Maximum band 7 (MaxB7, 500 m) 3. Maximum band 31 (MaxB31, 1000 m) 4. Minimum NBR (MinNBR, 250m and 500m) 5. Minimum band 2 (MinB2, 250 m) 6. Minimum band 5 (MinB5, 500 m)
For this first set of composites (i.e. the basic composites), all valid (i.e. the ones that had
passed the cloud detection test) observations from the MODIS passes were used. In addition to the basic composites, a second set was created by applying the six compositing
Figure 4. Location of study areas in part III. (III)
27
methods on pixels with a sensor zenith angle less than 40 degrees (i.e. restricted angle composites). The spatial resolution of MODIS data decreases from the nadir to the edges of the scanning swath. For the 1 km resolution bands the ground resolution cell size at the edge of the swath is 4.83 km along scan and 2.01 km along track and the decrease is especially rapid in sensor zenith angles greater than 40 degrees (Wolfe et al. 1998). As small-holder burning, which produces small burn scars, is an important feature of the fire regimes in Southeast Asia (Nicolas 1998, Bowen et al. 2001), effective spatial resolution of the composite images was considered to be important, and for this reason, the restricted angle composites were tested. For the same reason only 250m and 500m bands were considered when evaluating the separability between burnt and unburnt areas.
Three criteria were used to evaluate the usability of different compositing methods: 1) Homogeneity. In addition to visual inspection, a simple heterogeneity statistic was
used to quantify the differences between compositing methods. The coefficient of variation (i.e. standard deviation divided by mean) within a 5x5 kernel was multiplied by 100, thus producing the standard deviation as a percentage of the mean. Band 2 was used to calculate the statistic since it had a 250m spatial resolution and it was considered to be the single most important band in burnt area detection. Average values of this statistic over each composite were compared to quantify the differences between compositing methods. The statistic included both natural (i.e. variation due to land cover) and artificial heterogeneity, but since the natural heterogeneity did not vary between compositing methods, all the differences in the statistic were due to the compositing methods.
2) Separability between burnt and unburnt areas. Burnt and unburnt reference datasets were separately collected for both green vegetation dominated areas and senescent vegetation/soil dominated areas. This was done in order to evaluate if different compositing methods performed well in these areas that were noticed to have different types of spectral changes due to fire in this region (I). Altogether, 10 400 pixels were used as reference sample. The Bhattacharyya distance (Fukunaga 1990) was used to evaluate separability between burnt and unburnt areas in different composites, using all seven reflective bands. According to Lee and Choi (2000) Bhattacharyya distances higher than 1.46 to correspond less than 5% classification errors in maximum likelihood classification.
3) Sensor zenith angles and effective spatial resolution. Each compositing method was evaluated by the average sensor zenith angle of the observations selected for the resulting composites. In theory, the smaller the mean was, the smaller was the effective spatial resolution. However, the original spatial resolution (250m-1000m) of the band(s) used in the compositing criteria was also taken into consideration when evaluating the final effective spatial resolution. Investigation of burn scar patterns and size distribution (IV)
A polygon based approach was used to investigate the nature of burn scars in this region. Number of burn scars, total area and edge density (a measure of fragmentation previously used to analyse burn scars in Africa by Silva et al. 2005) were calculated from the reference burnt area maps. Edge density (perimeter/area) produces higher values for complex shapes and lower values for compact shapes. In addition, the distribution of burnt area into large (>25ha) and small (<25ha) burn scars was calculated. The 25ha limit was chosen partly because it has been suggested that small-holder burning rarely creates larger scars than this (Nicolas 1998, Bowen et al. 2001) and partly because 25ha corresponds to a 500m x 500m
28
pixel size and was therefore considered to be informative for medium resolution burnt area mapping.
However, the polygon based approach had some shortcomings. First of all, during the land cover and soil analysis, the location of a burn scar polygon had to be decided by the location of its centre. This might have given meaningless results, especially in the case of very large burns scars which spread across several land cover types. Secondly, and more importantly, as far as the medium resolution burnt area mapping was concerned, the fact that a burn scar was larger than 25ha did not necessarily mean that it would have filled one 500m resolution pixel. Narrow and/or fragmented burn scars that covered 25ha may have filled only small fractions of the 500m pixels they intersect.
For these reasons also a raster based simulation of medium resolution burnt area mapping was carried out in order to confirm polygon based findings on the usability and restrictions of regional level medium resolution burnt area mapping. The simulation was performed by overlaying a 500m x 500m grid over the reference burnt area maps. The proportion of burnt area in each grid cell was calculated and cells with more than 50% burnt were considered to be detected (as fully burnt), thus creating a simulated medium resolution burnt area map. According to Eva and Lambin (1998a) the 50% limit is a conservative estimate for burnt area mapping. They suggested that due to high contrast between newly burnt and unburnt areas, even pixels that were 40% or less is burnt could be detected as burnt. Assessment of the usability of super-resolution MODIS images (V)
The super-resolution technique was considered to potentially improve detection of small burn scars. In order to evaluate the usability of super-resolution images for burnt area mapping in this region, spectral separability between burnt and unburnt areas was calculated. All reference burnt areas were grouped into five classes according to their size. The maximum sizes of burn scars in each class were: 1. 1.5625ha (corresponding an area covered by a 125m resolution pixel), 2. 6.25ha (250m), 3. 25ha (500m), 4. 100ha (1000m) and 5. >100ha (>1000m). Burnt area in the five classes varied between 3700ha and 18 000ha, totalling around 41 000ha. The spectral separability between burn scars in different classes and unburnt reference areas were calculated in an average MODIS composite image and in the eight variants of super-resolution images using the Bhattacharyya distance (Fukunaga 1990). The average composite image created using the same data as the super-resolution images represented standard MODIS image in the analysis since none of the seven source images alone gave sufficient cloud free coverage over the study area. MAIN RESULTS AND DISCUSSION Fire-induced spectral changes (I, II, IV) The fire-induced changes were first studied in part I and the findings were subsequently tested in burnt area detection algorithms in parts II and IV. The results in part I showed that the reflectance in both bands 2 and 5 was relatively high in all of the land cover types, and
29
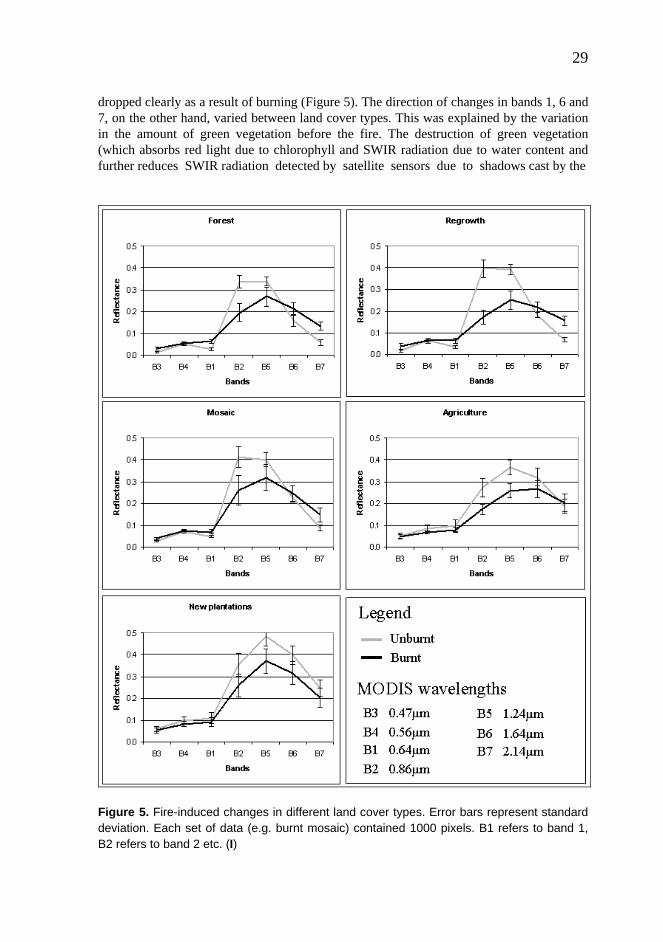
dropped clearly as a result of burning (Figure 5). The direction of changes in bands 1, 6 and 7, on the other hand, varied between land cover types. This was explained by the variation in the amount of green vegetation before the fire. The destruction of green vegetation (which absorbs red light due to chlorophyll and SWIR radiation due to water content and further reduces SWIR radiation detected by satellite sensors due to shadows cast by the
Figure 5. Fire-induced changes in different land cover types. Error bars represent standard deviation. Each set of data (e.g. burnt mosaic) contained 1000 pixels. B1 refers to band 1, B2 refers to band 2 etc. (I)
30
vegetation) leads to an increase in reflectance in bands 1, 6 and 7, as seen in the land cover types of forest, regrowth and mosaic, which are dominated by green vegetation (Figure 5). In the remaining two land cover types, dominated by senescent vegetation, the reflectance in bands 1 and 6 were already relatively high prior to fire and burning made it drop (due to dark ash). Band 7 was noticed to behave slightly differently in agricultural areas and new plantations, possibly due to variation in the amount of exposed soil between the two land cover types. In any case, the changes were very small in band 7 in the last two land cover types.
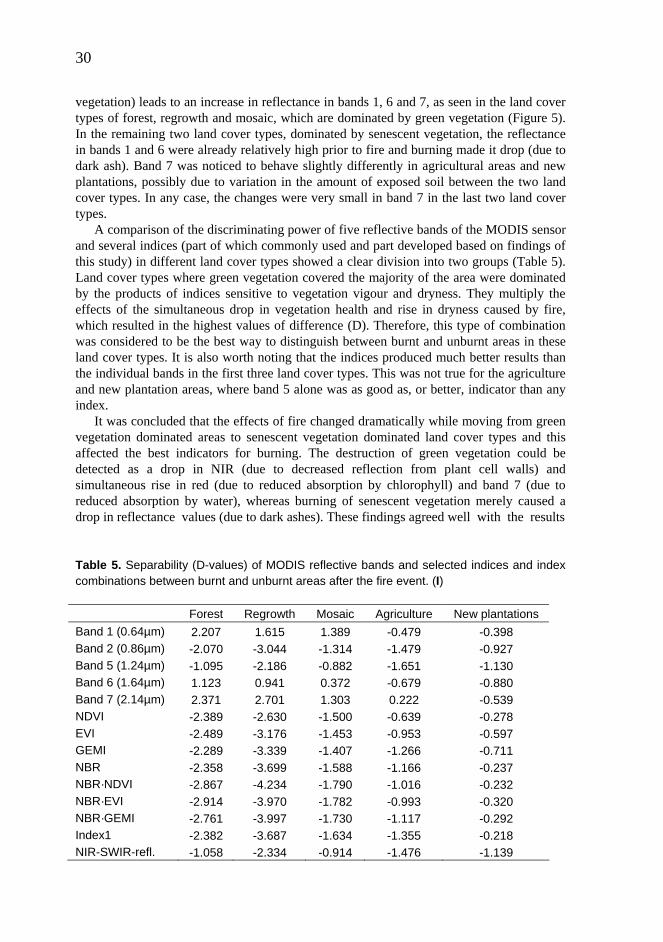
A comparison of the discriminating power of five reflective bands of the MODIS sensor and several indices (part of which commonly used and part developed based on findings of this study) in different land cover types showed a clear division into two groups (Table 5). Land cover types where green vegetation covered the majority of the area were dominated by the products of indices sensitive to vegetation vigour and dryness. They multiply the effects of the simultaneous drop in vegetation health and rise in dryness caused by fire, which resulted in the highest values of difference (D). Therefore, this type of combination was considered to be the best way to distinguish between burnt and unburnt areas in these land cover types. It is also worth noting that the indices produced much better results than the individual bands in the first three land cover types. This was not true for the agriculture and new plantation areas, where band 5 alone was as good as, or better, indicator than any index.
It was concluded that the effects of fire changed dramatically while moving from green vegetation dominated areas to senescent vegetation dominated land cover types and this affected the best indicators for burning. The destruction of green vegetation could be detected as a drop in NIR (due to decreased reflection from plant cell walls) and simultaneous rise in red (due to reduced absorption by chlorophyll) and band 7 (due to reduced absorption by water), whereas burning of senescent vegetation merely caused a drop in reflectance values (due to dark ashes). These findings agreed well with the results Table 5. Separability (D-values) of MODIS reflective bands and selected indices and index combinations between burnt and unburnt areas after the fire event. (I)
Forest Regrowth Mosaic Agriculture New plantations
Band 1 (0.64µm) 2.207 1.615 1.389 -0.479 -0.398 Band 2 (0.86µm) -2.070 -3.044 -1.314 -1.479 -0.927 Band 5 (1.24µm) -1.095 -2.186 -0.882 -1.651 -1.130 Band 6 (1.64µm) 1.123 0.941 0.372 -0.679 -0.880 Band 7 (2.14µm) 2.371 2.701 1.303 0.222 -0.539 NDVI -2.389 -2.630 -1.500 -0.639 -0.278 EVI -2.489 -3.176 -1.453 -0.953 -0.597 GEMI -2.289 -3.339 -1.407 -1.266 -0.711 NBR -2.358 -3.699 -1.588 -1.166 -0.237 NBR·NDVI -2.867 -4.234 -1.790 -1.016 -0.232 NBR·EVI -2.914 -3.970 -1.782 -0.993 -0.320 NBR·GEMI -2.761 -3.997 -1.730 -1.117 -0.292 Index1 -2.382 -3.687 -1.634 -1.355 -0.218 NIR-SWIR-refl. -1.058 -2.334 -0.914 -1.476 -1.139

31
of Silva et al. (2004), who consequently included pre-fire NDVI in their global burnt area detection algorithm in order to handle the spectral variability of fire-induced changes related to the type of vegetation. Interesting connections to regional burnt area detection algorithms could also be found: in the boreal areas band 1 and band 2 (NDVI) have been used in burnt area detection (e.g. Fraser et al. 2000) because they detect the destruction of green vegetation, whereas in the dry tropical areas bands 2, 5 and 6 have been noticed to be the best individual bands (Roy et al. 2002, Sá et al. 2003), exactly like in the last two land cover types in this study. However, in insular Southeast Asia both of these extremes existed, often side by side, causing high variation of fire-induced spectral changes even in small geographical regions.
Since indices or index combinations using bands 1, 2 and 7 were found to be the most prominent indicators of burning for green vegetation dominated areas and band 5 alone for areas dominated by senescent vegetation, empirically designed burnt area detection algorithms using these bands were tested. In the first test (II) all the areas were divided into green vegetation dominated and senescent vegetation dominated prior to the detection of burnt areas. However, the approach was subsequently refined to handle all the areas with one algorithm (IV). It has to be remembered that band 5 also showed relatively good separability in green vegetation dominated areas (Table 5). It was merely not as powerful in these areas as indices using bands 1, 2 and 7. These indices, on the other hand, did not detect burning in senescent vegetation dominated areas. Thus, using both of these indicators in all of the areas was considered to be merely beneficial. Therefore, in the second test (IV) a pixel was considered as a burnt area candidate if the product of NDVI and NBR dropped more than 0.3 or if band 5 reflectance dropped more than 20% from the pre-fire image to the post-fire image. In addition, the pixel value had to fulfil auxiliary criteria in order to be considered burnt. Two examples are given here: A) band 7 reflectance had to be more than 0.09 in the post-fire image and B) band 1 reflectance was not to be more than 0.01 lower than band 4 reflectance in the post-fire image. The two main criteria were designed to detect changes caused by fire in both green vegetation dominated and soil/senescent vegetation dominated areas, whereas the auxiliary conditions were meant to eliminate false alarms.
The two main criteria were found to detect large burnt areas in clear atmospheric conditions well (II and IV), as was expected on the basis of the results in part I. However, some omission and commission errors were noticed due to other changes in reflectance, not related to burning. Certain types of cloud shadows e.g. were falsely detected as burnt and needed to be excluded by adding the auxiliary condition on high reflectance at band 7. But this rule also cut out some of the darkest burnt areas where band 7 reflectance was very low due to dark ashes, regardless of the dryness of the area. On the other hand, commission errors were noticed especially in areas dominated by small-holder mosaic and large scale agriculture, where land clearance without burning was in some cases detected as burning. In any case, these problems were considered to be solvable with more sophisticated detection algorithms. The goal of this study was to find out the best indicators for detecting burnt areas and the practical tests were primarily conducted to verify the findings on the fire-induced changes in reflectance. The details on how to implement these findings into practice (i.e. detection algorithm) may vary considerably depending on the satellite data, resources and objectives of the projects they are used in.

32
Table 6. Number of available and selected passes and valid observations/pixel in different composites. Figures for composites where sensor zenith angle was restricted to lower than 40 degrees are printed in italic. (III)
Area Month Passes Selected Valid
observations/pixel
Percentage of study area according to the number of valid
observations/pixel Avg Std 0 1 2 3 4 5 >=6
Jul 19 17 10
4.5 2.5
2.8 1.6
4 7
10 23
14 26
15 20
14 13
11 7
31 4
Aug 22 19 11
6.2 2.7
3.4 2.0
1 11
4 20
8 21
11 17
12 11
12 9
52 11
Central Kalimantan
Sep 21 16 12
4.9 3.2
2.8 1.9
2 5
7 15
13 19
15 19
14 16
12 13
37 13
Jul 19 16 12
2.5 1.8
1.8 1.3
10 16
23 31
23 27
18 16
12 7
7 3
7 0
Aug 21 17 10
3.2 1.7
1.8 1.0
5 9
17 38
18 32
19 15
17 5
13 1
11 0
Riau
Sep 20 16 9
2.9 0.8
1.7 0.9
8 43
16 37
19 14
21 5
19 1
10 0
7 0
Multitemporal compositing for burnt area mapping (III)
Part III of this study highlighted the persistence of cloud cover in humid tropical regions. The number of available observations was generally very low (Table 6) in the monthly composites, regardless of the fact that the study was conducted around the driest time of year in the study areas. If the sensor zenith angle was restricted to a maximum of 40 degrees, the usability of the composites was seriously called into question due to a lack of cloud free observations. Cloud persistence at this level has serious effects on the usability and reliability of coarse/medium resolution large scale burnt area detection in this region, as was later noticed also in part IV.
Comparison of the heterogeneity of the composites revealed that the MaxB31 method clearly produced the most homogeneous composite. This characteristic of maximum temperature composites had been noticed also in other regions (Sousa et al. 2003, Chuvieco et al. 2005). The MinB2 and MinB5 composites were found to be slightly affected by cloud shadows but otherwise to be close to the quality of the MaxB31 in homogeneity. As far as separability between burnt and unburnt areas was concerned (Table 7), the MaxB31 composite revealed some unexpected weaknesses. In green vegetation dominated areas it was clearly hampered by the lower (1km) resolution of the thermal band on which the compositing was based on. In senescent areas, on the other hand, the method seemed to prefer pre-fire observations. The reason for this did not become entirely clear, but it might have been connected to the fact that most of the senescent reference areas were on drained peatlands. Due to low thermal conductivity of dry peat, the surface can reach high temperatures (Rieley and Page 2005, p.46). Thus, on peatlands the difference between pre- and post-fire ground surface temperature on areas covered by senescent vegetation may be more dependent on other factors (e.g. weather) than burning.

33
All of the minimum reflectance composites were found to produce good separability values between burnt and unburnt areas. Band 2 reflectance is especially sensitive to destruction of green vegetation, which explains why both the MinB2 and MinNBR methods performed slightly better than the MinB5 method on green vegetation dominated areas. MinB5, on the other hand, ranked number one on senescent areas and showed the most equal results over both land cover types. MinB5 composites were the only ones where the separability between burnt and unburnt areas was not clearly higher in green vegetation dominated areas. The underlying reason for this is that the spectral signatures of green vegetation and burnt areas differ more than those of senescent vegetation and burnt areas, as can be seen in Figure 5. This means that the equal separability in both of the land cover types in MinB5 method can be regarded as a sign that it is disproportionately powerful on senescent areas but also works reasonably well for green vegetation. This agrees well with the results of part I of this study.
Table 7. Bhattacharyya distance between burnt and unburnt reference areas in different composites for both green vegetation dominated and senescent vegetation/soil dominated areas. Results for composites where sensor zenith angle was restricted to lower than 40 degrees are printed in italics. Ranking for the compositing methods is in parenthesis. The ranking was done separately for vegetation dominated and senescent vegetation/soil dominated areas. (III)
Central Kalimantan Riau Aug Sep Aug Sep Avg
Green 1.26 1.32
1.34 1.38
1.02 0.9 1.13 (6) 1.35 (6) MaxNDVI
Senescent 0.65 1.04
0.98 0.68
1.06 0.93 0.90 (6) 0.86 (6)
Green 1.63 1.25
2.46 3.11
2.11 1.12 1.83 (5) 2.18 (5)
MaxB7 Senescent
1.05 1.57
1.22 1.28
0.84 1.14 1.06 (5) 1.42 (5)
Green 2.69 2.43
3.05 3.04
1.38 1.31 2.11 (4) 2.74 (4)
MaxB31 Senescent
1.87 2.07
1.44 1.47
1.12 1.30 1.43 (4) 1.77 (4)
Green 3.53 2.34
4.79 4.68
1.96 1.4 2.92 (2) 3.51 (3)
MinNBR Senescent
2.04 2.00
3.61 3.50
1.08 1.53 2.07 (3) 2.75 (3)
Green 4.24 2.23
5.13 5.23
1.61 1.39 3.09 (1) 3.73 (1)
MinB2 Senescent
3.27 3.06
3.18 2.90
1.69 1.16 2.33 (2) 2.98 (2)
Green 2.71 2.03
4.53 5.03
1.94 1.61 2.60 (3) 3.53 (2)
MinB5 Senescent
3.46 3.22
3.53 3.21
1.22 1.67 2.57 (1) 3.21 (1)
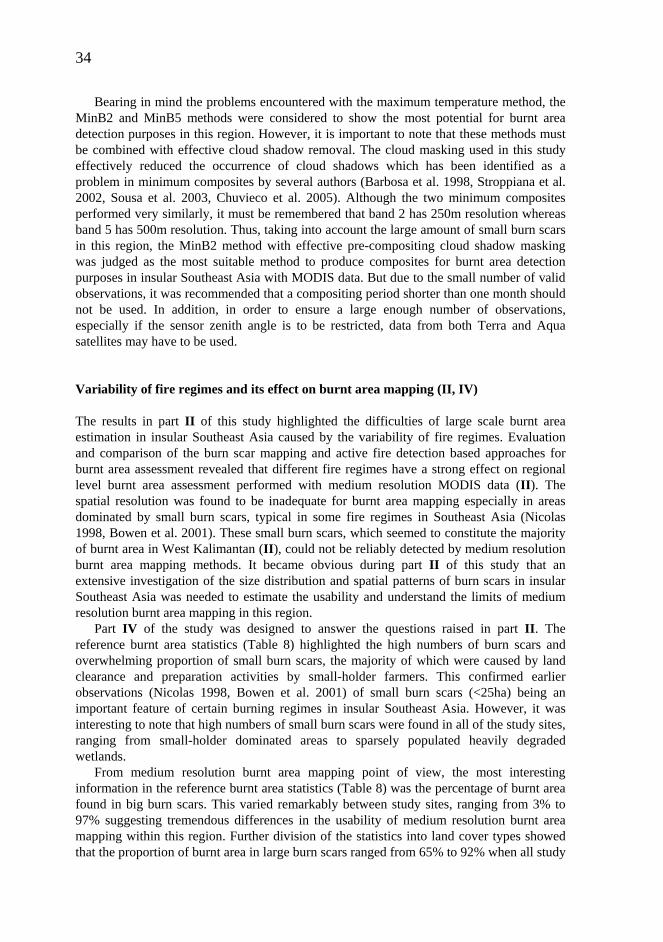
34
Bearing in mind the problems encountered with the maximum temperature method, the MinB2 and MinB5 methods were considered to show the most potential for burnt area detection purposes in this region. However, it is important to note that these methods must be combined with effective cloud shadow removal. The cloud masking used in this study effectively reduced the occurrence of cloud shadows which has been identified as a problem in minimum composites by several authors (Barbosa et al. 1998, Stroppiana et al. 2002, Sousa et al. 2003, Chuvieco et al. 2005). Although the two minimum composites performed very similarly, it must be remembered that band 2 has 250m resolution whereas band 5 has 500m resolution. Thus, taking into account the large amount of small burn scars in this region, the MinB2 method with effective pre-compositing cloud shadow masking was judged as the most suitable method to produce composites for burnt area detection purposes in insular Southeast Asia with MODIS data. But due to the small number of valid observations, it was recommended that a compositing period shorter than one month should not be used. In addition, in order to ensure a large enough number of observations, especially if the sensor zenith angle is to be restricted, data from both Terra and Aqua satellites may have to be used. Variability of fire regimes and its effect on burnt area mapping (II, IV)
The results in part II of this study highlighted the difficulties of large scale burnt area estimation in insular Southeast Asia caused by the variability of fire regimes. Evaluation and comparison of the burn scar mapping and active fire detection based approaches for burnt area assessment revealed that different fire regimes have a strong effect on regional level burnt area assessment performed with medium resolution MODIS data (II). The spatial resolution was found to be inadequate for burnt area mapping especially in areas dominated by small burn scars, typical in some fire regimes in Southeast Asia (Nicolas 1998, Bowen et al. 2001). These small burn scars, which seemed to constitute the majority of burnt area in West Kalimantan (II), could not be reliably detected by medium resolution burnt area mapping methods. It became obvious during part II of this study that an extensive investigation of the size distribution and spatial patterns of burn scars in insular Southeast Asia was needed to estimate the usability and understand the limits of medium resolution burnt area mapping in this region.
Part IV of the study was designed to answer the questions raised in part II. The reference burnt area statistics (Table 8) highlighted the high numbers of burn scars and overwhelming proportion of small burn scars, the majority of which were caused by land clearance and preparation activities by small-holder farmers. This confirmed earlier observations (Nicolas 1998, Bowen et al. 2001) of small burn scars (<25ha) being an important feature of certain burning regimes in insular Southeast Asia. However, it was interesting to note that high numbers of small burn scars were found in all of the study sites, ranging from small-holder dominated areas to sparsely populated heavily degraded wetlands.
From medium resolution burnt area mapping point of view, the most interesting information in the reference burnt area statistics (Table 8) was the percentage of burnt area found in big burn scars. This varied remarkably between study sites, ranging from 3% to 97% suggesting tremendous differences in the usability of medium resolution burnt area mapping within this region. Further division of the statistics into land cover types showed that the proportion of burnt area in large burn scars ranged from 65% to 92% when all study

35
Table 8. Reference burnt area statistics for the study sites used in part IV of this study. Statistics are based on burnt area classification on high resolution SPOT 4 and 5 images. (IV) Total burnt Small Scars (<25ha) Big Scars (>25ha)
Area in
1000ha N of scars
Edge density
N of scars
% of burnt area
Edge density
N of scars
% of burnt area
Edge density
NS1 17.7 4954 23.3 4885 38 39.94 69 63 13.3 Riau1 14.1 3994 26.7 3893 43 40.50 101 57 16.4 Riau2 11.5 3757 25.8 3686 48 38.68 71 53 14.0 Riau3 8.3 2484 25.5 2436 46 38.78 48 54 14.3 Riau4 22.0 4746 18.5 4677 35 38.05 69 65 7.8 SS1 16.5 6842 28.6 6795 68 35.58 47 33 14.0 SS2 20.2 7300 26.8 7182 58 35.08 118 42 15.3 SS3 59.2 1014 5.0 950 3 34.50 64 97 4.1 WK1 23.0 10804 28.9 10727 67 36.45 77 33 13.6 WK2 11.6 8069 35.7 8060 97 36.31 9 3 17.7 WK3 44.9 5447 18.2 5222 22 34.78 225 78 13.6 WK4 14.8 4998 33.9 4921 51 47.21 77 49 19.9 CK1 40.8 1168 12.9 1121 4 54.69 47 96 11.2 CK2 77.4 3142 12.6 3047 6 51.54 95 94 10.2 CK3 75.7 2221 13.6 2176 4 55.54 45 96 11.7 SK1 41.2 7570 22.4 7438 26 41.14 132 74 15.9 Total 498.9 78510 17.7 77216 24 39.22 1294 77 11.1
sites were combined. However, more detailed examination of the values revealed a high variation between study sites within one land cover type and, in some cases, low variation between land cover types within one study site (e.g. CK1). This suggested that the correlation between land cover type and burn scar size is not strong in this region, but all land cover types seemed to include both small and large scars in varying proportions, depending on the location of the study site. This is in contradiction with studies made in Africa and Australia, which have suggested clear connections between land cover types and the performance of coarse resolution burnt area mapping (e.g. grassland vs. forest) (Eva and Lambin 1998a, Stroppiana et al. 2003 and Silva et al. 2005). They have explained the differences mainly by smaller burn scar size in forest ecosystems. This has also been mentioned by Bucini and Lambin (2002).
The weak correlation between burn scars size and land cove type in insular Southeast Asia was explained by the fact that burning does not happen in natural ecosystems in this region. Humid tropical forests are very resistant to fires in natural conditions (Uhl et al. 1988, Uhl and Kaufmann 1990) and if burning is performed, it usually results in small scars in humid environment (Korontzi et al. 2003). However, practically all biomass burning in insular Southeast Asia is caused by human activities and it happens mainly in managed or degraded ecosystems (Bowen et al. 2001, II). It was concluded that in insular Southeast Asia continuing land cover change with fast expansion of managed agroecosystems together with the use of fire as a tool and the fire vulnerability of degraded natural
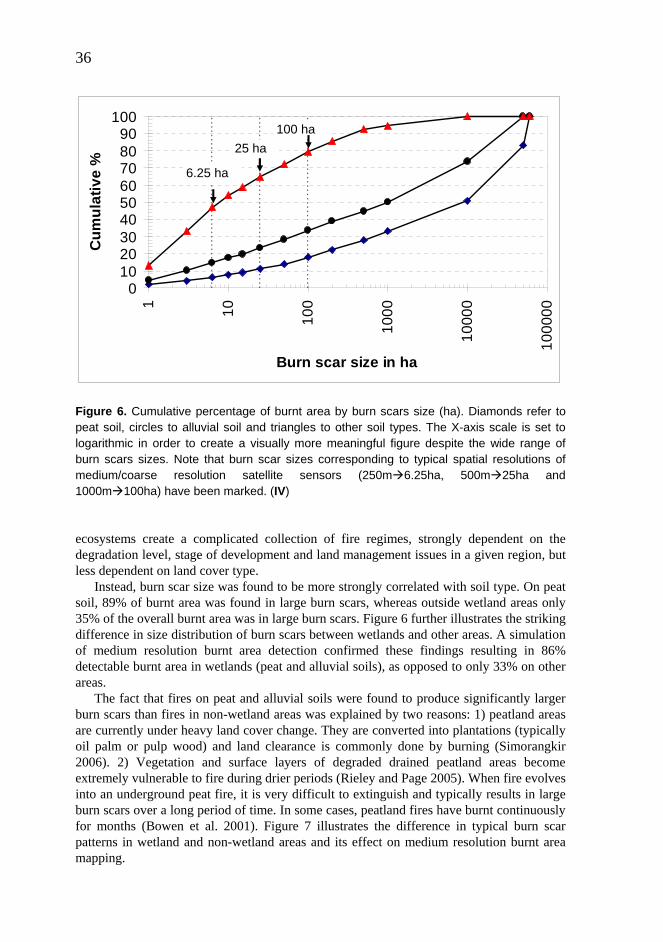
36
0102030405060708090
100
1 10 100
1000
1000
0
1000
00
Burn scar size in ha
Cum
ulat
ive
%
6.25 ha
25 ha100 ha
Figure 6. Cumulative percentage of burnt area by burn scars size (ha). Diamonds refer to peat soil, circles to alluvial soil and triangles to other soil types. The X-axis scale is set to logarithmic in order to create a visually more meaningful figure despite the wide range of burn scars sizes. Note that burn scar sizes corresponding to typical spatial resolutions of medium/coarse resolution satellite sensors (250m 6.25ha, 500m 25ha and 1000m 100ha) have been marked. (IV)
ecosystems create a complicated collection of fire regimes, strongly dependent on the degradation level, stage of development and land management issues in a given region, but less dependent on land cover type.
Instead, burn scar size was found to be more strongly correlated with soil type. On peat soil, 89% of burnt area was found in large burn scars, whereas outside wetland areas only 35% of the overall burnt area was in large burn scars. Figure 6 further illustrates the striking difference in size distribution of burn scars between wetlands and other areas. A simulation of medium resolution burnt area detection confirmed these findings resulting in 86% detectable burnt area in wetlands (peat and alluvial soils), as opposed to only 33% on other areas.
The fact that fires on peat and alluvial soils were found to produce significantly larger burn scars than fires in non-wetland areas was explained by two reasons: 1) peatland areas are currently under heavy land cover change. They are converted into plantations (typically oil palm or pulp wood) and land clearance is commonly done by burning (Simorangkir 2006). 2) Vegetation and surface layers of degraded drained peatland areas become extremely vulnerable to fire during drier periods (Rieley and Page 2005). When fire evolves into an underground peat fire, it is very difficult to extinguish and typically results in large burn scars over a long period of time. In some cases, peatland fires have burnt continuously for months (Bowen et al. 2001). Figure 7 illustrates the difference in typical burn scar patterns in wetland and non-wetland areas and its effect on medium resolution burnt area mapping.

37
Figure 7. Illustration of the effect of burn scar types on medium resolution burnt area mapping. On the left, a typical example of wetland burn scars, and on the right, small-holder burning on a non-wetland area. Both examples are from the South Kalimantan 1 SPOT 4 image. From top to bottom: SK1 SPOT 4 image, reference burnt area mapping, medium resolution (500m) burnt area mapping simulation and MODIS (250m) burnt area mapping. (RGB:432) (SPOT image © 2006 CNES) (IV)
38
Usability of the super-resolution images (V) In order to find solution to the problem of small burn scars, usability of super-resolution MODIS images was tested. The spectral separability between burnt and unburnt areas in the average composite and super-resolution images are presented in Table 9. As far as the super-resolution images are concerned, two results are clearly visible: regularization improves separability considerably while increasing the effective spatial resolution from 125m to 67.5m does not have any positive effect. Disturbance created by the edges of masked out areas in the source images was considered to be responsible for the lower separability in images with no regularization. The lack of improvement in spectral separability when effective spatial resolution was changed from 125m to 67.5m, on the other hand, was explained by insufficient number of source images. Super-resolution method was not able to produce four times higher effective spatial resolution with a small sample (on average 4.5 cloud free observations).
The spectral separability increased towards bigger burn scars due to less spectral mixture of burnt and unburnt areas (Table 9). However, it was noted that the separability was lower in the super-resolution images than in the average composite image in all of the size classes. This was unexpected since in theory super-resolution technique should have improved the separability in small burn scars. The poor performance of the super-resolution images was explained by atmospheric effects (clouds, smoke, haze etc.) that not only reduce the number of available observations dramatically in this region, but also decrease the quality of the super-resolution images due to atmospheric artefacts and disturbance created by the edges of masked out areas. It was concluded that super-resolution technique is not applicable for regional level burnt area mapping in the conditions of insular Southeast Asia with the materials and methods used in this study.
Table 9. Bhattacharyya distances between burnt and unburnt reference areas in the average composite and eight variants of super-resolution images. “Reg.” refers to regularization with line search. (V)
Burnt area size classes Image data
Class 1 Class 2 Class 3 Class 4 Class 5 250m average composite 1.338 1.420 1.914 2.320 3.071 125m block averaging, no reg. 0.663 0.700 0.846 1.132 1.697 125m block averaging, reg. 1.250 1.329 1.614 2.342 2.824 67.5m block averaging, no reg. 0.566 0.508 0.563 0.645 1.129 67.5m block averaging, reg. 1.162 1.082 1.184 1.360 2.037 125m bilinear, no reg. 0.761 0.802 0.953 1.302 1.856 125m bilinear, reg. 1.198 1.275 1.529 2.189 2.732 67.5m bilinear, no reg. 0.747 0.666 0.730 0.840 1.399 67.5m bilinear, reg. 1.008 0.921 1.000 1.170 1.788
39
CONCLUSIONS
This study has investigated three major aspects affecting the implementation and limits of medium resolution burnt area mapping in insular Southeast Asia keeping in mind the special characteristics of land cover, climate and fire regimes in this region. The results revealed that fire-induced changes in reflectance from medium resolution point of view, and thereby the best indicators between burnt and unburnt areas among wavelengths and multi-band indices, vary significantly according to pre-fire vegetation greenness. Considering the heterogeneous land cover structure in this region, this variation should be taken into account in change detection based burnt area mapping with reflective medium resolution data in order to maximally utilise the potential of these data.
Minimum NIR (band 2, 0.86µm) composites produced with cloud shadow masking were considered the most suitable material for burnt area mapping in insular Southeast Asia with MODIS data. However, cloud cover was noticed to severely disturb large scale burnt area mapping on several occasions. In order to minimize the effects of cloud cover, no shorter than monthly compositing period was recommended and whenever possible, the use of images from both Terra and Aqua satellite could be considered if MODIS data is used.
In any case, great caution is needed when interpreting regional burnt area maps in this region. A strong variation in the patterns and size distribution of burn scars was documented, which affected the reliability of medium resolution burnt area mapping. Unlike land cover, soil type was found to be a good indicator of the proportion of burnt area found in large burn scars and medium resolution burnt area mapping was found to be suitable for wetland areas. These, often extremely degraded, wetland areas experience yearly burning in varying intensity and are the main source of the annual haze affecting large areas of insular Southeast Asia. In addition, these fires cause globally significant carbon emissions due to burning peat (Page et al. 2002, Cochrane 2003) and contribute to the ever increasing carbon concentration in the atmosphere, which again is considered to be an important factor in global climate change. When the abovementioned issues are combined with efforts to monitor the remaining wetland areas and control continuing degradation and conversion, it becomes obvious why fires in Southeast Asian wetlands have attracted worldwide attention during the past ten years and why it is important to be able to monitor the extent of burnt surface in these areas.
On the other hand, the usability of medium resolution satellite data for burnt area mapping in non-wetland areas in this region was considered to be low. Alternative data and methods or calibration with extensive amount of high resolution data may have to be used to reliably estimate the extent of burnt surface in these areas. However, the use of high resolution satellite data is complicated by high cost and sporadic availability of such images in the humid tropical conditions of insular Southeast Asia. Therefore, a test with super-resolution MODIS images was conducted as a potential solution to this problem. But it failed to improve the detectability of small burn scars most likely due to atmospheric effects and insufficient number of available observations. It did, however, produce a visually superior image compared to traditional medium resolution composites and was therefore considered to be potentially useful for monitoring less dynamic targets than burn scars e.g. land cover.
40
Thus, regardless of the high cost and limited availability of high resolution satellite data, due to the difficulties and restrictions of medium resolution satellite data documented in this study, it seems that the most reliable way to map burnt areas in insular Southeast Asia with optical remote sensing data would be to use multi-source approaches combining medium and high resolution reflective data with soil information and possibly active fire detections. However, the details (materials, algorithms etc.) of any operational method have to be decided case by case. This study has not attempted to give specific instructions on the implementation of regional burnt area mapping system in insular Southeast Asia but aimed at improving our understanding of the underlying issues of medium resolution burnt area mapping in this region. The next step would be to apply the findings of this study into practice. It would be important to create an operational regional level burnt area mapping system for insular Southeast Asia that produces reliable results but it will be a challenging task.

41
REFERENCES Andreae, M.O. 1991. Biomass burning: its history, use, and distribution and its impact on
environmental quality and global climate. In: Levine, J. (Ed.). Global biomass burning, atmospheric, climatic, and biospheric implications. MIT Press, Cambridge, Massachusetts. p. 3-21.
Barbosa, P.M., Pereira, J.M.C. & Grégoire, J.-M. 1998. Compositing criteria for burned area assessment using multitemporal low resolution satellite data. Remote Sensing of Environment 65: 38-49.
Bartholome, E. & Belward, A.S. 2005. GLC2000: a new approach to global land cover mapping from Earth observation data. International Journal of Remote Sensing 26: 1959–1977.
Bird, M.I. & Cali, J.A. 1998. A million year record of fire in sub-Saharan Africa. Nature 394: 767-769.
Bowen, M.R., Bompard, J.M., Anderson, I.P., Guizol, P. & Guyon, A. 2001. Anthropogenic fires in Indonesia: a view from Sumatra. In: Eaton P. & Radojevic M. (Eds.). Forest fires and regional haze in Southeast Asia. Nova Science, Huntington, New York. p. 41-66.
Bucini, G. & Lambin, E.F. 2002. Fire impacts on vegetation in Central Africa: a remote-sensing-based statistical analysis. Applied Geography 22: 27–48.
Chokkalingam, U., Suyanto, Permana, R.P., Kurniawan, I., Mannes, J., Darmawan, A., Khususyiah, N. & Susanto, R.H. 2006. Community fire use, resource change, and livelihood impacts: the downward spiral in the wetlands of southern Sumatra. Mitigation and adaptation strategies for global change 12: 75-100.
Chuvieco, E., Ventura, G., Pilar Martín, M. & Gomez, I. 2005. Assessment of multitemporal compositing techniques of MODIS and AVHRR images for burned land mapping. Remote Sensing of Environment 94: 450-462.
Cochrane, M.A. 2001. Synergistic interactions between habitat fragmentation and fire in evergreen tropical forests. Conservation Biology 15: 1515-1521.
—2003. Fire science for rainforests. Nature 421: 913-919. — & M.D. Schulze 1999. Fire as a recurrent event in tropical forest of the eastern Amazon:
effects on forest structure, biomass, and species composition. Biotropica 31: 2-16. Crutzen, P.J. & Andreae, M.O. 1990. Biomass burning in the tropics: impact on
atmospheric chemistry and biogeochemical cycles. Science 250: 1669–1788. Dudal, R. & Soepraptohardjo 1957. Soil classification in Indonesia. Report No. 148.
Penyelidikan Pertanian, Bogor. Dwyer, E., Pereira, J.M.C., Gregoire, J.M. & Da Camara, C.C. 1999. Characterization of
the spatio-temporal patterns of global fire activity using satellite imagery for the period April 1992 to March 1993. Journal of Biogeography 27: 57-69.
—, Pinnock, S., Grégoire, J.M. & Pereira, J.M.C. 2000. Global spatial and temporal distribution of vegetation fire as determined from satellite observations. International Journal of Remote Sensing 21: 1289¯1302.
Eva, H. & Lambin, E. F. 1998a. Remote sensing of biomass burning in tropical regions: sampling issues and multisensor approach. Remote Sensing of the Environment 64: 292¯315.

42
— & Lambin, E.F. 1998b. Burnt area mapping in Central Africa using ATSR data. International Journal of Remote Sensing 19: 3473-3497.
— & Lambin, E.F. 2000. Fires and land-cover change in the tropics: A remote sensing analysis at the landscape scale. Journal of Biogeography 27: 765-776.
FAO, 2006. Fire management – global assessment 2006. FAO forestry paper 151, Food and Agriculture Organization of the United Nations, Rome.
Fernandez, A., Illera, P. & Casanova, J.L. 1997. Automatic mapping of surfaces affected by forest fires in Spain using AVHRR NDVI composite image data. Remote Sensing of Environment 60: 153-162
Fraser, R.H., Li, Z. & Cihlar, J. 2000. Hotspot and NDVI differencing synergy (HANDS): A new technique for burned area mapping over boreal forest. Remote Sensing of Environment 74: 362– 376.
Fukunaga, K. 1990. Introduction to statistical pattern recognition. Second edition. Academic Press Inc., New York.
Fuller, D.O. & Fulk, M. 2001. Burned area in Kalimantan, Indonesia mapped with NOAA-AVHRR and Landsat TM imagery. International Journal of Remote Sensing 22: 691-697.
Fuller, D.O., Jessup, T.C. & Salim, A. 2004. Loss of forest cover in Kalimantan, Indonesia, since the 1997-1998 El Niño. Conservation Biology 18: 249-254.
Giglio, L., Descloitres, J., Justice, C.O. & Kaufman, Y.J. 2003. An Enhanced Contextual Fire Detection Algorithm for MODIS. Remote Sensing of Environment 87: 273–282.
—, van der Werf, G.R., Randerson, J.T., Collatz, G.J. & Kasibhatla, P. 2006. Global estimation of burned area using MODIS active fire observations. Atmospheric Chemistry and Physics 6: 957–974.
Goldammer, J.G. 1999. Forests on fire. Science, New Series 284: 1782-1783. — 2006. History of equatorial vegetation fires and fire research in Southeast Asia before
the 1997–98 episode: A reconstruction of creeping environmental changes. Mitigation and adaptation strategies for global change 12: 13-32.
Grégoire, J.-M., Tansey, K. & Silva, J.M.N. 2003. The GBA2000 initiative: Developing a global burned area database from SPOTVEGETATION imagery. International Journal of Remote Sensing 24: 1369–1376.
Harris, R. 1987. Satellite remote sensing, an introduction. Routledge & Kegan Paul, London.
Heil, A., Langmann, B. & Aldrian, E. 2006. Indonesian peat and vegetation fire emissions: Study onfactors influencing large-scale smoke haze pollution using a regional atmospheric chemistry model. Mitigation and adaptation strategies for global change 12: 113-133.
Huete, A., Didan, K., Miura, T., Rodriguez, E.P., Gao X. & Ferreira, L.G. 2002. Overview of the radiometric and biophysical performance of the MODIS vegetation indices. Remote Sensing of Environment 83: 195-213.
Kaufman, Y.J. & Remer, L.A. 1994. Detection of forests using mid-IR reflectance: an application for aerosol studies. IEEE Transactions on Geoscience and Remote Sensing 32: 672-683.
—, Wald, A.E., Remer, L.A., Gao, B.-C., Li, R.-R. & Flynn, L. 1997. The MODIS 2.1µm channel – correlation with visible reflectance for use in remote sensing of aerosol. IEEE Transactions on Geoscience and Remote Sensing 35: 1286-1298.
Kauppi, P.E., Ausubel, J.H., Fang, J., Mather, A.S., Sedjo, R.A. & Waggoner, P.E. 2006. Returning forests analyzed with the forest identity. Proceedings of the National Academy of Sciences of the United States of America 103: 17574–17579.

43
Key, C.H. & Benson, N.C. 1999. Measuring and remote sensing of burn severity. In: Neuenschwander, L.F. & Ryan, K.C. (Eds.). Joint Fire Science Conference and Workshop, Proceedings Vol II. Univ. Idaho and Int. Assoc. Wildland Fire.
Korontzi, S., Justice, C.O. & Scholes, R.J. 2003. Influence of timing and spatial extent of savanna fires in southern Africa on atmospheric emissions. Journal of Arid Environments 54: 395– 404.
Langner, A., Miettinen, J. & Siegert, F. (in press). Land cover change 2002-2005 in Borneo and the role of fire derived from MODIS imagery. Global Change Biology.
Laumonier, Y. 1997. The Vegetation and Physiography of Sumatra. Kluwer Academic Publisher, Dordrecht, The Netherlands.
Lee, C. & Choi, E. 2000. Bayes error evaluation of the Gaussian ML classifier. IEEE Transactions on Geoscience and Remote Sensing 38: 1471-1475.
Levine, J.S. 1996a. Introduction. In: Levine, J. (Ed.). Biomass burning and global change, Vol. 1. MIT Press, Cambridge, Massachusetts. p. xxxv-xliii.
— 1996b. FireSat and the global monitoring of biomass burning. In: Levine, J. (Ed.). Biomass burning and global change, Vol. 1. MIT Press, Cambridge, Massachusetts. p. 107–132.
Li, R.R., Kaufman, Y.J., Hao, W.M., Salmon, J.M. & Gao, B.C. 2004. A technique for detecting burn scars using MODIS data. IEEE Transactions on Geoscience and Remote Sensing 42: 1300-1308.
Liew S.C., Lim, O.K., Kwoh, L.K. & Lim, H. 1998. A study of the 1997 forest fires in South East Asia using SPOT quicklook mosaics. IGARSS 1998, IEEE 1998 International Geoscience and Remote Sensing Symposium. Proceedings, Vol 2: 879-881.
—, Shen C., Low J., Lim A. & Kwoh L.K. 2003. Validation of MODIS fire product over Sumatra and Borneo using high resolution SPOT imagery. Proc. 24th Asian Conference on Remote Sensing & 2003 International Symposium on Remote Sensing: 671-673.
Lillesand, T.M. & Kiefer, R.W. 1987. Remote sensing and image interpretation. Second edition. John Wiley & Sons, inc., New York.
Martín, M.P., Díaz-Delgado, R., Chuvieco, E. & Ventura, G. 2002. Burned land mapping using NOAA-AVHRR and TERRA-MODIS. In: Viegas (Ed.). Conference proceedings: Forest fire research & wildland fire safety. Millpress, Rotterdam.
Miettinen, J. & Liew, S.C. 2005. Connection between fire and land cover change in Southeast Asia: a remote sensing case study in Riau, Sumatra. International Journal of Remote Sensing 26: 1109-1126.
Miller, J.D. & Yool, S.R. 2002. Mapping forest post-fire canopy consumption in several overstory types using multi-temporal Landsat TM and ETM data. Remote Sensing of Environment 82: 481-496.
Nicolas, M.V.J. 1998. Fighting the forest fires: the South Sumatra experience. Forest fire prevention and control project, Palembang. Ministry of forestry and estate crops and European Union, Jakarta.
Nielsen, T.T., Mbow, C. & Kane, R. 2002. A statistical methodology for burned area estimation using multitemporal AVHRR data. International Journal of Remote Sensing 23: 1181-1196.
Page, S.E., Siegert, F., Rieley, J.O., Boehm, H.-D.V., Jaya, A. & Limin S. 2002. The amount of carbon released from peat and forest in Indonesia during 1997. Nature 420: 61-65.
Pereira, J.M.C. 1999. A comparative evaluation of NOAA/AVHRR vegetation indexes for burned surface detection and mapping. IEEE Transactions on Geoscience and Remote Sensing 37: 217–226.

44
— 2003. Remote sensing of burned areas in tropical savannas. International Journal of Wildland Fire 12: 259-270.
Pinty, B. & Verstraete, M.M. 1992. GEMI: A non-linear index to monitor global vegetation from satellites. Vegetatio 101: 15-20.
Qadri, S.T. (Ed.) 2001. Fire, Smoke and Haze: the ASEAN Response Strategy. Asian Development Bank, Association of South East Asian Nations, Manila, Philippines.
Rieley, J.O. & Page, S.E. (Eds.) 2005. Wise use of tropical peatlands: focus of Southeast Asia. ALTERRA – Wageningen University and Research Centre and the EU INCO – STRAPEAT and RESTORPEAT Partnership. Wageningen, the Netherlands.
Roy, D.P., Giglio, L., Kendall, J.D. & Justice, C.O. 1999. Multi-temporal active-fire based burn scar detection algorithm. International Journal of Remote Sensing 20: 1031- 1038.
—, Lewis, P.E. & Justice, C.O. 2002. Burned area mapping using multi-temporal moderate spatial resolution data – a bi-directional reflectance model-based expectation approach. Remote Sensing of Environment 83: 263-286.
—, Jin, Y., Lewis, P.E. & Justice, C.O. 2005. Prototyping a global algorithm for systematic fire-affected area mapping using MODIS time series data. Remote Sensing of Environment 97: 137-162.
Sá, A.C.L., Pereira, J.M.C., Vasconcelos, M.J.P., Silva, J.M.N., Ribeiro, N. & Awasse, A. 2003. Assessing the feasibility of sub-pixel burned area mapping in miombo woodlands of Northern Mozambique using MODIS imagery. International Journal of Remote Sensing 24: 1783-1796.
Sanford, R.L., Saldarriaga, J., Clark, K.E., Uhl, C. & Herrera, R. 1985. Amazon rain-forest fires. Science, New Series 227: 53-55.
Selvaradjou, S-K., L. Montanarella, O. Spaargaren, D. Dent, Filippi, N. & Dominik, S. 2005. European Digital Archive of Soil Maps (EuDASM) – Metadata of the Soil Maps of Asia. Office of the Official Publications of the European Communities, Luxembourg.
Siegert, F. & Hoffmann, A.A. 2000. The 1998 forest fires in East Kalimantan (Indonesia): a quantitative evaluation using high resolution, multitemporal ERS-2 SAR images and NOAA-AVHRR hotspot data. Remote Sensing of Environment 72: 64-77.
—, Ruecker, G., Hindrichs, A. & Hoffmann, A.A. 2001. Increased damage from fires in logged forests during droughts caused by El Niño. Nature 414: 437-440.
Silva J.M.N, Cadima, J.F.C.L., Pereira, J.M.C. & Grégoire J.-M. 2004. Assessing the feasibility of a global model for multitemporal burned area mapping using SPOT-VEGETATION data. International Journal of Remote Sensing 25: 4889-4913.
—, Sá A.C.L. & Pereira J.M.C. 2005. Comparison of burned area estimates derived from SPOT-VEGETATION and Landsat ETM+ data in Africa: influence of spatial pattern and vegetation type. Remote Sensing of Environment 96: 188–201.
Simorangkir, D. 2006. Fire use: is it really the cheaper land preparation method for large-scale plantations? Mitigation and adaptation strategies for global change 12: 147–164.
Sousa, A.M.O., Pereira, J.M.C. & Silva, J.M.N. 2003. Evaluating the performance of multitemporal image compositing algorithms for burned area analysis. International Journal of Remote Sensing 24: 1219-1236.
Stibig, H-J., Upik, R., Beuchle, R., Hildanus & Mubareka, S. 2003a. The Land Cover Map for South East Asia in the Year 2000. GLC2000 database, European Commision Joint Research Centre. http://www.gvm.jrc.it/glc2000, accessed Nov 2006.
—, Beuchle, R. & Achard, F. 2003b. Mapping of the tropical forest cover of insular Southeast Asia from SPOT4-Vegetation images. International Journal of Remote Sensing 24: 3651–3662.
45
Stolle F., Dennis, R.A., Kurniwan, I. & Lambin, E.F. 2004. Evaluation of remote sensing-based active fire datasets in Indonesia. International Journal of Remote Sensing 20: 471-479.
Stroppiana, D., Pinnock, S., Pereira, J.M.C. & Grégoire, J.-M. 2002. Radiometric analysis of SPOT-VEGETATION images for burnt area detection in Northern Australia. Remote Sensing of Environment 82: 21-37.
—, Grégoire, J.M. & Pereira, J.M.C. 2003. The use of SPOT VEGETATION data in a classification tree approach for burnt area mapping in Australian savanna. International Journal of Remote Sensing 24: 2131-2151.
Suyanto, S. 2006. Underlying cause of fire: different form of land tenure conflicts in Sumatra. Mitigation and adaptation strategies for global change 12: 67–74.
Tacconi, L., Moore, P.F. & Kaimowitz, D. 2006. Fires in tropical forests – what is really the problem? Lessons from Indonesia. Mitigation and adaptation strategies for global change 12: 55-66.
Tansey, K., Gregoire, J.-M., Stroppiana, D., Sousa, A., Silva, J., Pereira, J.M.C., Boschetti, L., Maggi, M., Brivio, P.A., Fraser, R., Flasse, S., Ershov, D., Binaghi, E., Graetz, D. & Peduzzi, P. 2004. Vegetation burning in the year 2000: Global burned area estimates from SPOT VEGETATION data. Journal of Geophysical Research 109. D14S03, doi:10.1029/2003JD003598.
Trigg, S. & Flasse, S. 2000. Characterizing the spectral-temporal response of burned savannah using in situ spectroradiometry and infrared thermometry. International Journal of Remote Sensing 21: 3161-3168.
Uhl, C., Kaufman, J.B. & Cummings, D.L. 1988. Fire in the Venezuelan Amazon 2: environmental conditions necessary for forest fires in the evergreen rainforest of Venezuela. Oikos 53: 176-184.
— & Kauffman, J.B. 1990. Deforestation, fire susceptibility, and potential tree responses to fire in the Eastern Amazon. Ecology 71: 437-449.
Vermote, E.F., El Saleous, N.Z. & Justice, C.O. 2002. Atmospheric correction of MODIS data in the visible to middle infrared: first results. Remote Sensing of Environment 83: 97-111.
Whitmore, T.C. 1984. Tropical rain forests of the Far East. (2nd edition). Oxford University Press, Oxford.
Wolfe, R.E., Roy, D.P. & Vermote, E. 1998. MODIS land data storage, gridding, and compositing methodology: Level 2 Grid. IEEE Transactions on Geoscience and Remote Sensing 36: 1324-1338.
Zhang, Y.-H., Wooster, M.J., Tutubalina, O. & Perry, G.L.W. 2003. Monthly burned area and forest fire carbon emission estimates for the Russian Federation from SPOT VGT. Remote Sensing of Environment 87: 1-15.