Embed Size (px)
Citation preview
Instrumental and Sensory Quality of
Fallow Deer (Dama dama) and Red
Deer (Cervus Elaphus) Venison.
by
Christine Louise Hutchison
A thesis submitted in fulfilment of the requirements for the degree of
Doctor of Philosophy
University of Western Sydney School of Science and Health
2012
STATEMENT OF AUTHENTICATION
The work presented in this thesis is, to the best of my knowledge and
belief, original, except as acknowledged in the text. I hereby declare that
I have not submitted this material, either whole or in part, for a degree at
this or any other institution.
Christine Louise Hutchison, B.Ed., M.App.Sci. 3rd June, 2012
Acknowledgments
I would firstly like to thank my principal supervisor, Professor Robert Mulley. Rob
has provided an endless supply of support, patience, encouragement and wisdom
over the duration of my PhD candidature. Without Rob I would not have managed to
juggle the responsibilities of full time work, part time study and a young family quite
as I have. Also, thanks to my supervisory panel: Dr Jim Bergan, Emeritus Professor
Paul Baumgartner and Dr Rosalie Durham for their advice and expertise.
Thank you to Katrina Marshall and Professor David Laing for their assistance with
the sensory work. Thanks also go to Oleg Nicetic for his support with statistical
aspects of the project and to Dr Eva Wiklund and Dr Jason Flesch for assistance
during the experimental phase. I need to especially thank my family for their love,
support and hours of childcare provided during the project. I could not have done it
without you. I also wish to acknowledge my four children, Sarah, Laura, Mitchell
and Alexander, all born during the period of candidature, for their love and laughter
and making life interesting.
I also wish to acknowledge the support of the Rural Industries Research and
Development Corporation and the Deer Industry Association of Australia for funding
experimental work which formed the basis of the project. The animals used in this
study were sourced from Ward Holdings (fallow deer), Barry and Fay Dalton, Ian
and Heather Dowsett (red deer) and the University of Western Sydney. Industry
partners who assisted with processing include Myrtleford abattoir and Wodonga
abattoir. Mr Tim Hansen of Mandagery Creek Australian Farmed Venison assisted
with organisation of red deer slaughter and recovery of selected meat cuts.
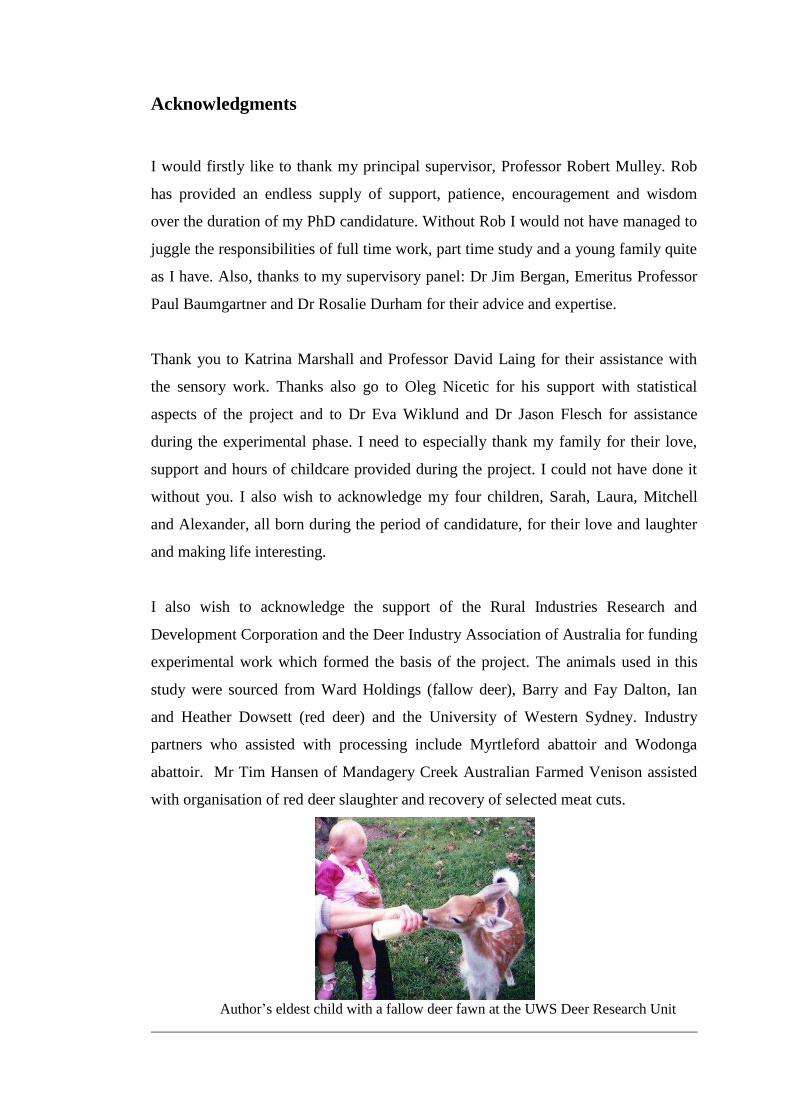
Author‟s eldest child with a fallow deer fawn at the UWS Deer Research Unit
i
Table of Contents TABLE OF CONTENTS i LIST OF TABLES vi LIST OF FIGURES ix LIST OF PLATES xi LIST OF ABBREVIATIONS xiv LIST OF TERMINOLOGY xviii LIST OF SPECIFIC NAMES xx PUBLICATIONS ARISING FROM THIS STUDY xx ii PRESENTATIONS ARISING FROM THIS STUDY xxiv ABSTRACT xxvi CHAPTER 1 General introduction 1
1.1: Background 2
1.2: Study aim 4
1.3: Experimental approach 4
1.4: Structure of the thesis 5
CHAPTER 2 Literature review 7
2.1: Venison production 8
2.1.1: History of deer as a meat species 8
2.1.2: Deer in Australia 8
2.1.3: Deer farming and venison production 9
2.1.4: Venison in the human diet 14
2.1.5: Current markets 18
2.1.6: Venison specifications 26
2.2: Measures of meat quality 28
2.2.1: Meat from muscle 28
2.2.2: Factors affecting meat quality 32
2.2.3: Consumer perception 49
ii
2.2.4: Beef and sheep meat quality improvement schemes 51
2.2.5: Estimations of body condition 57
2.3: Industry issues 62
2.3.1: Background 62
2.3.2: Current venison issues 67
2.3.3: Strategic industry alliances 73
CHAPTER 3 General materials and methods 76
3.1: Research environment and practices 77
3.1.1: University of Western Sydney deer research facilities 77
3.1.2: UWS fallow deer handling facilities 78
3.1.3: UWS abattoir facilities 80
3.1.4: Commercial abattoir description 81
3.1.5: UWS food processing facilities 82
3.1.6: UWS sensory evaluation and analysis facilities 82
3.1.7: Livestock and management 83
3.2: Meat quality analysis and procedures 85
3.2.1: pH 85
3.2.2: Intramuscular fat 85
3.2.3: Shear force/instrumental tenderness 86
3.2.4: Colour 87
3.2.5: Moisture 88
3.2.6: Freeze/thaw drip loss/purge 88
3.2.7: Carcass core body temperature 88
3.3: Measurements of body condition score 89
3.3.1: Kidney fat index 89
3.3.2: Carcass and fat depth measurements 91
3.4 : Sensory evaluation and analysis 94
3.4.1: Experimental design 94
3.4.2: Cooking and preparation technique 95
3.5: Statistical analysis 96
iii
CHAPTER 4 Relationship between body condition score and meat
quality parameters of venison 97
4.1: Introduction 98
4.2: Materials and methods 117
4.2.1: Fallow bucks of BCS 2 to 3 117
4.2.2: Fallow does of BCS 2, 3 and 4 117
4.2.3: Fallow bucks and haviers (castrated bucks) 118
4.2.4: Red deer stags with BCS of 2, 3 and 4 118
4.3: Results 120
4.3.1: Fallow bucks of BCS 2 to 3 120
4.3.2: Fallow does of BCS 2, 3 and 4. 121
4.3.3: Fallow bucks and haviers 123
4.3.4: Red deer stags with BCS of 2, 3 and 4 125
4.4: Discussion 127
4.4.1: BCS and live weight 127
4.4.2: Intramuscular fat 128
4.4.3: Shear force 129
4.4.4: Freeze-thaw/purge 132
4.4.5: Colour 133
4.5: Conclusions 135
CHAPTER 5 Effect of concentrate feeding on meat quality
parameters of venison from fallow deer does 137
5.1: Introduction 138
5.2: Materials and methods 140
5.3: Results 142
5.4: Discussion 151
5.4.1: BCS 151
5.4.2: pHu 151
5.4.3: Freeze-thaw purge 152
5.4.4: Intramuscular fat and tenderness 152
5.4.5: Colour 153
5.5: Conclusions 156
iv
CHAPTER 6 Relationship between post-slaughter management
and meat quality parameters of venison 158
6.1: Relationship of carcass hanging time to meat quality 159
6.1.1: Introduction 159
6.1.2: Materials and methods 164
6.1.3: Results 164
6.1.4: Discussion 168
6.1.4.1: Tenderness and meat ageing 168
6.1.4.2: Intramuscular fat 169
6.1.4.3: Colour 170
6.2: Pelvic suspension vs. Achilles tendon hanging of carcasses 171
6.2.1: Introduction 171
6.2.2 Materials and methods 175
6.2.2.1 Fallow Deer 175
6.2.2.2 Red Deer 176
6.2.3 Results 177
6.2.3.1 Fallow Deer Venison 177
6.2.3.2 Red Deer Venison 180
6.2.4: Discussion 181
6.2.4.1: Shear force 181
6.2.4.2: Freeze-thaw purge 183
6.3: Differences between slaughter premises for muscle pH 184
6.3.1: Introduction 184
6.3.2: Materials and methods 186
6.3.3: Results 186
6.3.4: Discussion 187
6.4: Conclusions 188
CHAPTER 7 Effect of pre- and post-slaughter management
on the sensory parameters of venison quality 190
7.1: Introduction 191
7.2: Materials and methods 198
7.2.1: Sensory evaluation facility 198
7.2.2: Panellists 198
7.2.3: Sample preparation 198
v
7.2.4: Sample testing 199
7.2.5: Data analysis 200
7.3: Results and discussion 201
7.3.1 Fallow deer (pasture-fed) 201
7.3.1.1 Experimental design 201
7.3.1.2 Results 201
7.3.1.3 Discussion 206
7.3.2: Fallow deer - Impact of Supplementary Feeding 208
7.3.2.1 Introduction 208
7.3.2.2 Experimental design 209
7.3.2.3 Results 210
7.3.2.4 Discussion 213
7.3.3 Red Deer (pasture-fed) 215
7.3.3.1 Introduction 215
7.3.3.2 Experimental design 216
7.3.3.3 Results 217
7.3.3.4 Discussion 221
7.4: Conclusions 223
CHAPTER 8 Conclusions and Recommendations for Industry 226
8.1 : Overall Conclusions 227
8.2 : Recommendations to Industry 229
REFERENCES 232
APPENDICES 275
Appendix 1: Australian Body Condition chart for fallow Deer 276
Appendix 2: Australian Body Condition Chart for Red Deer 277
Appendix 3: Body Condition Score chart for red deer 278
Appendix 4: Sensory Evaluation of Venison 280
vi
List of Tables Table 4.1: Meat quality attributes of M.longissimus dorsi from fallow
bucks of BCS 2 (n=16) and 3 (n=15). 121 Table 4.2: Meat quality attributes of M. longissimus dorsi from fallow
does of BCS 2 (n=7), BCS 3 (n=7) and BCS 4 (n=10). 123 Table 4.3: Meat quality attributes of M.longissimus dorsi from fallow
bucks and haviers of BCS 2 and 3. 124 Table 4.4: Meat quality attributes of M.longissimus dorsi from red stags
of BCS 2 (n=14), 3 (n=6) and 4 (n=6). 127 Table 5.1: BCS, weights and dressing percentages from fallow does
measured at either 135 or 170 days after commencement of feeding with concentrates (n=6 per group), compared with pasture-fed controls. 144
Table 5.2: pH over storage times from fallow doe venison measured at either 135 or 170 days after commencement of feeding with concentrates (n=6 per group), compared with pasture-fed controls. 147
Table 5.3: Percentage drip loss (purge) over storage times for fallow doe venison measured at either 135 or 170 days after commencement of feeding with concentrates (n=6 per group), compared with pasture-fed controls. 148
Table 5.4: Meat quality attributes of M.longissimus dorsi from fallow deer does with BCS 2, 3 and 4 fed on pasture or concentrates. 149
Table 5.5: Meat quality attributes of M.longissimus dorsi from fallow does measured at either 135 or 170 days after commencement of feeding with concentrates (n=6 per group), compared with pasture-fed controls. 150
Table 6.1: Meat quality attributes of M.longissimus dorsi from
fallow bucks and haviers with BCS between 2 and 3. 165
Table 6.2: Meat quality attributes of M.longissimus dorsi from fallow bucks and haviers with BCS between 2 and 3 measured at 5 days and 10 days post-mortem. 166
Table 6.3: Mean pH, moisture, shear force and intramuscular fat measurements for fore, mid- and hind loin samples for fallow bucks and haviers measured at 5 and 10 days post-mortem. 167
vii
Table 6.4: Meat quality attributes of M.longissimus dorsi from fallow bucks hung by the Achilles tendon and pelvic suspension methods (n=15). 179
Table 6.5: Meat quality attributes of M longissimus dorsi from fallow doe carcasses hung by either the Achilles tendon or by pelvic suspension (n=10). 180
Table 6.6: Meat quality attributes of M. longissimus dorsi from red stags hung by the Achilles tendon or pelvic suspension after slaughter (n=14). 181
Table 6.7: Ultimate pH of M.longissimus dorsi from fallow bucks slaughtered at three different slaughter plants. 186
Table 7.1: Mean (+/- SEM) sensory evaluation scores for venison
from fallow bucks (n=10) and does (n = 10). All panellists (n=42). 202
Table 7.2: Mean (+/- SEM) sensory evaluation scores for venison from fallow bucks (n=10) and does (n = 10), effect of panellist age (group 1 n=14, group 2 n=13, group 3 n=15) on determination of flavour strength. 202
Table 7.3: Mean (+/- SEM) sensory evaluation scores for venison from fallow bucks (n=10) and does (n = 10), effect of game eating experience (game eaters n=27, non game eaters n=15) on determination of flavour strength. 203
Table 7.4: Mean (+/- SEM) sensory evaluation scores for venison from fallow bucks and does with BCS of either 2 (n = 8) or 3 (n = 12). All panellists (n=42). 203
Table 7.5: Mean (+/- SEM) sensory evaluation scores for venison from fallow bucks and does hung by either the Achilles tendon or by pelvic suspension (n=20 of each), All panellists (n=42). 205
Table 7.6: Mean (+/- SEM) sensory evaluation scores for venison from fallow does fed on either pasture or grain prior to slaughter (n=12 per group). All panellists (n=42). 211
Table 7.7: Mean (+/- SEM) sensory evaluation scores for venison from fallow deer does with BCS ranging from 2 to 4. All panellists (n=42). 211
Table 7.8: Mean (+/- SEM) sensory evaluation scores for venison from fallow deer does (n=24) fed for either 135 or 170 days on grain, effect of panellist gender on determination of flavour strength. 212
Table 7.9: Mean (+/- SEM) sensory evaluation scores for venison from red stags hung by either the Achilles tendon or by pelvic suspension. 217

viii
Table 7.10: Mean (+/- SEM) sensory evaluation scores for venison from red stags with BCS of 2, 3 or 4 (n=12, 6 and 8 respectively). All panellists (n=42). 219
Table 7.11: Mean (+/- SEM) sensory evaluation scores for venison
from red stags with BCS of 2, 3 or 4 (n=12, 6 and 8 respectively), effect of panellist gender on determination of colour. 220
ix
List of Figures Figure 2.1: Australian deer processed and venison produced
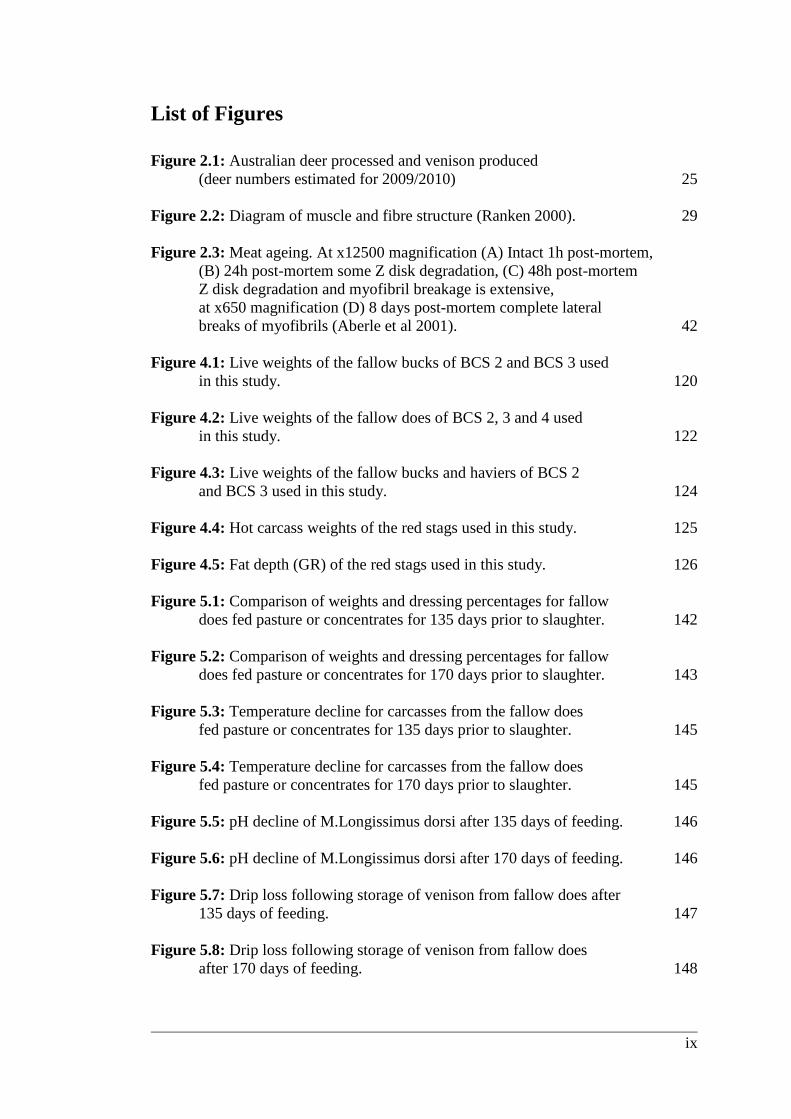
(deer numbers estimated for 2009/2010) 25 Figure 2.2: Diagram of muscle and fibre structure (Ranken 2000). 29 Figure 2.3: Meat ageing. At x12500 magnification (A) Intact 1h post-mortem,
(B) 24h post-mortem some Z disk degradation, (C) 48h post-mortem Z disk degradation and myofibril breakage is extensive, at x650 magnification (D) 8 days post-mortem complete lateral breaks of myofibrils (Aberle et al 2001). 42
Figure 4.1: Live weights of the fallow bucks of BCS 2 and BCS 3 used
in this study. 120
Figure 4.2: Live weights of the fallow does of BCS 2, 3 and 4 used in this study. 122
Figure 4.3: Live weights of the fallow bucks and haviers of BCS 2 and BCS 3 used in this study. 124
Figure 4.4: Hot carcass weights of the red stags used in this study. 125 Figure 4.5: Fat depth (GR) of the red stags used in this study. 126 Figure 5.1: Comparison of weights and dressing percentages for fallow
does fed pasture or concentrates for 135 days prior to slaughter. 142 Figure 5.2: Comparison of weights and dressing percentages for fallow
does fed pasture or concentrates for 170 days prior to slaughter. 143 Figure 5.3: Temperature decline for carcasses from the fallow does
fed pasture or concentrates for 135 days prior to slaughter. 145 Figure 5.4: Temperature decline for carcasses from the fallow does
fed pasture or concentrates for 170 days prior to slaughter. 145 Figure 5.5: pH decline of M.Longissimus dorsi after 135 days of feeding. 146 Figure 5.6: pH decline of M.Longissimus dorsi after 170 days of feeding. 146 Figure 5.7: Drip loss following storage of venison from fallow does after
135 days of feeding. 147 Figure 5.8: Drip loss following storage of venison from fallow does
after 170 days of feeding. 148
x
Figure 6.1: The pH /temperature window as it relates to meat tenderness. The solid line indicates optimal decline, the dashed line cold shortening and the dotted line heat shortening (Thompson 2002). 161
Figure 6.2: Diagram of pelvic suspended (left) and Achilles hung
carcass (Sorheim & Hildrum 2002). 170 Figure 6.3: Shear force mean values in 7 muscles (LD = M. longissimus,
BF = M. biceps femoris, ST = M. semitendinosus, SM = M. semimembranosus, AF = M. adductor femoris, VL = M. vastus lateralis and RF = M. rectus femoris) from fallow bucks (18 months old, n=8). 178
Figure 6.4: Shear force mean values in 9 muscles (SS = M. supraspinatus,
PS = M. psoas major, LD = M. longissimus, BF = M. biceps femoris, ST = M. semitendinosus, SM = M. semimembranosus, AF = M. adductor femoris, VL = M. vastus lateralis and RF = M. rectus femoris) from fallow bucks (36 months old, n=7). 178
Figure 6.5: Shear force mean values in 9 muscles (SS = M. supraspinatus,
PM = M. psoas major, LD = M. longissimus, BF = M. biceps femoris, ST = M. semitendinosus, SM = M. semimembranosus, AF = M. adductor femoris, VL = M. vastus lateralis and RF = M. rectus femoris) from fallow does (≥24 months old, n=10). 179
Figure 7.1: Mean (+/- sem) sensory panel scores of meat colour for
venison from fallow bucks and does with BCS of 2 and 3. 204
Figure 7.2: Mean (+/- sem) sensory panel scores of overall liking of
venison from fallow bucks and does with BCS of 2 and 3 hung
by the Achilles tendon or by pelvic suspension. 205
Figure 7.3: Mean (+/- sem) sensory panel scores for flavour strength
of venison from fallow does with body condition scores of 3
and 4 fed either pasture or grain prior to slaughter. 212
Figure 7.4: Mean (+/- sem) sensory panel scores for tenderness, juiciness
and overall liking for venison from red stags with BCS between 2
and 3 hung post-mortem by the Achilles tendon or by
pelvic suspension. 218
Figure 7.5: Mean (+/- sem) sensory panel scores for tenderness of venison
from red stags with BCS 2, 3 or 4. Higher scores indicate more
tender meat. 219
xi
List of Plates Plate 2.1: Examples of AUS-MEAT venison language and descriptions for some bone-in cuts. 27 Plate 2.2: Examples of AUS-MEAT venison language and descriptions for some boneless cuts. 27 Plate 2.3: Split fallow deer carcass hung by the pelvic suspension technique. 39 Plate 2.4: Fallow deer carcass suspended by the Achilles tendon. 40 Plate 3.1: Aerial image of the Deer Research Unit at UWS Hawkesbury Campus 77 Plate 3.2: Diagram of the UWS Deer Research Unit located at the
Hawkesbury Campus of the University of Western Sydney (Flesch 2001). 78
Plate 3.3: Entrance to deer handling shed used in this study. 78 Plate 3.4: Deer handling shed at UWS. 79 Plate 3.5: Deer handling cradle used in this study. 79 Plate 3.6: Mezzanine view of deer in the handling shed at UWS. 80 Plate 3.7: Experimental abattoir at UWS. 81 Plate 3.8: Scales and meat rail leading to the chiller in the experimental abattoir. 81 Plate 3.9: Fallow deer carcasses in the chiller at UWS. 81 Plate 3.10: Food processing facilities at UWS. 82 Plate 3.11: Vacuum packaging equipment. 82 Plate 3.12: Individual tasting booth in the sensory evaluation facility at UWS. 83 Plate 3.13: Sensory facility preparation area. 83 Plate 3.14: Servery side of the individual tasting booths. 83 Plate 3.15: Hybrid fallow deer at UWS 84 Plate 3.16: Typical red deer stag at UWS. 84 Plate 3.17: Buchi apparatus for Soxhlet fat extraction. 86 Plate 3.18: Samples prepared for colour evaluation and shear testing. 87 Plate 3.19: Texture/shear analysis. 87
xii
Plate 3.20: Colour measurement using the Minolta chromameter. 87 Plate 3.21: Excised kidneys with channel fat removed (Flesch 2001). 90 Plate 3.22: Kidneys trimmed prior to decapsulation (Flesch 2001). 90 Plate 3.23: Kidneys prepared and denuded as described by Riney (1955). 90 Plate 3.24: Deer in handling cradle for live palpation to estimate BCS
(Flesch 2001). 91
Plate 3.25: Forequarter fat measurement area (Flesch 2001). 92 Plate 3.26: Loin fat measurement area (Flesch 2001). 92 Plate 3.27: Rump fat measurement area (Flesch 2001). 93 Plate 3.28: Brisket fat measurement area (Flesch 2001). 93 Plate 3.29: Venison samples prepared for serving. 95 Plate 3.30: Venison samples presented to panellists. 95 Plate 3.31: Panellists assessing venison samples. 96 Plate 4.1: Mature fallow deer doe of BCS 2. 105 Plate 4.2: Dorsal view of BCS 2 carcass. 106 Plate 4.3: Caudal view of BCS 2 carcass. 106 Plate 4.4: Cross sectional view of EMA of BCS 2 carcass. 107 Plate 4.5: Mature fallow deer buck of BCS 3. 107 Plate 4.6: Dorsal view of BCS 3 carcass. 108 Plate 4.7: Caudal view of BCS 3 carcass. 108 Plate 4.8: Cross sectional view of EMA of BCS 3 carcass. 109 Plate 4.9: Mature fallow deer bucks of BCS 4. 109 Plate 4.10: Dorsal view of BCS 4 carcass. 110 Plate 4.11: Caudal view of BCS 4 carcass. 110 Plate 4.12: Cross sectional view of EMA of BCS 4 carcass. 111 Plate 4.13: Mature red stag of BCS 4. 112
xiii
Plate 4.14: Red stag carcass of BCS 4. 112 Plate 4.15: Red stags of BCS 2. 119 Plate 4.16: Red stags of BCS 3 and 4. 119 Plate 4.17: Split red stag carcasses of BCS 2 hanging in the chiller at Myrtleford abattoir. 119 Plate 5.1: Fallow doe in the handling cradle for palpation to assess BCS
over the rump. 141 Plate 6.1: Fallow deer carcass suspended by the Achilles tendon. 172 Plate 6.2: Fallow deer carcass suspended by the pelvic bone. 172 Plate 6.3: Whole fallow deer carcass suspended by the pelvic bone. 174 Plate 7.1: Panellist in individual tasting booth. 199
xiv
List of Abbreviations
a* measurement of redness
ADP adenosine diphosphate
AMSA American Meat Science Association
ANOVA analysis of variance
AT Achilles tendon
ATP adenosine triphosphate
AUS-MEAT Authority for Uniform Specifications of Meat and Livestock
b* measurement of yellowness or greenness or vividness
BCS body condition score
BMF bone marrow fat
BSE bovine spongiform encephalopathy
BV breeding value
CCP critical control point
CEQ consumer eating quality
cm centimetre/s
CRC co-operative research centre
CSIRO Commonwealth Scientific and Industrial Research Organisation
CT scanning X-ray computed tomography
CWD chronic wasting disease
DFD dry firm and dark
DIAA Deer Industry Association of Australia
E European fallow deer (Dama dama)
eg for example
EMA Eye muscle area
EQ eating quality
EQS eating quality standards
EU European Union
EUROP Five point scale for assessment of body conformation and fatness
et al. et alia
etc et cetera
F force
FMD foot and mouth disease
xv
g gram
GenStat statistical package
GLM generalised linear model
GM M.gluteus medius (rump)
GR fat depth Measurement of depth of fat at the GR site
GR site Site over the 12th rib at a vertical point down from the tuber coxae
(hip bone), 16cm out from the back bone
GVP gross value of production
h hour
H hybrid fallow deer (¼ Mesopotamian, ¾ European)
Ha hectares
HCW hot carcass weight
Hd head
IM intramuscular
IMF intramuscular fat
ISO International Organisation for Standardisation
JMGA Japanese Meat Grading Association
KFI kidney fat index
kg kilogram
L* measurement of lightness
Lab* colour measurement system
LD M.Longissimus dorsi (strip loin)
LW live weight
M molarity
m metre/s
MAXFAT ultrasonic technique of measuring rump fat thickness (US)
mg milligram
ml millilitres
mm millimetres
MQ meat quality
MQ4 composite meat quality score
MSA Meat Standards Australia
N nitrogen
n number
xvi
NS not significant
NSW New South Wales
NZ New Zealand
p statistical probability
PACCP palatability assured critical control point
pH acidity/alkalinity
pHi initial pH
pHu ultimate pH
ppm parts per million
PS Pelvic suspension (Tenderstretch)
PSE pale soft and exudative
PUFA polyunsaturated fatty acids
P8 rump site for fat depth measurement
QA quality assurance
QAMA quality assurance management and analysis
R&D research and development
RDI recommended daily intake
RIRDC Rural Industries Research and Development Corporation
SCW standard carcass weight
sd standard deviation
sec second
sem standard error of the mean
SmartStretch technique of stretching and shaping hot boned primals
SMEQ sheep meat eating quality
SPSS statistical package
TQM total quality management
UK United Kingdom
USA United States of America
USDA United States Department of Agriculture
UWS University of Western Sydney
VIAScan Video image analysis scanning system
VIC Victoria
WHC water holding capacity
wt weight
xvii
¼ M ¼ Mesopotamian fallow deer
< less than
> greater than
= equals
plus or minus variance around the mean
% percent
° degree
°C degrees Celsius
$A value in Australian dollars
$NZ value in New Zealand dollars
£ value in pounds sterling
xviii
List of Terminology
Term Meaning
adipose fatty body tissue
Benelux European customs union encompassing Belgium, the Netherlands and
Luxembourg
buck adult male fallow deer
bull uncastrated adult male bovine
calf juvenile red deer
calpain calcium activated muscle protease
carcass body of a slaughtered animal after exsanguination and evisceration
castrate animal with gonads removed, usually male
cathepsins lysomal bound protease
caudal position situated toward animal‟s tail region
cow adult female bovine
cranial position situated toward animal‟s head region
denver to remove the silver skin of a primal meat cut
doe adult female fallow deer
epimysium thick connective tissue sheath surrounding muscles
fawn juvenile fallow deer
havier deerwith gonads removed, usually male
heifer young cow
hind adult female red deer
in vivo in live animal
kiloton 1000 tonnes
lactation period of suckling by fawns and calves
myofibril long, rod-like, contractile organelle of muscle cells made of
sarcomeres
myofilament protein filaments of sarcomere, composed of actin and myosin
protease proteolytic enzyme digests peptide bonds of protein and peptides
rigor muscle depleted of ATP, muscle stiffens
rut deer mating season
sarcolemma transparent membrane covering muscle fibres
sarcomere repeating contractile unit of the myofibril

xix
stag adult male red deer
steer young castrated male bovine
tonne 1000kg
xx
List of Specific Names
Common Name Specific Name
Blackbuck Antelope Antilope cervicapra
Buffalo Bubalus bubalus
Camel Camelus dromedarious
Caribou Rangifer tarandus L.
Chamois Rupicapra pyrenaica parva
Chital deer Axis axis
Domestic cattle Bos taurus/indicus
Domestic goats Formosa formosa
Domestic pigs Sus scrofa domestica
Domestic sheep Ovis ovis spp.
Elk / Wapiti Cervus elaphus canadensis
Elk Cervus elaphus nelsoni
Fallow deer Dama dama
Feral goats Capra hircus
Feral sheep Ovis aries
Gemsbok Oryx gazella
Hog deer Axis porcinus
Impala Aepyceros melampus
Kangaroo Macropus spp.
Kudu Tragelaphus strepsiceros
Mesopotamian fallow deer Dama dama mesopotamica
Moose Alces alces
Mufflon Ovies aries orientalis
Mule deer Odocoileus hemionus
Muskoxen Ovibos moschatus
Ostrich Struthio camelus domesticus/australis
Pronghorn Antilocarpa americana
Rabbit Oryctolagus cuniculus
Red deer Cervus elaphus
xxi
Common Name Specific Name
Reedbuck Redunca fulvorufula
Reindeer / Caribou Cervus rangifer
Reindeer Rangifer tarandus tarandus
Roe deer Capreolus capreolus
Rusa deer Cervus timorensis
Sambar deer Cervus unicolor
Sika deer Cervus nippon
Springbok Antidorcas marsupialis
Tahr Hermitragus jemlaicus
White tailed deer Odocoileus virginianus
Wild Boar Sus Scrofa
Wildebeest Connochaetus spp.
xxii
Publications Arising from this Study
Hutchison, C.L., Mulley, R.C., Flesch, J.S., and Wiklund, E. 2012. „Effect of
concentrate feeding on instrumental meat quality and sensory characteristics
of fallow deer venison‟. Meat Science, 90, pp. 801-806.
Hutchison, C.L., Mulley, R.C., Flesch, J.S., and Wiklund, E. 2010. „Consumer
evaluation of venison sensory quality: Effects of sex, body condition score
and carcase suspension method‟. Meat Science, 86, pp. 311-316.
Hutchison, C.L., Flesch, J.S. and Mulley, R.C. 2006. „The Effect of Pelvic
Suspension on the Biochemical and Sensory Quality of Venison from Red
deer (Cervus elaphus) and Fallow deer (Dama dama)’.In: Proceedings of the
6th International Deer Biology Congress, Prague, Czechoslovakia, August 7-
11, pp. 212-215.
Hutchison, C.L., Flesch, J.S., Mulley, R.C. and Wiklund, E. 2006. „Studies of the
relationship between body condition score and venison quality characteristics
in red and fallow deer‟. In: Proceedings of the IV World Deer Congress,
Melbourne, Australia, April 20-22, pp. 86-88
Mulley, R.C., Hutchison, C.L., Flesch, J.S., Wiklund, E, and Nicetic, O. 2006.
Venison Quality. The relationship of body condition score with consumer
perception. Rural Industries Research and Development Corporation,
Publication No 06/043, CanPrint, ACT, ISBN 1741513065.
Wiklund, E., Hutchison, C., Flesch, J., Mulley, R. and Litteljohn, R.P. 2005. „Colour
stability and water-holding capacity of M.longissimus and carcass
characteristics in fallow deer (Dama dama) grazed on natural pasture or fed
barley‟. Rangifer, 25 (2): pp. 97-105.
xxiii
Hutchison C.L., Mulley, R.C., Flesch, J.S & Nicetic, O. 2004. „The relationship
between body condition score and venison quality, in farmed, entire and
castrated fallow deer bucks (Dama dama)‟. In: Proceedings of the Australian
Society of Animal Production Conference, Melbourne, July, pp. 321-327.
Sims, K.L., Wiklund, E., Hutchison, C.L., Mulley, R.C. and Littlejohn R.P. 2004.
„Effects of Pelvic Suspension on the Tenderness of Meat from Fallow Deer
(Dama dama)‟. In: Proceedings of the 50th International Congress of Meat
Science and Technology, Helsinki, Finland, pp.12-13.
Wiklund, E., Mulley, R.C., Hutchison, C.L. and Littlejohn, R.P. 2004. „Effect of
Carcass Suspension Method on Water Holding Capacity of Fallow Deer
(Dama dama) and Lamb Meat (M.Longissimus)’. In: Proceedings of the 50th
International Congress of Meat Science and Technology, Helsinki, Finland,
pp. 18-20.
Hutchison, C.L., Mulley, R.C. and Nicetic, O. 2002. „The relationship of body
condition score and venison quality characteristics in fallow deer (Dama
dama)‟. In: Proceedings of the 5th International Congress on the Biology of
Deer, Quebec City, Quebec, Canada, pp. 239-243.
xxiv
Presentations Arising from this Study
Hutchison, C.L. 2008. The Relationship of Body Condition Score and Carcass
Composition to Consumer Perception of Venison Quality. Innovations
Conference, June 2-4, University of Western Sydney.
Hutchison, C.L. 2007. Consumer Perception of Venison Quality. Innovations
Conference, June 4-6, University of Western Sydney.
Hutchison, C.L., Flesch, J.S. and Mulley, R.C. 2006. The Effect of Pelvic Suspension
on the Biochemical and Sensory Quality of Venison from Red deer (Cervus
elaphus) and Fallow deer (Dama dama). 6th International Deer Biology
Congress, Prague, Czechoslovakia, August 7-11.
Hutchison, C.L. 2006. The Relationship of Body Condition Score and Carcass
Composition to Consumer Perception of Venison Quality. Innovations
Conference, June 7-9, University of Western Sydney.
Hutchison C.L., Mulley, R.C., Flesch, J.S & Nicetic, O. 2004. The relationship
between body condition score and venison quality, in farmed, entire and
castrated fallow deer bucks (Dama dama). Australian Society of Animal
Production Conference, Invited Speaker, Melbourne, July.
Hutchison, C.L. 2005. Consumer venison quality characteristics in fallow deer
(Dama dama). Innovations Conference, June 3-7, University of Western
Sydney. 2005 conference award winner.
Hutchison, C.L. 2004. Venison quality characteristics in commercial grade fallow
deer (Dama dama). Innovations Conference, June 4-8, University of Western
Sydney.
xxv
Hutchison C. 2004. Relationship of Body Condition Score and Carcass Composition
to Consumer Perception of Venison Quality, Deer Industry Association of
Australia, Biennial Conference, April, Mt Gambier, SA (Invited presenter).
Sims, K.L, Mulley, R.C., Hutchison, C.L. & Wiklund, E. 2004. Post-Slaughter
Management of Fallow deer (Dama dama). Effect of Pelvic Suspension
Method on Meat tenderness. Deer Industry Association of Australia, Biennial
Conference, April, Mt Gambier, SA (Invited presenter).
Hutchison C.L., Mulley, R.C. and Nicetic, O. 2002. The relationship of body
condition score and venison quality characteristics in fallow deer (Dama
dama). 5th Int. Deer Biology Conference, Quebec City, Canada. July.
Hutchison C.L. 2001. Relationship of body condition score to venison quality. Deer
Industry Association of Australia, Biennial Conference, 7-9th September
2001, Canberra, ACT, (Invited presenter).
xxvi
Abstract
The supply of venison to the Australian domestic market is undermined by
inconsistent quality, lack of consistent supply, poor presentation and lack of product
knowledge by marketers and at point of sale. The aim of this work is to improve
quality assurance of venison produced by the Australian deer industry. This study
investigated links between live animal body condition along with pre- and post-
slaughter management with subsequent meat quality and consumer acceptance. A
study of this type has never before been conducted on venison.
Data for venison from fallow deer (Dama dama) castrates (n=18), bucks (n=31) and
does (n=24) as well as red deer (Cervus elaphus) stags (n=26) were analysed. The
study included pre-slaughter management of deer such as the effect of animal body
condition score, sex, supplementary feeding and pre-slaughter stress. A number of
post-slaughter treatments were also examined, including the effect of carcass ageing
and hanging method. Pre-slaughter Body Condition Score (BCS), the feeding
regimen for finishing deer prior to slaughter, and post-slaughter meat quality
attributes including pH, moisture content, fat content, fat distribution, shear force,
and Lab* colour measurement were the factors analysed along with consumer
sensory evaluation.
As body condition score increased so did levels of intramuscular fat, BCS 2-3
(p<0.001) and BCS 3-4 (p<0.01). Instrumental tenderness of venison also increased
as BCS increased, significantly so when BCS 4 animals were included in the study:
fallow does (p<0.01) and red stags (p<0.05). Even though venison from BCS 4
animals was more tender, BCS 2 and 3 animals provided venison of acceptable
tenderness, with most shear force values below 5.0kg and all well below 6.0 kg.
These data for tenderness are of importance to venison producers when determining
the condition of animals for slaughter, and producing for particular markets.
Freeze-thaw/purge losses were significantly higher in fallow deer bucks of BCS 3
when compared with BCS 2 (p<0.001). Bucks of BCS 3 had higher moisture content,
xxvii
though this was not significant. Significantly higher losses may be a result of a
number of factors including moisture content and fat percentages.
Meat colour measurements showed a decrease of redness as BCS increased. The
lower redness values were only significant for BCS 4 animals, being red deer stags
(p<0.01) and fallow deer does (p<0.05). This decrease in redness may be related to
fat deposition within the muscle in higher BCS animals. Fallow deer castrates of
BCS 2 and 3 had lower redness (p<0.05) and yellowness (p<0.05) than fallow deer
bucks of the same BCS, which may be attributable to hormonal status, muscle
activity and fat accretion.
Venison from fallow deer does produced the lowest shear force values (p<0.001),
regardless of BCS and animal age. These data suggest that older females culled for
poor reproductive performance are still suitable to slaughter and produce quality
venison. There were no significant differences in instrumental meat quality between
castrated male fallow deer and bucks.
Concentrate feeding of fallow deer does increased BCS (p<0.001). The concentrate-
fed deer had significantly higher live weights (p<0.001), carcass weights (p<0.01),
fat deposition and dressing percentages (p<0.001). Pasture-fed fallow deer venison
held its redness for a longer period than concentrate-fed venison (p<0.01), which is a
positive for pasture based management systems. Concentrate-fed animals had
significantly more tender meat than the pasture-fed group (p<0.05) which is probably
related to the increase of BCS and IMF.
In this study it was demonstrated that prolonged pre-slaughter handling in connection
with slaughter at an export abattoir significantly increased venison pH values
(p<0.05), compared with smaller purpose built slaughter systems. Stress before
slaughter can induce muscle glycogen depletion so meat pH stays above 6.0 and dark
firm dry meat (DFD) occurs.
Meat ageing is a technique employed by the meat industry to enhance tenderness of
product over various storage times. Dry ageing venison from fallow deer bucks and
castrates for between 5 and 10 days in this study had no significant effect on an
xxviii
already tender venison product. There was a general tendency for the meat aged for
10 days to be more tender, however, these differences were not statistically
significant.
The technique of hanging carcasses by pelvic suspension instead of by the Achilles
tendon resulted in more tender meat for fallow deer bucks (p<0.001), fallow deer
does (p<0.01) and red deer stags (p<0.001).
In this study, experiments using a consumer panel were conducted. Panellists
detected a gradual increase in tenderness of venison as BCS increased from 2 to 4,
and preferred venison from animals with a BCS of either 3 or 4, compared with BCS
2. Male panellists detected an increased darkening of the cooked meat as BCS
increased (p<0.01) compared with female panellists, however, this did not affect
overall liking or preference. Animals ranging in BCS from 2 to 4 can be slaughtered
without apparent effect on consumer preference, which allows for flexibility in the
supply chain. The data indicate no overall difference in liking for BCS 2-3 animals,
hung by the Achilles tendon, whether bucks or does (p>0.05). This is also important
given that most fallow deer presented for slaughter fall into this BCS range.
BCS was increased by grain feeding young animals to achieve BCS 4, which was not
achievable by pasture feeding alone. Consumer panels reported a significantly
stronger flavour in the venison from animals fed grain prior to slaughter (p<0.01),
particularly in animals that remained at BCS 3. Male panellists were particularly able
to detect a difference according to the number of days the animals were fed
concentrate feed, with longer feeding periods resulting in stronger flavours
(p<0.001). This result did not however affect overall liking or preference. However,
the stronger flavour in venison from grain-fed animals was not detected in animals of
BCS 4 in this study, possibly as a result of the higher intramuscular fat content
affecting the flavour strength of the muscle. As there were no significant differences
in other quality parameters between BCS 2, 3 and 4 animals, or between animals fed
grain or pasture, there would appear to be no justification for fallow deer farmers to
finish animals on grain prior to slaughter to achieve higher BCS.
xxix
Meat from fallow deer does was generally perceived as more tender than bucks
(p<0.001), even at older ages, and had a high overall liking rating by consumers even
though the meat was darker (p<0.001) and had a stronger flavour (p<0.01). The
middle aged group of panellists detected a stronger flavour in does (p<0.01), possibly
due to the animals being older, and this age group of panellists contained a higher
percentage of current venison consumers than the younger or older age groupings.
The group with previous game meat eating experience also detected a stronger
flavour in the venison from does (p<0.001). These results did not affect overall
liking.
The consumers clearly distinguished their overall liking for venison derived from
carcasses treated with pelvic suspension post-slaughter compared with Achilles
tendon suspension (p<0.001). This preference was demonstrated by the important
quality characteristics of tenderness and juiciness (p<0.001) which both increased in
venison as an effect of this technique. This finding is also consistent with the
instrumental data collected in this study, and indicates that the technique of pelvic
suspension should be adopted by the deer industry to produce venison for which
consumers have an increased preference.
The pH values measured in venison in the present study were in the range to
guarantee optimal tenderness which was supported by the consumer scores for
tenderness in venison, all averaging values of 8 or above on the scale from 0 (very
tough) to 11 (very tender). This suggested that all venison evaluated, regardless of
species, sex, age, BSC or carcass hanging method, generally was judged to be very
tender.
The hypothesis that changes in BCS would dramatically affect eating quality and
consumer preference has not been proven in these experiments for either species of
deer. The meat quality parameters measured, however, showed differences across the
BCS range 2 to 4, in increases in tenderness, less redness and higher levels of IMF,
particularly in red deer and fallow deer does with BCS 4 compared with BCS 2. This
difference is confirmed by the slight differentiation between BCS 2 and BCS 4 by
taste panellists, but with no negative implications for overall liking. It is apparent
from data for both red and fallow deer that there was a trend for greater overall liking
xxx
of venison from animals with BCS 3 and 4, compared with BCS 2, but this trend was
not significant. It may be necessary to slaughter larger numbers of animals to prove
beyond doubt that this trend is measurably significant.
The need to adopt the post-slaughter practice of pelvic suspension of deer carcasses
of all ages, sexes and body condition scores is unequivocal if enhanced tenderness of
venison is desirable. The sensory panels in this study validated the objective tests
that indicated increased tenderness and juiciness of venison from carcasses subjected
to pelvic suspension compared with carcasses hung by the Achilles tendon.
Flavour is a key quality attribute for consumers and in this study flavour was shown
to increase as animals aged and if they were fed grain prior to slaughter. The
detection by male panellists of stronger flavours in venison from deer fed grain prior
to slaughter was more surprising and this finding could be used by the deer industry
to satisfy market preference for stronger flavours, or could be a warning to restrict
the feeding of grain prior to slaughter if stronger flavours are not desirable.
Comparative evaluation of venison from bucks and does for „overall liking‟ indicated
consumer preference for venison from does. This is useful information for the deer
industry, especially with reference to slaughter of fallow deer, because fallow deer
bucks are very aggressive toward each other during the breeding season and at this
time of year, carcasses can be bruised and dehydrated. Venison quality can remain
acceptably high by slaughtering cull female stock during the breeding season.
Overall, this study has shown that venison is a high quality product. Sensory
evaluation showed the product to be strongly appreciated by men and women
between the ages of 25 and 55, and differences in „overall liking‟ between red and
fallow deer venison were not detected in this study. Consumer behaviour is shaped
by the availability of product to meet their needs. The decision to purchase food
products is generally influenced by perception of quality in terms of safety, sensory
aspects, nutrition and health (Troy and Kerry 2010). This study confirms that
Australian venison has the potential to meet all of the characteristics desired by
consumers.
Chapter One
1
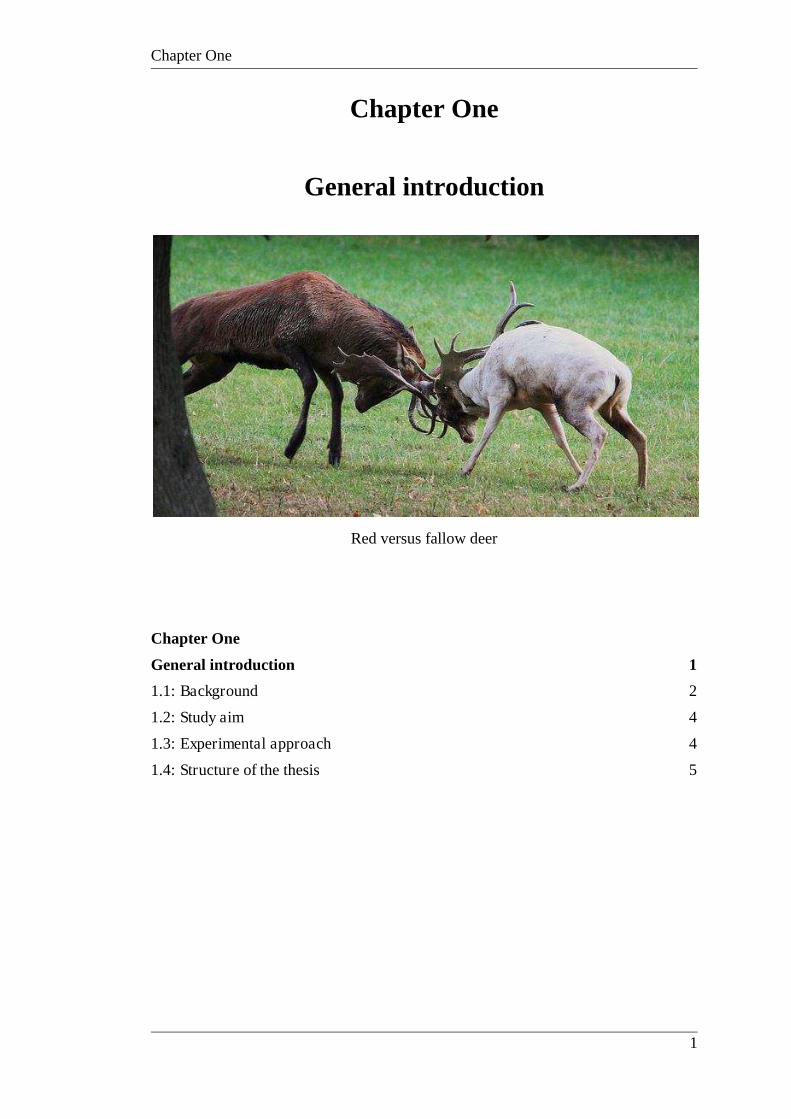
Chapter One
General introduction
Red versus fallow deer
Chapter One
General introduction 1
1.1: Background 2
1.2: Study aim 4
1.3: Experimental approach 4
1.4: Structure of the thesis 5
Chapter One
2
1.1: Background Consumer perception of venison is a critical issue for the Australian deer industry.
Inconsistency of Australian venison is currently a major difficulty in establishing
repeat purchasing by consumers and has resulted in Australian producers being
largely dependent on a volatile export market (Cox et al 2005). Supply of venison to
the Australian domestic market has been undermined by inconsistent quality, lack of
consistent supply, poor presentation and lack of product knowledge by marketers and
at point of sale. Potential local consumers of Australian venison appear to lack
confidence in the industry‟s ability to supply quality venison, particularly in the food
service industry where much of the venison sold is imported from New Zealand
(Tuckwell & Tume 2000).
Consumer behaviour is shaped by personal needs and the availability of product to
meet those needs. Consumers purchase a product when their perception of that
product is positive and this generally relates to quality in terms of safety, sensory
aspects, nutrition and health (Troy and Kerry 2010). Australian venison and venison
in general has the potential to satisfy these consumer desires but has to date, failed to
do so, largely as a result of quality issues.
The Australian venison industry must move towards the same goal for consumer
focused supply systems as the beef (Thompson 2002) and sheep meat (Hopkins
2011) industries have done. A quality assurance (QA) system which addresses both
live animal and carcass processing aspects, both on and off farm, can lead the
industry into a more successful consumer focus with the ability to supply specified
products to markets. This system may facilitate consumer acceptance of venison and
provide consistent quality for repeat purchase. The deer industry must deliver
venison of consistent quality at a reasonable price to promote venison as a healthy,
premium source of red meat.
Consumer perception of venison is a critical issue for the Australian deer industry,
which is currently experiencing an extended slump (Cox et al 2006). Scientific
contributions may form the basis for the ability of the industry to improve
Chapter One
3
consistency and quality of their product as identified by the Rural Industries
Research and Development Corporation (RIRDC) (McRae et al 2006).
The issues of inconsistent quality are of major concern for the industry and need to
be addressed in order for the industry to survive and rebuild. The questions remain;
how does a producer determine when animals are ready for slaughter in order to
produce optimal venison quality? What techniques can be employed pre- and post-
slaughter in order to reliably optimise meat quality?
Research was conducted by Flesch (2001) to provide producers and processors with
a common language for assessing animal body condition and determining suitability
for slaughter. This research resulted in the production of body condition scoring
(BCS) charts for fallow (Tuckwell et al 2000a) and red deer (Tuckwell et al 2000b).
These BCS charts gave Australian venison producers and processors a common
descriptive, assessment language for production and supply of suitable slaughter
stock. The obvious next step was to identify links between BCS and instrumental and
sensory mat quality and determine whether or not a premium live carcass produces
premium quality meat for the consumer. The RIRDC provided funding for this
project to establish links between BCS and meat quality. During this study
examination of pre- and post-slaughter management techniques such as feeding
regime and post-slaughter hanging method, and their effect on venison quality was
also explored. Research of this type had not been previously undertaken on fallow
deer, with some related research conducted on red deer in New Zealand. The links
between instrumental measures of quality and consumer acceptance have not been
previously studied for fallow and red deer venison.
The relationship of BCS along with pre- and post-slaughter management, to
instrumental measurements of deer venison quality and sensory evaluation by
consumers, may have important implications for all sections of the value chain,
especially in smaller industries such as the deer industry where it is critical that
product potential is maximised. Payment to producers based on consumer
satisfaction has the potential to initiate industry change (Polkinghorne and Thompson
2010).
Chapter One
4
Meat quality attributes such as tenderness, juiciness and flavour are not able to be
predicted by the appearance of the live animal or the meat. However, by establishing
links between live animal body condition score (BCS) and carcass fatness (Flesch
2001) with meat quality, predictions may be possible. This will assist producers
when determining the optimal condition of animals for slaughter. Links between live
deer assessment using the BCS system, and the resultant meat quality attributes and
acceptance by consumers has not been previously studied.
It is anticipated that scientific contributions, such as those outlined in this study will
assist the venison industry to improve consistency and quality of product.
1.2: Study aim
The aim of this work was to clearly establish the impact of a number of pre-slaughter
and post-slaughter production and processing techniques on instrumental and sensory
meat quality for venison from red and fallow deer.
The objectives of this study were to determine the effect of the following variables
on instrumental and sensory measures of venison quality as follows:
Body condition score (BCS)
Sex of the animal
Red and fallow deer species
Feeding regimes
Muscle ageing time
Post slaughter hanging technique.
1.3: Experimental approach
The study design followed a systems approach to venison quality; from on farm
growth and development, immediate post-slaughter management, optimum food
preparation through to consumer appraisal and perception. Experimental work was
Chapter One
5
carried out on selected slaughter age, red and fallow deer of body condition scores 2,
3 and 4 (lean, prime and fat) (Tuckwell et al 2000a;b). The research defines carcass
composition of the various scores. The study focuses on pre-slaughter treatments,
post-slaughter handling and meat quality assessment to determine parameters relative
to the production of optimal eating quality venison. In addition to eating quality and
consumer acceptance, venison from deer raised on pasture vs. supplementary feeding
was evaluated. This work uses body condition score as a critical parameter. Sensory
analysis was employed to quantify consumer expectation and acceptance of venison
of the three condition scores undergoing various treatments. The vision to link
carcass production with eating quality has long term implications for acceptance of
venison as a favoured consumer selection, just as Meat Standards Australia (MSA) is
achieving for the beef industry.
Definition of the relationship of BCS, along with pre- and post- slaughter treatments
with cooking and eating quality will increase opportunities for target marketing,
which should increase farm profitability and consumer satisfaction if product
consistency is enhanced. The pre- and post-slaughter techniques employed in this
study tested the effect of pelvic suspension (tender stretching) of carcasses for
product enhancement, evaluated ageing of venison, and looked at the effect of
supplementary feeding of deer pre-slaughter compared with pasture-fed deer, on
consumer sensory perception of meat quality attributes.
1.4: Structure of the thesis
This thesis is structured with a general introduction in Chapter 1, a literature review
in Chapter 2, general materials and methods in Chapter 3, four experimental chapters
from Chapter 4 to 7 and final conclusions in Chapter 8.
Chapter 4 establishes the relationship between body condition score and instrumental
measures of venison quality for both fallow and red deer.
Chapter One
6
Chapter 5 examines the effect of feeding concentrate feeds on the instrumental meat
quality of venison from fallow deer does.
Chapter 6 examines a number of pre- and post-slaughter management techniques,
including ageing time and carcass suspension methods on the instrumental quality of
fallow and red deer venison.
Chapter 7 encompasses all of the areas examined in Chapters 4 to 6 and presents
samples from these earlier experiments to consumer panellists for evaluation.
Chapter 8 brings together the main findings of the study and incorporates some
recommendations to industry.
Chapter Two
7
Chapter Two
Literature review
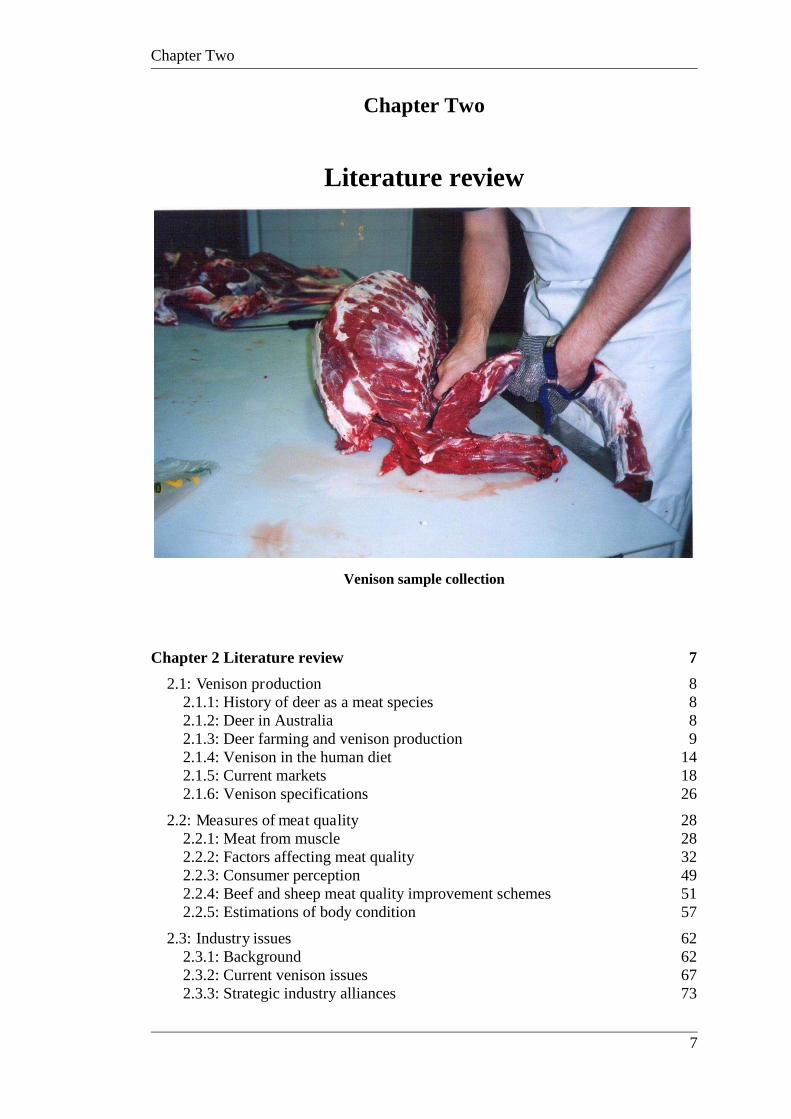
Venison sample collection
Chapter 2 Literature review 7
2.1: Venison production 8 2.1.1: History of deer as a meat species 8 2.1.2: Deer in Australia 8 2.1.3: Deer farming and venison production 9 2.1.4: Venison in the human diet 14 2.1.5: Current markets 18 2.1.6: Venison specifications 26
2.2: Measures of meat quality 28 2.2.1: Meat from muscle 28 2.2.2: Factors affecting meat quality 32 2.2.3: Consumer perception 49 2.2.4: Beef and sheep meat quality improvement schemes 51 2.2.5: Estimations of body condition 57
2.3: Industry issues 62 2.3.1: Background 62 2.3.2: Current venison issues 67 2.3.3: Strategic industry alliances 73
Chapter Two
8
2.1: Venison production
2.1.1: History of deer as a meat species
Deer are ruminants that constitute the family Cervidae of the order Artiodactyla and
sub-order Ruminantia. The Cervidae family consists of seventeen genera, forty
species, and over 190 different sub-species (Whitehead 1972).
It is believed that deer appeared early in the Oligocene epoch in Asia approximately
38 million years ago, with the dating of remains of fallow deer going back to the
second interglacial period 250,000 years ago (Chapman 1993). The intensive
husbandry of deer in farming environments, however, is relatively new to modern
agriculture, although archaeological records suggest breeding and utilisation by man
from 9000 BC (Reinken 1997). Most of the deer on farms today are believed to be no
more than forty generations removed from their wild descendants. Farmed deer still
exhibit some aspects of wild behaviour, with their ancestry still having an effect on
their diurnal and annual patterns of feed intake, growth and reproduction in managed
pastoral environments (Flesch 2001). Deer have not been selectively bred by man for
at least 5000 years and as such remain one of a few species to have been recently
domesticated (Fletcher 1998) for food production. Farmed deer have undergone little
genetic selection for improved domesticity, though are habituated to the farm
environment. This is in stark contrast to domesticated ungulates such as cattle, sheep
and goats, which have undergone extensive physiological, morphological and
behavioural changes as a result of thousands of years of selection for domesticity
(Flesch 2001).
2.1.2: Deer in Australia
Due to the lack of land bridges, native deer did not exist in Australia when cervids
spread throughout the world 15,000 to 30,000 years ago (Hansen 2004). Deer were
introduced into Australia as part of an acclimatisation program in the early 19th
Century, with the aim of “a more equitable distribution of the world‟s useful and
beautiful species” (Bentley 1978). This government program oversaw the
Chapter Two
9
introduction of several exotic species of animals and birds for use and hunting by the
British colonists. The first reported imports were of chital deer from India in 1800 by
Dr John Harris to his farm in the area which is now known as Chinatown in Sydney.
By 1809 his herd numbered 400 head (Hansen 2004). Approximately 20 deer species
were released from the mid 1800s up until 1900 by acclimatisation societies, hunting
clubs and individuals (Bentley 1978). Of these, only six remain after successfully
establishing wild populations, being red, fallow, rusa, chital, sambar and hog deer
(Moriarty 2004). These animals formed wild populations, and individuals from these
populations eventually formed the basis of Australian deer farming. Initial supply of
animals for farming came from capturing animals from wild populations, mainly
fallow deer in New South Wales, red deer in Queensland and rusa deer from the
Royal National Park near Sydney (Falepau 1999; Hansen 2004; Joubert 2004). Red
and fallow deer comprise most of the national herd of farmed deer with farms located
in NSW and Victoria. Rusa deer are farmed primarily in Queensland. Tasmania is
populated only with fallow deer, both in the wild and on farms (Falepau 1999).
2.1.3: Deer farming and venison production
Venison is traditionally defined as the meat from any furred game animal including
deer, rabbit and hare but is now more commonly used to refer to the meat of any
species of deer, whether hunted or farmed. Archaeological evidence shows that man
has been eating venison for many more centuries than beef or lamb and it has
constituted the base of meat diets for Europeans for between 5000 and 50000 years
(Fletcher 2001). The need for quality protein, fat, ease of domestication, draft
animals and fibre led to domestication of cattle and sheep 8000 years ago and for
man to hunt a variety of wild animals for food, clothing and fuel. Man no longer
requires a diet high in fat and lean meat meets consumer demands for healthier
lifestyles. Venison from deer and a number of other game meats can potentially meet
the demand for leaner and healthier meat sources (Wiklund et al 2010).
While sheep and cattle were being domesticated deer relied on natural selection and
thus populations have not had much human influence. The first deer farm was
established in Scotland in 1971 to farm red deer and was soon followed by a fallow
Chapter Two
10
deer farm established in Germany in 1973 (Reinken 1998). Red and fallow deer were
selected as a production species in Europe due to their longevity, disease resistance,
hardiness in winter, ease of calving and carcass and meat quality. Today, apart from
fallow and red deer, European game farms produce sika deer, roe deer, mouflon
(wild sheep) and wild boar, with often several species farmed together, particularly
in areas of culinary demand or where there are trophy hunting areas and tourism
(Audenaerde 1998). The challenge for deer farmers is to domesticate and breed for
temperament, leanness and growth in order to meet market requirements.
Deer farming, hunting, venison production and consumption has been firmly
established in Europe for many years (Piasentier et al 2005). The European Union
(EU) plays a major role in world production of farmed venison. Venison is produced
locally in several European countries, with centres for production, particularly for
fallow deer, being Austria, Germany, Italy, Sweden and Switzerland. Deer farming
has also been established in the Czech Republic, Portugal, Norway, Hungary,
Poland, Slovakia and Spain. Red deer are principally farmed in Great Britain.
However, European consumption far exceeds the ability of the EU to supply
sufficient quantities of venison (Audenaerde 1998). This surplus demand is catered
for primarily by imports of farmed venison from New Zealand, and to a much lesser
extent Australia, and some inputs from wild product harvested in Scotland and
central Europe. Countries such as Germany and the Scandinavian countries have a
culture of consuming venison. Countries, such as Australia where that culture is
missing, are often forced to export the venison that is produced. Europe produces for
its own consumption, while the New Zealand and Australian venison industries
depend on exports. There has been an increase in interest in venison by the EU due to
the recognition that venison is a healthy product. It is estimated that there are over
10,000 deer farmers in the EU producing over 7,000 tonnes of venison, and numbers
continue to rise (AACMI 1998; Audenaerde 1998). In 2002, estimates of the
European farmed red and fallow deer population stood at 410,000 and Scandinavian
reindeer at 90,000, while the total wild population was estimated at over 1 million
red deer, 5.5 million roe deer, 500,000 moose, 125,000 fallow deer and 50,000
reindeer (Fletcher 2004). Consequently the farmed venison sector in Europe is small
in relation to meat supplied from the wild venison sector, and there continues to be a
large market for trophy hunting, which is vital to the success of the European deer
Chapter Two
11
industry (Fletcher 2004). In 2004, farm sizes were very small with a predominance of
hobby farmers. Norway had 51 farms with a population of 650 deer, Benelux had
1,500 farms with 2,400 deer, and Switzerland, 485 farms carrying 8,389 deer. The
Czech Republic had approximately 200 farms with estimates of between 5,000 and
8,000 deer; Denmark had 142 farms with 20,000 deer and Poland 60 farms carrying a
total of 4,900 deer. Most farms carry only red and fallow deer, with Denmark also
carrying 200 sika deer (Fletcher 2004). More recent statistics on European farmed
deer holdings and meat processing quantities are difficult to obtain. In 2010, it was
reported that deer farming in the Netherlands was in decline, Latvia had several
holdings with a maximum of 60 deer per holding, France had 50 deer farms and 200-
330 deer parks, Switzerland had 600 deer farms, Sweden farmed 20,000 fallow deer
and 67,000 red deer, and there were large numbers of nomadic indigenous
communities farming or herding semi domesticated reindeer in Northern Europe. The
Czech Republic had 350 deer farms, Slovakia, 59 farms, while Lithuania had 152
deer farms. Germany had 6,000 small farms, mostly in Bavaria, with 70% having
fallow deer, and Austria had 1,600 deer farms but animal numbers were not reported
(FEDFA 2010). Recent estimates (FEDFA 2010) report national deer herd numbers
in the United Kingdom at 36,000, an increase from 2004 when there were 311 farms
carrying 32,500 deer (Fletcher 2004), with the majority being red deer, a number that
has been relatively stable and exhibiting only minor fluctuations since 1995
(Hoffman and Wiklund 2006).
Sweden, Norway, Finland and New Zealand lead the world in commercial venison
production, both in terms of quality and quantity. In the case of the Scandinavian
countries the venison comes from semi domesticated reindeer, and with New
Zealand, principally from farmed red deer (Wiklund 1996).
New Zealand has the world‟s largest and most advanced deer farming industry
(Pearse and Fung 2008). The first deer were brought to New Zealand from England
and Scotland for hunting in the mid to late 19th century. They were released and the
environment proved ideal: feral populations grew uncontrolled. The New Zealand
deer industry was established as a result of the capture of feral deer that were seen as
a pest species in New Zealand in the 1960s. The first breeding herd was established
in 1970 (Quinn-Walsh 2010) and has, over forty years, developed into a significant
Chapter Two
12
export industry (Asher et al 2011; Hoffman and Wiklund 2006). Since the
establishment of a commercial deer industry in New Zealand, producers have
imported red deer genetics from Europe, and elk from Canada and the USA, to
improve both velvet antler and venison production (Barry and Wilson 1984). In
2005, the New Zealand farmed deer herd was estimated at 1.7 million on 4,500
farms, the majority (85%) being red deer and the balance mostly elk or wapiti and a
few fallow deer. Of these, 680,000 head were slaughtered annually for venison
(Hoffman and Wiklund 2006), up from 83,000 head slaughtered in 1988 and 258,000
in 1992 (Drew and Stevenson 1992; Pearse and Fung 2008). In 2006, deer numbers
fell to 1.6 million and have continued to decline, with figures for 2007 being 1.4
million and current figures estimating the population at 1.12 million (MAF 2011) on
3,000 farms (Stewart 2011). The decline is attributed to producers with mixed
species farms reducing their deer numbers. A rebuilding of populations has
commenced and is expected to slowly continue (MAF 2011). The majority of deer in
New Zealand are farmed for venison and co-products, with the remainder bred for
velvet production (Pearse and Fung 2008). Ninety percent of the products, being
venison, velvet antler and co-products, were exported (Hoffman and Wiklund 2006,
MAF 2011). New Zealand currently supplies over 50% of the world‟s internationally
traded venison (Asher et al 2011). Revenue from exports in 2008/2009 was $NZ320
million, with 18,700 tonnes exported, of which 68% went to Germany (Quinn-Walsh
2010).
Deer farming is a mainstream industry in New Zealand and is the largest producer of
venison and velvet antler in the Asia Pacific region. The New Zealand deer industry
is ten times larger and produces twenty times more venison per annum than Australia
(AACMI 1994). The New Zealand herd is principally made up of red deer compared
with Australia, where the percentage of fallow deer and other species is higher.
Other countries, such as Malaysia, Mauritius, Reunion Island and New Caledonia,
produce the majority of the world‟s rusa deer, both farmed and wild (Hoffman and
Wiklund 2006; Dahlan 2009).
Commercial deer farming in Australia did not begin until the 1970s. The first
commercial deer farm was established in Victoria in 1971, with rusa deer legally
Chapter Two
13
captured from wild populations in the Royal National Park in Sydney (Moriarty
2004). The industry expanded rapidly until the late 1980s (McRae et al 2006) after
the publication by Anderson (1978), Gold on Four Feet, sparked a great deal of
interest in deer farming (Hansen 2004). The Australian Deer Breeders‟ Federation
was formed in 1979 and evolved into the current Deer Industry Association of
Australia Ltd in 1995 (RIRDC 2007). The species farmed commercially in Australia
are red deer, which comprises over 50% of all commercial production for venison
and velvet antler, fallow deer (both European fallow deer (Dama dama) and hybrids
of Persian or Mesopotamian fallow deer (Dama dama mesopotamica), which
constitute almost the remaining percentage and are grown mainly for venison
production. Other species produced in small numbers in Australia include rusa deer
for venison, wapiti/elk and sika/red hybrids for venison and velvet antler, and to an
even lesser extent, chital deer and sambar deer, both for venison (McKinnon 2011).
In 1999 the Australian herd size was 188,000 (Tuckwell 1999). An approximate
distribution of commercial deer operations by state in 1999 was: New South Wales
and Australian Capital Territory 30%, Victoria 26.5%, South Australia 15.5%,
Queensland 11%, Tasmania 8.5%, and Western Australia 8.5%. Of the 938
commercial farms in Australia with deer, only 212 held more than one species
(Tuckwell 1999). By January 2001, numbers were down to approximately 180,000
deer, farmed by between 600 and 1,000 farmers (RIRDC 2007). Fallow deer
comprised 41% of the herd, red deer 41%, rusa deer 12%, elk 4% and chital deer 2%
(Tuckwell 2001a).
The period between 1999 and 2001 saw the Australian deer industry in its most
profitable and commercially successful period since the establishment of the
industry, however, most factors associated with this success were those over which
the industry had little or no control. In particular, the Australian dollar was devalued,
and there was a lack of confidence in European markets in other, more traditional,
red meats, which increased demand for alternatives such as venison. High prices paid
during this period led to an increase in the number of animals processed with the
implications of that felt in subsequent years by producers and processors who were
later unable to keep up with demand due to the inability to supply adequate stock
numbers, despite demand being relatively low (Tuckwell 2003a).
Chapter Two
14
The national herd is currently estimated at 43,856 deer comprised of red, fallow,
rusa, chital, sambar, elk, hog and sika hybrid deer over 196 farms Australia wide
(McKinnon 2011). Red deer now comprise the majority of the herd at 48%, due their
ability to produce larger quantities of venison and velvet; fallow deer comprise 44%
with the remaining percentage being rusa, elk, sambar, chital, hog deer and other
unspecified species (Shapiro, 2010; McKinnon, 2011). It is believed that the majority
of deer found in Australia are wild, with deer farming for venison and velvet
performed by a small number of producers (Hoffman and Wiklund 2006; RIRDC
2007).
In 2011, of the 196 confirmed deer farms in Australia, the majority are located in
Victoria (35%), South Australia (24%) and New South Wales (12%) (Shapiro 2010),
with a small number located in Tasmania, Western Australia and Queensland
(McKinnon 2011). The Australian deer industry has a small number of large scale
farms and many smaller farms. The ten largest farms have over 1,000 head of deer
and represent 41% of the industry, while the smallest one hundred farms comprise
less than 10% of the total. One Australian producer has 4,500 head of deer, totalling
approximately 10% of the national herd, while 44 producers have less than 20
animals (Shapiro 2010).
2.1.4: Venison in the human diet
Red meat is a primary dietary component for human beings and should form part of a
well balanced and varied diet to be consumed on a daily basis (NHMRC 2003).
During the early period of Australia‟s colonisation, meat was in abundance and
consumption of beef and lamb in the 19th century was estimated at 290kg per capita
annually. By the mid 1940s this had declined to 190 kg per capita and by 1970 to 80
kg, 1990 to 52 kg and in 2008 50 kg per capita (Williams and Droulez 2010) with
only 10.4 kg of that coming from lamb (Fletcher et al 2009; Rees 2010).
Consumption of red meat in Australia has declined, despite increases in production,
however, total meat consumption has not declined, with an increase in the
consumption of white meat such as chicken and pork (Fletcher et al 2009). Based on
epidemiological studies, there is a positive association between saturated fat intake
Chapter Two
15
and obesity with red meat consumption. However, the nutritional benefits of
moderate meat consumption in terms of protein, vitamins and minerals outweigh the
disadvantages of intake of saturated fats (Schonfeldt and Gibson 2008).
There have been substantial changes in carcass composition, in terms of reduction of
fat, both biologically and as a result of trimming and adjustments in cooking methods
to further reduce the possibility of high saturated fat intake. These changes are
reflective of an increase in consumer demand for leaner red meat products and there
is an increase in global demand for high value animal protein (Schonfeldt and Gibson
2008; Stewart 2011). Consumers indicate that the nutritional value of the meat in
their diet is of increasing importance to them, and subsequently, to the meat industry
(De Smet 2011). In 2007, a survey indicated that 89% of red meat consumers
reported buying trimmed meat (5%) or removed some of the fat (84%) prior to
consumption, and over the past 20 years increasing consumer awareness of the
importance of health and the role of saturated fat has influenced consumer demands
and practices (Williams and Droulez 2010).
Deer venison is suited to modern consumer demand for lean red meat of high
nutrient value and low in fat, and is easy to prepare (Hoffman and Wiklund 2006;
Issanchou 1996). Compared with beef and lamb, venison has several advantages,
including a higher percentage of lean meat and more valuable cuts, and less fat and
bone (Hoffman and Wiklund 2006). As a result of the low fat content and favourable
fatty acid ratios, consumption of saturated fats is decreased (Piasentier et al 2005;
Wiklund et al 2010). However, younger consumers tend to consume less red meat
and more pork and chicken due to the perception of red meat not being as healthy as
white meat (Fletcher et al 2009). Women in particular consume less red meat and are
particularly low consumers of game meats such as venison (Hoffman and Wiklund
2006).
A study by Moffat (2005) indicated that consumers felt that venison was unsuitable
for children due to the perceived requirement of cooking only to rare doneness and
would therefore not purchase the meat for family meals. Moffat (2005) also reported
a perception that venison must be served very rare in order to retain its tenderness
characteristics and suggested that research to confirm this would be worthwhile. A
Chapter Two
16
study by Shaw (2000) indicated that venison cooked to medium doneness performs
well in sensory tests. Ironically, the health benefits provided by venison are
particularly suited to women of reproductive age, adolescent girls and growing
children due to the high percentage of quality protein, low fat content and high iron
levels. Venison has less than a quarter of the fat and 35% more protein per 100g of
tissue than beef (Aidoo and Haworth 1995).
When consuming venison or lean chicken, 22% of the energy is derived from the fat
content while beef, lamb and pork has values ranging from 33% to 47%. Venison has
an average total energy content of only 500 kJ per 100g compared to an average of
750 kJ per 100g for lean beef and lamb (Aidoo and Haworth 1995). The cholesterol
content in venison is also on the lowest range found in the majority of meat animals
at 80mg/100g of tissue. Significantly, it supplies almost 40% of the adult RDI of iron
in a 100g portion, while being lower in sodium and higher in copper and zinc than
lamb (Aidoo and Haworth 1995; Daszkiewicz et al 2009; Drew and Seman 1992;
Duranti et al 1994). Since the consumption of meat is unlikely to decline, it makes
sense for consumers to consider selecting venison for optimal nutrition (Radder and
le Roux 2005).
In a South African study (Radder and le Roux 2005) 55% of consumers admitted that
they did not know how to cook venison. Education is critical in relation to the
cooking of venison as there was also a perception that the meat is dry and tough and
is possibly being over cooked, or in some cases, under cooked (Radder and le Roux
2005). To this end the New Zealand deer industry has made an effort to educate new
domestic and international consumers on appropriate ways to cook venison (Barnett
2007). In Germany, the New Zealand venison industry continues to survey and
educate consumers with supermarket demonstrations, resulting in a gradual change in
consumer attitude to venison preparation over the past five years in this important
export market (Griffiths et al 2009). Traditional markets, such as Germany, still
relate the product to traditional preparation methods such as slow cooking with
strongly flavoured condiments, and believe venison to be a seasonal product because
it was traditionally hunted and not farmed. Game seasons in Europe and the United
States were not year round, and venison harvested during these periods (autumn and
winter) was often tough and gamey or livery in flavour due to the breeding season or
Chapter Two
17
rut. As a result, traditional consumers would often utilise moist heat methods of
preparation and strong accompanying flavours in order to compensate for the
tougher, gamier meat harvested during this time (Pearse and Fung 2008). Consumers
need to be shown that farmed venison lends itself to rapid, dry heat methods of
cooking such as grilling and stir frying, and should be done to medium doneness as a
maximum to ensure good eating quality, due to the low fat content and delicate
structure and flavour (Pearse and Fung 2008). The New Zealand venison industry is,
as a result of a productivity strategy, able to supply quality venison all year round,
with marketing strategies aiming to increase consumption in international markets
during what is typically the off season (Pearse and Fung 2008).
There is a paucity of information relating to the target markets for venison. In an
Australian study in 1994, the venison consumer was identified as ranging through all
occupation categories, with a concentration of 80% being professionals (AACMI
1994). Recently, the New Zealand industry identified consumers as being from a
range of age groups within households with high discretionary income, seeking
premium quality food that is healthy, convenient, quick to prepare and available all
year round (DINZ 2011). This has been a move away from the core consumer being
European, between 30 and 60 years old, and affluent with links to traditional
consumption of venison (O‟Connor 2006).
The Australian meat industry has identified a number of areas of fundamental
importance to red meat consumers. Meat should exhibit high organoleptic qualities,
be health enhancing, from ethical production systems, safe for consumers and good
value for money (Pethick et al 2011). Any research should be well integrated within
these parameters in a modern consumer focused industry (Wiklund 2009). Venison
comes from animals that are largely grazed for most of the year which means that
their meat is seen to be produced more ethically and with consideration of animal
welfare when compared with commercial grain produced beef, pork and poultry
(Wiklund 2009). Recent studies have found that while consumers rate red meat
highly in terms of nutrient content, less than 50% of consumers suggest red meat in
Australia is of high quality. The other issue which must be addressed is the consumer
perception of the value of chicken in preference to red meat in the diet, particularly
in relation to obesity and weight loss programs (Pethick et al 2011). As obesity
Chapter Two
18
continues to become a public health issue, the venison industry could benefit with a
product that has lower fat than skinless chicken, high levels of omega-3 fatty acids
and twice the available iron of other red meats (Wiklund 2009). These factors lend
credence to the suggestion that humans are adapted to the consumption of game
meats that have been a staple in the human diet for centuries (Fletcher 2004).
2.1.5: Current markets
Australia is a world renowned producer of red meat, specifically beef and lamb. The
Australian red meat industry has a well established export industry for beef, second
in size only to Brazil, and is also the second largest supplier of lamb, with New
Zealand being the industry leader (Fletcher et al 2009; Hooper 2010a, 2010b).
Australia exports 45% of its lamb production, 79% of mutton and 62% of beef
(Pethick et al 2011). The product is also well established in domestic markets. The
success of these markets, both domestically and internationally, is in large part due to
the ability of the industry to supply a safe, wholesome product of consistent quality
to target markets. Consumer focused research is integral to the success of both
domestic and international markets (Pethick et al 2011). This ability has been a
result, to a considerable extent, of the extensive research that has been conducted by
cooperative research centres (CRC) set up for both the beef cattle and sheep
industries, and adopted by industry segments (Devine 2001).
Venison is placed in a different marketing sector to the more traditional red meats,
beef and lamb. Despite the fact that venison has been consumed for centuries, it is a
relatively new product in terms of farmed meat, and as a result, it has not undergone
the extensive genetic improvements seen in both cattle and sheep (Barnett 2007).
The current market for Australian venison is largely an export market; opportunities
have arisen for export of Asian/Pacific venison, as Australia and New Zealand are
seen as producing a safe product in a clean environment. The majority of venison
exported is as meat cuts, sold chilled or frozen, not whole carcasses, with a small
percentage of live exports to Asia (AACMI 1994). Venison is not, however, well
known or represented in the domestic market. The development and maintenance of
Chapter Two
19
stable domestic and international markets for Australian venison is key to the long
term future of the Australian deer industry.
Since its inception in 1970s the Australian deer industry has relied primarily on
exports to European markets, along with New Zealand, the biggest producer and
exporter of farmed venison. Relatively small volumes are sold to other than the
traditional European markets: smaller markets include the USA (primarily supplied
by New Zealand), Japan, Taiwan and South Korea. The occurrence of the Chernobyl
nuclear disaster, outbreaks of foot and mouth disease (FMD), and bovine spongiform
encephalopathy (BSE or mad cow disease) in Europe and the United Kingdom has
opened up new export markets for safe, clean meat such as Australian and New
Zealand venison (Hoffman and Wiklund 2006), and resulted in record prices for New
Zealand venison (Loza 2003).
Supply of venison to the Australian domestic market has been undermined by
inconsistent quality, lack of consistent supply, poor presentation and lack of product
knowledge by marketers and at point of sale. Supplies are erratic and trade
confidence in year-round supply quality is low. Consumers also lack knowledge of
product attributes and usage. Potential local consumers of Australian venison appear
to lack confidence in the industry‟s ability to supply quality venison, particularly in
the food service industry, where much of the venison sold is imported from New
Zealand (Tuckwell & Tume 2000).
For deer farming to remain viable, activities such as production, processing and
marketing must become larger scale and more efficient to compete with other red
meat options in a competitive market (AACMI 1994). Venison prices to farmers
have fluctuated in recent years and more stable, stronger markets need to be
established. However, the price of venison per kilogram to the consumer in domestic
markets seems not to have been affected by the downturn in returns to producers
(Tuckwell and Tume 2000).
The cost of venison is positioned at the top end of the meat, fish and poultry market.
Venison is still seen as the meat of kings and is positioned as a traditional and luxury
meat. Local consumers may be aware of the product but are reluctant to try it or
Chapter Two
20
cannot source it. Venison has potential to give consumers greater variety in healthy
red meat consumption (Tuckwell and Tume 2000).
The domestic market for venison is small but Australian production remains
inadequate to meet current demand. The shortfall in supply is made up with New
Zealand imports. The main outlets are high-class restaurants, specialty butchers,
game meat stores and gourmet food stores. Constraints to increasing the domestic
market appear to be a lack of knowledge about the product, and how to prepare it.
Markets also prefer fresh to frozen product (Tuckwell and Tume 2000).
Development of the domestic market is critical to the long-term viability of the
Australian deer industry (RIRDC 2007).
In 1994, the Venison market development plan (RIRDC 1994) identified that the
Australian product, compared with New Zealand, was not performing in either
quality or consistency, with few exceptions. The recommendation was for industry to
improve both the quality and consistency of product or carry the consequences
(RIRDC 1994). In May 1998, on farm quality assurance programs commenced and
some farmers began the road to accreditation. The emphasis of the program was on
management of animal health and welfare issues resulting in high quality,
uncontaminated products for human consumption (Tuckwell 1999). These later
evolved into the venison quality assurance program (Tuckwell 2001b) and deer
quality assurance management and analysis (deer QAMA), which provided access to
both written manuals and computer databases to aid producers and processors in
establishing quality assurance systems (Tuckwell 2003a). It is recognised that quality
assurance accreditation is a minimum standard for access to international markets,
rather than simply an opportunity to gain price premiums over non-quality assured
products. As a result of bovine spongiform encephalopathy (BSE), foot and mouth
disease (FMD) and chronic wasting disease (CWD) outbreaks in European and North
American industries, a legacy of consumer concerns regarding the safety of red meat
(Tuckwell 2003a) and quality assurance can put Australian venison in an enviable
position in these markets. Apart from the few producers who have embraced this
program, little seems to have been achieved towards improving quality of venison
supply. AUS-MEAT specifications for all cuts of meat are also an important step in
improving market performance. Overall improvement in product quality and
Chapter Two
21
consistency demanded by consumers can only be achieved by vendors attending to
quality at all stages from livestock procurement to product marketing (RIRDC 2007).
World trade in venison is believed to be about 11,000 tonnes per annum
(Daszkiewicz 2009) with West Germany being the dominant importer of fresh and
frozen product. Swedish people consume on average 2.5 kg of venison annually per
capita, predominately reindeer meat; New Zealand people also consume 2.5 kg
annually, predominately red deer venison, Austrians 0.6kg, predominately fallow
deer venison and the Swiss, 0.5 kg. Germans consume, on average, 0.4 kg per person
per year, French 125g, Spanish 50g, British 40g and Australians 20g (Daszkiewicz et
al 2009; Tuckwell & Tume 2000). As illustrated here, very little venison is consumed
in the Australian market, with the majority of consumption occurring at high-end
food service establishments (McRae et al 2006). Domestic utilisation of Australian
venison was 108.7 tonnes (carcass weight), compared to beef at 763,000 tonnes,
lamb at 208,000 tonnes and mutton at 62,500 tonnes (McRae et al 2006). Despite the
high price of venison, this meat is valued internationally because of its nutrient
composition and fine textural qualities, but remains a traditional market with
consumption higher in locations where venison has been consumed historically for
hundreds of years (Daszkiewicz et al 2009).
Venison processors are attempting to expand their market presence in the United
Kingdom, though lack of supply, insufficient numbers of local producers and falling
New Zealand imports is hampering expansion. There has been a rise in the popularity
of venison in the UK following successful introduction of the product into retail
outlets, and raising consumer awareness of venison as a healthy meat. Sales of
venison have risen from £32 million in 2006 to £43 million in 2010, an increase of
over 34% (Dawson 2011). This is in part attributed to the release of recent research
results linking traditional red meats with cancer and suggesting venison as a healthy
alternative (Polak et al 2008). Due to the shortage of farmed deer venison, the UK is
attempting to satisfy markets with hunted, wild product (Dawson 2011).
The New Zealand industry matured with the development and launch of the
Cervena™ program. Cervena™ venison is distinguished from other venison on the
market by the trademarked assurance that the meat has been naturally produced and
Chapter Two
22
processed in accredited facilities (DINZ 2011).The program relies on industry agreed
quality assurance standards in transport and farm accreditation. The emphasis is on
young animals under three years of age that are free ranging on quality farms varying
in size from 200 to over 2000 acres, grazing on pasture-based systems with no added
hormones or steroids (DINZ 2011). There are also foci on processing, packaging and
freight forwarding as well as point of sale assurances backed by ISO 9002
certification with emphasis on safety and product specification. It is targeted at the
top-end restaurant trade, both domestically and internationally, and has resulted in
good growth for New Zealand venison exports (Anon 2005). Cervena™ venison
claims to be mild yet distinctive in flavour, tender, versatile and available all year
round (DINZ 2011).
The market requirements for an increasing supply of chilled product places demand
on New Zealand farmers to provide 55-65 kg carcasses from red deer. Farmers have
invested in correct genotype and hybrids of wapiti to achieve specifications in
minimum time (Pearse et al 1994; Stewart 2011). The supply of animals has shifted
from post-pubertal two year old animals to pre-pubertal one year old animals, with a
need for animals to achieve slaughter weights earlier. Peak venison schedule
payments to producers is for 8-12 month old animals, principally stags, from August
to November, with live weights ≥ 93 kg in order to achieve 50-65 kg carcass weights.
An optimal minimum carcass weight of 55 kg (Pearse and Fung 2008) has been
established to enable supply to seasonal game markets in Europe (Asher et al 2011).
This has led the NZ deer industry to develop the New Zealand Deer Industry
Productivity Strategy 2009-2014 and to invest money in genetic research to enhance
farm productivity (Quinn-Walsh et al 2010). The aim of this strategy is to increase
carcass weights and introduce a carcass yield module in the performance recording
database DEERSelect (Ward et al 2010). The DEERSelect program determines
breeding values (BV) for terminal and maternal sires, with emphasis on BV for
carcass traits such as growth, yield, eye muscle area and a range of other venison
quality attributes (Bell 2011). Breeding traits of interest for venison production
include weight at weaning, at one year of age, and mature breeding hind weight.
Once quantified in terms of venison quality, they may provide an opportunity for
improved carcass traits to form part of the payment system (Chardon 2009). An
important addition to the productivity strategy is the current Venison Supply Systems
Chapter Two
23
research program, with the specific aim of ensuring that any gains made through
productivity research are not made at the expense of meat quality (Wiklund 2009).
The NZ deer industry dominates the world market for venison with over 400,000
deer slaughtered in 1998, and product directed mainly to Europe and the USA. This
left the Muslim market open to Australia, as halal slaughter practices were not
available in New Zealand (Horsley 2004). In 2005, the NZ deer industry earned
$NZ263 million in export revenue derived from the slaughter of 762,427 deer; with
27,319 tonnes of venison were exported with a value of $NZ213 million, along with
780 tonnes of velvet antler (RIRDC 2007). In 2006, NZ exported 28,000 tonnes of
venison from 770,000 deer slaughtered (O‟Connor 2006). In 2008 they exported
21,800 tonnes with a value of $288 million; in 2009 that figure was 16,900 tonnes
with a value of $293 million. There was a decline in export volume in 2010 to 15,000
tonnes with value of $209 million, which reflected a drop in deer numbers. The total
number of animals slaughtered for 2010/2011 was 394,000 with 16,200 tonnes of
venison exported, at a value of $223 million for both the traditional European game
season and off season, with commodity prices increasing (DINZ 2011). The forecast
for the New Zealand deer industry is for a continued rise in production and exports
(MAF 2011). For the past three years the price paid to producers of New Zealand
venison has been stable and historically high at $NZ 8.03 per kilogram (dressed
weight) (Moffat 2011).
In 1996 it was estimated that 85% of Australian venison was exported to Europe
(50%), with the remainder to the USA and Asia. Prior to 1996, over 85% went to the
Muslim market in Asia (Falepau 1999). By 2006, venison exported from Australia
was estimated at over 90% of production and went predominately to the EU
(particularly Germany), and South-East Asia. Australia has imported in excess of
1000 tonnes per annum of New Zealand venison for domestic consumption
(O‟Connor 2006; RIRDC 2007) but in 2008, only 15 tonnes was reported (Zemke-
Smith 2009).
In the financial year 1999/2000, Australia processed 60,165 animals to produce
1,928 tonnes of venison (Tuckwell 2007). In 2000/2001 in Australia, 45,757 deer
were slaughtered to produce 1,680 tonnes of venison (RIRDC 2007). Of these,
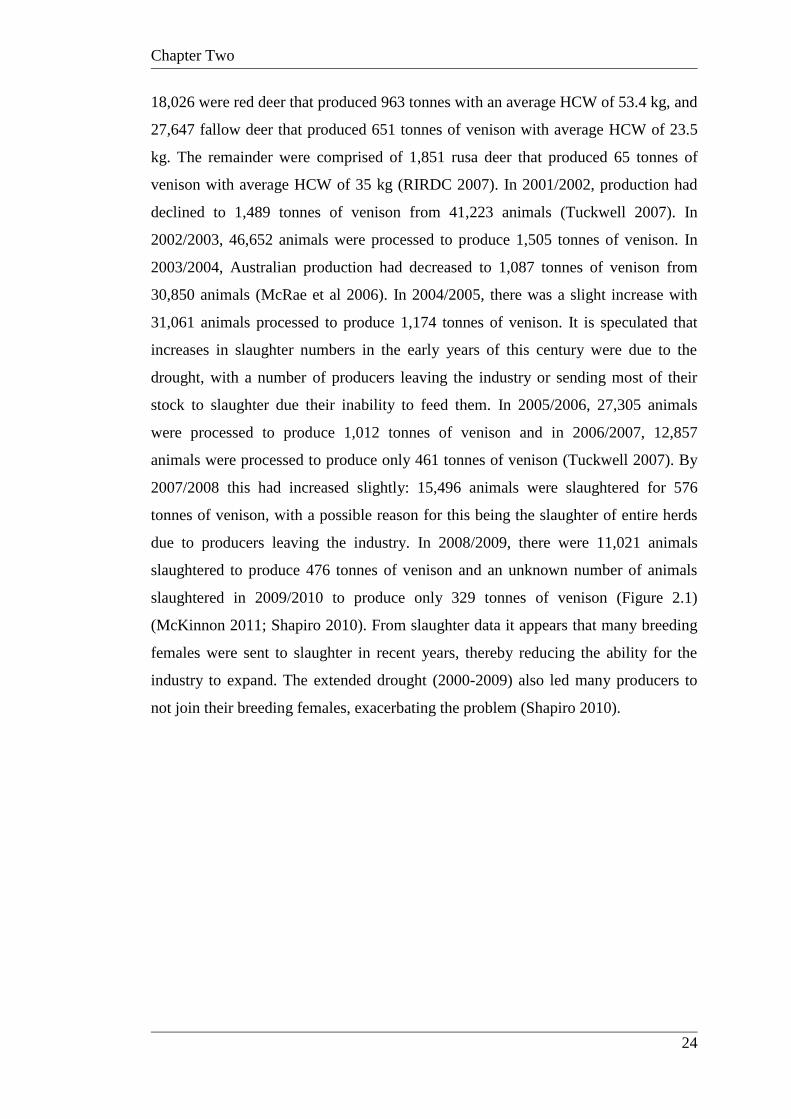
Chapter Two
24
18,026 were red deer that produced 963 tonnes with an average HCW of 53.4 kg, and
27,647 fallow deer that produced 651 tonnes of venison with average HCW of 23.5
kg. The remainder were comprised of 1,851 rusa deer that produced 65 tonnes of
venison with average HCW of 35 kg (RIRDC 2007). In 2001/2002, production had
declined to 1,489 tonnes of venison from 41,223 animals (Tuckwell 2007). In
2002/2003, 46,652 animals were processed to produce 1,505 tonnes of venison. In
2003/2004, Australian production had decreased to 1,087 tonnes of venison from
30,850 animals (McRae et al 2006). In 2004/2005, there was a slight increase with
31,061 animals processed to produce 1,174 tonnes of venison. It is speculated that
increases in slaughter numbers in the early years of this century were due to the
drought, with a number of producers leaving the industry or sending most of their
stock to slaughter due their inability to feed them. In 2005/2006, 27,305 animals
were processed to produce 1,012 tonnes of venison and in 2006/2007, 12,857
animals were processed to produce only 461 tonnes of venison (Tuckwell 2007). By
2007/2008 this had increased slightly: 15,496 animals were slaughtered for 576
tonnes of venison, with a possible reason for this being the slaughter of entire herds
due to producers leaving the industry. In 2008/2009, there were 11,021 animals
slaughtered to produce 476 tonnes of venison and an unknown number of animals
slaughtered in 2009/2010 to produce only 329 tonnes of venison (Figure 2.1)
(McKinnon 2011; Shapiro 2010). From slaughter data it appears that many breeding
females were sent to slaughter in recent years, thereby reducing the ability for the
industry to expand. The extended drought (2000-2009) also led many producers to
not join their breeding females, exacerbating the problem (Shapiro 2010).
Chapter Two
25
Figure 2.1 : Australian deer processed and venison produced (deer numbers estimated
for 2009/2010)
During the peak industry period of 1999 to 2001 venison carcass prices paid to
producers, averaged $4.80 per kg for fallow deer and $5.60 per kg for red deer
(Tuckwell 2003a). Prices dropped soon after due to the sudden availability of
relatively cheap, high quality beef throughout Europe (Tuckwell 2003a). In
2006/2007, the prices per kg for venison were an average of $2.70 per kg HCW with
a premium of $4 per kg paid for prime animals within optimal carcass weight ranges
(RIRDC 2007). The current price per kilogram (2011) for venison has increased
slightly with premium red deer carcasses attracting $4.80 to $5.00 per kg HCW and
$4.50 per kg HCW for premium weight fallow deer of HCW over 20 kg (Hansen
2011). Animals not reaching premium schedules as a result of advancing age or low
carcass weight are worth $3.00 to $4.00 per kg HCW. These changes are largely
attributable to newly instituted strategic alliances between processors and producers
(Hansen 2011). However, returns to producers are reduced as a result of high
transport costs due to the low number of export accredited abattoirs in Australia and
the distances required to truck animals to them for processing (Hansen 2011). The
gross value of production (GVP) of the Australian deer industry in 2006 was a
modest $5 million per annum (RIRDC 2007) compared with other red meat
industries: beef cattle at $7,436 million and sheep at $2,168 million (Fletcher et al
2009).
0
10000
20000
30000
40000
50000
60000
70000
Venison produced
(tonnes)
Deer nos. Processed
Chapter Two
26
In contrast, Australia produced 2.15 million tonnes of beef and veal with a gross
value of $7.4 billion, 435,000 tonnes of lamb and 258,000 tonnes of mutton in 2008,
with a gross value of sheep meat of $2.2 billion (Fletcher et al 2009). Australian
lamb production in 2010 was estimated at 412,000 tonnes, with slaughter stock
numbers of 8.6 million head from total stock numbers of around 68 million head on
22,858 farms. The saleyard price of lamb averaged around $4.70 per kg (dressed
weight). Total weight of lamb exported was estimated at 250 kilotonnes (Rees 2010).
Australian beef and veal production in 2010 was estimated at 2.1 million tonnes with
slaughter stock number of around 8.4 million head from total cattle stock numbers of
28.5 million on 49,757 farms. The weight of beef exported was estimated at 910
kilotonnes with an average saleyard price of $2.99 per kg (dressed weight) (Perry
2010). Red meat production and exports accounted for almost 22% of the total gross
value of Australian agricultural production in 2008 (Fletcher et al 2009).
2.1.6: Venison specifications
In 1995, AUS-MEAT instituted a common venison language in an attempt to
standardise and apply consistency to Australian product on the market. The
specifications document provided a common language and accurately described a
core range of cuts for the meat trade. The aim was to increase quality by providing
accepted product description and quality standards (AUS-MEAT 1995) (Plates 2.1.
and 2.2).
In 2001, RIRDC published a venison processing standards manual for marketers and
processors of Australian venison. The manual incorporated detail on best practice for
the supply chain from production to distribution as part of the Quality Management
Programme (RIRDC 2001). Selection of animals for processing specified that body
condition and animal age are critical factors influencing venison quality. The manual
provided a vague descriptor for producers of „minimum fat over the rump‟ and
referred readers to detailed BCS charts (Appendix 1 and 2), and specified the age of
supply of fallow deer bucks at two years immediately prior to the rut (RIRDC 2001).
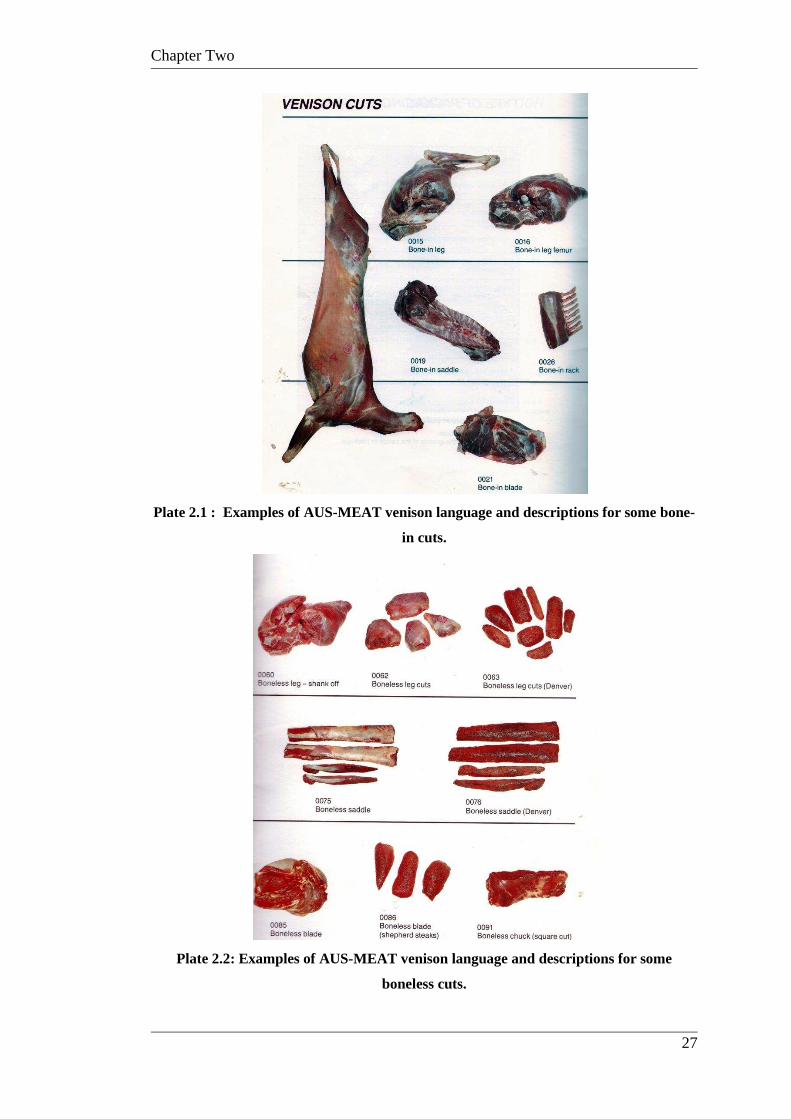
Chapter Two
27
Plate 2.1 : Examples of AUS-MEAT venison language and descriptions for some bone-
in cuts.
Plate 2.2: Examples of AUS-MEAT venison language and descriptions for some
boneless cuts.
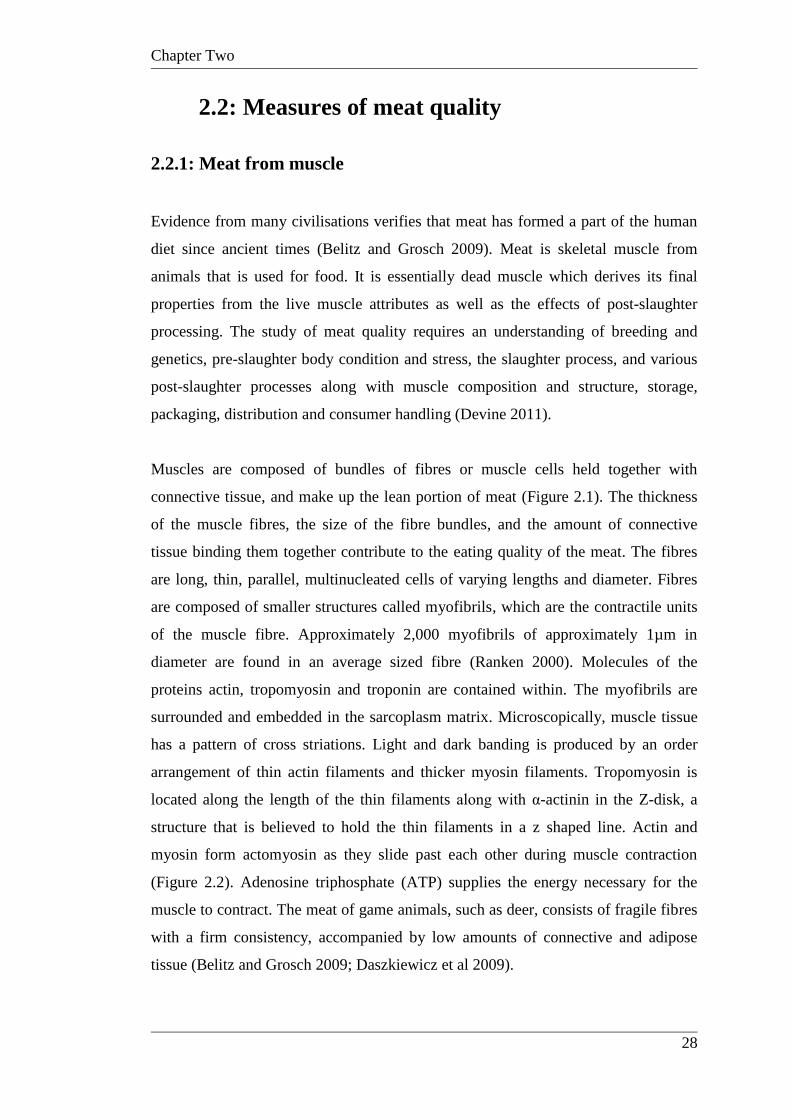
Chapter Two
28
2.2: Measures of meat quality
2.2.1: Meat from muscle
Evidence from many civilisations verifies that meat has formed a part of the human
diet since ancient times (Belitz and Grosch 2009). Meat is skeletal muscle from
animals that is used for food. It is essentially dead muscle which derives its final
properties from the live muscle attributes as well as the effects of post-slaughter
processing. The study of meat quality requires an understanding of breeding and
genetics, pre-slaughter body condition and stress, the slaughter process, and various
post-slaughter processes along with muscle composition and structure, storage,
packaging, distribution and consumer handling (Devine 2011).
Muscles are composed of bundles of fibres or muscle cells held together with
connective tissue, and make up the lean portion of meat (Figure 2.1). The thickness
of the muscle fibres, the size of the fibre bundles, and the amount of connective
tissue binding them together contribute to the eating quality of the meat. The fibres
are long, thin, parallel, multinucleated cells of varying lengths and diameter. Fibres
are composed of smaller structures called myofibrils, which are the contractile units
of the muscle fibre. Approximately 2,000 myofibrils of approximately 1µm in
diameter are found in an average sized fibre (Ranken 2000). Molecules of the
proteins actin, tropomyosin and troponin are contained within. The myofibrils are
surrounded and embedded in the sarcoplasm matrix. Microscopically, muscle tissue
has a pattern of cross striations. Light and dark banding is produced by an order
arrangement of thin actin filaments and thicker myosin filaments. Tropomyosin is
located along the length of the thin filaments along with α-actinin in the Z-disk, a
structure that is believed to hold the thin filaments in a z shaped line. Actin and
myosin form actomyosin as they slide past each other during muscle contraction
(Figure 2.2). Adenosine triphosphate (ATP) supplies the energy necessary for the
muscle to contract. The meat of game animals, such as deer, consists of fragile fibres
with a firm consistency, accompanied by low amounts of connective and adipose
tissue (Belitz and Grosch 2009; Daszkiewicz et al 2009).
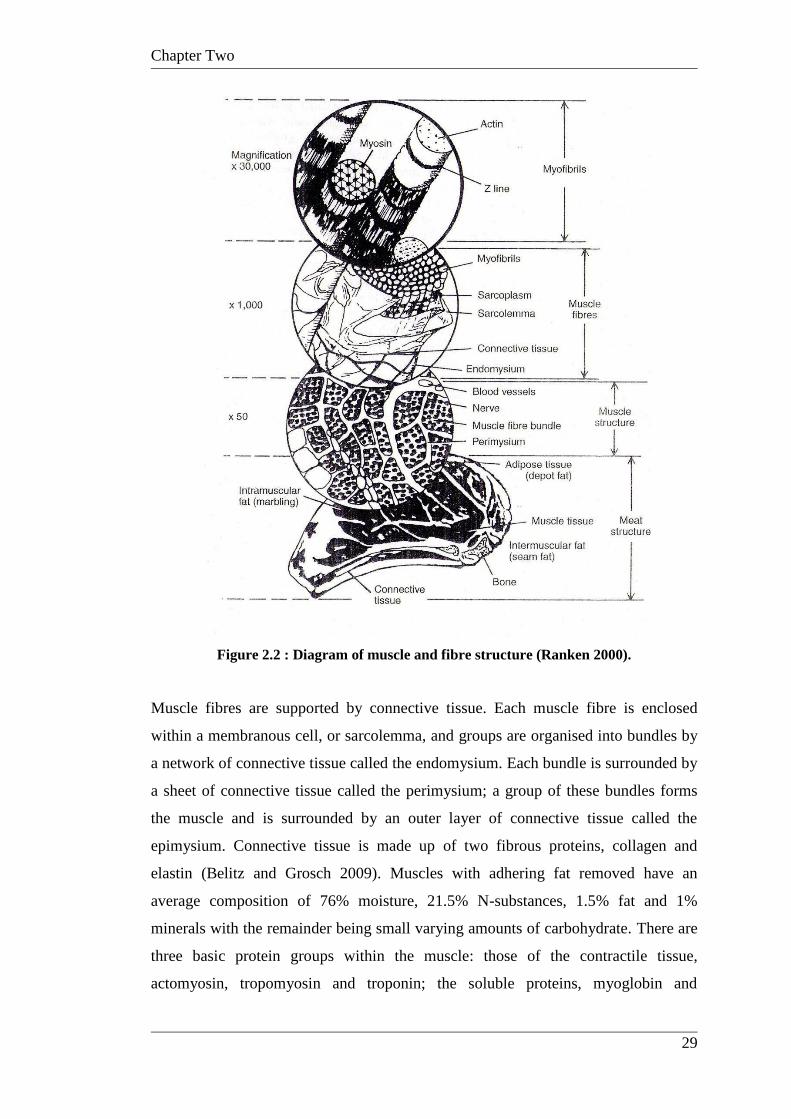
Chapter Two
29
Figure 2.2 : Diagram of muscle and fibre structure (Ranken 2000).
Muscle fibres are supported by connective tissue. Each muscle fibre is enclosed
within a membranous cell, or sarcolemma, and groups are organised into bundles by
a network of connective tissue called the endomysium. Each bundle is surrounded by
a sheet of connective tissue called the perimysium; a group of these bundles forms
the muscle and is surrounded by an outer layer of connective tissue called the
epimysium. Connective tissue is made up of two fibrous proteins, collagen and
elastin (Belitz and Grosch 2009). Muscles with adhering fat removed have an
average composition of 76% moisture, 21.5% N-substances, 1.5% fat and 1%
minerals with the remainder being small varying amounts of carbohydrate. There are
three basic protein groups within the muscle: those of the contractile tissue,
actomyosin, tropomyosin and troponin; the soluble proteins, myoglobin and
Chapter Two
30
enzymes; and the insoluble proteins, connective tissue and membrane proteins
(Belitz and Grosch 2009).
Many individual muscles are bound in clusters by membrane and silver skin and this
must be removed to improve the eating performance. Denvering is a process used to
remove the outer layer of connective tissue on a meat cut. The denvering of venison
upgrades the value of the cuts making venison better suited for consumer ready
portions (Wright 1993).
At slaughter, muscle begins the biochemical process of becoming meat. Once blood
circulation ceases, oxygen is no longer supplied to the muscle and anaerobic
conditions start to develop. Energy rich phosphates such as creatine phosphate, ATP
and adenosine diphosphate (ADP) are degraded. The sole remaining source of energy
stems from glycolysis, which is pH and temperature dependent and influenced by the
presence of glycogen stored in the muscle tissue (Ranken 2000). The pH of the
muscle decreases post-slaughter from the living tissue range of 7.0-7.2 to around 5.5.
With depletion of the oxygen supply to the tissues, lactic acid, which is produced
from glycogen, the energy store in the muscle, accumulates and results in the
decrease of muscle pH. Once the muscle is critically low in ATP, the myosin heads
begin to bind to the actin filaments, producing actomyosin causing a lack of
extensibility in the muscle (Pearce et al 2011). This process occurs a few hours post-
mortem and the carcass becomes rigid as rigor mortis sets in. This state of rigor , is
accompanied by depletion of ATP from the tissues and the formation of actomyosin
as the actin and myosin filaments slide past each other during contraction of the
muscle. Actomyosin is responsible for the tension in the muscles. As rigor proceeds,
the surface tissue of the muscle becomes wetter and drip, or muscle exudates,
increase (Belitz and Grosch 2009). Approximately two to three days after the
establishment of rigor, the muscles soften again, the fibres straighten, and breaks
appear in muscle fibres. The breaks, or autolysis, occur at the Z line where actin
filaments separate as a result of endogenous proteinases. This degradation of muscle
fibres will continue as the carcass or cut ages during proteolysis (Penfield and
Campbell 1990).
Chapter Two
31
Meat undergoes physical and chemical changes when heat is applied. At
approximately 38ºC, the proteins are denatured as the hydrogen and covalent bonds
that hold the native structure of the protein together begin to break, thus allowing
them to uncoil making them susceptible to coagulation. This coagulation is visible as
the meat becomes more opaque: the coagulated filaments block light rays and lose
moisture. As the length of the amino acid chain extends, their side groups become
more exposed and their reactivity sanctions the creation of new bonds, including
disulfide bonds. Water that was once trapped in the coiled structures and surrounding
areas is squeezed out of the tissue. Muscle fibres shrink in width at around 54ºC and
they shorten as temperatures rise. By the time temperatures have reached 77ºC the
cells deteriorate and break. The breaks are a manifestation of the chemical changes
occurring in the actin and myosin proteins and the physical weakening of cell
structures which allows the contents to escape. Individual proteins display different
levels of thermal sensitivity with denaturation of myosin near 55ºC, actins between
70ºC and 80ºC, whilst the sarcoplasmic proteins denature over a range of 40ºC to
90ºC (Charley and Weaver 1997). Meat in cooked form becomes more solid and is
generally tougher and less juicy than the raw sample. However, if meat continues to
cook above 60ºC, later tenderisation may result due to softening of the connective
tissue, particularly in the presence of moisture. The cooking method is one of the
most important factors in eating quality and should be used to optimise the
performance of meat (McGee 2004).
Meat has very weak aroma when raw but develops a completely different flavour and
aroma profile after cooking. The final flavour and aroma will vary as a result of pre-
slaughter factors such as type of feed consumed, body condition of animals and pre-
slaughter stress, as well as the time, temperature and method of cooking.
Development of flavour is believed to be a complex characteristic arising from the
presence of lactones, acyclic sulphur containing compounds and aromatic and non
aromatic heterocyclic compounds containing sulphur, nitrogen and oxygen.
Differences in the precursors of these compounds may vary between species, thereby
explaining the differing flavour profiles (Penfield and Campbell 1990). The Maillard
reaction is an integral part of the development of meat flavour, and is a form of
nonenzymatic browning. It results from a chemical reaction between an amino acid
and a reducing sugar, usually requiring heat (Ranken 2000)
Chapter Two
32
Meat quality refers to product characteristics which meet or exceed consumer
expectation. Meat quality includes attributes such as yield, safety, appearance,
palatability and image. Many quality attributes are affected on farm, pre-slaughter
and post-slaughter. Therefore quality assurance (QA) is required in a paddock-to-
plate approach. Quality improvement, in order to be successful, must be driven by
consumer expectations and perceptions as they are the ultimate product user. It has
been demonstrated that consumer preferences do not always equate with traditional
carcass grades (Issanchou 1996). Much previous research looks at quality from the
angle of yield and production traits. Considerable research on increasing yields has
been conducted but this is of least importance to the consumer. Eating quality and a
positive eating experience should be of primary concern to producers and exporters
of venison (Stevenson-Barry 2000b). Quality assurance begins on the farm, and
involves animal husbandry, breeding and genetics, animal nutrition, transport and
slaughter (McKendry 1993).
Production of meat that satisfies or exceeds consumer expectations with regard to
eating quality is central to the future of the deer industry. Eating quality for red meat
may be defined as consumer perception of meat that is tender or tough, juicy or dry,
flavoursome and free from taints (MTU 1999).
2.2.2: Factors affecting meat quality
The concept of meat quality is multifaceted and involves sensory perception,
nutritive value, hygiene, toxicology and technological factors (Oddy et al 2001). The
quality of meat is affected by both genetic and environmental factors. Genetic factors
are those associated with heredity, where individual genes influence the development
of a trait in the context of a particular environment. Environmental influences on
meat quality are those not attributable to genetics, such as factors associated with
animals on farm, pre-slaughter and post-slaughter processing (Warner et al 2010).
The final eating quality of meat is affected by both intrinsic and extrinsic factors. The
intrinsic factors include structural and compositional characteristics, which to a
certain extent are affected by on farm production but are less easily controlled and
Chapter Two
33
managed than extrinsic factors. Extrinsic factors prevail during animal production,
slaughter, processing and finally, preparation for consumption (Ferguson et al 2001;
Warner et al 2010).
There are a number of measurements commonly used by meat scientists for meat
description that can also indicate changes to meat quality for eating, cooking, storage
and processing purposes. For example, meat tenderness is determined from the
contribution of sarcomere length, amount and solubility of connective tissue, as well
as rate of proteolysis during ageing and levels of intramuscular fat (IMF) (Warner et
al 2010). It is well known, for instance, that muscle pH is associated with meat
tenderness, one of the most important consumer perception traits of meat, and pH
affects other important attributes like meat colour and water-holding properties
(Hood and Tarrant 1981). The colour of meat, fresh and after chilled or frozen
storage, is an important characteristic for marketing, as customer selection is often
associated with the appearance of the product to the exclusion of other characteristics
that are just as important but not readily discernible to the naked eye (Risvik 1994).
Water holding capacity is another characteristic of meat that is connected to
consumer perception of fresh, chilled or frozen/thawed meat, and is also an important
measurement for processors wanting to manufacture value added meat products and
smallgoods. The drip loss (purge) often found in trays or packaging when meat is
stored for various lengths of time can accelerate meat deterioration and can also
decrease the attractiveness of the product for consumers, whilst processors need this
information to incorporate into processing technologies for a range of meat products.
Some of the key measures of assessing meat quality will now be outlined, and are
examined in more detail in the following chapters.
2.2.2.1: Muscle pH
At time of death, muscle pH in ruminant species is around 7.0-7.2. This will decrease
to reach a value of approximately 5.5-5.6 (Pearce et al 2011). When the pH decline
ceases, it has reached ultimate pH (pHu) and which is usually measured around 24
hours post-mortem. Ultimate pH has a profound effect on meat quality: it is more
significant than the age of the animal and also impacts on shelf life, juiciness, texture
Chapter Two
34
and flavour (Pearce et al 2011). Rate of pH decline from around 7.0-7.2 at slaughter
in relation to muscle temperature is crucial to eating quality. Rate of decline is
variable and can be reached 1-48 hours post-mortem in beef (Thompson 2002).
Optimal tenderness is achieved in beef when the pH is less than 6.0 with a core body
temperature in the range of 10-20C (Thompson 2002). If temperature fall is rapid
and pH decline is slow, carcasses cold shorten and become extremely tough. If pH
fall is rapid and muscle temperature decline is slow, muscles heat shorten, which
makes meat slightly tougher and less juicy, and brings about colour changes and
excessive drip loss, accompanied by a lack of improvement with ageing. Enzymes
involved during ageing are denatured by low pH/high temp conditions (Thompson
2002). Therefore, if the muscle pH is greater than 6.0 at a core body or deep muscle
temperature of less than 12C (fast cooling), then the resultant meat will be
extremely tough and the carcass will have been classified as cold shortened. If
muscle pH is less than 5.9 at deep muscle temperatures greater than 30C (slow
cooling), then there will also be a loss of tenderness and juiciness, and the carcass
will have been classified as heat shortened. If pH fall is not as it should be, a number
of post-slaughter carcass management alterations can be made, such as using
electrical stimulation which accelerates the rate of pH decline in beef (Thompson
2002).
A study by Hannula and Puolanne (2004) determined that muscle pH needs to be at
or below 5.7 by the time the core body temperature reached 7ºC to achieve optimal
quality characteristics. Meat scientists agree that the rate of decline and pH at a
specified temperature affects meat tenderness, but have difficulty defining the exact
relationship (Shaw 2000).
Rate of pH decline is a function of carcass size and fat cover over the major primal
muscles (Stevenson-Barry 2000a). Abattoir conditions also affect pH, such as time
from stunning and exsanguination to the chiller, temperature of the slaughter floor
and the chilling environment (Mulley et al 2010). All electrical inputs have an effect.
Temperature and pH temperature decline begins on the slaughter floor and finishes in
the chiller when the carcass has reached its pHu. It is assessed by taking sequential
pH and temperature readings on a number of carcasses as they come off the floor and
Chapter Two
35
then at timed intervals until ultimate pH is achieved in the chiller. The time taken
determines the rate of pH decline (Stevenson-Barry 2000a).
Muscle pH is affected by pre-slaughter stresses caused by fasting, dehydration,
unfamiliar surroundings, transportation, human contact, social structure variation
through separation and mixing in lairage, sudden climatic changes, under
nourishment and over exercise (Ferguson et al 2001). These factors reduce muscle
energy (glycogen) stores. After death glycogen converts to lactic acid. Low glycogen
levels lead to production of less lactic acid than required to produce desirable pHu
levels. In well fed, non-stressed cattle and sheep, muscle glycogen levels range
between 1 and 2% of muscle weight (Ferguson et al 2001). When levels fall below
1%, less acid is produced post-mortem resulting in higher pHu. Healthy, well fed
cattle can afford to lose some glycogen (20-30%) without affecting pHu (MSA 2010).
When animals are stressed they are likely to be depleted of muscle glycogen stores. It
takes at least four to five days for glycogen levels in muscle to be restored once they
have been metabolised. Meat and Livestock Australia (MSA 2010) also recommends
that cattle with poor temperament or under extreme stress are not consigned. By not
mixing cattle from different mobs within two weeks of dispatch, it was reported
(MSA 2010) that pHu was not adversely affected. Loading without the use of goads
or electric prodders also reduced animal stress and resultant high pHu values (MSA
2010).
Time in lairage has an effect on pre-slaughter stresses (MSA 2010). A minimum of
four to six hours is recommended, with a longer period (24-48 hours) more desirable
for cattle that have travelled over 1000 km. Cattle to be assigned MSA grades must
be slaughtered within 24 hours of leaving the farm to be eligible. In North America
slaughtering off the truck is common, but distances travelled are usually small.
Recent studies (MSA 2010) indicate that this practice may lower weight losses and
improved product eating quality. Some MSA studies have shown that strategic
administration of electrolyte preparations reduces the incidence of dark cutting and
carcass shrinkage during chilling (MSA 2001). All ruminants rely on bacteria in the
rumen to convert carbohydrates to glucose and the process of rumination takes more
time to replenish lost glycogen stores. Feeding aids in replenishment and studies
Chapter Two
36
have shown that feeding cattle high energy concentrate feeds immediately prior to
slaughter may reduce the incidence of dark cutting or high pHu meat (MSA 2001).
Ultimate pH of longissimus dorsi at the quartering point of a carcass should be less
than or equal to 5.7 for optimal eating quality. The relationship between pHu and
tenderness tends to be curvilinear, peaking around 5.9-6.2 (most tough). Whilst the
threshold of 5.7 could be challenged for its stringency, this reference point ensures
the MSA guarantee of tenderness for beef (MSA 2010). Ultimate pH values over 5.7
in a study on fallow deer were sometimes associated with a tough product (Shaw
2000, Hutchison et al 2010).
The pHu affects colour, appearance, texture and shelf life of red meat and is therefore
commonly used in meat grading systems around the world. It also appears to affect
eating quality. Attributes such as tenderness, flavour, odour, juiciness and functional
properties such as water holding capacity and microbiological spoilage have been
shown to be affected in research conducted on beef, lamb and pork (Belitz and
Grolsch 2009). It appears that toughness increases as pHu increases up to a value of 6
and then decreases, however, studies on deer show that fallow deer and reindeer meat
are uniformly tender regardless of pHu (Barnier et al 1999; Sims et al 2004).
Research has shown that a characteristic of game meats, such as venison, is a high
concentration of lactic acid, a product of anaerobic glycolysis, leading to high acidity
(Daszkiewicz et al 2009). Red deer venison is reported to be similar to beef and
lamb, where pHu above 5.8 is cause for concern and usually reflected a stressful
event pre-slaughter which affected meat quality (Stevenson-Barry 2000a). Many
cases of pH above 6 and 7 were recorded in that study.
High pH is often found around areas of bruising. Cases can lead to rejection of meat
along the marketing chain (MSA 2010). Meat with pHu levels above 5.7 tend to be of
lower and more variable eating quality. Meat with high pHu is common where
animals have been exposed to relatively long periods of stress and is known as dark
cutting or DFD (dry, firm and dark). The meat looks purple rather than the preferred
bright red, has a coarse texture, higher water holding capacity (it loses a lot of
moisture during cooking), reduced shelf life due to microbial growths due to high pH
and moisture, and appears undercooked despite extensive cooking (Wiklund et al
Chapter Two
37
1995). Low pHu meat is more common after exposure to a short period of acute
stress just prior to slaughter and results in PSE (pale, soft, exudative) meat which
renders the meat unacceptable in terms of meat processing or consumption
(Stevenson-Barry 2000a). Acceptable pHu is 5.3-5.7 for guaranteed eating quality
(Stevenson-Barry 2000a). The frequency of DFD in studies on red deer was 1.5%,
fallow deer 1% (Pollard et al 1999, 2000) and reindeer 6% (Wiklund et al 1995). The
figure for reindeer is largely due to the traditional methods of lassoing animals prior
to slaughter and in some cases, long transport distances (Wiklund et al 1995).
It has been shown that tenderness can be improved in beef and lamb through the
process of ageing or proteolysis. Hanging carcasses or vacuum packaging cuts and
holding at specified temperatures over extended periods of time can enhance the
eating quality (Thompson 2002). Studies show that lamb in the intermediate range
pH of 5.8-6.2 can be successfully aged to improve tenderness, however it was not
possible with beef (still over 8 kg shear force after 45 days where samples over 5 kg
shear force are considered tough). Proteolysis or ageing experiments with red deer
venison of intermediate pHu held at 4°C behaved like lamb, but tenderness was still
not as good or consistent as ideal pHu samples (Stevenson-Barry 2000a) in this study.
As mentioned previously, a number of pre-slaughter parameters may affect ultimate
pH. Work done on body condition in red deer hinds suggests that BCS has an effect
on pHu. Some emaciated animals were culled due to poor reproductive performance
and low body condition, and all were found to have high pHu compared with those in
good condition (Stevenson-Barry 2000a). As body condition increased ultimate pH
decreased.
A study on red/wapiti and fallow deer processed at a commercial abattoir in NZ
(Stevenson-Barry 2000b) reported many carcasses with high pHu. In that study, many
fallow deer had high pHu which was attributed to unsettled behaviour and handling
difficulties compared with red deer slaughter. However, eating quality of fallow deer
venison was not as affected as red deer venison at similar pHu levels. The study also
compared sheep with deer carcasses and found more cases of high pHu in sheep than
in deer. In this particular study, however, the sheep had been washed, were subjected
Chapter Two
38
to yarding by dogs, and electric prods were used as stock control methods. These
pre-slaughter stressors may be implicated in a high meat pHu.
Recent studies have identified links between temperament and pHu. In the NZ study
(Stevenson-Barry 2000a), antagonistic behaviour was similar across sexes for both
red and fallow deer. Red deer displayed more antagonistic, and fallow more
unsettled, behaviour. Prior to stunning, red deer were more settled than fallow.
Temperament is reported to have an effect on pH and meat quality. Similar studies
on cattle have shown that more excitable temperament and shorter flight times out of
the crush are linked to higher pHu. Preliminary work on red deer in NZ suggested
that flighty/skittish animals have higher pHu. Selection based on temperament may
be deemed to be good practice from an animal handling and meat quality point of
view. Calm cattle also made higher average weight gains (Stevenson-Barry 2000b)
and in New Zealand, investigations into selection of red deer according to
temperament are ongoing (Archer et al 2009; Quinn-Walsh 2010).
2.2.2.2: Chilling rate
The relationship between onset of rigor and pH is recognised as a key determinant of
meat quality. Rigor that occurs too early during the post-mortem period, while pH is
high, will result in myofibrillar shortening, known as cold shortening, and meat will
toughen. Similarly, carcasses that cool too slowly will also exhibit myofibrillar
shortening and this is referred to as heat shortening. Light and lean carcasses, such as
young deer, which have between 50% and 80% less carcass fat than sheep and lamb
or cattle (Drew 1985; Fisher et al 1998) are more liable to cool quickly and therefore
cold shorten, while large, heavy and fatter beef carcasses have a lower rate of
temperature decline and are more likely to exhibit heat shortening (Ferguson et al
2001). It is therefore important to control the temperature at which rigor is achieved.
The most effective way of controlling the temperature is via the chilling regime. An
effective chiller design and control of the air flow and rate of temperature decline in
the carcass is an effective way of minimising myofibrillar shortening. Ideally, rigor
should be completed somewhere between 10˚C and 20˚C to minimise the degree of
myofibrillar shortening (Ferguson et al 2001).
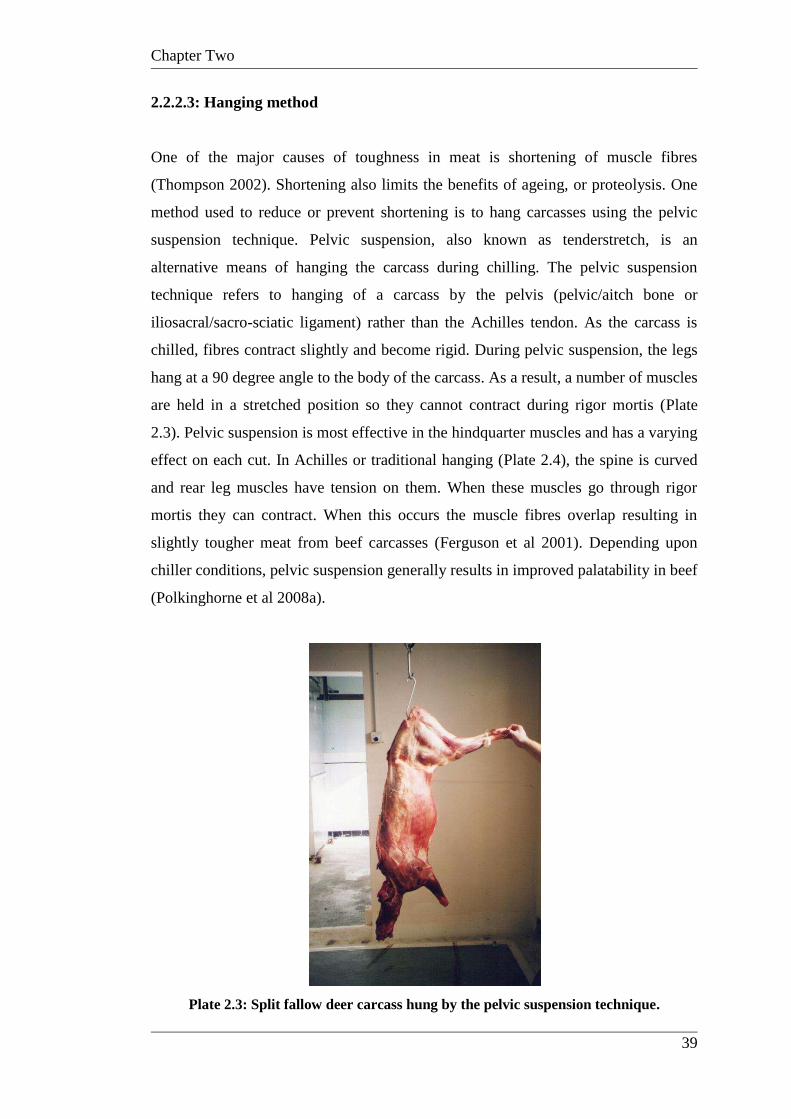
Chapter Two
39
2.2.2.3: Hanging method
One of the major causes of toughness in meat is shortening of muscle fibres
(Thompson 2002). Shortening also limits the benefits of ageing, or proteolysis. One
method used to reduce or prevent shortening is to hang carcasses using the pelvic
suspension technique. Pelvic suspension, also known as tenderstretch, is an
alternative means of hanging the carcass during chilling. The pelvic suspension
technique refers to hanging of a carcass by the pelvis (pelvic/aitch bone or
iliosacral/sacro-sciatic ligament) rather than the Achilles tendon. As the carcass is
chilled, fibres contract slightly and become rigid. During pelvic suspension, the legs
hang at a 90 degree angle to the body of the carcass. As a result, a number of muscles
are held in a stretched position so they cannot contract during rigor mortis (Plate
2.3). Pelvic suspension is most effective in the hindquarter muscles and has a varying
effect on each cut. In Achilles or traditional hanging (Plate 2.4), the spine is curved
and rear leg muscles have tension on them. When these muscles go through rigor
mortis they can contract. When this occurs the muscle fibres overlap resulting in
slightly tougher meat from beef carcasses (Ferguson et al 2001). Depending upon
chiller conditions, pelvic suspension generally results in improved palatability in beef
(Polkinghorne et al 2008a).
Plate 2.3: Split fallow deer carcass hung by the pelvic suspension technique.
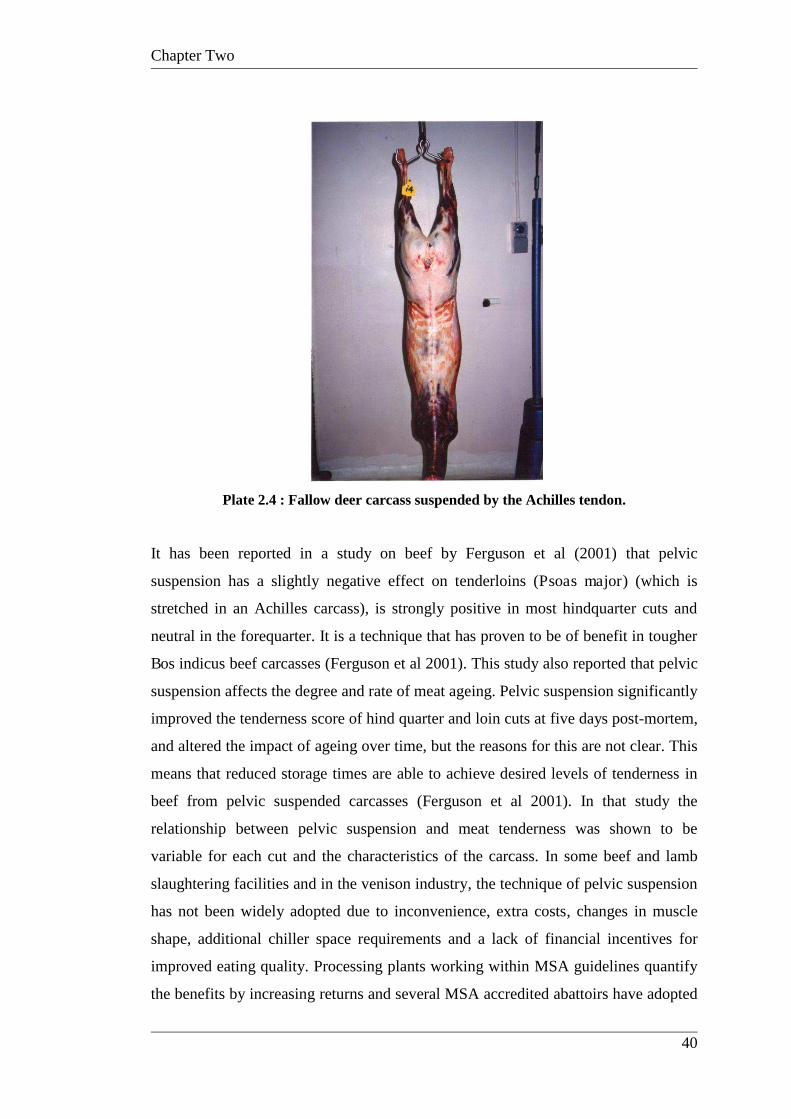
Chapter Two
40
Plate 2.4 : Fallow deer carcass suspended by the Achilles tendon.
It has been reported in a study on beef by Ferguson et al (2001) that pelvic
suspension has a slightly negative effect on tenderloins (Psoas major) (which is
stretched in an Achilles carcass), is strongly positive in most hindquarter cuts and
neutral in the forequarter. It is a technique that has proven to be of benefit in tougher
Bos indicus beef carcasses (Ferguson et al 2001). This study also reported that pelvic
suspension affects the degree and rate of meat ageing. Pelvic suspension significantly
improved the tenderness score of hind quarter and loin cuts at five days post-mortem,
and altered the impact of ageing over time, but the reasons for this are not clear. This
means that reduced storage times are able to achieve desired levels of tenderness in
beef from pelvic suspended carcasses (Ferguson et al 2001). In that study the
relationship between pelvic suspension and meat tenderness was shown to be
variable for each cut and the characteristics of the carcass. In some beef and lamb
slaughtering facilities and in the venison industry, the technique of pelvic suspension
has not been widely adopted due to inconvenience, extra costs, changes in muscle
shape, additional chiller space requirements and a lack of financial incentives for
improved eating quality. Processing plants working within MSA guidelines quantify
the benefits by increasing returns and several MSA accredited abattoirs have adopted
Chapter Two
41
the process (MSA 2010). There are some alternative methods that do not involve the
whole carcass, using boned meat cuts which are held in stretched form via packaging
(Hopkins 2011).
2.2.2.4: Muscle ageing
It is well recognised that tenderness is a highly valued consumer trait (Huff Lonergan
et al 2010) followed by flavour (Warner et al 2010). Ageing is a process used to
improve tenderness and flavour in meat and may involve techniques such as
extending carcass hanging time and long term storage of cuts in vacuum packs.
Ageing occurs as the muscle fibres break down slowly due to naturally occurring
proteolytic enzymes. During proteolysis the muscle fibres are weakened and meat
becomes more tender. Macroscopic appearance does not change as the change occurs
at a microscopic level with degradation of the Z disks and myofibril breakage (Figure
2.3) (Aberle et al 2001). There are three accepted endogenous proteinase systems
involved in proteolysis: the calcium dependent calpain system, lysosomal cathepsins
and proteosome, with the relative contribution of each causing considerable debate
(Ferguson et al 2001). Ageing is temperature and pH dependent and the effect of
ageing decreases over time, with most improvement in the first 21 days post-
slaughter. Higher temperatures result in more rapid proteolysis. The rate and extent
of glycolysis and proteolysis are the primary biochemical changes that determine
myofibrillar tenderness or toughness (Ferguson et al 2001; Warner et al 2010). Meat
can be aged in carcass form, on the bone-in primals (up to 14 days) or when vacuum
packed for long periods (up to 12 weeks). Over-aged meat develops off odours and
can give beef a liver taint. All MSA products have a minimum ageing time of five
days that is easily achieved by the butcher and packaged meat trades. Ageing meat
requires refrigerated storage which adds cost (MSA 2001).
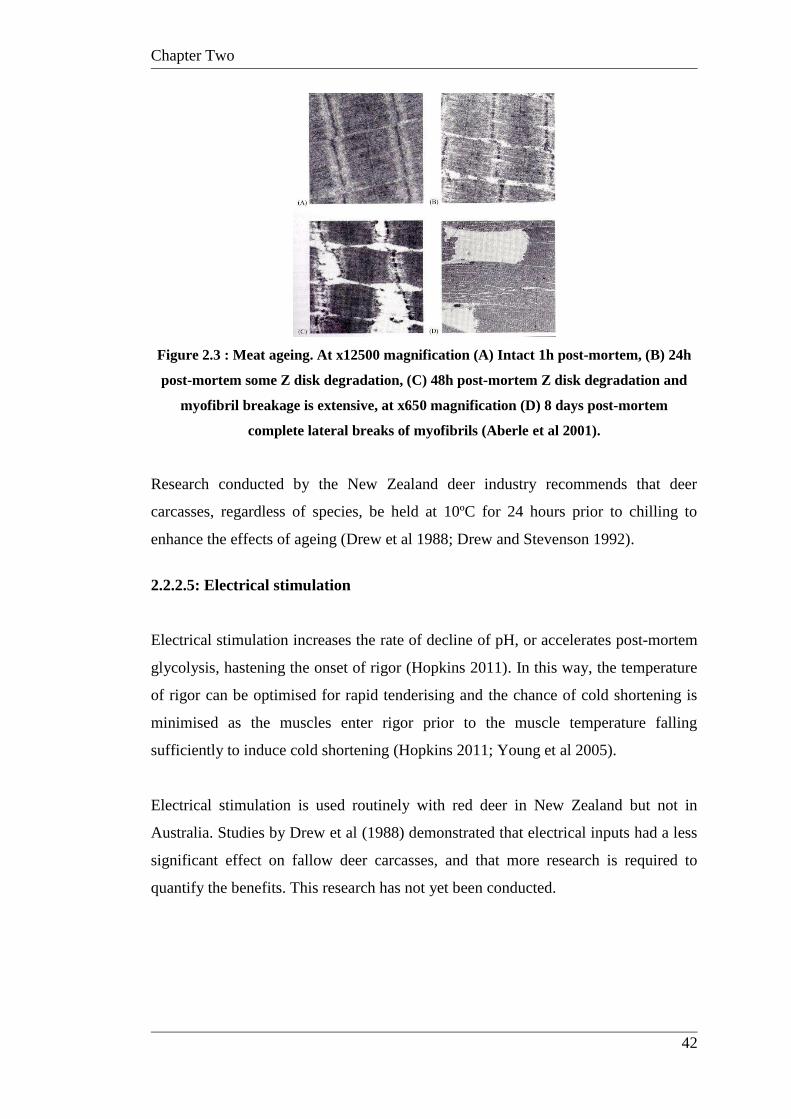
Chapter Two
42
Figure 2.3 : Meat ageing. At x12500 magnification (A) Intact 1h post-mortem, (B) 24h
post-mortem some Z disk degradation, (C) 48h post-mortem Z disk degradation and
myofibril breakage is extensive, at x650 magnification (D) 8 days post-mortem
complete lateral breaks of myofibrils (Aberle et al 2001).
Research conducted by the New Zealand deer industry recommends that deer
carcasses, regardless of species, be held at 10ºC for 24 hours prior to chilling to
enhance the effects of ageing (Drew et al 1988; Drew and Stevenson 1992).
2.2.2.5: Electrical stimulation
Electrical stimulation increases the rate of decline of pH, or accelerates post-mortem
glycolysis, hastening the onset of rigor (Hopkins 2011). In this way, the temperature
of rigor can be optimised for rapid tenderising and the chance of cold shortening is
minimised as the muscles enter rigor prior to the muscle temperature falling
sufficiently to induce cold shortening (Hopkins 2011; Young et al 2005).
Electrical stimulation is used routinely with red deer in New Zealand but not in
Australia. Studies by Drew et al (1988) demonstrated that electrical inputs had a less
significant effect on fallow deer carcasses, and that more research is required to
quantify the benefits. This research has not yet been conducted.
Chapter Two
43
2.2.2.6: Ossification
Skeletal ossification may also be measured as an effect on meat eating quality. It
measures the physiological maturity of the carcass. As an animal matures, cartilage
present around bones gradually fills with blood and calcifies into bone. Although
ossification largely occurs in association with the animal‟s chronological age, it can
also be affected by nutrition and development. It is measured visually during chiller
assessment by the grader. Eating quality declines as ossification increases (MSA
2010). MSA relates carcass weight to ossification, essentially a weight for age
measure. Cuts from carcasses at the same weight with lower ossification are graded
higher. It has been reported that cattle fed poor diets are likely to have higher
ossification. Cattle with fast growth rates will reach slaughter weight at a younger
age and reduced ossification (MSA 2001). In deer, faster growth rates resulted in
greater consumer acceptance of flavour in venison (Wiklund et al 2008).
2.2.2.7: Texture
Texture is a complex descriptor which incorporates the tenderness of meat. It also
incorporates the sensory parameters of chewiness, juiciness, softness and the muscle
fibre and connective tissue components of tenderness. Tenderness involves the
interaction of water holding capacity, muscle fibre proteins and their ultrastructures,
connective tissue proteins and fat content (Penfield and Campbell 1990). Tenderness
is a function of a number of parameters in the production and processing systems
through to the preparation method used by the consumer to cook meat (Thompson
2002).
Pre-slaughter parameters such as animal species, age, activity and ante-mortem stress
along with post-slaughter processes, including development of rigor, hanging
method, ageing, chilling and electrical stimulation have all been shown to affect meat
texture (Tornberg 1996).
Muscle fibre diameter is also related to the tenderness of cooked meat, along with the
end point temperature. Muscle fibres with small diameters result in more tender
meat. Higher end point temperatures will result in less tender meat as the network
Chapter Two
44
structure of proteins is tightened. Sarcomere length also affects tenderness, with
shorter sarcomeres being associated with toughness. Muscles with large amounts of
connective tissue are less tender (Warner et al 2010). Muscles that are in constant use
contain more collagen than less frequently used muscles. The amount of collagen
does not increase with animal age, however, the number and strength of the bonds
between peptide chains does increase, decreasing the amount of collagen that can be
solubilised when cooking (Penfield and Campbell 1990; Warner et al 2010).
The amount, distribution and composition of the intramuscular connective tissue
varies within muscles of the carcass and with the age of the animal slaughtered. It
has long been implicated in the toughness of meat. Cooking increases the strength of
the connective tissue in the internal temperature range of 20˚C to 50˚C, and it
decreases in strength with higher internal temperatures and longer cooking times,
particularly in the presence of moisture which hydrolyses the collagen component of
the connective tissue to gelatine. Cross linking of collagen in older animals is
believed to result in tougher meat, however, definitive links have not been
established. Amounts and composition of connective tissue may be manipulated by
animal nutrition and exercise, and affect the resultant meat texture (Purslow 2005).
2.2.2.8: Water holding capacity and drip loss
Water holding capacity is an important determinant of meat quality. It is integrally
involved in meat appearance prior to cooking, juiciness and sensory attributes
associated with mastication (Lawrie and Ledward 2006). A large component of
muscle is water. Typically meat is approximately 75% water by weight, and a small
proportion of this water, approximately 5%, is bound very closely to muscle proteins
via hydrogen and hydrophobic bonds (Huff-Lonergan and Lonergan 2005). Most of
the remaining free water is located within three dimensional spaces in the muscle
fibres, held by capillary forces between the thick and thin filaments, with a small
percentage located within connective tissue and the sarcoplasm (Huff-Lonergan and
Lonergan 2005). Water is held either within the myofibrils, or between them and the
sarcolemma between muscle cells and muscle bundles (Huff-Lonergan and Lonergan
2005).
Chapter Two
45
The extent of water holding by the protein network depends upon the amount of
cross linking among the peptide chains (Belitz and Grolsch 2009) and a number of
factors relating to the tissue itself and how it is handled post-slaughter (Huff-
Lonergan and Lonergan 2005). When the structures are disrupted the ability of the
meat to hold water is compromised. Proteolysis, changes in pH, cutting, freezing and
heating will all damage the cell walls and reduce water holding capacity (Penfield
and Campbell 1990). One of the many benefits of ageing of meat has been
improvement of water holding capacity, which is also enhanced by higher levels of
IMF (Lawrie and Ledward 2006). Issues with unsatisfactory water holding capacity
costs the meat industry millions of dollars annually. Research indicates that the rate
and extent of pH decline, proteolysis and protein oxidation are key parameters
controlling the ability of meat to retain moisture, with studies suggesting that
degradation of key cytoskeletal proteins by calpain proteinases also plays a role.
Rapid pH decline and/or low ultimate pH are implicated in low water holding
capacity and high purge losses due to protein denaturation. (Huff-Lonergan and
Lonergan 2005). The accelerated pH decline and/or resultant low ultimate pH causes
the myosin heads to denature and shrink, along with myofibrillar lateral shrinkage.
Denatured myosin loses the ability to retain water resulting in decreased water
holding capacity, and in the case of low ultimate pH: pale, soft, exudative meat
(PSE). This was previously a frequent condition in pig carcasses due to the high
prevalence of the Halothane gene, which was implicated in PSE cases (Pearce et al
2011). It has also been identified in grain-fed beef carcasses due to slower cooling
rates and rapid pH decline (Warner et al 2009). This is unlikely to be an issue for
lighter, faster cooling, deer carcasses (Drew 1985).
A large percentage of Australian venison is exported frozen, particularly to German
markets (Tuckwell 2007). One of the issues with freezing meat is the amount of
exudate that is expelled upon thawing. When muscles are frozen, water held within
the cells is squeezed out providing a reservoir of fluid to exude upon thawing
(Lawrie and Ledward 2006). Cellular damage is also possible, with the extent
dependent upon the quality and speed at which the muscle passes from -1ºC to -7ºC,
or freezing time. Faster freezing times result in less cellular damage and less
exudate upon thawing. This factor interacts with post-mortem ageing treatment and
thawing conditions (Anon and Calvelo 1980).
Chapter Two
46
2.2.2.9: Meat colour
The colour of muscle tissue is normally a purple/red hue due to the iron rich pigment,
myoglobin. Myoglobin is a water soluble protein that stores oxygen for the aerobic
metabolism in the muscle. It consists of a protein component and a non-protein
porphyrin ring with a central iron atom. The iron atom is an important determinant of
meat colour. Haemoglobin is found in the blood and therefore also contributes to the
colour of meat. Both of these conjugated protein pigments combine with oxygen to
assist metabolic processes, particularly in the live tissue. Haemoglobin is responsible
for oxygen transportation in the bloodstream, while myoglobin holds oxygen in the
tissue (Aberle et al 2001).
The amount of myoglobin in the muscle increases as the animal ages, therefore meat
from older animals is a darker red than young animals. Amounts of myoglobin also
vary with animal species and individual muscles within the same animal. Because
muscles vary greatly in their activity, their oxygen demand varies. As a consequence,
differing myoglobin concentrations are found in various muscles. Venison has a
characteristic dark red colour due to increased myoglobin in the muscle tissue
(Penfield and Campbell 1990), partially due to myoglobin induction as a result of
physical activity and a relatively high proportion and frequency of red muscle fibres,
(Aberle et al 2001) and high levels of iron (Drew and Seman 1987; Dahlan 2009).
This characteristic dark red colour can be off-putting to consumers who are
accustomed to the brighter, cherry red of beef or lamb. The colour also seems to
oxidise more rapidly than that of beef and lamb (Drew and Stevenson 1992; Wright
1993).
In living muscle tissue, purple/red myoglobin exists in balance with its bright red
oxygenated form, oxymyoglobin. After death the oxygen is utilised rapidly and meat
colour is reduced to purplish red. The cut surface of the meat quickly oxidizes and
exhibits the typical bright red hue of oxymyoglobin. Eventually a brownish colour
will form due to oxidation of the iron from a ferrous to ferric state, known as
metmyoglobin (MTU 2006a).
Chapter Two
47
The ultimate pH of meat affects meat colour. Meat that is high in pH takes on a
characteristic dark red colour and is referred to as DFD (dry, firm and dark). The
colour will gradually darken through the pH range of 5.4 to 7.0. Beef with a pH over
6.0 is referred to as dark cutting, however, consumers may regard beef with a pH of
5.8 as dark. The dark colour of red meat in the high pH range is caused by less
oxymyoglobin formation on the low acid surface. There is a similar reduction of
myoglobin below the surface, giving a dark appearance as a result of lower surface
light reflection as well as light scattering (MTU 2006a).
Colour changes occur in meat as a result of the cooking process. Reactions and
physical changes contribute to the colour as the surface is dehydrated and denatured
with heat. During cooking, myoglobin remains essentially unchanged until
approximately 60ºC, upon which disruption to the structure occurs. The oxygen
binding ability of myoglobin is lost, plus the iron atom releases an electron which in
turn causes the formation of a new tan coloured compound called hemichrome. By
approximately 80ºC, enough hemichrome has amassed that red meats take on a
brown-grey appearance, no myoglobin or red centre is found in the meat and it is
considered „well done‟ (McGee 2004). Surface browning is caused by decomposition
of fats, carbohydrate and proteins. The most common of these reactions is carbonyl-
amine browning or the Maillard reaction (Penfield and Campbell 1990).
2.2.2.10: Intramuscular fat
Intramuscular fat cells, or adipose tissue, are located in spaces in the perimysium,
most frequently along small blood vessels. Characteristics of fatty tissue vary
between species and according to pre-slaughter treatments, specifically manipulation
of feed (Warner et al 2010). Fatty acid composition will differ in degree of saturation
and in chain length. Most are saturated and monounsaturated, and as degree of
saturation increases, hardness of fat increases. Animal tissue also contains small
quantities of phospholipids. Cholesterol is associated with phospholipids in the
membranes of some cells (Penfield and Campbell 1990; Warner et al 2010).
During cooking fat is released from the cells by heat and is dispersed. This dispersed
fat lubricates the muscle fibres and connective tissue resulting in perceived
Chapter Two
48
tenderness and juiciness (Penfield and Campbell 1990). Some intramuscular fat is
necessary for optimal palatability (Devine 2001; Hopkins et al 2006). It is believed
that IMF has a direct relationship with the sensory parameters of juiciness and
flavour, and an indirect relationship with meat tenderness (Warner et al 2010). There
remains ongoing debate as to the benefits of fat marbling in relation to eating quality,
and whether improvements in eating quality justify the costs of achieving extensive
marbling.
Marbling is the intramuscular fat which appears as fine flecks within the muscle.
Marbling is a visual score given to a piece of meat, whereas IMF is the chemically
measured fat content including membrane lipids, although the two terms are often
used interchangeably (Warner et al 2010). Marbling is the last fat to be deposited and
the first to be utilised by the animal as an energy source. To maximise marbling, the
animal must be on a high nutritional plane. Marbling has a very positive effect on
eating quality of beef and is evidence of well fed animals (Devine 2001). It tends to
improve tenderness and juiciness. It is, however, possible to ensure good eating
quality without marbling if other factors are well managed. The United States
Department of Agriculture (USDA) grading schemes use marbling as an assessable
component and have done for more than 50 years, as has the Japanese Meat Grading
Association (JMGA) for the past 10 years, with premiums paid to producers
according the marbling levels. US consumers accept the role of marbling in meat
quality, as do Japanese consumers. The system works well for these countries where
uniform production methods are in place and do not give rise to the variations seen in
Australia in relation to carcass weight, breed, age, fatness and finishing regime
(MTU 2005).
The MSA and AUS-MEAT schemes utilise a similar system of marbling score as
part of their meat quality grading programs. Australian consumers have been shown
to assign higher scores for tenderness, juiciness, flavour and overall liking where
IMF is up to 14-17%, but not beyond that. Generally marbling accounts for between
3% and 10% of variation in tenderness scoring of beef (Warner et al 2010). Whether
Australian consumers come to accept high levels of marbling to be equated with
increased meat quality remains to be seen. Deer and other game meat species are
unlikely to achieve marbling within the muscle due to their naturally low levels of
Chapter Two
49
body fat. The lack of visible marbling in sheep and lamb meat, fish, chicken, pork,
venison, kangaroo and other game meats is not seen as a disadvantage but rather as a
marketing advantage in an emerging health conscious society (Devine 2001).
2.2.3: Consumer perception
The key to success for any product is to supply what the consumer desires. The most
important aspect of meat assessment occurs with the final product user, the consumer
(Oddy et al 2001). Markets may differ somewhat and suppliers need to be flexible in
their approach to marketing to a variety of consumers. In countries of affluence,
consumers demand meat products of high quality 100% of the time (Warner et al
2010). In terms of red meat quality, tenderness is known to be of paramount
importance to consumers, along with flavour (Troy and Kerry 2010). The red meat
industry, including that of venison, needs to invest in a consumer focused agenda in
order to be sustainable and increase profitability (Troy and Kerry 2010).
The ultimate determination of the quality of meat lies with the consumer. Consumers
define meat quality according to sensory quality, food safety, nutritional value and
convenience. The consumer uses both intrinsic cues such as appearance (visible fat),
colour and presentation, and extrinsic cues such as price, quality mark, and country
of origin along with production and nutritional information (Troy and Kerry 2010).
Repeat purchasing is only possible where the consumer is satisfied with the resultant
eating experience (Egan et al 2001). A study by Russell et al (2005) determined that
meat eating quality (65-68%) and price (25-28%) dominate decisions by consumers
to repeat purchase the product.
Product testing conducted with consumers or trained panels provides valuable data
that is not obtained by one dimensional testing such as objective measures of
tenderness, colour and other meat quality parameters. Measures of juiciness, flavour
and overall acceptability are not adequately obtained without the use of sensory
evaluation techniques (Thompson 2002).
Chapter Two
50
Consumer perception of quality is also largely determined by their beliefs and
attitudes to the product, which are largely culturally based. Venison exhibits
leanness, with a colour darker than the major meats (beef and lamb), and high
nutritional value. These quality attributes are hampered by a lack of availability
(particularly of domestic product), high price per kilogram, lack of consistency in
quality, lack of consumer knowledge on how to prepare it, and cultural acceptance
(the so called „Bambi‟ syndrome) in Australia (Janes 1993). Venison lends itself well
to Asian style food preparation of high heat and fast cooking times, which adds to the
convenience desired by consumers. The kangaroo industry have successfully dealt
with similar constraints including lack of cultural acceptance (the „Skippy‟ syndrome
and its common use as pet meat) (Beaton et al 2001) and availability. Kangaroo meat
can now be purchased in major supermarket chains around the country. This is also
possible for the Australian venison industry once producers have more ready access
to slaughter facilities. Similarly, lessons can be learnt from the New Zealand venison
industry with the introduction of the Cervena™ brand and a successful export
industry. Ironically, the majority of venison available in Australia is imported from
New Zealand. Due to venison‟s intrinsic and extrinsic quality attributes, it fits well
with consumer trends towards lighter, healthier, environmentally friendly, quality
assured foods. Assurance of consistency in venison quality is essential in order to
place the product successfully in consumer markets. Assurance can be brought about
by successful implementation of pre- and post-slaughter parameters in order to
optimise quality (Piasentier et al 2005).
Australian consumers place a great deal of emphasis on the leanness of meat
purchased for consumption at home, and rate tenderness as the most important eating
quality attribute followed by flavour (Egan et al 2001). Venison fits this profile well.
Egan et al (2001) concluded that consumers are becoming more educated,
demanding and critical in relation to the quality of food, and the meat industry must
face these challenges.
Lack of tenderness appears to be an issue for venison, particularly for meat from
males after the rut or breeding season. For maximum confidence in the quality of the
venison supply in Australia, Shaw (2000) recommended the use of sensory
evaluation systems similar to those developed for the MSA beef grading system. A
Chapter Two
51
laboratory device can only indicate whether a muscle is tender or tough, whereas a
consumer can give a more holistic picture relating to juiciness, texture, flavour and
overall liking or acceptability for consumption.
2.2.4: Beef and sheep meat quality improvement schemes
Meat Standards Australia began as an industry program in 1996 following intensive
consumer research on declining beef consumption (Polkinghorne et al 2008a). In
1983, Australians were eating 50 kg of beef per capita, declining to 33 kg by 2000,
and now stands at 39.6 kg (Fletcher et al 2009). Strategies were developed in order to
supply a more consistent quality product and to accurately describe palatability
(Polkinghorne et al 2008a). It is a cooperative program which rewards best practice
across all industry sectors and utilises a total quality management approach to predict
palatability in beef (Thompson et al 2008). MSA utilises a paddock-to-plate
approach in an attempt to obtain optimal beef eating quality (Thompson 2002). An
eating quality standards (EQS) program was developed and researchers identified
and quantified factors that could improve quality and consistency in beef. The
program became known as Meat Standards Australia (MSA) and continued to evolve
under the direction of Meat and Livestock Australia (MLA) (Polkinghorne et al
2008a). The MSA grading system maintains a focus on guaranteed eating quality for
the consumer through the utilisation of a total systems or TQM (total quality
management) approach to the control of factors affecting meat quality right through
the production, processing, value adding and distribution sectors (Thompson 2002).
The MSA grading scheme identifies critical control points (CCPs) in the meat
production system at all levels from on farm to consumption, and implements
controls in order to predict final product quality. Large scale consumer testing was
undertaken that allowed the CCPs to be ranked in terms of their potential impact on
final eating quality (Thompson 2002).
MSA is a cuts based grading system, rather than the traditional carcass based
grading, implemented in order to guarantee beef quality in the domestic market and
thereby increase confidence in, and consumption of, red meat (Polkinghorne and
Thompson 2010). Traditionally, carcass based grading systems such as those used by
Chapter Two
52
AUS-MEAT, USDA and JMGA, include descriptors of conformation and fat cover
(EUROP), skeletal maturity, marbling, meat colour, rib eye area, fat colour and depth
over a base of dentition and sex description (Polkinghorne 2006; Smith et al 2008).
These traditional grading schemes attempt to sort carcasses, often using
M.Longissimus dorsi (LD) as an indicator muscle, according to predicted eating
quality, however, the variations between assigned grades accounted for little
variation in palatability results when placed with consumers (Smith, et al 2008;
Thompson and Polkinghorne 2008).
The MSA cuts based system assigns an individual grade to muscles from the same
carcass to reflect expected differences in eating quality (Smith et al 2008). This is a
dramatic change from the traditional system of classifying carcasses into groups of
like appearance (Polkinghorne et al 2008b). Meat graded using the MSA system has
assigned a palatability score via the implementation of a palatability assured critical
control point (PACCP) and is labelled for consumers in order to provide a guarantee
of eating quality at three levels in conjunction with a suitable cooking method
(Polkinghorne 2006, Thompson and Polkinghorne 2008). The aim is to allow the
consumer to purchase and prepare beef with confidence. MSA product has a
minimum three star standard. Three stars is tenderness guaranteed, four star is
premium tenderness and five star, supreme tenderness. These grades are given to 40
individual carcass muscles, cooked by up to six alternative methods, thereby giving
the potential for assigning 137 grades to any one carcass for each number of days
aged (Polkinghorne et al 2008b).
This revolutionary approach involved the use of extensive consumer tasting panels to
aid in the identification and quantification of the critical control points (CCPs)
included in the model for eating quality predictability. The measures of tenderness,
juiciness, flavour and overall acceptability were combined into a single meat quality
score, and along with a palatability measure, formed a composite meat quality
(MQ4) score (Thompson et al 2008). Also included were inputs from pre- and post-
slaughter parameters such as breed, sex, ultimate pH, fat score and hanging method
(Polkinghorne et al 2008b; Polkinghorne and Thompson 2010).The scores were
calculated from data obtained from 32,000 cuts analysed by 68,000 consumer
panellists, with the use of a statistical prediction model (Polkinghorne et al 2008b;
Chapter Two
53
Polkinghorne and Thompson 2010). The uniqueness of the approach is the
traceability throughout the chain from paddock to plate. MSA provides feedback on
eating quality to the processor and producer. Linking price along the production
chain rewards and encourages approaches that improve beef quality and ultimately
consumer acceptance (Thompson et al 2008).
Grading is established by calculating the effect of factors relating to eating quality.
These include an animal‟s breed, sex, age, growth history, processing and chiller
assessment data along with individual cut and muscle, days of ageing (5-30) and
cooking method. A large database has been established with consumer sensory
scores, and MSA grades are set from analysis of consumer test results. The MSA
score is a composite of tenderness, juiciness, flavour and overall acceptability (MSA
2010).
Graders collate information provided by the cattle supplier (via MSA vendor
declaration) with abattoir information and chiller assessment detail. A statistical
calculation is made which estimates the interactive effect of all factors on eating
quality (MLA 2000).
The prediction parameters used in the MSA model are summarised as follows:
Percentage of Bos indicus content as specified by the producer and confirmed
with measurement of hump height. Bos indicus cattle tend to produce tougher
beef than Bos taurus.
Animal sex and ossification score, which is used in conjunction with carcass
weight to estimate growth rate effects and age, if unknown.
Stress and management practices, such as flight speed, time off feed and
mixing of groups prior to slaughter.
Carcass hanging method, either Achilles tendon, pelvic suspension from the
ligament, pelvic suspension from the aitch bone or tender cut.
Marbling score and rib fat. Higher levels increase the palatability of the meat.
Ultimate pH. Improvements in eating quality occur as pH declines from the
threshold of 5.7.
Chapter Two
54
Ageing period. Muscle ageing from 5 to 21 days has been shown to increase
beef palatability.
Cooking method: dry heat methods such as grilling, roasting and stir frying
for low connective tissue cuts, and moist heat methods such as stewing,
casseroling and braising for higher connective tissue cuts (Thompson 2002;
Polkinghorne et al 2008a).
In summary, Australian beef is graded with the following procedure: body number
and feed lot number, carcass weight, sex, percentage of Bos indicus content as this
tropical cattle genotype tends to produce less tender meat (Devine 2001), hanging
method, (Achilles tendon or pelvic suspension), ossification score, marbling score,
rib fat, pH and temperature. Other factors which do not impact on eating quality may
be taken at customers‟ request, such as meat colour, eye muscle area and fat colour
(MLA 2000). The MSA system is capable of underpinning a system whereby beef
producers are paid for quality as well as yield, while the consumer benefits from a
system which can accurately describe the eating quality of the beef that they
purchase (Thompson and Polkinghorne 2008). Current price premiums are being
generated from an MSA quality assured beef product, with payments to producers
being greater for MSA graded beef (Polkinghorne et al 2008b; Polkinghorne and
Thompson 2010). The adoption of MSA grading by the beef industry has resulted in
substantial change and improved awareness of the impact of various facets of the
supply chain on beef eating quality (Polkinghorne et al 2008b). Payments based on
consumer satisfaction, or value-based trading, is a powerful initiator for positive
industry change, with producers being paid for supplying what the consumer
demands (Polkinghorne and Thompson 2010).
Early this century, the Australian sheep meat industry identified a need for
improvements in eating quality and developed a framework and system of
classification to reliably predict eating quality in lamb, hogget and mutton products
(Russell et al 2005). Like beef, lamb was suffering from a decline in consumption
within the domestic market from 14.9 kg per capita in 1988 to 10.9 kg per capita in
1998, and ten years later, the figure stood at 10.4 kg (Fletcher et al 2009). Lamb was
also suffering from a lack of consistency in quality, particularly relating to
Chapter Two
55
tenderness, within a market of increased consumer expectation of premium quality
and value for money (Russell et al 2005).
The sheep meat eating quality (SMEQ) system was developed for use by producers
and processors for improvement of quality parameters (Hopkins 2011). The major
objectives of the eating quality assurance scheme were to describe and guarantee
eating quality of lamb and sheep meat products to consumers. Achieving this
objective would enable continuous improvement of product quality through all meat
production sectors with feedback to industry participants, much as MSA had done for
beef (Russell et al 2005).
Like the Australian beef industry before it, the lamb and sheep meat industry
identified a number of CCPs that may influence consumer acceptability of sheep
meat (Russell et al 2005), from live sheep genetics through to cooked meat (Young et
al 2005). These largely independent CCPs translated into a TQM system to improve
eating quality and reduce variability (Young et al 2005). A set of consumer
evaluation trials resulted in the development of a consumer eating quality score
(CEQ 0=poor, 100=excellent) which then provided a basis for the allocation of one
of 3 eating quality (EQ 1=inferior, 2= good everyday, 3=excellent) grades (Pleasants
et al 2005).
The prediction parameters used in the sheep meat eating quality model are
summarised as follows:
Choice of sire in relation to growth rate and muscling.
Animal age, determined by teeth eruption and wear, which is vital for
classification as lamb, hogget or mutton.
Nutrition: animals to be consuming a minimum of 50g per head per day.
Minimising stress at muster and slaughter through reduction in temperature
variations, noise and use of dogs. Good lairage design and skilled animal
handling.
Chapter Two
56
Carcass hanging method, either Achilles tendon, pelvic suspension from the
ligament, pelvic suspension from the aitch bone or tender cut and/or electrical
stimulation inputs.
GR fat depths.
Ultimate pH. Improvements in eating quality occur as pH declines from the
threshold of 5.7 (Hopkins 2011).
Improvements were achieved in the sheep meat industry with this shift to a consumer
focus and improvements in genetics, farm management and marketing. The industry
has achieved improved carcass weights, with future research focusing on
improvements in supply chain efficiency, reduction in carcass fatness and increase of
lean muscle (Pethick et al 2006). The Australian sheep industry, particularly the lamb
meat sector, has moved to a consumer focus when considering aspects of production
and processing (Hopkins 2011).
Consumer focused quality systems have been implemented internationally with the
advent of the New Zealand Beef and Lamb Quality Mark and the Cervena™ venison
quality brand, and the Blueprint for Eating Quality in the United Kingdom, which
marks a shift in the industry‟s focus from the producer to the consumer (Devine
2001). These systems are addressing the issue of variability in quality, particularly
tenderness, and developing „pathway‟ systems to ensure consumers can get branded
guaranteed tenderness. The Australian deer industry is currently investigating the
branding and quality marking of venison (McRae 2006). Recent research indicates
that consumers are willing to pay a premium for better eating quality (Polkinghorne
and Thompson 2010).
With eating quality grading standards in place for both the beef and sheep meat
industries, future research can focus on utilisation of genetic research to increase lean
meat yield, further eating quality studies, and the human nutritive value of red meat
(Pethick et al 2011).
If the venison industry intends to ensure optimal quality and tenderness of venison, it
is desirable for the industry to follow a similar pathway to that used by MSA and
SMEQ (Shaw 2000).
Chapter Two
57
2.2.5: Estimations of body condition
Body condition score (BCS) is a subjective assessment of flesh depths, including
muscle and fat, covering the animal‟s frame, as well as internal body fat reserves.
Estimations of BCS have traditionally been used in animal production systems to
relate the performance of animals to seasonal, nutritional, health and reproductive
variants (Flesch et al 2002). More recently these systems have been utilised in the
determination of suitability of livestock for live export (Gaden et al 2005). BCS
systems are useful due to their simplicity and efficiency at determining body
condition among animals of differing age, sex, frame size, muscling and weight. Live
weight, which is a common guide for assessing an animal‟s suitability for slaughter
or breed performance, does not account for differences in skeletal frame size,
muscling and fat accretion.
As animal condition increases from lean to fat, muscle volume also increases and fat
is deposited in various depots which vary between species. These developments are
evident via observation or palpation of key sites over the body. Descriptions of the
differences in condition have been documented for a number of species and
developed into body condition scoring systems. Most BCS systems developed for
domestic ruminants, including red and fallow deer, are based on a five point scale of
measurements that can be readily applied in the field, either by visual assessment or
palpation of the live animal. Examples of condition scoring systems for domestic
species include fallow deer (Flesch et al 2002), red deer (Audige et al 1998), pigs
(Elsley et al 1964), dairy cattle (Garnsworthy and Topps 1982; Gregory et al 1998),
beef cattle (Jansen et al 1985; Gresham et al 1986: Bullock et al 1991), sheep
(Hopkins et al 1995a), poultry (Gregory and Robins 1998) and goats (Mitchell 1986;
May et al 1995). None of these studies have linked BCS with meat eating quality.
Despite being subjective, these systems have some advantages over alternative
objective systems of assessing animal condition. Condition scoring requires minimal
training and results are generally consistent, no financial outlay is required for
specialised equipment, animal handling is not always required, and scoring is quick
and easy to perform (Gaden et al 2005). As with any subjective system, accuracy of
the assessor is key to its overall success. Numerous studies have shown that accuracy
Chapter Two
58
and repeatability are possible, especially with experienced scorers, with satisfactory
results from inexperienced assessors. Discrepancies will inevitably occur between
assessors, and a biological variation between animals also reduces accuracy.
Competency standards set by the National Livestock Reporting Service are an
attempt to improve assessor accuracy when estimating GR fat in sheep and goats
(Gaden et al 2005). Some objective measures have been developed to reduce the
subjectivity of the BCS system, however, many are financially or procedurally
inhibitive and it is often more practical and efficient to use manual methods. In
Australia, the current methods of assessing live animals in relation to carcass traits in
the major meat species of cattle, sheep and goats are AUS-MEAT live animal fat
scores. Fat scores are generally correlated with body condition scores, with some
exceptions in cattle (Gaden et al 2005).
Body condition scoring has been used extensively with dairy cattle in Australia via
systems such as the „Condition Magician‟, an eight point system which focuses detail
in the middle ranges where animals are deemed to be more productive (Gaden et al
2005). Beef cattle may be assessed using the AUS-MEAT live cattle language which
utilises fat scoring of subcutaneous fat depth at the P8 site (Gaden et al 20005) rather
than overall body condition. It is a useful indicator for market reporting of live cattle,
but lacks reliability in adequately describing body condition in very lean cattle.
Internationally, there are several condition scoring systems, predominately for dairy
and beef cattle. These scoring systems have been implemented widely for cattle and
are normally based around a five point system for beef and an 8-10 point system for
dairy cattle, with some detailing half scores (Gaden et al 2005).
The remaining meat species of sheep, goats, alpaca, camel, buffalo and deer all have
at least one simple system based around five body condition scores, with BCS 1
describing very lean animals and BCS 5 describing very fat animals (Gaden et al
2005). A number of systems operate on a fat score rather than a condition score, and
it takes skill on the part of the assessor to accurately estimate subcutaneous fat depth
in the live animal. Condition describes the amount of muscle and fat over the
skeleton, while fat score describes the amount of subcutaneous fat on an animal and
assumes a strong correlation between these scores and body condition. Subcutaneous
fat depth is an important carcass descriptor for meat animals in Australia, with AUS-
Chapter Two
59
Meat developing standard descriptions for the major meat species of cattle, sheep and
goats in the 1980s and 1990s. A system was not developed for the minor meat
species such as deer, but in 1995, AUS-MEAT published specifications for venison
cuts. Some systems are less reliable when dealing with very lean animals that may
still be in good condition, with variations in body size at the same fat depth, heavily
muscled animals with lower levels of subcutaneous fat, and individual variation in
distribution of fat over the carcass contributing to this. The use of fat score in
conjunction with BCS proved to be a more reliable indicator (Gaden et al 2005).
Fat scoring of carcasses is used extensively in Australian meat processing facilities.
The sites commonly used are the GR site, at the 12/13th rib, or the P8 rump site
which was selected, despite its less reliable indication of carcass fatness, as it
suffered less damage upon hide removal. These scores are combined with measures
of musculature, such as eye muscle area, to aid in determining price paid to
producers and in order to supply specified carcass quality to buyers (Pethick et al
2011).
Body condition scoring systems are used extensively in Australia for live animal
assessment and description for market related reasons such as livestock pricing, sale
by description and trade specifications, as well as for production purposes relating to
herd management and production, fertility and nutrition. To facilitate the translation
of objective descriptions of fat and muscle score into a mental image of the animal
being described, good quality photographs greatly assist the process and aid the
maintenance of standards of live animal assessment. These are particularly useful
with cattle; however, caution must be taken with species such as sheep, goats, deer
and alpaca, where coat and wool cover, especially in winter, may hamper visual
assessment. In these instances, palpation is necessary (Flesch et al 2002).
Recently, grading systems for meat, in particular beef, have related aspects of BCS to
meat eating quality, with many international markets now purchasing product using
USDA and Meat Standards Australia (MSA 2001) grading methods. There is now a
large amount of research data available on the eating quality of meat from a range of
domestic ruminant species, particularly sheep and cattle. Research on deer has so far
been limited, however, the eating quality aspects of reindeer (Rangifer tarandus
Chapter Two
60
tarandus) venison have been studied in relation to pre-slaughter handling and
supplementary feeding (Wiklund et al 1996b; 1997a; 2000; 2003a) and carcass
suspension methods (Wiklund et al 2011). The effects of various feeding regimens
on eating quality attributes in red deer venison have also been investigated (Wiklund
et al 2003c).
To encourage production of deer of consistent quality and to increase farmer returns
and consumer confidence for venison, BCS charts (Tuckwell et al 2000a; 2000b)
were developed for red and fallow deer (Appendices 1-3). The charts allow
producers to better assess their stock and use a common language, whereby
processors then have the ability to assess carcasses and pay accurately for the quality
they receive. It is anticipated that the use of these charts by deer farmers will lead to
improvements in venison quality and therefore consumer confidence.
Although most venison processors pay producers according to HCW and breed type,
few have attempted to differentiate payment on the basis of BCS. Processors
currently pay for a single HCW for animals of a species that fit within a weight range
irrespective of the animal‟s body condition. This system penalises those who produce
animals with ideal carcasses to cover losses incurred by animals in poor or over
condition. A system of visual assessment on the live animal plus objective HCW will
benefit farmers whose animals are in ideal condition and subsequently improve
venison quality. BCS could feasibly become a major factor that influences the price
paid to producers for their venison. The importance of bodyweight is clearly
demonstrated in payments currently made to producers for animals processed.
Producer payments should be increasingly based on a price grid determined by
factors such as age, sex, BCS and weight. In this way the industry has an opportunity
to improve the quality of venison available to international and domestic markets,
and subsequently provide a basis for improved confidence in local product (Tuckwell
and Tume, 2000).
Meat quality attributes such as tenderness, juiciness and flavour are not able to be
predicted by the appearance of the animal or the meat. By establishing links between
live animal body condition and carcass fatness with meat quality, predictions may be
possible. This, in turn, will aid producers when determining the optimal condition of
Chapter Two
61
animals for slaughter. Producers aim to achieve slaughter weights and process
animals at between 12 and 15 months of age, with red deer/elk hybrids and European
fallow/Mesopotamian hybrids able to achieve slaughter weights at 11-12 months.
Unlike cattle and sheep, deer are usually sold to a processor, not through a sale yard
or directly to an abattoir. Processors can then arrange transport, slaughter, packaging
and marketing (Horsley 2004). There are four major deer processing plants in
Australia: two in South Australia, one in the Central West region of New South
Wales and one in Western Australia (McKinnon 2011).
Currently, processors indicate that the ideal carcass weight for red deer is between 55
kg and 65 kg, and for fallow deer between 25 kg and 35 kg, but do not specify body
condition parameters despite referring to them in quality manuals (McRae et al
2006). Despite these guidelines, the average carcass weights for red deer and fallow
deer have fallen below the recommended weight ranges (McRae et al 2006;
Tuckwell 2007) and slaughter data show this trend has been continuing since 2000
(Tuckwell 2003a, 2007), with producers presenting processors with unfinished and
unsuitable animals for the premium venison market (Hansen 2004). With prices paid
to producers determined on an over the hook basis or HCW, returns are not as high
as they could be.
Tuckwell (2003b) recommended that Australian venison producers and processors
adopt QA programs and concentrate their efforts on influencing quality and therefore
profitability. These recommendations included feeding regimes to improve HCW in
a desired time frame, cost effectiveness in feeding programs, training in condition
score assessment of deer, and encouragement for processors to pay for carcasses
according to a pricing grid based on factors such as age, sex, BCS and HCW. This
would reward production of high quality carcasses and penalise poor production. The
Rural Industries Research and Development Corporation (RIRDC) is able to supply
processors with software to institute such grids (Tuckwell 2003a). Carcass weight
and carcass quality is under the direct control of the producer. Optimising quality of
supplied carcasses is under the control of the processor through slaughter and post-
slaughter processes.
Chapter Two
62
2.3: Industry issues
2.3.1: Background
The RIRDC has developed five year research and development plans for the
Australian deer industry. The purpose of the plans is to guide research and
development (R&D), provide clear direction and establish industry priorities for the
period. The first of these R&D plans commenced with the 1996-2000 plan, and new
plans have been developed for subsequent five year periods. At the commencement
of the first five year plan in 1996, the RIRDC-funded venison market development
project resulted in a large increase in international and domestic demand for
Australian venison. When export prices increased in the late 1990s, funding of
market development activities in the domestic market ceased. The strong domestic
market was lost when the limited volumes of venison produced were diverted to
higher paying export markets at the expense of the size of the national herd as
producers processed more animals to meet demands. The New Zealand deer industry
managed to secure this untapped Australian domestic market when export prices fell
as a way of selling venison previously sold in Europe (RIRDC 2007).
At the commencement of this project, the 2000-2005 RIRDC plan remained in place.
Both the first and second five year plans identified meat quality and quality
assurance as a key priority. These plans also identified the need for producers to
understand the impact they have on their financial returns. Producers have an
opportunity to improve the quality of animals produced, thereby improving venison
quality. One area identified was the poor live animal assessment skills of producers
and the need for them to utilise live animal assessment (or BCS) to help improve and
maintain quality and consistency of product. Venison R&D Objective 1 (2000-2005)
stated that „the average quality of animals processed by the Australian deer industry
varies greatly and is generally poor. Poor quality relates to lack of live animal
assessment standards, lack of management skills, lack of understanding of cost
benefits of improved management and absence of economies of scale‟ (RIRDC
2000).
Chapter Two
63
At the conclusion of this study, the 2006-2011 five year research and development
plan was drawing to a close. The goal of the current plan is to make the Australian
deer industry profitable and sustainable, with „efficient vertically integrated supply
chains‟ and effective marketing for a range of „internationally competitive products‟
(RIRDC 2007). The major focus of that document was on the establishment of
„market focused venison supply chain alliances‟ to sustain and develop the
diminishing Australian deer industry. The Australian deer industry is largely an
export focused one which leaves the participants vulnerable to the effects of unstable
trading conditions over which it has no control, such as international monetary
exchange rates and import regulations. These trading variables have driven the
industry towards a commodity approach to production and marketing with the export
market determining future production levels. This approach gives producers little
incentive to improve production and product quality due to the price taking approach
of commodity marketing. Prices offered by commodity markets do not support
profitable deer production in Australia. To provide producers with incentive and
thereby achieve sustainability for the deer industry, the formation of strategic
alliances within the supply chain was deemed necessary (RIRDC 2007).
The current five year plan has several specific objectives in place for the venison
industry in Australia. They include reducing the cost of production and processing,
improving value rewards in supply chains, promoting consumer awareness of
Australian venison attributes, and improving domestic and international marketing
strategies for Australian venison. They aim to do this by facilitating and promoting
adoption of existing knowledge by producers and processors incorporating industry
quality assurance schemes. There is a production target of over 80% slaughter
animals meeting the highest value carcass specification of processor price grids. To
meet this key performance index would support the establishment of supply chain
alliances while improving the technical capacity of the alliances to achieve high
value end market specifications. RIRDC propose to investigate the feasibility of on
farm slaughter systems and intends to review and improve the 1995 AUS-MEAT
terminology (RIRDC 2007).
In 2006, the agricultural industry in Australia was emerging from an extended
drought period which saw low commodity prices. These factors led to the Australian
Chapter Two
64
deer industry diminishing in size as many smaller producers exited from the industry,
while the larger producers, some with more than 1,000 head of deer, managed to
remain viable. Supply of venison products was also limited due to the slaughter of
young breeding females during this drought period, and subsequent reduction in herd
size over the following seasons (RIRDC 2007; Tuckwell 2007).
It is speculated that the major reasons for the industry downturn were the severe
drought in Eastern Australia between 2001 and 2003, a dramatic reduction in returns
for venison in 2003, and decreased confidence from producers in the industry. This
lack of confidence led to the slaughter of large numbers of breeding females at very
low prices, a reduction in new investment and a lack of herd expansion (RIRDC
2007).
The development of a competitive deer industry in Australia is only possible with the
adoption of efficient production and processing systems. Projects funded by RIRDC
to date have made available the knowledge required for producers and processors to
produce consistently high quality venison and velvet antler, and much has been
incorporated into the quality assurance program. The research projects conducted
have resulted in identification of the product parameters that define quality, yet
adoption of the necessary practices remained low because these practices usually
increase costs and to date they have not attracted price premiums. Tuckwell (2003a)
speculated that the future of the industry would be inextricably linked to its ability to
produce and market quality assured products. Due to the small size of the venison
industry in Australia compared with other red meat industries, the industry needs to
ensure that consumers have no quality-based reasons to reject its product but need to
be able to favourably consider Australian venison on the basis of its credibility and
quality (Tuckwell 2003a). Despite demand for high quality product in high value
markets, both international and domestic, the Australian deer industry has not
developed the capacity to meet market requirements in areas of product consistency,
quality and reliability of supply (RIRDC 2007).
Producers often equate quality with yield or hot carcass weight as this is how they
are paid. In the beef industry producers are paid for fat colour, lean colour, marbling,
pH and other quality parameters as outlined in the discussion on the work of Meat
Chapter Two
65
Standards Australia (MSA 2010). Game meat processors in Australia do not know
what quality of animal is going to be supplied to fill orders. In Australia a premium
price is paid if animals meet specifications in relation to weight (Hansen 2011). In
NZ killing space is booked ahead of time and meat companies visit producers to
check that animals meet specifications (DINZ 2011). It is apparent that in Australia
there is a lack of whole of supply chain approach to venison quality management, the
adoption of which has achieved a degree of success in both the Australian beef and
lamb industries and the New Zealand venison industry.
Quality assurance (QA) of venison is a key to long term product marketability and
has been identified as a priority component of the long term strategic plan and a key
challenge for the Australian deer industry. Many of the RIRDC funded research
projects completed during 1996-2000 have focused on aspects of QA at various
levels of production and processing, to position the Australian deer industry for long
term viability. The body condition scoring charts (Appendices 1 and 2) are an
example of RIRDC funded projects designed to focus on QA at the production and
processing level. This system provides a common language, which can be used by
producers, processors and marketers to describe carcass characteristics. QA success
is unlikely to be achieved by meat description alone and the task for the deer industry
is to now link production efficiency and processing to consumer acceptance of the
final product. There is now more emphasis on food chain management in most
countries of the world where food is produced in surplus, especially meat. This
project assesses the association between live animal and carcass characteristics and
consumer acceptance of venison by matching eating qualities of venison to body
condition scores and testing these with consumers. This paddock-to-plate approach
will link the outcomes of a series of projects, completed independently of each other,
to provide clear guidelines on carcass characteristics that will guide production
efficiency and value adding on farms and will clearly enhance the credibility,
application and adoption of QA by strengthening links between various sections of
the deer industry.
The need to link carcass production with eating quality has long-term implications
for acceptance of venison as a favoured consumer selection. Hence, definition of the
relationship of BCS with cooking and eating quality will increase opportunities for
Chapter Two
66
target marketing, which should increase farm profitability and consumer satisfaction
if product consistency is enhanced. However, it is acknowledged that factors such as
methods of slaughter, post-slaughter carcass management and methods of meat
storage can have a significant impact on eating quality of the final product. Texture,
flavour and tenderness are attributes valued by consumers as very important in
relation to the eating quality of meat. Different populations of consumers have
different preferences for these quality attributes, something that affects the market
for all types of meat. However, regardless of the consumer group, the consistency of
meat quality is very important, and the product should be of the same quality every
time it is purchased. In the MSA beef grading system these consumer important
sensory quality attributes have been weighted in an overall score where tenderness
represents 40(%), flavour 20(%), juiciness 10(%) and overall liking 30(%) (MSA
2001).
In addition to the association between BCS and various meat quality parameters,
other techniques employed in this study test the effect of pelvic suspension (tender
stretching) of carcasses for product enhancement, evaluate ageing of venison, and
look at the effect of supplementary feeding of deer pre-slaughter compared with
pasture-fed deer on consumer sensory perception of meat flavour. All of these
factors will be comparatively evaluated for the body condition scores of 2, 3 and 4.
Work undertaken by the beef CRC (Meat Quality) complements the consumer work
done here. Complementary projects relating to condition score and carcass
composition exist for sheep (Glimp et al 1998) and cattle (Apple et al 1999) and aid
in frameworking the proposed study. This project has, however, pioneered this type
of research in relation to venison production. Projects such as those listed above
complement the study as well as providing a model for venison. Tenderstretching or
pelvic suspension of carcasses is becoming increasingly popular in the Australian
beef industry as a result of MSA, and this procedure will be tested with venison to
determine if it is associated with product enhancement.
Chapter Two
67
2.3.2: Current venison issues
Meat quality studies on deer species are few compared with beef and lamb. In view
of the importance of the deer industry in New Zealand, Europe and the United
Kingdom, it is worthwhile to investigate meat quality to maximise commercial
returns (Daszkiewicz et al 2009; Radder and le Roux 2005).
Deer as a farmed species remain more nervous than other domesticated ruminants
and appear to be more predisposed to stress than many of the more domesticated
species such as cattle and sheep. Their typical first reaction to any external stimuli is
the flight or fight response. This makes deer more difficult to handle when yarding,
loading, transporting and holding in lairage. Facilities need to be designed to hold
deer and keep them in the best condition possible prior to slaughter to optimise meat
quality and reduce the incidence of bruising and high meat pH (Pollard et al 2003;
Hoffman and Wiklund 2006). This is currently an issue for producers in Australia,
where a very small number of abattoirs process deer on a regular basis. Producers are
often faced with the prospect of transporting their animals over large distances of up
to 2,000 km (Joubert 2004) at great expense financially and in relation to animal
well–being, or having to use less cost effective methods of processing such as mobile
slaughter facilities (Shapiro 2010). Despite codes of practice for transport, the long
distances travelled in Australia to take deer for slaughter to one of the few abattoirs
processing deer can result in deaths or downgrading of carcasses from damage
occurring during transit (Joubert 2004). Australian deer producers cited abattoir and
transport costs as well as access to export accredited facilities as reasons for
considering leaving the deer industry (Shapiro 2010). There are very few abattoirs
equipped to hold and process deer, particularly with export accreditation. Currently
the only known abattoirs processing deer are at Bordertown and Strathalbyn in South
Australia (mainly fallow deer), Myrtleford and Wodonga in Victoria and Beaufort
River in Western Australia. As Myrtleford and Beaufort River are the only export
accredited facilities in this group, and the majority of Australia‟s venison is destined
for export, animals from the east coast of Australia are regularly trucked to both of
these facilities (Hansen 2011). In contrast, New Zealand currently has 14 specialty
Chapter Two
68
venison processors with export accreditation, and distances required to transport deer
to one of these facilities for slaughter are low (Stewart 2011).
Long term sustainability to supply international markets has been frustrated by
failure to meet customer specifications in areas such as meat quality. Part of the
problem with inconsistency of the product comes from inconsistent quality of
animals supplied for processing. This could be aided by use of the BCS system.
Processors are continually encouraged to pay premium prices for stock purchased
from quality assured farms or to reduce prices for those not quality assured. Data
published regularly in the Australian Deer Farming Journal indicates that the quality
of animals processed varies greatly (Tuckwell and Tume 2000).
Current quality issues with venison relate to inconsistency of supply. Producers must
supply quality animals for slaughter and this currently does not appear to be
happening. Animals supplied include bucks/stags, castrates and cull does/hinds, and
the relationship between sex and age to variations in meat quality is unknown. One
area of concern is the number of animals not meeting minimum schedule slaughter
weights or body condition parameters (specifications) as well as varying levels of
bruising during stock handling and transport (Hansen 2004). As noted by Mulley
(1993), there is now a need for the venison production industry to conduct
comparative research into ways of finishing deer prior to slaughter so that seasonal
and gender factors affecting meat quality issues are accounted for in product
consistency.
Cause for concern for each species slaughtered for venison in 1998/1999 and
2000/01 is that more than 50% of carcasses processed weighed less than the ideal
weight range. This results in less farmer return. Statistics for red and rusa deer
indicate that those carcasses heavier than ideal are also discounted. During this time
period only 27.9% of red, 35.2% of fallow and 19.1% of rusa deer fell into the ideal
weight range for their species. The prime weight ranges are red 55-75 kg, fallow >26
kg and rusa 45-55 kg. The obvious effect of improving carcass weight is increased
farmer returns. The principal factor that the industry should consider in an effort to
improve returns to growers is to improve the average quality of stock committed for
processing. Farmer returns may fall unless the average quality (carcass weight and
Chapter Two
69
BCS) of animals processed improves (Tuckwell 2001a). Unfortunately, this trend
continued until 2007 (Tuckwell 2007). Recent reports from deer processors,
however, indicate that producers currently engaged in strategic alliances have been
able to supply animals of satisfactory carcass weights, although low numbers of
animals available for processing remains an issue (Hansen 2011).
Traceability is another issue for the Australian venison industry. The issue of
traceability has been a key component of quality programs in beef and lamb in
Australia (MSA 2010), and is an integral part of the NZ quality assurance programs
for venison, which were established to meet the exacting standards demanded by
export locations and supermarkets (Barnett 2007). The New Zealand deer industry is
currently investigating and implementing electronic identification to aid traceability
and carcass tracking. The technology allows individual animals to be tracked through
the entire processing chain making feedback possible to producers on the
performance and value of the animals supplied. Initial stages of the project will trace
the live animal through to the venison in cartons, however, it is envisaged that it will
be implemented through to the consumer level (Hickey 2011).
The traditional kill sheet utilised in New Zealand abattoirs will be replaced with a
venison value sheet. Producers will supply details including breeder and sire
identification, weaning dates, weight and live weight gains. The processing plant will
add data relating to dressing and meat yields, value details relating to co-products
such as pizzles and tendons, and customer destinations for primal cuts plus values
per head and per kilogram of venison. Once total value of the animal is established
deductions will be made for fixed processing costs and transport. Producers will then
be provided with comprehensive detail relating to individual animals which will aid
future farm management decisions and potentially improve quality and profitability.
It is envisaged that the traditional New Zealand payment system based on carcass
weight and GR fat depth will be replaced by a value based payment system (Hickey
2011), much the same as the proposed systems for Australian beef and lamb
(Polkinghorne and Thompson 2010). This type of system results in producers
actively contributing to the value chain (Hickey 2011). The Australian venison
industry developed a system known as Venstat, a computer database for processors
Chapter Two
70
to record similar details to the New Zealand system, but uptake has been slow
(Tuckwell 2001a).
The Australian venison industry remains in an extended slump, with declining
numbers of producers and low returns (McRae et al 2006; Shapiro 2010). Both
venison production and supplies were at a low level, prices received for deer were
also low and export demand had downturned (RIRDC 2007). This positon remains in
2012 in contrast to other red meat industries, such as lamb, where reduced production
has resulted in historically high prices in recent years (McRae et al 2006; Rees 2010).
The future of venison processors relies upon an assured supply of quality animals,
rather than the ad hoc supply of culls (Shapiro 2010), or supplying when the market
is ready but the deer, in terms of condition and live weight, are not (McRae et al
2006). It is acknowledged that the Australian deer industry does not have the same
degree of marketing funds at its disposal as beef, lamb or pork, however, the deer
industry has failed to capitalise on the growth in demand for meat products in recent
years. The industry objective should be to produce venison which consistently meets
and exceeds consumer needs and expectations of a food which is safe, wholesome
and healthy. The product from the beginning has the attributes in keeping with
today‟s consumer preferences (Wright 1993). Without a significant change in supply
chain management, the outlook for the deer industry in Australia is bleak.
The RIRDC commissioned a study to develop a marketing positioning strategy for
Australian venison (Moffat 2005). The study sought consumers of venison in
Australia, both commercial or food service and domestic, to determine their current
perception of the product. The study determined that chefs and the food service
industry in general were responsive to venison, but had issues with the consistency in
quality of the Australian product. Currently the food service sector sources venison
from New Zealand, specifically the Cervena™ brand, which enjoys an international
reputation for quality amongst consumers. The food service sector also identified
limited demand by restaurant clientele and that education of consumers in relation to
the actual flavour and texture of farmed venison, rather than perceived notions of
toughness and gaminess, may be a factor in rectifying this situation (Moffat 2005).
Chapter Two
71
A study by Cox et al (2006) identified a number of key issues associated with the
Australian venison industry. They included declining economic viability, high
infrastructure and slaughter charges, low viable producer numbers and low deer
prices. Producers also agree with the need for the establishment of a successful
domestic market (Shapiro 2011). Lack of consumer awareness is compounded by the
lack of a venison marketing plan. Underutilisation of whole deer carcasses especially
in relation to secondary or less valued cuts and by-products is an issue. Lack of
suitable product specifications, despite the existence of the AUS-MEAT venison
language and descriptions, continues to hamper quality assurance efforts. No
consistently applied carcass or cut grading system and competition from New
Zealand for the high quality end of the food service market, where top Australian
chefs regard New Zealand venison‟s consistency and quality as higher than that of
Australian venison, are impediments to producers. Australian chefs interviewed by
Moffat (2005) stated that meat grading is very important and there is a lack of
consistency in Australian venison. Cervena™ was seen as a credible brand due to
strict grading. This led to the development of a strategic plan designed to develop an
advanced market focus for venison producers and processors that repositions venison
in the broader red meat market and provides an acceptable price for consumers that
ensures adequate returns within the supply chain (Cox et al 2006).
The venison industry in Australia is plagued by consumer misconception regarding
the flavour profile and tenderness of the product. Traditionally, venison was not
farmed, rather hunted, particularly during game season in Europe and the United
States. Meat from male animals during this rutting or breeding period tended to be
very strong, livery and gamey in flavour and generally lacked tenderness. These
quality attributes resulted in the meat being slow cooked, with heavy, highly
flavoured sauces to mask the strong flavour and limited its consumption to the
traditional winter period, which reinforced seasonal availability. This type of heavy
cuisine does not appeal to younger, wealthy, health conscious and time poor
consumers (Loza 2001). Modern consumers lacking eating experience with venison
tend to believe this is true of farmed venison. The image of venison as a strong
gamey meat is not in line with the majority of the potential market, nor is it in line
with the actual flavour and tenderness profile of correctly prepared farmed venison.
Sensory panels conducted by Moffat (2005) found that consumers rated venison as
Chapter Two
72
tender, delicately flavoured and fine textured. Once consumers are educated in
relation to flavour attributes and methods of cooking, and availability (Hansen 2004)
and price issues relating to the domestic purchase of venison are addressed, the
potential for favourable feedback on the health features of this meat will be enhanced
(Moffat 2005). The industry needs to be able to deliver venison of consistent quality
and at a reasonable price in order to promote venison as a healthy, premium source
of red meat. Growing demand for venison will need to be supported by all industry
stakeholders to achieve growth in the Australian industry rather than growth in the
importation of New Zealand product (Moffat 2005).
The Australian venison industry has numerous strengths which may be drawn out
and built upon to bring about change, and there is acceptance within the industry for
the need to change. Venison, as a product, is well positioned in the food service
sector and is perceived as a premium product. The Australian industry, by increasing
the quality and consistency of supply, can position itself within this market and
compete with current importation of New Zealand venison. The industry has failed
previously to supply consistent satisfaction to the food service sector in terms of
quality and price, thereby impeding increased usage (RIRDC 2007), while the New
Zealand venison industry has a reputation for delivering consistent, high quality
product (Cox et al 2006). The current success of the New Zealand industry has been
attributed to the improvement of marketing structures and partnerships, market
diversification and development of products to meet changing consumer
requirements, a reputation for quality and trusted branding, and the increase in world
commodity prices (Moffat 2011). Venison is available in New Zealand in
supermarkets around the country, allowing more consumer access, along with
provision of cooking demonstrations and active marketing campaigns (Griffiths et al
2009). Venison is also highly attractive to consumers, once the issue of a lack of
awareness is overcome, and it fits well within current consumer trends for healthy
eating. Venison outscored beef in terms of eating quality with female panellists
(Moffatt 2005). The attractiveness of the product and consumer education are factors
that the industry can capitalise upon to increase demand. This demand, however,
needs to be supported by supply and funds for education and marketing, which are
currently lacking (RIRDC 2007). Demand continues to improve for healthy,
naturally raised meat such as venison, with people seeking low fat premium quality
Chapter Two
73
and tasty food. Venison‟s nutritional profile as the healthiest red meat is a core
component of its premium market positioning (Moffat 2011).
2.3.3: Strategic industry alliances
Venison can be promoted more effectively with a market focused approach where
consumers are identified and the marketing program directed to the appropriate target
market (Cox et al 2006). The establishment of market focused venison supply chain
alliances is viewed as the best solution to the current problems facing the Australian
venison industry (RIRDC 2007). Cox et al (2006) identified this approach as being
an efficient and effective strategic option for the Australian venison industry to meet
its current challenges. The current commodity system involves the participants
focusing on their own production framework without knowledge of other operations
of the supply chain. The market focused alliance system offers a whole of industry,
or paddock-to-plate, approach to participants. The system identifies the target
consumer value requirements and communicates these to different participants within
the production chain. This results in a shift from production focus to consumer focus.
Consumer issues are of increasing importance to the meat industry (De Smet 2011)
in all sectors from producers through to retailers and food service. The alliances have
a clear focus on delivering value to the target consumer. The aim will be to
determine what the consumer wants and to deliver the desired product, thereby
increasing product demand. A typical alliance would include producers delivering
deer at appropriate specifications, processors facilitating the slaughter of deer and
monitoring production to meet specifications as well as implementing grading
systems, wholesalers delivering specified product, and retailers and food service
supplying product to the target consumer (Cox et al 2006). The concept of strategic
alliances is not a new one for the Australian venison industry, and was recommended
by Tuckwell (2001a) to improve consumer confidence and industry sustainability.
The New Zealand industry also supports a whole of supply chain approach such as
the strategic alliance system proposed in Australia (Moffat 2011). The strategic
alliance approach allows increased connection with food producers by consumers to
Chapter Two
74
provide a higher degree of certainty about the origin, method of production and
ability to supply (Moffat 2011). Like the Australian industry, the New Zealand
venison industry uses a five year industry strategic intents program to guide industry
development, with the current program in place for 2009-2014. The current NZ
program aims to improve linkages between producers and the market as suggested to
Australian producers by RIRDC in 2007. Improving linkages has the potential to
result in the supply chain providing consumers with what they want, when they want
it, and receiving an adequate return for industry stakeholders. The New Zealand
venison industry has an enviable reputation for innovation and market
responsiveness (Griffiths et al 2009).
A number of supply chain alliances have been established in Australia since the
commencement of the latest five year plan and funding from RIRDC in 2006. To
date they have had limited success, but it is believed that necessity may see more
industry participants becoming involved in alliances and the industry may need to
further this concept in order to survive. Processors have reported improvement in
carcass weights with increases in schedule prices since the alliance program
commenced, however, the ability of producers to supply sufficient numbers of
animals remains an issue (Hansen 2011).
Despite the bleak outlook for the Australian deer industry, the New Zealand deer
industry demonstrates that good profits can still be achieved with the farming and
processing of deer, but it is important that all industry participants along the entire
supply chain are able to maximise and manage various CCP impacts on the supply of
consistent high quality venison to target markets (Shapiro 2010). One issue that is of
concern at the production level is the apparent lack of acknowledgment by producers
of the quality issues that are preventing the establishment of good venison markets
both domestically and internationally. A survey conducted by Shapiro (2010)
indicated that producers fail to identify poor quality as a factor impeding industry
success, when work by Cox et al (2006) indicated that this is a fundamental problem
with the current Australian venison supply. A number of producers, when questioned
about areas of research that they felt needed to be undertaken, responded with „no
more research and development was required‟ and there was a need for a „reduction
of the game flavour of venison‟ (Shapiro 2010). Both of these comments are of
Chapter Two
75
concern for an industry in crisis. It has been demonstrated by Moffat (2005) that
farmed venison has a mild flavour that is not regarded by consumers as gamey,
although it was perceived to be prior to sampling, and that RIRDC (2007) have
identified that significant research results are available to producers but uptake
appears to be limited.
Producers and processors of Australian venison need to focus on the development of
quality and consistency in their product, and then develop relationships with
consumers. No single strategy will secure the growth of the Australian venison
industry, and all stakeholders in the supply chain will need to work together and be
responsive to the market to achieve success (Moffat 2005). The venison alliance
projects offer hope that a cooperative supply chain approach will aid the ailing
industry (Tuckwell 2007).
The aim of this study is to characterise the meat quality attributes of deer carcasses
for body condition scores 2, 3 and 4 (commercial grades) in order to increase
consumer confidence, and consistency and quality of venison supply. The research
outcomes will result in a guide for industry that links body condition score to meat
quality, in particular, eating quality.
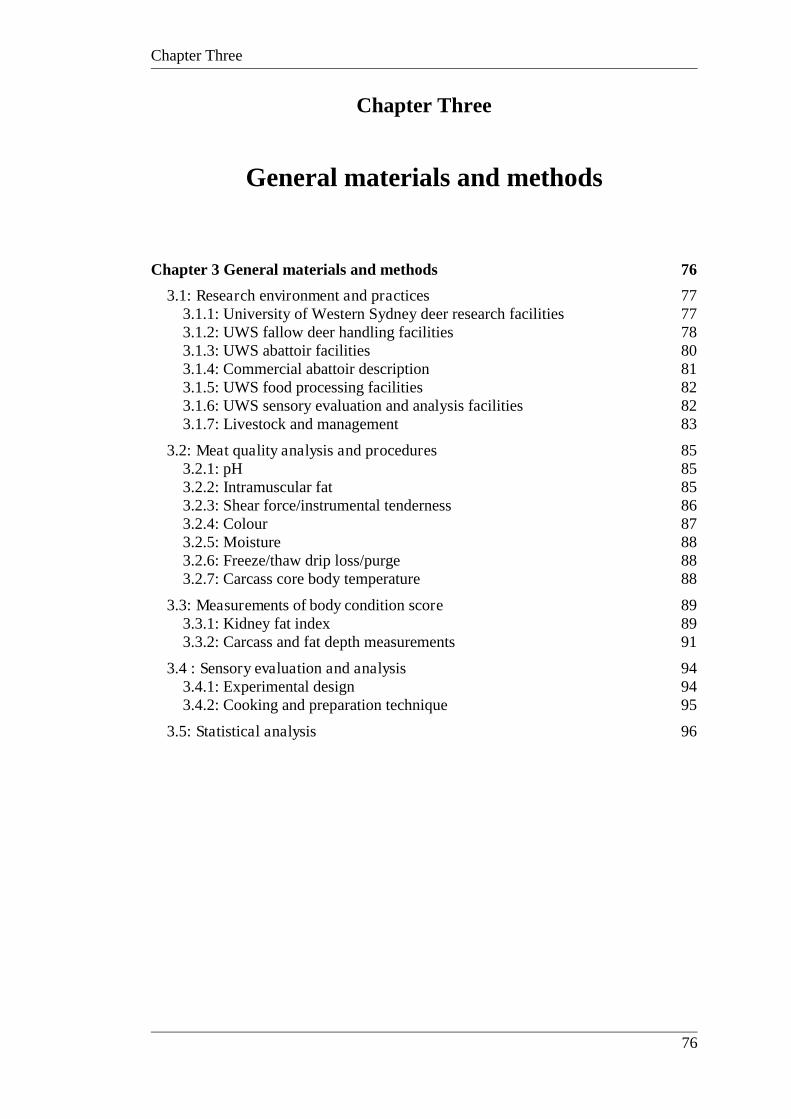
Chapter Three
76
Chapter Three
General materials and methods
Chapter 3 General materials and methods 76
3.1: Research environment and practices 77 3.1.1: University of Western Sydney deer research facilities 77 3.1.2: UWS fallow deer handling facilities 78 3.1.3: UWS abattoir facilities 80 3.1.4: Commercial abattoir description 81 3.1.5: UWS food processing facilities 82 3.1.6: UWS sensory evaluation and analysis facilities 82 3.1.7: Livestock and management 83
3.2: Meat quality analysis and procedures 85 3.2.1: pH 85 3.2.2: Intramuscular fat 85 3.2.3: Shear force/instrumental tenderness 86 3.2.4: Colour 87 3.2.5: Moisture 88 3.2.6: Freeze/thaw drip loss/purge 88 3.2.7: Carcass core body temperature 88
3.3: Measurements of body condition score 89 3.3.1: Kidney fat index 89 3.3.2: Carcass and fat depth measurements 91
3.4 : Sensory evaluation and analysis 94 3.4.1: Experimental design 94 3.4.2: Cooking and preparation technique 95
3.5: Statistical analysis 96
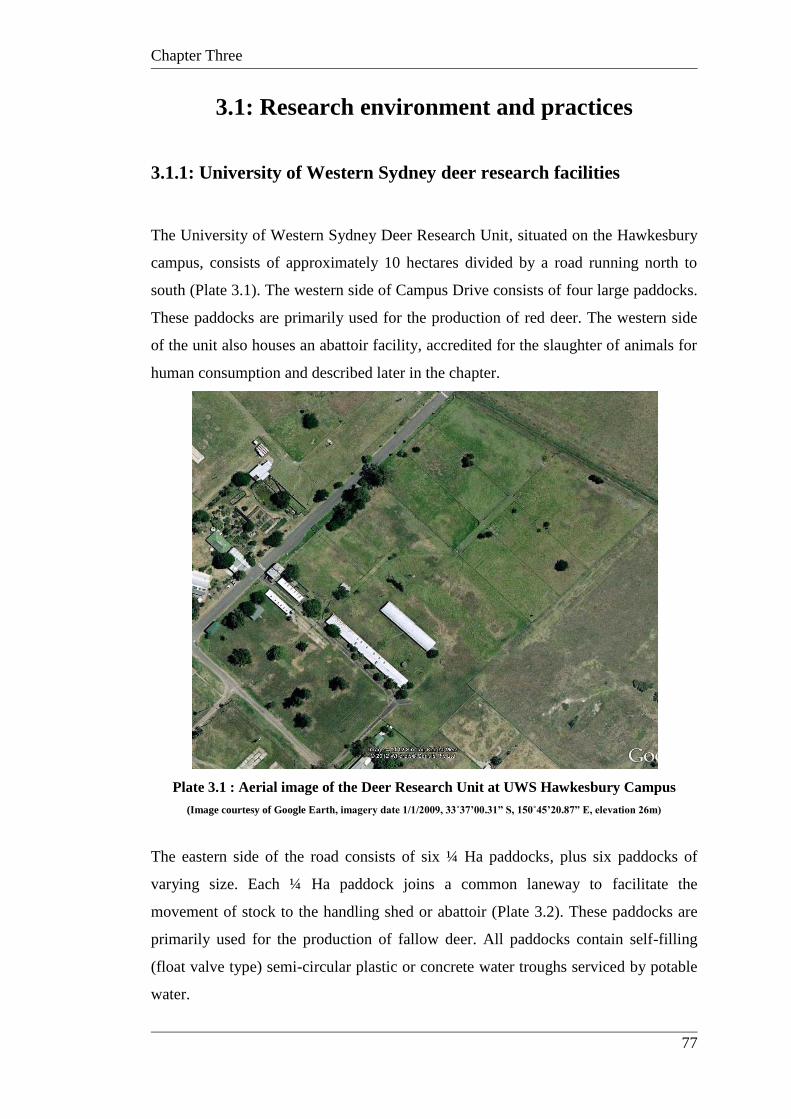
Chapter Three
77
3.1: Research environment and practices
3.1.1: University of Western Sydney deer research facilities
The University of Western Sydney Deer Research Unit, situated on the Hawkesbury
campus, consists of approximately 10 hectares divided by a road running north to
south (Plate 3.1). The western side of Campus Drive consists of four large paddocks.
These paddocks are primarily used for the production of red deer. The western side
of the unit also houses an abattoir facility, accredited for the slaughter of animals for
human consumption and described later in the chapter.
Plate 3.1 : Aerial image of the Deer Research Unit at UWS Hawkesbury Campus
(Image courtesy of Google Earth, imagery date 1/1/2009, 33˚37’00.31” S, 150˚45’20.87” E, elevation 26m)
The eastern side of the road consists of six ¼ Ha paddocks, plus six paddocks of
varying size. Each ¼ Ha paddock joins a common laneway to facilitate the
movement of stock to the handling shed or abattoir (Plate 3.2). These paddocks are
primarily used for the production of fallow deer. All paddocks contain self-filling
(float valve type) semi-circular plastic or concrete water troughs serviced by potable
water.
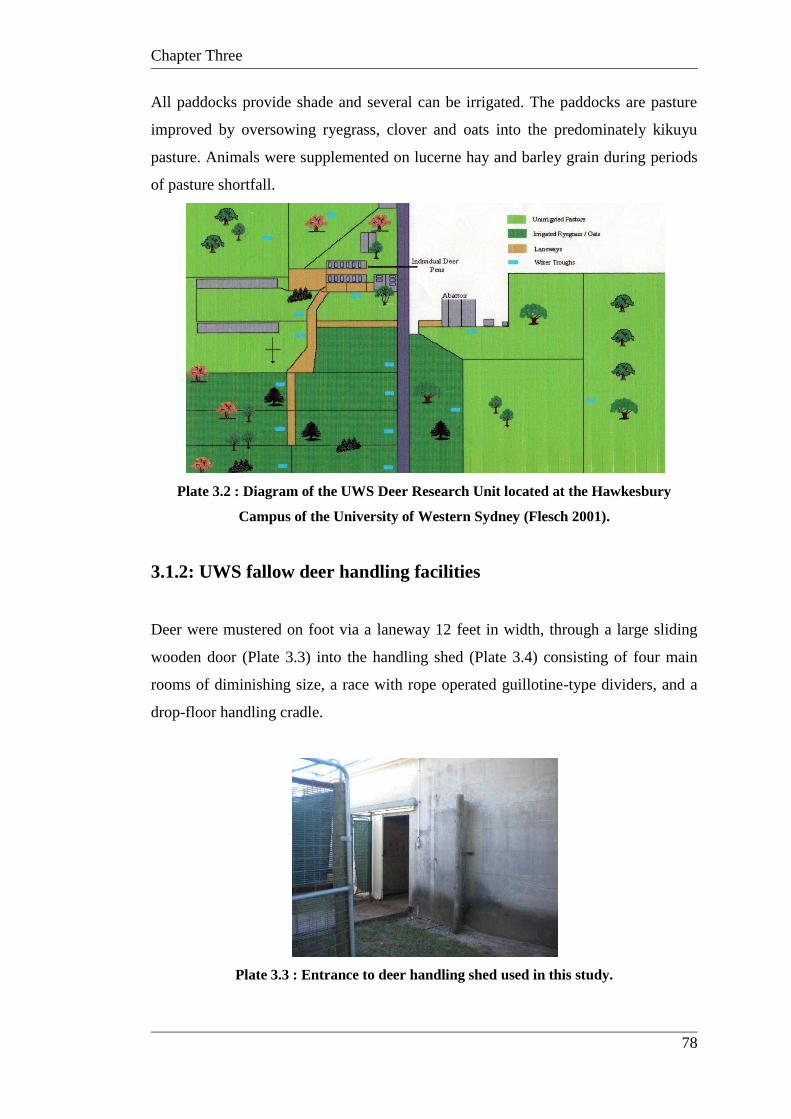
Chapter Three
78
All paddocks provide shade and several can be irrigated. The paddocks are pasture
improved by oversowing ryegrass, clover and oats into the predominately kikuyu
pasture. Animals were supplemented on lucerne hay and barley grain during periods
of pasture shortfall.
Plate 3.2 : Diagram of the UWS Deer Research Unit located at the Hawkesbury
Campus of the University of Western Sydney (Flesch 2001).
3.1.2: UWS fallow deer handling facilities
Deer were mustered on foot via a laneway 12 feet in width, through a large sliding
wooden door (Plate 3.3) into the handling shed (Plate 3.4) consisting of four main
rooms of diminishing size, a race with rope operated guillotine-type dividers, and a
drop-floor handling cradle.
Plate 3.3 : Entrance to deer handling shed used in this study.
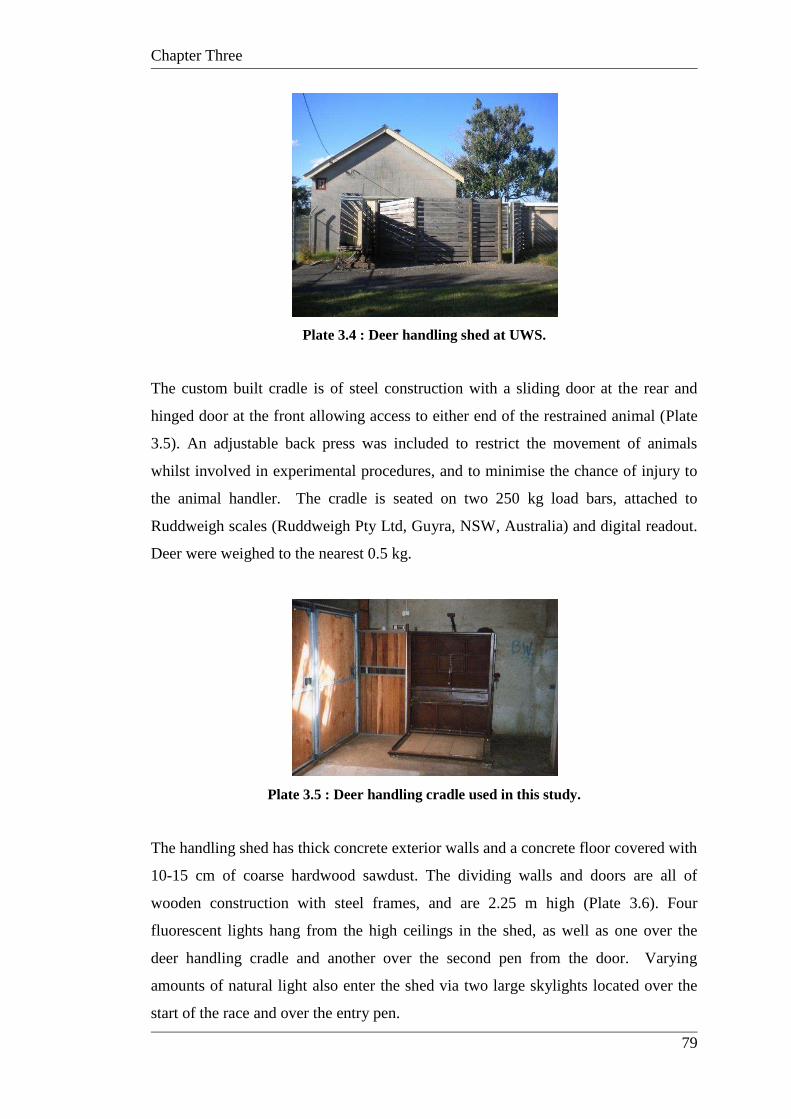
Chapter Three
79
Plate 3.4 : Deer handling shed at UWS.
The custom built cradle is of steel construction with a sliding door at the rear and
hinged door at the front allowing access to either end of the restrained animal (Plate
3.5). An adjustable back press was included to restrict the movement of animals
whilst involved in experimental procedures, and to minimise the chance of injury to
the animal handler. The cradle is seated on two 250 kg load bars, attached to
Ruddweigh scales (Ruddweigh Pty Ltd, Guyra, NSW, Australia) and digital readout.
Deer were weighed to the nearest 0.5 kg.
Plate 3.5 : Deer handling cradle used in this study.
The handling shed has thick concrete exterior walls and a concrete floor covered with
10-15 cm of coarse hardwood sawdust. The dividing walls and doors are all of
wooden construction with steel frames, and are 2.25 m high (Plate 3.6). Four
fluorescent lights hang from the high ceilings in the shed, as well as one over the
deer handling cradle and another over the second pen from the door. Varying
amounts of natural light also enter the shed via two large skylights located over the
start of the race and over the entry pen.
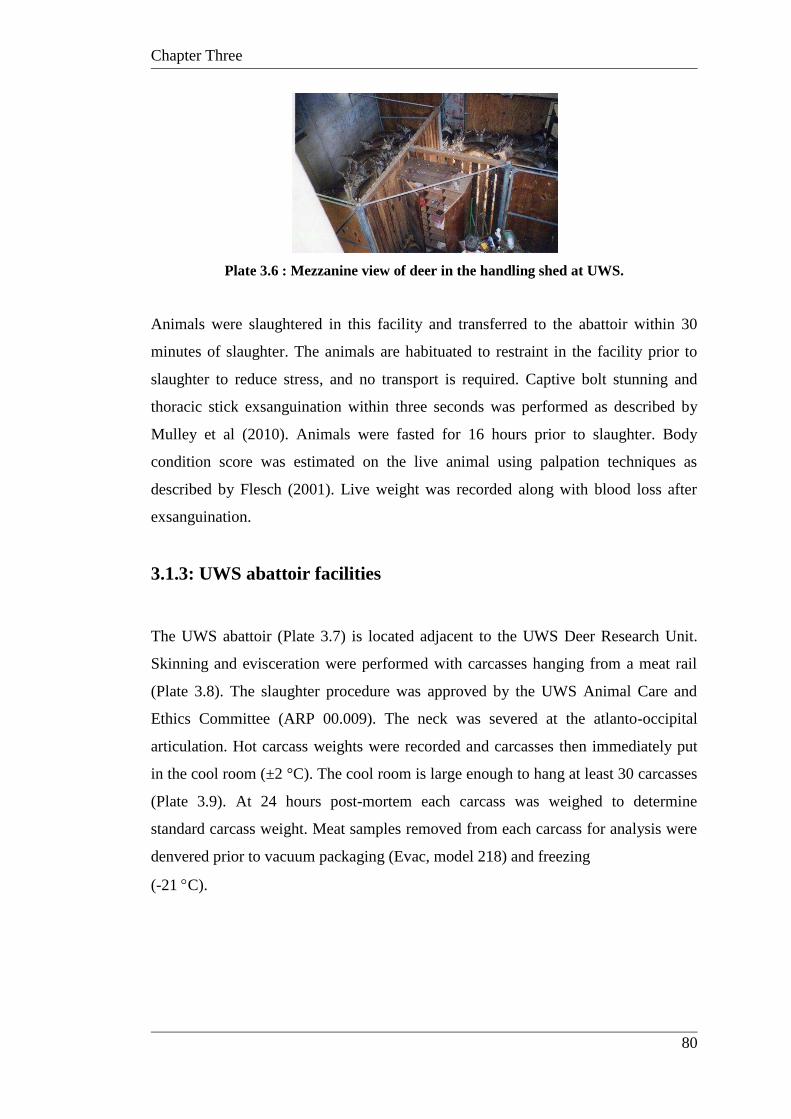
Chapter Three
80
Plate 3.6 : Mezzanine view of deer in the handling shed at UWS.
Animals were slaughtered in this facility and transferred to the abattoir within 30
minutes of slaughter. The animals are habituated to restraint in the facility prior to
slaughter to reduce stress, and no transport is required. Captive bolt stunning and
thoracic stick exsanguination within three seconds was performed as described by
Mulley et al (2010). Animals were fasted for 16 hours prior to slaughter. Body
condition score was estimated on the live animal using palpation techniques as
described by Flesch (2001). Live weight was recorded along with blood loss after
exsanguination.
3.1.3: UWS abattoir facilities
The UWS abattoir (Plate 3.7) is located adjacent to the UWS Deer Research Unit.
Skinning and evisceration were performed with carcasses hanging from a meat rail
(Plate 3.8). The slaughter procedure was approved by the UWS Animal Care and
Ethics Committee (ARP 00.009). The neck was severed at the atlanto-occipital
articulation. Hot carcass weights were recorded and carcasses then immediately put
in the cool room (±2 °C). The cool room is large enough to hang at least 30 carcasses
(Plate 3.9). At 24 hours post-mortem each carcass was weighed to determine
standard carcass weight. Meat samples removed from each carcass for analysis were
denvered prior to vacuum packaging (Evac, model 218) and freezing
(-21 C).
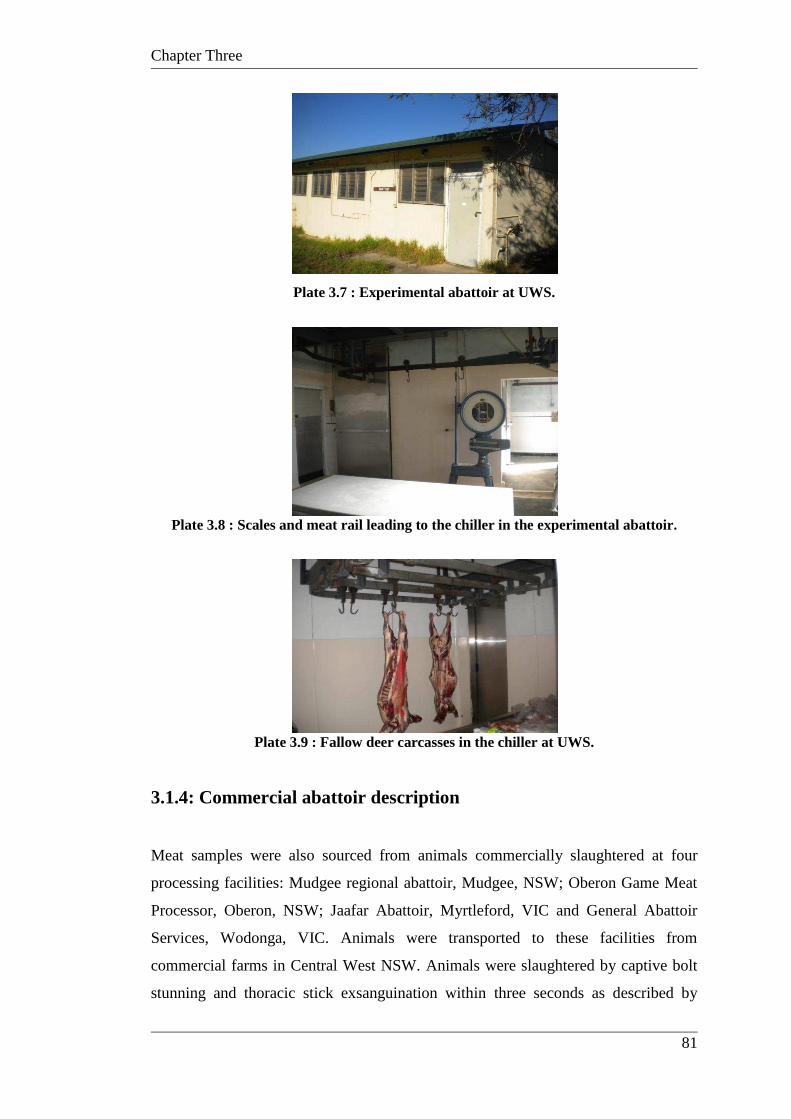
Chapter Three
81
Plate 3.7 : Experimental abattoir at UWS.
Plate 3.8 : Scales and meat rail leading to the chiller in the experimental abattoir.
Plate 3.9 : Fallow deer carcasses in the chiller at UWS.
3.1.4: Commercial abattoir description
Meat samples were also sourced from animals commercially slaughtered at four
processing facilities: Mudgee regional abattoir, Mudgee, NSW; Oberon Game Meat
Processor, Oberon, NSW; Jaafar Abattoir, Myrtleford, VIC and General Abattoir
Services, Wodonga, VIC. Animals were transported to these facilities from
commercial farms in Central West NSW. Animals were slaughtered by captive bolt
stunning and thoracic stick exsanguination within three seconds as described by
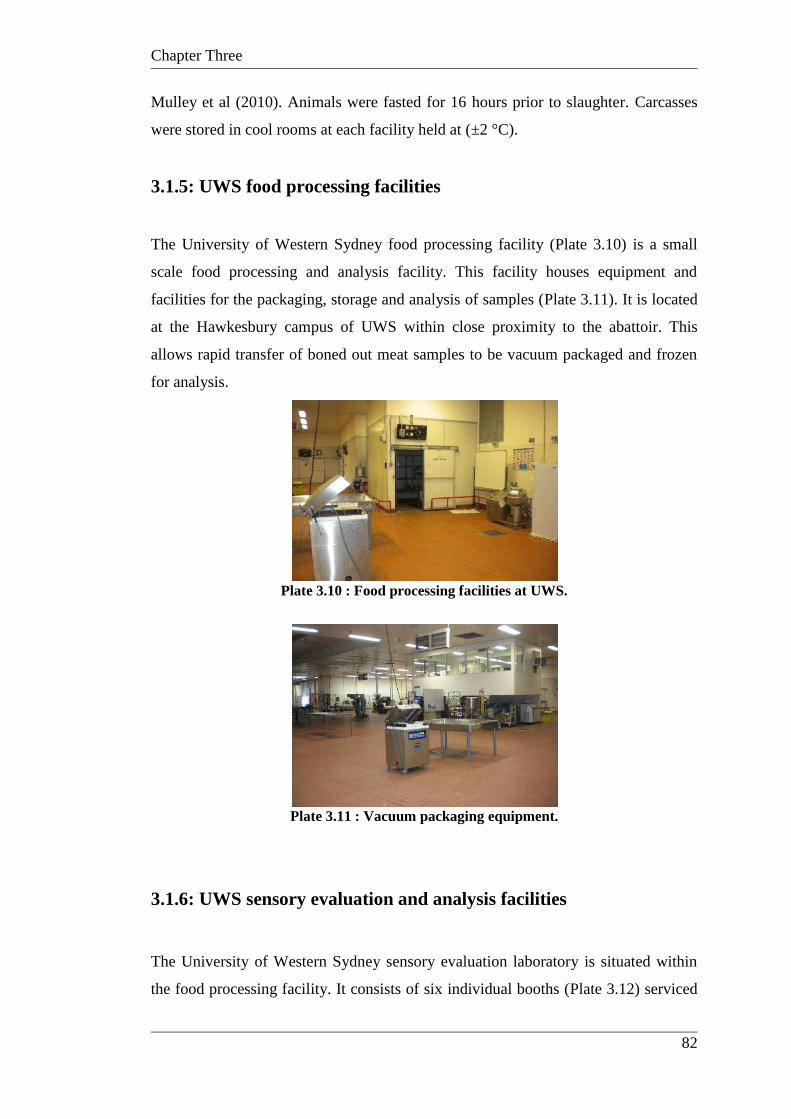
Chapter Three
82
Mulley et al (2010). Animals were fasted for 16 hours prior to slaughter. Carcasses
were stored in cool rooms at each facility held at (±2 °C).
3.1.5: UWS food processing facilities
The University of Western Sydney food processing facility (Plate 3.10) is a small
scale food processing and analysis facility. This facility houses equipment and
facilities for the packaging, storage and analysis of samples (Plate 3.11). It is located
at the Hawkesbury campus of UWS within close proximity to the abattoir. This
allows rapid transfer of boned out meat samples to be vacuum packaged and frozen
for analysis.
Plate 3.10 : Food processing facilities at UWS.
Plate 3.11 : Vacuum packaging equipment.
3.1.6: UWS sensory evaluation and analysis facilities
The University of Western Sydney sensory evaluation laboratory is situated within
the food processing facility. It consists of six individual booths (Plate 3.12) serviced
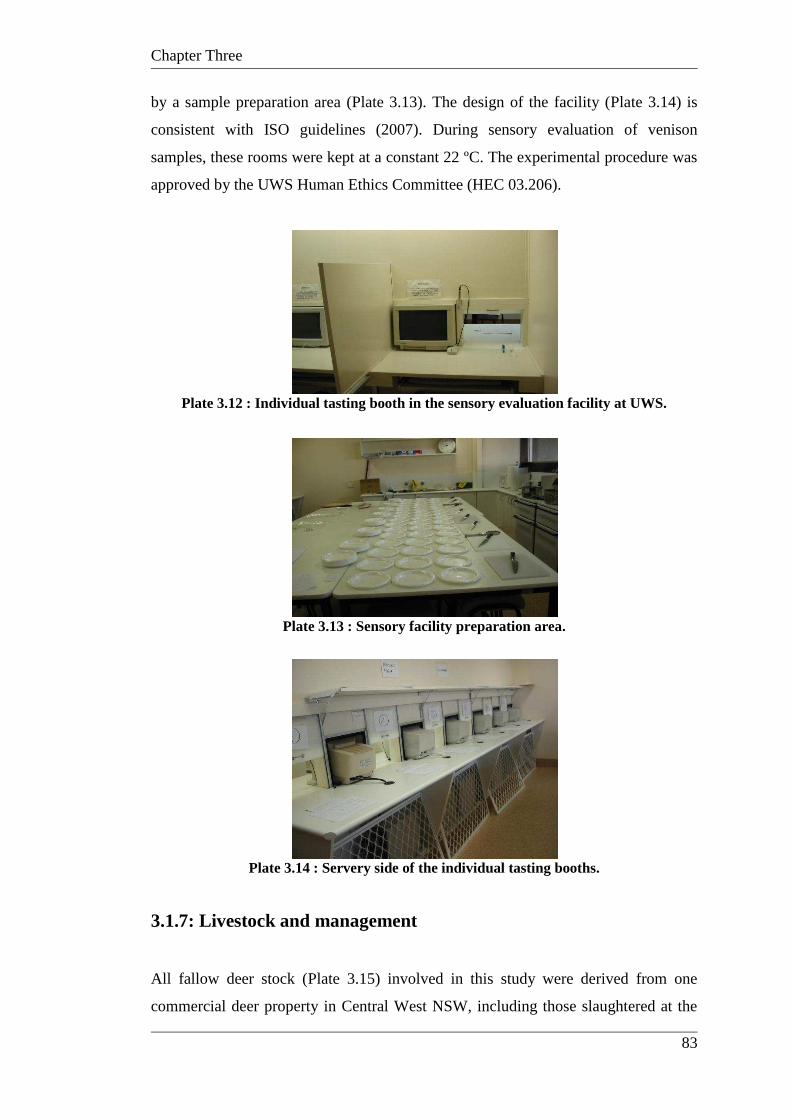
Chapter Three
83
by a sample preparation area (Plate 3.13). The design of the facility (Plate 3.14) is
consistent with ISO guidelines (2007). During sensory evaluation of venison
samples, these rooms were kept at a constant 22 ºC. The experimental procedure was
approved by the UWS Human Ethics Committee (HEC 03.206).
Plate 3.12 : Individual tasting booth in the sensory evaluation facility at UWS.
Plate 3.13 : Sensory facility preparation area.
Plate 3.14 : Servery side of the individual tasting booths.
3.1.7: Livestock and management
All fallow deer stock (Plate 3.15) involved in this study were derived from one
commercial deer property in Central West NSW, including those slaughtered at the
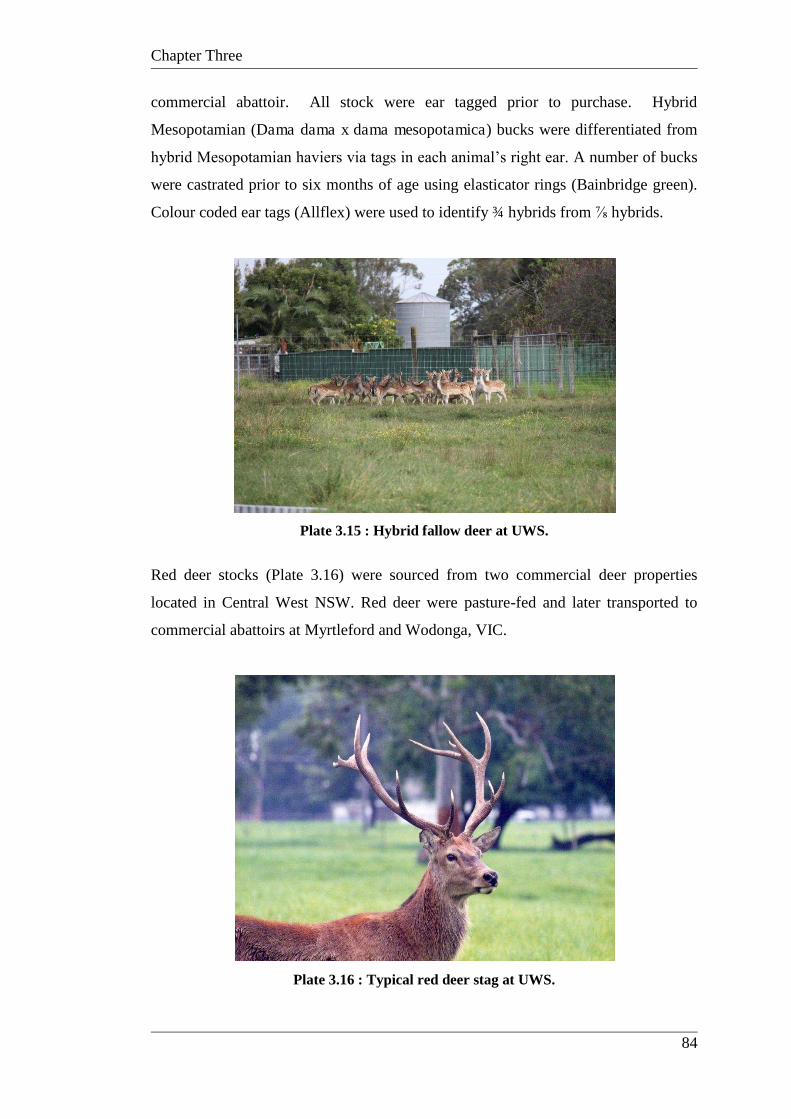
Chapter Three
84
commercial abattoir. All stock were ear tagged prior to purchase. Hybrid
Mesopotamian (Dama dama x dama mesopotamica) bucks were differentiated from
hybrid Mesopotamian haviers via tags in each animal‟s right ear. A number of bucks
were castrated prior to six months of age using elasticator rings (Bainbridge green).
Colour coded ear tags (Allflex) were used to identify ¾ hybrids from ⅞ hybrids.
Plate 3.15 : Hybrid fallow deer at UWS.
Red deer stocks (Plate 3.16) were sourced from two commercial deer properties
located in Central West NSW. Red deer were pasture-fed and later transported to
commercial abattoirs at Myrtleford and Wodonga, VIC.
Plate 3.16 : Typical red deer stag at UWS.
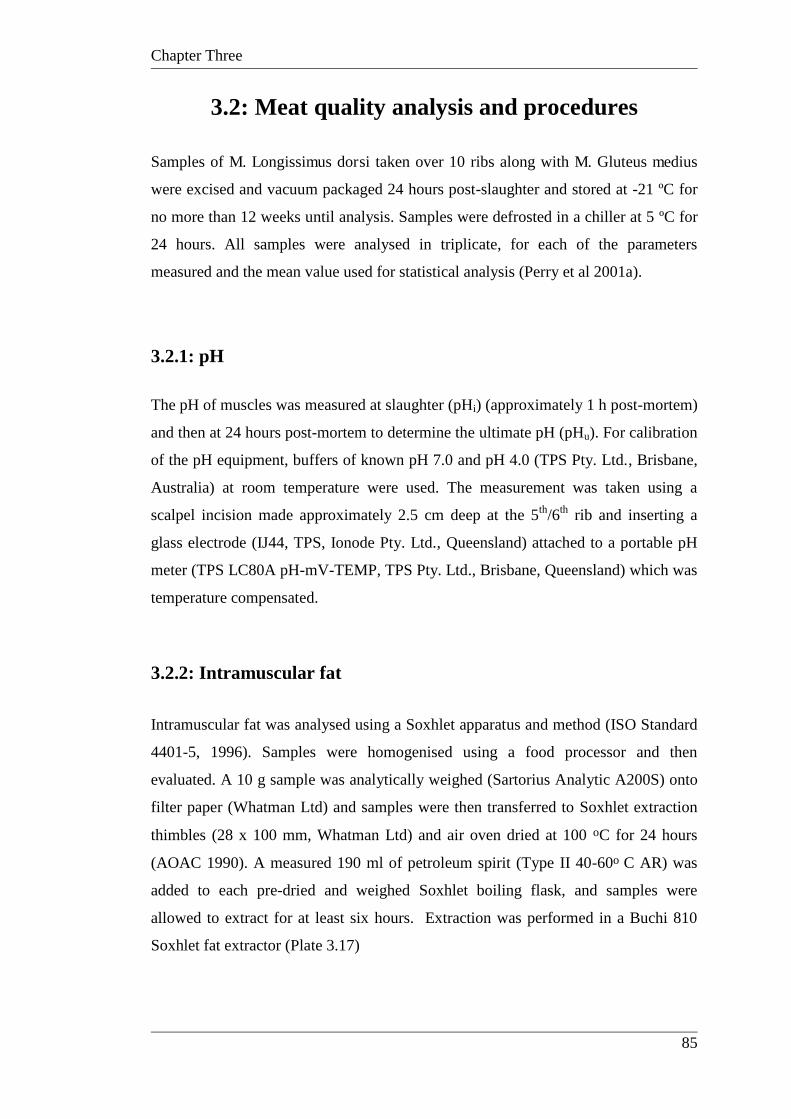
Chapter Three
85
3.2: Meat quality analysis and procedures
Samples of M. Longissimus dorsi taken over 10 ribs along with M. Gluteus medius
were excised and vacuum packaged 24 hours post-slaughter and stored at -21 ºC for
no more than 12 weeks until analysis. Samples were defrosted in a chiller at 5 ºC for
24 hours. All samples were analysed in triplicate, for each of the parameters
measured and the mean value used for statistical analysis (Perry et al 2001a).
3.2.1: pH
The pH of muscles was measured at slaughter (pHi) (approximately 1 h post-mortem)
and then at 24 hours post-mortem to determine the ultimate pH (pHu). For calibration
of the pH equipment, buffers of known pH 7.0 and pH 4.0 (TPS Pty. Ltd., Brisbane,
Australia) at room temperature were used. The measurement was taken using a
scalpel incision made approximately 2.5 cm deep at the 5th/6th rib and inserting a
glass electrode (IJ44, TPS, Ionode Pty. Ltd., Queensland) attached to a portable pH
meter (TPS LC80A pH-mV-TEMP, TPS Pty. Ltd., Brisbane, Queensland) which was
temperature compensated.
3.2.2: Intramuscular fat
Intramuscular fat was analysed using a Soxhlet apparatus and method (ISO Standard
4401-5, 1996). Samples were homogenised using a food processor and then
evaluated. A 10 g sample was analytically weighed (Sartorius Analytic A200S) onto
filter paper (Whatman Ltd) and samples were then transferred to Soxhlet extraction
thimbles (28 x 100 mm, Whatman Ltd) and air oven dried at 100 oC for 24 hours
(AOAC 1990). A measured 190 ml of petroleum spirit (Type II 40-60o C AR) was
added to each pre-dried and weighed Soxhlet boiling flask, and samples were
allowed to extract for at least six hours. Extraction was performed in a Buchi 810
Soxhlet fat extractor (Plate 3.17)
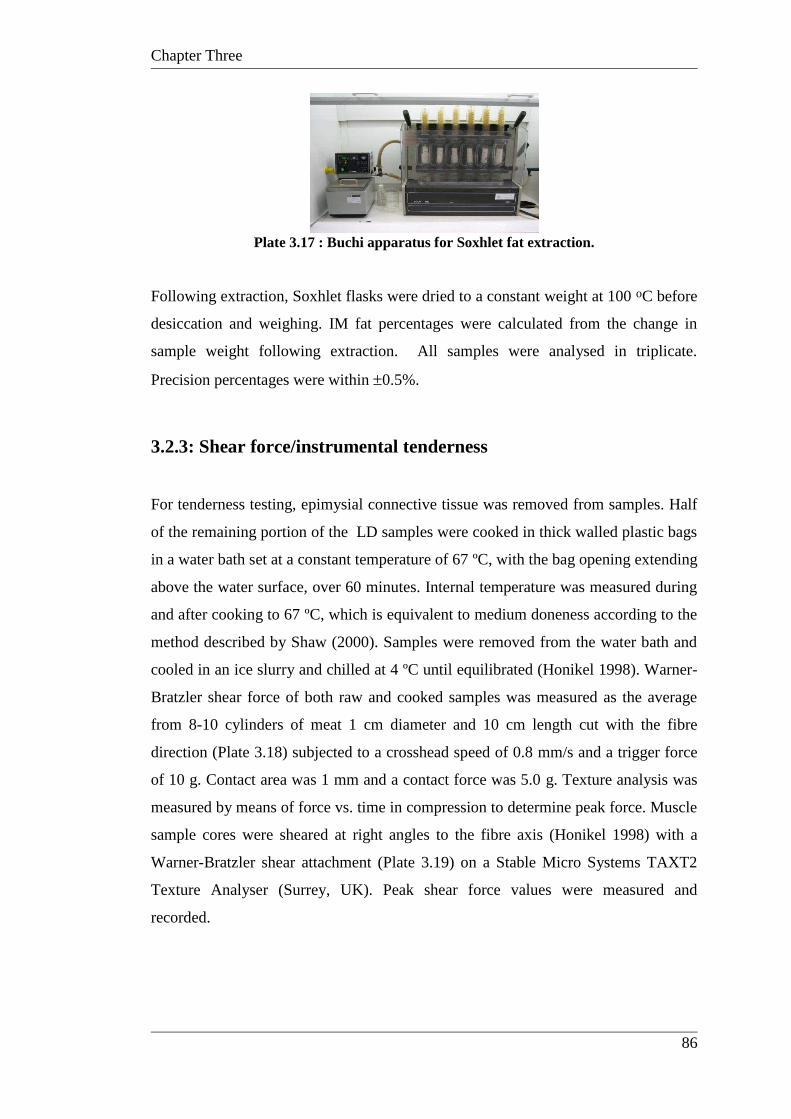
Chapter Three
86
Plate 3.17 : Buchi apparatus for Soxhlet fat extraction.
Following extraction, Soxhlet flasks were dried to a constant weight at 100 oC before
desiccation and weighing. IM fat percentages were calculated from the change in
sample weight following extraction. All samples were analysed in triplicate.
Precision percentages were within 0.5%.
3.2.3: Shear force/instrumental tenderness
For tenderness testing, epimysial connective tissue was removed from samples. Half
of the remaining portion of the LD samples were cooked in thick walled plastic bags
in a water bath set at a constant temperature of 67 ºC, with the bag opening extending
above the water surface, over 60 minutes. Internal temperature was measured during
and after cooking to 67 ºC, which is equivalent to medium doneness according to the
method described by Shaw (2000). Samples were removed from the water bath and
cooled in an ice slurry and chilled at 4 ºC until equilibrated (Honikel 1998). Warner-
Bratzler shear force of both raw and cooked samples was measured as the average
from 8-10 cylinders of meat 1 cm diameter and 10 cm length cut with the fibre
direction (Plate 3.18) subjected to a crosshead speed of 0.8 mm/s and a trigger force
of 10 g. Contact area was 1 mm and a contact force was 5.0 g. Texture analysis was
measured by means of force vs. time in compression to determine peak force. Muscle
sample cores were sheared at right angles to the fibre axis (Honikel 1998) with a
Warner-Bratzler shear attachment (Plate 3.19) on a Stable Micro Systems TAXT2
Texture Analyser (Surrey, UK). Peak shear force values were measured and
recorded.
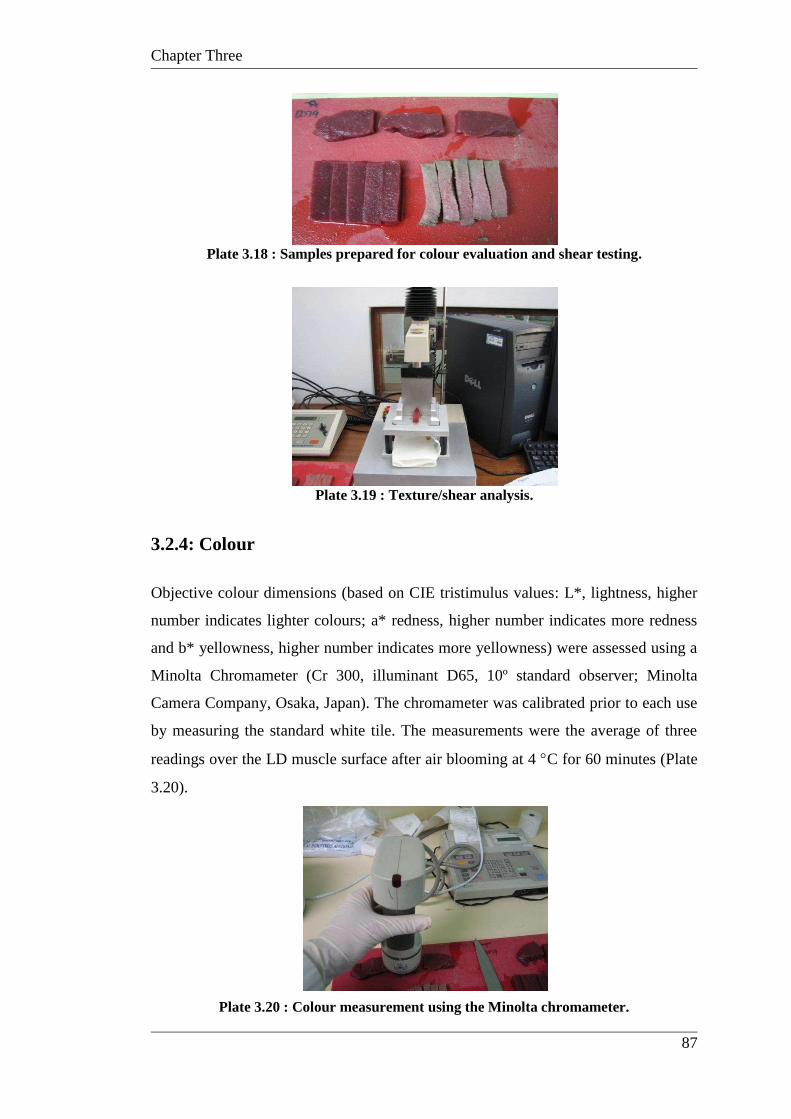
Chapter Three
87
Plate 3.18 : Samples prepared for colour evaluation and shear testing.
Plate 3.19 : Texture/shear analysis.
3.2.4: Colour
Objective colour dimensions (based on CIE tristimulus values: L*, lightness, higher
number indicates lighter colours; a* redness, higher number indicates more redness
and b* yellowness, higher number indicates more yellowness) were assessed using a
Minolta Chromameter (Cr 300, illuminant D65, 10º standard observer; Minolta
Camera Company, Osaka, Japan). The chromameter was calibrated prior to each use
by measuring the standard white tile. The measurements were the average of three
readings over the LD muscle surface after air blooming at 4 C for 60 minutes (Plate
3.20).
Plate 3.20 : Colour measurement using the Minolta chromameter.
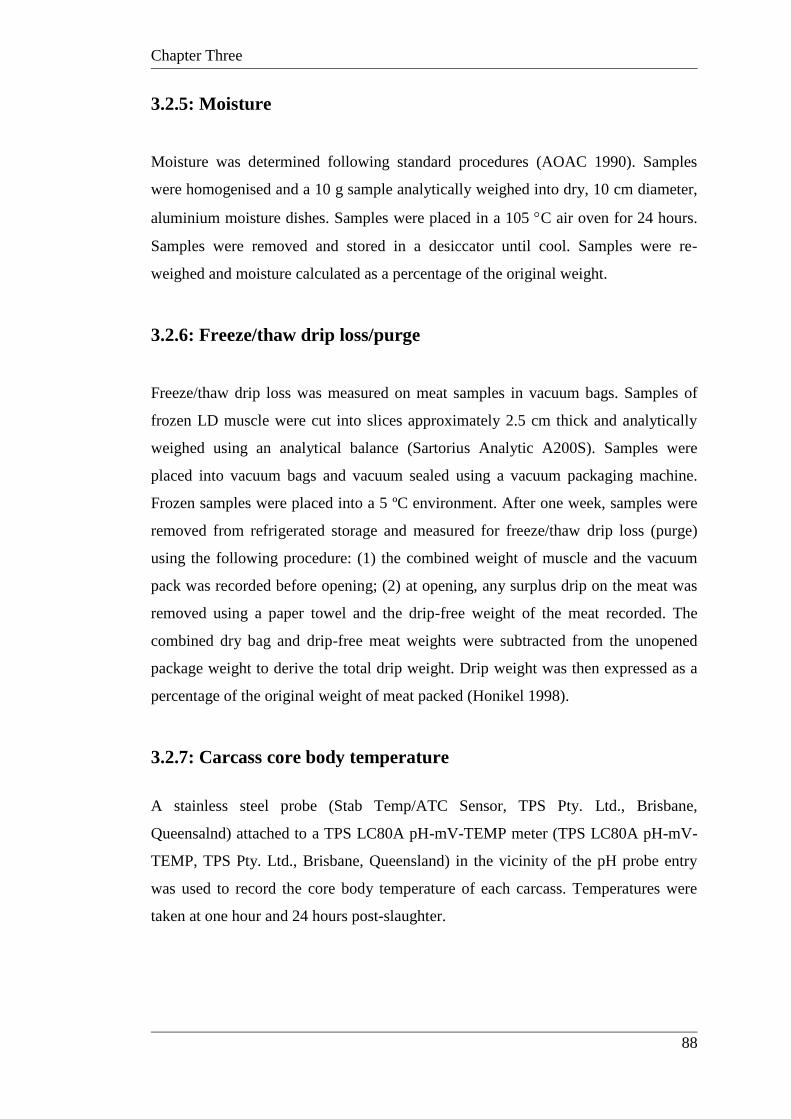
Chapter Three
88
3.2.5: Moisture
Moisture was determined following standard procedures (AOAC 1990). Samples
were homogenised and a 10 g sample analytically weighed into dry, 10 cm diameter,
aluminium moisture dishes. Samples were placed in a 105 C air oven for 24 hours.
Samples were removed and stored in a desiccator until cool. Samples were re-
weighed and moisture calculated as a percentage of the original weight.
3.2.6: Freeze/thaw drip loss/purge
Freeze/thaw drip loss was measured on meat samples in vacuum bags. Samples of
frozen LD muscle were cut into slices approximately 2.5 cm thick and analytically
weighed using an analytical balance (Sartorius Analytic A200S). Samples were
placed into vacuum bags and vacuum sealed using a vacuum packaging machine.
Frozen samples were placed into a 5 ºC environment. After one week, samples were
removed from refrigerated storage and measured for freeze/thaw drip loss (purge)
using the following procedure: (1) the combined weight of muscle and the vacuum
pack was recorded before opening; (2) at opening, any surplus drip on the meat was
removed using a paper towel and the drip-free weight of the meat recorded. The
combined dry bag and drip-free meat weights were subtracted from the unopened
package weight to derive the total drip weight. Drip weight was then expressed as a
percentage of the original weight of meat packed (Honikel 1998).
3.2.7: Carcass core body temperature
A stainless steel probe (Stab Temp/ATC Sensor, TPS Pty. Ltd., Brisbane,
Queensalnd) attached to a TPS LC80A pH-mV-TEMP meter (TPS LC80A pH-mV-
TEMP, TPS Pty. Ltd., Brisbane, Queensland) in the vicinity of the pH probe entry
was used to record the core body temperature of each carcass. Temperatures were
taken at one hour and 24 hours post-slaughter.
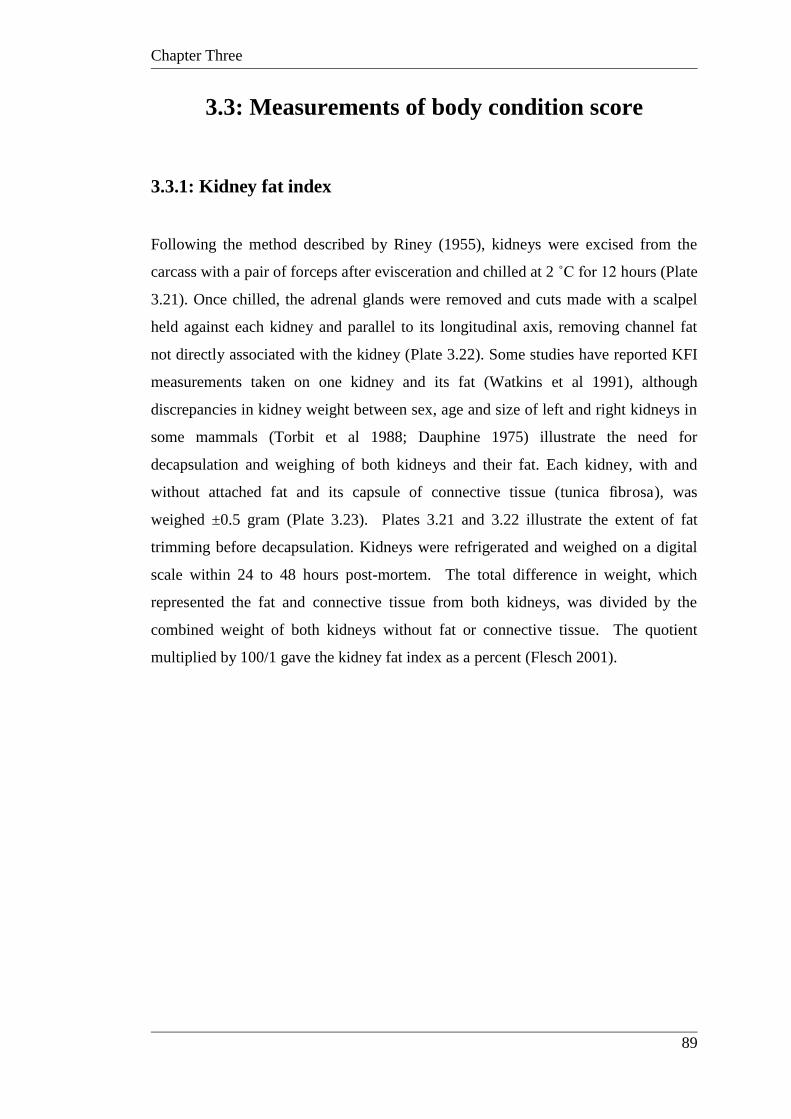
Chapter Three
89
3.3: Measurements of body condition score
3.3.1: Kidney fat index
Following the method described by Riney (1955), kidneys were excised from the
carcass with a pair of forceps after evisceration and chilled at 2 ˚C for 12 hours (Plate
3.21). Once chilled, the adrenal glands were removed and cuts made with a scalpel
held against each kidney and parallel to its longitudinal axis, removing channel fat
not directly associated with the kidney (Plate 3.22). Some studies have reported KFI
measurements taken on one kidney and its fat (Watkins et al 1991), although
discrepancies in kidney weight between sex, age and size of left and right kidneys in
some mammals (Torbit et al 1988; Dauphine 1975) illustrate the need for
decapsulation and weighing of both kidneys and their fat. Each kidney, with and
without attached fat and its capsule of connective tissue (tunica fibrosa), was
weighed ±0.5 gram (Plate 3.23). Plates 3.21 and 3.22 illustrate the extent of fat
trimming before decapsulation. Kidneys were refrigerated and weighed on a digital
scale within 24 to 48 hours post-mortem. The total difference in weight, which
represented the fat and connective tissue from both kidneys, was divided by the
combined weight of both kidneys without fat or connective tissue. The quotient
multiplied by 100/1 gave the kidney fat index as a percent (Flesch 2001).
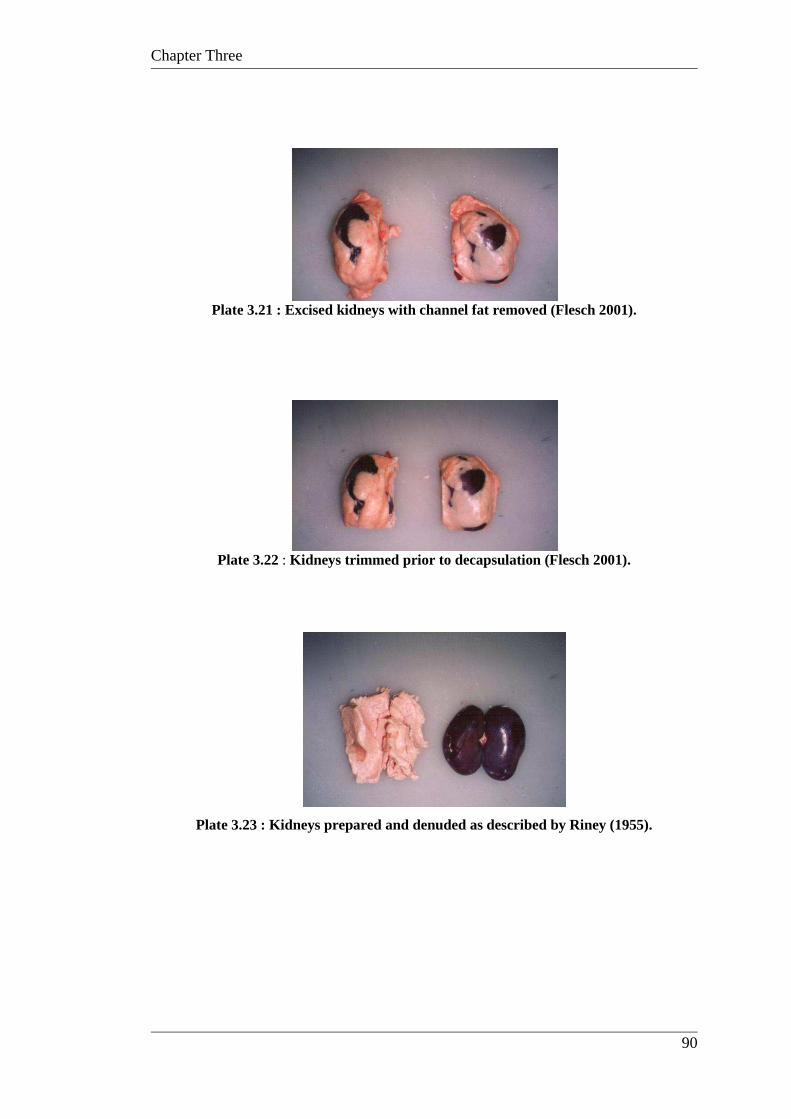
Chapter Three
90
Plate 3.21 : Excised kidneys with channel fat removed (Flesch 2001).
Plate 3.22 : Kidneys trimmed prior to decapsulation (Flesch 2001).
Plate 3.23 : Kidneys prepared and denuded as described by Riney (1955).
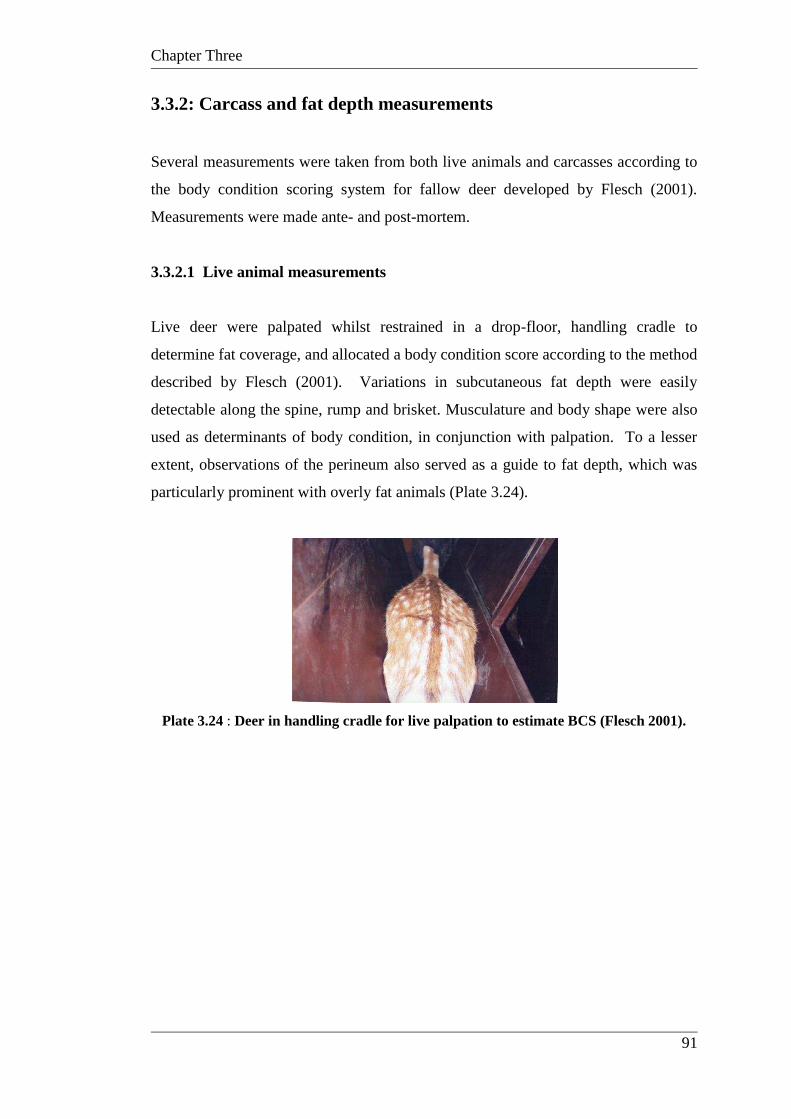
Chapter Three
91
3.3.2: Carcass and fat depth measurements
Several measurements were taken from both live animals and carcasses according to
the body condition scoring system for fallow deer developed by Flesch (2001).
Measurements were made ante- and post-mortem.
3.3.2.1 Live animal measurements
Live deer were palpated whilst restrained in a drop-floor, handling cradle to
determine fat coverage, and allocated a body condition score according to the method
described by Flesch (2001). Variations in subcutaneous fat depth were easily
detectable along the spine, rump and brisket. Musculature and body shape were also
used as determinants of body condition, in conjunction with palpation. To a lesser
extent, observations of the perineum also served as a guide to fat depth, which was
particularly prominent with overly fat animals (Plate 3.24).
Plate 3.24 : Deer in handling cradle for live palpation to estimate BCS (Flesch 2001).
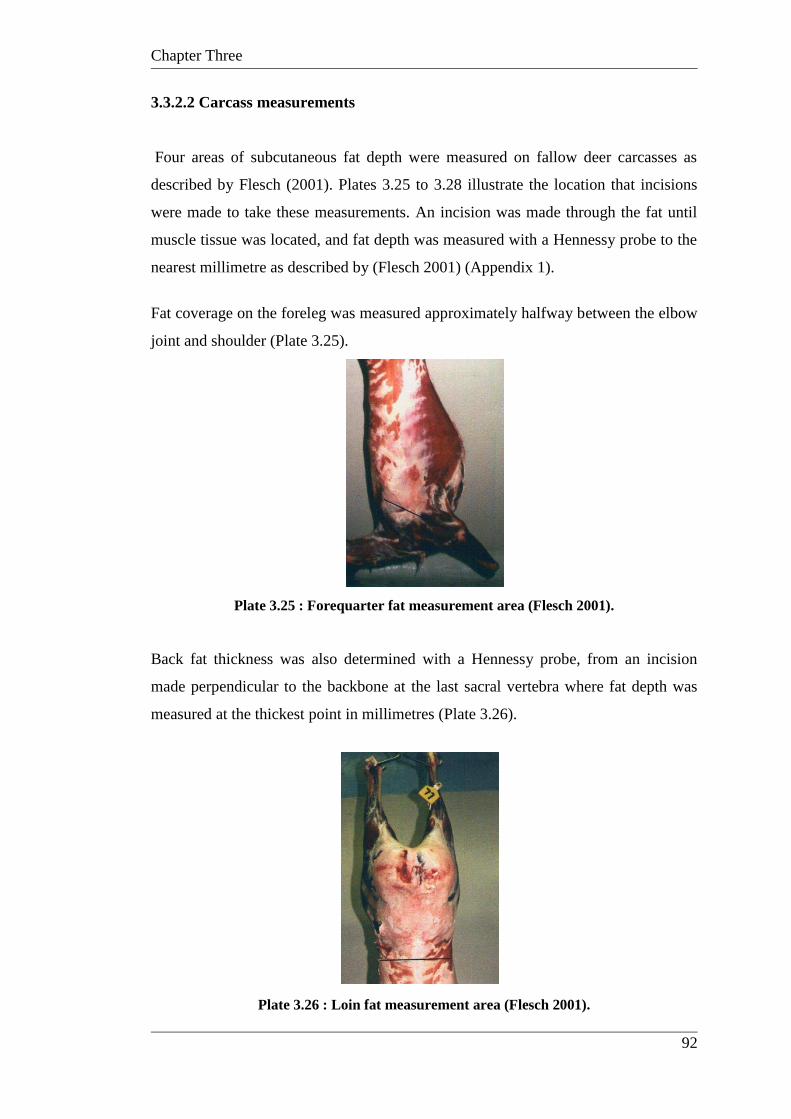
Chapter Three
92
3.3.2.2 Carcass measurements
Four areas of subcutaneous fat depth were measured on fallow deer carcasses as
described by Flesch (2001). Plates 3.25 to 3.28 illustrate the location that incisions
were made to take these measurements. An incision was made through the fat until
muscle tissue was located, and fat depth was measured with a Hennessy probe to the
nearest millimetre as described by (Flesch 2001) (Appendix 1).
Fat coverage on the foreleg was measured approximately halfway between the elbow
joint and shoulder (Plate 3.25).
Plate 3.25 : Forequarter fat measurement area (Flesch 2001).
Back fat thickness was also determined with a Hennessy probe, from an incision
made perpendicular to the backbone at the last sacral vertebra where fat depth was
measured at the thickest point in millimetres (Plate 3.26).
Plate 3.26 : Loin fat measurement area (Flesch 2001).
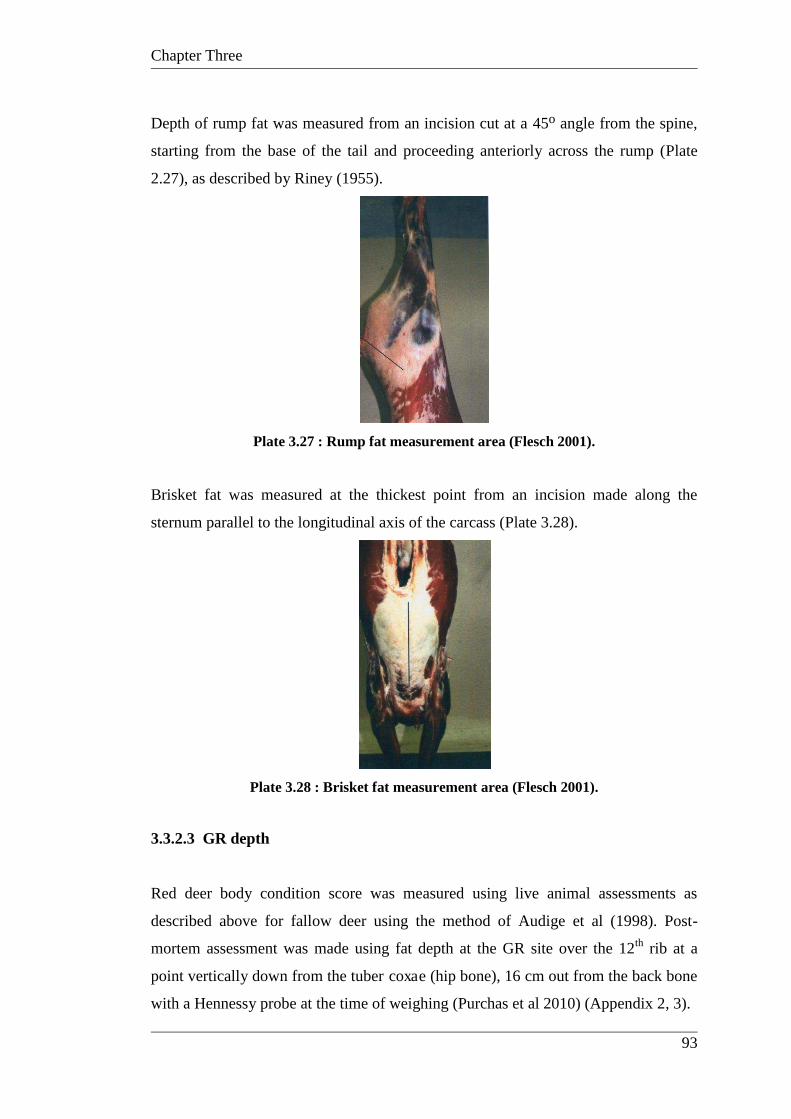
Chapter Three
93
Depth of rump fat was measured from an incision cut at a 45o angle from the spine,
starting from the base of the tail and proceeding anteriorly across the rump (Plate
2.27), as described by Riney (1955).
Plate 3.27 : Rump fat measurement area (Flesch 2001).
Brisket fat was measured at the thickest point from an incision made along the
sternum parallel to the longitudinal axis of the carcass (Plate 3.28).
Plate 3.28 : Brisket fat measurement area (Flesch 2001).
3.3.2.3 GR depth
Red deer body condition score was measured using live animal assessments as
described above for fallow deer using the method of Audige et al (1998). Post-
mortem assessment was made using fat depth at the GR site over the 12th rib at a
point vertically down from the tuber coxae (hip bone), 16 cm out from the back bone
with a Hennessy probe at the time of weighing (Purchas et al 2010) (Appendix 2, 3).
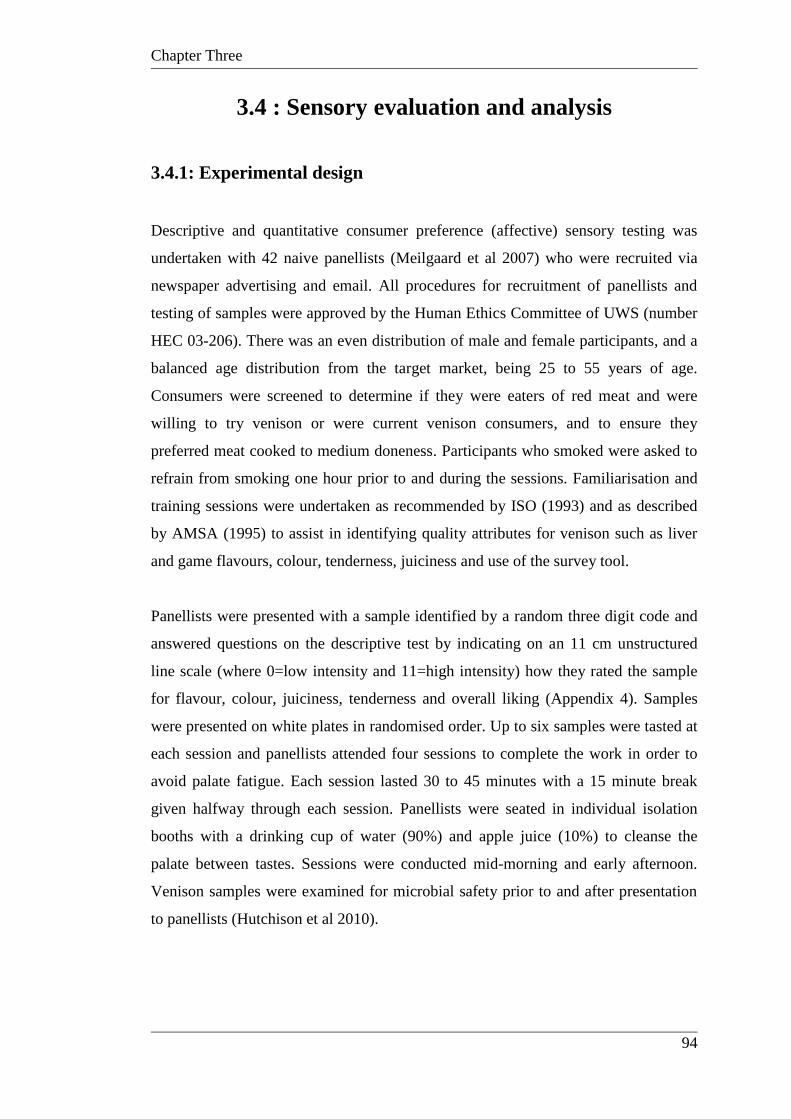
Chapter Three
94
3.4 : Sensory evaluation and analysis
3.4.1: Experimental design
Descriptive and quantitative consumer preference (affective) sensory testing was
undertaken with 42 naive panellists (Meilgaard et al 2007) who were recruited via
newspaper advertising and email. All procedures for recruitment of panellists and
testing of samples were approved by the Human Ethics Committee of UWS (number
HEC 03-206). There was an even distribution of male and female participants, and a
balanced age distribution from the target market, being 25 to 55 years of age.
Consumers were screened to determine if they were eaters of red meat and were
willing to try venison or were current venison consumers, and to ensure they
preferred meat cooked to medium doneness. Participants who smoked were asked to
refrain from smoking one hour prior to and during the sessions. Familiarisation and
training sessions were undertaken as recommended by ISO (1993) and as described
by AMSA (1995) to assist in identifying quality attributes for venison such as liver
and game flavours, colour, tenderness, juiciness and use of the survey tool.
Panellists were presented with a sample identified by a random three digit code and
answered questions on the descriptive test by indicating on an 11 cm unstructured
line scale (where 0=low intensity and 11=high intensity) how they rated the sample
for flavour, colour, juiciness, tenderness and overall liking (Appendix 4). Samples
were presented on white plates in randomised order. Up to six samples were tasted at
each session and panellists attended four sessions to complete the work in order to
avoid palate fatigue. Each session lasted 30 to 45 minutes with a 15 minute break
given halfway through each session. Panellists were seated in individual isolation
booths with a drinking cup of water (90%) and apple juice (10%) to cleanse the
palate between tastes. Sessions were conducted mid-morning and early afternoon.
Venison samples were examined for microbial safety prior to and after presentation
to panellists (Hutchison et al 2010).
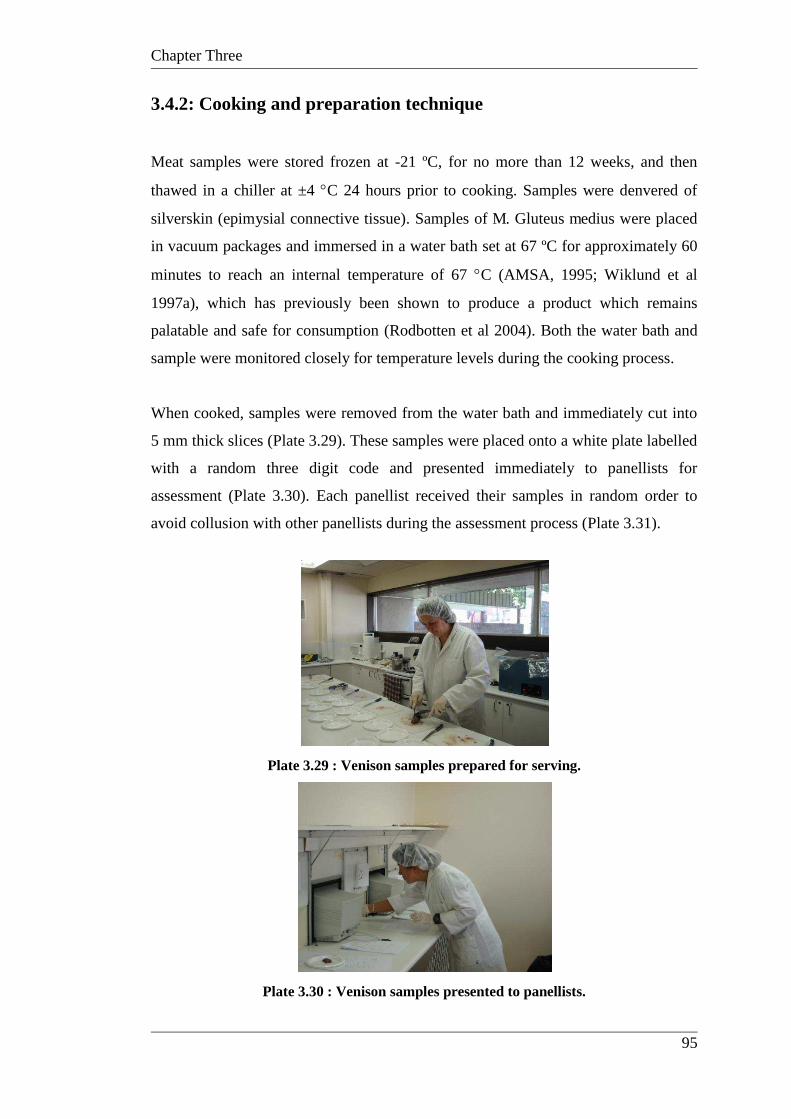
Chapter Three
95
3.4.2: Cooking and preparation technique
Meat samples were stored frozen at -21 ºC, for no more than 12 weeks, and then
thawed in a chiller at ±4 C 24 hours prior to cooking. Samples were denvered of
silverskin (epimysial connective tissue). Samples of M. Gluteus medius were placed
in vacuum packages and immersed in a water bath set at 67 ºC for approximately 60
minutes to reach an internal temperature of 67 C (AMSA, 1995; Wiklund et al
1997a), which has previously been shown to produce a product which remains
palatable and safe for consumption (Rodbotten et al 2004). Both the water bath and
sample were monitored closely for temperature levels during the cooking process.
When cooked, samples were removed from the water bath and immediately cut into
5 mm thick slices (Plate 3.29). These samples were placed onto a white plate labelled
with a random three digit code and presented immediately to panellists for
assessment (Plate 3.30). Each panellist received their samples in random order to
avoid collusion with other panellists during the assessment process (Plate 3.31).
Plate 3.29 : Venison samples prepared for serving.
Plate 3.30 : Venison samples presented to panellists.
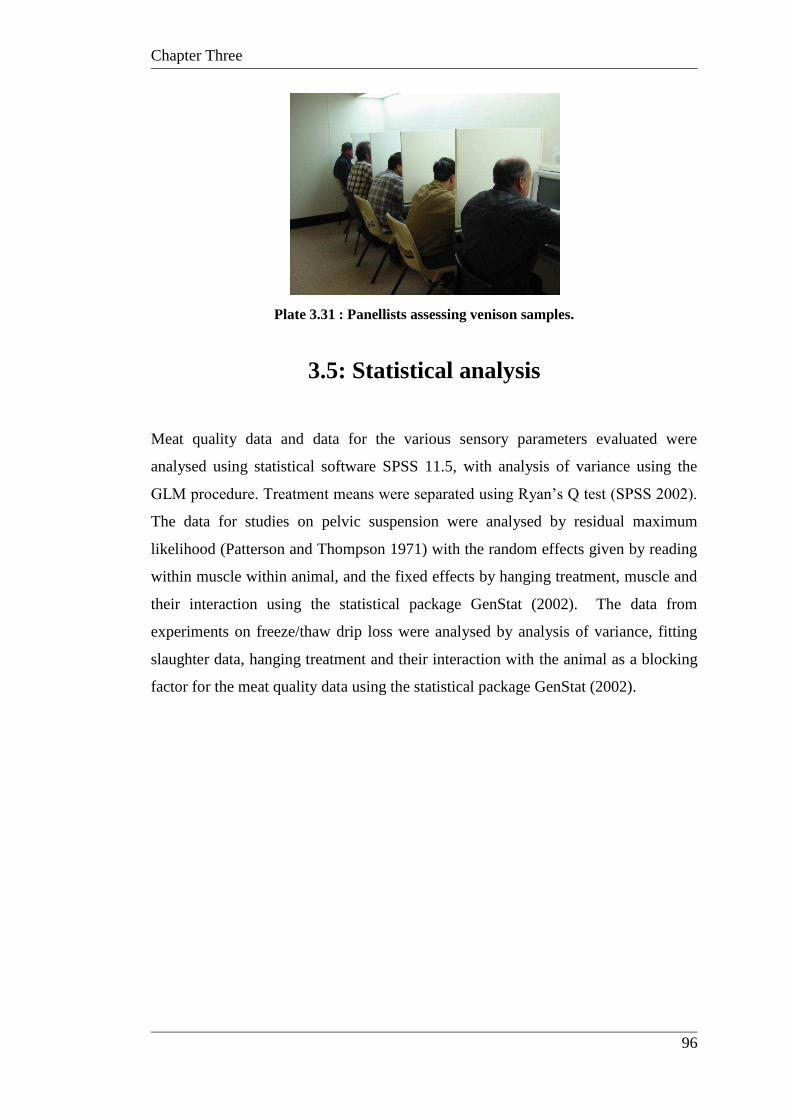
Chapter Three
96
Plate 3.31 : Panellists assessing venison samples.
3.5: Statistical analysis
Meat quality data and data for the various sensory parameters evaluated were
analysed using statistical software SPSS 11.5, with analysis of variance using the
GLM procedure. Treatment means were separated using Ryan‟s Q test (SPSS 2002).
The data for studies on pelvic suspension were analysed by residual maximum
likelihood (Patterson and Thompson 1971) with the random effects given by reading
within muscle within animal, and the fixed effects by hanging treatment, muscle and
their interaction using the statistical package GenStat (2002). The data from
experiments on freeze/thaw drip loss were analysed by analysis of variance, fitting
slaughter data, hanging treatment and their interaction with the animal as a blocking
factor for the meat quality data using the statistical package GenStat (2002).
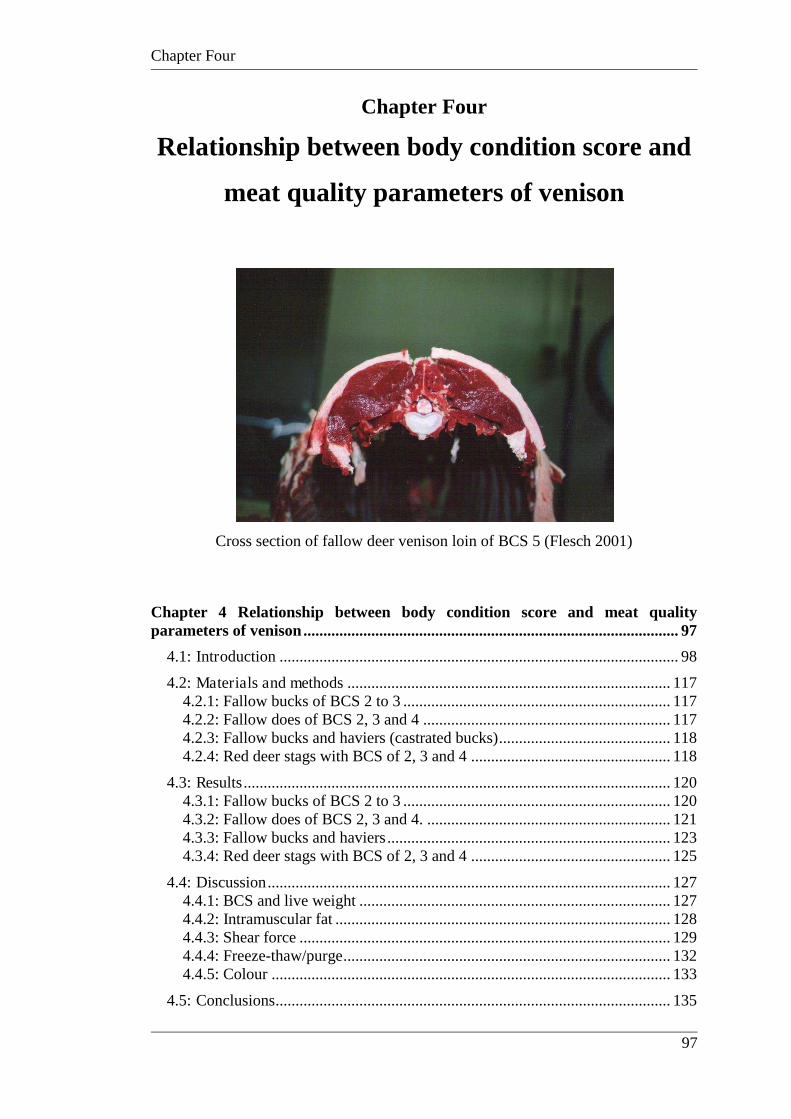
Chapter Four
97
Chapter Four
Relationship between body condition score and
meat quality parameters of venison
Cross section of fallow deer venison loin of BCS 5 (Flesch 2001)
Chapter 4 Relationship between body condition score and meat quality parameters of venison .............................................................................................. 97
4.1: Introduction .................................................................................................... 98
4.2: Materials and methods ................................................................................. 117 4.2.1: Fallow bucks of BCS 2 to 3 ................................................................... 117 4.2.2: Fallow does of BCS 2, 3 and 4 .............................................................. 117 4.2.3: Fallow bucks and haviers (castrated bucks) ........................................... 118 4.2.4: Red deer stags with BCS of 2, 3 and 4 .................................................. 118
4.3: Results ........................................................................................................... 120 4.3.1: Fallow bucks of BCS 2 to 3 ................................................................... 120 4.3.2: Fallow does of BCS 2, 3 and 4. ............................................................. 121 4.3.3: Fallow bucks and haviers ....................................................................... 123 4.3.4: Red deer stags with BCS of 2, 3 and 4 .................................................. 125
4.4: Discussion ..................................................................................................... 127 4.4.1: BCS and live weight .............................................................................. 127 4.4.2: Intramuscular fat .................................................................................... 128 4.4.3: Shear force ............................................................................................. 129 4.4.4: Freeze-thaw/purge .................................................................................. 132 4.4.5: Colour .................................................................................................... 133
4.5: Conclusions ................................................................................................... 135
Chapter Four
98
4.1: Introduction
Body condition scoring (BCS) is a non-invasive technique that has been established
in numerous animal species to determine general health status and reproductive
capabilities in both farmed and wild populations (Flesch 2001). It is a subjective
measure used to determine the condition or fat cover of an animal relative to its body
size (Evans 1978). The concept is based on the assumption that a particular fat depot
is related to reserves of body fat in the animal in a predictive way (Finger et al 1981).
The technique involves palpation of the live animal to determine the thickness of the
fat cover at various depots such as the rump, loin, brisket and perineum. Higher body
condition scores will have higher fat thicknesses.
There are a number of subjective and objective systems in use internationally as
predictors of body fat in live animals. These include various species specific BCS
systems, GR soft tissue and fat depth at the 12th rib (Hopkins 2010, 2011; Purchas et
al 2010), P8 fat depth over the rump (Pethick et al 2011), ultrasonic measurement of
the thickness of rump fat (MAXFAT) (Cook et al 2010), chest girth measurements
(Riney 1955), fat depth over the M.longissimus thorasis et lumborum (USFatC), dual
energy x-ray absorptiometry (DXA) (Dunshea et al 2007; Hopkins et al 2007), CT
scanning (Asher et al 2011) and video image analysis (VIAScan) (Jopson et al 2005;
Rius-Vilarrasa et al 2007; Hopkins 2010, 2011). Many of these techniques are used
either in isolation or combined to allow reliable estimation of body fat. Animals
destined for slaughter may also undergo post-mortem measures of various fat
indices, such as kidney fat index (KFI) and subcutaneous fat depths, to confirm BCS.
Estimations of BCS in live animals are only as reliable as the trained assessor
conducting the scoring and may be combined with other techniques such as
ultrasonography to enhance accuracy. Once trained and practised, an assessor may
quickly and accurately assign a BCS to a production animal (Phythian et al 2012) in
a handling cradle or free standing in a pen with a minimum of distress (Flesch 2001).
Recent studies in dairy cattle have examined the potential of digital imaging as a
method of automating BCS assessment (Bewley et al 2008; Azzaro et al 2011).
Chapter Four
99
The body condition of an animal is reflective of its nutritional status. It is a technique
that is fundamental to successful farming and reproductive performance of
ruminants, and also in establishing relationships between animal populations and
their habitats in wild ruminant populations (Torbit el al 1988). In farmed ruminants,
live weight may also reflect nutritional status and possible meat yield, however, it
does not account for variation in genotype within the same species, where some
animals may have larger body frames or musculature than another animal of the
same weight.
Estimation of body condition score has been reported for a number of wild
populations of ungulates in an attempt to relate body fat indices to animal condition,
population density and environment (Flesch 2001). In wild populations, only visual
assessment is generally possible (Riney 1955; Watson 1971) and accuracy is
hampered by seasonal variation in coat thickness and the flight distance of the wild
ungulates. Therefore, body condition scoring of wild ungulates has usually
necessitated post-mortem assessment on representative animals from a given
population. Post-mortem measures of kidney fat and fat indices, such as
subcutaneous fat measures, have been assessed in wild populations and the
techniques transferred and implemented in domestic ruminants (Flesch 2001). The
techniques have been documented for free ranging red deer (Riney 1955) and wild
populations of mule deer (Finger et al 1981) and impala (Anderson 1965).
Relationships between animal condition and fat indices have been documented in a
number of wild ungulate populations, namely white-tailed deer (Robbins et al 1974;
Kie et al 1983; Brown et al 1995); pronghorn (Depperschmidt et al 1987), mule deer
(Torbit et al 1988; Tollefson et al 2010;); elk (Greer 1968; Hunt 1979; Cook et al
2001; Piasecke and Bender 2009); caribou (Dauphine 1975; Chan McLeod et al
1999; Couturier et al 2009); moose (Testa and Adams 1998; DelGiudice et al 2011);
muskoxen (Adamczewski et al 1995); reedbuck (Taylor et al 2005); and impala
(Gaidet and Gaillard 2008). A recent study by Bishop et al (2009) with free ranging
mule deer also examined the potential for evaluating body condition using serum
thyroid hormone concentration in blood samples. The study determined that BCS
should be used whenever possible, although blood chemistry can also be a reasonable
predictor of body condition in wild ungulate populations (Bishop et al 2009). A
Chapter Four
100
number of studies have been conducted on blood metabolites and their relationship
with body condition and nutritional adequacy (Russel et al 1967; Annison 1960;
Annison et al 1984). The utilisation of these techniques is limited commercially by
the invasive nature and extensive animal handling required in the collection of blood
samples.
The majority of farmed ruminant species have been studied in relation to body
condition, and scoring systems have been developed as an aid for producers when
assessing nutritional status and reproductive performance. Studies have been
conducted in dairy cattle (Garnsworthy and Jones, 1987; Edmonson et al 1989;
Gregory et al 1998; Busato et al 2002; Al Ibrahim et al 2010; Dewhurst et al 2010;
Azzaro et al 2011); beef cattle (Jonhson et al 1972; Lowman et al 1976; Gresham et
al 1986; Nicholson and Sayers 1987; Bullock et al 1991; Perry and Fox 1996;
Markusfeld et al 1997; Dixon et al 2011); sheep (Jefferies 1961; Russel et al 1969;
Pollott and Kilkenny 1976; Butterfield et al 1983; Hopkins et al 1995b; Esmailizadeh
et al 2009; Herrera et al 2010; Maurya et al 2009, 2010; McGregor 2010; Kenyon et
al 2004, 2011); goats (Mitchell, 1986; May et al 1995; Barbosa et al 2009; Rivas-
Munoz et al 2010; Serin et al 2010; Agga et al 2011; Mendizabal et al 2011); red
deer (Kay et al 1981; Audige et al 1998, Hansen 2000); and fallow deer (Flesch
2001). Other production species have also been examined including pigs (Elsley et al
1964; Matousek et al 2011), poultry (Gregory and Robins 1998) and horses
(Henneke 1985; Dugdale et al 2011). BCS has also been used for evaluating the
condition of animals prior to determining their suitability for live export (Gaden et al
2005).
BCS may also be used as a guide for producers and processors when attempting to
achieve optimal slaughter condition in production animals. Currently, live weight is
the most commonly used parameter for determining slaughter suitability. Australia
has adopted the GR fat depth measurement technique, with slaughter animals
described by weight and fat level, however, greater scrutiny of the accuracy and
precision of such measures is needed to make them truly valued and useful
throughout the marketing chain (Hopkins 2011). There are discrepancies in findings
on the relationship of live weight to BCS. Live weight does not take into account
differences between breeds or genotypes within a species. It is possible that two
Chapter Four
101
animals may be identical slaughter weights and yet have different ratios of
muscle:bone, eye muscle area and yield of saleable cuts. Flesch (2001) found that
BCS was not significantly correlated with live weight when studying fallow deer
with liveweights ranging between 36 and 65 kg. Heavier boned and larger framed
Mesopotamian hybrid fallow deer had lower fat deposition than similar live weight
European fallow deer. Hopkins et al (1996) found that live weight in lambs was a
poor predictor of carcass fat depth at the GR site and LD fat depth. A study on
Angora goats and Merinos in southern Australia found a highly correlated
relationship between BCS and live weight (McGregor 2010), as did Glimp et al
(1998) and Sanson et al (1993) on studies of ewes. Linear relationships were
established for beef cattle for live weight, carcass weight, dressing percentage, eye
muscle area, fat thickness, muscle:bone ratio and yield (Apple et al 1999). Mitchell
et al (1976) found relationships between bodyweight and BCS in free ranging red
deer. Wilson and Audige (1996) examined target setting for BCS and body weights
in red deer, and formulated targets for production minimums and optimums. They
found that bodyweight alone provided a critical and accurate marker for venison
production. However, they also determined that setting targets for growth or BCS
was essential for producers to be able to supply specified product to venison markets.
Body condition indices are also measured post-mortem to validate visual or live
animal palpation assessment (Flesch 2001). BCS is frequently confirmed using three
areas of accumulated fat reserves, i.e. kidney fat index (KFI) (Riney 1955), bone
marrow fat (BMF) and subcutaneous fat (Harris 1945; Riney 1955). Fat reserves
provide a good indication of body condition and are deposited in animals in a pre-
determined sequence: initially in the bone marrow, then around the kidney and other
organs, followed by subcutaneously, and finally intramuscularly (Hammond 1932).
This theory is supported by Harris (1945), Riney (1955) and Jopson et al (1997) who
also examined mobilisation of fat stores during periods of feed deprivation, which
occurs in reverse order to deposition.
KFI is calculated using the ratio of perirenal fat to kidney weight (Flesch 2001). The
weight of the kidney is assumed to be relative to body size and provides the
benchmark from which deposition or mobilisation of fat can be measured (Batchelor
and Clarke 1970). This theory was disputed in a number of studies on seasonal
Chapter Four
102
variations in weight of kidneys in caribou (Dauphine 1975; Gerhart et al 1996); mule
deer (Torbit et al 1988); and wild sheep (van Vuren and Coblentz 1985). It is
understood that kidneys size decreases in malnourished deer (Torbit et al 1985) and
therefore may not always be an accurate indicator of body condition due to changes
in kidney weight, in animals experiencing, or recovering from, periods of
malnutrition.
KFI has been studied in white tailed deer (Ransom 1965; Finger et al 1981; Johns et
al 1984); mule deer (Anderson et al 1972; Torbit et al 1988); red deer (Riney 1955;
Batcheler and Clarke 1970; Suttie 1983); feral sheep (van Vuren and Coblentz); tahr
(Anderson and Henderson 1961); hares (Flux 1971); elk (Flook 1967); pronghorn
(Bear 1971); and chamois (Perezbarberia et al 1998). It is generally accepted as a
reliable indicator of body fat reserves, although as described previously, there is
decreased predictability in emaciated animals with very low KFI values (Ransom
1965). Suttie (1983) examined the relationship between KFI and BMF as an indicator
of BCS in red deer stags, and determined that KFI was not a reliable measure of total
body fat reserves in very lean animals (below BCS 2) without also examining BMF
and subcutaneous fat. These findings were confirmed in fallow deer (Flesch 2001).
For animals in poor condition, the most reliable indicator of body condition is bone
marrow fat (Riney 1955; Ransom 1965), used in conjunction with KFI or other
indices.
Other indicators of animal condition include animal height and chest girth
measurements. These techniques have been utilised in a number of studies relating
seasonal fluctuations to animal condition (Riney 1955; Weckerley et al 1987;
Houghton et al 1990). These methods of assessment have had limited success in
relation to determining body condition and are more closely correlated with live
weight (Smart et al 1973; Millspaugh and Brundige 1996), with limited application
in assessments on wild deer. The amount of animal handling required to undertake
these assessments in domestic species makes it less applicable in commercial
farming situations where large numbers of animals are being assessed. When live
weight is included in the equation with chest girth and animal height measurements
in beef cows, there is better correlation with body condition (Houghton et al 1990);
when used in isolation, palpation was found to be more accurate (Klosterman et al
Chapter Four
103
1968; Nelsen et al 1985). Flesch (2001) demonstrated that chest girth in BCS 4
fallow deer was significantly larger than BCS 2 and BCS 3, however the differences
between each score were insignificant. He concluded that they were not correlated
with any other condition indices. Therefore, height:weight ratios and chest girth
relationships were not practical or accurate methods of estimating body condition.
Combining palpation and visual assessment of BCS with other indicators such as
KFI, measures of subcutaneous fat, BMF, live weight and chest girth measurements
increased the accuracy of carcass composition predictions (Kistner et al 1980;
Depperschmidt et al 1987). Estimation of BCS by palpation is a rapid, noninvasive
method and the most common, and potentially accurate, method of assessing BCS
ante-mortem in large numbers of animals (Audige et al 1998). The BCS of breeding
and slaughter stock provides useful insights into management practices and
nutritional status of individual animals. Fatty deposits are only palpable in animals of
good condition, however, prominence of the spine, pelvis, sternum and ribs are used
as indicators of the presence or absence of fat deposits. Body shape and musculature
also form part of the visual and palpable assessment of BCS (Flesch 2001).
Several studies have examined the relationship between BCS or GR fat and tissue
depth with carcass composition and meat yield in sheep (Russel et al 1969; Glimp et
al 1998; Safari et al 2000; Ponnampalam et al 2007); dairy cows (Gresham et al
1986; Gregory et al 1998); beef cattle (Ledger and Hutchison 1962; Charles 1974;
Hinks and Prescott 1974; Faulkner et al 1990; Vieira et al 2007); and goats
(Greenwood et al 2008), however, no links were made to meat quality parameters.
GR fat depths have been identified as the most significant variable in prediction of
percentage yield of saleable cuts in lamb (Hopkins et al 1995b). This finding was
confirmed by Lambe et al (2009), where subcutaneous fat depth was found to
improve predictions of carcass composition and IMF in lamb carcasses.
Confirmation of BCS significantly improved accuracy of estimation when combined
with HCW and fat depth over the eye muscle area. The results indicated that as body
condition or conformation score increases, yield increased (Hopkins et al 1995b).
The predominant method in Australia for predicting meat yield in lamb carcasses is
HCW and tissue depth at the GR site (Hopkins 2008).
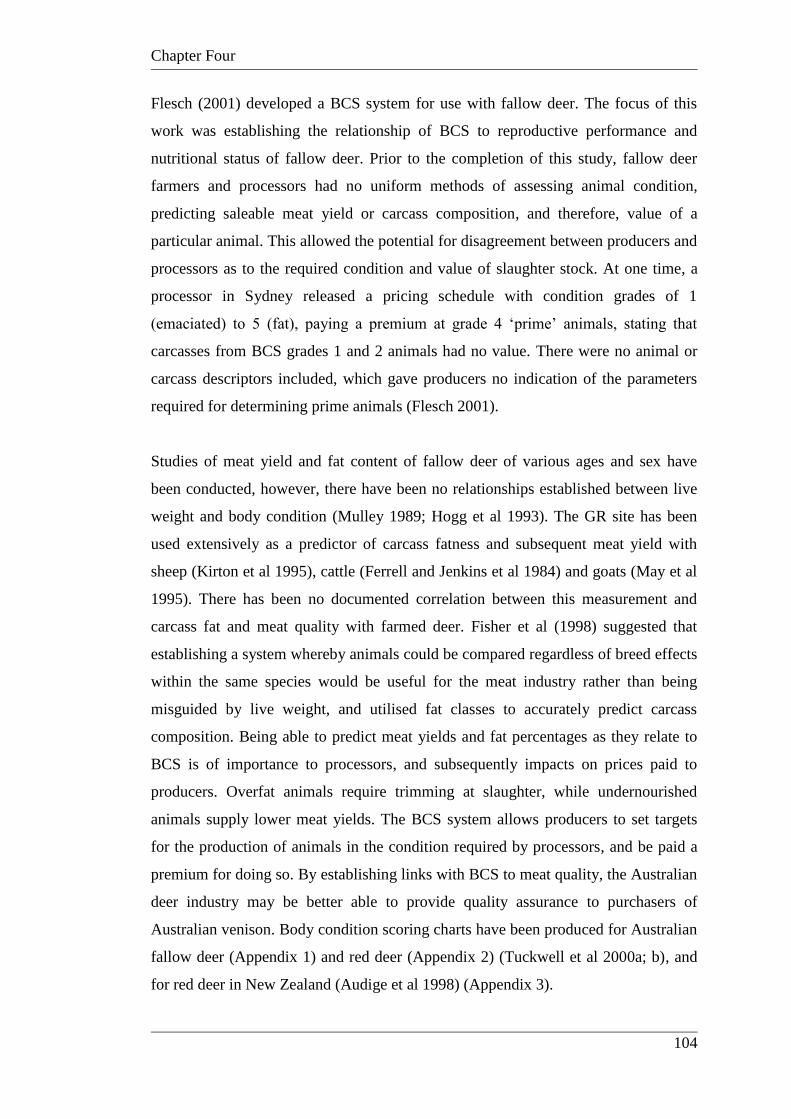
Chapter Four
104
Flesch (2001) developed a BCS system for use with fallow deer. The focus of this
work was establishing the relationship of BCS to reproductive performance and
nutritional status of fallow deer. Prior to the completion of this study, fallow deer
farmers and processors had no uniform methods of assessing animal condition,
predicting saleable meat yield or carcass composition, and therefore, value of a
particular animal. This allowed the potential for disagreement between producers and
processors as to the required condition and value of slaughter stock. At one time, a
processor in Sydney released a pricing schedule with condition grades of 1
(emaciated) to 5 (fat), paying a premium at grade 4 „prime‟ animals, stating that
carcasses from BCS grades 1 and 2 animals had no value. There were no animal or
carcass descriptors included, which gave producers no indication of the parameters
required for determining prime animals (Flesch 2001).
Studies of meat yield and fat content of fallow deer of various ages and sex have
been conducted, however, there have been no relationships established between live
weight and body condition (Mulley 1989; Hogg et al 1993). The GR site has been
used extensively as a predictor of carcass fatness and subsequent meat yield with
sheep (Kirton et al 1995), cattle (Ferrell and Jenkins et al 1984) and goats (May et al
1995). There has been no documented correlation between this measurement and
carcass fat and meat quality with farmed deer. Fisher et al (1998) suggested that
establishing a system whereby animals could be compared regardless of breed effects
within the same species would be useful for the meat industry rather than being
misguided by live weight, and utilised fat classes to accurately predict carcass
composition. Being able to predict meat yields and fat percentages as they relate to
BCS is of importance to processors, and subsequently impacts on prices paid to
producers. Overfat animals require trimming at slaughter, while undernourished
animals supply lower meat yields. The BCS system allows producers to set targets
for the production of animals in the condition required by processors, and be paid a
premium for doing so. By establishing links with BCS to meat quality, the Australian
deer industry may be better able to provide quality assurance to purchasers of
Australian venison. Body condition scoring charts have been produced for Australian
fallow deer (Appendix 1) and red deer (Appendix 2) (Tuckwell et al 2000a; b), and
for red deer in New Zealand (Audige et al 1998) (Appendix 3).
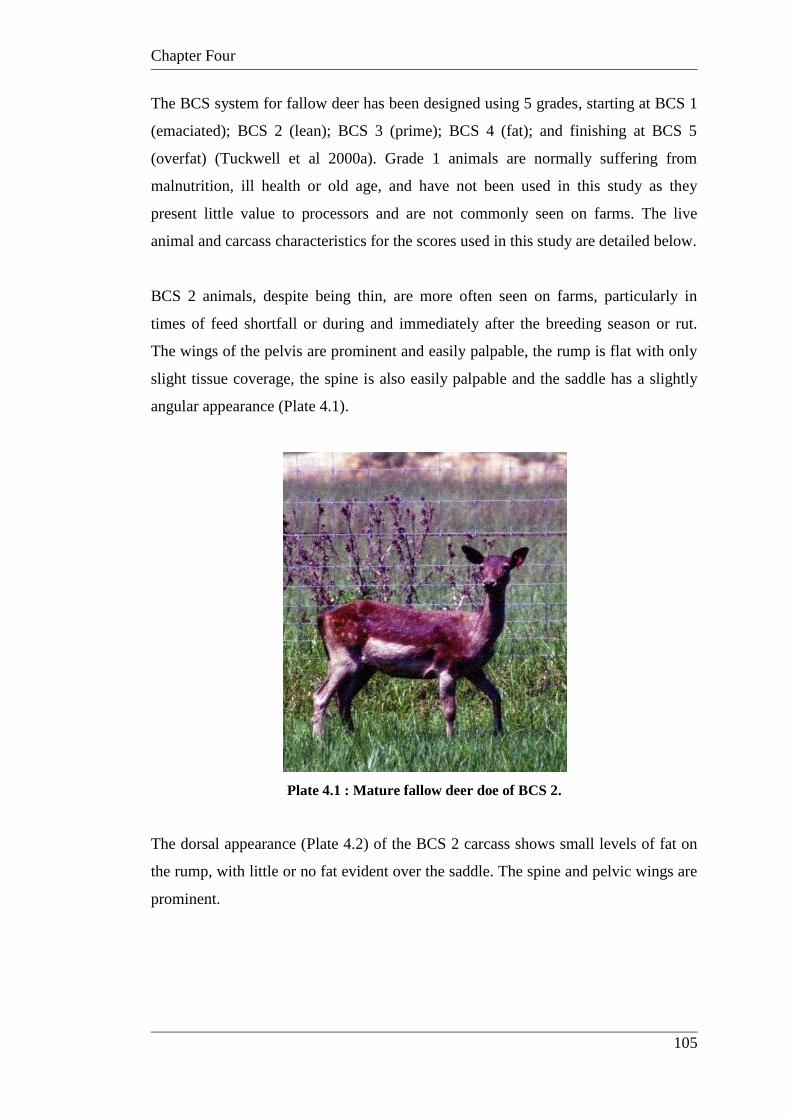
Chapter Four
105
The BCS system for fallow deer has been designed using 5 grades, starting at BCS 1
(emaciated); BCS 2 (lean); BCS 3 (prime); BCS 4 (fat); and finishing at BCS 5
(overfat) (Tuckwell et al 2000a). Grade 1 animals are normally suffering from
malnutrition, ill health or old age, and have not been used in this study as they
present little value to processors and are not commonly seen on farms. The live
animal and carcass characteristics for the scores used in this study are detailed below.
BCS 2 animals, despite being thin, are more often seen on farms, particularly in
times of feed shortfall or during and immediately after the breeding season or rut.
The wings of the pelvis are prominent and easily palpable, the rump is flat with only
slight tissue coverage, the spine is also easily palpable and the saddle has a slightly
angular appearance (Plate 4.1).
Plate 4.1 : Mature fallow deer doe of BCS 2.
The dorsal appearance (Plate 4.2) of the BCS 2 carcass shows small levels of fat on
the rump, with little or no fat evident over the saddle. The spine and pelvic wings are
prominent.
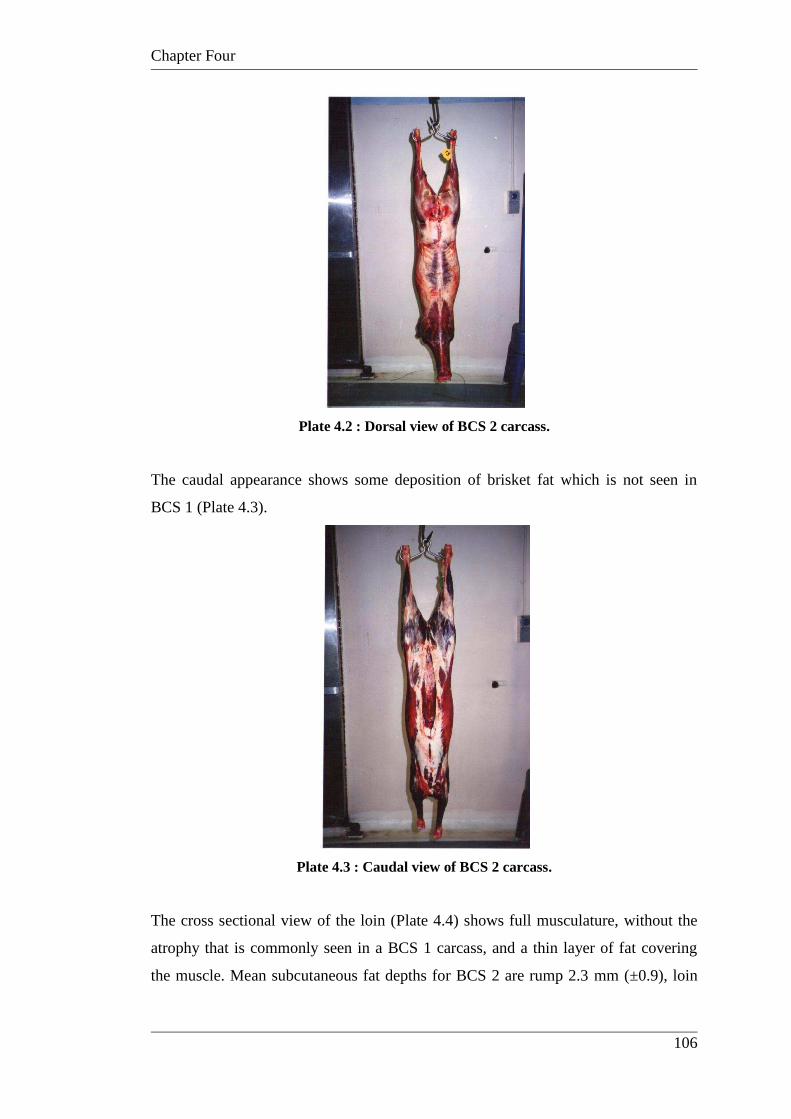
Chapter Four
106
Plate 4.2 : Dorsal view of BCS 2 carcass.
The caudal appearance shows some deposition of brisket fat which is not seen in
BCS 1 (Plate 4.3).
Plate 4.3 : Caudal view of BCS 2 carcass.
The cross sectional view of the loin (Plate 4.4) shows full musculature, without the
atrophy that is commonly seen in a BCS 1 carcass, and a thin layer of fat covering
the muscle. Mean subcutaneous fat depths for BCS 2 are rump 2.3 mm (±0.9), loin
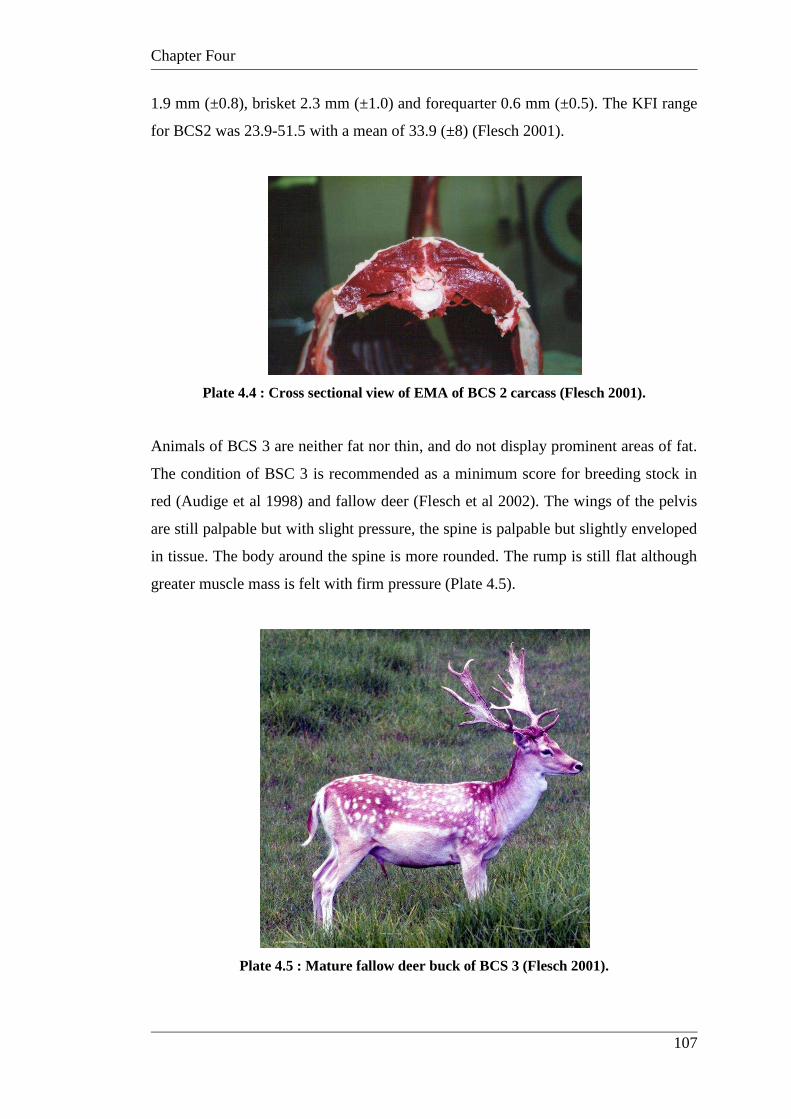
Chapter Four
107
1.9 mm (±0.8), brisket 2.3 mm (±1.0) and forequarter 0.6 mm (±0.5). The KFI range
for BCS2 was 23.9-51.5 with a mean of 33.9 (±8) (Flesch 2001).
Plate 4.4 : Cross sectional view of EMA of BCS 2 carcass (Flesch 2001).
Animals of BCS 3 are neither fat nor thin, and do not display prominent areas of fat.
The condition of BSC 3 is recommended as a minimum score for breeding stock in
red (Audige et al 1998) and fallow deer (Flesch et al 2002). The wings of the pelvis
are still palpable but with slight pressure, the spine is palpable but slightly enveloped
in tissue. The body around the spine is more rounded. The rump is still flat although
greater muscle mass is felt with firm pressure (Plate 4.5).
Plate 4.5 : Mature fallow deer buck of BCS 3 (Flesch 2001).
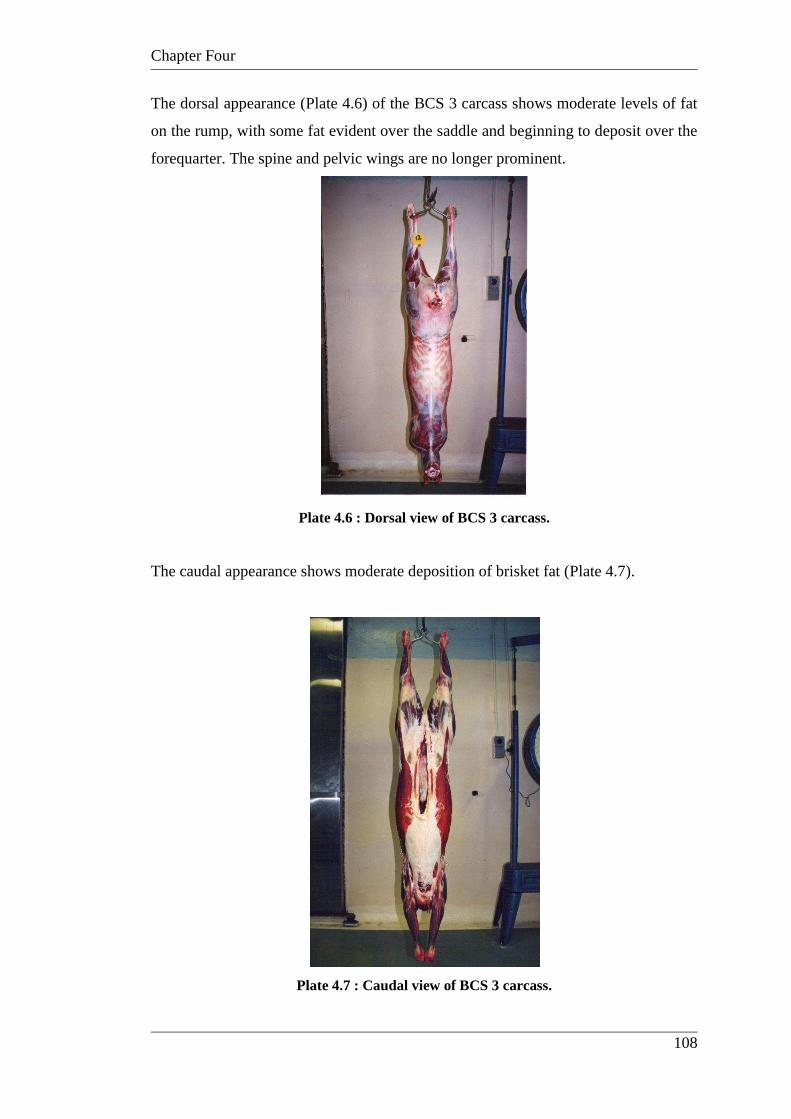
Chapter Four
108
The dorsal appearance (Plate 4.6) of the BCS 3 carcass shows moderate levels of fat
on the rump, with some fat evident over the saddle and beginning to deposit over the
forequarter. The spine and pelvic wings are no longer prominent.
Plate 4.6 : Dorsal view of BCS 3 carcass.
The caudal appearance shows moderate deposition of brisket fat (Plate 4.7).
Plate 4.7 : Caudal view of BCS 3 carcass.
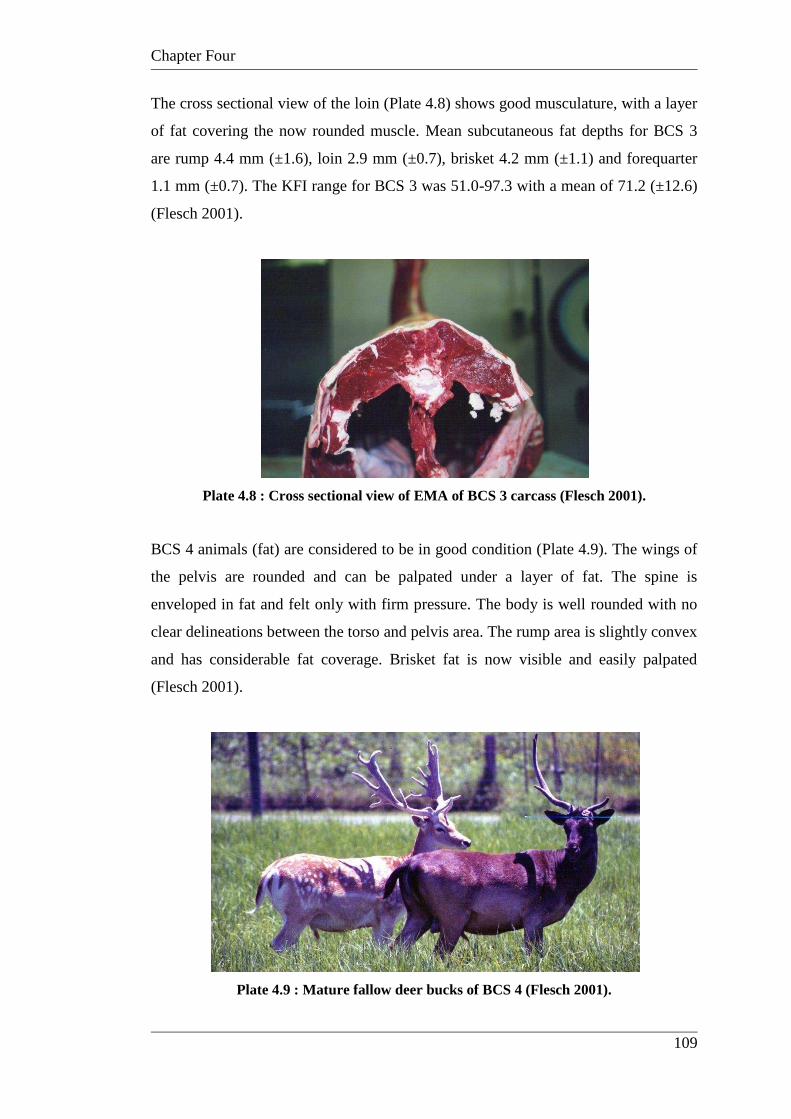
Chapter Four
109
The cross sectional view of the loin (Plate 4.8) shows good musculature, with a layer
of fat covering the now rounded muscle. Mean subcutaneous fat depths for BCS 3
are rump 4.4 mm (±1.6), loin 2.9 mm (±0.7), brisket 4.2 mm (±1.1) and forequarter
1.1 mm (±0.7). The KFI range for BCS 3 was 51.0-97.3 with a mean of 71.2 (±12.6)
(Flesch 2001).
Plate 4.8 : Cross sectional view of EMA of BCS 3 carcass (Flesch 2001).
BCS 4 animals (fat) are considered to be in good condition (Plate 4.9). The wings of
the pelvis are rounded and can be palpated under a layer of fat. The spine is
enveloped in fat and felt only with firm pressure. The body is well rounded with no
clear delineations between the torso and pelvis area. The rump area is slightly convex
and has considerable fat coverage. Brisket fat is now visible and easily palpated
(Flesch 2001).
Plate 4.9 : Mature fallow deer bucks of BCS 4 (Flesch 2001).
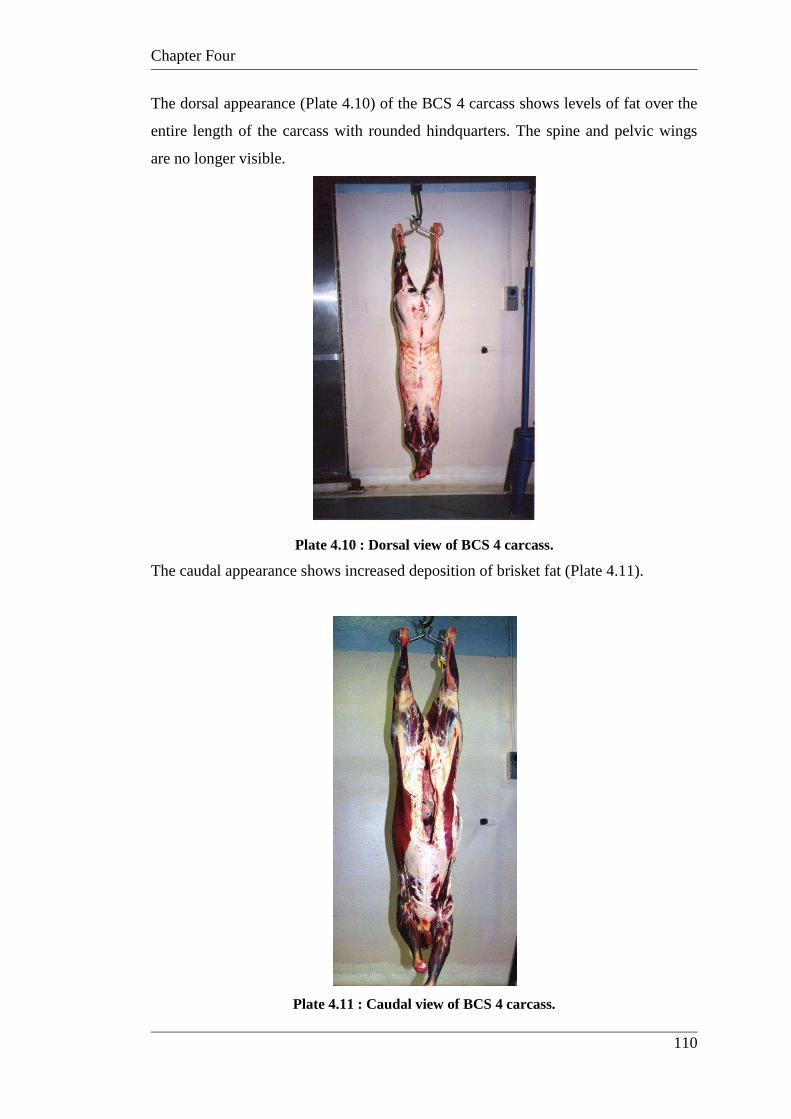
Chapter Four
110
The dorsal appearance (Plate 4.10) of the BCS 4 carcass shows levels of fat over the
entire length of the carcass with rounded hindquarters. The spine and pelvic wings
are no longer visible.
Plate 4.10 : Dorsal view of BCS 4 carcass.
The caudal appearance shows increased deposition of brisket fat (Plate 4.11).
Plate 4.11 : Caudal view of BCS 4 carcass.
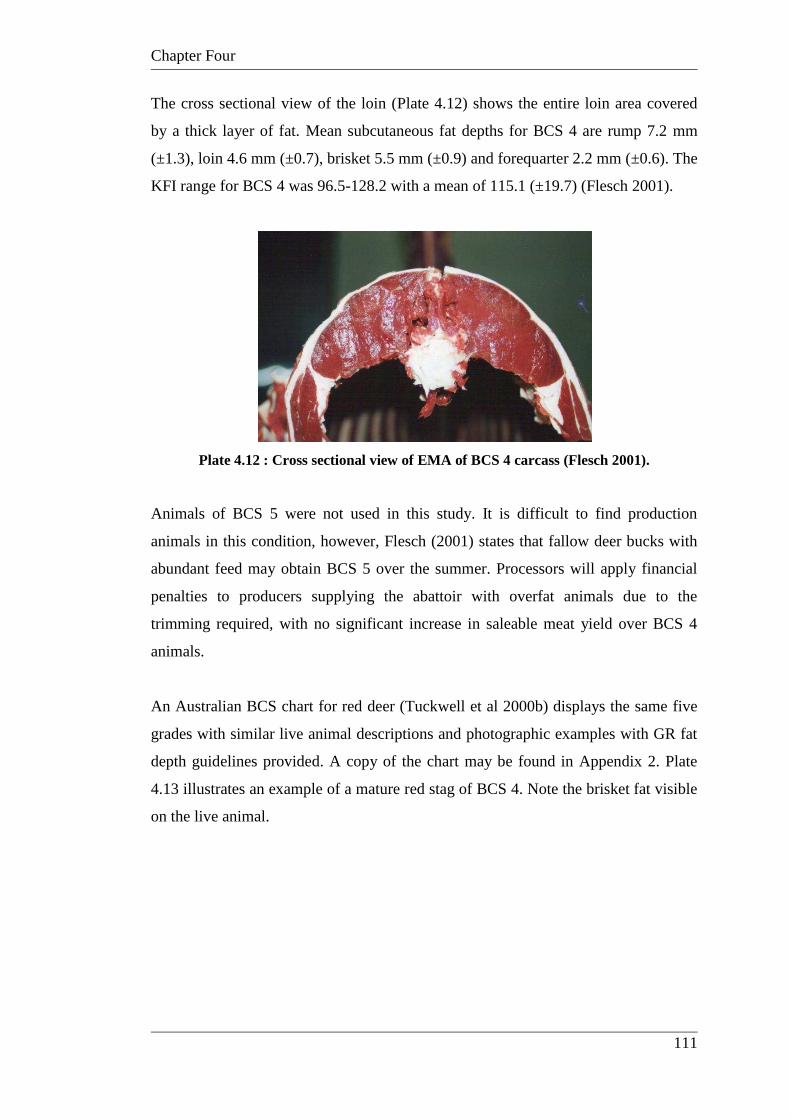
Chapter Four
111
The cross sectional view of the loin (Plate 4.12) shows the entire loin area covered
by a thick layer of fat. Mean subcutaneous fat depths for BCS 4 are rump 7.2 mm
(±1.3), loin 4.6 mm (±0.7), brisket 5.5 mm (±0.9) and forequarter 2.2 mm (±0.6). The
KFI range for BCS 4 was 96.5-128.2 with a mean of 115.1 (±19.7) (Flesch 2001).
Plate 4.12 : Cross sectional view of EMA of BCS 4 carcass (Flesch 2001).
Animals of BCS 5 were not used in this study. It is difficult to find production
animals in this condition, however, Flesch (2001) states that fallow deer bucks with
abundant feed may obtain BCS 5 over the summer. Processors will apply financial
penalties to producers supplying the abattoir with overfat animals due to the
trimming required, with no significant increase in saleable meat yield over BCS 4
animals.
An Australian BCS chart for red deer (Tuckwell et al 2000b) displays the same five
grades with similar live animal descriptions and photographic examples with GR fat
depth guidelines provided. A copy of the chart may be found in Appendix 2. Plate
4.13 illustrates an example of a mature red stag of BCS 4. Note the brisket fat visible
on the live animal.
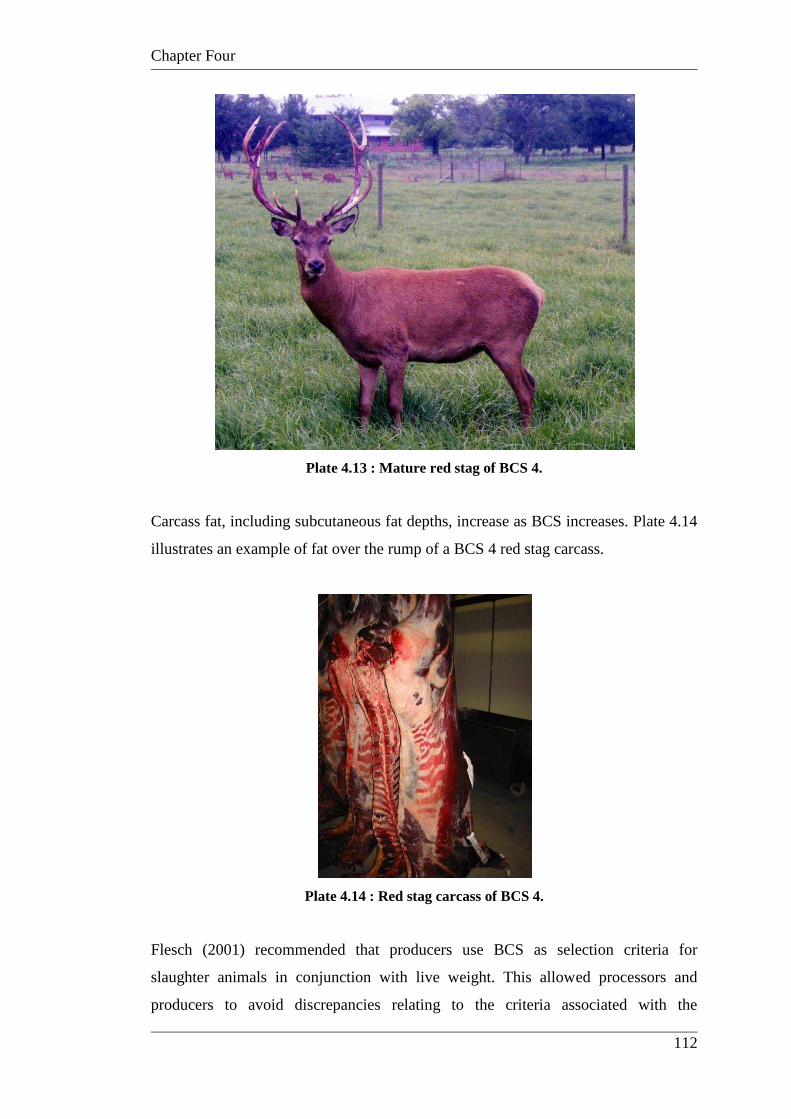
Chapter Four
112
Plate 4.13 : Mature red stag of BCS 4.
Carcass fat, including subcutaneous fat depths, increase as BCS increases. Plate 4.14
illustrates an example of fat over the rump of a BCS 4 red stag carcass.
Plate 4.14 : Red stag carcass of BCS 4.
Flesch (2001) recommended that producers use BCS as selection criteria for
slaughter animals in conjunction with live weight. This allowed processors and
producers to avoid discrepancies relating to the criteria associated with the
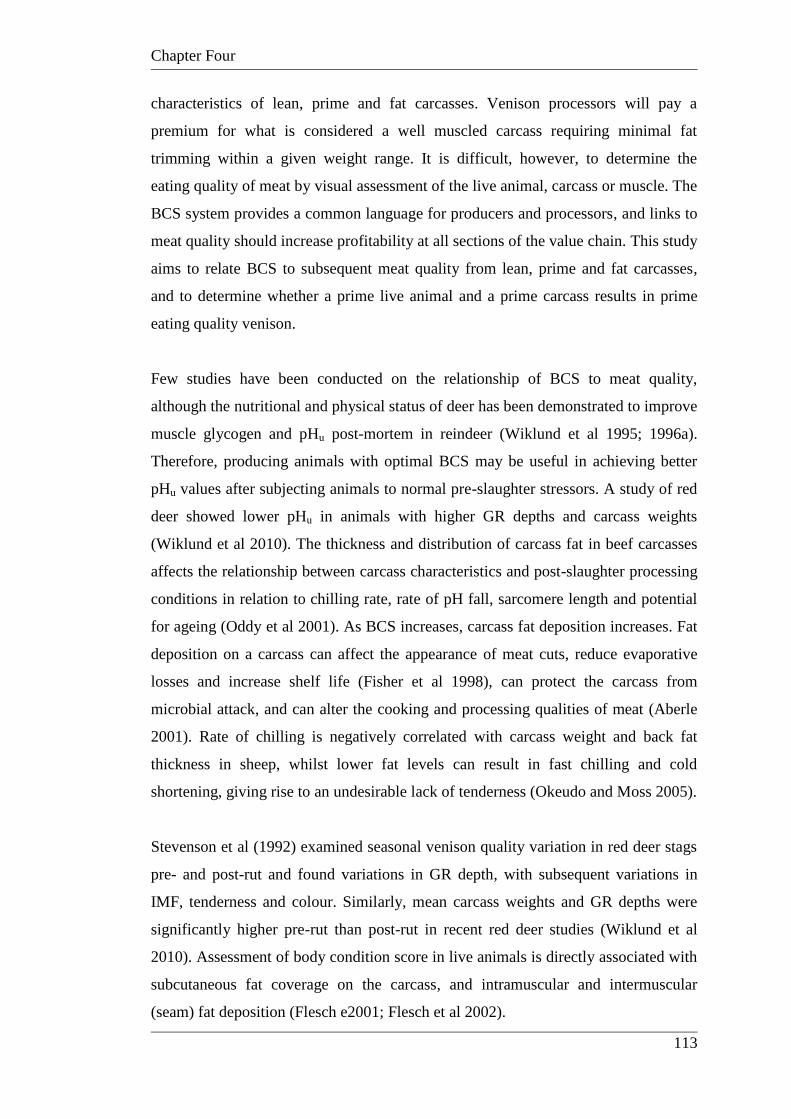
Chapter Four
113
characteristics of lean, prime and fat carcasses. Venison processors will pay a
premium for what is considered a well muscled carcass requiring minimal fat
trimming within a given weight range. It is difficult, however, to determine the
eating quality of meat by visual assessment of the live animal, carcass or muscle. The
BCS system provides a common language for producers and processors, and links to
meat quality should increase profitability at all sections of the value chain. This study
aims to relate BCS to subsequent meat quality from lean, prime and fat carcasses,
and to determine whether a prime live animal and a prime carcass results in prime
eating quality venison.
Few studies have been conducted on the relationship of BCS to meat quality,
although the nutritional and physical status of deer has been demonstrated to improve
muscle glycogen and pHu post-mortem in reindeer (Wiklund et al 1995; 1996a).
Therefore, producing animals with optimal BCS may be useful in achieving better
pHu values after subjecting animals to normal pre-slaughter stressors. A study of red
deer showed lower pHu in animals with higher GR depths and carcass weights
(Wiklund et al 2010). The thickness and distribution of carcass fat in beef carcasses
affects the relationship between carcass characteristics and post-slaughter processing
conditions in relation to chilling rate, rate of pH fall, sarcomere length and potential
for ageing (Oddy et al 2001). As BCS increases, carcass fat deposition increases. Fat
deposition on a carcass can affect the appearance of meat cuts, reduce evaporative
losses and increase shelf life (Fisher et al 1998), can protect the carcass from
microbial attack, and can alter the cooking and processing qualities of meat (Aberle
2001). Rate of chilling is negatively correlated with carcass weight and back fat
thickness in sheep, whilst lower fat levels can result in fast chilling and cold
shortening, giving rise to an undesirable lack of tenderness (Okeudo and Moss 2005).
Stevenson et al (1992) examined seasonal venison quality variation in red deer stags
pre- and post-rut and found variations in GR depth, with subsequent variations in
IMF, tenderness and colour. Similarly, mean carcass weights and GR depths were
significantly higher pre-rut than post-rut in recent red deer studies (Wiklund et al
2010). Assessment of body condition score in live animals is directly associated with
subcutaneous fat coverage on the carcass, and intramuscular and intermuscular
(seam) fat deposition (Flesch e2001; Flesch et al 2002).
Chapter Four
114
A major study relating animal body condition and eating quality is the development
of the Meat Standards Australia program (MSA 2010). In terms of meat eating
quality, MSA has revolutionised the way in which beef has been assessed to
guarantee optimal eating quality. The MSA grading system models an eating quality
score for beef using the primary animal and carcass characteristics of Bos indicus
percentage, carcass weight, sex, ossification, marbling scores and pHu. The
secondary characteristics utilised in this model are meat colour, rib fat depth, muscle
texture and firmness, and weight adjusted for maturity along with treatment effects.
The principle behind the MSA grading system is to optimise animal characteristics
and processing variables with preparation at the consumer end to ensure optimal
eating quality. A study by Watson et al (2008) reported that fat depths and meat
marbling scores were positively correlated and formed part of the meat quality score
for beef. Minimum rib fat requirements are in place for beef as it relates to even
chilling in the muscles and the subsequent positive effect on meat quality
(Polkinghorne et al 2008a).
Lambe et al (2008) suggested that in vivo methods, of which BCS is an example, of
assessing carcass and meat quality could result in improved meat quality in lambs
and provide incentive for producers to aid the improvement of meat quality. Live
weights and assessment of body condition are commonly used by producers of lamb
to select live lambs that may produce the best potential carcass characteristics
(Lambe et al 2008), yet little work has been done to quantify the meat quality
characteristics of this assessment.
Flesch (2001) determined that, in terms of animal production, being able to estimate
body condition of individual animals was vitally important for both breeding and
slaughter stock. However, little work has been done on establishing links with body
condition to the subsequent meat quality of slaughter animals. If there is a strong
relationship between BCS and meat quality characteristics, then BCS will not only be
an important tool in assessing the health and productive potential of farmed deer, but
will also assist in quality assurance and product description to enhance marketing
opportunities and consumer confidence. The majority of fallow deer on farms fall
into the BCS 2, 3 and 4 categories (Hansen 2011). With animals of slaughter weight,
the ability of the producer to determine BCS may have an important influence on the
Chapter Four
115
timing, age and selection of animals for slaughter, with premiums paid for animals in
prime condition (Hansen 2011).
Red meat processors in Australia currently use measures of subcutaneous fat depth
and animal weight to predict lean meat yield. In the Australian sheep meat industry,
Hopkins (2011) suggested that improved predictive accuracy of lean meat yield
could be achieved by use of subjective estimates of subcutaneous fat such as those
used in the BCS system for red and fallow deer. A BCS on a five point scale used in
combination with fat and muscle depth measurements could achieve increased
predictive accuracy. There is evidence that utilisation of loin fat measures and
muscle weight can improve accuracy of lean meat predictions up to 76% (Hopkins
2008) over the reported accuracy of the current VIAScan system of 55% (Hopkins et
al 2004). Pethick et al (2011) concluded that in Australia, the time is right for cost
effective industry measures of prediction of lean meat yield to facilitate clearer price
signals for producers than the currently utilised system of a single point measure of
subcutaneous fat in beef and lamb.
Animals used in the current study included fallow deer bucks, haviers (castrated
males) and does, as well as red deer stags. An experiment with haviers was
conducted in the early stages of the project because at that time a number of
producers were castrating fallow deer buck prior to puberty to control aggressive
behaviours, supply quality venison year round and extend the slaughter season
beyond puberty (12-15 months of age), including the breeding season or rut. During
the rut male animals are likely to lose condition and have fluctuations in testicular
androgen levels, resulting in behavioural changes and increased risk of body damage
caused by fighting (Stevenson et al 1992). The impact of seasonal change is greater
for entire males compared with females and castrated males (Pollock 1975).
Castration has been utilised in livestock production systems for hundreds of years to
manage male aggression and improve meat quality (Field 1971; Seideman et al
1982). The effects of castration on cervids have been limited to effects relating to
growth and carcass composition in fallow deer (Mulley and English 1985; Asher
1986; Mulley 1989; Hogg et al 1990) and red deer (Drew et al 1978; Asher et al
2011), however, none of this work was linked to meat quality. Since the time of

Chapter Four
116
conducting these experimental trials, producers have ceased the practise of castration
and are now slaughtering non-breeding does during the breeding season.
This chapter describes the meat quality characteristics of venison from red and
fallow deer collected in a series of experiments associated with measured BCS in
animals of different sex.
Chapter Four
117
4.2: Materials and methods
4.2.1: Fallow bucks of BCS 2 to 3
Thirty one entire fallow deer bucks ranging from 18-24 months old and with BCS
ranging between 2 (n=16) and 3 (n=15) (lean and prime) were slaughtered by captive
bolt stunning and thoracic stick exsanguination within 3 seconds of the stun (Chapter
3) and hung by the Achilles tendon. Carcasses were measured for core body
temperature and muscle pH at 1 and 24 hours post-mortem. BCS was measured ante
-mortem and confirmed with carcass measurements post-mortem. The M.
longissimus dorsi muscles (strip loins) were boned out from each carcass once core
body temperature was less than 7 °C post-slaughter and divided into two sections,
one complying with the specified standard for mid-loin according to AUS-MEAT
(1995) guidelines, and one from the foreloin (cranial) section of the muscle. These
selected cuts were vacuum packaged and frozen at –21 °C until analysed. Samples
were analysed in triplicate for pH, intramuscular fat, colour, shear force, moisture
and freeze-thaw loss and purge. Kidneys were excised for later KFI calculations to
assist confirmation of BCS.
4.2.2: Fallow does of BCS 2, 3 and 4
Twenty four non-pregnant fallow does, approximately 36 months old with a history
of one previous lactation, and of BCS 2 (n=7), 3 (n=7) and 4 (n=10) were
slaughtered using the methods described in 4.2.1. Carcasses were measured for core
body temperature and muscle pH at 1 and 24 hours post-mortem. BCS was measured
ante-mortem and confirmed with carcass measurements post-mortem. The M.
longissimus dorsi muscles (strip loins) were boned out from each carcass once core
body temperature was less than 7 °C post-slaughter. These cuts were vacuum
packaged and frozen at –21 °C until analysed. Samples were analysed in triplicate for
pH, intramuscular fat, colour, shear force, moisture and freeze-thaw loss and purge.
Kidneys were excised for later KFI calculations to assist confirmation of BCS.
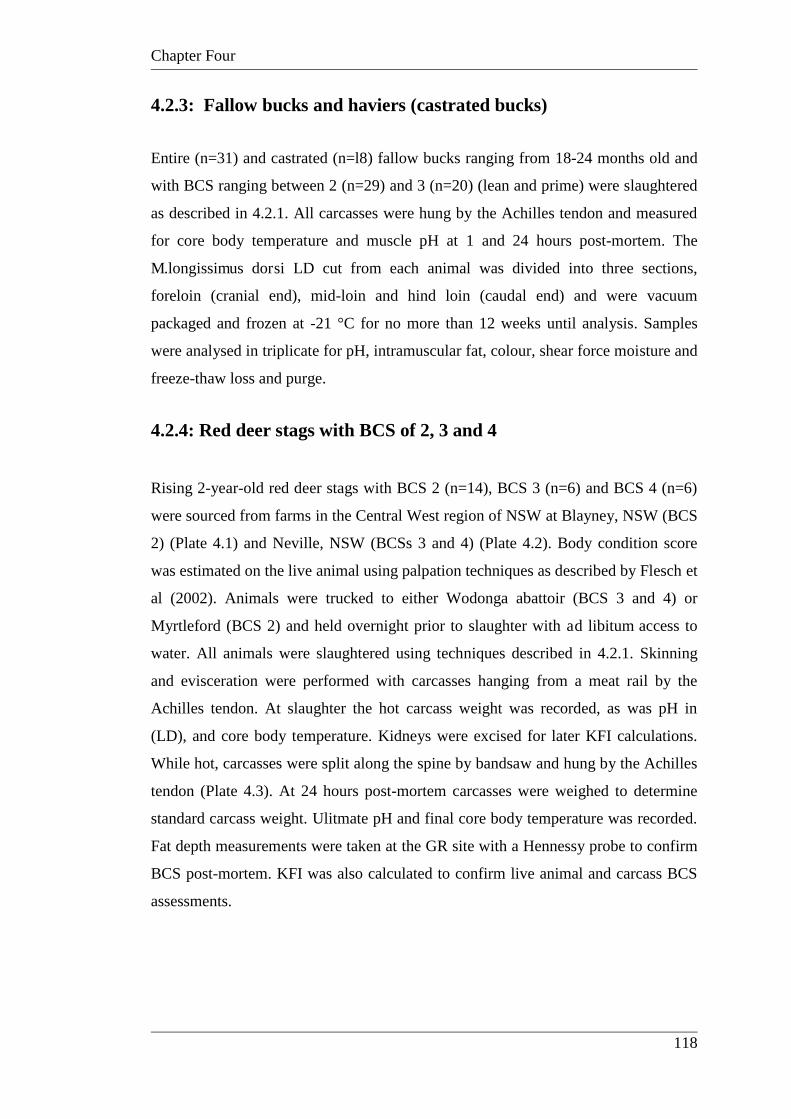
Chapter Four
118
4.2.3: Fallow bucks and haviers (castrated bucks)
Entire (n=31) and castrated (n=l8) fallow bucks ranging from 18-24 months old and
with BCS ranging between 2 (n=29) and 3 (n=20) (lean and prime) were slaughtered
as described in 4.2.1. All carcasses were hung by the Achilles tendon and measured
for core body temperature and muscle pH at 1 and 24 hours post-mortem. The
M.longissimus dorsi LD cut from each animal was divided into three sections,
foreloin (cranial end), mid-loin and hind loin (caudal end) and were vacuum
packaged and frozen at -21 °C for no more than 12 weeks until analysis. Samples
were analysed in triplicate for pH, intramuscular fat, colour, shear force moisture and
freeze-thaw loss and purge.
4.2.4: Red deer stags with BCS of 2, 3 and 4
Rising 2-year-old red deer stags with BCS 2 (n=14), BCS 3 (n=6) and BCS 4 (n=6)
were sourced from farms in the Central West region of NSW at Blayney, NSW (BCS
2) (Plate 4.1) and Neville, NSW (BCSs 3 and 4) (Plate 4.2). Body condition score
was estimated on the live animal using palpation techniques as described by Flesch et
al (2002). Animals were trucked to either Wodonga abattoir (BCS 3 and 4) or
Myrtleford (BCS 2) and held overnight prior to slaughter with ad libitum access to
water. All animals were slaughtered using techniques described in 4.2.1. Skinning
and evisceration were performed with carcasses hanging from a meat rail by the
Achilles tendon. At slaughter the hot carcass weight was recorded, as was pH in
(LD), and core body temperature. Kidneys were excised for later KFI calculations.
While hot, carcasses were split along the spine by bandsaw and hung by the Achilles
tendon (Plate 4.3). At 24 hours post-mortem carcasses were weighed to determine
standard carcass weight. Ulitmate pH and final core body temperature was recorded.
Fat depth measurements were taken at the GR site with a Hennessy probe to confirm
BCS post-mortem. KFI was also calculated to confirm live animal and carcass BCS
assessments.
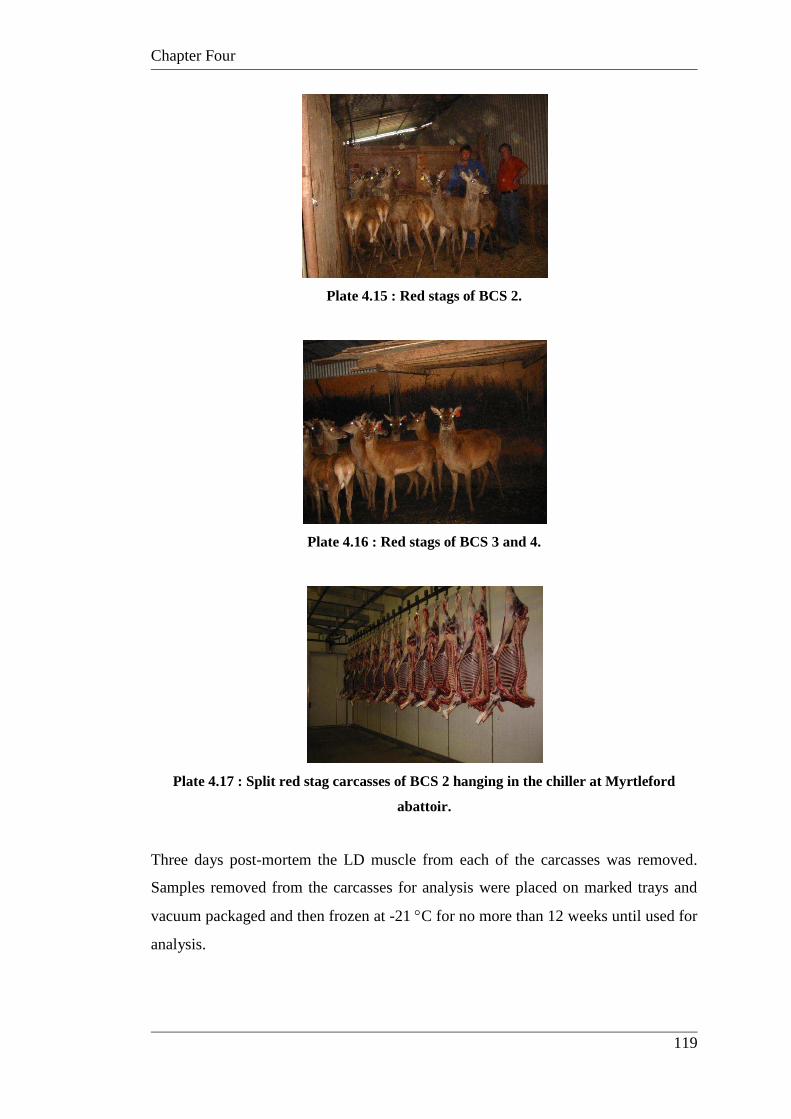
Chapter Four
119
Plate 4.15 : Red stags of BCS 2.
Plate 4.16 : Red stags of BCS 3 and 4.
Plate 4.17 : Split red stag carcasses of BCS 2 hanging in the chiller at Myrtleford
abattoir.
Three days post-mortem the LD muscle from each of the carcasses was removed.
Samples removed from the carcasses for analysis were placed on marked trays and
vacuum packaged and then frozen at -21 C for no more than 12 weeks until used for
analysis.
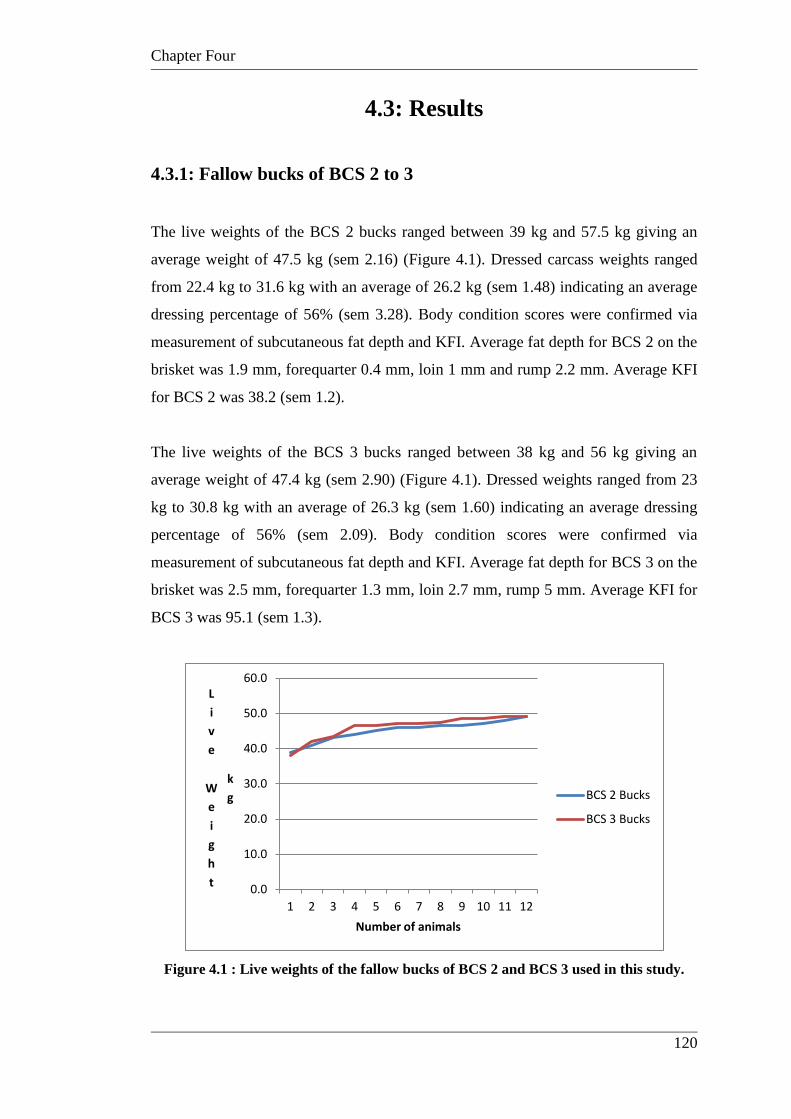
Chapter Four
120
4.3: Results
4.3.1: Fallow bucks of BCS 2 to 3
The live weights of the BCS 2 bucks ranged between 39 kg and 57.5 kg giving an
average weight of 47.5 kg (sem 2.16) (Figure 4.1). Dressed carcass weights ranged
from 22.4 kg to 31.6 kg with an average of 26.2 kg (sem 1.48) indicating an average
dressing percentage of 56% (sem 3.28). Body condition scores were confirmed via
measurement of subcutaneous fat depth and KFI. Average fat depth for BCS 2 on the
brisket was 1.9 mm, forequarter 0.4 mm, loin 1 mm and rump 2.2 mm. Average KFI
for BCS 2 was 38.2 (sem 1.2).
The live weights of the BCS 3 bucks ranged between 38 kg and 56 kg giving an
average weight of 47.4 kg (sem 2.90) (Figure 4.1). Dressed weights ranged from 23
kg to 30.8 kg with an average of 26.3 kg (sem 1.60) indicating an average dressing
percentage of 56% (sem 2.09). Body condition scores were confirmed via
measurement of subcutaneous fat depth and KFI. Average fat depth for BCS 3 on the
brisket was 2.5 mm, forequarter 1.3 mm, loin 2.7 mm, rump 5 mm. Average KFI for
BCS 3 was 95.1 (sem 1.3).
Figure 4.1 : Live weights of the fallow bucks of BCS 2 and BCS 3 used in this study.
0.0
10.0
20.0
30.0
40.0
50.0
60.0
1 2 3 4 5 6 7 8 9 10 11 12
L
i
v
e
W
e
i
g
h
t
k
g
Number of animals
BCS 2 Bucks
BCS 3 Bucks
Chapter Four
121
Meat quality parameters and relationships between meat quality parameters and BCS
are shown in Table 4.1. In this experiment, no significant differences were detected
between animals of BCS 2 and BCS 3 in any of the parameters of meat quality, with
the exception of freeze-thaw loss and purge, where BCS 3 samples had significantly
higher purge than BCS 2 (p<0.001).
Table 4.1 : Meat quality attributes of M.longissimus dorsi from fallow bucks of
BCS 2 (n=16) and 3 (n=15).
BCS pH Cooked
Shear
(g)
Raw
Shear
(g)
Colour
L*
Colour
a*
Colour
b*
Moisture
(%)
IM
Fat
(%)
Freeze
Thaw
loss
(%)
BCS 2 5.41a
(0.17)
5401.5a
(386.0)
2424.9a
(176.3)
20.23a
(0.345)
12.28
(0.32)
0.18a
(0.15)
75.73a
(0.13)
2.85a
(0.21)
11.24a
(0.49)
BCS 3 5.50a
(0.43)
4890.2a
(240.2)
2350.8a
(123.8)
21.33a
(0.57)
11.58a
(0.41)
0.12a
(0.17)
76.00a
(0.19)
2.96a
(0.21)
16.00b
(0.74)
Means and standard error of means (in parenthesis) are shown.
Treatments followed by the same letter in the columns are not significantly different
(p<0.05).
4.3.2: Fallow does of BCS 2, 3 and 4.
The live weights of the BCS 2 does ranged between 37 kg and 42 kg giving an
average weight of 39.1 kg (sem 1.79) (Figure 4.2). Dressed weights ranged from
22.9 kg to 28.5 kg with an average of 25.1 kg (sem 1.09) indicating an average
dressing percentage of 64%. Average fat depth for BCS 2 on the brisket was 2.8
mm, forequarter 0 mm, loin 0.4 mm, rump 3.4 mm. Average KFI for BCS 2 was 49.6
(sem 1.2).
The live weights of the BCS 3 does ranged between 42.5 kg and 44.5 kg giving an
average weight of 43.5 kg (sem 0.76) (Figure 4.2). Dressed weights ranged from
25.1 kg to 29 kg with an average of 27.6 kg (sem 1.82) indicating an average
dressing percentage of 63%. Average fat depth for BCS 3 on the brisket was 6 mm,
forequarter 2.5 mm, loin 2.5 mm, rump 7 mm. The average KFI was 97.1 (sem 1.1).
Chapter Four
122
The live weights of the BCS 4 does ranged between 41.5 kg and 50 kg giving an
average weight of 44.5 kg (sem 2.85) (Figure 4.2). Dressed weights ranged from
28.3 kg to 33 kg with an average of 28.7 kg (sem 2.20) indicating an average
dressing percentage of 64%. The fat depths for BCS 4 on the brisket was 8.5 mm,
forequarter 4.1 mm, loin 3.5 mm and rump 9 mm. The average KFI for BCS 4 was
137.4 (sem 1.1).
Figure 4.2 : Live weights of the fallow does of BCS 2, 3 and 4 used in this study.
For fallow deer does, there were significant differences between BCS for IMF (BCS
2-3, F1,16 = 32.713, p<0.001); (BCS 3-4, F2,18 = 7.988, p<0.01), with IMF increasing
as BCS increased., and colour „a‟ (redness) (F1,16 = 4.414, p<0.05), with redness
values at BCS 4 being lower than BCS 2 or BCS 3. There were significant
differences between BCS for tenderness (cooked shear force values) (F2,18=3.984,
p<0.05), with meat from BCS 4 carcasses being more tender than meat from BCS 2
and BCS 3 carcasses (Table 4.2).
0
10
20
30
40
50
60
1 2 3 4 5 6 7 8 9 10
L
i
v
e
w
e
i
g
h
t
k
g
Number of Animals
BCS 2
BCS 3
BCS 4
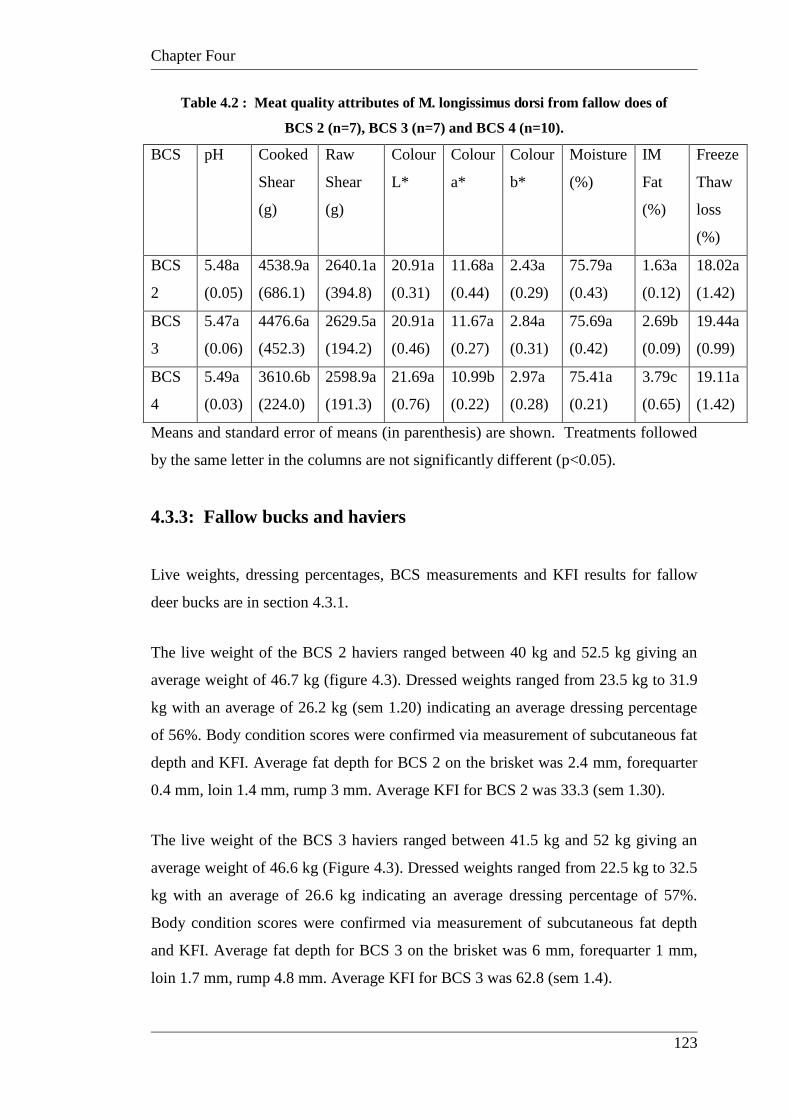
Chapter Four
123
Table 4.2 : Meat quality attributes of M. longissimus dorsi from fallow does of
BCS 2 (n=7), BCS 3 (n=7) and BCS 4 (n=10).
BCS pH Cooked
Shear
(g)
Raw
Shear
(g)
Colour
L*
Colour
a*
Colour
b*
Moisture
(%)
IM
Fat
(%)
Freeze
Thaw
loss
(%)
BCS
2
5.48a
(0.05)
4538.9a
(686.1)
2640.1a
(394.8)
20.91a
(0.31)
11.68a
(0.44)
2.43a
(0.29)
75.79a
(0.43)
1.63a
(0.12)
18.02a
(1.42)
BCS
3
5.47a
(0.06)
4476.6a
(452.3)
2629.5a
(194.2)
20.91a
(0.46)
11.67a
(0.27)
2.84a
(0.31)
75.69a
(0.42)
2.69b
(0.09)
19.44a
(0.99)
BCS
4
5.49a
(0.03)
3610.6b
(224.0)
2598.9a
(191.3)
21.69a
(0.76)
10.99b
(0.22)
2.97a
(0.28)
75.41a
(0.21)
3.79c
(0.65)
19.11a
(1.42)
Means and standard error of means (in parenthesis) are shown. Treatments followed
by the same letter in the columns are not significantly different (p<0.05).
4.3.3: Fallow bucks and haviers
Live weights, dressing percentages, BCS measurements and KFI results for fallow
deer bucks are in section 4.3.1.
The live weight of the BCS 2 haviers ranged between 40 kg and 52.5 kg giving an
average weight of 46.7 kg (figure 4.3). Dressed weights ranged from 23.5 kg to 31.9
kg with an average of 26.2 kg (sem 1.20) indicating an average dressing percentage
of 56%. Body condition scores were confirmed via measurement of subcutaneous fat
depth and KFI. Average fat depth for BCS 2 on the brisket was 2.4 mm, forequarter
0.4 mm, loin 1.4 mm, rump 3 mm. Average KFI for BCS 2 was 33.3 (sem 1.30).
The live weight of the BCS 3 haviers ranged between 41.5 kg and 52 kg giving an
average weight of 46.6 kg (Figure 4.3). Dressed weights ranged from 22.5 kg to 32.5
kg with an average of 26.6 kg indicating an average dressing percentage of 57%.
Body condition scores were confirmed via measurement of subcutaneous fat depth
and KFI. Average fat depth for BCS 3 on the brisket was 6 mm, forequarter 1 mm,
loin 1.7 mm, rump 4.8 mm. Average KFI for BCS 3 was 62.8 (sem 1.4).
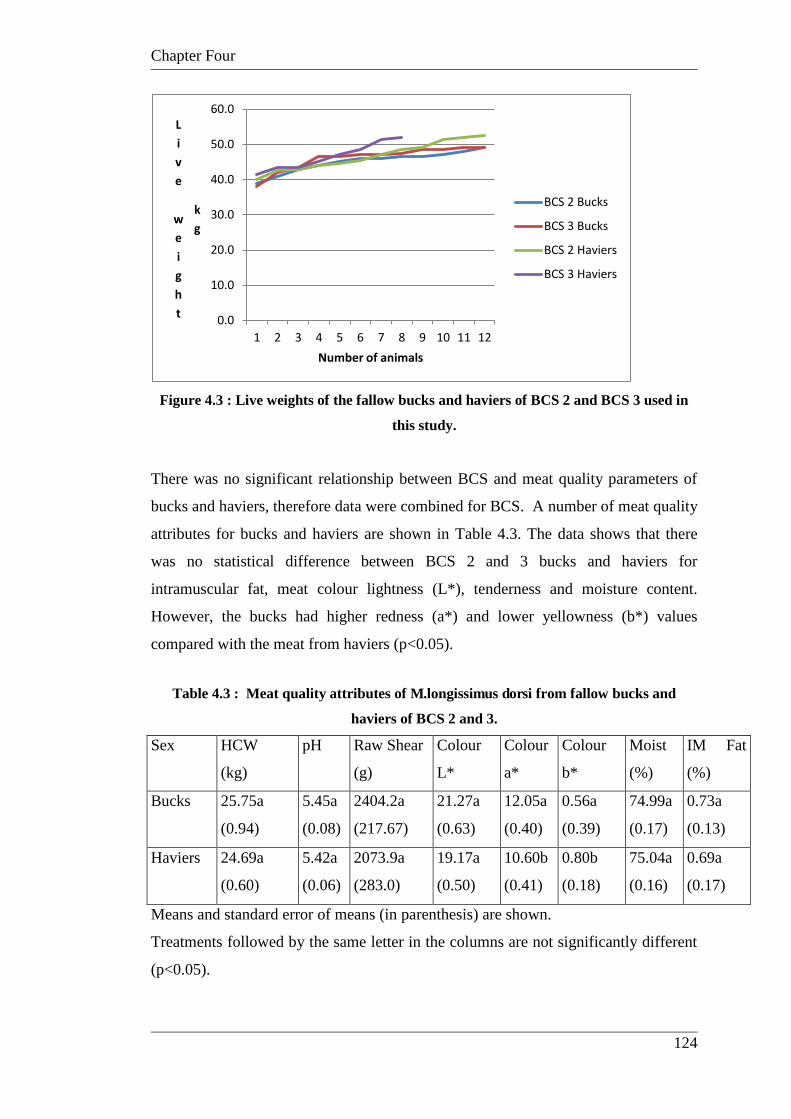
Chapter Four
124
Figure 4.3 : Live weights of the fallow bucks and haviers of BCS 2 and BCS 3 used in
this study.
There was no significant relationship between BCS and meat quality parameters of
bucks and haviers, therefore data were combined for BCS. A number of meat quality
attributes for bucks and haviers are shown in Table 4.3. The data shows that there
was no statistical difference between BCS 2 and 3 bucks and haviers for
intramuscular fat, meat colour lightness (L*), tenderness and moisture content.
However, the bucks had higher redness (a*) and lower yellowness (b*) values
compared with the meat from haviers (p<0.05).
Table 4.3 : Meat quality attributes of M.longissimus dorsi from fallow bucks and
haviers of BCS 2 and 3.
Sex HCW
(kg)
pH
Raw Shear
(g)
Colour
L*
Colour
a*
Colour
b*
Moist
(%)
IM Fat
(%)
Bucks 25.75a
(0.94)
5.45a
(0.08)
2404.2a
(217.67)
21.27a
(0.63)
12.05a
(0.40)
0.56a
(0.39)
74.99a
(0.17)
0.73a
(0.13)
Haviers 24.69a
(0.60)
5.42a
(0.06)
2073.9a
(283.0)
19.17a
(0.50)
10.60b
(0.41)
0.80b
(0.18)
75.04a
(0.16)
0.69a
(0.17)
Means and standard error of means (in parenthesis) are shown.
Treatments followed by the same letter in the columns are not significantly different
(p<0.05).
0.0
10.0
20.0
30.0
40.0
50.0
60.0
1 2 3 4 5 6 7 8 9 10 11 12
L
i
v
e
w
e
i
g
h
t
k
g
Number of animals
BCS 2 Bucks
BCS 3 Bucks
BCS 2 Haviers
BCS 3 Haviers
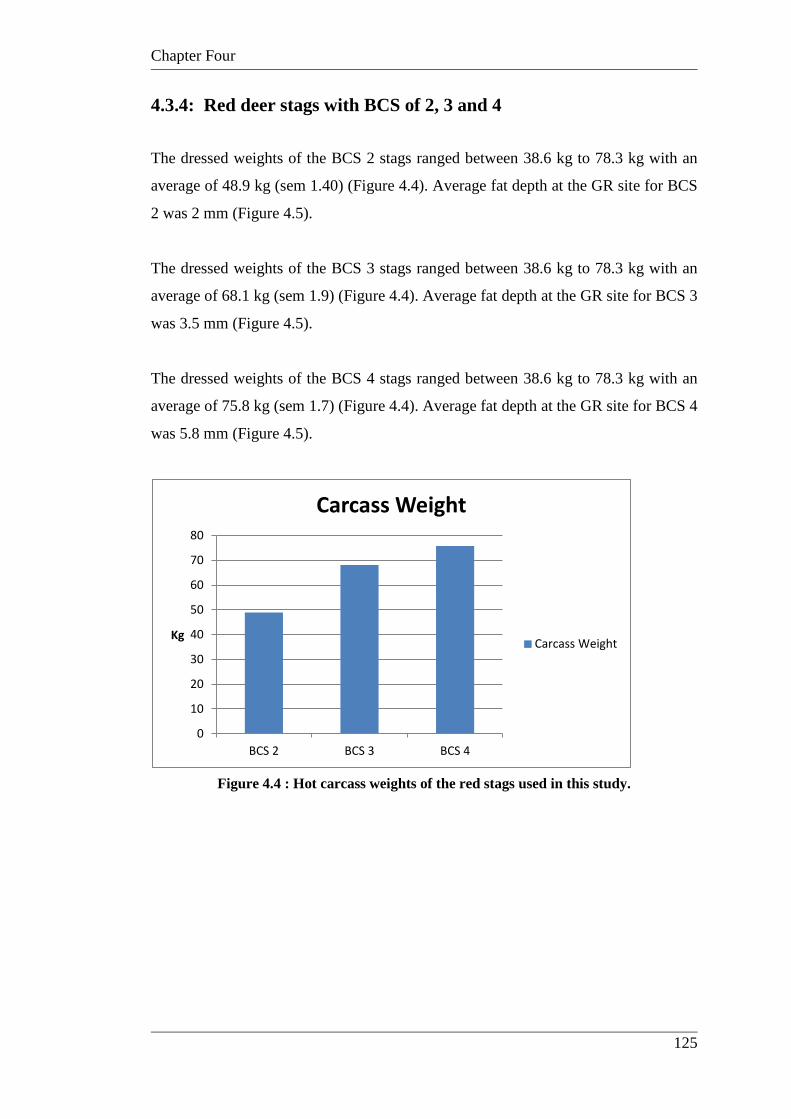
Chapter Four
125
4.3.4: Red deer stags with BCS of 2, 3 and 4
The dressed weights of the BCS 2 stags ranged between 38.6 kg to 78.3 kg with an
average of 48.9 kg (sem 1.40) (Figure 4.4). Average fat depth at the GR site for BCS
2 was 2 mm (Figure 4.5).
The dressed weights of the BCS 3 stags ranged between 38.6 kg to 78.3 kg with an
average of 68.1 kg (sem 1.9) (Figure 4.4). Average fat depth at the GR site for BCS 3
was 3.5 mm (Figure 4.5).
The dressed weights of the BCS 4 stags ranged between 38.6 kg to 78.3 kg with an
average of 75.8 kg (sem 1.7) (Figure 4.4). Average fat depth at the GR site for BCS 4
was 5.8 mm (Figure 4.5).
Figure 4.4 : Hot carcass weights of the red stags used in this study.
0
10
20
30
40
50
60
70
80
BCS 2 BCS 3 BCS 4
Kg
Carcass Weight
Carcass Weight
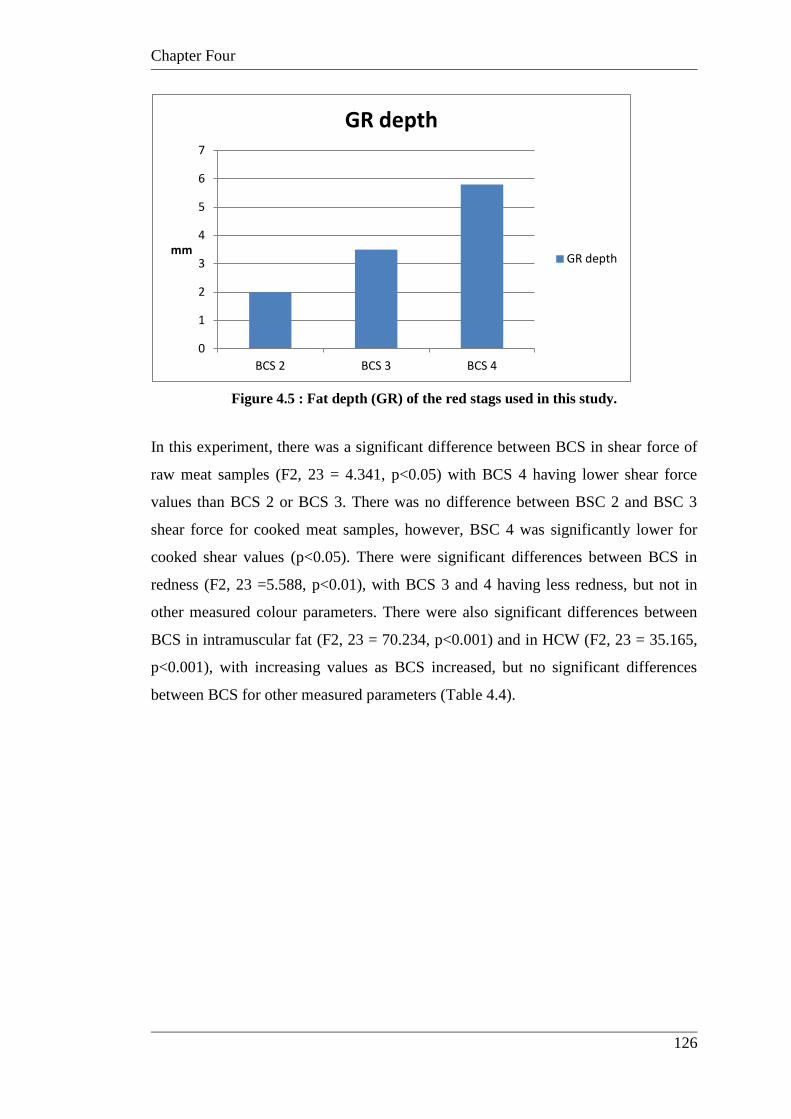
Chapter Four
126
Figure 4.5 : Fat depth (GR) of the red stags used in this study.
In this experiment, there was a significant difference between BCS in shear force of
raw meat samples (F2, 23 = 4.341, p<0.05) with BCS 4 having lower shear force
values than BCS 2 or BCS 3. There was no difference between BSC 2 and BSC 3
shear force for cooked meat samples, however, BSC 4 was significantly lower for
cooked shear values (p<0.05). There were significant differences between BCS in
redness (F2, 23 =5.588, p<0.01), with BCS 3 and 4 having less redness, but not in
other measured colour parameters. There were also significant differences between
BCS in intramuscular fat (F2, 23 = 70.234, p<0.001) and in HCW (F2, 23 = 35.165,
p<0.001), with increasing values as BCS increased, but no significant differences
between BCS for other measured parameters (Table 4.4).
0
1
2
3
4
5
6
7
BCS 2 BCS 3 BCS 4
mm
GR depth
GR depth
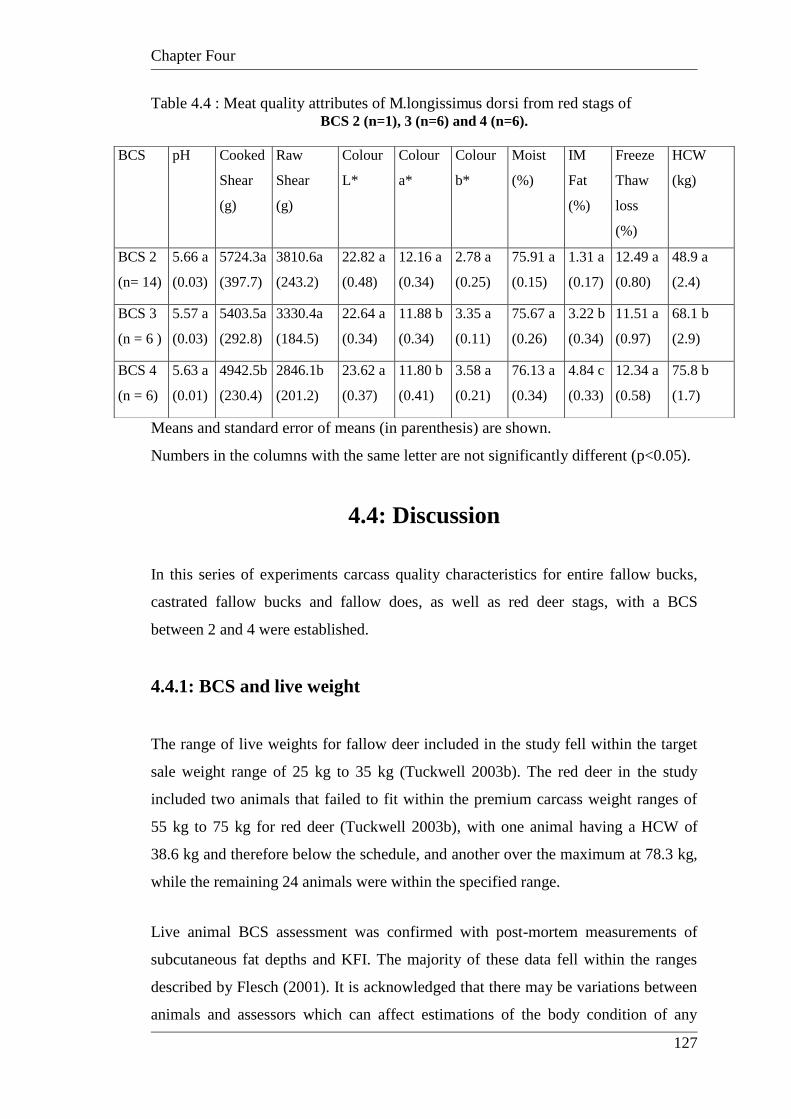
Chapter Four
127
Table 4.4 : Meat quality attributes of M.longissimus dorsi from red stags of BCS 2 (n=1), 3 (n=6) and 4 (n=6).
Means and standard error of means (in parenthesis) are shown.
Numbers in the columns with the same letter are not significantly different (p<0.05).
4.4: Discussion
In this series of experiments carcass quality characteristics for entire fallow bucks,
castrated fallow bucks and fallow does, as well as red deer stags, with a BCS
between 2 and 4 were established.
4.4.1: BCS and live weight
The range of live weights for fallow deer included in the study fell within the target
sale weight range of 25 kg to 35 kg (Tuckwell 2003b). The red deer in the study
included two animals that failed to fit within the premium carcass weight ranges of
55 kg to 75 kg for red deer (Tuckwell 2003b), with one animal having a HCW of
38.6 kg and therefore below the schedule, and another over the maximum at 78.3 kg,
while the remaining 24 animals were within the specified range.
Live animal BCS assessment was confirmed with post-mortem measurements of
subcutaneous fat depths and KFI. The majority of these data fell within the ranges
described by Flesch (2001). It is acknowledged that there may be variations between
animals and assessors which can affect estimations of the body condition of any
BCS pH Cooked
Shear
(g)
Raw
Shear
(g)
Colour
L*
Colour
a*
Colour
b*
Moist
(%)
IM
Fat
(%)
Freeze
Thaw
loss
(%)
HCW
(kg)
BCS 2
(n= 14)
5.66 a
(0.03)
5724.3a
(397.7)
3810.6a
(243.2)
22.82 a
(0.48)
12.16 a
(0.34)
2.78 a
(0.25)
75.91 a
(0.15)
1.31 a
(0.17)
12.49 a
(0.80)
48.9 a
(2.4)
BCS 3
(n = 6 )
5.57 a
(0.03)
5403.5a
(292.8)
3330.4a
(184.5)
22.64 a
(0.34)
11.88 b
(0.34)
3.35 a
(0.11)
75.67 a
(0.26)
3.22 b
(0.34)
11.51 a
(0.97)
68.1 b
(2.9)
BCS 4
(n = 6)
5.63 a
(0.01)
4942.5b
(230.4)
2846.1b
(201.2)
23.62 a
(0.37)
11.80 b
(0.41)
3.58 a
(0.21)
76.13 a
(0.34)
4.84 c
(0.33)
12.34 a
(0.58)
75.8 b
(1.7)
Chapter Four
128
particular animal. There were a small number of discrepancies with fat deposition on
the does that formed part of this study. It has been noted by Flesch (2001) that fat
deposition in does may not always follow a consistent pattern, and this was evident
in this study, with fat deposition lacking consistency between measurement sites. In a
study by Mushi et al (2008) comparing lambs and goats, the EUROP system of BCS
was found to be an accurate discriminator of potential carcass composition, as did
Johansen et al (2008). The EUROP system, like the BCS system for red and fallow
deer, is a five grade system designed to assess fatness and body condition in the live
animal.
As body condition score increased, HCW and live weight increased, in both fallow
and red deer, particularly when comparing BCS 4 animals to BCS 2 and 3. This has
been confirmed in sheep, where heavier and higher condition animals were
significantly heavier than lower and medium condition animals (Okeudo and Moss
2005; Glimp et al 1998; Juarez et al 2009) and red deer where GR fat depth was
strongly correlated to carcass weight (Stevenson-Barry et al 1999).
4.4.2: Intramuscular fat
IMF increased as body condition score increased in all study animals, significantly
for the fallow deer does and red stags. Similar results have been found in sheep,
where animals of higher body condition were significantly higher in IMF than lower
and medium condition animals (Diaz et al 2004; Okeudo and Moss 2005; Glimp et al
1998; Juarez et al 2009), and in cattle (Weglarz 2010), where IMF increased with
carcass fatness score, particularly in heifers when compared with bulls. Similar
results were documented in higher body condition horses (Sarries and Berlain 2005).
There was no significant difference in IMF content between fallow deer bucks and
haviers. Carcass weights were not significantly different between fallow deer bucks
and haviers, as was the case with red deer (Kay et al 1981). Previous studies by
Mulley (1996) indicated that haviers have a higher percentage of body fat in terms of
carcass composition and better year round meat quality regardless of breeding
season. This was confirmed by Woodford et al (1996) with castrated blackbuck
Chapter Four
129
antelope. Although expected, this was not confirmed in the current study, possibly
because drought conditions prevailed at the time of raising and slaughter. Lack of
feed availability reduced the ability of animals to store fat in typical carcass fat
deposition areas. The experiment was not repeated in times of better quality and
availability of pasture, since by the time the drought had abated, venison producers
had ceased the practise of castrating fallow deer bucks and the experimental finding
was no longer of commercial importance. A recent study by Asher et al (2011) on
red deer and wapiti-red hybrid stags noted that there was a delay of between 6 and 23
days in reaching slaughter weight in castrated animals. Carcass composition was
measured on the live animal by CT scanning and results confirmed with carcass
measurements post-slaughter. The carcass traits demonstrated a linear relationship
with body weight. The study concluded that there were no significant effects of
castration on any musculature, and only a minor effect of increased fatness within the
hind leg. Their findings support the results of this study, where there was no
significant difference between bucks and haviers, apart from meat colour, which was
not determined in the study by Asher et al (2011). Hogg et al (1990) similarly found
little effect of castration, with minor differences in musculature and fat deposition,
but commented on issues of reduced production due to lower live weight gains and
meat yields. A study of blackbuck antelope also determined that castration caused a
reduction in live weight gain but had no significant effect on slaughter or carcass
weight when compared with entire animals (Woodford et al 1996). Much of the
effect of steroid hormones on the growth of entire animals results in increased
weight of hide and bone (Mulley 1989), and this appears to be why reduced live
weight gain of castrates is not translated into carcass weight differences between
entire and castrates males in this and previous studies. Once entire males are dressed,
the heavier head, hide and bones of the extremities are lost as offal and the carcass
weight is then similar to that of castrated males of the same age.
4.4.3: Shear force
In the current study meat tenderness of venison increased as BCS increased,
significantly so when BCS 4 fallow does and red deer stags were included in the
study. This is in agreement with findings in steer carcasses where fatter carcasses
Chapter Four
130
displayed better tenderness than leaner carcasses (Pflanzer and Felicio 2009). In this
study, there was no significant difference in tenderness when comparing venison
from BCS 2 animals with BCS 3. BCS 4 animals, however, were significantly more
tender than the other two scores. Although venison from BCS 4 animals was more
tender, BCS 2 and 3 animals provided venison of acceptable tenderness, with shear
force values predominantly below 5.0 kg, and all well below 6.0 kg. A Warner-
Bratzler shear force value of over 5 kg is a nominal and arbitrary estimate of the
threshold for consumer acceptability of tenderness in lamb and sheep meat (Russell
et al 2005). This finding is of importance to venison producers when determining the
condition of animals for slaughter and for producing venison for particular markets.
In a study by Wiklund et al (2010) on seasonal variation in red deer venison, the deer
slaughtered prior to the rut had higher carcass weights and GR fat depths, and the
most tender meat compared with animals slaughtered at other times of the year. In
this study higher BCS animals had the most tender meat also, and the highest carcass
weights in both red deer and fallow deer venison. Conversely, tenderness is known to
decrease as slaughter weight increases in lamb (Martinez-Cerezo et al 2002;
Abdullah and Qudsieh 2009; Tejeda et al 2008) and beef (Sanudo et al 2004; Maher
et al 2004), where animal condition is not used as a slaughter parameter.
In a New Zealand study, venison from red deer hinds was more tender than venison
from stags (Purchas et al 2010), as was the case in this study for fallow deer does and
bucks. In this study does were also more tender at all body condition scores despite
being 12-18 months older than the males. Within sexes it has been shown that
tenderness decreased with advancing age in fallow deer bucks (Volpelli et al 2005;
Pinto et al 2009); red deer stags (Stevenson et al 1989a); blackbuck antelope
(Woodford et al 1996); camels (Dawood 1995); goats (Rodrigues et al 2011); and
lamb (Hopkins et al 2006, 2007; Pethick et al 2002, 2005b; Thompson et al 2005b).
However, between sexes this study showed that older females were more tender than
younger males both in instrumental measures and sensory evaluation (Hutchison et al
2010). A study on venison from red deer hinds (Stevenson et al 1989a) found that
unless the carcasses were visibly emaciated, the venison was of uniformly high
quality and tenderness irrespective of animal age, which ranged from 1 year to 13
years of age. Female roe deer have also been reported (Daszkiewicz et al 2012) to
exhibit lower shear force values compared to males. This has been confirmed in beef
Chapter Four
131
cattle, with heifers providing more tender meat than bulls or steers at the same age
(Lundesjo et al 2003, Daszkiewicz et al 2005; Weglarz 2010) and cows more tender
than bulls (Jelenikova et al 2008). Similar results are reported in lamb, with ewe
lambs providing more tender meat with higher levels of IMF than ram lambs (Craigie
et al 2012). Therefore, one can speculate from these studies that this is a difference
related to sex rather than age, with female animals having slightly higher IMF and
smaller diameter of muscle fibres than males of the same species. In a study on bulls,
muscle fibre area highly correlated with age and classification of EUROP score,
resulting in poorer eating quality of the meat (Mlynek et al 2007).
Purchas et al (2010) noted that red deer hinds had greater GR depths (NS) than stags,
and the hinds had significantly higher levels of IMF. Higher IMF levels were also
confirmed for hinds when compared to red stags in a study by Polak et al (2008) and
roe deer does when compared to bucks (Daszkiewicz et al 2012). In the study by
Purchas et al (2010) tenderness was improved due to greater IMF and slightly longer
sarcomeres. Red deer stags also had higher cooking losses and lower water holding
capacity (Purchas et al 2010). This was confirmed in a study of wild red deer
(Daszkiewicz et al 2009), where red deer stags had higher shear force values than
hinds. This study reported low collagen levels in stags that were further reduced in
the hind population measured (Daszkiewicz et al 2009). Although higher collagen
concentrations in muscles from red stags and fallow bucks, compared to fallow deer
does, haviers and red deer hinds, have not been reported as they have for lamb; these
findings may provide an explanation for differences in tenderness between sexes of
fallow and red deer venison (Dransfield et al 1990).
Tender venison without ageing, as was the finding in this experiment, has been
reported by other authors (Wiklund et al 2003b; Kochanowska-Maturszewska 2004).
Various other game animals have been examined for meat quality: springbok and
impala (Hoffman 2000); blackbuck antelope (Woodford et al 1996); wildebeest (van
Schalkwyk 2004); reedbuck (Hoffman et al 2008b); and kudu (Hoffman et 2009),
and have been found to produce universally tender meat when compared with
domestic meat species such as goats, beef cattle and sheep.
Chapter Four
132
4.4.4: Freeze-thaw/purge
Freeze-thaw purge losses were significantly higher in fallow deer bucks of BCS 3
when compared with BCS 2. Bucks of BCS 3 had a tendency to exhibit higher
moisture content, though this was not significant. Significantly higher losses may be
a result of a number of factors relating to water holding capacity, moisture content,
muscle structure, freezing quality and fat percentages. One outcome from freezing
meat is the amount of exudates that arise during thawing, as freezing causes an extra
loss of water compared with fresh chilled meat (Anon and Calvelo 1980; Leygonie et
al 2012). When meat is frozen, water is removed from within the muscle cells which
provides a potential reservoir of fluid that appears as drip on thawing (Lawrie and
Ledward 2006). Moore and Young (1991) determined that the dominant cause of
drip loss was the type of the freeze-thaw system and resultant cellular damage (Anon
and Calvelo 1980; Leygonie et al 2012). Given that all samples were frozen in the
same manner in the present study, this is an unlikely explanation for these results.
Daszkiewicz et al (2009) found that water holding capacity and association of free
water with protein was pH dependent. Post-mortem rate and extent of pH decline,
proteolysis and protein exudation are believed to be key influences in the ability of
meat to hold moisture (Huff-Lonergan and Lonergan 2005). While the mean pHu of
the BCS 3 bucks was slightly higher than the bucks of BCS 2, this was not
significant. Hoffman et al (2009) related drip loss to water holding capacity (WHC)
of meat which is influenced by several factors including the extent of post-mortem
pH fall. It is believed that higher muscle pH causes less water release from the
muscle since WHC is at a minimum between pH 5.0 and 5.5, which corresponds to
the isoelectric point of the protein within the muscle (Bouton et al 1971; Offer and
Knight 1988). This is confirmed by Hoffman et al (2007) who reported that very low
pHu values resulted in higher drip losses from the LD samples of springbok. Oddy et
al (2001) speculated that carcass size and fatness can interact with drip loss due to
the effect on chilling rate and glycolysis. Fast rates of pH decline and low pHu are
related to high purge losses as proteins lose the ability to bind water during rapid
proteolysis (Huff-Lonergan and Lonergan 2005). The pHu of carcasses from bucks of
both BCS 2 and 3 was not considered to be low, and venison is considered to be
more likely to have higher pHu and produce dry, firm and dark (DFD) meat rather
Chapter Four
133
than pale, soft and exudative (PSE) meat (Stevenson-Barry et al 1999). Low pHu
values and associated drip loss is a phenomenon that has been studied extensively on
pork where certain genetic traits in pigs can result in meat that is pale, soft and
exudative. This genotype results in abnormal flow of calcium across the
sarcoplasmic membrane of muscle cells, and fluid accumulates outside the myofibre
bundles and drips from the muscle, resulting in dry eating quality of the meat (Oddy
et al 2001). In this study the mean pH of BCS 3 bucks was within the optimal range
(5.4-5.7), therefore variation in pH cannot explain the result in this case. Does in this
study had higher mean freeze-thaw losses across all BCS than the BCS 3 fallow deer
bucks, while red stags had similar mean freeze-thaw losses. This was also reported
in roe deer does (Daszkiewicz et al 2012) where drip loss was higher when compared
to bucks. Wiklund et al (2010) speculated that seasonal variation in protein accretion
and catabolism, which relates to proteolysis and meat tenderness, would likely also
impact on WHC. Whether this has an effect on animals of higher BCS is unknown. A
similar finding in red deer venison (Wiklund et al 2010) demonstrated that animals
with higher BCS and higher carcass weights had the highest drip loss values, and
they speculated that high tenderness of the meat and loss of meat texture with
subsequent purge of moisture is a possible cause. This may also explain the higher
losses in venison from fallow deer does and bucks of BCS 3 in the current study,
however, this finding was not confirmed in any of the other venison analysed in the
study and would warrant further experimental investigation to confirm validity of the
result.
4.4.5: Colour
Colour measurements on the venison in this study revealed a decrease of redness (a*
value) as BCS increased. The lower redness values were only significant for BCS 4
red deer stags and BCS 4 fallow deer does compared with other BCS categories. This
decrease in redness may be related to fat deposition within the muscle. Hocqette et al
(2006) speculated that differences in levels of IMF and proportion of different
muscle fibre types may lead to differences in meat colour and tenderness. Meat from
goats (Madruga et al 2008) and lambs (Perlo et al 2008; Diaz et al 2002) with low
BCS had higher redness values. A study comparing meat from goats and lambs
Chapter Four
134
found that goats had higher redness values than lambs, and it was believed to be
associated with increased fatness in the lambs (Mushi et al 2008) and lower carcass
fatness in goats (Mushi et al 2008; Priolo et al 2002). Moloney et al (2008) also
found decreasing redness values over a longer concentrate feeding time in beef
correlated with increasing carcass weights. Stevenson-Barry et al (1999) determined
that increasing redness values correlated with an increase in animal age or pH, and
increased toughness in red deer venison and in beef (Triumf et al 2012). This
supports the findings for venison in this study where the lowest redness values were
measured in the most tender venison and therefore, lack of redness may be a possible
indicator of tenderness in venison. A pasture feeding study by Purchas and Zou
(2008) found that Wagyu-cross steers had lighter meat and the lowest shear force
values, while Friesen bull beef was darkest and least tender. The authors speculated
that the colour measures were due to high levels of fat marbling in the longissimus
muscle of the Wagyu-cross steers. In agreement with this study, there was no
significance difference in pHu between groups. Meat from lambs with lower GR
depths has also been shown to be leaner and more red (Perlo et al 2008; Diaz et al,
2002). Fallow deer haviers of BCS 2 and 3 had lower redness and yellowness than
fallow deer bucks of the same BCS, which may be attributable to hormonal status,
muscle activity and fat accretion. Animals in this study were slaughtered in April,
shortly after the completion of the rut, which may explain differences in meat colour,
because haviers are unaffected by breeding season. Stevenson et al (1992) reported
that leaner post-rut venison from red deer stags was redder than pre-rut meat which
also exhibited higher GR fat thickness. Redness of meat depends on the content and
state of heme pigments in the muscle. Meat with higher redness values, as with BCS
2 animals in this study, exhibits increased levels of oxymyoglobin and lower levels
of metmyoglobin (Fernandez-Lopez et al 2000). Animals that have higher levels of
myoglobin are likely to be more physically active and possibly more aggressive than
animals with lower levels (Mushi et al 2008). Animals grazing on pasture tend to be
more physically active and often leaner than those on feedlots, and have subsequent
higher amounts of heme pigments in the muscle.
Chapter Four
135
4.5: Conclusions
This study confirmed the inconsistent relationship between live weight and BCS. The
variation in BCS resulted in some differences in the measured meat quality
parameters for fallow and red deer. The fallow does with BCS 4 had higher IMF
content than BCS 3 and BCS 2. This difference in IMF content was also the most
obvious quality variation between BCS 3 and 4 for red deer. Sensory analysis and
consumer acceptance data were collected to test the hypothesis that BCS and venison
quality attributes are related to consumer expectation for the primary measures of
eating quality such as tenderness, juiciness and flavour (Chapter 7). A relationship
between BCS and consumer acceptance has previously been established for sheep
(Glimp et al 1998) and beef cattle (Gresham et al 1986; Hoving-Bolink et al 1999),
with USDA and Meat Standards Australia (MSA) grading systems well established
on domestic and international markets. This has re-established consumer confidence
and premium prices for product of consistent description and quality in those
industries. It remains to be seen if the BCS descriptor system established for deer and
the relationships now established with meat quality can be used by industry in a
similar way to bring about product consistency for venison.
In the present study red and fallow deer between 12 and 30 months of age raised on
pasture usually had a BCS between 2 and 3. In Australia, most deer are raised on
pasture and slaughtered for venison within this age range, and are unlikely to achieve
BCS 4 unless supplementary-fed in these age groupings (Chapter 5).
Venison quality within these age groupings and body condition scores is of
consistently high quality in terms of the major meat quality parameters of pH, colour,
tenderness and intramuscular fat. Venison that has increased tenderness and IMF
may be achieved by obtaining BCS 4 animals or processing does.
Venison producers are currently paid per kg of hot carcass weight. The target
premium carcass weight ranges specified by Tuckwell (2003) are 25 kg to 35 kg for
fallow deer, and 55 kg to 75 kg in red deer, regardless of sex, animal age and BCS.
By utilising the BCS system along with live weight, producers of venison can deliver

Chapter Four
136
an animal with the view to supplying optimal quality venison for specified markets
and then be paid accordingly. This system should aid producers and processors alike
in achieving better quality assurance for Australian venison.
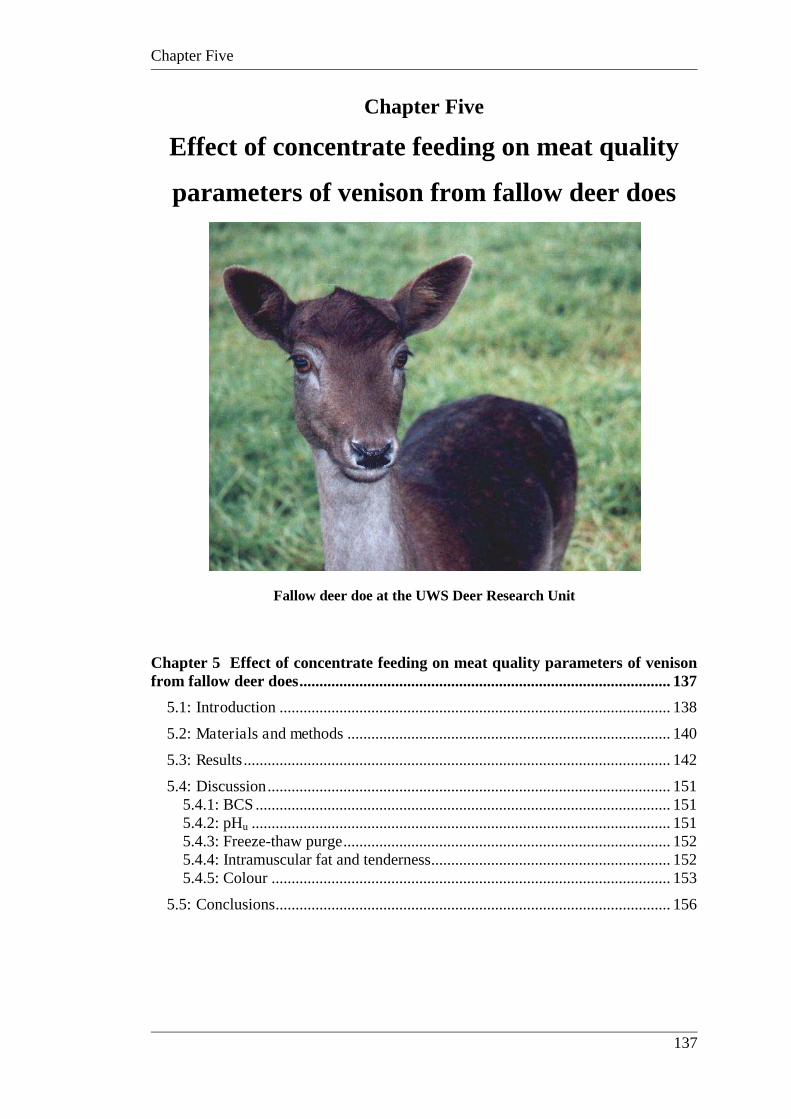
Chapter Five
137
Chapter Five
Effect of concentrate feeding on meat quality
parameters of venison from fallow deer does
Fallow deer doe at the UWS Deer Research Unit
Chapter 5 Effect of concentrate feeding on meat quality parameters of venison from fallow deer does ............................................................................................. 137
5.1: Introduction .................................................................................................. 138
5.2: Materials and methods ................................................................................. 140
5.3: Results ........................................................................................................... 142
5.4: Discussion ..................................................................................................... 151 5.4.1: BCS ........................................................................................................ 151 5.4.2: pHu ......................................................................................................... 151 5.4.3: Freeze-thaw purge .................................................................................. 152 5.4.4: Intramuscular fat and tenderness............................................................ 152 5.4.5: Colour .................................................................................................... 153
5.5: Conclusions ................................................................................................... 156
Chapter Five
138
5.1: Introduction
Body condition score is a useful tool in assessment of animal well-being (Flesch et al
2002), and a frequently used descriptor in the buying and selling of livestock for
slaughter. The BCS of an animal can be altered by the presence or absence of
supplementary feeds. Meat production systems for beef (Hunter et al 2001), lamb
(Pethick et al 2005a) and goat meat (Adam et al 2010; Madruga et al 2008)
frequently utilise supplementary feeding to increase feed conversion efficiency and
to produce carcasses that consistently meet market specifications. Market
specifications are often established according to the amount of subcutaneous fat
coverage on the live animal (Gaden et al 2005) and scales of reference have been
established that allow accurate prediction of carcass characteristics from live animal
BCS assessments in fallow (Flesch et al 2002) and red deer (Audige et al 1998;
Tuckwell 2003b).
Supplementary feeding strategies are often implemented in the production of red
meat in order to finish animals and achieve desired live weight targets prior to
slaughter (Cozzi et al 2009; Dannenberger et al 2006). Concentrate feeding is also
used to manipulate meat quality parameters such as degree of fatness and marbling
(Kerth et al 2007; Moloney et al 2008), fatty acid composition and flavour profiles
(Font i Furnols et al 2007). Studies on the effect of supplementary feeding with
concentrate feeds in relation to these meat quality parameters have been carried out
for beef (Cozzi et al 2009); lamb (Font i Furnols et al 2009), reindeer (Wiklund et al
2003a); and red deer (Phillip et al 2007).
Fallow deer are frequently fed concentrates over winter (Flesch et al 2002) or in
times of pastoral feed deficiency (Tuckwell 2003b). In the quest to meet market
specifications for fallow deer, it is necessary to also understand the effects of
supplementary feeding prior to slaughter on eating quality. Cooking methods are
usually implicated in changes to odour and flavour of meat. The type of feed
consumed immediately prior to slaughter by other domesticated animals used for
meat production, such as cattle (Resconi et al 2010) and sheep (Resconi et al 2009),
has been shown to alter the flavour of meat, with Lawrie and Ledward (2006)
Chapter Five
139
indicating that the degree of fatness of the carcass can also change perceptions of
flavour.
Studies comparing the effects of grain vs. pasture finishing have usually been
conducted in the major meat species, cattle and sheep. McCaughey & Cliplef (1996)
fed steers with grain over 33 or 75 days prior to slaughter and compared the meat
quality with meat from animals in a pasture control group. The study demonstrated
that while pasture finished steers had lower yields and darker meat, there were no
effects on tenderness, juiciness, flavour and overall acceptability according to
consumer testing, with the majority of animals meeting market requirements. Similar
studies were conducted by Pethick et al (2005a) on lamb resulting in
recommendations that the decision to grain finish should be based on production
costs due to the limited impact on eating quality.
Dahlan et al (2008) conducted a study looking at the chemical composition of farmed
tropical and temperate deer species. Fallow, sambar and Javan rusa deer were fed
concentrates which resulted in higher IMF content than the grazing Moluccan rusa
and red deer. As a species, fallow and red deer exhibited higher IMF than rusa and
sambar deer regardless of feed type. Venison from supplementary-fed deer was
redder in colour than grass-fed deer. Higher palatability feeding regimes significantly
influenced fat composition. Feeding red deer and reindeer commercial feed mixtures
(grain-based pellets) for 8-10 weeks prior to slaughter has been demonstrated to
significantly change the quality of venison compared with control groups of animals
grazing natural pasture before slaughter (Wiklund et al 2001a; 2003a; 2003b).
For the deer industry it is important to acknowledge the impact of feed type (pasture
vs. grain) on the quality of the meat. The image of venison is largely focused around
natural grazing to produce lean, nutritious meat (Tesanovic et al 2011). This study
investigated the influence of supplementary feeding, prior to slaughter, on carcass
and meat quality attributes of venison from fallow deer does.
Chapter Five
140
5.2: Materials and methods
Twenty four non-pregnant fallow deer does (at the commencement of the trial were
approximately 36 months old, with an average live weight of 43 kg and BCS 2)
(Flesch et al 2002) raised at UWS were included in the study. The animals were
quarter-bred hybrids of European type fallow deer (Dama dama) and the
Mesopotamian type (Dama dama mesopotamica), with European fallow deer being
the dominant influence. All does, prior to the feeding trial, had been raised on kikuyu
pasture, oversown with ryegrass and oats during winter. Twelve animals were grazed
on kikuyu pasture oversown with ryegrass and oats in winter. The remaining twelve
animals were fed lucerne hay (500 g/animal/day) and steam rolled barley (800
g/animal/day) during the feeding period.
Body condition score was assessed for each animal at the commencement and
completion of the trial using live palpation techniques as described by Flesch et al
(2002) (Plate 5.1). Animals were slaughtered using the methods described in Chapter
3. Animals were slaughtered in two groups: group 1 after 135 days (n=12; 6 grazing
and 6 barley/hay fed animals) and group 2 after 170 days (n=12; 6 grazing and 6
barley/hay fed animals) of feeding treatment. Dressed carcass weights, muscle pH
and core body temperatures were recorded 1-2 hours post-slaughter, and kidneys
excised. Carcasses were then transferred to the chiller. Core body temperature and
pH were logged hourly for 12 hours after slaughter. At 24 hours post-mortem,
ultimate pH (pHu) measurements and final core body temperatures were recorded.
Carcasses were examined to confirm BCS via fat depths and KFI. Samples of LD
(from the right side), as described in Chapter 3, were then excised and stored at
-21 ˚C for no more than 12 weeks for later analysis. Samples were analysed for
colour, drip loss and tenderness, as described in Chapter 3.
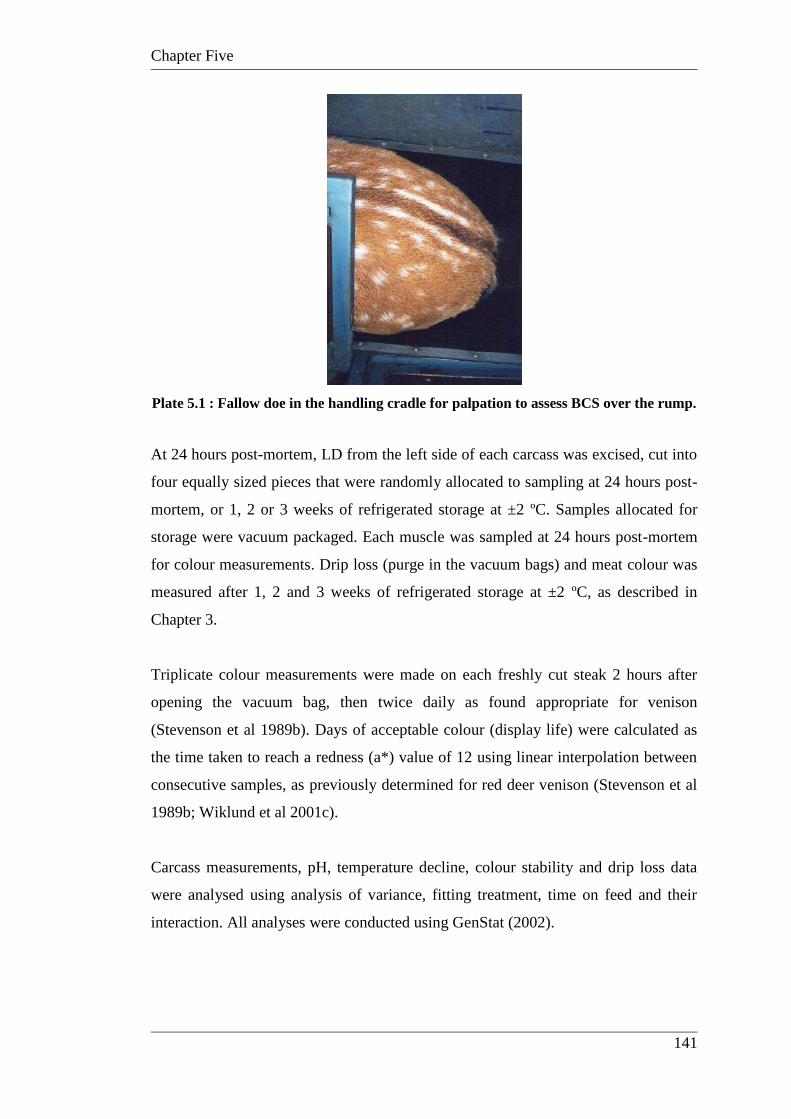
Chapter Five
141
Plate 5.1 : Fallow doe in the handling cradle for palpation to assess BCS over the rump.
At 24 hours post-mortem, LD from the left side of each carcass was excised, cut into
four equally sized pieces that were randomly allocated to sampling at 24 hours post-
mortem, or 1, 2 or 3 weeks of refrigerated storage at ±2 ºC. Samples allocated for
storage were vacuum packaged. Each muscle was sampled at 24 hours post-mortem
for colour measurements. Drip loss (purge in the vacuum bags) and meat colour was
measured after 1, 2 and 3 weeks of refrigerated storage at ±2 ºC, as described in
Chapter 3.
Triplicate colour measurements were made on each freshly cut steak 2 hours after
opening the vacuum bag, then twice daily as found appropriate for venison
(Stevenson et al 1989b). Days of acceptable colour (display life) were calculated as
the time taken to reach a redness (a*) value of 12 using linear interpolation between
consecutive samples, as previously determined for red deer venison (Stevenson et al
1989b; Wiklund et al 2001c).
Carcass measurements, pH, temperature decline, colour stability and drip loss data
were analysed using analysis of variance, fitting treatment, time on feed and their
interaction. All analyses were conducted using GenStat (2002).
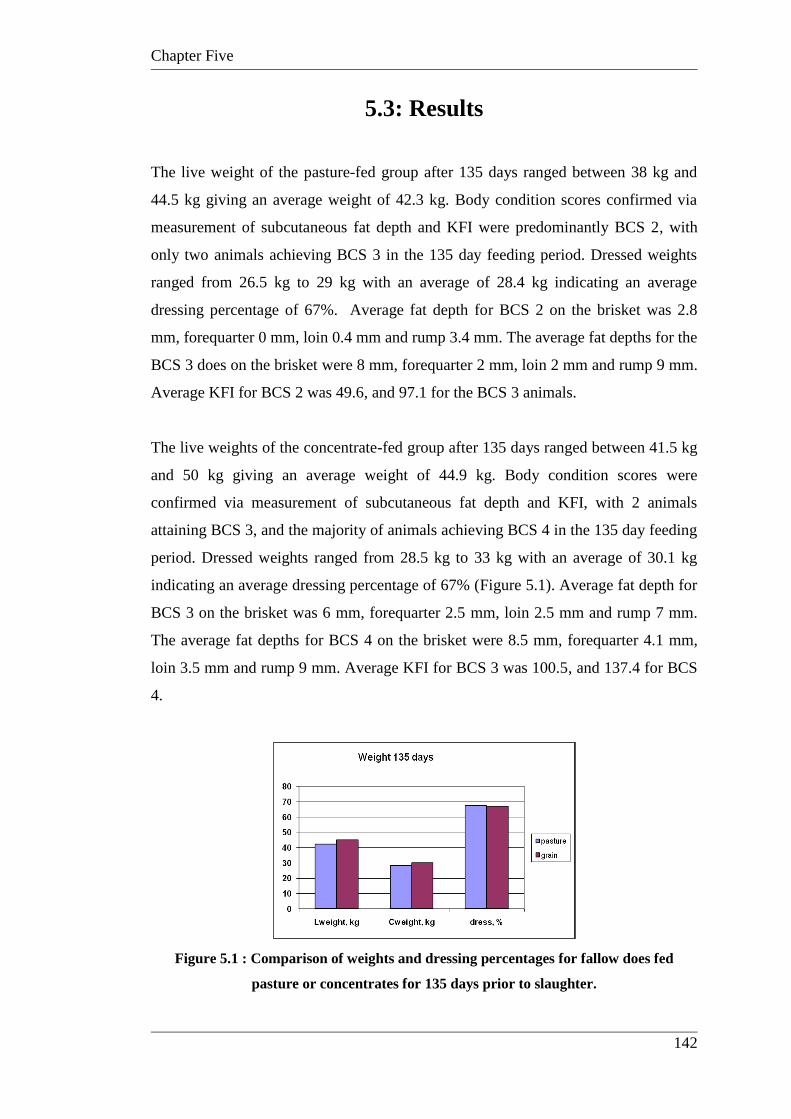
Chapter Five
142
5.3: Results
The live weight of the pasture-fed group after 135 days ranged between 38 kg and
44.5 kg giving an average weight of 42.3 kg. Body condition scores confirmed via
measurement of subcutaneous fat depth and KFI were predominantly BCS 2, with
only two animals achieving BCS 3 in the 135 day feeding period. Dressed weights
ranged from 26.5 kg to 29 kg with an average of 28.4 kg indicating an average
dressing percentage of 67%. Average fat depth for BCS 2 on the brisket was 2.8
mm, forequarter 0 mm, loin 0.4 mm and rump 3.4 mm. The average fat depths for the
BCS 3 does on the brisket were 8 mm, forequarter 2 mm, loin 2 mm and rump 9 mm.
Average KFI for BCS 2 was 49.6, and 97.1 for the BCS 3 animals.
The live weights of the concentrate-fed group after 135 days ranged between 41.5 kg
and 50 kg giving an average weight of 44.9 kg. Body condition scores were
confirmed via measurement of subcutaneous fat depth and KFI, with 2 animals
attaining BCS 3, and the majority of animals achieving BCS 4 in the 135 day feeding
period. Dressed weights ranged from 28.5 kg to 33 kg with an average of 30.1 kg
indicating an average dressing percentage of 67% (Figure 5.1). Average fat depth for
BCS 3 on the brisket was 6 mm, forequarter 2.5 mm, loin 2.5 mm and rump 7 mm.
The average fat depths for BCS 4 on the brisket were 8.5 mm, forequarter 4.1 mm,
loin 3.5 mm and rump 9 mm. Average KFI for BCS 3 was 100.5, and 137.4 for BCS
4.
Figure 5.1 : Comparison of weights and dressing percentages for fallow does fed
pasture or concentrates for 135 days prior to slaughter.
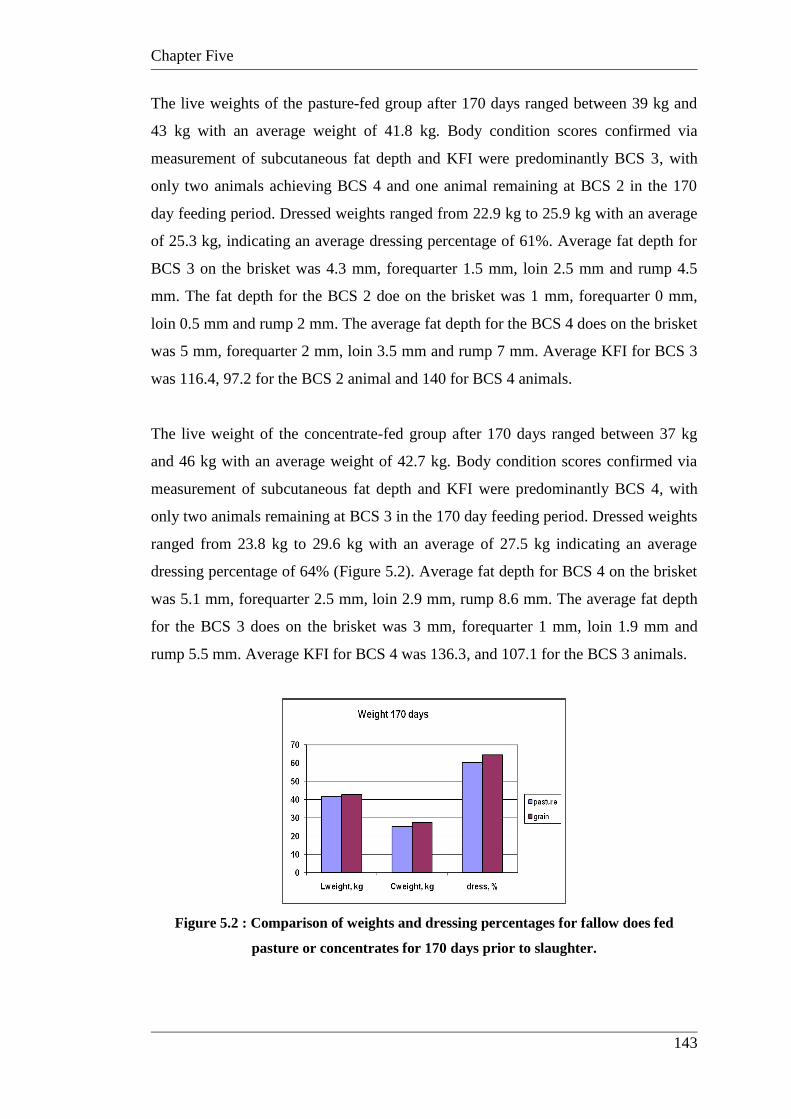
Chapter Five
143
The live weights of the pasture-fed group after 170 days ranged between 39 kg and
43 kg with an average weight of 41.8 kg. Body condition scores confirmed via
measurement of subcutaneous fat depth and KFI were predominantly BCS 3, with
only two animals achieving BCS 4 and one animal remaining at BCS 2 in the 170
day feeding period. Dressed weights ranged from 22.9 kg to 25.9 kg with an average
of 25.3 kg, indicating an average dressing percentage of 61%. Average fat depth for
BCS 3 on the brisket was 4.3 mm, forequarter 1.5 mm, loin 2.5 mm and rump 4.5
mm. The fat depth for the BCS 2 doe on the brisket was 1 mm, forequarter 0 mm,
loin 0.5 mm and rump 2 mm. The average fat depth for the BCS 4 does on the brisket
was 5 mm, forequarter 2 mm, loin 3.5 mm and rump 7 mm. Average KFI for BCS 3
was 116.4, 97.2 for the BCS 2 animal and 140 for BCS 4 animals.
The live weight of the concentrate-fed group after 170 days ranged between 37 kg
and 46 kg with an average weight of 42.7 kg. Body condition scores confirmed via
measurement of subcutaneous fat depth and KFI were predominantly BCS 4, with
only two animals remaining at BCS 3 in the 170 day feeding period. Dressed weights
ranged from 23.8 kg to 29.6 kg with an average of 27.5 kg indicating an average
dressing percentage of 64% (Figure 5.2). Average fat depth for BCS 4 on the brisket
was 5.1 mm, forequarter 2.5 mm, loin 2.9 mm, rump 8.6 mm. The average fat depth
for the BCS 3 does on the brisket was 3 mm, forequarter 1 mm, loin 1.9 mm and
rump 5.5 mm. Average KFI for BCS 4 was 136.3, and 107.1 for the BCS 3 animals.
Figure 5.2 : Comparison of weights and dressing percentages for fallow does fed
pasture or concentrates for 170 days prior to slaughter.
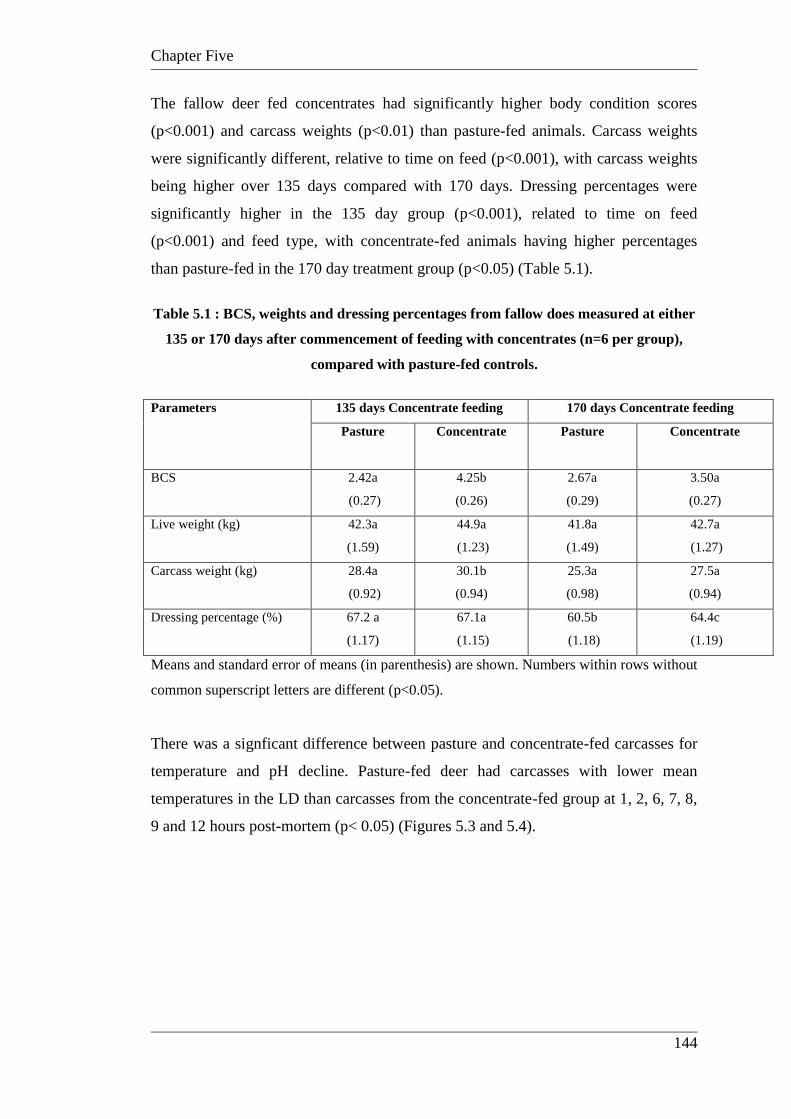
Chapter Five
144
The fallow deer fed concentrates had significantly higher body condition scores
(p<0.001) and carcass weights (p<0.01) than pasture-fed animals. Carcass weights
were significantly different, relative to time on feed (p<0.001), with carcass weights
being higher over 135 days compared with 170 days. Dressing percentages were
significantly higher in the 135 day group (p<0.001), related to time on feed
(p<0.001) and feed type, with concentrate-fed animals having higher percentages
than pasture-fed in the 170 day treatment group (p<0.05) (Table 5.1).
Table 5.1 : BCS, weights and dressing percentages from fallow does measured at either
135 or 170 days after commencement of feeding with concentrates (n=6 per group),
compared with pasture-fed controls.
Parameters 135 days Concentrate feeding 170 days Concentrate feeding
Pasture Concentrate Pasture Concentrate
BCS 2.42a
(0.27)
4.25b
(0.26)
2.67a
(0.29)
3.50a
(0.27)
Live weight (kg) 42.3a
(1.59)
44.9a
(1.23)
41.8a
(1.49)
42.7a
(1.27)
Carcass weight (kg) 28.4a
(0.92)
30.1b
(0.94)
25.3a
(0.98)
27.5a
(0.94)
Dressing percentage (%) 67.2 a
(1.17)
67.1a
(1.15)
60.5b
(1.18)
64.4c
(1.19)
Means and standard error of means (in parenthesis) are shown. Numbers within rows without
common superscript letters are different (p<0.05).
There was a signficant difference between pasture and concentrate-fed carcasses for
temperature and pH decline. Pasture-fed deer had carcasses with lower mean
temperatures in the LD than carcasses from the concentrate-fed group at 1, 2, 6, 7, 8,
9 and 12 hours post-mortem (p< 0.05) (Figures 5.3 and 5.4).
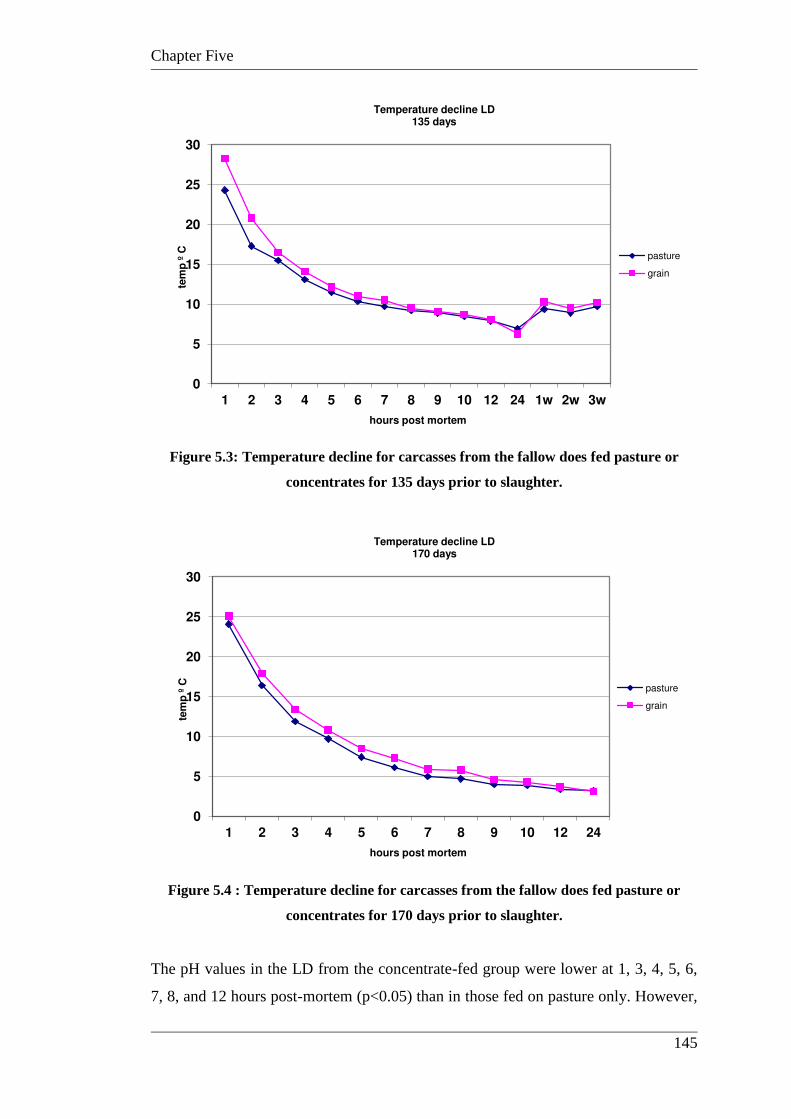
Chapter Five
145
Figure 5.3: Temperature decline for carcasses from the fallow does fed pasture or
concentrates for 135 days prior to slaughter.
Figure 5.4 : Temperature decline for carcasses from the fallow does fed pasture or
concentrates for 170 days prior to slaughter.
The pH values in the LD from the concentrate-fed group were lower at 1, 3, 4, 5, 6,
7, 8, and 12 hours post-mortem (p<0.05) than in those fed on pasture only. However,
0
5
10
15
20
25
30
1 2 3 4 5 6 7 8 9 10 12 24 1w 2w 3w
tem
p º
C
hours post mortem
Temperature decline LD 135 days
pasture
grain
0
5
10
15
20
25
30
1 2 3 4 5 6 7 8 9 10 12 24
tem
p º
C
hours post mortem
Temperature decline LD 170 days
pasture
grain
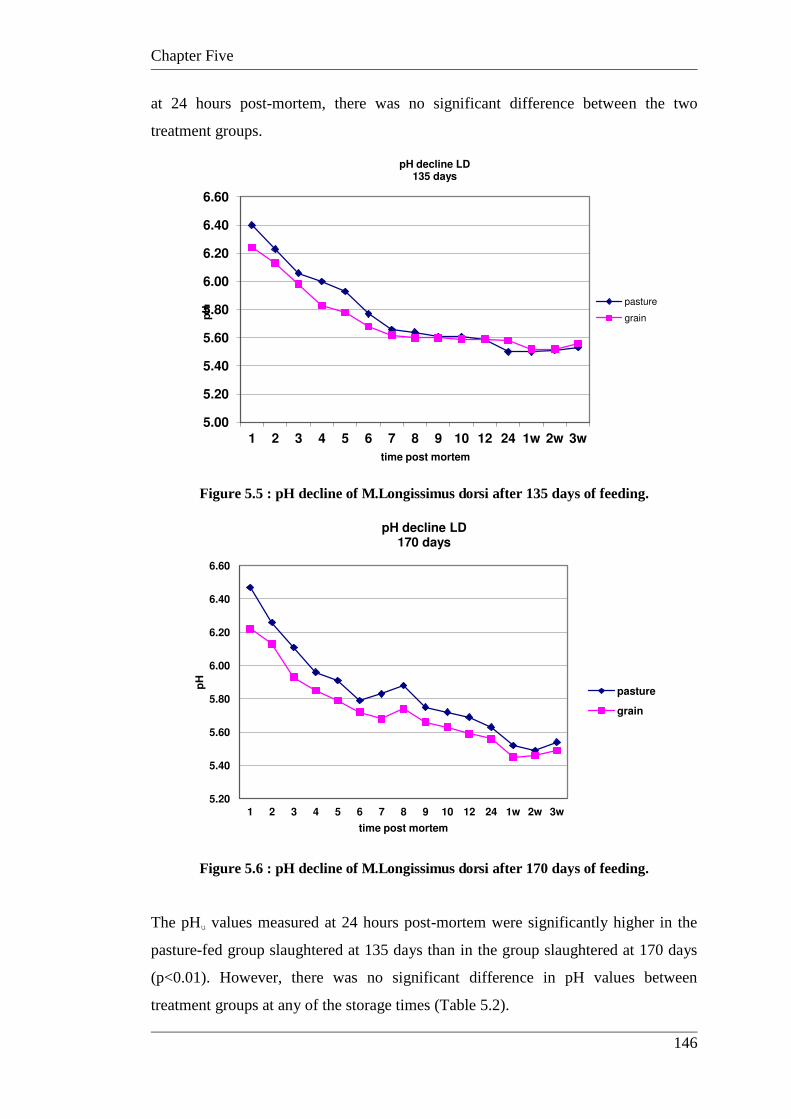
Chapter Five
146
at 24 hours post-mortem, there was no significant difference between the two
treatment groups.
Figure 5.5 : pH decline of M.Longissimus dorsi after 135 days of feeding.
Figure 5.6 : pH decline of M.Longissimus dorsi after 170 days of feeding.
The pHu values measured at 24 hours post-mortem were significantly higher in the
pasture-fed group slaughtered at 135 days than in the group slaughtered at 170 days
(p<0.01). However, there was no significant difference in pH values between
treatment groups at any of the storage times (Table 5.2).
5.00
5.20
5.40
5.60
5.80
6.00
6.20
6.40
6.60
1 2 3 4 5 6 7 8 9 10 12 24 1w 2w 3w
pH
time post mortem
pH decline LD 135 days
pasture
grain
5.20
5.40
5.60
5.80
6.00
6.20
6.40
6.60
1 2 3 4 5 6 7 8 9 10 12 24 1w 2w 3w
pH
time post mortem
pH decline LD 170 days
pasture
grain
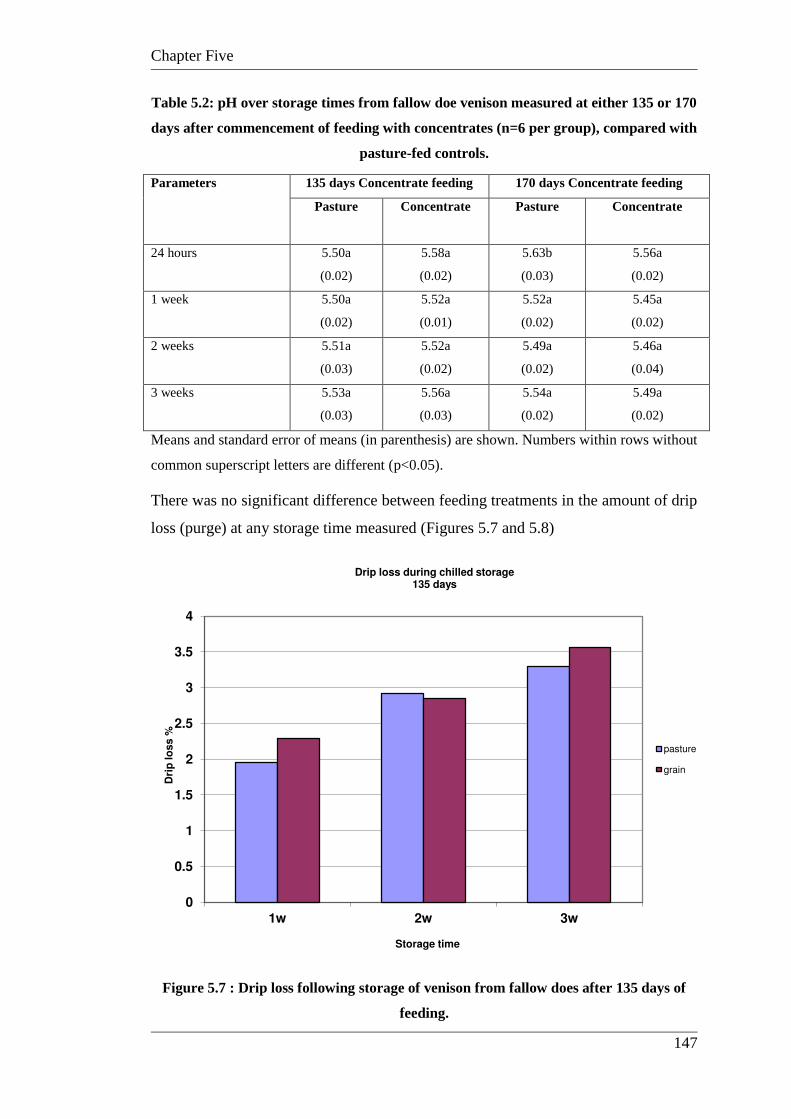
Chapter Five
147
Table 5.2: pH over storage times from fallow doe venison measured at either 135 or 170
days after commencement of feeding with concentrates (n=6 per group), compared with
pasture-fed controls.
Parameters 135 days Concentrate feeding 170 days Concentrate feeding
Pasture Concentrate Pasture Concentrate
24 hours 5.50a
(0.02)
5.58a
(0.02)
5.63b
(0.03)
5.56a
(0.02)
1 week 5.50a
(0.02)
5.52a
(0.01)
5.52a
(0.02)
5.45a
(0.02)
2 weeks 5.51a
(0.03)
5.52a
(0.02)
5.49a
(0.02)
5.46a
(0.04)
3 weeks 5.53a
(0.03)
5.56a
(0.03)
5.54a
(0.02)
5.49a
(0.02)
Means and standard error of means (in parenthesis) are shown. Numbers within rows without
common superscript letters are different (p<0.05).
There was no significant difference between feeding treatments in the amount of drip
loss (purge) at any storage time measured (Figures 5.7 and 5.8)
Figure 5.7 : Drip loss following storage of venison from fallow does after 135 days of
feeding.
0
0.5
1
1.5
2
2.5
3
3.5
4
1w 2w 3w
Dri
p lo
ss %
Storage time
Drip loss during chilled storage 135 days
pasture
grain
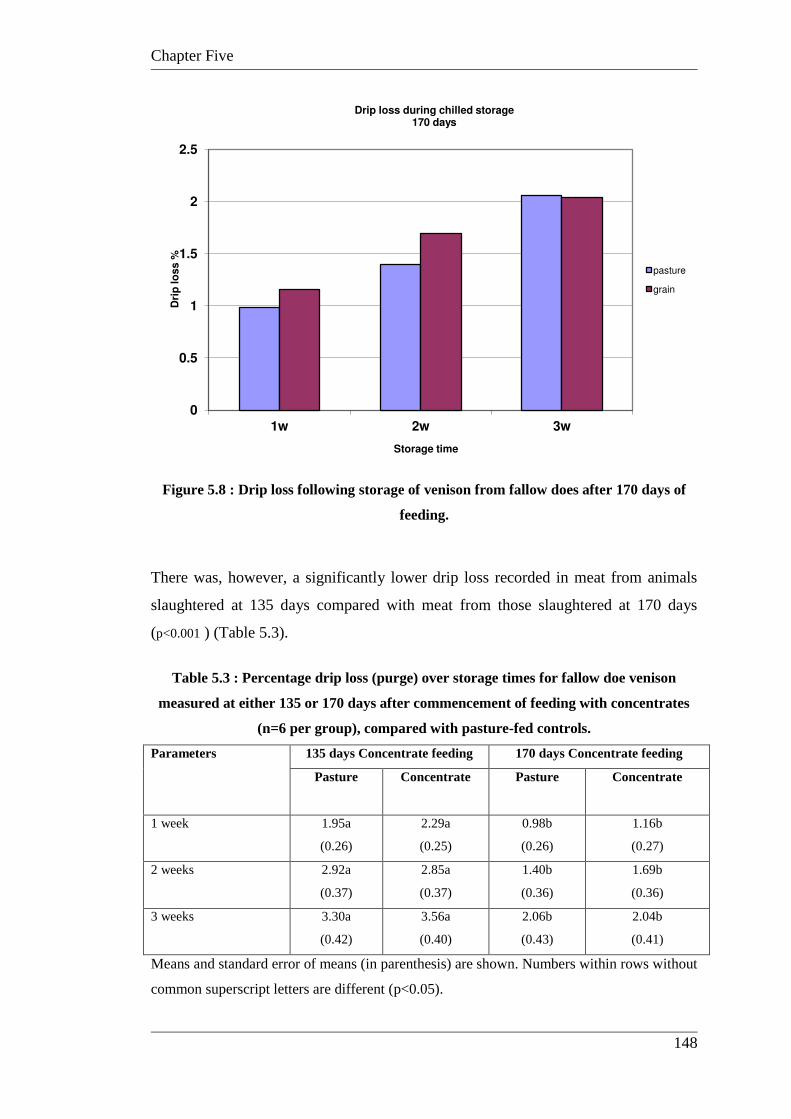
Chapter Five
148
Figure 5.8 : Drip loss following storage of venison from fallow does after 170 days of
feeding.
There was, however, a significantly lower drip loss recorded in meat from animals
slaughtered at 135 days compared with meat from those slaughtered at 170 days
(p<0.001 ) (Table 5.3).
Table 5.3 : Percentage drip loss (purge) over storage times for fallow doe venison
measured at either 135 or 170 days after commencement of feeding with concentrates
(n=6 per group), compared with pasture-fed controls.
Parameters 135 days Concentrate feeding 170 days Concentrate feeding
Pasture Concentrate Pasture Concentrate
1 week 1.95a
(0.26)
2.29a
(0.25)
0.98b
(0.26)
1.16b
(0.27)
2 weeks 2.92a
(0.37)
2.85a
(0.37)
1.40b
(0.36)
1.69b
(0.36)
3 weeks 3.30a
(0.42)
3.56a
(0.40)
2.06b
(0.43)
2.04b
(0.41)
Means and standard error of means (in parenthesis) are shown. Numbers within rows without
common superscript letters are different (p<0.05).
0
0.5
1
1.5
2
2.5
1w 2w 3w
Dri
p lo
ss %
Storage time
Drip loss during chilled storage 170 days
pasture
grain
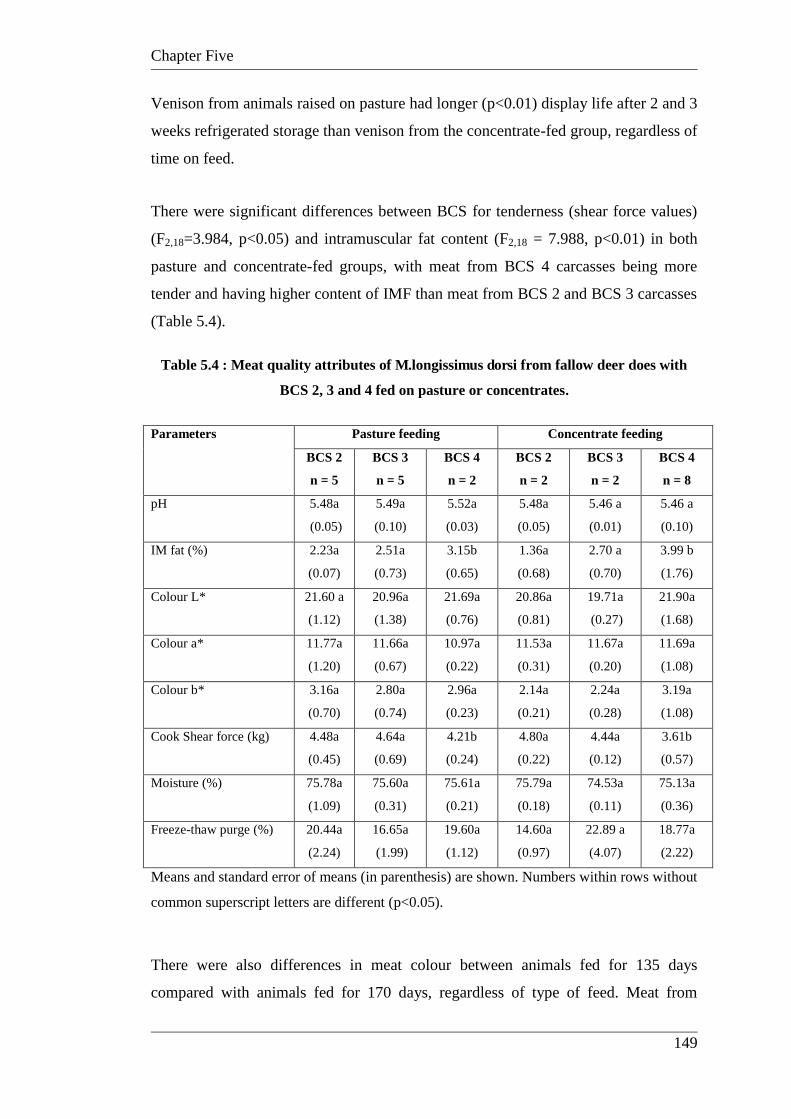
Chapter Five
149
Venison from animals raised on pasture had longer (p<0.01) display life after 2 and 3
weeks refrigerated storage than venison from the concentrate-fed group, regardless of
time on feed.
There were significant differences between BCS for tenderness (shear force values)
(F2,18=3.984, p<0.05) and intramuscular fat content (F2,18 = 7.988, p<0.01) in both
pasture and concentrate-fed groups, with meat from BCS 4 carcasses being more
tender and having higher content of IMF than meat from BCS 2 and BCS 3 carcasses
(Table 5.4).
Table 5.4 : Meat quality attributes of M.longissimus dorsi from fallow deer does with
BCS 2, 3 and 4 fed on pasture or concentrates.
Parameters Pasture feeding Concentrate feeding
BCS 2
n = 5
BCS 3
n = 5
BCS 4
n = 2
BCS 2
n = 2
BCS 3
n = 2
BCS 4
n = 8
pH 5.48a
(0.05)
5.49a
(0.10)
5.52a
(0.03)
5.48a
(0.05)
5.46 a
(0.01)
5.46 a
(0.10)
IM fat (%) 2.23a
(0.07)
2.51a
(0.73)
3.15b
(0.65)
1.36a
(0.68)
2.70 a
(0.70)
3.99 b
(1.76)
Colour L* 21.60 a
(1.12)
20.96a
(1.38)
21.69a
(0.76)
20.86a
(0.81)
19.71a
(0.27)
21.90a
(1.68)
Colour a* 11.77a
(1.20)
11.66a
(0.67)
10.97a
(0.22)
11.53a
(0.31)
11.67a
(0.20)
11.69a
(1.08)
Colour b* 3.16a
(0.70)
2.80a
(0.74)
2.96a
(0.23)
2.14a
(0.21)
2.24a
(0.28)
3.19a
(1.08)
Cook Shear force (kg) 4.48a
(0.45)
4.64a
(0.69)
4.21b
(0.24)
4.80a
(0.22)
4.44a
(0.12)
3.61b
(0.57)
Moisture (%) 75.78a
(1.09)
75.60a
(0.31)
75.61a
(0.21)
75.79a
(0.18)
74.53a
(0.11)
75.13a
(0.36)
Freeze-thaw purge (%) 20.44a
(2.24)
16.65a
(1.99)
19.60a
(1.12)
14.60a
(0.97)
22.89 a
(4.07)
18.77a
(2.22)
Means and standard error of means (in parenthesis) are shown. Numbers within rows without
common superscript letters are different (p<0.05).
There were also differences in meat colour between animals fed for 135 days
compared with animals fed for 170 days, regardless of type of feed. Meat from
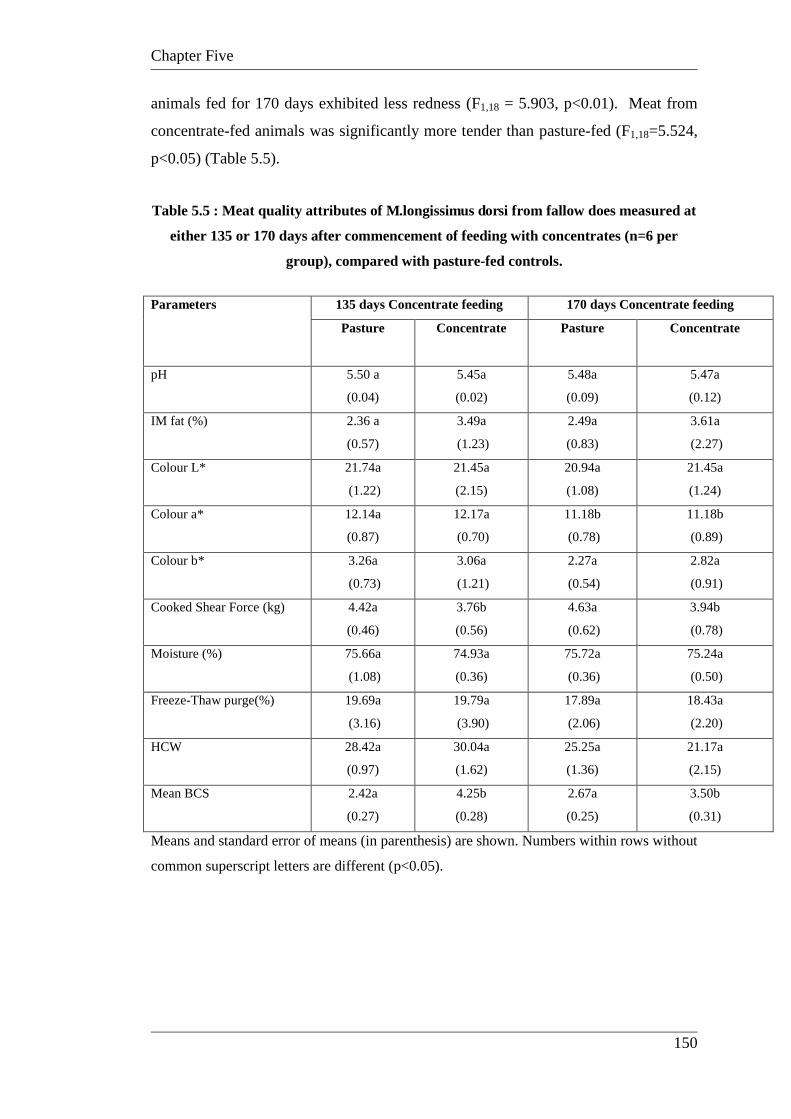
Chapter Five
150
animals fed for 170 days exhibited less redness (F1,18 = 5.903, p<0.01). Meat from
concentrate-fed animals was significantly more tender than pasture-fed (F1,18=5.524,
p<0.05) (Table 5.5).
Table 5.5 : Meat quality attributes of M.longissimus dorsi from fallow does measured at
either 135 or 170 days after commencement of feeding with concentrates (n=6 per
group), compared with pasture-fed controls.
Parameters 135 days Concentrate feeding 170 days Concentrate feeding
Pasture Concentrate Pasture Concentrate
pH 5.50 a
(0.04)
5.45a
(0.02)
5.48a
(0.09)
5.47a
(0.12)
IM fat (%) 2.36 a
(0.57)
3.49a
(1.23)
2.49a
(0.83)
3.61a
(2.27)
Colour L* 21.74a
(1.22)
21.45a
(2.15)
20.94a
(1.08)
21.45a
(1.24)
Colour a* 12.14a
(0.87)
12.17a
(0.70)
11.18b
(0.78)
11.18b
(0.89)
Colour b* 3.26a
(0.73)
3.06a
(1.21)
2.27a
(0.54)
2.82a
(0.91)
Cooked Shear Force (kg)
4.42a
(0.46)
3.76b
(0.56)
4.63a
(0.62)
3.94b
(0.78)
Moisture (%) 75.66a
(1.08)
74.93a
(0.36)
75.72a
(0.36)
75.24a
(0.50)
Freeze-Thaw purge(%) 19.69a
(3.16)
19.79a
(3.90)
17.89a
(2.06)
18.43a
(2.20)
HCW 28.42a
(0.97)
30.04a
(1.62)
25.25a
(1.36)
21.17a
(2.15)
Mean BCS 2.42a
(0.27)
4.25b
(0.28)
2.67a
(0.25)
3.50b
(0.31)
Means and standard error of means (in parenthesis) are shown. Numbers within rows without
common superscript letters are different (p<0.05).
Chapter Five
151
5.4: Discussion
5.4.1: BCS
In this experiment it was clearly demonstrated that concentrate feeding of the fallow
deer does increased BCS (8 animals of 12 classified as BCS 4 compared with 2 of 12
for animals grazing pasture) (p<0.001). A study by Volpelli et al (2002) found
similar results in a study on fallow deer bucks fed a concentrate mixture for 16 weeks
prior to slaughter. The concentrate-fed deer had significantly higher live weights,
carcass weights, fat deposition and dressing percentages. This is also a consistent
finding in goats (Goetsch et al 2011) and feedlot beef cattle (Realini et al 2004;
Marino et al 2006; Minchin et al 2009). It could also be concluded in this study that
concentrate-fed fallow deer does had higher body condition scores and carcass
weights than the pasture-fed deer. Changes to body composition in deer fed
concentrates needs to be recognised in venison production systems.
5.4.2: pHu
Studies on reindeer have demonstrated that nutritional status and physical condition
obtained with the use of commercial feed mixtures has a considerable effect on
muscle glycogen and meat ultimate pH (pHu) values (Wiklund et al 2000). However,
the measured pHu values in the present study did not indicate a difference in muscle
energy content between the two treatment groups. Similar results were observed by
Volpelli et al (2003) where improved nutritional status did not alter muscle glycogen
stores in fallow deer bucks. There was, however, significantly higher pHu values in
the pasture-fed group slaughtered at 135 days compared with 170 days. The group
slaughtered at 170 days were held in lairage in summer, compared to spring for the
135 days group. The pasture group generally had lower BCS than the concentrate-fed
animals. It is possible that stress affected the pH scores for this group by depleting
glycogen stores prior to slaughter. It must also be noted that pH continued to decline
between 24 hours and 1 week post-mortem (Table 5.2). This suggests that the
ultimate pH had not been attained in the first 24 hours post-mortem. There was no
significant difference in pH from any group after one week of storage. Temperature
Chapter Five
152
decline was more rapid in the pasture-fed group. This is possibly due to the lack of
insulating fat coverage, allowing more rapid cooling.
5.4.3: Freeze-thaw purge
Type of feed did not impact on drip loss/purge results in the current study. However,
it was evident that the group slaughtered at 135 days had lower losses than those
slaughtered at 170 days. Similar studies have been conducted on the water holding
properties of beef (Varela et al 2004), lamb (Diaz et al 2002) and fallow buck
venison (Volpelli et al 2002). These studies confirm the findings from this study that
feed type does not alter water holding capacity of the meat. A study on red deer
found that levels of antioxidants in the meat, such as vitamin E, resulted in
differences in drip loss. One explanation for the difference between groups
slaughtered at 135 days compared with 170 days may be the changes in pasture
quality as the seasons moved from late winter through to summer. Animals
slaughtered at 170 days had access to pasture from the spring flush, which may have
affected antioxidant levels in the feed consumed. The differences may have been
large enough to account for the differences between the groups slaughtered at 135
days compared with those slaughtered at 170 days.
5.4.4: Intramuscular fat and tenderness
Animals with higher BCS in this study had significantly higher IMF content and the
meat was generally more tender. A number of studies in other meat species have
yielded similar results, with meat from red deer (Purchas et al 2010), foals (Franco et
al 2011), lambs (Bonacina et al 2011), goats (Goetsch et al 2011) and beef (Lee at al
2009; Turner et al 2011) exhibiting higher instrumental tenderness as IMF increased.
Muscle lipid content has been positively correlated to tenderness in meat (Turner et
al 2011) although the reasons for this remain unclear. Raw muscle shear values were
not affected but once cooked, the meat was less tender for the pasture-fed deer, as
was the case for beef (Thenard et al 2006). Meat from the concentrate-fed animals
was significantly more tender than meat from the pasture-fed animals. Similar
Chapter Five
153
findings have been demonstrated in beef (Dannenberger et al 2006; Lanari et al
2002) and lamb (Perlo et al 2008; Ekiz et al 2012).
5.4.5: Colour
The venison from animals fed either pasture or concentrates only for longer periods
prior to slaughter, in this study, exhibited less redness, although there was no
difference in colour as a result of feed type. Animals fed for 170 days had lower
redness values than those fed for 135 days. It is suggested that the increased BCS,
and associated increase in IMF content in the meat, may have decreased the redness
of the meat in animals fed for 170 days. Another explanation could be the low levels
of antioxidants in the concentrate feed, which was reflected in the meat colour.
Earlier studies in red deer (Wiklund et al 2006) have demonstrated that pasture has
higher levels of antioxidants compared with concentrate feed and that meat from
animals grazing pasture exhibit better colour stability compared with meat from
concentrate-fed animals (Wiklund et al 2006). Similar findings have been reported in
beef cattle (Lanari et al 2002; Dunne et al 2011) and lambs (Diaz et al 2002; Perlo et
al 2008). Conversely, the meat from goats (Madruga et al 2008; Rodrigues et al
2011) and lambs (Perlo et al; Diaz et al 2002; Ekiz et al 2012) with low BCS had
higher redness values. A beef cattle study on time on feed prior to slaughter (Sami et
al 2004) found no significant difference between grain and pasture feeding.
However, bulls fed for 138 days vs. 100 days prior to slaughter had increased BCS,
and a significantly lower redness value relating to heme pigment concentration, as
well as increased IMF (Sami et al 2004). Moloney et al (2008) also found decreasing
redness values over longer feeding time in beef correlated with increasing carcass
weights. Hessle et al (2007) also confirm that changes in carcass traits appear to be
related to length of finishing period, rather than levels of grain feeding. This is
similar to the finding in the current study.
In studies comparing grain and pasture feeding in cattle, Hoving-Bolink et al (1999)
found that beef heifers had increased levels of IMF, lighter coloured and more tender
meat when supplemented with grain. These data support findings in the deer in this
study, and also concur that diet had no effect on pHu values or thaw loss/purge. In
Chapter Five
154
beef, studies have shown that grain-supplemented cattle resulted in fatter carcasses
and produced the most tender beef (French et al 2001, Moloney et al 2011; Cozzi et
al 2009). A pasture feeding study by Purchas and Zou (2008) found that Wagyu-
cross steers had lighter meat and the lowest shear force values, while beef from
Friesen bulls of comparable size was darkest and least tender. The authors speculate
that the colour measures are due to high levels of fat marbling in the longissimus
muscle of the Wagyu-cross steers and in agreement with the present study, there was
no significant difference in pHu between groups. Dannenberger et al (2006) found
that IMF increased as a result of feeding concentrate. Carcasses from the pasture-fed
group had an IMF of 1.5% compared to the grain-fed group at 2.6%. There was no
significant difference in slaughter weights, however longer feed times were required
for pasture-fed animals to achieve slaughter weights. The beef from concentrate-fed
cattle was more tender and lighter in colour, and slaughter weights were achieved
earlier than in pasture-fed cattle. In this study on deer, higher BCS was achieved
faster in the concentrate-fed group, which increased IMF and tenderness and
produced meat with less redness. This result may support the proposition by Purchas
and Zou (2008) that the higher IMF content resulted in less red meat. Pellet-fed
lambs were found to provide the highest carcass yields and dorsal and kidney fat
thickness with lighter colour, high fat marbling and greater tenderness. Pasture-fed
lambs were leaner and more red (Perlo et al 2008; Diaz et al, 2002) with concentrate-
fed lamb being fatter and less red (Priolo et al 2002).
Meat discolouration (from red to brown) results from oxidation of deoxymyoglobin
and oxymyoglobin to metamyoglobin. Type of feed has been implicated in the rate at
which chilled meat display life declines in beef (Yang et al 2002), lamb
(Ponnampalam et al 2001), reindeer (Wiklund and Johansson 2011) and red deer
(Wiklund et al 2002). The present study found that pasture-fed meat held its redness
for a longer period than concentrate-fed meat. This is in agreement with studies on
red deer, where a positive effect of the components of a pasture diet on meat colour
display life was reported (Wiklund et al 2002). Venison from the fallow deer does
finished on pasture maintained the desired red meat colour for longer compared with
venison from the grain-fed deer, which is another good reason for pasture based
management systems from the perspective of consumer preference. The same
findings have been demonstrated in beef (Sapp et al 1999).
Chapter Five
155
There were no significant differences in other meat quality parameters between
animals fed pasture or grain in the current study. This confirms previous reports in
fallow deer bucks (Volpelli et al 2003), beef cattle (Muir et al 1998; Minchin et al,
2009; Pordomingo et al 2012), lambs (Pethick et al 2002; Ripoll et al 2012) and
goats (Adam at el 2010), where decisions to finish on grain or pasture can simply be
based on costs of production (Pethick et al 2005a) and time available to get animals
up to slaughter weights (Muir et al 1998).
In Australia, most deer are raised on pasture and slaughtered for venison within the
age range of 12 to 24 months, therefore the fatty acid composition of the venison
produced from red and fallow deer can be expected to be rich in polyunsaturated
fatty acids (PUFA), as described by Wiklund et al (2001a; 2003a). Concentrate
feeding and resultant higher BCS had a strong tendency to increase IMF content and
tenderness in the meat. Good pasture and feeding with grain-based pellets improved
the nutritional status and physical condition of reindeer (Wiklund et al 1996b) and
red deer (Wiklund et al 2003a), as well as fallow deer in the current study, and had a
considerable effect on muscle glycogen content and meat pHu values. The chemical
composition of the meat changed (Wiklund et al 2001a; 2003a;2003b) so that meat
from grazing animals contained more polyunsaturated fatty acids, while meat from
animals fed grain-based feeds had more saturated fat.
Venison generally has a low fat content but the fatty acid composition is still
important for meat shelf life and for the quality of processed meat products. PUFA
are more prone to oxidation compared with saturated fats, therefore the difference in
fat composition between grazing animals and animals fed grain-based feeds might
also affect the quality of processed meat products (Sampels et al 2004).
Phillip et al (2007) conducted a study on 180 red deer yearlings to determine the
effect of different feed types on deer raised for venison. Live weight gain was
linearly and positively correlated to the proportion of grain in the diet. Fatness was
also linear, aligned with increasing concentrate, even at fixed body weights for
slaughter. The fatty acid composition of the meat was also altered by the different
levels of concentrate feeding in that study. They concluded that high level grain
feeding is an effective nutritional strategy to enhance growth performance, with a
Chapter Five
156
negative impact on carcass fatness, offset by desirable changes in monounsaturated
fatty acids and conjugated linoleic acid. This confirms findings in the current study,
where fatness increased with concentrate feeding of deer as well as finishing time. It
was evident from this study that various meat quality parameters were affected by
type of feed and time on feed, however, none of these had a negative impact on
eating quality.
In other studies on deer, access to high quality pasture and feeding with grain-based
pellets improved the nutritional status and physical condition of both reindeer and
red deer, and had a considerable effect on muscle glycogen content and meat pHu
values (Wiklund et al 1996; Wiklund et al 2003a, Wiklund et al 2003b). Ultimate pH
is a well recognised factor influencing meat quality parameters such as tenderness
and colour of the meat (Wiklund et al 1996). In the present study there was no
difference in pHu between animals fed pasture or grain, or between animals of
different body condition score.
5.5: Conclusions
Type of feed has an impact on the nutritional status of fallow deer does. BCS may be
manipulated by supplementing pasture-fed animals with concentrate feeds. Feeding
concentrates was shown to increase BCS, carcass weight and dressing percentages.
These weights and dressing percentages were higher at 135 days over 170 days and
meat from the 135 day group exhibited lower drip loss. This indicates that there is
li ttle advantage to keeping animals on expensive concentrate feeds for extended
periods of time. A decision on whether or not to feed concentrates prior to slaughter
is contingent on financial factors and timing of slaughter. Meat from animals
produced by either pasture or feeding concentrates is satisfactory from a meat quality
perspective regardless of feed type. Pasture feeding resulted in meat with longer
chilled display life which is a positive for pasture based management.
For the deer industry, it is important to acknowledge the impact of feed type (pasture
vs. grain) on the chemical composition and quality parameters of the meat as well as
ethical aspects of the production systems. The image of venison is very much

Chapter Five
157
focused around natural grazing and ethical production techniques to produce a
healthy type of meat, which are attributes that consumers are increasingly looking for
when purchasing meat and other food products.
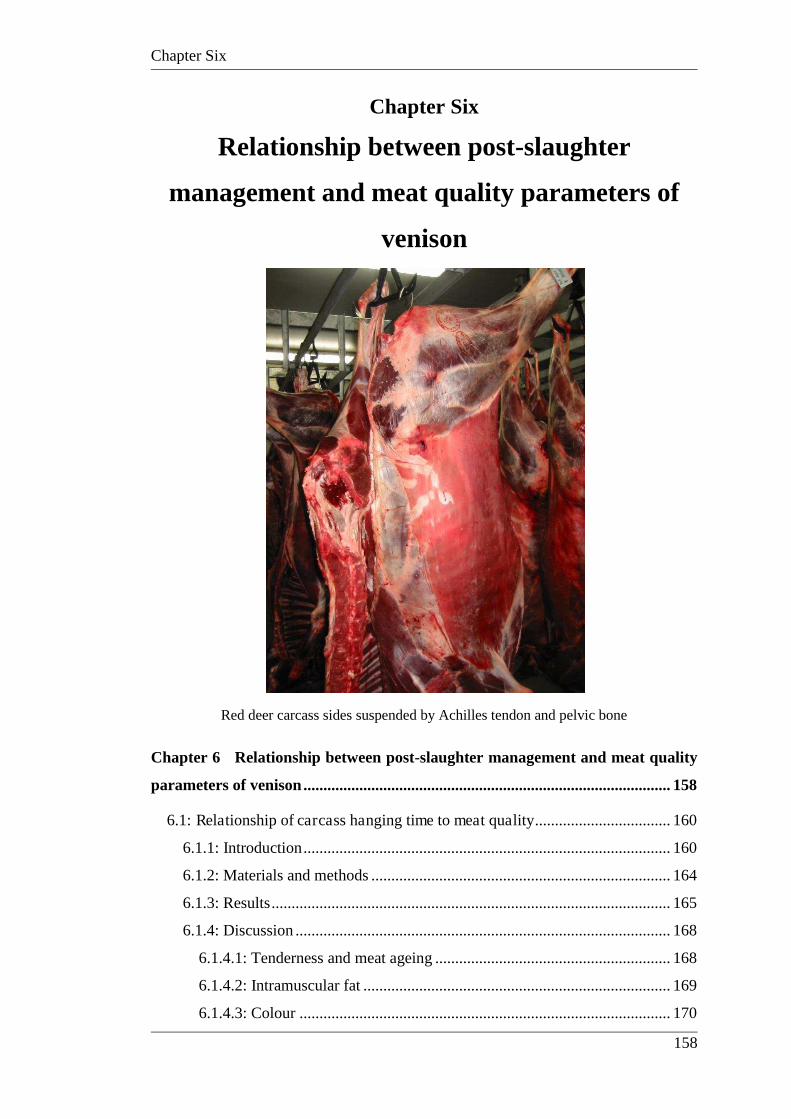
Chapter Six
158
Chapter Six
Relationship between post-slaughter
management and meat quality parameters of
venison
Red deer carcass sides suspended by Achilles tendon and pelvic bone
Chapter 6 Relationship between post-slaughter management and meat quality
parameters of venison ............................................................................................ 158
6.1: Relationship of carcass hanging time to meat quality .................................. 160
6.1.1: Introduction ............................................................................................ 160
6.1.2: Materials and methods ........................................................................... 164
6.1.3: Results .................................................................................................... 165
6.1.4: Discussion .............................................................................................. 168
6.1.4.1: Tenderness and meat ageing ........................................................... 168
6.1.4.2: Intramuscular fat ............................................................................. 169
6.1.4.3: Colour ............................................................................................. 170
Chapter Six
159
6.2: Pelvic suspension vs. Achilles tendon hanging of carcasses ........................ 171
6.2.1: Introduction ............................................................................................ 171
6.2.2 Materials and methods ............................................................................ 175
6.2.2.1 Fallow Deer ...................................................................................... 175
6.2.2.2 Red Deer........................................................................................... 176
6.2.3 Results ..................................................................................................... 177
6.2.3.1 Fallow Deer Venison ....................................................................... 177
6.2.3.2 Red Deer Venison ............................................................................ 180
6.2.4: Discussion .............................................................................................. 181
6.2.4.1: Shear force ...................................................................................... 181
6.2.4.2: Freeze-thaw purge ........................................................................... 183
6.3: Differences between slaughter premises for muscle pH ............................... 184
6.3.1: Introduction ............................................................................................ 184
6.3.2: Materials and methods ........................................................................... 186
6.3.3: Results .................................................................................................... 186
6.3.4: Discussion .............................................................................................. 187
6.4: Conclusions ................................................................................................... 188
Chapter Six
160
6.1: Relationship of carcass hanging time to meat
quality
6.1.1: Introduction
Meat tenderness has been identified by consumers as having high importance in
terms of overall meat quality (Herrera-Mendez et al 2006). Variations in meat
tenderness are a result of a combination of pre- and post-slaughter parameters,
including how meat is prepared for consumption at the consumer end (Koohmaraie
1996). The meat industry has identified a number of factors which affect final meat
tenderness, such as species, breed, age, sex and muscle type. Tenderness of meat is
determined by the amount and solubility of connective tissue, sarcomere length, rate
of proteolysis, as well as the effect of intramuscular fat and post-mortem energy
metabolism (Warner et al 2010). An understanding of the mechanisms involved in
meat tenderness allows the meat industry the scope to improve consistency in terms
of eating quality for consumers (Huff Lonergan et al 2010). Pre-slaughter
management has a significant effect on the final tenderness of the product, including
animal age and condition, finishing regime and animal handling. Post-slaughter
management techniques are also employed in order to enhance final product quality,
such as electrical stimulation, hanging technique, chilling conditions and muscle
ageing (Smulders et al 1991).
Meat ageing is defined as improvements in eating quality that occur in meat as it is
held for a period of time post-mortem (Thompson 2002). Ageing of meat is related to
enzyme activity in the muscle post-mortem, specifically enzymic degradation of
myofibrillar and associated proteins (Koohmaraie 1996). The tenderising process is
recognised as an endogenous proteolytic system related to the action of cathepsins,
the calcium dependent calpains, and the proteasomes in softening the myofibrillar
structure (Herrera-Mendez et al 2006). The role of the calpain system is undisputed,
even though the mode of action is largely unknown, however, there is some question
as to the role of cathepsins in contributing to proteolysis in the early post-mortem
period (Thompson 2002). The rate and extent of tenderising varies to a large degree,
resulting in varied tenderness of meat at the consumer end (Koohmaraie 1996). The
rate of tenderising varies with different species and has been listed in order of speed
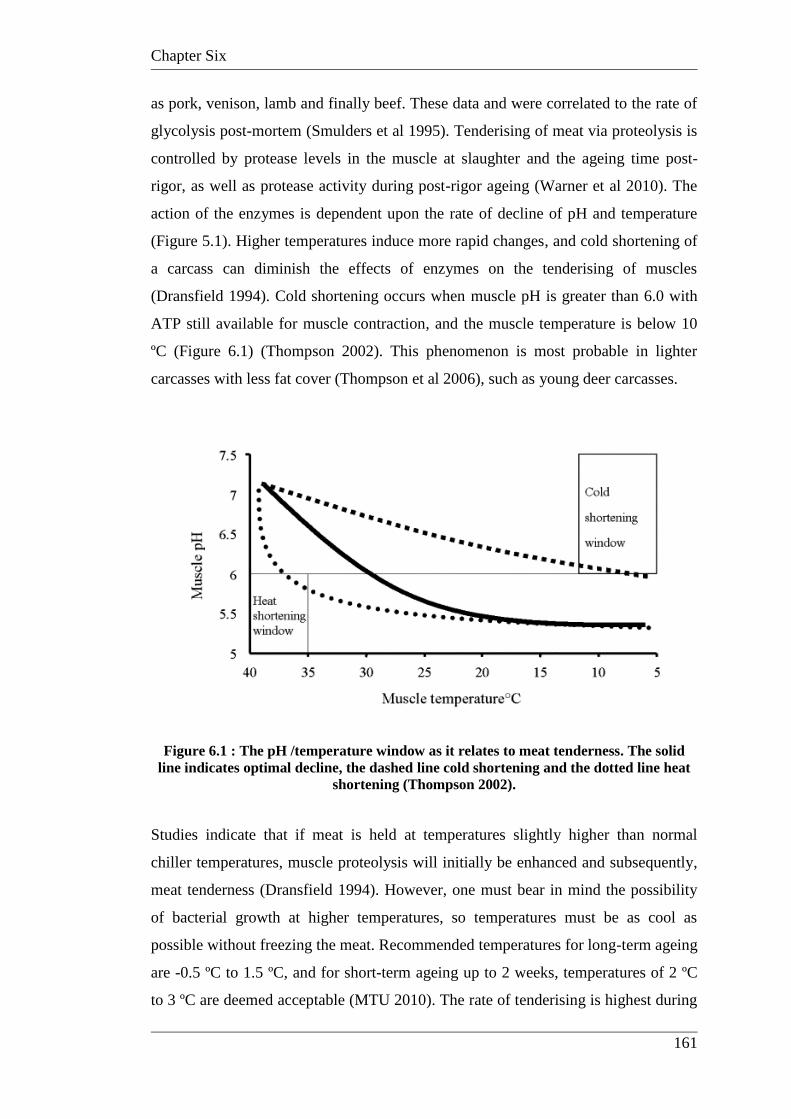
Chapter Six
161
as pork, venison, lamb and finally beef. These data and were correlated to the rate of
glycolysis post-mortem (Smulders et al 1995). Tenderising of meat via proteolysis is
controlled by protease levels in the muscle at slaughter and the ageing time post-
rigor, as well as protease activity during post-rigor ageing (Warner et al 2010). The
action of the enzymes is dependent upon the rate of decline of pH and temperature
(Figure 5.1). Higher temperatures induce more rapid changes, and cold shortening of
a carcass can diminish the effects of enzymes on the tenderising of muscles
(Dransfield 1994). Cold shortening occurs when muscle pH is greater than 6.0 with
ATP still available for muscle contraction, and the muscle temperature is below 10
ºC (Figure 6.1) (Thompson 2002). This phenomenon is most probable in lighter
carcasses with less fat cover (Thompson et al 2006), such as young deer carcasses.
Figure 6.1 : The pH /temperature window as it relates to meat tenderness. The solid line indicates optimal decline, the dashed line cold shortening and the dotted line heat
shortening (Thompson 2002).
Studies indicate that if meat is held at temperatures slightly higher than normal
chiller temperatures, muscle proteolysis will initially be enhanced and subsequently,
meat tenderness (Dransfield 1994). However, one must bear in mind the possibility
of bacterial growth at higher temperatures, so temperatures must be as cool as
possible without freezing the meat. Recommended temperatures for long-term ageing
are -0.5 ºC to 1.5 ºC, and for short-term ageing up to 2 weeks, temperatures of 2 ºC
to 3 ºC are deemed acceptable (MTU 2010). The rate of tenderising is highest during
Chapter Six
162
the early stages of ageing and diminishes with time (MTU 2010). A study by Young
et al (2005) found that rapid ageing of sheep carcasses optimised eating quality when
ageing was promoted by higher temperatures (2-4 ºC).
Tenderising by ageing is also believed to reflect ultrastructural changes in the meat
structure, including separation between myofibrils and sarcolemma, with longer
storage times of 7 and 14 days resulting in more detachment in moose and reindeer
meat (Taylor et al 2001). Different muscles will respond differently to the ageing
process (MTU 2010). Those with higher levels of connective tissue will not improve
as much as those with little connective tissue (MTU 2010). Amount and solubility of
the connective tissue component is related to the age of the animal at slaughter, as
well as activity of the muscle in structure and function in the live animal (Thompson
et al 2006).
Anecdotally, the optimum length of ageing time between slaughter of an animal and
boning the carcass into commercial cuts or storage in vacuum packaging has been a
source of constant debate across all sections of the meat industry for many years.
Sanudo et al (2004) suggested that optimum ageing time depends on many factors,
including breed and age at slaughter. Given the interest in this question, it is
surprising that there has not been more extensive work done to evaluate the effect of
hanging or ageing time on meat quality parameters. Lack of chiller storage space and
interruption to cash flow have been reasons given by abattoirs and wholesalers to
limit the time between slaughter and carcass boning, while retail traders have argued
that meat quality is more important than storage costs and should dictate when
carcasses and vacuum packaged cuts are on-sold (MTU 2010). The meat industry is
full of anecdotes relating to this question and there is little evidence to support many
of the claims on the relationship between length of post-slaughter hanging times of
carcasses or storage time of vacuum packaged cuts and meat quality parameters.
Post-mortem ageing is a well recognised method utilised for the improvement of
tenderness, flavour and overall acceptability of beef. Traditionally, the methods
employed were to hang the carcass, or parts thereof, in a cool room until it was
believed to be ready to be sold to consumers. Natural loss of moisture occurred in the
uncovered carcass leading to less saleable yields. This process is known as dry
Chapter Six
163
ageing (MTU 2010). With the development of vacuum packaging, it was possible to
age primal cuts in a vacuum bag under more controlled conditions, leading to
increased saleable yield and the possibility of longer storage times, due to anaerobic
conditions in the pack. This method of ageing is referred to as wet ageing (Smith et
al 2008). Dry ageing is still perceived, by the premium restaurant trade, to be the
preferred method of ageing beef, leading to enhanced tenderness and flavour, where
Angus and Wagyu beef primals are often used (MTU 2010).
Even more important for the deer industry is the question of whether commercial
practices applied to carcasses from traditional domesticated species such as sheep
and cattle are appropriate for the much leaner deer carcasses. Studies on reindeer
(Barnier et al 1999; Wiklund et al 1997a) meat quality have reported that the meat is
very tender as early as 3 days post-mortem, with no significant increase in tenderness
after 7 or 14 days. The small size of muscle fibres and low collagen content in that
species is thought to be partly responsible for the tenderness, and therefore the meat
does not require ageing (Barnier et al 1999). It has also been explained by high
activity of the calpains and cathepsins (Farouk et al 2007; Wiklund et al 1997a). A
study conducted on fallow deer by Freudenreich and Fischer (1989) reported that
sensory quality was better after wet ageing for 16 days with no significant effect after
9 days. A study on red deer stags, fallow deer bucks and elk bull venison (Drew et al
1988) found that ageing at 10 ºC for the first 24 hours post-mortem, followed by up
to 72 hours at 4 ºC, resulted in improved tenderness, particularly for loin muscles
when compared with venison held at 4 ºC for the same time period .
Most of the previous studies into the effect of aging on meat tenderness have been
done by excising muscles at 1-2 days post-mortem and ageing in vacuum bags, for
periods ranging from 2 to 35 days with the average being 14 to 21 days. Studies done
on lamb (Martinez-Cerezo et al 2002; Medel et al 2002; Thompson et al 2005b; Font
i Furnols et al 2006) and beef (Campo et al 2000; Maher et al 2004; Sanudo et al
2004; Moloney 2011, Monson et al 2005; and Revilla and Vivar-Quintana 2006)
found that as ageing time increased, so did meat tenderness in a variety of breeds and
sexes. Vieira et al (2007) found that there was no real benefit of ageing up to 7 days
for yearling Spanish oxen. Studies on other species such as water buffalo (Neath et al
2007; Irurueta et al 2008), ostrich (Botha et al 2007), goats (Kannan et al 2006),
Chapter Six
164
camel (Soltanizadeh et al 2008) and reindeer (Barnier et al 1999) have found that
optimal tenderness can be achieved in as little as 3 to 5 days with no significant
difference after this time.
While wet ageing (vacuum packaging) appears to be the most common method that
has been studied, dry ageing, where the carcass is hung whole or in parts without any
protective covering, such as in the experiment conducted as part of this work, is also
used in industry for ageing of meat. A study conducted by Laster et al (2008)
compared the two methods of wet and dry ageing, and they reported that wet aged rib
eye beef steaks had lower shear force values than dry aged rib eye. However, dry
aged sirloin had lower shear force values than wet aged sirloin in that study. In
concluding, Laster et al (2008) found that there was no real significant difference
between the two methods, however saleable yields were lower with dry ageing.
This section describes an experiment designed to test whether length of carcass
hanging time post-slaughter affects the main meat quality parameters in deer
venison. The animals tested represented commercial age and body condition scores
for fallow deer of two sexes. Only one deer species (fallow deer) was tested to
minimise costs.
6.1.2: Materials and methods
Entire (n=25) and castrated (n=ll) fallow bucks (haviers) ranging from 18-24 months
old and with body condition scores ranging between 2 and 3 (lean and prime), with
average live weight of 45 kg, were fasted for 16 h and slaughtered by captive bolt
stunning and thoracic stick exsanguination within 3 seconds of the stun. All carcasses
were hung by the Achilles tendon and measured for core body temperature and
muscle pH at 1 and 24 hours post-mortem. Body condition score was measured ante-
mortem and confirmed with carcass measurements post-mortem according to the
method of Flesch et al (2002). Carcasses were hung uncovered (dry aged) in a chiller
at ±2 ºC for 5 or 10 days. LD muscles were boned out from each carcass at 5 and
then 10 days post-slaughter and divided into 3 sections, one complying with the
specified standard for mid-loin according to AUS-MEAT (1995) guidelines, one
Chapter Six
165
from the foreloin section (cranial end) of the muscle, and a third from the hind loin
(caudal end). These selected cuts were vacuum packaged and frozen at -21 °C for no
more than 12 weeks until analysed. Samples were analysed in triplicate for pH,
intramuscular fat, colour, shear force, moisture and freeze-thaw loss and purge. All
analyses were carried out in triplicate.
6.1.3: Results
A number of meat quality attributes for bucks and haviers are shown in Tables 6.1
and 6.2. The data show that there was no statistical difference between bucks and
castrated bucks (haviers) for intramuscular fat, meat colour lightness (L*), tenderness
and moisture content (Table 6.1). The samples from haviers had lower a* (redness)
and higher b* (yellowness) values than entire bucks after 5 days of dry ageing
(p<0.05).
Table 6.1 : Meat quality attributes of M.longissimus dorsi from fallow bucks and haviers with BCS between 2 and 3.
Sex HCW
(kg)
pHµ
Raw Shear
(g)
Colour
L*
Colour
a*
Colour
b*
Moisture
(%)
IM Fat
(%)
Bucks 25.75a
(0.94)
5.45a
(0.08)
2404.2a
(217.67)
21.27a
(0.63)
12.05a
(0.40)
0.56a
(0.39)
74.99a
(0.17)
0.73a
(0.13)
Haviers 24.69a
(0.60)
5.42a
(0.06)
2073.9a
(283.0)
19.17a
(0.50)
10.60b
(0.41)
0.80b
(0.18)
75.04a
(0.16)
0.69a
(0.17)
Means and standard error of means (in parenthesis) are shown. Treatments followed by the same letter
in the columns are not significantly different (p<0.05)
There was also no difference in moisture content for samples collected between 5
days and 10 days post-mortem. Muscle tenderness was increased after 10 days
ageing (NS) (Table 6.2).
Chapter Six
166
Table 6.2 : Meat quality attributes of M.longissimus dorsi from fallow bucks and haviers with BCS between 2 and 3 measured at 5 days and 10 days post-mortem.
Parameters 5 days post-mortem 10 days post-mortem
Entire bucks Haviers Entire bucks Haviers
pH 5.45 a
(0.08)
5.42 a
(0.06)
5.63a
(0.03)
5.66a
(0.02)
IM fat (%) 0.73a
(0.13)
0.69a
(0.17)
0.75a
(0.14)
0.70a
(0.16)
Colour L* 21.27a
(0.63)
19.17a
(0.50)
not analysed not analysed
Colour a* 12.05a
(0.40
10.60b
(0.28)
not analysed not analysed
Colour b* 0.56a
(0.39)
0.80b
(0.18)
not analysed not analysed
Shear force (g)
2404.20a
(217.67)
2073.87a
(283.02)
2364.14a
(148.34)
1996a
(128.47)
Moisture (%) 74.99a
(0.17)
75.04a
(0.16)
74.77a
(0.78)
74.95a
(0.12)
Freeze-thaw
purge (%)
17.48
(1.62)
16.97
(1.50)
16.58a
(1.51)
15.37a
(2.35)
HCW (kg) 25.75a
(0.94)
24.69a
(0.60)
25.75a
(0.94)
24.69a
(0.60)
Means and standard error of means (in parenthesis) are shown. Treatments followed by the
same letter in the rows are not significantly different (p<0.05). Not analysed - samples
destroyed following bushfire and consequent power loss to freezers
There was significantly more intramuscular fat (p<0.05) and moisture (p<0.001) in
the forequarter loin when compared with mid and hind loin samples, although there
were no significant differences between mid and hind loin. Tenderness was increased
in all loin samples after 10 days (NS) (Table 6.3).
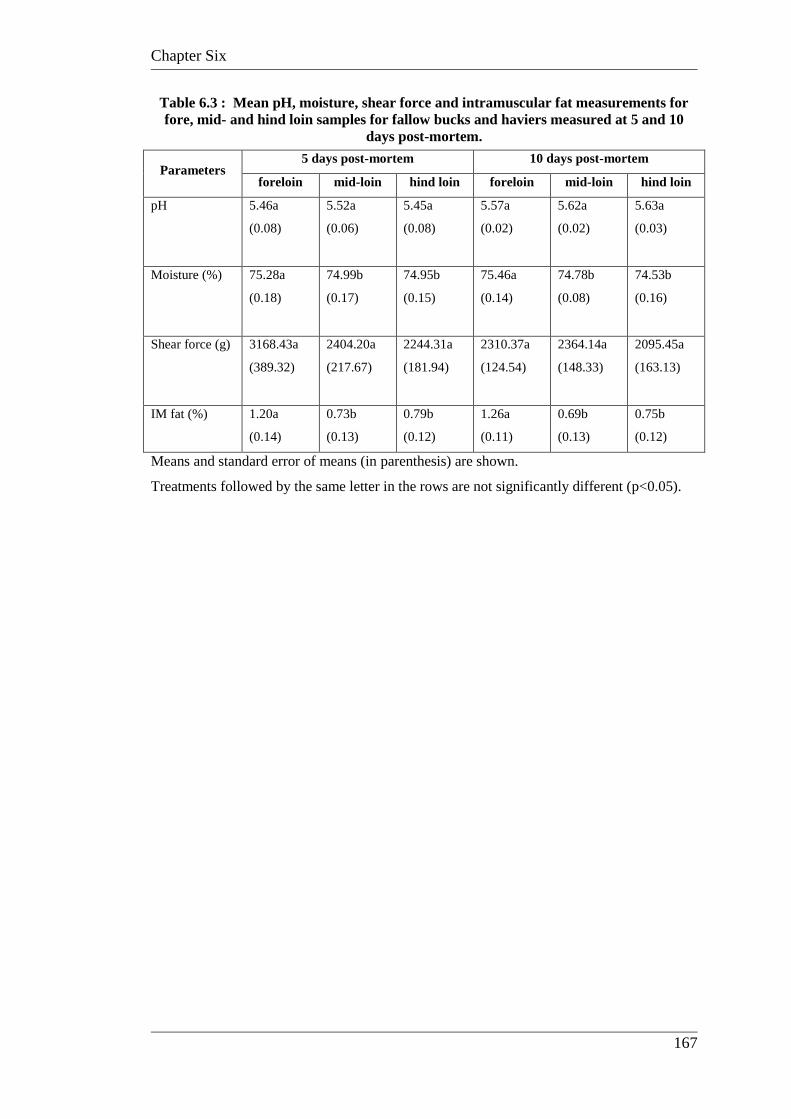
Chapter Six
167
Table 6.3 : Mean pH, moisture, shear force and intramuscular fat measurements for fore, mid- and hind loin samples for fallow bucks and haviers measured at 5 and 10
days post-mortem.
Parameters 5 days post-mortem 10 days post-mortem
foreloin mid-loin hind loin foreloin mid-loin hind loin
pH 5.46a
(0.08)
5.52a
(0.06)
5.45a
(0.08)
5.57a
(0.02)
5.62a
(0.02)
5.63a
(0.03)
Moisture (%) 75.28a
(0.18)
74.99b
(0.17)
74.95b
(0.15)
75.46a
(0.14)
74.78b
(0.08)
74.53b
(0.16)
Shear force (g) 3168.43a
(389.32)
2404.20a
(217.67)
2244.31a
(181.94)
2310.37a
(124.54)
2364.14a
(148.33)
2095.45a
(163.13)
IM fat (%) 1.20a
(0.14)
0.73b
(0.13)
0.79b
(0.12)
1.26a
(0.11)
0.69b
(0.13)
0.75b
(0.12)
Means and standard error of means (in parenthesis) are shown.
Treatments followed by the same letter in the rows are not significantly different (p<0.05).
Chapter Six
168
6.1.4: Discussion
6.1.4.1: Tenderness and meat ageing
There was no significant difference in most meat quality parameters, including
tenderness between carcasses sampled 5 days and 10 days post-slaughter, or between
entire bucks and haviers. There was a general tendency for the meat aged for 10 days
to be more tender than the 5 day aged meat, however, these differences were
statistically not significant (p>0.05). This is not consistent with findings in beef
(Destefanis et al 2003) who found no differences in meat quality attributes of steers
and bulls. Ahnstrom et al (2009) found that shear force values of yearling Charolais
heifers showed no significant differences over 7 days but were significantly more
tender after 14 days of ageing. There has long been anecdotal debate about the merits
of hanging venison carcasses longer, and the effect this has on meat tenderness, but
for animals in the current study with BCS between 2 and 3 there was no apparent
difference resulting from hanging carcasses longer. These results in fallow deer agree
with previous studies on reindeer where optimal tenderness in the meat was achieved
already after 1-3 days of ageing of the meat (Wiklund et al 1997a). A study by Shaw
(2000) also determined that venison from red deer had acceptable tenderness after
only 24 hours ageing. Studies on lamb have found that an ageing time of 20 days was
required for consumers to detect a significant difference in tenderness (Font i Furnols
et al 2006). Similarly, Freudenreich and Fischer (1989) found that wild harvested
fallow deer required at least 16 days for consumers to detect increased tenderness.
Perry et al (2001b) found that consumers ranked lamb aged for 14 days as more
tender than lamb aged for one day despite there being no significant difference in
instrumental measures of tenderness of the samples. Like fallow deer venison, water
buffalo is a low fat meat that has lower shear force values and is higher in iron and
protein than beef (Murthy and Devadason 2003). Neath et al (2007) found no
significant differences in tenderness when water buffalo meat was aged for 14 days.
However, tenderness increased in water buffalo meat after ageing over 25 days in a
study conducted by Irurueta et al (2008). Blackbuck antelope meat displayed
significant increases in pH, lower shear force values, and increased colour for all
values in meat aged for 10 days (Woodford et al 1996).
Chapter Six
169
Samples in the current study were frozen after ageing until analysed. Studies by
Drew et al (1988) found that tenderness increased 10-40% in deer venison when it
was frozen and slowly thawed. A Swedish study drew the same conclusion when
analysing shear force values of beef that had been frozen, where it was found that
frozen samples had significantly lower (p=0.005) shear force values than fresh beef
samples (MTU 2006b). This was confirmed in another study of beef where meat
aged for 2 days and then frozen had the same shear force values as chilled meat aged
for 7 days (Lagerstedt et al 2008) and similar results were reported for Korean
Hanwoo beef (Kim et al 2011). A study on lambs found that any differences
occurring as a result of freezing were small and not deemed to be significant by
consumers (Muela et al 2012). It is possible that samples were universally tender as a
result of the storage process in the current study.
Most commercial venison carcasses in Australia are broken into primal cuts between
1 and 3 days post-slaughter to avoid weight loss from dehydration in the chiller. It
would appear that commercial carcasses with BCS between 2 and 3 can be processed
at a range of times after slaughter without changing venison quality parameters, as
longer hanging times did not enhance or adversely effect parameters that are
associated with tenderness, juiciness and flavour for either of the sexes tested. This
adds considerable flexibility to commercial practice, especially given the
circumstance that deer are usually slaughtered in abattoirs primarily used for the
slaughter of other species and are operating under the commercial constraints
developed to service the wider meat industry.
6.1.4.2: Intramuscular fat
In this experiment there was no difference in intramuscular fat between entire and
castrated bucks, yet Mulley et al (1996) showed castrates to be fatter in all depots
than entires at this age, as has also been demonstrated in beef (Zhou et al 2011;
Zamiri et al 2012) from animals of the same age. Results in the current study may
just relate to animals of BCS 2 to 3, as BCS was not estimated for animals used by
Mulley et al (1996). It may also relate to poorer pasture conditions at the time of
slaughter as a result of drought. In previous studies of venison characteristics, for
most species of deer, there has been only rudimentary information given about the
Chapter Six
170
age, weight and management of the animals used to derive the data. From the data
provided by Flesch et al (2002) for fallow deer, and Audige et al (1998) for red deer
on physical and carcass differences between various BCS categories, it may be
necessary to redefine some of those meat quality measurements. In the commercial
deer industry carcass weight is a primary descriptor for payment to farmers, yet it is
possible that two animals with the same carcass weight could have very different
BCS and provide very different results for meat quality. Meat quality parameters
such as intramuscular fat, moisture, water holding capacity and possibly shear force
could change with BCS, along with changes that occur between sexes and between
seasons of the year.
The foreloin (cranial end) had significantly more fat and moisture than the mid- and
hind loin, a result consistent with the way in which fat accretion develops in other
livestock species (Butterfield 1988). These data are unlikely to be of any commercial
consequence in fallow deer given the small size of the meat cut and the way in which
this primal cut is marketed (i.e. as one whole piece, either bone-in (rack) or bone-
out).
6.1.4.3: Colour
Venison from castrated fallow deer bucks was shown to have less redness and
increased yellowness compared with entire bucks. A similar result was obtained in
fallow deer meat from castrated bucks, without ageing (Chapter 4). Similar results
were also reported for entire and castrated blackbuck antelope (Woodford et al 1996)
and goats (Kim et al 2010). Possible reasons for this may include reduced aggression
and activity in relation to adverse behavioural responses in lairage of castrated
animals. Increased muscle activity and aggression, as seen with entire male animals,
is associated with increased redness and brightness in their meat (MTU 2006a).
Given the outcomes of this study it was concluded that factors other than post-
slaughter hanging time of carcasses were more likely to effect venison quality.
However, further studies could be done utilising wet or vacuum pack ageing of cuts
over longer periods of time rather than the dry ageing methods utilised here.
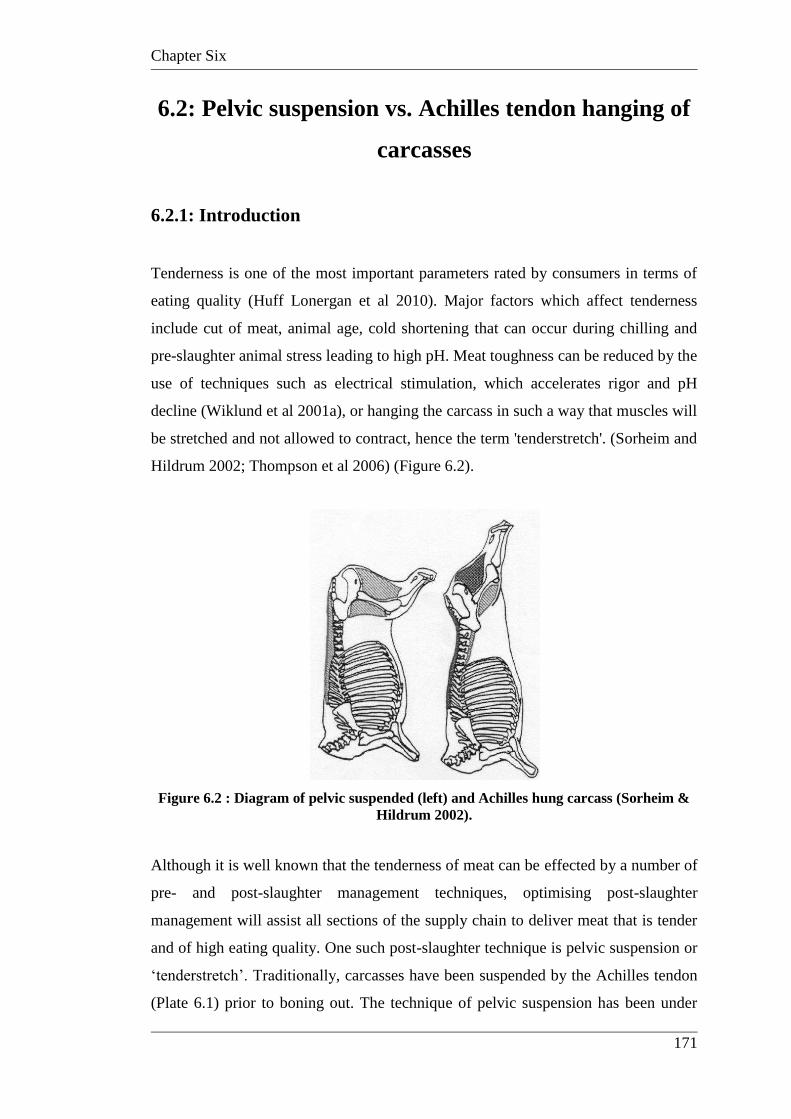
Chapter Six
171
6.2: Pelvic suspension vs. Achilles tendon hanging of
carcasses
6.2.1: Introduction
Tenderness is one of the most important parameters rated by consumers in terms of
eating quality (Huff Lonergan et al 2010). Major factors which affect tenderness
include cut of meat, animal age, cold shortening that can occur during chilling and
pre-slaughter animal stress leading to high pH. Meat toughness can be reduced by the
use of techniques such as electrical stimulation, which accelerates rigor and pH
decline (Wiklund et al 2001a), or hanging the carcass in such a way that muscles will
be stretched and not allowed to contract, hence the term 'tenderstretch'. (Sorheim and
Hildrum 2002; Thompson et al 2006) (Figure 6.2).
Figure 6.2 : Diagram of pelvic suspended (left) and Achilles hung carcass (Sorheim & Hildrum 2002).
Although it is well known that the tenderness of meat can be effected by a number of
pre- and post-slaughter management techniques, optimising post-slaughter
management will assist all sections of the supply chain to deliver meat that is tender
and of high eating quality. One such post-slaughter technique is pelvic suspension or
„tenderstretch‟. Traditionally, carcasses have been suspended by the Achilles tendon
(Plate 6.1) prior to boning out. The technique of pelvic suspension has been under
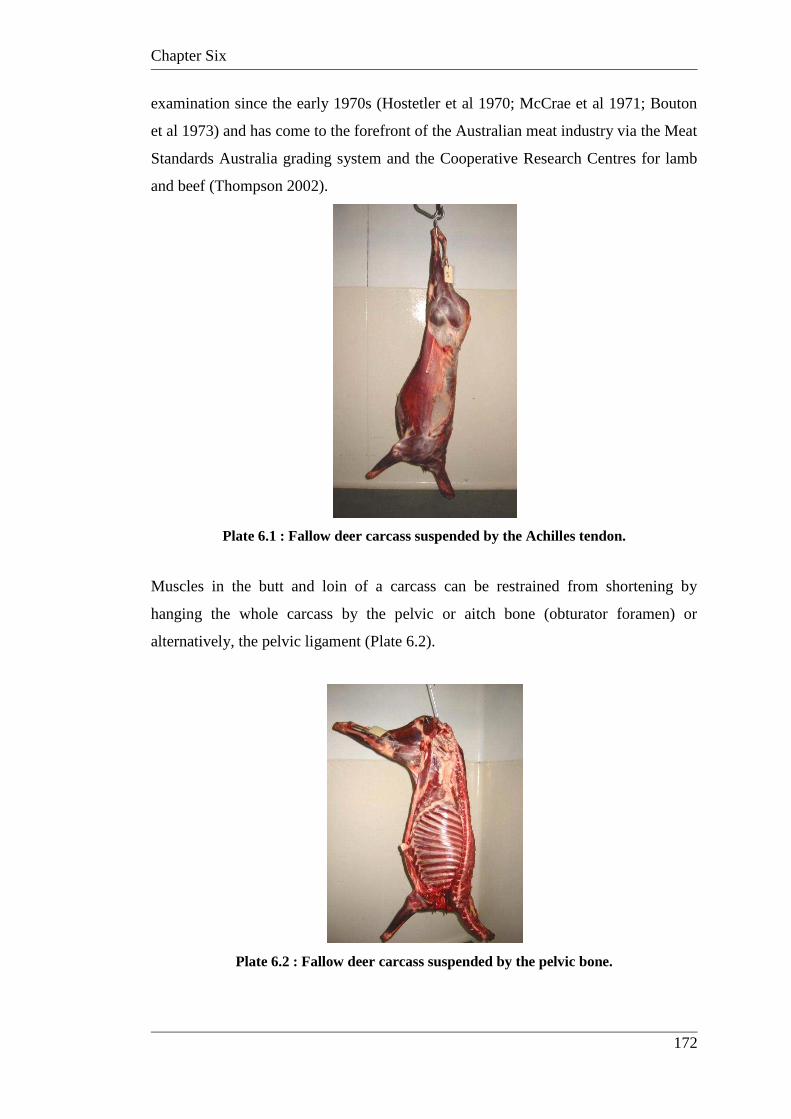
Chapter Six
172
examination since the early 1970s (Hostetler et al 1970; McCrae et al 1971; Bouton
et al 1973) and has come to the forefront of the Australian meat industry via the Meat
Standards Australia grading system and the Cooperative Research Centres for lamb
and beef (Thompson 2002).
Plate 6.1 : Fallow deer carcass suspended by the Achilles tendon.
Muscles in the butt and loin of a carcass can be restrained from shortening by
hanging the whole carcass by the pelvic or aitch bone (obturator foramen) or
alternatively, the pelvic ligament (Plate 6.2).
Plate 6.2 : Fallow deer carcass suspended by the pelvic bone.
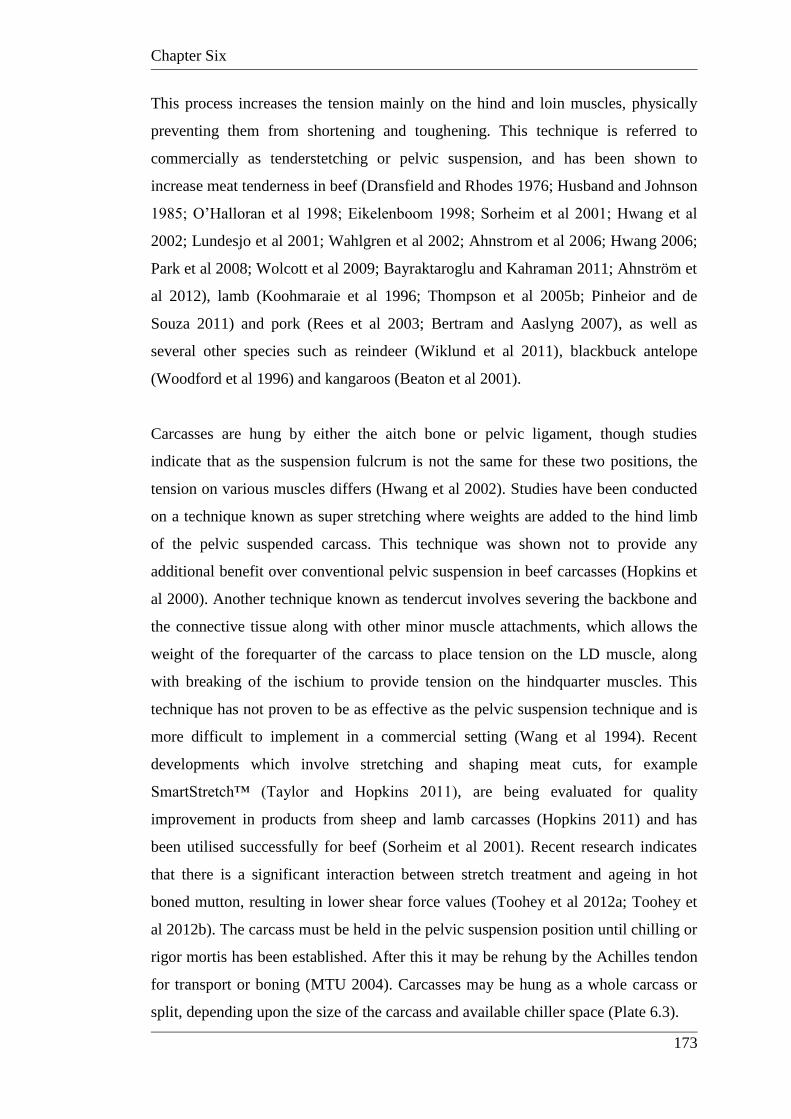
Chapter Six
173
This process increases the tension mainly on the hind and loin muscles, physically
preventing them from shortening and toughening. This technique is referred to
commercially as tenderstetching or pelvic suspension, and has been shown to
increase meat tenderness in beef (Dransfield and Rhodes 1976; Husband and Johnson
1985; O‟Halloran et al 1998; Eikelenboom 1998; Sorheim et al 2001; Hwang et al
2002; Lundesjo et al 2001; Wahlgren et al 2002; Ahnstrom et al 2006; Hwang 2006;
Park et al 2008; Wolcott et al 2009; Bayraktaroglu and Kahraman 2011; Ahnström et
al 2012), lamb (Koohmaraie et al 1996; Thompson et al 2005b; Pinheior and de
Souza 2011) and pork (Rees et al 2003; Bertram and Aaslyng 2007), as well as
several other species such as reindeer (Wiklund et al 2011), blackbuck antelope
(Woodford et al 1996) and kangaroos (Beaton et al 2001).
Carcasses are hung by either the aitch bone or pelvic ligament, though studies
indicate that as the suspension fulcrum is not the same for these two positions, the
tension on various muscles differs (Hwang et al 2002). Studies have been conducted
on a technique known as super stretching where weights are added to the hind limb
of the pelvic suspended carcass. This technique was shown not to provide any
additional benefit over conventional pelvic suspension in beef carcasses (Hopkins et
al 2000). Another technique known as tendercut involves severing the backbone and
the connective tissue along with other minor muscle attachments, which allows the
weight of the forequarter of the carcass to place tension on the LD muscle, along
with breaking of the ischium to provide tension on the hindquarter muscles. This
technique has not proven to be as effective as the pelvic suspension technique and is
more difficult to implement in a commercial setting (Wang et al 1994). Recent
developments which involve stretching and shaping meat cuts, for example
SmartStretch™ (Taylor and Hopkins 2011), are being evaluated for quality
improvement in products from sheep and lamb carcasses (Hopkins 2011) and has
been utilised successfully for beef (Sorheim et al 2001). Recent research indicates
that there is a significant interaction between stretch treatment and ageing in hot
boned mutton, resulting in lower shear force values (Toohey et al 2012a; Toohey et
al 2012b). The carcass must be held in the pelvic suspension position until chilling or
rigor mortis has been established. After this it may be rehung by the Achilles tendon
for transport or boning (MTU 2004). Carcasses may be hung as a whole carcass or
split, depending upon the size of the carcass and available chiller space (Plate 6.3).
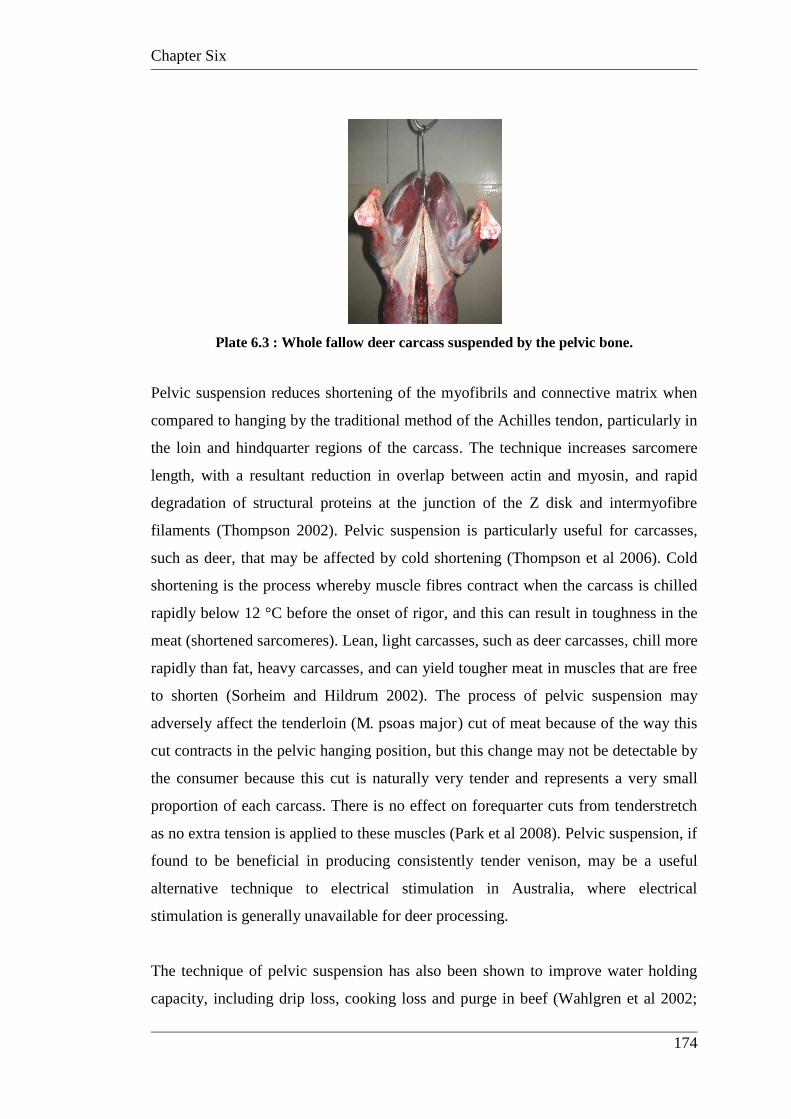
Chapter Six
174
Plate 6.3 : Whole fallow deer carcass suspended by the pelvic bone.
Pelvic suspension reduces shortening of the myofibrils and connective matrix when
compared to hanging by the traditional method of the Achilles tendon, particularly in
the loin and hindquarter regions of the carcass. The technique increases sarcomere
length, with a resultant reduction in overlap between actin and myosin, and rapid
degradation of structural proteins at the junction of the Z disk and intermyofibre
filaments (Thompson 2002). Pelvic suspension is particularly useful for carcasses,
such as deer, that may be affected by cold shortening (Thompson et al 2006). Cold
shortening is the process whereby muscle fibres contract when the carcass is chilled
rapidly below 12 °C before the onset of rigor, and this can result in toughness in the
meat (shortened sarcomeres). Lean, light carcasses, such as deer carcasses, chill more
rapidly than fat, heavy carcasses, and can yield tougher meat in muscles that are free
to shorten (Sorheim and Hildrum 2002). The process of pelvic suspension may
adversely affect the tenderloin (M. psoas major) cut of meat because of the way this
cut contracts in the pelvic hanging position, but this change may not be detectable by
the consumer because this cut is naturally very tender and represents a very small
proportion of each carcass. There is no effect on forequarter cuts from tenderstretch
as no extra tension is applied to these muscles (Park et al 2008). Pelvic suspension, if
found to be beneficial in producing consistently tender venison, may be a useful
alternative technique to electrical stimulation in Australia, where electrical
stimulation is generally unavailable for deer processing.
The technique of pelvic suspension has also been shown to improve water holding
capacity, including drip loss, cooking loss and purge in beef (Wahlgren et al 2002;
Chapter Six
175
Ahnstrom et al 2006) and lamb (Wiklund et al 2004). This results in a more tender
and juicier product. The technique also appears to be affected by temperature or
chilling rate as described by Thompson et al (2005b) and Sorheim et al (2001) with
the largest benefits seen at fast chilling rates.
Pelvic suspension has proven to be effective in a number of meat species, however
adoption by processors has been limited. Reasons for this include alteration of the
shape of primal meat cuts, particularly in the hind limbs, thereby reducing the speed
at which operators work in the boning room, and a potential for increased space for
hanging in abattoir chillers (Hopkins 2011). Alternatives to overcome these issues
include rehanging of carcasses by the Achilles tendon after a core body temperature
of less than 7 ºC is achieved, or making use of alternative technology where hot
boned cuts are stretched and ejected into packaging which maintains the cut in a
stretched form (Toohey et al 2008).
In Australia red deer now comprise half of the national herd of deer, and yield two
thirds of the venison harvested each year (Tuckwell 2003b). The deer herd in New
Zealand, one of the largest exporters of venison, is predominantly composed of red
deer (O‟Connor 2006). Studies on red deer carcasses and venison were therefore
included in the current project to complement the fallow deer work. Even though
more scientific literature on red deer venison is available compared with reports on
fallow deer venison, the pelvic suspension (tenderstretch) technique appears not to
have been previously evaluated for red deer carcasses and venison quality. Thus, this
study provides an important comparative approach to product quality and consumer
acceptance of two types of venison, and adds valuable information to the limited
overall knowledge about this product.
6.2.2 Materials and methods
6.2.2.1 Fallow Deer
Eight fallow deer bucks (18 months old, average live weight 42 kg, body condition
score (BCS) 2-3, 7 fallow deer bucks ( 36 months old, average live weight 57 kg,
Chapter Six
176
BCS 2-3) and 10 fallow deer does (≥24 months old, average live weight 38 kg, BCS
2-4), raised at the University of Western Sydney, were included in the study. The
animals were fasted for 16 h prior to slaughter, stunned with a captive bolt and bled
using thoracic stick exsanguination within 3 s of the stun. At slaughter the hot
carcass weight was recorded, as was pH in M.longissimus dorsi (LD, strip loin) and
core body temperature. Kidneys were excised for later KFI calculations. While hot,
carcasses were split along the mid ventral axis (spine) by bandsaw and one half
randomly assigned to Achilles tendon suspension whilst the other side was hung by
pelvic suspension through the aitch bone.
At 24 hours post-mortem carcasses were weighed to determine standard carcass
weight. Ultimate pH and final core body temperature was recorded. Fat depth
measurements were taken as described by Flesch (2001) to confirm BCS post-
mortem. KFI was also calculated to confirm live animal and carcass BCS
assessments.
Nine selected muscles were collected from each carcass-half (Mm.
semimembranosus, adductor femoris, biceps femoris, semitendinosus, vastus
lateralis, rectus femoris, psoas major, longissimus dorsi, and supra spinatus). The
meat samples were vacuum packaged, and then frozen and stored at -21 oC for no
more than 12 weeks, until analysis.
Samples of LD muscles were analysed in triplicate for intramuscular fat, colour,
shear force, moisture and freeze-thaw loss and purge. The data were analysed
statistically by residual maximum likelihood (Patterson & Thompson, 1971), with
the random effects given by reading within muscle within animal, and the fixed
effects by hanging treatment, muscle and their interaction, using the statistical
package GenStat (2002).
6.2.2.2 Red Deer
Fourteen rising 2 year old red deer stags averaging BCS 2 were sourced from
properties at Blayney and Young, NSW. Body condition score was estimated on the
live animal using palpation techniques as described by Flesch et al (2002). All
Chapter Six
177
animals were slaughtered as described for fallow deer in 6.2.2.1. Skinning and
evisceration were performed with carcasses hanging from a meat rail by the Achilles
tendon. At slaughter the hot carcass weight was recorded, as was pH in
M.longissimus dorsi (LD, strip loin) and core body temperature. Kidneys were
excised for later KFI calculations. While hot, carcasses were split along the spine by
bandsaw and one half randomly assigned to Achilles tendon suspension whilst the
other side was hung by pelvic suspension through the aitch bone.
At 24 hours post-mortem carcasses were weighed to determine standard carcass
weight. Ultimate pH and final core body temperature was recorded. Fat depth
measurements were taken at the GR site with a Hennessy probe to confirm BCS
post-mortem. KFI was also calculated to confirm live animal and carcass BCS
assessments. The LD muscle from each of the carcasses was removed along with the
GM muscle, for use in sensory trials (Chapter 7). Samples removed from the
carcasses for analysis were placed on marked trays and vacuum packaged, and then
frozen at -21 C for no more than 12 weeks, until used for analysis.
Samples were analysed in triplicate for intramuscular fat, colour, shear force
moisture and freeze-thaw loss and purge. The data were analysed statistically by
residual maximum likelihood (Patterson & Thompson, 1971), with the random
effects given by reading within muscle within animal, and the fixed effects by
hanging treatment, muscle and their interaction, using the statistical package GenStat
(2002).
6.2.3 Results
6.2.3.1 Fallow Deer Venison
The results suggest that pelvic suspension of the carcasses had the greatest impact on
meat tenderness in venison from the younger male fallow deer (Figure 6.3), some
impact on tenderness in venison from the older male deer (Figure 6.4) and significant
impact only on the tenderness of the LD muscle in venison from the female deer
(Figure 6.5).
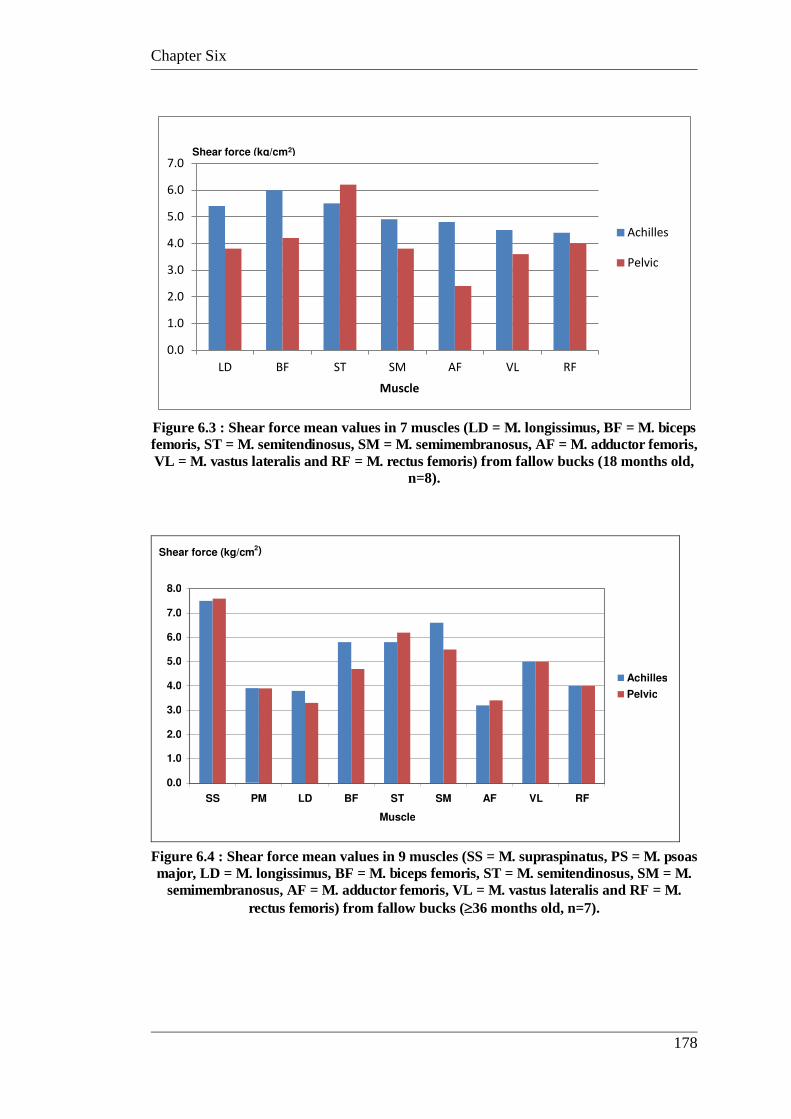
Chapter Six
178
Figure 6.3 : Shear force mean values in 7 muscles (LD = M. longissimus, BF = M. biceps femoris, ST = M. semitendinosus, SM = M. semimembranosus, AF = M. adductor femoris, VL = M. vastus lateralis and RF = M. rectus femoris) from fallow bucks (18 months old,
n=8).
Figure 6.4 : Shear force mean values in 9 muscles (SS = M. supraspinatus, PS = M. psoas major, LD = M. longissimus, BF = M. biceps femoris, ST = M. semitendinosus, SM = M.
semimembranosus, AF = M. adductor femoris, VL = M. vastus lateralis and RF = M. rectus femoris) from fallow bucks (36 months old, n=7).
0.0
1.0
2.0
3.0
4.0
5.0
6.0
7.0
LD BF ST SM AF VL RF
Muscle
Achilles
Pelvic
Shear force (kg/cm2)
0.0
1.0
2.0
3.0
4.0
5.0
6.0
7.0
8.0
SS PM LD BF ST SM AF VL RF Muscle
Achilles Pelvic
Shear force (kg/cm 2 )
Chapter Six
179
Figure 6.5 : Shear force mean values in 9 muscles (SS = M. supraspinatus, PM = M. psoas
major, LD = M. longissimus, BF = M. biceps femoris, ST = M. semitendinosus, SM = M. semimembranosus, AF = M. adductor femoris, VL = M. vastus lateralis and RF = M. rectus
femoris) from fallow does (≥24 months old, n=10).
For fallow deer bucks, there was no interaction between body condition score and
method of hanging the carcass for all parameters measured. There were no statistical
differences between carcasses hung post-mortem by the Achilles tendon or by pelvic
suspension for the M. longissimus dorsi quality parameters of pH, colour, moisture or
fat. While there was no detectable difference of hanging method on raw muscle shear
force values (p>0.05), pelvic suspended carcasses had significantly lower cooked
shear force values than Achilles hung carcasses (p<0.001). In this experiment, no
significant differences were detected between animals of BCS 2 and BCS 3 in any of
the other parameters of meat quality, therefore data were combined for BCS 2 and
BCS 3 carcasses (Table 6.4).
Table 6.4 : Meat quality attributes of M.longissimus dorsi from fallow bucks hung by the Achilles tendon and pelvic suspension methods (n=15).
Hanging pH Cooked
Shear
(g)
Raw
Shear
(g)
Colour
L*
Colour
a*
Colour
b*
Moist
(%)
IM
Fat
(%)
Freeze
thaw
loss
(%)
Achilles
Hung
5.80a
(0.04)
5889.5a
(341.7)
2177.4a
(115.2)
20.46a
(0.39)
12.29a
(0.52)
0.088a
(0.20)
75.70a
(0.17)
2.74a
(0.16)
13.56a
(0.98)
Pelvic
suspension
5.80a
(0.03)
4402.2b
(157.8)
2598.4a
(165.6)
21.21a
(0.55)
11.56a
(0.36)
0.117a
(0.11)
76.02a
(0.15)
3.06a
(0.24)
13.69a
(0.76)
Means and standard error of means (in parenthesis) are shown
Treatments followed by the same letter in the columns are not significantly different
(p<0.05).
0
1
2
3
4
5
6
7
SS PM LD BF ST SM AF VL RF
k
g
/
c
m
2
Muscle
Achilles
Pelvic
Chapter Six
180
For fallow deer does, there was no interaction between body condition score and
method of hanging the carcass for all parameters measured. Data for BCS were
analysed for differences between carcasses hung by the Achilles tendon and
carcasses hung by pelvic suspension. There was a significant difference between
methods of suspension for cooked shear (F1,16 = 7.427, p<0.01) but not for other
parameters tested (Table 6.5), with meat from pelvic suspension carcasses being
more tender.
Table 6.5 : Meat quality attributes of M longissimus dorsi from fallow doe carcasses hung by either the Achilles tendon or by pelvic suspension (n=10).
Method
suspension
pH Cooked
Shear
(g)
Raw
Shear
(g)
Colour
L*
Colour
a*
Colour
b*
Moist
(%)
IM Fat
(%)
Freeze
Thaw
loss
(%)
Achilles
Tendon
5.73a
(0.03)
4558.6a
(217.2)
2545.9a
(277.3)
22.13a
(0.45)
13.56a
(0.39)
1.68a
(0.28)
75.49a
(0.47)
1.78a
(0.18)
16.67a
(1.04)
Pelvic
Suspension
5.69a
(0.02)
3778.6b
(155.9)
2721.6a
(271.5)
22.24a
(0.43)
13.56a
(0.37)
1.68a
(0.35)
74.35a
(0.28)
1.89a
(0.17)
13.76a
(1.08)
Means and standard error of means (in parenthesis) are shown
Treatments followed by the same letter in the columns are not significantly different
(p<0.05).
6.2.3.2 Red Deer Venison
There was a significant difference between carcasses hung by the Achilles tendon
compared with pelvic suspension for cooked shear (F1,26 =16.204, p<0.001) but not
for other parameters tested (Table 6.6), with meat from pelvic suspended carcasses
being more tender.
Chapter Six
181
Table 6.6 : Meat quality attributes of M. longissimus dorsi from red stags hung by the Achilles tendon or pelvic suspension after slaughter (n=14).
Method of
Hanging
pH Cooked
Shear
(g)
Raw
Shear
(g)
Colour
L*
Colour
a*
Colour
b*
Moist
(%)
IM
Fat
(%)
Freeze
Thaw
loss
(%)
HCW
(kg)
Achilles
tendon
5.63
(2.67)
5475.78 a
(298.13)
3535.01 a
(184.00)
23.01 a
(0.39)
11.44 a
(0.35)
2.96 a
(0.22)
75.95 a
(0.14)
1.72 a
(0.28)
12.06 a
(0.67)
51.56
(2.67)
Pelvic
Suspension
5.63
(2.67)
4124.12 b
(154.49)
3761.80 a
(167.87)
23.19 a
(0.28)
11.80 a
(0.21)
3.05 a
(0.15)
75.96 a
(0.20)
1.47 a
(0.22)
10.39 a
(0.57)
As
above
Means and standard error of means (in parenthesis) are shown.
Treatments followed by the same letter in the columns are not significantly different
(p<0.05).
6.2.4: Discussion
6.2.4.1: Shear force
The technique of hanging carcasses by the pelvic or aitch bone („tenderstretch‟)
instead of in the usual position by the Achilles tendon resulted in more tender meat in
the M. longissimus dorsi (strip loin) for fallow deer bucks, fallow deer does and red
deer stags. In the Australian beef grading system Meat Standards Australia (MSA),
consumer important sensory quality attributes have been weighted in an overall score
where tenderness represents 40%, flavour 20%, juiciness 10% and overall liking 30%
(MSA 2001). It is well known that the conditions during rigor development (e.g.
muscle pH decline, temperature/pH relationship and carcass treatment) are very
important in controlling meat tenderisation (Dransfield 1994). Therefore, carcass
suspension techniques have been studied for beef (Hostetler et al 1970; Lundesjö
Ahnström et al 2003; Ahnström et al 2012) where the variation in tenderness is
considered to be the main reason for consumer dissatisfaction (Koohmaraie 1996).
Results similar to the current study were shown in beef, where the pelvic suspension
technique generally improved tenderness in most of the studied muscles, but
responses to suspension method were inconsistent and differed by muscles and
genders (bulls, heifers and cows) (Lundesjö et al 2005; Ahnström et al 2012). The
tenderness in meat from bulls was increased as an effect of pelvic suspension
Chapter Six
182
compared with meat from the heifers (Fisher et al 1994; Lundesjö Ahnström et al
2003). Pelvic suspension was also found to increase tenderness of meat from Bos
indicus cattle (Wolcott et al 2009), hybrid Charolais heifers (Ahnström et al 2009),
non-electrically stimulated bulls (Sorheim et al 2001) and cull ewes (Pinheiro and de
Souza 2011).
In the carcasses from the young fallow deer bucks, the tenderness of the following
muscles was significantly improved (p0.05) as a result of pelvic suspension; Mm.
longissimus, biceps femoris, semimembranosus, adductor femoris and vastus
lateralis. These results are in good agreement with earlier studies on beef, where the
tenderness of Mm. longissimus, semimembranosus and adductor femoris was
increased by pelvic suspension (Hostetler et al 1970; Bouton et al 1973). For the
older fallow deer bucks, significant effects of pelvic suspension on meat tenderness
were found in Mm. biceps femoris and semimembranosus. The muscles that
increased in tenderness as a result of pelvic suspension in the present study are
considered the most valuable cuts in a deer carcass, i.e. M. longissimus (strip loin),
Mm. semimembranosus and adductor femoris (topside), M. biceps femoris
(silverside) and M. vastus lateralis (knuckle). The fallow deer does only showed
improvement in tenderness for Mm. Longissimus. There was no significant effect on
forequarter muscles, as is the case for beef (Park et al 2008). It was noted by
Thompson (2002) that poorer eating quality beef carcasses showed the greatest
response to pelvic suspension, as did Sorheim et al (2001), so it is not surprising that
already tender and high eating quality meat from fallow deer does was not as
significantly affected as that from fallow deer bucks and red stags.
Studies in beef (Hwang et al 2002) also found that pelvic suspension resulted in
longer sarcomeres and more tender meat for most hindquarter muscles when
compared to Achilles hanging. The effect was most significant in the Mm.
semimembranosus, longissimus dorsi, gluteus medius, biceps femoris and the vastus
group. As was the case in the current study, the tenderloin or Mm, psoas major was
allowed to shorten as a result of pelvic suspension, however, the decrease in
sarcomere length was small and did not significantly affect tenderness of this already
tender muscle.
Chapter Six
183
6.2.4.2: Freeze-thaw purge
There was no significant difference in the freeze-thaw purge losses in pelvic
suspended carcasses versus Achilles hung carcasses. It has been documented,
however, that water holding capacity in fresh, chilled beef is improved by pelvic
suspension of the carcass (Eikelenboom et al 1998; Ahnström et al 2006), while
other studies have found no significant effect (Bayraktaroglu and Kahraman 2011).
Wiklund et al (2004) reported that drip loss was significantly lower in fallow deer
venison that had been suspended by the Achilles tendon, however, vacuum package
purge was lower in pelvic suspended samples stored for 3 weeks.
The positive effect of pelvic suspension on tenderness in venison from young male
fallow deer and young red deer stags is important information to consider for the
Australian and New Zealand deer industries. This type of animal represents the deer
most likely to be supplied for commercial slaughter in Australia and New Zealand. In
addition, the important commercial cuts from female deer were generally more
tender than the same cuts from males. The slaughter of female deer therefore
provides a good option for farmers wishing to supply chilled venison year-round,
especially at times of the year when the quality of venison from male deer is
negatively affected by the breeding season.
Chapter Six
184
6.3: Differences between slaughter premises for
muscle pH
6.3.1: Introduction
Animals store glycogen in the muscle for energy that is used to support general body
function (Thompson 2001). Prior to slaughter animals may metabolize these energy
stores when dealing with stressors that occur with handling, transportation and
lairage. If an animal is severely stressed it may deplete the energy stores in the
muscles. Ferguson et al (2001) state that in relation to optimal meat quality, pre-
slaughter depletion of glycogen stores is unequivocally the most critical parameter.
Utilisation of glycogen stores (glycogenolysis) is believed to occur as a result of an
increase in activity and adrenal activation.
It is well known that muscle energy (glycogen) is required during the conversion of
muscle to meat, post-slaughter. When an animal is slaughtered the muscle continues
to metabolise glycogen stored in the muscle in a process known as glycolysis.
Glycolysis results in the production of lactic acid, thereby reducing muscle pH. The
rate at which glycolysis occurs is temperature dependent. The process of glycolysis
causes the muscle pH to decrease. In a live animal muscle pH is fairly neutral (7.1)
and optimal pH of meat is within the range of 5.3 to 5.6. This ultimate pH is
achieved when the carcass temperature falls below 7 ºC or at around 20 hours post-
slaughter and energy stores have been exhausted. If energy stores are insufficient at
slaughter, then insufficient lactic acid is produced during glycolysis and pH will be
high (Aberle et al 2001).
The negative impact and incidence of high muscle pHu on meat quality is well
documented in the major meat species, beef (Hood and Tarrant 1981; Thompson
2002) and lamb (Koohmaraie 1996, Thompson et al 2005b; Young et al 2005). It has
also been tested in buffalo (Neath et al 2007); gemsbok (Hoffman and Laubscher
Chapter Six
185
2010); fallow deer (Falepau 1999; Diverio et al 1998); red deer (Pollard et al 1999,
Stevenson-Barry et al 1999); and reindeer (Rehbinder, 1990; Wiklund 1996b;
Wiklund et al 1997b; 2003a).
Venison with high pH has undesirable characteristics, as is the case with other meats,
with a decreased shelf life as one of the major problems. The high pH will promote
microbial spoilage, an effect which is especially critical for vacuum packaged meat.
Meat with high pH is generally referred to as DFD (dry, firm and dark). The
frequency of occurrence of DFD (meat pH above 6.2 in M. longissimus dorsi) in
venison has been reported in Sweden (reindeer, n=3,500, Wiklund et al 1995) and
New Zealand (red and fallow deer, n=3,600, Pollard et al 1999) as 6% in reindeer,
1.5% in red deer and 1% in fallow deer venison. Higher pH values also often result
in less tender meat in beef (Purchas et al 1999), lamb (Watanabe et al 1996) and red
deer venison (Stevenson-Barry et al 1999; Wiklund et al 2010).
Stress is an unavoidable consequence of the process of transferring animals from the
farm to slaughter (Ferguson and Warner 2008). Meat Standards Australia (MSA)
have set criteria for supplying cattle to minimise pre-slaughter stressors and
subsequent depletion of muscle glycogen reserves. These criteria include adequate
feeding of cattle up until dispatch to ensure muscle glycogen levels are between 60
and 120 µmol/g. This ensures levels of muscle glycogen at the time of slaughter are
at least 57 µmol/g so that sufficient lactic acid may be formed to lower muscle pH
from around 7.1 in the live animal to 5.5 post-mortem. Short term stress can increase
the capacity of the muscle to decline in pH while long term stress can reduce it.
Muscle glycogen is depleted by stress through the action of adrenaline and
β2=adrenoreceptor densities (Oddy et al 2011). Stressors that need to be controlled to
minimise fluctuations in the emotional state of the animal are transport distances and
lairage conditions involving handling and human contact, unfamiliar environments,
fasting, changes in social structure as a result of mixing and/or separation of animals
and changes in climate (Thompson 2002; Ferguson and Warner 2008).
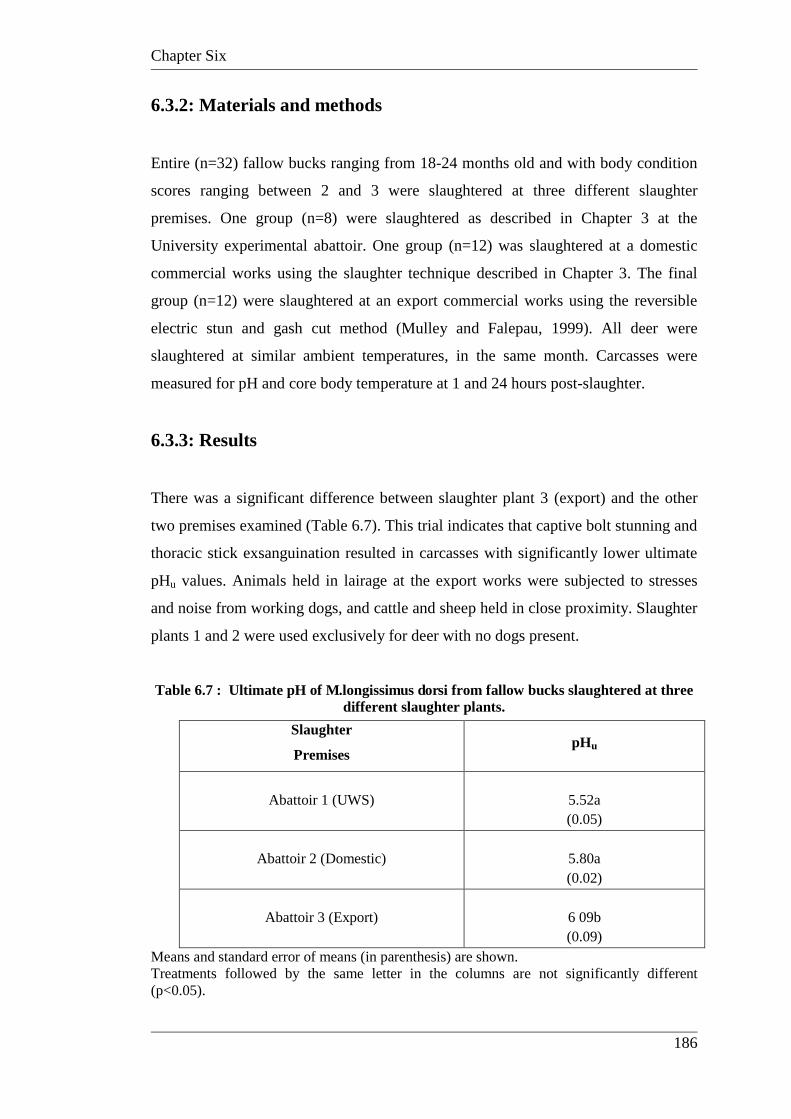
Chapter Six
186
6.3.2: Materials and methods
Entire (n=32) fallow bucks ranging from 18-24 months old and with body condition
scores ranging between 2 and 3 were slaughtered at three different slaughter
premises. One group (n=8) were slaughtered as described in Chapter 3 at the
University experimental abattoir. One group (n=12) was slaughtered at a domestic
commercial works using the slaughter technique described in Chapter 3. The final
group (n=12) were slaughtered at an export commercial works using the reversible
electric stun and gash cut method (Mulley and Falepau, 1999). All deer were
slaughtered at similar ambient temperatures, in the same month. Carcasses were
measured for pH and core body temperature at 1 and 24 hours post-slaughter.
6.3.3: Results
There was a significant difference between slaughter plant 3 (export) and the other
two premises examined (Table 6.7). This trial indicates that captive bolt stunning and
thoracic stick exsanguination resulted in carcasses with significantly lower ultimate
pHu values. Animals held in lairage at the export works were subjected to stresses
and noise from working dogs, and cattle and sheep held in close proximity. Slaughter
plants 1 and 2 were used exclusively for deer with no dogs present.
Table 6.7 : Ultimate pH of M.longissimus dorsi from fallow bucks slaughtered at three different slaughter plants.
Slaughter
Premises pHu
Abattoir 1 (UWS)
5.52a (0.05)
Abattoir 2 (Domestic)
5.80a (0.02)
Abattoir 3 (Export)
6 09b (0.09)
Means and standard error of means (in parenthesis) are shown. Treatments followed by the same letter in the columns are not significantly different (p<0.05).
Chapter Six
187
6.3.4: Discussion
In this experiment it was demonstrated that the prolonged pre-slaughter handling in
connection with slaughter at an export abattoir resulted in higher venison pH values.
Stress before slaughter can induce muscle glycogen depletion so meat pH stays
above 6.2 and DFD meat occurs. In a similar study, muscle glycogen was found to be
the highest and optimal pHu was achieved in fallow deer where animals were shot in
the paddock, thereby avoiding any handling prior to slaughter (Mojito et al 2007).
The next best result was obtained in animals that were moved into lairage and
processed without delay. The groups which resulted in the highest incidence of high
meat pH and DFD meat and lowest muscle glycogen levels was in the group where
animals were held in lairage overnight prior to slaughter as is the normal practice
with venison processing in Australia (Mojito et al 2007).
There are numerous studies in beef (Purchas and Aungsupakorn 1993), lamb (Bouton
et al 1971) and pork (Dransfield et al 1995) that have linked variation in ultimate
muscle pH and its relationship to meat tenderness. These studies concur that as pH
increases from 5.5 to 6.0, instrumental tenderness decreases. A study by Yu and Lee
(1986) suggests that proteolysis is reduced at higher pH levels, thereby reducing
tenderness. In red deer, a study by Stevenson-Barry et al (1999) reported that optimal
tenderness was achieved at a pH value of 5.5 with greater variability in tenderness in
the pH range of 5.8 to 6.0. This was confirmed by Hoffman et al (2007) in a study on
springbok, where an increase of ultimate pH from 5.5 to 5.9 resulted in increased
shear force values.
As the New Zealand red deer industry was being established, the use of a mobile
slaughter plant was trialled in order to reduce pre-slaughter handling and thereby
minimise the incidence of high pH in venison (Yerex 1979). However, its use was
soon dismissed as an option because it proved to be economically impractical
(Seamer 1986). More recently, mobile plants for deer have operated in Canada
(Diversified Animal Management, 1997), the UK (Anon 1993; Pollard et al 2002)
and Australia (Mulley 2011). Mobile slaughter facilities have been used for reindeer
in Sweden since 1993. When new directives regarding meat inspection at reindeer
Chapter Six
188
slaughter were instituted (National Food Administration 1998), many of the former
outdoor slaughter sites were closed and the numbers of reindeer transported to
slaughter increased (Wiklund 1996b). Slaughter age reindeer bulls exhibited lower
pHu values when handled carefully and transported for less than 5 hours compared to
bulls manually handled and transported over larger distances (Wiklund et al 2001a).
According to Wilson (1999), regular handling of deer can reduce the occurrence of
pre-slaughter stress since it improves the animals‟ ability to cope with management
practices. Selection of tamer and calmer breeding animals is also an important
measure to reduce stress (Wilson 1999). These practices should be implemented in
particular for fallow deer, since it has been demonstrated that they require very
careful, slow handling and are prone to panic (Diverio et al 1998; Pollard et al 2002).
6.4: Conclusions
Pelvic suspension of carcasses has been demonstrated to improve tenderness in meat
from young fallow deer bucks, older fallow deer bucks and does as well as young red
stags, the type of animals most likely to be supplied by deer farmers for commercial
slaughter in Australia. Results for fallow deer of different BCS, age and sex, and for
red deer, also indicate that pelvic suspension increases the tenderness of venison, the
quality attribute determined by consumers as being of most importance. Given the
consistency of this result and the importance of meat tenderness in the meat retail
sector, this technique should be adopted by the Australian deer industry, especially
given the low availability of other techniques associated with increasing meat
tenderness such as electrical stimulation. If electrical stimulation of carcasses were
to become more widely available in slaughter premises in Australia, it would also be
interesting to trial the techniques of pelvic suspension and electrical stimulation of
carcasses in combination to evaluate possible cumulative effects. Studies in lamb and
mutton by Young et al (2005) determined that electrical stimulation was not required
when pelvic suspension techniques were utilised, however, Thompson et al (2006)
found a cumulative effect when pelvic suspension was combined with other post-
slaughter management techniques for optimising tenderness.
Chapter Six
189
The present results also indicate that pelvic suspension has a positive effect on
water-holding properties by reducing moisture loss of fresh chill-stored fallow deer
venison, an important consideration given that juiciness is the second most important
characteristic of meat according to consumer surveys. Most venison produced is sold
frozen (Wiklund et al 2004), and in this study freeze-thaw losses were unaffected by
suspension method.
In both fallow deer and red deer venison pelvic suspension is an inexpensive and
reliable way to improve venison tenderness and palatability. The perceived
disadvantages in terms of labour and chiller capacity in a commercial setting are not
significant in terms of the potential for improved eating quality of venison from red
and fallow deer. It is possible to achieve similar levels of tenderness in fallow deer
bucks as fallow deer does by employing pelvic suspension techniques.
In these experiments it was also demonstrated that there is no commercial advantage
in hanging fallow deer carcasses for extended periods of time after slaughter to
increase tenderness, a technique that has been applied to carcasses from older
animals harvested from the wild in other parts of the world. Analysis of data from
this study indicated that carcasses from deer farmed commercially and slaughtered
for meat can be broken into primal cuts using the same time periods used on
carcasses from sheep and cattle with no loss of eating quality. This is an advantage
to the deer industry because no special longer-term storage requirements are
therefore necessary.
Minimising pre-slaughter stressors is also vital to ensure venison of ideal ultimate pH
and therefore, optimise meat quality.
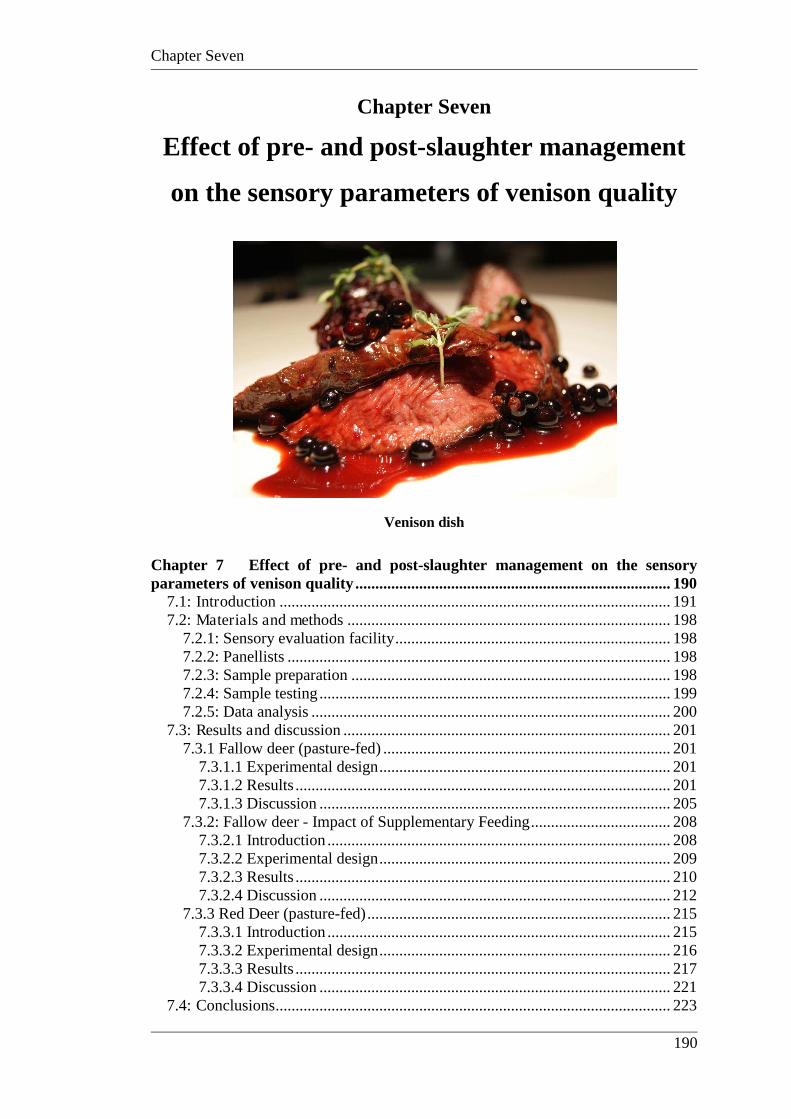
Chapter Seven
190
Chapter Seven
Effect of pre- and post-slaughter management
on the sensory parameters of venison quality
Venison dish
Chapter 7 Effect of pre- and post-slaughter management on the sensory parameters of venison quality ............................................................................... 190
7.1: Introduction .................................................................................................. 191 7.2: Materials and methods ................................................................................. 198
7.2.1: Sensory evaluation facility ..................................................................... 198 7.2.2: Panellists ................................................................................................ 198 7.2.3: Sample preparation ................................................................................ 198 7.2.4: Sample testing ........................................................................................ 199 7.2.5: Data analysis .......................................................................................... 200
7.3: Results and discussion .................................................................................. 201 7.3.1 Fallow deer (pasture-fed) ........................................................................ 201
7.3.1.1 Experimental design ......................................................................... 201 7.3.1.2 Results .............................................................................................. 201 7.3.1.3 Discussion ........................................................................................ 205
7.3.2: Fallow deer - Impact of Supplementary Feeding ................................... 208 7.3.2.1 Introduction ...................................................................................... 208 7.3.2.2 Experimental design ......................................................................... 209 7.3.2.3 Results .............................................................................................. 210 7.3.2.4 Discussion ........................................................................................ 212
7.3.3 Red Deer (pasture-fed) ............................................................................ 215 7.3.3.1 Introduction ...................................................................................... 215 7.3.3.2 Experimental design ......................................................................... 216 7.3.3.3 Results .............................................................................................. 217 7.3.3.4 Discussion ........................................................................................ 221
7.4: Conclusions ................................................................................................... 223
Chapter Seven
191
7.1: Introduction
One of the primary objectives of the red meat industry has been an attempt to deliver
consistently high quality meat to consumers (Grunert et al 2004). Eating quality has
long been recognised as a determinant for repeat purchasing by consumers (Watson
et al 2008) and many forms of assessment are utilised to gauge a good eating
experience by the consumer. These include measurement of pre- and post-slaughter
parameters and physical measures of the meat such as shear force, water holding
capacity and colour values. Though one dimensional, these measures attempt to
predict various aspects of the eating experience of consumers, however, the ultimate
way of testing the product is to place it with a consumer panel (Russell et al 2005,
Watson et al 2008). Sensory evaluation is the science of judging and evaluating the
quality of food by using some or all of the senses, for example, taste, smell, sight,
touch and hearing. Human beings have always used their senses for guiding their
choice of food (Meilgaard et al 2007). Our senses are used to evaluate the quality of
food, and although science has developed objective measures to assess food quality,
they cannot replace the use and sensitivity of the human senses (Poste et al 1991).
A sensory evaluation is generally based on the qualities of the food characteristics,
both acceptable and unacceptable, which are sensed by the consumer or taste
panellist. These general characteristics are normally appearance, flavour and texture
but can be divided further into colour, aroma, taste, tenderness, juiciness and mouth
feel. For red meats, consumers generally rank these attributes, with tenderness being
the most important, followed by juiciness (Issanchou 1996).
A number of studies have been done to link physical and biochemical measures of
meat from domesticated livestock to consumer preference. A range of objective meat
quality measurements, including water-holding capacity and colour as well as
chemical and nutritional composition of meat, have been related to sensory attributes
of a range of domesticated species including beef (Egan et al 2001; Perry et al 2001b;
Thompson 2002; Lagerstedt et al 2008; Yadata et al 2009), lamb (Sanudo et al 1998;
Martinez-Cerezo et al 2002; Hoffman et al 2003; Hopkins et al 2005; Pethick et al
2005a; Pleasants et al 2005; Thompson et al 2005b; Mushi et al 2008), goat meat
Chapter Seven
192
(Carlucci et al 1998, Mushi et al 2008) and pork (Aaslyng et al 2007; Bertram &
Aaslyng 2007; Lloveras et al 2008). Tenderness of beef has been tested for consumer
preference in a number of studies. (Rosenvold et al 2002; Voges et al 2007; Sawyer
et al 2007; Destefanis et al 2008; Hildrum et al 2009; Rodas-Gonzalez et al 2009)
and Thompson (2002) found a high correlation between tenderness and overall liking
in beef samples, but it appears similar studies have not been done with fallow deer
venison.
The sensory quality of venison has not been studied extensively but some research
has reported various meat quality and sensory attributes of red deer (Wiklund et al
2003b) and reindeer (Wiklund et al 2003a). Sensory evaluation studies have been
conducted on some other game species including kangaroo (Wynn et al 2004),
buffalo (Vasanthi et al 2007), springbok (Hoffman et al 2007), camel (Dawood
1995), ostrich (Hoffman et al 2008a), horse (Sarries & Berlain 2005), rabbit (Combes
et al 2008) and feral goats (Swan et al 1998), while Rodbotten et al (2004) developed
a sensory map of 15 species, both domesticated and non-domesticated. The deer
venison included in that study was from wild reindeer, moose and roe deer. They
noted that these species along with beaver, farmed goat and hare were identified as
having the most intense gamey flavour, whilst chicken, turkey, pork and veal had
little perceived flavour. Lamb, roe deer, moose and hare were identified as being the
most tender. A number of sensory studies on meat have been undertaken but none
with a particular focus on venison in relation to pre- and post-slaughter handling and
body condition.
Consumer panellists may be either trained or untrained. A trained panel will be
comprised of fewer panellists compared with untrained panels, and all members of a
trained panel will have attended a number of familiarisation sessions enabling them
to detect specific quality aspects of the meat to be tested (Perry et al 2001a; Hansen
et al 2006; Combes et al 2008; Hoffman et al 2008; Watson et al 2008). Due to the
small number of panellists in trained panels, bias may be introduced as a result of the
training process as well as demographic variations of panel members who may not
represent the wider population (Hwang et al 2008). However, trained panellists are
generally adept at scoring very specific attributes (Thompson 2002). Untrained
consumer panels are comprised of a larger number of panellists and are generally
Chapter Seven
193
used for simple consumer preference or comparative testing (Hopkins et al 2005;
Polkinghorne et al 2008a, Thompson et al 2005b). In other studies (Wheeler et al
2004; Lagerstedt et al 2008) a semitrained panel was used where a larger number of
consumer panellists had attended a small number of familiarisation sessions for
detection of a range of flavour and other quality attributes. As described by Munoz,
(1998) consumers for quantitative, descriptive analysis should be “naïve users” or
potential users of the product who are carefully recruited, not panellists who have
been trained to evaluate products in a laboratory. The number of panellists in those
studies needed to be larger than in studies using trained panels in order to produce
valid results. Poste et al (1991) described panels that fell into one of four categories:
(i) highly trained experts consisting of between one and three people; these types of
panels are used where a high degree of acuity is required and mostly found in the
wine, tea and coffee industries (ii) trained panels of between 10 and 20 people used
for assessing product attribute changes (iii) laboratory acceptance panels of between
25 and 50 people; these are valuable in determining consumer acceptance or
descriptions of products (iv) larger panels of over 100 people, which are largely used
to determine general consumer preference and reaction to products without specific
descriptors. A review of related literature highlights the highly variable nature of the
panel type utilised in meat studies. Panels vary from large untrained consumer panels
involving many hundreds of panellists (Hopkins et al 2005); smaller numbers, under
100, of semi-trained panellists (Lagerstedt et al 2008); through to small trained
panels of under 10 panellists (Wilkund et al 2009).
Sensory evaluation can be viewed as a science that uses people as instruments. The
human senses are influenced by external physical and psychological factors or
biases, and these external factors need to be controlled or minimised in order to
achieve accurate and repeatable results. Meat as a biological product presents many
challenges for evaluation studies of sensory attributes. Unlike a processed product,
raw meat is not uniform. Primal cuts may vary in flavour from one end to the other,
and there can be great variation between samples (Munoz 1998). Achieving similar
end point temperatures during preparation can also be difficult across the entire cut
for the purpose of sensory evaluation techniques.
Chapter Seven
194
Descriptive analysis is used to identify sensory characteristics that are important in a
product and to produce information on the degree of intensity of those
characteristics. This type of analysis allows quantitative studies of meat samples to
be linked to, and provide additional information on, meat quality from biochemical
analysis (Munoz 1998). As success of food products is determined by consumer
acceptance, it is important to measure consumer perceptions of a range of meat
quality attributes to ensure repeat purchase of meat products.
It is important to present samples to the appropriate target market for evaluation.
Little literature exists which identifies target markets for consumers of Australian
venison, even though the deer industries in New Zealand and Australia have
established export markets in Europe. At the commencement of the deer farming
industry and today, much of the venison produced in Australia and NZ is exported to
Western Europe and Scandinavia where it is considered a traditional product
(O‟Connor 2006). However, recent approaches by Australian and New Zealand chefs
have promoted a more contemporary style of cooking farmed venison. Research by
the deer industry in New Zealand has shown emerging market niches in younger
consumers and households with high disposable income (O‟Connor 2006). These
markets seek lighter, healthier menu options with premium quality and convenience.
Markets are also being established in Asia (O‟Connor 2006).
The palatability of a food product largely determines whether a consumer chooses to
include that product in their diet, though factors such as price, availability and
cultural acceptability will also influence whether particular products are consumed
regularly. Current consumers are more health conscious and demand meat that is of
high quality (Thompson 2002), and the success or failure of food products is driven
by consumer acceptance. Meat quality is an area of increasing consumer focus, with
various grading systems in place throughout Australia and the rest of the world.
These systems, such as Meat Standards Australia (MSA), have evaluated consumer
acceptability for beef and lamb products (Thompson 2002). For meat products the
characteristics of palatability most commonly referred to by consumers are
tenderness, juiciness and flavour, though it is likely that considerable variation exists
between consumers as to which part of this combination contributes most to their
eating experience. Various machines and laboratory assays can quantify individual
Chapter Seven
195
characteristics of meat, but the palatability or overall liking is an imprecise science
that can only be measured by consumers, varies between consumers, and combines
several characteristics in its appraisal (Aberle et al 2001). Variation in any one
characteristic can alter the palatability mix and change the overall liking.
There are many areas in the value chain from paddock to plate that can affect
palatability and these need to be standardised, where possible, for sensory evaluation
to be informative. The age of an animal, husbandry and management, slaughter
techniques and post-slaughter carcass storage can all be standardised, therefore
cooking technique and cut of meat must also be standardised for sensory evaluation
work to be meaningful and comparative. Variations in cooking technique between
consumers can alter the perception and palatability of meat (Aberle et al 2001;
AMSA 1995), so for comparative sensory analysis of product between consumers the
cooking technique must be standardised, as described in the general materials and
methods section of this document. Although the cooking technique applied to
sensory work is different in some cases to that which would be applied commercially
(eg. the charcoal layer of steak cooked on a hot plate, or embellished flavours from
marinades and sauces, are missing), the ability to compare tenderness, juiciness and
natural flavour in a standardised way between samples is retained.
There is considerable literature on the impact of animal age and cut of meat on meat
quality (Berg and Butterfield 1976; Butterfield 1988; Lawrie and Ledward 2006;
Aberle et al 2001; Rodbotten et al 2004), particularly tenderness. Although muscles
of very young animals are more tender than those of aged animals (Aberle et al
2001), changes occurring with age are not linear with increasing age (Butterfield
1988). As animals grow, muscle growth and fat deposition occur at different rates,
producing considerable variation within the carcass depending on when the animal is
slaughtered. During rapid phases of growth, tenderness increases with time because
rapid development of muscle fibre size reduces the relative effect of existing
connective tissue on muscle fibre bundles. Thus, market weight beef animals (12 to
18 months of age) often have more tender meat than growing calves (6 months of
age) (Aberle et al 2001). This is also likely to be the case in deer although there is no
evidence based on experimental work to support this.
Chapter Seven
196
Aberle et al (2001) also contend that beef flavour intensifies as animals get older and
carcass maturity and marbling increases. They suggested that the likely cause of
flavour change with increased age is due to an increase in concentration of
nucleotides in muscle, which degrade to inosinic acid and hypoxanthine post-
mortem. Flavour intensity may become so great that it is objectionable to some
consumers, an example being the strong mutton flavour of mature sheep or meat
from game animals.
As animals mature, body composition ratios of muscle:bone:fat occur (Butterfield
1988), with body fat deposition (intramuscular and intermuscular) increasing
proportionately to muscle and bone under normal growth patterns. The relationship
between slaughter weight, fat content and some quality attributes has been
established for some meats such as beef (Correale et al 1986), lamb (Tejeda et al
2008) and rabbit (Carrilho et al 2009), but has not been considered as important with
deer venison because the leanness of venison is considered to be an important
marketing strength. However, linkage of BCS with animal age can assist with
standardising physical (cut size, tenderness) and biochemical (flavour, colour)
characteristics once consumer preference is known, in addition to providing
important information on the husbandry and management of animals pre-slaughter.
In the current study, as described in Chapter 5, it was evident that slaughter-aged
(12-24 months) fallow deer are usually in the BCS range 2-3, though older animals
can reach BCS 4-5 seasonally or when fed concentrates.
Body condition score is a useful tool in assessment of animal nutritional status, and a
frequently used descriptor in the buying and selling of livestock for slaughter (Flesch
et al 2002). Market specifications are often established according to the amount of
subcutaneous fat coverage (Gaden et al 2005) on the live animal and scales of
reference have been established that allow accurate prediction of carcass
characteristics from live animal BCS assessments in fallow (Flesch et al 2002) and
red deer (Tuckwell 2003b). As previously described, the level of fatness in a carcass
can be estimated by using BCS as an indicator. Often the only guide to whether an
animal is suitable for slaughter is its live weight and general body condition, and for
Chapter Seven
197
this reason the present study was developed to evaluate whether BCS per se was
related to consumer preference for fallow or red deer venison.
Venison from fallow deer carcasses hung by pelvic suspension has been shown to be
consistently more tender than venison from carcasses hung by the Achilles tendon
(Sims et al 2004), and this improvement to product quality has been demonstrated
across different sex and age classes of fallow deer. The technique of PS is now used
commercially for carcasses from domestic species like beef and lamb, especially
within quality control systems that guarantee a tender product (Meat Standards
Australia, 2001). The effect of pelvic suspension as an alternative carcass suspension
technique on meat quality has not been reported for red deer prior to this study.
Previous chapters have described meat quality attributes and physical characteristics
commonly measured for meat, and post-slaughter carcass management that can
influence some of those measurements. This section describes sensory analysis of
venison from red and fallow deer using consumer preference tests. The data are
arranged separately for fallow deer and red deer.
Chapter Seven
198
7.2: Materials and methods
7.2.1: Sensory evaluation facility
The University of Western Sydney‟s sensory evaluation laboratory consists of six
individual booths designed to minimise suggestion, effect or influence by other
panellists. The booths are serviced by a preparation area. The room was kept at a
constant 22 ºC during tastings with uniform fluorescent lighting. The design of the
facility is consistent with ISO guidelines (2007).
7.2.2: Panellists
Descriptive and consumer preference (affective) sensory testing was undertaken with
42 panellists (Meilgaard et al 2007) who were recruited via newspaper advertising
and email. All procedures for recruitment of panellists and testing of samples were
approved by the Human Ethics Committee of UWS (number HEC 03-206). There
was an even distribution of males and females with ages ranging from 25 to 55 years.
Panellists were screened to determine if they were eaters of red meat and were
willing to try venison, or were current venison consumers. Consumers were also
screened to ensure they preferred meat cooked to medium doneness. Panellists who
smoked were asked to refrain from smoking one hour prior to and during the
sessions. Panellists undertook familiarisation and training sessions as recommended
by ISO (1993), and as described by AMSA (1995), to assist in identifying quality
parameters for venison such as liver and game flavours, colour, tenderness, juiciness
and use of the survey tool.
7.2.3: Sample preparation
Frozen samples were transferred to a cooling chamber, with a temperature of 5 ºC, 24
hours prior to analysis. Samples were prepared in unsealed vacuum packages
immersed in a water bath for 60 minutes, to reach an internal temperature of 67 C.
(Wiklund et al 1997b; AMSA 1995) which was shown to produce a product which
remains palatable and safe for consumption (Rodbotten et al 2004). Both the water
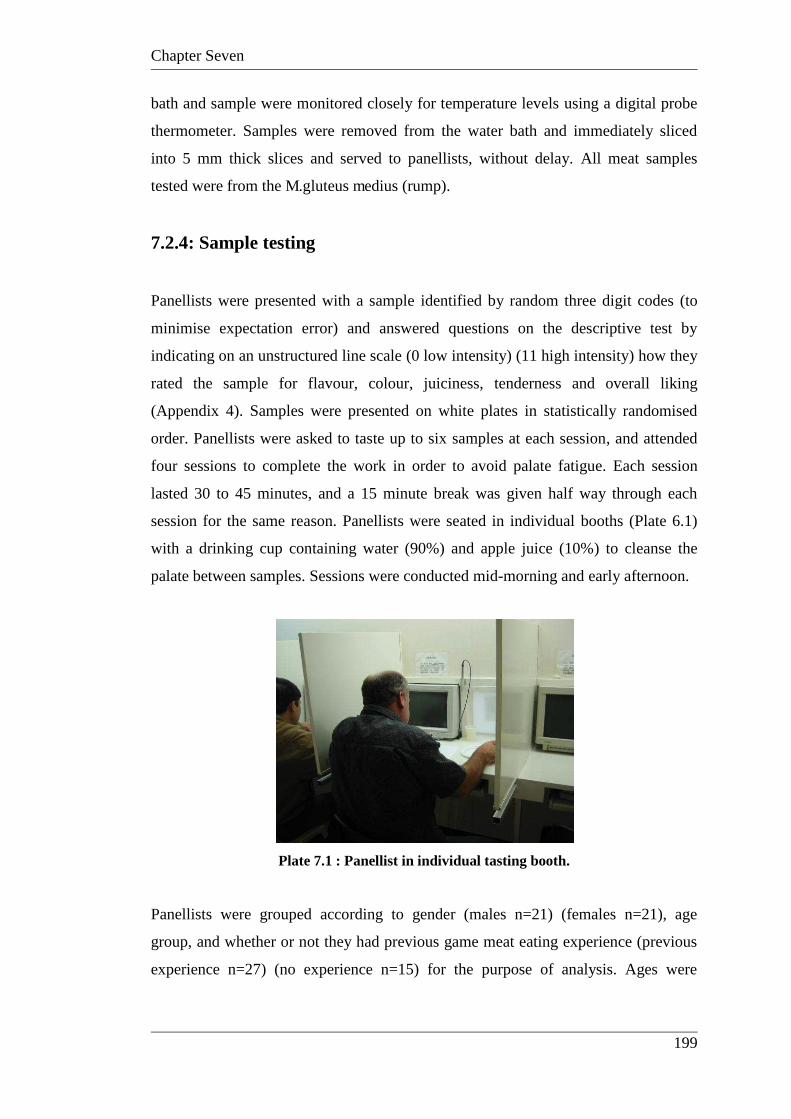
Chapter Seven
199
bath and sample were monitored closely for temperature levels using a digital probe
thermometer. Samples were removed from the water bath and immediately sliced
into 5 mm thick slices and served to panellists, without delay. All meat samples
tested were from the M.gluteus medius (rump).
7.2.4: Sample testing
Panellists were presented with a sample identified by random three digit codes (to
minimise expectation error) and answered questions on the descriptive test by
indicating on an unstructured line scale (0 low intensity) (11 high intensity) how they
rated the sample for flavour, colour, juiciness, tenderness and overall liking
(Appendix 4). Samples were presented on white plates in statistically randomised
order. Panellists were asked to taste up to six samples at each session, and attended
four sessions to complete the work in order to avoid palate fatigue. Each session
lasted 30 to 45 minutes, and a 15 minute break was given half way through each
session for the same reason. Panellists were seated in individual booths (Plate 6.1)
with a drinking cup containing water (90%) and apple juice (10%) to cleanse the
palate between samples. Sessions were conducted mid-morning and early afternoon.
Plate 7.1 : Panellist in individual tasting booth.
Panellists were grouped according to gender (males n=21) (females n=21), age
group, and whether or not they had previous game meat eating experience (previous
experience n=27) (no experience n=15) for the purpose of analysis. Ages were
Chapter Seven
200
grouped as follows: age group 1 (25-34 years n=14), age group 2, (35-44 years n=13)
age group 3 (45-55 years n=15).
The panellists were asked to evaluate samples to determine any differences between
samples due to differences in BCS, sex, post-slaughter suspension method and
feeding regime.
Venison samples were examined for microbial safety prior to and after presentation
to panellists, then frozen and stored for 6 months after completion of the tests.
7.2.5: Data analysis
Score sheets were measured by two assessors using vernier callipers, and the data
recorded as described by Thompson et al (2005c). Data were analysed using SPSS
11.5 analysis of variance using the GLM procedure. All fixed effects and their
interactions were tested in the same model. If the treatment effect was significant,
treatment means were separated using Ryan‟s Q test (SPSS 2002).
Chapter Seven
201
7.3: Results and discussion
7.3.1 Fallow deer (pasture-fed)
A series of experiments were performed to investigate the effect of BCS, sex of the
animal and method of post-slaughter carcass management on sensory perception of
fallow deer venison quality by consumers.
7.3.1.1 Experimental design
Intact (n=20) fallow bucks ranging from 18-24 months old, and non-pregnant fallow
does (n=10) approximately 36 months old with a history of one previous lactation, in
the BCS range of 2 and 3 (lean and prime), were killed by captive bolt stunning and
thoracic stick exsanguination within 3 seconds of the stun. All fallow deer were
raised on pasture. All carcasses were split along the spine before chilling, with one of
the sides randomly allocated to be hung by the Achilles tendon (AT) and the other
side hung by the aitch bone for the pelvic suspension (PS) technique. All sides were
measured for core body temperature and muscle pH at 1 and 24 hours post-mortem
in the Longissimus dorsi between the 5th and 6th rib. BCS was measured ante-mortem
and confirmed with carcass measurements post-mortem. The M.gluteus medius
muscles (GM) (rumps) were boned out from each carcass side once carcass
temperature was less than 7° C. Samples were then vacuum packaged, frozen and
stored at -21º C for no more than 12 weeks, until sensory evaluations were carried
out. Kidneys with fat were excised for later KFI calculations according to the method
of Riney (1955) to assist confirmation of BCS.
7.3.1.2 Results
The data are arranged to compare sensory evaluation of venison from bucks and does
with a mean pHu of 5.50 (sem 0.02) (Table 7.1 and 7.2), differences in BCS (Table
7.4) and method of post-slaughter hanging in the chiller (Table 7.5). In the
comparison for sex effects (Table 7.1), venison from 36-month-old does scored
significantly higher for flavour strength (F1,336 =5.19, p<0.05), for tenderness
Chapter Seven
202
(F1,336=13.96, p<0.001) and for darker colour (F1,336= 30.027, p<0.001) compared
with the 18-24 month-old bucks. Panellists from age group 2 (35-44 years) detected a
difference in the flavour strength (Table 7.2) of samples according to the sex of the
deer. This age group determined that does had a stronger flavour (mean 8.57, sem
0.32) (p<0.01). The group with game meat eating experience detected a difference in
flavour strength between the sexes of animals (Table 7.3), with does determined to
be stronger in flavour than bucks (mean 8.73 sem 0.17) (p<0.001).
Table 7.1 : Mean (+/- sem) sensory evaluation scores for venison from fallow bucks (n=10)
and does (n = 10). All panellists (n=42).
Sex Colour Aroma Aroma
Strength
Flavour Flavour
Strength
Game
Flavour
Tenderness Juiciness Overall
Liking
Buck 7.74a
(0.18)
8.48a
(0.15)
7.73a
(0.17)
9.74a
(0.17)
8.12a
(0.17)
6.56a
(0.20)
8.71a
(0.22)
8.07a
(0.21)
9.97a
(0.20)
Doe 9.08b
(0.17)
8.71a
(0.16)
7.53a
(0.18)
9.92a
(0.18)
8.65b
(0.15)
6.90a
(0.20)
9.76b
(0.17)
7.96a
(0.21)
10.15a
(0.14)
Means and standard error of means (in parenthesis) are shown.
Numbers in columns with the same letter are not significantly different.
Table 7.2 : Mean (+/- sem) sensory evaluation scores for venison from fallow bucks (n=10)
and does (n = 10), effect of panellist age (group 1 n=14, group 2 n=13, group 3 n=15) on
determination of flavour strength.
Sex Group
One
Group
Two
Group
Three
Buck 8.82a
(0.27)
7.35a
(0.33)
8.13a
(0.26)
Doe 8.53a
(0.28)
8.57b
(0.32)
8.77a
(0.22)
Means and standard error of means (in parenthesis) are shown.
Numbers in columns with the same letter are not significantly different.
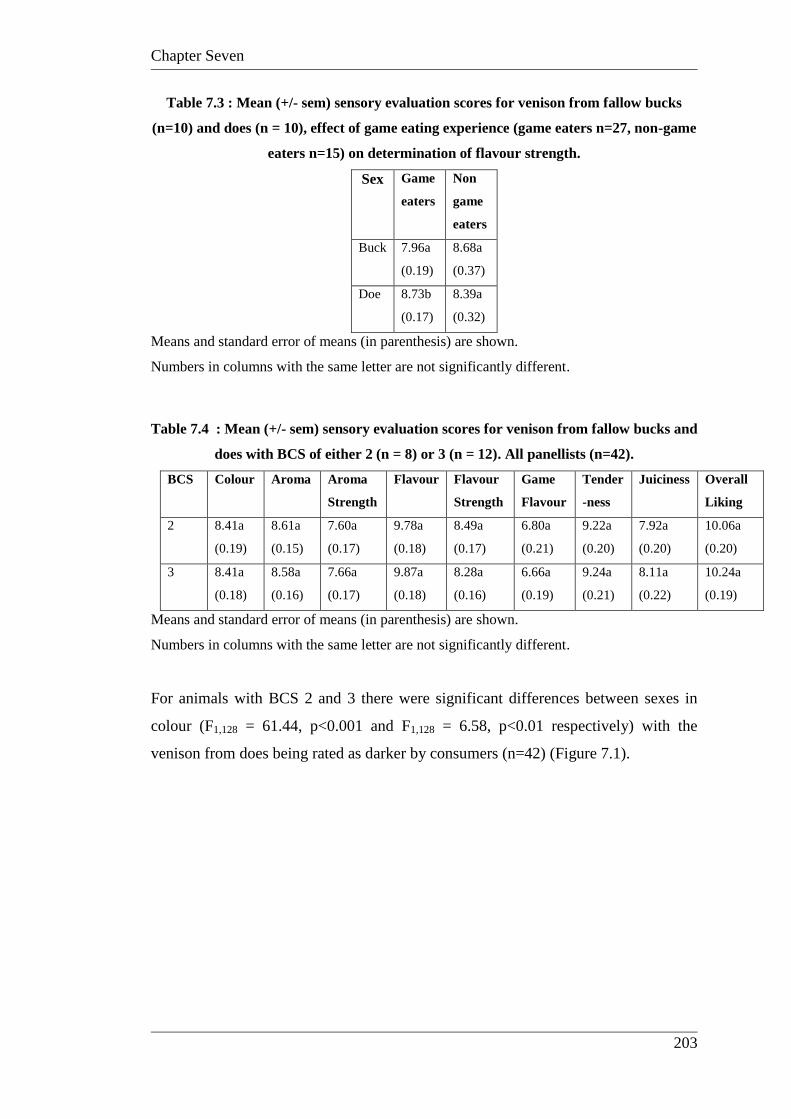
Chapter Seven
203
Table 7.3 : Mean (+/- sem) sensory evaluation scores for venison from fallow bucks
(n=10) and does (n = 10), effect of game eating experience (game eaters n=27, non-game
eaters n=15) on determination of flavour strength.
Sex Game
eaters
Non
game
eaters
Buck 7.96a
(0.19)
8.68a
(0.37)
Doe 8.73b
(0.17)
8.39a
(0.32)
Means and standard error of means (in parenthesis) are shown.
Numbers in columns with the same letter are not significantly different.
Table 7.4 : Mean (+/- sem) sensory evaluation scores for venison from fallow bucks and
does with BCS of either 2 (n = 8) or 3 (n = 12). All panellists (n=42).
BCS Colour Aroma Aroma
Strength
Flavour Flavour
Strength
Game
Flavour
Tender
-ness
Juiciness Overall
Liking
2 8.41a
(0.19)
8.61a
(0.15)
7.60a
(0.17)
9.78a
(0.18)
8.49a
(0.17)
6.80a
(0.21)
9.22a
(0.20)
7.92a
(0.20)
10.06a
(0.20)
3 8.41a
(0.18)
8.58a
(0.16)
7.66a
(0.17)
9.87a
(0.18)
8.28a
(0.16)
6.66a
(0.19)
9.24a
(0.21)
8.11a
(0.22)
10.24a
(0.19)
Means and standard error of means (in parenthesis) are shown.
Numbers in columns with the same letter are not significantly different.
For animals with BCS 2 and 3 there were significant differences between sexes in
colour (F1,128 = 61.44, p<0.001 and F1,128 = 6.58, p<0.01 respectively) with the
venison from does being rated as darker by consumers (n=42) (Figure 7.1).
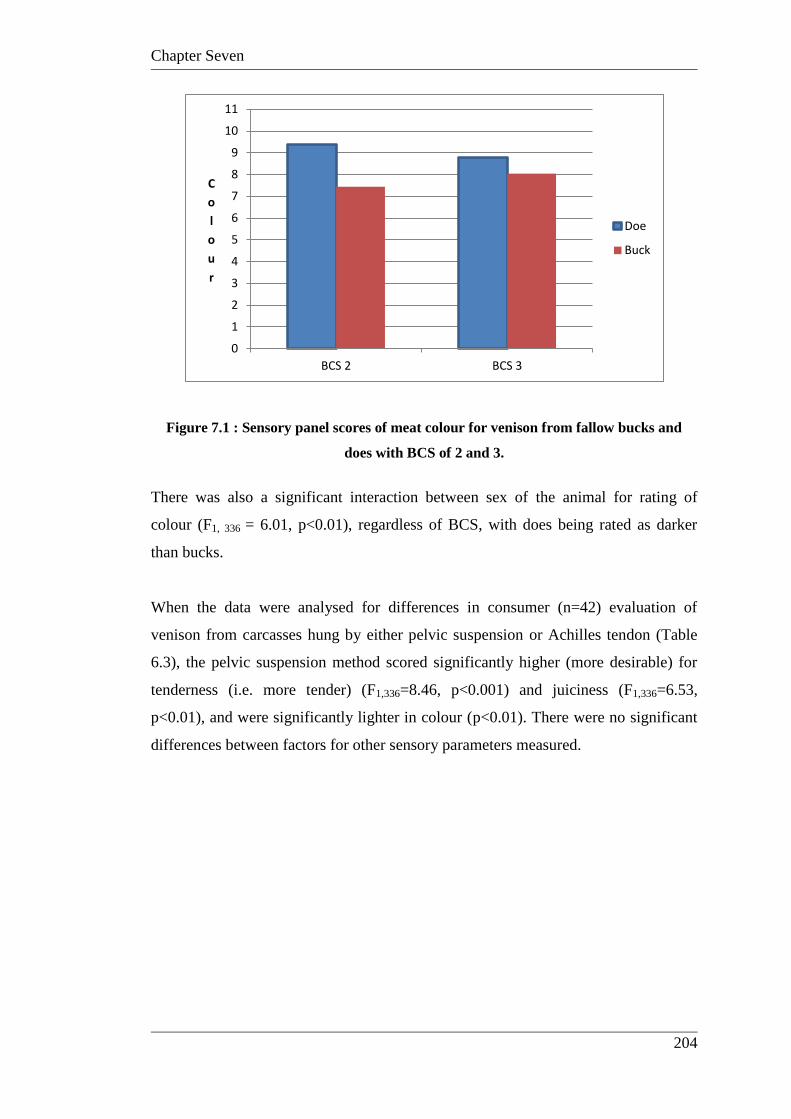
Chapter Seven
204
Figure 7.1 : Sensory panel scores of meat colour for venison from fallow bucks and
does with BCS of 2 and 3.
There was also a significant interaction between sex of the animal for rating of
colour (F1, 336 = 6.01, p<0.01), regardless of BCS, with does being rated as darker
than bucks.
When the data were analysed for differences in consumer (n=42) evaluation of
venison from carcasses hung by either pelvic suspension or Achilles tendon (Table
6.3), the pelvic suspension method scored significantly higher (more desirable) for
tenderness (i.e. more tender) (F1,336=8.46, p<0.001) and juiciness (F1,336=6.53,
p<0.01), and were significantly lighter in colour (p<0.01). There were no significant
differences between factors for other sensory parameters measured.
0
1
2
3
4
5
6
7
8
9
10
11
BCS 2 BCS 3
C
o
l
o
u
r
Doe
Buck
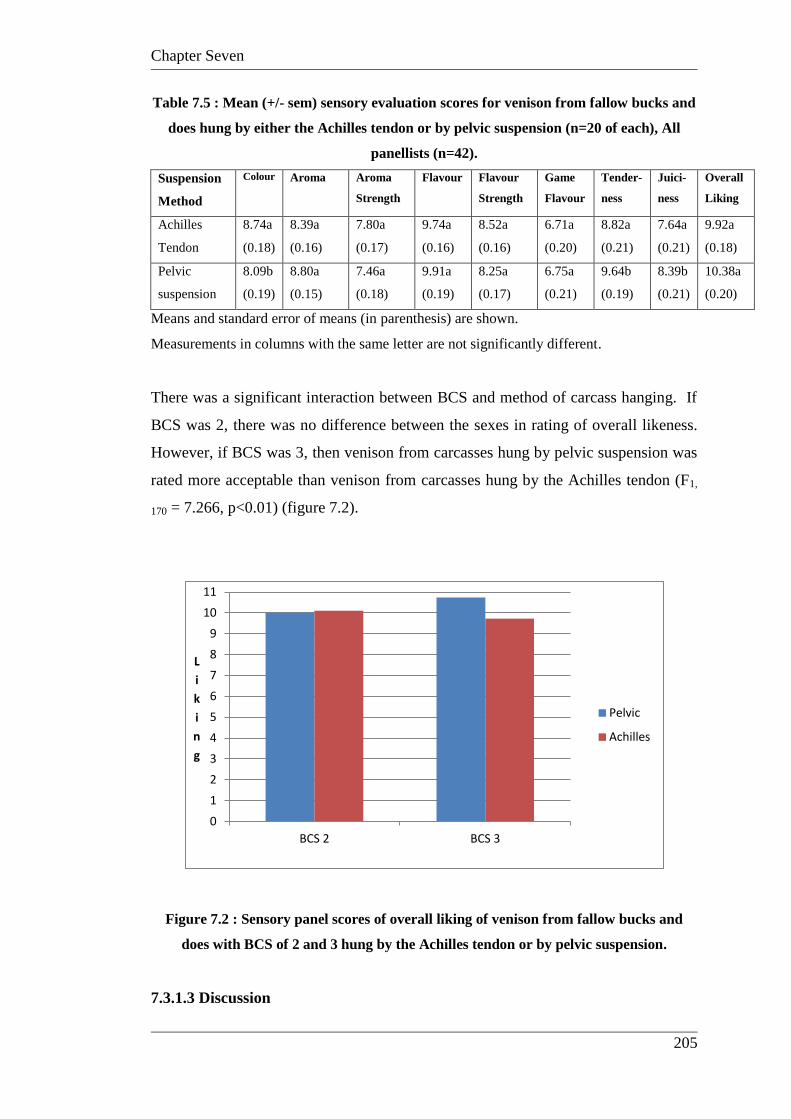
Chapter Seven
205
Table 7.5 : Mean (+/- sem) sensory evaluation scores for venison from fallow bucks and
does hung by either the Achilles tendon or by pelvic suspension (n=20 of each), All
panellists (n=42).
Suspension
Method
Colour Aroma Aroma
Strength
Flavour Flavour
Strength
Game
Flavour
Tender-
ness
Juici-
ness
Overall
Liking
Achilles
Tendon
8.74a
(0.18)
8.39a
(0.16)
7.80a
(0.17)
9.74a
(0.16)
8.52a
(0.16)
6.71a
(0.20)
8.82a
(0.21)
7.64a
(0.21)
9.92a
(0.18)
Pelvic
suspension
8.09b
(0.19)
8.80a
(0.15)
7.46a
(0.18)
9.91a
(0.19)
8.25a
(0.17)
6.75a
(0.21)
9.64b
(0.19)
8.39b
(0.21)
10.38a
(0.20)
Means and standard error of means (in parenthesis) are shown.
Measurements in columns with the same letter are not significantly different.
There was a significant interaction between BCS and method of carcass hanging. If
BCS was 2, there was no difference between the sexes in rating of overall likeness.
However, if BCS was 3, then venison from carcasses hung by pelvic suspension was
rated more acceptable than venison from carcasses hung by the Achilles tendon (F1,
170 = 7.266, p<0.01) (figure 7.2).
Figure 7.2 : Sensory panel scores of overall liking of venison from fallow bucks and
does with BCS of 2 and 3 hung by the Achilles tendon or by pelvic suspension.
7.3.1.3 Discussion
0
1
2
3
4
5
6
7
8
9
10
11
BCS 2 BCS 3
L
i
k
i
n
g
Pelvic
Achilles
Chapter Seven
206
From this set of experiments there were a number of key findings. Meat from fallow
deer does was generally more tender than bucks, even at older ages, and had a high
overall liking rating by consumers even though the meat was significantly darker and
had a stronger flavour. This finding is similar to that found with lamb where older
animals have stronger flavour profiles (Pethick et al 2002; Pethick et al 2005b).
Other studies in lamb have also found that colour strength increases as a function of
age, with lambs having the lightest colour followed by hoggets. The darker colour
was linked to increasing myoglobin levels (Pethick et al 2002; Hopkins et al 2005).
The middle-aged group of panellists detected a stronger flavour in does, possibly due
to the animals being older, and this age group of panellists contained a higher
percentage of current venison consumers than the other two age groupings. The game
meat eating group also detected a stronger flavour in the does, a finding possibly
related to prior game meat eating experience. This general acceptance of venison
from older does is quite important as farmers can now consider early culling of does
that are not performing in the breeding herd without losing carcass value. This
practice will only be effective if wholesalers also accept the consumer ratings from
sensory tests, and do not superimpose on venison values held for other domestic
meats. Unlike some studies of mutton (Pethick et al 2002; Thompson et al 2005b)
venison from older does in this study was more tender than venison from younger
bucks, and this is likely to be a result of sex differences rather than age. Similar
studies on cattle have shown heifers to be significantly more tender than steers and
bulls (Florek and Litwinczuk 2002; Weglarz et al 2002; Lundesjö et al 2003), ewes
more tender than rams (Craigie et al 2012) and goats (Rodrigues et al 2011), which
support the findings for deer in this and previous studies (Sims et al 2004). Studies
on red deer venison have demonstrated that physiological changes in male deer
triggered by increasing testicular secretion of testosterone around the rutting season
(breeding season) had negative effects on venison tenderness (Stevenson et al 1992;
Wiklund et al 2010), while no effects of season on venison tenderness have been
demonstrated for female deer. In reindeer venison evaluated by a trained taste panel,
adult bulls and cows had a more coarse fibre structure, more fat flavour and was less
tender than venison from reindeer calves (Wiklund et al 2002). The overall liking for
venison from older females in this study is an important finding for deer farmers.
Results from consumer testing indicated that venison from older cull females is
Chapter Seven
207
desirable, with a number of sensory attributes rated more highly than venison from
younger bucks.
The data indicate no overall difference in liking for BCS 2-3 animals, hung by the
Achilles tendon, whether bucks or does. This is also important given that most
fallow deer presented for slaughter fall into this BCS range.
The consumers clearly distinguished their overall liking for venison derived from
carcasses treated with pelvic suspension post-slaughter compared with Achilles
tendon suspension. This preference was demonstrated by the important quality
characteristics of tenderness and juiciness which both increased in venison as an
effect of this technique. The ability of consumers to detect higher levels of juiciness
in samples from animals that were hung by pelvic suspension techniques supports
findings from a study by Wiklund et al (2004) where water holding capacity was
increased in meat from both fallow deer venison and lamb when comparing carcasses
hung by the pelvic suspension technique rather than the Achilles tendon hanging
method. Water holding capacity is an important meat quality attribute, as loss of
water in the form of purge or drip affects the appearance of vacuum packaged meat
and is also related to juiciness of cooked meat for table purposes (Wiklund et al
2009). This finding is also consistent with the data in Chapter 6, and indicates that
the technique of pelvic suspension should be adopted by the deer industry to produce
venison for which consumers have an increased preference. Similar studies in lamb
have also found pelvic suspension to be beneficial in producing more tender meat, as
assessed by consumers. (Thompson et al 2005b). Park et al (2008) confirmed these
results with beef. There was a significant interaction between BCS and method of
hanging between the sexes in rating of overall liking, whereby consumers were
unable to differentiate between venison hanging techniques at BCS 2, but had a
definite preference for venison from carcasses hung by the pelvis at BCS 3. As
shown in Figure 6.2, when scores are as close as these, it may be of little
consequence in the market where consumers only have a single sample to „analyse‟
at a meal. This increased rating for venison of higher BCS is further investigated
later in this chapter.
Chapter Seven
208
7.3.2: Fallow deer - impact of supplementary feeding
7.3.2.1 Introduction
Body condition score is a useful tool in assessment of animal well-being, and a
frequently used descriptor in the buying and selling of livestock for slaughter. The
BCS of an animal can be altered by the presence or absence of supplementary feeds,
and meat production systems for beef (Hunter et al 2001), lamb (Pethick et al 2005a)
and goat meat (Adam et al 2010; Madruga et al 2008) frequently utilise
supplementary feeding to increase feed conversion efficiency and to produce
carcasses that consistently meet market specifications. These specifications are often
established according to the amount of subcutaneous fat coverage on the live animal,
and scales of reference have been established that allow accurate prediction of
carcass characteristics from live animal BCS assessments in fallow deer (Flesch et al
2002) and red deer (Audige et al 1998; Tuckwell 2003b).
In the quest to meet market specifications for various deer species, it is important to
define the effects of supplementary feeding of fallow deer on venison flavour.
Cooking methods are usually implicated in changes to the odour and taste of meat
(Bejerholm and Aaslyng 2003). However, the feed consumed by other domesticated
meat production animals such as cattle (Resconi et al 2010) and sheep (Resconi et al
2009) immediately prior to slaughter has been shown to alter the flavour of the meat,
with Lawrie and Ledward (2006) indicating that the degree of fatness of the carcass
can also change perceptions of flavour, due to concentrations of fatty acids.
Studies comparing the effects of grain vs. pasture finishing have usually been
conducted in the major meat species, cattle and sheep. McCaughey & Cliplef (1996)
fed steers with grain over 33 or 75 days prior to slaughter and compared the meat
quality with meat from animals in a pasture control group. The study demonstrated
that while pasture finished steers had lower yields and darker meat, with the majority
of animals meeting market requirements, there were no effects on tenderness,
juiciness, flavour and overall acceptability, according to consumer testing. Similar
studies were conducted by Pethick et al (2005a) on lamb, resulting in
Chapter Seven
209
recommendations that the decision to grain finish should be based on production
costs due to the limited impact on eating quality.
The sensory quality of deer venison has not been studied extensively, but some
research has reported intermediate to high sensory scores for tenderness, juiciness
and variations in the amount of game or “wild” flavour for red deer (Cervus elaphus)
(Wiklund et al 2003b), reindeer and caribou (Rangifer tarandus tarandus) (Rincker
et al 2006; Wiklund et al 2003a), and more recently, from this study fallow deer
venison (Hutchison et al 2010). The characteristic sensory attributes for venison
identified in these studies include highly tender and juicy, with flavour profiles
ranging from mild to livery, all leading to good overall acceptance by consumer
panels. Rodbotten et al (2004) developed a sensory map of 15 species, both
domesticated and non-domesticated. The deer venison included in that study was
from wild reindeer (Rangifer tarandus tarandus), moose (Alces alces) and roe deer
(Capreolus capreolus), with moose achieving the highest overall acceptability rating
from consumers, particularly in terms of tendernesss, flavour and juiciness.
In the current study it was evident that slaughter-aged (12-24 months) fallow deer are
usually in the BCS range 2-3, though older animals can reach BCS 4-5 seasonally or
when fed concentrates. In beef animals flavour intensity becomes greater as carcass
maturity and marbling increases (Aberle et al 2001; MSA 2001). It is important to
know if increased carcass fatness associated with concentrate feeding of deer alters
venison characteristics to the extent that consumers can detect a difference in flavour
compared with deer fed on pasture only, and if so, whether the change in flavour is
appreciated or not. This trial investigated the influence of supplementary feeding on
the eating quality characteristics of venison from fallow deer.
7.3.2.2 Experimental design
Non-pregnant, fallow does (n=24) approximately thirty six months old at the
commencement of the trial and with a history of one previous lactation, an average
live weight of 43 kg and BCS 2 (Flesch et al 2002), were slaughtered as part of a
supplementary feed trial (Chapter 5). The animals were quarter-bred hybrids of the
European type of fallow deer (Dama dama) and the Mesopotamian type (D.d.
Chapter Seven
210
mesopotamica), with European fallow deer being the dominant influence. Prior to the
feeding trial, all the does were raised principally on kikuyu pasture oversown with
ryegrass and oats during winter. Twelve of these does were grazed on kikuyu pasture
oversown with ryegrass and oats in winter. The remaining animals were fed barley
(800 g/animal/day) and lucerne hay 500 g/animal/day) during the supplementary
feeding period. The animals were randomly allocated to one of two groups: group 1
animals were slaughtered after 135 days of feeding (n=12; 6 grazing and 6
barley/hay fed animals) and group 2 after 170 days of feeding (n=12; 6 grazing and 6
barley/hay fed animals). All animals were fasted for 16 h prior to slaughter and their
live weights recorded before they were slaughtered as described in Chapter 3.
Samples were analysed to ascertain the effects of feeding on meat quality. This trial
also provided BCS 4 animals for establishing relationships between BCS and eating
quality..
7.3.2.3 Results
The data are arranged to compare sensory evaluation of venison from fallow deer
does of BCS 2, 3 and 4, raised on pasture only or supplementary-fed with grain and
lucerne hay and with an overall mean pHu of 5.52 (sem 0.01). There was no
interaction between BCS and feed for all sensory parameters measured, except for
flavour strength. Therefore, data were averaged over BCS for analysis of differences
between feed and averaged over feed for analysis of difference between BCS for all
sensory parameters measured except for flavour strength (Table 6.6). The only
difference in sensory attributes detected by panellists was a difference in flavour
strength between animals fed grain (mean score 8.52, sem 1.84) compared with
animals fed only pasture (mean score 8.08, sem 2.13) prior to slaughter, with venison
from grain-fed animals deemed to have a stronger flavour (p<0.05) (Table 7.7).
Analysis of variance for averaged data shows no significant differences between
BCS and feed for all sensory parameters analysed. However, there was a significant
interaction between BCS and feed for flavour strength (F1, 199 = 4.69, p<0.05). When
deer BCS was 3, consumers scored barley-fed (mean score 8.60, sem 0.33) animals
significantly higher than pasture (mean score 7.53, sem 0.37) fed animals (F1,79 =
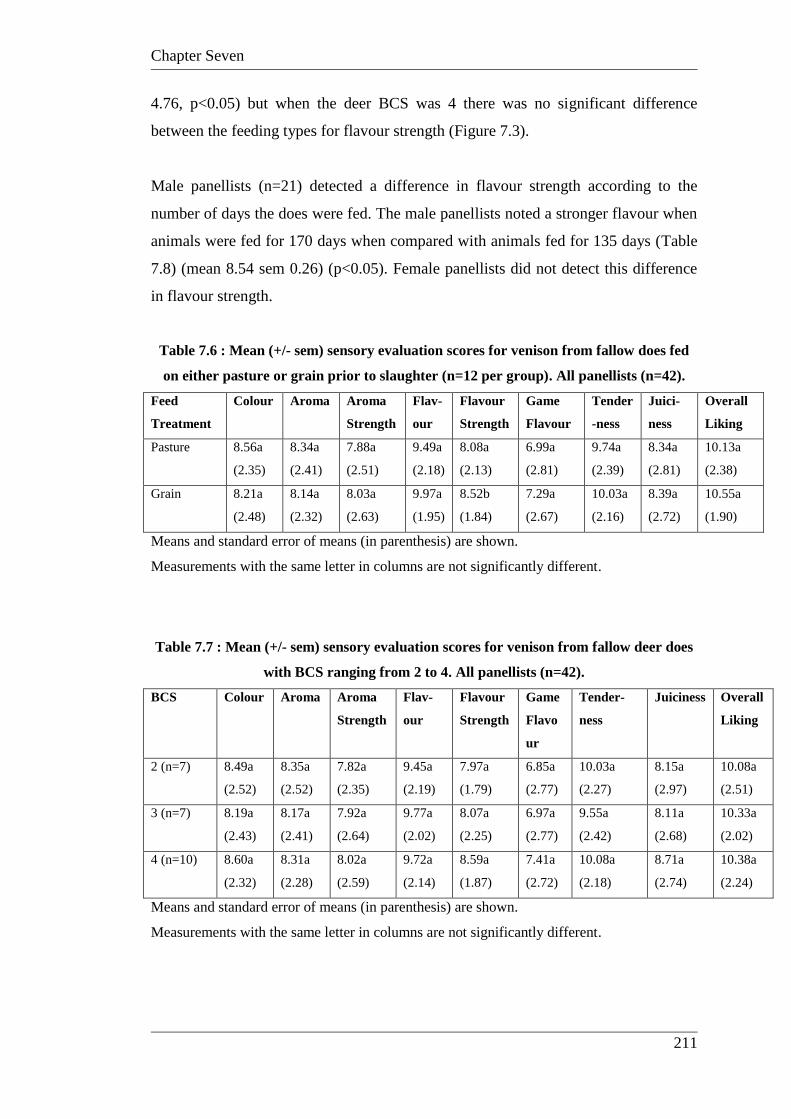
Chapter Seven
211
4.76, p<0.05) but when the deer BCS was 4 there was no significant difference
between the feeding types for flavour strength (Figure 7.3).
Male panellists (n=21) detected a difference in flavour strength according to the
number of days the does were fed. The male panellists noted a stronger flavour when
animals were fed for 170 days when compared with animals fed for 135 days (Table
7.8) (mean 8.54 sem 0.26) (p<0.05). Female panellists did not detect this difference
in flavour strength.
Table 7.6 : Mean (+/- sem) sensory evaluation scores for venison from fallow does fed
on either pasture or grain prior to slaughter (n=12 per group). All panellists (n=42).
Feed
Treatment
Colour Aroma Aroma
Strength
Flav-
our
Flavour
Strength
Game
Flavour
Tender
-ness
Juici-
ness
Overall
Liking
Pasture 8.56a
(2.35)
8.34a
(2.41)
7.88a
(2.51)
9.49a
(2.18)
8.08a
(2.13)
6.99a
(2.81)
9.74a
(2.39)
8.34a
(2.81)
10.13a
(2.38)
Grain 8.21a
(2.48)
8.14a
(2.32)
8.03a
(2.63)
9.97a
(1.95)
8.52b
(1.84)
7.29a
(2.67)
10.03a
(2.16)
8.39a
(2.72)
10.55a
(1.90)
Means and standard error of means (in parenthesis) are shown.
Measurements with the same letter in columns are not significantly different.
Table 7.7 : Mean (+/- sem) sensory evaluation scores for venison from fallow deer does
with BCS ranging from 2 to 4. All panellists (n=42).
BCS Colour Aroma Aroma
Strength
Flav-
our
Flavour
Strength
Game
Flavo
ur
Tender-
ness
Juiciness Overall
Liking
2 (n=7) 8.49a
(2.52)
8.35a
(2.52)
7.82a
(2.35)
9.45a
(2.19)
7.97a
(1.79)
6.85a
(2.77)
10.03a
(2.27)
8.15a
(2.97)
10.08a
(2.51)
3 (n=7) 8.19a
(2.43)
8.17a
(2.41)
7.92a
(2.64)
9.77a
(2.02)
8.07a
(2.25)
6.97a
(2.77)
9.55a
(2.42)
8.11a
(2.68)
10.33a
(2.02)
4 (n=10) 8.60a
(2.32)
8.31a
(2.28)
8.02a
(2.59)
9.72a
(2.14)
8.59a
(1.87)
7.41a
(2.72)
10.08a
(2.18)
8.71a
(2.74)
10.38a
(2.24)
Means and standard error of means (in parenthesis) are shown.
Measurements with the same letter in columns are not significantly different.
Chapter Seven
212
For BCS 3 the flavour strength for pasture-fed animals was significantly lower
(score=7.53 sem 0.37) than for animals fed barley (score= 8.60 sem 0.33). When
BCS was 4 there was no significant difference between pasture-fed and barley-fed
animals (Figure 7.3).
Figure 7.3 : Sensory panel scores for flavour strength of venison from fallow does with
body condition scores of 3 and 4, fed either pasture or grain prior to slaughter.
Table 7.8 : Mean (+/- sem) sensory evaluation scores for venison from fallow deer does
(n=24) fed for either 135 or 170 days on grain, effect of panellist gender on
determination of flavour strength.
Days of feeding Male Female
135 7.75a
(0.29)
8.33a
(0.37)
170 8.54b
(0.26)
7.96a
(0.33)
Means and standard error of means (in parenthesis) are shown.
Numbers in columns with the same letter are not significantly different.
7.3.2.4 Discussion
0
1
2
3
4
5
6
7
8
9
10
11
BCS 3 BCS 4
F
l
a
v
o
u
r
S
t
r
e
n
g
t
h
Grain
Pasture
Chapter Seven
213
Sensory evaluation is designed to measure the eating experience of the consumer.
Consumer preference is based on evaluation of predictive measures of meat quality
by the end user, and in this study differences between BCS, time on feed and feed
type were evaluated.
In beef animals, it has been reported that flavour intensity becomes greater as carcass
maturity and marbling increases (Aberle et al 2001; MSA 2010). For fallow deer in
this study, body condition score was increased by grain feeding young fallow deer to
achieve BCS 4, which was difficult to achieve by pasture feeding alone. Taste panels
found a significantly stronger flavour in the venison from animals fed grain prior to
slaughter, particularly in animals that remained at BCS 3. The flavour modification is
possibly due to changes in the fatty acid profile of venison from the grain-fed group
as shown in reindeer and red deer (Sampels et al 2004). Male panellists were
particularly able to detect a difference according to the number of days the animals
were fed concentrate feed, with longer feeding periods resulting in stronger flavours.
This result did not, however, affect overall liking or preference. Issanchou (1996)
stated that males rate flavour as more important than do females and this may explain
their perception and reporting of differences in flavour. These data are supported by
a number of other studies which also reported changes in flavour profiles in beef
(French et al 2001), lamb (Pethick et al 2002; Pethick et al 2005a), red deer (Wiklund
et al 2003b) and reindeer fed concentrate feed or grain immediately prior to slaughter
(Wiklund et al 2003a). However, the stronger flavour in venison from grain-fed
animals was not detected in animals of BCS 4 in this study, possibly as a result of the
higher intramuscular fat content altering the flavour strength of the muscle. Fat
content has been correlated with flavour in a study on red deer venison (Wilkund et
al 2008) and is known to influence the flavour profile of lamb (Pethick et al 2005a)
and kudu (Hoffman et al 2009). Panellists were unable to detect the increased
tenderness and fat content of the meat from BCS 4 animals that was determined by
instrumental measures (Chapter 4). As there were no significant differences in other
quality parameters between BCS 2, 3 and 4 animals, or between animals fed grain or
pasture, there would appear to be no justification for fallow deer farmers to finish
animals on grain prior to slaughter to achieve higher BCS. This is corroborated in a
Chapter Seven
214
study on beef heifers by Hessle et al (2007), where it was determined that
satisfactory carcasses may be achieved on pasture finishing.
The meat from all animals included in this supplementary feed study has also been
evaluated for colour stability during display and after chilled storage up to six weeks
in vacuum bags (Wiklund et al 2005). It was concluded that venison from the fallow
deer finished on pasture maintained the desired red meat colour for longer compared
with venison from the grain-fed deer (Wiklund et al 2005), which is another good
reason, from the perspective of consumer preference, for pasture based management
systems.
Feeding red deer and reindeer commercial feed mixtures (grain-based pellets) for 8-
10 weeks prior to slaughter has been demonstrated to significantly change the flavour
of venison compared with control groups of animals grazing natural pasture before
slaughter (Wiklund et al 2001a; 2003a). A study by Wiklund et al (2000) found no
significant differences in sensory attributes for female reindeer calves fed
commercial pellets and silage over the natural diet of lichens. In a separate study on
reindeer bulls Wiklund et al (2003a), the deer fed commercial feed scored higher for
liver and sweet flavour and lower for off flavour than reindeer reared on natural
grazing land and not fed concentrate feeds. A similar study was conducted by
Wiklund et al (2003b) on red deer stags reared on pasture or fed a commercial feed
mixture prior to slaughter. Trained panellists detected a difference in grassy flavour
in the two groups with the pasture fed group having more grassy flavour than the
group fed on the commercial concentrate. Kerth et al (2007) finished Angus-cross
steers (English x Continental) on rye grass forage or high concentrate diet and
presented the samples to a trained panel. Tenderness and flavour were not affected
by finishing regime, however meat from cattle finished on grain had a higher
consumer acceptability score. Realini et al (2009) found that European consumers
preferred beef that contained at least a portion of pasture in the finishing diet. Font i
Furnols et al (2009) determined that consumers preferred lambs fed on concentrate
feeds or a mixture of pasture and concentrate to those raised on pasture alone. This
was confirmed by Resconi et al (2009) where consumers indicated higher tenderness
scores and less off flavours and odours in lambs with concentrate included in their
diets.
Chapter Seven
215
In the previous section it was shown that flavour increased with increasing animal
age, and these data show that flavour can be increased by grain feeding animals of
the same age, compared with pasture-fed animals. This knowledge may be of some
importance to deer farmers producing for particular market preferences.
In this study the most important finding was that consumer preference was not
affected by finishing deer on concentrate feed or pasture prior to slaughter, or by
BCS. Optimal tenderness (shear force) was achieved in BCS 4 (Chapter 4), though
panellists rated all samples to be at the high end of the tenderness scale. This finding
was also reported for reindeer meat (Wiklund and Johansson 2011). This study
confirmed that fallow deer does of BCS 2-4 can be slaughtered year round with no
impact on the consumer acceptability of venison.
7.3.3 Red deer (pasture-fed)
7.3.3.1 Introduction
As mentioned previously, product consistency is vitally important for growth of the
domestic and export markets for Australian farmed venison. In Australia and
elsewhere, red deer are being farmed in increasing numbers for venison production,
and development of finesse in post-slaughter carcass treatment is likely to provide
significant return on investment because the anticipated improvements to product
quality will add significant value to the product. Venison from fallow deer and red
deer carcasses hung by pelvic suspension has been shown (Sims et al 2004 and
Chapter 5 of this study) to be consistently more tender than venison from carcasses
hung by the Achilles tendon, and this improvement to product quality has been
demonstrated across different sex and age classes of deer. The technique of pelvic
suspension is now used commercially for carcasses from domesticated species such
as beef and lamb, especially within quality control systems that guarantee a tender
product. The effect of pelvic suspension as an alternative carcass suspension
technique on meat quality has not been reported for red deer prior to this study, and
results in Chapter 5 demonstrated that meat tenderness increased for both raw and
cooked venison by using this technique, as measured in the laboratory by using a
Chapter Seven
216
Warner-Bratzler shear attachment on a texture analyser. This section now
investigates whether sensory evaluation panels can detect differences in venison
quality from red deer carcasses treated differently post-slaughter.
As previously described the level of fatness in a carcass can be detected by using
BCS as an indicator. At any given time there can be variation within and between
farms in the BCS of animals due to differences in age, sex, management practices,
disease status and climatic conditions, and venison quality will vary in response to
pressures exerted by these variations. Quite often, the only guide to whether an
animal is suitable for slaughter is its live weight and general body condition, and for
this reason it is important to know whether BCS per se is related to consumer
preference in the case of red deer venison. This section also explores consumer
perception of differences in BCS for red deer stags.
7.3.3.2 Experimental design
Pelvic suspension
Venison from rising 2 year old red deer stags (n=14) was used for this work.
Carcasses were split along the mid-ventral axis, and each carcass side was randomly
allotted to either Achilles tendon suspension (normal hanging technique) or to pelvic
suspension. GM muscles were excised and used for this experiment. Using this
experimental design, each animal was exposed to both treatments, and consumers
could evaluate venison from the same animal by tasting venison from each of the
treatments randomly.
Effect of BCS
Venison from red deer stags (n=26) killed commercially and with BCS ranging
between 2 and 4 was collected for this study (see Chapter 4). The sensory evaluation
techniques and tasting panel are as described for fallow deer experiments. The same
group of panellists (n=42) used in 7.3.1 and 7.3.2 were also utilised for this
experiment.
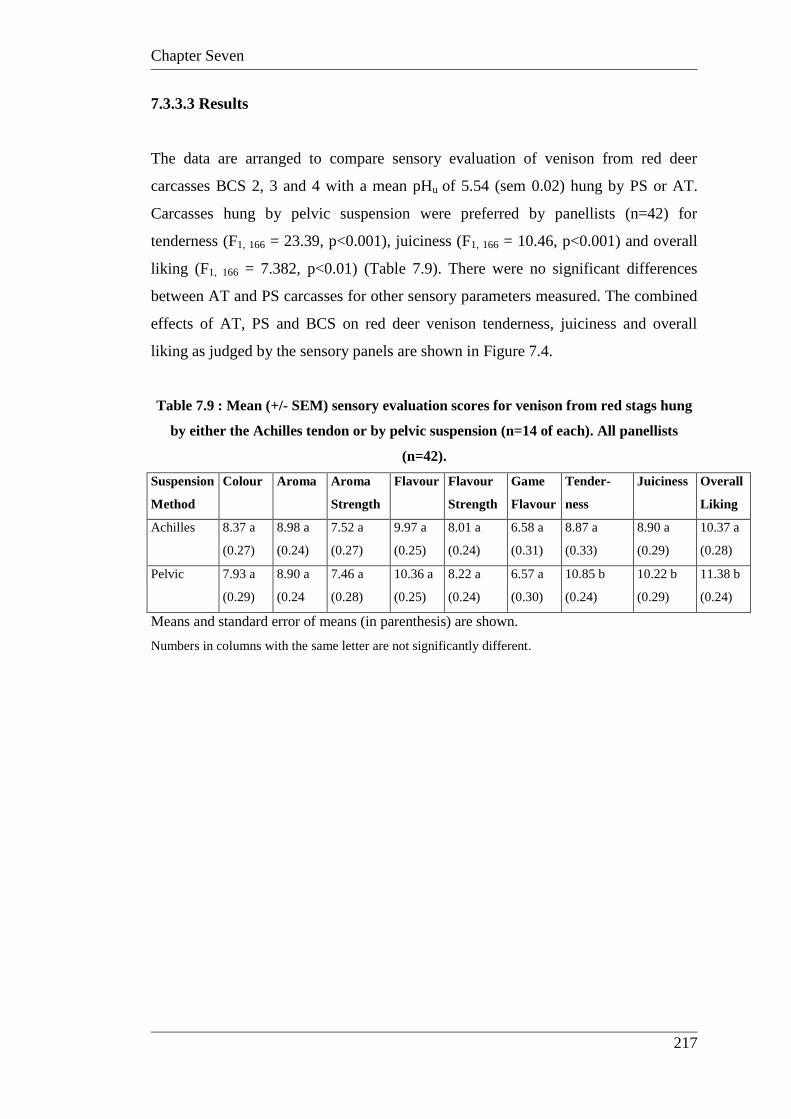
Chapter Seven
217
7.3.3.3 Results
The data are arranged to compare sensory evaluation of venison from red deer
carcasses BCS 2, 3 and 4 with a mean pHu of 5.54 (sem 0.02) hung by PS or AT.
Carcasses hung by pelvic suspension were preferred by panellists (n=42) for
tenderness (F1, 166 = 23.39, p<0.001), juiciness (F1, 166 = 10.46, p<0.001) and overall
liking (F1, 166 = 7.382, p<0.01) (Table 7.9). There were no significant differences
between AT and PS carcasses for other sensory parameters measured. The combined
effects of AT, PS and BCS on red deer venison tenderness, juiciness and overall
liking as judged by the sensory panels are shown in Figure 7.4.
Table 7.9 : Mean (+/- SEM) sensory evaluation scores for venison from red stags hung
by either the Achilles tendon or by pelvic suspension (n=14 of each). All panellists
(n=42).
Suspension
Method
Colour Aroma Aroma
Strength
Flavour Flavour
Strength
Game
Flavour
Tender-
ness
Juiciness Overall
Liking
Achilles 8.37 a
(0.27)
8.98 a
(0.24)
7.52 a
(0.27)
9.97 a
(0.25)
8.01 a
(0.24)
6.58 a
(0.31)
8.87 a
(0.33)
8.90 a
(0.29)
10.37 a
(0.28)
Pelvic 7.93 a
(0.29)
8.90 a
(0.24
7.46 a
(0.28)
10.36 a
(0.25)
8.22 a
(0.24)
6.57 a
(0.30)
10.85 b
(0.24)
10.22 b
(0.29)
11.38 b
(0.24)
Means and standard error of means (in parenthesis) are shown.
Numbers in columns with the same letter are not significantly different.
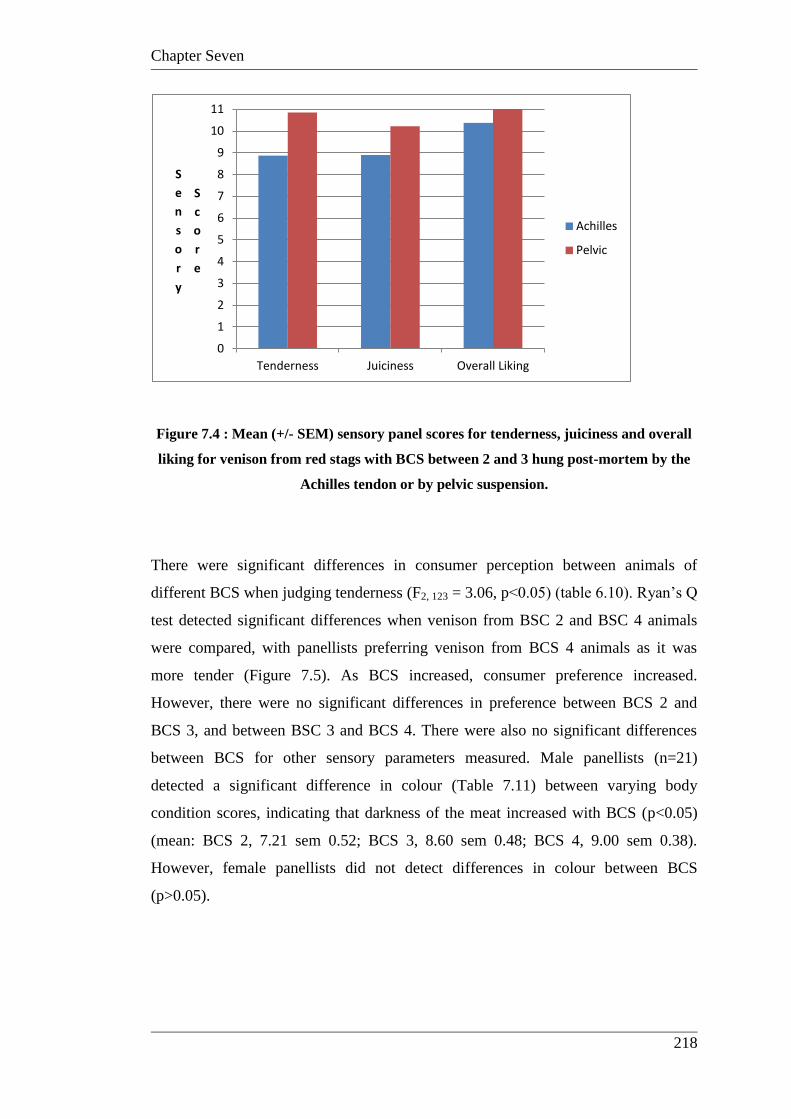
Chapter Seven
218
Figure 7.4 : Mean (+/- SEM) sensory panel scores for tenderness, juiciness and overall
liking for venison from red stags with BCS between 2 and 3 hung post-mortem by the
Achilles tendon or by pelvic suspension.
There were significant differences in consumer perception between animals of
different BCS when judging tenderness (F2, 123 = 3.06, p<0.05) (table 6.10). Ryan‟s Q
test detected significant differences when venison from BSC 2 and BSC 4 animals
were compared, with panellists preferring venison from BCS 4 animals as it was
more tender (Figure 7.5). As BCS increased, consumer preference increased.
However, there were no significant differences in preference between BCS 2 and
BCS 3, and between BSC 3 and BCS 4. There were also no significant differences
between BCS for other sensory parameters measured. Male panellists (n=21)
detected a significant difference in colour (Table 7.11) between varying body
condition scores, indicating that darkness of the meat increased with BCS (p<0.05)
(mean: BCS 2, 7.21 sem 0.52; BCS 3, 8.60 sem 0.48; BCS 4, 9.00 sem 0.38).
However, female panellists did not detect differences in colour between BCS
(p>0.05).
0
1
2
3
4
5
6
7
8
9
10
11
Tenderness Juiciness Overall Liking
S
e
n
s
o
r
y
S
c
o
r
e
Achilles
Pelvic
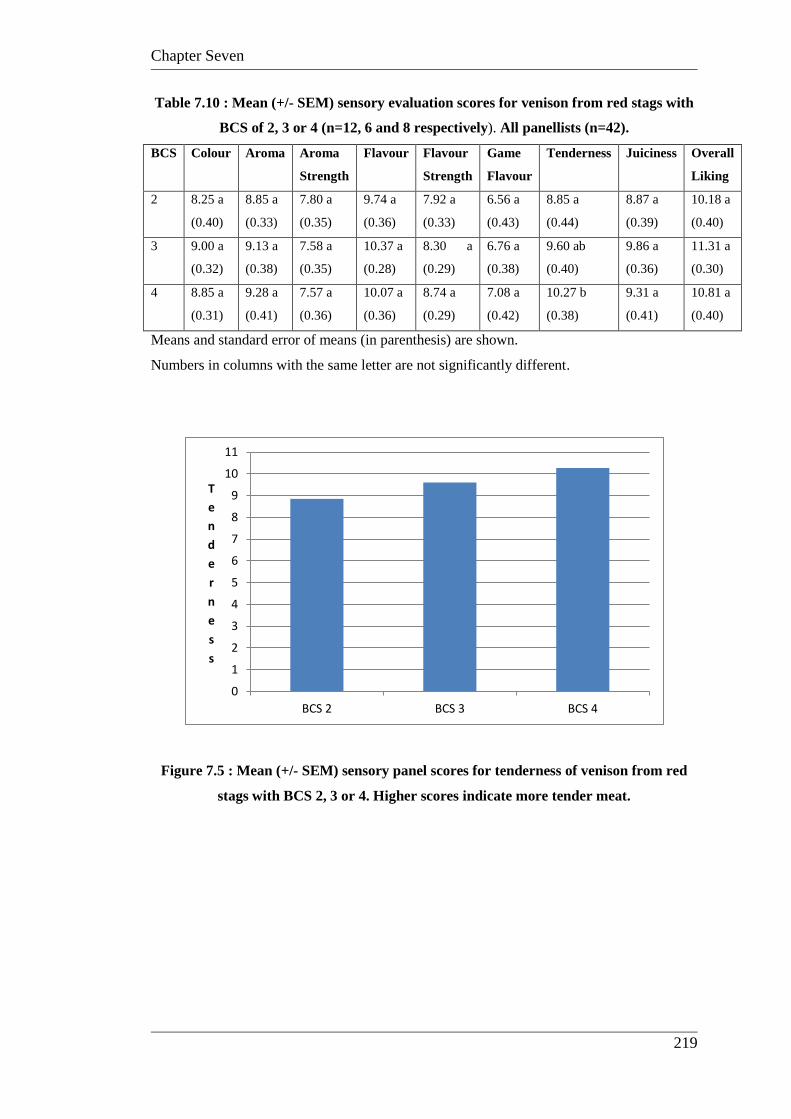
Chapter Seven
219
Table 7.10 : Mean (+/- SEM) sensory evaluation scores for venison from red stags with
BCS of 2, 3 or 4 (n=12, 6 and 8 respectively). All panellists (n=42).
BCS Colour Aroma Aroma
Strength
Flavour Flavour
Strength
Game
Flavour
Tenderness Juiciness Overall
Liking
2 8.25 a
(0.40)
8.85 a
(0.33)
7.80 a
(0.35)
9.74 a
(0.36)
7.92 a
(0.33)
6.56 a
(0.43)
8.85 a
(0.44)
8.87 a
(0.39)
10.18 a
(0.40)
3 9.00 a
(0.32)
9.13 a
(0.38)
7.58 a
(0.35)
10.37 a
(0.28)
8.30 a
(0.29)
6.76 a
(0.38)
9.60 ab
(0.40)
9.86 a
(0.36)
11.31 a
(0.30)
4 8.85 a
(0.31)
9.28 a
(0.41)
7.57 a
(0.36)
10.07 a
(0.36)
8.74 a
(0.29)
7.08 a
(0.42)
10.27 b
(0.38)
9.31 a
(0.41)
10.81 a
(0.40)
Means and standard error of means (in parenthesis) are shown.
Numbers in columns with the same letter are not significantly different.
Figure 7.5 : Mean (+/- SEM) sensory panel scores for tenderness of venison from red
stags with BCS 2, 3 or 4. Higher scores indicate more tender meat.
0
1
2
3
4
5
6
7
8
9
10
11
BCS 2 BCS 3 BCS 4
T
e
n
d
e
r
n
e
s
s
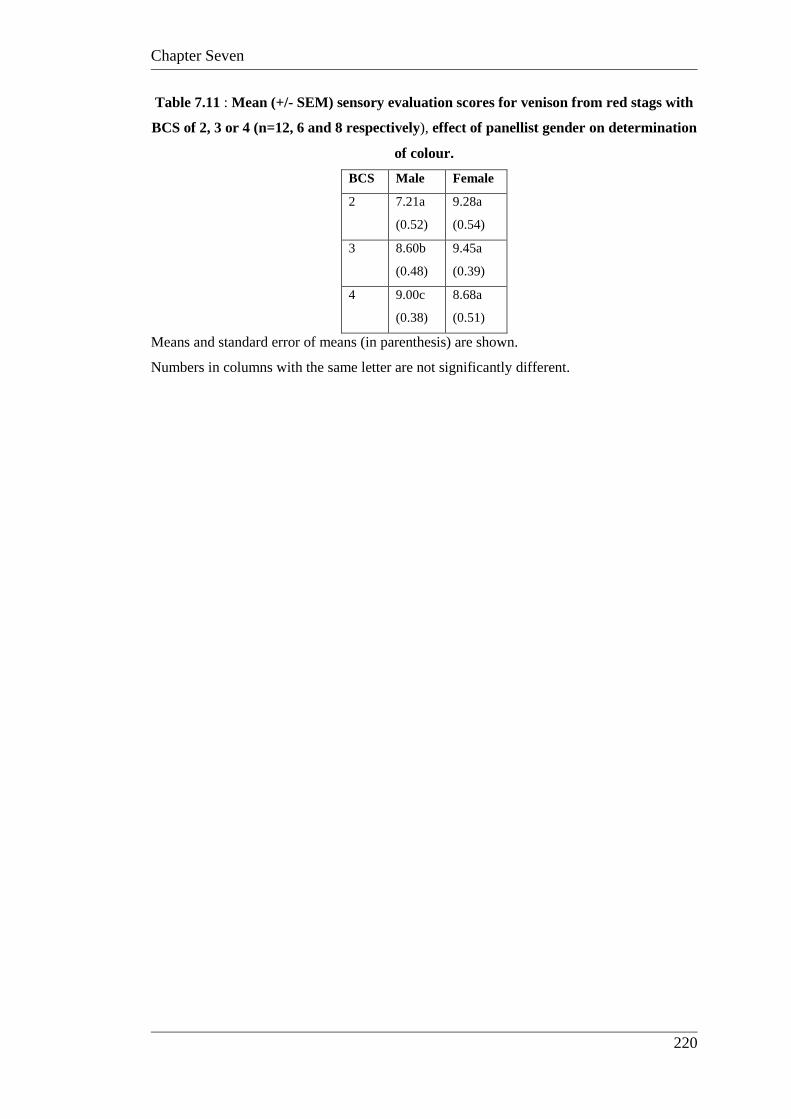
Chapter Seven
220
Table 7.11 : Mean (+/- SEM) sensory evaluation scores for venison from red stags with
BCS of 2, 3 or 4 (n=12, 6 and 8 respectively), effect of panellist gender on determination
of colour.
BCS Male Female
2 7.21a
(0.52)
9.28a
(0.54)
3 8.60b
(0.48)
9.45a
(0.39)
4 9.00c
(0.38)
8.68a
(0.51)
Means and standard error of means (in parenthesis) are shown.
Numbers in columns with the same letter are not significantly different.
Chapter Seven
221
7.3.3.4 Discussion
As for fallow deer, pelvic suspension of red deer carcasses produced venison rump
that was significantly more juicy and tender than the venison from carcasses hung by
the Achilles tendon. The overall liking for venison from carcasses hung by pelvic
suspension was significantly higher, and once again reinforced the data in Chapter 6
on the advantages to the deer industry of employing this technique. Tenderness is
consistently noted by consumers as the most important quality characteristics that
they look for in meat (Risvik, 1994), and the pelvic suspension technique has been
shown in these experiments to be consistently noted by panellists to produce venison
that is more tender and juicy. Venison is generally more tender than beef, and for
some deer species ageing of the meat is not necessary at all (Barnier et al 1999;
Wiklund et al 1997b). This phenomenon has been explained by high activity of
tenderising enzymes in venison (Barnier et al 1999; Farouk et al 2007) compared
with beef. Variation in meat pHu and glycogen content related to nutritional
status/body condition and pre-slaughter stress can give rise to considerable variation
in meat tenderness in species such as beef and lamb (Purchas et al 1999; Watanabe et
al 1996), and similar results have been found for red deer venison. Within the normal
pH range, values around 5.5 have been reported to yield more tender venison than
those in the 5.8-6.0 range (Stevenson-Barry et al 1999). This intermediate pH
venison was tougher than normal pH even after ageing, and more variable in
tenderness (i.e. of less consistent quality) than normal pH (deer) venison. In contrast,
reindeer venison has been found to be extremely tender regardless of meat pH
(Wiklund et al 1997a).
The pHu values measured in venison in the present study were in the range to
guarantee optimal tenderness which was supported by the consumer scores for
tenderness in fallow deer and red deer venison, all averaging values of 8 or above on
the scale from 0 (very tough) to 11 (very tender). This suggested that all venison
evaluated, regardless of species, sex, age, BSC or carcass hanging method, generally
was judged to be very tender, and data are in agreement with previously mentioned
comparisons of venison with beef.
Chapter Seven
222
There was a gradual increase in tenderness of venison as BCS increased from 2 to 4.
However, as seen in the previous section (7.3.1), this result can be obtained by
hanging carcasses differently after slaughter. As occurred in experiments with
fallow deer there were no differences in the range of quality parameters measured
across red deer carcasses ranging from BCS 2 to 4, except for a small increase in
tenderness, and again this is a good result for red deer farmers and wholesalers.
Animals ranging in BCS from 2 to 4 can be slaughtered without apparent effect on
consumer preference, which allows for flexibility in the supply chain. Until now
animals with low BCS (around BCS 2) have been considered to be largely unfit for
the venison market, yet the results obtained in the current study show that consumers
were reasonably happy with the meat. The current study does show a definite trend
by consumers to prefer venison from animals with a BCS of either 3 or 4, compared
with BCS 2, but this trend was not significant. The male panellists detected an
increased darkening of the meat as BCS increased, but this did not affect overall
liking or preference.
Chapter Seven
223
7.4: Conclusions
The hypothesis that changes in BCS would dramatically affect eating quality and
consumer preference has not been proven in these experiments for either species of
deer. The meat quality parameters measured (Chapter 4), however, showed
differences across the BCS range 2 to 4, in increases in tenderness, less redness and
higher levels of IMF, particularly in red deer and fallow deer does with BCS 4
compared with BCS 2 (Chapter 4). This difference is further confirmed by the slight
differentiation between BCS 2-4 by taste panellists, but with no negative
implications for overall liking. It is apparent from data for both red and fallow deer
that there was a trend for greater overall liking of venison from animals with BCS 3
and 4, compared with BCS 2, but this trend was not significantly different. It may be
necessary to slaughter larger numbers of animals to prove beyond doubt that this
trend is measurably significant.
Horsfield and Taylor (1976) concluded that the list of textural attributes can be
reduced to three basic descriptors without loss of information. They are
toughness/tenderness, succulence/juiciness and flavour. In the current study these
variables were shown to be relative to the overall liking of the product. An important
finding in this study was the enhancement of tenderness and juiciness in all carcasses
from red and fallow deer subjected to the pelvic suspension method of hanging
carcasses as they cooled down and entered rigor mortis. The sensory evaluation
scores for overall liking were consistently higher for venison from the carcasses
subjected to pelvic suspension, a further validation of the importance of tenderness
and juiciness as favoured quality attributes of meat by consumers.
The need to adopt the post-slaughter practice of pelvic suspension of deer carcasses
of all ages, sexes and body condition scores is unequivocal if enhanced tenderness of
venison is desirable. The sensory panels in this study validated the objective tests
that indicated increased tenderness and juiciness of venison from carcasses subjected
to pelvic suspension compared with venison from carcasses hung by the Achilles
tendon in all trials where the pelvic suspension technique was employed.
Chapter Seven
224
The technique of pelvic suspension can be easily installed as routine practice in
abattoirs once adopted, by altering the mechanics of how a carcass is added to and
removed from the meat rail into and out of the chiller. Carcasses can be re-hung by
the Achilles tendon for ease of transportation to the meat boning room of wholesale
and retail butchers so that retail cut shape of the meat is maintained, because the
process of tenderstetching carcasses is only effective while the carcass is cooling
down to a deep core temperature of 4-7 oC during the first 12-24 hours post-
slaughter. There are no mechanical reasons preventing the adoption of this valuable
technique to enhance meat quality, though uptake of this technology will require
cultural changes in the abattoir sector to alter traditional work practices. This could
prove difficult given the entrenched work practices in the abattoir sector (Mulley and
Falepau 1999)
Flavour is another key quality attribute evaluated by consumers and in this study
flavour was shown to increase as animals got older, and if they were fed grain prior
to slaughter. The trend for meat flavour to increase as animal age increases has been
shown in a number of studies and in a range of domestic species (Aberle et al 2001),
and is referred to anecdotally in reference to wild-shot deer (Whitehead 1993). The
detection by male panellists of stronger flavours in venison from deer fed grain prior
to slaughter was more surprising, and this finding could be used by the deer industry
to satisfy market preference for stronger flavours, or could be a warning to restrict
the feeding of grain prior to slaughter if stronger flavours are not desirable.
Interestingly, the stronger flavours in grain-fed deer were only detected in the lower
BCS range, and were not detected when BCS was 4. Perhaps higher carcass fat
levels in BCS 4 animals masked the flavour changes.
Venison from bucks vs. does for „overall liking‟ from the sensory testing indicated
consumer preference for venison from does. This is confirmed in a study on roe deer,
where meat from does was more tender than meat from bucks (Daszkiewicz et al
2012). This is useful information for the deer industry, especially with reference to
slaughter of fallow deer, because fallow deer bucks are very aggressive toward each
other during the breeding season and at this time of year carcasses can be bruised and
dehydrated. Venison quality can remain acceptably high by slaughtering cull female
stock during the breeding season.
Chapter Seven
225
Overall this study has shown that venison is a high quality product with meat quality
parameters similar to, or more desirable than, other domestic meats. Sensory
evaluation showed the product to be strongly appreciated by men and women
between the ages of 25 to 55, and differences in „overall liking‟ between red and
fallow deer venison were not detected in this study. The consumer scores for
tenderness in fallow deer and red deer venison in the present study all averaged
values of 8 or above on the scale from 0 (very tough) to 11 (very tender). This
supports the view that all venison evaluated regardless of species, sex age, BCS or
carcass hanging method, generally was judged to be very tender.
Chapter Eight
226
Chapter Eight
Conclusions and Recommendations for
Industry
Chapter 8 Conclusions and Recommendations for Industry ............................. 226
8.1 : Overall Conclusions ..................................................................................... 227
8.2 : Recommendations to Industry ..................................................................... 229
Chapter Eight
227
8.1: Overall Conclusions
This study investigated a range of factors that can impact on meat quality in farmed
deer, and provides, for the first time, an evaluation of these factors by consumers of
venison. The data provide consumer evidence that supports niche marketing
opportunities, which if exploited, can create new areas of business for the Australian
deer industry. In this study deer responded in a manner similar to other domesticated
ruminants in terms of manipulating the factors affecting meat quality, and for most
parameters tested there was close agreement between instrumental and sensory
analyses. Factors tested in this study and described elsewhere for the major meat
species, cattle and sheep (Hoffman and Wiklund 2006), include effect of animal age,
sex, planes of nutrition, pre-slaughter stress, post-slaughter suspension methods and
the effect of grain feeding on the meat quality and composition. Consumer
preference, and overall liking of venison from red and fallow deer, indicated sensory
differences in several key areas. There was a difference for some parameters tested
between the sex and age of consumers. Further, there was a clear preference for
venison from carcasses hung by pelvic suspension post-slaughter, for both species of
deer across all parameters. These findings in particular provide important new
guidance for the marketing of venison in Australia and elsewhere.
Links between live animal body condition, along with pre- and post-slaughter
management with subsequent meat quality and consumer acceptance have not been
investigated previously for venison. In this and previous studies (Mulley and Falepau
1999; Flesch et al 2002) involving the slaughter of large numbers of farmed fallow
deer, it was evident that most fallow deer less than 24 months old presented for
slaughter have BCS between 2 and 3, with a relatively smaller proportion with BCS
between 3 and 4. In red deer, the most common BCS in slaughter animals less than 2
years old also ranged between BCS 2 and 3, with older stags and cull hinds reaching
BCS 4 at certain times of the year (stags) and particularly in the case of hinds that did
not carry or rear a calf the previous year. Younger animals with higher BCS may be
commercially more valuable, particularly in terms of yields, although animals with
BCS ranging between 2 and 4 were shown in this study to produce venison that was
evaluated by consumers as high quality. Hence, the hypothesis that changes in BCS
Chapter Eight
228
would affect eating quality and consumer preference has not been clearly established
for either red or fallow deer. This important finding gives deer farmers greater
flexibility when establishing marketing options. Animals of BCS 2 had good
instrumental tenderness and good overall liking by consumers. Animals with BCS 3
and 4, along with venison from female animals, may be able to provide a premium
product with enhanced tenderness if desired by niche markets.
The most important finding in this study was the enhancement of tenderness and
juiciness in all carcasses from red and fallow deer subjected to the pelvic suspension
method of hanging compared to the Achilles tendon method. This enhancement of
quality assurance provides the deer industry with an opportunity to increase
tenderness and juiciness of BCS 2 and male animals to the levels achieved by does
and animals of higher BCS. As stated previously, the aim of this work was to find
ways to improve quality assurance of venison produced by the Australian deer
industry, and the data for use of pelvic suspension as the preferred method of post-
slaughter carcass management are unequivocal.
This study showed that fallow deer does between BCS 2 and 4 can be slaughtered
with no impact on consumer acceptability of venison. While female deer tended to
produce venison of higher quality in terms of consumer acceptance and instrumental
measures of tenderness, the Australian deer industry needs to retain as many
reproductive age females as possible to increase the size of the national herd.
Processing large numbers of female deer, apart from cull does or hinds, would be
counterproductive to industry growth. The females need to be retained for breeding,
not processed for venison (Shapiro 2010). Techniques such as pelvic suspension are
invaluable to the deer industry because similar meat quality characteristics can be
achieved in young slaughter-aged male deer, compared with females, by using this
technique. This outcome increases the opportunity to slaughter male deer year round,
while maintaining consumer acceptance, and preserving female deer for breeding
stock.
Another important finding of this study was that instrumental meat quality and
consumer preferences were not significantly enhanced by finishing animals on
concentrate feeds prior to slaughter. Although optimal instrumental tenderness was
Chapter Eight
229
achieved in animals of BCS 4, which was achieved through concentrate feeding,
consumers rated all samples to be at the high end of the tenderness scale. Venison
from pasture based systems also exhibited a longer chilled display life. Pasture based
management systems are more economical for deer producers, and venison from deer
finished on pasture pre-slaughter has been evaluated by consumers in this study as
being of equally high quality compared with venison from animals finished on grain.
Overall, this study has shown that venison is a high quality product. Sensory
evaluation showed the product to be strongly appreciated by men and women
between the ages of 25 to 55, and differences in „overall liking‟ between red and
fallow deer venison were not detected.
Consumer perception of venison is a critical issue for the Australian deer industry.
The scientific contribution of this study will assist the venison industry to improve
consistency and quality of their product.
8.2: Recommendations to Industry
As a result of this study a number of key recommendations for the Australian deer
industry have been formulated.
The initial aim of this study was to identify any links between live animal BCS and
instrumental and sensory quality of venison. These links have been made, further
enhancing the use of a common BCS language across all sectors of the deer industry.
Recommendation 1: All animals within the BCS range of 2-4 can be slaughtered to
produce venison that is highly acceptable to consumers. For premium ends of the
market, producers may choose to attain BCS 4 by grain finishing their animals, or
process does in order to achieve increased tenderness.
This study showed that feeding concentrates can improve BCS and HCW in a desired
time frame, and that production of animals in a range of body conditions, with or
Chapter Eight
230
without the use of concentrate feeds, can result in high quality product. The cost
benefit of feeding programs is one to be determined by the producer and processor.
Recommendation 2: Concentrate feeding can be used to produce a premium product
with enhanced tenderness, as a result of increased BCS and a stronger flavour profile.
Pasture feeding produces venison of consistently good quality with longer chilled
display life. The decision to feed concentrates or use a pasture based system is left to
the discretion of the producer and the processors with no real adverse effects on
venison quality.
Recommendation 3: In situations where longer display life is an important
marketing requirement, animals should be finished on high quality pasture prior to
slaughter.
Possibly the most important finding emanating from this work is the need to utilise
the technique of pelvic suspension for deer carcasses. This post-slaughter
management technique was shown to increase tenderness of venison, in all sex and
age groups of animals, significantly so with males of both species.
Recommendation 4: Pelvic suspension should be used for post-slaughter hanging of
deer carcasses until the carcass reaches pHu.
Does, regardless of age, produced venison of increased tenderness and acceptability
for consumers, compared with bucks. Pelvic suspension of carcasses from males
increased tenderness to levels similar to those measured in females. This is a vital
piece of information for an industry that needs to maintain breeding stocks of
females, while producing meat of consistently high quality.
Recommendation 5: Pelvic suspension hanging should be applied to carcasses from
all male deer slaughtered.
Opportunities now exist for the industry to bring about greater consistency of
product, as has occurred in other livestock industries such as beef and sheep. The

Chapter Eight
231
relationship of BCS, instrumental measurements of deer venison quality and sensory
evaluation by consumers has important implications for all sections of the value
chain, especially in smaller industries such as the deer industry where it is critical
that product potential is maximised. This study has produced new information that
can underpin venison as a quality assured product, and is industry ready for adoption.
References
232
References
AACMI. 1994. Deer marketing and production study. Rural Industries Research and Development Corporation, No 91/1, RIRDC, Canberra, ACT.
AACMI. 1998. Australian deer industry manual. Rural Industries Research and
Development Corporation, No 98/8, RIRDC, Canberra, ACT.
Aaslyng, MD, Oksama, M, Olsen, EV, Bejerholm, C, Baltzer, M, Andersen, G, Wender, LPB, Byrne, DV and Gabrielsen, G. 2007. „The impact of sensory quality of pork on consumer preference‟. Meat Science, 76, (1), pp. 61-73.
Abdullah, AY and Qudsieh, RI. 2009. „Effect of slaughter weight and ageing time on
the quality of meat from Awassi ram lambs‟. Meat Science, 82, pp. 309-316. Aberle, ED, Forrest, JC, Gerrard, DE and Mills, EW. 2001. Principles of Meat
Science. 4th edn, Kendall/Hunt Publishing Company, Iowa, USA Adam, AAG, Atta, M. and Ismail, SH. 2010. „Quality and sensory evaluation from
Nilotic male kids fed on two different diets‟. Journal of Animal and Veterinary Advances, 9, (15), pp. 2008-2012.
Adamczewski, JZ, Flood, PF and Gunn, A. 1995. „Body composition of muskoxen
Ovibos moschatus and its estimation from condition index and mass measurements‟, Canadian Journal of Zoology, 73, (11), pp. 2021-2034.
Agga, GE, Udala, U, Regassa, F and Wudie, A. 2011. „Body measurements of bucks
of three goat breeds in Ethiopia and their correlation to breed, age and testicular measurements‟. Small Ruminant Research, 95, (2-3), pp. 133-138.
Ahnstrom, ML, Enfalt, AC, Hansson, I and Lundstrom, K. 2006. „Pelvic suspension
improves quality characteristics in M. Semimembranosus from Swedish dual purpose young bulls‟. Meat Science, 72, (3), pp. 555-559.
Ahnstrom, ML, Hessle, A, Johansson, L, Hunt, MC and Lundstrom, K. 2009.
„Influence of carcass suspension on meat quality of Charolais heifers from two sustainable feeding regimes‟. Animal, 3, (6), pp.906-913.
Aidoo, KE and Haworth, JP. 1995. „Nutritional content of farmed venison‟. Journal
of Human Nutrition and Dietetics, 8, (6), pp.441-446.
Al Ibrahim, RM, Kelly, AK, O‟Grady, L, Gath, VP, McCarney, C and Mulligan, FJ. 2010. „The effect of body condition score at calving and supplementation with Saccharomyces cerevisiae on milk production, metabolic status, and rumen fermentation of dairy cows in early lactation‟. Journal of Dairy Science, 93, (11), pp. 5318-5328.
References
233
AMSA (American Meat Science Association). 1995. Research guidelines for cookery, sensory evaluation and instrumental tenderness measurements of fresh meat. National Livestock and Meat Board, Chicago, Illinois, USA.
Anderson, AE, Medin, DE and Bowden, CD. 1972. „Indices of carcass fat in a
Colorado mule deer population‟. Journal of Wildlife Management, 36, pp. 579-594.
Anderson, JL. 1965. „Annual changes in testis and kidney fat weight of impala
(Aepyceros melampus Lichtenstein), Lammergeyer, 3, pp. 57-59. Anderson, R. 1978. Gold on four feet. R Anderson and Associates, Collingwood,
Victoria. Anderson, J.A. and Henderson, JB. 1961. Himalayan Tahr in New Zealand, New
Zealand Deerstalkers' Assoc. Spec. Bull., 2, 37, pp.69-77. Annison, EF. 1960. „Plasma non-esterified fatty acids in sheep‟. Australian Journal
of Agricultural Research, 11, pp. 58-64. Annison, EF, Gooden, JM, Hough, GM and Mcdowell, GH. 1984. „Physiological
cost of pregnancy and lactation in the ewe‟. In Reproduction in Sheep, DR Lindsay and DT Pearce (eds), Australian Academy of Science, pp. 174-181.
Anon. 1993. „Mobile venison slaughter facility gets EC approval from MAFF‟. Deer
Farming, 40 p. 18.
Anon. 2005. „Make mine venison. Marketing strategy puts deer on the top US tables‟. Strategic Direction, 21, (9), pp. 12-14.
Anon, MC and Calvelo, A. 1980. „Freezing rate effects on the drip loss of frozen
beef‟. Meat Science, 4, pp. 1-14. AOAC. 1990. Official methods of analysis. Association Official Analytical Chemists,
Washington , DC. Apple, JK, Davis JC, Stephenson, J, Hankins, JE, Davis, JR and Beaty, SL. 1999.
„Influence of body condition score on carcass characteristics and sub-primal yield from cull beef cows‟. Journal of Animal Science, 77, 10, pp. 2660-2620.
Archer, J, Asher, G and Ward, J. 2009. „Genetics of temperament in deer‟, In
Proceedings of a Deer Course for Veterinarians, 26, Christchurch, July, pp. 115-117.
Asher, GW. 1986. Studies on the reproduction of farmed fallow deer (Dama dama).
PhD thesis, Lincoln University.
Asher, GW, Archer, JA, Ward, JF, Mackintosh, CG and Littlejohn, RP. 2011. „The effect of prepubertal castration of red deer and wapiti-red deer crossbred stags on growth and carcass production‟. Livestock Science, 137, pp. 196-204.
References
234
Audenaerde, PMF. 1998. „European view on the deer farming industry of the world‟. In Advances in Deer Biology: Proceedings of the 4th International Deer Biology Congress, 30 June - 4th July, Kaposvar, Hungary.
Audige, L, Wilson, PR and Morris, RS. 1998. „A body condition score system and its
use for farmed red deer hinds‟. New Zealand Journal of Agricultural Research, 41, pp. 545-553.
AUS-MEAT. 1995. Product specifications for venison. RIRDC, Canberra, Australia. Azzaro, G, Caccamo, M, Ferguson, JD, Battiato, S, Farinella, GM, Guarnera, GC
Puglisi, G, Petriglieri, R and Licitra, G. 2011. „Objective estimation of body condition score by modelling cow body shape from digital images‟. Journal of Dairy Science, 94, (4), pp. 2126-2137.
Barbosa, LP, Rodrigues, MT, Guimaraes, JD, Maffili, VV, Amorim, LDS and Neto,
AFG. 2009. „Body condition and productive performance of Alpine goats in early lactation‟. Revista Brasileira de Zootecnia, 38, (11), pp. 2137-2413.
Barnett, S. 2007. „Marketing of meat from New Zealand‟. In Proceedings of the Deer
Branch of the New Zealand Veterinary Association, 24, Palmerston North, May, p. 75.
Barnier, VMH, Wiklund, E, van Dijk, A, Smulders, FJM and Malmfors, G. 1999.
„Proteolytic enzyme and inhibitor levels in reindeer (Rangifer tarandus tarandus L) vs. bovine longissimus muscle, as they relate to ageing rate and response‟. Rangifer, 19, pp. 13-18.
Barry, TN and Wilson, PR. 1984. „Venison production from farmed deer‟, Journal of
Agricultural Science, 12, (3), pp. 159-165.
Batcheler, CL and Clarke, CMH. 1970. „Note on kidney weights and the kidney fat index‟. New Zealand Journal of Science, 13, (4), pp. 663-668.
Bayraktaroglu, AG and Kahraman, T. 2011. „Effect of muscle stretching on meat
quality of biceps femoris from beef‟. Meat Science, 88, pp. 580-583. Bear, GD. 1971. „Seasonal trends in fat levels of pronghorns Antilocarpa
americana’, in Colorado‟. Journal of Mammalogy, 52, pp. 583-589. Beaton, A, Spiegel, N, Wynn, P and Thompson, JM. 2001. „Improving the quality of
kangaroo meat‟. Kangaroo Industry Association of Australia Newsletter, 24, pp. [4-8]
Bejerholm, C and Aaslyng, MD. 2004. „The influence of cooking technique and core
temperature on results of a sensory analysis of pork-depending on raw meat quality‟. Food Quality and Preference, 15, (1), pp 19-30.
Belitz, HD and Grosch, W. 2009. „Food Chemistry’. Springer, Berlin.
References
235
Bell, A. 2011. „ Deer progeny test launched‟. Deer Industry New Zealand News, 48, June/July, p. 9.
Bentley, A. 1978. An introduction to deer of Australia. Hawthorn Press, Melbourne. Berg, RT and Butterfield, RM. 1976, New concepts of cattle growth, Sydney
University Press, Sydney. Bertram, HC and Aaslyng, MD. 2007. „Pelvic suspension and fast post-mortem
chilling: effects on technological and sensory quality of pork - a combined NMR and sensory study‟, Meat Science, 76, (3), pp. 524-535.
Bewley, JM, Peacock, AM, Lewis, O, Boyce, RE, Roberts, DJ, Coffey, MP, Kenyon,
SJ and Schutz, MM. 2008. „Potential for estimation of body condition scores in dairy cattle from digital images‟. Journal of Dairy Science, 91, pp.3439-3453.
Bishop, CJ, Watkins, BE, Wolfe, LL, Freddy, DJ and White GC. 2009. „Evaluating
mule deer body condition using serum thyroid hormone concentrations‟. Journal of Wildlife management, 73, (3), pp. 462-467.
Bonacina, MS, Osoria, MTM, Osoria, JCDS, Correa, GF & Hashimoto JH. 2011.
„The influence of sex and finishing system on carcass and meat quality of Texel x Corriedale lambs‟. Revista Brasileira de Zootecnia, 40, pp. 1242-1249.
Botha, SStC, Hoffman, LC and Britz, TJ. 2007. „Physical meat quality characteristics
of hot-deboned ostrich (Struthio camelus var. Domesticus) Muscularis gastrocnemius, pars interna during post-mortem ageing‟. Meat Science, 75, pp. 709-718.
Bouton, PE, Fisher, AL, Harris, PV and Baxter, RI. 1973. „A comparison of the
effects of some post-slaughter treatments on the tenderness of beef‟. Journal of Food Technology, 8, pp. 39-49.
Bouton, PE, Harris, PV and Shorthose, WR. 1971. „Effect of ultimate pH upon the
water-holding capacity and tenderness of mutton‟. Journal of Food Science, 36, pp. 435-439.
Brown, RD, Hellgren, EC, Abbott, M, Ruthven III, DC and Bingham, RL. 1995.
„Effects of dietary energy and protein restriction on nutritional indices of female white tailed deer‟. Journal of Wildlife management, 59, (3), pp. 595-609.
Bullock, KD, Bertrand, JK, Benyshek, LL, Williams, SE and Lust, DG. 1991.
„Comparison of real-time ultrasound and other live measures to carcass measures as predictors of beef cow energy stores‟. Journal of Animal Science, 69, pp. 3908-3916.
References
236
Busato, A, Faissler, D, Kupfer, U and Blum, JW. 2002. „Body condition scores in dairy cows: associations with metabolic and endocrine changes in healthy dairy cows‟. Journal of Veterinary Medicine, Series A: Physiology Pathology Clinical Medicine, 49, (9), pp. 455-460.
Butterfield, RM. 1988. New concepts of sheep growth, Griffin Press Ltd, South
Australia.. Butterfield, RM, Griffiths, DA, Thompson, JM, Zamora, J and James, AM. 1983.
„Changes in body composition relative to weight and maturity in large and small strains of Australian Merino rams 1 Muscle, bone and fat‟. Journal of Animal Production, 36, pp. 29-37.
Campo, MM, Santolaria, P, Sanudo, C, Lepetit, J, Olleta, JL, Panea, B and Alberti, P.
2000. „Assessment of breed type and ageing time effects on beef meat quality using two different texture devices‟. Meat Science, 55, pp. 371-378.
Carlucci, A, Girolami, A, Napolitano, F and Monteleone, E. 1998. „Sensory
evaluation of young goat meat‟. Meat Science, 50, (1), pp. 131-136. Carrilho, MC, Campo, MM, Olleta, JL, Beltran, JA and Lopez, M. 2009. „Effect of
diet, slaughter weight and sex on instrumental and sensory meat characteristics in rabbits‟. Meat Science, 82, pp. 37-43.
Chan-McLeod, AC, White, RG and Russell, DE. 1999. „Comparative body
composition strategies of breeding and nonbreeding female caribou‟. Canadian Journal of Zoology, 77, (12), pp. 1901-1907.
Chapman, N. 1993. „Distribution and biology of fallow deer‟, In Proceedings of the
First World Forum on Fallow Deer Farming, G W Asher (ed.), Mudgee, NSW, Australia, pp. 1-11.
Chardon, J. 2009. „Breeding goals for the deer industry‟. In Proceedings of a Deer
Course for Veterinarians, 26, Christchurch, July, pp. 118-120. Charles, DD. 1974. „A method of estimating carcase components in cattle‟. Research
in Veterinary Science, 16, pp. 89-94. Charley, H and Weaver, C. 1997. Foods: A Scientific Approach’. 3rd edn, Merrill
Publishing Company, Upper Saddle River, N.J. Combes, S, Gonzalez, I, Dejean, S, Baccini, A, Jehl, N, Juin, H, Cauquil, L,
Gabinaud, B, Lebas, F and Larzul, C. 2008. „Relationships between sensory and physicochemical measurements in meat of rabbit from three different breeding systems using canonical correlation analysis‟. Meat Science, 80, (3), pp. 835-841.
Cook, RC, Cook, JG and Mech, LD. 2004. „Nutritional condition of northern
Yellowstone elk‟. Journal of Mammalogy, 85, (4), pp. 714-722.
References
237
Cook, RC, Cook, JG, Murray, DL, Zager, P, Johnson, BK and Gratson, MW. 2001. „Nutritional condition models for elk: which are the most sensitive, accurate and precise?‟. Journal of Wildlife Management, 65, (4), pp. 988-997.
Cook, RC, Cook, JG, Stephenson, TR, Myers, WL, McCorquodale, SM, Vales, DJ,
Irwin, LL, Hall, PB, Spencer, RD, Murphie, SL, Schoenecker, KA and Miller, PJ. 2010. „Revisions of rump fat and body condition scoring indices for deer, elk and moose‟. Journal of Wildlife Management, 74, (4), pp. 880-896.
Correale, KK, Savell, JW, Griffin, DB, Acuff, GR and Vanderzant, C. 1986.
„Microbiological and sensory characteristics of beef loin steaks: role of subcutaneous fat‟. Meat Science, 18, (4), pp. 241-253.
Couturier, S, Cote, SD, Huot, J and Otto, RD. 2009. „Body condition dynamics in a
northern ungulate gaining fat in winter‟. Canadian Journal of Zoology, 87, (5), pp. 367-378.
Cox, RJ, Watson, GK, McRae, TB and Cunial, CM. 2006. „An industry endorsed
strategic plan for the Australian venison industry‟. AFBM Journal, 3, (2), pp.14-22.
Cozzi, G, Brscic, M, da Ronch, F, Boukha, A, Tenti, S and Gottardo, F. 2009.
„Comparison of two feeding finishing treatments on production and quality of organic beef‟. Italian Journal of Animal Science, 9, (4), pp. 404-409.
Craigie, CR, Lambe, NR, Richardson, RI, Haresign, W, Maltin, CA, Rehfeldt, C,
Roehe, R, Morris, ST and Bunger L. 2012. „The effect of sex on some carcass and meat quality traits in Texel ewe and ram lambs‟. Animal Production Science, 52, pp. 601-607.
Dahlan, I. 2009. „Characteristics and cutability of farmed Rusa deer (Cervus
timorensis) carcasses for marketing of venison‟. Asian-Australasian Journal of Animal Science, 22, (5), pp. 740-746.
Dahlan, I. and Norfarizan Hanoon, NA. 2008. „Chemical composition, palatability
and physical characteristics of venison from farmed deer‟. Animal Science Journal, 79, (4), pp. 498-503.
Dannenberger, D, Nuernberg, K, Nuernberg, G and Ender, K. 2006. „Carcass and
meat quality of pasture vs. concentrate fed German Simmental and German Holstein bulls‟. Archiv fur Tierzucht, 49, (4), pp. 315-328.
Daszkiewicz, T, Janiszewski, P and Wajda, S. 2009. „Quality characteristics of meat
from wild red deer (Cervus elaphus L.) hinds and stags‟. Journal of Muscle Foods, 20, pp. 428-448.
Daszkiewicz, T, Kubiak, D, Winarski, M and Koba-Kowalczyk, M. 2012. „The effect
of gender on the quality of roe deer (Capreolus capreolus L.) meat‟. Small Ruminant Research, 103, (2-3), pp. 169-175.
References
238
Daszkiewicz, T, Wajda, S and Kondratowicz, J. 2005. „Physico-chemical and sensory properties of meat from black and white and black and white x Limousine heifers differing in intramuscular fat content‟. Animal Science Papers and Reports, 23, (3), pp. 181-187.
Daszkiewicz, T, Wajda, S, Kubiak, D and Krasowska, J. 2009. „Quality of meat from
young bulls in relation to its ultimate pH value‟. Animal Science Papers and Reports, 27, (4), pp. 293-302.
Dauphine, TC Jr. 1975. „Kidney weight fluctuations affecting the kidney fat index in
caribou‟. Journal of Wildlife Management, 39, (2), pp. 379-386. Dawood, AA. 1995. „Physical and sensory characteristics of Nadji - camel meat‟.
Meat Science, 39, (1), pp. 59-69. Dawson, F. 2011. „Supply issues hamper market growth for venison processors‟.
Food Manufacture, March issue, p 5.
Delgiudice, GD, Sampson, BA, Lenarz, MS, Schrage, MW and Edwards, AJ. 2011. „Winter body condition of moose (Alces alces) in a declining population in northeastern Minnesota‟. Journal of Wildlife Disease, 47, (1), pp. 30-40.
Depperschmidt, JD, Torbit, SC, Alldredge, AW and Deblinger, RD. 1987. „Body
condition indices for starved pronghorns‟. Journal of Wildlife Management, 51, (3), pp. 675-678.
De Smet, S. 2011. „Editorial. 57th International Congress of Meat Science and
Technology-ICoMST 2011‟. Meat Science, 89, p. 243 Destefanis, G, Brugiapaglia, A, Barge, MT and Dal Molin, E. 2008. „Relationship
between beef consumer tenderness perception and Warner-Bratzler shear force‟. Meat Science, 78, (3), pp. 153-156.
Destefanis, G, Brugiapaglia, A, Barge, MT and Lazzaroni, C. 2003. „Effect of
castration on meat quality in Pietmontese cattle‟. Meat Science, 64, pp. 215-218.
Devine, CE. 2001. „International significance of Australian research on beef quality -
a view from the periphery‟. Australian Journal of Experimental Agriculture, 41, (7), pp. 1089-1098.
Dewhurst, RJ, Davies, DWR and Fisher, WJ. 2010. „Effects of forage NDF content
and body condition score on forage intake by Holstein-Friesian dairy cows in the dry period‟. Animal, 4, (1), pp. 76-80.
Diaz, MT, Caneque, V, Lauzurica, S, Velasco, S, Ruiz de Huidobro, F and Perez, C.
2004. „Prediction of suckling lamb carcass composition from objective and subjective carcass measurements‟. Meat Science, 66, (4), pp. 895-902.
References
239
Diaz, MT, Velasco, S, Caneque, V, Lauzurica, S, Ruiz de Huidobro, F, Perez, C, Gonzalez, J and Manzanares, C. 2002. „Use of concentrate or pasture for fattening lambs and its effect on carcass and meat quality‟. Small Ruminant Research, 43, (3), pp. 257-268.
DINZ (Deer Industry New Zealand). 2011. Venison market report‟. Deer Industry
New Zealand News, 48, June/July, p. 36. Diverio, S, Federici, C, Angelucci, G, Pelliccia, C, Vegni, F, Beghelli, V. 1998.
„Stress response in fallow deer Dama dama: effect of preslaughter management‟. In: Advances in Deer Biology, Proceedings of the 4th International Deer Biology Congress, Editor Z Zomborszky, Kaposvar, Hungary, pp. 319-321.
Diversified Animal Management. 1997. Good news for meat producers! Canadian
Elk and Deer Farmer, Early Summer, p. 108. Dixon, RM, Playford and Coates, DB. 2011. „Nutrition of beef breeder cows in the
dry tropics. 1. Effects of nitrogen supplementation and weaning on breeder performance‟. Animal Production Science, 51, (6), pp. 515-528.
Dransfield, E. 1994. „Optimization of tenderisation, ageing and tenderness‟, Meat
Science, 36, pp. 105-121. Dransfield, E, Nute, GR, Hogg BW and Walters, BR. 1990. „Carcass and eating
quality of ram, castrated ram and ewe lambs‟. Animal Production, 50, pp. 291-299.
Dransfield, E, Nute, GR, Mottram, DS, Rowan, TG and Lawrence, TLJ. 1985. „Pork
quality from pigs fed on low glucosinate rapeseed meal: influence of level in the diet, sex and ultimate pH‟. Journal of the Science of Food and Agriculture, 36, (7), pp. 546-556.
Dransfield, E and Rhodes, DN. 1976. „Effect of post rigor muscle length on the
texture of meat‟. Journal of the Science of Food and Agriculture, 27, (5), pp. 483-486.
Drew, KR. 1985. „Meat production from farmed deer‟. Biology of Deer Production,
22, pp. 285-290. Drew, KR, Crosbie, SF, Forss, DA, Manley, TR and Pearse, AJ. 1988. „Electrical
stimulation and ageing of carcasses from red, fallow and New Zealand Wapiti-type male deer‟. Journal of Science Food and Agriculture, 43, pp. 245-259.
Drew, KR, Fennessy, PF and Greer, GJ. 1978. „The growth and carcass
characteristics of entire and castrate red stags‟. In: Proceedings of the New Zealand Society of Animal Production, 38, pp. 142-144.
References
240
Drew, KR and Seman, DL. 1987. „The nutrient content of venison‟. In: Proceedings of the Nutrition Society of New Zealand, 12, pp. 49-55.
Drew, KR and Stevenson, JM. 1992. „Venison processing, packaging and storage‟.
In: Proceedings of a Deer Course for Veterinarians, Deer Branch, NZVA, 9, pp. 10-12.
Dugdale, AHA, Curtis, GC, Harris, PA and Argo, CM. 2011. „Assessment of body
fat in the pony: Part 1. Relationships between the anatomical distribution of adipose tissue, body composition and body condition‟. Equine Veterinary Journal, 43, (5), pp. 552-561.
Dunne, PG, Monahan, FJ and Moloney, AP. 2011. „Current perspectives on the
darker beef often reported from extensively-managed cattle: does physical activity play a significant role?‟. Livestock Science, 142, pp. 1-22.
Dunshea, FR, Suster, D, Eason, PJ, Warner, RD, Hopkins, DL and Ponnampalam,
EN. 2007. „Accuracy of dual energy X-ray absorptiometry, weight, longissimus lumborum muscle depth and GR fat depth to predict half carcass composition in sheep‟. Australian Journal of Experimental Agriculture, 47, (10), pp. 855-859.
Duranti, E, Casoli, C, Coli, R, Cardinali, A and DFonnini, D. 1994. „Fallow deer
meat. Productive, qualitative and nutritional characteristics‟. Annali della Facolta’ di Agraria Universita’ degli Studi-Perugia, 48, pp. 75-98.
Edmonson, AJ, Lean, IJ, Weaver, LD, Farver, T and Webster, G. 1989. „A body
condition scoring chart for holstein dairy cows‟. Journal of Dairy Science, 72, pp. 68-78.
Egan, AF, Ferguson, DM and Thompson, JM. 2001. „Consumer sensory
requirements for beef and their implications for the Australian beef industry‟. Australian Journal of Experimental Agriculture, 41, pp. 855-859.
Eikelenboom, G, Barnier, VMH, Hoving-Bolink, AH, Smulders, FJM and Culioli, J.
1998. „Effect of pelvic suspension and cooking temperature on the tenderness of electrically stimulated and aged beef, assessed with shear and compression tests‟. Meat Science, 49, (1), pp. 89-99.
Ekiz, B, Yilmaz, A, Ozcan, M and Kocak, O. 2012. „Effect of production system on
carcass measurements and meat quality of Kivircik lambs‟. Meat Science, 90, pp. 465-471.
Elsley, FWH, McDonald, I and Fowler, VR. 1964. „The effect of plane of nutrition
on the carcasses of pigs and lambs when variations in fat content are excluded‟. Animal Production, 6, pp. 141-154.
References
241
Esmailizadeh, AK, Dayani, O and Mokhtari, MS. 2009. „Lambing season and fertility of fat tailed ewes under an extensive production system are associated with liveweight and body condition around mating‟. Animal Production Science, 49, (12), pp. 1086-1092.
Evans, DG. 1978. „The interpretation and analysis of subjective body condition
scores‟. Animal Production, 26, pp. 119-125. Falepau, DF. 1999. „Factors associated with the occurrence of ecchymosis blood
splash in fallow deer (Dama dama)’. Thesis, University of Western Sydney, Penrith.
Farouk, MM, Beggan, M, Hurst, S, Stuart, A, Dobbie, P and Bekhit, AED. 2007.
„Meat quality attributes of chilled venison and beef‟. Journal of Food Quality 30, pp. 1023-1039.
Faulkner, DB, Parrett, DF, McKeith, FK and Berger, LL. 1990. „Prediction of fat
cover and carcass composition from live and carcass measurements‟. Journal of Animal Science, 68, pp. 604-610.
FEDFA (Federation of European Deer Farming Association). 2010. „Minutes of the
spring meeting‟, Brussels, March 20-21, 2010. Ferguson, DM, Bruce, HL, Thompson, JM, Egan, AF, Perry, D and Shorthose, WR.
2001. „Factors affecting beef palatability - farmgate to chilled carcass. Australian Journal of Experimental Agriculture, 41, pp. 879-891.
Ferguson, DM and Warner, RD. 2008. „Have we underestimated the impact of pre
slaughter stress on meat quality in ruminants?‟. Meat Science, 80, pp.12-19. Fernandez-Lopez, J, Perez-Alvarez, JA and Randa-Catala, V. 2000. „Effect of
mincing degree on colour properties in pork meat‟. Colour Research and Application, 25, (5), pp. 376-380.
Ferrell, CL and Jenkins, TG. 1984. „Relationships among various body components
of mature cows‟. Journal of Animal Science, 58, pp. 222-227. Field, RA. 1971. „Effect of castration on meat quality and quantity‟. Journal of
Animal Science, 32, pp. 849-858. Finger, SE, Brisbin, IL and Smith, MH. 1981. „Kidney fat as a predictor of body
condition in white-tailed deer‟. Journal of Wildlife Management, 45, (4), pp. 964-968.
Fisher, AV, Bayntun, JA and Enser, M. 1998. „Carcass and meat quality
characteristics: venison in a competitive market‟. In Proceedings of the 2nd World Deer Farming Congress, pp. 211-218.
Fisher, AV, Nute, GR, Fursey, GA and Cook, G. 1994. „Post mortem manipulation
of beef quality‟. Meat Focus International, 3, pp.62-65.
References
242
Flesch, JS. 2001. Nutritional Requirements of Pregnant and Lactating Fallow Deer (Dama dama). PhD thesis, University of Western Sydney, Penrith.
Flesch, JS, Mulley, RC and Asher, GW. 2002. „Development of a body condition
scoring system for farmed fallow deer (Dama dama)’. In 5th International Deer Biology Congress, 25-30 August 2002, Quebec City, Canada, pp. 20-26.
Fletcher, D. 1998. „The First New Domesticant for 5000 years?‟ In RIRDC Report on
the Second World Deer Farming Congress, Limerick, Ireland, p 8. Fletcher, J. 2004. „Deer veterinary issues in the United Kingdom and Europe‟ In
Proceedings of the 1st World Deer Veterinary Congress, 21, Queenstown, February, pp. 5-7.
Fletcher, S, Buetre, B and Morey, K. 2009. The value of the red meat industry to
Australia. Abare Research Report, 09.13, Department of Agriculture, Fisheries and Forestry. Canberra.
Fletcher, TJ. 2001. „Farmed deer: New domestic animals defined by controlled
breeding‟. Reproduction, Fertility and Development, 13, pp. 511-516. Flook, DR. 1967. The apparent unequal sex ratio of wapiti. PhD thesis, University of
Alberta. Florek, M and Litwinczuk, Z. 2002. „The quality of meat from carcasses of young
bulls and heifers classified according to the EUROP system‟. Animal Science Papers and Reports, 20, Suppl. 1, pp. 69-178.
Flux, JEC. 1971. „Validity of the kidney fat index for estimating the condition of
hares: a discussion‟. New Zealand Journal of Science, 14, (2), pp. 238-244. Font i Furnols, M, Realini, CE, Guerrero, L, Oliver, MA, Sanudo, C, Campo, MM,
Nute, GR, Caneque, V, Alvarez, A, San Julian, R, Luzardo, S, Brito, G and Montossi, F. 2009. „Acceptability of lamb fed on pasture, concentrate or combinations of both systems by European consumers‟. Meat Science, 81, pp. 196-202.
Font i Furnols, M, San Julian, R, Guerrero, L, Sanudo, C, Campo, MM, Olleta, JL,
Oliver, MA, Caneque, V, Alvarez, I, Diaz, MT, Branscheid, W, Wicke, M, Nute, GR and Montossi, F. 2006. „Acceptability of lamb meat from different producing systems and ageing time to German, Spanish and British consumers‟. Meat Science, 72, pp. 545-554.
Franco, D, Rodriguez, E, Purrinos, L, Crecente, S, Bermudez, R, and Lorenzo, JM.
2011. „Meat quality of “Galician Mountain” foals breed. Effect of sex, slaughter age and livestock production system‟. Meat Science, 88, pp. 292-298.
References
243
French, P, O‟Riordan, EG, Monahan, FJ, Caffrey, PJ, Mooney, MT, Troy, DJ and Moloney, AP. 2001. „The eating quality of meat of steers fed grass and/or concentrates‟. Meat Science, 57, (4), pp. 379-386.
Freudenreich, P nad Fischer, K. 1989. „Untersuchungen zur Fleischqualitatet von
Damtieren [Studies on the venison quality of fallow deer]‟. Mitteilungsblatt der Bundesanstalt fuer Fleischforschung Kulmbach, 104, pp. 176-183.
Gaden, R, Duddy, G and Irwin, J. 2005. Identifying live animal condition scoring
systems for the Australian livestock export industry’. Meat and Livestock Australia, North Sydney
Gaidet, N and Gaillard, JM. 2008. „Density dependant body condition and
recruitment in a tropical ungulate‟. Canadian Journal of Zoology, 86, (1), pp. 24-32.
Garnsworthy, PC and Jones, GP. 1987. „The influence of body condition at calving
and dietary protein supply on voluntary feed intake and performance in dairy cows‟. Animal Production, 44, pp. 347-353.
Garnsworthy, PC and Topps, JH. 1982. „The effect of body condition of dairy cows
at calving on their food intake and performance when given complete diets‟. Animal Production, 35, pp 113-119.
GenStat Committee. 2002. GenStat for Windows. 6th edn, VSN International, Oxford. Gerhart, KL, White, RG, Cameron, RD and Russell, DE. 1996. „Body composition
and nutrient reserves of Arctic caribou‟. Canadian Journal of Zoology, 74, (1), pp. 136-146.
Glimp, HA, Ringkob, TP, Bruce LB, Lawler, WC and Butler, RF. 1998. „Influence
of cull ewe body condition on carcass composition‟. Sheep and Goat Research Journal, 14, 3, pp. 180-184.
Goetsch, AL, Merkel, RC and Gipson, TA. 2011. „Factors affecting goat meat
production and quality‟. Small Ruminant Research, 101, pp. 173-181. Greenwood, PL, Finn, JA, May, TJ and Nicholls, PJ. 2008. „Preslaughter
management practices influence carcass characteristics of young goats‟. Australian Journal of Experimental Agriculture, 48, (7), pp. 910-915.
Greer, KR. 1968. „A compression method indicates fat content of elk wapiti femur
marrows‟. Journal of Wildlife Management, 32, pp. 747-751. Gregory, NG and Robins, JK. 1998. „A body condition scoring system for layer
hens‟. New Zealand Journal of Agricultural Research, 41, pp. 555-559. Gregory, NG, Robins, JK, Thomas, DG and Purchas, RW. 1998. „Relationship
between body condition score and body composition in dairy cows‟. New Zealand Journal of Agricultural Research, 41, pp. 527-532.
References
244
Gresham, JD, Holloway, JW, Butts, WT and McCurley, JR. 1986. „Prediction of mature cow carcass composition from live animal measurements‟. Journal of Animal Science, 63, pp. 1041-1048.
Griffiths, RE, Moffat, IW and O‟Connor, MJ. 2009. „Five year industry strategic
intents for New Zealand venison and velvet‟. In Proceedings of a Deer Course for Veterinarians, 26, Christchurch, July, pp. 1-4.
Grunert, KG, Bredahl, L and Brunso, K. 2004. „Consumer perception of meat quality
and implications for product development in the meat sector - a review‟. Meat Science, 66, pp. 259-272.
Hammond, J. 1932. Growth and development of mutton qualities in sheep. Oliver
and Boyd, London. Hannula, T and Puolanne, E. 2004. „The effect of cooling rate on beef tenderness: the
significance of pH at 7ºC‟. Meat Science, 67, (3), pp. 403-408. Hansen, AT. 2000. A study of reproductive performance and pre weaning mortality
in farmed red deer in Australia’. MVSC thesis, University of Sydney.
Hansen, AT. 2004. „Deer farming in Australia‟. In: Proceedings of the 1st World Deer Veterinary Congress, 21, Queenstown, February, pp. 15-17.
Hansen, S, Therkildsen, M and Byrne, DV. 2006. „Effects of compensatory growth
strategy on sensory and physical properties of meat from young bulls‟. Meat Science, 74, (2), pp. 628-643.
Hansen, T. 2011. Personal Communication. Mandagery Creek Venison, Orange,
NSW.
Harris, D. 1945. „Symptoms of malnutrition in deer‟. Journal of Wildlife Management’, 9, pp. 319-322.
Henneke, DR. 1985. „A condition score system for horses‟. Equine Practice, 7, pp.
13-15. Herrera, GI, Lopez, JRA, Burgoa, AA and Gonzalez-Bulnes, A. 2010. „Effect of
body condition and season of the year on oestrous cycle, oestrous, follicular development and ovulation rate in Pelibuey ewes under tropical conditions‟. Veterinaria Mexico, 41, (3), pp. 167-175.
Herrera-Mendez, CH, Becila, S, Boudjellal and Ouali, A. 2006. „Meat ageing:
reconsideration of the current concept‟. Trends in Food Science and Technology, 17, pp. 394-405.
Hessle, A, Nadeau, E and Johnsson, S. 2007. „Finishing of dairy steers having grazed
semi-natural grasslands‟. Livestock Science, 106, (1), pp. 19-27.
References
245
Hickey, G. 2011. „Firstlight to harness power of EID in integrated value chain‟. Deer Industry New Zealand News, 48, June/July, pp. 18-19.
Hildrum, KI, Rodbotten, R, Hoy, M, Berg, J, Narum, B and Wold JP. 2009.
„Classification of different bovine muscles according to sensory characteristics and Warner Bratzler shear force‟. Meat Science, 83, pp. 302-307.
Hinks, CE and Prescott, JHD. 1974. „A note on the prediction of carcass composition
in beef cattle‟. Animal Production, 19, pp. 115-117. Hocquette, JF, Renand, G, Leveziel, H, Picard, B, Cassar-Malek, I. 2006. „The
potential benefits of genetics and genomics to improve beef quality‟. Animal Science Papers and Reports, 24, (3), pp. 173-189.
Hoffman, LC. 2000. „Meat quality attributes of night cropped impala (Aepyceros
melampus). South African Journal of Animal Science, 30, pp. 133-137. Hoffman, LC, Kroucamp, M and Manley, M. 2007. „Meat quality characteristics of
springbok Antidorcas marsupialis. 4: Sensory meat evaluation as influenced by age, gender and production region‟. Meat Science, 78, (4), pp. 774-778.
Hoffman, LC and Laubscher, LL. 2010. „A comparison between the effects of day
and night cropping on gemsbok (Oryx gazella) meat quality‟. Meat Science, 85, pp. 356-362.
Hoffman, LC, Mostert, AC, Kidd, M and Laubscher, LL. 2009. „Meat quality of
kudu (Tragelaphus strepsiceros) and impala (Aepyceros melampus): carcass yield, physical quality and chemical composition of kudu and impala Longissimus dorsi muscle as affected by gender and age‟. Meat Science, 83, pp. 788-795.
Hoffman, LC, Mostert, AC and Laubscher, LL. 2009. „Meat quality of kudu
(Tragelaphus strepsiceros) and impala (Aepyceros melampus): the effect of gender and age on the fatty acid profile, cholesterol content and sensory characteristics of kudu and impala meat‟. Meat Science, 83, pp. 737-743.
Hoffman, LC, Muller, M, Cloete, SWP and Brand, M. 2008a. „Physical and sensory
meat quality of South African black ostriches Struthio camelus var domesticus, Zimbabwean blue ostriches Struthio camelus australis and their hybrid‟. Meat Science, 79, (20), pp. 365-374.
Hoffman, LC, Muller, M, Cloete, SWP and Schmidt, D. 2003. „Comparison of six
crossbred lamb types: sensory, physical and nutritional meat quality characteristics‟. Meat Science, 65, (4), pp. 1265-1274.
Hoffman, LC, van Schalkwyk, S and Muller, NM. 2008b. Physical and chemical
composition of male and female mountain reedbuck (Redunca fulvorufula) meat. South African Journal of Wildlife Research, 38, pp. 11-16.
References
246
Hoffman, LC and Wiklund, E. 2006. „Game and venison - meat for the modern consumer‟. Meat Science, 74, pp. 197-208.
Hogg, BW, Catchside, LM and Mercer, GJK. 1990. „Carcass composition in male
fallow deer (Dama dama): age and castration effects of dissected tissue distribution‟. Animal Production, 51, pp. 405-413.
Hogg, BW, Mortimer, BJ and Mercer, GJK. 1993. „The influence of the
Mesopotamian genotype on carcass quality and composition of fallow deer bucks‟. In Proceedings of the 1st World Forum on Fallow Deer Farming, Edit G W Asher, Ruakura Agricultural Centre, Hamilton, New Zealand, pp 191-196.
Honikel, KO. 1998. „‟Reference methods for the assessment of physical
characteristics of meat‟. Meat Science, 49, (4), pp. 447-457. Hood, D E and Tarrant, P V. 1981. „The problem of dark-cutting in beef’. Martinus
Nijhoff, Den Haag, The Netherlands. Hooper, S. 2010a. Australian lamb. Financial performance of slaughter lamb
producing farms, 2007-08 to 2009-10. May,, ABARE, Canberra. Hooper, S. 2010b. Australian beef. Financial performance of beef cattle producing
farms, 2007-08 to 2009-10. June, ABARE, Canberra. Hopkins, DL. 2008. „An industry applicable model for predicting lean meat yield in
lamb carcasses‟. Australian Journal of Experimental Agriculture, 48, (7), pp. 757-761.
Hopkins, DL. 2011. „Processing technology changes in the Australian sheep meat
industry: an overview‟. Animal Production Science, 51, pp. 399-405. Hopkins, DL. 2010. „Technology supporting the development of a product - the case
of Australian sheep meat. In Proceedings of the 14th AAAP animal science congress’, plenary 12, Pingtung, Taiwan, pp. 315-323.
Hopkins, DL, Anderson, MA, Morgan, JE and Hall, DG. 1995a. „A probe to measure
GR in lamb carcasses at chain speed‟. Meat Science, 39, 2, pp. 159-165. Hopkins, DL, Hall, DG and Luff, AF. 1996. „Lamb carcass characteristics: 3.
Describing changes in carcasses of growing lambs using real-time ultrasound and the use of these measurements for estimating the yield of saleable meat‟. Australian Journal of Experimental Agriculture, 36, (1), pp. 37-43.
Hopkins, DL, Hegarty, RS, Walker, PJ and Pethick, DW. 2006. „Relationship
between animal age, intra muscular fat, cooking loss, pH, shear force and eating quality of aged meat from sheep‟. Australian Journal of Experimental Agriculture, 46, (6-7), pp. 879-884.
References
247
Hopkins, DL, Littlefield, PJ and Thompson, JM. 2000. „The effect on tenderness of super tenderstretching‟. Asian-Australasian Journal of Animal Sciences, 13, Suppl. C, p. 240.
Hopkins, DL, Safari, E, Thompson, JM and Smith CR. 2004. „Video image analysis
in the Australian meat industry - precision and accuracy of predicting lean meat yield in lamb carcasses‟. Meat Science, 67, pp. 269-274.
Hopkins, DL, Stanley, DF, Martin, LC, Toohey, ES and Gilmour, AR. 2007.
„Genotype and age effects on sheep meat production. 3. Meat quality‟. Australian Journal of Experimental Agriculture, 47, (10), pp. 1155-1164.
Hopkins, DL, Stanley, DF and Ponnampalam, EN. 2007. „Relationship between real-
time ultrasound and carcass measures and composition in heavy sheep‟. Australian Journal of Experimental Agriculture, 47, (11), pp. 1304-1308.
Hopkins, DL, Walker, PJ, Thompson, JM and Pethick, DW. 2005. „Effect of sheep
type on meat and eating quality of sheep meat‟. Australian Journal of Experimental Agriculture, 45, (5), pp. 499-507.
Hopkins, DL, Wootton, SA, Gamble, DJ and Atkinson, WR. 1995b. „Lamb carcass
characteristics. 2. Estimation of the percentage of saleable cuts for carcasses prepared as trim and traditional cuts using carcass weight, fat depth, eye muscle area, sex and conformation score‟. Australian Journal of Experimental Agriculture, 35, pp. 161-169.
Horsfield, S, and Taylor LJ. 1976. „Exploring the relationship between sensory data
and acceptability of meat‟. Journal of the Science of Food and Agriculture, 27, pp. 1044-1056.
Horsley, P. 2004. „Secure markets before delving into deer‟. Farming Ahead, 146,
pp. 42-57. Hostetler, R L, Landmann, W A, Link, B A and Fitzhugh Jr, H A. 1970. „Influence
on carcass position during rigor mortis on tenderness of beef muscles: comparison of two treatments‟. Journal of Animal Science, 31, pp. 47-50.
Houghton, PL, Lemenager, RP, Moss, GE and Hendrix, KS. 1990. „Prediction of
postpartum beef cow body composition using weight to height ratio and visual body condition score‟. Journal of Animal Science, 68, p. 1248.
Hoving-Bolink, AH, Hanekamp, WJA and Walstra, P. 1999. „Effects of diet on
carcass, meat and eating quality of once-bred Pietmontese x Friesen heifers‟. Livestock Production Science, 57, pp. 267-272.
Huff-Lonergan, E and Lonergan, SM. 2005. „Mechanisms of water holding capacity
of meat: the role of post mortem biochemical and structural changes‟. Meat Science, 71, pp. 194-204.
References
248
Huff-Lonergan, E, Zhang, W and Lonergan, SM. 2010. „Biochemistry of post-mortem muscle - Lessons on mechanisms of meat tenderization‟. Meat Science, 86, pp.184-195.
Hunt, HM. 1979. „Comparison of dry-weight methods for estimating elk femur
marrow fat‟. Journal of Wildlife Management, 43, (2), pp. 560-562. Hunter, RA, Burrow, HM and McCrabb, GJ. 2001. „Sustained growth promotion,
carcass and meat quality of steers slaughtered at three live weights‟. Australian Journal of Experimental Agriculture, 41, pp. 1033-1040.
Husband, PM and Johnson, BY. 1985. „Beef tenderness: the influence of animal age
and post-mortem treatment‟. CSIRO Food Research Quarterly, 45, (1), pp. 1-4.
Hutchison, CL, Mulley, RC, Wiklund, E and Flesch, JS. 2010. „Consumer evaluation
of venison sensory quality: effects of sex, body condition score and carcase suspension method‟. Meat Science, 86, pp. 311-316.
Hwang, IH. 2006. „Post slaughter intervention techniques to ensure tenderness of
beef muscles for Korean consumers‟. Journal of Animal Science and Technology, 48, (6), pp. 921-932.
Hwang, IH, Gee, A, Polkinghorne, R and Thompson JM. 2002. „The effect of
different pelvic hanging techniques on meat quality in beef‟. In Proceedings of 48th International Congress of Meat Science and Technology, Rome, 25-30 August, pp. 220-221.
Hwang, IH, Polkinghorne, R, Lee JM and Thompson JM. 2008. „Demographic and
design effects on beef sensory scores given by Korean and Australian consumers‟. Australian Journal of Experimental Agriculture, 48, pp. 1387-1395.
International Organization for Standardization. 2007. Sensory analysis; general
guidance for the designing of test rooms. Geneva. ISO 8589:2007 International Organization for Standardization. 1993. Sensory analysis; general
guidance for the selection, training and monitoring of assessors Part I: selected assessors; Part II experts, Geneva. ISO 8586:1993
International Organization for Standardization. 1996. Meat and Meat products;
determination of free fat content, Geneva. ISO 4401.5:1996 Irurueta, M, Cadoppi, A, Langman, L, Grigioni, G and Carduza, F. 2008. „Effect of
ageing on the characteristics of meat from water buffalo grown in the Delta del Parana region of Argentina‟. Meat Science, 79, pp. 529-533.
Issanchou, S. 1996. „Consumer expectations and perceptions of meat and meat
product quality‟. Meat Science, 43, Suppl., pp. S5-S19.
References
249
Janes, R. 1993. „International Marketing of New Zealand‟s Farmed Venison‟. In : Proceedings of the First World Deer Congress, Christchurch, New Zealand, pp. 237-241.
Jansen, J, Bech Andersen, B, Busk, H, Lagerweij, GW and Oldenbroek, JK. 1985.
„In vivo estimation of the body composition in young bulls for slaughter I The repeatability and reproducibility of a scoring system, an ultrasonic scanning technique and body measurements‟. Livestock Production Science, 12, pp. 221-230.
Jefferies, BC. 1961. „Body condition scoring and its use in management‟. Tasmanian
Journal of Agriculture, 32, pp. 19-21. Jelenikova, J, Pipek, P and Staruch, L. 2008. „The influence of ante mortem
treatment on relationship between pH and tenderness of beef‟. Meat Science, 80, pp. 870-874.
Johansen, J, Aastveit, AH, Egelandsdal, B, Kvaal, K and Roe, M. 2006. „Validation
of the EUROP system for lamb classification in Norway; repeatability and accuracy of visual assessment and prediction of lamb carcass composition‟. Meat Science, 74, (3), pp.497-504.
Johns, PE, Smith, MH and Chesser, RK. 1984. „Annual cycles of the kidney fat
index in a south eastern white-tailed deer herd‟. Journal of Wildlife Management, 45, (1), pp. 172-186.
Johnson, ER, Pryor, WJ and Butterfield, RM. 1972. „Studies of fat distribution in the
bovine carcass. II Relationship of the intramuscular fat to the quantitative analysis of the skeletal musculature‟. Australian Journal of Agricultural Research, 24, pp. 287-296.
Jopson, NB, Behrent, M and McEwan, JC. 2005. New marketing initiatives in New
Zealand; payment schemes on predicted cut weights. In: Proceedings of the International Skjervold symposium: ‘Lamb Innovation - breeding for high quality lamb carcasses, Hamar, Norway 2-3 June.
Jopson, NB, Thompson, JN and Fennessy, PF. 1997. „Tissue mobilization rates in
male fallow deer Dama dama as determined by computed tomography - the effects of natural and enforced food restriction‟. Journal of Animal Science, 65, pp. 311-320.
Joubert, S. 2004. „Australian deer welfare‟. In: Proceedings of the 1st World Deer
Veterinary Congress, 21, Queenstown, February, pp. 144-146. Juarez, M, Horcada, A, Alcalde, MJ, Valera, M, Polvillo, O and Molina, A. 2009.
„Meat and fat quality of unweaned lambs as affected by slaughter weight and breed‟. Meat Science, 83, pp. 308-313.
References
250
Kannan,G, Gadiyaram, KM, Galipalli, S, Carmichael, A, Kouakou, B, Pringle, TD, McMillin, KW and Gelaye, S. 2006. „Meat quality in goats as influenced by dietary protein and energy levels, and post-mortem ageing‟. Small Ruminant Research, 61, pp. 45-52.
Kay, RNB, Sharman, GAM, Hamilton, WJ, Goodall, ED, Peenie, K and Coutts,
AGP. 1981. „Carcass characteristics of young red deer farmed on hill pasture‟. Journal of Agricultural Science, , 96, pp. 79-87.
Kenyon, PR, Morel, PCH and Morris, ST. 2004. „The effect of individual liveweight
and condition scores of ewes at mating on reproductive and scanning performance‟. New Zealand Veterinary Journal, 52, (5), pp. 230-235.
Kenyon, PR, Morris, ST, Stafford, KJ and West, DM. 2011. „Effect of ewe body
condition and nutrition in late pregnancy on the performance of triplet bearing ewes and their progeny‟. Animal Production Science, 51, (6), pp. 557-564.
Kerth, CR, Braden, KW, Cox, R Kerth, LK and Rankins Jr, DL. 2007. „Carcass,
sensory, fat color, and consumer acceptance characteristics of Angus-cross steers finished on ryegrass Lolium multiflorum forage or on a high-concentrate diet‟. Meat Science, 75, (2), pp. 324-331.
Kie, JG, White, M and Drawe, DL. 1983. „Condition parameters of white-tailed deer
in Texas‟. Journal of Wildlife Management, 47, (3), pp. 583-594. Kim, BK, Hwang, EG and Kim, SM. 2010. „Meat quality and sensory properties of
Korean native black goat by different castration age‟. Korean Journal for Food Science of Animal Resources, 30, (3), pp. 419-426.
Kim, HW, Lee, ES, Choi, YS, Choi, JH, Han DJ, Kim, HY, Song, DH, Choi, SG and
Kim, CJ. 2011. „Effects of aging period prior to freezing on meat quality of Hanwoo muscle (Longissimus dorsi)‟. Korean Journal for Food Science of Animal Resources, 31, (6), pp. 799-806.
Kirton, AH, Mercer, GJK, Duganzich, DM and Uljee, AE. 1995. „Use of electronic
probes for classifying lamb carcasses‟. Meat Science, 39, (2), pp. 167-176. Kistner, TP, Trainer, CE and Hartmann, NA. 1980. „A field technique for evaluating
physical condition of deer‟. Wildlife Society Bulletin, 8, pp. 11-17. Klosterman, EW, Sanford, LG and Parker, CF. 1968. „Effects of cow size and
condition and ration protein content upon maintenance requirements of mature beef cows‟. Journal of Animal Science, 27,pp. 242-248.
Kochanowska-Maturszewska, A. 2004. Quality of carcasses and meat from wild and
farm Cervidae. PhD thesis, University of Warmia and Mazury. Koohmaraie, M. 1996. „Biochemical factors regulating the toughening and
tenderisation processes of meat‟. Meat Science, 43, pp. 193-201.
References
251
Koohmaraie, M, Doumit, ME and Wheeler, TL. 1996. „Meat toughening does not occur when rigor shortening is prevented‟. Journal of Animal Science, 74, pp. 2935-2942.
Lagerstedt, A, Enfalt, L, Johansson, L and Lundstrom, K. 2008. „Effect of freezing
on sensory quality, shear force and water loss in beef M. Longissimus dorsi’, Meat Science, 80, (2), pp. 457-461.
Lambe, NR, Navajas, EA, Bunger, L, Fisher, AV, Roehe, R and Simm, G. 2009.
„Prediction of lamb carcass composition and meat quality using combinations of post mortem measurements‟. Meat Science, 81, pp. 711-719.
Lambe, NR, Navajas, EA, Schofield, CP, Fisher, AV, Simm, G, Roehe, R and
Bunger, L. 2008. „The use of various live animal measurements to predict carcass and meat quality in two divergent lamb breeds‟. Meat Science, 80, pp. 1138-1149.
Lanari, MC, Brewster, M, Yang, A. and Tume, RK. 2002. „Pasture and grain
finishing affect the colour stability of beef‟. Journal of Food Science, 67, (7), pp. 2467-2473.
Laster, MA, Smith, RD, Nicholson, KL, Nicholson, JDW, Miller, RK, Griffin, DB,
Harris, KB and Savell, JW. 2008. „Dry versus wet ageing of beef: retail cutting, yields and consumers sensory attribute evaluations of steaks from ribeyes, strip loins and top sirloins from two quality grade groups‟. Meat Science, 80, pp. 795-804.
Lawrie, RA and Ledward, DA. 2006. Lawrie’s Meat Science. 7th edn. CRC Press
:Woodhead Publishing, Boca Raton, Fla : Cambridge, England. Ledger, HP and Hutchison, HG. 1962. „The value of the tenth rib as a sample joint
for the estimation of lean, fat and bone in carcasses of East African Zebu cattle‟. Journal of Agricultural Science, 58, pp. 81-88.
Lee, JM, Kim, TW, Kim, JH, Cho, SH, Seong, PN, Jung, MO, Cho , YM, Park, BY,
& Kim, DH. 2009. „Comparison of chemical, physical and sensory traits of longissimus lumborum Hanwoo beef and Australian Wagyu beef‟. Korean Journal for Food Science of Animal Resources, 29, pp. 91-98.
Leygonie, C, Britz, TJ and Hoffman, LC. 2012. „Impact of freezing and thawing on
the quality of meat: review‟. Meat Science, 91, pp. 93-98. Lloveras, MR, Goenaga, PR, Irurueta, M, Carduza, F, Grigioni, G, Garcia, PT and
Mendola, A. 2008. „Meat quality traits of commercial hybrid pigs in Argentina‟. Meat Science, 79, pp. 458-462.
Lowman, BG, Scott, NA and Somerville, SH. 1972. „Condition Scoring of Cattle’.
Rev edn, Edinburgh School of Agriculture, Edinburgh
References
252
Loza, MJ. 2001. „Sensitive issues for the deer industry‟. In Proceedings of a deer course for veterinarians, 18, Palmerston North, May, pp.73-78.
Loza, MJ. 2003. „Reflections and visions in the deer industry‟. In Proceedings of the
New Zealand Society of Animal Production, 63, Queenstown, June 25-27, pp.212-217.
Lundesjö, M, Lundstrom, K and Hansson, I. 2001. „Effect of pelvic suspension in
beef on yield, shear force and sarcomere length of valuable cuts with emphasis on M. Semimembranosus‟. In Proceedings of 47th International Congress of Meat Science and Technology, Krakow, Poland.
Lundesjö Ahnström, M, Enfält, L, Johansson, J, Virhammar, K, Hansson, I,
Johansson, L and Lundström, K. 2003. „Effect of pelvic suspension on sensory and instrumental evaluation on four beef muscles in heifers and young bulls‟. In Proceedings 49th International Congress of Meat Science and Technology, Sao Paolo, Brazil, pp 161-162.
Lundesjö Ahnström, M, Hansson, I, Wiklund, E and Lundström, K. 2005. „Shear
force and sarcomere length of five pelvic suspended muscles from different bovine genders‟, In Proceedings 51st International Congress of Meat Science and Technology, Baltimore, USA, p. 20.
Lundesjö Ahnström, M, Hunt, MC and Lundström, K. 2012. „Effects of pelvic
suspension of beef carcasses on quality and physical traits of five muscles from four gender-age groups‟. Meat Science, 90, pp. 528-535.
Madruga, MS, Torres, TS, Carvalho, FF, Queiroga, RC, Narain, N, Garrutti, D,
Souza Neto, MA, Mattos, CW and Costa, RG. 2008. „Meat quality of Moxotó and Canindé goats as affected by two levels of feeding‟. Meat Science, 80, (4), pp. 1019-1023.
MAF, Ministry of Agriculture and Forestry. 2011. Situation and Outlook for New
Zealand Agriculture and Forestry (SONZAF) for 2011. MAF, Wellington. Maher, SC, Mullen, AM, Keane, MG, Buckley, DJ, Kerry, JP and Moloney, AP.
2004. „Decreasing variation in the eating quality of beef through homogenous pre and post slaughter management‟. Meat Science, 67, pp. 33-43.
Marino, R, Albenzio, M, Girolami, A, Muscio, A, Sevi, A and Braghieri, A. 2006.
„Effect of forage to concentrate ratio on growth performance, and on carcass and meat quality of Podolian young bulls‟. Meat Science, 72, pp. 415-424.
Markusfeld, O, Galon, N and Ezra, E. 1997. „Body condition score, health, yield and
fertility in dairy cows‟. Veterinary Record, 141, pp. 67-72. Martinez-Cerezo, S, Sanudo, C, Olleta, JL, Medel, I, Panea, B, Macie, S and Sierra,
I. 2002. „Breed, weight and ageing effects on meat lamb tenderness assessed by consumers‟. In Proceedings 48th International Congress of Meat Science and Technology, Rome, Italy.
References
253
Matousek, V, Kernerova, N, Machal, L and Vaclavovsky, J. 2011. „The fat cover in gilts in relation to body condition and reproduction‟. Acta Universitatis Agriculturae et Silviculturae Mendelianae Brunensis, 59, (1), pp. 163-172.
Maurya, VP, Kumar, S, Kumar, D, Gulyani, R, Joshi, A, Naqvi, SMK, Arora, AL
and Singh, VK. 2009. „Effect of body condition score on reproductive performance of Chokla ewes‟. Indian Journal of Animal Sciences, 79, (11), pp.1136-1138.
Maurya, VP, Sejian, V, Kumar, D, and Naqvi, SMK. 2010. „Effect of induced body
condition score differences on sexual behaviour, scrotal measurements, semen attributes and endocrine responses in Malpura rams under hot semi-arid environment‟. Journal of Animal Physiology and Animal Nutrition, 94, (6), pp. e308-e317.
May, T, Greenwood, P and Finn, J. 1995. Fat scoring goats. Agfact A7110, 1st edn,
New South Wales Department of Agriculture, Sydney McCaughey, WP and Cliplef, RL. 1996. „Carcass and organoleptic characteristics of
meat from steers grazed on alfalfa/grass pastures and finished on grain‟. Canadian Journal of Animal Science, 76, (1), pp. 149-152.
McCrae, SE, Seccombe, CG, Marsh, BB and Carse, WA. 1971. „Studies in meat
tenderness. The tenderness of various lamb muscles in relation to the skeletal restraint and delay before freezing‟. Journal of Food Science, 36, pp. 566-567.
McGee, H. 2004. ‘On food and cooking: the science and lore of the kitchen’. Hodder
and Stoughton, London, UK McGregor, BA. 2010. „Influence of stocking rate and mixed grazing of Angora goats
and merino sheep on animal and pasture production in southern Australia. 2. Liveweight, body condition score, carcass yield and mortality‟. Animal Production Science, 50, (2), pp. 149-157.
McKendry, B. 1993. „Venison Quality Assurance‟. In Proceedings of the First World
Deer Congress, Christchurch, New Zealand, pp. 225-226. McKinnon, M. 2011. Personal Communication. Deer Industry Association of
Australia. McRae, TB, Cox, RJ and Watson, GK. 2006. „A situational analysis of the Australian
venison industry‟. AFBM Journal, 3, (1), pp.5-10.
Medel, I, Sanudo, C, Martinez, S, Panea, B, Roncales,P and Beltran, JA. 2002. „Quality of vacuum packaged lamb meat after different ageing times‟. In Proceedings of 48th International Congress of Meat Science and Technology, Rome, Italy, pp. 346-347.
References
254
Meilgaard, MC, Civille, GV and Carr, B. 2007. Sensory evaluation techniques. 4th edn. Taylor and Francis, Boca Raton.
Mendizabal, JA, Delfa, R, Arana, A and Purroy, A. 2011. „Body condition score and
fat mobilization as management tools for goats on native pastures‟. Small Ruminant Research, 98, (1-3), pp. 121-127.
Millspaugh, JJ and Brundige, GC. 1996. „Estimating elk weight from chest girth‟.
Wildlife Society Bulletin, 24, (1), pp. 58-61. Minchin, W, Buckley, F, Kenny, DA, Monahan, FJ, Shalloo, L and O‟Donovan, M.
2009. „Effect of grass silage and concentrate based feeding strategies on cull dairy cow performance, carcass and meat quality characteristics‟. Meat Science, 81, pp. 93-101.
Mitchell, B, McCowan, D and Nicholson, IA. 1976. „Annual cycles of bodyweight
and condition in Scottish red deer‟. Journal of Zoology, 180, pp. 107-127. Mitchell, T. 1986. Condition scoring goats. Agfact A723, 2nd edn, New South
Wales Department of Agriculture, MLA (Meat and Livestock Australia). 2000. Meat Standards Australia information
kit, Meat and Livestock Australia, North Sydney. Mlynek, K, Elminowska-Wenda, G and Gulinski, P. 2006. „The relationship between
microstructure of Longissimus lumborum muscle and carcass quality of bulls slaughtered at three ages‟. Animal Science Papers and Reports, 24, (1), pp. 57-63.
Moffat, D. 2005. A domestic marketing positioning strategy for Australian venison.
Rural Industries Research and Development Corporation, ACT.
Moffat, IW. 2011. „Venison enjoying period of stability‟. Deer Industry New Zealand News, 48, June/July, p. 15.
Mojita, J, Slamecka, J, Hell, P and Zaujec, K. 2007. „Influence of killing methods on
the quality of fallow deer meat. Comparison of the physical - technological quality of fallow deer meat from managed preserves with different killing methods. Fleischwirtschaft, 87, (10), pp. 118-120.
Moloney, AP, Keane, MG, Dunne, PG, Mooney, MT and Troy, DJ. 2008. „Effect
of concentrate feeding pattern in a grass silage/concentrate beef finishing system on performance, selected carcass and meat quality characteristics‟. Meat Science, 79, (2), pp. 355-364.
Moloney, AP, Mooney, MT, Troy, DJ and Keane, MG. 2011. „Finishing cattle at
pasture at 30 months of age or indoors at 25 months of age: effects on selected carcass and meat quality characteristics‟. Livestock Science, 141, pp.17-23.
References
255
Monson, F, Sanudo, C and Sierra, I. 2005. Influence of breed and ageing time on the sensory meat quality and consumer acceptability in intensively reared beef‟. Meat Science, 71, pp.471-479.
Moore, VJ and Young, OA. 1991. „The effect of electrical stimulation, thawing,
ageing and packaging on the colour and display life of lamb chops‟. Meat Science, 30, pp. 131-145.
Moriarty, AJ. 2004. Ecology and environmental impact of Javan rusa deer (Cervus
timorensis russa) in the Royal National Park, PhD thesis, University of Western Sydney, Penrith.
MSA (Meat Standards Australia). 2001. How to do it, Beef CRC, Armidale, NSW. MSA (Meat Standards Australia). 2010. Meat Standards Australia. Viewed October,
2010<http://www.mla.com.au/TopicHierarchy/IndustryPrograms/MeatStandardsAustralia/Default.htm>.
MTU 1999. „A critical control point approach to beef eating quality‟. Meat
Technology Update, 1/99, Tingalpa, Qld, Australia. MTU 2004. „Tenderstretch‟. Meat Technology Update, 1/04 February, Tingalpa, Qld,
Australia. MTU 2005. „Marbling and quality of beef‟. Meat Technology Update, 3/05 June,
Tingalpa, Qld, Australia. MTU 2006a. „Colour defects in meat: Part 1 Browning of fresh meat‟. Meat
Technology Update, 5/06 October, Tingalpa, Qld, Australia. MTU 2006b. „Effect of freezing on shear force and sensory quality of beef‟. Meat
Technology Update, 6/06 December, Tingalpa, Qld, Australia. MTU 2010. „Dry Ageing of beef‟. Meat Technology Update, 2/10 April, Tingalpa,
Qld, Australia. Muela, E, Sanudo, C, Campo, MM, Medel, I and Beltran, JA. 2012. „Effect of
freezing method and frozen storage duration on lamb sensory quality‟. Meat Science, 90, pp. 209-215.
Muir, PD, Deaker, JM and Bown, MD. 1998. „Effects of forage- and grain-based
feeding systems on beef quality: a review‟. New Zealand Journal of Agricultural Research, 41, (4), pp. 623-635.
Mulley, RC. 1989. Reproduction and performance of farmed fallow deer, PhD thesis,
University of Sydney, Sydney. Mulley, RC. 1993. „Venison Production from farmed fallow deer‟. In Proceedings of
the First World Forum on Fallow Deer Farming, G W Asher (ed.), Mudgee, NSW, Australia, pp. 183-189.
References
256
Mulley, RC. 2011. Personal communication: Rural Industries Research and Development Corporation, Deer Industry committee member.
Mulley, RC and English, AW. 1985. „The effects of castration of fallow deer (Dama
dama) on body growth and venison production‟. Animal Production, 41, pp. 359-361.
Mulley, RC, English, AW Thompson, JM, Butterfield, RM and Martin, P. 1996.
„Growth and body composition of entire and castrated fallow bucks Dama dama treated with zeranol‟, Animal Production, 63,(1), pp. 159-165.
Mulley, RC and Falepau, DF. 1999. Identification of factors associated with
ecchymosis blood splash in deer, Canprint, ACT, Australia p. 206. Mulley, RC, Falepau, DF, Flesch, JS and Wiklund, E. 2010. „Rate of blood loss and
timing of exsanguination on prevalence of ecchymosis in fallow deer (Dama dama)’. Meat Science, 85, (1), pp. 21-25.
Mulley, RC and Flesch, JS. 2001. Nutritional requirements for pregnant and
lactating red and fallow deer. Canprint, ACT, Australia p. 136. Munoz, AM. 1998. „Consumer perceptions of meat, understanding these results
through descriptive analysis‟. Meat Science, 49, Supp. 1, pp. S287-S295. Murthy TRK and Devadason, IP. 2003. „Buffalo meat and meat products - an
overview‟. In Proceedings of the Fourth Asian Buffalo Congress on Buffalo for Food, Security and Employment, 25-28 February 2003, New Delhi, India, Asian Buffalo Association, New Delhi, pp. 193-199.
Mushi, DE, Elk, LO, Thomassen, MS, Serheim, O and Adney, T. 2008. „Suitability
of Norwegian short-tail lambs, Norwegian dairy goats and cashmere goats for meat production - carcass, meat, chemical and sensory characteristics‟. Meat Science, 80, (3), pp. 842-850.
National Food Administration. 1998. „Regulations regarding slaughter, meat
inspection and handling of reindeer meat’. SLVFS 1998:17 H 197 in Swedish.
Neath, KE, Del Barrio, AN, Lapitan, RM, Herrera, JRV, Cruz, LC, Fujihara, T,
Muroya, S, Chikuni, K, Hirabayashi, M and Kanai, Y. 2007. „Difference in tenderness and pH decline between water buffalo meat and beef during post-mortem ageing‟. Meat Science, 75, pp. 499-505.
Nelsen, TC, Short, RE, Reynolds, WL and Urick, JJ. 1985. „Palpated and visually
assigned condition scores compared with weight, height and heart girth in Hereford and crossbred cows‟. Journal of Animal Science, 60, pp. 363-366.
NHMRC (National Health and Medical Research Council). 2003. „Dietary guidelines
for Australian adults’. NHMRC, Canberra, ACT..
References
257
Nicholson, MJ and Sayers, AR. 1987. „Repeatability, reproducibility and sequential use of condition scoring of Bos indicus cattle‟. Tropical Animal Health and Production, 19, pp. 127-135.
O‟Connor, MJ. 2006. „Current deer industry issues‟, Proceedings of a Deer Course
for Veterinarians. Deer Branch, New Zealand Veterinary Association, 23, May, Wellington, NZ, pp. 26-28.
Oddy, VH, Harper, GS, Greenwood, PL and McDonagh, MB. 2001. „Nutritional and
developmental effects on the intrinsic properties of muscles as they relate to the eating quality of beef‟. Australian Journal of Experimental Agriculture, 41, pp. 921-942.
Offer, G and Knight, P. 1988. The structural basis of water holding in meat. Part II:
drip losses. In R.Lawrie, Developments in Meat Science, pp. 63-243. O‟Halloran, JM, Ferguson, DM, Perry, D and Egan, AF. 1998. „Mechanism of
tenderness improvement in tenderstretched beef carcasses‟. In Proceedings of the 44th International Congress of Meat Science and Technology, Barcelona, Spain, pp. 712-713.
Okeudo, NJ and Moss, BW. 2005. „Interrelationships amongst carcass and eat quality
characteristics of sheep‟. Meat Science, 69, (1), pp. 1-8.
Park, BY, Hwang, IH, Cho, SH, Yoo, YM, Kim, JH, Lee, JM, Polkinghorne, R and Thompson JM. 2008. „Effect of carcass suspension and cooking method on the palatability of three beef muscles as assessed by Korean and Australian consumers‟. Australian Journal of Experimental Agriculture, 48, pp 1396-1404.
Patterson, HD and Thompson, R. 1971. „Recovery of inter-block information when
block sizes are unequal‟. Biometrika, 58, pp. 545-554. Pearce, KL, Rosenvold, K, Andersen, HJ and Hopkins, DL. 2011. „Water distribution
and mobility in meat during the conversion of muscle to meat and ageing and the impacts on fresh meat quality attributes - a review‟. Meat Science, 89, pp. 111-124.
Pearse, AJ, Drew, KR and Whaanga, AJ. 1994. „Advances in New Zealand farm
management to enhance deer production to fulfil international market demands‟. In: Proceedings of the 3rd International Congress on the Biology of Deer, Edinburgh, UK, p. 350.
Pearse, AJ and Fung, LE. 2008. „The deer industry‟s productivity strategy: concepts
and development‟. In Proceedings of a Deer Course for Veterinarians, 25, Christchurch, July, pp. 1-5.
Penfield, MP and Campbell, AM. 1990. Experimental food science. Academic Press,
San Diego.
References
258
Perezbarberia, FJ, Mutuberria, G and Nores, C. 1998. „Reproductive parameters, kidney fat index and grazing activity relationships between the sexes in Cantabrian chamois Rupicapra pyrenaica parva’. Acta Theriologica, 43,(3), pp. 311-324.
Perlo, F, Bonato, P, Teira, G, Tisocco, O, Vicentin, J, Pueyo, J and Mansilla, A.
2008. „Meat quality of lambs produced in the Mesopotamia region of Argentina finished on different diets‟. Meat Science, 79, (3), pp. 576-581.
Perry, D, Shorthose, WR, Ferguson, DM, and Thompson, JM. 2001a. „Methods used
in the CRC program for the determination of carcass yield and beef quality‟. Australian Journal of Experimental Agriculture, 41, pp. 953-957.
Perry, D, Thompson, JM, Hwang, IH, Butchers, A and Egan, AF. 2001b.
„Relationship between objective measurements and taste panel assessment of beef quality‟. Australian Journal of Experimental Agriculture, 41, pp. 981-989.
Perry, P, 2010. „Livestock: Beef and veal‟. Australian Commodities, 17, (3), pp. 502-
508. Perry, TC and Fox, DG. 1996. „Predicting carcass composition and individual feed
requirement in live cattle widely varying in body size‟. Journal of Animal Science, 75, pp. 300-307.
Pethick, DW, Ball, AJ, Banks, RG and Hocquette, JF. 2011. „Current and future
issues facing red meat quality in a competitive market and how to manage continuous improvement‟. Animal Production Science, 51, pp. 13-18.
Pethick, DW, Banks, RG, Hales, J and Ross, IR. 2006. „Australian prime lamb - a
vision for 2020‟. International Journal of Sheep and Wool Science, 54, (1), pp. 66-73.
Pethick, DW, Baud, S, Walker, P, Thompson, JM, Hopkins, DL and Skerritt, J. 2002.
„Defining and quantifying some on-farm factors influencing sheepmeat eating quality‟. Wool Technology and Sheep Breeding, 50, (4), pp. 608-614.
Pethick, DW, Davidson, R, Hopkins, DL, Jacob, RH, D‟Souza, DN, Thompson, JM
and Walker, PJ. 2005a. „The effect of dietary treatment on meat quality and on consumer perception of sheep meat eating quality‟. Australian Journal of Experimental Agriculture, 45, pp. 517-524.
Pethick, DW, Hopkins, DL, D‟Souza, DN, Thompson JM and Walker, PJ. 2005b.
„Effects of animal age on the eating quality of sheep meat‟. Australian Journal of Experimental Agriculture, 45, (5), pp. 491-498.
Pflanzer, SB and de Felicio, PE. 2009. „Effects of teeth maturity and fatness of
Nellore (Bos indicus) steer carcasses on instrumental and sensory tenderness‟. Meat Science, 83, pp. 697-701.
References
259
Phillip, EL, Oresanya, TF and St. Jacques, J. 2007. „Fatty acid profile, carcass traits and growth rate of red deer fed diets varying in the ratio of concentrate: dried and pelleted roughage, and raised for venison production‟. Small Ruminant Research, 71, pp. 215-221.
Phythian, CJ, Hghes, D, Michalopoulou, Cripps, PJ and Duncan, JS. 2012.
„Reliability of body condition scoring of sheep for cross-farm assessments‟. Small Ruminant Research, 104, (1), pp.156-162.
Piasecke, JR and Bender, LC. 2009. „Relationships between nutritional condition of
adult females and relative carrying capacity for rocky mountain elk‟. Rangeland Ecology and Management, 62, (2), pp. 145-152.
Piasentier, E, Bovolenta, S and Viliani, M. 2005. „Wild ungulate farming systems
and product quality‟. Veterinary Research Communications, 29, (Suppl. 2), pp. 65-70.
Pinheiro, RSB and de Souza, HBA. 2011. „Methods of discard ewe carcass
suspension and the quality of meat‟. Ciencia e Tecnologia de Alimentos, 31, (1), pp. 221-224.
Pinto, F, Tarricone, S, Marsico, G, Forcelli, MG, Celi, R and Rasulo, A. 2009.
„Nutritional quality of meats from young fallow deer (Dama dama) of different ages‟. Progress in Nutrition, 11, (1), pp. 57-67.
Pleasants, AB, Thompson, JM, and Pethick, DW. 2005. „A model relating a function
of tenderness, juiciness, flavour and overall liking to the eating quality of sheep meat‟. Australian Journal of Experimental Agriculture, 45, pp. 483-489.
Polak, T, Rajar, A, Gasperlin, L and Zlender, B. 2008. „Cholesterol concentration
and fatty acid profile of red deer (Cervus elaphus) meat‟. Meat Science, 80, pp. 864-869.
Polkinghorne, RJ. 2006. „Implementing a palatability assured critical control point
(PACCP) approach to satisfy consumer demands‟ Meat Science, 74, (1), pp. 180-187.
Polkinghorne, RJ and Thompson, JM. 2010. „Meat standards and grading. A world
view‟. Meat Science, 86, pp. 227-235. Polkinghorne, RJ, Thompson JM, Watson, R, Gee, A and Porter M. 2008a.
„Evolution of the Meat Standards Australia (MSA) beef grading system‟. Australian Journal of Experimental Agriculture, 48, pp. 1351-1359.
Polkinghorne, RJ, Watson, R, Thompson, JM and Pethick DW. 2008b. „Current
usage and future development of the Meat Standards Australia (MSA) grading system‟. Australian Journal of Experimental Agriculture, 48, pp. 1459-1464.
References
260
Pollard, JC, Littlejohn, RP, Asher, GW, Pearse, AJT, Stevenson-Barry, JM and Manley, TR. 2000. „Physiological quantification of pre-slaughter handling stress in red deer‟. In Proceedings of a Deer Course for Veterinarians, Deer Branch, NZVA, 17, pp. 123-129.
Pollard, JC, Littlejohn, RP, Scobie, DR, Pearse, AJ and Stevenson-Barry, JM. 2003.
„Maintaining product quality from the farm gate to the processing facility‟. In Proceedings of the New Zealand Society of Animal Production, 63, Queenstown, June 25-27, pp. 237-242.
Pollard JC, Pearse AJT, Webster JR, Drew KR, Asher GW, Stevens DR, Stevenson-
Barry JM, Mackintosh CG, Matthews LR, Fisher AD, Fisher MW, Stafford KJ, Wilson PR, Tacon JR, and Scott I. 2002. Review of Deer Welfare. Confidential Report to DeerResearch, New Zealand.
Pollard, JC, Stevenson-Barry, JM, Littlejohn, RP. 1999. „Factors affecting behaviour,
bruising and pHu in a deer slaughter premises‟. In Proceedings of the New Zealand Society of Animal Production, 59, pp.148-151.
Pollott, GE and Kilkenny, JB. 1976. „A note on the use of condition scoring in
commercial sheep flocks‟. Animal Production, 23, pp. 261-264. Ponnampalam, EN, Hopkins, DL, Butler, KL, Dunshea, FR and Warner, RD. 2007.
„Genotype and age effects on sheep meat production. 2. Carcass quality traits‟. Australian Journal of Experimental Agriculture, 47, (10), pp. 1147-1154.
Ponnampalam, EN, Trout, GR, Sinclair, AJ, Egan AR and Leury, BJ. 2001.
„Comparison of the colour stability and lipid oxidative stability of fresh and vacuum packaged lamb muscle containing elevated omega 3 and omega 6 fatty acid levels from dietary manipulation‟. Meat Science, 58, 151-161.
Pordomingo, AJ, Grigioni, G, Carduza, F and Volpi Lagreca, G. 2012. „Effect of
feeding treatment during the backgrounding phase of beef production from pasture on: I. Animal performance, carcass and meat quality‟. Meat Science, 90, pp. 939-946.
Poste, LM, Mackie, DA, Butler, G and Larmond, E. 1991. Laboratory methods for
sensory analysis of food, Research Branch Agriculture Canada, Publication 1864/E, Canada Communication Group, Ottawa, Canada.
Priolo, A, Micol, D, Agabriel, J, Prache, S and Dransfield, E. 2002. „Effect of grass
or concentrate feeding systems on lamb carcass and meat quality, Meat Science, 62, (2), pp. 179-185.
Purchas, RW and Aungsupakorn, R. 1993. „Further investigations into the
relationship between ultimate pH and tenderness for beef samples from bulls and steers‟. Meat Science, 34, (2), pp. 163-178.
References
261
Purchas, RW, Triumf, EC and Egelandsdal, B. 2010. „Quality characteristics and composition of the longissimus muscle in the short loin from male and female farmed red deer in New Zealand‟. Meat Science, 86, pp. 505-510.
Purchas, RW, Yan, X and Hartley, DG. 1999. „The influence of a period of ageing on
the relationship between ultimate pH and shear force values of beef M. longissimus thoracis’. Meat Science, 51, pp. 135-141.
Purchas, RW and Zou, M. 2008. „Composition and quality differences between the
longissimus and infraspinatus muscles for several groups of pasture-finished cattle‟. Meat Science, 80, pp. 470-479.
Purslow, PP. 2005. „Intramuscular connective tissue and its role in meat quality‟.
Meat Science, 70, (3), pp. 435-447. Quinn-Walsh, EC, Johnson, DL, Chardon, J and Spelman, RJ. 2010. „Deer
improvement‟s breeding programme for venison production in red deer (Cervus elaphus)’.In Proceedings of the New Zealand Society of Animal Production, 70, Massey University, 23-25 June, pp. 275-277.
Radder, L and le Roux, R. 2005. „Factors effecting food choice in relation to
venison: a South African example‟. Meat Science, 71, pp. 583-589. Ranken, MD. 2000. Handbook of meat product technology. Blackwell Science, USA, Ransom, AB. 1965. „Kidney and marrow fat as indicators of white-tailed deer
condition‟. Journal of Wildlife Management, 29, pp. 397-398. Realini, CE, Duckett, SK, Brito, GW, Dalla Rizza, M and De Mattos, D. 2004.
„Effect of pasture vs. concentrate feeding with or without antioxidants on carcass characteristics, fatty acid composition, and quality of Uruguayan beef‟. Meat Science, 66, (3), pp. 567-577.
Realini, CE, Font i Furnols, M, Guerrero, L, Montossi, F, Campo, MM, Sanudo, C,
Nute, GR, Alvarez, I, Caneque, V, Brito, G and Oliver MA. 2009. „Effect of finishing diet on consumer acceptability of Uruguayan beef in the European market‟. Meat Science, 81, pp. 499-506.
Rees, G. 2010. „Sheep Meat‟. Australian Commodities, 17, (4), pp. 690-695. Rees, MP, Trout, GR and Warner, RD. 2003. „The influence of the rate of pH decline
on the rate of ageing for pork. I: Interaction with method of suspension‟. Meat Science, 65, pp.791-804.
Rehbinder, C. 1990. „Management stress in reindeer‟. Rangifer, Special Issue 3, pp.
267-288. Reinken, G. 1997. „Re-distribution, use and naming of fallow deer Cervus Dama L in
Europe‟, Zeitschrift Fur Jagdwissenscaft, 43, (3), pp. 197-206.
References
262
Reinken, G. 1998. Deer Farming. Rural Industries Research and Development Corporation Report on the Second World Deer Farming Congress, 24-28 June, 1998, Limerick, Ireland, RIRDC, Canberra, p. 6.
Resconi, VC, Campo, MM, Font i Furnols, M, Montossi, F and Sanudo, C. 2009.
„Sensory evaluation of castrated lambs finished on different proportions of pasture and concentrate feeding systems‟. Meat Science, 83, (1), pp. 31-37.
Resconi, VC, Campo, MM, Font i Furnols, M, Montossi, F and Sanudo, C. 2010.
„Sensory quality of beef from different finishing diets‟. Meat Science, 86, (3), pp. 865-869.
Revilla, I and Vivar-Quintana, AM. 2006. „Effect of breed and ageing time on meat
quality and sensory attributes of veal calves of the “Ternera de Aliste” Quality Label‟. Meat Science, 73, pp. 189-195.
Rincker, PJ, Bechtel, PJ, Finstad, G, van Buuren, RGC, Killefer, J. and McKeith, FK.
2006.„Similarities and differences in composition and selected sensory attributes of reindeer, caribou and beef‟. Journal of Muscle Foods, 17, pp. 65-78.
Riney, T. 1955. „Evaluating condition of free-ranging red deer Cervus elaphus with
special reference to New Zealand‟, New Zealand Journal of Science and Technology, 36 B, pp. 429-463.
Ripoll, G, Alberti, P and Joy, M. 2012. „Influence of alfalfa grazing-based feeding
systems on carcass fat colour and meat quality of light lambs‟. Meat Science, 90, pp. 457-464.
RIRDC. 1994. Venison Market Development Plan. Paper No 92/6, RIRDC,
Canberra, Australia. RIRDC. 2000. Research and development plan for the deer program 2000-2005,
Rural Industries Research and Development Corporation, Canberra, Australia.
RIRDC. 2001. Venison Processing Standards. Venison Marketers and Processors
Specification Manual. Rural Industries Research and Development Corporation, Canberra, Australia.
RIRDC. 2007. Deer industry R&D plan 2006 to 2011. Rural Industries Research and
Development Corporation, No 06/113, RIRDC, Canberra, ACT. Risvik E. 1994. „Sensory properties and preferences‟, Meat Science, 36, p. 6777. Rius-Vilarrasa, E, Bunger, L, Matthews, K, Maltin, CA, Hinz, A and Roehe, R.
2007. „Evaluation of video image analysis (VIA) technology to predict lean meat yield of sheep carcasses online under abattoir conditions‟. In Proceedings of the British Society of Animal Science, Southport, April, pp. 321-336.
References
263
Rivas-Munoz, R, Carrillo, E, Rodriguez-Martinez, R, Leyva, C, Mellado, M and Veliz, FG. 2010. „Effect of body condition score of does and use of bucks subjected to added artificial light on oestrus response of Alpine goats‟. Tropical Animal Health and Production, 42, (6), pp. 1285-1289.
Robbins, C T, Moen, A N and Reid, JT. 1974. „Body composition of white-tailed
deer‟. Journal of Animal Science, 38, (4), pp. 871-876. Rodas-Gonzalez, A, Huerta-Leidenz, N, Jerez-Timaure,N and Miller MF. 2009.
„Establishing tenderness thresholds of Venezuelen beef steaks using consumer and trained panels‟, Meat Science, 83, pp. 218-223.
Rodbotten, M, Kubberod, E, Lea, P, and Ueland, O. 2004. „A sensory map of the
meat universe. Sensory profile of meat from 15 species‟, Meat Science, 68, pp 134-137.
Rodrigues, L, Goncalves, HC, Medeiros, BBL, Martins, MF, Komiyama, CM and
Canizares, MC. 2011. „Effect of genotype, finishing system and sex on physiochemical characteristics of goat meat‟. Ciencia e Technologia de Alimentos, 31, (4), pp. 992-997.
Rosenvold, K, van den Berg, F, Andersen, HJ, Johansson, L and Lundstrom, K.
2002. „Beef, Warner-Bratzler shear force measurements, in relation to sensory-determined tenderness; does measurement temperature influence the interpretation?‟. Proceedings 48th International Congress of Meat Science and Technology, Rome, Italy.
Russel, AJF, Doney, JM and Gunn, RG. 1969. „Subjective assessment of body fat in
live sheep‟. Journal of Agricultural Science, 72, pp. 451-454. Russel, AJF, Doney, JM and Reid, RL. 1967. „Energy requirements of the pregnant
ewe‟. Journal of agricultural Science, 68, pp. 359-363. Russell, BC, McAlister, G, Ross, IS and Pethick, DW. 2005. „Lamb and sheep meat
eating quality - industry and scientific issues and the need for integrated research‟. Australian Journal of Experimental Agriculture, 45, pp 465-467.
Safari, E, Hopkins, DL, Fogarty, NM and Hoist, PJ. 2000. „The significance of
including breed in the prediction of trimmed fat from lamb carcasses using different indicators of fatness‟. Asian-Australasian Journal of Animal Science, 13 (Suppl.1), pp. 373-376.
Sami, AS, Augustini, C and Schwarz, FJ. 2004. „Effects of feeding intensity and time
on feed on performance, carcass characteristics and meat quality of Simmental bulls‟. Meat Science, 67, (2), pp. 195-201.
Sampels, S, Pickova, J and Wiklund, E. 2004. Fatty acids, antioxidants and oxidation
stability of processed reindeer meat. Meat Science, 67, pp. 523-532.
References
264
Sanson, DW, West, TR, Tatman, WR, Riley, ML, Judkins, MB and Moss, GE. 1993. „Relationship of body composition of mature ewes with condition score and body weight‟. Journal of Animal Science, 71, pp. 1112-1116.
Sanudo, C, Macie, ES, Olleta, JL, Villarroel, M, Panea, B and Alberti, F. 2004. „The
effects of slaughter weight, breed type and ageing time on beef meat quality using two different texture devices‟. Meat Science, 66, pp.925-932.
Sanudo, C, Nute, GR, Campo, MM, Maria, G, Baker, A Sierra, I, Enser, ME, and
Wood, JD. 1998. „Assessment of commercial lamb meat quality by British and Spanish taste panels‟, Meat Science, 48, (1), pp. 91-100.
Sapp, PH, Williams, SE and McCann, MA. 1999. „Sensory attributes and retail
display characteristics of pasture- and/or grain-fed beef aged 7, 14 or 21 days‟. Journal of Food Quality, 22, (3), pp. 257-274.
Sarries, MV and Berlain MJ. 2005. „Carcass characteristics and meat quality of male
and female foals‟, Meat Science, 70, (1), pp. 141-152. Sawyer, JT, Baublits, RT, Apple, JK, Meullenet, JF, Johnson,ZB and Alpers, TK.
2007. „Lateral and longitudinal characterization of color stability, instrumental tenderness and sensory characteristics in the beef M. semimembranosus’. Meat Science, 75, (4), pp. 575-584.
Seamer, DJ. 1986. „The welfare of deer at slaughter in New Zealand and Great
Britain‟. The Veterinary Record, 118, pp. 257-258. Seideman, SC, Cross, HR, Oltjen, RR, Schanbacher, BD. 1982. „Utilisation of the
intact male for red meat production: a review‟. Journal of Animal Science, 55, pp. 826-840.
Serin, I, Serin, G, Yilma, M, Kial, F and Ceylan, A. 2010. „The effects of body
weight, body condition score, age, lactation, serum triglyceride, cholesterol and paraoxanase levels on pregnancy rate of saanen goats in breeding season‟. Journal of Animal and Veterinary Advances, 9, (13), pp. 1848-1851.
Schonfeldt, HC and Gibson, N. 2008. „Changes in nutrient quality of meat in an
obesity context‟. Meat Science, 80, pp.20-27. Shapiro, S. 2010. Deer Industry Database. Rural Industries Research and
Development Corporation, No 09/175, RIRDC, Canberra, ACT.
Shaw, F. 2000. Eating qualities of venison from red and fallow deer. Rural Industries Research and Development Corporation, No 00/49, RIRDC, Canberra, ACT.
Sims, KL, Wiklund, E, Hutchison, CL, Mulley, RC and Littlejohn, RP. 2004. „Effect
of pelvic suspension on the tenderness of meat from fallow deer Dama dama’. In Proceedings 50th International Congress of Meat Science and Technology, Helsinki, Finland, pp. 12-13.
References
265
Smart, CW, Giles, RH and Guynn, DC. 1973. „Weight tape for white-tailed deer in Virginia‟. Journal of Wildlife Management, 37, pp. 553-555.
Smith RD, Nicholson, KL, Nicholson, JDW, Harris, KB, Miuller, RK, Griffin, DB
and Savell, JW. 2008. „Dry versus wet ageing of beef: retail cutting yields and consumer palatability evaluations from steaks from US choice and US select short loins‟. Meat Science, 79, pp. 631-639.
Smith, GC, Tatum, JD and Belk, KE. 2008. „International perspective:
characterisation of United States Department of Agriculture and Meat Standards Australia systems for assessing beef quality‟. Australian Journal of Experimental Agriculture, 48, pp.1465-1480.
Smulders, FJM, Barnier, VMH, Geeshink,GH and van Laack, R. 1995. „The muscle
biological background of meat tenderness‟. In K.Lundstrom, I.Hansson and E. Wiklund (Eds.), Composition of meat in relationship to processing, nutritional and sensory quality: from farm to fork, ECCEAMST, Utrecht, pp. 103-117.
Smulders, FJM, van Laack, R and Eikelenboom, G. 1991. „Muscle and meat quality:
biological basis, processing, preparation‟. In The European meat industry in the 1990’s’. Audet, Nijmegen, pp. 121-159.
Soltanizadeh, N, Kadivar, M, Keramat, J and Fazilati, M. 2008. „Comparison of fresh
beef and camel meat proteolysis during cold storage‟. Meat Science, 80, pp. 892-895.
Sorheim, O and Hildrum, KI. 2002. „Muscle stretching techniques for improving
meat tenderness‟. Trends in Food Science and Technology, 13, pp. 127-135. Sorheim, O, Idland, J, Halvorsen, EC, Froystein, T, Lea, P and Hildrum, KI. 2001.
„Influence of beef carcass stretching and chilling rate on tenderness of m.longissimus dorsi‟. Meat Science, 57, (1), pp. 79-85.
SPSS. 2002. SPSS for Windows Version 115, SPSS Inc, Chicago, Illinois, USA. Stevenson, JM, Drew, KR, Duncan, SJ and Litteljohn, RP. 1989a. „The relationship
of meat quality to age at slaughter in red deer stags and hinds‟. Report for the New Zealand Game Industry Board.
Stevenson, JM, Seman, DL and Littlejohn, RP. 1992. „Seasonal variation in venison
quality of mature, farmed red deer stags in New Zealand‟. Journal of Animal Science, 70, pp. 1389-1396.
Stevenson, JM, Seman, DL, Weatherall, IL and Littlejohn, RP. 1989b. „Evaluation of
venison colour by an objective method using CIELAB values‟. Journal of Food Science, 54, pp. 1661-1662.
Stevenson-Barry, JM. 2000a. „Systems for Quality Venison‟. In Proceedings of a
Deer Course for Veterinarians, Deer Branch, NZVA, 17, pp. 117-122.
References
266
Stevenson-Barry, JM. 2000b. „Venison - quality issues‟. In Proceedings of a Deer Course for Veterinarians, Deer Branch, NZVA, 17, pp. 131-136.
Stevenson-Barry, JM, Carseldine, WJ, Duncan, SJ and Littlejohn, RP. 1999.
„Incidence of high pH venison: implications for quality‟. In Proceedings New Zealand Society of Animal Production, 59, pp. 145-147.
Stevenson-Barry, JM, Drew, KR, Duncan, SJ and Littlejohn, RP. 1999. „The
relationship of meat quality to age at slaughter and indicators of animal age in red deer stags and hinds‟. In Proceedings of the New Zealand Society of Animal Production, 59, pp. 137-139.
Stewart, P. 2011. „Who deers wins! Special conference report‟. Deer Industry New
Zealand News, 48, June/July, p. 4.
Suttie, JM. 1983. „The relationship between kidney fat index and marrow fat percentage as indicators of condition in red deer stags Cervus elaphus’. Journal of Zoology, 20, (1), pp. 563-565.
Swan, JE, Esguerra, CM and Farouk, MM. 1998. „Some physical, chemical and
sensory properties of chevon products from three New Zealand goat breeds‟. Small Ruminant Research, 28, pp. 273-280.
Taylor, JM and Hopkins, DL. 2011. „Patents for stretching and shaping meats‟.
Recent patents on food, nutrition and agriculture, 3, (2), pp. 91-101. Taylor, RG, Labas, R, Smulders, FJM and Wiklund, E. 2001. „Ultrastructural
changes during ageing in M. Longissimus thoracis from moose and reindeer‟. Meat Science, 60, pp. 321-326.
Taylor, WA, Skinner, JD and Krecek, RC. 2005. „Seasonal body condition indices of
mountain reedbuck (Redunca fulvorufula) in two areas of South African highveld: The grassland and Karoo biomes‟. South African Journal of Animal Sciences, 35, (1), pp.19-29.
Tejeda, JF, Pena, RE and Andres, AI. 2008. „Effect of live weight and sex on
physico-chemical and sensorial characteristics of Merino lamb meat‟. Meat Science, 80, pp. 1061-1067.
Tesanovic, D, Kalenjuk, B, Tesanovic, D, Psodorov, D, Ristic, Z and Markovic, V.
2011. „Changes of biochemical and sensory characteristics in the musculus longissimus dorsi of the fallow deer in the early phase post-mortem and during maturation‟. African Journal of Biotechnology, 10, (55), pp. 11668-11675.
Testa, JW and Adams, GP. 1998. „Body condition and adjustments to reproductive
effort in female moose Alces alces’. Journal of Mammalogy, 79, (4), pp. 1345-1354.
References
267
Thenard, V, Dumont, R, Grosse, M, Trommenschlager, JM, Fiorelli, JL and Roux, M. 2006. „Grass steer production system to improve carcass and meat quality‟. Livestock Science, 105, (1-3), pp. 185-197.
Thompson, JM. 2001. ‘Meat science and technology - meat’. CD Rom, University of
New England, Armidale, NSW. Thompson, JM. 2002. „Managing meat tenderness‟. Meat Science, 62, pp. 295-308. Thompson, JM, Gee, A, Hopkins, DL, Pethick, DW, Baud, SR and O‟Halloran, WJ.
2005c. „Development of a sensory protocol for testing palatability of sheep meats‟. Australian Journal of Experimental Agriculture, 45, pp. 469-476.
Thompson, JM, Hopkins, DL, D‟Souza, DN, Walker, PJ, Baud, SR and Pethick,
DW. 2005b. „The impact of processing on sensory and objective measurements of sheep meat eating quality‟. Australian Journal of Experimental Agriculture, 45, pp. 561-573.
Thompson, JM, Pleasants, AB and Pethick, DW. 2005a. „The effect of design and
demographic factors on consumer sensory scores‟. Australian Journal of Experimental Agriculture, 45, pp. 477-482.
Thompson, JM, Perry, D, Daly, B, Gardner, GE, Johnston, DJ and Pethick, DW.
2006. „Genetic and environmental effects on the muscle structure response post mortem‟. Meat Science, 74, pp. 59-65.
Thompson JM and Polkinghorne, R. 2008. „Preface‟. Journal of Experimental
Agriculture, 48, pp. iii-iv. Thompson, JM, Polkinghorne, R, Hwang, IH, Gee, AM, Cho, SH, Park, BY and Lee,
JM. 2008. „Beef quality grades as determined by Korean and Australian consumers‟. Australian Journal of Experimental Agriculture, 48, pp. 1380-1386.
Tollefson, TN, Shipley, LA, Myers, WL, Keisler, DH and Dasgupta, N. 2010.
„Influence of summer and autumn nutrition on body condition and reproduction in lactating mule deer‟. Journal of Wildlife Management, 74, (5), pp. 974-986.
Toohey, ES, Hopkins, DL, Lamb, TA, Nielson, SG and Gutkze, D. 2008.
„Accelerated tenderness of sheep topsides using a meat stretching device‟. In Proceedings of the 54th International Congress of Meat Science and Technology, 7B, Cape Town, South Africa, pp. 1-3.
Toohey, ES, van de Ven, R, Thompson, JM, Geesink, GH and Hopkins, DL. 2012a.
„SmartStretch™ Technology. I. Improving the tenderness of sheep topsides (m. Semimembranosus) using a meat stretching device‟. Meat Science, 91, pp. 142-147.
References
268
Toohey, ES, van de Ven, R, Thompson, JM, Geesink, GH and Hopkins, DL. 2012b. „SmartStretch™ Technology. II. Improving the tenderness of leg meat from sheep using a meat stretching device‟. Meat Science, 91, pp. 125-130.
Torbit, SC, Carpenter, LH, Alldredge, AW and Swift, DM. 1985. „Mule deer body
composition - a comparison of methods‟. Journal of Wildlife Management, 49, pp. 86-91.
Torbit, SC, Carpenter, LH, Bartman, RM, Alldredge, AW and White, GC. 1988.
„Calibration of carcass fat indices in wintering mule deer‟. Journal of Wildlife Management, 52, (4), pp. 582-588.
Tornberg, E. 1996. „Biophysical aspects of meat tenderness‟. Meat Science, 43, (S),
pp. S175-S191. Triumf, EC, Purchas, RW, Mielnik, M, Maehre, HK, Elvevoll, E, Slinde, E and
Egelandsdal, B. 2012. „Composition and some quality characteristics of the longissimus muscle of reindeer in Norway compared to farmed New Zealand red deer‟ Meat Science, 90, pp. 122-129.
Troy, DJ and Kerry, JP. 2010. „Consumer perception and the role of science in the
meat industry‟. Meat Science, 86, pp. 214-226. Tuckwell, C. 1999. Development of the deer industry as a major Australian livestock
industry. Rural Industries Research and Development Corporation, No 99/92, RIRDC, Canberra, ACT.
Tuckwell, C. 2001a. Deer: quality assurance, strategic alliances and industry
development. Rural Industries Research and Development Corporation, No 01/120, RIRDC, Canberra, ACT.
Tuckwell, C. 2001b. Venison quality assurance. Rural Industries Research and
Development Corporation, No 01/94, RIRDC, Canberra, ACT. Tuckwell, C. 2003a. Deer farming in Australia: production and markets for venison,
velvet antler and co-products in 2001-02. Rural Industries Research and Development Corporation, No 02/128, RIRDC, Canberra, ACT.
Tuckwell, C. 2003b. The deer farming handbook. Rural Industries Research and
Development Corporation, No 02/128, RIRDC, Canberra, ACT.
Tuckwell, C. 2007. Deer industry statistics. Rural Industries Research and Development Corporation, No 07/174, RIRDC, Canberra, ACT.
Tuckwell, C, Flesch, JS and Mulley, RC. 2000a. „Body condition scoring chart for
fallow deer’. RIRDC, Canberra, ACT. Tuckwell, C, Hansen A and McKay, B. 2000b. „Body condition scoring chart for red
deer’. RIRDC, Canberra, ACT.
References
269
Tuckwell, C and Tume, L 2000, Niche markets for venison, RIRDC, Canberra, ACT. Turner, T, Hessle, A, Lundstroom, K and Pickova, J. 2011. „Silage-concentrate
finishing of bulls versus silage or fresh forage finishing of steers: effects on fatty acids and meat tenderness‟. Acta Agriculturae Scandinavica, Section A - Animal Science, 61, pp. 103-113.
Van Vuren, D and Coblentz, BE. 1985. „Kidney weight variation and the kidney fat
index: an evaluation‟. Journal of Wildlife Management, 49, (1), pp. 177-179. Van Schalkwyk, S. 2004. „Meat quality characteristics of three South African game
species: black wildebeest (Connochaetes gnou), blue wildebeest (Connochaetes taurinus) and mountain reedbuck (Redunca fulvorufula)’. MSc thesis, University of Stellenbosch.
Varela, A, Oliete, B, Moreno, T, Portela, C, Monserrat, L, Carballo, JA and Sanchez,
L. 2004. Effect of pasture finishing on the meat characteristics and intramuscular fatty acid profile of steers of the Rubia Gallega breed‟. Meat Science, 67, pp. 515-022.
Vasanthi, C, Venkataramanujam, V and Dushyanthan, K. 2007. „Effect of cooking
temperature and time on the physico-chemical, histological and sensory properties of female carabeef buffalo meat‟. Meat Science, 76, (2), pp. 274-280.
Vieiria,C, Cerdeno, A, Serrano, E, Lavin, P. And Mantecon, AR. 2007. „Breed and
ageing extent on carcass and meat quality of beef from adult steers (oxen)‟. Livestock Science, 107, pp. 62-69.
Voges, KL, Mason, CL, Brooks, JC, Delmore, RJ, Griffin, DB, Hale, DS, Henning,
WR, Johnson, DD, Lorenzen, CL, Maddock, RJ, Miller, RK, Morgan, JB, Baird, BE, Gwartney, BL and Savell, JW. 2007. „National beef tenderness survey-2006: assessment of Warner-Bratzler shear and sensory panels ratings for beef from US retail and foodservice establishments‟. Meat Science, 77, (3), pp. 357-364.
Volpelli, LA, Failla, S, Sepulcri, A and Piasentier, E. 2005. „Calpain system in vitro
activity and myofibril fragmentation index in fallow deer (Dama dama); effects of age and supplementary feeding‟. Meat Science, 69, pp. 579-582.
Volpelli, LA, Valusso, R, Morgante, M, Pittia, P and Piasentier, E. 2003. „Meat
quality in male fallow deer (Dama dama): effects of age and supplementary feeding‟. Meat Science, 65, pp. 555-562.
Volpelli, LA, Valusso, R and Piasentier, E. 2002. „Carcass quality in male fallow
deer (Dama dama): effects of age and supplementary feeding‟. Meat Science, 60, pp. 427-432.
References
270
Wahlgren, NM, Goransson, M, Linden, H and Willhammar, O. 2002. „Reducing the influence of animal variation and ageing on beef tenderness‟. In Proceedings of 48th International Congress of Meat Science and Technology, Rome, 25-30 August, pp. 240-241.
Ward, JF, Archer, JA, Farmer, RJ, Sweetman, MF, Nicoll, GB and Yuan, JV. 2010.
„Can ultrasound eye muscle area scanning be used in the New Zealand deer industry?‟ In Proceedings of the New Zealand Society of Animal Production, 70, Massey University, 23-25 June, pp. 275-277
Warner, RD, Greenwood, PL, Pethick, DW and Ferguson, DM. 2010. „Genetic and
environmental effects on meat quality‟. Meat Science, 86, pp. 171-183.
Warner, RD, Kearney, GA, Thompson, JM and Polkinghorne, R. 2009. „Rigor temperature influences objective and consumer quality traits of beef striploin‟. In Proceedings of the 55th International Congress of Meat Science and Technology, August, Copenhagen , Denmark. pp.16-21.,
Watanabe, A, Daly, CC and Devine, CE. 1996. „The effects of ultimate pH of meat on
tenderness changes during ageing‟. Meat Science, 42, pp. 67-78. Watkins, BE, Witham, JH, Ullrey, SJ, and Jones, M. 1991. „Body composition and
condition evaluation of white-tailed deer fawns‟. Journal of Wildlife Management, 55, pp. 39-51.
Watson, A. 1971. „Climate and antler shedding and performance of red deer in north
east Scotland‟. Journal of Applied Ecology, 8, pp. 53-67. Watson, R, Gee, A, Polkinghorne, R and Porter, M. 2008. „Consumer assessment of
eating quality-development of protocols for Meat Standards Australia (MSA) testing‟. Australian Journal of Experimental Agriculture, 48, pp. 1360-1367.
Weckerly, FW, Leberg, PL and Van Den Bussche, RA. 1987. „Variation of weight
and chest girth in white-tailed deer‟. Journal of Wildlife Management, 51, (2), pp. 334-337.
Weglarz, A. 2010. „Quality of beef from semi-intensively fattened heifers and bulls‟.
Animal Science Papers and Reports, 28, (3), pp. 207-218.
Weglarz, A, Zapletal, P, Gil, Z, Skrzynski, G and Adamczyk, K. 2002. „The effect of sex and age on beef quality‟. Zeszyty Naukowe Przegladu Hododowlanego, 62, pp. 211-216.
Wheeler, TL, Shackelford, SD, and Koohmaraie, M. 2004. „The accuracy and
repeatability of untrained laboratory consumer panelists in detecting differences in beef Longissimus tenderness‟. Journal of Animal Science, 82, (2), pp. 557-562.
Whitehead, GK. 1972. Deer of the world. Constable, London, UK.
References
271
Whitehead, GK. 1993. The Whitehead encyclopaedia of deer. Swan Hill Press, Shrewsbury, England.
Wiklund, E. 1996. Pre-slaughter handling of reindeer Rangifer tarandus tarandus L
- effects on meat quality, thesis, Department of Food Science, Swedish University of Agricultural Sciences, Uppsala, Sweden.
Wiklund, E. 2009. „Venison quality, from plate to gate‟. In Proceedings of a Deer
Course for Veterinarians, 26, Christchurch, July, pp. 24-26. Wiklund, E, Andersson, A, Malmfors, G and Lundstrom, K. 1996a. „Muscle
glycogen levels and blood metabolites in reindeer (Rangifer tarandus atrandus L.) after transport and lairage‟. Meat Science, 42, (2), pp. 133-144.
Wiklund, E, Andersson, A, Malmfors, G, Lundstrom, K and Danell, O. 1995.
„Ultimate pH values in reindeer meat with particular regard to animal sex and age, muscle and transport distance‟. Rangifer, 15, (2), pp. 47-54.
Wiklund, E, Asher, GW, Archer, JA, Ward, JF and Littlejohn, RP. 2008. „Carcass
and meat quality characteristics in young red deer stags of different growth rates‟. In Proceedings of the New Zealand Society of Animal production, 68, Brisbane, Australia, 24-27 June, pp.174-177.
Wiklund, E, Barnier, VMH, Smulders, FJM, Lundstrom, K and Malmfors, G. 1997a.
„Proteolysis and tenderisation in reindeer Rangifer tarandus tarandus L bull longissimus thoracis muscle of various ultimate pH‟. Meat Science, 46, pp. 33-43.
Wiklund, E, Dobbie, P, Stuart, A and Littlejohn, RP. 2010. „Seasonal variation in red
deer (Cervus elaphus) venison drip loss, calpain activity, colour and tenderness‟. Meat Science, 86, (3), pp. 720-727.
Wiklund, E, Farouk, M., Stuart, A. and Dobbie, P. 2009. „Consumer evaluation of
chilled-never-frozen versus chilled-frozen-thawed beef and venison‟. Proceedings, 55th International Congress of Meat Science and Technology, 16-21 August, Copenhagen, Denmark.
Wiklund, E, Finstad, G, Aguiar, G and Bechtel, PJ. 2011. „Does carcass suspension
technique influence reindeer (Rangifer tarandus tarandus) meat quality attributes?‟ Animal Production Science, 51, (4), pp. ci-civ.
Wiklund, E, Hansson, I and Åhman, B. 2002. „Sensory quality of meat from reindeer
bulls, cows and calves‟. In Proceedings, 12th Nordic Conference on Reindeer Research, Kiruna, Sweden, pp. 115-116.
Wiklund, E, Hutchison, CL, Flesch, JS, Mulley, RC and Littlejohn, RP. 2005.
„Colour stability and water-holding capacity of M. Longissimus and carcass characteristics in fallow deer Dama dama grazed on natural pasture or fed barley‟. Rangifer, 25, (2), pp. 97-105.
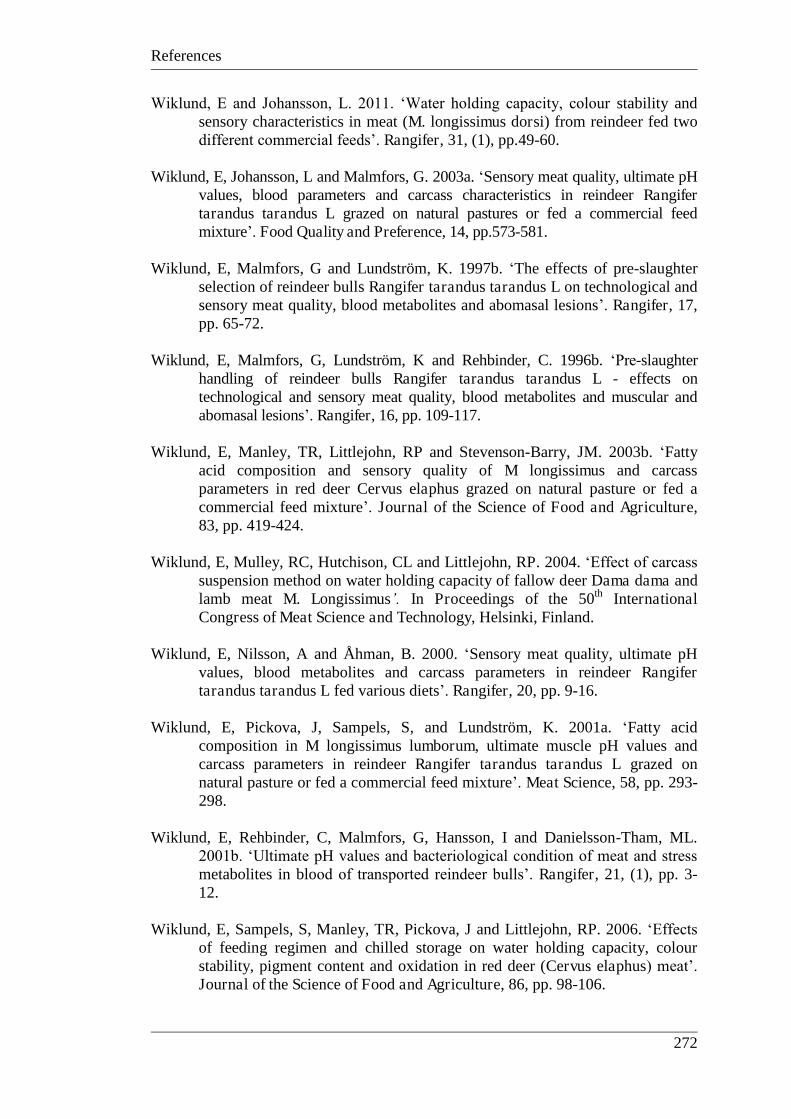
References
272
Wiklund, E and Johansson, L. 2011. „Water holding capacity, colour stability and sensory characteristics in meat (M. longissimus dorsi) from reindeer fed two different commercial feeds‟. Rangifer, 31, (1), pp.49-60.
Wiklund, E, Johansson, L and Malmfors, G. 2003a. „Sensory meat quality, ultimate pH
values, blood parameters and carcass characteristics in reindeer Rangifer tarandus tarandus L grazed on natural pastures or fed a commercial feed mixture‟. Food Quality and Preference, 14, pp.573-581.
Wiklund, E, Malmfors, G and Lundström, K. 1997b. „The effects of pre-slaughter
selection of reindeer bulls Rangifer tarandus tarandus L on technological and sensory meat quality, blood metabolites and abomasal lesions‟. Rangifer, 17, pp. 65-72.
Wiklund, E, Malmfors, G, Lundström, K and Rehbinder, C. 1996b. „Pre-slaughter
handling of reindeer bulls Rangifer tarandus tarandus L - effects on technological and sensory meat quality, blood metabolites and muscular and abomasal lesions‟. Rangifer, 16, pp. 109-117.
Wiklund, E, Manley, TR, Littlejohn, RP and Stevenson-Barry, JM. 2003b. „Fatty
acid composition and sensory quality of M longissimus and carcass parameters in red deer Cervus elaphus grazed on natural pasture or fed a commercial feed mixture‟. Journal of the Science of Food and Agriculture, 83, pp. 419-424.
Wiklund, E, Mulley, RC, Hutchison, CL and Littlejohn, RP. 2004. „Effect of carcass
suspension method on water holding capacity of fallow deer Dama dama and lamb meat M. Longissimus’. In Proceedings of the 50th International Congress of Meat Science and Technology, Helsinki, Finland.
Wiklund, E, Nilsson, A and Åhman, B. 2000. „Sensory meat quality, ultimate pH
values, blood metabolites and carcass parameters in reindeer Rangifer tarandus tarandus L fed various diets‟. Rangifer, 20, pp. 9-16.
Wiklund, E, Pickova, J, Sampels, S, and Lundström, K. 2001a. „Fatty acid
composition in M longissimus lumborum, ultimate muscle pH values and carcass parameters in reindeer Rangifer tarandus tarandus L grazed on natural pasture or fed a commercial feed mixture‟. Meat Science, 58, pp. 293-298.
Wiklund, E, Rehbinder, C, Malmfors, G, Hansson, I and Danielsson-Tham, ML.
2001b. „Ultimate pH values and bacteriological condition of meat and stress metabolites in blood of transported reindeer bulls‟. Rangifer, 21, (1), pp. 3-12.
Wiklund, E, Sampels, S, Manley, TR, Pickova, J and Littlejohn, RP. 2006. „Effects
of feeding regimen and chilled storage on water holding capacity, colour stability, pigment content and oxidation in red deer (Cervus elaphus) meat‟. Journal of the Science of Food and Agriculture, 86, pp. 98-106.
References
273
Wiklund, E, Stevenson-Barry, JM, Duncan, SJ and Littlejohn, RP. 2001c. „Electrical stimulation of red deer Cervus elaphus carcasses – effects on rate of pH-decline, meat tenderness, colour stability and water-holding capacity‟. Meat Science, 59, pp. 211-220.
Williams, P and Droulez, V. 2010. „Australian red meat consumption - implications of
changes over 20 years on nutrient composition‟. Food Australia, 63, (3), pp. 87-94.
Wilson, P. 1999. „Regular handling reduces blood splash in meat‟. Farming Ahead,
85, p. 23. Wilson, PR and Audige, LJ. 1996. „Target setting: body condition scores and
weights‟. In Proceedings of a Deer Course for Veterinarians, Deer Branch, NZVA, 13, pp. 27-37.
Wolcott, ML, Johnston, DJ, Barwick, SA, Iker, CL, Thompson, JM and Burrow,
HM. 2009. „Genetics of meat quality and carcass traits and the impact of tenderstretching in two tropical beef genotypes‟. Animal Production Science, 49, pp. 383-398.
Woodford, KB, Shorthose, WR, Stark, JL and Johnson, GW. 1996. „Carcass
composition and meat quality parameters of entire and castrate farmed blackbuck antelope (Antilope cervicapra)’. Meat Science, 43, (1), pp. 25-36.
Wright, W. 1993. „Venison Processing in New Zealand‟. In Proceedings of the First
World Deer Congress Christchurch, New Zealand, pp. 217-220. Wynn, P, Beaton, A and Spiegel, N 2004, Meat quality of kangaroos, Canprint,
ACT, Australia p.61. Yadata, MA, Werner, C, Tibbo, M, Wollny, CBA and Wicke, M. 2009. „Assessment
of the sensory quality and shelf stability of selected Horro beef muscles in Ethiopia‟. Meat Science, 83, pp.113-119.
Yang, A, Lanari, MC, Brewster, M and Tume RK. 2002. „Lipid stability and meat
colour of beef from pasture and grain fed cattle with or without vitamin E supplement‟. Meat Science, 60, pp. 41-50.
Yerex, D. 1979. Deer Farming in New Zealand. Wellington Deer Farming Services,
Division of Agricultural Promotion Associates, Wellington, NZ, p. 120. Young, OA, Hopkins, DL and Pethick, DW. 2005. „Critical control points for meat
quality in the Australian sheep meat supply chain‟. Australian Journal of Experimental Agriculture, 45, pp. 593-601.
Yu, LP and Lee YB. 1986. „Effects of post mortem pH and temperature muscle
structure on meat tenderness‟. Journal of Food Science, 51, (3), pp.774-780.
References
274
Zamiri, MJ, Eilami, B and Kianzad, MR. 2012. „Effects of castration and fattening period on growth performance and carcass characteristics in Iranian goats‟. Small Ruminant Research, 104, (1), pp. 55-61.
Zemke-Smith, G. 2009. „Deer product exports‟. In Proceedings of a Deer Course for
Veterinarians, 26, Christchurch, July, pp. 28-30. Zhou, ZK, Gao, X, Li, JY, Chen, JB and Xu, SZ. 2011. „Effect of castration on
carcass quality and differential gene expression of longissimus muscle between steer and bull‟. Molecular Biology Reports, 38, (8), pp. 5307-5312.
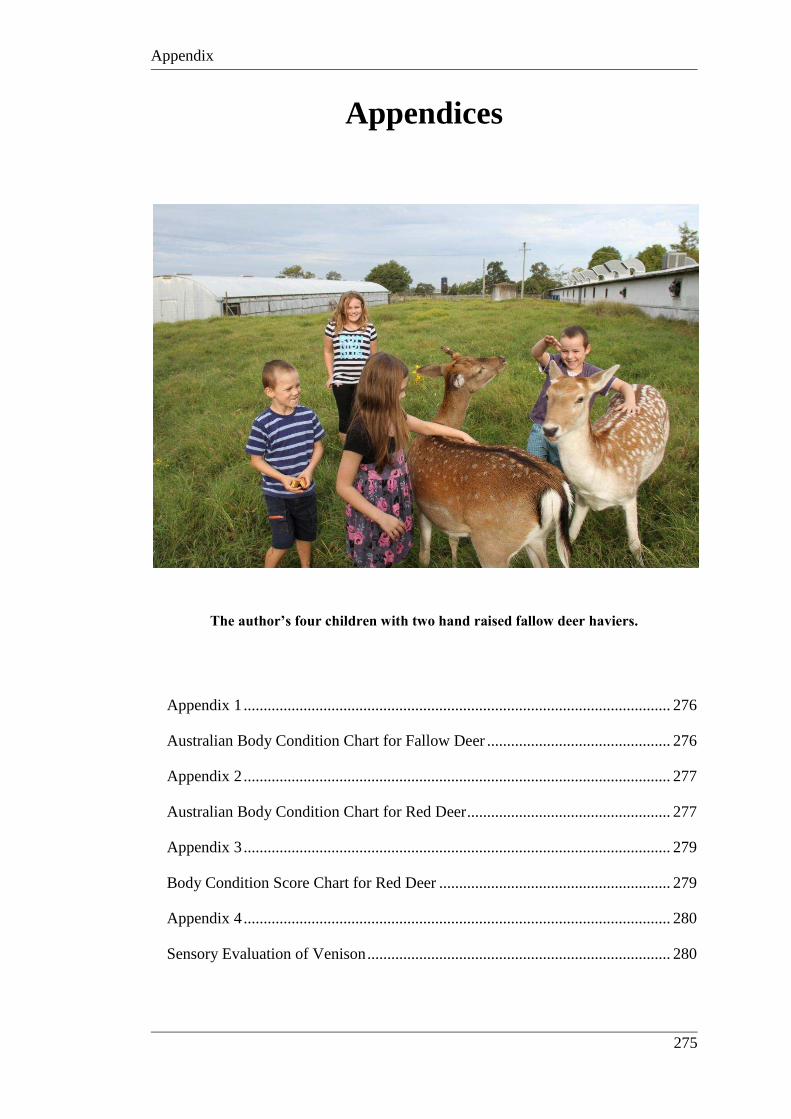
Appendix
275
Appendices
The author’s four children with two hand raised fallow deer haviers.
Appendix 1 ........................................................................................................... 276
Australian Body Condition Chart for Fallow Deer .............................................. 276
Appendix 2 ........................................................................................................... 277
Australian Body Condition Chart for Red Deer ................................................... 277
Appendix 3 ........................................................................................................... 279
Body Condition Score Chart for Red Deer .......................................................... 279
Appendix 4 ........................................................................................................... 280
Sensory Evaluation of Venison ............................................................................ 280
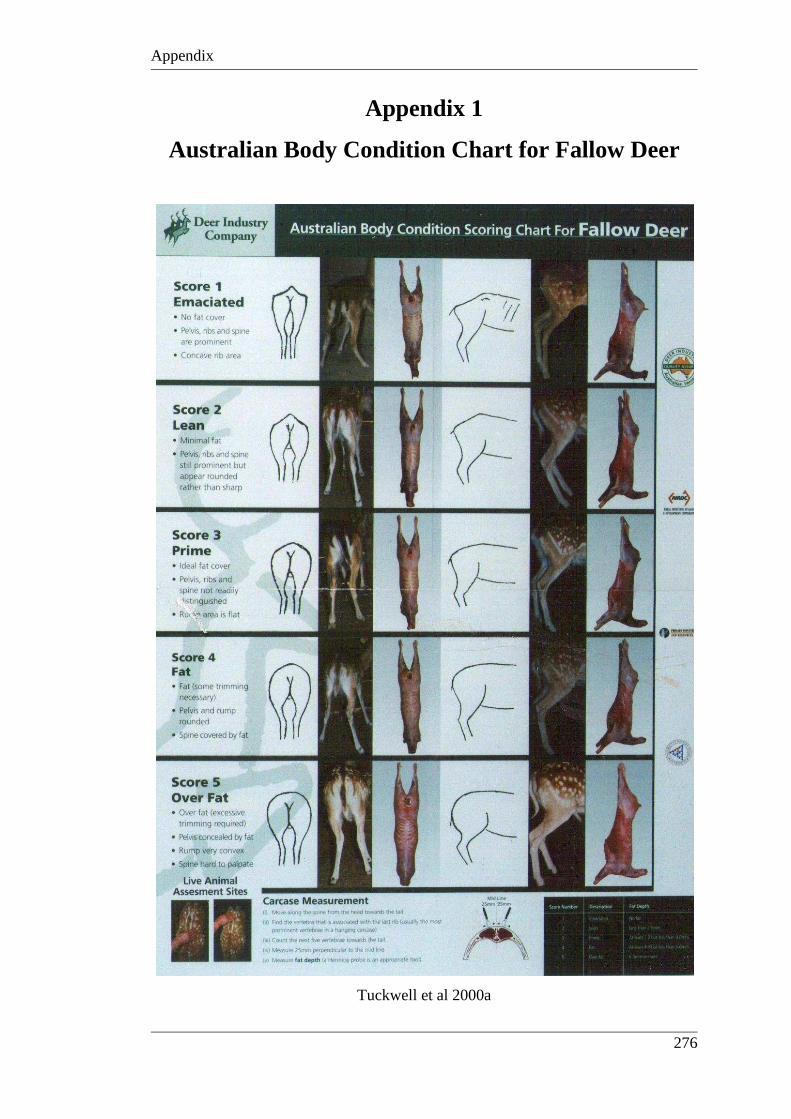
Appendix
276
Appendix 1
Australian Body Condition Chart for Fallow Deer
Tuckwell et al 2000a
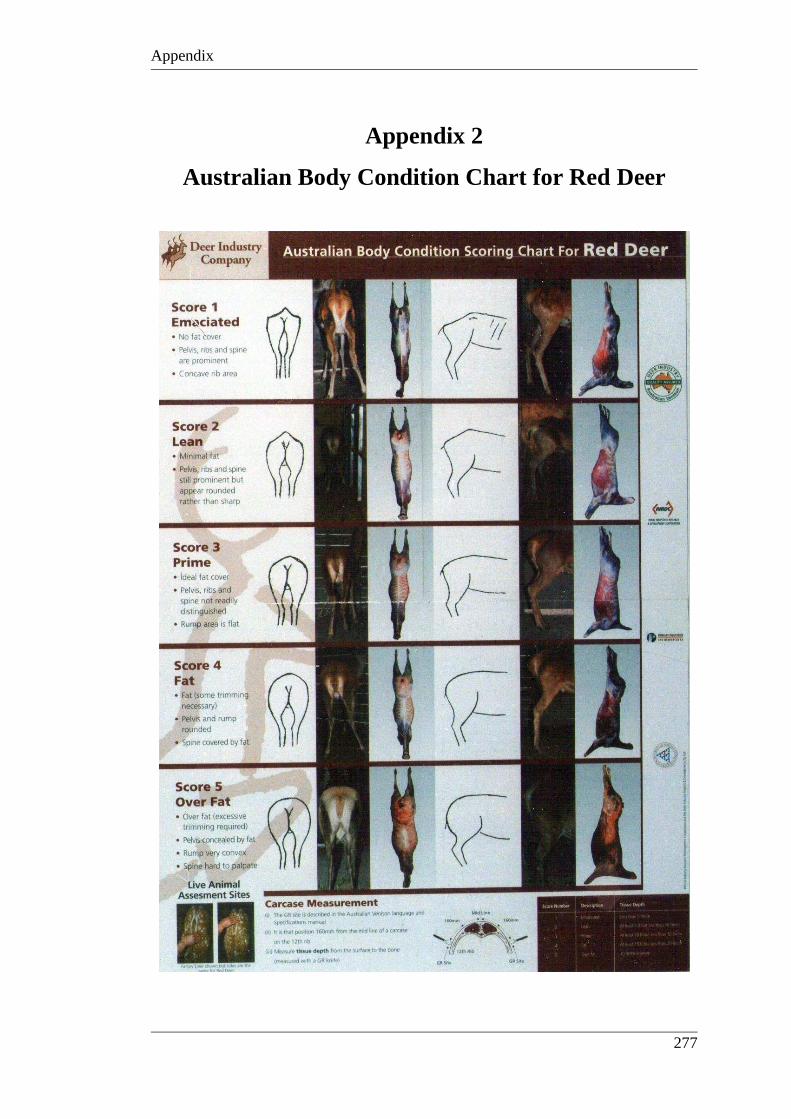
Appendix
277
Appendix 2
Australian Body Condition Chart for Red Deer
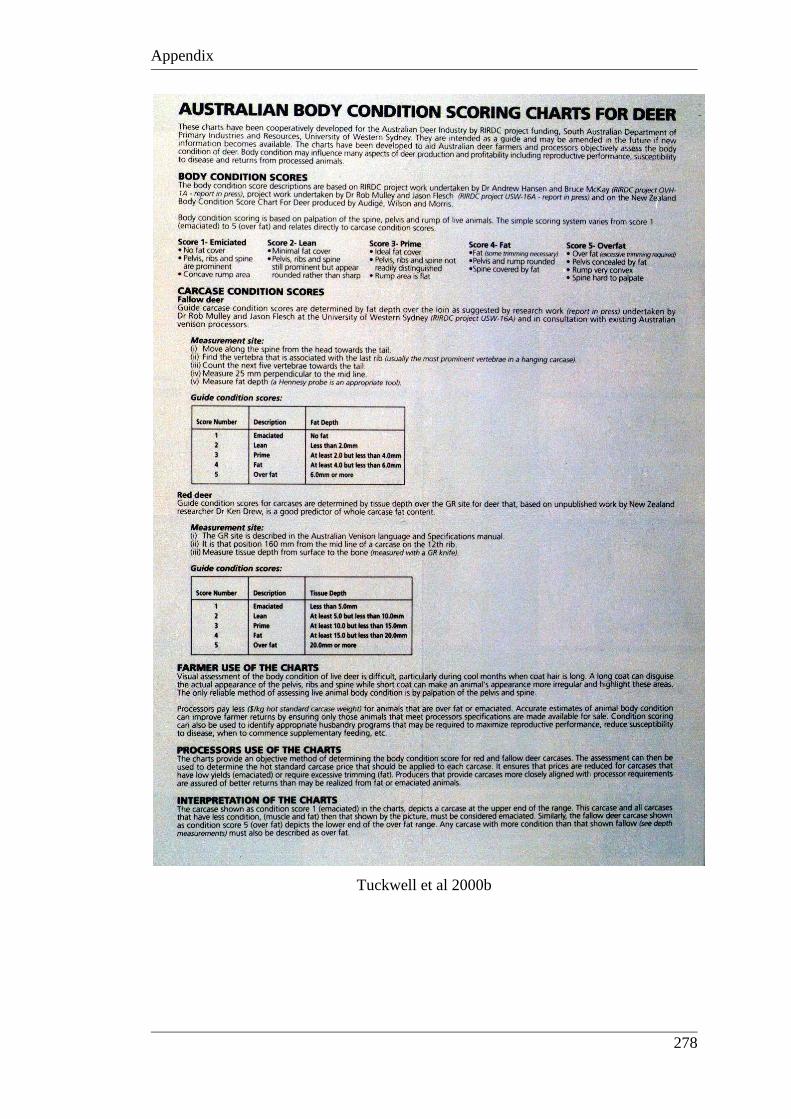
Appendix
278
Tuckwell et al 2000b
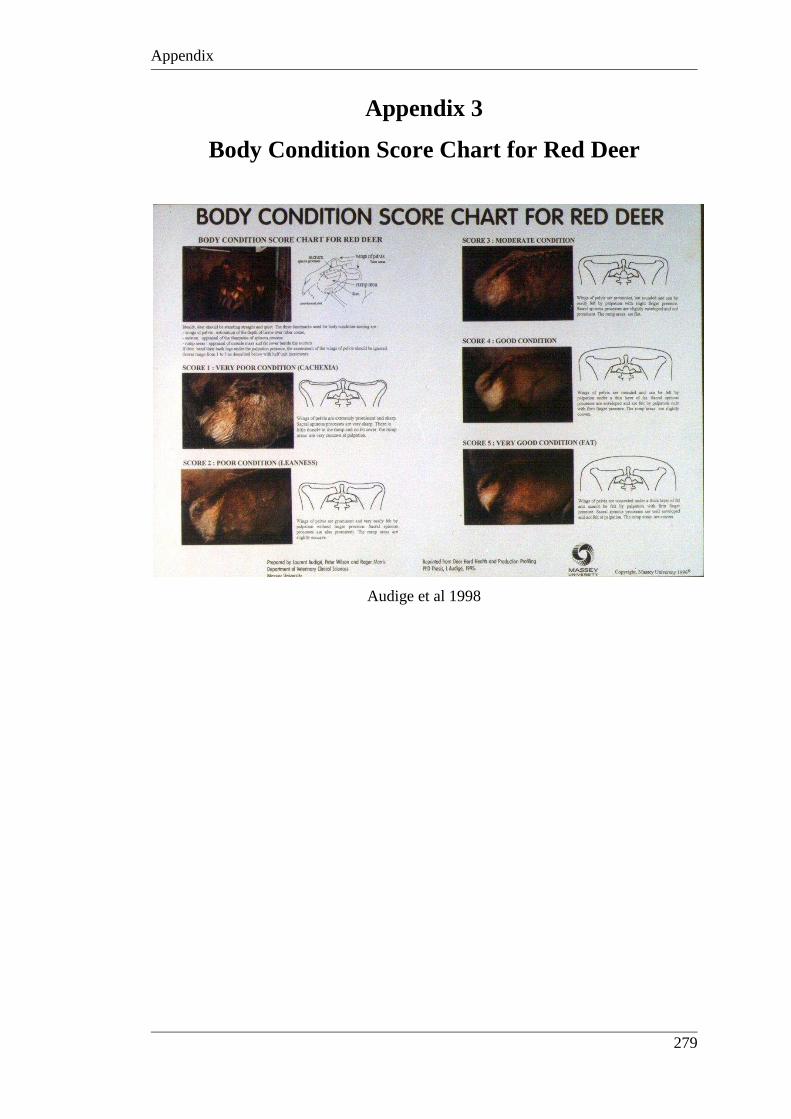
Appendix
279
Appendix 3
Body Condition Score Chart for Red Deer
Audige et al 1998
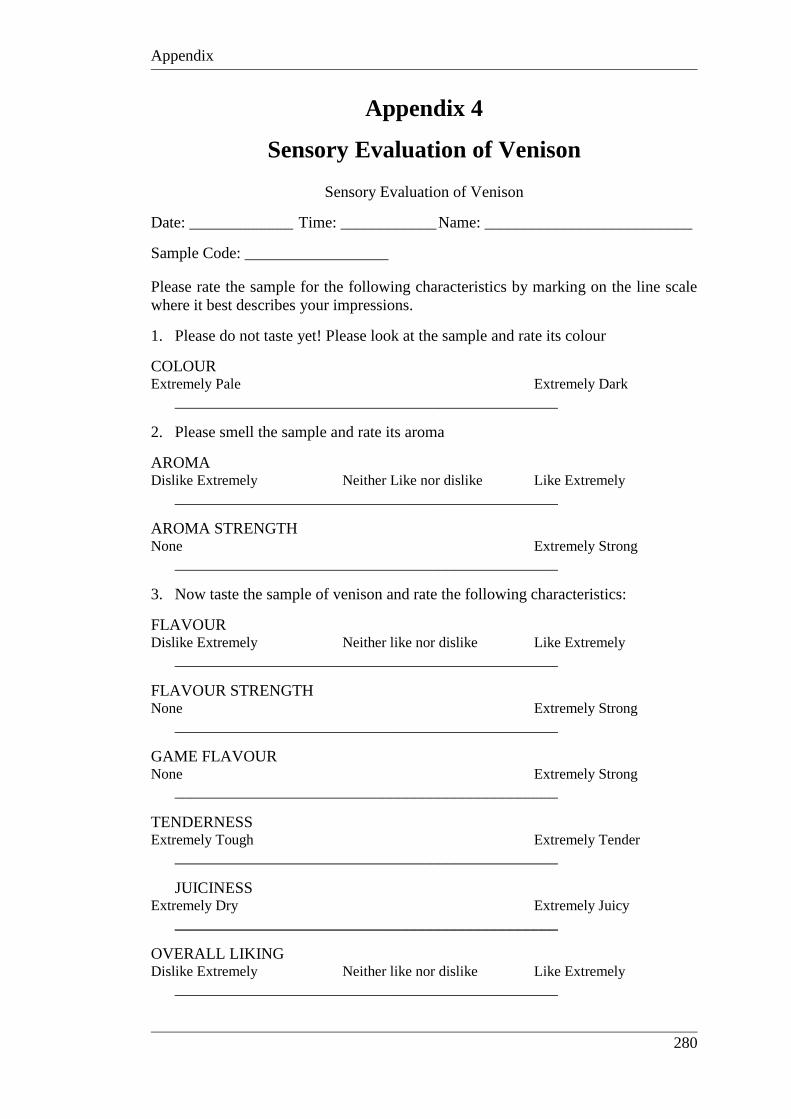
Appendix
280
Appendix 4
Sensory Evaluation of Venison
Sensory Evaluation of Venison
Date: _____________ Time: ____________ Name: __________________________
Sample Code: __________________ Please rate the sample for the following characteristics by marking on the line scale where it best describes your impressions.
1. Please do not taste yet! Please look at the sample and rate its colour
COLOUR Extremely Pale Extremely Dark
________________________________________________
2. Please smell the sample and rate its aroma
AROMA Dislike Extremely Neither Like nor dislike Like Extremely
________________________________________________
AROMA STRENGTH None Extremely Strong
________________________________________________
3. Now taste the sample of venison and rate the following characteristics:
FLAVOUR Dislike Extremely Neither like nor dislike Like Extremely
________________________________________________
FLAVOUR STRENGTH None Extremely Strong
________________________________________________
GAME FLAVOUR None Extremely Strong
________________________________________________
TENDERNESS Extremely Tough Extremely Tender
________________________________________________
JUICINESS Extremely Dry Extremely Juicy
________________________________________________
OVERALL LIKING Dislike Extremely Neither like nor dislike Like Extremely
________________________________________________