Embed Size (px)
Citation preview
295
Chapter 22: Animal Remains: Discussion
by
Paul Croft
[Ed. For additional bibliographic references, see p.316.]
§ 22.1 Introduction
This chapter presents the full report on the animal re-mains from the Neolithic to Bronze Age settlement atKissonerga. The contribution on the animal remains in§ 10 is a partial synopsis of this full report, and pres-ents no additional information or interpretation. For theconvenience of the reader of this full report, all tablesand figures which have been included in § 10 havebeen duplicated in the present chapter.
The excavations at Kissonerga have yielded a largernumber of identifiable faunal remains than any otherarchaeological site, of whatever period, in Cyprus. Atotal of 11,302 fragments of mammalian bone (ex-cluding mice and shrews) has been identified (Table22.1), of which fallow deer (Dama mesopotamica), pigand caprines together account for 10,988 fragments, or97.2%. Fox remains are reasonably common, and cat-tle, dog, cat, an equid and the Cypriot pigmy hippo-potamus (Phanourios minutus) are represented by lesserquantities of material. In addition to these terrestrialmammals, single teeth of a cetacean (whale) and a sealcould not be more closely identified. Moderate quanti-ties of bird remains (107 fragments), many of whichproved identifiable, were also recovered and will bediscussed below. Fish, mollusc and crab remains werenot uncommon at Kissonerga, and this material is dis-cussed in § 13 and 14. A total of 323 kg of non-fossil,terrestrial mammalian bone was recovered of which51.8% by weight proved identifiable (Table 22.2).
Identification was attempted for almost all frag-ments of the larger animals (viz. cattle, deer, pig andcaprines), but excluded vertebrae other than the atlas,axis and sacrum, as well as ribs. Teeth of the largeranimals which comprised less than half of a completetooth crown were also excluded. For the much lessabundant smaller creatures any identifiable fragmentwas counted.
Thousands of measurements were taken on the Kis-sonerga animal bones, but metrical data are only pre-sented here insofar as they serve to illustrate pointsmade in the text. Most measurements were taken fol-lowing the guidelines of von den Driesch (1976), andwhere this was not the case this is indicated. In thescatter diagrams displaying metrical data, symbolslocated on the axes represent items for which only theone dimension represented on that axis could berecorded. In such cases it is generally quite apparent
approximately where in the plotted scatter of points thesymbol would have occurred had both dimensions beenrecordable.
In keeping with the general aims of this primarypublication of the results of excavations at Kissonerga,the present report on the animal remains is intendedmainly as a presentation of information, and it is fo-cused at the intra-site level. Basic interpretations ofvarious aspects of the data have been presented here,but clearly such a large body of faunal data merits
Table 22.1. Total numbers of identified mammalianbone fragments
Taxon Total %
Deer 4,375 38.7Pig 4,615 40.8Caprine 1,998 17.7Fox 210 1.9Bos 51 0.5Dog 33 0.3Cat 16 0.1Hippopotamus 1 -Equid 1 -Cetacean 1 -Seal 1 -
Total 11,302 100.0
Table 22.2. Weights of non-fossil terrestrial mammal-ian bone
Taxon Weight (g) %
IdentifiedDeer 84,016 1 50.2Pig 52,597 31.4Caprines 28,340 2 16.9Bos 1,692 1.0Fox 460 0.3Dog 120 0.1Equus 50 +Cat 40 +
Total Identified 167,315 (51.8% of total sample)
Unidentified 3 155,717 (48.2% of total sample)
Total Sample 323,032
1 figure includes 11,070 g of antler2 figure includes 4,903 g of horncore3 0.4% of unidentified material clearly derives from large animals of
Bos/Equus size, whilst these large animals account for 1.0% of theweight of identified material.
§ 22 Animal Remains: Discussion
296
further discussion in the context of what is known fromother Early Prehistoric sites on the island of Cyprus,and, more generally, in the context of a wider geo-graphical and temporal framework. Such a discussiondoes not, however, fall within the scope of this contri-bution, and it must be reserved for another occasion.For a recent attempt at a more synthetic faunal-basedview of economic developments in Early PrehistoricCyprus the reader is referred to Croft (1991).
§ 22.2 Sample bias and recovery
§ 22.2.1 Sample bias
The extent to which all of the animals which contrib-uted to a faunal sample are actually represented in it, isdependent upon a range of cultural and environmentalfactors. Normally the bone sample recovered from anancient settlement site is but a small fraction of thetotal amount of skeletal material from which it derives,and this is, in turn, often only a tiny portion of the re-mains of the animal populations which were exploitedby the human inhabitants of the site. Nevertheless, thefullest possible understanding of human exploitation ofanimal populations would require that these "target"populations of animals be reconstructed. However,since the adequacy of archaeological samples to serveas a basis for extrapolation to target populations cannotbe evaluated without prior knowledge of the structure ofthe very target populations which are to be recon-structed, zooarchaeology may be seen to be workingwithin severe constraints.
Taphonomic processes regulate the transition fromthe complete skeletons of slaughtered animals to theusually much-diminished assemblage of animal bonewhich awaits the excavator. Since an understanding ofthese processes is crucial if reconstructions of the pastbased on faunal data are ever to attain a high degree ofreliability, considerable attention has been paid to themfor well over a decade (e.g. Behrensmeyer and Hill1980; Binford 1981). Notwithstanding that progresshas been slow and that no easy answers have emerged,an essentially new climate of thought has emerged inzooarchaeology. Perhaps the most important effect ofthis has been to focus attention on the fact that ar-chaeological faunal assemblages are normally severelyattenuated and consequently furnish a biased set of datafrom which to reconstruct the past.
Although adequate strategies for circumventing thedistorting effects of the differential destruction of thebones of different taxa and of different elements withina given taxon, have yet to be devised, it is possible tomake a rough estimate of the probable overall extent ofassemblage attenuation. Despite the fact that MNI(Minimum Number of Individuals) figures are knownto possess severe deficiencies as a basic unit of faunalquantification, they may usefully be employed in mak-ing such an estimate. It is, furthermore, necessary to
assume that the dry weight of the skeleton amounts to aconstant proportion of total live bodyweight for each ofthe main animals under discussion viz. deer, pig andcaprines. Following Bourdillon and Coy (1980, 83) ithas been assumed that this proportion is 7%.
If (minimal) MNI figures (generated by Grayson's(1973) "minimum distinction" approach) for each ofthe main taxa represented at Kissonerga are multipliedby 7% of the estimated live bodyweight of a single in-dividual, the resulting value represents a minimal esti-mate of the weight of bone which that taxon ought tohave contributed to the assemblage. The estimates oflive body weight employed are deer 96 kg, pig 60 kgand caprines 34 kg. (The use of these figures has beendiscussed elsewhere by the writer (Croft 1988a; 1991,Table 1), although the weight estimate used here forpig is reduced in order to take account of the high fre-quency of pre-adult culling at Kissonerga.) The differ-ences between the sum of the estimates of potentialbone weight for all taxa and the weight of bone actuallyrecovered suggests the minimum amount of bone whichhas been lost between the slaughter of the animals andthe recovery of the faunal sample.
The calculation for the Kissonerga animal boneassemblage is as follows: MNI figures of 136 deer, 97pigs and 67 caprines suggest a theoretical minimumassemblage total of 1,480.7 kg. The actual total weightof animal bone recovered (excluding identified remainsof taxa other than these main three, but including uni-dentified material of the correct general size) was 320.1kg. Thus, a minimal estimate of the proportion of theKissonerga assemblage which is missing is 78.4%.
Any claim for the accuracy of the forgoing calcula-tions would almost certainly be misplaced; the result isbest viewed as an extremely rough estimate. An esti-mated level of attrition of around four-fifths does, how-ever, serve to illustrate the point that Kissonerga is noexception to the general rule that faunal samples nor-mally represent a very small proportion of even theminimum amount of material from which they couldpossibly have been derived.
Table 22.3. The impact of wet sieving on the bone as-semblages for selected animals
Taxon Number of Theoretical total Estimatedidentifiable fragments assemblage %
Excavated wet sieved size missed
Cattle 51 0 51 0Deer 4,313 62 10,513 58Caprine 1,964 34 5,398 63Pig 4,505 110 15,505 70Fox 193 17 1,893 89Bird 75 32 3,275 97
§ 22 Animal Remains: Discussion
297
§ 22.2.2 Recovery
During the first three seasons of work at Kissonerga drysieving was conducted sporadically, at the discretion ofindividual archaeologists, using a variety of sieves andprimarily with a view to recovering small artefacts.This unsatisfactory situation was remedied in the fourth(1986) season with the introduction of a more system-atic programme of flotation and water sieving employ-ing a standard range of meshes (1 mm for the wetsieve) and geared primarily to the recovery of biologicalremains.
Whilst the most conspicuous result of this samplingprogramme has perhaps been the recovery of a substan-tial assemblage of plant remains by flotation (§ 11), theconsequences for the faunal assemblage of wet sieving
have been not inconsiderable. The fact that smalleritems tend to be more prevalent amongst the findswhen excavated deposits have been sieved than whenthey have not is reflected in the fact that the wet sieveyielded a greater proportion of the identified remains ofthe smaller rather than the larger animals. Thus, nocattle remains and only 1.4% of deer remains were re-covered in this way, but 8.1% of fox remains and29.9% of bird remains, to give but a few examples,were recovered in the wet sieve.
If, for the sake of argument, it is assumed that 1%of excavated deposits was wet sieved (certainly an over-estimate), then the figures quoted above may be put intosome sort of perspective. Of a total of 4,375 identifieddeer bones from Kissonerga, 4,313 were recoveredduring excavation and a further 62 from wet sieving anestimated 1% of all excavated deposits. This suggeststhat wet sieving of 100% of the excavated deposits
Table 22.4b. Pig
Element Left Right ND Total
scapula 76 84 2 162p. humerus 43 47 - 90d. humerus 94 96 3 193p. ulna 78 70 - 148d. ulna 16 12 - 28p. radius 63 64 1 128d. radius 34 40 - 74p. femur 34 50 1 85d. femur 72 76 - 148patella 12 11 - 23p. tibia 51 45 1 97d. tibia 41 44 - 85astragalus 44 29 1 74calcaneum 79 67 1 147
atlas - - - 66axis - - - 21sacrum - - - 24pelvic frags - - - 260carpals - - - 26tarsals - - - 39longbone shafts - - - 183m/carpal III/IV - - - 100.5m/tarsal III/IV - - - 57m/podial III/IV - - - 77phalanx 1 - - - 308phalanx 2 - - - 107phalanx 3 - - - 124
Total* 2,874.5*number of whole bones possessing twoarticular ends, to be subtracted 9
TOTAL POSTCRANIAL FRAGMENTS 2,865.5head 1,004
TOTAL FRAGMENTS 3,869.5
* In order that this total should be comparable with those for the othertaxa it excludes 325 fragments of metapodia II and V, 125 accessoryphalanges and 60 fragments of fibula, since these elements have noanalogues in the deer or caprine skeleton. Furthermore, only half of thefull total of 469 fragments of metapodia III and IV is included, since theanatomical analogue of these paired elements is a single cannon bone.
Table 22.4a-d. Breakdown by element of identifiedmaterial of the main animal taxa
Table 22.4a. Deer
Element Left Right ND Total
scapula 85 90 17 192p. humerus 45 42 4 91d. humerus 128 135 8 271p. ulna 71 82 - 153d. ulna 4 4 - 8p. radius 100 113 2 215d. radius 73 94 2 169p. femur 46 64 28 138d. femur 90 132 4 226patella 29 24 1 54p. tibia 55 57 - 112d. tibia 92 111 1 204astragalus 47 48 4 99calcaneum 52 46 2 100nav-cuboid 16 16 - 32p.m/carpal 34 21 - 55d.m/carpal 8 7 45 60p.m/tarsal 27 23 - 50d.m/tarsal 75 12 38 67p.m/podial - - 4 4d.m/podial - - 27 27
atlas - - - 25axis - - - 57pelvic frags - - - 331sacrum - - - 45sesamoid - - - 3carpals - - - 42tarsals - - - 13os malleolare - - - 12longbone shafts - - - 429phalanx 1 - - - 226phalanx 2 - - - 145phalanx 3 - - - 94
Total 3,749number of whole bones possessing twoarticular ends, to be subtracted 4
TOTAL POSTCRANIAL FRAGMENTS 3,745head 346antler 284
TOTAL FRAGMENTS 4,375
§ 22 Animal Remains: Discussion
298
should have yielded 6,200 identifiable deer remains, i.e.considerably more than were actually recovered on site.Adding together the number of identifiable deer re-mains which were retrieved and the theoretical numberwhich were overlooked it may be concluded that some58% of available identifiable deer bones was missed.For other taxa the equivalent figures are caprines 63%,pig 70%, fox 89% and bird 97% (Table 22.3). Thus, bycomparison with the recovery rate for deer remains(which was itself less than ideal), the recovery rate forthe remains of the smaller caprines and pig was ratherpoor, whilst that for fox and bird (very small creatures)was comparatively very poor, the vast majority of theirremains having apparently been overlooked.
The situation which has been described of differen-
tial recovery rates and a failure to retrieve more than afraction of the total number of bone fragments on a siteposes severe problems for the accurate interpretation ofthe faunal assemblage which was recovered. In at-tempting to evaluate what the assemblage contains, it isclearly necessary to consider what it does not contain.This state of affairs is by no means peculiar to the Kis-sonerga assemblage, and will inevitably prevail to somedegree in any assemblage which was retrieved by lessthan total sieving through a fine wet sieve. The imple-mentation of the sampling programme at Kissonergahas at least permitted some estimate to be made of theseverity of the problem of partial recovery, and the re-sults, although perhaps disquieting, provide a generalindication of the extent to which caution must be ap-plied in accepting the credibility of the conclusionswhich have been drawn.
Although the conclusions of faunal analyses such asthe present one are conventionally (if implicitly) pre-sented as truths, the foregoing caveat reminds us thatsuch "truths" are, in fact, merely approximations with amargin of error of virtually indefinable extent. Howeversound the scientific background and however developedthe zoological and statistical expertise of the practi-tioner, zooarchaeological interpretation remains a frus-tratingly approximate art.
Table 22.4c. Caprines
Element Left Right ND Total IncludesGoat Sheep
scapula 40 34 3 77 29 5p. humerus 23 15 - 38 3 1d. humerus 53 67 2 122 13 1p. ulna 52 47 - 99 21 2d. ulna 3 4 - 7 - -p. radius 44 36 - 80 42 4d. radius 27 31 - 58 26 -p. femur 32 26 1 59 21 7d. femur 36 36 1 73 - -patella 5 8 1 14 - -p. tibia 27 25 - 52 - -d. tibia 40 38 - 78 4 -astragalus 27 29 1 57 32 2calcaneum 27 33 5 65 30 5nav-cuboid 9 9 - 18 8 -p.m/carpal 13 24 - 37 2 1d.m/carpal 2 7 11 20 8 1p.m/tarsal 25 22 5 52 3 -d.m/tarsal 5 4 9 18 7 1p.m/podial - - 3 3 - -d.m/podial - 1 35 36 8 -
atlas - - - 37 3 3axis - - - 48 5 1pelvic frags - - - 156 19 2sacrum - - - 17 - -sesamoid - - - 1 - -os malleolare - - - 5 - -carpals - - - 9 - -tarsals - - - 3 - -longbone shafts - - - 106 1 1phalanx 1 - - - 115 1 -phalanx 2 - - - 73 8 -phalanx 3 - - - 39 22 5
Total 1672 316 42number of whole bones possessingtwo articular ends and fused proximalulnae/radii, to be subtracted 10
TOTAL POSTCRANIAL FRAGMENTS 1662 316 42head 257 4 -horncore 79 42 2
TOTAL FRAGMENTS 1998 362 44
Table 22.4d. Fox
Element Left Right ND Total
scapula 2 3 - 5p. humerus - 3 - 3d. humerus 8 5 - 13p. ulna 8 13 - 21p. radius 2 4 - 6d. radius 1 4 - 5p. femur 3 2 1 6d. femur 5 2 - 7p. tibia - 3 - 3d. tibia 6 6 - 12astragalus 1 1 - 2calcaneum 3 2 - 5metacarpal 7 7 - 14metatarsal 8 8 - 16metapodial - - 11 11
vertebra - - - 6atlas - - - 2pelvic frags - - - 12sacrum - - - 1longbone shafts - - - 18phalanges - - - 14
head - - - 33
Total 215number of whole bones possessing twoarticular ends, to be subtracted 5
TOTAL FRAGMENTS 210
§ 22 Animal Remains: Discussion
299
§ 22.3 Skeletal element representation
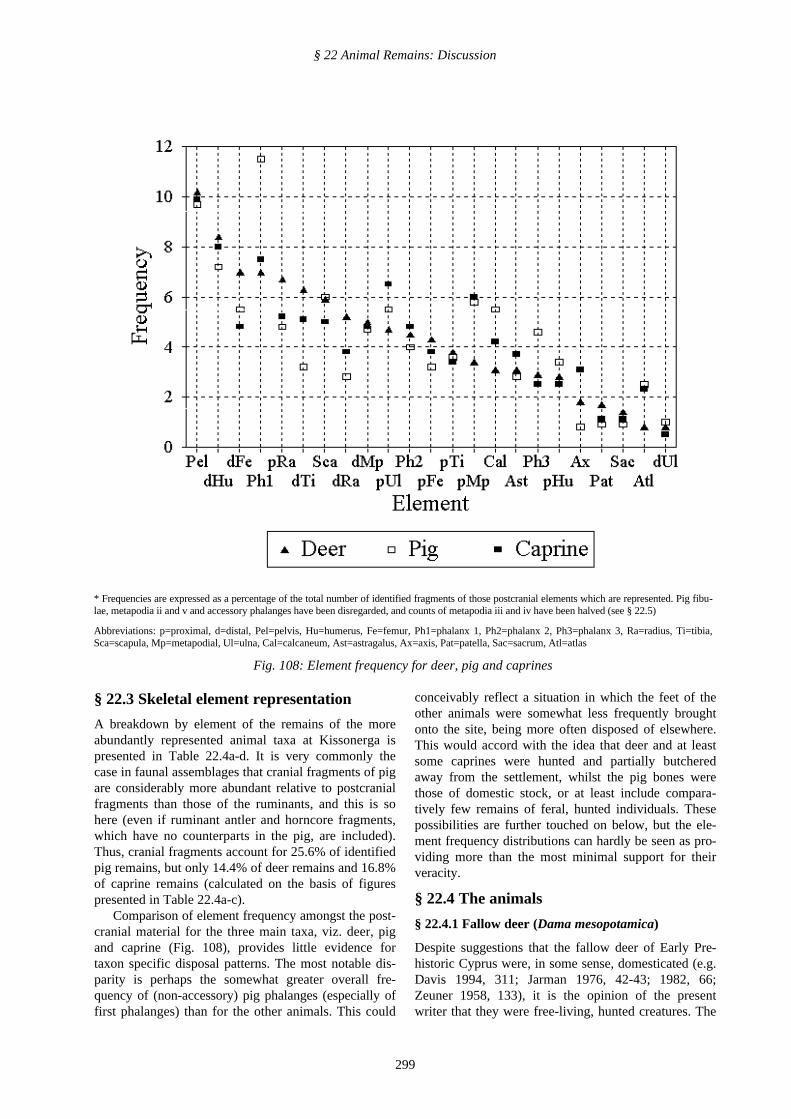
A breakdown by element of the remains of the moreabundantly represented animal taxa at Kissonerga ispresented in Table 22.4a-d. It is very commonly thecase in faunal assemblages that cranial fragments of pigare considerably more abundant relative to postcranialfragments than those of the ruminants, and this is sohere (even if ruminant antler and horncore fragments,which have no counterparts in the pig, are included).Thus, cranial fragments account for 25.6% of identifiedpig remains, but only 14.4% of deer remains and 16.8%of caprine remains (calculated on the basis of figurespresented in Table 22.4a-c).
Comparison of element frequency amongst the post-cranial material for the three main taxa, viz. deer, pigand caprine (Fig. 108), provides little evidence fortaxon specific disposal patterns. The most notable dis-parity is perhaps the somewhat greater overall fre-quency of (non-accessory) pig phalanges (especially offirst phalanges) than for the other animals. This could
conceivably reflect a situation in which the feet of theother animals were somewhat less frequently broughtonto the site, being more often disposed of elsewhere.This would accord with the idea that deer and at leastsome caprines were hunted and partially butcheredaway from the settlement, whilst the pig bones werethose of domestic stock, or at least include compara-tively few remains of feral, hunted individuals. Thesepossibilities are further touched on below, but the ele-ment frequency distributions can hardly be seen as pro-viding more than the most minimal support for theirveracity.
§ 22.4 The animals
§ 22.4.1 Fallow deer (Dama mesopotamica)
Despite suggestions that the fallow deer of Early Pre-historic Cyprus were, in some sense, domesticated (e.g.Davis 1994, 311; Jarman 1976, 42-43; 1982, 66;Zeuner 1958, 133), it is the opinion of the presentwriter that they were free-living, hunted creatures. The
* Frequencies are expressed as a percentage of the total number of identified fragments of those postcranial elements which are represented. Pig fibu-lae, metapodia ii and v and accessory phalanges have been disregarded, and counts of metapodia iii and iv have been halved (see § 22.5)
Abbreviations: p=proximal, d=distal, Pel=pelvis, Hu=humerus, Fe=femur, Ph1=phalanx 1, Ph2=phalanx 2, Ph3=phalanx 3, Ra=radius, Ti=tibia,Sca=scapula, Mp=metapodial, Ul=ulna, Cal=calcaneum, Ast=astragalus, Ax=axis, Pat=patella, Sac=sacrum, Atl=atlas
Fig. 108: Element frequency for deer, pig and caprines
§ 22 Animal Remains: Discussion
300
arguments for the free-living rather than domesticstatus of the fallow deer have been rehearsed elsewhere(Croft 1988a; 1991, 64-66) and will not be reiteratedhere. It is stressed, however, that the non-domesticstatus of the deer should not be taken to imply that theirexploitation was a random, unstructured affair. Indeed,culling patterns deduced from deer remains from Kis-sonerga and other Cypriot sites show very clearly that a
system of game management must have existedamongst the human communities whose subsistencedepended heavily upon deer over several millennia.
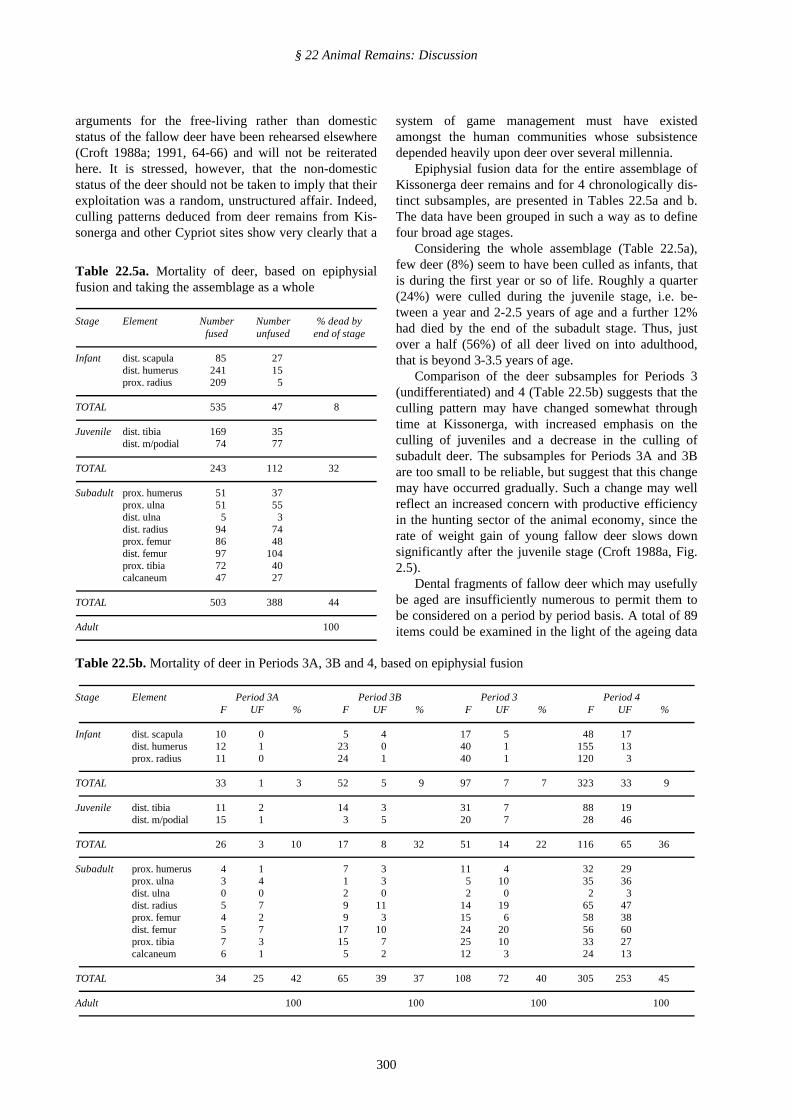
Epiphysial fusion data for the entire assemblage ofKissonerga deer remains and for 4 chronologically dis-tinct subsamples, are presented in Tables 22.5a and b.The data have been grouped in such a way as to definefour broad age stages.
Considering the whole assemblage (Table 22.5a),few deer (8%) seem to have been culled as infants, thatis during the first year or so of life. Roughly a quarter(24%) were culled during the juvenile stage, i.e. be-tween a year and 2-2.5 years of age and a further 12%had died by the end of the subadult stage. Thus, justover a half (56%) of all deer lived on into adulthood,that is beyond 3-3.5 years of age.
Comparison of the deer subsamples for Periods 3(undifferentiated) and 4 (Table 22.5b) suggests that theculling pattern may have changed somewhat throughtime at Kissonerga, with increased emphasis on theculling of juveniles and a decrease in the culling ofsubadult deer. The subsamples for Periods 3A and 3Bare too small to be reliable, but suggest that this changemay have occurred gradually. Such a change may wellreflect an increased concern with productive efficiencyin the hunting sector of the animal economy, since therate of weight gain of young fallow deer slows downsignificantly after the juvenile stage (Croft 1988a, Fig.2.5).
Dental fragments of fallow deer which may usefullybe aged are insufficiently numerous to permit them tobe considered on a period by period basis. A total of 89items could be examined in the light of the ageing data
Table 22.5b. Mortality of deer in Periods 3A, 3B and 4, based on epiphysial fusion
Stage Element Period 3A Period 3B Period 3 Period 4F UF % F UF % F UF % F UF %
Infant dist. scapula 10 0 5 4 17 5 48 17dist. humerus 12 1 23 0 40 1 155 13prox. radius 11 0 24 1 40 1 120 3
TOTAL 33 1 3 52 5 9 97 7 7 323 33 9
Juvenile dist. tibia 11 2 14 3 31 7 88 19dist. m/podial 15 1 3 5 20 7 28 46
TOTAL 26 3 10 17 8 32 51 14 22 116 65 36
Subadult prox. humerus 4 1 7 3 11 4 32 29prox. ulna 3 4 1 3 5 10 35 36dist. ulna 0 0 2 0 2 0 2 3dist. radius 5 7 9 11 14 19 65 47prox. femur 4 2 9 3 15 6 58 38dist. femur 5 7 17 10 24 20 56 60prox. tibia 7 3 15 7 25 10 33 27calcaneum 6 1 5 2 12 3 24 13
TOTAL 34 25 42 65 39 37 108 72 40 305 253 45
Adult 100 100 100 100
Table 22.5a. Mortality of deer, based on epiphysialfusion and taking the assemblage as a whole
Stage Element Number Number % dead byfused unfused end of stage
Infant dist. scapula 85 27dist. humerus 241 15prox. radius 209 5
TOTAL 535 47 8
Juvenile dist. tibia 169 35dist. m/podial 74 77
TOTAL 243 112 32
Subadult prox. humerus 51 37prox. ulna 51 55dist. ulna 5 3dist. radius 94 74prox. femur 86 48dist. femur 97 104prox. tibia 72 40calcaneum 47 27
TOTAL 503 388 44
Adult 100
§ 22 Animal Remains: Discussion
301
of Chapman and Chapman (1975), and the results con-cur well with the conclusions on deer mortality inferredfrom epiphysial fusion data. Dental data tend, com-paratively, to underestimate the incidence of youngdeath, suggesting that only 5% died at ages of 14months or less (compared with the fusion-based esti-mate of 9% by c. 12 months). However, estimates thatby 18 months (mid-juvenile stage) 22% had died andthat by 22 months (late juvenile stage) 35% had died,accord extremely closely with the fusion evidence.
Tentative estimates of the age of dental fragmentsolder than three years suggest that death occurred mostfrequently in the 5th year (8 items), but not infrequentlyin the 4th year (n=3), 6th year (n=4) and 7th year(n=3). Only one item seemed likely to derive from adeer older than 7 years.
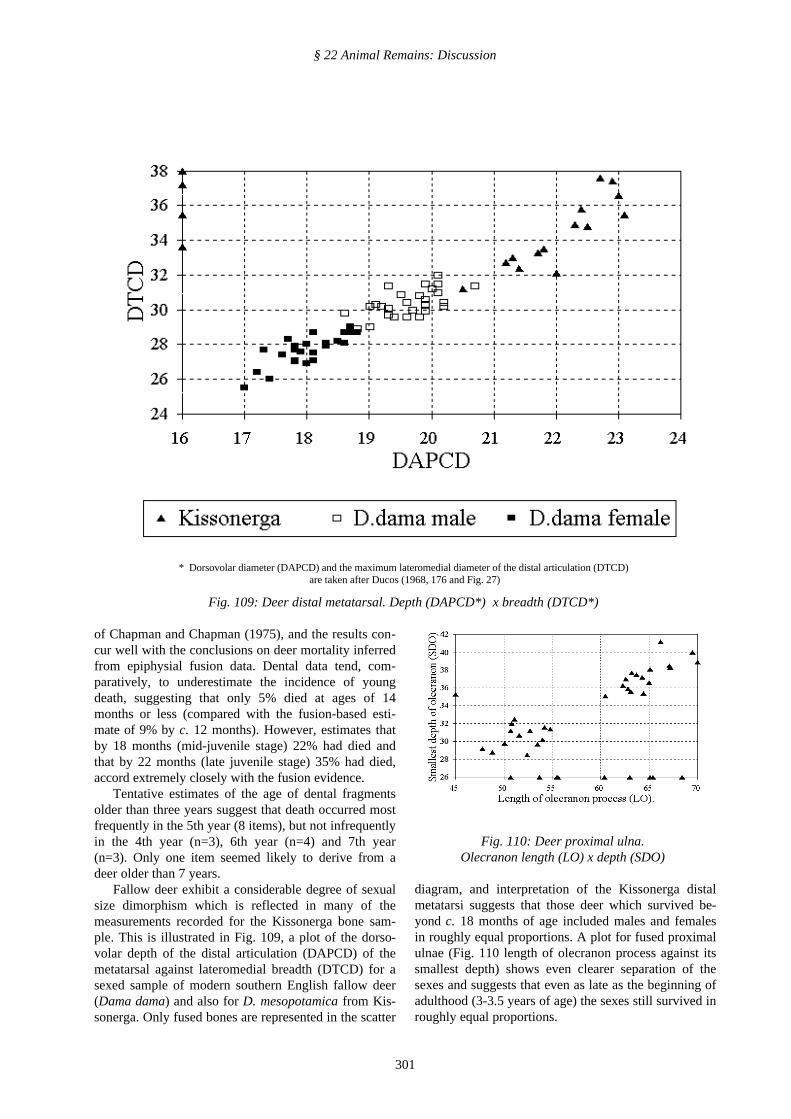
Fallow deer exhibit a considerable degree of sexualsize dimorphism which is reflected in many of themeasurements recorded for the Kissonerga bone sam-ple. This is illustrated in Fig. 109, a plot of the dorso-volar depth of the distal articulation (DAPCD) of themetatarsal against lateromedial breadth (DTCD) for asexed sample of modern southern English fallow deer(Dama dama) and also for D. mesopotamica from Kis-sonerga. Only fused bones are represented in the scatter
diagram, and interpretation of the Kissonerga distalmetatarsi suggests that those deer which survived be-yond c. 18 months of age included males and femalesin roughly equal proportions. A plot for fused proximalulnae (Fig. 110 length of olecranon process against itssmallest depth) shows even clearer separation of thesexes and suggests that even as late as the beginning ofadulthood (3-3.5 years of age) the sexes still survived inroughly equal proportions.
* Dorsovolar diameter (DAPCD) and the maximum lateromedial diameter of the distal articulation (DTCD) are taken after Ducos (1968, 176 and Fig. 27)
Fig. 109: Deer distal metatarsal. Depth (DAPCD*) x breadth (DTCD*)
Fig. 110: Deer proximal ulna.Olecranon length (LO) x depth (SDO)
§ 22 Animal Remains: Discussion
302
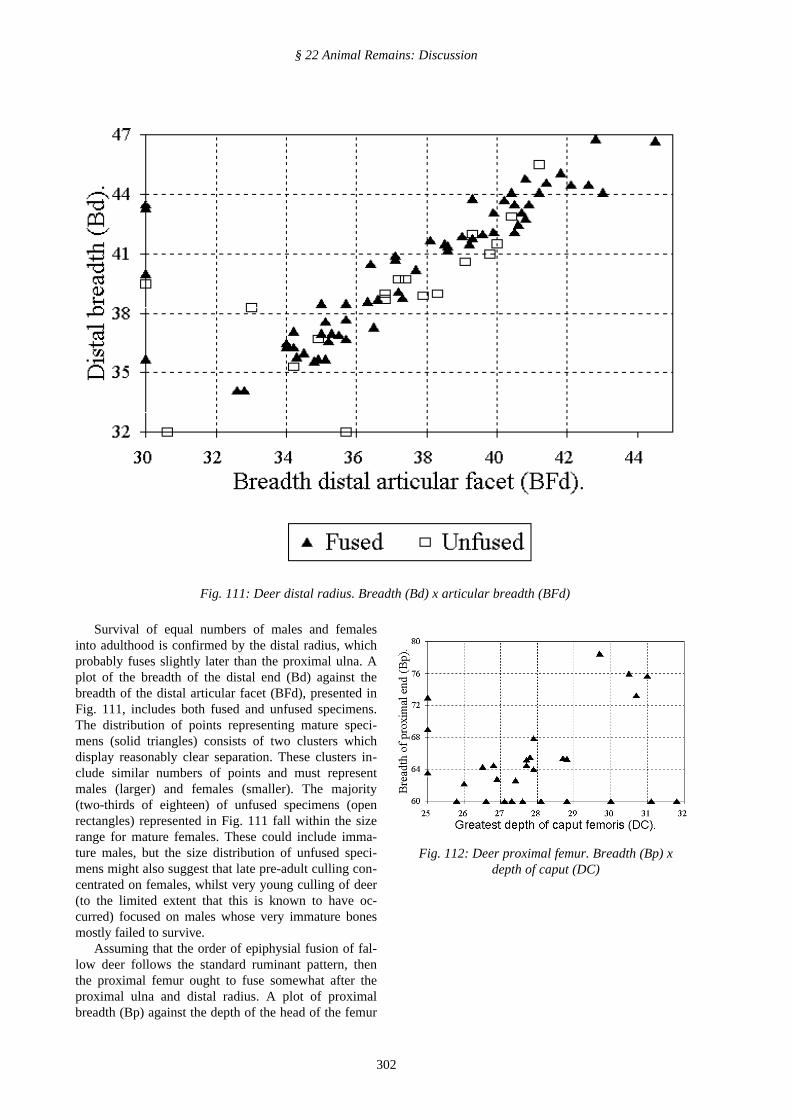
Survival of equal numbers of males and femalesinto adulthood is confirmed by the distal radius, whichprobably fuses slightly later than the proximal ulna. Aplot of the breadth of the distal end (Bd) against thebreadth of the distal articular facet (BFd), presented inFig. 111, includes both fused and unfused specimens.The distribution of points representing mature speci-mens (solid triangles) consists of two clusters whichdisplay reasonably clear separation. These clusters in-clude similar numbers of points and must representmales (larger) and females (smaller). The majority(two-thirds of eighteen) of unfused specimens (openrectangles) represented in Fig. 111 fall within the sizerange for mature females. These could include imma-ture males, but the size distribution of unfused speci-mens might also suggest that late pre-adult culling con-centrated on females, whilst very young culling of deer(to the limited extent that this is known to have oc-curred) focused on males whose very immature bonesmostly failed to survive.
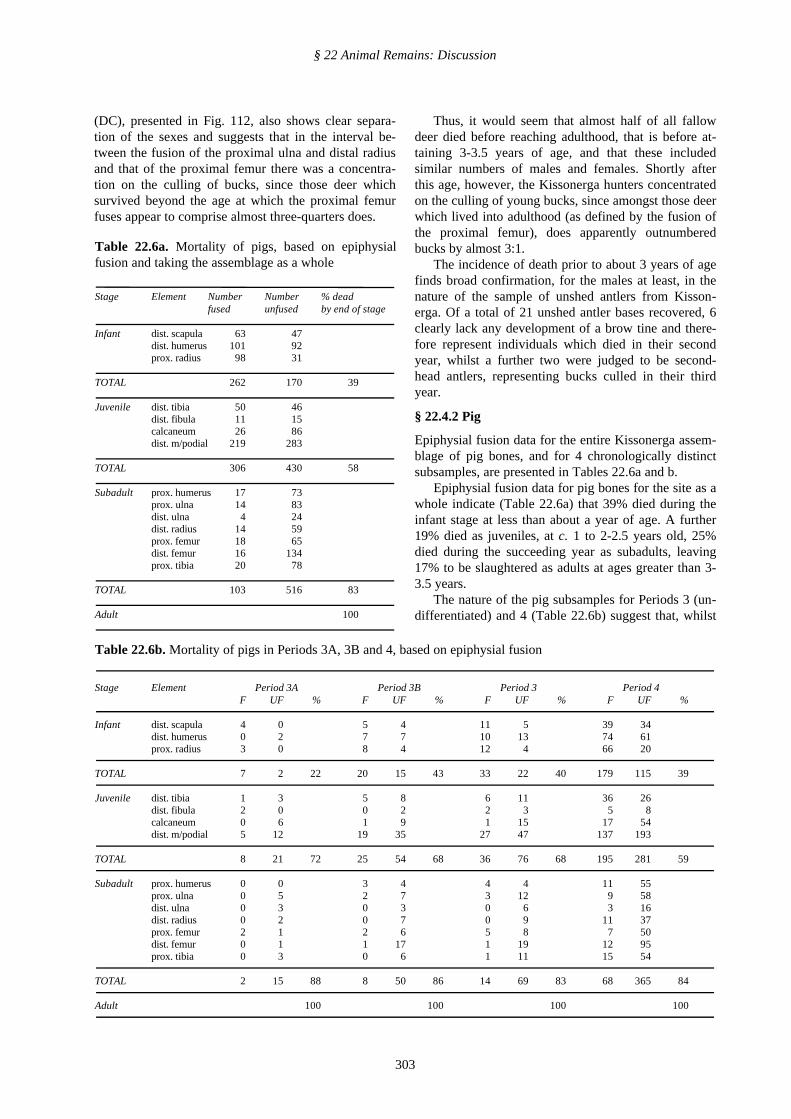
Assuming that the order of epiphysial fusion of fal-low deer follows the standard ruminant pattern, thenthe proximal femur ought to fuse somewhat after theproximal ulna and distal radius. A plot of proximalbreadth (Bp) against the depth of the head of the femur
Fig. 111: Deer distal radius. Breadth (Bd) x articular breadth (BFd)
Fig. 112: Deer proximal femur. Breadth (Bp) xdepth of caput (DC)
§ 22 Animal Remains: Discussion
303
(DC), presented in Fig. 112, also shows clear separa-tion of the sexes and suggests that in the interval be-tween the fusion of the proximal ulna and distal radiusand that of the proximal femur there was a concentra-tion on the culling of bucks, since those deer whichsurvived beyond the age at which the proximal femurfuses appear to comprise almost three-quarters does.
Thus, it would seem that almost half of all fallowdeer died before reaching adulthood, that is before at-taining 3-3.5 years of age, and that these includedsimilar numbers of males and females. Shortly afterthis age, however, the Kissonerga hunters concentratedon the culling of young bucks, since amongst those deerwhich lived into adulthood (as defined by the fusion ofthe proximal femur), does apparently outnumberedbucks by almost 3:1.
The incidence of death prior to about 3 years of agefinds broad confirmation, for the males at least, in thenature of the sample of unshed antlers from Kisson-erga. Of a total of 21 unshed antler bases recovered, 6clearly lack any development of a brow tine and there-fore represent individuals which died in their secondyear, whilst a further two were judged to be second-head antlers, representing bucks culled in their thirdyear.
§ 22.4.2 Pig
Epiphysial fusion data for the entire Kissonerga assem-blage of pig bones, and for 4 chronologically distinctsubsamples, are presented in Tables 22.6a and b.
Epiphysial fusion data for pig bones for the site as awhole indicate (Table 22.6a) that 39% died during theinfant stage at less than about a year of age. A further19% died as juveniles, at c. 1 to 2-2.5 years old, 25%died during the succeeding year as subadults, leaving17% to be slaughtered as adults at ages greater than 3-3.5 years.
The nature of the pig subsamples for Periods 3 (un-differentiated) and 4 (Table 22.6b) suggest that, whilst
Table 22.6a. Mortality of pigs, based on epiphysialfusion and taking the assemblage as a whole
Stage Element Number Number % deadfused unfused by end of stage
Infant dist. scapula 63 47dist. humerus 101 92prox. radius 98 31
TOTAL 262 170 39
Juvenile dist. tibia 50 46dist. fibula 11 15calcaneum 26 86dist. m/podial 219 283
TOTAL 306 430 58
Subadult prox. humerus 17 73prox. ulna 14 83dist. ulna 4 24dist. radius 14 59prox. femur 18 65dist. femur 16 134prox. tibia 20 78
TOTAL 103 516 83
Adult 100
Table 22.6b. Mortality of pigs in Periods 3A, 3B and 4, based on epiphysial fusion
Stage Element Period 3A Period 3B Period 3 Period 4F UF % F UF % F UF % F UF %
Infant dist. scapula 4 0 5 4 11 5 39 34dist. humerus 0 2 7 7 10 13 74 61prox. radius 3 0 8 4 12 4 66 20
TOTAL 7 2 22 20 15 43 33 22 40 179 115 39
Juvenile dist. tibia 1 3 5 8 6 11 36 26dist. fibula 2 0 0 2 2 3 5 8calcaneum 0 6 1 9 1 15 17 54dist. m/podial 5 12 19 35 27 47 137 193
TOTAL 8 21 72 25 54 68 36 76 68 195 281 59
Subadult prox. humerus 0 0 3 4 4 4 11 55prox. ulna 0 5 2 7 3 12 9 58dist. ulna 0 3 0 3 0 6 3 16dist. radius 0 2 0 7 0 9 11 37prox. femur 2 1 2 6 5 8 7 50dist. femur 0 1 1 17 1 19 12 95prox. tibia 0 3 0 6 1 11 15 54
TOTAL 2 15 88 8 50 86 14 69 83 68 365 84
Adult 100 100 100 100
§ 22 Animal Remains: Discussion
304
infant slaughter remained just as frequent (about 40%),rather fewer pigs (20% compared with 28%) may havebeen slaughtered as juveniles and rather more (25%compared with 15%) as subadults during the later pe-riod. The subsamples for Periods 3A and 3B are insuf-ficiently large to permit any further refinement of thissuggestion.
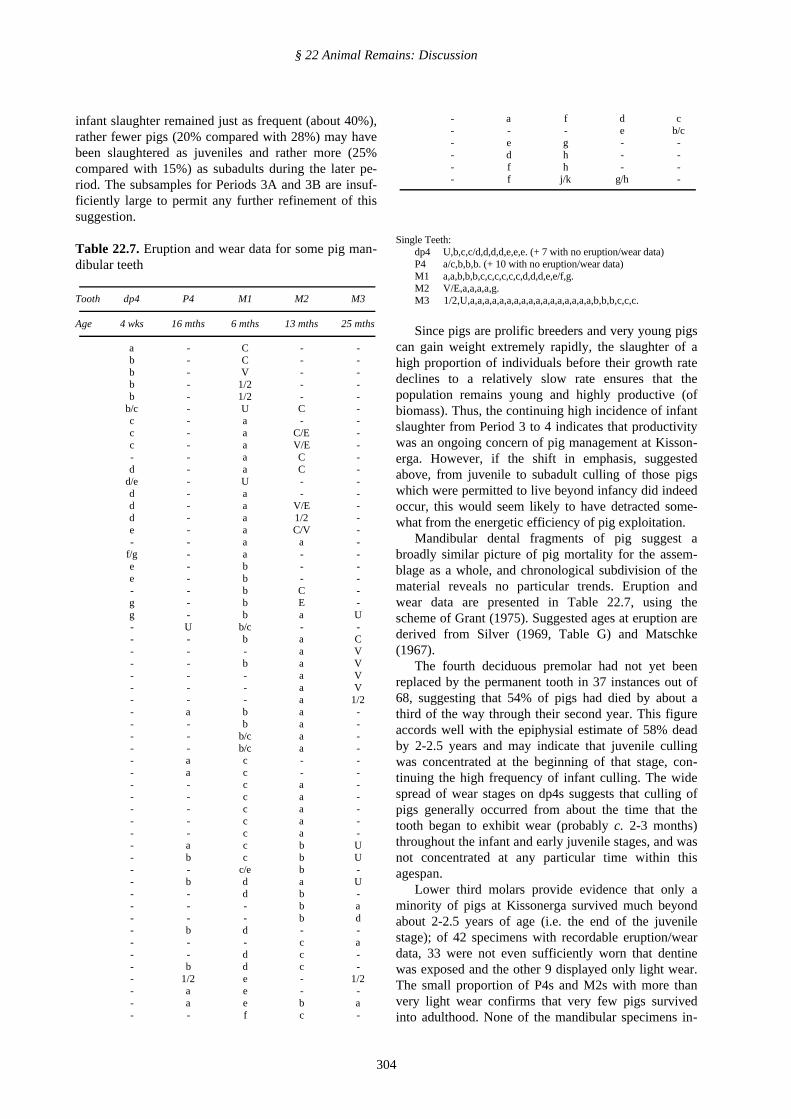
Table 22.7. Eruption and wear data for some pig man-dibular teeth
Tooth dp4 P4 M1 M2 M3
Age 4 wks 16 mths 6 mths 13 mths 25 mths
a - C - -b - C - -b - V - -b - 1/2 - -b - 1/2 - -
b/c - U C -c - a - -c - a C/E -c - a V/E -- - a C -d - a C -
d/e - U - -d - a - -d - a V/E -d - a 1/2 -e - a C/V -- - a a -
f/g - a - -e - b - -e - b - -- - b C -g - b E -g - b a U- U b/c - -- - b a C- - - a V- - b a V- - - a V- - - a V- - - a 1/2- a b a -- - b a -- - b/c a -- - b/c a -- a c - -- a c - -- - c a -- - c a -- - c a -- - c a -- - c a -- a c b U- b c b U- - c/e b -- b d a U- - d b -- - - b a- - - b d- b d - -- - - c a- - d c -- b d c -- 1/2 e - 1/2- a e - -- a e b a- - f c -
- a f d c- - - e b/c- e g - -- d h - -- f h - -- f j/k g/h -
Single Teeth:dp4 U,b,c,c/d,d,d,d,e,e,e. (+ 7 with no eruption/wear data)P4 a/c,b,b,b. (+ 10 with no eruption/wear data)M1 a,a,b,b,b,c,c,c,c,c,c,d,d,d,e,e/f,g.M2 V/E,a,a,a,a,g.M3 1/2,U,a,a,a,a,a,a,a,a,a,a,a,a,a,a,a,a,a,b,b,b,c,c,c.
Since pigs are prolific breeders and very young pigscan gain weight extremely rapidly, the slaughter of ahigh proportion of individuals before their growth ratedeclines to a relatively slow rate ensures that thepopulation remains young and highly productive (ofbiomass). Thus, the continuing high incidence of infantslaughter from Period 3 to 4 indicates that productivitywas an ongoing concern of pig management at Kisson-erga. However, if the shift in emphasis, suggestedabove, from juvenile to subadult culling of those pigswhich were permitted to live beyond infancy did indeedoccur, this would seem likely to have detracted some-what from the energetic efficiency of pig exploitation.
Mandibular dental fragments of pig suggest abroadly similar picture of pig mortality for the assem-blage as a whole, and chronological subdivision of thematerial reveals no particular trends. Eruption andwear data are presented in Table 22.7, using thescheme of Grant (1975). Suggested ages at eruption arederived from Silver (1969, Table G) and Matschke(1967).
The fourth deciduous premolar had not yet beenreplaced by the permanent tooth in 37 instances out of68, suggesting that 54% of pigs had died by about athird of the way through their second year. This figureaccords well with the epiphysial estimate of 58% deadby 2-2.5 years and may indicate that juvenile cullingwas concentrated at the beginning of that stage, con-tinuing the high frequency of infant culling. The widespread of wear stages on dp4s suggests that culling ofpigs generally occurred from about the time that thetooth began to exhibit wear (probably c. 2-3 months)throughout the infant and early juvenile stages, and wasnot concentrated at any particular time within thisagespan.
Lower third molars provide evidence that only aminority of pigs at Kissonerga survived much beyondabout 2-2.5 years of age (i.e. the end of the juvenilestage); of 42 specimens with recordable eruption/weardata, 33 were not even sufficiently worn that dentinewas exposed and the other 9 displayed only light wear.The small proportion of P4s and M2s with more thanvery light wear confirms that very few pigs survivedinto adulthood. None of the mandibular specimens in-
§ 22 Animal Remains: Discussion
305
cluded in Table 22.7 indicate advanced age, but threemaxillary dental specimens display heavy wear, sug-gesting that occasional pigs were allowed to live on intoadvanced years.
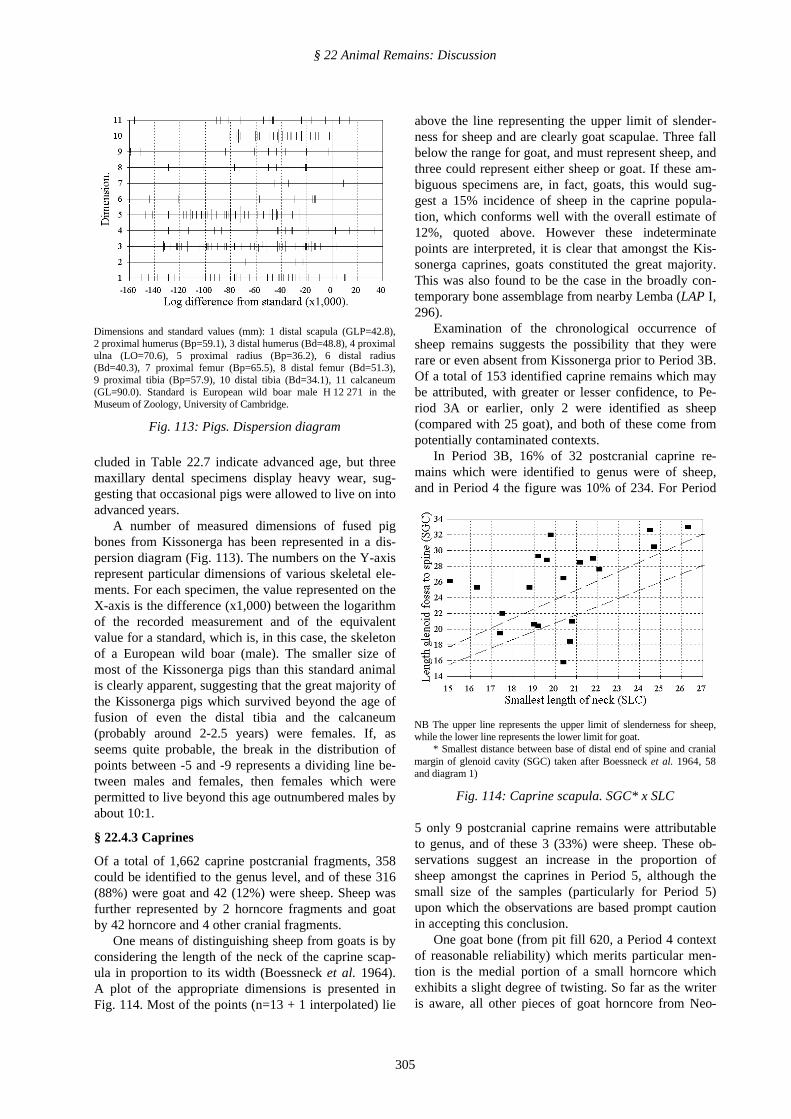
A number of measured dimensions of fused pigbones from Kissonerga has been represented in a dis-persion diagram (Fig. 113). The numbers on the Y-axisrepresent particular dimensions of various skeletal ele-ments. For each specimen, the value represented on theX-axis is the difference (x1,000) between the logarithmof the recorded measurement and of the equivalentvalue for a standard, which is, in this case, the skeletonof a European wild boar (male). The smaller size ofmost of the Kissonerga pigs than this standard animalis clearly apparent, suggesting that the great majority ofthe Kissonerga pigs which survived beyond the age offusion of even the distal tibia and the calcaneum(probably around 2-2.5 years) were females. If, asseems quite probable, the break in the distribution ofpoints between -5 and -9 represents a dividing line be-tween males and females, then females which werepermitted to live beyond this age outnumbered males byabout 10:1.
§ 22.4.3 Caprines
Of a total of 1,662 caprine postcranial fragments, 358could be identified to the genus level, and of these 316(88%) were goat and 42 (12%) were sheep. Sheep wasfurther represented by 2 horncore fragments and goatby 42 horncore and 4 other cranial fragments.
One means of distinguishing sheep from goats is byconsidering the length of the neck of the caprine scap-ula in proportion to its width (Boessneck et al. 1964).A plot of the appropriate dimensions is presented inFig. 114. Most of the points (n=13 + 1 interpolated) lie
above the line representing the upper limit of slender-ness for sheep and are clearly goat scapulae. Three fallbelow the range for goat, and must represent sheep, andthree could represent either sheep or goat. If these am-biguous specimens are, in fact, goats, this would sug-gest a 15% incidence of sheep in the caprine popula-tion, which conforms well with the overall estimate of12%, quoted above. However these indeterminatepoints are interpreted, it is clear that amongst the Kis-sonerga caprines, goats constituted the great majority.This was also found to be the case in the broadly con-temporary bone assemblage from nearby Lemba (LAP I,296).
Examination of the chronological occurrence ofsheep remains suggests the possibility that they wererare or even absent from Kissonerga prior to Period 3B.Of a total of 153 identified caprine remains which maybe attributed, with greater or lesser confidence, to Pe-riod 3A or earlier, only 2 were identified as sheep(compared with 25 goat), and both of these come frompotentially contaminated contexts.
In Period 3B, 16% of 32 postcranial caprine re-mains which were identified to genus were of sheep,and in Period 4 the figure was 10% of 234. For Period
5 only 9 postcranial caprine remains were attributableto genus, and of these 3 (33%) were sheep. These ob-servations suggest an increase in the proportion ofsheep amongst the caprines in Period 5, although thesmall size of the samples (particularly for Period 5)upon which the observations are based prompt cautionin accepting this conclusion.
One goat bone (from pit fill 620, a Period 4 contextof reasonable reliability) which merits particular men-tion is the medial portion of a small horncore whichexhibits a slight degree of twisting. So far as the writeris aware, all other pieces of goat horncore from Neo-
Dimensions and standard values (mm): 1 distal scapula (GLP=42.8),2 proximal humerus (Bp=59.1), 3 distal humerus (Bd=48.8), 4 proximalulna (LO=70.6), 5 proximal radius (Bp=36.2), 6 distal radius(Bd=40.3), 7 proximal femur (Bp=65.5), 8 distal femur (Bd=51.3),9 proximal tibia (Bp=57.9), 10 distal tibia (Bd=34.1), 11 calcaneum(GL=90.0). Standard is European wild boar male H 12 271 in theMuseum of Zoology, University of Cambridge.
Fig. 113: Pigs. Dispersion diagram
NB The upper line represents the upper limit of slenderness for sheep,while the lower line represents the lower limit for goat.
* Smallest distance between base of distal end of spine and cranialmargin of glenoid cavity (SGC) taken after Boessneck et al. 1964, 58and diagram 1)
Fig. 114: Caprine scapula. SGC* x SLC
§ 22 Animal Remains: Discussion
306
lithic and Chalcolithic Cyprus are of the untwisted"scimitar" type, displaying no hint of the helical twistwhich is so characteristic of the more developed formsof the domestic goat (Clutton-Brock 1981, 61; Zeuner1955). Torsion in goat horncores is usually regarded asa mutation which resulted from modified selective pres-sures upon goats quite early on in the process of do-
mestication (Hole et al. 1969, 277-278). However, sincea slight degree of torsion is not unknown in the hornsof the Western Asiatic wild goat (Capra aegagrus), theincreasing frequency and amplitude of this characteris-tic amongst their domestic descendants should perhapsbe viewed as the development of a pre-existing charac-ter (Ducos and Helmer 1981, 523). Whatever the de-tails of the origin of the trait, by the time of the laterChalcolithic in Cyprus, the twisted horncore has be-come the norm among domestic goat populations inmainland Western Asia. Although this is not necessar-ily the case, it may be that the twisted horncore fromKissonerga reflects changes in selective pressures upongoats in the later part of the Chalcolithic period. In-deed, the possibility is suggested below that goat man-agement underwent a change in Period 4. The apparentrarity of twisted goat horns at this time in Cyprus, andthe fact they do not seem to have occurred earlier, areprobably due to differences in the selective pressures towhich the goats were exposed on the mainland and inthe insular situation of Cyprus.
Mortality patterns for the Kissonerga goats may bededuced from epiphysial fusion data; figures are pre-sented for the assemblage as a whole (Table 22.8a) andfor four chronological subsamples (Table 22.8b). Al-though the samples include undifferentiated caprinematerial as well as items which could be attributed spe-cifically to goat, the relative rarity at Kissonerga ofbones which could be attributed to sheep suggests thatonly a minimal amount of sheep material, if any, willhave been included in these samples, which should,therefore, reflect the situation for goats.
Table 22.8a. Mortality of goats, based on epiphysialfusion and taking the assemblage as a whole
Stage Element Number Number % dead byfused unfused end of stage
Infant dist. scapula 32 8dist. humerus 98 38prox. radius 74 1
TOTAL 204 47 19%
Juvenile dist. tibia 61 16dist. m/podial 40 30
TOTAL 101 46 31%
Subadult prox. humerus 22 15prox. ulna 20 40dist. ulna 3 0dist. radius 26 32prox. femur 37 14dist. femur 34 37prox. tibia 36 16calcaneum 24 21
TOTAL 202 175 46%
Adult 100%
Table 22.8b. Mortality of goats* in Periods 3A, 3B and 4, based on epiphysial fusion
Stage Element Period 3A Period 3B Period 3 Period 4F UF % F UF % F UF % F UF %
Infant dist. scapula 1 0 1 1 4 2 17 4dist. humerus 6 1 5 1 11 2 62 16prox. radius 6 0 6 0 12 0 50 1
TOTAL 13 1 7 12 2 14 27 4 13 129 21 14
Juvenile dist. tibia 3 3 6 2 11 6 33 7dist. m/podial 4 4 4 6 8 11 20 15
TOTAL 7 7 50 10 8 44 19 17 47 53 22 29
Subadult prox. humerus 0 3 1 2 1 5 16 10prox. ulna 1 1 1 3 2 4 15 26dist. ulna 0 0 0 0 0 0 3 0dist. radius 0 4 5 3 6 7 18 17prox. femur 0 1 0 1 0 2 30 11dist. femur 1 4 1 2 3 6 28 24prox. tibia 3 3 2 1 7 5 21 7calcaneum 1 3 2 2 3 5 18 13
TOTAL 6 19 76 12 14 54 22 34 61 149 108 42
Adult 100 100 100 100
* Including items identified as undifferentiated caprine, but excluding those specifically identified as sheep.
§ 22 Animal Remains: Discussion
307
Overall 19% of the Kissonerga goats died as infantsof younger than a year old. During the juvenile stage, atover a year but less than 1.5-2.5 years of age, 12% wereslaughtered, whilst a further 15% died during the suc-ceeding subadult stage. Thus, 54% of the Kissonergagoats survived beyond 2.5-3.5 years of age to beslaughtered as adults.Table 22.9. Eruption and wear data for some caprinemandibular teeth
Tooth dp3 P4 M1 M2 M3Suggested age 0-6 24 3 12 24at eruption wks mths mths mths mths
g - b - -f/g - d C -- - - c Cg - d - -g - d - -k - h f -- - - f b/c- c h g -- h h f d/e- g h g d- g h - -- h h - -- - h h d- h h h -- h i - -- h i - -- h k - -- h k h g- h k h -- h l - -- - - h h- h n h j- i j - -- i n - -- i n h -- h k h g/h- - - h g/h- l n h j
Single Teeth:dp3 e,g,g,g,g. (+ 1 with no eruption/wear data)P4 c,g,g,h,h,h,h,i. (+ 6 with no eruption/wear data)M1 d,f,g,i,k.M2 f,f.M3 b,c,c,g,h,h,i,j,j,j,j,j
Of the chronological subsamples presented in Table22.8b, those for Periods 3A and 3B are too small to betrustworthy. The undifferentiated Period 3 subsample ishardly large enough to inspire enormous confidence,but does tend to suggest a degree of deviation from thepattern apparent from the much larger Period 4 sub-sample. It would seem that juvenile culling was muchless frequently practised in the later period (15% com-pared with 34% in Period 3), and that concomitantlymore goats survived into adulthood (58% comparedwith 39% in Period 3). A change in goat managementmay be indicated, but its significance remains obscure.
Eruption and wear data for caprine mandibles fromKissonerga are presented in Table 22.9. The stagesutilised are those of Payne (1973), beginning with “a”for first stage (enamel wear only). The presence of 11
specimens of dp3 and 32 of P4 suggests a 26% mortal-ity rate before the age of two years i.e. towards the ju-venile/subadult transition in fusion terms, which ac-cords well with the figure of 31% dead by the end ofthe juvenile stage which has been established for theassemblage as a whole (Table 22.8a). Of 22 eruptedlower third molars for which eruption and wear dataexist, 7 are in full wear (defined by Payne's 10th wearstage) and 15 exhibit lesser degrees of wear. This sug-gests that those caprines which survived into adulthoodwere generally culled as young adults. The dental dataare insufficient to permit meaningful subdivision alongchronological lines.
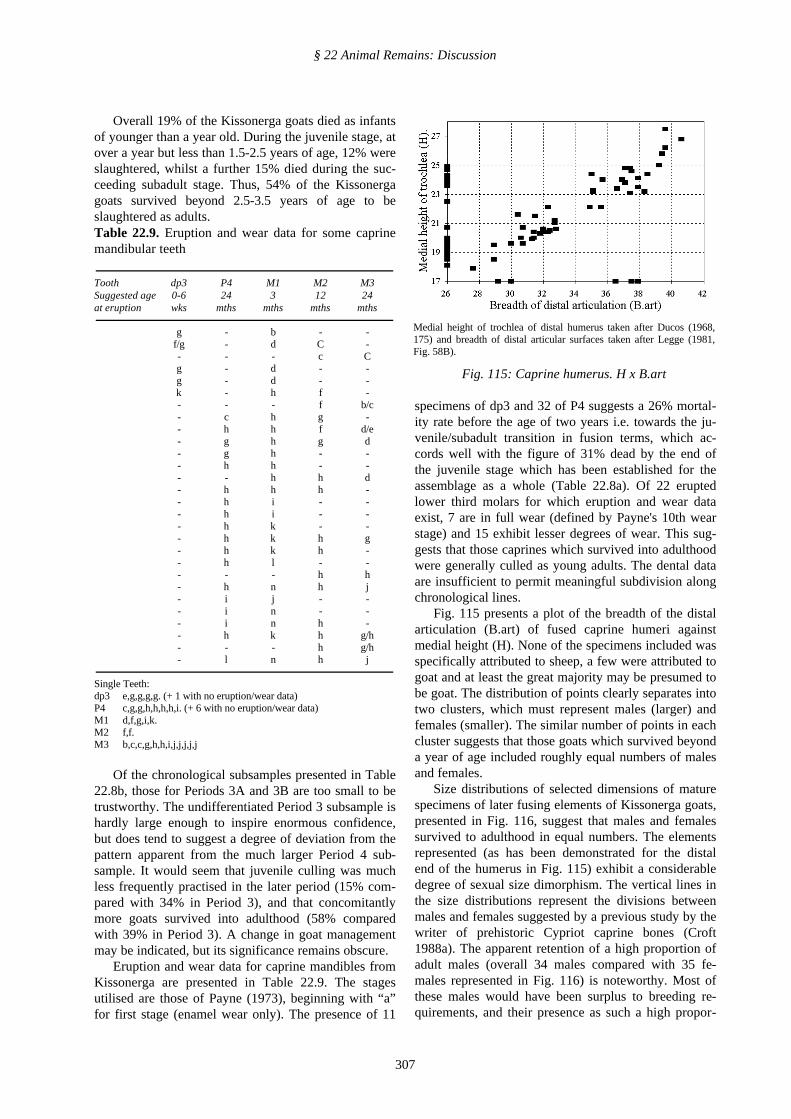
Fig. 115 presents a plot of the breadth of the distalarticulation (B.art) of fused caprine humeri againstmedial height (H). None of the specimens included wasspecifically attributed to sheep, a few were attributed togoat and at least the great majority may be presumed tobe goat. The distribution of points clearly separates intotwo clusters, which must represent males (larger) andfemales (smaller). The similar number of points in eachcluster suggests that those goats which survived beyonda year of age included roughly equal numbers of malesand females.
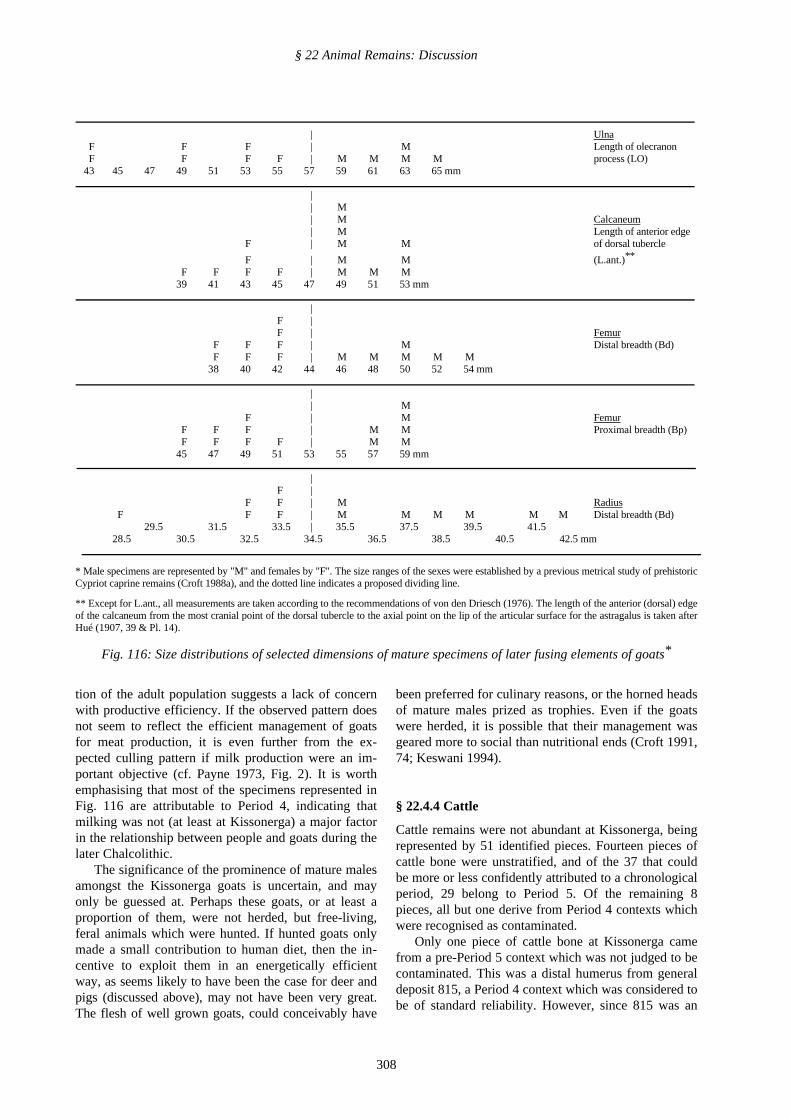
Size distributions of selected dimensions of maturespecimens of later fusing elements of Kissonerga goats,presented in Fig. 116, suggest that males and femalessurvived to adulthood in equal numbers. The elementsrepresented (as has been demonstrated for the distalend of the humerus in Fig. 115) exhibit a considerabledegree of sexual size dimorphism. The vertical lines inthe size distributions represent the divisions betweenmales and females suggested by a previous study by thewriter of prehistoric Cypriot caprine bones (Croft1988a). The apparent retention of a high proportion ofadult males (overall 34 males compared with 35 fe-males represented in Fig. 116) is noteworthy. Most ofthese males would have been surplus to breeding re-quirements, and their presence as such a high propor-
Medial height of trochlea of distal humerus taken after Ducos (1968,175) and breadth of distal articular surfaces taken after Legge (1981,Fig. 58B).
Fig. 115: Caprine humerus. H x B.art
§ 22 Animal Remains: Discussion
308
tion of the adult population suggests a lack of concernwith productive efficiency. If the observed pattern doesnot seem to reflect the efficient management of goatsfor meat production, it is even further from the ex-pected culling pattern if milk production were an im-portant objective (cf. Payne 1973, Fig. 2). It is worthemphasising that most of the specimens represented inFig. 116 are attributable to Period 4, indicating thatmilking was not (at least at Kissonerga) a major factorin the relationship between people and goats during thelater Chalcolithic.
The significance of the prominence of mature malesamongst the Kissonerga goats is uncertain, and mayonly be guessed at. Perhaps these goats, or at least aproportion of them, were not herded, but free-living,feral animals which were hunted. If hunted goats onlymade a small contribution to human diet, then the in-centive to exploit them in an energetically efficientway, as seems likely to have been the case for deer andpigs (discussed above), may not have been very great.The flesh of well grown goats, could conceivably have
been preferred for culinary reasons, or the horned headsof mature males prized as trophies. Even if the goatswere herded, it is possible that their management wasgeared more to social than nutritional ends (Croft 1991,74; Keswani 1994).
§ 22.4.4 Cattle
Cattle remains were not abundant at Kissonerga, beingrepresented by 51 identified pieces. Fourteen pieces ofcattle bone were unstratified, and of the 37 that couldbe more or less confidently attributed to a chronologicalperiod, 29 belong to Period 5. Of the remaining 8pieces, all but one derive from Period 4 contexts whichwere recognised as contaminated.
Only one piece of cattle bone at Kissonerga camefrom a pre-Period 5 context which was not judged to becontaminated. This was a distal humerus from generaldeposit 815, a Period 4 context which was considered tobe of standard reliability. However, since 815 was an
| UlnaF F F | M Length of olecranonF F F F | M M M M process (LO)
43 45 47 49 51 53 55 57 59 61 63 65 mm
| | M| M Calcaneum| M Length of anterior edge
F | M M of dorsal tubercle
F | M M (L.ant.)**
F F F F | M M M39 41 43 45 47 49 51 53 mm
| F | F | Femur
F F F | M Distal breadth (Bd)F F F | M M M M M
38 40 42 44 46 48 50 52 54 mm
| | M
F | M Femur F F F | M M Proximal breadth (Bp) F F F F | M M45 47 49 51 53 55 57 59 mm
| F |
F F | M Radius F F F | M M M M M M Distal breadth (Bd)
29.5 31.5 33.5 | 35.5 37.5 39.5 41.528.5 30.5 32.5 34.5 36.5 38.5 40.5 42.5 mm
* Male specimens are represented by "M" and females by "F". The size ranges of the sexes were established by a previous metrical study of prehistoricCypriot caprine remains (Croft 1988a), and the dotted line indicates a proposed dividing line.
** Except for L.ant., all measurements are taken according to the recommendations of von den Driesch (1976). The length of the anterior (dorsal) edgeof the calcaneum from the most cranial point of the dorsal tubercle to the axial point on the lip of the articular surface for the astragalus is taken afterHué (1907, 39 & Pl. 14).
Fig. 116: Size distributions of selected dimensions of mature specimens of later fusing elements of goats*
§ 22 Animal Remains: Discussion
309
extensive, superficial ashy deposit, the risk of somecontamination by later material is considerable, andeven though the ceramic assemblage and other artefactsfrom this unit betrayed no evidence of this, thechronological distribution of cattle remains on the sitefavours the idea that the single cattle bone from 815 isintrusive.
The Kissonerga evidence thus accords with the ob-servation that cattle do not occur in Cyprus after theAceramic Neolithic (Guilaine et al. 1995, 30) and priorto the beginning of the Bronze Age. Their significantlevel of abundance (7%) in the small Period 5 animalbone sample (Table 22.10c) shows that relatively soonafter the end of the Chalcolithic period, recently intro-duced cattle had become an important component of theanimal economy (Croft 1996, 222).
The Kissonerga cattle remains are generally frag-mentary, and little of the material was measurable.Considered as a single group, the material gives theoverall impression of small stature. Three measurableastragali have greatest (lateral) length measurements of72.0, 70.8 and 56.9 mm, and two naviculocuboids havegreatest breadths of 49.2 and 43.7 mm.
§ 22.4.5 Equid
An upper molariform tooth was the only equid boneidentified from Kissonerga. It came from general de-posit 774, a Period 4/5 context, so it may reflect thepresence of equids at Kissonerga in Period 5. However,since this context was recognised as being contami-nated, the date of this single equid bone is very muchopen to doubt. Although equid remains have been re-ported from pre-Bronze Age Cyprus (Schwartz 1973,217; 1974a and b; Zeuner and Grosvenor Ellis 1961,236), in the writer's opinion these reports are unreliable(Croft 1988a).
§ 22.4.6 Dog
Occasional dog remains, amounting to a total of 33fragments, are known from contexts of at least standardreliability for Periods 2, 3A, 3B and 4. Few bones weremeasurable, but the Kissonerga material seems, on thewhole, to represent robust, medium-sized dogs. Sur-prisingly, damage to faunal remains consistent withdog chewing was not noted.
§ 22.4.7 Cat
Cat remains were occasionally encountered in contextsof at least standard reliability in Periods 3A, 3B and 4,and amount to a total of 16 fragments. The cats of Kis-sonerga perhaps tended to be slightly larger than mod-ern Felis catus in Cyprus, although the sample is toosmall to substantiate this generalisation adequately.
§ 22.4.8 Fox
Fox is represented with moderate frequency from Pe-riod 2 onwards at Kissonerga, a total of 210 fragments
having been identified. Unlike the other small carni-vores, the fox was probably not resident on the site, andfoxes would most likely have been brought there dead,having been hunted or trapped away from the settle-ment. A wide range of skeletal elements is sufficientlyabundantly represented (Table 22.4d) to suggest thatwhole skeletons of foxes were being disposed of on thesite. Foxes were presumably killed mainly for theirpelts, and were brought back for skinning, although itis not impossible that their flesh was also eaten.
§ 22.4.9 Hippopotamus
A semi-fossilised lower first molar tooth was the onlyitem which was attributable to the Cypriot pigmy hip-popotamus (Phanourios minutus). It was found in Unit1292, the lower fill/occupation deposit in B 1103 ofPeriod 3B. The fact that this tooth was covered in ahard white crystalline encrustation, quite unlike thegranular grey encrustation commonly found on otheranimal bones from Kissonerga, sets it apart. This toothwas clearly brought into the settlement as a fossil, inthe same way that a hippopotamus distal metacarpalseems to have been introduced to the Aceramic Neo-lithic settlement at Cape Andreas-Kastros (Davis 1987,308; 1989, 193). It may well have been collected as acurio, millennia after the extinction of hippopotami onCyprus, from fossiliferous deposits known to existnearby (Held 1992, 38).
§ 22.4.10 Marine mammals
Two single teeth represent marine mammals. Firstly, acetacean (whale) tooth came from an unstratified con-text and has not been more closely identified. A secondtooth (from surface 1255 of Period 4) represents a ma-rine carnivore, probably the Monk Seal (Monachusmonachus).
§ 22.4.11 Birds
Bird remains were encountered in contexts of periods2-4, and of 107 pieces recovered, 48 proved identifi-able. The fact that 32 of these pieces of bird bone wererecovered by wet sieving, suggests that the overall re-covery rate for bird remains has been very poor indeed(Table 22.3).
Secure identification of the full range of bird re-mains from Kissonerga is rather more problematic thanfor the mammalian bone. According to a recent check-list of the Cyprus Ornithological Society, 360 aviantaxa have been commonly or occasionally observed inCyprus in recent years and presumably at least as widea selection of birds existed during the early Holocene.By comparison, a very limited range of mammalianspecies is known from Early Prehistoric sites on theisland. The difficulty (often impossibility) of separatingclosely related avian taxa on the basis of small samplesof fragmentary osteological remains from archaeologi-cal sites exacerbates the problem of identification, even
§ 22 Animal Remains: Discussion
310
assuming access to an adequate reference collection.Fortunately, a large proportion of the Kissonerga
bird remains represents taxa which are common at thepresent day, and thus readily identifiable. Other taxathan those which have been identified are also clearlypresent, but it has thus far not proved possible to iden-tify them with a satisfactory level of confidence. Fur-ther work is therefore required to maximise the yield ofinformation from the Kissonerga bird bone assemblage,and the results presented here must be viewed as in-complete.
A majority of identifiable bird remains was attribut-able to various species of pigeon. Most abundant waswoodpigeon (Columba palumbus), represented by 16fragments and rock dove (Columba livia) representedby 15 fragments, remains of both taxa deriving from 13separate contexts. A third pigeon species, turtle dove(Streptopelia turtur), was represented by 5 fragmentsfrom as many different contexts.
Another group of birds represented by multiplespecimens in the Kissonerga assemblage are the ducks.One specimen was attributed to mallard (Anas platy-rynchos) and three others almost certainly representother species of duck.
The writer's tentative identification of song thrush(Turdus philomelos) from Ceremonial Area pit 1225(LAP II.2, 73) has, in the light of comparison with awider range of reference material, been confirmed anda second fragment from the same context is now viewedas most probably representing the same taxon.
Other birds which could confidently be identified onthe basis of single specimens are quail (Coturnix co-turnix), coot (Fulica atra) and jay (Garrulus glandar-ius).
Several lower order identifications (which may intime be improved with reference to a wider range ofcomparative material) on single specimens are worthmentioning here in order more fully to indicate the di-versity of the Kissonerga bird remains. A fragment of alarge wader probably represents crane (Grus grus). Afragment of a large Accipiter probably represents one ofthe larger vultures of the region (i.e. larger than griffonvulture). Finally, a single fragment represents one ofthe larger owls.
The comparative fragility of bird bones suggeststhat only a small proportion of those which werebrought onto the site will actually have survived. Fur-thermore, it has been estimated (Table 22.3) that theoverwhelming majority (97%) of bird remains pre-served at Kissonerga has been overlooked. Thus, thenot inconsiderable quantity of bird remains which wasrecovered and the diversity of taxa identified will cer-tainly represent merely the tip of the avian iceberg. Itseems clear that birds will have constituted a far moresignificant resource than first appearances might sug-gest.
§ 22.4.12 Microfauna
House Mouse (Mus musculus)
Several hundred rodent bones were retrieved from Kis-sonerga, mainly from the wet sieve. They occurredquite commonly in contexts dating to Periods 2-4, butwere not recovered from Periods 1 or 5. The rodentremains included 52 upper incisors which each pos-sessed a subapical notch which is characteristic ofhouse mouse (Mus musculus) (Harrison and Bates1991, 251). The other rodent remains do not provideevidence for the presence of any other species at Kis-sonerga.
The great majority of the mouse bones came frompit and grave contexts, although other types of context,especially building fills and wall collapse deposits, alsoyielded mouse remains. Presumably pits and gravesprovided useful sources of food, and easy burrowingconditions and open steep-sided pits would also havefunctioned as "pit-traps" into which mice and othersmall creatures fell and from which they could not es-cape.
Although some of the rodent remains may well beintrusive, a dozen burnt fragments dating to all Periodsfrom 2-4, confirm the presence of mice during the oc-cupation of the settlement. This evidence is corrobo-rated by the existence of half a dozen animal boneswhich bear traces of rodent gnawing. These items in-clude caprine, pig and deer phalanges and a pig meta-podial, and date to Periods 3B and 4.
Lesser White-toothed Shrew (Crocidura suaveolens)
Thirteen fragments, all retrieved by wet sieving, wereattributed to the Lesser White-toothed Shrew (Cro-cidura suaveolens). Shrew remains came mainly frompits, and the 10 contexts which yielded them date toPeriods 2-4 and also contained mouse remains.
Amphibians
Several dozen fragments of frog or toad bone derivefrom 18 contexts dating from Periods 2-4. Amphibianremains came mainly from pits, for which fact the pit-trap effect is probably responsible.
Reptiles
Like other microfaunal remains, the several dozen rep-tile bones which were found tended to come from pits,but also occurred in a variety of other contexts. Theycome from contexts which date to Periods 2-4, but asever with burrowing microfauna, it is likely that manyof them are not contemporary with the archaeologicaldeposits in which they occur, but represent later, intru-sive material. One reptile vertebra was burnt.
The Kissonerga reptile remains have not been stud-ied in detail, but it is clear that they consist over-whelmingly of a variety of lizards. Many bones com-pare with Stellio stellio, but others clearly derive from
§ 22 Animal Remains: Discussion
311
other saurian species. A single snake mandible waspresent.
§ 22.5. Faunal change through time
Changes in the animal economy at Kissonerga mightwell be expected to be reflected in changes throughtime in the relative importance of the main economicanimals. Period 1 yielded no identifiable animal re-mains and only 20 may be even tentatively attributed toPeriod 2. Periods 3A, 3B and 4, however, all have suf-ficient quantities of animal remains to be potentiallyuseful in the study of long-term change. Since the time-span represented by these three periods is lengthy,probably amounting to about a thousand years, a degreeof change in subsistence practice would seem quitelikely to have occurred.
Only 7 identifiable bone fragments could be firmlyattributed to Period 5, although a considerably largerquantity (340 fragments) was attributable to this periodwith a lesser degree of confidence. Thus, although notideal, the Period 5 sample also has something to offerto an assessment of subsistence change.
The raw counts of identified fragments by period(Table 22.10a) are indeed suggestive that the animaleconomy at Kissonerga did not remain static through-out this long span of time. It appears that the relativeimportance of deer declined substantially and pigs un-derwent a concomitant increase, whilst the frequency ofcaprine bones remained fairly stable. This is a situation
which clearly merits closer examination, but for a vari-ety of reasons the raw counts of identifiable fragmentsare unsuitable for this purpose, since they contain anumber of potentially serious inherent biases conse-quent upon the anatomical differences between pigsand ruminants.
Whilst the ruminants may possess either antlers orhorncores, the pig possesses no comparable structure.On the other hand, pigs have more teeth than rumi-nants and their skulls tend to fragment into a greaternumber of identifiable fragments. The larger number ofbones in the foot of the pig also provides a potentialsource of bias which will tend to inflate the apparentimportance of pigs compared with ruminants if the as-sessment is based on fragments counts. Pigs possessfour metapodial bones per limb, to each of which isattached a digit, whilst deer and caprines have only asingle functional metapodial (cannon) bone, whichbears two digits. The digits of all of these animals con-sist of three phalanges. Thus, pigs have twice as manyphalanges and four times as many metapodia as deer orcaprines. Finally, pigs possess a fibula, which is lack-ing in the ruminants.
In order that figures for the abundance of identifiedfragments of the main economic animals at Kissonergamay more meaningfully be compared, raw counts havebeen adjusted in the following ways:
1) All cranial material has been excluded.2) Pig metapodia ii and v and their (accessory)
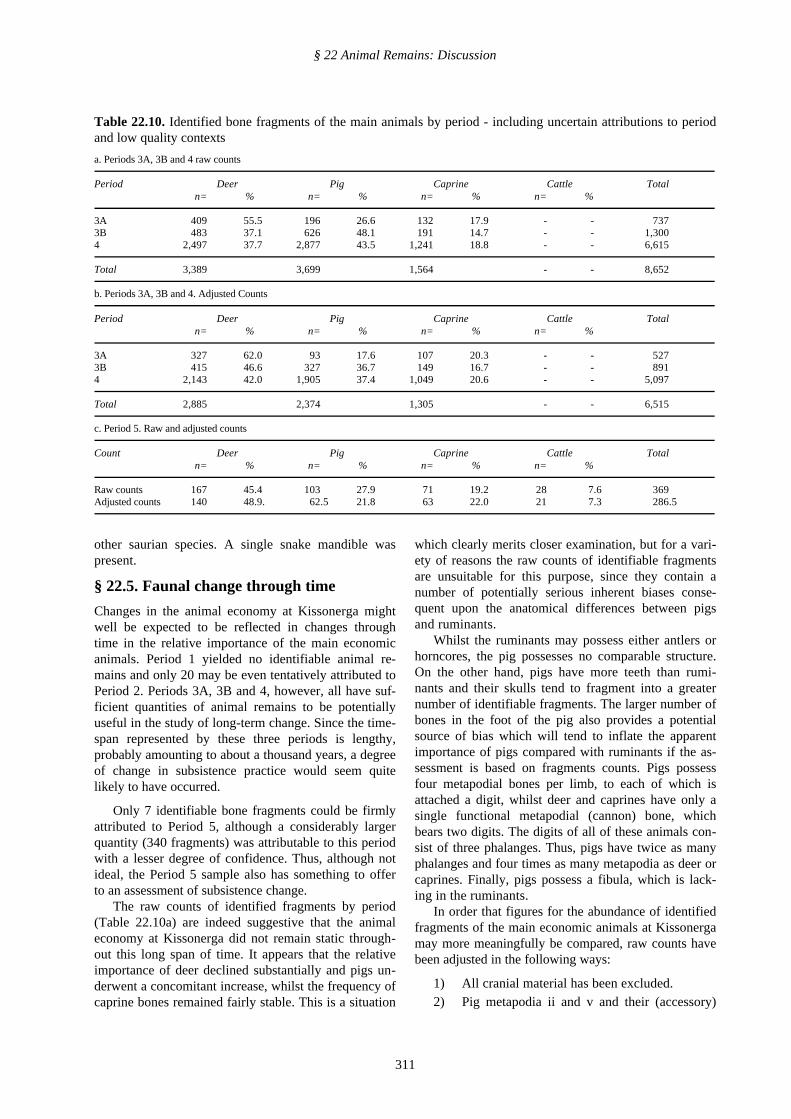
Table 22.10. Identified bone fragments of the main animals by period - including uncertain attributions to periodand low quality contexts
a. Periods 3A, 3B and 4 raw counts
Period Deer Pig Caprine Cattle Totaln= % n= % n= % n= %
3A 409 55.5 196 26.6 132 17.9 - - 7373B 483 37.1 626 48.1 191 14.7 - - 1,3004 2,497 37.7 2,877 43.5 1,241 18.8 - - 6,615
Total 3,389 3,699 1,564 - - 8,652
b. Periods 3A, 3B and 4. Adjusted Counts
Period Deer Pig Caprine Cattle Totaln= % n= % n= % n= %
3A 327 62.0 93 17.6 107 20.3 - - 5273B 415 46.6 327 36.7 149 16.7 - - 8914 2,143 42.0 1,905 37.4 1,049 20.6 - - 5,097
Total 2,885 2,374 1,305 - - 6,515
c. Period 5. Raw and adjusted counts
Count Deer Pig Caprine Cattle Totaln= % n= % n= % n= %
Raw counts 167 45.4 103 27.9 71 19.2 28 7.6 369Adjusted counts 140 48.9. 62.5 21.8 63 22.0 21 7.3 286.5
§ 22 Animal Remains: Discussion
312
phalanges have been excluded.3) Numbers of pig metapodia iii and iv have been
halved (so adjusted counts of pig bones are notalways expressed as whole numbers, but mayinclude 0.5 of a bone).
4) Pig fibulae have been excluded.
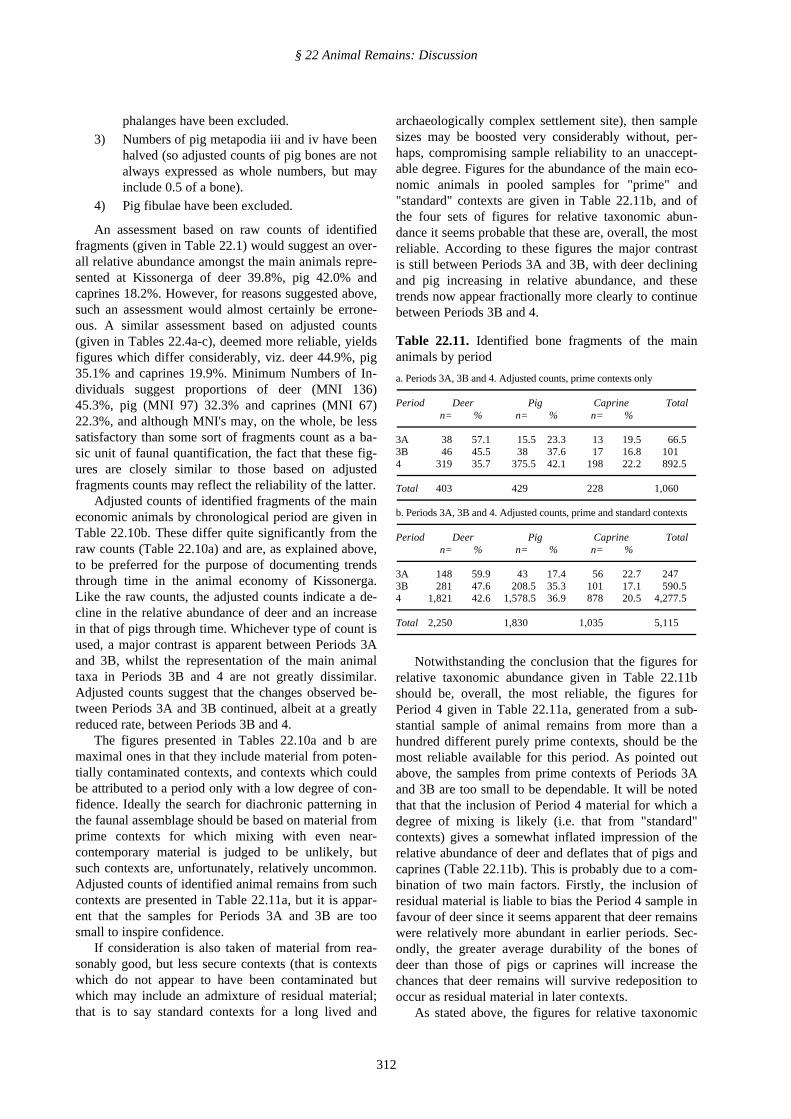
An assessment based on raw counts of identifiedfragments (given in Table 22.1) would suggest an over-all relative abundance amongst the main animals repre-sented at Kissonerga of deer 39.8%, pig 42.0% andcaprines 18.2%. However, for reasons suggested above,such an assessment would almost certainly be errone-ous. A similar assessment based on adjusted counts(given in Tables 22.4a-c), deemed more reliable, yieldsfigures which differ considerably, viz. deer 44.9%, pig35.1% and caprines 19.9%. Minimum Numbers of In-dividuals suggest proportions of deer (MNI 136)45.3%, pig (MNI 97) 32.3% and caprines (MNI 67)22.3%, and although MNI's may, on the whole, be lesssatisfactory than some sort of fragments count as a ba-sic unit of faunal quantification, the fact that these fig-ures are closely similar to those based on adjustedfragments counts may reflect the reliability of the latter.
Adjusted counts of identified fragments of the maineconomic animals by chronological period are given inTable 22.10b. These differ quite significantly from theraw counts (Table 22.10a) and are, as explained above,to be preferred for the purpose of documenting trendsthrough time in the animal economy of Kissonerga.Like the raw counts, the adjusted counts indicate a de-cline in the relative abundance of deer and an increasein that of pigs through time. Whichever type of count isused, a major contrast is apparent between Periods 3Aand 3B, whilst the representation of the main animaltaxa in Periods 3B and 4 are not greatly dissimilar.Adjusted counts suggest that the changes observed be-tween Periods 3A and 3B continued, albeit at a greatlyreduced rate, between Periods 3B and 4.
The figures presented in Tables 22.10a and b aremaximal ones in that they include material from poten-tially contaminated contexts, and contexts which couldbe attributed to a period only with a low degree of con-fidence. Ideally the search for diachronic patterning inthe faunal assemblage should be based on material fromprime contexts for which mixing with even near-contemporary material is judged to be unlikely, butsuch contexts are, unfortunately, relatively uncommon.Adjusted counts of identified animal remains from suchcontexts are presented in Table 22.11a, but it is appar-ent that the samples for Periods 3A and 3B are toosmall to inspire confidence.
If consideration is also taken of material from rea-sonably good, but less secure contexts (that is contextswhich do not appear to have been contaminated butwhich may include an admixture of residual material;that is to say standard contexts for a long lived and
archaeologically complex settlement site), then samplesizes may be boosted very considerably without, per-haps, compromising sample reliability to an unaccept-able degree. Figures for the abundance of the main eco-nomic animals in pooled samples for "prime" and"standard" contexts are given in Table 22.11b, and ofthe four sets of figures for relative taxonomic abun-dance it seems probable that these are, overall, the mostreliable. According to these figures the major contrastis still between Periods 3A and 3B, with deer decliningand pig increasing in relative abundance, and thesetrends now appear fractionally more clearly to continuebetween Periods 3B and 4.
Table 22.11. Identified bone fragments of the mainanimals by period
a. Periods 3A, 3B and 4. Adjusted counts, prime contexts only
Period Deer Pig Caprine Totaln= % n= % n= %
3A 38 57.1 15.5 23.3 13 19.5 66.53B 46 45.5 38 37.6 17 16.8 1014 319 35.7 375.5 42.1 198 22.2 892.5
Total 403 429 228 1,060
b. Periods 3A, 3B and 4. Adjusted counts, prime and standard contexts
Period Deer Pig Caprine Totaln= % n= % n= %
3A 148 59.9 43 17.4 56 22.7 2473B 281 47.6 208.5 35.3 101 17.1 590.54 1,821 42.6 1,578.5 36.9 878 20.5 4,277.5
Total 2,250 1,830 1,035 5,115
Notwithstanding the conclusion that the figures forrelative taxonomic abundance given in Table 22.11bshould be, overall, the most reliable, the figures forPeriod 4 given in Table 22.11a, generated from a sub-stantial sample of animal remains from more than ahundred different purely prime contexts, should be themost reliable available for this period. As pointed outabove, the samples from prime contexts of Periods 3Aand 3B are too small to be dependable. It will be notedthat that the inclusion of Period 4 material for which adegree of mixing is likely (i.e. that from "standard"contexts) gives a somewhat inflated impression of therelative abundance of deer and deflates that of pigs andcaprines (Table 22.11b). This is probably due to a com-bination of two main factors. Firstly, the inclusion ofresidual material is liable to bias the Period 4 sample infavour of deer since it seems apparent that deer remainswere relatively more abundant in earlier periods. Sec-ondly, the greater average durability of the bones ofdeer than those of pigs or caprines will increase thechances that deer remains will survive redeposition tooccur as residual material in later contexts.
As stated above, the figures for relative taxonomic
§ 22 Animal Remains: Discussion
313
abundance given for Periods 3A and 3B in Table22.11b seem likely to be the best available, and al-though the possibility exists that they give a somewhatinflated impression of the abundance of deer, this isless likely to be the case than for Period 4, for whichthe figures given in Table 22.11b are to be preferred.To summarise the trends which may be inferred, theyare a constant steep decline in the relative abundance ofdeer remains (from 60% to 36%) throughout the time-span represented by Periods 3A, 3B and 4, and a con-comitant increase in the relative abundance of pig re-mains (from 17% to 42%). The relative abundance ofcaprine remains fluctuates around the 20% level, but aperiod of somewhat depressed relative frequency maybe indicated in Period 3B.
Taxonomic frequencies for the Period 5 animalbone sample are presented in Table 22.10c. The samplefor this period derives very largely from insecure con-texts and it will be observed that it is, moreover, rathersmall. In view of these circumstances the temptationmust be resisted to compare it with those from Periods3A, 3B and 4 other than tentatively and in the broadestterms.
It has been argued above that cattle were not presentat Kissonerga prior to Period 5, and during this periodthey represent about 7% of animal bones (based on ad-justed counts). Caprines seem to occur in Period 5 withsimilar frequency to previous periods. The possibility
has been noted above that sheep may have increased inimportance compared with goats, but the latter retaintheir predominance amongst the caprines. It would beunwise to place too much reliance on these Period 5figures, but the possibility is indicated of a somewhatincreased frequency of deer remains and a considerabledecrease in pig by comparison with Period 4.
§ 22.6. The spatial distribution of the faunalremains
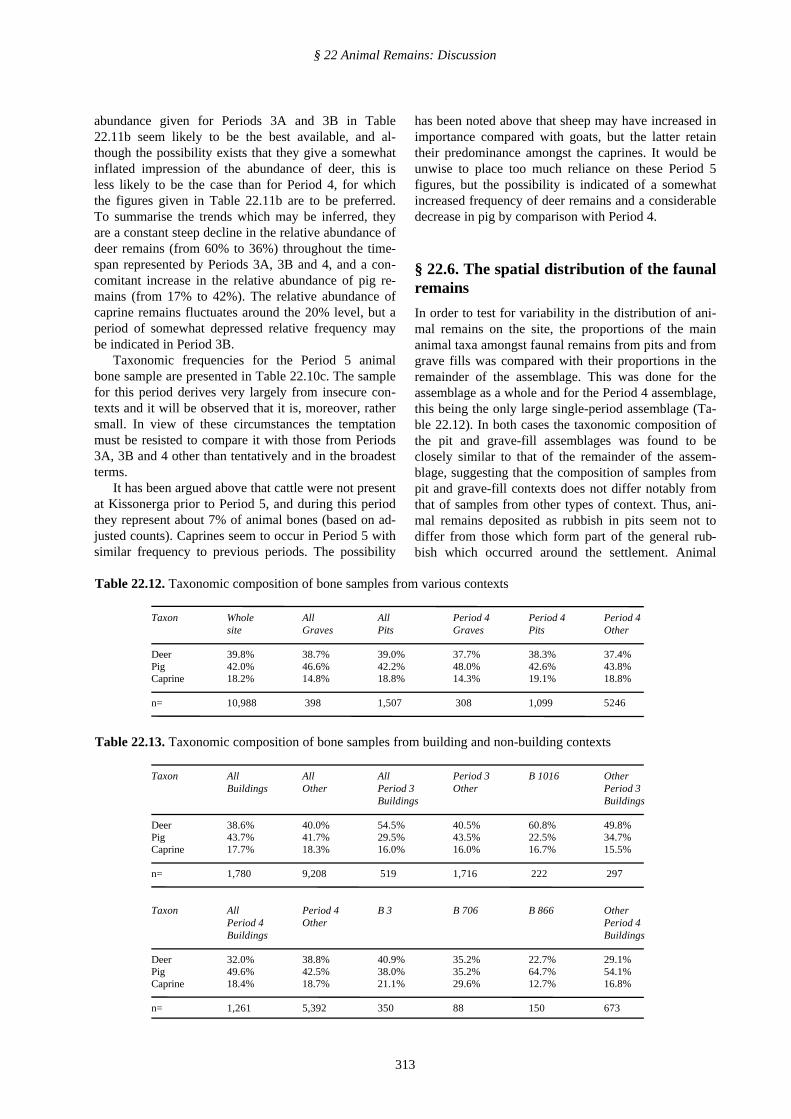
In order to test for variability in the distribution of ani-mal remains on the site, the proportions of the mainanimal taxa amongst faunal remains from pits and fromgrave fills was compared with their proportions in theremainder of the assemblage. This was done for theassemblage as a whole and for the Period 4 assemblage,this being the only large single-period assemblage (Ta-ble 22.12). In both cases the taxonomic composition ofthe pit and grave-fill assemblages was found to beclosely similar to that of the remainder of the assem-blage, suggesting that the composition of samples frompit and grave-fill contexts does not differ notably fromthat of samples from other types of context. Thus, ani-mal remains deposited as rubbish in pits seem not todiffer from those which form part of the general rub-bish which occurred around the settlement. Animal
Table 22.12. Taxonomic composition of bone samples from various contexts
Taxon Whole All All Period 4 Period 4 Period 4site Graves Pits Graves Pits Other
Deer 39.8% 38.7% 39.0% 37.7% 38.3% 37.4%Pig 42.0% 46.6% 42.2% 48.0% 42.6% 43.8%Caprine 18.2% 14.8% 18.8% 14.3% 19.1% 18.8%
n= 10,988 398 1,507 308 1,099 5246
Table 22.13. Taxonomic composition of bone samples from building and non-building contexts
Taxon All All All Period 3 B 1016 OtherBuildings Other Period 3 Other Period 3
Buildings Buildings
Deer 38.6% 40.0% 54.5% 40.5% 60.8% 49.8%Pig 43.7% 41.7% 29.5% 43.5% 22.5% 34.7%Caprine 17.7% 18.3% 16.0% 16.0% 16.7% 15.5%
n= 1,780 9,208 519 1,716 222 297
Taxon All Period 4 B 3 B 706 B 866 OtherPeriod 4 Other Period 4Buildings Buildings
Deer 32.0% 38.8% 40.9% 35.2% 22.7% 29.1%Pig 49.6% 42.5% 38.0% 35.2% 64.7% 54.1%Caprine 18.4% 18.7% 21.1% 29.6% 12.7% 16.8%
n= 1,261 5,392 350 88 150 673
§ 22 Animal Remains: Discussion
314
bones from grave fills were not, apparently, deliberatelydeposited and consist exclusively of residual material. Itis thus hardly surprising that these bones also reflectthe composition of the general, ambient rubbish.
The composition of bone samples from buildingswas also examined to see if it was in any way distinc-tive, and this line of enquiry did yield more positiveresults (Table 22.13) although their meaning remainsobscure.
Taken as a whole, the assemblage of animal re-mains from occupation deposits in buildings differshardly at all from the non-building assemblage in termsof taxonomic composition. Period 3 buildings, however,did yield a substantially higher proportion of deer re-mains and less pig than other Period 3 contexts, whilstthe reverse appears to be true for Period 4 buildings,albeit to a lesser degree. The significance, if any, ofthese observations is unknown.
Only B 1016 of Period 3A and B 3, 706 and 866 ofPeriod 4 yielded sufficiently large samples of bones tobe considered on an individual basis. B 1016 yielded asomewhat higher proportion of deer remains andsomewhat less pig compared with the other Period 3buildings. Pithos House (B 3) yielded a relatively highproportion of deer bones compared with other Period 4buildings, whilst B 866 had a notably high proportionof pig bones. Clearly, the taxonomic composition offaunal samples from buildings is quite variable, andmay well reflect the use of the buildings, the diet ofthose who used the buildings or chronological variabil-ity. None of these various explanations is preferredhere, and it may indeed be that some combination ofthese factors is responsible for the observed variability.
§ 22.7. Discussion and conclusions
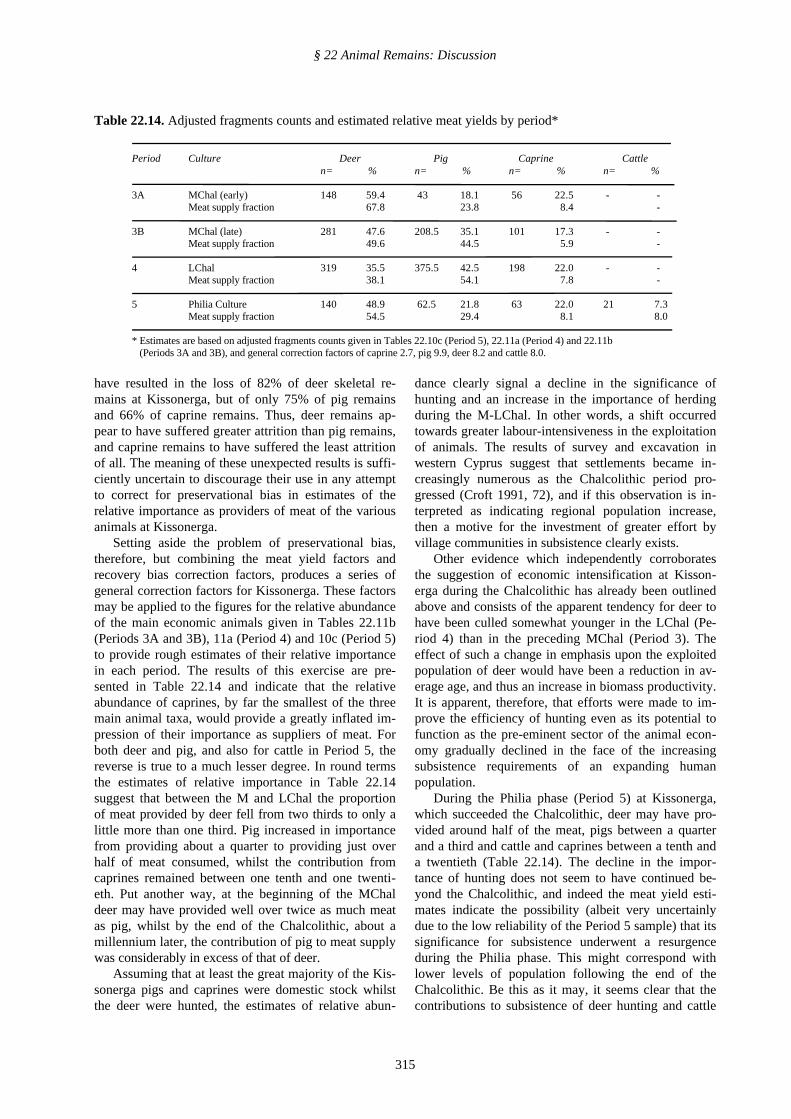
The section above on faunal change through time(§ 22.5) has outlined long-term trends in the develop-ment of the Kissonerga animal economy. It has beenargued that adjustments to the raw fragments countsare necessary in order to counteract the effects of cer-tain inherent biases, and that the adjusted figuresshould permit a more reliable assessment of variationsover time in the relative abundance of deer, pig andcaprines, the main economic animals at ChalcolithicKissonerga. The results of such an assessment suggest asteep decline in the relative abundance of deer and aconcomitant increase in that of pig between Periods 3Aand 4 (mid-fourth to mid-third millennium BC), whilstthe abundance of caprines remained relatively stable. InPeriod 5, which corresponds with the Philia Culture(late third millennium BC), cattle occurred for the firsttime and the trends in the abundance of deer and pigremains which have been observed throughout the pre-ceding millennium or so of the M and LChal appear tohave been reversed.
These observed trends have been expressed in termsof the relative abundance of the remains of the various
animals, without any attempt to compensate for thepreservational and recovery biases which have beenshown to exist at Kissonerga. However, in order morefully to understand the significance of these trends forthe subsistence economies of successive human com-munities, it is necessary to look beyond percentage fig-ures generated more or less directly from fragmentscounts.
If it is assumed that the animals were exploitedmainly for their meat, it is clear that their relativeabundance will not directly reflect their relative im-portance to the subsistence of the human community,since the different animals yield very different amountsof meat. In order to make a rough estimate of the rela-tive importance of the various animals as providers ofmeat, it is first necessary to adopt some estimate ofrelative meat yield per individual. The figures adoptedhere are as follows: caprine 1.0, pig 3.0, deer 3.4, cattle8.0. (The use of these meat yield factors has been dis-cussed elsewhere by the writer (Croft 1988a; 1991, Ta-ble 1), with the exception that the pig is here accordeda lower factor (3.0 rather than 4.0) in an admittedlyrather arbitrary attempt to take account of the high fre-quency of pre-adult slaughter at Kissonerga).
Secondly, it is necessary to take account of the dif-ferential recovery rates which are known to have pre-vailed at Kissonerga. On the basis of the figures givenin Table 22.3 may be estimated that 100% of cattle re-mains were recovered, so a recovery bias correctionfactor of 1.0 is applied, reflecting the fact that no cor-rection is necessary. For deer it may be inferred thatonly 42% of all remains were recovered so a correctionfactor of 2.4 should be applied. Factors for pig (30%recovered) and caprine (37% recovered) may be calcu-lated on the same basis as 3.3 and 2.7.
Finally, in order to get a clearer idea of the eco-nomic significance of chronological variability in rela-tive taxonomic abundance based on fragments counts,differences in susceptibility to attrition of the bones ofthe different animals should ideally be taken into ac-count. Common sense suggests that such differencesmay well exist. For example, the more frequently im-mature bones of pig might be expected to have suffereda greater degree of attrition than those of the othermain animals and the assemblages of both pig and ca-prine bones might be expected to be more attenuatedthan the deer assemblage, since deer bones are largerand more robust. However, if MNI figures are used inthe way outlined in § 22.2.1 above to calculate theoreti-cal total weights of animal remains which ought to bepresent for each taxon, we find that the impact of as-semblage attrition does not accord with these expecta-tions.
Including unidentified material, allocated to eachtaxon in proportion to the representation of that taxonin the identified fraction of the sample (data from Table22.2), it may be estimated that taphonomic processes
§ 22 Animal Remains: Discussion
315
have resulted in the loss of 82% of deer skeletal re-mains at Kissonerga, but of only 75% of pig remainsand 66% of caprine remains. Thus, deer remains ap-pear to have suffered greater attrition than pig remains,and caprine remains to have suffered the least attritionof all. The meaning of these unexpected results is suffi-ciently uncertain to discourage their use in any attemptto correct for preservational bias in estimates of therelative importance as providers of meat of the variousanimals at Kissonerga.
Setting aside the problem of preservational bias,therefore, but combining the meat yield factors andrecovery bias correction factors, produces a series ofgeneral correction factors for Kissonerga. These factorsmay be applied to the figures for the relative abundanceof the main economic animals given in Tables 22.11b(Periods 3A and 3B), 11a (Period 4) and 10c (Period 5)to provide rough estimates of their relative importancein each period. The results of this exercise are pre-sented in Table 22.14 and indicate that the relativeabundance of caprines, by far the smallest of the threemain animal taxa, would provide a greatly inflated im-pression of their importance as suppliers of meat. Forboth deer and pig, and also for cattle in Period 5, thereverse is true to a much lesser degree. In round termsthe estimates of relative importance in Table 22.14suggest that between the M and LChal the proportionof meat provided by deer fell from two thirds to only alittle more than one third. Pig increased in importancefrom providing about a quarter to providing just overhalf of meat consumed, whilst the contribution fromcaprines remained between one tenth and one twenti-eth. Put another way, at the beginning of the MChaldeer may have provided well over twice as much meatas pig, whilst by the end of the Chalcolithic, about amillennium later, the contribution of pig to meat supplywas considerably in excess of that of deer.
Assuming that at least the great majority of the Kis-sonerga pigs and caprines were domestic stock whilstthe deer were hunted, the estimates of relative abun-
dance clearly signal a decline in the significance ofhunting and an increase in the importance of herdingduring the M-LChal. In other words, a shift occurredtowards greater labour-intensiveness in the exploitationof animals. The results of survey and excavation inwestern Cyprus suggest that settlements became in-creasingly numerous as the Chalcolithic period pro-gressed (Croft 1991, 72), and if this observation is in-terpreted as indicating regional population increase,then a motive for the investment of greater effort byvillage communities in subsistence clearly exists.
Other evidence which independently corroboratesthe suggestion of economic intensification at Kisson-erga during the Chalcolithic has already been outlinedabove and consists of the apparent tendency for deer tohave been culled somewhat younger in the LChal (Pe-riod 4) than in the preceding MChal (Period 3). Theeffect of such a change in emphasis upon the exploitedpopulation of deer would have been a reduction in av-erage age, and thus an increase in biomass productivity.It is apparent, therefore, that efforts were made to im-prove the efficiency of hunting even as its potential tofunction as the pre-eminent sector of the animal econ-omy gradually declined in the face of the increasingsubsistence requirements of an expanding humanpopulation.
During the Philia phase (Period 5) at Kissonerga,which succeeded the Chalcolithic, deer may have pro-vided around half of the meat, pigs between a quarterand a third and cattle and caprines between a tenth anda twentieth (Table 22.14). The decline in the impor-tance of hunting does not seem to have continued be-yond the Chalcolithic, and indeed the meat yield esti-mates indicate the possibility (albeit very uncertainlydue to the low reliability of the Period 5 sample) that itssignificance for subsistence underwent a resurgenceduring the Philia phase. This might correspond withlower levels of population following the end of theChalcolithic. Be this as it may, it seems clear that thecontributions to subsistence of deer hunting and cattle
Table 22.14. Adjusted fragments counts and estimated relative meat yields by period*
Period Culture Deer Pig Caprine Cattlen= % n= % n= % n= %
3A MChal (early) 148 59.4 43 18.1 56 22.5 - -Meat supply fraction 67.8 23.8 8.4 -
3B MChal (late) 281 47.6 208.5 35.1 101 17.3 - -Meat supply fraction 49.6 44.5 5.9 -
4 LChal 319 35.5 375.5 42.5 198 22.0 - -Meat supply fraction 38.1 54.1 7.8 -
5 Philia Culture 140 48.9 62.5 21.8 63 22.0 21 7.3Meat supply fraction 54.5 29.4 8.1 8.0
* Estimates are based on adjusted fragments counts given in Tables 22.10c (Period 5), 22.11a (Period 4) and 22.11b (Periods 3A and 3B), and general correction factors of caprine 2.7, pig 9.9, deer 8.2 and cattle 8.0.
§ 22 Animal Remains: Discussion
316
herding were sufficient in the Philia phase to permit areduction (perhaps by almost a half) in the very heavydependence on swineherding which had gradually de-veloped through the M and LChal.
That deer persisted as a subsistence resource of con-siderable significance in the western Ktima Lowlandsarea for at least a further millennium after the occupa-tion of Kissonerga is indicated by the animal bonesfrom the nearby Late Bronze Age site of Maa-Paleokastro (Croft 1988b). Between the later-third andlater-second millennium BC it appears that the impor-tance of cattle and caprines in the local animal econ-omy grew and that of pigs declined still further.
Acknowledgements
This study was undertaken with the financial support of the BritishSchool of Archaeology in Jerusalem, which is gratefully acknowledged.Thanks are also due to Mrs. N. Chapman for permitting the use of metri-cal data derived from fallow deer skeletons in the collection of her latehusband.
Additional bibliographic references
Croft, P.W. 1996 “Animal Remains from Marki-Alonia” Chapter 9A pp 217-223 in D. Frankel andJ. Webb 1996.
Davis, S.J.M. 1994 Even more bones from Khirokitia:the 1988-1991 excavations pp 305-333 inA. Le Brun, Fouilles récentes à Khirokitia (Chypre)1988-1991. Paris.
Guilaine, J., F. Briois, J. Coularou and I Carrère 1995“L’Etablissement Neolithique de Shillourokambos(Parekklisha, Chypre). Premiers Résultats”R.D.A.C. 1995, 11-32
![Achtung! Dies ist eine Internet-Sonderausgabe des ...titus.uni-frankfurt.de/personal/jg/pdf/jg1996h.pdf · Studia Iranica, Mesopotamica et Anatolica 2, 1996 [1997], 235-248 zu entnehmen](https://img.pdfslide.us/doc/110x75/5eaad6f390e05264fd26d564/achtung-dies-ist-eine-internet-sonderausgabe-des-titusuni-studia-iranica.jpg)