Embed Size (px)
Citation preview
RESEARCH ARTICLE Open Access
Institutional maternal and perinatal deaths:a review of 40 low and middle incomecountriesPatricia E. Bailey1,2*, Wasihun Andualem3, Michel Brun4, Lynn Freedman2, Sourou Gbangbade5, Malick Kante2,Emily Keyes1,2, Edwin Libamba6, Allisyn C. Moran7, Halima Mouniri8, Dahada Ould el Joud9 and Kavita Singh10,11
Abstract
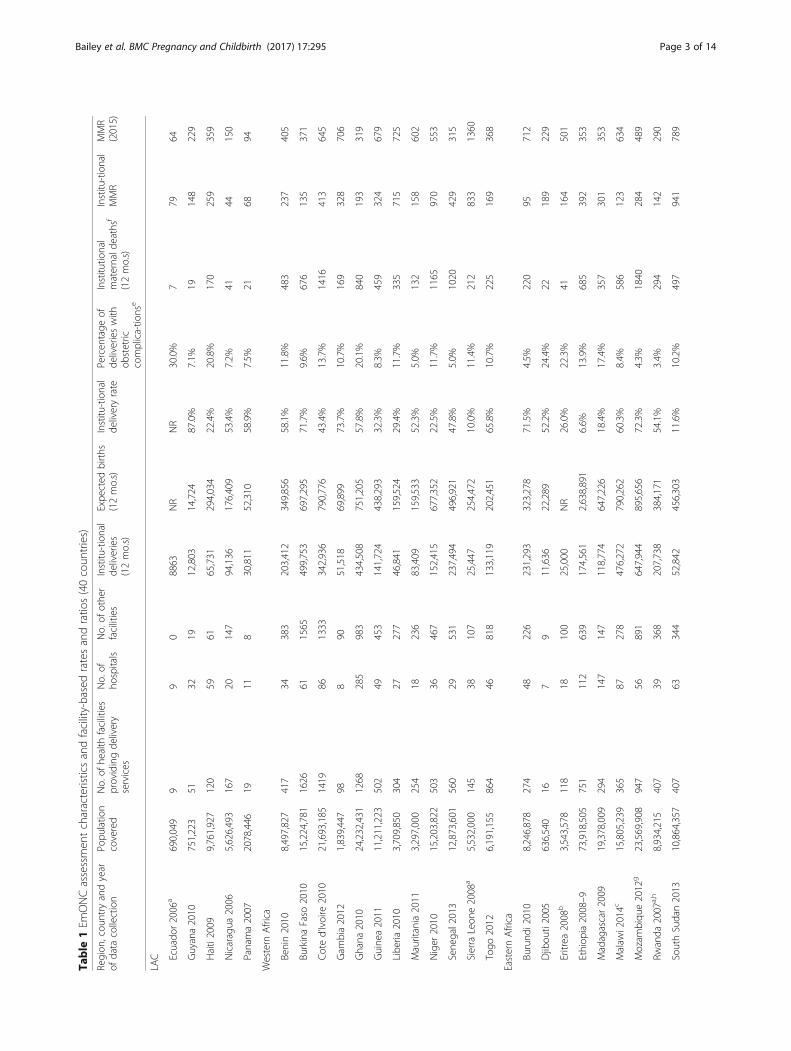
Background: Understanding the magnitude and clinical causes of maternal and perinatal mortality are basicrequirements for positive change. Facility-based information offers a contextualized resource for clinical andorganizational quality improvement. We describe the magnitude of institutional maternal mortality, causesof death and cause-specific case fatality rates, as well as stillbirth and pre-discharge neonatal death rates.
Methods: This paper draws on secondary data from 40 low and middle income countries that conductedemergency obstetric and newborn care assessments over the last 10 years. We reviewed 6.5 million deliveries,surveyed in 15,411 facilities. Most of the data were extracted from reports and aggregated with excel.
Results: Hemorrhage and hypertensive diseases contributed to about one third of institutional maternal deaths andindirect causes contributed another third (given the overrepresentation of sub-Saharan African countries with largeproportions of indirect causes). The most lethal obstetric complication, across all regions, was ruptured uterus, followedby sepsis in Latin America and the Caribbean and sub-Saharan Africa. Stillbirth rates exceeded pre-discharge neonataldeath rates in nearly all countries, possibly because women and their newborns were discharged soon after birth.
Conclusions: To a large extent, facility-based findings mirror what population-based systematic reviews have alsodocumented. As coverage of a skilled attendant at birth increases, proportionally more deaths will occur in facilities,making improvements in record-keeping and health management information systems, especially for stillbirths andearly neonatal deaths, all the more critical.
Keywords: Cause of maternal death, Direct and indirect deaths, Cause specific case fatality rate, Stillbirth rate, Earlyneonatal death rate, Perinatal mortality
BackgroundPost Millennium Development Goal global action agendassuch as the Sustainable Development Goals (SDGs), EveryNewborn Action Plan (ENAP) and Ending PreventableMaternal Mortality continue to measure global progressto reduce the maternal mortality ratio (MMR), the neo-natal mortality rate, and now (under ENAP guidance) thestillbirth rate [1–3]. Understanding the magnitude andclinical causes of maternal and perinatal mortality are
basic requirements for policy setting, program design,innovation testing, and the implementation of evidence-based interventions. Understanding maternal and new-born outcomes captured at health facilities presents anopportunity for health care staff and decision-makers toreflect on what they could do better.High quality data on how many maternal and new-
born deaths occur and their causes are notoriously dif-ficult to come by and global estimates come fromcomplex models based on multiple sources: vital regis-tration data, confidential enquiries, large householdsurveys, reproductive-age mortality studies, researchreports, surveillance data, and verbal autopsies [4–8].Over the last few decades the Maternal Mortality
* Correspondence: [email protected] Health Programs, FHI 360, 359 Blackwell Street, Durham, NC 27701,USA2Averting Maternal Death & Disability, Columbia University, New York, NY,USAFull list of author information is available at the end of the article
© The Author(s). 2017 Open Access This article is distributed under the terms of the Creative Commons Attribution 4.0International License (http://creativecommons.org/licenses/by/4.0/), which permits unrestricted use, distribution, andreproduction in any medium, provided you give appropriate credit to the original author(s) and the source, provide a link tothe Creative Commons license, and indicate if changes were made. The Creative Commons Public Domain Dedication waiver(http://creativecommons.org/publicdomain/zero/1.0/) applies to the data made available in this article, unless otherwise stated.
Bailey et al. BMC Pregnancy and Childbirth (2017) 17:295 DOI 10.1186/s12884-017-1479-1

Estimation Inter-Agency Group produced a series of ma-ternal mortality estimates [7, 9, 10], the Global Burden ofDisease Studies contributed important systematic analysesof trends, projections, and causes of maternal and childmortality [6, 11, 12], while the World Health Organization(WHO) produced two systematic analyses of the globalcauses of maternal death [13, 14]. The authors of thesecomprehensive systematic reviews shy away from usingroutine health facility data because of inherent selectionbias. However, in the 2003–2009 WHO systematic ana-lysis, the authors consulted health facility data when theinstitutional delivery rate in that country was 50% orgreater during the period reviewed [14].Globally, the coverage of skilled attendant at birth in-
creased from 59% in 1990 to 71% in 2015 [15]. Morecountries are adopting a 100% institutional delivery policyand institutional delivery rates are rising. This shift meansthat proportionately more individuals with peripartumand perinatal complications will access treatment, andmortality events, when they happen, are more likely tooccur in facilities than at home. In low and middle incomecountries facility-based maternal and perinatal mortalityfigures do not yet substitute population-derived estimatesas they reflect only those women and newborns who suc-ceed in accessing facility-based care. Facility-based eventsare highly specific to local contextualized conditions, andthus, are well-suited to inform local policy makers, clini-cians and programs to target specific health systemstrengthening efforts. Most importantly, they can be usedto improve service quality. As the SDGs bring a renewedglobal focus on improving the quality of routine healthmanagement information systems, through the HealthData Collaborative and other initiatives, and as theyinclude the use of new technologies, data quality andavailability will increase and the cost of collecting data willdecrease.This paper reviews data from up to 40 low and middle
income countries and describes the magnitude of insti-tutional maternal mortality, causes of maternal deathand cause-specific case fatality rates, as well as institu-tional stillbirth and early or pre-discharge neonatal deathrates, in most cases, at the national level. This analysisdraws on reports produced over the last decade.
MethodsThis secondary data analysis is based on a review of cross-sectional health facility surveys known as emergency ob-stetric and newborn care (EmONC) assessments, whichfocus on routine intrapartum care for women and theirnewborns as well as more complicated births. These as-sessments have been driven by the United Nations Fundfor Population (UNFPA), the United Nations Children’sFund (UNICEF), the WHO, and the Averting MaternalDeath and Disability (AMDD) program at Columbia
University. The methods have been described elsewhere,but a summary follows [16, 17].
SamplingMost EmONC assessments were national in scope andtargeted facilities providing childbirth services. As a rule,all hospitals were selected, and if a “census” of childbirthsites was not possible, hospitals were supplemented byeither a random sample of mid-level facilities (healthcenters, clinics), or a “restricted census” of higher volumemid-level facilities that attended more than a specifiednumber of monthly deliveries. Usually, both private andpublic sector facilities were included. Table 1 shows thenumber of hospitals and other facilities surveyed in eachcountry and the population size covered by the facilitiesvisited.
Primary data collection instrumentsIn each country, a core team adapted a set of standard-ized instruments that covered the availability and statusof infrastructure, human resources, drugs, equipment,and supplies, and service statistics, in addition to a pro-vider interview and chart reviews [18]. Most relevant tothis paper was the 12-month retrospective summary ofservice statistics that included the number of deliveries,women experiencing obstetric and non-obstetric com-plications by type of complication, maternal deaths bycause, and birth outcomes. Data collectors extracteddata from logbooks in labor and delivery wards, mater-nity wards, operating theatres, and newborn careunits in each facility. When any doubt or clarificationwas required, data collectors turned to the staff onduty.Definitions of causes of maternal death were informed
by the international statistical classification of diseasesand related health problems, 10th edition (ICD-10) andits application to deaths during pregnancy, childbirthand the puerperium (ICD-MM). Obstetric complicationswere elaborated upon to distinguish between antepartumand postpartum hemorrhage and retained placenta. Pro-longed and obstructed labor were included, sometimesjoined as one category. Ruptured uterus and ectopic preg-nancy along with postpartum sepsis, severe pre-eclampsiaand eclampsia were the final “major direct complications”listed on the instrument. Indirect complications includedmalaria, HIV/AIDS, severe anemia, and less commonly,hepatitis and diabetes. In each case, the form included acategory for “other” direct complications and “other” in-direct complications. Causes of death mirrored the listingof complications. Finally, space permitted the reporting ofunspecified/unknown causes of maternal death. For the12-month summary of maternal deaths, the data collec-tors were guided by the primary sources they located onthe wards or with the staff. Where maternal death audits
Bailey et al. BMC Pregnancy and Childbirth (2017) 17:295 Page 2 of 14
Table
1Em
ONCassessmen
tcharacteristicsandfacility-basedratesandratio
s(40coun
tries)
Region
,cou
ntry
andyear
ofdata
collection
Popu
latio
ncovered
No.of
health
facilities
providingde
livery
services
No.of
hospitals
No.of
othe
rfacilities
Institu
-tional
deliveries
(12mo.s)
Expe
cted
births
(12mo.s)
Institu
-tional
deliveryrate
Percen
tage
ofde
liverieswith
obstetric
complica-tio
nse
Institu
tional
maternald
eathsf
(12mo.s)
Institu
-tional
MMR
MMR
(2015)
LAC Ecuado
r2006
a690,049
99
08863
NR
NR
30.0%
779
64
Guyana2010
751,223
5132
1912,803
14,724
87.0%
7.1%
19148
229
Haiti2009
9,761,927
120
5961
65,731
294,034
22.4%
20.8%
170
259
359
Nicaragua
2006
5,626,493
167
20147
94,136
176,409
53.4%
7.2%
4144
150
Panama2007
2078,446
1911
830,811
52,310
58.9%
7.5%
2168
94
Western
Africa
Benin2010
8,497,827
417
34383
203,412
349,856
58.1%
11.8%
483
237
405
BurkinaFaso
2010
15,224,781
1626
611565
499,753
697,295
71.7%
9.6%
676
135
371
Coted’Ivoire
2010
21,693,185
1419
861333
342,936
790,776
43.4%
13.7%
1416
413
645
Gam
bia2012
1,839,447
988
9051,518
69,899
73.7%
10.7%
169
328
706
Ghana
2010
24,232,431
1268
285
983
434,508
751,205
57.8%
20.1%
840
193
319
Guine
a2011
11,211,223
502
49453
141,724
438,293
32.3%
8.3%
459
324
679
Libe
ria2010
3,709,850
304
27277
46,841
159,524
29.4%
11.7%
335
715
725
Mauritania2011
3,297,000
254
18236
83,409
159,533
52.3%
5.0%
132
158
602
Niger
2010
15,203,822
503
36467
152,415
677,352
22.5%
11.7%
1165
970
553
Sene
gal2013
12,873,601
560
29531
237,494
496,921
47.8%
5.0%
1020
429
315
Sierra
Leon
e2008
a5,532,000
145
38107
25,447
254,472
10.0%
11.4%
212
833
1360
Togo
2012
6,191,155
864
46818
133,119
202,451
65.8%
10.7%
225
169
368
EasternAfrica
Burund
i2010
8,246,878
274
48226
231,293
323,278
71.5%
4.5%
220
95712
Djibou
ti2005
636,540
167
911,636
22,289
52.2%
24.4%
22189
229
Eritrea
2008
b3,543,578
118
18100
25,000
NR
26.0%
22.3%
41164
501
Ethiop
ia2008–9
73,918,505
751
112
639
174,561
2,638,891
6.6%
13.9%
685
392
353
Madagascar2009
19,378,009
294
147
147
118,774
647,226
18.4%
17.4%
357
301
353
Malaw
i2014c
15,805,239
365
87278
476,272
790,262
60.3%
8.4%
586
123
634
Mozam
biqu
e2012
g23,569,908
947
56891
647,944
895,656
72.3%
4.3%
1840
284
489
Rwanda
2007
a,h
8,934,215
407
39368
207,738
384,171
54.1%
3.4%
294
142
290
SouthSudan2013
10,864,357
407
63344
52,842
456,303
11.6%
10.2%
497
941
789
Bailey et al. BMC Pregnancy and Childbirth (2017) 17:295 Page 3 of 14

Table
1Em
ONCassessmen
tcharacteristicsandfacility-basedratesandratio
s(40coun
tries)(Con
tinued)
Zanzibar
2012
a1,460,987
7943
3627,102
54,057
50.1%
9.3%
62229
NR
Zambia2014-15c
15,023,315
384
118
266
475,646
644,500
73.8%
5.0%
759
160
224
Cen
tralAfrica
Ang
ola2007
18,176,685
400
84316
248,187
872,481
28.4%
12.5%
1410
568
477
Cam
eroo
n2010
15,544,387
607
123
484
282,486
615,558
45.9%
11.4%
744
263
596
Chad2011
11,679,974
139
5782
49,202
520,927
9.4%
9.3%
1048
2130
856
Con
go2012
4,085,422
240
32208
85,038
170,362
49.9%
5.1%
246
289
442
Dem
RepCon
go2011
15,421,731
266
69197
158,546
616,869
25.7%
10.8%
282
178
693
SãoTomé&P2013
178,739
61
55455
6166
88.5%
3.2%
6110
156
Southe
rnAfrica
Lesotho2015
1,954,906
160
22138
43,165
58,197
74.2%
8.1%
66153
487
Nam
ibia2005
2,028,238
100
4159
44,592
62,875
70.9%
6.7%
57128
265
Asia Afghanistan
2009
23,500,000
7869
9192,627
993,840
19.4%
12.9%
258
134
396
Bang
lade
sh2012
d43,667,450
846
234
612
253,728
NR
NR
17.3%
377
149
176
Cam
bodia2014
13,388,910
180
9189
119,931
382,830
31.3%
8.2%
5748
161
Mon
golia
2009
1,139,462
2121
031,012
27,448
113.0%
28.3%
1032
44
NRno
trepo
rted
,LACLatin
Americaan
dtheCaribbe
an,M
MRmaterna
lmortalityratio
,momon
ths,MMR(201
5)seereference[7]
a Ecuad
or,D
emocratic
Repu
blicof
Con
go,R
wan
da,São
Toméan
dPríncipe
,SierraLeon
ean
dZa
nzibar
repo
rted
onlydirect
materna
ldeaths
bEritrea:2
5,00
0de
liveriesarelivebirths,b
ased
on20
06da
ta,n
otEm
ONCassessmen
t;institu
tiona
ldeliveryrate
also
notba
sedon
EmONCassessmen
tc M
alaw
iand
Zambia:de
aths
andde
liveriesweigh
ted;
inMalaw
iunw
eigh
tedde
liveries=36
7,73
8an
dun
wtde
aths
=55
7;in
Zambia,un
weigh
tedde
liveries=25
4,79
0an
dun
wtde
aths
=67
3dBa
nglade
shhe
alth
facilitiesthat
performed
cesarean
swereconsidered
hospita
ls;ifno
t,considered
“other”.Sampleinclud
ed24
districts
e Com
plications
includ
edon
lymajor
direct
obstetric
complications
(hem
orrhag
e,severe
pre-eclampsia/eclam
psia,sep
sis,prolon
ged/ob
structed
labo
r,severe
abortio
ncomplications,rup
tureduterus,e
ctop
icpreg
nancy)
f Materna
ldeathsinclud
eallm
aterna
ldeaths(dire
ct,ind
irect
andun
know
ncauses)
gMozam
biqu
e:Ba
sedon
3mon
thsof
data,m
ultip
liedby
4to
show
12mon
ths,forconsistencyacross
coun
tries
hRw
anda
:Based
on6mo.sof
data
forfacilitybirths,com
plications
andde
aths,m
ultip
liedby
2to
show
12mon
thsof
data,for
consistencyacross
coun
tries
Bailey et al. BMC Pregnancy and Childbirth (2017) 17:295 Page 4 of 14

or reviews took place, those records were also accessed,but generally no subsequent recoding was performed.The 12-month retrospective compilation of service
statistics was also designed to test the intrapartum andearly neonatal death rate as an indicator of intrapartumcare quality [19]. Data extraction from maternity ordelivery registers captured the number of antepartum(macerated) and intrapartum (fresh) stillbirths, definedby 28 weeks of gestation or more. Intrapartum stillbirthsand live births were divided between those weighingabove and below 2500 g. Early neonatal deaths were de-fined as those occurring before discharge or within thefirst 24 h, whichever came first. Countries varied widelyas to level of detail captured, and thus, categories wereadded for unspecified stillbirths and birth weights whenthe timing of death or birth weight was not recorded,and for live births and early neonatal deaths when birthweight was not recorded.These categories for maternal and newborn outcomes
were standardized across countries. Data collectors weretrained to use a manual with the same definitions foreach obstetric complication, type of stillbirth and earlyneonatal death.
Secondary analysisEmONC assessment final reports were the source ofmost of the data compiled in this paper; we had accessto primary data in nine countries, but only in two orthree situations did we access those data. Becausereporting was largely driven by country interests, notall reports contained the same information nor was itpresented in a standardized fashion. Consequently, thenumber of countries in each table differs. For example,some countries did not report the major obstetric com-plications by type of complication, making it impossibleto calculate cause specific case fatality rates. One reportcandidly reported that the number of maternal deathswas grossly underreported and was not included. Othercountries presented the intrapartum and pre-dischargeneonatal death rate as recommended, restricting thenumerator and denominator to babies weighing 2500 gor more, but they failed to report all stillbirths, nor didthey report the number for which birth weight or stillbirthtiming was unspecified; these data were not included inthe paper. A small number of countries reported only dir-ect maternal deaths, omitting the number of unspecified/unknown maternal deaths or indirect deaths; these reportswere retained. Some countries distinguished betweenantepartum hemorrhage and postpartum hemorrhage,while others reported the two together.About 10 of the 40 countries had conducted more
than one EmONC assessment. In all cases, we extractedinformation from the most recent report except for
Ethiopia, whose final report for their most recent assess-ment was not yet available.Based on numbers drawn from the reports, we cal-
culated the percentage of deliveries with obstetriccomplications and the institutional maternal mortalityratio, using 100,000 deliveries rather than live birthssince some countries only counted deliveries. We alsocalculated any regional aggregations, newborn mortal-ity rates, and the ratio of stillbirths to early neonataldeaths. The case fatality rate was calculated by divid-ing the number of maternal deaths due to a specificcomplication by the number of complications treated.The stillbirth rate was estimated by dividing the totalnumber of stillbirths by all deliveries (multiplied by1000); the pre-discharge neonatal mortality rate wassimilar but we removed the deliveries resulting in astillbirth from the denominator.
Data collection and managementMinistries of Health provided oversight to all EmONCassessments and were usually supported by a technicalsteering committee. Public or private research institu-tions, universities, or central statistical offices were themost common implementing bodies for the assess-ments. Data collection teams usually consisted of fourdata collectors, generally having a health background.Data collectors participated in a weeklong training thatincluded a review of each questionnaire, role plays, andexercises to familiarize themselves with the question-naires and the data collectors’ manual. Each training in-cluded a one-day field activity in local hospitals andhealth centers where teams completed the question-naires under supervision. Generally, quality assuranceteams closely monitored the first week or two of fieldactivities. Teams usually required one to two days tocomplete a hospital and half a day to complete a healthcenter.Data collection was paper-based for all countries but
one, and data entry performed with CSPro. Report ana-lyses were produced with statistical software such asSTATA, SPSS or sometimes excel. When mid-level fa-cilities were sampled, the data were weighted based onselection probability. Weighting is required to accountfor the non-uniform selection probabilities that wouldaffect how data from selected facilities represent all fa-cilities, including those not selected.Technical support was provided by consultants to the
AMDD program. Countries varied by the intensity ofsupport – from no direct AMDD support (Ecuador,Panama, Cote d’Ivoire, Eritrea), to minimal remote support(Mongolia, Cambodia, Afghanistan), to most countries withmore intensive support. UNFPA and UNICEF were the pre-dominant supporters for EmONC assessments but bilateral
Bailey et al. BMC Pregnancy and Childbirth (2017) 17:295 Page 5 of 14
partners and foundations also played important roles de-pending on the country.
Ethical concernsNames of women or other identifying information werenever included in the primary data collection. Countriesfollowed the guidance of their ministries of health andwhen required, approval of the protocols and data collec-tion instruments from local institutional review boardswas obtained. No additional approval was sought for thispaper since the primary source of the data were reports inthe public domain.
ResultsUp to 40 country reports (including Zanzibar) providedthe number of maternal deaths that took place withinhealth care institutions, 31 from sub-Saharan Africa, andthe remaining nine from Latin America and the Caribbeanand Asia (Table 1). The scope of EmONC assessmentsranged from all nine hospitals in the province of Azuay,Ecuador to 1626 facilities in Burkina Faso, inclusive ofall facilities with at least one delivery in the past12 months. The total number of facilities (15,411) regis-tered 6.5 million deliveries and 17,314 maternal deaths.To contextualize the number of institutional maternaldeaths and associated MMR, we included the institu-tional delivery rate and the percentage of institutionaldeliveries with a major direct obstetric complication.Both indicators were derived from EmONC assessmentdata. The final column includes the 2015 population-based MMR estimated by the Maternal Mortality Estima-tion Inter-Agency Group [7], also included for context,although most assessments occurred before 2015. Institu-tional delivery rates ranged from 7% in Ethiopia in 2008–9to 113% in Mongolia (likely explained by a non-standardsampling strategy of 21 hospitals and their catchmentareas). The next highest institutional delivery rate was88% in São Tomé & Príncipe. Institutional MMRs rangedfrom 2130 maternal deaths per 100,000 deliveries in Chadto 32 in Mongolia.Countries with relatively low coverage of institutional
deliveries such as Haiti, Niger, Sierra Leone, Ethiopia,South Sudan, Angola, and Chad tended to have high in-stitutional MMRs, suggesting that a disproportionatenumber of women delivering in facilities experiencedserious complications. To some extent, the percentageof deliveries with major obstetric complications sup-ports this pattern where high percentages were foundin countries with high institutional MMRs. However,countries such as the Democratic Republic of Congo orAfghanistan also exhibited relatively low institutionaldelivery rates, 10% or more of deliveries with complica-tions, and had institutional MMRs of less than 200,making it difficult to discern any robust pattern. A high
percentage of complicated deliveries could also reflectthe type of facility surveyed, e.g. Ecuador (30%) andMongolia (28%), where only hospitals were assessed.
Causes of institutional maternal deaths and cause specificcase fatality ratesFigure 1 shows the distribution of all reported causesof maternal death for 38 countries. In 20 countries,hemorrhage and hypertensive diseases (severe pre-eclampsia/eclampsia) approached or exceeded 40% ofmaternal deaths. Similarly, 10 countries reported simi-lar levels of indirect causes of maternal death.Only 33 countries reported the number of women
with major obstetric complications by type of complica-tion, found in the regional summaries of Table 2 (upperpanel). In the Latin America and Caribbean region,hypertensive disorders ranked first (41% of direct mater-nal deaths), while hemorrhage ranked first in sub-Saharan Africa (33%) and Asia (42%). The lower panelshows that in sub-Saharan Africa 61% of maternal deathswere attributable to direct causes, 35% to indirect causesand 4% were unspecified or unknown, while LatinAmerica and the Caribbean and Asian regions wereweighted towards a larger proportion of direct causes ofdeath.Ruptured uterus had the highest cause-specific case
fatality rate in each region, ranging from 8.9% in sub-Saharan Africa to 2.5% in the Latin America andCaribbean region. In other words, for every 100 womenwith a ruptured uterus in sub-Saharan Africa, 9 will die.The second highest specific cause of death was postpar-tum sepsis in sub-Saharan Africa (5.7%) and in LatinAmerica and the Caribbean (1.1%), while in Asia,hypertensive diseases and hemorrhage tied for second(0.9%).Seventeen sub-Saharan African countries reported
the number of indirect complications and deaths due tomalaria in pregnancy, HIV/AIDS, severe anemia andother indirect causes of death. A few countries reportedsickle cell anemia, hepatitis and diabetes, but mostcountries placed these women in the category of“other” indirect complications; 68% of indirect compli-cations were malaria-related, 13% to HIV/AIDS, 7% toanemia, and 12% to “other indirect” complications. Lessthan 1% of indirect complications reported were casesof sickle cell anemia, hepatitis or diabetes, but morethan a third of pregnant or recently delivered womenwith hepatitis or diabetes died before discharge (under-reporting of survivors was likely). The case fatality ratefor anemia was 2.3%, 1.0% for HIV/AIDS, 0.5% for mal-aria, and 1.6% for “other” indirect complications (datanot shown).Figure 2 depicts the cause-specific case fatality rates for
direct obstetric complications, organized by countries
Bailey et al. BMC Pregnancy and Childbirth (2017) 17:295 Page 6 of 14

within regions. Hashed bars indicate a case fatalityrate based on small numbers. Angola, Chad, CongoBrazzaville, Guinea, Mauritania, Senegal, and SouthSudan experienced high rates (≥4%) across three ormore complications.
Institutional stillbirth and pre-discharge early neonatalmortality ratesTwenty-three countries calculated stillbirth and pre-discharge early neonatal death rates, nine of which did notdistinguish between antepartum and intrapartum still-births, while two countries calculated only a pre-dischargeperinatal mortality rate (Table 3 and Fig. 3). Stillbirth ratesranged from 5.8 per 1000 deliveries in Mongolia, to 116.5in Madagascar. Pre-discharge neonatal death rates were
often much smaller than the stillbirth rates except forMongolia. Early neonatal death rates ranged from 1.8 inGuinea to 21 in Bangladesh. The ratio of stillbirths to earlyneonatal deaths varied widely across countries, rangingfrom the outlier ratios of 26 and 25 stillbirths to 1 pre-discharge neonatal death in Madagascar and Guinea to 0.7to 1 in Mongolia. Mongolia had the lowest institutional andpopulation-based MMR and the lowest stillbirth rate, butits pre-discharge early neonatal death rate was similar tothat of many countries, and begs for an explanation – aquestion of sampling or quality of newborn care?
DiscussionThis institutional assessment compiles data from manycountries where every country set out with similar
Fig. 1 Distribution of causes of maternal death (38 countries). São Tomé & Príncipe, Sierra Leone, Rwanda and Ecuador reported only directcauses of maternal death; HEM=hemmorrhage; PEE=pre-eclampsia, eclampsia; OBSTR=obstructed/prolonged labor; RU=ruptured uterus;SEP=sepsis; AB=abortion; EC=ectopic pregnancy; OTH DIR=other direct causes of death; IND=indirect causes of death; UNSPEC=unspecified/unknown cause of death
Bailey et al. BMC Pregnancy and Childbirth (2017) 17:295 Page 7 of 14

Table
2Num
ericandpe
rcen
tdistrib
utionof
direct
obstetric
complications
andallm
aternald
eathsby
causeandregion
(33coun
tries)
Allregion
sLatin
America&theCaribbe
ana
Sub-SaharanAfrica
bAsiac
Com
plications
Deaths
CFR
Com
plications
Deaths
CFR
Com
plications
Deaths
Com
plications
Deaths
CFR
n%
n%
n%
n%
n%
n%
CFR
n%
n%
Direct
complications/causes
Hem
orrhage
183,232
26%
2902
33%
1.6%
5202
11%
5023%
1.0%
149,093
28%
2588
33%
1.7%
28,937
26%
264
42%
0.9%
Hypertensivedisease
71,658
10%
1689
19%
2.4%
9441
19%
9041%
1.0%
47,993
9%1470
19%
3.1%
14,224
13%
129
21%
0.9%
Abo
rtion
65,594
9%653
8%1.0%
3837
8%20
9%0.5%
42,548
8%598
8%1.4%
19,209
17%
356%
0.2%
Postpartum
sepsis
16,363
2%815
9%5.0%
969
2%11
5%1.1%
13,994
3%793
10%
5.7%
1400
1%11
2%0.8%
Obstr/prolong
labo
r154,648
22%
773
9%0.5%
6037
12%
73%
0.1%
128,099
24%
722
9%0.6%
20,512
18%
447%
0.2%
Ectopicpreg
nancy
13,732
2%211
2%1.5%
727
1%6
3%0.8%
10,756
2%200
3%1.9%
2249
2%5
1%0.2%
Ruptured
uterus
8727
1%719
8%8.2%
122
0.2%
31%
2.5%
7786
1%695
9%8.9%
819
1%21
3%2.6%
Other
185,241
26%
929
11%
0.5%
22,639
46%
3014%
0.1%
136,907
25%
786
10%
0.6%
25,695
23%
113
18%
0.4%
Total
699,195
100%
8691
100%
1.2%
48,974
100%
217
100%
0.4%
537,176
100%
7852
100%
1.5%
113,045
100%
622
100%
0.6%
Direct
causes
8691
63%
217
82%
7852
61%
622
89%
Indirect
causes
4660
34%
3313%
4556
35%
7110%
Unspe
cifiedcauses
539
4%12
5%518
4%9
1%
TOTA
L13,890
100%
262
100%
12,926
100%
702
100%
Note:
CFRCasefatalityrate;“othe
r”direct
complications
includ
edprem
atureruptureof
mem
bran
es,m
alpresen
tatio
n,preterm
labo
r,po
st-term
labo
r,previous
cesarean
delivery,cord
prolap
se,m
ultip
lege
stations
and
othe
rs.“Other”direct
deaths
includ
eem
bolism,ane
sthe
siacomplications,and
othe
rsa Include
sEcua
dor,Guy
ana,Haiti,
Nicarag
uaan
dPa
nama
bInclud
esBe
nin,
Gam
bia,Gha
na,G
uine
a,Libe
ria,M
auritan
ia,N
iger,Sen
egal,Tog
o,Bu
rund
i,Djib
outi,
Eritrea,E
thiopia,Malaw
i,Mozam
biqu
e,So
uthSu
dan,
Zambia,Ang
ola,Cam
eroo
n,Cha
d,Con
go,São
Tomé&Príncipe
,Lesothoan
dNam
ibia
c Includ
esAfgha
nistan
,Ban
glad
esh,
Cam
bodiaan
dMon
golia
Bailey et al. BMC Pregnancy and Childbirth (2017) 17:295 Page 8 of 14

objectives, used a similar methodology and data collec-tion instrument, and had common indicators. By design,each assessment captured a complete recording of allmaternal deaths by cause and common perinatal out-comes. This is a strength that other multi-country stud-ies have not shared. In this overview, we gatheredservice statistics from more than 15,400 health care fa-cilities that mirror findings from more complex model-ing exercises, regardless of differences in methodologyand reference populations.We saw hypertensive diseases as the predominant cause
of institutional maternal death in the Latin America andCaribbean region and hemorrhage highlighted in Asiancountries, despite the small number of surveys in each ofthose regions. Meanwhile, hemorrhage was the predomin-ant cause of institutional maternal deaths in sub-SaharanAfrican countries, a region also distinguished by its largeproportion of indirect maternal deaths.In Table 4 below we compare the overall distribution
of institutional causes of 14,785 deaths from 26 sub-Saharan African countries with the population-baseddistribution found in the WHO 2003–2009 systematicreview (in both cases, unknown causes of death were ex-cluded). Cases of ruptured uterus and obstructed laborwere included in “other direct causes” for the EmONC
Assessments while these cases were likely assigned tohemorrhage or sepsis in the WHO study [14]. The de-gree of similitude in the distribution of causes is bothvalidating and reassuring but may also point to possibledata quality issues and/or differences between all deathsversus just those occurring in facilities.The larger proportion of indirect causes found in this
paper is noteworthy but it also may be underreportedespecially where comorbidities were common. Duringthe training, data collectors were instructed to classify amaternal death as direct if there was evidence of bothdirect and indirect causes. For programmatic purposes,indirect causes of maternal mortality require a greaterfocus of attention, not just for purposes of reporting butalso for health service delivery organization to interveneearly to prevent these deaths.We also observed that institutional stillbirth rates
tended to be substantially higher than early neonatal deathrates, and that countries with high institutional stillbirthrates also tended to exhibit high institutional MMRs.According to other studies, we might have expected theratio of stillbirths to early neonatal deaths to be approxi-mately 1.3 to 1, but these institutional data suggest a lowerratio, i.e., more stillbirths than expected [20, 21]. Unfortu-nately, given the uneven reporting of whether the stillbirth
Fig. 2 Cause-specific case fatality rates by region and country (33 countries). Hashed bars represent rates based on very small numbers;HEM=hemmorrhage; OBL=obstructed/prolonged labor; RU=ruptured uterus; SEP=sepsis; PEE=pre-eclampsia, eclampsia; AB=abortion; ECT=ectopicpregnancy; LAC=Latin America & the Caribbean; Maurit=Mauritania; Mozam=Mozambique; Ecua=Ecuador; Guya=Guyana; Nica=Nicaragua;Panam=Panama; Afghan=Afghanistan; Bangla=Bangladesh; Camb=Cambodia; Mongol=Mongolia; STP=São Tomé e Príncipe
Bailey et al. BMC Pregnancy and Childbirth (2017) 17:295 Page 9 of 14

was macerated or intrapartum, the often-cited ratio of 1intrapartum stillbirth to 3 macerated stillbirths could notbe assessed [22].The 2030 ENAP target for the stillbirth rate is 12/1000
total births and the target neonatal death rate is thesame, but among live births. At this time, most countriesin this overview are far from reaching the stillbirth targetand many countries would fail to reach the neonatal tar-get of 12, although this is more difficult to ascertaingiven the censoring of data since so many women andtheir newborns are discharged within 12 h of delivery. Arecent six-country study of early neonatal mortalityshowed that neonatal deaths in the first six and 24 h ac-count for one-third and 46%, respectively, of all neonataldeaths [23]. Therefore, a doubling or tripling of the earlyneonatal deaths observed in this overview might provide
a rough estimate of the actual neonatal death rate. Butlike the MMR, it is unclear whether institutional ratesand ratios are likely to be higher or lower than thepopulation-based rates. Nevertheless, high stillbirth ratesobserved in the EmONC assessments give pause; theglobal stillbirth rate for 2015 was 18.4 per 1000 births,while the rate for sub-Saharan Africa was 28.7 [4]. Ac-cording to the authors of recent trend data for stillbirthrates, when compared to high quality vital registrationdata, facility data tend to overestimate the stillbirth ratedue to selection bias [4, 5].Despite evidence for reductions in maternal and peri-
natal mortality over the last two decades, this multi-country overview leads to recommendations for clinicalpractice and policy if we are to move towards the goal ofending preventable maternal and newborn deaths. From
Table 3 Institutional stillbirth and pre-discharge early neonatal mortality rates (23 countries)
Region, country andyear of data collection
Institu-tionaldeliveries
Ante-partumSBs
Intra-partumSBs
Unspe-cifiedSBs
TotalSBs
SB rate per1000 deliveries
pNDs pND rate per1000 live births
SB:pNDratio
LAC
Guyana 2010 12,803 70 67 89 226 17.7 65 5.2 3.5
Nicaragua 2006 94,136 NR NR NR 1210 12.9 889 9.6 1.4
Western Africa
Gambia 2012 51,518 1023 944 66 2033 39.5 433 8.8 4.7
Ghana 2010 434,508 3989 4685 1223 9897 22.8 2201 5.2 4.5
Guinea 2011 141,724 1944 1457 3639 6040 42.6 242 1.8 25.0
Niger 2010 152,415 1171 4105 1072 6348 41.6 545 3.7 11.6
Senegal 2013 237,494 3761 3345 2078 9184 38.7 1439 6.3 6.4
Togo 2012 133,119 974 1728 1150 3852 28.9 634 4.9 6.1
Eastern Africa
Eritrea 2008 25,000 NR NR NR 933 37.3 185 7.7 5.0
Ethiopia 2008–9 174,561 NR NR NR 7366 42.2 522 3.1 14.1
Madagascar 2009 118,774 NR NR NR 13,832 116.5 527 5.0 26.2
Malawi 2014 476,272 3632 4403 NR 8035 16.9 5028 10.7 1.6
Mozambique 2012a 647,944 828 3440 8200 12,468 19.2 1380 2.2 9.0
Rwanda 2007a 207,738 17,456 5618 NR 23,074 11.1 9432 5.1 2.4
South Sudan 2013 52,842 208 541 373 1122 21.2 948 18.3 1.2
Zambia 2014–15 475,646 NR NR NR 11,233 23.6 1980 4.3 5.7
Central Africa
Chad 2011 49,202 274 814 NR 2155 43.8 239 5.1 9.0
Congo 2012 85,038 657 856 219 1732 20.4 264 3.2 6.6
Dem Rep Congo 2011 156,546 NR NR NR 5949 38.0 1271 8.4 4.7
Asia
Afghanistan 2009 192,627 NR NR NR 4177 21.7 1422 7.5 2.9
Bangladesh 2012 253,728 NR NR NR 8119 32.0 5158 21.0 1.6
Cambodia 2014 119,931 92 715 NR 807 6.7 479 4.0 1.7
Mongolia 2009 30,131 NR NR NR 175 5.8 242 8.1 0.7
NR not reported, SB stillbirth, pND pre-discharge early neonatal death, dying before discharge or within the first 24 h, whichever came firstaMozambique and Rwanda adjusted to reflect 12 months of information
Bailey et al. BMC Pregnancy and Childbirth (2017) 17:295 Page 10 of 14

the clinical perspective, although fewer in absolute num-bers than hemorrhage or hypertensive disorders, uterinerupture and maternal sepsis were the most lethal compli-cations. The literature consistently shows the elevated riskof mortality from ruptured uterus [24–27]. High casefatality rates for uterine rupture suggest poor diagnosticskills, inadequate patient monitoring after admission anddelays in appropriate treatment [28], or perhaps inappro-priate or overuse of augmentation or induction. Severalstudies point to high rates of rupture after admission
[25, 29]. Ruptured uterus is also an indication thatwomen with obstructed labor or at risk of rupture, e.g.having a previous uterine scar, still experience difficul-ties in accessing surgical care in a timely manner.Considerable international investment has focused on
reducing deaths due to hemorrhage and hypertensivedisorders, given how many deaths are attributable tothese complications. Both have well-known pharmaco-logical solutions as well as effective preventative mea-sures with active management of the third stage of
Fig. 3 Institutional stillbirth and pre-discharge neonatal death (pND) rates (25 countries)
Bailey et al. BMC Pregnancy and Childbirth (2017) 17:295 Page 11 of 14

labor and the potential to detect high blood pressureand proteinuria during antenatal care. Ruptured uterusmight be viewed as requiring more complex multi-sectoral fixes – improved road networks, better com-munication and transportation options, as well as thehuman resources who can and will monitor the pro-gression of labor, follow protocol, and perform cesareandelivery. Sepsis may require more of a professional cul-ture change towards infection prevention, more access-ible water, sanitation and hygiene infrastructure as wellas antenatal screening.To optimize the investment of an EmONC assessment,
it should be followed by multilevel planning and imple-mentation phases. In 2016, only six of the countriesmentioned in this publication have set up such processesthat include maternal and newborn care monitoring inEmONC facilities (Burkina Faso, Cambodia, Haiti,Madagascar, Niger and Togo). However, this number islikely to increase significantly in 2017. The production,analysis and utilization of data by providers with thesupport of coaches also contribute to improve quality ofcare.
LimitationsWithout access to the original data, we could notstandardize reporting nor could we stratify by level of fa-cility or management authority, which would haveallowed a deeper understanding of which deaths oc-curred where and how many. There may also have beenbias in how causes of death were ascertained acrosscountries although training guidelines were the sameacross most countries. It is possible that some countrieswere more comfortable than others using ICD-MM. Go-ing forward, EmONC assessments should better alignthe cause of death categories with ICD-MM, thus mak-ing these data more attractive as an additional source forglobal estimates.Systematic documentation of stillbirths is at an early
stage in many low and middle income countries andthe differentiation between antepartum and intrapar-tum stillbirths is not yet standard practice across or
within countries. Like maternal deaths, stillbirth ratesand early neonatal death rates are susceptible to errorsof omission and misclassification [30]. Especially criticalmay be widespread misclassification of early neonataldeaths as intrapartum stillbirths due to lack of diagnos-tic skill, environmental pressure or convenience. Coun-tries such as Madagascar, Guinea and Ethiopia thatexhibited an extreme ratio of stillbirths to early neo-natal deaths should investigate these rates to under-stand possible contributory clinical and reportingpractices. Caregivers need access to simple equipmentto measure the presence of fetal heart beats on admis-sion, training to make accurate assessments and thepaper or electronic tools that encourage reportingwhether the fetal death was antepartum or intrapartum[31]. As long as large numbers of stillbirths and birthweights remain unspecified, the use of the intrapartumand early neonatal death rate as an indicator for qualityof intrapartum care will be compromised or relegatedto the status of a special study.The recording of maternal deaths is likely to be in-
complete given the primary sources of the statistics –routine paper-based logbooks – the extended coverageof 12 months, and for unintentional and intentionalreasons. Obstetric complications are also likely to beundercounted as they are rarely collected by routinehealth management information systems. Specific casefatality rates suggest inconsistent reporting and re-cording across facilities and countries. For example,the case fatality rate of 1% for HIV in sub-SaharanAfrica was surprisingly low as were the case fatalityrates of 0% for hemorrhage in Ecuador, and 0% forobstructed labor in Ghana, Togo and the Gambia.Nevertheless, by supporting the EmONC assessmentswe have learned that registers and logbooks tend to bemore complete than facility reports of aggregated data.We also observed that where maternal death surveil-lance and response (MDSR) initiatives were wellentrenched, the quality of the maternal death data inthe EmONC assessments appeared to be of higherquality than where MDSR efforts were in their earlystages. As countries adopt Making Every Baby Count:Audit and Review of Stillbirths and Neonatal Deaths,routine data on newborn outcomes are likely to im-prove in quality as will our understanding of whydeaths occur and how to intervene.
ConclusionsAs skilled delivery coverage increases and maternal mor-tality declines, women who die in facilities may no lon-ger represent the tip of an iceberg, but most maternaldeaths. With appropriate reflection, institutional still-birth and early neonatal death rates, causes of maternal
Table 4 Comparison of causes of maternal mortality in sub-Saharan countries by different sources
For sub-SaharanAfrican countries
EmONC Assessments(institution-based)
WHO 2003–2009 Review(population-based)
Hemorrhage 21.0% 24.5%
Abortion + ectopicpregnancy
7.2% 9.6%
Sepsis 6.0% 10.3%
Hypertensive diseases 10.5% 16.0%
Other direct causes 17.8% 11.1%
Indirect causes 37.5% 28.6%
Bailey et al. BMC Pregnancy and Childbirth (2017) 17:295 Page 12 of 14

death and case fatality rates can guide management onhow to improve health workers’ capacity to meet the de-mand for emergency care, including record-keeping, andidentify hotspots of where and what is needed to reducedelays in seeking, reaching and receiving care. Facility-level data will become all the more important and thusefforts to improve data quality are crucial.
AbbreviationsAMDD: Averting Maternal Death and Disability; EmONC: emergency obstetricand newborn care; ENAP: Every Newborn Action Plan; ICD-10: Internationalstatistical classification of diseases and related health problems, 10th edition;ICD-MM: The WHO application of ICD-10 to deaths during pregnancy, child-birth, and the puerperium (maternal mortality); MDSR: Maternal deathsurveillance and response; MMR: Maternal mortality ratio; SDG: SustainableDevelopment Goal; UNFPA: United Nations Population Fund; UNICEF: UnitedNations Children’s Fund; WHO: World Health Organization
AcknowledgementsWe would like to acknowledge two persons who extracted most of the datafrom the published reports – Lauren Hart and Carolyn Huang, who at thetime were affiliated with the MEASURE Evaluation Phase IV Project at theUniversity of North Carolina, and we thank internal reviewers Catherine Toddand Donna McCarraher for their helpful reviews as well as external reviewers.
FundingThe United States Agency for International Development (USAID) funded thepreparation of this publication through a cooperative agreement (GHA-A-00-08-00003-00) with the MEASURE Evaluation Phase IV Project under a contractwith FHI 360. The manuscript represents the views of the authors and doesnot represent the views of USAID or the US Government. The funders hadno role in the design of the study, the collection, analysis, and interpretationof data, or the writing of the manuscript.
Availability of data and materialsData sharing is not applicable as most of the data were extracted fromEmONC assessment reports that are in the public domain. There is nocentralized archive for assessment datasets, but may be available fromcountry Ministries of Health and UNFPA or UNICEF country offices. Specificreports can be requested from the authors.
Authors’ contributionsPB, KS, AM determined the design of the study; PB coordinated the dataextraction and drafted the analysis; MK provided critical review; WA, SG, EK,EL, HM, and DO have supported multiple assessments and reviewed specificcountry findings; MB and LF oversaw the overall implementation of EmONCassessment program and provided critical review. All authors contributed tothe writing and approved the final version.
Ethics approval and consent to participateThe authors did not seek approval from an internal review board for thissecondary data analysis since the primary sources of the data were reportsin the public domain, based on surveys that had already undergone ethicalapproval. Names of women or other identifying information were neverincluded in primary data collection. Countries followed the guidance oftheir ministries of health or the research institutions that carried out thesurveys, and when required, approval of the protocols and data collectioninstruments from local institutional review boards was obtained.
Consent for publicationNot applicable.
Competing interestsThe authors declare that they have no competing interests.
Publisher’s NoteSpringer Nature remains neutral with regard to jurisdictional claims inpublished maps and institutional affiliations.
Author details1Global Health Programs, FHI 360, 359 Blackwell Street, Durham, NC 27701,USA. 2Averting Maternal Death & Disability, Columbia University, New York,NY, USA. 3Independent consultant, Addis Ababa, Ethiopia. 4UNFPA, New York,NY, USA. 5Independent consultant, Cotonou, Benin. 6Independent consultant,Lilongwe, Malawi. 7U.S. Agency for International Development, Washington,DC, USA. 8Independent consultant, Rabat, Morocco. 9Independent consultant,Nouakchott, Mauritania. 10MEASURE Evaluation, Carolina Population Center,University of North Carolina at Chapel Hill, Chapel Hill, NC 27516, USA.11Department of Maternal and Child Health, Gillings School of Global PublicHealth, University of North Carolina at Chapel Hill, Chapel Hill, NC 27599,USA.
Received: 9 February 2017 Accepted: 30 August 2017
References1. Moxon SG, Ruysen H, Kerber KJ, Amouzou A, Fournier S, Grove J, Moran AC,
Vaz LM, Blencowe H, Conroy N, et al. Count every newborn; a measurementimprovement roadmap for coverage data. BMC Pregnancy Childbirth. 2015;15(Suppl 2):S8.
2. World Health Organization: Every Newborn: an Action Plan to EndPreventable Deaths (ENAP) [http://www.who.int/maternal_child_adolescent/topics/newborn/en/]. Accessed 7 Sept 2017.
3. World Health Organization: Strategies toward Ending Preventable MaternalMortality (EPMM) [http://who.int/reproductivehealth/topics/maternal_perinatal/epmm/en/]. Accessed 15 May 2017.
4. Blencowe H, Cousens S, Jassir FB, Say L, Chou D, Mathers C, Hogan D,Shiekh S, Qureshi ZU, You D, et al. National, regional, and worldwideestimates of stillbirth rates in 2015, with trends from 2000: a systematicanalysis. Lancet Glob Health. 2016;4(2):e98–e108.
5. Cousens S, Blencowe H, Stanton C, Chou D, Ahmed S, Steinhardt L, CreangaAA, Tuncalp O, Balsara ZP, Gupta S, et al. National, regional, and worldwideestimates of stillbirth rates in 2009 with trends since 1995: a systematicanalysis. Lancet. 2011;377(9774):1319–30.
6. Wang H, Liddell CA, Coates MM, Mooney MD, Levitz CE, Schumacher AE,Apfel H, Iannarone M, Phillips B, Lofgren KT, et al. Global, regional, andnational levels of neonatal, infant, and under-5 mortality during 1990-2013:a systematic analysis for the global burden of disease study 2013. Lancet.2014;384(9947):957–79.
7. World Health Organization, UNICEF, UNFPA, World Bank Group, UnitedNations Population Divsion: Trends in Maternal Mortality: 1990 to 2015. In.Geneva, Switzerland; 2015:38.
8. Mgawadere F, Kana T, van den Broek N. Measuring maternal mortality: asystematic review of methods used to obtain estimates of the maternalmortality ratio (MMR) in low- and middle-income countries. Br Med Bull.2017;122(1):1.
9. AbouZahr C, Wardlaw T, Hill K. Maternal mortality in 2000: estimatesdeveloped by WHO. Geneva: UNICEF and UNFPA; 2004.
10. World Health Organization, UNICEF, UNFPA, The World Bank, United NationsPopulation Divsion: Trends in maternal mortality: 1990 to 2013. Estimates byWHO, UNICEF, UNFPA, The World Bank and the United Nations PopulationDivision. In. Geneva, Switzerland; 2014: 56.
11. Kassebaum NJ, Bertozzi-Villa A, Coggeshall MS, Shackelford KA, Steiner C,Heuton KR, Gonzalez-Medina D, Barber R, Huynh C, Dicker D, et al. Global,regional, and national levels and causes of maternal mortality during 1990-2013: a systematic analysis for the global burden of disease study 2013.Lancet. 2014;384(9947):980–1004.
12. Kassebaum NJ, Collaborators GMM. Global, regional, and national levels ofmaternal mortality, 1990-2015: a systematic analysis for the global burden ofdisease study 2015. Lancet. 2016;388:1775–812.
13. Khan KS, Wojdyla D, Say L, Gulmezoglu AM, Van Look PFA. WHOanalysis of causes of maternal death: a systematic review. Lancet. 2006;367(9516):1066–74.
14. Say L, Chou D, Gemmill A, Tunçalp O, Moller A, Daniels J, Gulmezoglu A,Temmerman M, Alkema L. Global causes of maternal death: a WHOsystematic analysis. Lancet Global Health. 2014;11:e323–33.
15. United Nations: The millennium development goals report 2015 [http://www.un.org/millenniumgoals/2015_MDG_Report/pdf/]. Accessed 21 May 2017.
16. Keyes EB, Haile-Mariam A, Tesfaye NB, Wasihun GA, Pearson L, Abdullah M,Kebede H. Ethiopia’s Assessment of emergency obstetric and newborn care:
Bailey et al. BMC Pregnancy and Childbirth (2017) 17:295 Page 13 of 14
setting the gold standard for national facility-based assessments. Int JGynecol Obstet. 2011;115(1):94–100.
17. Bailey P, van Roosmalen J, Mola G, Evans C, de Bernis L, Dao B. Assistedvaginal delivery in low and middle income countries: an overview. B J O G.2017;124(9):1335–44.
18. Averting Maternal Death and Disability (AMDD) Toolkit [https://www.mailman.columbia.edu/research/averting-maternal-death-and-disability-amdd/toolkit]. Accessed 21 May 2017.
19. Fauveau V. New indicator of quality of emergency obstetric and newborncare. Lancet. 2007;370(9595):1310–0.
20. WHO: The World Health Report: 2005. Make every mother and child count.Geneva: World Health Organization; 2005.
21. Engmann C, Matendo R, Kinoshita R, Ditekemena J, Moore J, Goldenberg RL,Tshefu A, Carlo WA, McClure EM, Bose C, et al. Stillbirth and early neonatalmortality in rural Central Africa. Int J Gynaecol Obstet. 2009;105(2):112–7.
22. Lawn J, Shibuya K, Stein C. No cry at birth: global estimates of intrapartumstillbirths and intrapartum-related neonatal deaths. Bull World Health Organ.2005;83:409–17.
23. Baqui AH, Mitra DK, Begum N, Hurt L, Soremekun S, Edmond K, et al.Neonatal mortality within 24 hours of birth in six low- and lower-middle-income countries. Bull World Health Organ. 2016;94:752–758B.
24. Hofmeyr GJ, Say L, Gulmezoglu AM. WHO systematic review of maternalmortality and morbidity: the prevalence of uterine rupture. BJOG. 2005;112(9):1221–8.
25. van den Akker T, Mwagomba B, Irlam J, van Roosmalen J. Using audits toreduce the incidence of uterine rupture in a Malawian district hospital.Int J Gynecol Obstet. 2009;107(3):289–94.
26. Nakimuli A, Nakubulwa S, Kakaire O, Osinde MO, Mbalinda SN, Nabirye RC,Kakande N, Kaye DK. Maternal near misses from two referral hospitals inUganda: a prospective cohort study on incidence, determinants andprognostic factors. BMC Pregnancy Childbirth. 2016;16:24.
27. Nyamtema AS, Mwakatundu N, Dominico S, Mohamed H, Pemba S,Rumanyika R, Kairuki C, Kassiga I, Shayo A, Issa O, et al. Enhancing maternaland Perinatal health in under-served remote areas in sub-Saharan Africa: aTanzanian model. PLoS One. 2016;11(3):e0151419.
28. Miller S, Abalos E, Chamillard M, Ciapponi A, Colaci D, Comande D, Diaz V,Geller S, Hanson C, Langer A, et al. Beyond too little, too late and too much,too soon: a pathway towards evidence-based, respectful maternity careworldwide. Lancet. 2016;388(10056):2176–92.
29. Mbaruku G, van Roosmalen J, Kimondo I, Bilango F, Bergstrom S. Perinatalaudit using the 3-delays model in western Tanzania. Int J Gynaecol Obstet.2009;106(1):85–8.
30. Maaloe N, Housseine N, Bygbjerg IC, Meguid T, Khamis RS, Mohamed AG,Nielsen BB, van Roosmalen J. Stillbirths and quality of care during labour atthe low resource referral hospital of Zanzibar: a case-control study. BMCPregnancy Childbirth. 2016;16(1):351.
31. Goldenberg RL, McClure EM, Kodkany B, Wembodinga G, Pasha O, Esamai F,Tshefu A, Patel A, Mabaye H, Goudar S, et al. A multi-country study of the“intrapartum stillbirth and early neonatal death indicator” in hospitals inlow-resource settings. Int J Gynecol Obstet. 2013;122(3):230–3.
• We accept pre-submission inquiries
• Our selector tool helps you to find the most relevant journal
• We provide round the clock customer support
• Convenient online submission
• Thorough peer review
• Inclusion in PubMed and all major indexing services
• Maximum visibility for your research
Submit your manuscript atwww.biomedcentral.com/submit
Submit your next manuscript to BioMed Central and we will help you at every step:
Bailey et al. BMC Pregnancy and Childbirth (2017) 17:295 Page 14 of 14


![[XLS] · Web viewPopulation (000) (000) % total DEATHS UNPOP DIVISION 98 REV I. Communicable diseases, maternal and perinatal conditions and nutritional deficiencies Tuberculosis](https://img.pdfslide.us/doc/110x75/5b01aeed7f8b9a65618e0161/xls-viewpopulation-000-000-total-deaths-unpop-division-98-rev-i-communicable.jpg)