Embed Size (px)
Citation preview

Maternal and Perinatal Mortality and Morbidity in QueenslandQueensland Maternal and Perinatal Quality Council Report 2013
Great state. Great opportunity.
Department of Health

Report authors Professor Michael HumphreyProfessor Paul ColditzAssociate Professor Vicki Flenady Dr Nikki Whelan
Editorial Sub-Committee
Professor Michael Humphrey (Chair)Professor Leonie Callaway Joanne ElleringtonAssociate Professor Vicki Flenady Rebecca JenkinsonProfessor Sue Kildea
See page 108 and 109 for Authors’ and Editorial Sub-Committee details.
Maternal and perinatal mortality and morbidity in QueenslandQueensland Maternal and Perinatal Quality Council Report 2013
ISBN 978-1-876532-02-4
Published by the State of Queensland (Department of Health), September, 2013
This document is licensed under a Creative Commons Attribution 3.0 Australia licence. To view a copy of this licence, visit creativecommons.org/licenses/by/3.0/au
© State of Queensland (Department of Health) [2013]You are free to copy, communicate and adapt the work, as long as you attribute the State of Queensland (Department of Health).
For more information contact:
The Secretariat Queensland Maternal and Perinatal Quality Council
C/- Clinical Access and Redesign UnitHealth Service and Clinical Innovation Division, Level 13, Block 7Royal Brisbane and Women’s HospitalHerston QLD 4029Phone: 07 3646 6880Email: [email protected]

1
Queensland Maternal and Perinatal Quality Council Report 2013
Preface
The primary purpose of the Queensland Maternal and Perinatal Quality Council is to provide advice and make recommendations to the Minister for Health and the Director-General of the Queensland Department of Health on matters relating to statewide and facility-specific morbidity and mortality. The Council functions under the quality assurance provisions of sections 81-92 of the Hospital and Health Boards Act 2011, which enables the Council to undertake confidential enquiries into maternal and perinatal morbidity and mortality while providing members with legislative protection.
This is the third report of the Council since it recommenced activity in mid-2009, after a three year period during which its purpose and functionality were reviewed. This report:
• Reviews maternal deaths in the period 2009 to 2011 in Queensland• Reviews perinatal deaths in the period 2009 to 2011 in Queensland• Examines pregnancy and newborn outcomes in the period 2010 to 2011 in Queensland.
The report highlights clinical areas which may benefit from review by practitioners in maternity and newborn facilities, to the ultimate benefit of future mothers and babies.
The report contains data obtained from the following sources:
• Perinatal Data Collection Team (PDCT)• Health Statistics Unit (HSU)• Australian Institute of Health and Welfare (AIHW)• Registry of Births, Deaths and Marriages, Queensland• Office of the State Coroner, Queensland.
The Council is grateful for the cooperation of the Registrar for Births, Deaths and Marriages and the State Coroner who have facilitated access to relevant data.
I would like to thank the Council members, and those who support them, for their commitment to improving maternal and perinatal outcomes. I trust that clinicians throughout Queensland will find this report helpful and ask that they give careful consideration to, in particular, the Council’s recommendations and good practice points.
The Department of Health supports the work of the Queensland Maternal and Perinatal Quality Council with the realisation that sound health planning principles need to be based on the best available evidence including analyses of health outcomes by clinical experts such as form the contents of this report. Comments on the findings of this report are welcomed.
Dr Michael Cleary Deputy Director-General Health Service and Clinical Innovation Division Queensland Department of Health
Maternal and Perinatal Mortality and Morbidity in Queensland
2
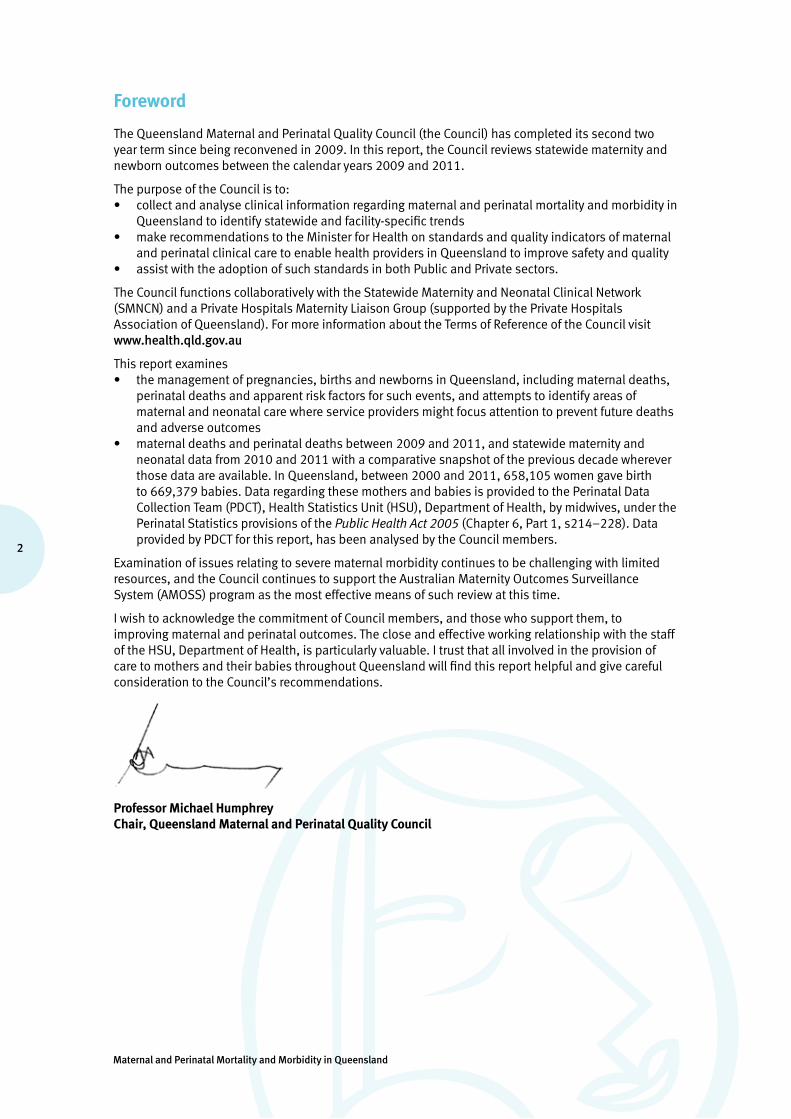
Foreword
The Queensland Maternal and Perinatal Quality Council (the Council) has completed its second two year term since being reconvened in 2009. In this report, the Council reviews statewide maternity and newborn outcomes between the calendar years 2009 and 2011.
The purpose of the Council is to:• collect and analyse clinical information regarding maternal and perinatal mortality and morbidity in
Queensland to identify statewide and facility-specific trends• make recommendations to the Minister for Health on standards and quality indicators of maternal
and perinatal clinical care to enable health providers in Queensland to improve safety and quality• assist with the adoption of such standards in both Public and Private sectors.
The Council functions collaboratively with the Statewide Maternity and Neonatal Clinical Network (SMNCN) and a Private Hospitals Maternity Liaison Group (supported by the Private Hospitals Association of Queensland). For more information about the Terms of Reference of the Council visit www.health.qld.gov.au
This report examines • the management of pregnancies, births and newborns in Queensland, including maternal deaths,
perinatal deaths and apparent risk factors for such events, and attempts to identify areas of maternal and neonatal care where service providers might focus attention to prevent future deaths and adverse outcomes
• maternal deaths and perinatal deaths between 2009 and 2011, and statewide maternity and neonatal data from 2010 and 2011 with a comparative snapshot of the previous decade wherever those data are available. In Queensland, between 2000 and 2011, 658,105 women gave birth to 669,379 babies. Data regarding these mothers and babies is provided to the Perinatal Data Collection Team (PDCT), Health Statistics Unit (HSU), Department of Health, by midwives, under the Perinatal Statistics provisions of the Public Health Act 2005 (Chapter 6, Part 1, s214–228). Data provided by PDCT for this report, has been analysed by the Council members.
Examination of issues relating to severe maternal morbidity continues to be challenging with limited resources, and the Council continues to support the Australian Maternity Outcomes Surveillance System (AMOSS) program as the most effective means of such review at this time.
I wish to acknowledge the commitment of Council members, and those who support them, to improving maternal and perinatal outcomes. The close and effective working relationship with the staff of the HSU, Department of Health, is particularly valuable. I trust that all involved in the provision of care to mothers and their babies throughout Queensland will find this report helpful and give careful consideration to the Council’s recommendations.
Professor Michael Humphrey Chair, Queensland Maternal and Perinatal Quality Council

3
Queensland Maternal and Perinatal Quality Council Report 2013
Contents
Preface ................................................................................................................................................................. 1
Foreword .............................................................................................................................................................. 2
List of figures........................................................................................................................................................ 5
List of tables ......................................................................................................................................................... 6
Summary .............................................................................................................................................................. 9
Recommendations ............................................................................................................................................. 11
Good practice points .......................................................................................................................................... 11
1. Maternal and perinatal mortality ................................................................................................................... 131.1 Definitions...................................................................................................................................................... 131.2 Maternal deaths .......................................................................................................................................... 14
1.2.1 Maternal mortality ratio (MMR) ......................................................................................................... 141.2.2 Classification of cause of maternal deaths 2009 to 2011 ................................................................. 141.2.3 Cause of maternal death .................................................................................................................. 141.2.4 Avoidability ...................................................................................................................................... 151.2.5 Data collection and quality ............................................................................................................... 151.2.6 Reporting of maternal deaths ........................................................................................................... 151.2.7 Deaths of Aboriginal and Torres Strait Islander women ..................................................................... 151.2.8 Suicide ............................................................................................................................................. 161.2.9 Maternal cardiac disease ................................................................................................................. 161.2.10 Hypertension in pregnancy .............................................................................................................. 161.2.11 Other clinical issues raised by case review ....................................................................................... 171.2.12 Malignant melanoma ....................................................................................................................... 171.2.13 Autopsies following maternal death ................................................................................................ 17
1.3 Perinatal deaths ........................................................................................................................................... 171.3.1 Perinatal mortality review modus operandi ...................................................................................... 171.3.2 Clinical classification ....................................................................................................................... 171.3.3 Data collection and data quality ...................................................................................................... 181.3.4 The Improving perinatal review and outcomes via education program.............................................. 191.3.5 National Perinatal Death Clinical Audit Tool ..................................................................................... 191.3.6 Definitions of perinatal deaths ........................................................................................................ 201.3.7 Perinatal mortality rates and trends ................................................................................................. 201.3.8 PSANZ-PDC and PSANZ-NDC classification of perinatal deaths ......................................................... 211.3.9 Multiple pregnancy .......................................................................................................................... 241.3.10 Indigenous perinatal mortality ......................................................................................................... 251.3.11 Gestation and birthweight specific perinatal mortality rates ............................................................. 261.3.12 Perinatal autopsies: ......................................................................................................................... 29
2. Pregnancy and newborn care ..................................................................................................................... 292.1 Mode of healthcare delivery ......................................................................................................................... 292.2 Home birth ................................................................................................................................................... 302.3 Gestation at birth ......................................................................................................................................... 302.4 Birthweight .................................................................................................................................................. 342.5 Multiple pregnancies ................................................................................................................................... 342.6 Assisted conception ..................................................................................................................................... 352.7 Onset of labour ............................................................................................................................................ 362.8 Mode of birth ............................................................................................................................................... 382.9 Indigenous mothers and their babies........................................................................................................... 41
2.9.1 Department of Health performance indicators in Aboriginal and Torres Strait Islander health related to maternity and newborn care .................................................................................. 44
2.10 Influence of maternal risk factors ................................................................................................................. 452.10.1 Effect of previous pregnancy on mode of birth ................................................................................. 452.10.2 Effect of previous caesarean section on mode of birth ..................................................................... 462.10.3 Maternal age .................................................................................................................................... 472.10.4 Maternal obesity .............................................................................................................................. 502.10.5 Maternal smoking ............................................................................................................................ 522.10.6 Remoteness of residence ................................................................................................................. 532.10.7 Socio-economic disadvantage ......................................................................................................... 56
Maternal and Perinatal Mortality and Morbidity in Queensland
4
3. Congenital malformations .............................................................................................................................. 593.1 Sentinel congenital heart disease in Queensland, 2007 to 2011 ................................................................. 61
4. Comparisons between hospital groups and their outcomes ....................................................................... 62
5. Data tables ................................................................................................................................................. 71
6. Data sources used in this report ............................................................................................................... 102
APPENDICES
Appendix 1: IMPROVE program ......................................................................................................................... 103
Appendix 2: Investigating the causes of stillbirth: a NHMRC funded study........................................................ 104
Appendix 3: Statewide maternity and neonatal clinical network (SMNCN) ........................................................ 106
Appendix 4: Australasian maternity outcomes surveillance system (AMOSS) ................................................... 107
Appendix 5: Membership of the Queensland Maternal and Perinatal Quality Council, 2011–2013 .................. 108
Abbreviations ................................................................................................................................................... 110
Acknowlegments ..........................................................................................................................inside back cover

5
Queensland Maternal and Perinatal Quality Council Report 2013
List of figures
Figure 1: Perinatal mortality rates, Queensland 2000 to 2011 ......................................................................................................20
Figure 2: Perinatal death by PSANZ-PDC classification, Queensland 2009 to 2011 ......................................................................23
Figure 3: Stillbirths by PSANZ-PDC classification, Queensland 2009 to 2011 ...............................................................................23
Figure 4: Neonatal deaths by PSANZ-PDC classification, Queensland 2009 to 2011 .....................................................................23
Figure 5: Neonatal deaths by PSANZ-NDC classification, Queensland 2009 to 2011 ....................................................................24
Figure 6: Perinatal mortality rates and risk by gestation, Queensland 2009 to 2011 .....................................................................26
Figure 7: Perinatal autopsies by type of death, Queensland 2000 to 2011 ........................................................................ 29
Figure 8: Number of births by mode of healthcare delivery, Queensland 2000 to 2011 ...............................................................29
Figure 9: Percentage of women accessing public and private birth care, Queensland 2000 to 2011 ...................................... 30
Figure 10: Percentage of home births by maternal age group, Queensland 2000 to 2011 (see Table 35) ................................ 30
Figure 11: Percentage of women giving birth by gestation, Queensland 2000 to 2011 ..................................................................31
Figure 12: Percentage of women giving birth at less than 34 weeks gestation, Queensland 2000 to 2011 ............................... 31
Figure 13: Percentage of babies born by gestation, Queensland 2000 to 2011 ..............................................................................31
Figure 14: Percentage of babies born at 33 weeks gestation or less, Queensland 2000 to 2011 ...................................................32
Figure 15: Percentage of women giving birth at less than 37 weeks’ gestation by mode of healthcare delivery, Queensland 2000 to 2011 ............................................................................................................................ 32
Figure 16: Percentage of women giving birth by mode of healthcare delivery and gestation, Queensland 2000 to 2011 ...............32
Figure 17: Number of women giving birth by mode of healthcare delivery, gestation, and onset of labour, Queensland 2000 to 2011 ............................................................................................................................ 33
Figure 18: Distribution of birth weights, Queensland 2000 to 2011 ................................................................................... 34
Figure 19: Percentage of multiple pregnancies by maternal age, Queensland 2000 to 2011 ..........................................................34
Figure 20: Percentage of multiple and singleton pregnancies by gestation at birth, Queensland 2000 to 2011 .............................35
Figure 21: Influence of assisted conception techniques, Queensland 2008 to 2011 ......................................................................35
Figure 22: Percentage of multiple births in pregnancies conceived with and without the use of assisted conception techniques, Queensland 2000 to 2011 .............................................................................................................................................36
Figure 23: Onset of labour, all births, Queensland 2000 to 2011 ....................................................................................................36
Figure 24: Spontaneous onset of labour by mode of healthcare delivery, Queensland 2000 to 2011 ...................................... 37
Figure 25: Induction of labour by mode of healthcare delivery, Queensland 2000 to 2011 ..................................................... 37
Figure 26: Elective caesarean section by mode of healthcare delivery, Queensland 2000 to 2011 .......................................... 37
Figure 27: Mode of birth of babies, Queensland 2000 to 2011—percentage of births ....................................................................38
Figure 28: Mode of assisted vaginal birth of babies, Queensland 2000 to 2011 ...................................................................38Figure 29: Incidence of unassisted vaginal birth of babies by mode of healthcare delivery, Queensland 2000 to 2011 .................39
Figure 30: Incidence of caesarean section birth of babies by mode of healthcare delivery, Queensland 2000 to 2011 ............... 39
Figure 31: Incidence of caesarean section birth, before and in labour, of babies born in public and private hospitals, Queensland 2000 to 2011 ............................................................................................................................ 39
Figure 32: Incidence of assisted vaginal birth of babies by mode of healthcare delivery, Queensland 2000 to 2011 .................. 40
Figure 33: Incidence of caesarean section birth of babies when there is a breech presentation, by mode of healthcare delivery, Queensland 2000 to 2011 ................................................................................ 40
Figure 34: Incidence of caesarean section for multiple births by mode of healthcare delivery, Queensland 2000 to 2011 .......... 41
Figure 35: Incidence of maternal age groups by maternal Indigenous status, Queensland 2000 to 2011 ................................. 41
Figure 36: Percentage of women giving birth, by maternal Indigenous status and gestational age, Queensland 2000 to 2011 ..... 42
Figure 37: Incidence of women giving birth by gestational groups and maternal Indigenous status, Queensland 2000 to 2011 ... 42
Figure 38: Incidence of birth by gestation at birth and maternal Indigenous status, Queensland 2000 to 2011 ......................... 42
Figure 39: Incidence of birth at or below 36 weeks gestation by maternal Indigenous status, Queensland 2000 to 2011 ..............43
Figure 40: Mean birthweight by gestational age and maternal Indigenous status, Queensland 2000 to 2011 ...............................43
Figure 41: Percentage of babies by gestation, birthweight group and maternal Indigenous status, Queensland 2000 to 2011 .... 44
Figure 42: Incidence of mode of birth by previous pregnancy, Queensland 2000 to 2011 ...................................................... 46
Figure 43: Incidence of mode of birth by previous caesarean sections, Queensland 2001 to 2011—number of previous caesarean sections completely collected since 2001 ....................................................................................................... 46
Figure 44: Percentage of births by maternal age group, Queensland 2000 to 2011 ........................................................................47
Figure 45: Number of births to women less than 20 years of age by mode of healthcare delivery, Queensland 2000 to 2011 ...... 47
Figure 46: Number of births to women 20–34 years of age by mode of healthcare delivery, Queensland 2000 to 2011 ............. 48
Figure 47: Number of births to women 35 or more years of age by mode of healthcare delivery, Queensland 2000 to 2011 ....... 48
Figure 48: Incidence of multiple birth by maternal age, Queensland 2008 to 2011 ........................................................................49

Maternal and Perinatal Mortality and Morbidity in Queensland
6
Figure 49: Percentage of babies born by maternal age and gestation, Queensland 2000 to 2011 ........................................... 49
Figure 50: Percentage of babies requiring admission to NICU or special care units by maternal age, Queensland 2000 to 2011 .. 50
Figure 51: BMI versus mode of birth, Queensland 2008 to 2011 ....................................................................................... 50
Figure 52: BMI versus gestation at birth, Queensland 2008 to 2011 ............................................................................................. 51
Figure 53: BMI versus birthweight, Queensland 2008 to 2011 .......................................................................................... 51
Figure 54: BMI versus perinatal mortality rates (per 1,000 births), Queensland 2008 to 2011 .......................................................51
Figure 55: Smoking versus gestation, Queensland 2010 to 2011 ...................................................................................... 52
Figure 56: Smoking versus birthweight, Queensland 2010 to 2011 ................................................................................................52
Figure 57: Smoking versus perinatal mortality rates (per 1,000 births), Queensland 2010 to 2011 ...............................................53
Figure 58: Remoteness of residence versus gestation, Queensland 2010 to 2011 ..........................................................................54
Figure 59: Remoteness of residence and Indigenous status versus gestation, Queensland 2010 to 2011 .....................................54
Figure 60: Remoteness of residence versus birthweight, Queensland 2010 to 2011 .....................................................................54
Figure 61: Remoteness of residence and Indigenous status versus birthweight, Queensland 2010 to 2011 ..................................55
Figure 62: Remoteness of residence versus perinatal mortality rates (per 1,000 births), Queensland 2010 to 2011 ......................55
Figure 63: Remoteness of residence and Indigenous status versus perinatal mortality rates (per 1,000 births), Queensland 2010 to 2011 ............................................................................................................................ 56
Figure 64: SEIFA quintile versus gestation, Queensland 2010 to 2011 ...........................................................................................56
Figure 65: SEIFA quintile and Indigenous status versus gestation, Queensland 2010 to 2011 ................................................ 57
Figure 66: SEIFA quintile versus birthweight, Queensland 2010 to 2011 ........................................................................................57
Figure 67: SEIFA quintile and Indigenous status versus birthweight, Queensland 2010 to 2011 ...................................................57
Figure 68: SEIFA quintile versus perinatal mortality rates (per 1,000 births), Queensland 2010 to 2011 .......................................58
Figure 69: SEIFA quintile and Indigenous status versus perinatal mortality rates (per 1,000 births), Queensland 2010 to 2011 ...58
Figure 70: Proportion (%) of selected primigravidae having a caesarean section birth, Queensland 2010 to 2011 ........................67
Figure 71: Proportion (%) of selected primigravidae achieving unassisted vaginal birth, Queensland 2010 to 2011 ......................67
Figure 72: Proportion (%) of caesarean sections performed without labour in all women giving birth, Queensland 2010 to 2011 68
Figure 73: Proportion (%) of elective births (inductions of labour and caesarean sections without labour in all women giving birth) occurring before 38 completed weeks gestation, Queensland 2010 to 2011 ................................68
Figure 74: Proportion (%) of all women giving birth whose previous pregnancy ended in a first caesarean section who achieved a vaginal birth (i.e. successful VBAC), Queensland 2010 to 2011 ..........................................................69
Figure 75: Proportion (%) of selected primigravidae labouring spontaneously and achieving unassisted vaginal birth without episiotomy and without third/fourth degree perineal tear, Queensland 2010 to 2011 ..................................................69
Figure 76: Proportion (%) of all women giving birth labouring spontaneously and achieving unassisted vaginal birth without episiotomy and without third/fourth degree perineal tear, Queensland 2010 to 2011 ..................................................70
List of tables
Table 1: Maternal mortality ratios, Queensland and Australia 2000 to 2011 ...............................................................................14
Table 2: Classification of maternal deaths in Queensland, 2009 to 2011 ....................................................................................14
Table 3: Cause of maternal deaths in Queensland, during pregnancy or within 42 days after their pregnancy, 2009 to 2011 .....14
Table 4: Cause of maternal deaths in Queensland, between 43 and 365 days after their pregnancy, 2009 to 2011 ....................15
Table 5: Avoidable factors in maternal deaths in Queensland, during pregnancy or within 365 days after their pregnancy, 2009 to 2011 .................................................................................................................................................................15
Table 6: Incidence of autopsy being performed in maternal deaths, Queensland 2009 to 2011 ..................................................17
Table 7: Stillbirth, neonatal and perinatal death rates, Queensland 2009 to 2011 .................................................................... 20
Table 8: Perinatal mortality rates by facility type, Queensland 2009 to 2011 ..............................................................................21
Table 9: Perinatal deaths by type and PSANZ-PDC, Queensland 2009 to 2011 ............................................................................22
Table 10: Neonatal deaths PSANZ-NDC, Queensland 2009 to 2011...............................................................................................22
Table 11: Perinatal deaths by PSANZ-PDC and plurality, Queensland 2009 to 2011 .....................................................................24
Table 12: Neonatal deaths by PSANZ-NDC and plurality, Queensland 2009 to 2011 .....................................................................25
Table 13: Perinatal deaths by Indigenous status, Queensland 2009 to 2011 ................................................................................25
Table 14: Perinatal deaths by PSANZ-PDC and Indigenous status, Queensland 2009 to 2011 .......................................................25
Table 15: Neonatal deaths by PSANZ-NDC and Indigenous status, Queensland 2009 to 2011 .....................................................26
Table 16: Perinatal deaths by gestation (completed weeks), Queensland 2009 to 2011 ...............................................................26
Table 17: Perinatal deaths by birthweight, Queensland 2009 to 2011 ..........................................................................................27
Table 18: Perinatal deaths by PSANZ-PDC and gestational age, Queensland 2009 to 2011 ..........................................................27
Table 19: Neonatal deaths by PSANZ-NDC and gestational age, Queensland 2009 to 2011 ..........................................................28
Table 20: Perinatal deaths by PSANZ-PDC and birthweight, Queensland 2009 to 2011 .................................................................28
Table 21: Neonatal deaths by PSANZ-NDC and birthweight, Queensland 2009 to 2011 ................................................................28
7
Queensland Maternal and Perinatal Quality Council Report 2013
Table 22: Congenital malformations reported in the pregnancy and newborn period, Queensland 2010 to 2011 .........................59
Table 23: Neonatal profiles associated with the one or more congenital malformation, Queensland 2010 to 2011 ......................59
Table 24: Maternal profiles associated with the birth of babies with one or more congenital malformation, Queensland 2010 to 2011 .............................................................................................................................................60
Table 25: Infants with sentinel cardiac anomalies born in Queensland July 2007 to June 2011 by initial admission cardiac diagnosis ............................................................................................................................61
Table 26: Hospital groups for outcome comparisons .....................................................................................................................62
Table 27: Maternal profiles by hospital group (%), Queensland 2010 to 2011 ..............................................................................63
Table 28: Baby profiles by hospital group (%), Queensland 2010 to 2011 ....................................................................................65
Table 29: Perinatal mortality rates, Queensland 2000 to 2011 ......................................................................................................71
Table 30: Perinatal autopsy rates, Queensland 2000 to 2011 ........................................................................................................71
Table 31: Perinatal deaths by detailed PSANZ-PDC classification, Queensland 2009 to 2011 .......................................................71
Table 32: Neonatal deaths by detailed PSANZ-PDC classification, Queensland 2009 to 2011 ......................................................74
Table 33: Numbers and rates of stillbirth, neonatal death and perinatal death, by birthweight, Queensland 2000 to 2011 ..........75
Table 34: Numbers and rates of stillbirth, neonatal death and perinatal death, by gestation, Queensland 2000 to 2011 .............75
Table 35: Women giving birth by mode of healthcare delivery, Queensland 2001 to 2011 ...........................................................76
Table 36: Number and percentage of women giving birth by gestation at birth, Queensland 2000 to 2011...................................76
Table 37: Number and percentage of babies born by gestation at birth, Queensland 2000 to 2011 .............................................76
Table 38: Number and percentage of women giving birth by gestation at birth and mode of healthcare delivery, Queensland 2000 to 2011 .............................................................................................................................................77
Table 39: Number and percentage of babies born in public and private hospitals, by gestation at birth, mode of healthcare delivery and onset of labour/elective caesarean section, Queensland 2000 to 2011 ....................77
Table 40: Incidence of admission to NICU or a SCN and PNMR (per 1,000 births) by gestation of babies born, Queensland 2000 to 2011 .............................................................................................................................................78
Table 41: Birthweight of babies born, Queensland 2000 to 2011 .................................................................................................78
Table 42: Incidence of multiple pregnancies by maternal age, Queensland 2000 to 2011 .............................................................79
Table 43: Number and percentage of multiple and singleton births (number of mothers) by gestation, Queensland 2000 to 2011 .............................................................................................................................................79
Table 44: Number and percentage of singleton and multiple births (number of mothers) in pregnancies conceived with and without the use of assisted conception techniques, Queensland 2008 to 2011 ............................................79
Table 45: Number and percentage of babies born by use of assisted conception techniques and need for care in NICU or a SCN, Queensland 2008 to 2011 .............................................................................................................................................80
Table 46: Number and percentage of women giving birth by onset of labour, Queensland 2000 to 2011 .....................................80
Table 47: Number of women giving birth by onset of labour and mode of healthcare delivery, Queensland 2000 to 2011 ...........80
Table 48: Incidence of women giving birth by onset of labour and mode of healthcare delivery, Queensland 2000 to 2011 ........81
Table 49: Number of women giving birth by onset of labour, gestational group and mode of healthcare delivery, Queensland 2000 to 2011 .............................................................................................................................................81
Table 50 Number of babies born by birth mode, Queensland 2000 to 2011 ..................................................................................81
Table 51: Percentage of babies born by birth mode, Queensland 2000 to 2011 ............................................................................82
Table 52: Number of babies born by birth mode and mode of healthcare delivery, Queensland 2000 to 2011 .............................82
Table 53: Percentage of babies born by birth mode and mode of healthcare delivery, Queensland 2000 to 2011 ........................82
Table 54: Number of babies born by caesarean section with and without labour by mode of healthcare delivery, Queensland 2000 to 2011 .............................................................................................................................................83
Table 55: Percentage of babies born by caesarean section with and without labour by mode of healthcare delivery, Queensland 2000 to 2011 .............................................................................................................................................83
Table 56: Number and percentage of caesarean section births in breech presentation by mode of healthcare delivery, Queensland 2000 to 2011 .............................................................................................................................................84
Table 57: Number and incidence of caesarean sections in women having multiple births, Queensland 2008 to 2011 .................84
Table 58: Number of women giving birth by Indigenous status and maternal age group, Queensland 2000 to 2011 ....................85
Table 59: Percentage of women giving birth by Indigenous status and maternal age group, Queensland 2000 to 2011................85
Table 60: Number and percentage of women giving birth by Indigenous status and mode of healthcare delivery, Queensland 2000 to 2011 .............................................................................................................................................85
Table 61: Birthweight (number (n), mean and standard deviation (SD)) by Indigenous status and gestation, Queensland 2000 to 2011 .............................................................................................................................................86
Table 62: Percentage of babies born by Indigenous status, gestation and birthweight, Queensland 2000 to 2011 .......................86
Table 63: Percentage of women smoking at less than 20 weeks gestation during pregnancy by Indigenous status, Queensland 2010 to 2011 .............................................................................................................................................87
Table 64: Percentage of women smoking after 20 weeks gestation during pregnancy by Indigenous status, Queensland 2010 to 2011 .............................................................................................................................................87
Table 65: Percentage of women attending five or more antenatal visits during pregnancy by Indigenous status, Queensland 2008 to 2011 .............................................................................................................................................87
Maternal and Perinatal Mortality and Morbidity in Queensland
8
Table 66: Percentage of babies born with birthweight less than 2500 grams by Indigenous status, Queensland 2008 to 2011 ...87
Table 67: Number of women giving birth by mode of birth and previous pregnancy, Queensland 2000 to 2011 ...........................88
Table 68: Incidence of mode of birth by previous pregnancy, Queensland 2000 to 2011 ..............................................................88
Table 69: Number of women giving birth by mode of birth and previous caesarean section, Queensland 2001 to 2011 ..............88
Table 70: Percentage of mode of birth by previous caesarean section, Queensland 2001 to 2011 ................................................89
Table 71: Births by maternal age, Queensland 2000 to 2011 ........................................................................................................90
Table 72: Number of women giving birth by maternal age group and mode of healthcare delivery, Queensland 2000 to 2011 ....90
Table 73: Number of women giving birth by maternal age group and plurality, Queensland 2000 to 2011 ....................................91
Table 74: Number and percentage of babies born by maternal age group and gestation at birth, Queensland 2000 to 2011 .......91
Table 75: Number of babies born by maternal age group and need for admission to NICU or SCN, Queensland 2000 to 2011 .....91
Table 76: Number and percentage of births by maternal age and gestation at birth, Queensland 2000 to 2011 ...........................92
Table 77: Correlation of (BMI of women giving birth with mode of healthcare delivery, Queensland 2008 to 2011 .......................93
Table 78: Correlation of BMI of women giving birth with maternal age, Queensland 2008 to 2011 ...............................................93
Table 79: Correlation of BMI of women giving birth with mode of birth, Queensland 2008 to 2011 ..............................................93
Table 80: Correlation of BMI of women giving birth with gestation at birth, Queensland 2008 to 2011 ........................................94
Table 81: Correlation of BMI of women giving birth with birthweight of their babies, Queensland 2008 to 2011 ...........................94
Table 82: Correlation of body mass index (BMI) of women giving birth with perinatal outcome, Queensland 2008 to 2011 .........95
Table 83: Correlation (%) of cigarette smoking status of women giving birth with maternal age, Queensland 2008 to 2011 ........95
Table 84: Correlation (%) of cigarette smoking status of women giving birth with gestation at birth, Queensland 2008 to 2011 ..95
Table 85: Correlation (%) of cigarette smoking status of women giving birth with birthweight, Queensland 2008 to 2011 ...........95
Table 86: Correlation of cigarette smoking status of women giving birth with perinatal outcome, Queensland 2008 to 2011 ......96
Table 87: Correlation of remoteness class of women giving birth with gestation at birth and Indigenous status, Queensland 2010 to 2011 .............................................................................................................................................96
Table 88:Correlation of remoteness class of women giving birth with birthweight of their babies and Indigenous status, Queensland 2010 to 2011 .............................................................................................................................................97
Table 89: Correlation of remoteness class of women giving birth with perinatal outcome and Indigenous status, Queensland 2010 to 2011 ............................................................................................................................................97
Table 90: Correlation of socio-economic status of women giving birth with gestation at birth and Indigenous status, Queensland 2010 to 2011 .............................................................................................................................................98
Table 91: Correlation of socio-economic status of women giving birth with birthweight and Indigenous status, Queensland 2010 to 2011 .............................................................................................................................................98
Table 92: Correlation of socio-economic status of women giving birth with perinatal outcome and Indigenous status, Queensland 2010 to 2011 .............................................................................................................................................99
Table 93: ICD–10 detail of anomaly groups used in this report .....................................................................................................99
Table 94: Perinatal care indicators by hospital group, Queensland 2010 to 2011........................................................................102
Table 95: Clinical Practice Guidelines published by QMNCGP as at June 2013 ...........................................................................106
Table 96: AMOSS projects commenced in the period 2009 to 2012 ............................................................................................107
9
Queensland Maternal and Perinatal Quality Council Report 2013
Summary
The report focuses primarily on the 122,150 women who gave birth to 124,211 babies in Queensland between 2010 and 2011, with a comparative review of the previous decade depending upon data availability. To complete the ‘catch-up phase’ of the Queensland Maternal and Perinatal Quality Council’s work after a period of inactivity prior to 2009, it examines maternal deaths and perinatal deaths between 2009 and 2011.
During this time:• there were 18 deaths of women during pregnancy or within 42 days after their pregnancy—four of
which were direct maternal deaths. A further 48 women died between 43 days and 365 days after their pregnancy. Using the International Classification of Diseases, Version 10 (ICD–10) definition of maternal death, the maternal mortality ratio (MMR) in Queensland for these years was 8.1 per 100,000 births. Suicide was the leading cause of death in women, both within 42 days after their pregnancy and between 43 days and 365 days after their pregnancy.
• there were 1954 perinatal deaths, giving a perinatal mortality rate of 10.5 per 1000 births (stillbirth rate 6.8 per 1000 births and neonatal mortality rate (NMR) 3.8 per 1000 live births). Comparison with most recently published Australian data cannot be made directly, as neonatal mortality data was missing from one state in the Australian report1, and the definitions of perinatal death differ slightly. With those caveats in mind, the perinatal mortality rate (PNMR) for Queensland was close to the Australian rate—the stillbirth rate in Queensland was equivalent to the Australian rate, but the NMR for Queensland was higher than the Australian rate.
The deaths were classified using the Perinatal Society of Australia and New Zealand (PSANZ) perinatal (PSANZ-PDC) and neonatal (PSANZ-NDC) classifications. The most common cause of perinatal death in normally formed term infants was unexplained stillbirth (46.3%) followed by hypoxic peripartum death (16.1%) which includes deaths occurring either intrapartum or in the neonatal period without major pre-existing conditions. This group of deaths may benefit from closer review at both local and state level.
The risk factors for adverse pregnancy outcomes identified in this report, including smoking, overweight and obesity, and living in disadvantage are consistent with those reported in The Lancet Stillbirth Series2 3. This series made a specific call to action for high income countries to develop programs to address inequality of health outcomes for women of childbearing age4.
Indigenous women continue to have higher rates of adverse pregnancy outcomes compared to non-Indigenous women. The overall PNMR is 80% higher for Indigenous women—the neonatal death component is 2.4 times the rate of non-Indigenous women. The main contributor to this disparity relates to preterm birth. However, the relatively higher incidence of neonatal deaths assigned to unknown or undetermined for Indigenous women indicates the need for improvement in data quality.
Smoking throughout pregnancy increases the likelihood of preterm and low birthweight birth, and is associated with a perinatal mortality risk of 14.5 per 1000 births for smokers versus a risk of 9.2 per 1000 births for non-smokers. Smoking throughout pregnancy is significantly more common in young women and Indigenous women.
Almost 50% of the women who gave birth between 2010 and 2011 were overweight or obese, and women in this group were more likely to have a:• caesarean section birth• baby weighing more than 4000 grams• baby who died in the perinatal period. The safety of interventions for weight loss when a woman is pregnant and obese, for the mother and her baby, is not clear5. Prenatal counselling must be seen as vital to this group of women, both for their future pregnancies and for their ongoing life and health expectancy.
1 Li Z, Zeki R, Hilder L & Sullivan EA. (2012). Australia’s mothers and babies 2010. Perinatal statistics series no. 27. Cat. no. PER 57. Canberra: AIHW National Perinatal Epidemiology and Statistics Unit.
2 Flenady V, Middleton P, et al. (2011). Stillbirths: the way forward in high-income countries. Lancet 377(9778): 1703-1717.3 Flenady V, Koopmans L, et al. (2011). Major risk factors for stillbirth in high-income countries: a systematic review and
meta-analysis. Lancet 377(9774): 1331-1340. 4 Goldenberg RL, McClure EM, Bhutta ZA, Belizan JM, Reddy UM, Rubens CE, Mabeya H, Flenady V, Darmstadt GL, for The Lancet’s
Stillbirth Series steering committee. Stillbirths: the vision for 2020. Lancet 2011; published online April 14. DOI:10.1016/S0140-6736(10)62235-0).
5 Furber CM, McGowan L, Bower P, Kontopantelis E, Quenby S, Lavender T. (2013). Antenatal interventions for reducing weight in obese women for improving pregnancy outcome. Cochrane Database of Systematic Reviews 2013, Issue 1.
Maternal and Perinatal Mortality and Morbidity in Queensland
10
Attendance at more than five antenatal visits is less common in Indigenous women. Socio-economic disadvantage—as measured by Socio-economic Indexes for Areas (SEIFA) quintiles—is associated with an increased risk of perinatal death, preterm birth and low birthweight birth. These outcomes are more marked for Indigenous women and their babies. The influence of remoteness of residence of the mother—as measured by Accessibility/remoteness index of Australia (ARIA) score—was less clear.
Between 2000 and 2011, the rate of birth at gestations 37 to 39 weeks has increased significantly (from less than 43% to more than 53%). There has been a concomitant decrease in births at gestations of 40 weeks or more. Overall, there has been little change seen in the rate of birth at less than 37 weeks, though there has been a clear increase in the rate of birth at less than 37 weeks gestation in the private healthcare sector. There is a clear difference in the gestational patterns between public and private healthcare sectors with a marked preponderance for elective caesarean section and, to a lesser degree induction of labour, in the 37 to 39 week gestation period in the private healthcare sector. A significantly higher PNMR is shown for all gestations below 40 weeks in association with elective birth.
Between 2000 and 2011, 56% to 62% of multiple pregnancies ended before 37 weeks gestation. Approximately 4% of births in Queensland are from pregnancies conceived with the aid of assisted conception techniques—28% of multiple pregnancies have been conceived with the aid of assisted conception techniques. Improved extracorporeal techniques for assisted conception have resulted in a steady fall in the rate of multiple pregnancy in association with these techniques, but the same type of improvement has not been seen in relation to the use of ovulation induction and/or artificial insemination.
Since 2005, the frequency of elective caesarean section (20% to 21%) and induction of labour (22% to 23%) have remained steady with pregnancies ending in spontaneous labour in less than 60% of instances. Women being cared for in the public healthcare sector laboured spontaneously in 63% to 65% of pregnancies, while women being cared for in the private healthcare sector laboured spontaneously in 39% to 40% of pregnancies. This disparity between these modes of healthcare delivery is mirrored in the lower rates of induction of labour and elective caesarean section in the public healthcare sector.
Between 2000 and 2011 the rate of unassisted vaginal birth decreased from 65% to 56%, with a concomitant rise in the rate of caesarean section birth from 26% to 34%. A marked disparity is seen between care in the public and private healthcare sectors, with the likelihood of a woman giving birth in the public healthcare sector having an unassisted vaginal birth being approximately 50% higher than a woman in the private healthcare sector. By 2011, almost 50% of women giving birth in the private healthcare sector had a caesarean section birth, while less than one-third of women giving birth in the public healthcare sector had a caesarean section birth.
A small group of care indicators, chosen for relevance by the Council, are examined in this report, with comparison hospitals being grouped in clinically relevant ‘hospital/facility’ groupings. Women presenting to public hospitals which did not have an established maternity service often presented in preterm labour and the outcomes were often poor. Indicators examining ‘selected primigravidae’ showed that these women were most likely to have a caesarean section birth in a private facility or in a high-care level public facility. Spontaneous onset of labour and unassisted vaginal birth without major perineal damage (third/fourth degree tear or episiotomy) were less likely in these facilities and more likely in smaller provincial/rural facilities.
Future work and direction of the Council includes:• implementation of an active Indigenous Perinatal Health Sub-Committee• potential reporting of facility-specific public hospital indicator outcomes—the Council would be
interested in dialogue regarding potential future maternity and newborn care clinical indicators and the manner in which they are reported
• review of ‘contributing factors’ by the Maternal and Perinatal Mortality Sub-Committees • piloting of the revised National Maternal Mortality Advisory Committee’s Maternal Death Reporting
form by the Maternal Mortality Sub-Committee, subsequent to proposed changes to the Public Health Act 2005 which will mandate reporting of maternal deaths6
• examination of the potential for development of a Queensland Congenital Anomaly Register by the Congenital Anomaly Sub-Committee.
6 Recommendation five, QMPQC report 2011: Legislative change to the Public Health Act 2005, with reference to a requirement for all deaths of women during pregnancy or within one year of the end of a pregnancy being reported via the PDCT, is necessary to improve the quality of information available for review of the causation of deaths and the possible presence of avoidable factors.

11
Queensland Maternal and Perinatal Quality Council Report 2013
Recommendations
The Council recommends (not in any order of priority):
1. all frontline clinicians (e.g. medical officers, nurses and bereavement support personnel) involved in Queensland hospital maternity and newborn services attend the IMPROVE program to enhance optimal clinical practice around the time of a perinatal death according to the PSANZ Perinatal Mortality Guidelines (see Section 1.3.4)
2. that the SMNCN seeks assistance from the Royal Australian and New Zealand College of Obstetricians and Gynaecologists (RANZCOG) and other relevant professional bodies to examine the possible development of a small number of obstetric services which retain, preserve and teach the obstetric skill of vaginal breech birth (see Section 2.8)
3. that the HSU considers progressing a recommendation through the appropriate mechanisms of government to Council of Australian Governments (COAG), to develop an indicator relating to gestation at birth (e.g. less than 37 weeks gestation) in addition to the indicator relating to Indigenous baby birthweight. The Indigenous baby birthweight indicator may be more valuable if calculated for gestation equal to 37 or more weeks, tracking near-term intrauterine growth restriction (see Section 2.9.1).
4. that the Department of Health ensures no further rural maternity services close, and actively seeks to open/re-open rural maternity services where possible (see Section 4).
5. that future Council reports examine clinical indicators, such as those in this report, by individual hospital/facility (see Section 4).
Good practice points
The Council commends the following clinical practice improvement ‘good practice points’ to clinicians:
• Women with a history of serious mental illness (e.g. schizophrenia, bipolar affective disorder, schizoaffective disorder) should routinely be offered mental health follow-up for at least the first 12 months post-partum (see Section 1.2.7).
• Practitioners referring women for termination of pregnancy or undertaking termination of pregnancy should ensure adequate follow-up for such women, especially if the procedure is undertaken for mental health concerns (see Section 1.2.7).
• Mental health screening is performed almost universally in the public healthcare sector, but less so in the private healthcare sector. Use of the Edinburgh postnatal depression score (EPDS) in the private healthcare sector may help to identify women who warrant further follow-up (see Section 1.2.7).
• A rise in blood pressure during antenatal care needs careful evaluation and review. This is particularly important in women with gestational diabetes, who are at an increased risk of developing pre-eclampsia (see Section 1.2.8).
• Hypertension in labour needs to be actively managed, even if the aetiology of the hypertension is not clearly apparent (see Section 1.2.8).
• Vaginal bleeding in pregnancy warrants a careful history and examination, including visualising the cervix, rather than replacing these procedures with an ultrasound scan alone (see Section 1.2.9).
• Post-partum thromboprophylaxis in high risk women should be continued for six weeks. The finding of ovarian vein thrombosis is an indication for full anticoagulation in the post-partum period (see Section 1.2.9).
• Multiple presentations post-partum need to be thoroughly assessed and reviewed at a senior level even if the pregnancy and birth were uncomplicated (see Section 1.2.9).

Maternal and Perinatal Mortality and Morbidity in Queensland
12
Good practice points continued
• Autopsy should be undertaken whenever possible after a maternal death, even if a coronial autopsy is not ordered, because inheritable conditions may be discovered (see Section 1.2.11).
• All perinatal deaths should be investigated comprehensively according to the PSANZ Perinatal Mortality Guidelines despite the presence of a presumed cause of death (see Section 1.3.8).
• Following a perinatal death, all parents should be offered the option of an autopsy examination. The Council strongly encourages requesting placental histopathology in every case of stillbirth, neonatal death and high risk newborn according to the PSANZ Perinatal Mortality Guidelines. Placentas should be sent to pathology fresh and un-fixed (see Section 1.3.3).
• Determining the accuracy of completion of the death certificates, and submitting amendments when required, should be a routine part of local perinatal mortality committee review of all perinatal deaths. Parents should be informed of this outcome prior to receiving a revised death certificate (see Section 1.3.3).
• Elective repeat caesarean section and induction of labour before 39 weeks of gestation are common, yet are associated with respiratory and other adverse neonatal outcomes. Elective intervention in pregnancy before 39 weeks of gestation should be avoided wherever possible (see Section 2.3).
• Maternity care providers should provide clear information to women carrying multiple pregnancies regarding the risk of preterm labour, and steps that should be taken in the event that a woman carrying a multiple pregnancy suspects the onset of preterm labour (see Section 2.5).
• Given the unchanging risks of multiple pregnancy occurring in association with ovulation induction and the consequent risk of adverse outcomes due to the multiple pregnancies, the same attention to technique monitoring and quality improvement as has been seen with extracorporeal techniques is recommended to those prescribing ovulation induction (see Section 2.6).
• Smoking cessation programs as part of routine antenatal care reduce fetal exposure to cigarette smoke, low birthweight and preterm birth, and should form part of routine antenatal care. Specialised programs to assist Indigenous women to stop smoking before and during pregnancy should be prioritised (see Section 2.10.5).
• Where maternal risk factors, such as advanced maternal age, obesity and smoking are identified, clinicians should provide clear information to the woman regarding those risks and their implications. Whilst specific recommendations may be required regarding an appropriate level of facility care, such recommendations must be consistent with continuing provision of non-fragmented models of care with a defined primary care giver (see Section 2.10).
• Maternity services are encouraged to be continuously aware of their own performance by monitoring against relevant indicators and to readily make this information available to staff and to consumers of their care (see Section 4).

13
Queensland Maternal and Perinatal Quality Council Report 2013
1. Maternal and perinatal mortality
1.1 Definitions
The Council uses the following definitions.
Fetal deaths (known as stillbirth)
Defined by the Registration of Births, Deaths and Marriages Act 2003 as:
a child who has shown no sign of respiration or heartbeat, or other sign of life, after completely leaving the child’s mother; and who has been gestated for 20 weeks or more, or weighs 400 grams or more.
Livebirths
Defined by the Public Health Act 2005 as: a baby whose heart has beaten after delivery of the baby is completed.
Birthweight and gestation are not included in this definition. Therefore, in this report, deaths of liveborn babies where both the birthweight is less than 400 grams and/or the gestation is less than 20 weeks, and deaths of liveborn babies when the birthweight and gestational age are unknown, are included as neonatal deaths.
Neonatal deaths
Neonatal deaths are those occurring in live births within the first 28 days of life.
Mothers
The number of mothers is defined as: the number of women having a pregnancy which resulted in a livebirth or fetal death.
Maternal death
A maternal death is defined by the World Health Organization (WHO) as: the death of a woman while pregnant or within 42 days of termination of pregnancy, irrespective of the duration and the site of the pregnancy, from any cause related to or aggravated by the pregnancy or its management.
This definition excludes deaths from accidental or incidental causes.
Maternal mortality ratio
The maternal mortality ratio (MMR) is defined as:
The definitions used by the Council in this report include, in addition to the WHO definition, incidental deaths and deaths occurring more than 42 days after termination of the pregnancy7.
Late maternal death
Death of a woman within one year of giving birth or otherwise ending a pregnancy.
These deaths are not included in the calculation of the MMR.
Classification of maternal deaths
Direct deaths are those which result from obstetric complications of the pregnant state (pregnancy, labour and puerperium), including deaths from interventions, omissions, inappropriate treatment, or from a chain of events resulting from any of the above. They are complications of the pregnancy itself.
Indirect deaths are those which result from pre-existing disease or disease that developed during pregnancy and was not due to direct obstetric causes, but which may have been aggravated by physiological effects of pregnancy.
Incidental deaths are those due to conditions occurring during pregnancy, where the pregnancy is unlikely to have contributed significantly to the death, although it is sometimes possible to postulate a distant association.
7 Maternal Mortality Working Party, NHMRC. Report on Maternal Deaths in Australia 1991-93. Canberra: NHMRC.
Number of maternal deaths
Number of mothersx 100,000
Maternal and Perinatal Mortality and Morbidity in Queensland
14
1.2 Maternal deaths
1.2.1 Maternal mortality ratio (MMR)
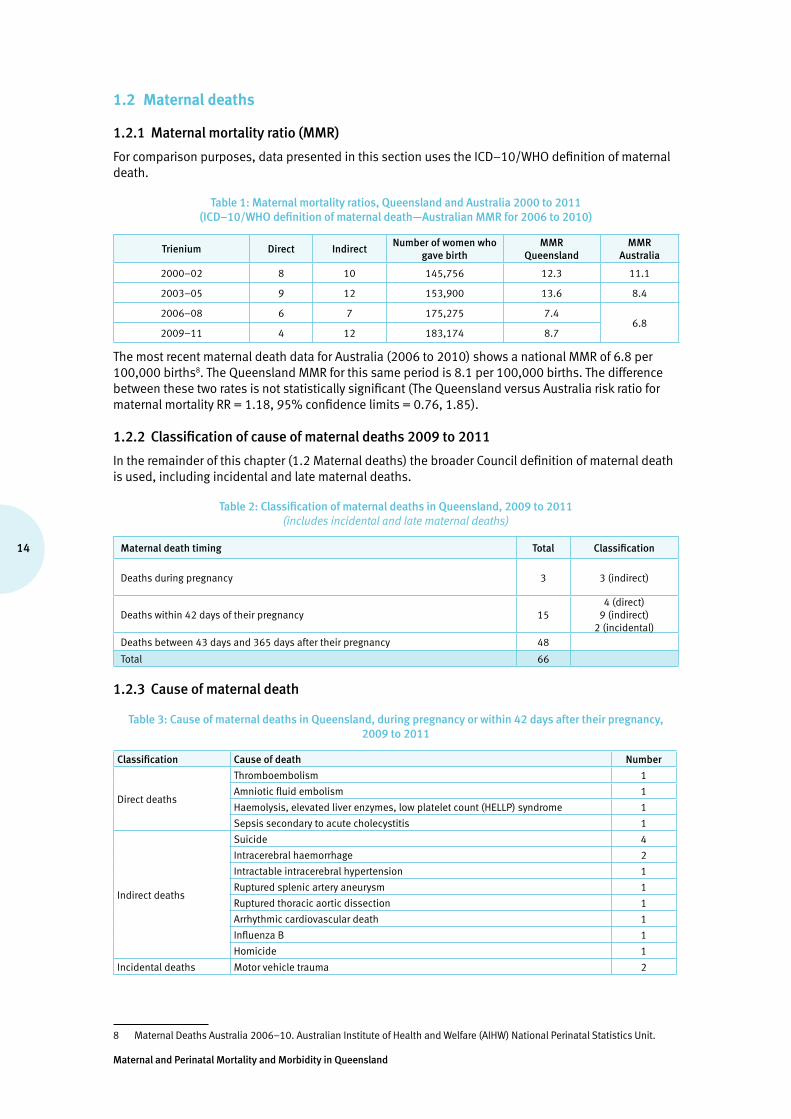
For comparison purposes, data presented in this section uses the ICD–10/WHO definition of maternal death.
Table 1: Maternal mortality ratios, Queensland and Australia 2000 to 2011 (ICD–10/WHO definition of maternal death—Australian MMR for 2006 to 2010)
Trienium Direct Indirect Number of women who
gave birthMMR
QueenslandMMR
Australia
2000–02 8 10 145,756 12.3 11.1
2003–05 9 12 153,900 13.6 8.4
2006–08 6 7 175,275 7.46.8
2009–11 4 12 183,174 8.7
The most recent maternal death data for Australia (2006 to 2010) shows a national MMR of 6.8 per 100,000 births8. The Queensland MMR for this same period is 8.1 per 100,000 births. The difference between these two rates is not statistically significant (The Queensland versus Australia risk ratio for maternal mortality RR = 1.18, 95% confidence limits = 0.76, 1.85).
1.2.2 Classification of cause of maternal deaths 2009 to 2011
In the remainder of this chapter (1.2 Maternal deaths) the broader Council definition of maternal death is used, including incidental and late maternal deaths.
Table 2: Classification of maternal deaths in Queensland, 2009 to 2011 (includes incidental and late maternal deaths)
Maternal death timing Total Classification
Deaths during pregnancy 3 3 (indirect)
Deaths within 42 days of their pregnancy 154 (direct)
9 (indirect)2 (incidental)
Deaths between 43 days and 365 days after their pregnancy 48
Total 66
1.2.3 Cause of maternal death
Table 3: Cause of maternal deaths in Queensland, during pregnancy or within 42 days after their pregnancy, 2009 to 2011
Classification Cause of death Number
Direct deaths
Thromboembolism 1
Amniotic fluid embolism 1
Haemolysis, elevated liver enzymes, low platelet count (HELLP) syndrome 1
Sepsis secondary to acute cholecystitis 1
Indirect deaths
Suicide 4
Intracerebral haemorrhage 2
Intractable intracerebral hypertension 1
Ruptured splenic artery aneurysm 1
Ruptured thoracic aortic dissection 1
Arrhythmic cardiovascular death 1
Influenza B 1
Homicide 1
Incidental deaths Motor vehicle trauma 2
8 Maternal Deaths Australia 2006–10. Australian Institute of Health and Welfare (AIHW) National Perinatal Statistics Unit.
15
Queensland Maternal and Perinatal Quality Council Report 2013
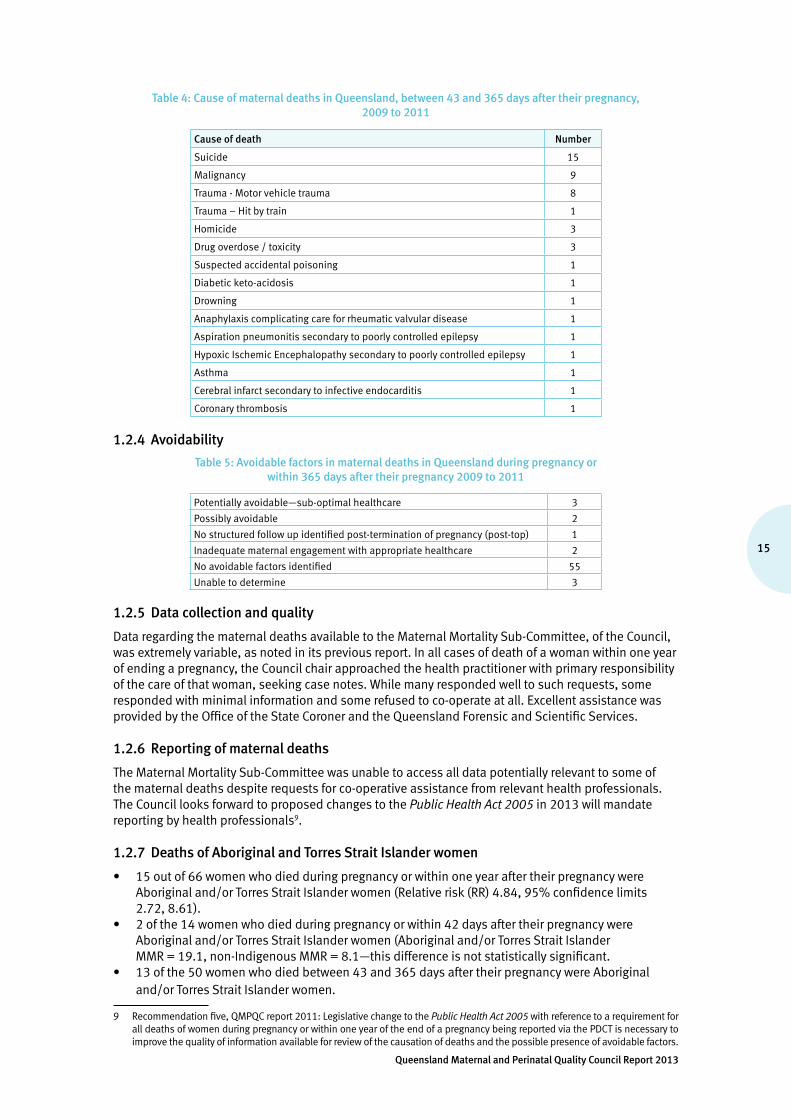
Table 4: Cause of maternal deaths in Queensland, between 43 and 365 days after their pregnancy, 2009 to 2011
Cause of death Number
Suicide 15
Malignancy 9
Trauma - Motor vehicle trauma 8
Trauma – Hit by train 1
Homicide 3
Drug overdose / toxicity 3
Suspected accidental poisoning 1
Diabetic keto-acidosis 1
Drowning 1
Anaphylaxis complicating care for rheumatic valvular disease 1
Aspiration pneumonitis secondary to poorly controlled epilepsy 1
Hypoxic Ischemic Encephalopathy secondary to poorly controlled epilepsy 1
Asthma 1
Cerebral infarct secondary to infective endocarditis 1
Coronary thrombosis 1
1.2.4 Avoidability
Table 5: Avoidable factors in maternal deaths in Queensland during pregnancy or within 365 days after their pregnancy 2009 to 2011
Potentially avoidable—sub-optimal healthcare 3
Possibly avoidable 2
No structured follow up identified post-termination of pregnancy (post-top) 1
Inadequate maternal engagement with appropriate healthcare 2
No avoidable factors identified 55
Unable to determine 3
1.2.5 Data collection and quality
Data regarding the maternal deaths available to the Maternal Mortality Sub-Committee, of the Council, was extremely variable, as noted in its previous report. In all cases of death of a woman within one year of ending a pregnancy, the Council chair approached the health practitioner with primary responsibility of the care of that woman, seeking case notes. While many responded well to such requests, some responded with minimal information and some refused to co-operate at all. Excellent assistance was provided by the Office of the State Coroner and the Queensland Forensic and Scientific Services.
1.2.6 Reporting of maternal deaths
The Maternal Mortality Sub-Committee was unable to access all data potentially relevant to some of the maternal deaths despite requests for co-operative assistance from relevant health professionals. The Council looks forward to proposed changes to the Public Health Act 2005 in 2013 will mandate reporting by health professionals9.
1.2.7 Deaths of Aboriginal and Torres Strait Islander women
• 15 out of 66 women who died during pregnancy or within one year after their pregnancy were Aboriginal and/or Torres Strait Islander women (Relative risk (RR) 4.84, 95% confidence limits 2.72, 8.61).
• 2 of the 14 women who died during pregnancy or within 42 days after their pregnancy were Aboriginal and/or Torres Strait Islander women (Aboriginal and/or Torres Strait Islander MMR = 19.1, non-Indigenous MMR = 8.1—this difference is not statistically significant.
• 13 of the 50 women who died between 43 and 365 days after their pregnancy were Aboriginal and/or Torres Strait Islander women.
9 Recommendation five, QMPQC report 2011: Legislative change to the Public Health Act 2005 with reference to a requirement for all deaths of women during pregnancy or within one year of the end of a pregnancy being reported via the PDCT is necessary to improve the quality of information available for review of the causation of deaths and the possible presence of avoidable factors.
Maternal and Perinatal Mortality and Morbidity in Queensland
16
1.2.8 Suicide
Suicide is the leading cause of death in women within 42 days after their pregnancy and between 43 days and 365 days after their pregnancy. There appears to be a significant worldwide risk of maternal suicide following termination of pregnancy and, in fact, a higher risk than that following term delivery.
The potential for depression and other mental health issues at this time needs to be better appreciated. Active follow-up of these women needs to happen. Practitioners referring women for termination of pregnancy or undertaking termination of pregnancy should ensure adequate follow up for such women, especially if the procedure is undertaken for mental health concerns.
Good practice points
• Women with a history of serious mental illness (e.g. schizophrenia, bipolar affective disorder, schizoaffective disorder) should routinely be offered mental health follow-up for at least the first 12 months post-partum.
• Practitioners referring women for termination of pregnancy or undertaking termination of pregnancy should ensure adequate follow-up, especially if the procedure is undertaken for mental health concerns.
• Mental health screening is performed almost universally in the public healthcare sector, but less so in the private healthcare sector. Use of the EPDS in the private sector may help to identify women who warrant further follow-up.
Beyond Blue’s Clinical Practice Guidelines10, recommend that:• the EPDS should be used by health professionals as a component of the assessment of all women
for symptoms of depression in the antenatal period
• the EPDS should be used by health professionals as a component of the assessment of all women in the postnatal period for symptoms of depression or co-occurring depression and anxiety
• a score of 13 or more can be used for detecting symptoms of major depression in the postnatal period.
1.2.9 Maternal cardiac disease
There has been a substantial fall in the number of maternal deaths due to cardiovascular disease when compared to recent previous reports. It remains to be seen whether this is a consistent trend, but given the recommendations of the last report11, and the recognised importance of maternal heart disease as a cause of death, the findings of this report are very welcome.
1.2.10 Hypertension in pregnancy
Recognition of the significance of and management of hypertension complicating pregnancy was a feature of several deaths.
Good practice points
• A rise in blood pressure during antenatal care needs careful evaluation and review. This is particularly important in women with gestational diabetes, who are an increased risk of developing pre-eclampsia.
• Hypertension in labour needs to be actively managed, even if the aetiology of the hypertension is not clearly apparent.
10 Austin M-P, Highet N and the Guidelines Expert Advisory Committee. (2011). Clinical practice guidelines for depression and related disorders—anxiety, bipolar disorder and puerperal psychosis—in the perinatal period. A guideline for primary care health professionals. Melbourne: beyondblue: the national depression initiative.
11 Recommendation two, QMPQC report 2011: When pregnant women present with common symptoms, such as chest pain, palpitations, syncope and shortness of breath, there should be a low threshold for considering significant cardiovascular disease and referral for specialist opinion and investigation within a clinically appropriate time frame.

17
Queensland Maternal and Perinatal Quality Council Report 2013
1.2.11 Other clinical issues raised by case review
A report of this type does not allow for detailed discussion of individual case management. However, the Maternal Mortality Sub-Committee noted several areas of concern.
Good practice points
• Vaginal bleeding in pregnancy warrants a careful history and examination, including visualising the cervix, rather than replacing these procedures with an ultrasound scan alone.
• Post-partum thromboprophylaxis in high risk women should be continued for six weeks. The finding of ovarian vein thrombosis is an indication for full anticoagulation in the post-partum period.
• Multiple presentations post-partum need to be thoroughly assessed and reviewed at a senior level even if the pregnancy and birth were uncomplicated.
1.2.12 Malignant melanoma
The Maternal Mortality Sub-Committee noted a total of eight women died within one year after their pregnancy between 2004 and 2011 (three between 2009 and 2011 covered by this report). Further study of the rate and risk of malignant melanoma deaths in relation to pregnancy is being considered.
1.2.13 Autopsies following maternal death
Table 6: Incidence of autopsy being performed in maternal deaths, Queensland 2009 to 2011
Deaths Autopsies
Total deaths between 2009 and 2011 66 51 (77.3%)
Deaths meeting ICD–10 definition of maternal death 16 13 (81.3%)
Deaths not due to advanced malignancy 57 51 (89.5%)
The Maternal Mortality Sub-Committee noted some instances where autopsy was not performed, but where diagnosis confirmation would have been wise and where information about potential inheritable conditions may have been found.
Good practice point
• Autopsy should be undertaken whenever possible, even if a coronial autopsy is not ordered, because inheritable conditions may be discovered.
1.3 Perinatal deaths
1.3.1 Perinatal mortality review modus operandi
All perinatal deaths in Queensland are subject to a systematic review. Perinatal mortality data has been obtained from the PDCT and the Registry of Births Deaths and Marriages, and case summaries from hospital and regional perinatal mortality committees in Queensland. A number of local perinatal mortality committees collaborated with the Council in the perinatal mortality review process, submitting confidential case summaries and classifications.
1.3.2 Clinical classification
The Council has adopted the PSANZ classification system, including the PSANZ-PDC and PSANZ-NDC12, and all perinatal deaths in Queensland are classified accordingly. The system has been shown to perform well against other contemporary systems13. The purpose of classifying deaths according to the PSANZ system is to identify preventable factors associated with perinatal death, through the systematic application of clinically relevant categories to large populations.
12 Chan A, King J, Flenady V, Haslam R, Tudehope D. (2004). Classification of perinatal deaths: development of the Australian and New Zealand Classifications. J Paediatr. Child Health. Jul; 40(7):340–7.
13 Flenady V, Frøen JF, Pinar H, Torabi R, Saastad E, Guyon G, Russell L, Charles A, Harrison C, Chauke L, Pattinson R, Koshy R, Bahrin S, Gardener G, Day K, Petersson K, Gordon A, Gilshenan K. (2009). An evaluation of classification systems for stillbirth. BMC Pregnancy Childbirth.9:24.

Maternal and Perinatal Mortality and Morbidity in Queensland
18
1.3.3 Data collection and data quality
The data used to assist in classification of perinatal deaths by the Council’s Perinatal Mortality Sub-Committee was sourced from:• MR63D perinatal data collection forms, which are completed by all maternity hospitals in Queensland
and forwarded to the PDCT. The MR63D form (a potentially rich data source containing over 50 data fields) is used to supply information to the National Perinatal Epidemiology and Statistics Unit (NPESU) and can also be used for benchmarking and other research projects.
• the Medical Certificate of Cause of Perinatal Death (Forms 9 and 9A).• The National Perinatal Death Clinical Audit Tool (NPDCAT) summaries received and discharge
summaries (where available) from hospitals• pathology reports, including autopsy and placental pathology, cytogenetics.
During the course of review of perinatal deaths, the sub-committee’s ability to classify cause of death accurately was often limited due to inadequate investigation and conflicting or lacking information in the materials provided. Low autopsy rates continue to pose a major limitation.
Placental pathology, which is an essential component of investigation protocol for stillbirths and neonatal deaths, was often not performed in cases of death where this examination may have provided the only lead to reasons for the death. Despite a presumed cause of death, placental pathology should be undertaken for all stillbirths and also for births of infants at increased risk of neonatal death. Placental histopathology remains a cornerstone investigation of perinatal death and other poor pregnancy outcomes.
The overall autopsy rate has remained relatively constant at 30%. This rate is disappointingly low. Autopsy remains the gold standard investigation and appropriate counselling should be provided to all parents following a stillbirth or neonatal death about the option of a high quality autopsy14. Parents should be made aware that important information about the cause of death may be missed if an autopsy is not performed. Unfortunately, insufficient number of pathologists with expertise in perinatal autopsy in Queensland is an impediment to quality and reporting. Delays in receiving autopsy reports of six months or more are not uncommon in Queensland.
Good practice point
• Following a perinatal death, all parents should be offered the option of an autopsy examination. The Queensland Maternal and Perinatal Quality Council strongly encourages requesting placental histopathology in every case of stillbirth, neonatal death and high risk newborn according to the PSANZ Perinatal Mortality Guidelines15. Placentas should be sent to pathology fresh and un-fixed.
The need for high quality perinatal autopsies, performed by pathologists with specialised paediatric and perinatal training, and experience is emphasised. This is of particular importance at a time of potential changes in the structure and delivery of health services. The necessity for training, retaining, and supporting pathologists with expertise in perinatal autopsy procedures is highlighted. Recognition of the need for continued investment of time and resources is required for maintenance of accessible, sustainable, tertiary level post-mortem services. Perinatal post-mortem services are largely restricted to the public healthcare sector. Access to perinatal post-mortem services and out-of-pocket costs are significant barriers to bereaved parents in the private healthcare sector seeking perinatal post-mortem services.
Death certificate data are notoriously inaccurate worldwide16 and, in Australia, it is largely attributed to the policy of completing the death certificate at the time of a perinatal death prior to full investigation and review of the death. The Perinatal Mortality Sub-Committee found the information on death certificates was often inaccurate. Common errors included administrative aspects due to lack of knowledge of the requirements and assigned cause of death. The Perinatal Mortality Sub-Committee is undertaking a detailed review of death certificates to identify areas for clinician education to improve accuracy of this information. Following review and classification of perinatal deaths, clinicians are encouraged to submit a revised death certificate where information is found to be inaccurate for re-issuing to the parents. Parents should be contacted prior to receiving a revised death certificate to inform them of this outcome.
14 Flenady V, King J, Charles A, et al. (2009). Clinical practice guideline for perinatal mortality. Version 2.2 April. www.psanz.org.au Accessed August 2011
15 PSANZ Clinical Practice Guideline for Perinatal Mortality, Chapter 4 – Perinatal post-mortem examination. www.stillbirthalliance.org.au/guideline1.htm
16 Kirby RS. (1993). “The coding of underlying cause of death from fetal death certificates: issues and policy considerations.” Am J Public Health. 83: 1088-91
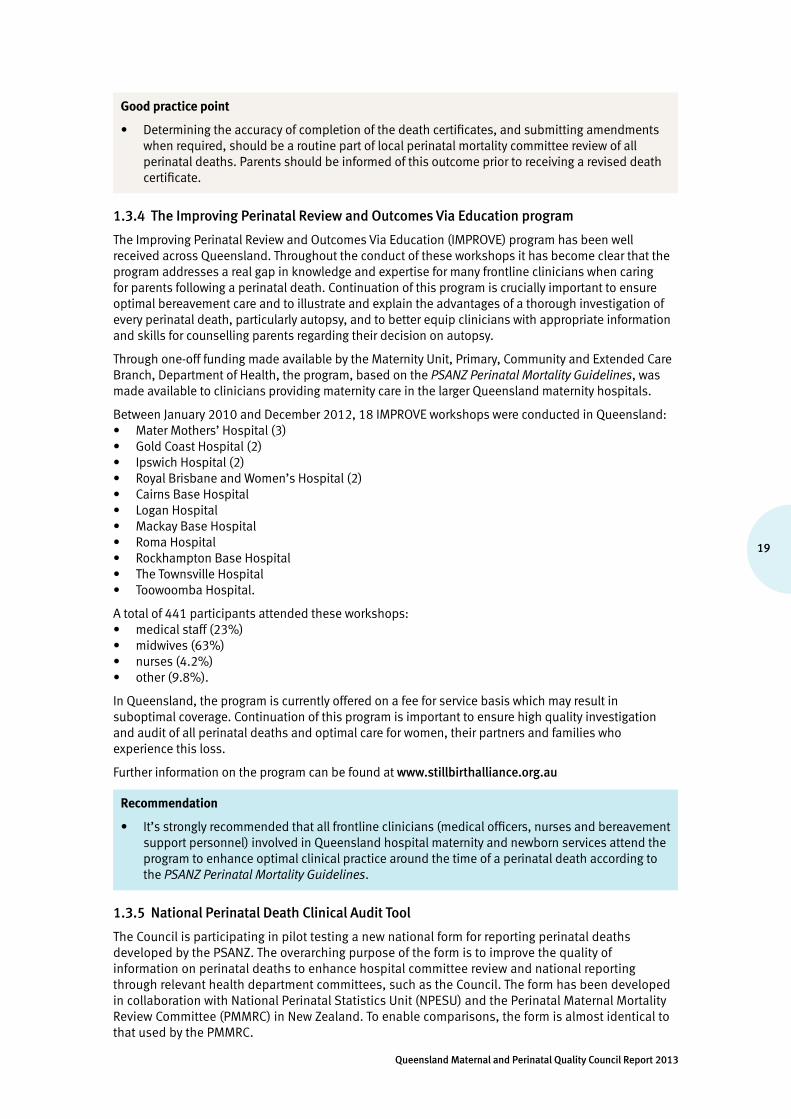
19
Queensland Maternal and Perinatal Quality Council Report 2013
Good practice point
• Determining the accuracy of completion of the death certificates, and submitting amendments when required, should be a routine part of local perinatal mortality committee review of all perinatal deaths. Parents should be informed of this outcome prior to receiving a revised death certificate.
1.3.4 The Improving Perinatal Review and Outcomes Via Education program
The Improving Perinatal Review and Outcomes Via Education (IMPROVE) program has been well received across Queensland. Throughout the conduct of these workshops it has become clear that the program addresses a real gap in knowledge and expertise for many frontline clinicians when caring for parents following a perinatal death. Continuation of this program is crucially important to ensure optimal bereavement care and to illustrate and explain the advantages of a thorough investigation of every perinatal death, particularly autopsy, and to better equip clinicians with appropriate information and skills for counselling parents regarding their decision on autopsy.
Through one-off funding made available by the Maternity Unit, Primary, Community and Extended Care Branch, Department of Health, the program, based on the PSANZ Perinatal Mortality Guidelines, was made available to clinicians providing maternity care in the larger Queensland maternity hospitals.
Between January 2010 and December 2012, 18 IMPROVE workshops were conducted in Queensland: • Mater Mothers’ Hospital (3)• Gold Coast Hospital (2)• Ipswich Hospital (2)• Royal Brisbane and Women’s Hospital (2)• Cairns Base Hospital • Logan Hospital• Mackay Base Hospital• Roma Hospital• Rockhampton Base Hospital• The Townsville Hospital• Toowoomba Hospital.
A total of 441 participants attended these workshops:• medical staff (23%)• midwives (63%)• nurses (4.2%)• other (9.8%).
In Queensland, the program is currently offered on a fee for service basis which may result in suboptimal coverage. Continuation of this program is important to ensure high quality investigation and audit of all perinatal deaths and optimal care for women, their partners and families who experience this loss.
Further information on the program can be found at www.stillbirthalliance.org.au
Recommendation
• It’s strongly recommended that all frontline clinicians (medical officers, nurses and bereavement support personnel) involved in Queensland hospital maternity and newborn services attend the program to enhance optimal clinical practice around the time of a perinatal death according to the PSANZ Perinatal Mortality Guidelines.
1.3.5 National Perinatal Death Clinical Audit Tool
The Council is participating in pilot testing a new national form for reporting perinatal deaths developed by the PSANZ. The overarching purpose of the form is to improve the quality of information on perinatal deaths to enhance hospital committee review and national reporting through relevant health department committees, such as the Council. The form has been developed in collaboration with National Perinatal Statistics Unit (NPESU) and the Perinatal Maternal Mortality Review Committee (PMMRC) in New Zealand. To enable comparisons, the form is almost identical to that used by the PMMRC.
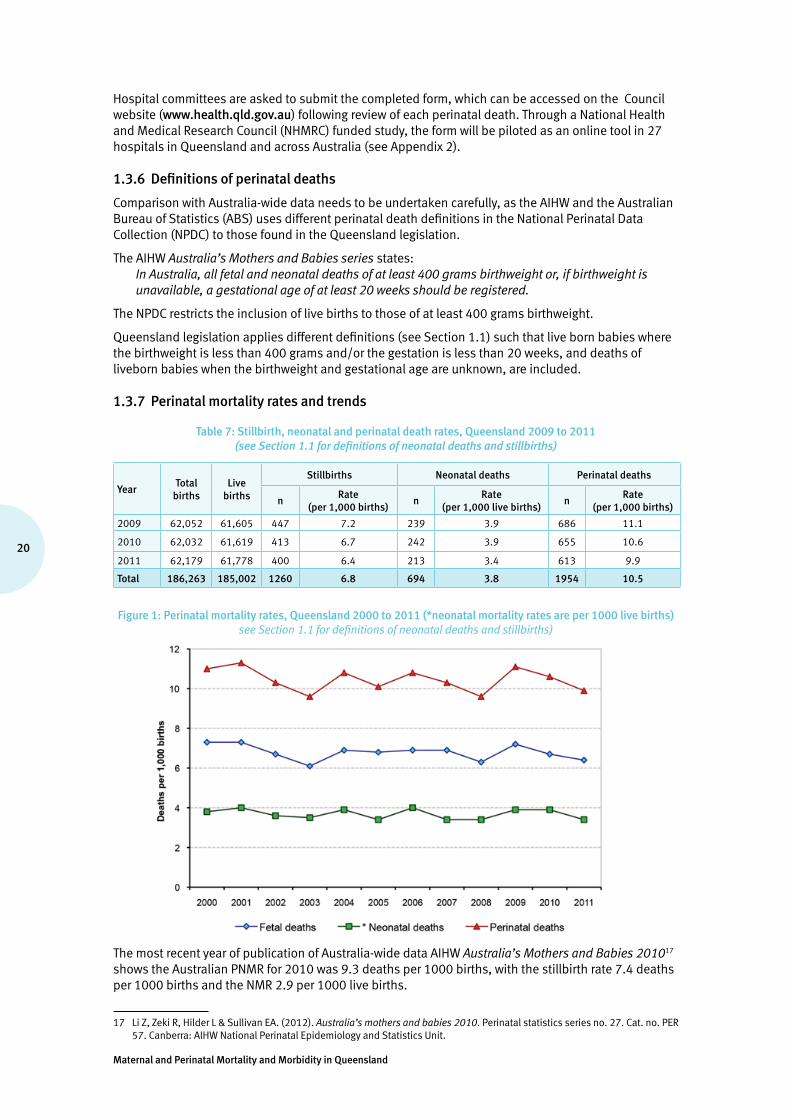
Maternal and Perinatal Mortality and Morbidity in Queensland
20
Hospital committees are asked to submit the completed form, which can be accessed on the Council website (www.health.qld.gov.au) following review of each perinatal death. Through a National Health and Medical Research Council (NHMRC) funded study, the form will be piloted as an online tool in 27 hospitals in Queensland and across Australia (see Appendix 2).
1.3.6 Definitions of perinatal deaths
Comparison with Australia-wide data needs to be undertaken carefully, as the AIHW and the Australian Bureau of Statistics (ABS) uses different perinatal death definitions in the National Perinatal Data Collection (NPDC) to those found in the Queensland legislation.
The AIHW Australia’s Mothers and Babies series states: In Australia, all fetal and neonatal deaths of at least 400 grams birthweight or, if birthweight is unavailable, a gestational age of at least 20 weeks should be registered.
The NPDC restricts the inclusion of live births to those of at least 400 grams birthweight.
Queensland legislation applies different definitions (see Section 1.1) such that live born babies where the birthweight is less than 400 grams and/or the gestation is less than 20 weeks, and deaths of liveborn babies when the birthweight and gestational age are unknown, are included.
1.3.7 Perinatal mortality rates and trends
Table 7: Stillbirth, neonatal and perinatal death rates, Queensland 2009 to 2011 (see Section 1.1 for definitions of neonatal deaths and stillbirths)
YearTotal
birthsLive
births
Stillbirths Neonatal deaths Perinatal deaths
nRate
(per 1,000 births)n
Rate(per 1,000 live births)
nRate
(per 1,000 births)
2009 62,052 61,605 447 7.2 239 3.9 686 11.1
2010 62,032 61,619 413 6.7 242 3.9 655 10.6
2011 62,179 61,778 400 6.4 213 3.4 613 9.9
Total 186,263 185,002 1260 6.8 694 3.8 1954 10.5
Figure 1: Perinatal mortality rates, Queensland 2000 to 2011 (*neonatal mortality rates are per 1000 live births) see Section 1.1 for definitions of neonatal deaths and stillbirths)
The most recent year of publication of Australia-wide data AIHW Australia’s Mothers and Babies 201017 shows the Australian PNMR for 2010 was 9.3 deaths per 1000 births, with the stillbirth rate 7.4 deaths per 1000 births and the NMR 2.9 per 1000 live births.
17 Li Z, Zeki R, Hilder L & Sullivan EA. (2012). Australia’s mothers and babies 2010. Perinatal statistics series no. 27. Cat. no. PER 57. Canberra: AIHW National Perinatal Epidemiology and Statistics Unit.

21
Queensland Maternal and Perinatal Quality Council Report 2013
Applying the standard definition used by ABS and AIHW of all fetal and neonatal deaths of at least 400 grams birthweight or, if birthweight is unavailable, a gestational age of at least 20 weeks, and using the statistical comparator for Queensland of the remainder of Australia minus one state for which neonatal mortality data was missing:
• the PNMR for Queensland was 10.4 deaths per 1000 births versus 9.4 deaths per 1000 births (RR = 1.11, 95% confidence limits 1.01, 1.22)
• the stillbirth rate for Queensland was 6.7 deaths per 1000 births versus 6.9 deaths per 1000 births (RR = 0.96, 95% confidence limits 0.86, 1.07)
• the NMR for Queensland was 3.8 deaths per 1000 births versus 2.5 deaths per 1000 births (RR = 1.54, 95% confidence limits 1.31, 1.81).
The PNMR for public hospital and private hospital modes of healthcare delivery are seen in Table 8. The differential in rates has multiple explanations, including differences in acuity of care needed, gestation and birth weight limits, and maternal profiles (see Tables 26 to 28).
Table 8: Perinatal mortality rates by facility type, Queensland 2009 to 2011
Perinatal deaths Stillbirths Neonatal deaths
n PNMR n SBR n NMR
Public hospital care 1,591 12.2 1,025 7.9 566 4.4
Private hospital care 361 6.5 233 4.2 128 2.3
Care mode not stated 2 7.2 2 7.2 0 -
Total 1,954 10.5 1,260 6.8 694 3.8
PNMR = perinatal mortality rate per 1000 births | SBR = stillbirth rate per 1000 births | NMR = neonatal mortality rate per 1000 live births
1.3.8 PSANZ-PDC and PSANZ-NDC classification of perinatal deaths
Between 2000 and 2011, the main causes or important contributing conditions of perinatal deaths, according to the PSANZ-PDC and PSANZ-NDC classification, are shown in Tables 9 and 10, and Figures 2 to 4. Detailed sub-classifications are found in Tables 31 and 32.
The overall PNMR between 2009 and 2011 was 10.5 per 1000 births—1954 of the 186,262 babies born in this period (see Table 8). Almost two-thirds (1260) of these perinatal deaths were stillbirths (64.5%), and the remaining 694 babies (35.5%) died in the newborn period.
Tables 9 and 10 show the classification of perinatal deaths by PSANZ-PDC and PSANZ-NDC classifications (see Section 1.3.2). Tables 30 and 31 show the classifications in greater detail.
The principal PSANZ-PDC categories for perinatal deaths were congenital abnormality (26.7%), spontaneous preterm (24.6%) and unexplained antepartum death (19.7%) (see Figure 2 and Tables 9 and 10).
The most frequent categories of the PSANZ-PDC for stillbirths, accounting for almost 70% of these deaths, were unexplained antepartum death (30.6%), congenital abnormality (25.0%), and spontaneous preterm (13.9%). No obstetric antecedent was identified in 2.6% of stillbirths (see Figure 3).
Neonatal deaths were classified by both PSANZ-PDC and PSANZ -NDC. The main categories of the PSANZ-PDC were spontaneous preterm (43.9%) and congenital abnormality (29.7%) with no obstetric antecedent found in 7.1% (see Figure 4). The major categories according to the PSANZ-NDC were extreme prematurity (36.2%) and congenital abnormality (29.1%) (see Figure 5).
The major subcategories of the congenital abnormality category according to the PSANZ-PDC were, for stillbirths and neonatal deaths respectively: • chromosomal 8% and 4%• central nervous system 7% and 3.9%• cardiovascular 3.2% and 7.2%.
In the majority (62.5%) of perinatal deaths assigned to the category of spontaneous preterm, chorioamnionitis was either clinically suspected or confirmed on histopathology of the placenta. In 17.5%of these perinatal deaths, either no placental histopathology was undertaken or it was unknown whether this was performed.

Maternal and Perinatal Mortality and Morbidity in Queensland
22
Of unexplained stillbirths (unexplained antepartum death), 42 (10.%) of the 385 were associated with significant placental insufficiency (see Table 30, Category 10.1) and according to other approaches to classification internationally (Froen18, Korteweg19) would be classified as a placental pathology cause of death rather than unexplained. Further, in 56 (14.5%) of these apparently unexplained deaths, placental histopathology was either not performed or unknown whether it was performed.
As placental pathology is a crucially important investigation for stillbirths, it could be argued that causes in these cases should be classified as ‘unclassifiable’ rather than ‘unexplained’.
Removing the ‘unclassifiable’ and the placental insufficiency groups reduces the unexplained stillbirth proportion to 22.7% (rather than 30.6%). Including an autopsy examination as part of the criteria for assignment of the unexplained antepartum stillbirth category may reduce this further.
Revisions to the PSANZ–PDC definition of the unexplained antepartum death category to clearly identify the ‘true’ proportion of ‘unexplained’ is currently being considered by the PSANZ Perinatal Mortality Group.
Further, the proportion of the ‘unexplained’ stillbirth group where a placental pathology report was not available at the time of classification indicates room for improvement in standards of investigation and audit of stillbirths.
Table 9: Perinatal deaths by type and PSANZ-PDC, Queensland 2009 to 2011
Type of perinatal death
Stillbirth Neonatal death Perinatal death
PSANZ-PDC classification n % Rate1 n % Rate2 n % Rate1
1. Congenital abnormality 315 25.0 1.7 206 29.7 1.1 521 26.7 2.8
2. Perinatal infection 36 2.9 0.2 10 1.4 0.1 46 2.4 0.2
3. Hypertension 35 2.8 0.2 12 1.7 0.1 47 2.4 0.3
4. Antepartum haemorrhage 76 6.0 0.4 36 5.2 0.2 112 5.7 0.6
5. Maternal conditions 21 1.7 0.1 4 0.6 0.0 25 1.3 0.1
6. Specific perinatal conditions 105 8.3 0.6 25 3.6 0.1 130 6.7 0.7
7. Hypoxic peripartum deaths 19 1.5 0.1 34 4.9 0.2 53 2.7 0.3
8. Fetal growth restriction 60 4.8 0.3 13 1.9 0.1 73 3.7 0.4
9. Spontaneous preterm 175 13.9 0.9 305 43.9 1.6 480 24.6 2.6
10. Unexplained antepartum death 385 30.6 2.1 0.0 385 19.7 2.1
11. No obstetric antecedent 33 2.6 0.2 49 7.1 0.3 82 4.2 0.4
Total 1,260 100 6.8 694 100 3.8 1954 100 10.5
% = percentage | 1 = per 1000 births | 2 = per 1000 live births
Table 10: Neonatal deaths PSANZ-NDC, Queensland 2009 to 2011
Neonatal deaths
PSANZ–NDC classification n % Rate1
1. Congenital abnormality 202 29.1 1.1
2. Extreme prematurity 251 36.2 1.4
3. Cardio-respiratory disorders 68 9.8 0.4
4. Infection 24 3.5 0.1
5. Neurological 76 11.0 0.4
6. Gastrointestinal 25 3.6 0.1
7. Other 48 6.9 0.3
Total 694 100 3.8
% = percentage | 1 = per 1000 live births
18 Froen, J. F., Pinar H., Flenady V.J. et al. (2009). Causes of death and associated conditions (Codac): a utilitarian approach to the classification of perinatal deaths. BMC Pregnancy Childbirth 9: 22.
19 Korteweg, F. J., Gordijn S. J., et al. (2006). The Tulip classification of perinatal mortality: introduction and multidisciplinary inter-rater agreement. BJOG 113(4): 393-401.

23
Queensland Maternal and Perinatal Quality Council Report 2013
Figure 2: Perinatal death by PSANZ-PDC classification, Queensland 2009 to 2011
Figure 3: Stillbirths by PSANZ-PDC classification, Queensland 2009 to 2011
Figure 4: Neonatal deaths by PSANZ-PDC classification, Queensland 2009 to 2011

Maternal and Perinatal Mortality and Morbidity in Queensland
24
Figure 5: Neonatal deaths by PSANZ-NDC classification, Queensland 2009 to 2011
1.3.9 Multiple pregnancy
Multiple pregnancy was associated with a PNMR of 43.6 per 1000 births, compared with 9.4 per 1000 births for singleton pregnancies (see Tables 11 and 12). The 2009 to 2011 multiple pregnancy versus singleton pregnancy risk ratio for perinatal death: RR = 4.65, 95% confidence limits = 4.10, 5.28.
The principal conditions contributing to the excessive rate of perinatal death in multiple pregnancy are specific perinatal conditions (twin-twin transfusion), spontaneous preterm, congenital abnormality and unexplained antepartum death (PSANZ-PDC)—the principal known causes of the excessive rate of neonatal death in multiple pregnancy are extreme prematurity, congenital abnormality, cardio-respiratory and neurological (PSANZ-NDC).
Table 11: Perinatal deaths by PSANZ-PDC and plurality, Queensland 2009 to 2011
Plurality
Singleton Multiple Relative risk (95% confidence limits) multiple versus singleton PSANZ-PDC n % Rate n % Rate
1. Congenital abnormality 494 29.3 2.7 27 10.1 4.4 1.61 (1.09, 2.37)†
2. Perinatal infection 41 2.4 0.2 5 1.9 0.8 Not calculated–small cell size
3. Hypertension 46 2.7 0.3 np np np Not calculated–small cell size
4. Antepartum haemorrhage 104 6.2 0.6 8 3.0 1.3 2.26 (1.10, 4.64)†
5. Maternal conditions 24 1.4 0.1 np np np Not calculated–small cell size
6. Specific perinatal conditions 77 4.6 0.4 53 19.9 8.6 20.23 (14.27, 28.68)†
7. Hypoxic peripartum deaths 51 3.0 0.3 np np np Not calculated–small cell size
8. Fetal growth restriction 68 4.0 0.4 5 1.9 0.8 2.16 (0.87, 5.36)
9. Spontaneous preterm 359 21.3 2.0 121 45.3 19.7 9.91 (8.08, 12.16)†
10. Unexplained antepartum death 358 21.2 2.0 27 10.1 4.4 2.22 (1.50, 3.28)†
11. No obstetric antecedent 65 3.9 0.4 17 6.4 2.8 7.69 (4.51, 13.10)†
Total 1,687 100 9.4 267 100 43.6 4.65 (4.10, 5.28)†
Rate = per 1000 births | † = statistically significant | Total babies born 2009 to 2011 = 186,263, Total singletons born 2009 to 2011 = 180,135 | Total multiples born between 2009 to 2011 = 6,128,
Small cell size numbers are not published = np

25
Queensland Maternal and Perinatal Quality Council Report 2013
Table 12: Neonatal deaths by PSANZ-NDC and plurality, Queensland 2009 to 2011
Plurality
Singleton Multiple Relative risk (95% confidence limits)
multiple versus singleton PSANZ-NDC n % Rate n % Rate
1. Congenital abnormality 181 32.9 1.0 21 14.6 3.5 3.46 (2.20, 5.43)†
2. Extreme prematurity 175 31.8 1.0 76 52.8 12.7 12.95 (9.90, 16.82)†
3. Cardio-respiratory disorders 56 10.2 0.3 12 8.3 2.0 6.39 (3.43, 11.91)†
4. Infection 18 3.3 0.1 6 4.2 1.0 9.94 (3.95, 25.02)†
5. Neurological 64 11.6 0.4 12 8.3 2.0 5.59 (3.02, 10.35)†
6. Gastrointestinal 20 3.6 0.1 5 3.5 0.8 7.45 (2.80, 19.85)†
7. Other 36 6.5 0.2 12 8.3 2.0 9.94 (5.17, 19.09)†
Total 550 100 3.1 144 100 24.0 7.80 (6.51, 9.36)†
Rate = per 1000 births | † = statistically significant | Total live babies born 2009 to 2011 = 185,002 Total live singletons born 2009 to 2011 = 178,997 | Total live multiples born 2009 to 2011 = 6005
1.3.10 Indigenous perinatal mortality
Indigenous babies were almost twice as likely to die in the perinatal period (18.3 per 1000 births) as their non-Indigenous counter parts (10.0 per 1000 births). The 2009 to 2011 Indigenous versus non-Indigenous risk ratio for perinatal death was statistically significant: RR = 1.79, 95% confidence limits = 1.55, 2.08 (see Table 13). The rate of both stillbirth and neonatal deaths was significantly higher for Indigenous babies compared with non-Indigenous babies (9.9 per 1000 births versus 6.6 per 1000 births, and 8.3 per 1000 live births versus 3.5 per 1000 live births respectively).
Table 13: Perinatal deaths by Indigenous status, Queensland 2009 to 2011
Totalbirths
Livebirths
Stillbirths Neonatal deaths Perinatal deaths
n Rate1 n Rate2 n Rate1
Indigenous 10,617 10,512 105 9.9 87 8.3 192 18.1
Non-Indigenous 175,601 174,445 1,156 6.6 607 3.5 1,763 10.0
Indigenous status not stated 45 45 0 - 0 - 0 -
Relative risk for Indigenous (95% confidence limits)3
1.50 2.38 1.79
(1.23, 1.83) (1.90, 2.98) (1.55, 2.08)
1 = per 1000 births | 2 = per 1000 live births | 3 excludes 45 live births where the Indigenous status was not stated
PSANZ-PDC classification of perinatal deaths indicates that spontaneous preterm birth, unexplained antepartum deaths and deaths associated with congenital abnormalities are all more likely to occur as causes of perinatal death in Indigenous babies (see Table 14). PSANZ-NDC classification of neonatal deaths indicates that Indigenous babies are more likely to die in the newborn period from extreme prematurity, congenital abnormality, cardio-respiratory disorders and ‘other’ (principally unknown/undetermined) when compared with non-Indigenous babies.
Table 14: Perinatal deaths by PSANZ-PDC and Indigenous status, Queensland 2009 to 2011
Indigenous status Relative risk (95%confidence limits) Indigenous versus
non-Indigenous Indigenous Non-Indigenous
PSANZ-PDC n % Rate n % Rate
1. Congenital abnormality 40 20.8 3.8 481 27.3 2.7 1.39 (1.01, 1.92)†
2. Perinatal infection 6 3.1 0.6 40 2.3 0.2 2.51 (1.07, 5.93)†
3. Hypertension np np np 43 2.4 0.2 Not calculated–small cell size
4. Antepartum haemorrhage 11 5.7 1.0 101 5.7 0.6 1.83 (0.98, 3.40)
5. Maternal conditions np np np 21 1.2 0.1 Not calculated–small cell size
6. Specific perinatal conditions np np np 127 7.2 0.7 Not calculated–small cell size
7. Hypoxic peripartum deaths 5 2.6 0.5 48 2.7 0.3 1.75 (0.70, 4.38)
8. Fetal growth restriction 7 3.6 0.7 66 3.7 0.4 1.78 (0.82. 3.87)
9. Spontaneous preterm 70 36.5 6.7 410 23.3 2.3 2.86 (2.22, 3.68)†
10. Unexplained antepartum death 34 17.7 3.2 351 19.9 2.0 1.62 (1.14, 2.31)†
11. No obstetric antecedent 8 4.2 0.8 74 4.2 0.4 1.81 (0.87, 3.76)
Total 192 100 18.3 1,762 100 10.0 1.83 (1.58, 2.12)†
Rate = per 1000 births | † = statistically significant | Total babies born 2009 to 2011 = 186,263 Total Indigenous babies born 2009 to 2011 = 10,617 | Total non-Indigenous babies born 2009 to 2011 = 175, 6014
Indigenous status not stated = 45 | Small cell size numbers are not published = np
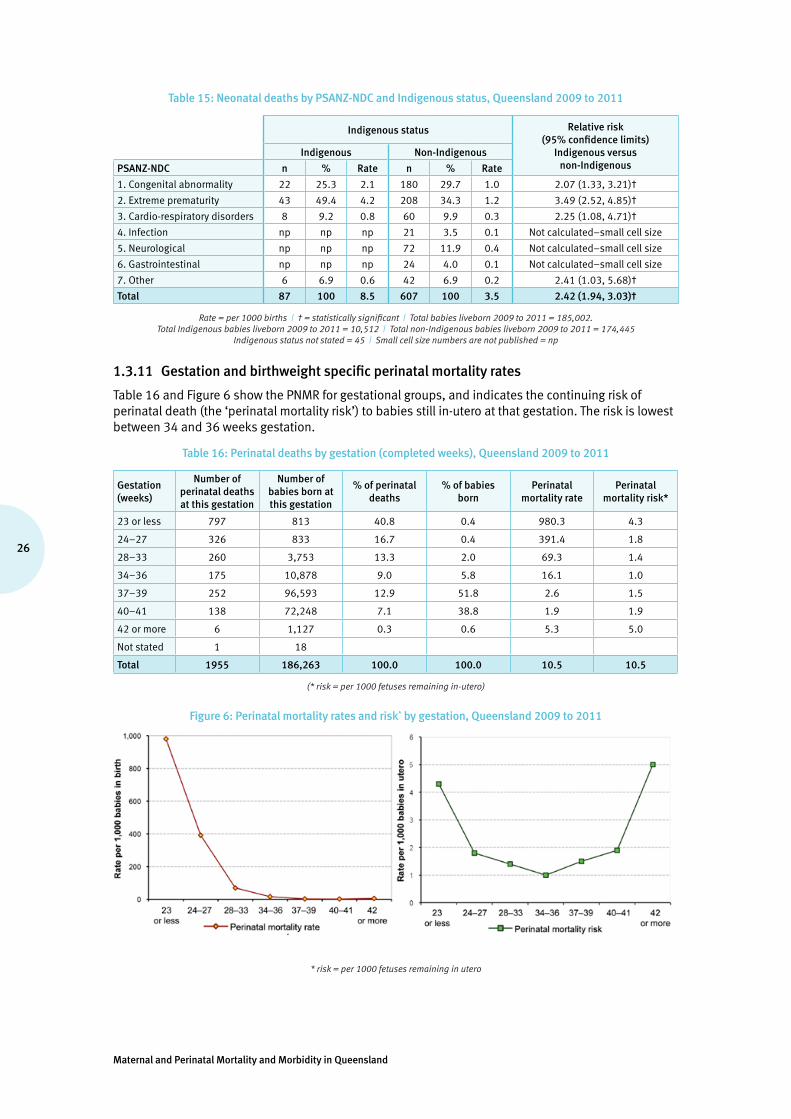
Maternal and Perinatal Mortality and Morbidity in Queensland
26
Table 15: Neonatal deaths by PSANZ-NDC and Indigenous status, Queensland 2009 to 2011
Indigenous status Relative risk (95% confidence limits)
Indigenous versus non-Indigenous
Indigenous Non-Indigenous
PSANZ-NDC n % Rate n % Rate
1. Congenital abnormality 22 25.3 2.1 180 29.7 1.0 2.07 (1.33, 3.21)†
2. Extreme prematurity 43 49.4 4.2 208 34.3 1.2 3.49 (2.52, 4.85)†
3. Cardio-respiratory disorders 8 9.2 0.8 60 9.9 0.3 2.25 (1.08, 4.71)†
4. Infection np np np 21 3.5 0.1 Not calculated–small cell size
5. Neurological np np np 72 11.9 0.4 Not calculated–small cell size
6. Gastrointestinal np np np 24 4.0 0.1 Not calculated–small cell size
7. Other 6 6.9 0.6 42 6.9 0.2 2.41 (1.03, 5.68)†
Total 87 100 8.5 607 100 3.5 2.42 (1.94, 3.03)†
Rate = per 1000 births | † = statistically significant | Total babies liveborn 2009 to 2011 = 185,002. Total Indigenous babies liveborn 2009 to 2011 = 10,512 | Total non-Indigenous babies liveborn 2009 to 2011 = 174,445
Indigenous status not stated = 45 | Small cell size numbers are not published = np
1.3.11 Gestation and birthweight specific perinatal mortality rates
Table 16 and Figure 6 show the PNMR for gestational groups, and indicates the continuing risk of perinatal death (the ‘perinatal mortality risk’) to babies still in-utero at that gestation. The risk is lowest between 34 and 36 weeks gestation.
Table 16: Perinatal deaths by gestation (completed weeks), Queensland 2009 to 2011
Gestation (weeks)
Number of perinatal deaths at this gestation
Number of babies born at this gestation
% of perinatal deaths
% of babies born
Perinatal mortality rate
Perinatal mortality risk*
23 or less 797 813 40.8 0.4 980.3 4.3
24–27 326 833 16.7 0.4 391.4 1.8
28–33 260 3,753 13.3 2.0 69.3 1.4
34–36 175 10,878 9.0 5.8 16.1 1.0
37–39 252 96,593 12.9 51.8 2.6 1.5
40–41 138 72,248 7.1 38.8 1.9 1.9
42 or more 6 1,127 0.3 0.6 5.3 5.0
Not stated 1 18
Total 1955 186,263 100.0 100.0 10.5 10.5
(* risk = per 1000 fetuses remaining in-utero)
Figure 6: Perinatal mortality rates and risk* by gestation, Queensland 2009 to 2011
* risk = per 1000 fetuses remaining in utero
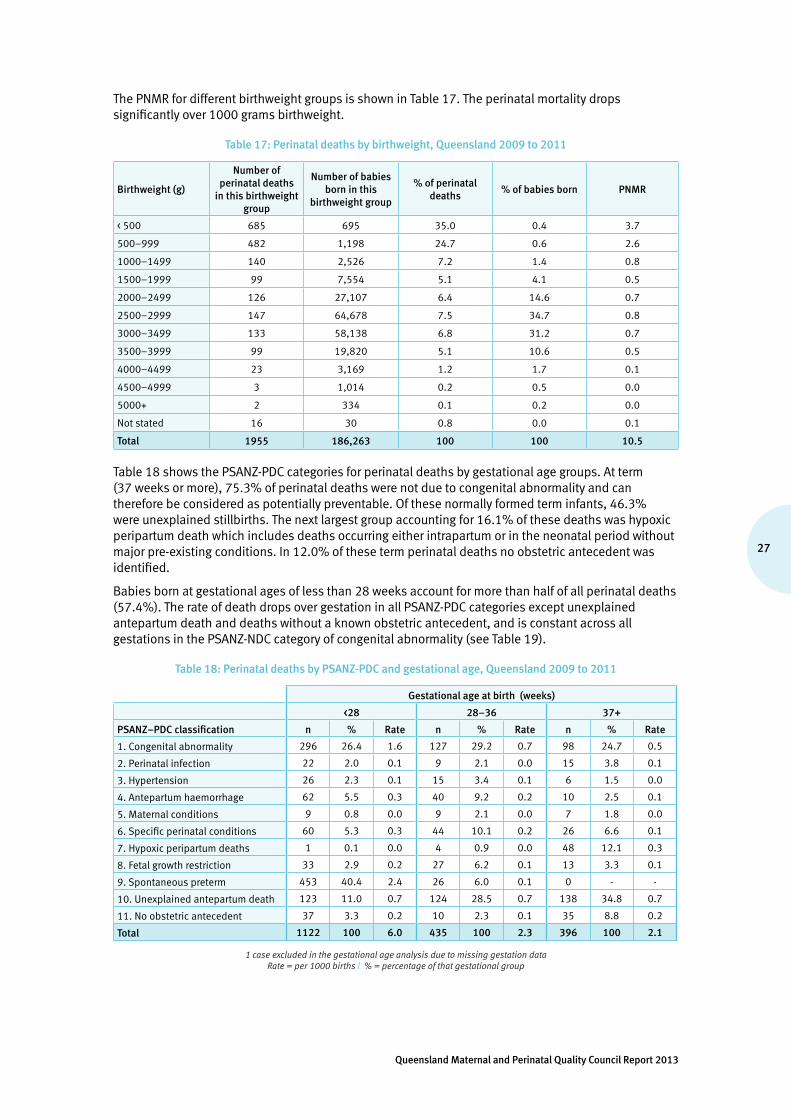
27
Queensland Maternal and Perinatal Quality Council Report 2013
The PNMR for different birthweight groups is shown in Table 17. The perinatal mortality drops significantly over 1000 grams birthweight.
Table 17: Perinatal deaths by birthweight, Queensland 2009 to 2011
Birthweight (g)
Number of perinatal deaths
in this birthweight group
Number of babies born in this
birthweight group
% of perinatal deaths
% of babies born PNMR
< 500 685 695 35.0 0.4 3.7
500–999 482 1,198 24.7 0.6 2.6
1000–1499 140 2,526 7.2 1.4 0.8
1500–1999 99 7,554 5.1 4.1 0.5
2000–2499 126 27,107 6.4 14.6 0.7
2500–2999 147 64,678 7.5 34.7 0.8
3000–3499 133 58,138 6.8 31.2 0.7
3500–3999 99 19,820 5.1 10.6 0.5
4000–4499 23 3,169 1.2 1.7 0.1
4500–4999 3 1,014 0.2 0.5 0.0
5000+ 2 334 0.1 0.2 0.0
Not stated 16 30 0.8 0.0 0.1
Total 1955 186,263 100 100 10.5
Table 18 shows the PSANZ-PDC categories for perinatal deaths by gestational age groups. At term (37 weeks or more), 75.3% of perinatal deaths were not due to congenital abnormality and can therefore be considered as potentially preventable. Of these normally formed term infants, 46.3% were unexplained stillbirths. The next largest group accounting for 16.1% of these deaths was hypoxic peripartum death which includes deaths occurring either intrapartum or in the neonatal period without major pre-existing conditions. In 12.0% of these term perinatal deaths no obstetric antecedent was identified.
Babies born at gestational ages of less than 28 weeks account for more than half of all perinatal deaths (57.4%). The rate of death drops over gestation in all PSANZ-PDC categories except unexplained antepartum death and deaths without a known obstetric antecedent, and is constant across all gestations in the PSANZ-NDC category of congenital abnormality (see Table 19).
Table 18: Perinatal deaths by PSANZ-PDC and gestational age, Queensland 2009 to 2011
Gestational age at birth (weeks)
<28 28–36 37+
PSANZ–PDC classification n % Rate n % Rate n % Rate
1. Congenital abnormality 296 26.4 1.6 127 29.2 0.7 98 24.7 0.5
2. Perinatal infection 22 2.0 0.1 9 2.1 0.0 15 3.8 0.1
3. Hypertension 26 2.3 0.1 15 3.4 0.1 6 1.5 0.0
4. Antepartum haemorrhage 62 5.5 0.3 40 9.2 0.2 10 2.5 0.1
5. Maternal conditions 9 0.8 0.0 9 2.1 0.0 7 1.8 0.0
6. Specific perinatal conditions 60 5.3 0.3 44 10.1 0.2 26 6.6 0.1
7. Hypoxic peripartum deaths 1 0.1 0.0 4 0.9 0.0 48 12.1 0.3
8. Fetal growth restriction 33 2.9 0.2 27 6.2 0.1 13 3.3 0.1
9. Spontaneous preterm 453 40.4 2.4 26 6.0 0.1 0 - -
10. Unexplained antepartum death 123 11.0 0.7 124 28.5 0.7 138 34.8 0.7
11. No obstetric antecedent 37 3.3 0.2 10 2.3 0.1 35 8.8 0.2
Total 1122 100 6.0 435 100 2.3 396 100 2.1
1 case excluded in the gestational age analysis due to missing gestation data Rate = per 1000 births | % = percentage of that gestational group
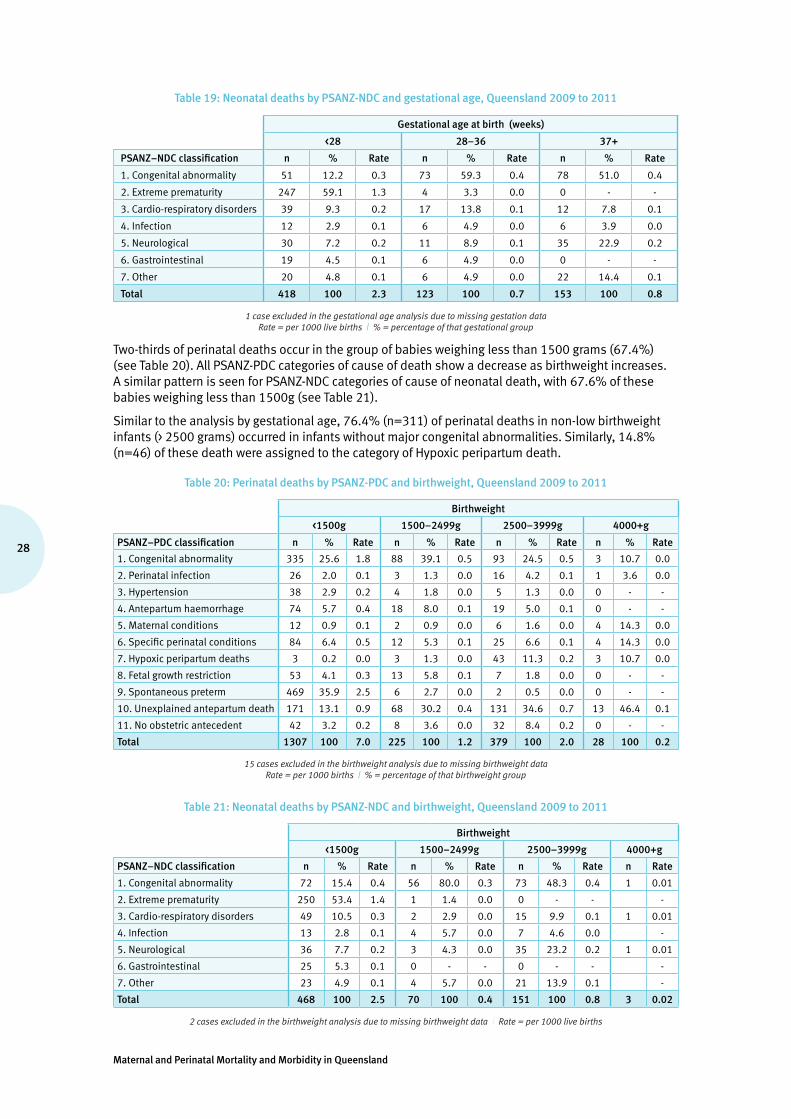
Maternal and Perinatal Mortality and Morbidity in Queensland
28
Table 19: Neonatal deaths by PSANZ-NDC and gestational age, Queensland 2009 to 2011
Gestational age at birth (weeks)
<28 28–36 37+
PSANZ–NDC classification n % Rate n % Rate n % Rate
1. Congenital abnormality 51 12.2 0.3 73 59.3 0.4 78 51.0 0.4
2. Extreme prematurity 247 59.1 1.3 4 3.3 0.0 0 - -
3. Cardio-respiratory disorders 39 9.3 0.2 17 13.8 0.1 12 7.8 0.1
4. Infection 12 2.9 0.1 6 4.9 0.0 6 3.9 0.0
5. Neurological 30 7.2 0.2 11 8.9 0.1 35 22.9 0.2
6. Gastrointestinal 19 4.5 0.1 6 4.9 0.0 0 - -
7. Other 20 4.8 0.1 6 4.9 0.0 22 14.4 0.1
Total 418 100 2.3 123 100 0.7 153 100 0.8
1 case excluded in the gestational age analysis due to missing gestation data Rate = per 1000 live births | % = percentage of that gestational group
Two-thirds of perinatal deaths occur in the group of babies weighing less than 1500 grams (67.4%) (see Table 20). All PSANZ-PDC categories of cause of death show a decrease as birthweight increases. A similar pattern is seen for PSANZ-NDC categories of cause of neonatal death, with 67.6% of these babies weighing less than 1500g (see Table 21).
Similar to the analysis by gestational age, 76.4% (n=311) of perinatal deaths in non-low birthweight infants (> 2500 grams) occurred in infants without major congenital abnormalities. Similarly, 14.8% (n=46) of these death were assigned to the category of Hypoxic peripartum death.
Table 20: Perinatal deaths by PSANZ-PDC and birthweight, Queensland 2009 to 2011
Birthweight
<1500g 1500–2499g 2500–3999g 4000+g
PSANZ–PDC classification n % Rate n % Rate n % Rate n % Rate
1. Congenital abnormality 335 25.6 1.8 88 39.1 0.5 93 24.5 0.5 3 10.7 0.0
2. Perinatal infection 26 2.0 0.1 3 1.3 0.0 16 4.2 0.1 1 3.6 0.0
3. Hypertension 38 2.9 0.2 4 1.8 0.0 5 1.3 0.0 0 - -
4. Antepartum haemorrhage 74 5.7 0.4 18 8.0 0.1 19 5.0 0.1 0 - -
5. Maternal conditions 12 0.9 0.1 2 0.9 0.0 6 1.6 0.0 4 14.3 0.0
6. Specific perinatal conditions 84 6.4 0.5 12 5.3 0.1 25 6.6 0.1 4 14.3 0.0
7. Hypoxic peripartum deaths 3 0.2 0.0 3 1.3 0.0 43 11.3 0.2 3 10.7 0.0
8. Fetal growth restriction 53 4.1 0.3 13 5.8 0.1 7 1.8 0.0 0 - -
9. Spontaneous preterm 469 35.9 2.5 6 2.7 0.0 2 0.5 0.0 0 - -
10. Unexplained antepartum death 171 13.1 0.9 68 30.2 0.4 131 34.6 0.7 13 46.4 0.1
11. No obstetric antecedent 42 3.2 0.2 8 3.6 0.0 32 8.4 0.2 0 - -
Total 1307 100 7.0 225 100 1.2 379 100 2.0 28 100 0.2
15 cases excluded in the birthweight analysis due to missing birthweight data Rate = per 1000 births | % = percentage of that birthweight group
Table 21: Neonatal deaths by PSANZ-NDC and birthweight, Queensland 2009 to 2011
Birthweight
<1500g 1500–2499g 2500–3999g 4000+g
PSANZ–NDC classification n % Rate n % Rate n % Rate n Rate
1. Congenital abnormality 72 15.4 0.4 56 80.0 0.3 73 48.3 0.4 1 0.01
2. Extreme prematurity 250 53.4 1.4 1 1.4 0.0 0 - - -
3. Cardio-respiratory disorders 49 10.5 0.3 2 2.9 0.0 15 9.9 0.1 1 0.01
4. Infection 13 2.8 0.1 4 5.7 0.0 7 4.6 0.0 -
5. Neurological 36 7.7 0.2 3 4.3 0.0 35 23.2 0.2 1 0.01
6. Gastrointestinal 25 5.3 0.1 0 - - 0 - - -
7. Other 23 4.9 0.1 4 5.7 0.0 21 13.9 0.1 -
Total 468 100 2.5 70 100 0.4 151 100 0.8 3 0.02
2 cases excluded in the birthweight analysis due to missing birthweight data | Rate = per 1000 live births

29
Queensland Maternal and Perinatal Quality Council Report 2013
1.3.12 Perinatal autopsies:
Just under one-third of babies dying in the perinatal period have an autopsy (32.1% between 2009 and 2011) (see Figure 7 and Table 30). The autopsy rate for stillborn babies has remained relatively constant over the last five years (34.3% to 37.4%), though the rate of neonatal death autopsy has declined in that period from 31.2% to 20.7%.
Figure 7: Perinatal autopsies by type of death, Queensland 2000 to 2011 (see Table 30)
2. Pregnancy and newborn care
In the years 2010 and 2011 in Queensland, 122,150 women gave birth to 124,211 babies—this is the primary focus of this section of the report. Where possible they are compared with the larger cohort of 658,105 women who gave birth to 669,379 babies in Queensland between 2000 and 2011. Data was provided to the PDCT by midwives, under the Perinatal Statistics provisions of the Public Health Act 2005 (Chapter 6, Part 1, s214–228).
2.1 Mode of healthcare delivery
The number of women giving birth per year has risen from 48,524 in 2000 to 61,123 in 2011, an increase of 26.0% over this 12-year period (see Figure 8 and 9, and Table 34). The number of women cared for in the public healthcare sector has increased by 18.8% and the number cared for in the private healthcare sector by 44.1%—there has been little change, however from 2007–08 to the end of 2011.
Figure 8: Number of births by mode of healthcare delivery, Queensland 2000 to 2011 (see Table 35)

Maternal and Perinatal Mortality and Morbidity in Queensland
30
Figure 9: Percentage of women accessing public and private birth care, Queensland 2000 to 2011 (see Table 35)
From 2001 onwards data relating to intended place of birth and actual place of birth have been collected.
Between 2001 and 2011, 601,012 of the 609,581 (98.6%) women intended to give birth in a hospital—of these 601,012 women, 597,726 (99.5%) succeeded, while 171 gave birth at home, 14 gave birth in a birth centre and 3101 gave birth in ‘other’ circumstances (i.e. born before arrival).
In the same period:
• 7326 women intended to give birth in a birth centre—of these 7326 women, 5696 succeeded. Of the remaining women, 1,495 gave birth in hospital, 11 gave birth at home and 124 in ‘other’ circumstances
• 1197 women intended to give birth at home—of these 1197 women, 919 gave birth at home and 249 were transferred for birth elsewhere.
Data was incomplete for 111 women in this period.
2.2 Home birth
On average, 80 women per year plan to give birth at home and have done so (see Figure 10). The age profile of these women has slowly changed, with women over 35 years of age increasing from 27.8% to 36.8%.
Figure 10: Percentage of home births by maternal age group, Queensland 2000 to 2011 (see Table 35)
2.3 Gestation at birth
Between 2000 and 2011, the rate of birth at gestations 37 to 39 weeks has increased significantly, from less than 43% to more than 53% (see Figure 11 and Table 36).
There has been a concomitant decrease in births at gestations of 40 weeks or more. Whilst it would be tempting to think that this relates to evidence suggesting that women should be given advice to end their pregnancy by 40 weeks plus 10 days, most of this decrease has been in the 40 to 41 week group, rather than the 42 weeks or more group.

31
Queensland Maternal and Perinatal Quality Council Report 2013
Figure 11: Percentage of women giving birth by gestation, Queensland 2000 to 2011 (see Table 36)
There has been little change in the incidence of birth at less than 37 weeks (see Figure 12 and Table 36).
Figure 12: Percentage of women giving birth at less than 34 weeks gestation, Queensland 2000 to 2011 (see Table 36)
The changes in gestation at birth of the mothers are mirrored in the changes in gestation of the babies born (see Figures 13 and 14, and Table 38).
Figure 13: Percentage of babies born by gestation, Queensland 2000 to 2011 (see Table 38)
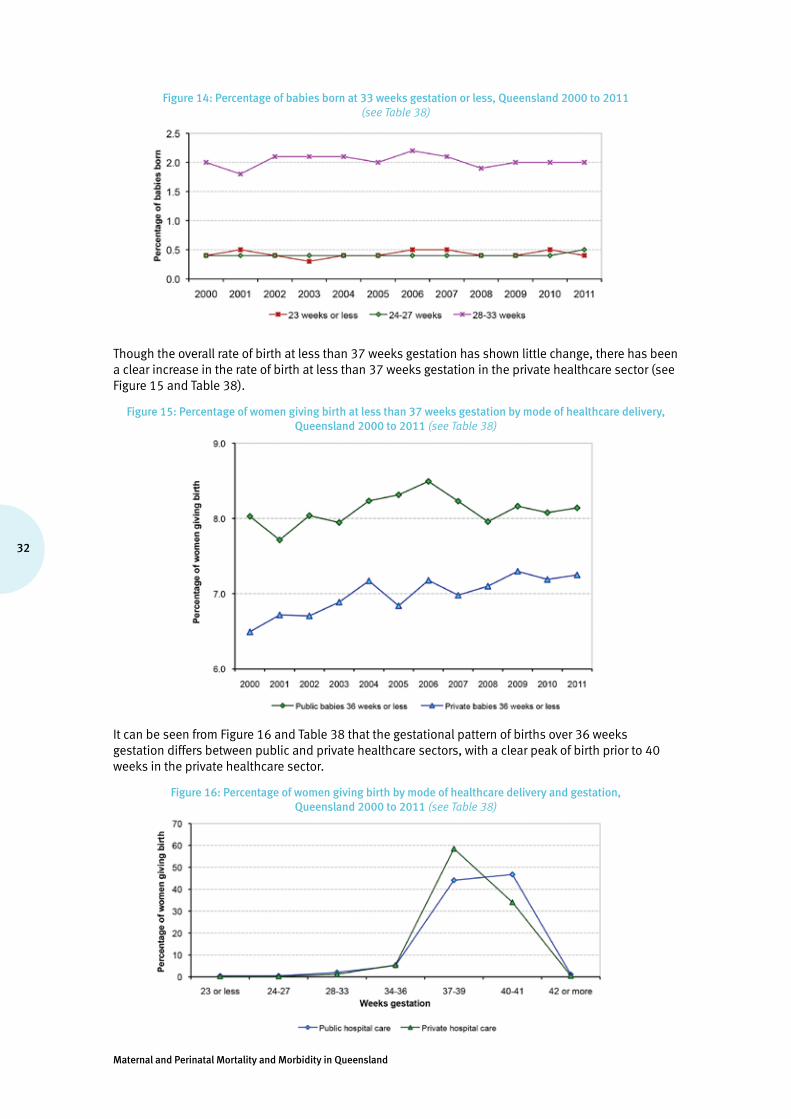
Maternal and Perinatal Mortality and Morbidity in Queensland
32
Figure 14: Percentage of babies born at 33 weeks gestation or less, Queensland 2000 to 2011 (see Table 38)
Though the overall rate of birth at less than 37 weeks gestation has shown little change, there has been a clear increase in the rate of birth at less than 37 weeks gestation in the private healthcare sector (see Figure 15 and Table 38).
Figure 15: Percentage of women giving birth at less than 37 weeks gestation by mode of healthcare delivery, Queensland 2000 to 2011 (see Table 38)
It can be seen from Figure 16 and Table 38 that the gestational pattern of births over 36 weeks gestation differs between public and private healthcare sectors, with a clear peak of birth prior to 40 weeks in the private healthcare sector.
Figure 16: Percentage of women giving birth by mode of healthcare delivery and gestation, Queensland 2000 to 2011 (see Table 38)
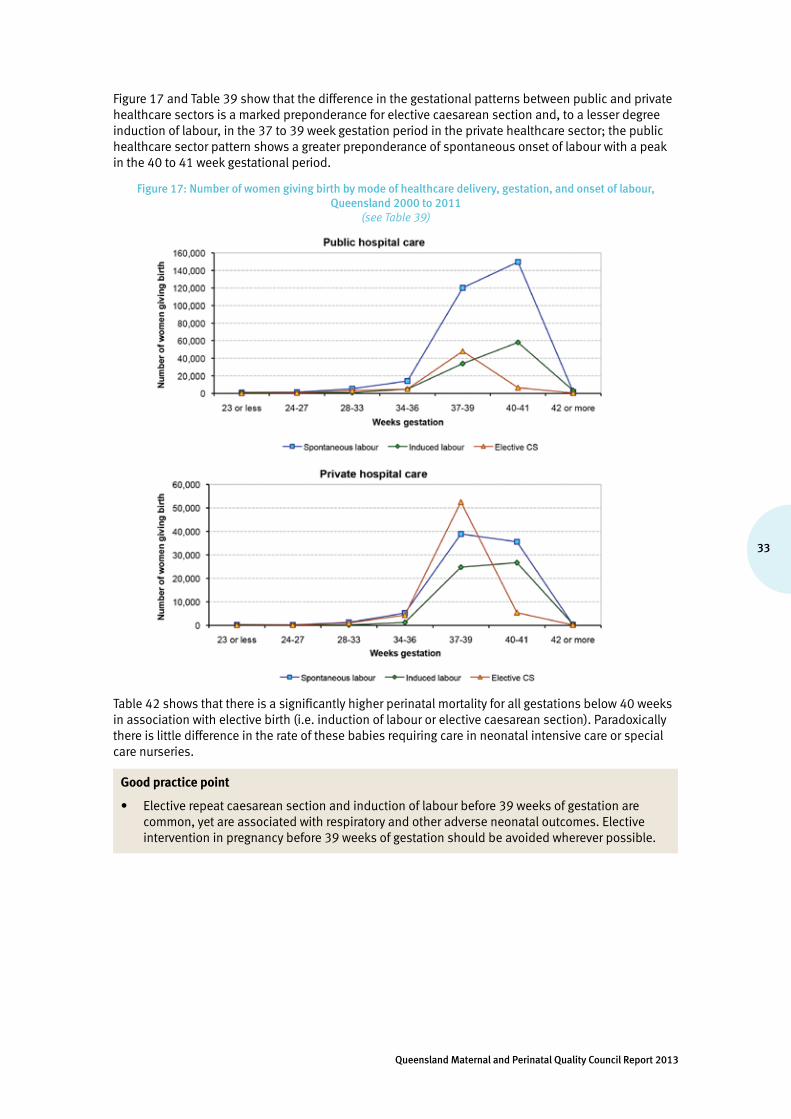
33
Queensland Maternal and Perinatal Quality Council Report 2013
Figure 17 and Table 39 show that the difference in the gestational patterns between public and private healthcare sectors is a marked preponderance for elective caesarean section and, to a lesser degree induction of labour, in the 37 to 39 week gestation period in the private healthcare sector; the public healthcare sector pattern shows a greater preponderance of spontaneous onset of labour with a peak in the 40 to 41 week gestational period.
Figure 17: Number of women giving birth by mode of healthcare delivery, gestation, and onset of labour, Queensland 2000 to 2011
(see Table 39)
Table 42 shows that there is a significantly higher perinatal mortality for all gestations below 40 weeks in association with elective birth (i.e. induction of labour or elective caesarean section). Paradoxically there is little difference in the rate of these babies requiring care in neonatal intensive care or special care nurseries.
Good practice point
• Elective repeat caesarean section and induction of labour before 39 weeks of gestation are common, yet are associated with respiratory and other adverse neonatal outcomes. Elective intervention in pregnancy before 39 weeks of gestation should be avoided wherever possible.

Maternal and Perinatal Mortality and Morbidity in Queensland
34
2.4 Birthweight
Approximately 7% of babies born are low birthweight (less than 2500 grams) as shown in Figure 18 and Table 41, and this rate has not changed significantly between 2000 and 2011.
Figure 18: Distribution of birth weights, Queensland 2000 to 2011 (see Table 41)
2.5 Multiple pregnancies
The overall rate of multiple pregnancy has varied between 1.5% and 1.8% over the period covered by this report (see Figure 19 and Table 42). The rate of multiple pregnancy increased significantly with maternal age (maternal age 35+ versus maternal age <35 risk ratio, 2000 to 2011: RR = 1.59, 95% confidence limits = 1.52, 1.66).
Figure 19: Percentage of multiple pregnancies by maternal age, Queensland 2000 to 2011 (see Table 42)
It is clear that multiple pregnancy is a powerful predictor of preterm birth, with less than 7% of singleton pregnancies ending before 37 weeks gestation, while between 56% and 62% of multiple pregnancies end before 37 weeks gestation.

35
Queensland Maternal and Perinatal Quality Council Report 2013
Figure 20: Percentage of multiple and singleton pregnancies by gestation at birth, Queensland 2000 to 2011 (see Table 43)
Good practice point
• Maternity care providers should provide clear information to women carrying multiple pregnancies regarding the risk of preterm labour, and steps that should be taken in the event that a woman carrying a multiple pregnancy suspects the onset of preterm labour.
2.6 Assisted conception
Approximately 4% of births in Queensland are from pregnancies conceived with the aid of assisted conception techniques. Less than 4% of singleton pregnancies have been conceived with the aid of assisted conception techniques, but 28% of multiple pregnancies have been conceived with their aid.
Figure 21: Influence of assisted conception techniques, Queensland 2008 to 2011 (see Table 44)
Singleton Multiple
Multiple pregnancy occurs in 1.1% to 1.3% of pregnancies conceived without any identified assisted conception technique (see Figure 22 and Table 44).
The development of improved extracorporeal techniques for assisted conception (invitro fertilisation, gamete intra-fallopian transfer, intracytoplasmic sperm injection, embryo transfer or related techniques) has resulted in a steady almost 50% fall in the rate of multiple pregnancy between 2000 and 2011 in association with these techniques (23.2% to 12.2%).
The same type of improvement has not been seen in relation to the use of ovulation induction and/or artificial insemination, with the multiple pregnancy incidence persistently in the region of 8%.

Maternal and Perinatal Mortality and Morbidity in Queensland
36
Figure 22: Percentage of multiple births in pregnancies conceived with and without the use of assisted conception techniques, Queensland 2000 to 2011
(see Table 44)
AIH/AID +/or ovulation induction = artificial insemination and/or ovulation induction processes. Extracorporeal techniques = invitro fertilisation, gamete intra-fallopian transfer, intracytoplasmic sperm injection, embryo transfer or related techniques.
Good practice point
• Given the unchanging risks of multiple pregnancy occurring in association with ovulation induction and the consequent risk of adverse outcomes due to the multiple pregnancies, the same attention to technique monitoring and quality improvement as has been seen with extracorporeal techniques is recommended to those prescribing ovulation induction.
2.7 Onset of labour
There has been little change since 2005, with pregnancies ending in spontaneous labour in less than 60% of instances (see Figure 23 and Table 46). The frequency of elective caesarean section (20% to 21%) and induction of labour (22% to 23%) are similar to each other.
Figure 23: Onset of labour, all births, Queensland 2000 to 2011 (see Table 46)
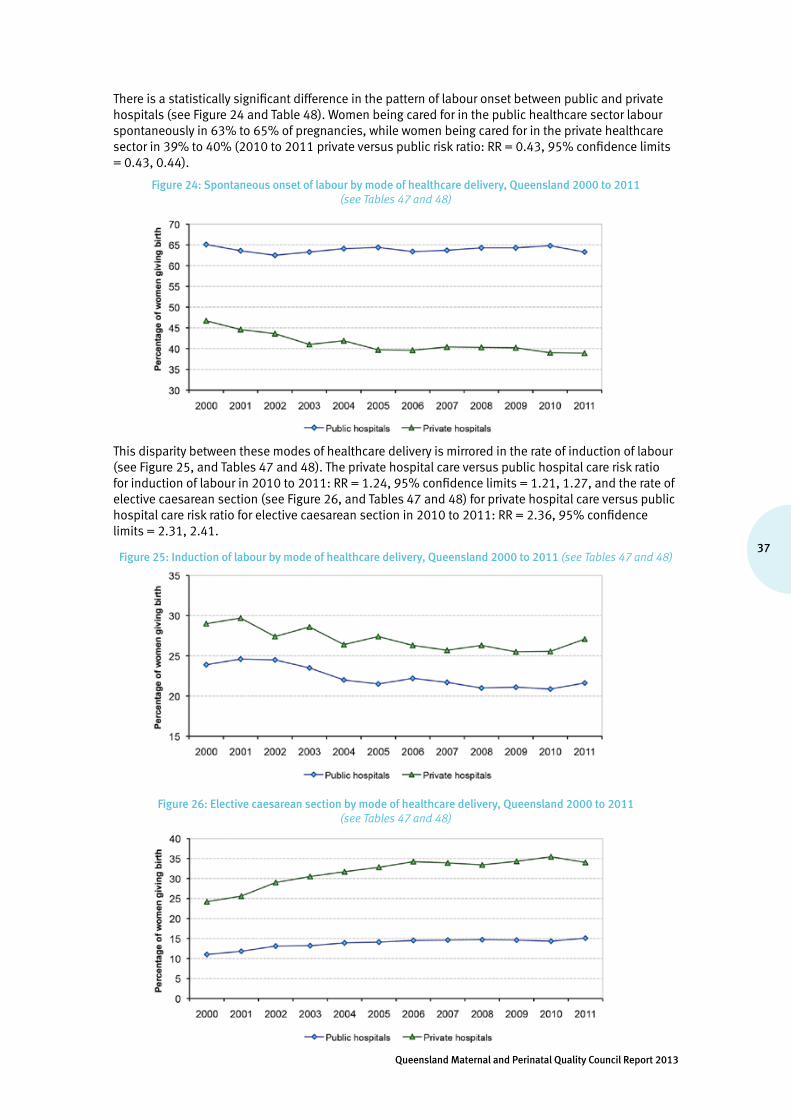
37
Queensland Maternal and Perinatal Quality Council Report 2013
There is a statistically significant difference in the pattern of labour onset between public and private hospitals (see Figure 24 and Table 48). Women being cared for in the public healthcare sector labour spontaneously in 63% to 65% of pregnancies, while women being cared for in the private healthcare sector in 39% to 40% (2010 to 2011 private versus public risk ratio: RR = 0.43, 95% confidence limits = 0.43, 0.44).
Figure 24: Spontaneous onset of labour by mode of healthcare delivery, Queensland 2000 to 2011 (see Tables 47 and 48)
This disparity between these modes of healthcare delivery is mirrored in the rate of induction of labour (see Figure 25, and Tables 47 and 48). The private hospital care versus public hospital care risk ratio for induction of labour in 2010 to 2011: RR = 1.24, 95% confidence limits = 1.21, 1.27, and the rate of elective caesarean section (see Figure 26, and Tables 47 and 48) for private hospital care versus public hospital care risk ratio for elective caesarean section in 2010 to 2011: RR = 2.36, 95% confidence limits = 2.31, 2.41.
Figure 25: Induction of labour by mode of healthcare delivery, Queensland 2000 to 2011 (see Tables 47 and 48)
Figure 26: Elective caesarean section by mode of healthcare delivery, Queensland 2000 to 2011 (see Tables 47 and 48)
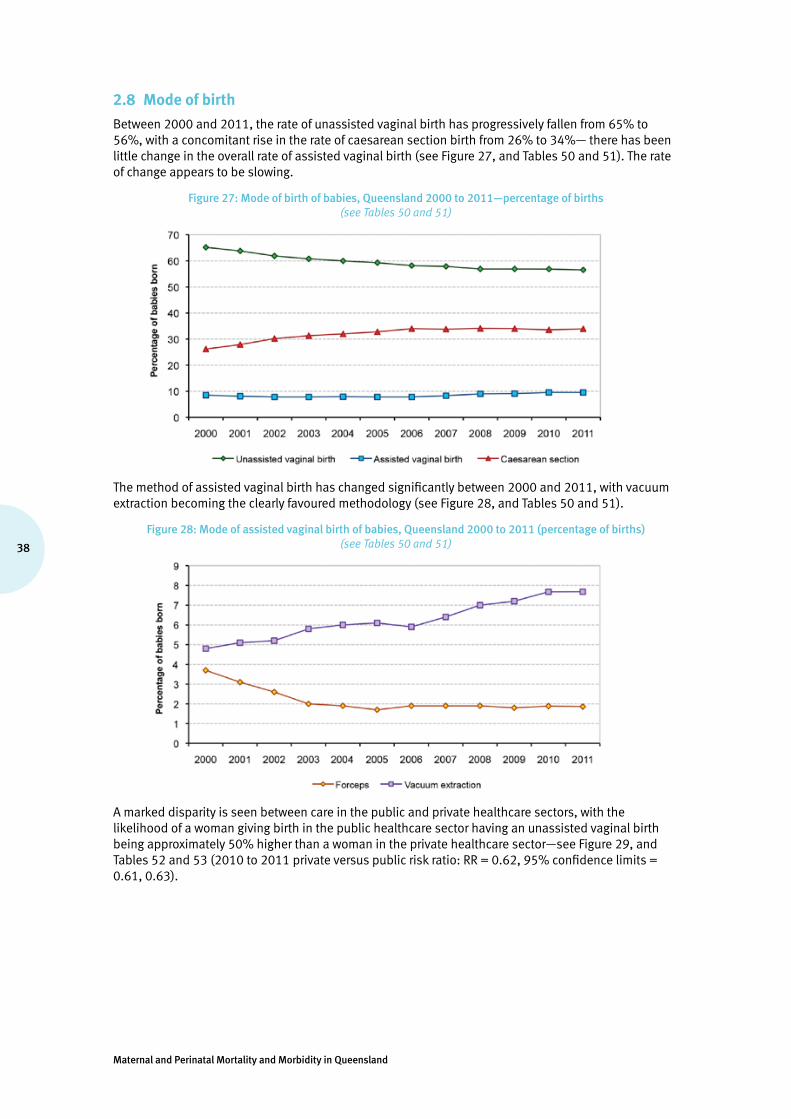
Maternal and Perinatal Mortality and Morbidity in Queensland
38
2.8 Mode of birth
Between 2000 and 2011, the rate of unassisted vaginal birth has progressively fallen from 65% to 56%, with a concomitant rise in the rate of caesarean section birth from 26% to 34%— there has been little change in the overall rate of assisted vaginal birth (see Figure 27, and Tables 50 and 51). The rate of change appears to be slowing.
Figure 27: Mode of birth of babies, Queensland 2000 to 2011—percentage of births (see Tables 50 and 51)
The method of assisted vaginal birth has changed significantly between 2000 and 2011, with vacuum extraction becoming the clearly favoured methodology (see Figure 28, and Tables 50 and 51).
Figure 28: Mode of assisted vaginal birth of babies, Queensland 2000 to 2011 (percentage of births) (see Tables 50 and 51)
A marked disparity is seen between care in the public and private healthcare sectors, with the likelihood of a woman giving birth in the public healthcare sector having an unassisted vaginal birth being approximately 50% higher than a woman in the private healthcare sector—see Figure 29, and Tables 52 and 53 (2010 to 2011 private versus public risk ratio: RR = 0.62, 95% confidence limits = 0.61, 0.63).

39
Queensland Maternal and Perinatal Quality Council Report 2013
Figure 29: Incidence of unassisted vaginal birth of babies by mode of healthcare delivery, Queensland 2000 to 2011 (refer Tables 52 and 53)
By 2010 and 2011, almost 50% of women giving birth in the private healthcare sector had a caesarean section birth, while less than one-third of women giving birth in the public healthcare sector had a caesarean section birth—see Figure 30, and Tables 52 and 53 (2010 to 2011 private versus public risk ratio RR = 1.74, 95% confidence limits = 1.72, 1.77).
Figure 30: Incidence of caesarean section birth of babies by mode of healthcare delivery, Queensland 2000 to 2011 (see Tables 52 and 53)
The difference in the rate of caesarean section between the two hospital systems is explained almost entirely by a highly significant preponderance of elective caesarean section (i.e. caesarean section without labour) in the private healthcare sector—see Figure 31, and Tables 54 and 55 (2010 to 2011 private versus public risk ratio for elective caesarean section RR = 2.30, 95% confidence limits = 2.28, 2.32, and the 2010 to 2011 private versus public risk ratio for non-elective caesarean section RR = 1.13, 95% confidence limits = 1.11, 1.14).
Figure 31: Incidence of caesarean section birth, before and in labour, of babies born in public and private hospitals, Queensland 2000 to 2011 (see Tables 54 and 55)
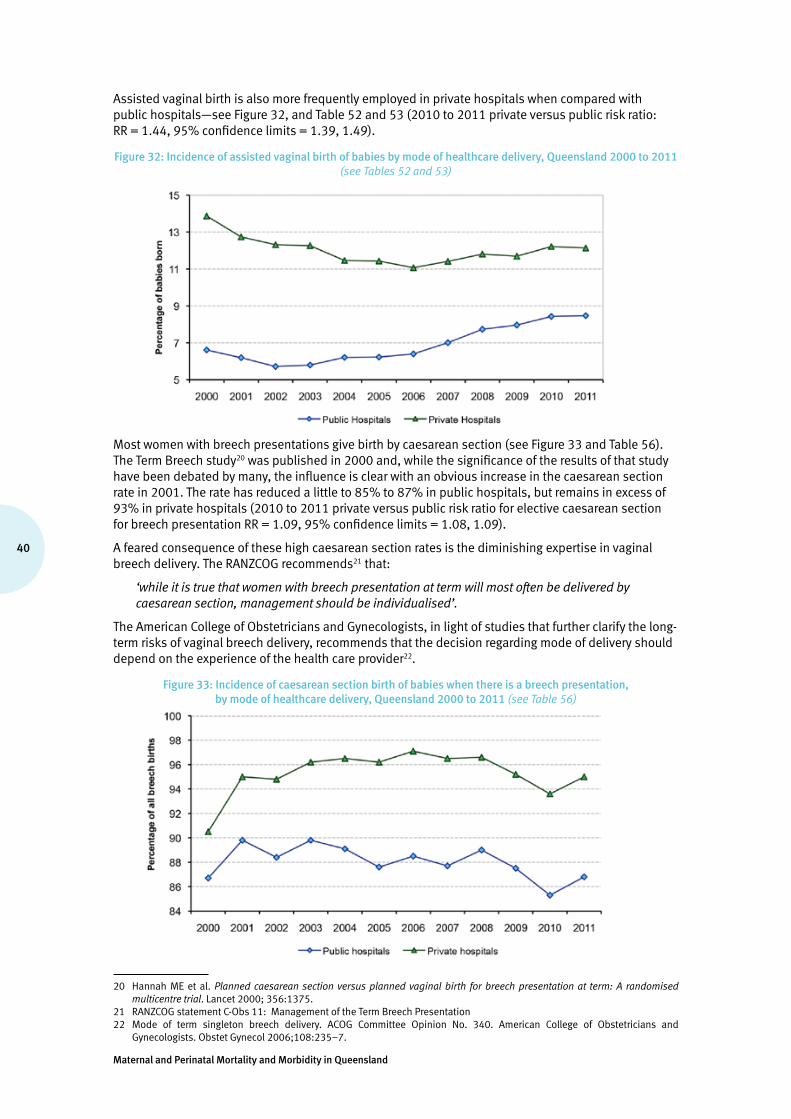
Maternal and Perinatal Mortality and Morbidity in Queensland
40
Assisted vaginal birth is also more frequently employed in private hospitals when compared with public hospitals—see Figure 32, and Table 52 and 53 (2010 to 2011 private versus public risk ratio: RR = 1.44, 95% confidence limits = 1.39, 1.49).
Figure 32: Incidence of assisted vaginal birth of babies by mode of healthcare delivery, Queensland 2000 to 2011 (see Tables 52 and 53)
Most women with breech presentations give birth by caesarean section (see Figure 33 and Table 56). The Term Breech study20 was published in 2000 and, while the significance of the results of that study have been debated by many, the influence is clear with an obvious increase in the caesarean section rate in 2001. The rate has reduced a little to 85% to 87% in public hospitals, but remains in excess of 93% in private hospitals (2010 to 2011 private versus public risk ratio for elective caesarean section for breech presentation RR = 1.09, 95% confidence limits = 1.08, 1.09).
A feared consequence of these high caesarean section rates is the diminishing expertise in vaginal breech delivery. The RANZCOG recommends21 that:
‘while it is true that women with breech presentation at term will most often be delivered by caesarean section, management should be individualised’.
The American College of Obstetricians and Gynecologists, in light of studies that further clarify the long-term risks of vaginal breech delivery, recommends that the decision regarding mode of delivery should depend on the experience of the health care provider22.
Figure 33: Incidence of caesarean section birth of babies when there is a breech presentation, by mode of healthcare delivery, Queensland 2000 to 2011 (see Table 56)
20 Hannah ME et al. Planned caesarean section versus planned vaginal birth for breech presentation at term: A randomised multicentre trial. Lancet 2000; 356:1375.
21 RANZCOG statement C-Obs 11: Management of the Term Breech Presentation22 Mode of term singleton breech delivery. ACOG Committee Opinion No. 340. American College of Obstetricians and
Gynecologists. Obstet Gynecol 2006;108:235–7.

41
Queensland Maternal and Perinatal Quality Council Report 2013
Recommendation
• That the SMNCN seeks assistance from the RANZCOG and other relevant professional bodies to examine the possible development of a small number of obstetric services which retain, preserve and teach the obstetric skill of vaginal breech birth.
Women with multiple pregnancies are most likely to give birth by caesarean section, with the rate steadily increasing between 2000 and 2011—see Figure 34 and Table 57 (2010 to 2011 private versus public risk ratio for elective caesarean section for multiple pregnancy RR = 1.12, 95% confidence limits = 1.07, 1.18).
Figure 34: Incidence of caesarean section for multiple births by mode of healthcare delivery, Queensland 2000 to 2011
(see Table 57)
2.9 Indigenous mothers and their babies
Between 2009 and 2011, 10,486 Indigenous women gave birth in Queensland (5.7% of the total of 183,174 women giving birth). Of these women, 10,273 (97.9%) were cared for in the public healthcare sector, compared with 68.3% of non-Indigenous women who accessed public hospital care (see Table 58 and 59).
Just over 80% of Indigenous women giving birth are 20 or more years of age, whilst approximately 95% of non-Indigenous women giving birth are 20 or more years of age (see Figure 35, and Table 58 and 59).
Figure 35: Incidence of maternal age groups by maternal Indigenous status, Queensland 2000 to 2011 (see Tables 58 and 59)

Maternal and Perinatal Mortality and Morbidity in Queensland
42
AsseeninFigures36to39,andTables61and62,Indigenouswomenaremorelikelythannon-Indigenouswomentogivebirthatlowergestations(theIndigenousversusnon-Indigenousriskratioforbirthatgestationsof33weeksorlessRR=1.77,95%confidencelimits=1.69,1.86).Thisdifferenceingestationalpatternhasremainedconstantbetween2000and2011.
Figure 36: Percentage of women giving birth, by maternal Indigenous status and gestational age, Queensland 2000 to 2011 (see Tables 61 and 62)
Figure 37: Incidence of women giving birth by gestational groups and maternal Indigenous status, Queensland 2000 to 2011 (see Tables 61 and 62)
Figure 38: Incidence of birth by gestation at birth and maternal Indigenous status, Queensland 2000 to 2011 (see Table 62)

43
Queensland Maternal and Perinatal Quality Council Report 2013
Figure 39: Incidence of birth at or below 36 weeks gestation by maternal Indigenous status, Queensland 2000 to 2011, detail from Figure 38
(see Table 62)
Gestationalage-specificbirthweightsaresimilarforIndigenousandnon-Indigenousbabies(seeFigure40andTable62).
Figure 40: Mean birthweight by gestational age and maternal Indigenous status, Queensland 2000 to 2011
(see Table 61 and 62)
ThedifferentgestationalpatternsbetweenIndigenousandnon-IndigenouspregnanciesmeansthattherateoflowbirthweightIndigenousbabiesbeingbornissignificantlyhigherthanfornon-Indigenousbabies—seeFigure41andTable62onthefollowingpage(theIndigenousversusnon-Indigenousriskratioforbirthweightlessthan2500grams:RR=1.81,95%confidencelimits=1.76,1.87).

Maternal and Perinatal Mortality and Morbidity in Queensland
44
Figure 41: Percentage of babies by gestation, birthweight group and maternal Indigenous status, Queensland 2000 to 2011
(see Table 62)
2.9.1 Department of Health performance indicators in Aboriginal and Torres Strait Islander health related to maternity and newborn care
In2007,theDepartmentofHealthcommittedtoestablishmeasurableaccountabilities,startingwithkeyareasofchronicdisease,maternalandchildhealth.ThissetofstatewideindicatorsisdrawnprincipallyfromQueenslandHospitalAdmittedPatientDataCollectionandtheQueenslandPerinatalDataCollection.Fourindicators,reportedhere,relatetomaternityandnewborncareinpublichealthcare.
Aboriginal and Torres Strait Islander women who smoked after 20 weeks gestation
Thisindicatorisdefinedas:the proportion of Aboriginal and Torres Strait Islander women who smoked after 20 weeks gestation.
Aboriginal and Torres Strait Islander women who smoked at any time during pregnancy
Thisindicatorisdefinedas:the proportion of Aboriginal and Torres Strait Islander women who smoked at any time during pregnancy.
Theperinataldatacollectionincludesdataitemsofsmokingatlessthan20weeksgestationduringpregnancyandsmokingafter20weeksgestationduringpregnancy.Thestatewidedatacollectionallowingcalculationoftheseindicatorscommencedinmid–2009.Usingthesetwodataitems(seeTables63and64)the2010to2011rateofwomenwhoidentifiedasAboriginaland/orTorresStraitIslandersmoking:• atlessthan20weeksgestationduringpregnancywas51.3%• after20weeksgestationduringpregnancywas45.4%.
Therelevantincidenceinnon-Indigenouswomenwas14.4%and11.6%.
Aboriginal and Torres Strait Islander women who attended five or more antenatal visits during pregnancy
Thisindicatorisdefinedas:the number of Aboriginal and Torres Strait Islander women who attended at least five antenatal visits and gave birth at 32 weeks or more gestation to a live or stillborn baby as a proportion of Aboriginal and Torres Strait Islander women who gave birth at 32 weeks or more gestation resulting in at least one live born or still born baby.
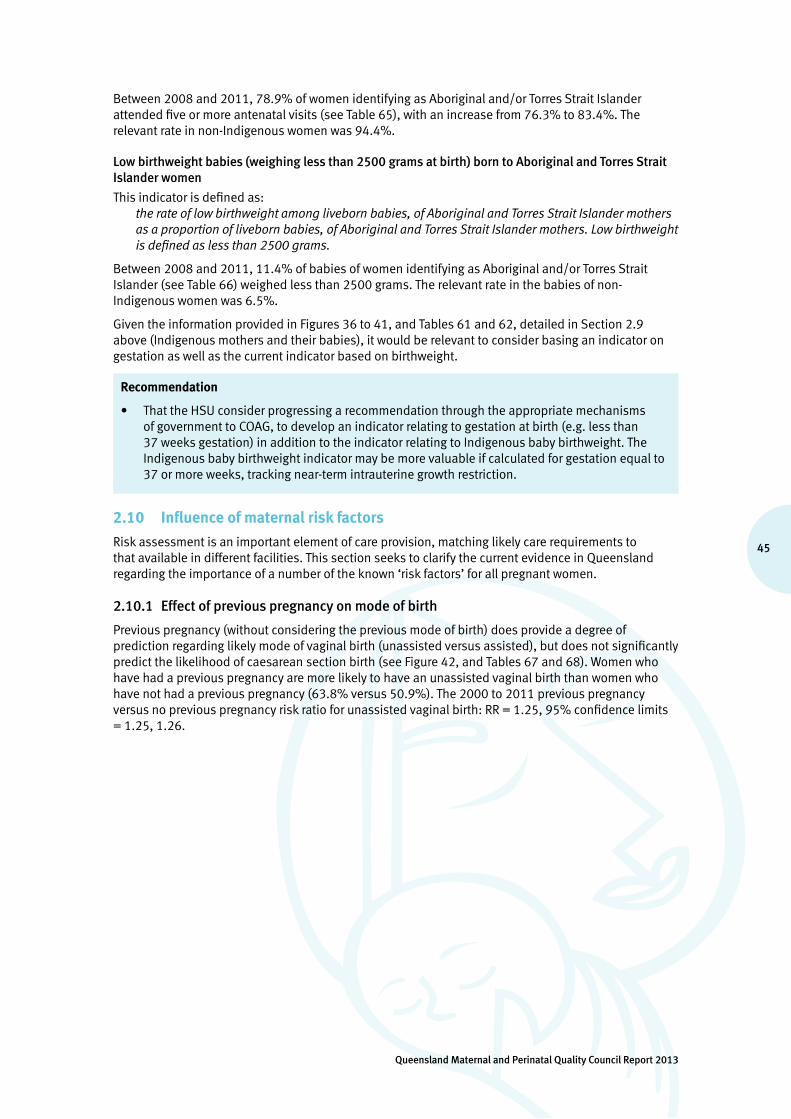
45
Queensland Maternal and Perinatal Quality Council Report 2013
Between2008and2011,78.9%ofwomenidentifyingasAboriginaland/orTorresStraitIslanderattendedfiveormoreantenatalvisits(seeTable65),withanincreasefrom76.3%to83.4%.Therelevantrateinnon-Indigenouswomenwas94.4%.
Low birthweight babies (weighing less than 2500 grams at birth) born to Aboriginal and Torres Strait Islander women
Thisindicatorisdefinedas:the rate of low birthweight among liveborn babies, of Aboriginal and Torres Strait Islander mothers as a proportion of liveborn babies, of Aboriginal and Torres Strait Islander mothers. Low birthweight is defined as less than 2500 grams.
Between2008and2011,11.4%ofbabiesofwomenidentifyingasAboriginaland/orTorresStraitIslander(seeTable66)weighedlessthan2500grams.Therelevantrateinthebabiesofnon-Indigenouswomenwas6.5%.
GiventheinformationprovidedinFigures36to41,andTables61and62,detailedinSection2.9above(Indigenousmothersandtheirbabies),itwouldberelevanttoconsiderbasinganindicatorongestationaswellasthecurrentindicatorbasedonbirthweight.
Recommendation
• ThattheHSUconsiderprogressingarecommendationthroughtheappropriatemechanismsofgovernmenttoCOAG,todevelopanindicatorrelatingtogestationatbirth(e.g.lessthan37weeksgestation)inadditiontotheindicatorrelatingtoIndigenousbabybirthweight.TheIndigenousbabybirthweightindicatormaybemorevaluableifcalculatedforgestationequalto37ormoreweeks,trackingnear-termintrauterinegrowthrestriction.
2.10 Influence of maternal risk factors
Riskassessmentisanimportantelementofcareprovision,matchinglikelycarerequirementstothatavailableindifferentfacilities.ThissectionseekstoclarifythecurrentevidenceinQueenslandregardingtheimportanceofanumberoftheknown‘riskfactors’forallpregnantwomen.
2.10.1 Effect of previous pregnancy on mode of birth
Previouspregnancy(withoutconsideringthepreviousmodeofbirth)doesprovideadegreeofpredictionregardinglikelymodeofvaginalbirth(unassistedversusassisted),butdoesnotsignificantlypredictthelikelihoodofcaesareansectionbirth(seeFigure42,andTables67and68).Womenwhohavehadapreviouspregnancyaremorelikelytohaveanunassistedvaginalbirththanwomenwhohavenothadapreviouspregnancy(63.8%versus50.9%).The2000to2011previouspregnancyversusnopreviouspregnancyriskratioforunassistedvaginalbirth:RR=1.25,95%confidencelimits=1.25,1.26.
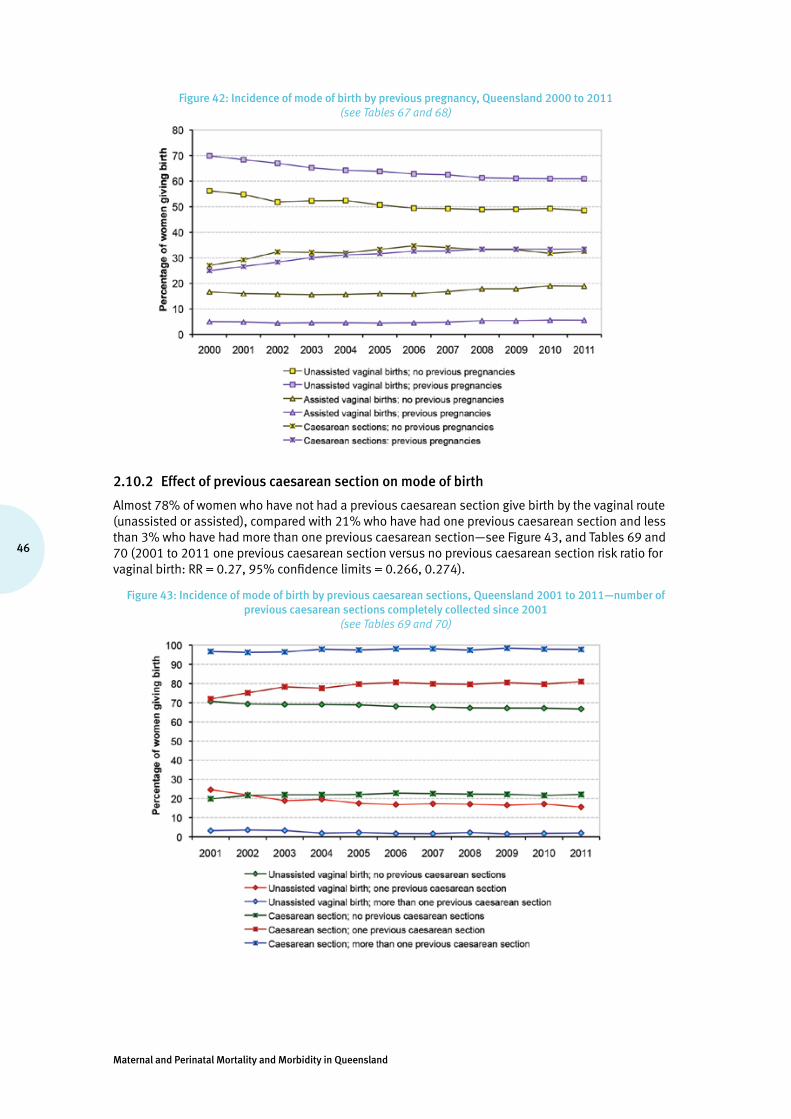
Maternal and Perinatal Mortality and Morbidity in Queensland
46
Figure 42: Incidence of mode of birth by previous pregnancy, Queensland 2000 to 2011 (see Tables 67 and 68)
2.10.2 Effect of previous caesarean section on mode of birth
Almost78%ofwomenwhohavenothadapreviouscaesareansectiongivebirthbythevaginalroute(unassistedorassisted),comparedwith21%whohavehadonepreviouscaesareansectionandlessthan3%whohavehadmorethanonepreviouscaesareansection—seeFigure43,andTables69and70(2001to2011onepreviouscaesareansectionversusnopreviouscaesareansectionriskratioforvaginalbirth:RR=0.27,95%confidencelimits=0.266,0.274).
Figure 43: Incidence of mode of birth by previous caesarean sections, Queensland 2001 to 2011—number of previous caesarean sections completely collected since 2001
(see Tables 69 and 70)
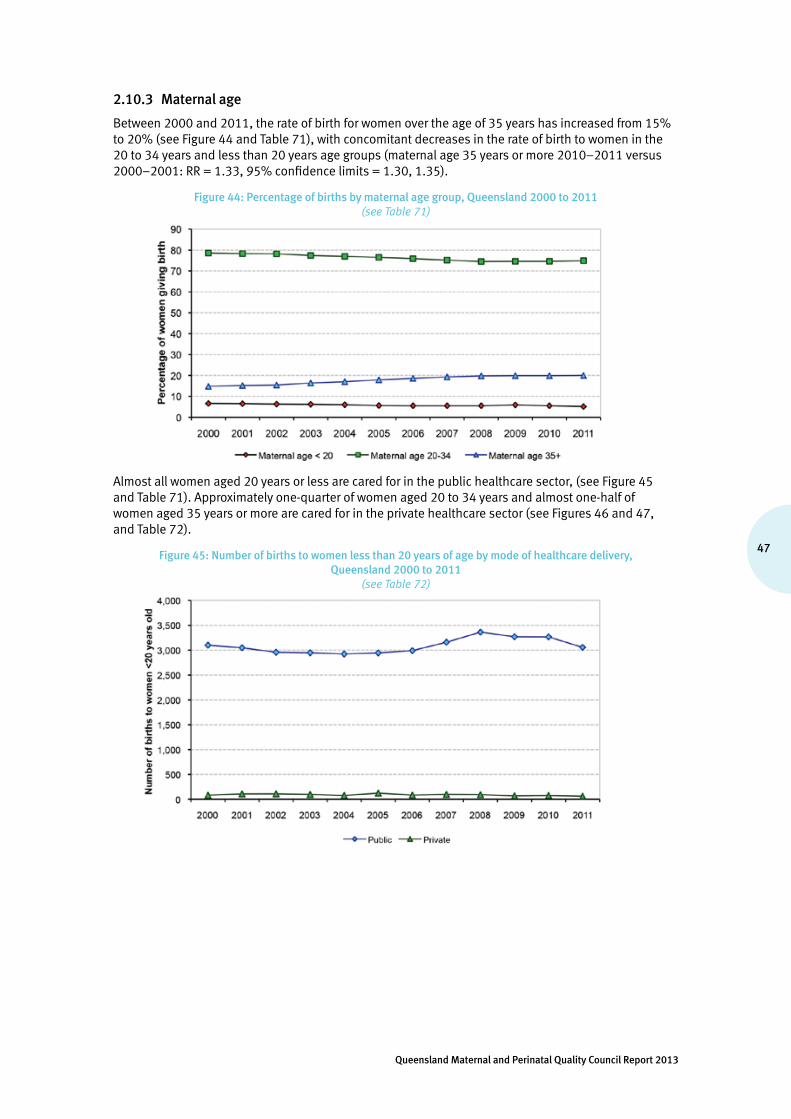
47
Queensland Maternal and Perinatal Quality Council Report 2013
2.10.3 Maternal age
Between2000and2011,therateofbirthforwomenovertheageof35yearshasincreasedfrom15%to20%(seeFigure44andTable71),withconcomitantdecreasesintherateofbirthtowomeninthe20to34yearsandlessthan20yearsagegroups(maternalage35yearsormore2010–2011versus2000–2001:RR=1.33,95%confidencelimits=1.30,1.35).
Figure 44: Percentage of births by maternal age group, Queensland 2000 to 2011 (see Table 71)
Almostallwomenaged20yearsorlessarecaredforinthepublichealthcaresector,(seeFigure45andTable71).Approximatelyone-quarterofwomenaged20to34yearsandalmostone-halfofwomenaged35yearsormorearecaredforintheprivatehealthcaresector(seeFigures46and47,andTable72).
Figure 45: Number of births to women less than 20 years of age by mode of healthcare delivery, Queensland 2000 to 2011
(see Table 72)

Maternal and Perinatal Mortality and Morbidity in Queensland
48
Figure 46: Number of births to women 20–34 years of age by mode of healthcare delivery, Queensland 2000 to 2011
(see Table 72)
Figure 47: Number of births to women 35 or more years of age by mode of healthcare delivery, Queensland 2000 to 2011
(refer Table 72)
Thereisanalmostlinearincreaseintherateofmultiplebirthastheageofwomenincreases—seeFigure48andTable73(2008to2011maternalage31yearsormoreversusmaternalage25orlessriskratioformultiplepregnancy:RR=2.15,95%confidencelimits=2.04,2.26).Itisunclearastohowmuchofthisdifferenceinincidencerelatestotheuseofassistedreproductiontechnologies.

49
Queensland Maternal and Perinatal Quality Council Report 2013
Figure 48: Incidence of multiple birth by maternal age, Queensland 2008 to 2011 (see Table 73)
Olderwomenaremorelikelythanyoungerwomentogivebirthbetween34and38weeksgestation,ratherthan39weeksormore—seeFigure49andTable74(2000to2011,maternalage31yearsormoreversusmaternalage25orlessriskratioforbirthbetween34and38weeksgestation:RR=1.34,95%confidencelimits=1.33,1.36).
Figure 49: Percentage of babies born by maternal age and gestation, Queensland 2000 to 2011 (see Table 74)
Babiesofwomen36ormoreyearsofageandwomen20orlessyearsofagearemostlikelytoneednewborncareinNICUand/oraSCN—seeFigure50andTable75(2000to2011,maternalage36yearsormoreversusmaternalage35yearsorlessriskratioforNICUand/orSCNcare:RR=1.16,95%confidencelimits=1.15,1.18,and2000to2011,maternalage20yearsorlessversusmaternalage21yearsormoreriskratioforNICUand/orSCNcare:RR=1.09,95%confidencelimits=1.07,1.11).
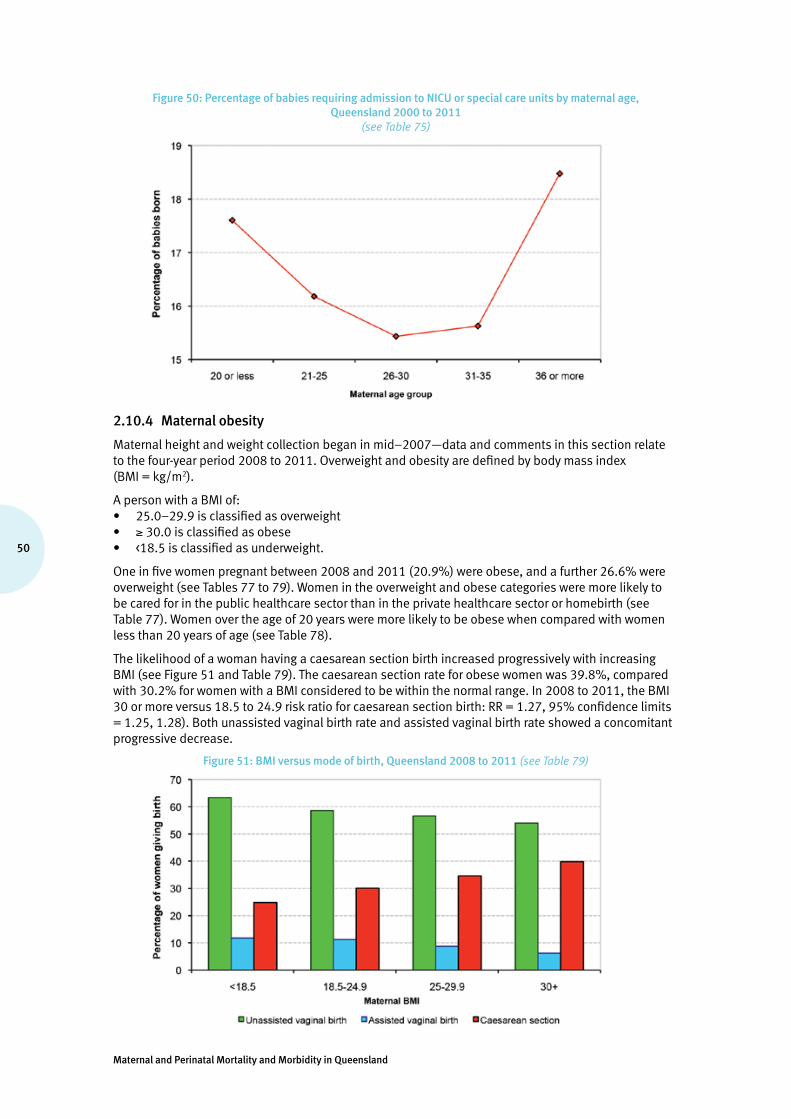
Maternal and Perinatal Mortality and Morbidity in Queensland
50
Figure 50: Percentage of babies requiring admission to NICU or special care units by maternal age, Queensland 2000 to 2011
(see Table 75)
2.10.4 Maternal obesity
Maternalheightandweightcollectionbeganinmid–2007—dataandcommentsinthissectionrelatetothefour-yearperiod2008to2011.Overweightandobesityaredefinedbybodymassindex(BMI=kg/m2).
ApersonwithaBMIof:• 25.0–29.9isclassifiedasoverweight• ≥30.0isclassifiedasobese• <18.5isclassifiedasunderweight.
Oneinfivewomenpregnantbetween2008and2011(20.9%)wereobese,andafurther26.6%wereoverweight(seeTables77to79).Womenintheoverweightandobesecategoriesweremorelikelytobecaredforinthepublichealthcaresectorthanintheprivatehealthcaresectororhomebirth(seeTable77).Womenovertheageof20yearsweremorelikelytobeobesewhencomparedwithwomenlessthan20yearsofage(seeTable78).
ThelikelihoodofawomanhavingacaesareansectionbirthincreasedprogressivelywithincreasingBMI(seeFigure51andTable79).Thecaesareansectionrateforobesewomenwas39.8%,comparedwith30.2%forwomenwithaBMIconsideredtobewithinthenormalrange.In2008to2011,theBMI30ormoreversus18.5to24.9riskratioforcaesareansectionbirth:RR=1.27,95%confidencelimits=1.25,1.28).Bothunassistedvaginalbirthrateandassistedvaginalbirthrateshowedaconcomitantprogressivedecrease.
Figure 51: BMI versus mode of birth, Queensland 2008 to 2011 (see Table 79)

51
Queensland Maternal and Perinatal Quality Council Report 2013
Obesity does not appear to have any significant influence on gestation at birth (see Figure 52 and Table 80). Obese women are more likely to have a baby weighing more than 4000 grams when compared with lighter women, and underweight women are more likely than heavier women to have a baby weighing less than 2500 grams (see Figure 53 and Table 81).
Figure 52: BMI versus gestation at birth, Queensland 2008 to 2011 (see Table 80)
Figure 53: BMI versus birthweight, Queensland 2008 to 2011 (see Table 81)
Obesity is associated with an excessive incidence of perinatal death (25% more likely than in woman with a BMI less than 30 (2008 to 2011 BMI 30 or more versus BMI less than 30 risk ratio for perinatal death: RR = 1.33, 95% confidence limits = 1.21, 1.47). Both fetal death and neonatal death rates are increased in this obese group (see Figure 54 and Table 82).
Figure 54: BMI versus perinatal mortality rates (per 1,000 births), Queensland 2008 to 2011 (see Table 82)

Maternal and Perinatal Mortality and Morbidity in Queensland
52
2.10.5 Maternal smoking
Smoking status before and after 20 weeks gestation has been collected since mid–2009. Younger women are more likely to smoke than older women (see Table 83). The rate of smoking after 20 weeks gestation is 13.6%, compared with 16.6% before 20 weeks gestation.
Women who smoke are more likely to give birth preterm. Smoking after 20 weeks gestation is associated with a rate of preterm birth (less than 37 weeks gestation) of 20.9%, compared with 18.1% for women who do not smoke after 20 weeks gestation—see Figure 55 and Table 84 (2010 to 2011 smoking after 20 weeks gestation versus not smoking after 20 weeks gestation risk ratio for birth at gestations less than 37 weeks: RR = 1.42, 95% confidence limits = 1.36, 1.49).
Figure 55: Smoking versus gestation, Queensland 2010 to 2011 (see Table 84)
Cigarette smoking is associated with a significantly higher incidence of birth of babies with birthweight less than 2500 grams, and a lower incidence of birth of babies with birthweight 4000 grams or more—see Figure 56 and Table 85 (2010 to 2011 smoking after 20 weeks gestation versus not smoking after 20 weeks gestation risk ratio for birthweight less than 2500 grams: RR = 1.93, 95% confidence limits = 1.84, 2.02). The birthweight distribution appears similar for women who smoke before 20 weeks and those who continue to smoke after 20 weeks gestation.
Figure 56: Smoking versus birthweight, Queensland 2010 to 2011(refer Table 85)
Smoking in pregnancy, whether before or after 20 weeks gestation, is associated with a more than 50% increase in the risk of perinatal death (see Figure 57 and Table 86). Women who smoke before 20 weeks gestation have a perinatal mortality rate of 14.2 per 1000 births, compared with 9.1 per 1000 births for women who do not smoke before 20 weeks gestation. The risk of perinatal death rises marginally for women who continue to smoke after 20 weeks gestation—14.5 per 1000 births (2010 to 2011 smoking after 20 weeks gestation versus not smoking after 20 weeks gestation risk ratio for perinatal death: RR = 1.57, 95% confidence limits = 1.37, 1.81).

53
Queensland Maternal and Perinatal Quality Council Report 2013
Figure 57: Smoking versus perinatal mortality rates (per 1,000 births), Queensland 2010 to 2011 (see Table 86)
Good practice point
• Smoking cessation programs as part of routine antenatal care reduce fetal exposure to cigarette smoke, low birthweight and preterm birth, and should form part of routine antenatal care23. Specialised programs to assist Indigenous women to stop smoking before and during pregnancy should be prioritised.
2.10.6 Remoteness of residence
The Accessibility/Remoteness Index of Australia (ARIA) is an index of the accessibility of places to service centres, or conversely of remoteness of places24. Geographical areas are given a score (continuous between zero and15) based on the road distance to service towns of different sizes. Scores for regions are derived by averaging scores of 1 km2 grid.
This section examines the relationship between remoteness classes of the primary residence of the mothers and some outcomes. The index scores can be classified into various categories—five remoteness classes are used:
• Highly accessible (ARIA score 0 to <0.20)—relatively unrestricted accessibility to a wide range of goods and services and opportunities for social interaction.
• Accessible (ARIA score 0.20 to <2.40)—some restrictions to accessibility of some goods, services and opportunities for social interaction.
• Moderately accessible (ARIA score 2.40 to <5.95)—significantly restricted accessibility of goods, services and opportunities for social interaction.
• Remote (ARIA score 5.95 to <10.5)—very restricted accessibility of goods, services and opportunities for social interaction.
• Very remote (ARIA score 10.5 to <15)—very little accessibility of goods, services and opportunities for social interaction.
Women living in highly accessible and accessible areas (Class 1 and 2; ARIA score 0 to <2.40) are more likely to give birth at or after 37 weeks gestation (92.3%) than women who live in remote and very remote areas (89.9%) (Class 4 and 5; ARIA score 5.95 to <15) (Figure 58 and Table 87) (2010 to 2011 ARIA class 1 and 2 versus ARIA Class 4 and 5 risk ratio for birth at or after 37 weeks: RR = 1.03, 95% confidence limits = 1.02, 1.04).
23 Lumley J, Chamberlain C, Dowswell T, Oliver S, Oakley L, Watson L. Interventions for promoting smoking cessation during pregnancy. Cochrane Database of Systematic Reviews 2009, Issue 3.
24 http://www.oesr.qld.gov.au/about-statistics/statistical-standards/national/aria.php
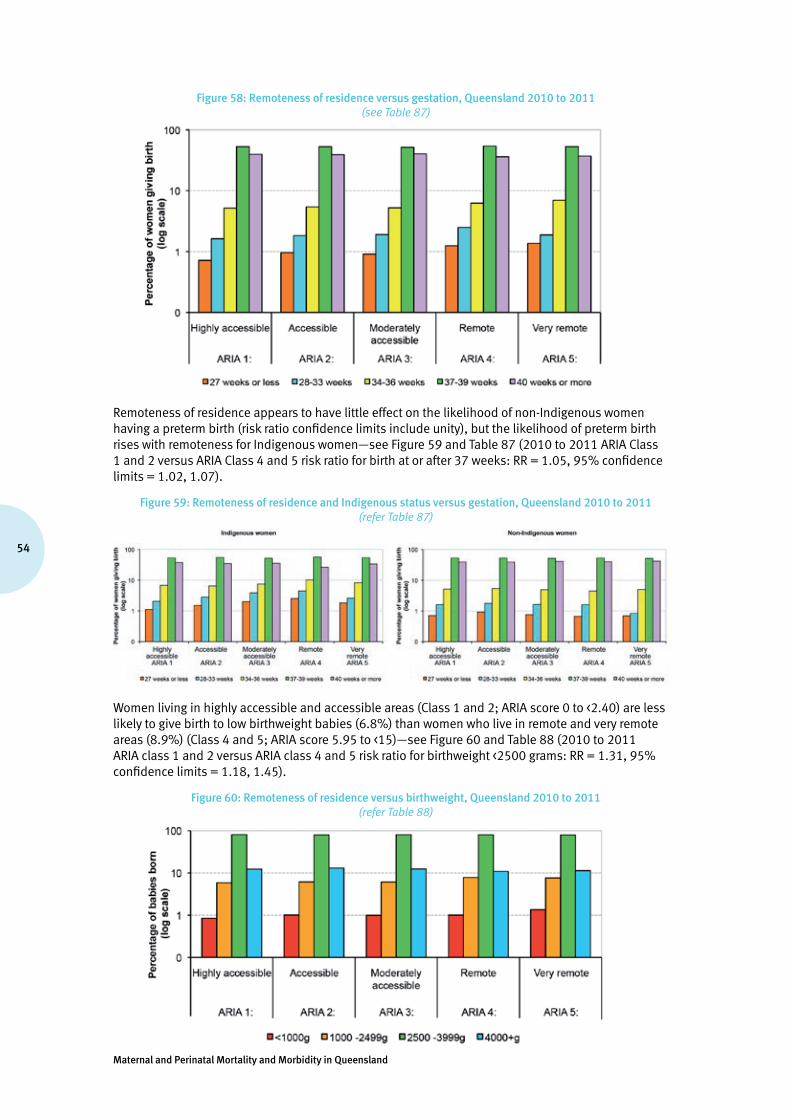
Maternal and Perinatal Mortality and Morbidity in Queensland
54
Figure 58: Remoteness of residence versus gestation, Queensland 2010 to 2011(see Table 87)
Remoteness of residence appears to have little effect on the likelihood of non-Indigenous women having a preterm birth (risk ratio confidence limits include unity), but the likelihood of preterm birth rises with remoteness for Indigenous women—see Figure 59 and Table 87 (2010 to 2011 ARIA Class 1 and 2 versus ARIA Class 4 and 5 risk ratio for birth at or after 37 weeks: RR = 1.05, 95% confidence limits = 1.02, 1.07).
Figure 59: Remoteness of residence and Indigenous status versus gestation, Queensland 2010 to 2011 (refer Table 87)
Women living in highly accessible and accessible areas (Class 1 and 2; ARIA score 0 to <2.40) are less likely to give birth to low birthweight babies (6.8%) than women who live in remote and very remote areas (8.9%) (Class 4 and 5; ARIA score 5.95 to <15)—see Figure 60 and Table 88 (2010 to 2011 ARIA class 1 and 2 versus ARIA class 4 and 5 risk ratio for birthweight <2500 grams: RR = 1.31, 95% confidence limits = 1.18, 1.45).
Figure 60: Remoteness of residence versus birthweight, Queensland 2010 to 2011 (refer Table 88)

55
Queensland Maternal and Perinatal Quality Council Report 2013
The likelihood of low birthweight birth rises with remoteness for Indigenous women—13.6% of Indigenous women who live in remote and very remote areas gave birth to low birthweight babies versus 10% of Indigenous women living in highly accessible and accessible areas—see Figure 61 and Table 88 (2010 to 2011 ARIA Class 1 and 2 versus ARIA Class 4 and 5 risk ratio for Indigenous birthweight <2500 grams: RR = 1.36, 95% confidence limits = 1.16, 1.60). Paradoxically, 5.2% of non-Indigenous women who live in remote and very remote areas gave birth to low birthweight babies versus 6.7% of non-Indigenous women living in highly accessible and accessible areas (2010 to 2011 ARIA Class 1 and 2 versus ARIA Class 4 and 5 risk ratio for non-Indigenous birthweight <2500 grams: RR = 0.78, 95% confidence limits = 0.65, 0.93).
Figure 61: Remoteness of residence and Indigenous status versus birthweight, Queensland 2010 to 2011 (see Table 88)
Overall, women living in highly accessible and accessible areas (Class 1 and 2; ARIA score 0 to <2.40) have similar perinatal mortality rates to women who live in remote and very remote areas (Class 4 and 5; ARIA score 5.95 to <15) 10 per 1000 births versus 10.1 per 1000 births—see Figure 62 and Table 89 (risk ratio confidence limits include unity, and hence the difference is not statistically significant).
Figure 62: Remoteness of residence versus perinatal mortality rates (per 1,000 births), Queensland 2010 to 2011(see Table 89)
The perinatal mortality rate for babies of Indigenous women who live in remote and very remote areas was 16.1 per 1000 births versus 13.8 per 1000 births for babies of Indigenous women living in highly accessible and accessible areas—see Figure 63 and Table 89 (risk ratio confidence limits include unity). On the other hand, babies of non-Indigenous women who live in remote and very remote areas had a lower perinatal mortality rate (5.4 per 1000 births) than babies of non-Indigenous women living in highly accessible and accessible areas (9.9 per 1000 births)—2010 to 2011 ARIA Class 4 and 5 versus ARIA Class 1 and 2 risk ratio for non-Indigenous perinatal death: RR = 0.54, 95% confidence limits = 0.31, 0.96.

Maternal and Perinatal Mortality and Morbidity in Queensland
56
Figure 63: Remoteness of residence and Indigenous status versus perinatal mortality rates (per 1,000 births), Queensland 2010 to 2011
(see Table 89)
2.10.7 Socio-economic disadvantage
SEIFA are summary measures of a number of variables that represent different aspects of relative socio-economic disadvantage and/or advantage in a geographic area25. The SEIFA indexes are created by combining information collected regarding economic and social resources of people and households within an area in the five-yearly Census of Population and Housing. This section examines the index of relative socio-economic advantage and disadvantage in relation to selected outcomes. This SEIFA index ranks different geographic areas of Australia according to a ‘score’ that is created for the area based on characteristics of people, families and dwellings within that area. For the purposes of this report the SEIFA index of relative socio-economic advantage and disadvantage is divided into five percentage-based groups (quintiles), producing a continuum of advantage (high values–quintiles five and four) to disadvantage (low values–quintiles one and two).
Women who were in the more disadvantaged groups (SEIFA quintiles one and two) were more likely to give birth before 37 weeks gestation (8.5%) than women who were in the more advantaged groups (7.2%) (SEIFA quintiles four and five)—see Figure 64 and Table 90 (2010 to 2011 SEIFA quintiles one and two versus SEIFA quintiles four and five risk ratio for birth before 37 weeks: RR = 1.18, 95% confidence limits = 1.13, 1.24).
Figure 64: SEIFA quintile versus gestation, Queensland 2010 to 2011 (see Table 90)
There is little difference in the incidence of preterm birth before 37 weeks gestation between Indigenous women in the more disadvantaged groups (12.6%) and the more advantaged groups (11.2%)—see Figure 65 and Table 91 (risk ratio confidence limits include unity). The likelihood of preterm birth rises with disadvantage for non-Indigenous women (2010 to 2011 SEIFA quintiles one and two versus SEIFA quintiles four and five risk ratio for birth before 37 weeks: RR = 1.12, 95% confidence limits = 1.07, 1.18).
25 Australian Bureau of Statistics “2039.0 Information Paper: An Introduction to Socio-Economic Indexes for Areas (SEIFA), 2006” www.abs.gov.au/ausstats/[email protected]/mf/2039.0
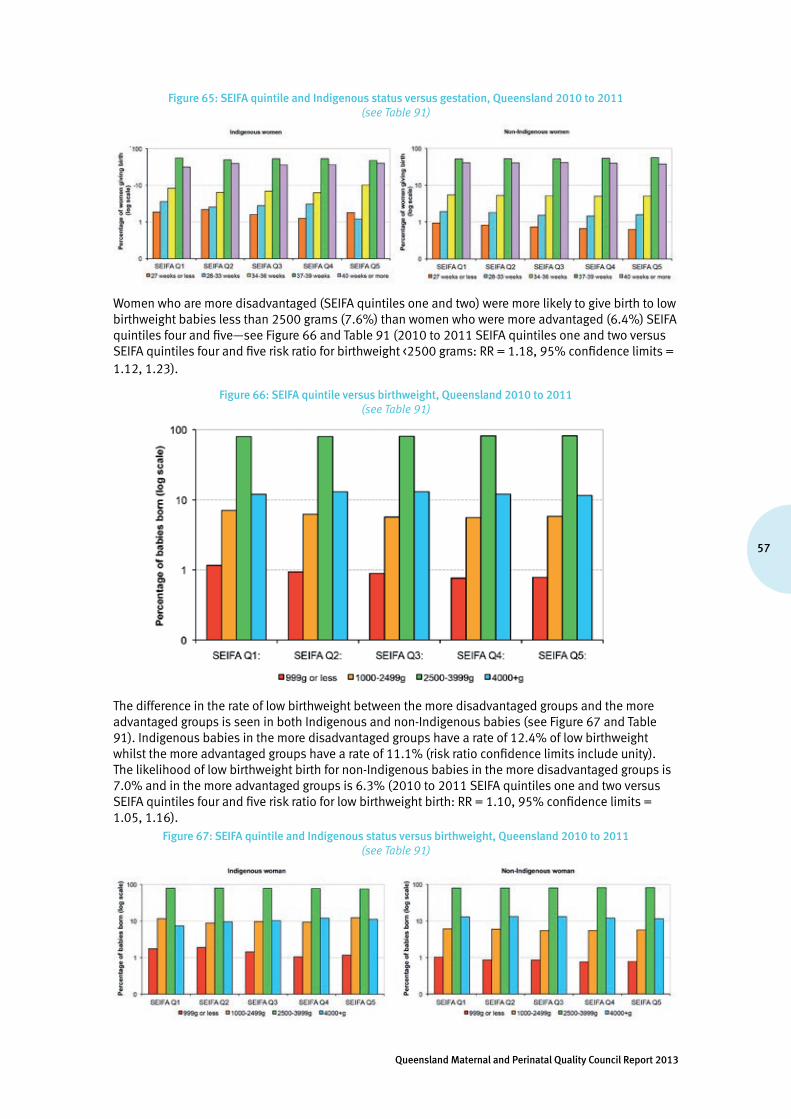
57
Queensland Maternal and Perinatal Quality Council Report 2013
Figure 65: SEIFA quintile and Indigenous status versus gestation, Queensland 2010 to 2011 (see Table 91)
Women who are more disadvantaged (SEIFA quintiles one and two) were more likely to give birth to low birthweight babies less than 2500 grams (7.6%) than women who were more advantaged (6.4%) SEIFA quintiles four and five—see Figure 66 and Table 91 (2010 to 2011 SEIFA quintiles one and two versus SEIFA quintiles four and five risk ratio for birthweight <2500 grams: RR = 1.18, 95% confidence limits = 1.12, 1.23).
Figure 66: SEIFA quintile versus birthweight, Queensland 2010 to 2011(see Table 91)
The difference in the rate of low birthweight between the more disadvantaged groups and the more advantaged groups is seen in both Indigenous and non-Indigenous babies (see Figure 67 and Table 91). Indigenous babies in the more disadvantaged groups have a rate of 12.4% of low birthweight whilst the more advantaged groups have a rate of 11.1% (risk ratio confidence limits include unity). The likelihood of low birthweight birth for non-Indigenous babies in the more disadvantaged groups is 7.0% and in the more advantaged groups is 6.3% (2010 to 2011 SEIFA quintiles one and two versus SEIFA quintiles four and five risk ratio for low birthweight birth: RR = 1.10, 95% confidence limits = 1.05, 1.16).
Figure 67: SEIFA quintile and Indigenous status versus birthweight, Queensland 2010 to 2011 (see Table 91)
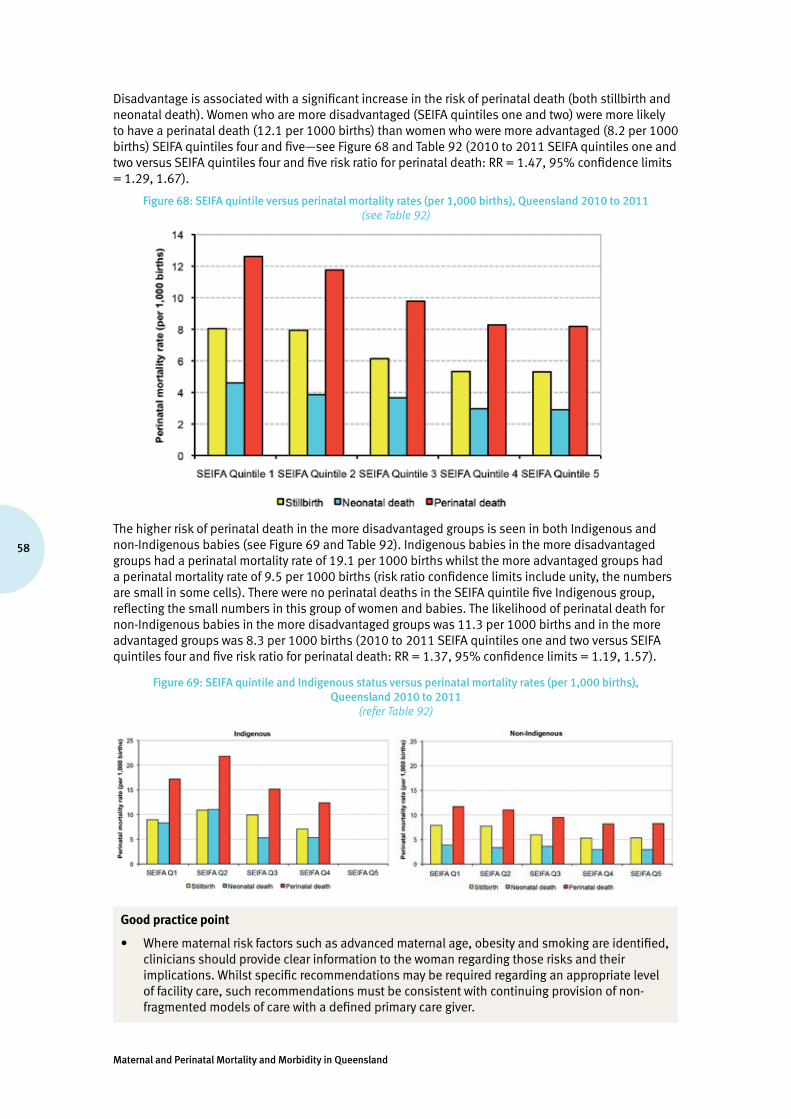
Maternal and Perinatal Mortality and Morbidity in Queensland
58
Disadvantage is associated with a significant increase in the risk of perinatal death (both stillbirth and neonatal death). Women who are more disadvantaged (SEIFA quintiles one and two) were more likely to have a perinatal death (12.1 per 1000 births) than women who were more advantaged (8.2 per 1000 births) SEIFA quintiles four and five—see Figure 68 and Table 92 (2010 to 2011 SEIFA quintiles one and two versus SEIFA quintiles four and five risk ratio for perinatal death: RR = 1.47, 95% confidence limits = 1.29, 1.67).
Figure 68: SEIFA quintile versus perinatal mortality rates (per 1,000 births), Queensland 2010 to 2011 (see Table 92)
The higher risk of perinatal death in the more disadvantaged groups is seen in both Indigenous and non-Indigenous babies (see Figure 69 and Table 92). Indigenous babies in the more disadvantaged groups had a perinatal mortality rate of 19.1 per 1000 births whilst the more advantaged groups had a perinatal mortality rate of 9.5 per 1000 births (risk ratio confidence limits include unity, the numbers are small in some cells). There were no perinatal deaths in the SEIFA quintile five Indigenous group, reflecting the small numbers in this group of women and babies. The likelihood of perinatal death for non-Indigenous babies in the more disadvantaged groups was 11.3 per 1000 births and in the more advantaged groups was 8.3 per 1000 births (2010 to 2011 SEIFA quintiles one and two versus SEIFA quintiles four and five risk ratio for perinatal death: RR = 1.37, 95% confidence limits = 1.19, 1.57).
Figure 69: SEIFA quintile and Indigenous status versus perinatal mortality rates (per 1,000 births), Queensland 2010 to 2011
(refer Table 92)
Good practice point
• Where maternal risk factors such as advanced maternal age, obesity and smoking are identified, clinicians should provide clear information to the woman regarding those risks and their implications. Whilst specific recommendations may be required regarding an appropriate level of facility care, such recommendations must be consistent with continuing provision of non-fragmented models of care with a defined primary care giver.
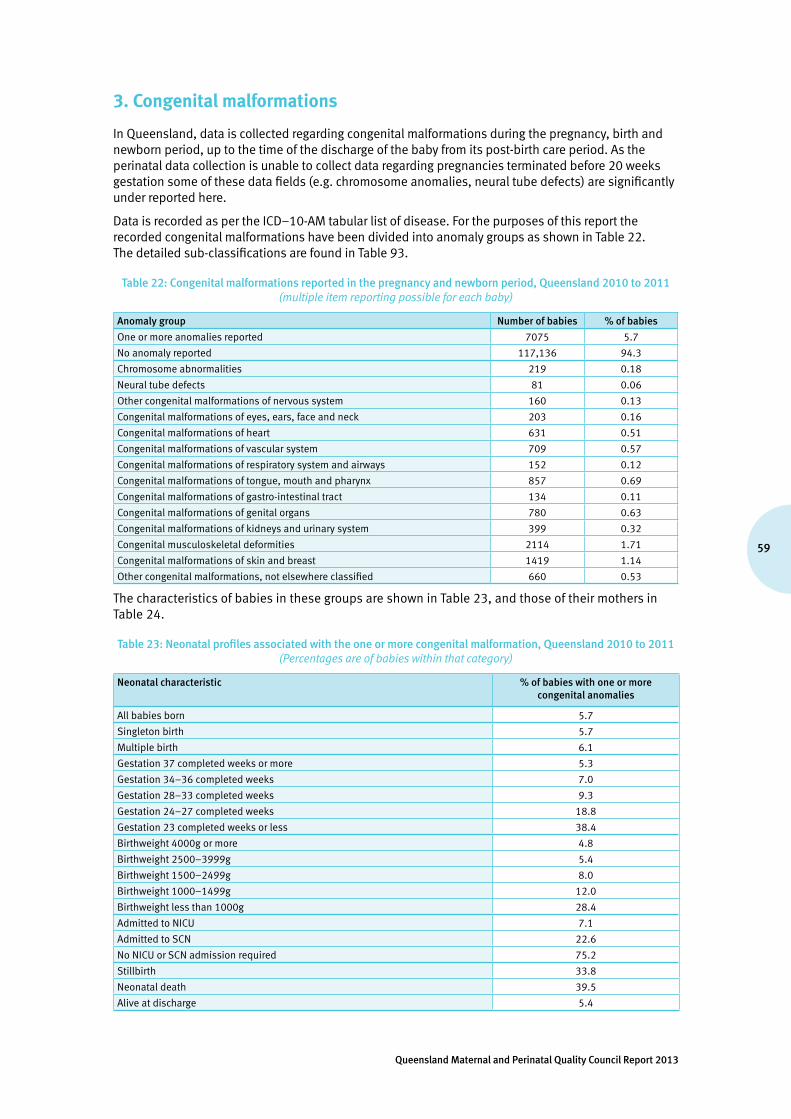
59
Queensland Maternal and Perinatal Quality Council Report 2013
3. Congenital malformations
In Queensland, data is collected regarding congenital malformations during the pregnancy, birth and newborn period, up to the time of the discharge of the baby from its post-birth care period. As the perinatal data collection is unable to collect data regarding pregnancies terminated before 20 weeks gestation some of these data fields (e.g. chromosome anomalies, neural tube defects) are significantly under reported here.
Data is recorded as per the ICD–10-AM tabular list of disease. For the purposes of this report the recorded congenital malformations have been divided into anomaly groups as shown in Table 22. The detailed sub-classifications are found in Table 93.
Table 22: Congenital malformations reported in the pregnancy and newborn period, Queensland 2010 to 2011(multiple item reporting possible for each baby)
Anomaly group Number of babies % of babies
One or more anomalies reported 7075 5.7
No anomaly reported 117,136 94.3
Chromosome abnormalities 219 0.18
Neural tube defects 81 0.06
Other congenital malformations of nervous system 160 0.13
Congenital malformations of eyes, ears, face and neck 203 0.16
Congenital malformations of heart 631 0.51
Congenital malformations of vascular system 709 0.57
Congenital malformations of respiratory system and airways 152 0.12
Congenital malformations of tongue, mouth and pharynx 857 0.69
Congenital malformations of gastro-intestinal tract 134 0.11
Congenital malformations of genital organs 780 0.63
Congenital malformations of kidneys and urinary system 399 0.32
Congenital musculoskeletal deformities 2114 1.71
Congenital malformations of skin and breast 1419 1.14
Other congenital malformations, not elsewhere classified 660 0.53
The characteristics of babies in these groups are shown in Table 23, and those of their mothers in Table 24.
Table 23: Neonatal profiles associated with the one or more congenital malformation, Queensland 2010 to 2011(Percentages are of babies within that category)
Neonatal characteristic % of babies with one or more congenital anomalies
All babies born 5.7
Singleton birth 5.7
Multiple birth 6.1
Gestation 37 completed weeks or more 5.3
Gestation 34–36 completed weeks 7.0
Gestation 28–33 completed weeks 9.3
Gestation 24–27 completed weeks 18.8
Gestation 23 completed weeks or less 38.4
Birthweight 4000g or more 4.8
Birthweight 2500–3999g 5.4
Birthweight 1500–2499g 8.0
Birthweight 1000–1499g 12.0
Birthweight less than 1000g 28.4
Admitted to NICU 7.1
Admitted to SCN 22.6
No NICU or SCN admission required 75.2
Stillbirth 33.8
Neonatal death 39.5
Alive at discharge 5.4

Maternal and Perinatal Mortality and Morbidity in Queensland
60
Table 24: Maternal profiles associated with the birth of babies with one or more congenital malformation, Queensland 2010 to 2011
Maternal characteristic % of babies of women with this maternal characteristic having one or more congenital anomalies
Maternal age <20 6.0
Maternal age 20–34 5.7
Maternal age 35 or more 5.6
Indigenous mother 4.8
Non-Indigenous mother 5.7
Pregnancy conceived via assisted conception 4.7
Pregnancy conceived without assisted conception 5.7
Maternal BMI <18.5 5.5
Maternal BMI 18.5–24.9 5.4
Maternal BMI 25–29.9 5.6
Maternal BMI 30 or more 6.0
Maternal smoking during pregnancy 5.7
No maternal smoking during pregnancy 5.7
Maternal ARIA score highly accessible (0 to <0.20) 7.0
Maternal ARIA score accessible (0.20 to <2.40) 3.8
Maternal ARIA score moderately accessible (2.40 to <5.95) 3.6
Maternal ARIA score remote (5.95 to <10.5) 3.5
Maternal ARIA score very remote (10.5 to <15) 3.0
SEIFA 1st quintile 6.4
SEIFA 2nd quintile 4.7
SEIFA 3rd quintile 5.9
SEIFA 4th quintile 5.4
SEIFA 5th quintile 6.8
Percentages are of mothers within that categorySEIFA quintiles: 1 = Lowest socioeconomic status, 5 = Highest socioeconomic status
Review of the data in Tables 23 and 24 indicates that:
• babies born to Indigenous mothers appear to have a lower incidence of congenital anomaly than babies born to non-Indigenous mothers—the reasons for differences between the two groups of babies appears complex and beyond the scope of this report to answer (2010 to 2011 the Indigenous babies versus non-Indigenous babies risk ratio for one or more congenital anomalies: RR = 0.83, 95% confidence limits = 0.75, 0.93)
• babies born to women with a high BMI has a significantly increased rate of congenital anomaly (2010 to 2011 babies born to mothers with BMI >30 versus babies born to mothers with BMI <30 risk ratio for one or more congenital anomalies: RR = 1.10, 95% confidence limits = 1.04, 1.16)
• babies born after ovulation induction and/or extracorporeal assisted conception had a lower incidence of congenital anomaly than babies born from ‘natural conceptions’, whereas artificial insemination appeared to be associated with an increased incidence of congenital anomaly (2010 to 2011 babies from assisted conception pregnancy versus babies from pregnancy conceived without assisted conception risk ratio for one or more congenital anomalies: incidence of one or more anomaly without assisted conception 5.7%, with ovulation induction 4.2%, with extracorporeal techniques 4.9% and with AID/AIH 7.2%. For all assisted conception versus no assisted conception RR = 0.82, 95% confidence limits = 0.72, 0.91)
• there is no significant difference in the incidence of congenital anomalies between babies born in singleton and in multiple pregnancies (2010 to 2011 babies from multiple birth versus from babies from singleton birth risk ratio for one or more congenital anomalies: RR = 1.08, 95% confidence limits = 0.96, 1.22)
• babies born in 2010 and 2011 to mothers living in highly accessible areas (ARIA score 0 to <0.20) appeared to have a higher risk of congenital anomaly compared with all other babies (babies from ARIA score 0 to <0.20 versus all other babies risk ratio for one or more congenital anomalies: RR = 1.90, 95% confidence limits = 1.80, 2.00).

61
Queensland Maternal and Perinatal Quality Council Report 2013
However, using the broader categorisation of congenital anomalies used by the NPESU of AIHW26, reanalysis of the data (not shown here) reveals that:• the RR for congenital anomalies (CA) in Indigenous versus non-Indigenous is 1.12 (95% confidence
limits 0.88-1.44) which suggests a slightly higher rate (though non-significant) of CAs for births to Indigenous mothers
• the RR for most disadvantaged SEIFA quintile relative to the most advantaged is 1.40 (95% confidence limits 1.14–1.71) which suggests a higher rate of CAs for births to women in the most disadvantaged quintile
• the rate of CAs to births for women in highly accessible locations is no longer higher than for other locations.
The difference in the results of these two approaches is likely related to detection or reporting rates differing between tertiary and non-tertiary hospitals particularly for minor congenital anomalies and also possibly movement of women with higher risk births to give birth in metropolitan areas.
3.1 Sentinel congenital heart disease in Queensland, 2007 to 2011
Congenital heart disease (CHD) is one of the most common congenital abnormalities in neonates with moderate or severe anomalies and has been reported in approximately 6 per 1000 live births27. The detection of severe congenital cardiac lesions using fetal echocardiography on antenatal screening was first reported in 198628. Routine screening on mid-trimester scan for significant fetal cardiac lesions has been widely practiced in Queensland from the late 1990s. Early detection of major congenital heart lesions allows a planned delivery in a tertiary perinatal centre as recommended in recent CHD cohort outcome studies29.
This report examines known cases of four sentinel cardiac anomalies during the birth admission of infants delivered in Queensland from July 2007 to June 2011: • Hypoplastic left heart syndrome (HLHS)• Pulmonary atresia (PA)• Transposition of the great arteries (TGA)• Tetralogy of Fallot (ToF).
During this period, there were 259 births with at least one of these congenital lesions of whom 236 were livebirths and 29 stillbirths (11.2%). Although tertiary delivery is recommended in infants born with these lesions, 146 were delivered in a tertiary neonatal nursery and 113 (43.6%) were born in a non-tertiary nursery. The initial admission of each infant was examined using Queensland Perinatal Data Collection (QPDC) and Queensland Hospital Admitted Patient Data Collection (QHAPDC) for reporting of the sentinel cardiac lesion as an indication of early ascertainment of significant cardiac anomaly (see Table 25). Birth admission data showed that between 13.9% (HLHS) and 27.4% (ToF) of infants with these major cardiac anomalies were not known or recorded on their birth admission. An improvement in antenatal detection rates for these significant CHD lesions and planned delivery in a tertiary neonatal nursery would be important in this high risk cohort of infants.
An amendment to the QPDC form since July 2011 has included antenatal scan results to improve ascertainment of fetal detection rates. Improved statewide notification of fetal anomaly in termination of pregnancy would also allow more precise fetal detection rates to be followed.
Table 25: Infants with sentinel cardiac anomalies born in Queensland July 2007 to June 2011 by initial admission cardiac diagnosis
Cases n
Cases reported at birth admission
% reported at birth admission % not reported at birth admission
HLHS 62 54 87.1 13.9
PA 40 30 75.0 25.0
TGA 73 42 84.9 15.1
TOF 84 61 72.6 27.4
26 Abeywardana S & Sullivan E. (2008.) Congenital anomalies in Australia 2002–2003. Birth anomalies series no. 3 Cat no. PER 41. Sydney: AIHW National Perinatal Statistics Unit
27 Hoffman J, Kaplan S. The incidence of congenital heart disease. J American College of Cardiology 2002;39:1890-190028 Fermon L, De Geeter B, Aubry MC, et al. A close collaboration between obstetrician and cardiologist allows antenatal detection
of severe cardiac malformations by 2D echocardiography (abstract). Proceedings of the Second World Congress of Paediatric Cardiology. New York, 1986:10
29 Anagnostou K, Messenger L, Yates R, Kelsall W. Outcome of infants with prenatally diagnosed congenital heart disease delivered outside specialist paediatric cardiac centres. Arch Dis Child Fetal Neonatal Ed 2012:F1-F4, doi:10.1136/archdischild-2011-300488
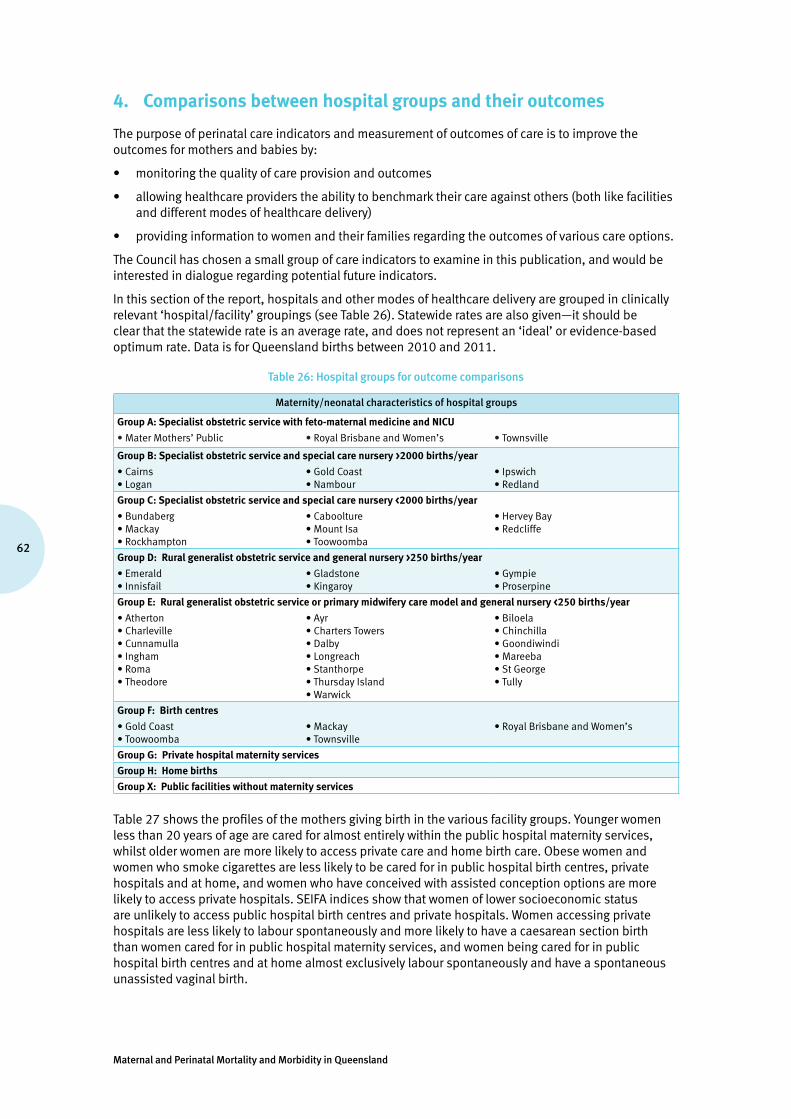
Maternal and Perinatal Mortality and Morbidity in Queensland
62
4. Comparisons between hospital groups and their outcomes
The purpose of perinatal care indicators and measurement of outcomes of care is to improve the outcomes for mothers and babies by:
• monitoring the quality of care provision and outcomes
• allowing healthcare providers the ability to benchmark their care against others (both like facilities and different modes of healthcare delivery)
• providing information to women and their families regarding the outcomes of various care options.
The Council has chosen a small group of care indicators to examine in this publication, and would be interested in dialogue regarding potential future indicators.
In this section of the report, hospitals and other modes of healthcare delivery are grouped in clinically relevant ‘hospital/facility’ groupings (see Table 26). Statewide rates are also given—it should be clear that the statewide rate is an average rate, and does not represent an ‘ideal’ or evidence-based optimum rate. Data is for Queensland births between 2010 and 2011.
Table 26: Hospital groups for outcome comparisons
Maternity/neonatal characteristics of hospital groups
Group A: Specialist obstetric service with feto-maternal medicine and NICU
•Mater Mothers’ Public •Royal Brisbane and Women’s •Townsville
Group B: Specialist obstetric service and special care nursery >2000 births/year
•Cairns•Logan
•GoldCoast•Nambour
•Ipswich•Redland
Group C: Specialist obstetric service and special care nursery <2000 births/year
•Bundaberg•Mackay•Rockhampton
•Caboolture•MountIsa•Toowoomba
•HerveyBay•Redcliffe
Group D: Rural generalist obstetric service and general nursery >250 births/year
•Emerald•Innisfail
•Gladstone•Kingaroy
•Gympie•Proserpine
Group E: Rural generalist obstetric service or primary midwifery care model and general nursery <250 births/year
•Atherton•Charleville•Cunnamulla•Ingham•Roma•Theodore
•Ayr•ChartersTowers•Dalby•Longreach•Stanthorpe•ThursdayIsland•Warwick
•Biloela•Chinchilla•Goondiwindi•Mareeba•StGeorge•Tully
Group F: Birth centres
•GoldCoast•Toowoomba
•Mackay•Townsville
•RoyalBrisbaneandWomen’s
Group G: Private hospital maternity services
Group H: Home births
Group X: Public facilities without maternity services
Table 27 shows the profiles of the mothers giving birth in the various facility groups. Younger women less than 20 years of age are cared for almost entirely within the public hospital maternity services, whilst older women are more likely to access private care and home birth care. Obese women and women who smoke cigarettes are less likely to be cared for in public hospital birth centres, private hospitals and at home, and women who have conceived with assisted conception options are more likely to access private hospitals. SEIFA indices show that women of lower socioeconomic status are unlikely to access public hospital birth centres and private hospitals. Women accessing private hospitals are less likely to labour spontaneously and more likely to have a caesarean section birth than women cared for in public hospital maternity services, and women being cared for in public hospital birth centres and at home almost exclusively labour spontaneously and have a spontaneous unassisted vaginal birth.

63
Queensland Maternal and Perinatal Quality Council Report 2013
Table 27: Maternal profiles by hospital group (%), Queensland 2010 to 2011
Maternal profiles
Facility group
A B C D E F G H X Total
Spe
cial
ist o
bste
tric
s, fe
to-
mat
erna
l med
icin
e, n
eona
tal
inte
nsiv
e ca
re u
nit
Spe
cial
ist o
bste
tric
s, s
peci
al
care
nur
sery
, >2
000
birt
hs/y
ear
Spe
cial
ist o
bste
tric
s, s
peci
al
care
nur
sery
, <20
00 b
irth
s/ye
ar
Non
-spe
cial
ist o
bste
tric
s,
gene
ralis
t neo
nata
l car
e, >
250
birt
hs/y
ear
Non
-spe
cial
ist o
bste
tric
s,
gene
ralis
t neo
nata
l car
e, <
250
birt
hs/y
ear
Bir
th c
entr
es
Priv
ate
hosp
ital
mat
erni
ty a
nd
new
born
ser
vice
s
Hom
e bi
rths
Publ
ic fa
cilit
ies
wit
hout
m
ater
nity
ser
vice
s
Number of women 22,355 32,594 21,085 4,458 3,568 1,516 36,268 153 153 122,150
Maternal age
Less than 20 years 5.4 7.3 9.0 8.3 11.8 1.0 0.4 0.7 17.0 5.3
20–34 years 76.3 76.8 77.6 78.5 76.1 81.4 69.6 62.7 73.2 74.8
35 or more years 18.4 15.9 13.4 13.2 12.0 17.6 30.0 36.6 9.8 19.9
Maternal BMI
Underweight (<18.5 kg/m2) 6.2 4.5 4.4 4.7 4.6 4.0 4.5 5.2 5.2 4.8
Normal (18.5–24.9 kg/m2) 45.6 41.2 38.4 42.3 41.9 58.8 54.0 56.9 41.2 45.6
Overweight (25–29.9 kg/m2) 24.2 27.0 27.5 29.4 28.8 25.3 26.2 18.3 17.6 26.4
Obese (30 or more kg/m2) 19.3 24.8 28.2 23.3 23.6 9.8 14.6 9.2 13.1 21.0
Indigenous status
Indigenous 6.1 7.8 8.7 9.6 21.2 1.8 0.4 0 43.1 5.9
Non-Indigenous 93.9 92.2 91.3 90.4 78.8 98.2 99.6 100 56.9 94.1
Smoking
Smoking before 20 weeks 14.2 24.1 27.9 27.3 32.0 5.7 2.1 0.7 56.2 16.6
Smoking after 20 weeks 11.5 19.5 23.8 23.5 27.3 3.4 1.5 0.7 48.4 13.6
Past births*
One or more previous births 53.8 61.1 63.4 64.3 66.6 66.6 56.0 81.7 81.7 59.1
No previous caesarean birth 83.9 84.9 83.8 87.2 89.2 100.0 75.9 84.3 95.4 82.3
One or more previous caesareans
16.1 15.1 16.2 12.8 10.8 0.0 24.1 15.7 4.6 17.7
No previous births 46.2 38.9 36.6 35.7 33.4 33.4 44.0 18.3 18.3 40.9
Assisted conception
Ovulation induction (+ AIH/AID)**
0.6 0.4 0.4 0.3 0.2 0.3 2.5 0.0 0.0 1.1
AIH/AID 0.3 0.1 0.1 0.0 0.0 0.2 0.8 0.0 0.0 0.3
IVF/GIFT/ICSI*** 1.5 0.8 1.0 0.7 0.7 0.9 7.9 1.3 0.0 3.1
Maternal SEIFA index****
Quintile 1 9.2 16.4 23.7 35.2 26.6 2.5 3.8 9.8 59.5 13.5
Quintile 2 14.4 23.3 36.6 22.1 65.2 14.4 15.0 16.3 13.7 22.6
Quintile 3 26.0 28.8 26.5 39.4 5.5 37.5 25.7 28.1 17.0 26.8
Quintile 4 25.3 26.9 9.6 2.0 0.6 24.0 28.4 26.1 3.3 22.3
Quintile 5 24.6 4.3 3.3 0.0 0.0 21.4 24.9 19.0 0.0 13.9
* Births = livebirth or stillbirth **AIH/AID = Artificial insemination by husband/donor
***IVF = Invitrofertilisation, GIFT =Gamete Intra-Fallopian Transfer, ICSI = Intracytoplasmic sperm injection **** SEIFA index of relative socio-economic advantage and disadvantage index quintiles:
1 = lowest socioeconomic status, 5 = highest socioeconomic status

Maternal and Perinatal Mortality and Morbidity in Queensland
64
Table 27: Maternal profiles by hospital group (%), Queensland 2010 to 2011 (continued)
Maternal profiles
Facility group
A B C D E F G H X Total
Spe
cial
ist o
bste
tric
s, fe
to-
mat
erna
l med
icin
e, n
eona
tal
inte
nsiv
e ca
re u
nit
Spe
cial
ist o
bste
tric
s, s
peci
al c
are
nurs
ery,
>20
00 b
irth
s/ye
ar
Spe
cial
ist o
bste
tric
s, s
peci
al c
are
nurs
ery,
<2,
000
birt
hs/y
ear
Non
-spe
cial
ist o
bste
tric
s,
gene
ralis
t neo
nata
l car
e, >
250
birt
hs/y
ear
Non
-spe
cial
ist o
bste
tric
s,
gene
ralis
t neo
nata
l car
e, <
250
birt
hs/y
ear
Bir
th c
entr
es
Priv
ate
hosp
ital
mat
erni
ty a
nd
new
born
ser
vice
s
Hom
e bi
rths
Publ
ic fa
cilit
ies
wit
hout
mat
erni
ty
serv
ices
Complications of pregnancy
Antepartum haemorrhage 4.6 2.0 2.5 1.0 0.6 1.8 2.2 0.7 1.3 2.6
Pre-eclampsia/PIH***** 5.3 4.1 5.0 3.3 3.4 0.2 5.1 0.7 1.3 4.7
Gestational diabetes 6.1 7.4 7.0 4.7 3.4 2.0 4.8 0.7 2.6 6.0
Multiple gestation 2.4 1.2 1.1 0.4 0.2 0.0 2.2 0.0 0.0 1.6
Onset of labour
Spontaneous 60.1 65.1 61.2 68.8 73.7 99.5 39.0 100.0 100.0 56.6
Induced 22.5 21.1 23.2 18.5 16.1 0.5 26.3 0.0 0.0 22.7
No labour 17.4 13.8 15.6 12.7 10.2 0.0 34.7 0.0 0.0 20.6
Method of birth
Spontaneous vaginal birth 56.4 66.0 65.0 70.0 73.9 99.9 40.3 100.0 100.0 57.3
Vacuum extraction birth 9.1 6.7 6.3 5.7 5.8 0.1 9.5 0.0 0.0 7.8
Forceps birth 1.7 1.6 1.4 1.0 0.5 0.0 2.8 0.0 0.0 1.9
Elective caesarean section 17.4 13.8 15.6 12.7 10.2 0.0 34.7 0.0 0.0 20.6
Emergency caesarean section 15.4 11.8 11.7 10.5 9.6 0.0 12.6 0.0 0.0 12.4
All caesarean section 32.8 25.6 27.3 23.3 19.8 0.0 47.4 0.0 0.0 33.0
Regional analgesia during labour
Epidural, combined epidural/spinal, spinal or caudal
50.1 38.5 40.2 27.6 23.9 0.2 67.4 0.0 0.0 48.1
Complications of labour and birth
Cord prolapse 0.3 0.1 0.1 0.2 0.1 0.0 0.1 0.0 0.0 0.1
Fetal distress 3.1 8.5 5.3 3.3 3.6 0.3 4.8 0.7 0.0 5.4
Manual removal of placenta 1.4 1.3 1.4 1.2 1.5 1.3 0.9 0.0 3.9 1.2
Post-partum haemorrhage 9.5 7.2 6.0 6.8 6.1 5.7 2.4 13.7 11.8 6.0
Perineal status ******
Intact or grazes only 59.9 57.7 60.0 56.6 62.1 47.1 63.1 54.9 71.9 60.0
1st or 2nd degree tear 29.0 34.9 31.0 36.2 31.7 49.1 24.7 42.5 21.6 30.2
3rd or 4th degree tear 1.9 2.0 1.6 1.8 1.8 2.4 0.7 2.6 0.7 1.5
Episiotomy 9.2 5.5 7.4 5.3 4.3 1.4 11.5 0.0 3.3 8.2
**** SEIFA index of relative socio-economic advantage and disadvantage index quintiles: 1 = lowest socioeconomic status, 5 = highest socioeconomic status , ***** PIH = pregnancy-induced hypertension
*****IVF = Invitrofertilisation, GIFT =Gamete Intra-Fallopian Transfer, ICSI = Intracytoplasmic sperm injection

65
Queensland Maternal and Perinatal Quality Council Report 2013
Table 28 shows profiles of the babies born in the facility groups. As expected by the complexity of care of many of the mothers and babies born in the Group A public hospitals, which not only provide specialist obstetric care but also the sub-specialty of feto-maternal medicine and the specialty of neonatal intensive care unit, are more likely to be preterm, of low birthweight, in poor condition at birth as measured by Apgar scores, to be admitted to specialised nursery care, and to die in the perinatal period.
A significant proportion of the 152 women (25.7%) who gave birth in public hospitals which did not have established maternity services, presented there in preterm labour and had babies that were more likely to be low birthweight, be in poor condition at birth, and to die in the perinatal period. Support for such facilities when faced with these unusual circumstances is vital to these mothers and babies. Other women present nearer to term and anecdotal evidence is that this is, at times, related to a lack of understanding by local communities of the inability of such facilities to provide effective care after a birthing service has closed.
Recommendation
• That the Department of Health ensures that no further rural maternity services close, and actively seeks to open/re-open rural maternity services where possible.
Table 28: Baby profiles by hospital group (%), Queensland 2010 to 2011
Baby profiles
Facility group
A B C D E F G H X Total
Spe
cial
ist o
bste
tric
s,
feto
-mat
erna
l med
icin
e,
neon
atal
inte
nsiv
e ca
re u
nit
Spe
cial
ist o
bste
tric
s,
Spe
cial
car
e nu
rser
y,
>200
0 bi
rths
/yea
r
Spe
cial
ist o
bste
tric
s,
Spe
cial
car
e nu
rser
y, <
2000
bi
rths
/yea
r
Non
-spe
cial
ist o
bste
tric
s,
gene
ralis
t neo
nata
l car
e,
>250
bir
ths/
year
Non
-spe
cial
ist o
bste
tric
s,
gene
ralis
t neo
nata
l car
e,
<250
bir
ths/
year
Bir
th c
entr
es
Priv
ate
hosp
ital
mat
erni
ty
and
new
born
ser
vice
s
Hom
e bi
rths
Publ
ic fa
cilit
ies
wit
hout
m
ater
nity
ser
vice
sNumber of babies 22,916 32,991 21,330 4203 3848 1516 37,101 154 152 124,211
Gestational age
Less than 28 weeks 2.2 0.6 0.8 0.3 0.5 0.0 0.5 0.0 6.6 0.9
28–33 weeks 4.8 1.4 1.4 0.7 0.6 0.0 1.5 0.0 4.6 2.0
34–36 weeks 6.6 5.4 5.9 3.3 2.9 0.1 6.4 1.3 14.5 5.8
37–39 weeks 45.1 49.8 50.4 46.9 48.1 41.5 62.1 37.0 44.1 52.4
40 or more weeks 41.2 42.7 41.6 48.8 48.1 58.4 29.5 61.7 26.3 38.9
Birthweight
Less than 1500g 4.3 1.0 1.0 0.5 0.6 0.0 1.0 0.0 9.2 1.6
1500–2499g 7.5 5.2 5.5 2.8 2.9 0.3 4.8 0.6 10.5 5.4
2500–3999g 75.9 80.8 80.2 82.4 83.0 82.0 83.3 68.8 75.0 80.6
4000g or more 12.3 13.0 13.3 14.3 13.5 17.7 10.8 29.9 3.9 12.4
Birth status
Born alive and discharged alive
98.1 99.0 99.0 99.5 99.4 100.0 99.4 100.0 92.8 99.0
Stillborn 1.08 0.63 0.79 0.31 0.36 0.00 0.42 0.00 5.92 0.66
Born alive / died before discharge
0.80 0.35 0.24 0.24 0.26 0.00 0.21 0.00 1.32 0.36

Maternal and Perinatal Mortality and Morbidity in Queensland
66
Table 28: Baby profiles by hospital group (%), Queensland 2010 to 2011
Baby profiles
Facility group
A B C D E F G H X Total
Spe
cial
ist o
bste
tric
s, fe
to-
mat
erna
l med
icin
e, n
eona
tal
inte
nsiv
e ca
re u
nit
Spe
cial
ist o
bste
tric
s, S
peci
al
care
nur
sery
, >2
000
birt
hs/y
ear
Spe
cial
ist o
bste
tric
s, S
peci
al
care
nur
sery
, <20
00 b
irth
s/ye
ar
Non
-spe
cial
ist o
bste
tric
s,
gene
ralis
t neo
nata
l car
e,
>250
bir
ths/
year
Non
-spe
cial
ist o
bste
tric
s,
gene
ralis
t neo
nata
l car
e, <
250
birt
hs/y
ear
Bir
th c
entr
es
Priv
ate
hosp
ital
mat
erni
ty a
nd
new
born
ser
vice
s
Hom
e bi
rths
Publ
ic fa
cilit
ies
wit
hout
m
ater
nity
ser
vice
s
5–minute Apgar score
0–6 12.7 8.4 10.0 7.2 7.8 2.7 7.5 7.1 17.1 9.1
7 or more 86.9 91.6 90.0 92.8 92.0 97.3 92.5 92.9 79.6 90.8
Congenital anomaly*
Present 10.6 5.5 6.5 3.7 2.4 6.5 2.9 3.2 3.9 5.7
Admission to a neonatal intensive care unit
Yes 9.98 0.20 0.00 0.00 0.00 0.00 1.47 0.00 0.00 2.33
Admission to a special care baby unit
Yes 22.05 19.24 20.43 0.00 0.00 0.00 11.90 0.00 0.66 16.24
Admission to a neonatal intensive care unit and/or a special care baby unit
Yes 23.68 19.27 20.43 0.00 0.00 0.00 12.16 0.00 0.66 16.63
* Diagnosed during ‘birth admission’
Figures 70 to 76, and Table 94 show seven perinatal care indicators designed to assess the outcomes of maternity and newborn care. The indicators shown in Figures 70, 71 and 75 examine women defined as ‘selected primigravidae’; these are women whose age is between 20 and 34 years, who have not had previous births, who have a singleton birth in current pregnancy, who gave birth between 37 weeks + 0 days to 40 weeks + 6 days completed weeks of gestation, and whose baby presented in a standard head first flexed manner (cephalic/vertex presentation at birth). These standardised outcomes tend to allow for more valid comparisons across care groups.
Figure 70 shows the proportion of selected primigravidae having a caesarean section birth. The state average caesarean section rate for this group of women is 27.5%, with public facilities varying between 19.3% and 23.9%, and private facilities 39.4%. Group A public facilities have a higher caesarean section rate than the other public facilities, in line with the greater complexity of care required for a number of the women they care for. Selected primigravidae being cared for in private facilities are almost twice as likely to have a caesarean section birth as those in public hospitals (RR = 1.86, 95% confidence limits 1.79, 1.93).
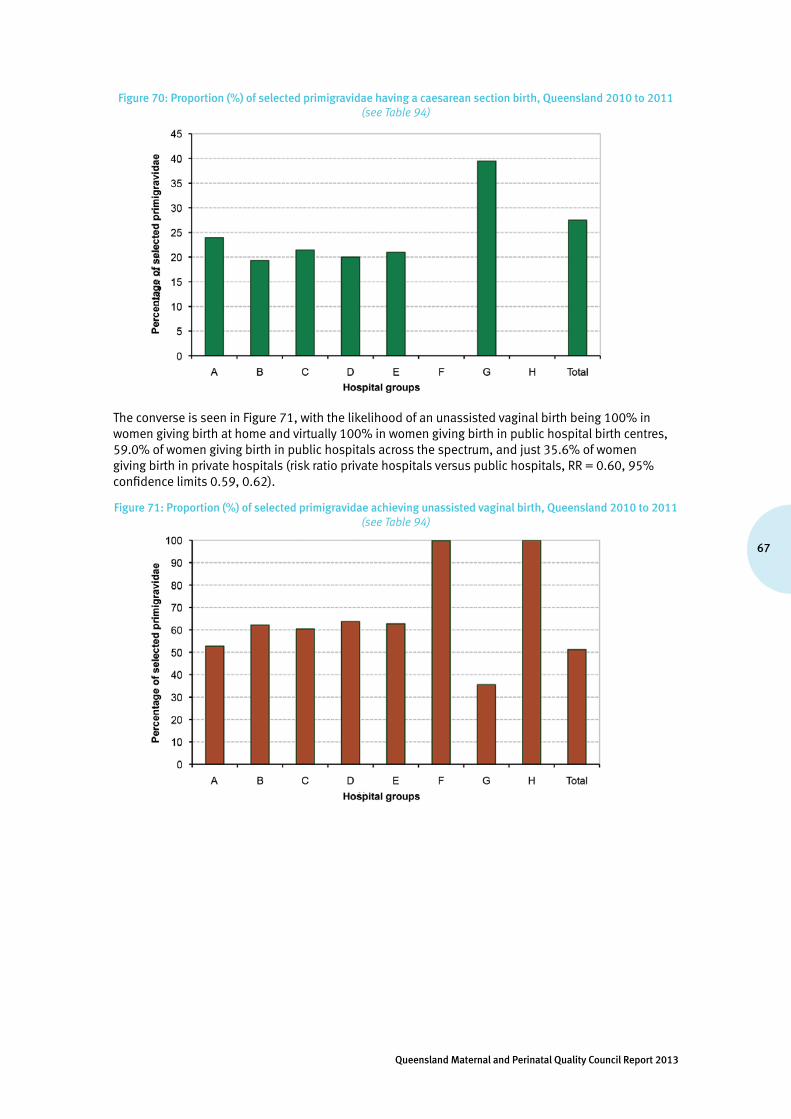
67
Queensland Maternal and Perinatal Quality Council Report 2013
Figure 70: Proportion (%) of selected primigravidae having a caesarean section birth, Queensland 2010 to 2011(see Table 94)
The converse is seen in Figure 71, with the likelihood of an unassisted vaginal birth being 100% in women giving birth at home and virtually 100% in women giving birth in public hospital birth centres, 59.0% of women giving birth in public hospitals across the spectrum, and just 35.6% of women giving birth in private hospitals (risk ratio private hospitals versus public hospitals, RR = 0.60, 95% confidence limits 0.59, 0.62).
Figure 71: Proportion (%) of selected primigravidae achieving unassisted vaginal birth, Queensland 2010 to 2011(see Table 94)
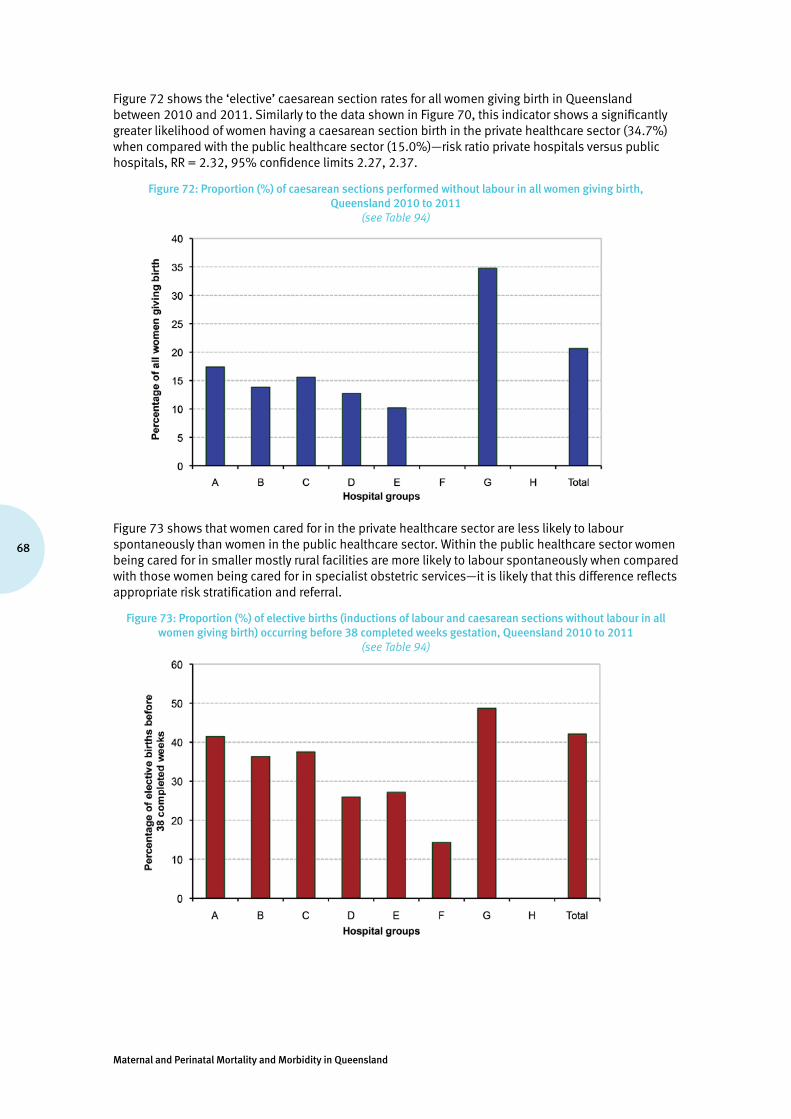
Maternal and Perinatal Mortality and Morbidity in Queensland
68
Figure 72 shows the ‘elective’ caesarean section rates for all women giving birth in Queensland between 2010 and 2011. Similarly to the data shown in Figure 70, this indicator shows a significantly greater likelihood of women having a caesarean section birth in the private healthcare sector (34.7%) when compared with the public healthcare sector (15.0%)—risk ratio private hospitals versus public hospitals, RR = 2.32, 95% confidence limits 2.27, 2.37.
Figure 72: Proportion (%) of caesarean sections performed without labour in all women giving birth, Queensland 2010 to 2011
(see Table 94)
Figure 73 shows that women cared for in the private healthcare sector are less likely to labour spontaneously than women in the public healthcare sector. Within the public healthcare sector women being cared for in smaller mostly rural facilities are more likely to labour spontaneously when compared with those women being cared for in specialist obstetric services—it is likely that this difference reflects appropriate risk stratification and referral.
Figure 73: Proportion (%) of elective births (inductions of labour and caesarean sections without labour in all women giving birth) occurring before 38 completed weeks gestation, Queensland 2010 to 2011
(see Table 94)
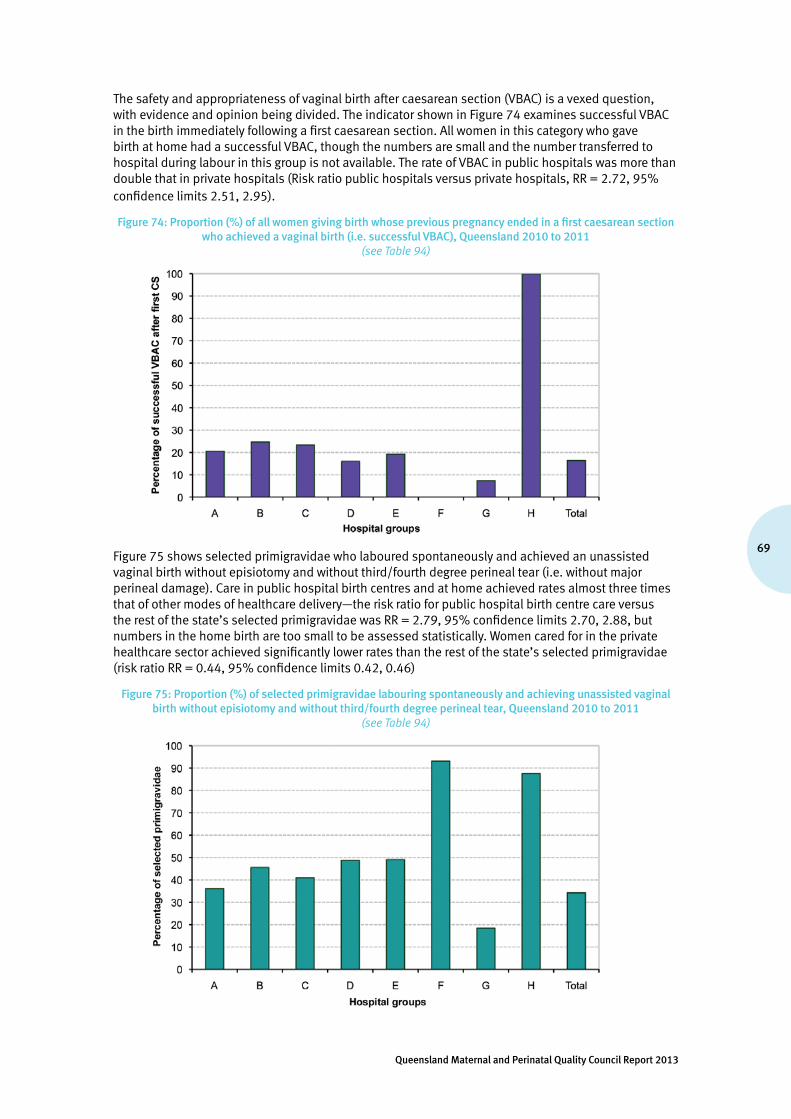
69
Queensland Maternal and Perinatal Quality Council Report 2013
The safety and appropriateness of vaginal birth after caesarean section (VBAC) is a vexed question, with evidence and opinion being divided. The indicator shown in Figure 74 examines successful VBAC in the birth immediately following a first caesarean section. All women in this category who gave birth at home had a successful VBAC, though the numbers are small and the number transferred to hospital during labour in this group is not available. The rate of VBAC in public hospitals was more than double that in private hospitals (Risk ratio public hospitals versus private hospitals, RR = 2.72, 95% confidence limits 2.51, 2.95).
Figure 74: Proportion (%) of all women giving birth whose previous pregnancy ended in a first caesarean section who achieved a vaginal birth (i.e. successful VBAC), Queensland 2010 to 2011
(see Table 94)
Figure 75 shows selected primigravidae who laboured spontaneously and achieved an unassisted vaginal birth without episiotomy and without third/fourth degree perineal tear (i.e. without major perineal damage). Care in public hospital birth centres and at home achieved rates almost three times that of other modes of healthcare delivery—the risk ratio for public hospital birth centre care versus the rest of the state’s selected primigravidae was RR = 2.79, 95% confidence limits 2.70, 2.88, but numbers in the home birth are too small to be assessed statistically. Women cared for in the private healthcare sector achieved significantly lower rates than the rest of the state’s selected primigravidae (risk ratio RR = 0.44, 95% confidence limits 0.42, 0.46)
Figure 75: Proportion (%) of selected primigravidae labouring spontaneously and achieving unassisted vaginal birth without episiotomy and without third/fourth degree perineal tear, Queensland 2010 to 2011
(see Table 94)

Maternal and Perinatal Mortality and Morbidity in Queensland
70
Figure 76 shows all women who laboured spontaneously and achieved an unassisted vaginal birth without major perineal damage. Similar variations to those seen in Figure 65 are found in this larger group.
Figure 76: Proportion (%) of all women giving birth labouring spontaneously and achieving unassisted vaginal birth without episiotomy and without third/fourth degree perineal tear, Queensland 2010 to 2011
(see Table 94)
Good practice point
• Maternity services are encouraged to be continuously aware of their own performance by monitoring against relevant indicators, and to readily make this information available to staff and to consumers of their care.
Recommendation
• That future Council reports will examine clinical indicators, such as those in this report, by individual hospital/facility.

71
Queensland Maternal and Perinatal Quality Council Report 2013
5. Data tables
Table 29: Perinatal mortality rates, Queensland 2000 to 2011
(see Section 1.1 regarding definitions of neonatal deaths and stillbirths)
2000 2001 2002 2003 2004 2005 2006 2007 2008 2009 2010 2011
Fetal deaths 7.3 7.3 6.7 6.1 6.9 6.8 6.9 6.9 6.3 7.2 6.7 6.4
Neonatal deaths
3.8 4 3.6 3.5 3.9 3.4 4.0 3.4 3.4 3.9 3.9 3.4
Perinatal deaths
11 11.3 10.3 9.6 10.8 10.1 10.8 10.3 9.6 11.1 10.6 9.9
Table 30: Perinatal autopsy rates, Queensland 2000 to 2011
Autopsy rates (per cent performed)
2000 2001 2002 2003 2004 2005 2006 2007 2008 2009 2010 2011
Stillbirths 44.1 38.8 24.3 29.6 22.8 28.3 30.7 34.3 36.5 37.4 35.8 36.9
Neonatal deaths
29.9 25.6 14.7 17.0 17.2 22.2 29.1 31.2 26.7 27.6 23.1 20.7
Perinatal deaths
39.3 34.2 20.9 25.1 20.7 26.3 30.1 33.3 33.1 34.0 31.1 31.3
Table 31: Perinatal deaths by detailed PSANZ-PDC classification, Queensland 2009 to 2011
PSANZ-PDC cause of deathPerinatal deaths Stillbirths Neonatal deaths
n % n % n %
1. Congenital abnormality (including terminations for congenital abnormalities)
1.1 Central nervous system 115 5.9 88 7.0 27 3.9
1.2 Cardiovascular system 90 4.6 40 3.2 50 7.2
1.3 Urinary system 43 2.2 22 1.7 21 3.0
1.4 Gastrointestinal system 4 0.2 2 0.2 2 0.3
1.5 Chromosomal 129 6.6 101 8.0 28 4.0
1.6 Metabolic 7 0.4 1 0.1 6 0.9
1.7 Multiple/non-chromosomal syndromes 61 3.1 31 2.5 30 4.3
1.8 Other congenital abnormality 63 3.2 25 2.0 38 5.5
1.9 Unspecified congenital abnormality 9 0.5 5 0.4 4 0.6
2. Perinatal infection
2.1 Bacterial 2 0.1 1 0.1 1 0.1
2.11 Group B streptococcus 5 0.3 4 0.3 1 0.1
2.12 E coli 2 0.1 1 0.1 1 0.1
2.13 Listeria monocytogenes
2.14 Spirochaetal e.g. syphilis 2 0.1 2 0.2
2.18 Other bacterial 8 0.4 7 0.6 1 0.1
2.19 Unspecified bacterial 9 0.5 8 0.6 1 0.1
2.2 Viral
2.21 Cytomegalovirus 9 0.5 7 0.6 2 0.3
2.22 Parvovirus 4 0.2 4 0.3
2.23 Herpes simplex virus
2.24 Rubella virus
2.28 Other viral 2 0.1 2 0.3
2.29 Unspecified viral
2.3 Protozoal e.g. toxoplasma 1 0.1 1 0.1
2.5 Fungal
2.8 Other specified organism
2.9 Other unspecified organism 2 0.1 1 0.1 1 0.1
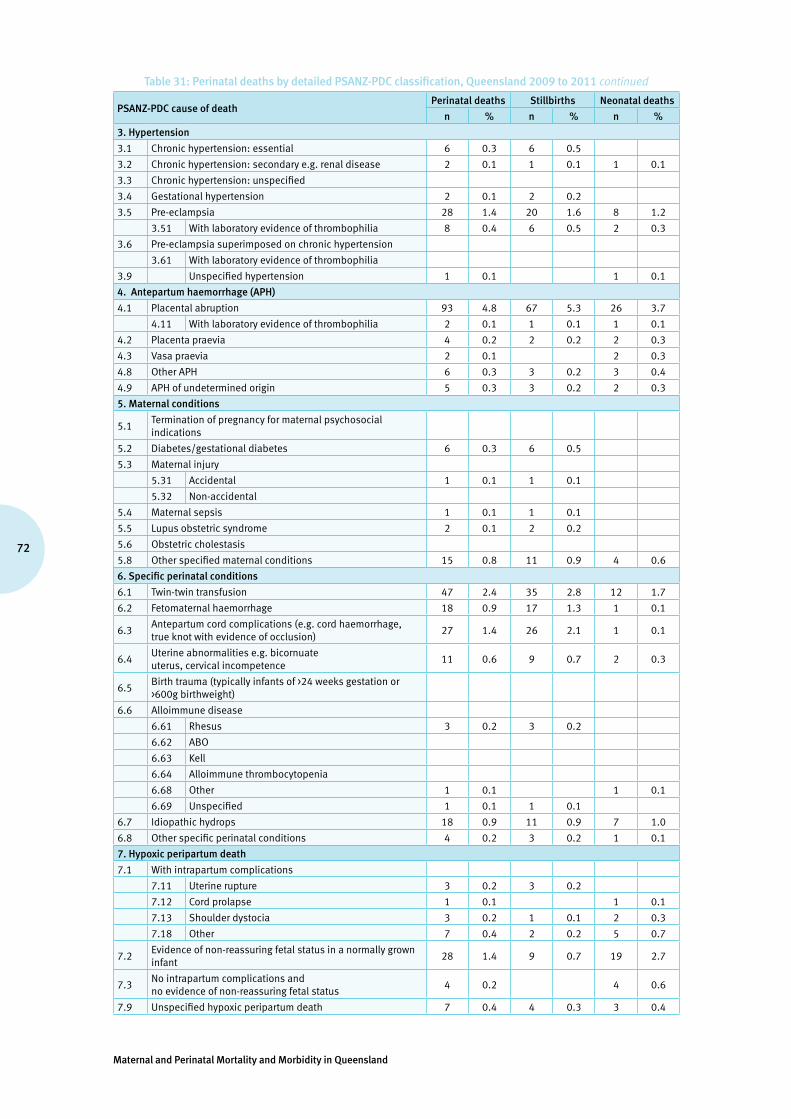
Maternal and Perinatal Mortality and Morbidity in Queensland
72
Table 31: Perinatal deaths by detailed PSANZ-PDC classification, Queensland 2009 to 2011 continued
PSANZ-PDC cause of deathPerinatal deaths Stillbirths Neonatal deaths
n % n % n %
3. Hypertension
3.1 Chronic hypertension: essential 6 0.3 6 0.5
3.2 Chronic hypertension: secondary e.g. renal disease 2 0.1 1 0.1 1 0.1
3.3 Chronic hypertension: unspecified
3.4 Gestational hypertension 2 0.1 2 0.2
3.5 Pre-eclampsia 28 1.4 20 1.6 8 1.2
3.51 With laboratory evidence of thrombophilia 8 0.4 6 0.5 2 0.3
3.6 Pre-eclampsia superimposed on chronic hypertension
3.61 With laboratory evidence of thrombophilia
3.9 Unspecified hypertension 1 0.1 1 0.1
4. Antepartum haemorrhage (APH)
4.1 Placental abruption 93 4.8 67 5.3 26 3.7
4.11 With laboratory evidence of thrombophilia 2 0.1 1 0.1 1 0.1
4.2 Placenta praevia 4 0.2 2 0.2 2 0.3
4.3 Vasa praevia 2 0.1 2 0.3
4.8 Other APH 6 0.3 3 0.2 3 0.4
4.9 APH of undetermined origin 5 0.3 3 0.2 2 0.3
5. Maternal conditions
5.1Termination of pregnancy for maternal psychosocial indications
5.2 Diabetes/gestational diabetes 6 0.3 6 0.5
5.3 Maternal injury
5.31 Accidental 1 0.1 1 0.1
5.32 Non-accidental
5.4 Maternal sepsis 1 0.1 1 0.1
5.5 Lupus obstetric syndrome 2 0.1 2 0.2
5.6 Obstetric cholestasis
5.8 Other specified maternal conditions 15 0.8 11 0.9 4 0.6
6. Specific perinatal conditions
6.1 Twin-twin transfusion 47 2.4 35 2.8 12 1.7
6.2 Fetomaternal haemorrhage 18 0.9 17 1.3 1 0.1
6.3Antepartum cord complications (e.g. cord haemorrhage, true knot with evidence of occlusion)
27 1.4 26 2.1 1 0.1
6.4Uterine abnormalities e.g. bicornuate uterus, cervical incompetence
11 0.6 9 0.7 2 0.3
6.5Birth trauma (typically infants of >24 weeks gestation or >600g birthweight)
6.6 Alloimmune disease
6.61 Rhesus 3 0.2 3 0.2
6.62 ABO
6.63 Kell
6.64 Alloimmune thrombocytopenia
6.68 Other 1 0.1 1 0.1
6.69 Unspecified 1 0.1 1 0.1
6.7 Idiopathic hydrops 18 0.9 11 0.9 7 1.0
6.8 Other specific perinatal conditions 4 0.2 3 0.2 1 0.1
7. Hypoxic peripartum death
7.1 With intrapartum complications
7.11 Uterine rupture 3 0.2 3 0.2
7.12 Cord prolapse 1 0.1 1 0.1
7.13 Shoulder dystocia 3 0.2 1 0.1 2 0.3
7.18 Other 7 0.4 2 0.2 5 0.7
7.2Evidence of non-reassuring fetal status in a normally grown infant
28 1.4 9 0.7 19 2.7
7.3No intrapartum complications and no evidence of non-reassuring fetal status
4 0.2 4 0.6
7.9 Unspecified hypoxic peripartum death 7 0.4 4 0.3 3 0.4

73
Queensland Maternal and Perinatal Quality Council Report 2013
Table 31: Perinatal deaths by detailed PSANZ-PDC classification, Queensland 2009 to 2011 continued
PSANZ-PDC cause of deathPerinatal deaths Stillbirths Neonatal deaths
n % n % n %
8. Fetal Growth Restriction (FGR)
8.1With evidence of reduced vascular perfusion on Doppler studies and/or placental histopathology
48 2.5 38 3.0 10 1.4
8.2 With chronic villitis 2 0.1 2 0.2
8.3 No placental pathology 12 0.6 11 0.9 1 0.1
8.4 No examination of placenta
8.8 Other specified placental pathology 4 0.2 3 0.2 1 0.1
8.9Unspecified or not known whether placenta examined
7 0.4 6 0.5 1 0.1
9. Spontaneous preterm (<37 weeks gestation)
9.1Spontaneous preterm with intact membranes, or membrane rupture <24 hours before delivery
2 0.1 2 0.3
9.11 With chorioamnionitis on placental histopathology 140 7.2 45 3.6 95 13.7
9.12Without chorioamnionitis on placental histopathology
77 3.9 22 1.7 55 7.9
9.13With clinical evidence of chorioamnionitis, no examination of placenta
5 0.3 1 0.1 4 0.6
9.17No clinical signs of chorioamnionitis, no examination of placenta
10 0.5 1 0.1 9 1.3
9.19Unspecified or not known whether placenta examined
34 1.7 17 1.3 17 2.4
9.2Spontaneous preterm with membrane rupture >24 hours before delivery
1 0.1 1 0.1
9.21 With chorioamnionitis on placental histopathology 130 6.7 50 4.0 80 11.5
9.22Without chorioamnionitis on placental histopathology
20 1.0 11 0.9 9 1.3
9.23With clinical evidence of chorioamnionitis, no examination of placenta
4 0.2 3 0.2 1 0.1
9.27No clinical signs of chorioamnionitis, no examination of placenta
4 0.2 1 0.1 3 0.4
9.29Unspecified or not known whether placenta examined
16 0.8 7 0.6 9 1.3
9.3Spontaneous preterm with membrane rupture of unknown duration before delivery
9.31 With chorioamnionitis on placental histopathology 20 1.0 9 0.7 11 1.6
9.32Without chorioamnionitis on placental histopathology
6 0.3 1 0.1 5 0.7
9.33With clinical evidence of chorioamnionitis, no examination of placenta
1 0.1 1 0.1
9.37No clinical signs of chorioamnionitis, no examination of placenta
3 0.2 1 0.1 2 0.3
9.39Unspecified or not known whether placenta examined
7 0.4 6 0.5 1 0.1
10. Unexplained antepartum death
10.1With evidence of reduced vascular perfusion on Doppler studies and / or placental histopathology
42 2.1 42 3.3
10.2 With chronic villitis 5 0.3 5 0.4
10.3 No placental pathology 212 10.8 212 16.8
10.4 No examination of placenta 17 0.9 17 1.3
10.8 Other specified placental pathology 70 3.6 70 5.6
10.9 Unspecified or not known whether placenta examined 39 2.0 39 3.1
11. No obstetric antecedent
11.1 Sudden infant death syndrome (SIDS) 1 0.1 1 0.1
11.11SIDS Category IA: Classic features of SIDS present and completely documented
1 0.1 1 0.1
11.12SIDS Category IB: Classic features of SIDS present but incompletely documented
1 0.1 1 0.1
11.13SIDS Category II: Infant deaths that meet Category I: except for one or more features
5 0.3 5 0.7
11.2 Postnatally acquired infection 3 0.2 3 0.4
11.3 Accidental asphyxiation 1 0.1 1 0.1
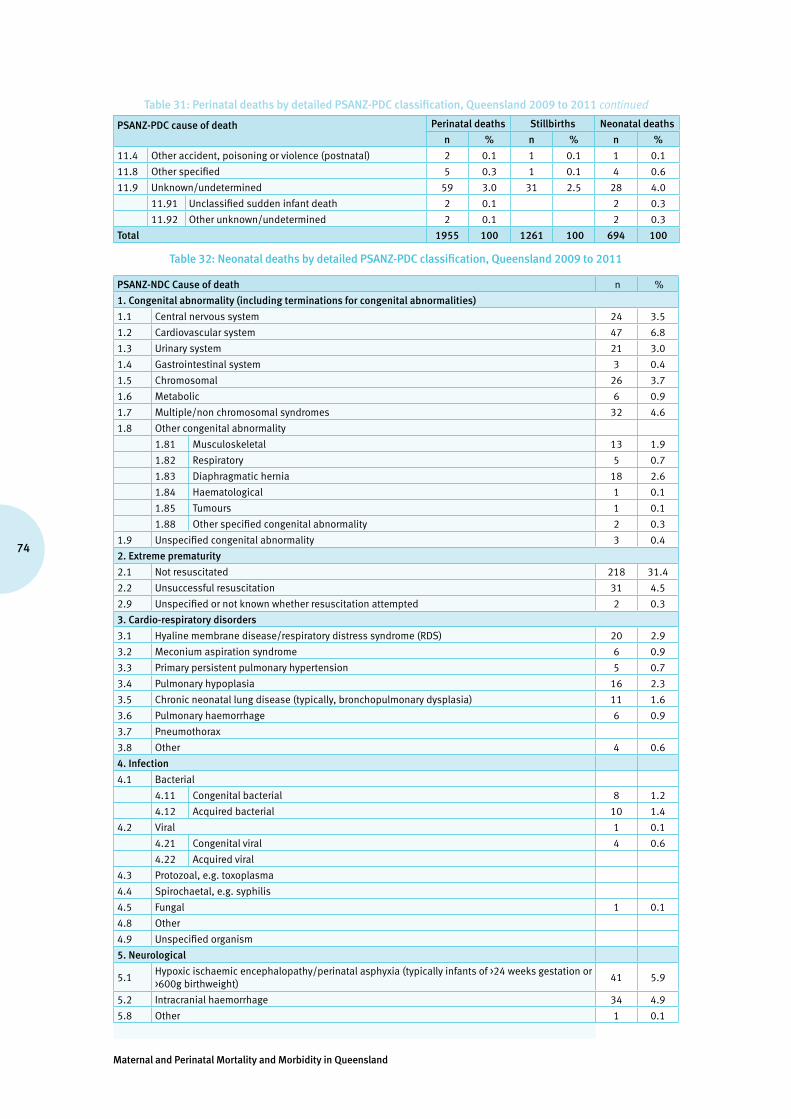
Maternal and Perinatal Mortality and Morbidity in Queensland
74
Table 31: Perinatal deaths by detailed PSANZ-PDC classification, Queensland 2009 to 2011 continued
PSANZ-PDC cause of death Perinatal deaths Stillbirths Neonatal deaths
n % n % n %
11.4 Other accident, poisoning or violence (postnatal) 2 0.1 1 0.1 1 0.1
11.8 Other specified 5 0.3 1 0.1 4 0.6
11.9 Unknown/undetermined 59 3.0 31 2.5 28 4.0
11.91 Unclassified sudden infant death 2 0.1 2 0.3
11.92 Other unknown/undetermined 2 0.1 2 0.3
Total 1955 100 1261 100 694 100
Table 32: Neonatal deaths by detailed PSANZ-PDC classification, Queensland 2009 to 2011
PSANZ-NDC Cause of death n %
1. Congenital abnormality (including terminations for congenital abnormalities)
1.1 Central nervous system 24 3.5
1.2 Cardiovascular system 47 6.8
1.3 Urinary system 21 3.0
1.4 Gastrointestinal system 3 0.4
1.5 Chromosomal 26 3.7
1.6 Metabolic 6 0.9
1.7 Multiple/non chromosomal syndromes 32 4.6
1.8 Other congenital abnormality
1.81 Musculoskeletal 13 1.9
1.82 Respiratory 5 0.7
1.83 Diaphragmatic hernia 18 2.6
1.84 Haematological 1 0.1
1.85 Tumours 1 0.1
1.88 Other specified congenital abnormality 2 0.3
1.9 Unspecified congenital abnormality 3 0.4
2. Extreme prematurity
2.1 Not resuscitated 218 31.4
2.2 Unsuccessful resuscitation 31 4.5
2.9 Unspecified or not known whether resuscitation attempted 2 0.3
3. Cardio-respiratory disorders
3.1 Hyaline membrane disease/respiratory distress syndrome (RDS) 20 2.9
3.2 Meconium aspiration syndrome 6 0.9
3.3 Primary persistent pulmonary hypertension 5 0.7
3.4 Pulmonary hypoplasia 16 2.3
3.5 Chronic neonatal lung disease (typically, bronchopulmonary dysplasia) 11 1.6
3.6 Pulmonary haemorrhage 6 0.9
3.7 Pneumothorax
3.8 Other 4 0.6
4. Infection
4.1 Bacterial
4.11 Congenital bacterial 8 1.2
4.12 Acquired bacterial 10 1.4
4.2 Viral 1 0.1
4.21 Congenital viral 4 0.6
4.22 Acquired viral
4.3 Protozoal, e.g. toxoplasma
4.4 Spirochaetal, e.g. syphilis
4.5 Fungal 1 0.1
4.8 Other
4.9 Unspecified organism
5. Neurological
5.1Hypoxic ischaemic encephalopathy/perinatal asphyxia (typically infants of >24 weeks gestation or >600g birthweight)
41 5.9
5.2 Intracranial haemorrhage 34 4.9
5.8 Other 1 0.1

75
Queensland Maternal and Perinatal Quality Council Report 2013
Table 32: Neonatal deaths by detailed PSANZ-PDC classification, Queensland 2009 to 2011 continued
PSANZ-NDC Cause of death n %
6. Gastrointestinal
6.1 Necrotising enterocolitis 24 3.5
6.8 Other 1 0.1
7. Other
7.1 SIDS
7.11 SIDS Category IA: Classic features of SIDS present and completely documented 1 0.1
7.12 SIDS Category IB: Classic features of SIDS present but incompletely documented 1 0.1
7.13 SIDS Category II : Infant deaths that meet category I except for one or more features 6 0.9
7.2 Multisystem failure-only if unknown primary cause or trigger event 2 0.3
7.3 Trauma 1 0.1
7.8 Other specified 2 0.3
7.9 Unknown/undetermined 31 4.5
7.91 Unclassified sudden infant death 2 0.3
7.92 Other unknown/undetermined 2 0.3
Total 694 100
Table 33: Numbers and rates of stillbirth, neonatal death and perinatal death, by birthweight, Queensland 2000 to 2011
Stillbirths Neonatal deaths Perinatal deaths
Birthweight (g)Total
birthsLive
birthsNumber
Deaths per 1,000 births
NumberDeaths per
1,000 live birthsNumber
Deaths per 1,000 births
Less than 500 2,402 655 1,747 727.3 619 945.0 2,366 985.0
500–749 1,852 1,285 567 306.2 507 394.6 1,074 579.9
750–999 1,842 1,614 228 123.8 187 115.9 415 225.3
1,000–1,249 2,287 2,126 161 70.4 85 40.0 246 107.6
1,250–1,499 3,129 2,964 165 52.7 54 18.2 219 70.0
1,500–1,749 4,833 4,690 143 29.6 69 14.7 212 43.9
1,750–1,999 7,704 7,562 142 18.4 81 10.7 223 28.9
2,000–2,249 26,236 26,076 160 6.1 95 3.6 255 9.7
2,250–2,499 57,235 57,069 166 2.9 96 1.7 262 4.6
2500–2,999 117,010 116,682 328 2.8 195 1.7 523 4.5
3,000–3,499 202,415 202,136 279 1.4 168 0.8 447 2.2
3,500–3,999 172,698 172,526 172 1.0 124 0.7 296 1.7
4,000–4,499 58,875 58,708 167 2.8 136 2.3 303 5.1
4500 and over 10,752 10,684 68 6.3 41 3.8 109 10.1
Not stated 109 67 42 10 52
Total 669,379 664,844 4,535 6.8 2,467 3.7 7,002 10.5
Table 34: Numbers and rates of stillbirth, neonatal death and perinatal death, by gestation, Queensland 2000 to 2011
Stillbirths Neonatal deaths Perinatal deaths
Gestation (weeks)
Total births
Live births
NumberDeaths per
1,000 birthsNumber
Deaths per 1,000 live births
NumberDeaths per
1,000 births
23 or less 2,859 950 1,909 667.7 909 956.8 2,818 985.7
24–27 2,909 2,332 577 198.3 515 220.8 1,092 375.4
28–33 13,597 12,893 704 51.8 276 21.4 980 72.1
34–36 38,614 38,175 439 11.4 196 5.1 635 16.4
37–39 322,988 322,444 544 1.7 360 1.1 904 2.8
40–41 282,483 282,151 332 1.2 200 0.7 532 1.9
42 or more 5,860 5,838 22 3.8 11 1.9 33 5.6
Not stated 69 61 8 0 8
Total 669,379 664,844 4,535 6.8 2,467 3.7 7,002 10.5

Maternal and Perinatal Mortality and Morbidity in Queensland
76
Table 35: Women giving birth by mode of healthcare delivery, Queensland 2001 to 2011
(data regarding mode of healthcare delivery was collected completely from 2001 onwards)
Year Public hospital Private hospital
Planned home birth
Born before arrival
Data incomplete
Total women giving birthMaternity service Birth centre
2000 35,967 (74.1%) 12,429 (25.6%) 126 (0.3%) 2 48,524
2001 33,487 (68.5%) 441 (0.9%) 14,595 (29.8%) 102 (0.2%) 162 (0.3%) 121 48,908
2002 32,313 (66.9%) 382 (0.8%) 15,280 (31.6%) 59 (0.1%) 165 (0.3%) 125 48,324
2003 33,144 (66.9%) 459 (0.9%) 15,594 (31.5%) 67 (0.1%) 232 (0.5%) 16 49,512
2004 33,480 (66.9%) 457 (0.9%) 15,759 (31.5%) 55 (0.1%) 283 (0.6%) 17 50,051
2005 36,644 (67.4%) 439 (0.8%) 16,891 (31.1%) 42 (0.1%) 297 (0.5%) 24 54,337
2006 37,681 (67.6%) 472 (0.8%) 17,188 (30.8%) 46 (0.1%) 300 (0.5%) 32 55,719
2007 40,375 (68.2%) 504 (0.9%) 17,909 (30.2%) 81 (0.1%) 337 (0.6%) 22 59,228
2008 41,125 (68.2%) 431 (0.7%) 18,279 (30.3%) 110 (0.2%) 359 (0.6%) 24 60,328
2009 41,591 (68.2%) 581 (1.0%) 18,328 (30.0%) 123 (0.2%) 367 (0.6%) 34 61,024
2010 41,474 (68.0%) 691 (1.1%) 18,362 (30.1%) 85 (0.1%) 415 (0.7%) 0 61,027
2011 41,880 (68.5%) 840 (1.4%) 17,906 (29.3%) 69 (0.1%) 428 (0.7%) 2 61,123
Total 449,161 (68.3%) 5,697 (0.9%) 198,520 (30.2%) 965 (0.1%) 3,345 (0.5%) 419 658,105
Table 36: Number and percentage of women giving birth by gestation at birth, Queensland 2000 to 2011(gestation not stated for 69 women)
Weeks23 or less 24–27 28–33 34–36 37–39 40–41 42 or more Total
Year
2000 204 (0.4%) 195 (0.4%) 858 (1.8%) 2,440 (5.0%) 20,791 (42.8%) 23,093 (47.6%) 933 (1.9%) 48,524
2001 202 (0.4%) 193 (0.4%) 772 (1.6%) 2,452 (5.0%) 21,100 (43.1%) 23,470 (48.0%) 718 (1.5%) 48,908
2002 170 (0.4%) 190 (0.4%) 867 (1.8%) 2,449 (5.1%) 21,823 (45.2%) 22,203 (45.9%) 620 (1.3%) 48,324
2003 154 (0.3%) 189 (0.4%) 880 (1.8%) 2,542 (5.1%) 22,899 (46.2%) 22,354 (45.1%) 491 (1.0%) 49,512
2004 201 (0.4%) 197 (0.4%) 917 (1.8%) 2,636 (5.3%) 23,696 (47.3%) 21,980 (43.9%) 417 (0.8%) 50,051
2005 209 (0.4%) 211 (0.4%) 953 (1.8%) 2,891 (5.3%) 26,165 (48.2%) 23,525 (43.3%) 379 (0.7%) 54,337
2006 239 (0.4%) 237 (0.3%) 1,019 (1.8%) 3,006 (5.4%) 27,399 (49.2%) 23,471 (42.1%) 342 (0.6%) 55,719
2007 260 (0.4%) 185 (0.4%) 1,041 (1.8%) 3,157 (5.3%) 29,059 (49.1%) 25,101 (42.4%) 414 (0.7%) 59,228
2008 234 (0.4%) 232 (0.4%) 1,019 (1.7%) 3,154 (5.2%) 30,272 (50.2%) 24,993 (41.4%) 419 (0.7%) 60,328
2009 248 (0.4%) 236 (0.4%) 1,068 (1.8%) 3,260 (5.3%) 31,088 (50.9%) 24,695 (40.5%) 422 (0.7%) 61,024
2010 256 (0.4%) 244 (0.4%) 1,065 (1.7%) 3,196 (5.2%) 31,767 (52.1%) 24,137 (39.6%) 356 (0.6%) 61,027
2011 242 (0.4%) 258 (0.4%) 1,050 (1.7%) 3,261 (5.3%) 32,551 (53.3%) 23,406 (38.3%) 349 (0.6%) 61,123
Table 37: Number and percentage of babies born by gestation at birth, Queensland 2000 to 2011 (gestation not stated for 69 babies)
Weeks23 or less 24–27 28–33 34–36 37–39 40–41 42 or more Total
Year
2000 221 (0.4%) 219 (0.4%) 1,002 (2.0%) 2,723 (5.5%) 21,104 (42.8%) 23,105 (46.8%) 933 (1.9%) 49,318
2001 225 (0.5%) 217 (0.4%) 911 (1.8%) 2,721 (5.5%) 21,419 (43.1%) 23,478 (47.2%) 718 (1.4%) 49,690
2002 188 (0.4%) 218 (0.4%) 1,039 (2.1%) 2,764 (5.6%) 22,156 (45.0%) 22,209 (45.1%) 620 (1.3%) 49,196
2003 173 (0.3%) 211 (0.4%) 1,038 (2.1%) 2,852 (5.7%) 23,242 (46.1%) 22,357 (44.4%) 491 (1.0%) 50,367
2004 216 (0.4%) 237 (0.4%) 1,073 (2.1%) 2,955 (5.8%) 24,019 (47.2%) 21,986 (43.2%) 417 (0.8%) 50,910
2005 227 (0.4%) 232 (0.4%) 1,121 (2.0%) 3,248 (5.9%) 26,543 (48.0%) 23,527 (42.6%) 379 (0.7%) 55,281
2006 256 (0.5%) 275 (0.4%) 1,233 (2.2%) 3,362 (5.9%) 27,761 (49.0%) 23,473 (41.4%) 342 (0.6%) 56,708
2007 284 (0.5%) 206 (0.4%) 1,236 (2.1%) 3,527 (5.9%) 29,462 (48.9%) 25,104 (41.7%) 414 (0.7%) 60,244
2008 256 (0.4%) 261 (0.4%) 1,191 (1.9%) 3,584 (5.8%) 30,689 (50.0%) 24,997 (40.7%) 419 (0.7%) 61,402
2009 272 (0.4%) 265 (0.4%) 1,249 (2.0%) 3,660 (5.9%) 31,482 (50.7%) 24,695 (39.8%) 422 (0.7%) 62,052
2010 281 (0.5%) 271 (0.4%) 1,267 (2.0%) 3,557 (5.7%) 32,150 (51.8%) 24,144 (38.9%) 356 (0.6%) 62,032
2011 260 (0.4%) 297 (0.5%) 1,237 (2.0%) 3,661 (5.9%) 32,961 (53.0%) 23,408 (37.6%) 349 (0.6%) 62,179
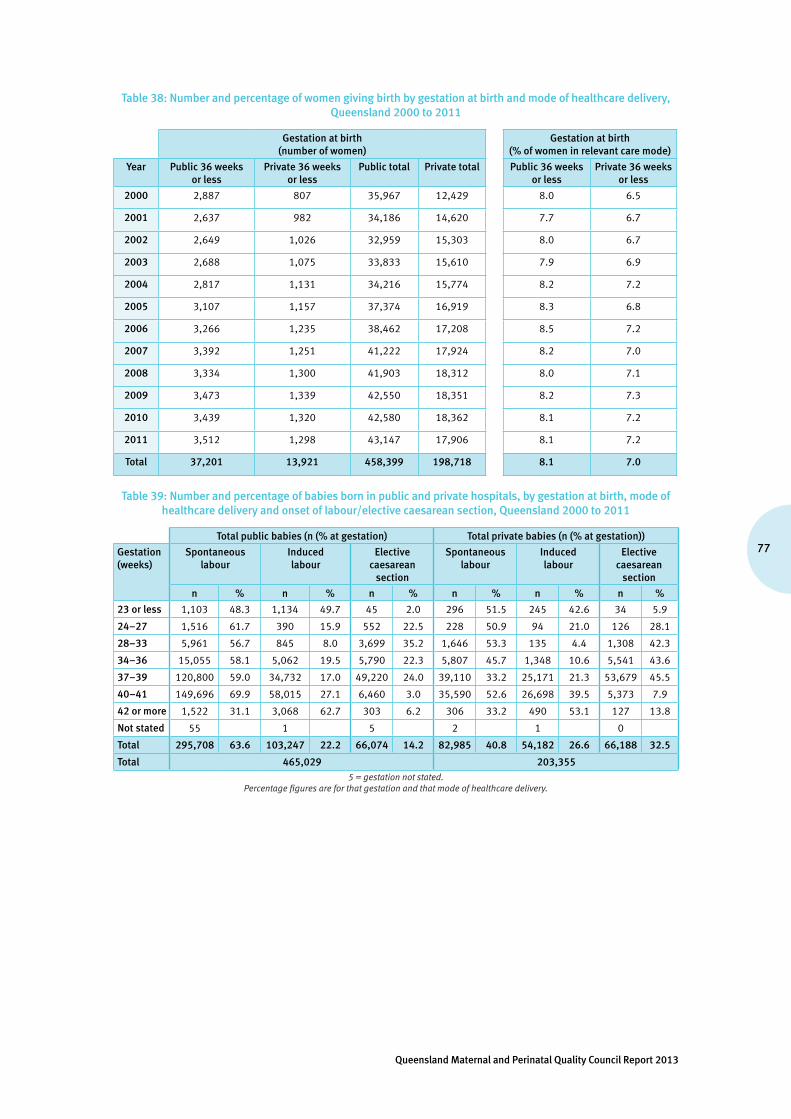
77
Queensland Maternal and Perinatal Quality Council Report 2013
Table 38: Number and percentage of women giving birth by gestation at birth and mode of healthcare delivery, Queensland 2000 to 2011
Gestation at birth (number of women)
Gestation at birth (% of women in relevant care mode)
Year Public 36 weeks or less
Private 36 weeks or less
Public total Private total Public 36 weeks or less
Private 36 weeks or less
2000 2,887 807 35,967 12,429 8.0 6.5
2001 2,637 982 34,186 14,620 7.7 6.7
2002 2,649 1,026 32,959 15,303 8.0 6.7
2003 2,688 1,075 33,833 15,610 7.9 6.9
2004 2,817 1,131 34,216 15,774 8.2 7.2
2005 3,107 1,157 37,374 16,919 8.3 6.8
2006 3,266 1,235 38,462 17,208 8.5 7.2
2007 3,392 1,251 41,222 17,924 8.2 7.0
2008 3,334 1,300 41,903 18,312 8.0 7.1
2009 3,473 1,339 42,550 18,351 8.2 7.3
2010 3,439 1,320 42,580 18,362 8.1 7.2
2011 3,512 1,298 43,147 17,906 8.1 7.2
Total 37,201 13,921 458,399 198,718 8.1 7.0
Table 39: Number and percentage of babies born in public and private hospitals, by gestation at birth, mode of healthcare delivery and onset of labour/elective caesarean section, Queensland 2000 to 2011
Total public babies (n (% at gestation) Total private babies (n (% at gestation))
Gestation (weeks)
Spontaneous labour
Induced labour
Elective caesarean
section
Spontaneous labour
Induced labour
Elective caesarean
section
n % n % n % n % n % n %
23 or less 1,103 48.3 1,134 49.7 45 2.0 296 51.5 245 42.6 34 5.9
24–27 1,516 61.7 390 15.9 552 22.5 228 50.9 94 21.0 126 28.1
28–33 5,961 56.7 845 8.0 3,699 35.2 1,646 53.3 135 4.4 1,308 42.3
34–36 15,055 58.1 5,062 19.5 5,790 22.3 5,807 45.7 1,348 10.6 5,541 43.6
37–39 120,800 59.0 34,732 17.0 49,220 24.0 39,110 33.2 25,171 21.3 53,679 45.5
40–41 149,696 69.9 58,015 27.1 6,460 3.0 35,590 52.6 26,698 39.5 5,373 7.9
42 or more 1,522 31.1 3,068 62.7 303 6.2 306 33.2 490 53.1 127 13.8
Not stated 55 1 5 2 1 0
Total 295,708 63.6 103,247 22.2 66,074 14.2 82,985 40.8 54,182 26.6 66,188 32.5
Total 465,029 203,3555 = gestation not stated.
Percentage figures are for that gestation and that mode of healthcare delivery.

Maternal and Perinatal Mortality and Morbidity in Queensland
78
Table 40: Incidence of admission to NICU or a SCN and PNMR (per 1,000 births) by gestation of babies born, Queensland 2000 to 2011
% admitted to NICU or SCN PNMR (per 1,000 births)
Gestation (weeks)
Spontaneous labour
Induced labour or elective caesarean
section TotalSpontaneous
labour
Induced labour or elective caesarean
section Total
20 or less 0.0 0.0 0.0 1,000.0 1,000.0 1,000.0
21 0.2 0.3 0.3 1,000.0 1,000.0 994.8
22 0.0 2.9 1.6 995.1 1,000.0 994.5
23 3.8 20.6 14.6 907.7 981.1 934.0
24 27.6 72.3 56.1 542.7 799.2 635.4
25 47.3 85.2 71.0 304.1 640.8 429.9
26 62.4 88.5 78.4 200.4 462.1 301.3
27 75.5 87.6 82.0 112.6 286.1 191.1
28 78.9 88.1 84.1 107.3 258.9 173.4
29 84.7 89.1 87.1 71.4 173.6 118.6
30 87.3 91.1 89.4 62.6 140.0 97.7
31 88.7 93.6 91.3 16.4 116.5 62.8
32 91.2 92.5 91.9 34.5 87.6 58.9
33 92.4 92.5 92.4 21.0 62.5 38.2
34 93.5 91.4 92.3 13.9 39.8 25.5
35 88.4 82.0 84.9 9.0 24.9 16.2
36 64.5 52.1 57.9 8.7 18.5 13.3
37 30.1 19.1 24.7 4.4 8.3 6.4
38 14.9 11.0 13.3 2.0 3.0 2.6
39 10.1 8.1 8.9 1.7 2.4 2.0
40 9.5 7.6 8.1 1.5 2.8 1.9
41 10.9 9.4 10.2 1.9 1.9 1.9
42 11.9 10.7 11.6 6.0 4.3 4.9
43 or more 8.7 22.7 15.6 45.5 65.2 55.6
Total 18.7 14.4 16.2 8.0 13.7 10.4
Table 41: Birthweight of babies born, Queensland 2000 to 2011 (data incomplete for 109 babies)
Birthweight (number of babies)
Year <1000g 1000–1499g 1500–2499g 2,500–3999g 4000+g Total
n % n % n % n % n %
2000 467 0.9 339 0.7 2,679 5.4 39,368 79.8 6,460 13.1 49,318
2001 440 0.9 358 0.7 2,571 5.2 39,852 80.2 6,464 13.0 49,690
2002 405 0.8 347 0.7 2,811 5.7 39,435 80.2 6,192 12.6 49,196
2003 410 0.8 364 0.7 2,683 5.3 40,428 80.3 6,473 12.9 50,367
2004 470 0.9 339 0.7 2,835 5.6 40,913 80.4 6,340 12.5 50,910
2005 461 0.8 367 0.7 3,085 5.6 44,596 80.7 6,767 12.2 55,281
2006 542 1.0 413 0.7 3,202 5.6 45,559 80.3 6,980 12.3 56,708
2007 512 0.8 414 0.7 3,183 5.3 48,556 80.6 7,561 12.6 60,244
2008 526 0.9 411 0.7 3,209 5.2 49,418 80.5 7,832 12.8 61,402
2009 571 0.9 387 0.6 3,430 5.5 49,750 80.2 7,901 12.7 62,052
2010 579 0.9 393 0.6 3,324 5.4 49,967 80.6 7,759 12.5 62,032
2011 559 0.9 418 0.7 3,326 5.3 50,206 80.7 7,663 12.3 62,179
Total 5,942 0.9 4550 0.7 36,338 5.4 538,048 80.4 84,392 12.6 669,379

79
Queensland Maternal and Perinatal Quality Council Report 2013
Table 42: Incidence of multiple pregnancies by maternal age, Queensland 2000 to 2011
2000 2001 2002 2003 2004 2005 2006 2007 2008 2009 2010 2011
Maternal age <20 0.6 0.6 0.7 0.7 0.7 0.8 0.7 0.8 0.7 0.9 0.9 0.5
Maternal age 20–34 1.5 1.4 1.7 1.7 1.6 1.6 1.6 1.6 1.6 1.5 1.4 1.6
Maternal age 35+ 2.4 2.5 2.4 2.2 2.4 2.4 2.4 2.4 2.6 2.5 2.4 2.2
Total 1.6 1.5 1.7 1.7 1.7 1.7 1.7 1.7 1.8 1.7 1.6 1.7
Table 43: Number and percentage of multiple and singleton births (number of mothers) by gestation, Queensland 2000 to 2011 (data incomplete for 68 mothers)
Year Singleton <37 Singleton 37+ Twin <37 Twin 37+Higher
multiple <37
Higher multiple
37+
n % n % n % n % n % n
2000 3,260 6.8 44,493 93.2 409 55.9 323 44.1 28 96.6 1
2001 3,195 6.6 44,960 93.4 395 54.6 328 45.4 29 100 0
2002 3,176 6.7 44,306 93.3 470 58.0 340 42.0 30 100 0
2003 3,274 6.7 45,397 93.3 474 57.7 347 42.3 17 100 0
2004 3,439 7.0 45,764 93.0 497 60.2 329 39.8 15 100 0
2005 3,727 7.0 49,687 93.0 514 57.4 382 42.6 23 100 0
2006 3,900 7.1 50,848 92.9 577 61.3 364 38.7 24 100 0
2007 4,052 7.0 54,168 93.0 572 58.5 406 41.5 19 100 0
2008 4,002 6.8 55,263 93.2 621 59.6 421 40.4 16 100 0
2009 4,197 7.0 55,812 93.0 596 60.3 392 39.7 19 95.0 1
2010 4,164 6.9 55,871 93.1 579 59.9 388 40.1 18 94.7 1
2011 4,196 7.0 55,894 93.0 589 58.8 412 41.2 26 100 0
Total 44,582 6.9 602,463 93.1 6,293 58.7 4,432 41.3 264 98.9 3
Table 44: Number and percentage of singleton and multiple births (number of mothers) in pregnancies conceived with and without the use of assisted conception techniques, Queensland 2008 to 2011
AIH/AID +/or
ovulation inductionExtracorporeal
techniquesNo assisted conception technique
identified Total pregnancies
YearSingleton Multiple Singleton Multiple Singleton Multiple
n % n % n % n % n % n % n
2000 574 92.1 49 7.9 447 76.8 135 23.2 46,741 98.8 578 1.2 48,524
2001 602 90.9 60 9.1 613 78.8 165 21.2 46,941 98.9 527 1.1 48,908
2002 559 88.9 70 11.1 659 79.2 173 20.8 46,266 98.7 597 1.3 48,324
2003 577 92.3 48 7.7 726 79.9 183 20.1 47,371 98.7 607 1.3 49,512
2004 658 91.6 60 8.4 793 79.1 209 20.9 47,759 98.8 572 1.2 50,051
2005 653 91.3 62 8.7 877 80.7 210 19.3 51,888 98.8 647 1.2 54,337
2006 666 92.1 57 7.9 1,136 82.4 242 17.6 52,952 98.8 666 1.2 55,719
2007 653 90.4 69 9.6 1,192 83.9 229 16.1 56,386 98.8 699 1.2 59,228
2008 743 91.7 67 8.3 1,335 85.4 228 14.6 57,192 98.7 763 1.3 60,328
2009 770 92.3 64 7.7 1,426 86.5 222 13.5 57,820 98.8 722 1.2 61,024
2010 766 92.5 62 7.5 1,673 88.5 218 11.5 57,602 98.8 706 1.2 61,027
2011 808 91.9 71 8.1 1,631 87.8 226 12.2 57,657 98.7 730 1.3 61,123
Total 8,029 91.6 739 8.4 12,508 83.7 2,440 16.3 626,575 98.8 7,814 1.2 658,105
AIH/AID +/or ovulation induction = artificial insemination and/or ovulation induction processes; extracorporeal techniques = invitro fertilisation, gamete intra-fallopian transfer, intracytoplasmic sperm injection, embryo transfer or related techniques.
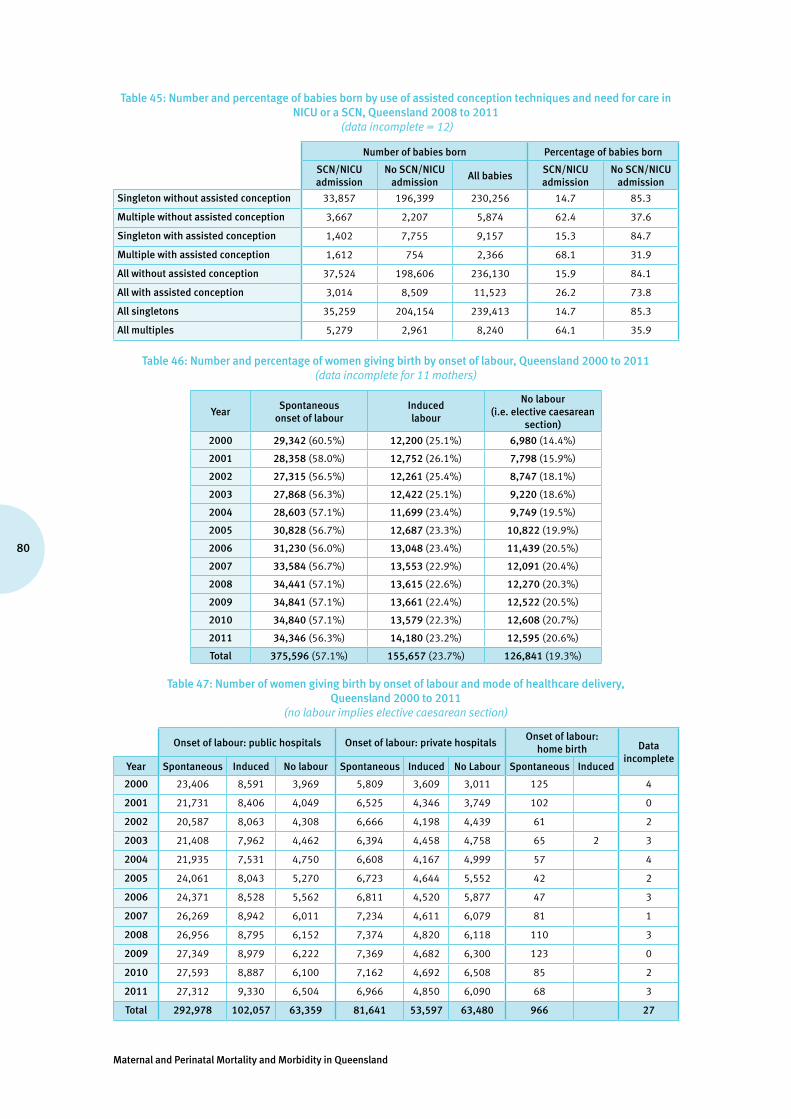
Maternal and Perinatal Mortality and Morbidity in Queensland
80
Table 45: Number and percentage of babies born by use of assisted conception techniques and need for care in NICU or a SCN, Queensland 2008 to 2011
(data incomplete = 12)
Number of babies born Percentage of babies born
SCN/NICU admission
No SCN/NICU admission
All babiesSCN/NICU admission
No SCN/NICU admission
Singleton without assisted conception 33,857 196,399 230,256 14.7 85.3
Multiple without assisted conception 3,667 2,207 5,874 62.4 37.6
Singleton with assisted conception 1,402 7,755 9,157 15.3 84.7
Multiple with assisted conception 1,612 754 2,366 68.1 31.9
All without assisted conception 37,524 198,606 236,130 15.9 84.1
All with assisted conception 3,014 8,509 11,523 26.2 73.8
All singletons 35,259 204,154 239,413 14.7 85.3
All multiples 5,279 2,961 8,240 64.1 35.9
Table 46: Number and percentage of women giving birth by onset of labour, Queensland 2000 to 2011 (data incomplete for 11 mothers)
YearSpontaneous
onset of labour Induced labour
No labour (i.e. elective caesarean
section)
2000 29,342 (60.5%) 12,200 (25.1%) 6,980 (14.4%)
2001 28,358 (58.0%) 12,752 (26.1%) 7,798 (15.9%)
2002 27,315 (56.5%) 12,261 (25.4%) 8,747 (18.1%)
2003 27,868 (56.3%) 12,422 (25.1%) 9,220 (18.6%)
2004 28,603 (57.1%) 11,699 (23.4%) 9,749 (19.5%)
2005 30,828 (56.7%) 12,687 (23.3%) 10,822 (19.9%)
2006 31,230 (56.0%) 13,048 (23.4%) 11,439 (20.5%)
2007 33,584 (56.7%) 13,553 (22.9%) 12,091 (20.4%)
2008 34,441 (57.1%) 13,615 (22.6%) 12,270 (20.3%)
2009 34,841 (57.1%) 13,661 (22.4%) 12,522 (20.5%)
2010 34,840 (57.1%) 13,579 (22.3%) 12,608 (20.7%)
2011 34,346 (56.3%) 14,180 (23.2%) 12,595 (20.6%)
Total 375,596 (57.1%) 155,657 (23.7%) 126,841 (19.3%)
Table 47: Number of women giving birth by onset of labour and mode of healthcare delivery, Queensland 2000 to 2011
(no labour implies elective caesarean section)
Onset of labour: public hospitals Onset of labour: private hospitalsOnset of labour:
home birth Data incomplete
Year Spontaneous Induced No labour Spontaneous Induced No Labour Spontaneous Induced
2000 23,406 8,591 3,969 5,809 3,609 3,011 125 4
2001 21,731 8,406 4,049 6,525 4,346 3,749 102 0
2002 20,587 8,063 4,308 6,666 4,198 4,439 61 2
2003 21,408 7,962 4,462 6,394 4,458 4,758 65 2 3
2004 21,935 7,531 4,750 6,608 4,167 4,999 57 4
2005 24,061 8,043 5,270 6,723 4,644 5,552 42 2
2006 24,371 8,528 5,562 6,811 4,520 5,877 47 3
2007 26,269 8,942 6,011 7,234 4,611 6,079 81 1
2008 26,956 8,795 6,152 7,374 4,820 6,118 110 3
2009 27,349 8,979 6,222 7,369 4,682 6,300 123 0
2010 27,593 8,887 6,100 7,162 4,692 6,508 85 2
2011 27,312 9,330 6,504 6,966 4,850 6,090 68 3
Total 292,978 102,057 63,359 81,641 53,597 63,480 966 27
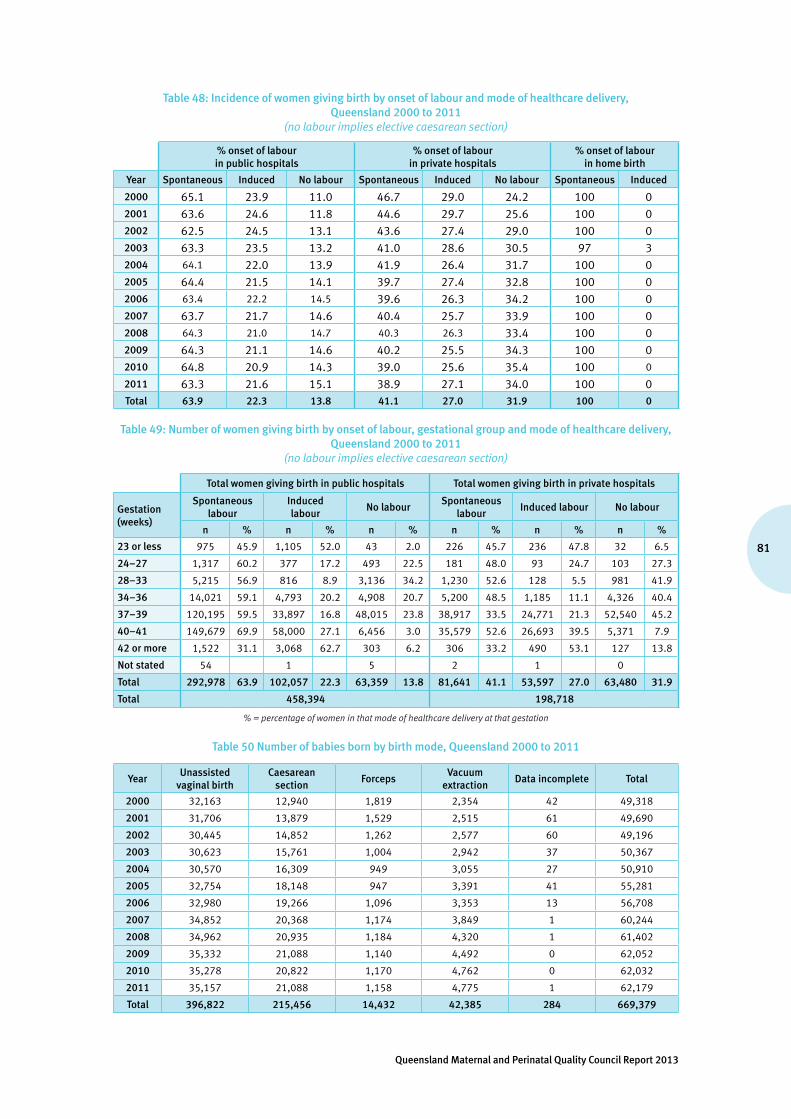
81
Queensland Maternal and Perinatal Quality Council Report 2013
Table 48: Incidence of women giving birth by onset of labour and mode of healthcare delivery, Queensland 2000 to 2011
(no labour implies elective caesarean section)
% onset of labour in public hospitals
% onset of labour in private hospitals
% onset of labour in home birth
Year Spontaneous Induced No labour Spontaneous Induced No labour Spontaneous Induced
2000 65.1 23.9 11.0 46.7 29.0 24.2 100 02001 63.6 24.6 11.8 44.6 29.7 25.6 100 02002 62.5 24.5 13.1 43.6 27.4 29.0 100 02003 63.3 23.5 13.2 41.0 28.6 30.5 97 32004 64.1 22.0 13.9 41.9 26.4 31.7 100 02005 64.4 21.5 14.1 39.7 27.4 32.8 100 02006 63.4 22.2 14.5 39.6 26.3 34.2 100 02007 63.7 21.7 14.6 40.4 25.7 33.9 100 02008 64.3 21.0 14.7 40.3 26.3 33.4 100 02009 64.3 21.1 14.6 40.2 25.5 34.3 100 02010 64.8 20.9 14.3 39.0 25.6 35.4 100 0
2011 63.3 21.6 15.1 38.9 27.1 34.0 100 0Total 63.9 22.3 13.8 41.1 27.0 31.9 100 0
Table 49: Number of women giving birth by onset of labour, gestational group and mode of healthcare delivery, Queensland 2000 to 2011
(no labour implies elective caesarean section)
Total women giving birth in public hospitals Total women giving birth in private hospitals
Gestation (weeks)
Spontaneous labour
Induced labour
No labourSpontaneous
labourInduced labour No labour
n % n % n % n % n % n %
23 or less 975 45.9 1,105 52.0 43 2.0 226 45.7 236 47.8 32 6.5
24–27 1,317 60.2 377 17.2 493 22.5 181 48.0 93 24.7 103 27.3
28–33 5,215 56.9 816 8.9 3,136 34.2 1,230 52.6 128 5.5 981 41.9
34–36 14,021 59.1 4,793 20.2 4,908 20.7 5,200 48.5 1,185 11.1 4,326 40.4
37–39 120,195 59.5 33,897 16.8 48,015 23.8 38,917 33.5 24,771 21.3 52,540 45.2
40–41 149,679 69.9 58,000 27.1 6,456 3.0 35,579 52.6 26,693 39.5 5,371 7.9
42 or more 1,522 31.1 3,068 62.7 303 6.2 306 33.2 490 53.1 127 13.8
Not stated 54 1 5 2 1 0
Total 292,978 63.9 102,057 22.3 63,359 13.8 81,641 41.1 53,597 27.0 63,480 31.9
Total 458,394 198,718
% = percentage of women in that mode of healthcare delivery at that gestation
Table 50 Number of babies born by birth mode, Queensland 2000 to 2011
YearUnassisted
vaginal birthCaesarean
section Forceps
Vacuum extraction
Data incomplete Total
2000 32,163 12,940 1,819 2,354 42 49,318
2001 31,706 13,879 1,529 2,515 61 49,690
2002 30,445 14,852 1,262 2,577 60 49,196
2003 30,623 15,761 1,004 2,942 37 50,367
2004 30,570 16,309 949 3,055 27 50,910
2005 32,754 18,148 947 3,391 41 55,281
2006 32,980 19,266 1,096 3,353 13 56,708
2007 34,852 20,368 1,174 3,849 1 60,244
2008 34,962 20,935 1,184 4,320 1 61,402
2009 35,332 21,088 1,140 4,492 0 62,052
2010 35,278 20,822 1,170 4,762 0 62,032
2011 35,157 21,088 1,158 4,775 1 62,179
Total 396,822 215,456 14,432 42,385 284 669,379
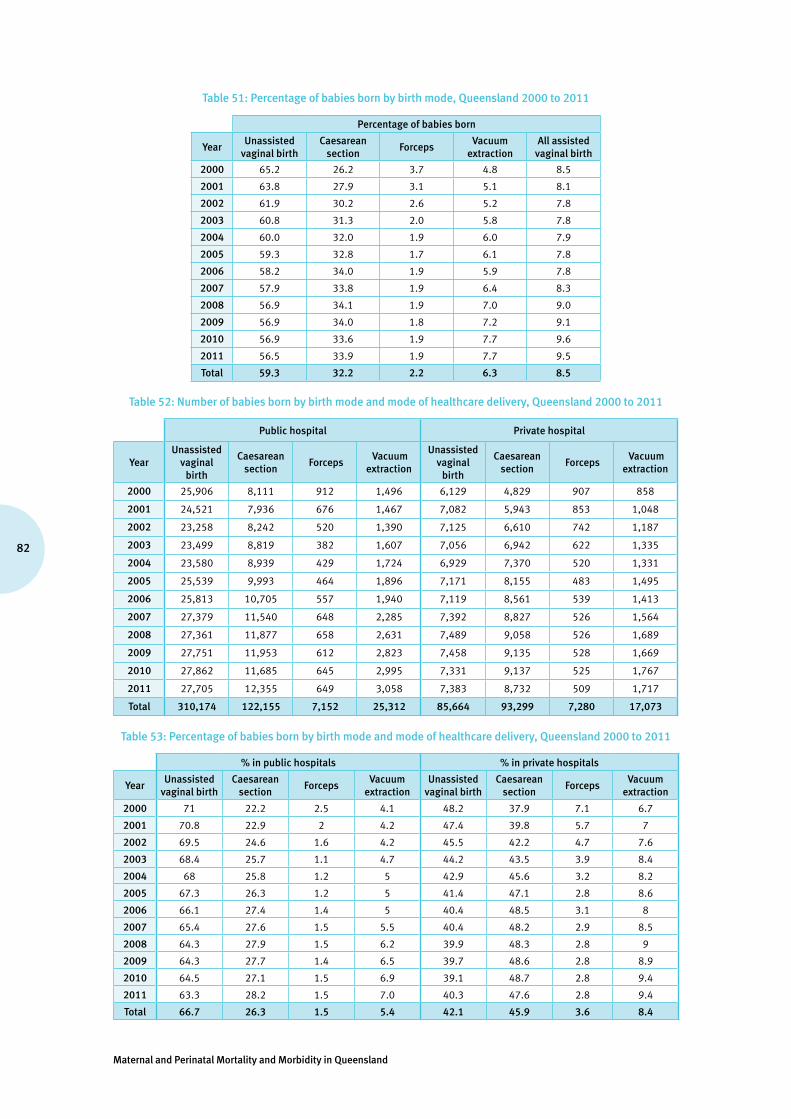
Maternal and Perinatal Mortality and Morbidity in Queensland
82
Table 51: Percentage of babies born by birth mode, Queensland 2000 to 2011
Percentage of babies born
YearUnassisted
vaginal birthCaesarean
section Forceps
Vacuum extraction
All assisted vaginal birth
2000 65.2 26.2 3.7 4.8 8.5
2001 63.8 27.9 3.1 5.1 8.1
2002 61.9 30.2 2.6 5.2 7.8
2003 60.8 31.3 2.0 5.8 7.8
2004 60.0 32.0 1.9 6.0 7.9
2005 59.3 32.8 1.7 6.1 7.8
2006 58.2 34.0 1.9 5.9 7.8
2007 57.9 33.8 1.9 6.4 8.3
2008 56.9 34.1 1.9 7.0 9.0
2009 56.9 34.0 1.8 7.2 9.1
2010 56.9 33.6 1.9 7.7 9.6
2011 56.5 33.9 1.9 7.7 9.5
Total 59.3 32.2 2.2 6.3 8.5
Table 52: Number of babies born by birth mode and mode of healthcare delivery, Queensland 2000 to 2011
Public hospital Private hospital
YearUnassisted
vaginal birth
Caesarean section
Forceps Vacuum
extraction
Unassisted vaginal
birth
Caesarean section
Forceps Vacuum
extraction
2000 25,906 8,111 912 1,496 6,129 4,829 907 858
2001 24,521 7,936 676 1,467 7,082 5,943 853 1,048
2002 23,258 8,242 520 1,390 7,125 6,610 742 1,187
2003 23,499 8,819 382 1,607 7,056 6,942 622 1,335
2004 23,580 8,939 429 1,724 6,929 7,370 520 1,331
2005 25,539 9,993 464 1,896 7,171 8,155 483 1,495
2006 25,813 10,705 557 1,940 7,119 8,561 539 1,413
2007 27,379 11,540 648 2,285 7,392 8,827 526 1,564
2008 27,361 11,877 658 2,631 7,489 9,058 526 1,689
2009 27,751 11,953 612 2,823 7,458 9,135 528 1,669
2010 27,862 11,685 645 2,995 7,331 9,137 525 1,767
2011 27,705 12,355 649 3,058 7,383 8,732 509 1,717
Total 310,174 122,155 7,152 25,312 85,664 93,299 7,280 17,073
Table 53: Percentage of babies born by birth mode and mode of healthcare delivery, Queensland 2000 to 2011
% in public hospitals % in private hospitals
YearUnassisted
vaginal birthCaesarean
section Forceps
Vacuum extraction
Unassisted vaginal birth
Caesarean section
Forceps Vacuum
extraction
2000 71 22.2 2.5 4.1 48.2 37.9 7.1 6.7
2001 70.8 22.9 2 4.2 47.4 39.8 5.7 7
2002 69.5 24.6 1.6 4.2 45.5 42.2 4.7 7.6
2003 68.4 25.7 1.1 4.7 44.2 43.5 3.9 8.4
2004 68 25.8 1.2 5 42.9 45.6 3.2 8.2
2005 67.3 26.3 1.2 5 41.4 47.1 2.8 8.6
2006 66.1 27.4 1.4 5 40.4 48.5 3.1 8
2007 65.4 27.6 1.5 5.5 40.4 48.2 2.9 8.5
2008 64.3 27.9 1.5 6.2 39.9 48.3 2.8 9
2009 64.3 27.7 1.4 6.5 39.7 48.6 2.8 8.9
2010 64.5 27.1 1.5 6.9 39.1 48.7 2.8 9.4
2011 63.3 28.2 1.5 7.0 40.3 47.6 2.8 9.4
Total 66.7 26.3 1.5 5.4 42.1 45.9 3.6 8.4

83
Queensland Maternal and Perinatal Quality Council Report 2013
Table 54: Number of babies born by caesarean section with and without labour by mode of healthcare delivery, Queensland 2000 to 2011
Public hospitals Private hospitals
Year Total birthsCaesarean
section without labour
Caesarean section with
labourTotal births
Caesarean section without
labour
Caesarean section with
labour
2000 36,463 3,969 4,142 12,727 3,011 1,818
2001 34,654 4,049 3,887 14,933 3,749 2,194
2002 33,463 4,308 3,934 15,671 4,439 2,171
2003 34,336 4,462 4,357 15,962 4,758 2,184
2004 34,695 4,750 4,189 16,153 4,999 2,371
2005 37,925 5,270 4,723 17,312 5,552 2,603
2006 39,024 5,562 5,143 17,635 5,877 2,684
2007 41,853 6,011 5,529 18,309 6,079 2,748
2008 42,527 6,152 5,725 18,762 6,118 2,940
2009 43,139 6,222 5,731 18,790 6,300 2,835
2010 43,187 6,100 5,585 18,760 6,508 2,629
2011 43,768 6,504 5,851 18,341 6,090 2,642
Total 465,034 63,359 58,796 203,355 63,480 29,819
Table 55: Percentage of babies born by caesarean section with and without labour by mode of healthcare delivery, Queensland 2000 to 2011
% in public hospitals % in private hospitals
YearCaesarean section
without labourCaesarean section
with labourCaesarean section
without labourCaesarean section
with labour
2000 10.9 11.4 23.7 14.3
2001 11.7 11.2 25.1 14.7
2002 12.9 11.8 28.3 13.9
2003 13.0 12.7 29.8 13.7
2004 13.7 12.1 30.9 14.7
2005 13.9 12.5 32.1 15.0
2006 14.3 13.2 33.3 15.2
2007 14.4 13.2 33.2 15.0
2008 14.5 13.5 32.6 15.7
2009 14.4 13.3 33.5 15.1
2010 14.1 12.9 34.7 14.0
2011 14.9 13.4 33.2 14.4
Total 13.6 12.6 31.2 14.7
Risk ratio = 1.75 (95% confidence limits 1.74, 1.76) of all caesarean sections public vs private hospitals Risk ratio = 2.30 (95% confidence limits 2.28, 2.32) of caesarean sections without labour public vs private hospitals
Risk ratio = 1.13 (95% confidence limits 1.10, 1.14) of caesarean sections with labour public vs private hospitals

Maternal and Perinatal Mortality and Morbidity in Queensland
84
Table 56: Number and percentage of caesarean section births in breech presentation by mode of healthcare delivery, Queensland 2000 to 2011
Year
Public hospital breech presentation
Private hospital breech presentation
All hospital breech presentation
Caesarean section births
Total births
% caesarean sections
Caesarean section births
Total births
% caesarean sections
Caesarean section births
Total births
% caesarean sections
2000 1,381 1,593 86.7 570 630 90.5 1,951 2,223 87.8
2001 1,265 1,408 89.8 697 734 95.0 1,962 2,142 91.6
2002 1,266 1,432 88.4 764 806 94.8 2,030 2,238 90.7
2003 1,324 1,475 89.8 853 887 96.2 2,177 2,362 92.2
2004 1,264 1,419 89.1 789 818 96.5 2,053 2,237 91.8
2005 1,443 1,647 87.6 844 877 96.2 2,287 2,524 90.6
2006 1,399 1,581 88.5 911 938 97.1 2,310 2,519 91.7
2007 1,459 1,664 87.7 967 1,002 96.5 2,426 2,666 91.0
2008 1,538 1,728 89.0 856 886 96.6 2,394 2,614 91.6
2009 1,488 1,700 87.5 877 921 95.2 2,365 2,621 90.2
2010 1,571 1,841 85.3 976 1,043 93.6 2,547 2,884 88.3
2011 1,659 1,911 86.8 1,000 1,053 95.0 2,659 2,964 89.7
Total 17,057 19,399 87.9 10,104 10,595 95.4 27,161 29,994 90.6
Risk ratio = 1.09 (95% confidence limits 1.08, 1.09) of caesarean sections in breech presentation private versus public hospitals
Table 57: Number and incidence of caesarean sections in women having multiple births, Queensland 2008 to 2011
Public hospital multiple pregnancies
Private hospital multiple pregnancies
All multiple pregnancies
YearCaesarean
sectionTotal
multiples
% caesarean sections
Caesarean section
Total multiples
% caesarean sections
Caesarean section
Total multiples
% caesarean sections
2000 259 484 53.5 195 278 70.1 454 762 59.6
2001 250 453 55.2 210 298 70.5 460 751 61.3
2002 290 491 59.1 246 349 70.5 536 840 63.8
2003 284 493 57.6 249 345 72.2 533 838 63.6
2004 280 469 59.7 296 371 79.8 576 840 68.6
2005 353 537 65.7 314 382 82.2 667 919 72.6
2006 357 549 65.0 353 416 84.9 710 965 73.6
2007 427 620 68.9 312 377 82.8 739 997 74.1
2008 422 617 68.4 370 441 83.9 792 1,058 74.9
2009 375 581 64.5 339 427 79.4 714 1,008 70.8
2010 392 595 65.9 332 391 84.9 724 986 73.4
2011 417 602 69.3 338 425 79.5 755 1,027 73.5
Total 4,106 6,491 63.3 3,554 4,500 79.0 7,660 10,991 69.7
Risk ratio = 1.25 (95% confidence limits 1.22, 1.28) of caesarean sections in multiple pregnancies private versus public hospitals

85
Queensland Maternal and Perinatal Quality Council Report 2013
Table 58: Number of women giving birth by Indigenous status and maternal age group, Queensland 2000 to 2011
Maternal age: Indigenous women Maternal age: non-Indigenous women Incomplete data
TotalYear <20 20–34 35+ Total <20 20–34 35+ Total
2000 541 2,052 208 2,801 2,642 36,087 6,985 45,714 9 48,524
2001 525 1,993 175 2,693 2,633 36,304 7,270 46,207 8 48,908
2002 522 1,966 233 2,721 2,544 35,822 7,227 45,593 10 48,324
2003 581 2,038 241 2,860 2,464 36,299 7,881 46,644 8 49,512
2004 533 2,023 211 2,767 2,470 36,505 8,305 47,280 4 50,051
2005 592 2,203 274 3,069 2,477 39,360 9,428 51,265 3 54,337
2006 537 2,121 279 2,937 2,538 40,155 10,075 52,768 14 55,719
2007 599 2,273 298 3,170 2,658 42,261 11,099 56,018 40 59,228
2008 669 2,386 318 3,373 2,787 42,520 11,611 56,918 37 60,328
2009 645 2,366 321 3,332 2,691 43,140 11,837 57,668 24 61,024
2010 698 2,453 354 3,505 2,646 43,083 11,788 57,517 5 61,027
2011 679 2,598 372 3,649 2,440 43,199 11,821 57,460 14 61,123
Total 7,121 26,472 3,284 36,877 30,990 474,735 115,327 621,052 176 658,105
Table 59: Percentage of women giving birth by Indigenous status and maternal age group, Queensland 2000 to 2011
Maternal age: Indigenous women Maternal age: Non-Indigenous women
Year <20 20–34 35+ <20 20–34 35+
2000 19.3 73.3 7.4 5.8 78.9 15.3
2001 19.5 74.0 6.5 5.7 78.6 15.7
2002 19.2 72.3 8.6 5.6 78.6 15.9
2003 20.3 71.3 8.4 5.3 77.8 16.9
2004 19.3 73.1 7.6 5.2 77.2 17.6
2005 19.3 71.8 8.9 4.8 76.8 18.4
2006 18.3 72.2 9.5 4.8 76.1 19.1
2007 18.9 71.7 9.4 4.7 75.4 19.8
2008 19.8 70.7 9.4 4.9 74.7 20.4
2009 19.4 71.0 9.6 4.7 74.8 20.5
2010 19.4 70.0 10.1 4.6 74.9 20.5
2011 18.6 71.2 10.2 4.2 75.2 20.6
Total 19.3 71.8 8.9 5.0 76.4 18.6
Table 60: Number and percentage of women giving birth by Indigenous status and mode of healthcare delivery, Queensland 2000 to 2011
Indigenous Non-Indigenous
% Public care of Indigenous women
% Public care of non-Indigenous womenYear
Public hospital care Total
Public hospital care Total
2000 2,749 2,801 33,211 45,714 98.1 72.6
2001 2,641 2,693 31,537 46,207 98.1 68.3
2002 2,664 2,721 30,286 45,593 97.9 66.4
2003 2,793 2,860 31,034 46,644 97.7 66.5
2004 2,711 2,767 31,503 47,280 98.0 66.6
2005 3,011 3,069 34,361 51,265 98.1 67.0
2006 2,885 2,937 35,566 52,768 98.2 67.4
2007 3,105 3,170 38,078 56,018 97.9 68.0
2008 3,298 3,373 38,571 56,918 97.8 67.8
2009 3,258 3,332 39,269 57,668 97.8 68.1
2010 3,452 3,505 39,124 57,517 98.5 68.0
2011 3,563 3,649 39,570 57,460 97.6 68.9
Total 36,130 36,877 422,110 621,052 98.0 68.0
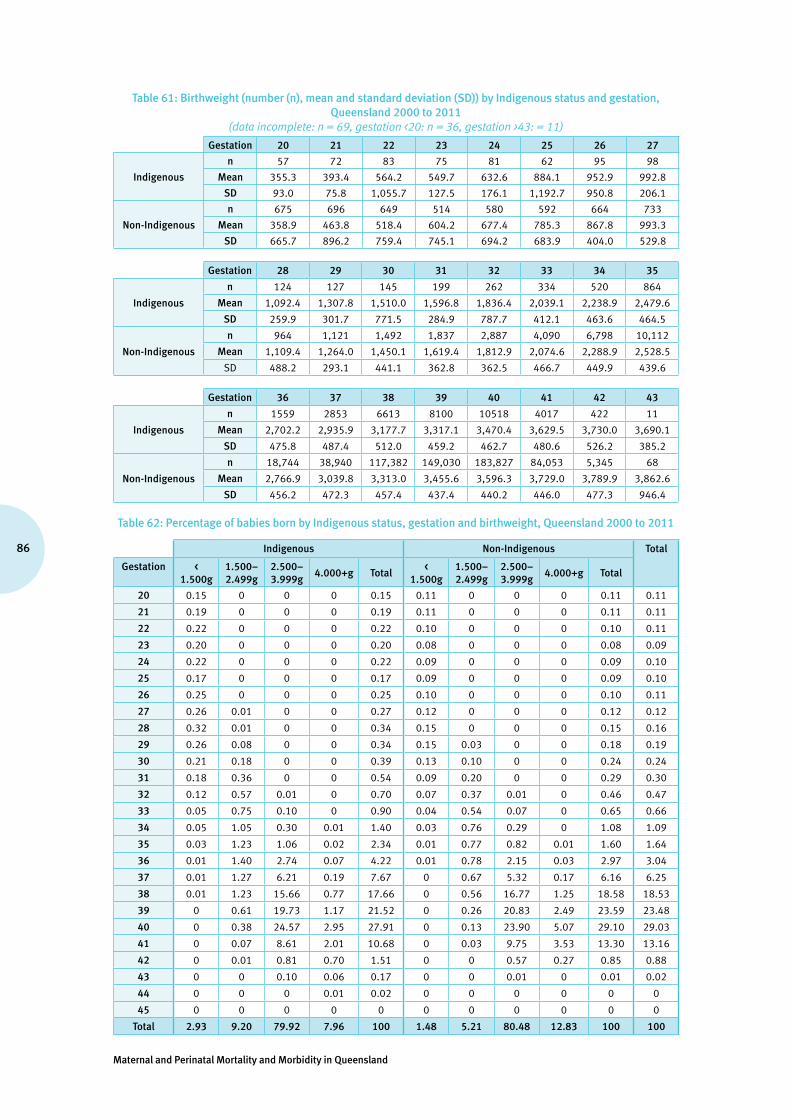
Maternal and Perinatal Mortality and Morbidity in Queensland
86
Table 61: Birthweight (number (n), mean and standard deviation (SD)) by Indigenous status and gestation, Queensland 2000 to 2011
(data incomplete: n = 69, gestation <20: n = 36, gestation >43: = 11)
Gestation 20 21 22 23 24 25 26 27
Indigenous
n 57 72 83 75 81 62 95 98
Mean 355.3 393.4 564.2 549.7 632.6 884.1 952.9 992.8
SD 93.0 75.8 1,055.7 127.5 176.1 1,192.7 950.8 206.1
Non-Indigenous
n 675 696 649 514 580 592 664 733
Mean 358.9 463.8 518.4 604.2 677.4 785.3 867.8 993.3
SD 665.7 896.2 759.4 745.1 694.2 683.9 404.0 529.8
Gestation 28 29 30 31 32 33 34 35
Indigenous
n 124 127 145 199 262 334 520 864
Mean 1,092.4 1,307.8 1,510.0 1,596.8 1,836.4 2,039.1 2,238.9 2,479.6
SD 259.9 301.7 771.5 284.9 787.7 412.1 463.6 464.5
Non-Indigenous
n 964 1,121 1,492 1,837 2,887 4,090 6,798 10,112
Mean 1,109.4 1,264.0 1,450.1 1,619.4 1,812.9 2,074.6 2,288.9 2,528.5
SD 488.2 293.1 441.1 362.8 362.5 466.7 449.9 439.6
Gestation 36 37 38 39 40 41 42 43
Indigenous
n 1559 2853 6613 8100 10518 4017 422 11
Mean 2,702.2 2,935.9 3,177.7 3,317.1 3,470.4 3,629.5 3,730.0 3,690.1
SD 475.8 487.4 512.0 459.2 462.7 480.6 526.2 385.2
Non-Indigenous
n 18,744 38,940 117,382 149,030 183,827 84,053 5,345 68
Mean 2,766.9 3,039.8 3,313.0 3,455.6 3,596.3 3,729.0 3,789.9 3,862.6
SD 456.2 472.3 457.4 437.4 440.2 446.0 477.3 946.4
Table 62: Percentage of babies born by Indigenous status, gestation and birthweight, Queensland 2000 to 2011
Indigenous Non-Indigenous Total
Gestation < 1.500g
1.500–2.499g
2.500–3.999g
4.000+g Total<
1.500g1.500–2.499g
2.500–3.999g
4.000+g Total
20 0.15 0 0 0 0.15 0.11 0 0 0 0.11 0.11
21 0.19 0 0 0 0.19 0.11 0 0 0 0.11 0.11
22 0.22 0 0 0 0.22 0.10 0 0 0 0.10 0.11
23 0.20 0 0 0 0.20 0.08 0 0 0 0.08 0.09
24 0.22 0 0 0 0.22 0.09 0 0 0 0.09 0.10
25 0.17 0 0 0 0.17 0.09 0 0 0 0.09 0.10
26 0.25 0 0 0 0.25 0.10 0 0 0 0.10 0.11
27 0.26 0.01 0 0 0.27 0.12 0 0 0 0.12 0.12
28 0.32 0.01 0 0 0.34 0.15 0 0 0 0.15 0.16
29 0.26 0.08 0 0 0.34 0.15 0.03 0 0 0.18 0.19
30 0.21 0.18 0 0 0.39 0.13 0.10 0 0 0.24 0.24
31 0.18 0.36 0 0 0.54 0.09 0.20 0 0 0.29 0.30
32 0.12 0.57 0.01 0 0.70 0.07 0.37 0.01 0 0.46 0.47
33 0.05 0.75 0.10 0 0.90 0.04 0.54 0.07 0 0.65 0.66
34 0.05 1.05 0.30 0.01 1.40 0.03 0.76 0.29 0 1.08 1.09
35 0.03 1.23 1.06 0.02 2.34 0.01 0.77 0.82 0.01 1.60 1.64
36 0.01 1.40 2.74 0.07 4.22 0.01 0.78 2.15 0.03 2.97 3.04
37 0.01 1.27 6.21 0.19 7.67 0 0.67 5.32 0.17 6.16 6.25
38 0.01 1.23 15.66 0.77 17.66 0 0.56 16.77 1.25 18.58 18.53
39 0 0.61 19.73 1.17 21.52 0 0.26 20.83 2.49 23.59 23.48
40 0 0.38 24.57 2.95 27.91 0 0.13 23.90 5.07 29.10 29.03
41 0 0.07 8.61 2.01 10.68 0 0.03 9.75 3.53 13.30 13.16
42 0 0.01 0.81 0.70 1.51 0 0 0.57 0.27 0.85 0.88
43 0 0 0.10 0.06 0.17 0 0 0.01 0 0.01 0.02
44 0 0 0 0.01 0.02 0 0 0 0 0 0
45 0 0 0 0 0 0 0 0 0 0 0
Total 2.93 9.20 79.92 7.96 100 1.48 5.21 80.48 12.83 100 100

87
Queensland Maternal and Perinatal Quality Council Report 2013
Table 63: Percentage of women smoking at less than 20 weeks gestation during pregnancy by Indigenous status, Queensland 2010 to 2011
(data collection for this item commenced mid–2009)
Indigenous status
YearIdentifies as Aboriginal and/or
Torres Strait IslanderDoes not identify as Aboriginal
and/or Torres Strait IslanderAll women giving birth
2010 53.2 14.9 17.1
2011 49.5 13.8 16.0
Total 51.3 14.4 16.6
Table 64: Percentage of women smoking after 20 weeks gestation during pregnancy by Indigenous status, Queensland 2010 to 2011
(data collection for this item commenced mid–2009)
Indigenous Status
YearIdentifies as Aboriginal and/or
Torres Strait IslanderDoes not identify as Aboriginal
and/or Torres Strait IslanderAll women giving birth
2010 46.0 12.0 13.9
2011 44.8 11.3 13.3
Total 45.4 11.6 13.6
Table 65: Percentage of women attending five or more antenatal visits during pregnancy by Indigenous status, Queensland 2008 to 2011
Indigenous Status
YearIdentifies as Aboriginal and/or
Torres Strait IslanderDoes not identify as Aboriginal
and/or Torres Strait IslanderAll women giving birth
2008 76.3 93.5 92.5
2009 77.8 94.2 93.3
2010 77.7 94.5 93.5
2011 83.4 95.3 94.6
Total 78.9 94.4 93.5
Table 66: Percentage of babies born with birthweight less than 2500 grams by Indigenous status, Queensland 2008 to 2011
Indigenous Status
YearIdentifies as Aboriginal and/or
Torres Strait IslanderDoes not identify as Aboriginal
and/or Torres Strait IslanderAll women giving birth
2008 10.9 % 6.5 % 6.8 %
2009 11.6 % 6.8 % 7.1 %
2010 12.1 % 6.6 % 6.9 %
2011 12.0 % 6.6 % 6.9 %
Total 11.4 % 6.5 % 6.6 %
Risk ratio = 1.76 (95% confidence limits 1.68, 1.85) of Indigenous vs non-Indigenous birthweight less than 2500g

Maternal and Perinatal Mortality and Morbidity in Queensland
88
Table 67: Number of women giving birth by mode of birth and previous pregnancy, Queensland 2000 to 2011(data incomplete: n = 195)
No previous pregnancies Previous pregnancies
YearUnassisted
vaginal birth Assisted vaginal
birth Caesarean
section Unassisted
vaginal birthAssisted vaginal
birth Caesarean
section
2000 8,196 2,435 3,943 23,712 1,699 8,497
2001 8,019 2,334 4,269 23,457 1,663 9,107
2002 7,426 2,264 4,638 22,783 1,528 9,625
2003 7,758 2,319 4,760 22,622 1,586 10,432
2004 7,865 2,348 4,785 22,489 1,626 10,911
2005 8,169 2,575 5,358 24,395 1,723 12,077
2006 8,124 2,624 5,709 24,661 1,791 12,797
2007 8,691 2,973 6,012 25,963 2,007 13,581
2008 8,665 3,163 5,876 26,111 2,282 14,230
2009 8,888 3,247 6,018 26,212 2,336 14,322
2010 8,969 3,471 5,775 26,108 2,421 14,283
2011 8,924 3,481 5,982 26,106 2,404 14,310
Total 99,694 33,234 63,125 294,619 23,066 144,172
Table 68: Incidence of mode of birth by previous pregnancy, Queensland 2000 to 2011
% of unassisted vaginal births % of assisted vaginal births % of caesarean sections
YearNo previous pregnancies
Previous pregnancies
No previous pregnancies
Previous pregnancies
No previous pregnancies
Previous pregnancies
2000 56.2 69.9 16.7 5.0 27.0 25.0
2001 54.8 68.4 16.0 4.9 29.2 26.6
2002 51.8 67.0 15.8 4.5 32.3 28.3
2003 52.3 65.2 15.6 4.6 32.1 30.1
2004 52.4 64.2 15.7 4.6 31.9 31.1
2005 50.7 63.8 16.0 4.5 33.3 31.6
2006 49.4 62.8 15.9 4.6 34.7 32.6
2007 49.2 62.5 16.8 4.8 34.0 32.7
2008 48.9 61.3 17.9 5.4 33.2 33.4
2009 49.0 61.1 17.9 5.4 33.2 33.4
2010 49.2 61.0 19.1 5.7 31.7 33.4
2011 48.5 61.0 18.9 5.6 32.5 33.4
Total 50.9 63.8 17.0 5.0 32.2 31.2
Total 59.9 8.5 31.5
Table 69: Number of women giving birth by mode of birth and previous caesarean section, Queensland 2001 to 2011
(data incomplete: n = 3,876)
No previous caesarean sections
YearUnassisted
vaginal birthAssisted
vaginal birth Caesarean
section
2001 27,263 3,671 7,654
2002 27,194 3,550 8,489
2003 28,684 3,717 9,109
2004 29,091 3,789 9,240
2005 31,316 4,102 10,062
2006 31,510 4,217 10,558
2007 33,256 4,744 11,084
2008 33,277 5,150 11,050
2009 33,664 5,323 11,145
2010 33,630 5,631 10,833
2011 33,636 5,608 11,166
Total 342,521 49,502 110,390

89
Queensland Maternal and Perinatal Quality Council Report 2013
Table 69: Number of women giving birth by mode of birth and previous caesarean section, Queensland 2001 to 2011 (data incomplete: n = 3,876)
continued
One previous caesarean section
YearUnassisted
vaginal birthAssisted
vaginal birth Caesarean
section
2001 1,155 160 3,379
2002 1,149 157 3,944
2003 1,083 162 4,488
2004 1,225 182 4,858
2005 1,199 188 5,465
2006 1,223 188 5,849
2007 1,341 220 6,194
2008 1,383 268 6,458
2009 1,366 247 6,648
2010 1,395 254 6,481
2011 1,253 272 6,523
Total 13,772 2,298 60,287
More than one previous caesarean section
YearUnassisted
vaginal birthAssisted
vaginal birth Caesarean
section
2001 42 1 1,263
2002 49 2 1,320
2003 49 3 1,427
2004 31 3 1,599
2005 44 4 1,905
2006 37 4 2,091
2007 39 5 2,300
2008 59 7 2,556
2009 39 1 2,527
2010 50 7 2,744
2011 53 5 2,604
Total 492 42 22,336
Table 70: Percentage of mode of birth by previous caesarean section, Queensland 2001 to 2011
% unassisted vaginal birth % caesarean section
YearNo previous caesarean sections
One previous caesarean
section
More than one previous
caesarean section
No previous caesarean sections
One previous caesarean
section
More than one previous
caesarean section
2001 70.7 24.6 3.2 19.8 72.0 96.7
2002 69.3 21.9 3.6 21.6 75.1 96.3
2003 69.1 18.9 3.3 21.9 78.3 96.5
2004 69.1 19.6 1.9 21.9 77.5 97.9
2005 68.9 17.5 2.3 22.1 79.8 97.5
2006 68.1 16.8 1.7 22.8 80.6 98.1
2007 67.8 17.3 1.7 22.6 79.9 98.1
2008 67.3 17.1 2.3 22.3 79.6 97.5
2009 67.2 16.5 1.5 22.2 80.5 98.4
2010 67.1 17.2 1.8 21.6 79.7 98.0
2011 66.7 15.6 2.0 22.2 81.1 97.8
Total 68.2 18.0 2.2 22.0 79.0 97.7
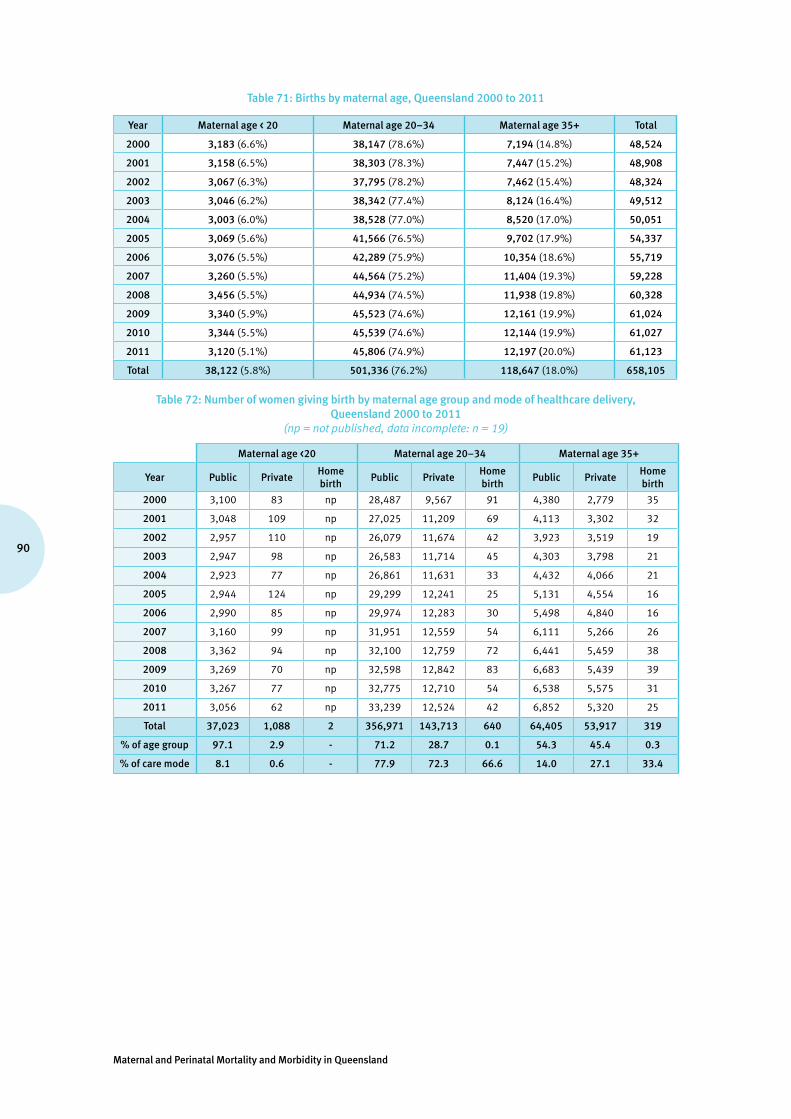
Maternal and Perinatal Mortality and Morbidity in Queensland
90
Table 71: Births by maternal age, Queensland 2000 to 2011
Year Maternal age < 20 Maternal age 20–34 Maternal age 35+ Total
2000 3,183 (6.6%) 38,147 (78.6%) 7,194 (14.8%) 48,524
2001 3,158 (6.5%) 38,303 (78.3%) 7,447 (15.2%) 48,908
2002 3,067 (6.3%) 37,795 (78.2%) 7,462 (15.4%) 48,324
2003 3,046 (6.2%) 38,342 (77.4%) 8,124 (16.4%) 49,512
2004 3,003 (6.0%) 38,528 (77.0%) 8,520 (17.0%) 50,051
2005 3,069 (5.6%) 41,566 (76.5%) 9,702 (17.9%) 54,337
2006 3,076 (5.5%) 42,289 (75.9%) 10,354 (18.6%) 55,719
2007 3,260 (5.5%) 44,564 (75.2%) 11,404 (19.3%) 59,228
2008 3,456 (5.5%) 44,934 (74.5%) 11,938 (19.8%) 60,328
2009 3,340 (5.9%) 45,523 (74.6%) 12,161 (19.9%) 61,024
2010 3,344 (5.5%) 45,539 (74.6%) 12,144 (19.9%) 61,027
2011 3,120 (5.1%) 45,806 (74.9%) 12,197 (20.0%) 61,123
Total 38,122 (5.8%) 501,336 (76.2%) 118,647 (18.0%) 658,105
Table 72: Number of women giving birth by maternal age group and mode of healthcare delivery, Queensland 2000 to 2011
(np = not published, data incomplete: n = 19)
Maternal age <20 Maternal age 20–34 Maternal age 35+
Year Public PrivateHome birth
Public PrivateHome birth
Public PrivateHome birth
2000 3,100 83 np 28,487 9,567 91 4,380 2,779 35
2001 3,048 109 np 27,025 11,209 69 4,113 3,302 32
2002 2,957 110 np 26,079 11,674 42 3,923 3,519 19
2003 2,947 98 np 26,583 11,714 45 4,303 3,798 21
2004 2,923 77 np 26,861 11,631 33 4,432 4,066 21
2005 2,944 124 np 29,299 12,241 25 5,131 4,554 16
2006 2,990 85 np 29,974 12,283 30 5,498 4,840 16
2007 3,160 99 np 31,951 12,559 54 6,111 5,266 26
2008 3,362 94 np 32,100 12,759 72 6,441 5,459 38
2009 3,269 70 np 32,598 12,842 83 6,683 5,439 39
2010 3,267 77 np 32,775 12,710 54 6,538 5,575 31
2011 3,056 62 np 33,239 12,524 42 6,852 5,320 25
Total 37,023 1,088 2 356,971 143,713 640 64,405 53,917 319
% of age group 97.1 2.9 - 71.2 28.7 0.1 54.3 45.4 0.3
% of care mode 8.1 0.6 - 77.9 72.3 66.6 14.0 27.1 33.4

91
Queensland Maternal and Perinatal Quality Council Report 2013
Table 73: Number of women giving birth by maternal age group and plurality, Queensland 2000 to 2011
Pregnancy plurality
Maternal age Singleton Twins higher multiple%
Twins%
higher multiple%
all multiple
20 or less 56,079 412 4 0.7 0.01 0.7
21–25 127,096 1,444 17 1.1 0.01 1.1
26–30 198,049 3,126 75 1.6 0.04 1.6
31–35 178,502 3,655 108 2.0 0.06 2.1
36 or more 87,386 2,089 63 2.3 0.07 2.4
Total 647,112 10,726 267 1.6 0.04 1.7
Table 74: Number and percentage of babies born by maternal age group and gestation at birth, Queensland 2000 to 2011 (data incomplete: n = 69)
Gestation at birth
Maternal age33 weeks or less 34–38 weeks 39 weeks or more Total
n % n % n % n %
20 or less 1,984 0.3 14,075 2.1 40,835 6.1 56,915 8.5
21–25 3,642 0.5 34,151 5.1 92,230 13.8 130,036 19.4
26–30 5,436 0.8 59,889 9.0 139,194 20.8 204,536 30.6
31–35 5,142 0.8 61,580 9.2 119,406 17.8 186,138 27.8
36 or more 3,161 0.5 34,745 5.2 53,840 8.0 91,754 13.7
Total 19,365 2.9 204,440 30.5 445,505 66.6 669,379 100
Table 75: Number of babies born by maternal age group and need for admission to NICU or SCN, Queensland 2000 to 2011
Babies requiring NICU/SCN admission
Maternal ageNICU/SCN No NICU/SCN
n % n %
20 or less 10,019 17.6 46,896 82.4
21–25 21,042 16.2 108,994 83.8
26–30 31,573 15.4 172,963 84.6
31–35 29,092 15.6 157,046 84.4
36 or more 16,952 18.5 74,802 81.5
Total 108,678 16.2 560,701 83.8

Maternal and Perinatal Mortality and Morbidity in Queensland
92
Tabl
e 76
: Num
ber a
nd p
erce
ntag
e of
bir
ths
by m
ater
nal a
ge a
nd g
esta
tion
at b
irth
, Que
ensl
and
2000
to 2
011
(dat
a in
com
plet
e: n
= 6
8, p
erce
ntag
es a
re o
f tot
al in
eac
h ag
e gr
oup
for t
hat y
ear)
Mat
erna
l age
Ges
tati
on20
0020
0120
0220
0320
0420
0520
0620
0720
0820
0920
1020
11To
tal N
o an
d %
<20
23 w
eeks
or l
ess
2522
1612
2121
1719
2118
1613
221
0.8
0.7
0.5
0.4
0.7
0.7
0.6
0.6
0.6
0.5
0.5
0.4
0.6
24–
27 w
eeks
1523
1216
1320
2720
2515
2623
235
0.5
0.7
0.4
0.5
0.4
0.7
0.9
0.6
0.7
0.4
0.8
0.7
0.6
28–
33 w
eeks
8752
5865
7559
5780
8086
7770
846
2.7
1.6
1.9
2.1
2.5
1.9
1.9
2.5
2.3
2.6
2.3
2.2
2.2
34–
36 w
eeks
194
182
164
189
164
188
182
188
191
178
196
172
2,18
86.
15.
85.
46.
25.
56.
15.
95.
85.
55.
35.
95.
55.
7
37–
39 w
eeks
1,11
31,
136
1,15
71,
203
1,14
81,
219
1,23
61,
261
1,41
51,
395
1,46
61,
416
15,1
6535
.036
.037
.739
.538
.339
.740
.238
.740
.941
.843
.845
.439
.8
40–
41 w
eeks
1,67
21,
691
1,59
61,
521
1,55
31,
526
1,52
71,
656
1,70
01,
625
1,54
51,
412
19,0
2452
.653
.552
.150
.051
.749
.749
.750
.849
.248
.746
.245
.349
.9
42 w
eeks
or m
ore
7252
6239
2735
2933
2420
1814
425
2.3
1.6
2.0
1.3
0.9
1.1
0.9
1.0
0.7
0.6
0.5
0.4
1.1
20–
34
23 w
eeks
or l
ess
130
148
116
120
143
143
170
195
161
185
168
170
1,84
90.
30.
40.
30.
30.
40.
30.
40.
40.
40.
40.
40.
40.
4
24–
27 w
eeks
147
135
147
137
137
137
169
129
163
173
170
170
1,81
40.
40.
40.
40.
40.
40.
30.
40.
30.
40.
40.
40.
40.
4
28–
33 w
eeks
614
568
657
640
676
720
773
734
723
735
758
747
8,34
51.
61.
51.
71.
71.
81.
71.
81.
61.
61.
61.
71.
61.
7
34–
36 w
eeks
1,85
61,
819
1,85
51,
906
1,97
92,
095
2,18
92,
317
2,26
32,
376
2,27
62,
321
25,2
524.
94.
74.
95.
05.
15.
05.
25.
25.
05.
25.
05.
15.
0
37–
39 w
eeks
16,0
9316
,205
16,7
3917
,365
17,9
7219
,674
20,4
0021
,397
22,1
6022
,664
23,2
1323
,916
237,
798
42.2
42.3
44.3
45.3
46.7
47.3
48.2
48.0
49.3
49.8
51.0
52.2
47.4
40–
41 w
eeks
18,5
9018
,860
17,7
8817
,792
17,3
1118
,519
18,3
3719
,500
19,1
6319
,074
18,6
8518
,201
221,
820
48.7
49.2
47.1
46.4
44.9
44.6
43.4
43.8
42.7
41.9
41.0
39.7
44.2
42 w
eeks
or m
ore
713
567
493
381
305
275
246
284
297
314
264
279
4,41
81.
91.
51.
31.
00.
80.
70.
60.
60.
70.
70.
60.
60.
9
35+
23 w
eeks
or l
ess
4932
3822
3745
5246
5245
7259
549
0.7
0.4
0.5
0.3
0.4
0.5
0.5
0.4
0.4
0.4
0.6
0.5
0.5
24–
27 w
eeks
3335
3136
4754
4136
4448
4865
518
0.5
0.5
0.4
0.4
0.6
0.6
0.4
0.3
0.4
0.4
0.4
0.5
0.4
28–
33 w
eeks
157
152
152
175
166
174
189
227
216
247
230
233
2,31
82.
22.
02.
02.
21.
91.
81.
82.
01.
82.
01.
91.
92.
0
34–
36 w
eeks
390
451
430
447
493
608
635
652
700
706
724
768
7,00
45.
46.
15.
85.
55.
86.
36.
15.
75.
95.
86.
06.
35.
9
37–
39 w
eeks
3,58
53,
759
3,92
74,
331
4,57
65,
272
5,76
36,
401
6,69
77,
029
7,08
87,
219
65,6
4749
.850
.552
.653
.353
.754
.355
.756
.156
.157
.858
.459
.255
.3
40–
41 w
eeks
2,83
12,
919
2,81
93,
041
3,11
63,
480
3,60
73,
945
4,13
03,
996
3,90
73,
793
41,5
8439
.439
.237
.837
.436
.635
.934
.834
.634
.632
.932
.231
.135
.1
42 w
eeks
or m
ore
148
9965
7185
6967
9798
8874
561,
017
2.1
1.3
0.9
0.9
1.0
0.7
0.6
0.9
0.8
0.7
0.6
0.5
0.9
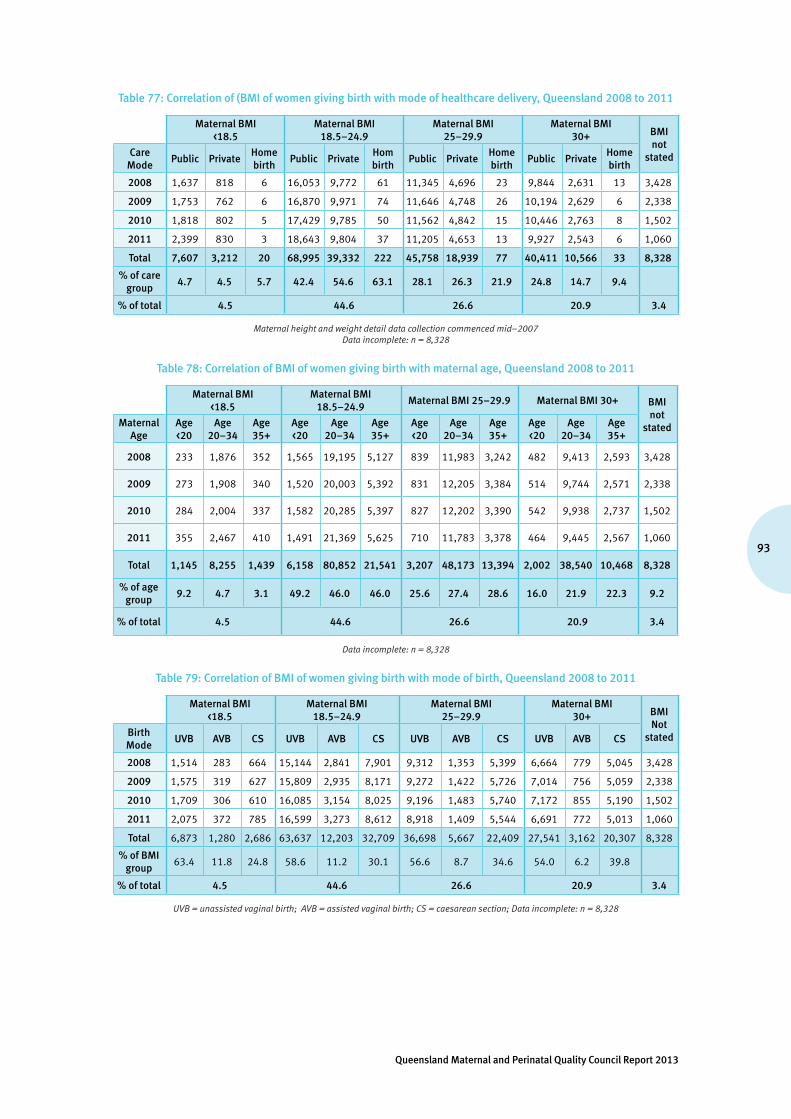
93
Queensland Maternal and Perinatal Quality Council Report 2013
Table 77: Correlation of (BMI of women giving birth with mode of healthcare delivery, Queensland 2008 to 2011
Maternal BMI <18.5
Maternal BMI 18.5–24.9
Maternal BMI 25–29.9
Maternal BMI 30+ BMI
not statedCare
ModePublic Private
Home birth
Public PrivateHom birth
Public PrivateHome birth
Public PrivateHome birth
2008 1,637 818 6 16,053 9,772 61 11,345 4,696 23 9,844 2,631 13 3,428
2009 1,753 762 6 16,870 9,971 74 11,646 4,748 26 10,194 2,629 6 2,338
2010 1,818 802 5 17,429 9,785 50 11,562 4,842 15 10,446 2,763 8 1,502
2011 2,399 830 3 18,643 9,804 37 11,205 4,653 13 9,927 2,543 6 1,060
Total 7,607 3,212 20 68,995 39,332 222 45,758 18,939 77 40,411 10,566 33 8,328
% of care group
4.7 4.5 5.7 42.4 54.6 63.1 28.1 26.3 21.9 24.8 14.7 9.4
% of total 4.5 44.6 26.6 20.9 3.4
Maternal height and weight detail data collection commenced mid–2007 Data incomplete: n = 8,328
Table 78: Correlation of BMI of women giving birth with maternal age, Queensland 2008 to 2011
Maternal BMI <18.5
Maternal BMI 18.5–24.9
Maternal BMI 25–29.9 Maternal BMI 30+ BMI not
statedMaternal Age
Age <20
Age 20–34
Age 35+
Age <20
Age 20–34
Age 35+
Age <20
Age 20–34
Age 35+
Age <20
Age 20–34
Age 35+
2008 233 1,876 352 1,565 19,195 5,127 839 11,983 3,242 482 9,413 2,593 3,428
2009 273 1,908 340 1,520 20,003 5,392 831 12,205 3,384 514 9,744 2,571 2,338
2010 284 2,004 337 1,582 20,285 5,397 827 12,202 3,390 542 9,938 2,737 1,502
2011 355 2,467 410 1,491 21,369 5,625 710 11,783 3,378 464 9,445 2,567 1,060
Total 1,145 8,255 1,439 6,158 80,852 21,541 3,207 48,173 13,394 2,002 38,540 10,468 8,328
% of age group
9.2 4.7 3.1 49.2 46.0 46.0 25.6 27.4 28.6 16.0 21.9 22.3 9.2
% of total 4.5 44.6 26.6 20.9 3.4
Data incomplete: n = 8,328
Table 79: Correlation of BMI of women giving birth with mode of birth, Queensland 2008 to 2011
Maternal BMI <18.5
Maternal BMI 18.5–24.9
Maternal BMI 25–29.9
Maternal BMI 30+ BMI
Not statedBirth
ModeUVB AVB CS UVB AVB CS UVB AVB CS UVB AVB CS
2008 1,514 283 664 15,144 2,841 7,901 9,312 1,353 5,399 6,664 779 5,045 3,428
2009 1,575 319 627 15,809 2,935 8,171 9,272 1,422 5,726 7,014 756 5,059 2,338
2010 1,709 306 610 16,085 3,154 8,025 9,196 1,483 5,740 7,172 855 5,190 1,502
2011 2,075 372 785 16,599 3,273 8,612 8,918 1,409 5,544 6,691 772 5,013 1,060
Total 6,873 1,280 2,686 63,637 12,203 32,709 36,698 5,667 22,409 27,541 3,162 20,307 8,328
% of BMI group
63.4 11.8 24.8 58.6 11.2 30.1 56.6 8.7 34.6 54.0 6.2 39.8
% of total 4.5 44.6 26.6 20.9 3.4
UVB = unassisted vaginal birth; AVB = assisted vaginal birth; CS = caesarean section; Data incomplete: n = 8,328
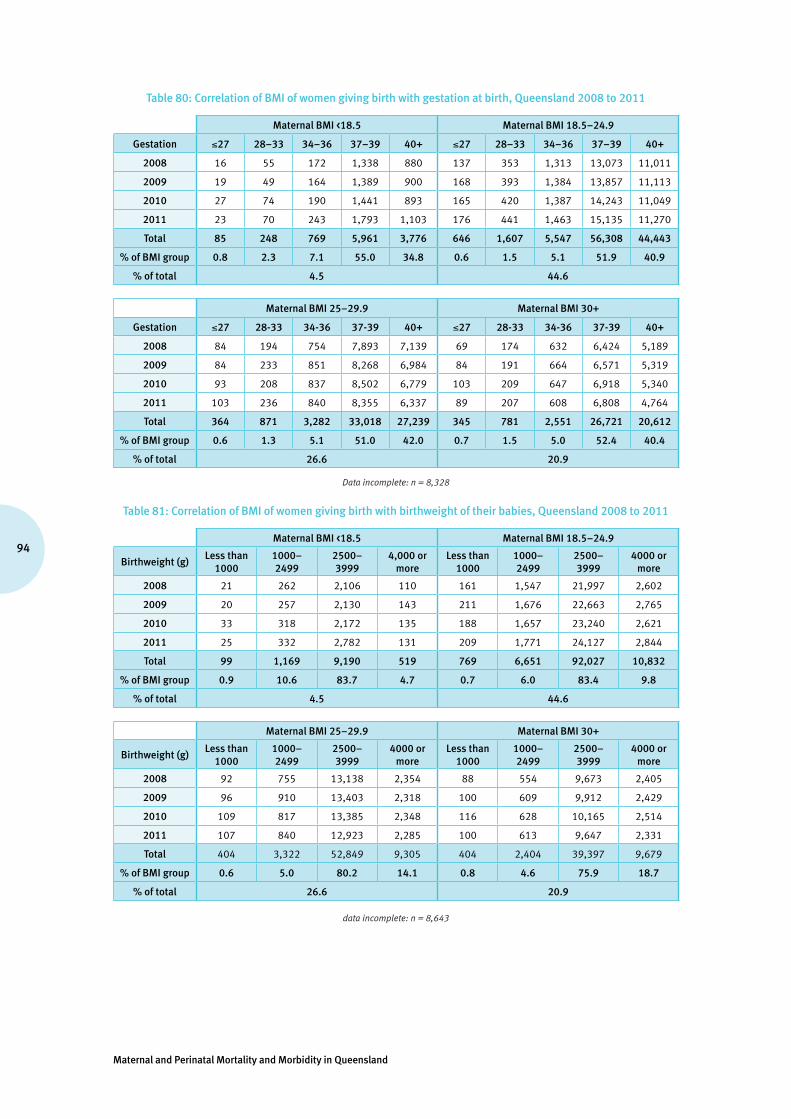
Maternal and Perinatal Mortality and Morbidity in Queensland
94
Table 80: Correlation of BMI of women giving birth with gestation at birth, Queensland 2008 to 2011
Maternal BMI <18.5 Maternal BMI 18.5–24.9
Gestation ≤27 28–33 34–36 37–39 40+ ≤27 28–33 34–36 37–39 40+
2008 16 55 172 1,338 880 137 353 1,313 13,073 11,011
2009 19 49 164 1,389 900 168 393 1,384 13,857 11,113
2010 27 74 190 1,441 893 165 420 1,387 14,243 11,049
2011 23 70 243 1,793 1,103 176 441 1,463 15,135 11,270
Total 85 248 769 5,961 3,776 646 1,607 5,547 56,308 44,443
% of BMI group 0.8 2.3 7.1 55.0 34.8 0.6 1.5 5.1 51.9 40.9
% of total 4.5 44.6
Maternal BMI 25–29.9 Maternal BMI 30+
Gestation ≤27 28-33 34-36 37-39 40+ ≤27 28-33 34-36 37-39 40+
2008 84 194 754 7,893 7,139 69 174 632 6,424 5,189
2009 84 233 851 8,268 6,984 84 191 664 6,571 5,319
2010 93 208 837 8,502 6,779 103 209 647 6,918 5,340
2011 103 236 840 8,355 6,337 89 207 608 6,808 4,764
Total 364 871 3,282 33,018 27,239 345 781 2,551 26,721 20,612
% of BMI group 0.6 1.3 5.1 51.0 42.0 0.7 1.5 5.0 52.4 40.4
% of total 26.6 20.9
Data incomplete: n = 8,328
Table 81: Correlation of BMI of women giving birth with birthweight of their babies, Queensland 2008 to 2011
Maternal BMI <18.5 Maternal BMI 18.5–24.9
Birthweight (g)Less than
10001000–2499
2500–3999
4,000 or more
Less than 1000
1000–2499
2500–3999
4000 or more
2008 21 262 2,106 110 161 1,547 21,997 2,602
2009 20 257 2,130 143 211 1,676 22,663 2,765
2010 33 318 2,172 135 188 1,657 23,240 2,621
2011 25 332 2,782 131 209 1,771 24,127 2,844
Total 99 1,169 9,190 519 769 6,651 92,027 10,832
% of BMI group 0.9 10.6 83.7 4.7 0.7 6.0 83.4 9.8
% of total 4.5 44.6
Maternal BMI 25–29.9 Maternal BMI 30+
Birthweight (g)Less than
10001000–2499
2500–3999
4000 or more
Less than 1000
1000–2499
2500–3999
4000 or more
2008 92 755 13,138 2,354 88 554 9,673 2,405
2009 96 910 13,403 2,318 100 609 9,912 2,429
2010 109 817 13,385 2,348 116 628 10,165 2,514
2011 107 840 12,923 2,285 100 613 9,647 2,331
Total 404 3,322 52,849 9,305 404 2,404 39,397 9,679
% of BMI group 0.6 5.0 80.2 14.1 0.8 4.6 75.9 18.7
% of total 26.6 20.9
data incomplete: n = 8,643
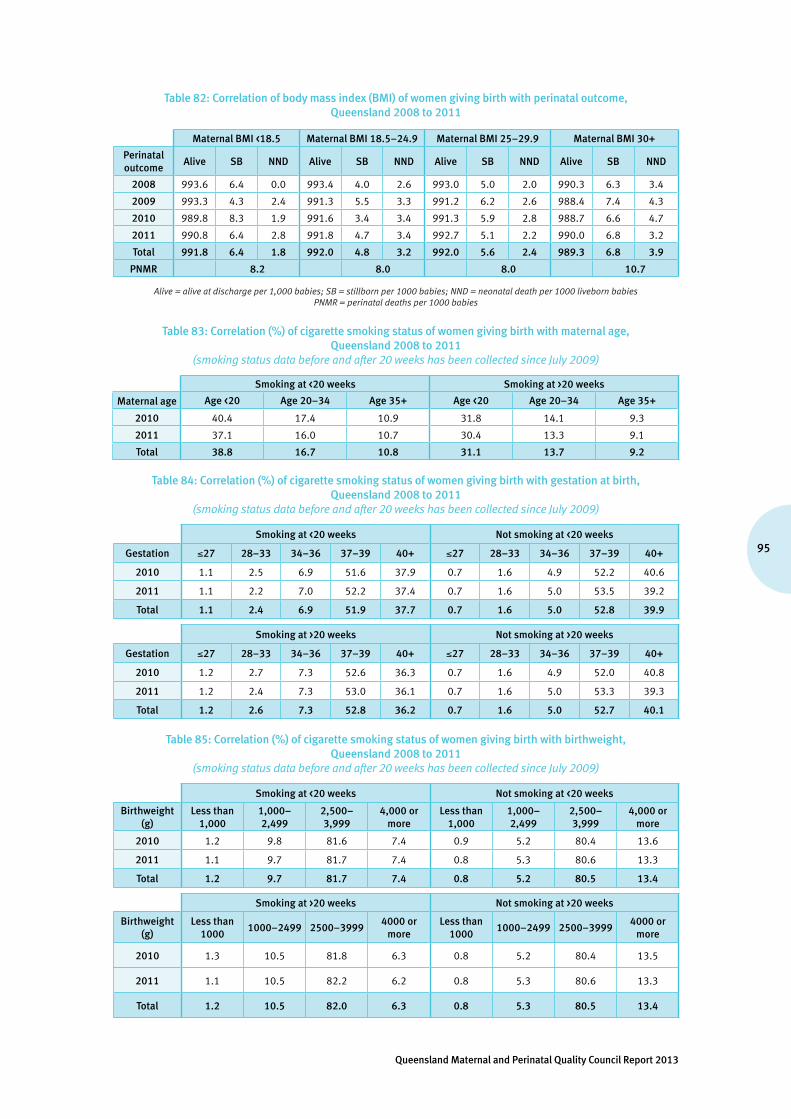
95
Queensland Maternal and Perinatal Quality Council Report 2013
Table 82: Correlation of body mass index (BMI) of women giving birth with perinatal outcome, Queensland 2008 to 2011
Maternal BMI <18.5 Maternal BMI 18.5–24.9 Maternal BMI 25–29.9 Maternal BMI 30+
Perinatal outcome
Alive SB NND Alive SB NND Alive SB NND Alive SB NND
2008 993.6 6.4 0.0 993.4 4.0 2.6 993.0 5.0 2.0 990.3 6.3 3.4
2009 993.3 4.3 2.4 991.3 5.5 3.3 991.2 6.2 2.6 988.4 7.4 4.3
2010 989.8 8.3 1.9 991.6 3.4 3.4 991.3 5.9 2.8 988.7 6.6 4.7
2011 990.8 6.4 2.8 991.8 4.7 3.4 992.7 5.1 2.2 990.0 6.8 3.2
Total 991.8 6.4 1.8 992.0 4.8 3.2 992.0 5.6 2.4 989.3 6.8 3.9
PNMR 8.2 8.0 8.0 10.7
Alive = alive at discharge per 1,000 babies; SB = stillborn per 1000 babies; NND = neonatal death per 1000 liveborn babies PNMR = perinatal deaths per 1000 babies
Table 83: Correlation (%) of cigarette smoking status of women giving birth with maternal age, Queensland 2008 to 2011
(smoking status data before and after 20 weeks has been collected since July 2009)
Smoking at <20 weeks Smoking at >20 weeks
Maternal age Age <20 Age 20–34 Age 35+ Age <20 Age 20–34 Age 35+
2010 40.4 17.4 10.9 31.8 14.1 9.3
2011 37.1 16.0 10.7 30.4 13.3 9.1
Total 38.8 16.7 10.8 31.1 13.7 9.2
Table 84: Correlation (%) of cigarette smoking status of women giving birth with gestation at birth, Queensland 2008 to 2011
(smoking status data before and after 20 weeks has been collected since July 2009)
Smoking at <20 weeks Not smoking at <20 weeks
Gestation ≤27 28–33 34–36 37–39 40+ ≤27 28–33 34–36 37–39 40+
2010 1.1 2.5 6.9 51.6 37.9 0.7 1.6 4.9 52.2 40.6
2011 1.1 2.2 7.0 52.2 37.4 0.7 1.6 5.0 53.5 39.2
Total 1.1 2.4 6.9 51.9 37.7 0.7 1.6 5.0 52.8 39.9
Smoking at >20 weeks Not smoking at >20 weeks
Gestation ≤27 28–33 34–36 37–39 40+ ≤27 28–33 34–36 37–39 40+
2010 1.2 2.7 7.3 52.6 36.3 0.7 1.6 4.9 52.0 40.8
2011 1.2 2.4 7.3 53.0 36.1 0.7 1.6 5.0 53.3 39.3
Total 1.2 2.6 7.3 52.8 36.2 0.7 1.6 5.0 52.7 40.1
Table 85: Correlation (%) of cigarette smoking status of women giving birth with birthweight, Queensland 2008 to 2011
(smoking status data before and after 20 weeks has been collected since July 2009)
Smoking at <20 weeks Not smoking at <20 weeks
Birthweight (g)
Less than 1,000
1,000–2,499
2,500–3,999
4,000 or more
Less than 1,000
1,000–2,499
2,500–3,999
4,000 or more
2010 1.2 9.8 81.6 7.4 0.9 5.2 80.4 13.6
2011 1.1 9.7 81.7 7.4 0.8 5.3 80.6 13.3
Total 1.2 9.7 81.7 7.4 0.8 5.2 80.5 13.4
Smoking at >20 weeks Not smoking at >20 weeks
Birthweight (g)
Less than 1000
1000–2499 2500–39994000 or
moreLess than
10001000–2499 2500–3999
4000 or more
2010 1.3 10.5 81.8 6.3 0.8 5.2 80.4 13.5
2011 1.1 10.5 82.2 6.2 0.8 5.3 80.6 13.3
Total 1.2 10.5 82.0 6.3 0.8 5.3 80.5 13.4

Maternal and Perinatal Mortality and Morbidity in Queensland
96
Table 86: Correlation of cigarette smoking status of women giving birth with perinatal outcome, Queensland 2008 to 2011
(smoking status data before and after 20 weeks has been collected since July 2009)
Smoking at <20 weeks Not smoking at <20 weeks
Perinatal outcome Alive SB NND Alive SB NND
2010 985.5 8.7 5.8 990.5 6.0 3.5
2011 986.1 8.3 5.6 991.2 5.9 2.9
Total 985.8 8.5 5.7 990.9 6.0 3.2
PNMR 14.2 9.1
Smoking at >20 weeks Not smoking at >20 weeks
Perinatal outcome Alive SB NND Alive SB NND
2010 985.4 9.1 5.6 990.4 6.1 3.5
2011 985.6 9.1 5.3 991.2 5.8 3.0
Total 985.5 9.1 5.5 990.8 6.0 3.3
PNMR 14.5 9.2
Alive = alive at discharge; SB = stillborn; NND = neonatal death; PNMR = perinatal deaths per 1000 babies
Table 87: Correlation of remoteness class of women giving birth with gestation at birth and Indigenous status, Queensland 2010 to 2011
ARIA 1: highly accessible ARIA 2: accessible ARIA 3: moderately accessible
Gestation ≤27 28–33
34–36
37–39
40+ ≤27 28–33
34–36
37–39
40+ ≤27 28–33
34–36
37–39
40+
YearIndigenous status
2010Indigenous 1.1 2.2 6.0 54.0 36.7 1.9 3.2 6.2 54.5 34.2 1.8 3.6 8.2 51.6 34.8
Non-Indigenous 0.7 1.6 5.1 52.5 40.1 1.0 1.8 5.3 51.7 40.2 0.7 1.7 4.9 50.4 42.3
2011Indigenous 1.1 1.9 7.4 51.8 37.8 1.1 2.4 6.8 54.8 34.9 2.2 4.1 6.7 51.6 35.4
Non-Indigenous 0.7 1.6 5.2 53.3 39.2 0.9 1.7 5.4 53.7 38.3 0.8 1.6 5.0 52.8 39.8
TotalIndigenous 1.1 2.0 6.8 52.8 37.3 1.5 2.8 6.5 54.6 34.6 2.0 3.9 7.5 51.6 35.1
Non-Indigenous 0.7 1.6 5.1 52.9 39.7 0.9 1.8 5.4 52.7 39.3 0.8 1.6 4.9 51.6 41.1
Total All 0.7 1.6 5.2 52.9 39.6 1.0 1.8 5.4 52.8 39.0 0.9 1.9 5.2 51.6 40.3
ARIA 4: remote ARIA 5: very remote
Gestation ≤27 28–33
34–36
37–39
40+ ≤27 28–33
34–36
37–39
40+
YearIndigenous status
2010Indigenous 2.4 4.7 10.6 56.3 26.0 1.9 1.3 8.8 54.0 33.9
Non-Indigenous 0.3 1.9 4.5 53.3 40.0 0.5 0.3 4.4 47.5 47.3
2011Indigenous 2.7 4.2 9.6 57.1 26.4 1.7 3.9 7.7 53.7 33.0
Non-Indigenous 1.1 1.3 4.5 52.2 40.9 0.9 1.4 5.7 55.3 36.8
TotalIndigenous 2.5 4.5 10.1 56.7 26.2 1.8 2.6 8.3 53.8 33.5
Non-Indigenous 0.7 1.6 4.5 52.8 40.5 0.7 0.8 5.0 51.3 42.1
Total All 1.2 2.5 6.2 54.0 36.0 1.4 1.9 6.9 52.8 37.0
Percentages are of ARIA/Indigenous status groups.Remoteness classes: 1. Highly accessible (major cities of Australia; ARIA score 0 to <0.20)2. Accessible (inner regional Australia: ARIA score 0.20 to <2.40)3. Moderately accessible (outer regional Australia; ARIA score 2.40 to <5.95)4. Remote (remote Australia; ARIA score 5.95 to <10.5)5. Very remote (very remote Australia; ARIA score 10.5 to <15) Interstate, overseas, data incomplete: n = 100

97
Queensland Maternal and Perinatal Quality Council Report 2013
Table 88:Correlation of remoteness class of women giving birth with birthweight of their babies and Indigenous status, Queensland 2010 to 2011
ARIA 1: highly accessible ARIA 2: accessible ARIA 3: moderately accessible
Birthweight (g)
999
or le
ss
1000
–24
99
2500
–39
99
4000
or m
ore
999
or le
ss
1000
–24
99
2500
–39
99
4000
or m
ore
999
or le
ss
1000
–24
99
2500
–39
99
4000
or m
ore
YearIndigenous status
2010Indigenous 1.1 7.6 80.7 10.6 2.4 9.6 79.9 8.1 1.9 11.7 77.9 8.6
Non-Indigenous 0.8 5.7 81.0 12.4 1.0 6.0 79.7 13.2 0.9 5.5 80.5 13.2
2011Indigenous 0.8 9.3 80.1 9.8 1.3 8.0 79.2 11.5 2.1 11.3 77.6 8.9
Non-Indigenous 0.8 5.9 81.1 12.2 0.9 5.9 80.0 13.2 0.8 5.2 81.3 12.7
TotalIndigenous 0.9 8.5 80.4 10.2 1.8 8.8 79.5 9.8 2.0 11.5 77.7 8.8
Non-Indigenous 0.8 5.8 81.0 12.3 1.0 6.0 79.8 13.2 0.9 5.3 80.9 12.9
Total All 0.8 5.9 81.0 12.3 1.0 6.1 79.8 13.1 1.0 6.1 80.5 12.4
ARIA 4: remote ARIA 5: very remote
Birthweight (g)
999
or le
ss
1000
–24
99
2500
–39
99
4000
or m
ore
999
or le
ss
1000
–24
99
2500
–39
99
4000
or m
ore
YearIndigenous
status
2010Indigenous 2.0 14.2 77.1 6.7 2.1 8.9 80.8 8.3
Non-Indigenous 0.3 5.4 81.0 13.3 0.5 4.6 78.7 16.1
2011Indigenous 1.8 14.3 76.5 7.4 1.5 11.6 78.2 8.7
Non-Indigenous 0.9 4.4 82.8 11.8 0.8 3.1 81.4 14.7
TotalIndigenous 1.9 14.2 76.8 7.0 1.8 10.2 79.5 8.5
Non-Indigenous 0.6 4.9 81.9 12.6 0.7 3.9 80.0 15.4
Total All 1.0 7.8 80.3 10.9 1.3 7.6 79.7 11.3
Percentages are of ARIA/Indigenous status groups.Remoteness classes: 1. Highly accessible (major cities of Australia; ARIA score 0 to <0.20)2. Accessible (inner regional Australia: ARIA score 0.20 to <2.40)3. Moderately accessible (outer regional Australia; ARIA score 2.40 to <5.95)4. Remote (remote Australia; ARIA score 5.95 to <10.5)5. Very remote (very remote Australia; ARIA score 10.5 to <15))Interstate, overseas, data incomplete: n = 89
Table 89: Correlation of remoteness class of women giving birth with perinatal outcome and Indigenous status, Queensland 2010 to 2011
ARIA 1: highly accessible ARIA 2: accessible ARIA 3: moderately accessible
Perinatal outcome Alive SBR NMR PNMR Alive SBR NMR PNMR Alive SBR NMR PNMR
Indigenous 983.8 8.5 8.0 16.2 988.4 7.9 3.7 11.6 977.9 11.5 11.0 22.1
Non-Indigenous 988.9 7.6 3.5 11.1 990.5 6.1 3.4 9.5 990.5 6.1 3.5 9.5
Total 988.6 7.7 3.8 11.4 990.5 6.2 3.4 9.5 988.9 6.8 4.4 11.1
ARIA 4: remote ARIA 5: very remote
Perinatal outcome Alive SBR NMR PNMR Alive SBR NMR PNMR
Indigenous 983.9 8.8 7.5 16.1 983.9 8.5 7.8 16.1
Non-Indigenous 994.7 3.3 2.0 5.3 994.5 2.8 2.8 5.5
Total 991.3 5.0 3.7 8.7 988.2 6.2 5.7 11.8
Rates are calculated within ARIA/Indigenous status groups.Alive = alive at discharge, SBR = stillbirth rate per 1000 babies, NMR = neonatal mortality rate per 1000 liveborn babies, PNMR = perinatal deaths per 1000 babies. Remoteness classes: 1. Highly accessible (major cities of Australia; ARIA score 0 to <0.20)2. Accessible (inner regional Australia: ARIA score 0.20 to <2.40)3. Moderately accessible (outer regional Australia; ARIA score 2.40 to <5.95)4. Remote (remote Australia; ARIA score 5.95 to <10.5)5. Very remote (very remote Australia; ARIA score 10.5 to <15)
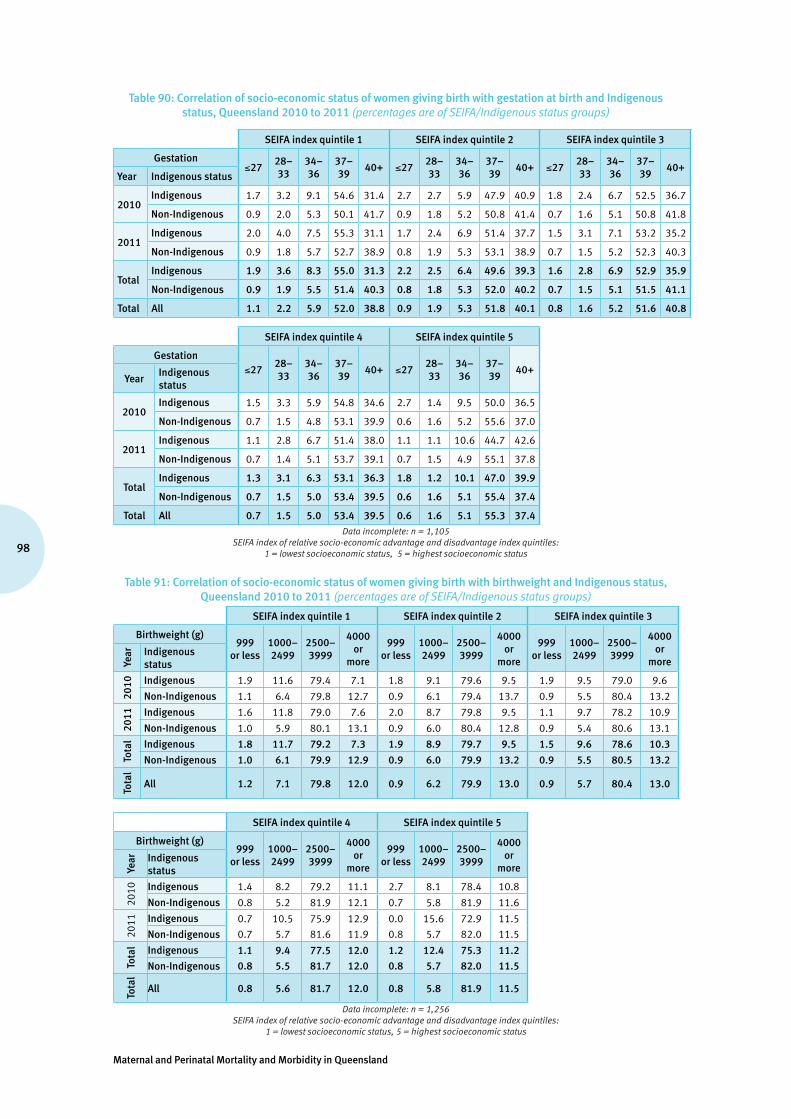
Maternal and Perinatal Mortality and Morbidity in Queensland
98
Table 90: Correlation of socio-economic status of women giving birth with gestation at birth and Indigenous status, Queensland 2010 to 2011 (percentages are of SEIFA/Indigenous status groups)
SEIFA index quintile 1 SEIFA index quintile 2 SEIFA index quintile 3
Gestation≤27
28–33
34–36
37–39
40+ ≤2728–33
34–36
37–39
40+ ≤2728–33
34–36
37–39
40+Year Indigenous status
2010Indigenous 1.7 3.2 9.1 54.6 31.4 2.7 2.7 5.9 47.9 40.9 1.8 2.4 6.7 52.5 36.7
Non-Indigenous 0.9 2.0 5.3 50.1 41.7 0.9 1.8 5.2 50.8 41.4 0.7 1.6 5.1 50.8 41.8
2011Indigenous 2.0 4.0 7.5 55.3 31.1 1.7 2.4 6.9 51.4 37.7 1.5 3.1 7.1 53.2 35.2
Non-Indigenous 0.9 1.8 5.7 52.7 38.9 0.8 1.9 5.3 53.1 38.9 0.7 1.5 5.2 52.3 40.3
TotalIndigenous 1.9 3.6 8.3 55.0 31.3 2.2 2.5 6.4 49.6 39.3 1.6 2.8 6.9 52.9 35.9
Non-Indigenous 0.9 1.9 5.5 51.4 40.3 0.8 1.8 5.3 52.0 40.2 0.7 1.5 5.1 51.5 41.1
Total All 1.1 2.2 5.9 52.0 38.8 0.9 1.9 5.3 51.8 40.1 0.8 1.6 5.2 51.6 40.8
SEIFA index quintile 4 SEIFA index quintile 5
Gestation≤27
28–33
34–36
37–39
40+ ≤2728–33
34–36
37–39
40+Year
Indigenous status
2010Indigenous 1.5 3.3 5.9 54.8 34.6 2.7 1.4 9.5 50.0 36.5
Non-Indigenous 0.7 1.5 4.8 53.1 39.9 0.6 1.6 5.2 55.6 37.0
2011Indigenous 1.1 2.8 6.7 51.4 38.0 1.1 1.1 10.6 44.7 42.6
Non-Indigenous 0.7 1.4 5.1 53.7 39.1 0.7 1.5 4.9 55.1 37.8
TotalIndigenous 1.3 3.1 6.3 53.1 36.3 1.8 1.2 10.1 47.0 39.9
Non-Indigenous 0.7 1.5 5.0 53.4 39.5 0.6 1.6 5.1 55.4 37.4
Total All 0.7 1.5 5.0 53.4 39.5 0.6 1.6 5.1 55.3 37.4
Data incomplete: n = 1,105 SEIFA index of relative socio-economic advantage and disadvantage index quintiles:
1 = lowest socioeconomic status, 5 = highest socioeconomic status
Table 91: Correlation of socio-economic status of women giving birth with birthweight and Indigenous status, Queensland 2010 to 2011 (percentages are of SEIFA/Indigenous status groups)
SEIFA index quintile 1 SEIFA index quintile 2 SEIFA index quintile 3
Birthweight (g)999
or less1000–2499
2500–3999
4000 or
more
999or less
1000–2499
2500–3999
4000 or
more
999or less
1000–2499
2500–3999
4000 or
moreYear Indigenous
status
2010 Indigenous 1.9 11.6 79.4 7.1 1.8 9.1 79.6 9.5 1.9 9.5 79.0 9.6
Non-Indigenous 1.1 6.4 79.8 12.7 0.9 6.1 79.4 13.7 0.9 5.5 80.4 13.2
2011 Indigenous 1.6 11.8 79.0 7.6 2.0 8.7 79.8 9.5 1.1 9.7 78.2 10.9
Non-Indigenous 1.0 5.9 80.1 13.1 0.9 6.0 80.4 12.8 0.9 5.4 80.6 13.1
Tota
l Indigenous 1.8 11.7 79.2 7.3 1.9 8.9 79.7 9.5 1.5 9.6 78.6 10.3
Non-Indigenous 1.0 6.1 79.9 12.9 0.9 6.0 79.9 13.2 0.9 5.5 80.5 13.2
Tota
l
All 1.2 7.1 79.8 12.0 0.9 6.2 79.9 13.0 0.9 5.7 80.4 13.0
SEIFA index quintile 4 SEIFA index quintile 5
Birthweight (g)999
or less1000–2499
2500–3999
4000 or
more
999or less
1000–2499
2500–3999
4000 or
moreYear Indigenous
status
2010 Indigenous 1.4 8.2 79.2 11.1 2.7 8.1 78.4 10.8
Non-Indigenous 0.8 5.2 81.9 12.1 0.7 5.8 81.9 11.6
2011 Indigenous 0.7 10.5 75.9 12.9 0.0 15.6 72.9 11.5
Non-Indigenous 0.7 5.7 81.6 11.9 0.8 5.7 82.0 11.5
Tota
l Indigenous 1.1 9.4 77.5 12.0 1.2 12.4 75.3 11.2
Non-Indigenous 0.8 5.5 81.7 12.0 0.8 5.7 82.0 11.5
Tota
l
All 0.8 5.6 81.7 12.0 0.8 5.8 81.9 11.5
Data incomplete: n = 1,256 SEIFA index of relative socio-economic advantage and disadvantage index quintiles:
1 = lowest socioeconomic status, 5 = highest socioeconomic status

99
Queensland Maternal and Perinatal Quality Council Report 2013
Table 92: Correlation of socio-economic status of women giving birth with perinatal outcome and Indigenous status, Queensland 2010 to 2011 (rates are calculated within SEIFA/Indigenous status groups)
SEIFA index quintile 1 SEIFA index quintile 2 SEIFA index quintile 3
Perinatal outcome Alive SBR NMR PNMR Alive SBR NMR PNMR Alive SBR NMR PNMR
Indigenous 982.8 9.0 8.3 17.2 978.2 10.9 11.0 21.8 984.8 9.9 5.3 15.2
Non-Indigenous 988.3 7.9 3.9 11.7 989.0 7.7 3.3 11.0 990.5 5.9 3.6 9.5
Total 987.4 8.0 4.6 12.6 988.2 7.9 3.9 11.8 990.2 6.1 3.7 9.8
SEIFA index quintile 4 SEIFA index quintile 5
Perinatal outcome Alive SBR NMR PNMR Alive SBR NMR PNMR
Indigenous 987.6 7.1 5.3 12.4 1,000.0 0.0 0.0 0.0
Non-Indigenous 991.8 5.3 2.9 8.2 991.7 5.4 2.9 8.3
Total 991.7 5.3 3.0 8.3 991.8 5.3 2.9 8.2
Alive = alive at discharge, SBR = stillbirth rate per 1000 babies NMR = neonatal mortality rate per 1000 liveborn babies, PNMR = perinatal deaths per 1000 babies
SEIFA index of relative socio-economic advantage and disadvantage index quintiles: 1 = lowest socioeconomic status, 5 = highest socioeconomic status
Table 93: ICD–10 detail of anomaly groups used in this report (reporting is from the pregnancy and newborn period only)
ICD–10 code
Anomaly description
Chromosome abnormalities
Q90 Down’s syndrome
Q91 Edwards’ syndrome and Patau’s syndrome
Q92 Other trisomies and partial trisomies of the autosomes, not elsewhere classified
Q93 Monosomies and deletions from the autosomes, not elsewhere classified
Q95 Balanced rearrangements and structural markers, not elsewhere classified
Q96 Turner’s syndrome
Q97 Other female sex chromosome abnormalities, not elsewhere classified
Q98 Other male sex chromosome abnormalities, not elsewhere classified
Q99 Other chromosome abnormalities, not elsewhere classified
Neural tube defects
Q00 Anencephaly and similar malformations
Q01 Encephalocele
Q05 Spina bifida
Other congenital malformations of nervous system
Q02 Microcephaly
Q03 Congenital hydrocephalus
Q04 Other congenital malformations of brain
Q06 Other congenital malformations of spinal cord
Q07 Other congenital malformations of nervous system
Congenital malformations of eyes, ears, face and neck
Q10 Congenital malformations of eyelid, lacrimal apparatus and orbit
Q11 Anophthalmos, microphthalmos and macrophthalmos
Q12 Congenital lens malformations
Q13 Congenital malformations of anterior segment of eye
Q14 Congenital malformations of posterior segment of eye
Q15 Other congenital malformations of eye
Q16 Congenital malformations of ear causing impairment of hearing
Q17 Other congenital malformations of ear
Q18 Other congenital malformations of face and neck
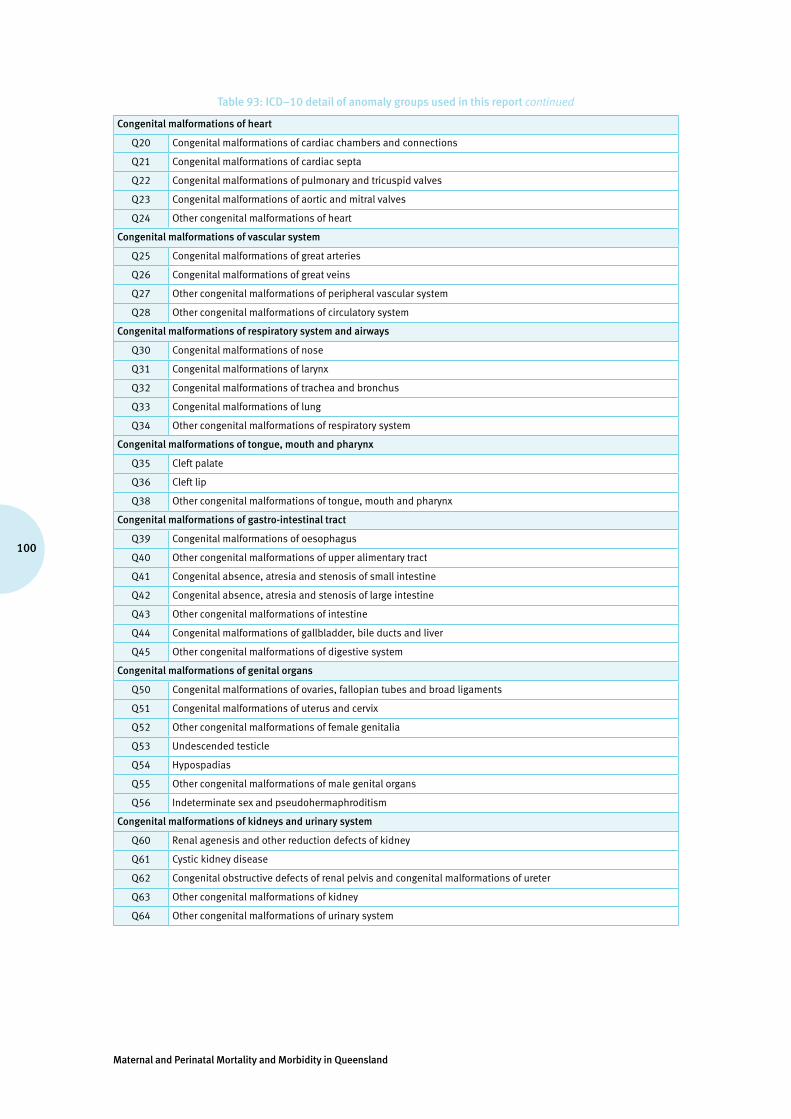
Maternal and Perinatal Mortality and Morbidity in Queensland
100
Table 93: ICD–10 detail of anomaly groups used in this report continued
Congenital malformations of heart
Q20 Congenital malformations of cardiac chambers and connections
Q21 Congenital malformations of cardiac septa
Q22 Congenital malformations of pulmonary and tricuspid valves
Q23 Congenital malformations of aortic and mitral valves
Q24 Other congenital malformations of heart
Congenital malformations of vascular system
Q25 Congenital malformations of great arteries
Q26 Congenital malformations of great veins
Q27 Other congenital malformations of peripheral vascular system
Q28 Other congenital malformations of circulatory system
Congenital malformations of respiratory system and airways
Q30 Congenital malformations of nose
Q31 Congenital malformations of larynx
Q32 Congenital malformations of trachea and bronchus
Q33 Congenital malformations of lung
Q34 Other congenital malformations of respiratory system
Congenital malformations of tongue, mouth and pharynx
Q35 Cleft palate
Q36 Cleft lip
Q38 Other congenital malformations of tongue, mouth and pharynx
Congenital malformations of gastro-intestinal tract
Q39 Congenital malformations of oesophagus
Q40 Other congenital malformations of upper alimentary tract
Q41 Congenital absence, atresia and stenosis of small intestine
Q42 Congenital absence, atresia and stenosis of large intestine
Q43 Other congenital malformations of intestine
Q44 Congenital malformations of gallbladder, bile ducts and liver
Q45 Other congenital malformations of digestive system
Congenital malformations of genital organs
Q50 Congenital malformations of ovaries, fallopian tubes and broad ligaments
Q51 Congenital malformations of uterus and cervix
Q52 Other congenital malformations of female genitalia
Q53 Undescended testicle
Q54 Hypospadias
Q55 Other congenital malformations of male genital organs
Q56 Indeterminate sex and pseudohermaphroditism
Congenital malformations of kidneys and urinary system
Q60 Renal agenesis and other reduction defects of kidney
Q61 Cystic kidney disease
Q62 Congenital obstructive defects of renal pelvis and congenital malformations of ureter
Q63 Other congenital malformations of kidney
Q64 Other congenital malformations of urinary system

101
Queensland Maternal and Perinatal Quality Council Report 2013
Table 93: ICD–10 detail of anomaly groups used in this report continued
Congenital musculoskeletal deformities
Q65 Congenital deformities of hip
Q66 Congenital deformities of feet
Q67 Congenital musculoskeletal deformities of head, face, spine and chest
Q68 Other congenital musculoskeletal deformities
Q69 Polydactyly
Q70 Syndactyly
Q71 Reduction defects of upper limb
Q72 Reduction defects of lower limb
Q73 Reduction defects of unspecified limb
Q74 Other congenital malformations of limb(s)
Q75 Other congenital malformations of skull and face bones
Q76 Congenital malformations of spine and bony thorax
Q77 Osteochondrodysplasia with defects of growth of tubular bones and spine
Q78 Other osteochondrodysplasias
Q79 Congenital malformations of the musculoskeletal system, not elsewhere classified
Congenital malformations of skin and breast
Q80 Congenital ichthyosis
Q81 Epidermolysis bullosa
Q82 Other congenital malformations of skin
Q83 Congenital malformations of breast
Q84 Other congenital malformations of integument
Other congenital malformations, not elsewhere classified
Q85 Phakomatoses, not elsewhere classified
Q86 Congenital malformation syndromes due to known exogenous causes, not elsewhere classified
Q87 Other specified congenital malformation syndromes affecting multiple systems
Q89 Other congenital malformations, not elsewhere classified

Maternal and Perinatal Mortality and Morbidity in Queensland
102
Table 94: Perinatal care indicators by hospital group, Queensland 2010 to 2011
Perinatal care
indicators
Facility group
A B C D E F G H Total
Specialist obstetrics, feto-maternal medicine, neonatal intensive care unit
Specialist obstetrics, special care nursery, >2000 births/year
Specialist obstetrics, special care nursery, <2000 births/year
Non-specialist obstetrics, generalist neonatal care, >250 births/year
Non-specialist obstetrics, generalist neonatal care, <250 births/year
Birth centres
Private hospital maternity and newborn services
Home births
Proportion (%) of selected primigravidae having a caesarean section birth*
23.9 19.3 21.4 20.0 21.0 NR 39.4 NR 27.5
Proportion (%) of selected primigravidae achieving unassisted vaginal birth*
52.7 62.1 60.3 63.7 62.7 99.7 35.6 100.0 51.2
Proportion (%) of caesarean sections performed without labour in all women giving birth
17.4 13.8 15.6 12.7 10.2 NR 34.7 NR 20.6
Proportion (%) of elective births (inductions of labour and caesarean sections without labour in all women giving birth) occurring before 38 completed weeks gestation
41.5 36.3 37.5 26.0 27.1 14.3 48.7 NR 42.1
Proportion (%) of all women giving birth whose previous pregnancy ended in a first caesarean section who achieved a vaginal birth (i.e. successful VBAC)
20.6 24.7 23.3 16.0 19.2 NR 7.4 100.0 16.4
Proportion (%) of selected primigravidae labouring spontaneously and achieving unassisted vaginal birth without episiotomy and without third/fourth degree perineal tear*
36.1 45.5 40.9 48.7 49.1 93.1 18.5 87.5 34.2
Proportion (%) of all women giving birth labouring spontaneously and achieving unassisted vaginal birth without episiotomy and without third/fourth degree perineal tear
38.9 48.7 45.1 54.1 59.3 95.8 20.3 97.4 39.1
* Selected primigravida = mothers age group 20–34 years, no previous births, singleton birth in current pregnancy, 37 weeks + 0 days to 40 weeks + 6 days completed weeks of gestation, cephalic/vertex presentation at birth
(NR = not relevant)
6. Data sources used in this report
Pregnancy, birth and neonatal data collected between 2000 and 2011 was sourced from the PDCT and prepared by Ms Vesna Dunne, Principal Statistical Output Officer Health Statistics Unit, Department of Health. This data was further analysed and collated by Professor Michael Humphrey, Chair of the Council.
Previous reports by this Council and the Queensland Council on Obstetric and Paediatric Morbidity and Mortality (QCOPMM) were sources of data regarding maternal and perinatal deaths between 1988 and 2003, as were AIHW reports on maternal deaths in Australia.
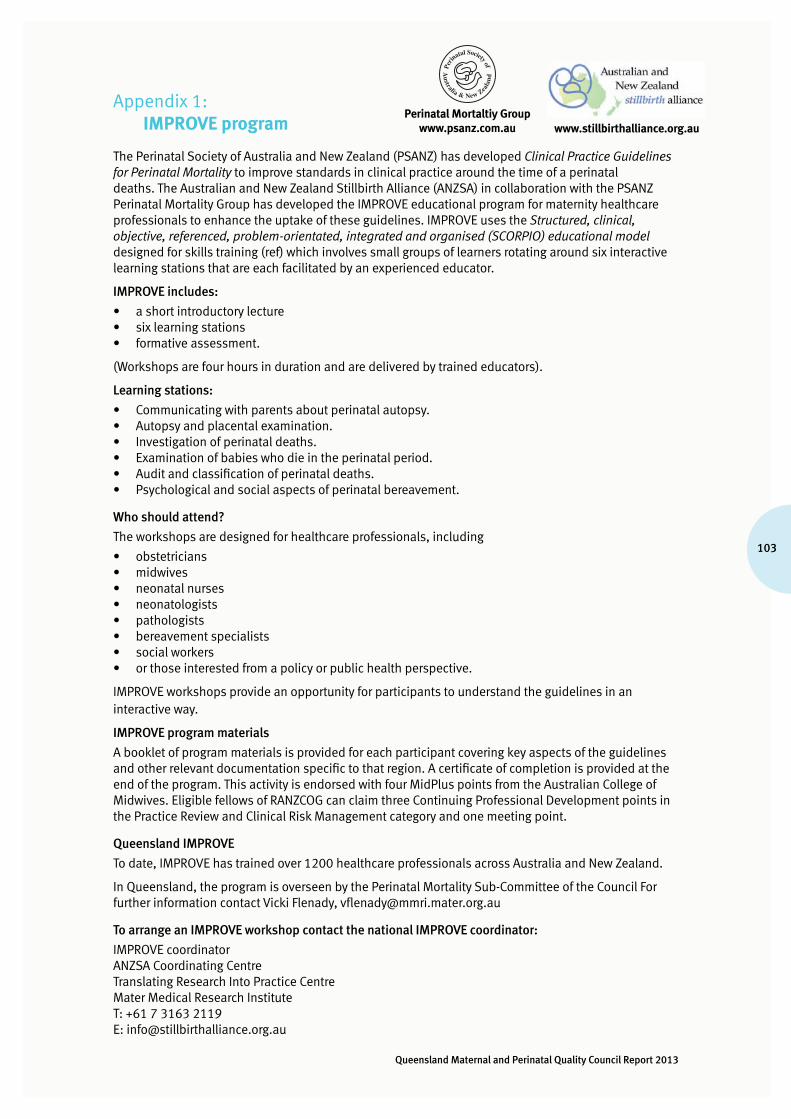
103
Queensland Maternal and Perinatal Quality Council Report 2013
Appendix 1: IMPROVE program
The Perinatal Society of Australia and New Zealand (PSANZ) has developed Clinical Practice Guidelines for Perinatal Mortality to improve standards in clinical practice around the time of a perinatal deaths. The Australian and New Zealand Stillbirth Alliance (ANZSA) in collaboration with the PSANZ Perinatal Mortality Group has developed the IMPROVE educational program for maternity healthcare professionals to enhance the uptake of these guidelines. IMPROVE uses the Structured, clinical, objective, referenced, problem-orientated, integrated and organised (SCORPIO) educational model designed for skills training (ref) which involves small groups of learners rotating around six interactive learning stations that are each facilitated by an experienced educator.
IMPROVE includes:
• a short introductory lecture• six learning stations• formative assessment.
(Workshops are four hours in duration and are delivered by trained educators).
Learning stations:
• Communicating with parents about perinatal autopsy.• Autopsy and placental examination.• Investigation of perinatal deaths.• Examination of babies who die in the perinatal period.• Audit and classification of perinatal deaths.• Psychological and social aspects of perinatal bereavement.
Who should attend?
The workshops are designed for healthcare professionals, including
• obstetricians• midwives• neonatal nurses• neonatologists• pathologists• bereavement specialists• social workers• or those interested from a policy or public health perspective.
IMPROVE workshops provide an opportunity for participants to understand the guidelines in an interactive way.
IMPROVE program materials
A booklet of program materials is provided for each participant covering key aspects of the guidelines and other relevant documentation specific to that region. A certificate of completion is provided at the end of the program. This activity is endorsed with four MidPlus points from the Australian College of Midwives. Eligible fellows of RANZCOG can claim three Continuing Professional Development points in the Practice Review and Clinical Risk Management category and one meeting point.
Queensland IMPROVE
To date, IMPROVE has trained over 1200 healthcare professionals across Australia and New Zealand.
In Queensland, the program is overseen by the Perinatal Mortality Sub-Committee of the Council For further information contact Vicki Flenady, [email protected]
To arrange an IMPROVE workshop contact the national IMPROVE coordinator:
IMPROVE coordinator ANZSA Coordinating Centre Translating Research Into Practice Centre Mater Medical Research Institute T: +61 7 3163 2119 E: [email protected]
www.stillbirthalliance.org.auPerinatal Mortaltiy Group
www.psanz.com.au
Perin
atal Society of
Australia & New Zea
land
Maternal and Perinatal Mortality and Morbidity in Queensland
104
Appendix 2: Investigating the causes of stillbirth: a NHMRC funded study
Background
Stillbirth is a common adverse pregnancy outcome which can have devastating long-term effects. Stillbirth rates have not decreased in over 20 years. Many stillbirths are not appropriately investigated resulting in erroneous data on causation and lack of focus for prevention strategies—up to one-third are classified as unexplained.
Inadequate investigation of stillbirths is driven by a lack of evidence for test performance and costs. National guidelines from the Perinatal Society of Australia and New Zealand (PSANZ) recommend a comprehensive approach to investigating all stillbirths, including autopsy examination. However, uptake into practice is low due to clinician uncertainty about the benefits and consent is also a major limiting factor. This specifically relates to autopsy; an expensive and an intrusive procedure for parents.
While autopsy is deemed the gold standard investigation, there is limited data on its value across the spectrum of stillbirths and autopsy rates have declined below the recommended rate in many regions in Australia. The loss of important information when an autopsy is not performed can affect the quality of future pregnancy counselling and impede further reduction in the incidence of stillbirth.
The Australian and New Zealand Stillbirth Alliance (ANZSA) (www.stillbirthalliance.org.au) has received an NHMRC project grant for a detailed study on investigation of stillbirths which aims to address the call for better data on the causes of stillbirths from the NHMRC maternity services review and The Lancet Stillbirth Series30.
Study aims
The large scale prospective cohort study across maternity hospitals in Australia, including singleton stillbirths, will identify causes of stillbirths in a large well-investigated cohort and improve the quality of data on stillbirths across Australia through identifying a cost-effective, evidence-based approach to stillbirth investigations. Following investigation, and multidisciplinary review at the hospital according to national guidelines, data will be submitted to the main coordinating centre. We are planning to include data from clinical audit of 900 stillbirths across at least 20 Tertiary and Level 2 hospitals over a three-year study period. Cost-effectiveness analysis will be undertaken comparing a comprehensive versus selective approach according to presenting scenario.
The study also provides the opportunity of piloting the National Perinatal Clinical Audit Tool which, in Queensland, is supported by the Queensland Maternal Perinatal Quality Council and the Perinatal Data Collection Unit.
Study procedure at hospitals
Prior to commencement of the study, an educational program ‘Improving perinatal mortality review and outcomes via education’ (IMPROVE)31 will be provided for staff at participating hospitals. The program covers all aspects of the PSANZ Perinatal Mortality Guidelines32 and has a major focus on investigation and audit of stillbirths. We ask that all key staff (targeting senior midwives and registrars) caring for women around the time of a stillbirth attend the IMPROVE workshop and that investigation, audit and classification is conducted according to the guidelines as routine for all stillbirths, including completion of the recommended case summary form. This form will be available as a web-based application for the purposes of this study. Following local mortality committee review, hospitals are asked to submit the case summary form electronically to the main coordinating centre at the Mater Medical Research Institute. Individual hospital reports can be obtained from the database for submitted cases in order to assist hospitals with their routine mortality audit reporting. Human Research Ethics review has allowed a waiver of the need for consent from parents due to the audit nature of the study. Each stillbirth will be assigned a unique study indentifier prior to electronic submission, allowing for cases to be submitted with de-identified data. This dataset will also have all names and addresses relating to the case removed and date of birth replaced with year of birth.
30 The Lancet Stillbirth Series is available free at: www.lancet.com/series/stillbirth31 Refer to the ANZSA website for more details: www.stillbirthalliance.org.au/education.htm32 PSANZ Perinatal Mortality Guidelines Chapter 2 under Perinatal Mortality Group on the PSANZ website: www.psanz.org.au

105
Queensland Maternal and Perinatal Quality Council Report 2013
For further information contact:
Vicki Flenady T: (07) 3163 1592 E: [email protected]
Participating Queensland facilities and lead clinicians:
• Cairns Base Hospital, Philippa Cuttance• Gold Coast Hospital, Anne Sneddon• Ipswich Hospital, Kassam Mahomed• Mater Mothers’ Hospital, Glenn Gardener, Dr Lucy Cooke and Trish Wilson• Logan Hospital, Janet Draper• Nambour Hospital, Ted Weaver• Royal Brisbane and Women’s Hospital, Yogesh Chadha• Toowoomba Hospital, Bronwyn Brabrook and Linda Brook• Townsville Hospital, David Watson and Anne-Marie Lawrence

Maternal and Perinatal Mortality and Morbidity in Queensland
106
Appendix 3: Statewide maternity and neonatal clinical network (SMNCN)
The Council has a close working relationship with the SMNCN and views that body as the peak clinical body in Queensland for maternity and newborn care. The Queensland Maternity and Neonatal Clinical Guidelines Program (QMNCPG), established by Queensland clinicians, and working also in close partnership with both the SMNCN and the Council, has an effective program of developing clinical guidelines with further work progressing on implementation and evaluation of health outcomes and healthcare research. Guidelines may be accessed at www.health.qld.gov.au
Table 95: Clinical Practice Guidelines published by QMNCGP as at June 2013
Maternity clinical guideline titles
Early pregnancy loss
Early onset Group B streptococcal disease
Hypertensive disorders of pregnancy
Induction of labour
Intrapartum fetal surveillance
Normal birth
Obesity
Perineal care
Preterm labour
Primary postpartum haemorrhage
Stillbirth care
Therapeutic termination of pregnancy
Vaginal birth after caesarean section
Venous thromboembolism prophylaxis
Newborn clinical guideline titles
Breastfeeding initiation
Examination of the newborn
Hypoglycaemia - neonatal
Hypoxic ischaemic encephalopathy
Jaundice - neonatal
Neonatal abstinence syndrome
Respiratory distress and the administration of Continuous Positive Airways Pressure (CPAP
Neonatal hypoglycaemia
Seizures - neonatal
Stabilisation for retrieval - neonatal
Term small for gestational age baby
Operational framework titles
Maternity shared care
Non-urgent referral for antenatal care

107
Queensland Maternal and Perinatal Quality Council Report 2013
Appendix 4: Australasian maternity outcomes surveillance system (AMOSS)
The Queensland Maternal and Perinatal Quality Council 2011 report noted that:examination of issues relating to severe maternal morbidity is challenging due to definitional and reporting issues. Council believes that the current AMOSS, which is a national program studying rare and serious conditions complicating pregnancy and childbirth, is the most effective means of such review at this time.
The AMOSS is described as: a national surveillance mechanism designed to study a variety of rare or serious conditions in pregnancy, childbirth and the post natal phase. Through translating the findings from these studies into reliable evidence-based practice, the aim of AMOSS is to improve the safety and quality of maternity care in Australia and New Zealand.
The AMOSS objectives are to: • improve the knowledge of rare obstetric disorders and their management in Australia • develop and implement a national network of collaborators • undertake national research of rare obstetric disorders evident during pregnancy and puerperium• translate research findings into policy, clinical guidelines and education resources for the
multidisciplinary workforce.
The flexibility of the AMOSS design allows the project to respond rapidly to emergent issues. The Influenza H1N1 outbreak in 2009 is a case in point, where findings from the AMOSS study allowed care modification and risk reduction for pregnant women by the time that this infection reached the northern hemisphere in significant numbers.
The projects undertaken by AMOSS to date are shown in Table 91. The Queensland Maternal and Perinatal Quality Council is supportive of the AMOSS project and its methodologies, looks forward to the outcomes of the studies as they are completed, and hopes that clinical lessons learned from the AMOSS projects will improve outcomes for pregnant women and their babies.
Table 96: AMOSS projects commenced in the period 2009 to 2012
Influenza H1N1 with Intensive Care Admission
Morbid obesity (body mass index >50)
Influenza A with intensive care admission
Eclampsia
Placenta accreta
Peripartum hysterectomy
Antenatal pulmonary embolism
Amniotic fluid embolism
Rheumatic heart disease
Gestational breast cancer
Vasa praevia

Maternal and Perinatal Mortality and Morbidity in Queensland
108
Appendix 5: Membership of the Queensland Maternal and Perinatal Quality Council, 2011–2013
Queensland Maternal and Perinatal Quality Council
Professor Michael Humphrey (Chair)
Clinical Advisor, Office of Rural and Remote HealthSenior Medical Coordinator (Obstetrics), Retrieval Services Queensland
Professor Leonie Callaway Staff Specialist, Internal and Obstetric Medicine, Royal Brisbane and Women’s HospitalProfessor and Head, Northern Academic Cluster, School of Medicine, The University of Queensland
Associate Professor Robert Cincotta (to February 2012)
Director, Queensland Ultrasound for Women
Cheryl Clayton Director of Clinical Services, Mater Private Hospital, Redland
Professor Paul Colditz Director, Perinatal Research Centre, The University of Queensland
Helen Coxhead (to November 2012) Midwifery Unit Manager, The Townsville Hospital
Associate Professor Vicki Flenady Director, Translating Research Into Practice CentreProgram Head, Mothers’ and Babies Theme, Mater Medical Research Institute
Rebecca Jenkinson Nominee, Queensland Consumer Council
Associate Professor Rebecca Kimble Clinical Director, Obstetric Services, Royal Brisbane and Women’s Hospital
Professor Sue Kildea Director, Midwifery Research Unit, Australian Catholic University and Mater Mothers’ Hospital Mater Medical Research Institute (MMRI
Dr David Knight Director, Neonatology, Mater Mother’s Hospital
Jonelle Mayers (to December 2012) Nurse Unit Manager, Special Care Baby Unit, Cairns Base Hospital
Dr Ian Mottarelly Senior Medical Officer, Gympie Hospital
Associate Professor Julie McGaughran Director, Genetic Health Queensland
Dr Diane Payton Staff Anatomical Pathologist, Pathology Queensland
Dr Peter Schmidt Senior Medical Officer, Paediatrics, Gold Coast Hospital
Dr Renuka Sekar Staff Specialist Obstetrics—Maternal and Fetal Medicine, Royal Brisbane and Women’s Hospital
Dr Mary Sidebotham (to April 2013) Lecturer, B Mid. School of Nursing and Midwifery, Griffith University
Dr Nikki Whelan Obstetrician and Gynaecologist (Private Practice), Brisbane
Maternal Mortality Sub-Committee
Dr Nikki Whelan (Chair) Obstetrician and Gynaecologist (Private Practice), Brisbane
Professor Leonie Callaway Staff Specialist, Internal and Obstetric Medicine, Royal Brisbane and Women’s Hospital
Dr Robert Cardwell (consulting member) Deputy Medical Director (Southern Operations), Retrieval Services QueenslandStaff Specialist, Emergency Medicine, Royal Brisbane and Women’s Hospital
Associate Professor Rob Cincotta(consulting member)
Director, Queensland Ultrasound for Women
Helen Coxhead (to November 2012) Manager, Midwifery Unit, Townsville Hospital
Dr Nathan Milne Forensic Pathologist, Forensic and Scientific Services
Dr Ian Mottarelly Senior Medical Officer, Gympie Hospital
Dr Peter Harms Director, Anaesthesia, Mater Mothers’ Hospital, Mater Health Services
Dr Mary Sidebotham (to April 2013) Lecturer, B Mid. School of Nursing and Midwifery, Griffith University
Dr William Parsonage Staff Specialist, Cardiology, Royal Brisbane and Women’s Hospital
Dr Sally Matheson Staff Psychiatrist, Consultation Liaison Psychiatry, Royal Brisbane and Women’s Hospital
Dr Rebecca Williams Forensic Pathologist, Forensic and Scientific Services

109
Queensland Maternal and Perinatal Quality Council Report 2013
Perinatal Mortality Sub-Committee
Associate Professor Vicki Flenady (Co-chair)
Director, Translating Research Into Practice Centre Program Head, Mothers’ and Babies Theme. Mater Medical Research Institute
Joanne Ellerington Principal Data Collections Officer, Health Statistics Unit, Department of Health
Dr David Cartwright Director, Neonatology, Royal Brisbane and Women’s Hospital
Dr Lucy Cooke (Co-chair) Staff Specialist, Neonatology, Mater Health Services
Paul Gardiner (to May 2013) IMPROVE Coordinator
Rebecca Jenkinson Nominee, Queensland Consumer Council
Dr David Knight Director, Neonatology, Mater Health Services
Dr Helen Liley Senior Staff Specialist, Neonatology, Mater Health Services
Dr Rohan Lourie Consultant Pathologist, Mater Health Services
Dr Kassam Mahomed Senior Staff Specialist, Ipswich Hospital
Melanie McKenzie Nominee, Queensland Consumer Council
Dr Diane Payton Staff Anatomical Pathologist, Pathology Queensland
Teresa Walsh Caseload Midwife
Dr Nikki Whelan Consultant Obstetrician Gynaecologist
Dr Paul Woodgate Senior Staff Specialist, Neonatology, Mater Health Services
Congenital Anomaly Sub-Committee
Professor Paul Colditz (Chair) Professor, Perinatal Medicine, University of Queensland
Joanne Ellerington Principal Data Collections Officer, Health Statistics Unit, Department of Health
Associate Professor Rob Cincotta(consulting member)
Maternal Fetal Medicine Specialist, Mater Health ServicesDirector, Queensland Ultrasound for Women
Dr Timothy Donovan Senior Medical Officer, Neonatology, Royal Brisbane and Women’s Hospital
Dr Trish Johnston Director, Statistical Analysis and Linkage Team, Health Statistics Unit, Department of Health
Melanie McKenzie Nominee, Queensland Consumer Council
Associate Professor Julie McGaughran Director, Genetic Health Queensland
Dr Diane Payton Staff Anatomical Pathologist, Pathology Queensland
Dr Renuka Sekar Staff Specialist Obstetrics—Maternal and Fetal Medicine, Royal Brisbane and Women’s Hospital
Editorial Sub-Committee
Professor Michael Humphrey (Chair)
Clinical Advisor, Office of Rural and Remote HealthSenior Medical Coordinator (Obstetrics), Retrieval Services Queensland
Joanne Ellerington Principal Data Collections Officer, Health Statistics Unit, Department of Health
Professor Leonie Callaway Staff Specialist, Internal and Obstetric Medicine, Royal Brisbane and Women’s Hospital
Associate Professor Vicki Flenady Director, Translating Research Into Practice CentreProgram Head, Mothers’ and Babies Theme. Mater Medical Research Institute
Rebecca Jenkinson Nominee, Queensland Consumer Council
Professor Sue Kildea Director, Midwifery Research Unit, Australian Catholic University and Mater Mothers’ Hospital MMRI
Secretariat
Andrea Chitakis Clinical Access and Redesign Unit, Health Service and Clinical Innovation Division, Department of Health

Maternal and Perinatal Mortality and Morbidity in Queensland
110
Abbreviations
ABS Australian Bureau of StatisticsAID Artificial insemination - donorAIH Artificial insemination - husbandAIHW Australian Institute of Health and WelfareAMOSS Australasian Maternity Outcomes Surveillance SystemANZSA Australian and New Zealand Stillbirth AllianceARIA Accessibility/Remoteness Index of AustraliaBMI body mass indexCA congenital anomalyCHD congenital heart diseaseCOAG Council of Australian GovernmentsEPDS Edinburgh Postnatal Depression ScoreFGR Fetal growth restrictiong gramHELLP Haemolysis, elevated liver enzymes, low platelet countHLHS Hypoplastic Left Heart SyndromeICD-10 International Classification of Diseases, version 10IMPROVE IMproving Perinatal Review and Outcomes Via EducationMMR maternal mortality ratioNHMRC National Health and Medical Research CouncilNICU neonatal intensive care unitNMR Neonatal mortality rateNPDC National Perinatal Data CollectionNPDCAT National Perinatal Death Clinical Audit ToolNPESU (AIHW) National Perinatal Epidemiology and Statistics UnitPA Pulmonary AtresiaPDCT Perinatal Data Collection TeamPMMRC Perinatal Maternal Mortality Review Committee, New ZealandPNMR Perinatal mortality ratePSANZ Perinatal Society of Australia and New ZealandPSANZ-NDC Perinatal Society of Australia and New Zealand Neonatal Death ClassificationPSANZ-PDC Perinatal Society of Australia and New Zealand Perinatal Death ClassificationQCOPMM Queensland Council on Obstetric and Paediatric Morbidity and MortalityQMNCPG Queensland Maternity and Neonatal Clinical Guidelines ProgramQMPQC Queensland Maternal and Perinatal Quality Council (also noted as ‘the Council’)QHAPDC Queensland Hospital Admitted Patient Data CollectionQPDC Queensland Perinatal Data CollectionRANZCOG Royal Australian and New Zealand College of Obstetricians and GynaecologistsRR relative riskSBR Stillbirth rateSCN special care nurserySEIFA Socio-economic Indexes for AreasSIDS Sudden infant death syndromeSMNCN Statewide Maternity and Neonatal Clinical NetworkTGA Transposition of the Great ArteriesToF Tetralogy of Fallottop termination of pregnancyVBAC Vaginal birth after caesarean sectionWHO World Health Organization

iii
Queensland Maternal and Perinatal Quality Council Report 2013
Acknowlegments
The Queensland Maternal and Perinatal Quality Council acknowledges the clinicians who have participated in hospital committee perinatal mortality review and classification.
We thank the Health Statistics Unit, in particular:
• Joanne Ellerington and Colleen Morris, for their support in perinatal death review and reporting and in performing a major case ascertainment exercise relating to maternal deaths
• Vesna Dunne, for assistance with data retrieval
• Dr Trish Johnston, for advice and assistance with data linkage and interpretation.
The support of the following individuals is acknowledged:
• Sue Cornes, Senior Director, Health Statistics Unit, Department of Health
• Corelle Davies, A/Executive Director, Primary, Community and Extended Care Branch, Queensland Health (until November 2012)
• Terri Price, Director, Primary, Community and Extended Care Branch, Queensland Health (until December 2012)
• Dr Jillann Farmer, Director, Patient Safety and Quality Improvement Service (until July 2012)
• Dr John Wakefield, Executive Director, Patient Safety and Quality Improvement Service (until December 2012)
• Kirstine Sketcher-Baker, Senior Director, Patient Safety Unit (from January 2013)
• Lucy Fisher, Executive Director, Private Hospitals Association of Qld Inc
• Adjunct Professor Russell Stitz and Professor Michael Ward, Commissioners, Health Quality and Complaints Commission
• Helen Borradale and Rachel Welch, Legislative Policy Unit, Department of Health
• Michael Barnes, Queensland State Coroner and the staff of the Office of the State Coroner
• Professor Charles Naylor, Chief Forensic Pathologist, Forensic and Scientific Services
• Samantha Mason, Executive Secretary to Chief Forensic Pathologist, Forensic and Scientific Services.
Maternal and Perinatal Mortality and Morbidity in QueenslandQueensland Maternal and Perinatal Quality Council Report 2013
Great state. Great opportunity.
Department of Health