Embed Size (px)
Citation preview

Institute for Public Policy 2018 Gubernatorial Race
August 2018Report of Findings

SECTION ONE About the Poll
SECTION TWO Project Overview
SECTION THREE Key Findings & Headlines
SECTION FOUR Detailed Study Findings
Table of Contents

Slide /GreatBlue Research, Inc. 3
Our Story
Sacred Heart University and GreatBlue Research are partnering through the Institute for Public Policy to analyze salient issues facing the State of Connecticut. This collaboration combines the academic excellence of a top-rated private University with the research design, analysis, and reporting expertise of GreatBlue Research.

Table of ContentsSECTION ONE
About the Poll
SECTION TWO Project Overview
SECTION THREE Headlines
SECTION FOUR Detailed Study Findings

Areas of Investigation
The Sacred Heart University Institute for Public Policy leveraged quantitative research through a telephonic methodology to address the following areas of investigation:
๏ Voter preferences regarding the 2018 CT Gubernatorial Race
๏ Voter preferences regarding the 2018 election for the U.S. House of Representatives
๏ Impressions of Democratic and Republic Candidates for Governor
๏ Presidential Job Approval ๏ Gubernatorial Job Approval๏ Issues facing the State of Connecticut ๏ Demographic profiles of respondents

Slide /GreatBlue Research, Inc. 6
Research Methodology Snapshot
Methodology
Telephone*
Target
“Likely voters” ***
No. of Completes
502
Confidence Level
95
Margin of Error
+/- 4.32
No. of Questions
21**
Sample
Connecticut residents
* Supervisory personnel in addition to computer-aided interviewing platforms ensure the integrity of the data is accurate. ** This represents the total possible number of questions; not all respondents will answer all questions based on skip patterns and other instrument bias. *** Respondents to the survey indicated they were registered to vote, had voted in the 2016 election, and were “very” or “somewhat” likely to vote in the 2018 election in order to qualify for the survey.
Research Dates
August 16-21

Table of ContentsSECTION ONE
About the Poll
SECTION TWO Project Overview
SECTION THREE Key Findings & Headlines
SECTION FOUR Detailed Study Findings

Slide /GreatBlue Research, Inc.
SHU Institute for Public Policy - Key Findings & Headlines
❖ Data indicated a tight race for the governorship is ahead in the coming months as, currently, 40.8% of Connecticut voters currently support Ned Lamont (D) for governor compared to 36.9% who support Bob Stefanowski (R). • Unaffiliated voters are currently divided as 29.8% support Ned Lamont (D) and 29.8% support Bob Stefanowski (R).
In addition, another 27.3% of unaffiliated voters were undecided at the time of the poll. • A major gender gap exists as 49.3% of female voters support Ned Lamont (D) compared to 30.1% of female voters
who support Bob Stefanowski (R). However, 43.9% of male voters support Bob Stefanowski (R) compared to 31.4% of male voters who support Ned Lamont (D).
❖ 29.8% of Connecticut voters have a “favorable” view of Ned Lamont (D), while 30.3% have a “favorable” view of Bob Stefanowski (R). However, the race will remain fluid as voters get to know more about the candidates. Currently, 44.4% of Connecticut voters “have not heard enough about” Bob Stefanowski (R) to form an opinion, and 41.6% report the same about Ned Lamont (D).
❖ The top issues driving voters’ behavior heading into the race of governor was the “high overall tax burden” (24.7%) or “State budget crisis” (22.3%) in Connecticut.
❖ In addition, leading up to the gubernatorial election to choose his successor, only 15.9% of Connecticut voters “approve” of the job Dannel Malloy is doing as governor.
8
Slide /GreatBlue Research, Inc.
SHU Institute for Public Policy - Key Findings & Headlines
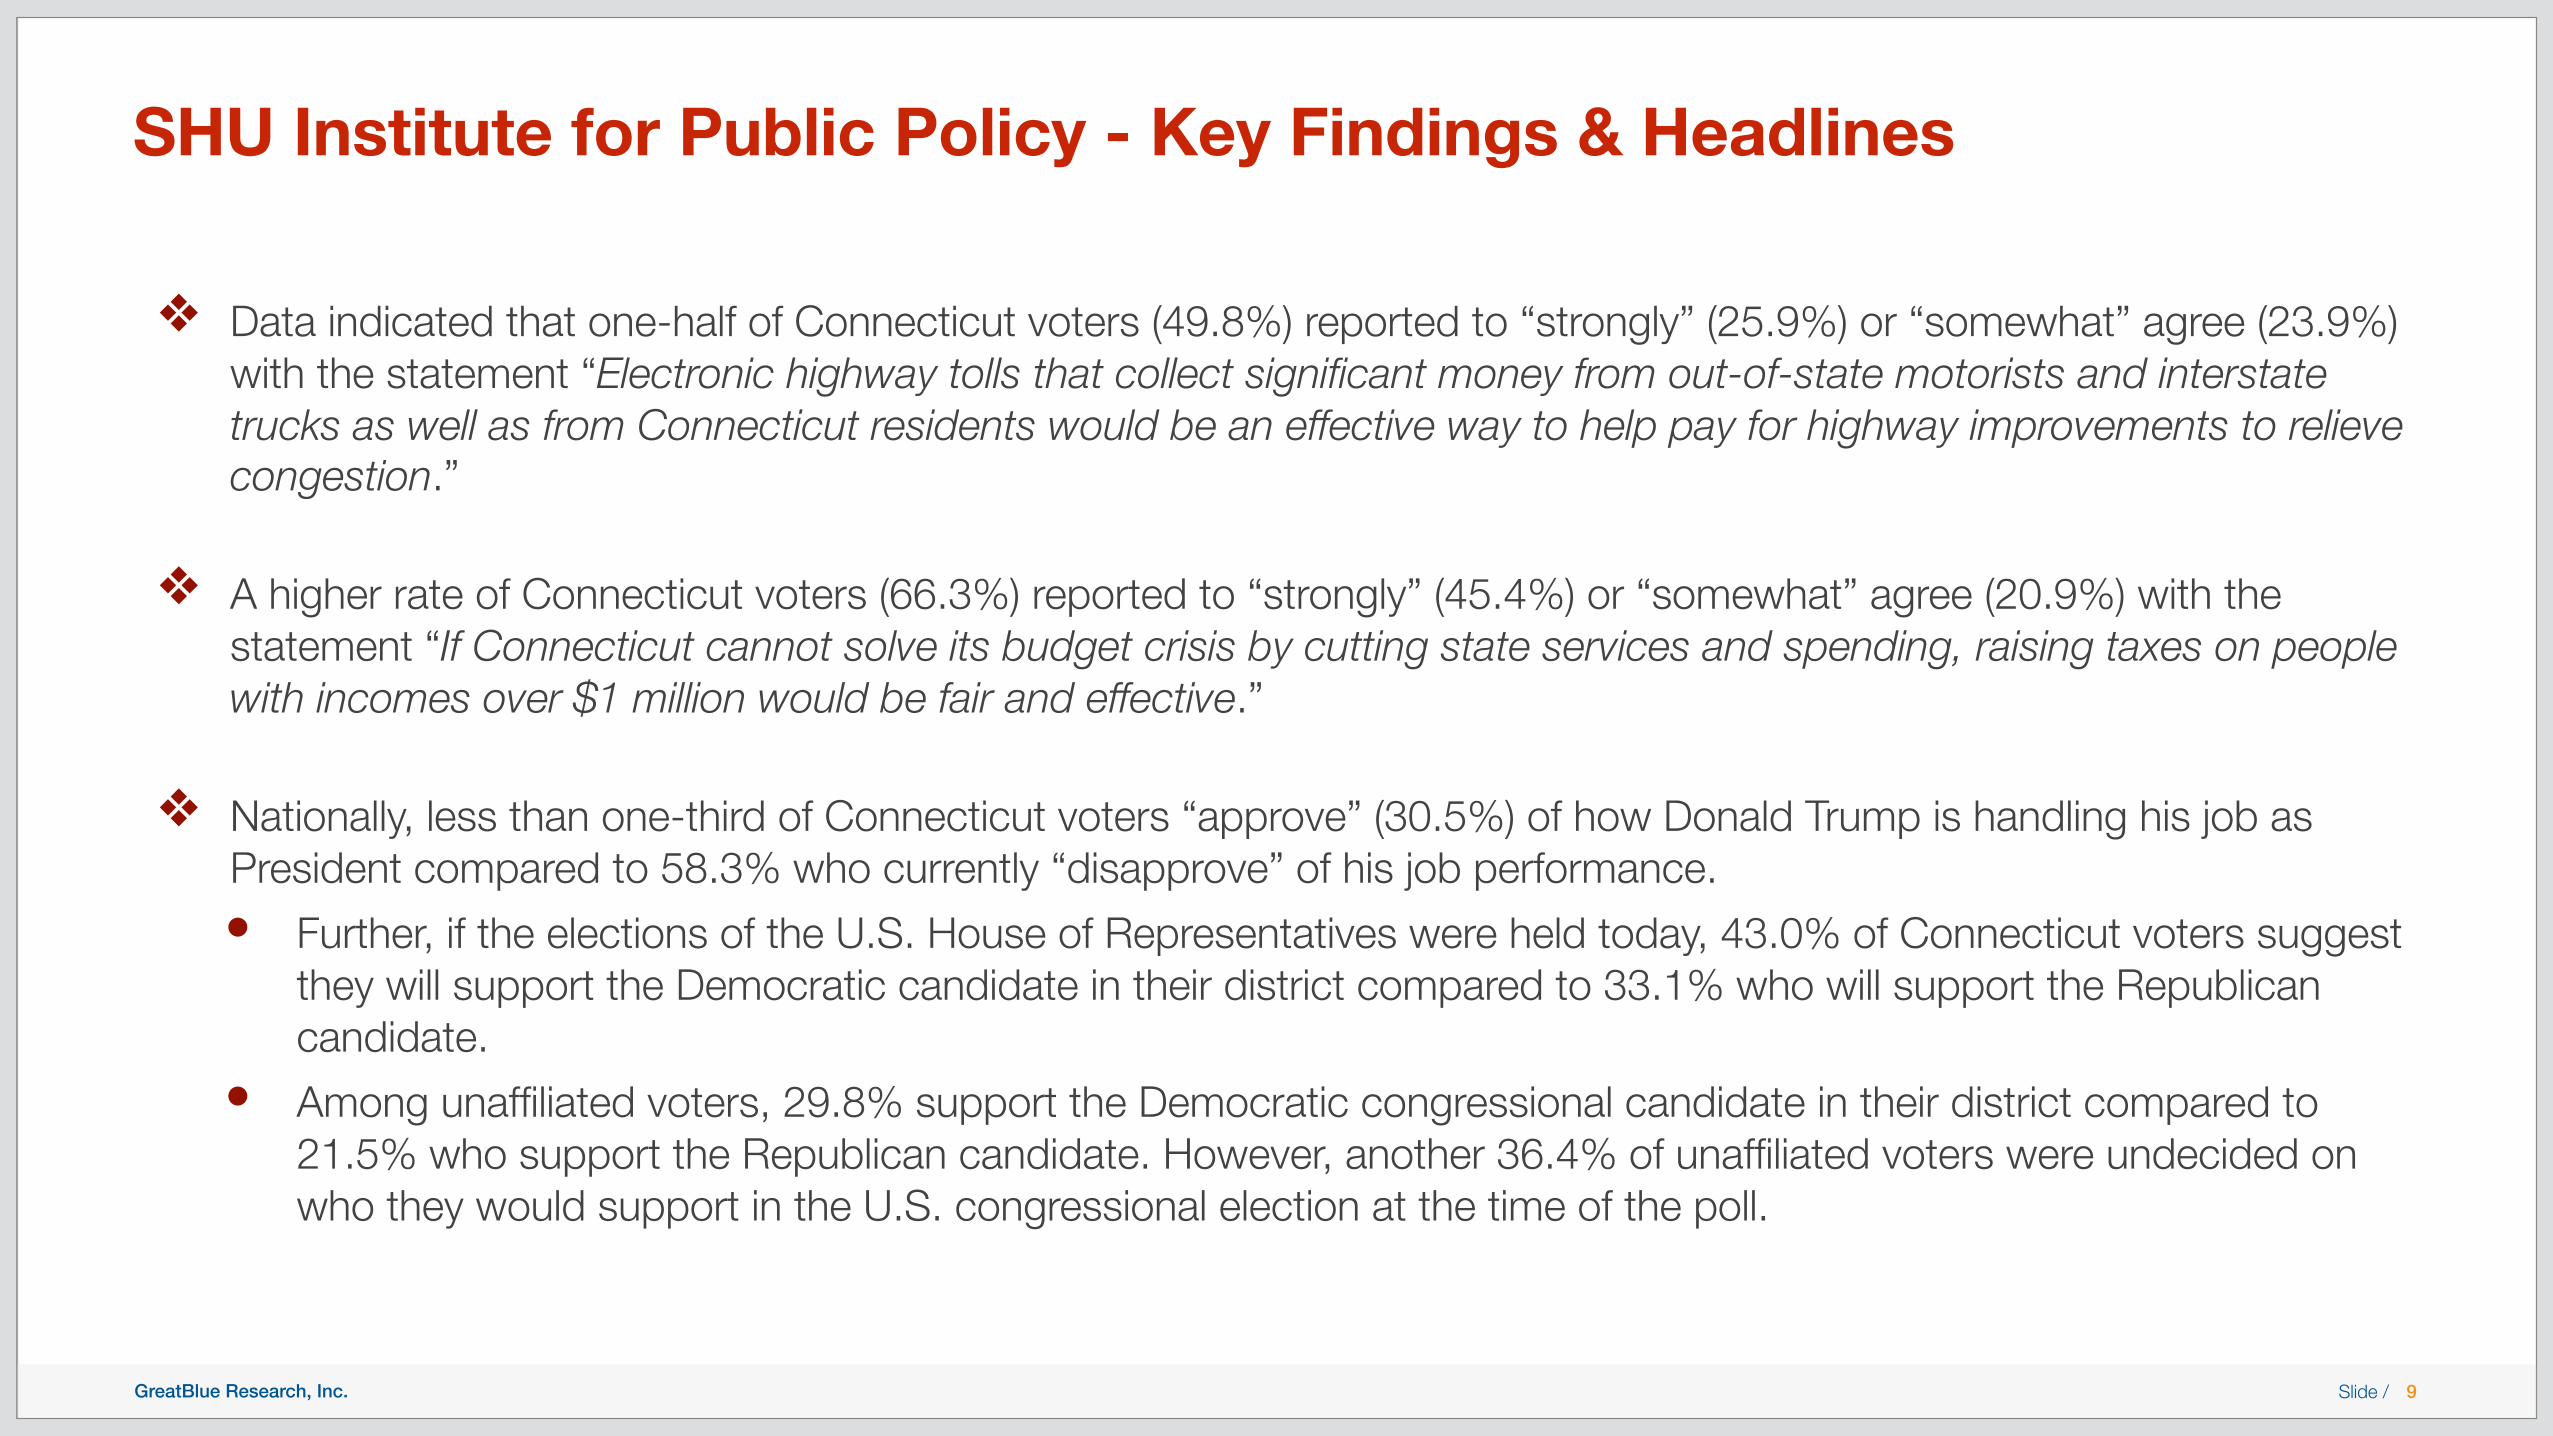
❖ Data indicated that one-half of Connecticut voters (49.8%) reported to “strongly” (25.9%) or “somewhat” agree (23.9%) with the statement “Electronic highway tolls that collect significant money from out-of-state motorists and interstate trucks as well as from Connecticut residents would be an effective way to help pay for highway improvements to relieve congestion.”
❖ A higher rate of Connecticut voters (66.3%) reported to “strongly” (45.4%) or “somewhat” agree (20.9%) with the statement “If Connecticut cannot solve its budget crisis by cutting state services and spending, raising taxes on people with incomes over $1 million would be fair and effective.”
❖ Nationally, less than one-third of Connecticut voters “approve” (30.5%) of how Donald Trump is handling his job as President compared to 58.3% who currently “disapprove” of his job performance. • Further, if the elections of the U.S. House of Representatives were held today, 43.0% of Connecticut voters suggest
they will support the Democratic candidate in their district compared to 33.1% who will support the Republican candidate.
• Among unaffiliated voters, 29.8% support the Democratic congressional candidate in their district compared to 21.5% who support the Republican candidate. However, another 36.4% of unaffiliated voters were undecided on who they would support in the U.S. congressional election at the time of the poll.
9

Table of ContentsSECTION ONE
About the Poll
SECTION TWO Project Overview
SECTION THREE Key Findings & Headlines
SECTION FOUR Detailed Study Findings

Slide /GreatBlue Research, Inc.
Gubernatorial RaceOverall, in regards to the 2018 Gubernatorial election being held in November, 40.8% of Connecticut voters suggest they will support Ned Lamont (D) for governor in the fall, compared to 36.9% who will support Bob Stefanowski (R). However, it is important to note that 16.7% of voters were undecided at the time of the poll. ❖ Both candidates have strong support within their own
parties as 81.9% of Republicans support Bob Stefanowski and 76.9% of Democrats support Ned Lamont.
❖ Currently, unaffiliated voters are split with 29.8% supporting Ned Lamont and 29.8% supporting Bob Stefanowski.
11
If the election for governor were being held today, and the candidates were Ned Lamont (D) and Bob Stefanowski (R) for whom would you vote?Q
16.7%
5.6%
36.9%
40.8%
Ned Lamont (D) Bob Stefanowski (R)Someone else Don't know/unsure
If the election for governor were being held today, and the candidates were Ned Lamont (D) and Bob Stefanowski (R) for whom would you vote?
TotalParty affiliation... Gender… College degree... Age... Race/ethnicity...
Democrat Republican Unaffiliated Female Male Yes No 18 to 34 35 to 44 45 to 64 65 or older White Black Hispanic
Ned Lamont (D) 40.8 76.9 4.2 29.8 49.8 31.4 36.5 42.9 46.5 40.2 40.3 39.8 37.0 60.9 62.1Bob Stefanowski (R) 36.9 9.5 81.9 29.8 30.1 43.9 37.7 36.2 29.1 28.0 38.3 43.9 43.4 4.3 13.8Someone else 5.6 3.0 2.8 13.2 4.6 6.7 7.8 4.6 7.0 14.6 4.6 0.8 4.4 17.4 6.9Don’t know/unsure 16.7 10.6 11.1 27.3 15.4 18.0 18.0 16.4 17.4 17.1 16.8 15.4 15.2 17.4 17.2

Slide /GreatBlue Research, Inc.
Gubernatorial RaceBoth candidates for governor have opportunities to grow support as 44.4% of Connecticut voters “have not heard enough about” Bob Stefanowski to form an opinion yet, and 41.6% report the same about Ned Lamont.
12
Is your opinion of Ned Lamont favorable, unfavorable or haven't you heard enough about him?
Q 4.6%
41.6%
24.5%
29.3%
Favorable UnfavorableHaven't heard enough Don't know/unsure
Is your opinion of Ned Lamont favorable, unfavorable or haven't you heard enough about him?
TotalParty affiliation... Gender… College degree...
Democrat Republican Unaffiliated Female Male Yes No
Favorable 29.3 49.2 9.0 23.1 35.5 23.0 24.6 31.9Unfavorable 24.5 7.5 52.8 17.4 18.5 31.0 23.4 25.2Haven’t heard enough about
41.6 40.7 32.6 52.9 42.9 40.2 46.7 38.6Don’t know/unsure 4.6 2.5 5.6 6.6 3.1 5.9 5.4 4.3Is your opinion of Ned Lamont favorable, unfavorable or haven't you heard enough about him?
TotalAge... Race/ethnicity...
18 to 34 35 to 44 45 to 64 65 or older White Black Hispanic
Favorable 29.3 27.9 29.3 30.6 29.3 26.5 41.3 44.8Unfavorable 24.5 15.1 18.3 28.1 29.3 29.8 4.3 0.0Haven’t heard enough about
41.6 55.8 48.8 35.2 36.6 39.3 54.3 48.3Don’t know/unsure 4.6 1.2 3.7 6.1 4.9 4.4 0.0 6.9
Is your opinion of Bob Stefanowski favorable, unfavorable or haven't you heard enough about him?
Q 5.2%
44.4%
20.1%
30.3%
Favorable UnfavorableHaven't heard enough Don't know/unsure
Is your opinion of Bob Stefanowski favorable, unfavorable or haven't you heard enough about him?
TotalParty affiliation... Gender… College degree...
Democrat Republican Unaffiliated Female Male Yes No
Favorable 30.3 8.0 66.7 22.3 25.1 35.6 30.5 30.1Unfavorable 20.1 39.7 4.9 10.7 25.1 15.1 15.6 22.8Haven’t heard enough about
44.4 46.7 25.0 62.0 45.9 43.1 48.5 41.9Don’t know/unsure 5.2 5.5 3.5 5.0 3.9 6.3 5.4 5.2Is your opinion of Bob Stefanowski favorable, unfavorable or haven't you heard enough about him?
TotalAge... Race/ethnicity...
18 to 34 35 to 44 45 to 64 65 or older White Black Hispanic
Favorable 30.3 23.3 25.6 28.6 38.2 35.2 6.5 13.8Unfavorable 20.1 22.1 14.6 22.4 20.3 18.5 32.6 20.7Haven’t heard enough about
44.4 52.3 53.7 44.9 34.1 42.9 50.0 58.6Don’t know/unsure 5.2 2.3 6.1 4.1 7.3 3.3 10.9 6.9

Slide /GreatBlue Research, Inc.
Congressional RaceIn regards to the U.S. congressional races also being held in November, 43.0% of Connecticut voters suggest they will support the Democratic candidate in their district compared to 33.1% who will support the Republican candidate. ❖ Both major parties running for U.S. House of
Representatives have consolidated strong support within their own parties as 83.3% of Republicans support Republican candidates for Congress and 81.9% of Democrats support Democratic candidates for Congress.
❖ However, in regards to the U.S. congressional election, unaffiliated voters currently favor the Democratic candidates in their district by a 29.8% to 21.5% margin.
13
If the election for the U.S. House of Representatives were being held today, would you vote for the Democratic candidate or the Republican candidate in your congressional district?
Q19.9%
4.0%
33.1%
43.0%
Democratic candidate Republican candidateSomeone else Don't know/unsure
If the election for the U.S. House of Representatives were being held today, would you vote for the Democratic candidate or the Republican candidate in your congressional district?
TotalParty affiliation... Gender… College degree... Age... Race/ethnicity...
Democrat Republican Unaffiliated Female Male Yes No 18 to 34 35 to 44 45 to 64 65 or older White Black Hispanic
Democratic candidate 43.0 81.9 4.2 29.8 50.2 35.6 40.1 44.4 51.2 45.1 42.9 37.4 38.8 67.4 69.0Republican candidate 33.1 5.0 83.3 21.5 25.5 41.4 32.3 33.4 23.3 24.4 33.2 43.9 39.6 2.2 10.3Someone else 4.0 1.0 2.1 12.4 3.9 3.8 6.0 3.0 7.0 11.0 1.5 0.8 3.1 13.0 0.0Don’t know/unsure 19.9 12.1 10.4 36.4 20.5 19.2 21.6 19.1 18.6 19.5 22.4 17.9 18.5 17.4 20.7

Slide /GreatBlue Research, Inc.
Job Approval RatingsOver two-thirds of Connecticut voters “disapprove” of how Dannel Malloy is handling his job as governor (69.6%), while only 15.9% “approve” of his job performance. ❖ Only 2.8% of Republican voters in the state currently
approve of Dannel Malloy’s job performance. ❖ Over three-quarters of unaffiliated voters currently
“disapprove” of how Dannel Malloy is handling his job as Governor.
14
Do you approve or disapprove of the way Dannel Malloy is handling his job as Governor?Q
14.5%
69.6%
15.9%
Approve Disapprove Don't know/unsure
Do you approve or disapprove of the way Dannel Malloy is handling his job as Governor?
TotalParty affiliation... Gender… College degree... Age... Race/ethnicity...
Democrat Republican Unaffiliated Female Male Yes No 18 to 34 35 to 44 45 to 64 65 or older White Black Hispanic
Approve 15.9 28.6 2.8 10.7 18.9 12.6 12.0 17.6 15.1 13.4 15.3 17.9 13.6 26.1 24.1
Disapprove 69.6 51.8 92.4 76.0 63.3 76.6 70.7 69.3 70.9 73.2 70.9 65.0 74.0 52.2 62.1
Don’t know/unsure 14.5 19.6 4.9 13.2 17.8 10.9 17.4 13.1 14.0 13.4 13.8 17.1 12.3 21.7 13.8

Slide /GreatBlue Research, Inc.
Job Approval Ratings58.3% of Connecticut voters “disapprove” of how Donald Trump is handling his job as President, while slightly less than one-third “approve” of his job performance (30.5%). ❖ Only 4.0% of Democratic voters in the state currently
approve of Donald Trump’s job performance. ❖ Over three-fifths of unaffiliated voters currently
“disapprove” of how Donald Trump is handling his job as President.
15
Do you approve or disapprove of the way Donald Trump is handling his job as President?Q
11.2%
58.3%
30.5%
Approve Disapprove Don't know/unsure
Do you approve or disapprove of the way Donald Trump is handling his job as President?
TotalParty affiliation... Gender… College degree... Age... Race/ethnicity...
Democrat Republican Unaffiliated Female Male Yes No 18 to 34 35 to 44 45 to 64 65 or older White Black Hispanic
Approve 30.5 4.0 75.0 23.1 23.6 38.1 31.1 30.1 23.3 24.4 30.1 37.4 36.0 4.3 17.2
Disapprove 58.3 87.9 14.6 62.0 65.3 51.0 57.5 59.0 69.8 63.4 56.6 52.0 53.7 89.1 65.5
Don’t know/unsure 11.2 8.0 10.4 14.9 11.2 10.9 11.4 10.9 7.0 12.2 13.3 10.6 10.3 6.5 17.2

Slide /GreatBlue Research, Inc.
Issues facing the State of ConnecticutFor the majority of residents, either the State’s “high overall tax burden” (24.7%) or “budget crisis” (22.3%) would be the topic that would determine their vote for governor. Another 12.7% reported the “high overall cost of living” in the State would be the deciding factor for them. “Education inequality” (7.2%), “low economic growth” (6.4%), and “income inequality within the State” (5.8%) were factors for fewer voters.
16
What is the most important issue to you in deciding your vote for governor in November?Q
High overall tax burdenState budget crisis
High overall cost of livingEducation inequality
Low economic growthIncome inequality within the State
People moving out of CTInfrastructure
Low wage growthTraffic
Quality of the cities in the stateOther/don't know
0% 25% 50% 75% 100%9.6%
0.8%0.6%1.8%3.2%5.0%5.8%6.4%7.2%12.7%
22.3%24.7% What is the most important issue to you in
deciding your vote for governor in November?
TotalParty affiliation... Gender… College degree...
Democrat Republican Unaffiliated Female Male Yes No
High overall tax burden 24.7 19.6 29.9 25.6 22.4 27.2 25.1 24.0
State budget crisis 22.3 20.6 28.5 19.0 21.6 23.4 16.2 25.8
High overall cost of living 12.7 10.6 8.3 19.8 15.8 9.6 17.4 10.0
What is the most important issue to you in deciding your vote for governor in November?
TotalAge... Race/ethnicity...
18 to 34 35 to 44 45 to 64 65 or older White Black Hispanic
High overall tax burden 24.7 11.6 19.5 33.2 25.2 26.7 13.0 27.6
State budget crisis 22.3 23.3 26.8 18.9 23.6 25.4 10.9 6.9
High overall cost of living 12.7 11.6 19.5 33.2 25.2 26.7 13.0 27.6

Slide /GreatBlue Research, Inc.
Half of Connecticut voters, 49.8%, reported to either “strongly” (25.9%) or “somewhat” agree (23.9%) with the statement “Electronic highway tolls that collect significant money from out-of-state motorists and interstate trucks as well as from Connecticut residents would be an effective way to help pay for highway improvements to relieve congestion.” ❖ 65.9% of Democratic voters in the State supported electronic
highway tolls compared 38.8% of Republican voters. ❖ 41.3% of unaffiliated voters supported electric highway tolls
compared to 52.8% who opposed these tolls.
17
Issues facing the State of Connecticut“Electronic highway tolls that collect significant money from out-of-state motorists and interstate trucks as well as from Connecticut residents would be an effective way to help pay for highway improvements to relieve congestion.”
Q4.2%
35.1%
11.0%23.9%
25.9%
Strongly agree Somewhat agree Somewhat disagreeStrongly disagree Don't know/unsure
“Electronic highway tolls that collect significant money from out-of-state motorists and interstate trucks as well as from Connecticut residents would be an effective way to help pay for highway improvements to relieve congestion.”
TotalParty affiliation... Gender… College degree... Age... Race/ethnicity...
Democrat Republican Unaffiliated Female Male Yes No 18 to 34 35 to 44 45 to 64 65 or older White Black Hispanic
Strongly agree 25.9 32.7 19.4 24.8 28.2 23.8 25.7 26.1 20.9 22.0 28.1 28.5 28.5 19.6 17.2Somewhat agree 23.9 33.2 19.4 16.5 25.1 23.0 24.6 23.7 24.4 23.2 24.5 24.4 22.4 28.3 34.5Somewhat disagree 11.0 9.5 8.3 14.0 9.3 12.6 12.0 10.6 19.8 12.2 10.2 5.7 8.5 23.9 17.2Strongly disagree 35.1 20.6 49.3 38.8 32.4 38.1 32.9 36.2 32.6 36.6 35.2 35.8 37.0 23.9 27.6Don’t know/unsure 4.2 4.0 3.5 5.8 5.0 2.5 4.8 3.3 2.3 6.1 2.0 5.7 3.6 4.3 3.4
17

Slide /GreatBlue Research, Inc. 18
Issues facing the State of Connecticut
“If Connecticut cannot solve its budget crisis by cutting state services and spending, raising taxes on people with incomes over $1 million would be fair and effective.”
Q4.2%
20.7%
8.8%
20.9%
45.4%
Strongly agree Somewhat agree Somewhat disagreeStrongly disagree Don't know/unsure
“If Connecticut cannot solve its budget crisis by cutting state services and spending, raising taxes on people with incomes over $1 million would be fair and effective.”
TotalParty affiliation... Gender… College degree... Age... Race/ethnicity...
Democrat Republican Unaffiliated Female Male Yes No 18 to 34 35 to 44 45 to 64 65 or older White Black Hispanic
Strongly agree 45.4 59.3 25.0 47.9 49.8 41.4 52.1 42.6 46.5 45.1 46.9 43.1 45.0 56.5 34.5Somewhat agree 20.9 21.6 19.4 19.0 21.6 20.1 18.6 21.9 26.7 19.5 18.9 22.8 19.8 28.3 31.0Somewhat disagree 8.8 6.5 15.3 5.8 8.1 9.6 9.0 8.8 10.5 13.4 7.1 7.3 8.5 8.7 10.3Strongly disagree 20.7 9.5 36.1 21.5 15.4 26.4 16.2 23.1 11.6 17.1 24.0 22.8 22.4 4.3 24.1Don’t know/unsure 4.2 3.0 4.2 5.8 5.0 2.5 4.2 3.6 4.7 4.9 3.1 4.1 4.4 2.2 0.0
18
Two-thirds of Connecticut voters, 66.3%, reported to either “strongly” (45.4%) or “somewhat” agree (20.9%) with the statement “If Connecticut cannot solve its budget crisis by cutting state services and spending, raising taxes on people with incomes over $1 million would be fair and effective.” ❖ 80.9% of Democratic voters in the State supported raising taxes
on people with incomes over $1 million compared 44.4% of Republican voters.
❖ 66.9% of unaffiliated voters supported raising taxes on people with incomes over $1 million compared to 27.3% who opposed these taxes.

Slide /GreatBlue Research, Inc. 19
Lesley DeNardis, Ph.D. Executive Director, Institute for Public Policy
(203) 371-7834 [email protected]
Michael Vigeant CEO, GreatBlue Research
(860) 736-6158 [email protected]