Embed Size (px)
Citation preview
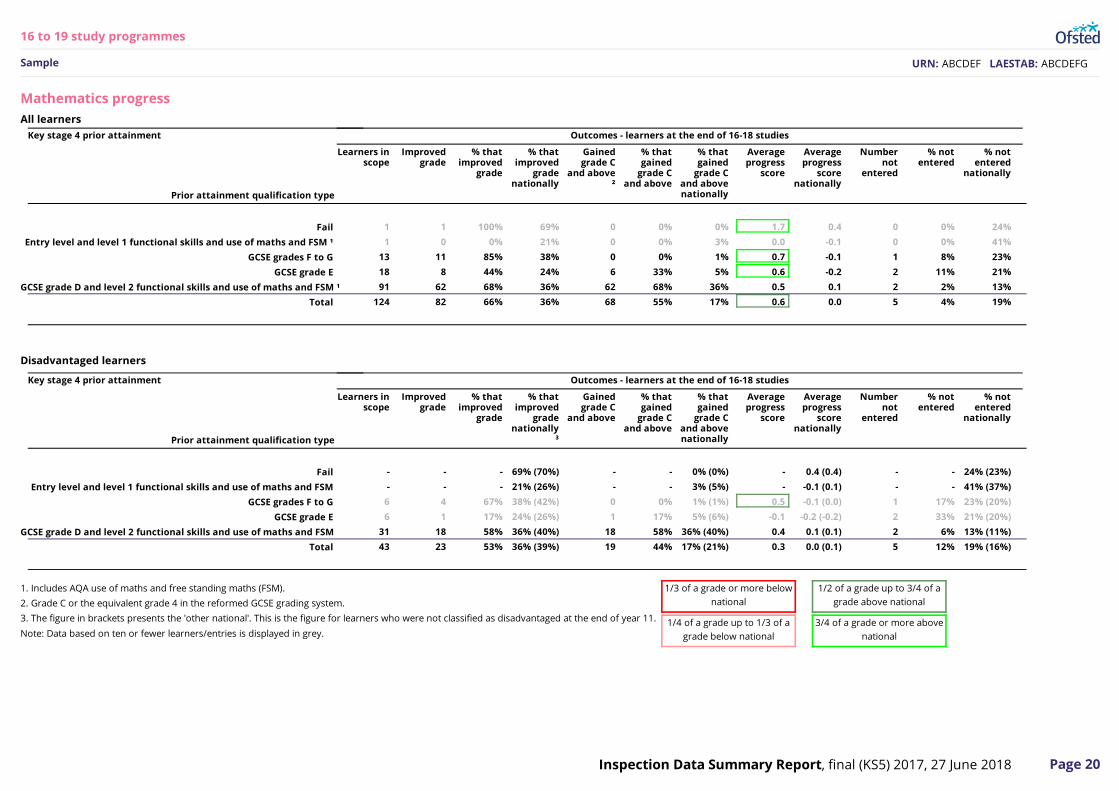
URN: ABCDEF LAESTAB: ABCDEFG
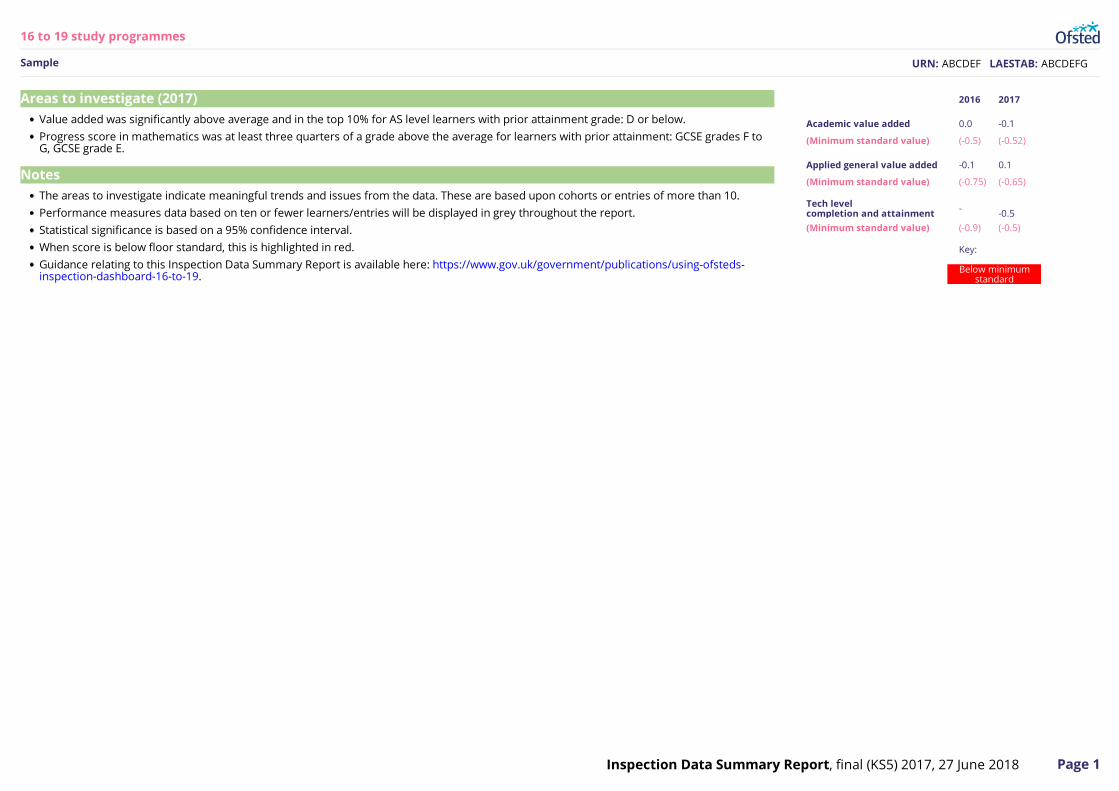
Value added was significantly above average and in the top 10% for AS level learners with prior attainment grade: D or below.
Progress score in mathematics was at least three quarters of a grade above the average for learners with prior attainment: GCSE grades F toG, GCSE grade E.
The areas to investigate indicate meaningful trends and issues from the data. These are based upon cohorts or entries of more than 10.
Performance measures data based on ten or fewer learners/entries will be displayed in grey throughout the report.
Statistical significance is based on a 95% confidence interval.
When score is below floor standard, this is highlighted in red.
Guidance relating to this Inspection Data Summary Report is available here: https://www.gov.uk/government/publications/using-ofsteds-inspection-dashboard-16-to-19.
2016 2017
Academic value added 0.0 -0.1
(Minimum standard value) (-0.5) (-0.52)
Applied general value added -0.1 0.1
(Minimum standard value) (-0.75) (-0.65)
Tech levelcompletion and attainment - -0.5
(Minimum standard value) (-0.9) (-0.5)
Key:
Below minimumstandard
Page 1Inspection Data Summary Report, final (KS5) 2017, 27 June 2018
Areas to investigate (2017)
Notes
16 to 19 study programmesCover
Sample
URN: ABCDEF LAESTAB: ABCDEFG
Page 2Inspection Data Summary Report, final (KS5) 2017, 27 June 2018
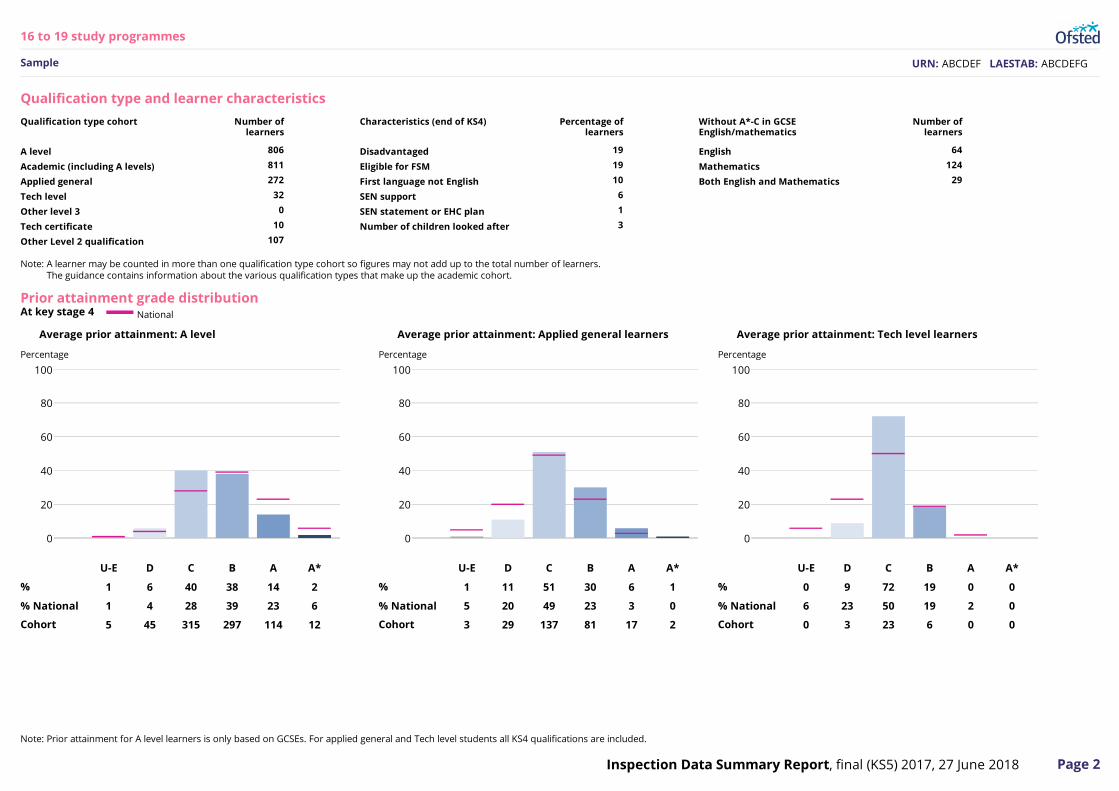
Qualification type cohort Number oflearners
A level 806
Academic (including A levels) 811
Applied general 272
Tech level 32
Other level 3 0
Tech certificate 10
Other Level 2 qualification 107
Characteristics (end of KS4) Percentage oflearners
Disadvantaged 19
Eligible for FSM 19
First language not English 10
SEN support 6
SEN statement or EHC plan 1
Number of children looked after 3
Without A*-C in GCSEEnglish/mathematics
Number oflearners
English 64
Mathematics 124
Both English and Mathematics 29
100
20
40
60
80
00
U-E D C B A A*
% 1 6 40 38 14 2
% National 1 4 28 39 23 6
Cohort 5 45 315 297 114 12
100
20
40
60
80
00
U-E D C B A A*
% 1 11 51 30 6 1
% National 5 20 49 23 3 0
Cohort 3 29 137 81 17 2
100
20
40
60
80
00
U-E D C B A A*
% 0 9 72 19 0 0
% National 6 23 50 19 2 0
Cohort 0 3 23 6 0 0
16 to 19 study programmesContext
Sample
Qualification type and learner characteristics
National
Prior attainment grade distributionAt key stage 4
Average prior attainment: A level
Percentage
Average prior attainment: Applied general learners
Percentage
Average prior attainment: Tech level learners
Percentage
Note: A learner may be counted in more than one qualification type cohort so figures may not add up to the total number of learners.The guidance contains information about the various qualification types that make up the academic cohort.
Note: Prior attainment for A level learners is only based on GCSEs. For applied general and Tech level students all KS4 qualifications are included.
URN: ABCDEF LAESTAB: ABCDEFG
Page 3Inspection Data Summary Report, final (KS5) 2017, 27 June 2018
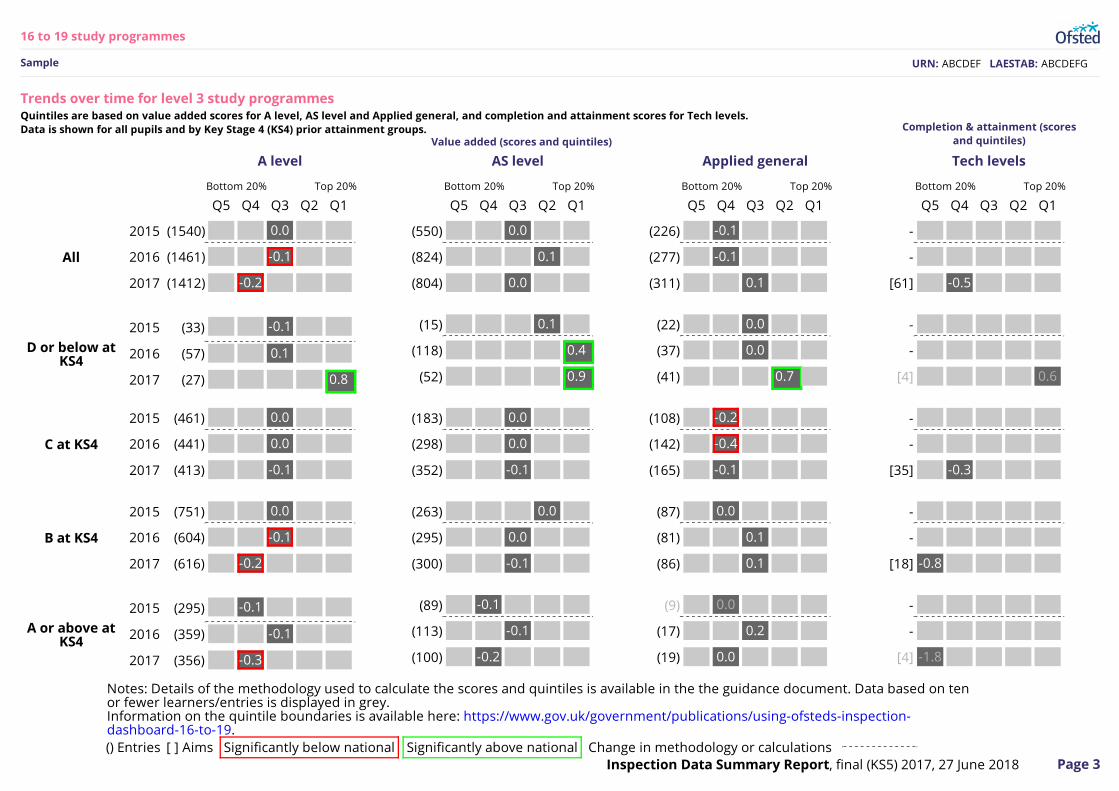
A level
Bottom 20% Top 20%
Q5 Q4 Q3 Q2 Q1
All 2015 (1540) 0.0
All 2016 (1461) -0.1
All 2017 (1412) -0.2
D or below atKS4 2015 (33) -0.1
D or below atKS4 2016 (57) 0.1
D or below atKS4 2017 (27) 0.8
C at KS4 2015 (461) 0.0
C at KS4 2016 (441) 0.0
C at KS4 2017 (413) -0.1
B at KS4 2015 (751) 0.0
B at KS4 2016 (604) -0.1
B at KS4 2017 (616) -0.2
A or above atKS4 2015 (295) -0.1
A or above atKS4 2016 (359) -0.1
A or above atKS4 2017 (356) -0.3
AS level
Bottom 20% Top 20%
Q5 Q4 Q3 Q2 Q1
(550) 0.0
(824) 0.1
(804) 0.0
(15) 0.1
(118) 0.4
(52) 0.9
(183) 0.0
(298) 0.0
(352) -0.1
(263) 0.0
(295) 0.0
(300) -0.1
(89) -0.1
(113) -0.1
(100) -0.2
Applied general
Bottom 20% Top 20%
Q5 Q4 Q3 Q2 Q1
(226) -0.1
(277) -0.1
(311) 0.1
(22) 0.0
(37) 0.0
(41) 0.7
(108) -0.2
(142) -0.4
(165) -0.1
(87) 0.0
(81) 0.1
(86) 0.1
(9) 0.0
(17) 0.2
(19) 0.0
Tech levels
Bottom 20% Top 20%
Q5 Q4 Q3 Q2 Q1
-
-
[61] -0.5
-
-
[4] 0.6
-
-
[35] -0.3
-
-
[18] -0.8
-
-
[4] -1.8
16 to 19 study programmesLevel
Sample
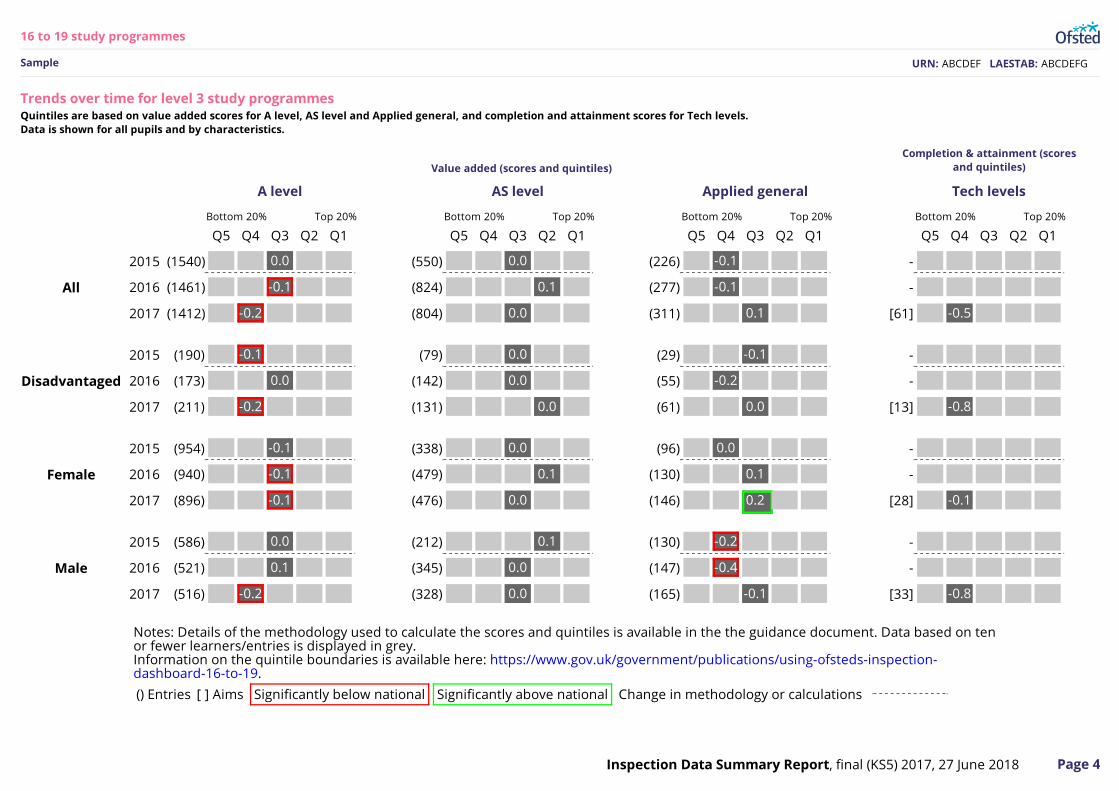
Trends over time for level 3 study programmesQuintiles are based on value added scores for A level, AS level and Applied general, and completion and attainment scores for Tech levels.Data is shown for all pupils and by Key Stage 4 (KS4) prior attainment groups.
Value added (scores and quintiles)Completion & attainment (scores
and quintiles)
Notes: Details of the methodology used to calculate the scores and quintiles is available in the the guidance document. Data based on tenor fewer learners/entries is displayed in grey.Information on the quintile boundaries is available here: https://www.gov.uk/government/publications/using-ofsteds-inspection-dashboard-16-to-19.
() Entries [ ] Aims Change in methodology or calculationsSignificantly below national Significantly above national
URN: ABCDEF LAESTAB: ABCDEFG
Page 4Inspection Data Summary Report, final (KS5) 2017, 27 June 2018
A level
Bottom 20% Top 20%
Q5 Q4 Q3 Q2 Q1
All 2015 (1540) 0.0
All 2016 (1461) -0.1
All 2017 (1412) -0.2
Disadvantaged 2015 (190) -0.1
Disadvantaged 2016 (173) 0.0
Disadvantaged 2017 (211) -0.2
Female 2015 (954) -0.1
Female 2016 (940) -0.1
Female 2017 (896) -0.1
Male 2015 (586) 0.0
Male 2016 (521) 0.1
Male 2017 (516) -0.2
AS level
Bottom 20% Top 20%
Q5 Q4 Q3 Q2 Q1
(550) 0.0
(824) 0.1
(804) 0.0
(79) 0.0
(142) 0.0
(131) 0.0
(338) 0.0
(479) 0.1
(476) 0.0
(212) 0.1
(345) 0.0
(328) 0.0
Applied general
Bottom 20% Top 20%
Q5 Q4 Q3 Q2 Q1
(226) -0.1
(277) -0.1
(311) 0.1
(29) -0.1
(55) -0.2
(61) 0.0
(96) 0.0
(130) 0.1
(146) 0.2
(130) -0.2
(147) -0.4
(165) -0.1
Tech levels
Bottom 20% Top 20%
Q5 Q4 Q3 Q2 Q1
-
-
[61] -0.5
-
-
[13] -0.8
-
-
[28] -0.1
-
-
[33] -0.8
16 to 19 study programmesLevel
Sample
Trends over time for level 3 study programmesQuintiles are based on value added scores for A level, AS level and Applied general, and completion and attainment scores for Tech levels.Data is shown for all pupils and by characteristics.
Value added (scores and quintiles)Completion & attainment (scores
and quintiles)
Notes: Details of the methodology used to calculate the scores and quintiles is available in the the guidance document. Data based on tenor fewer learners/entries is displayed in grey.Information on the quintile boundaries is available here: https://www.gov.uk/government/publications/using-ofsteds-inspection-dashboard-16-to-19.
() Entries [ ] Aims Change in methodology or calculationsSignificantly below national Significantly above national
URN: ABCDEF LAESTAB: ABCDEFG
Page 5Inspection Data Summary Report, final (KS5) 2017, 27 June 2018
Technical certificates
Bottom 20% Top 20%
Q5 Q4 Q3 Q2 Q1
All 2015 -
All 2016 -
All 2017 [14] 0.4
G or below atKS4 2015 -
G or below atKS4 2016 -
G or below atKS4 2017 -
F at KS4 2015 -
F at KS4 2016 -
F at KS4 2017 [1] -1.2
E at KS4 2015 -
E at KS4 2016 -
E at KS4 2017 [3] -0.5
D or above atKS4 2015 -
D or above atKS4 2016 -
D or above atKS4 2017 [10] 0.8
Other level 2vocational
Bottom 20% Top 20%
Q5 Q4 Q3 Q2 Q1
-
-
[112] 0.9
-
-
-
-
-
[1] -1.1
-
-
[13] 0.1
-
-
[96] 0.9
16 to 19 study programmesLevel
Sample
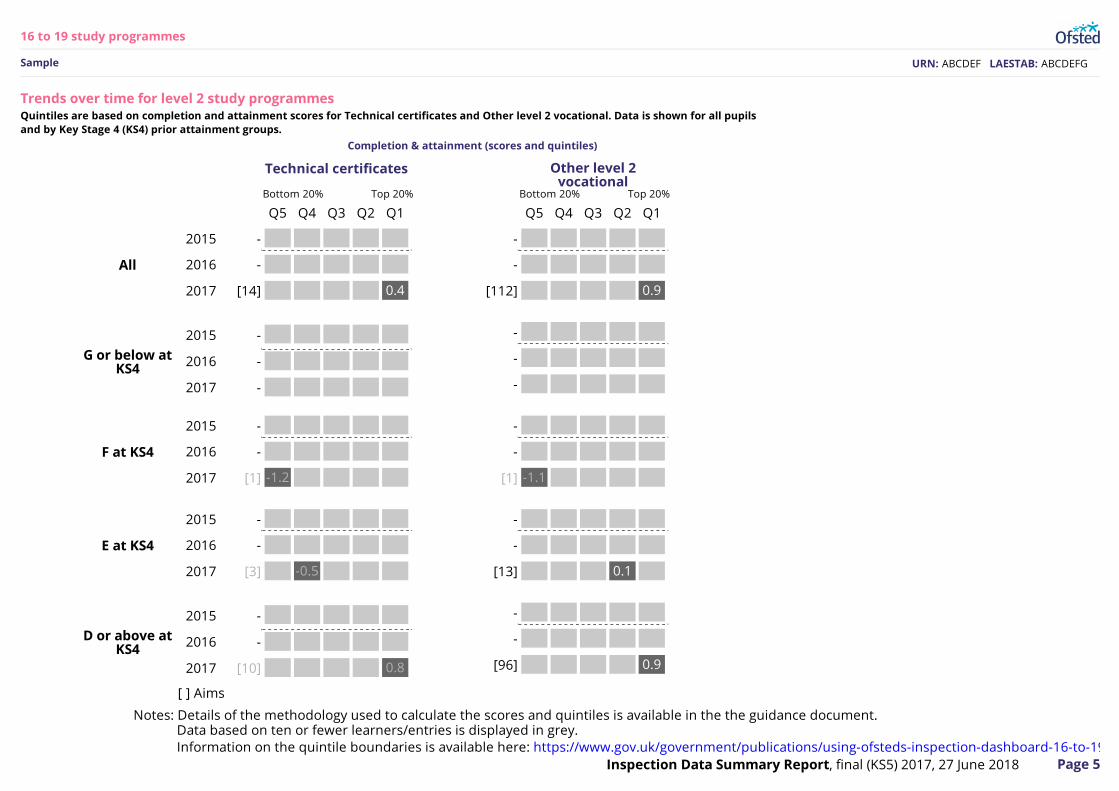
Trends over time for level 2 study programmesQuintiles are based on completion and attainment scores for Technical certificates and Other level 2 vocational. Data is shown for all pupilsand by Key Stage 4 (KS4) prior attainment groups.
Completion & attainment (scores and quintiles)
[ ] Aims
Notes: Details of the methodology used to calculate the scores and quintiles is available in the the guidance document.Data based on ten or fewer learners/entries is displayed in grey.Information on the quintile boundaries is available here: https://www.gov.uk/government/publications/using-ofsteds-inspection-dashboard-16-to-19
URN: ABCDEF LAESTAB: ABCDEFG
Page 6Inspection Data Summary Report, final (KS5) 2017, 27 June 2018
Technical certificates
Bottom 20% Top 20%
Q5 Q4 Q3 Q2 Q1
All 2015 -
All 2016 -
All 2017 [14] 0.4
Disadvantaged 2015 -
Disadvantaged 2016 -
Disadvantaged 2017 [2] -0.7
Female 2015 -
Female 2016 -
Female 2017 [1] 0.8
Male 2015 -
Male 2016 -
Male 2017 [13] 0.4
Other level 2vocational
Bottom 20% Top 20%
Q5 Q4 Q3 Q2 Q1
-
-
[112] 0.9
-
-
[34] 0.5
-
-
[59] 1.0
-
-
[53] 0.7
16 to 19 study programmesLevel
Sample
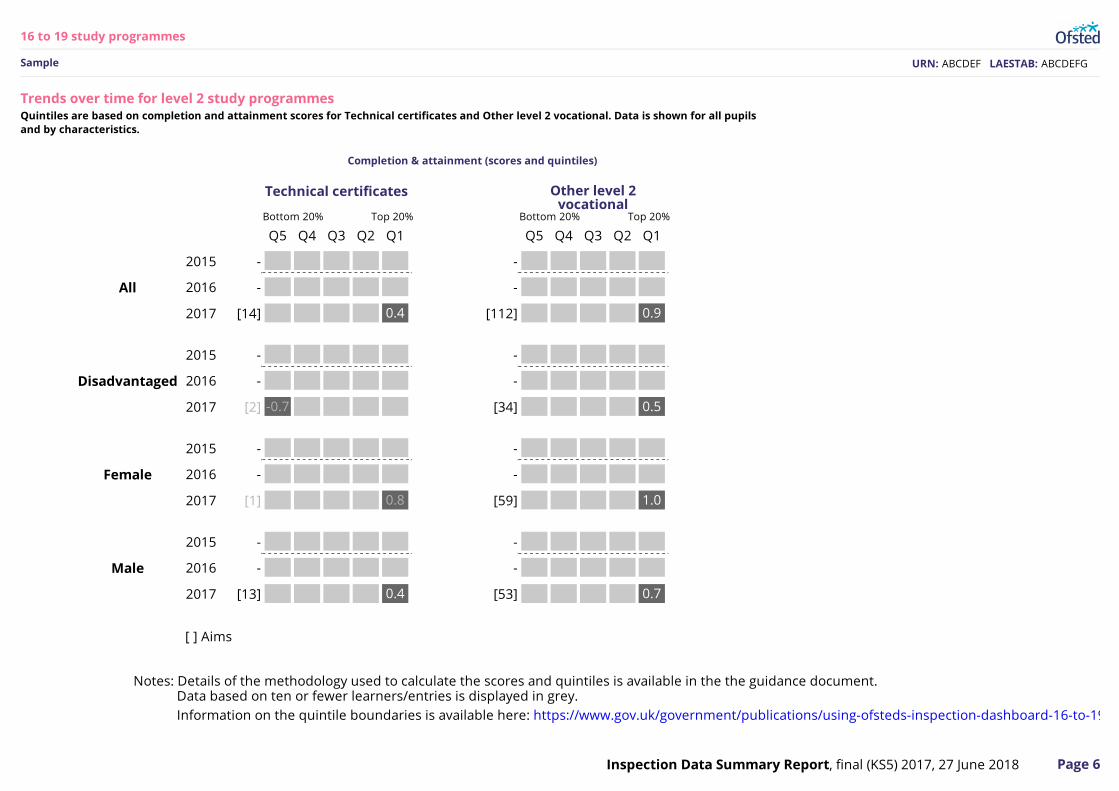
Trends over time for level 2 study programmesQuintiles are based on completion and attainment scores for Technical certificates and Other level 2 vocational. Data is shown for all pupilsand by characteristics.
Completion & attainment (scores and quintiles)
Notes: Details of the methodology used to calculate the scores and quintiles is available in the the guidance document.
[ ] Aims
Data based on ten or fewer learners/entries is displayed in grey.Information on the quintile boundaries is available here: https://www.gov.uk/government/publications/using-ofsteds-inspection-dashboard-16-to-19
URN: ABCDEF LAESTAB: ABCDEFG
Page 7Inspection Data Summary Report, final (KS5) 2017, 27 June 2018
Psychology3
-4
0
VA -0.2 -0.1 0.1
Entries 130 116 129
Maths
-0.5 -0.4 -0.8
98 97 93
History
-0.1 0.1 -0.3
94 89 77
English lang
-0.1 -0.3 -0.2
81 70 76
Biology
0.1 -0.3 -0.3
69 69 67
Sociology
0.1 -0.2 0.3
64 53 61
Business stds
0.5 0.0 0.0
64 63 60
Health&socialApplied
0.1 0.7 0.8
68 56 60
Med/film/TV3
-4
0
VA 0.2 -0.1 -0.2
Entries 59 59 59
Geography
-0.1 -0.3 -0.6
30 42 54
Chemistry
0.4 0.0 0.1
53 52 51
English lit
0.1 -0.1 0.0
49 58 49
Law
1.0 0.4 0.2
53 28 46
Physics
-0.2 -0.1 -0.3
34 38 44
Fine art
-0.3 0.1 -0.7
51 37 37
Acc & finance
0.4 0.1 -0.8
23 31 37
English3
-4
0
VA 0.0 0.1 -0.2
Entries 77 35 36
Photography
-0.4 -0.4 -0.4
46 43 35
Travel&tourismApplied
-0.3 0.0 -0.3
13 22 31
Use of maths
-0.1 -0.1 -0.2
12 18 31
Govt & pol
-0.2 0.1 0.1
23 15 29
Comms stds
-0.3 0.0 0.0
39 30 26
Graphics
0.6 0.0 -0.5
25 29 26
A&D textiles
-0.4 -0.1 -0.1
20 19 22
16 to 19 study programmesVA
Sample
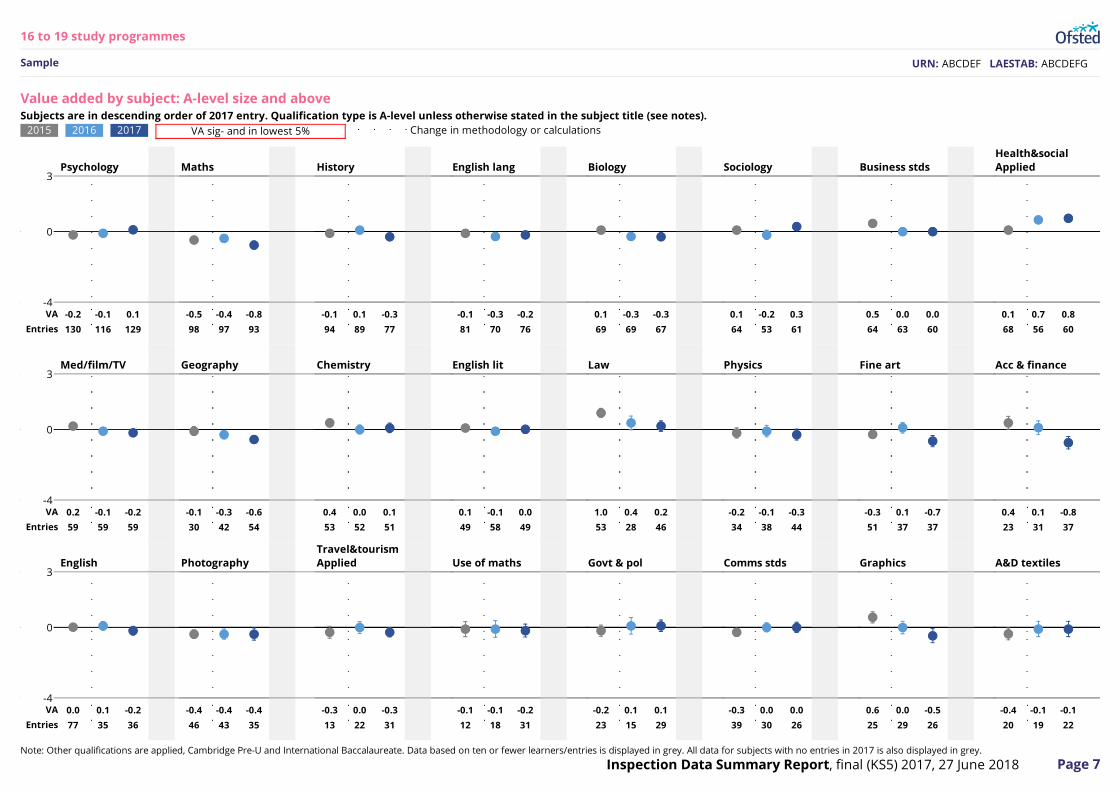
Value added by subject: A-level size and aboveSubjects are in descending order of 2017 entry. Qualification type is A-level unless otherwise stated in the subject title (see notes).
2015 2016 2017 VA sig- and in lowest 5% Change in methodology or calculations
Note: Other qualifications are applied, Cambridge Pre-U and International Baccalaureate. Data based on ten or fewer learners/entries is displayed in grey. All data for subjects with no entries in 2017 is also displayed in grey.
URN: ABCDEF LAESTAB: ABCDEFG
Page 8Inspection Data Summary Report, final (KS5) 2017, 27 June 2018
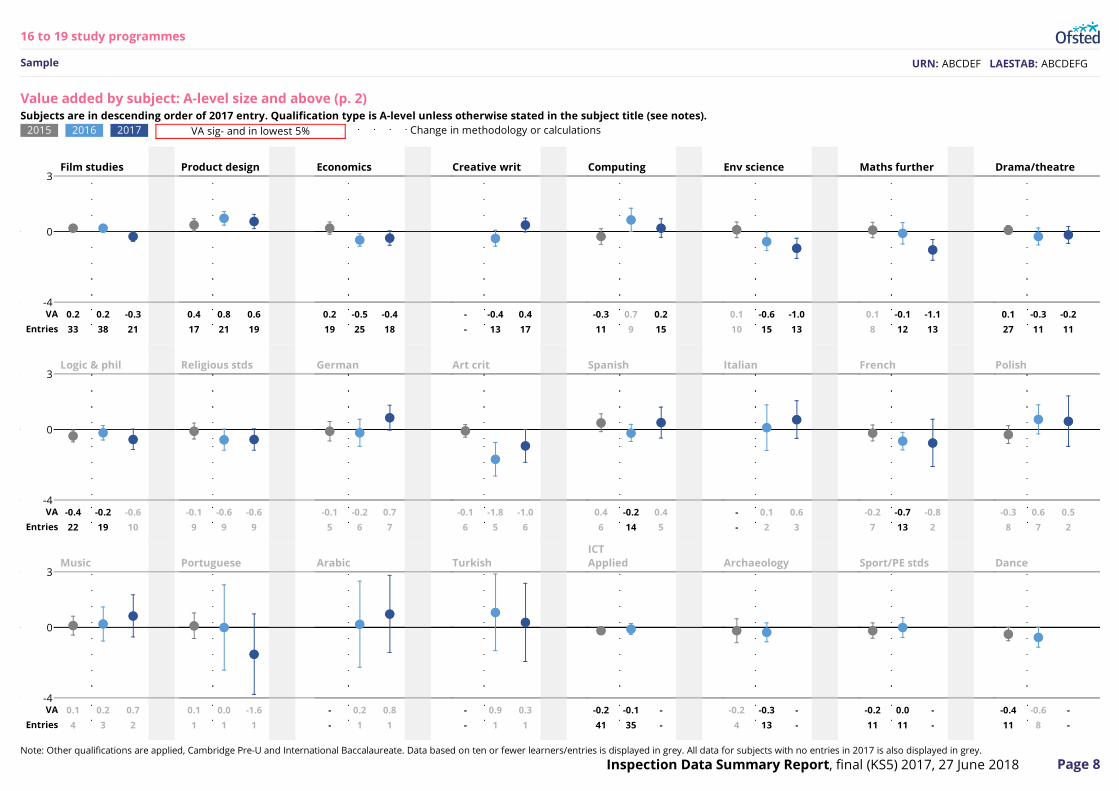
Film studies3
-4
0
VA 0.2 0.2 -0.3
Entries 33 38 21
Product design
0.4 0.8 0.6
17 21 19
Economics
0.2 -0.5 -0.4
19 25 18
Creative writ
- -0.4 0.4
- 13 17
Computing
-0.3 0.7 0.2
11 9 15
Env science
0.1 -0.6 -1.0
10 15 13
Maths further
0.1 -0.1 -1.1
8 12 13
Drama/theatre
0.1 -0.3 -0.2
27 11 11
Logic & phil3
-4
0
VA -0.4 -0.2 -0.6
Entries 22 19 10
Religious stds
-0.1 -0.6 -0.6
9 9 9
German
-0.1 -0.2 0.7
5 6 7
Art crit
-0.1 -1.8 -1.0
6 5 6
Spanish
0.4 -0.2 0.4
6 14 5
Italian
- 0.1 0.6
- 2 3
French
-0.2 -0.7 -0.8
7 13 2
Polish
-0.3 0.6 0.5
8 7 2
Music3
-4
0
VA 0.1 0.2 0.7
Entries 4 3 2
Portuguese
0.1 0.0 -1.6
1 1 1
Arabic
- 0.2 0.8
- 1 1
Turkish
- 0.9 0.3
- 1 1
ICTApplied
-0.2 -0.1 -
41 35 -
Archaeology
-0.2 -0.3 -
4 13 -
Sport/PE stds
-0.2 0.0 -
11 11 -
Dance
-0.4 -0.6 -
11 8 -
16 to 19 study programmesVA
Sample
Value added by subject: A-level size and above (p. 2)Subjects are in descending order of 2017 entry. Qualification type is A-level unless otherwise stated in the subject title (see notes).
2015 2016 2017 VA sig- and in lowest 5% Change in methodology or calculations
Note: Other qualifications are applied, Cambridge Pre-U and International Baccalaureate. Data based on ten or fewer learners/entries is displayed in grey. All data for subjects with no entries in 2017 is also displayed in grey.
URN: ABCDEF LAESTAB: ABCDEFG
Page 9Inspection Data Summary Report, final (KS5) 2017, 27 June 2018
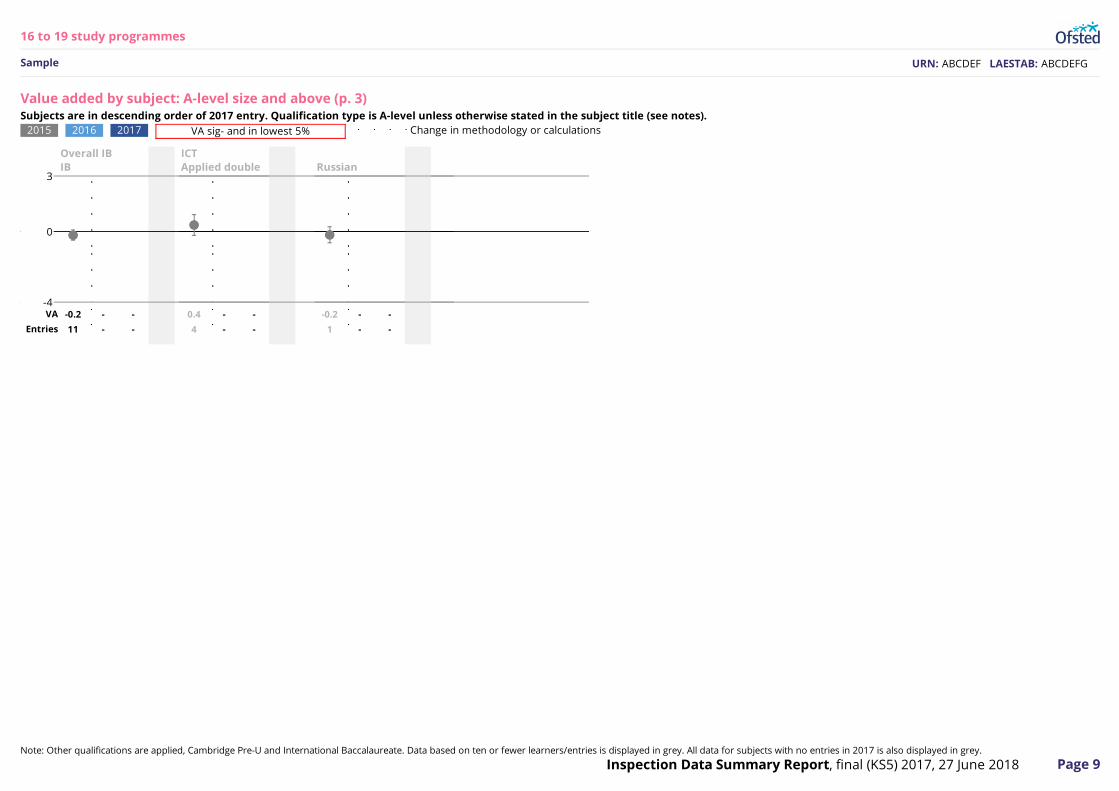
Overall IBIB
3
-4
0
VA -0.2 - -
Entries 11 - -
ICTApplied double
0.4 - -
4 - -
Russian
-0.2 - -
1 - -
16 to 19 study programmesVA
Sample
Value added by subject: A-level size and above (p. 3)Subjects are in descending order of 2017 entry. Qualification type is A-level unless otherwise stated in the subject title (see notes).
2015 2016 2017 VA sig- and in lowest 5% Change in methodology or calculations
Note: Other qualifications are applied, Cambridge Pre-U and International Baccalaureate. Data based on ten or fewer learners/entries is displayed in grey. All data for subjects with no entries in 2017 is also displayed in grey.
URN: ABCDEF LAESTAB: ABCDEFG
Page 10Inspection Data Summary Report, final (KS5) 2017, 27 June 2018
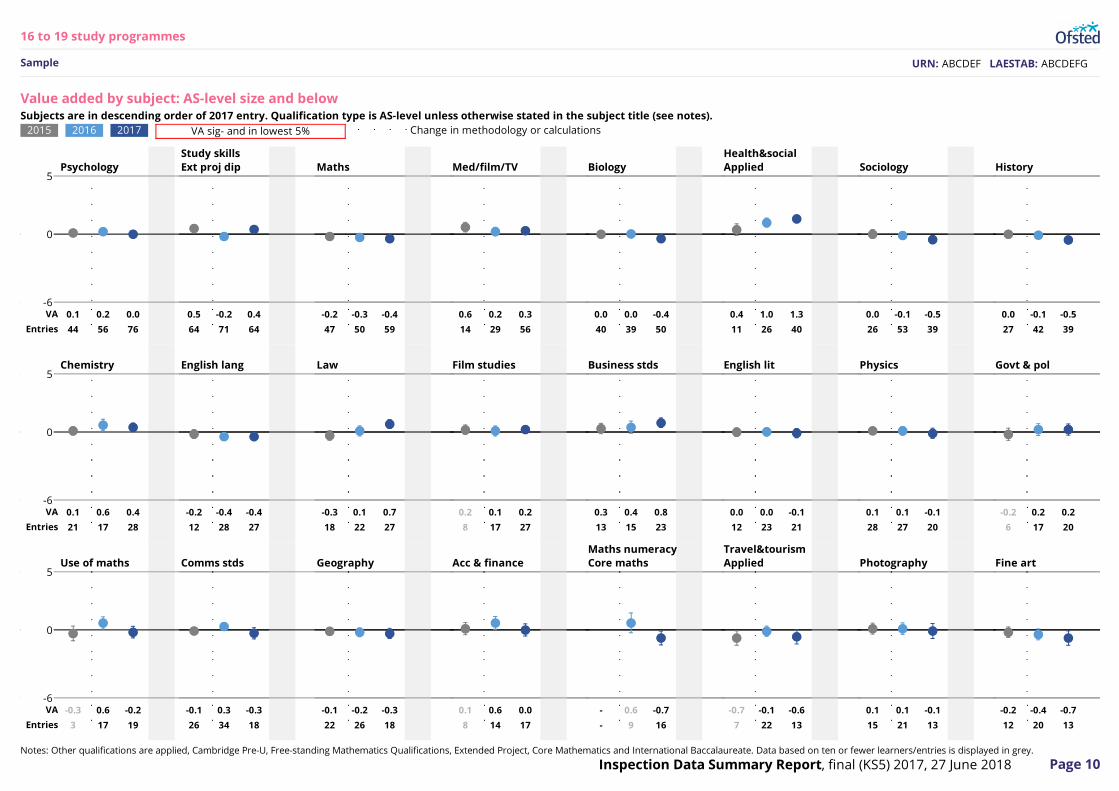
Psychology5
-6
0
VA 0.1 0.2 0.0
Entries 44 56 76
Study skillsExt proj dip
0.5 -0.2 0.4
64 71 64
Maths
-0.2 -0.3 -0.4
47 50 59
Med/film/TV
0.6 0.2 0.3
14 29 56
Biology
0.0 0.0 -0.4
40 39 50
Health&socialApplied
0.4 1.0 1.3
11 26 40
Sociology
0.0 -0.1 -0.5
26 53 39
History
0.0 -0.1 -0.5
27 42 39
Chemistry5
-6
0
VA 0.1 0.6 0.4
Entries 21 17 28
English lang
-0.2 -0.4 -0.4
12 28 27
Law
-0.3 0.1 0.7
18 22 27
Film studies
0.2 0.1 0.2
8 17 27
Business stds
0.3 0.4 0.8
13 15 23
English lit
0.0 0.0 -0.1
12 23 21
Physics
0.1 0.1 -0.1
28 27 20
Govt & pol
-0.2 0.2 0.2
6 17 20
Use of maths5
-6
0
VA -0.3 0.6 -0.2
Entries 3 17 19
Comms stds
-0.1 0.3 -0.3
26 34 18
Geography
-0.1 -0.2 -0.3
22 26 18
Acc & finance
0.1 0.6 0.0
8 14 17
Maths numeracyCore maths
- 0.6 -0.7
- 9 16
Travel&tourismApplied
-0.7 -0.1 -0.6
7 22 13
Photography
0.1 0.1 -0.1
15 21 13
Fine art
-0.2 -0.4 -0.7
12 20 13
16 to 19 study programmesVA
Sample
Value added by subject: AS-level size and belowSubjects are in descending order of 2017 entry. Qualification type is AS-level unless otherwise stated in the subject title (see notes).
2015 2016 2017 VA sig- and in lowest 5% Change in methodology or calculations
Notes: Other qualifications are applied, Cambridge Pre-U, Free-standing Mathematics Qualifications, Extended Project, Core Mathematics and International Baccalaureate. Data based on ten or fewer learners/entries is displayed in grey.
URN: ABCDEF LAESTAB: ABCDEFG
Page 11Inspection Data Summary Report, final (KS5) 2017, 27 June 2018
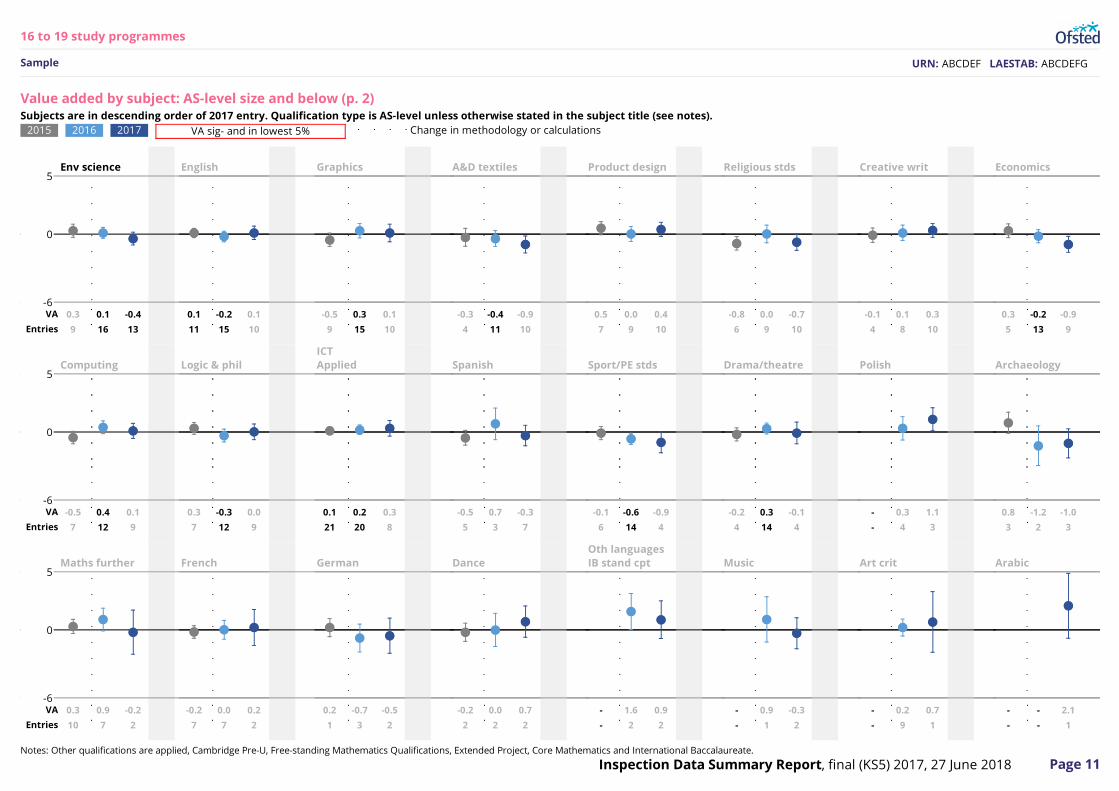
Env science5
-6
0
VA 0.3 0.1 -0.4
Entries 9 16 13
English
0.1 -0.2 0.1
11 15 10
Graphics
-0.5 0.3 0.1
9 15 10
A&D textiles
-0.3 -0.4 -0.9
4 11 10
Product design
0.5 0.0 0.4
7 9 10
Religious stds
-0.8 0.0 -0.7
6 9 10
Creative writ
-0.1 0.1 0.3
4 8 10
Economics
0.3 -0.2 -0.9
5 13 9
Computing5
-6
0
VA -0.5 0.4 0.1
Entries 7 12 9
Logic & phil
0.3 -0.3 0.0
7 12 9
ICTApplied
0.1 0.2 0.3
21 20 8
Spanish
-0.5 0.7 -0.3
5 3 7
Sport/PE stds
-0.1 -0.6 -0.9
6 14 4
Drama/theatre
-0.2 0.3 -0.1
4 14 4
Polish
- 0.3 1.1
- 4 3
Archaeology
0.8 -1.2 -1.0
3 2 3
Maths further5
-6
0
VA 0.3 0.9 -0.2
Entries 10 7 2
French
-0.2 0.0 0.2
7 7 2
German
0.2 -0.7 -0.5
1 3 2
Dance
-0.2 0.0 0.7
2 2 2
Oth languagesIB stand cpt
- 1.6 0.9
- 2 2
Music
- 0.9 -0.3
- 1 2
Art crit
- 0.2 0.7
- 9 1
Arabic
- - 2.1
- - 1
16 to 19 study programmesVA
Sample
Value added by subject: AS-level size and below (p. 2)Subjects are in descending order of 2017 entry. Qualification type is AS-level unless otherwise stated in the subject title (see notes).
2015 2016 2017 VA sig- and in lowest 5% Change in methodology or calculations
Notes: Other qualifications are applied, Cambridge Pre-U, Free-standing Mathematics Qualifications, Extended Project, Core Mathematics and International Baccalaureate.
URN: ABCDEF LAESTAB: ABCDEFG
Page 12Inspection Data Summary Report, final (KS5) 2017, 27 June 2018
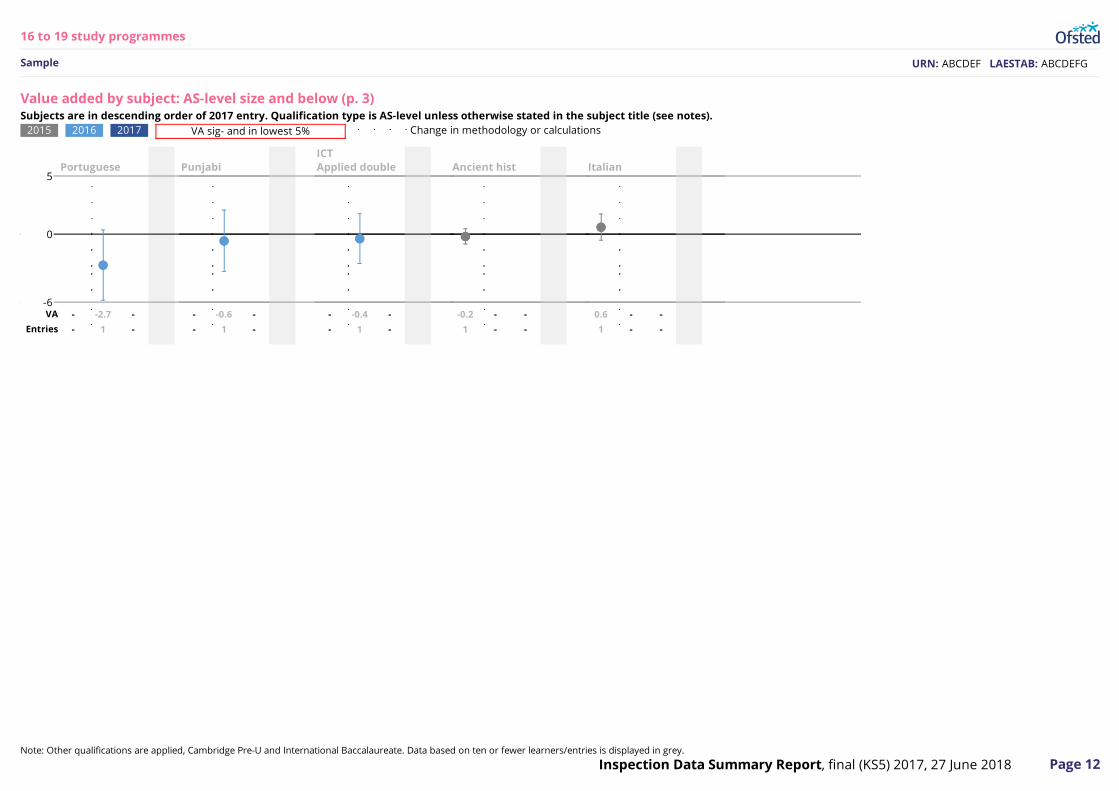
Portuguese5
-6
0
VA - -2.7 -
Entries - 1 -
Punjabi
- -0.6 -
- 1 -
ICTApplied double
- -0.4 -
- 1 -
Ancient hist
-0.2 - -
1 - -
Italian
0.6 - -
1 - -
16 to 19 study programmesVA
Sample
Value added by subject: AS-level size and below (p. 3)Subjects are in descending order of 2017 entry. Qualification type is AS-level unless otherwise stated in the subject title (see notes).
2015 2016 2017 VA sig- and in lowest 5% Change in methodology or calculations
Note: Other qualifications are applied, Cambridge Pre-U and International Baccalaureate. Data based on ten or fewer learners/entries is displayed in grey.
URN: ABCDEF LAESTAB: ABCDEFG
Page 13Inspection Data Summary Report, final (KS5) 2017, 27 June 2018
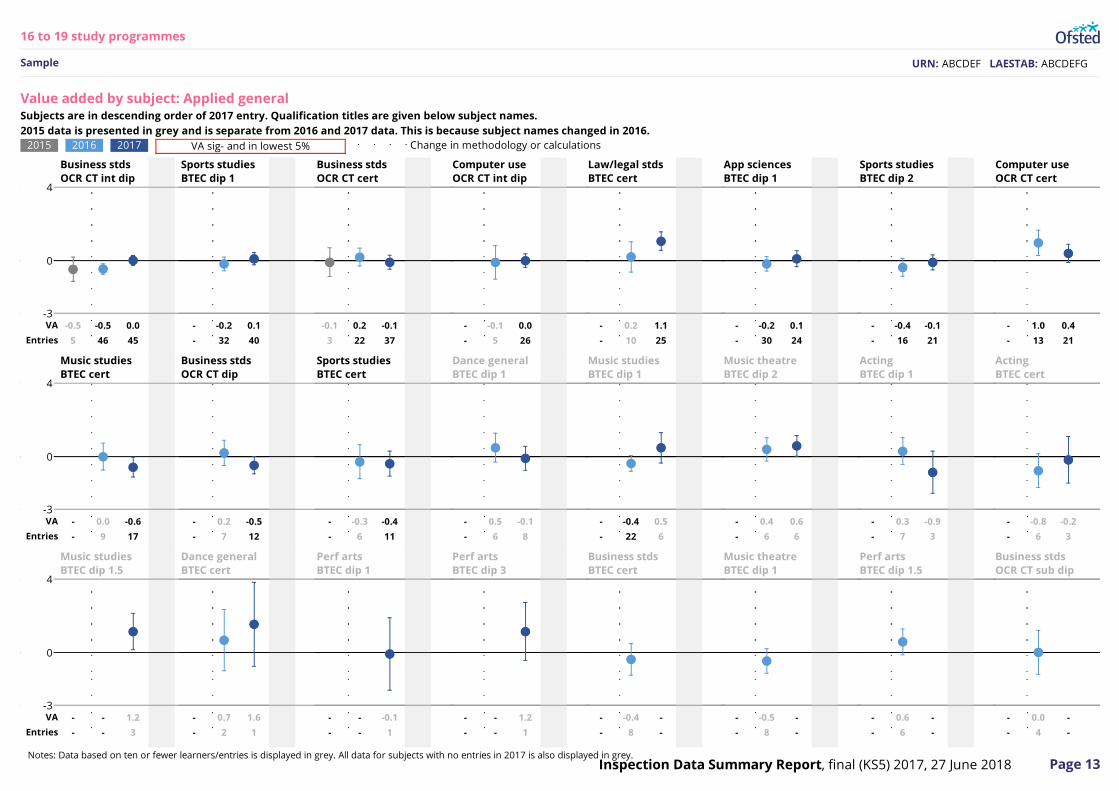
Business stdsOCR CT int dip
4
-3
0
VA -0.5 -0.5 0.0
Entries 5 46 45
Sports studiesBTEC dip 1
- -0.2 0.1
- 32 40
Business stdsOCR CT cert
-0.1 0.2 -0.1
3 22 37
Computer useOCR CT int dip
- -0.1 0.0
- 5 26
Law/legal stdsBTEC cert
- 0.2 1.1
- 10 25
App sciencesBTEC dip 1
- -0.2 0.1
- 30 24
Sports studiesBTEC dip 2
- -0.4 -0.1
- 16 21
Computer useOCR CT cert
- 1.0 0.4
- 13 21
Music studiesBTEC cert
4
-3
0
VA - 0.0 -0.6
Entries - 9 17
Business stdsOCR CT dip
- 0.2 -0.5
- 7 12
Sports studiesBTEC cert
- -0.3 -0.4
- 6 11
Dance generalBTEC dip 1
- 0.5 -0.1
- 6 8
Music studiesBTEC dip 1
- -0.4 0.5
- 22 6
Music theatreBTEC dip 2
- 0.4 0.6
- 6 6
ActingBTEC dip 1
- 0.3 -0.9
- 7 3
ActingBTEC cert
- -0.8 -0.2
- 6 3
Music studiesBTEC dip 1.5
4
-3
0
VA - - 1.2
Entries - - 3
Dance generalBTEC cert
- 0.7 1.6
- 2 1
Perf artsBTEC dip 1
- - -0.1
- - 1
Perf artsBTEC dip 3
- - 1.2
- - 1
Business stdsBTEC cert
- -0.4 -
- 8 -
Music theatreBTEC dip 1
- -0.5 -
- 8 -
Perf artsBTEC dip 1.5
- 0.6 -
- 6 -
Business stdsOCR CT sub dip
- 0.0 -
- 4 -
16 to 19 study programmesVA
Sample
Value added by subject: Applied generalSubjects are in descending order of 2017 entry. Qualification titles are given below subject names.2015 data is presented in grey and is separate from 2016 and 2017 data. This is because subject names changed in 2016.
2015 2016 2017 VA sig- and in lowest 5% Change in methodology or calculations
Notes: Data based on ten or fewer learners/entries is displayed in grey. All data for subjects with no entries in 2017 is also displayed in grey.
URN: ABCDEF LAESTAB: ABCDEFG
Page 14Inspection Data Summary Report, final (KS5) 2017, 27 June 2018
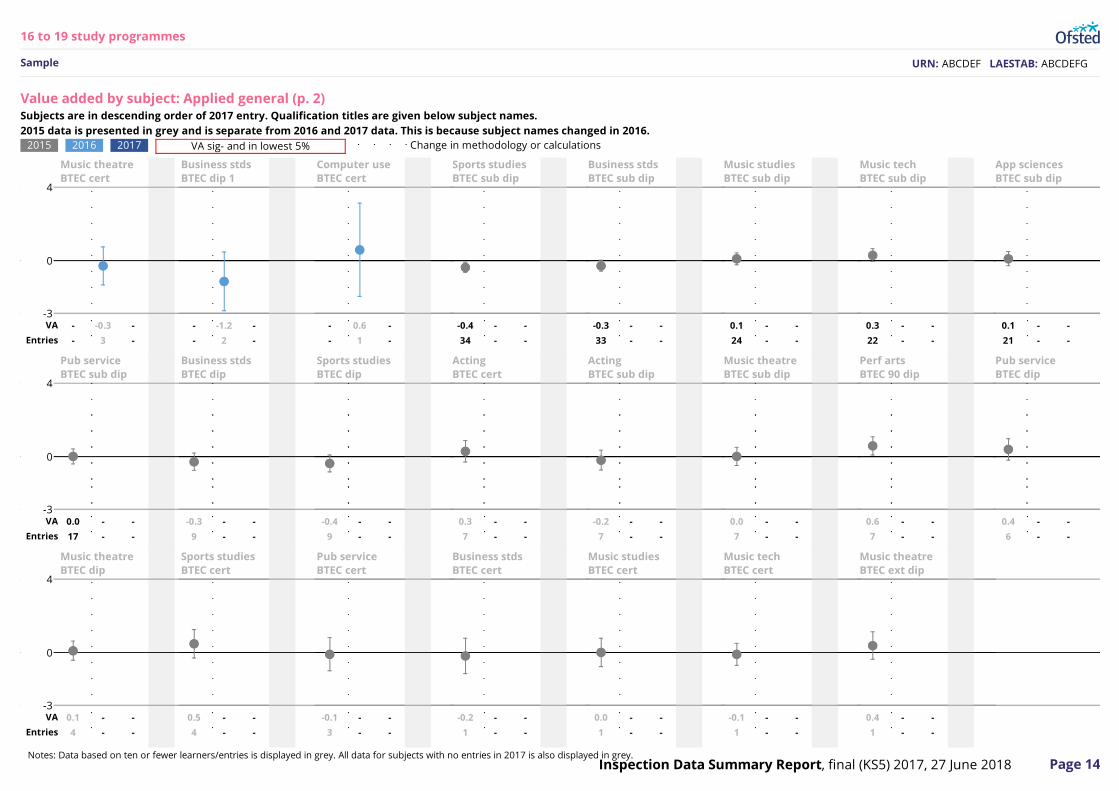
Music theatreBTEC cert
4
-3
0
VA - -0.3 -
Entries - 3 -
Business stdsBTEC dip 1
- -1.2 -
- 2 -
Computer useBTEC cert
- 0.6 -
- 1 -
Sports studiesBTEC sub dip
-0.4 - -
34 - -
Business stdsBTEC sub dip
-0.3 - -
33 - -
Music studiesBTEC sub dip
0.1 - -
24 - -
Music techBTEC sub dip
0.3 - -
22 - -
App sciencesBTEC sub dip
0.1 - -
21 - -
Pub serviceBTEC sub dip
4
-3
0
VA 0.0 - -
Entries 17 - -
Business stdsBTEC dip
-0.3 - -
9 - -
Sports studiesBTEC dip
-0.4 - -
9 - -
ActingBTEC cert
0.3 - -
7 - -
ActingBTEC sub dip
-0.2 - -
7 - -
Music theatreBTEC sub dip
0.0 - -
7 - -
Perf artsBTEC 90 dip
0.6 - -
7 - -
Pub serviceBTEC dip
0.4 - -
6 - -
Music theatreBTEC dip
4
-3
0
VA 0.1 - -
Entries 4 - -
Sports studiesBTEC cert
0.5 - -
4 - -
Pub serviceBTEC cert
-0.1 - -
3 - -
Business stdsBTEC cert
-0.2 - -
1 - -
Music studiesBTEC cert
0.0 - -
1 - -
Music techBTEC cert
-0.1 - -
1 - -
Music theatreBTEC ext dip
0.4 - -
1 - -
16 to 19 study programmesVA
Sample
Value added by subject: Applied general (p. 2)Subjects are in descending order of 2017 entry. Qualification titles are given below subject names.2015 data is presented in grey and is separate from 2016 and 2017 data. This is because subject names changed in 2016.
2015 2016 2017 VA sig- and in lowest 5% Change in methodology or calculations
Notes: Data based on ten or fewer learners/entries is displayed in grey. All data for subjects with no entries in 2017 is also displayed in grey.
URN: ABCDEF LAESTAB: ABCDEFG
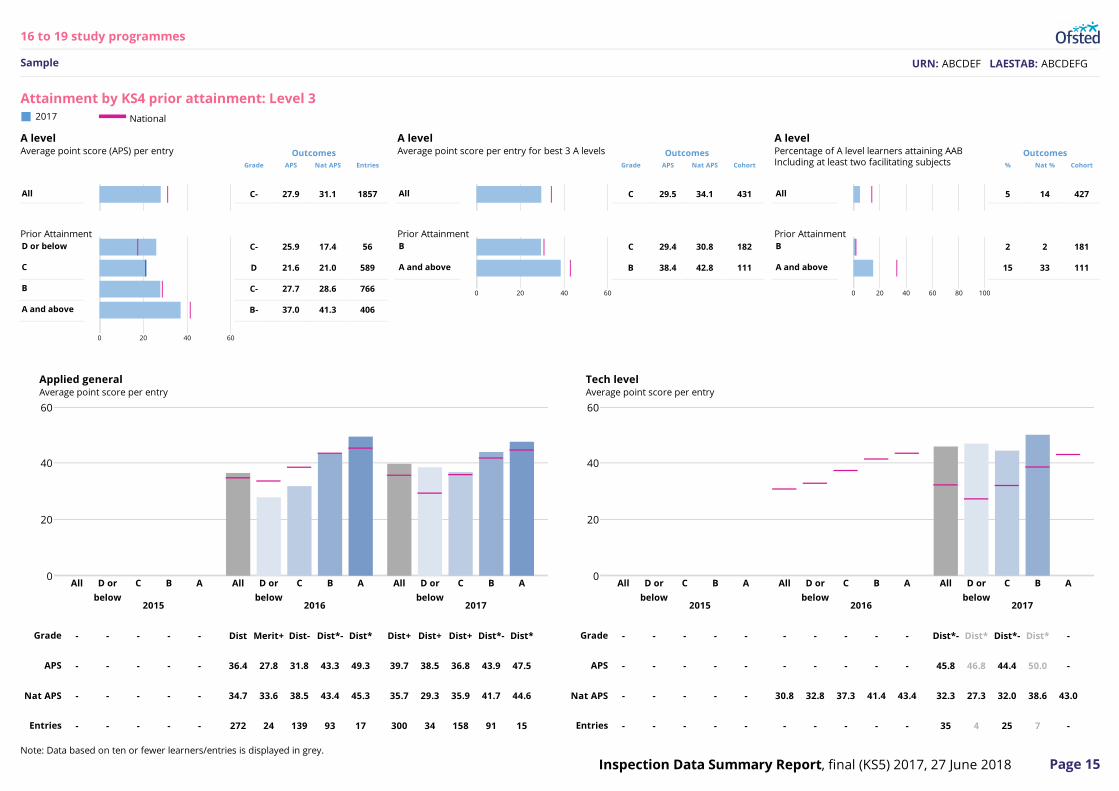
All
Grade
C-
APS
27.9
Nat APS
31.1
Entries
1857
6020 4000
D or below
C
B
A and above
C-
D
C-
B-
25.9
21.6
27.7
37.0
17.4
21.0
28.6
41.3
56
589
766
406
All
Grade
C
APS
29.5
Nat APS
34.1
Cohort
431
6020 4000
B
A and above
C
B
29.4
38.4
30.8
42.8
182
111
All
%
5
Nat %
14
Cohort
427
10020 40 60 8000
B
A and above
2
15
2
33
181
111
Page 15Inspection Data Summary Report, final (KS5) 2017, 27 June 2018
60
20
40
00
201520152015 2015 201620162016 2016 201720172017 2017
Grade - - - - - Dist Merit+ Dist- Dist*- Dist* Dist+ Dist+ Dist+ Dist*- Dist*
APS - - - - - 36.4 27.8 31.8 43.3 49.3 39.7 38.5 36.8 43.9 47.5
Nat APS - - - - - 34.7 33.6 38.5 43.4 45.3 35.7 29.3 35.9 41.7 44.6
Entries - - - - - 272 24 139 93 17 300 34 158 91 15
All D or
below
C B A All D or
below
C B A All D or
below
C B A
60
20
40
00
201520152015 2015 201620162016 2016 201720172017 2017
Grade - - - - - - - - - - Dist*- Dist* Dist*- Dist* -
APS - - - - - - - - - - 45.8 46.8 44.4 50.0 -
Nat APS - - - - - 30.8 32.8 37.3 41.4 43.4 32.3 27.3 32.0 38.6 43.0
Entries - - - - - - - - - - 35 4 25 7 -
All D or
below
C B A All D or
below
C B A All D or
below
C B A
16 to 19 study programmesLevel
Sample
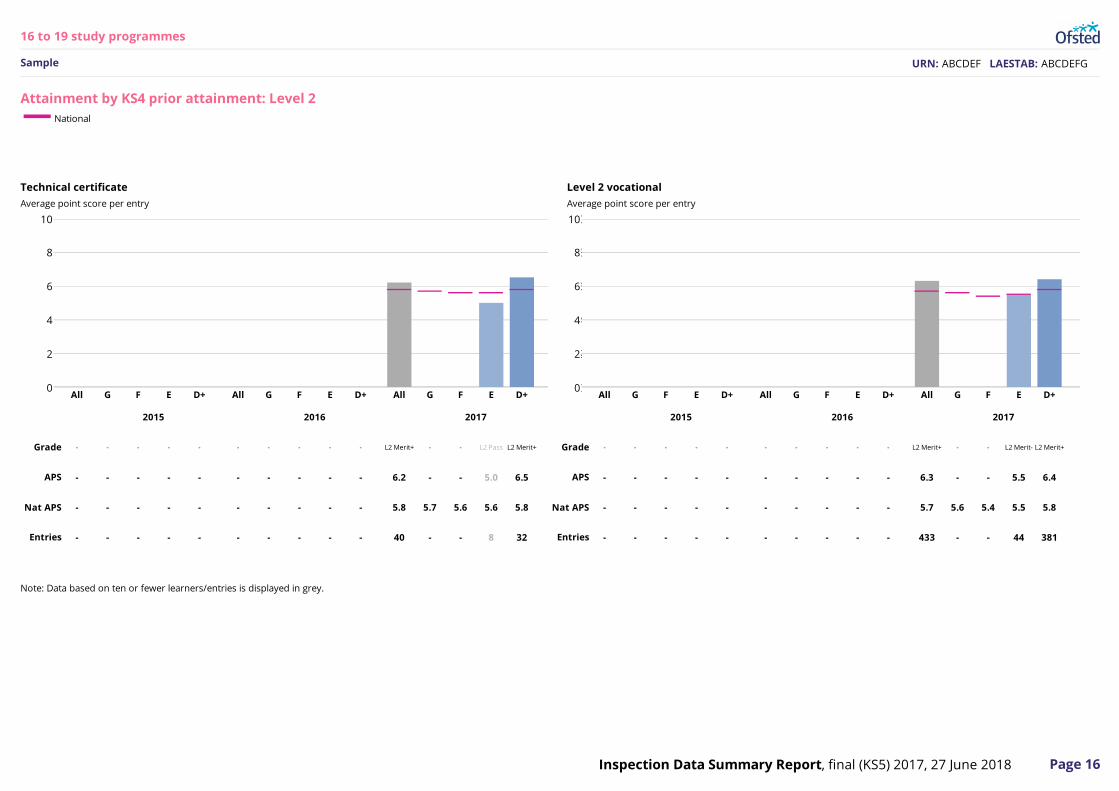
Attainment by KS4 prior attainment: Level 32017 National
A levelAverage point score (APS) per entry Outcomes Outcomes Outcomes
Prior Attainment
A levelAverage point score per entry for best 3 A levels
Prior Attainment
A levelPercentage of A level learners attaining AABIncluding at least two facilitating subjects
Prior Attainment
Applied generalAverage point score per entry
Tech levelAverage point score per entry
Note: Data based on ten or fewer learners/entries is displayed in grey.
URN: ABCDEF LAESTAB: ABCDEFG
Page 16Inspection Data Summary Report, final (KS5) 2017, 27 June 2018
10 10
2 2
4 4
6 6
8 8
0 00 0
201520152015 2015 201620162016 2016 201720172017 2017
Grade - - - - - - - - - - L2 Merit+ - - L2 Pass L2 Merit+
APS - - - - - - - - - - 6.2 - - 5.0 6.5
Nat APS - - - - - - - - - - 5.8 5.7 5.6 5.6 5.8
Entries - - - - - - - - - - 40 - - 8 32
All G F E D+ All G F E D+ All G F E D+
10
2
4
6
8
00
201520152015 2015 201620162016 2016 201720172017 2017
Grade - - - - - - - - - - L2 Merit+ - - L2 Merit- L2 Merit+
APS - - - - - - - - - - 6.3 - - 5.5 6.4
Nat APS - - - - - - - - - - 5.7 5.6 5.4 5.5 5.8
Entries - - - - - - - - - - 433 - - 44 381
All G F E D+ All G F E D+ All G F E D+
16 to 19 study programmesLevel
Sample
Attainment by KS4 prior attainment: Level 2National
Technical certificate
Average point score per entry
Level 2 vocational
Average point score per entry
Note: Data based on ten or fewer learners/entries is displayed in grey.
URN: ABCDEF LAESTAB: ABCDEFG
Page 17Inspection Data Summary Report, final (KS5) 2017, 27 June 2018
A-Level (including AS)
100
20
40
60
80
0020152015 20162016 20172017
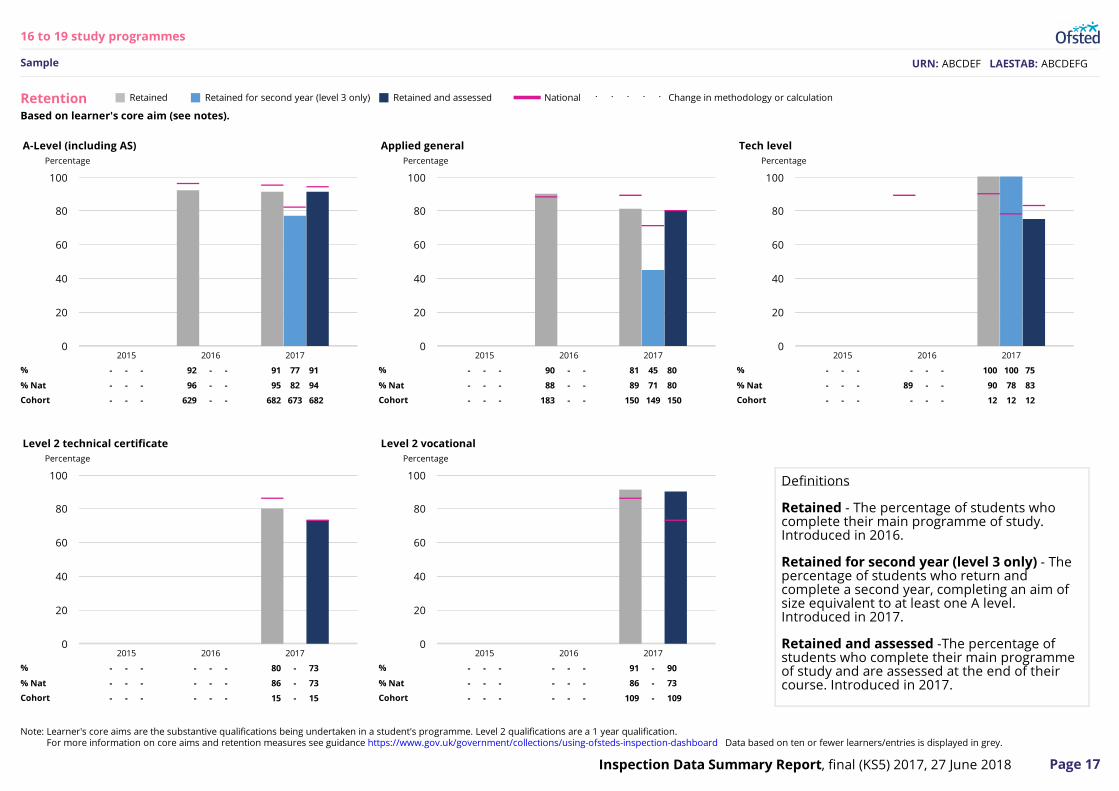
% - - - 92 - - 91 77 91
% Nat - - - 96 - - 95 82 94
Cohort - - - 629 - - 682 673 682
Applied general
100
20
40
60
80
0020152015 20162016 20172017
% - - - 90 - - 81 45 80
% Nat - - - 88 - - 89 71 80
Cohort - - - 183 - - 150 149 150
Tech level
100
20
40
60
80
0020152015 20162016 20172017
% - - - - - - 100 100 75
% Nat - - - 89 - - 90 78 83
Cohort - - - - - - 12 12 12
Level 2 technical certificate
100
20
40
60
80
0020152015 20162016 20172017
% - - - - - - 80 - 73
% Nat - - - - - - 86 - 73
Cohort - - - - - - 15 - 15
Level 2 vocational
100
20
40
60
80
0020152015 20162016 20172017
% - - - - - - 91 - 90
% Nat - - - - - - 86 - 73
Cohort - - - - - - 109 - 109
Percentage Percentage Percentage
Percentage Percentage
16 to 19 study programmesRetention
Sample
Retention Retained Retained for second year (level 3 only) Retained and assessed National Change in methodology or calculation
Based on learner's core aim (see notes).
Definitions
Retained - The percentage of students whocomplete their main programme of study.Introduced in 2016.
Retained for second year (level 3 only) - Thepercentage of students who return andcomplete a second year, completing an aim ofsize equivalent to at least one A level.Introduced in 2017.
Retained and assessed -The percentage ofstudents who complete their main programmeof study and are assessed at the end of theircourse. Introduced in 2017.
Note: Learner's core aims are the substantive qualifications being undertaken in a student's programme. Level 2 qualifications are a 1 year qualification.For more information on core aims and retention measures see guidance https://www.gov.uk/government/collections/using-ofsteds-inspection-dashboard Data based on ten or fewer learners/entries is displayed in grey.
URN: ABCDEF LAESTAB: ABCDEFG
Page 18Inspection Data Summary Report, final (KS5) 2017, 27 June 2018
A-Level (including AS)
100
20
40
60
80
00MaleMale FemaleFemale DisadvantagedDisadvantaged
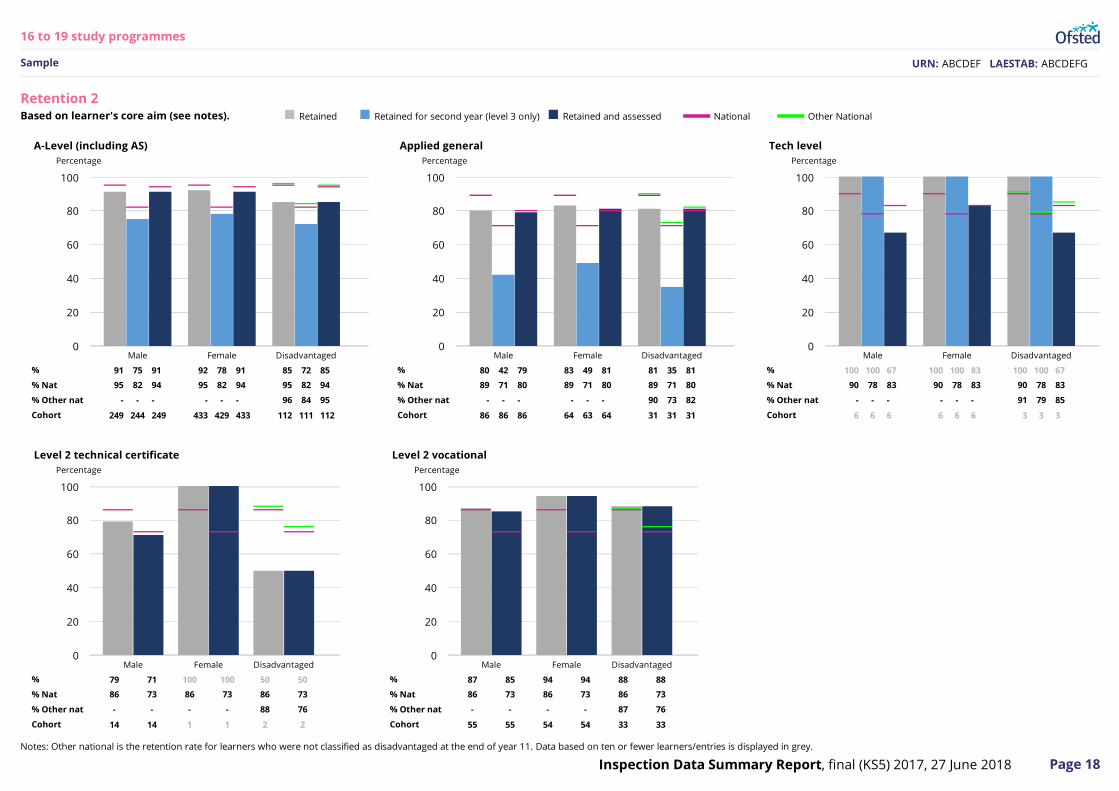
% 91 75 91 92 78 91 85 72 85
% Nat 95 82 94 95 82 94 95 82 94
% Other nat - - - - - - 96 84 95
Cohort 249 244 249 433 429 433 112 111 112
Applied general
100
20
40
60
80
00MaleMale FemaleFemale DisadvantagedDisadvantaged
% 80 42 79 83 49 81 81 35 81
% Nat 89 71 80 89 71 80 89 71 80
% Other nat - - - - - - 90 73 82
Cohort 86 86 86 64 63 64 31 31 31
Tech level
100
20
40
60
80
00MaleMale FemaleFemale DisadvantagedDisadvantaged
% 100 100 67 100 100 83 100 100 67
% Nat 90 78 83 90 78 83 90 78 83
% Other nat - - - - - - 91 79 85
Cohort 6 6 6 6 6 6 3 3 3
Level 2 technical certificate
100
20
40
60
80
00Male Female Disadvantaged
% 79 71 100 100 50 50
% Nat 86 73 86 73 86 73
% Other nat - - - - 88 76
Cohort 14 14 1 1 2 2
Level 2 vocational
100
20
40
60
80
00Male Female Disadvantaged
% 87 85 94 94 88 88
% Nat 86 73 86 73 86 73
% Other nat - - - - 87 76
Cohort 55 55 54 54 33 33
Percentage Percentage Percentage
Percentage Percentage
16 to 19 study programmesRetention
Sample
Retention 2Retained Retained for second year (level 3 only) Retained and assessed National Other NationalBased on learner's core aim (see notes).
Notes: Other national is the retention rate for learners who were not classified as disadvantaged at the end of year 11. Data based on ten or fewer learners/entries is displayed in grey.
URN: ABCDEF LAESTAB: ABCDEFG
Page 19Inspection Data Summary Report, final (KS5) 2017, 27 June 2018
Learners inscope
Improvedgrade
% thatimproved
grade
% thatimproved
gradenationally
Gainedgrade C
and above¹
% thatgained
grade Cand above
% thatgained
grade Cand abovenationally
Averageprogress
score
Averageprogress
scorenationally
Numbernot
entered
% notentered
% notentered
nationally
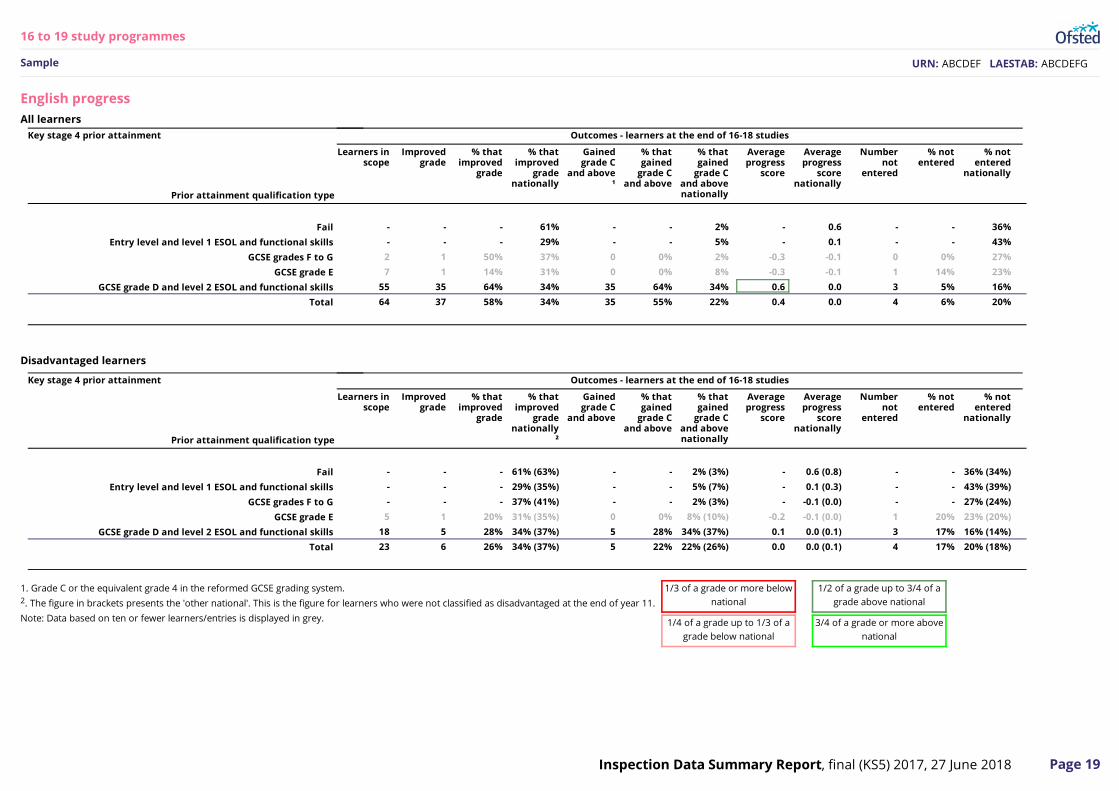
Fail - - - 61% - - 2% - 0.6 - - 36%
Entry level and level 1 ESOL and functional skills - - - 29% - - 5% - 0.1 - - 43%
GCSE grades F to G 2 1 50% 37% 0 0% 2% -0.3 -0.1 0 0% 27%
GCSE grade E 7 1 14% 31% 0 0% 8% -0.3 -0.1 1 14% 23%
GCSE grade D and level 2 ESOL and functional skills 55 35 64% 34% 35 64% 34% 0.6 0.0 3 5% 16%
Total 64 37 58% 34% 35 55% 22% 0.4 0.0 4 6% 20%
Learners inscope
Improvedgrade
% thatimproved
grade
% thatimproved
gradenationally
²
Gainedgrade C
and above
% thatgained
grade Cand above
% thatgained
grade Cand abovenationally
Averageprogress
score
Averageprogress
scorenationally
Numbernot
entered
% notentered
% notentered
nationally
Fail - - - 61% (63%) - - 2% (3%) - 0.6 (0.8) - - 36% (34%)
Entry level and level 1 ESOL and functional skills - - - 29% (35%) - - 5% (7%) - 0.1 (0.3) - - 43% (39%)
GCSE grades F to G - - - 37% (41%) - - 2% (3%) - -0.1 (0.0) - - 27% (24%)
GCSE grade E 5 1 20% 31% (35%) 0 0% 8% (10%) -0.2 -0.1 (0.0) 1 20% 23% (20%)
GCSE grade D and level 2 ESOL and functional skills 18 5 28% 34% (37%) 5 28% 34% (37%) 0.1 0.0 (0.1) 3 17% 16% (14%)
Total 23 6 26% 34% (37%) 5 22% 22% (26%) 0.0 0.0 (0.1) 4 17% 20% (18%)
16 to 19 study programmesEnglish
Sample
English progressAll learners
Key stage 4 prior attainment Outcomes - learners at the end of 16-18 studies
Prior attainment qualification type
Prior attainment qualification type
Disadvantaged learners
Key stage 4 prior attainment Outcomes - learners at the end of 16-18 studies
1/3 of a grade or more belownational
1/2 of a grade up to 3/4 of agrade above national
1/4 of a grade up to 1/3 of agrade below national
3/4 of a grade or more abovenational
1. Grade C or the equivalent grade 4 in the reformed GCSE grading system.2. The figure in brackets presents the 'other national'. This is the figure for learners who were not classified as disadvantaged at the end of year 11.
Note: Data based on ten or fewer learners/entries is displayed in grey.
URN: ABCDEF LAESTAB: ABCDEFG
Page 20Inspection Data Summary Report, final (KS5) 2017, 27 June 2018
Learners inscope
Improvedgrade
% thatimproved
grade
% thatimproved
gradenationally
Gainedgrade C
and above²
% thatgained
grade Cand above
% thatgained
grade Cand abovenationally
Averageprogress
score
Averageprogress
scorenationally
Numbernot
entered
% notentered
% notentered
nationally
Fail 1 1 100% 69% 0 0% 0% 1.7 0.4 0 0% 24%
Entry level and level 1 functional skills and use of maths and FSM ¹ 1 0 0% 21% 0 0% 3% 0.0 -0.1 0 0% 41%
GCSE grades F to G 13 11 85% 38% 0 0% 1% 0.7 -0.1 1 8% 23%
GCSE grade E 18 8 44% 24% 6 33% 5% 0.6 -0.2 2 11% 21%
GCSE grade D and level 2 functional skills and use of maths and FSM ¹ 91 62 68% 36% 62 68% 36% 0.5 0.1 2 2% 13%
Total 124 82 66% 36% 68 55% 17% 0.6 0.0 5 4% 19%
Learners inscope
Improvedgrade
% thatimproved
grade
% thatimproved
gradenationally
³
Gainedgrade C
and above
% thatgained
grade Cand above
% thatgained
grade Cand abovenationally
Averageprogress
score
Averageprogress
scorenationally
Numbernot
entered
% notentered
% notentered
nationally
Fail - - - 69% (70%) - - 0% (0%) - 0.4 (0.4) - - 24% (23%)
Entry level and level 1 functional skills and use of maths and FSM - - - 21% (26%) - - 3% (5%) - -0.1 (0.1) - - 41% (37%)
GCSE grades F to G 6 4 67% 38% (42%) 0 0% 1% (1%) 0.5 -0.1 (0.0) 1 17% 23% (20%)
GCSE grade E 6 1 17% 24% (26%) 1 17% 5% (6%) -0.1 -0.2 (-0.2) 2 33% 21% (20%)
GCSE grade D and level 2 functional skills and use of maths and FSM 31 18 58% 36% (40%) 18 58% 36% (40%) 0.4 0.1 (0.1) 2 6% 13% (11%)
Total 43 23 53% 36% (39%) 19 44% 17% (21%) 0.3 0.0 (0.1) 5 12% 19% (16%)
16 to 19 study programmesMaths
Sample
Mathematics progressAll learners
Key stage 4 prior attainment Outcomes - learners at the end of 16-18 studies
Prior attainment qualification type
Prior attainment qualification type
Disadvantaged learners
Key stage 4 prior attainment Outcomes - learners at the end of 16-18 studies
1/3 of a grade or more belownational
1/2 of a grade up to 3/4 of agrade above national
1/4 of a grade up to 1/3 of agrade below national
3/4 of a grade or more abovenational
1. Includes AQA use of maths and free standing maths (FSM).
2. Grade C or the equivalent grade 4 in the reformed GCSE grading system.
3. The figure in brackets presents the 'other national'. This is the figure for learners who were not classified as disadvantaged at the end of year 11.
Note: Data based on ten or fewer learners/entries is displayed in grey.

URN: ABCDEF LAESTAB: ABCDEFG
Page 21Inspection Data Summary Report, final (KS5) 2017, 27 June 2018
Destinations
End of KS5Number of
learners
Education oremployment /
trainingdestination Apprenticeship
Any educationdestination
UK highereducation
Destination notsustained
Activity notcaptured in data
2015 664 92% 11% 61% 42% 6% 2%
2014 647 90% 9% 59% 35% 8% 1%
2013 650 66% 6% 56% 39% 11% 22%
2015 88 94% 10% 72% 40% x x
2014 83 86% 4% 51% 27% 14% 0%
2013 50 74% x 65% 39% 15% x
2015 391 93% 10% 64% 48% 6% 2%
2014 397 91% 8% 60% 37% x x
2013 380 66% 5% 57% 40% 9% 23%
2015 273 90% 12% 56% 34% 7% 3%
2014 250 89% 10% 57% 32% x x
2013 270 66% 8% 56% 38% 13% 19%
2015 366145 89% 7% 66% 51% 8% 3%
2014 362930 88% 7% 65% 48% 9% 3%
2013 358970 73% 5% 65% 48% 10% 15%
16 to 19 study programmesDestinations
Sample
Destinations are shown for learners who finished their study programme, having entered at least one level 3 qualification.
of which:
All learners
Disadvantaged
Female
Male
National
x denotes that data has been suppressed.