Embed Size (px)
Citation preview

IMPROVING ROAD SAFETYTamil Nadu Road Sector Project
2011 ISSUE 5THE WORLD BANK IN INDIAMINISTRY OF FINANCEDEpARTMENT OF ECONOMIC AFFAIRS
INNOVATIONS IN DEVELOPMENT
5

THE WORLD BANK IN INDIA2 MINISTRY OF FINANCEDEpARTMENT OF ECONOMIC AFFAIRS
Overview

3
TAMIl NADU ROAD
SEcTOR PROjEcT
THE WORLD BANK IN INDIA MINISTRY OF FINANCEDEpARTMENT OF ECONOMIC AFFAIRS
Towards complete road safety management
India’s highways are increasingly becoming killing fields. The country has one of the highest rates of road accidents in the world with about 500,000 accidents a year. Some 130,000 people lose their lives each year, and another 500,000 or so are injured. In fact, more lives are lost in road accidents in India than in epidemics, natural calamities or wars put together. Within India, Tamil Nadu has recorded one of the fastest increases in the number of vehicles on the roads and the maximum number of fatalities in the country. About 150 accidents take place per day on average, claiming around two lives every hour.
In April 2007, Tamil Nadu became the first state in the country to announce a Road Safety Policy. This was followed, in 2009, by a Road Safety Action Plan. As part of the Action Plan, an easy-to-use bilingual software package - known as the Road Accident Data Management System (RADMS) - was developed, with the help of an international consultant, under the World Bank-supported Tamil Nadu Road Sector Project. The GIS-based RADMS software geographically maps all road accidents that take place on Tamil Nadu’s national and state highways, as well as on urban and district roads. The system identifies the most accident-prone spots and displays crash trends and other information at the click of a mouse. The RADMS software, developed
after detailed consultations between the police, transport and highways departments, has been helping the authorities analyze the ‘how’, ‘where’ and ‘why’ of road accidents, and enabling them to plan and implement remedial measures. In the two years since the system has been operational, nearly 3000 accident-prone spots have been identified. The implementation of road safety measures based on this analytical data has brought down the number of accident fatalities in Tamil Nadu from 13.39 for every 10,000 vehicles in 2006 to 10.09 in 2010, exceeding the targets set by the state.
The RADMS software, developed at a cost of Rs. 2.20 crores (about $500,000), has been deployed at all the state’s 1,400 police stations and personnel at each station have been trained in its use. While similar software was first used in Kerala, Tamil Nadu is the first state to deploy it extensively. The software is constantly being improved. It is planned to provide each police station with a hand-held GPS device to enable personnel to enter the details at the accident site itself. It is also planned to link the system with medical facilities across the state for quick attention to accident victims. The creation of a national road accident database along these lines can help to markedly improve road safety across the country.

THE WORLD BANK IN INDIA4 MINISTRY OF FINANCEDEpARTMENT OF ECONOMIC AFFAIRS
In the past five years, the number of registered vehicles on Tamil Nadu’s roads has gone up by almost 40 percent - from 82 lakh in 2007 to 1.3
crore in 2010, or 8.2 million to 13 million. With more vehicles on the streets and little demarcation of lanes for those travelling at different speeds, road accidents in the state were rising. This was compounded by poor road conditions, little driver education, and poor enforcement of traffic rules.
To improve road safety, data was needed on the most frequent causes of accidents and the most accident-prone locations. The paper-based First Information Report process was not effective as it lacked important information, was cumbersome, and generated a heavy backlog of work at police
stations. Moreover, actions between the key departments involved in road traffic management – police, highways, transport – were not coordinated, resulting in piece-meal efforts to improve road safety.
The first step to improve road safety was the development of a comprehensive data base on which appropriate road safety measures could be based. Accordingly, as part of its Road Safety Action Plan, the state engaged an international road safety consultant to develop a comprehensive bilingual software package to collect, analyze and generate crucial reports on road accidents on a day to day basis. Major stake holders such as the police, transport and highways departments were involved in the software’s development.
Challenges

5
TAMIl NADU ROAD
SEcTOR PROjEcT
THE WORLD BANK IN INDIA MINISTRY OF FINANCEDEpARTMENT OF ECONOMIC AFFAIRS
In 2009, an easy-to-use software known as the Road Accident Data Management System (RADMS) was developed.
The software is easy to deploy and easy to use. Its uniform, intuitive screens make it one of the simplest systems to master. After visiting the accident site, the police person on duty logs onto the system’s website at the police station and enters the details of the accident into a simple online Accident Record Form (ARF). The details of each accident include the registration numbers of the vehicles involved, the number of people involved in the accident, the number of fatalities, the severity of injuries, the exact location and condition of the road, whether helmets and/or seat belts were being used or not, the levels of intoxication, if at all, of the driver, the type of accident – whether head-on or from the rear, etc. The system has made the cumbersome paper-based First Information Report reporting process a thing of the past.
Within seconds of the first entry, automated emails are sent to the transport and highways departments. At least one official from each department then has to visit the accident spot to gather and record the relevant information onto the online form. For instance, the transport department will fill in the
driver’s education, license type, age and condition of the vehicle, insurance details etc. while the highways department will enter the width, category, and surface condition of the road. This has to be done within 24 hours for fatal accidents and three days for non-fatal ones, or else the system will automatically generate emails to the superior officers in each department. Of the 150 fields in the ARF, 110 are to be entered by the police, 24 by the transport department, and 16 by the highways department. Of these, only 29 fields are mandatory, of which 26 are to be entered by the police, and 3 by the transport department.
Since coordination between the different departments involved in road safety is critical for the implementation of successful remedial measures, systems have been put in place to ensure this. The State Traffic Planning Cell (STPC) is the central nodal agency for RADMS, and the Additional Director General of Police (ADGP) has been vested with the primary responsibility for managing the system and submitting reviews to the government. The highways department’s role is to analyse accident-prone spots and suggest remedial measures, while the transport department reviews the remedial measures suggested and sanctions budgets under the Road Safety Fund to implement them.
Innovation

THE WORLD BANK IN INDIA6 MINISTRY OF FINANCEDEpARTMENT OF ECONOMIC AFFAIRS
Accident analysis
RADMS is supported by a powerful analysis engine that enables the authorities to identify high-density accident locations and generate automatic vehicle collision diagrams. This is designed to assist road safety engineers in improving the safety of roads and intersections.
Kilometer Analysis analyses accidents along a selected stretch of road.
Grid Analysis looks at the frequency of accidents in a specified area and identifies accident hotspots.
cluster Analysis provides an analysis of the density and severity of accidents in selected areas.
Monitor Sites Analysis provides a visual comparison of the severity of accidents on selected sites. It also generates reports and graphs showing the effect of remediation measures.
collision Diagram Analysis analyses the general pattern of accidents in select locations, usually junctions.
corridor Analysis locates high-crash concentrations within a corridor. It allows routes to be linked together so that an analyst can assess the overall safety of a transportation corridor.
link Node Analysis analyses accidents occurring between any two nodes in the road network and is used when no maps are available to enter accident details.
Safety Benefit Evaluations study the effectiveness of remedial measures to reduce accidents.
Stick Analysis gives a pictorial representation of accidents along a number of parameters.
Innovation

7
TAMIl NADU ROAD
SEcTOR PROjEcT
THE WORLD BANK IN INDIA MINISTRY OF FINANCEDEpARTMENT OF ECONOMIC AFFAIRS
Home Page: Registered users can search and view accidents on the map, analyze these accidents, view monthly accident trends, the latest updates etc.
cluster Analysis facilitates analysis of the density and severity of accidents around an accident-prone spot or a bridge structure. The output is a map depicting high-crash locations.

THE WORLD BANK IN INDIA8 MINISTRY OF FINANCEDEpARTMENT OF ECONOMIC AFFAIRS
Monitor Sites Analysis is used to analyse the accident density in a defined region. This analysis helps the accident investigator to ‘monitor’ and compare an area of high-crash density before and after implementing interventions.
corridor Analysis enables planners to locate high-accident concentrations within a given traffic corridor to facilitate in effective traffic planning.
Innovation

9
TAMIl NADU ROAD
SEcTOR PROjEcT
THE WORLD BANK IN INDIA MINISTRY OF FINANCEDEpARTMENT OF ECONOMIC AFFAIRS
Reports
RADMS produces over 60 standard reports and allows users to create their own reports using any of the fields entered in the Accident Report Form. Accordingly, road traffic accident reports can be generated district-wise on an hourly, daily, monthly and yearly basis, identifying the times and days of the week when most accidents take place, the most
frequent types of crashes at these sites, the kind of vehicles most frequently involved, the most common causes of the accidents such as road and weather conditions, alcohol use, etc. The broad range of analytical data generated enables the authorities to plan and implement appropriate remedial measures.
225
200
175
150
135
100
75
50
25
0
Num
ber o
f Acc
iden
ts
00:0
0 - 02
:00
02:0
0 - 04
:00
04:0
0 -06
:00
06:0
0 - 08
:00
08:0
0 - 10
:00
10:0
0 - 12
:00
12:0
0 - 14
:00
14:0
0 - 16
:00
16:0
0 - 18
:00
18:0
0 - 20
:00
20:0
0 -22
:00
22:0
0 - 23
:59
District Chennai cityNumber of accidents vs time of accident and accident severity
District Chennai cityNumber of accidents vs accident cause
Injured in accidents due to road conditionsInjured in accidents due to heavy traffic
Inattentive turn
High Speed
Injured in accidents due to human errorChanging lane without due careInjured in accidents due to weatherInjured in accidents due to vehicle defectAlchohol abuseNonrespect of rights of way rulesDriving against flow of trafficDangerous overtaking

THE WORLD BANK IN INDIA10 MINISTRY OF FINANCEDEpARTMENT OF ECONOMIC AFFAIRS
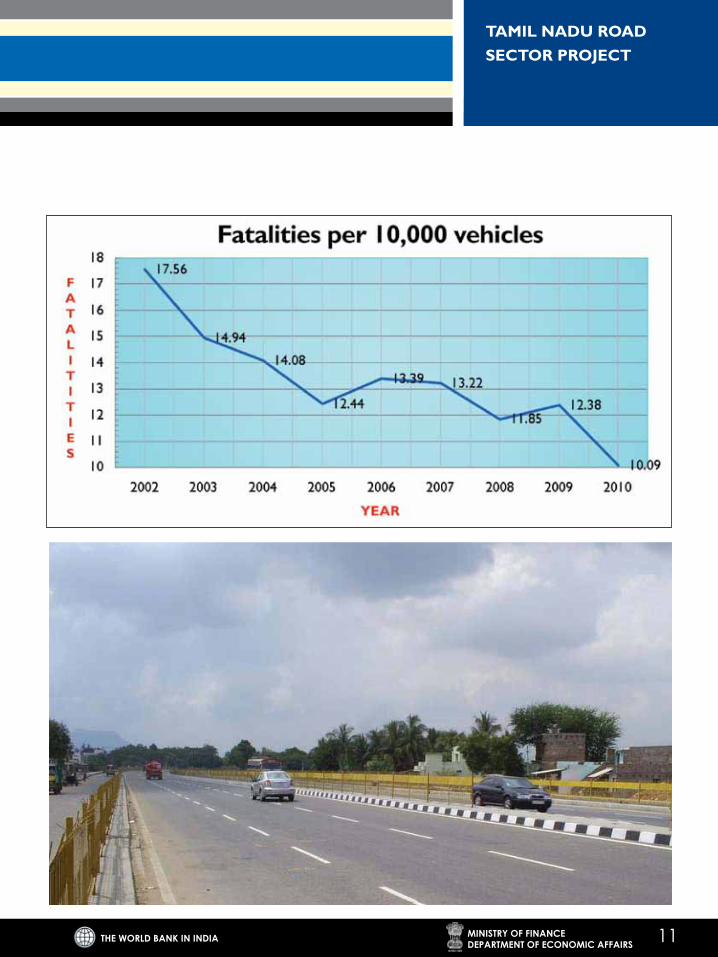
The RADMS system has been deployed at all the state’s 1,400 police stations. It has helped identify nearly 3,000 accident-
prone black spots. This has led to a number of interventions that have reduced road accident fatalities in the state from 13.39 for every 10,000 vehicles in 2006 to 10.09 in 2010. It has also resulted in:
Better traffic management With accurate and real time accident data replacing the voluminous FIR data, the police department has been able to effectively post personnel at critical traffic junctions, deploy radar at appropriate places to detect and prevent speeding, provide speed breakers at relevant spots, upgrade traffic lights, and enforce rules for the use of seat belt and helmets etc.
Better roads The highways department has been able to improve road conditions where they are most needed such as by creating dividers in areas which have a high frequency of head-on collisions, upgrading unsafe road junctions, providing better street lighting, installing road signs, trimming trees and so on.
Increased road safety awarenessThe transport department has been able to target
road safety awareness programs for appropriate groups, such as providing compulsory refresher classes for drivers of heavy vehicles.
Better allocation of budget resourcesThe availability of accurate information has enabled the authorities to provide financial and economic justification for the allocation of budgetary resources to improve road conditions.
Road safety now high on state agendaThe provision of regular reports to the highest authorities in the state has raised the profile of road safety in Tamil Nadu. Moreover, each department now has ownership of road safety issues, and the people have access to accurate information empowering them to ask questions about the implementation of road safety measures.
Road Ahead
The RADMS software is constantly being improved. It is soon planned to provide a hand-held GPS devise to each police station, enabling personnel to enter details at the accident spot itself. The device will automatically pick up the date, time, and spot where the accident happened. Efforts are also on to link the system with medical facilities for quick attention to accident victims.
Impacts
11
TAMIl NADU ROAD
SEcTOR PROjEcT
THE WORLD BANK IN INDIA MINISTRY OF FINANCEDEpARTMENT OF ECONOMIC AFFAIRS

contributions
R.Thiagarajan, IAS, Project Director Officers of the Police, Transport, and Highways Departments Tamil Nadu
T.Pratap, World Bank
Des
ign:
ww
w.d
igit
atem
edia
.in
TAMIl NADUROad SECTOR PROJECT
THE WORLD BANK IN INDIAMINISTRY OF FINANCEDEpARTMENT OF ECONOMIC AFFAIRS