Embed Size (px)
Citation preview

See important disclosures, including any required research certifications, beginning on page 26
■ Investment case We initiate coverage of China Aircraft Leasing Group (CALC), the largest independent aircraft lessor in China, with a Buy (1) rating and DCF-based 12-month target price of HKD12.10. We see CALC as a good vehicle through which investors can benefit from the growing aviation market in China, whose capacity we forecast to see a CAGR of 10% from 2015-20, despite a gradual slowdown in China’s economy. We believe CALC’s fleet will expand more rapidly than the broader market over 2015-20 due to its smaller fleet size (only 44 aircraft at end-2014) than some local lessors under Chinese banks or other global peers. By the same token, the 100 Airbus A320 aircraft it has on order should enable its earnings to grow rapidly up to 2020. We see the company’s setting up of an aircraft disassembly plant as positive in the long term. Not only
will this plant provide a new income source from 2017, it will also raise CALC’s capability to provide a one-stop service to help airlines manage their capacity, and allow it to capture more contracts, given that many airlines will need to dispose of aged aircraft over the next few years. ■ Catalysts In our view, strong 2014 results and a positive outlook for 2015 would be major catalysts in the near term. Besides, new ad hoc leasing contracts for second-hand aircraft and higher-than-expected realisation of finance lease receivables (explained inside) would be additional share-price catalysts. In the long term, we see a possibility of the stock being rerated as more investors recognise the potential of CALC’s aircraft leasing and aircraft disassembly businesses, which should be sustainable and profitable businesses for the company. ■ Valuation The stock is trading currently at 2015-16E PERs of 9-12x, in line with the median PERs for the sector of 9-11x.We think the CALC stock deserves a higher valuation, as we forecast much higher EPS growth of 22-31% YoY for 2015-16, vs. the median for the sector of 16-17%. Our TP implies 2015/2016E PERs of 15x/12x.
■ Risks The major risks to our call would be weaker-than-expected demand for aircraft leasing, and the need for equity financing if the company expands too fast.
Industrials / China1848 HK
20 March 2015
China Aircraft Leasing Group
Initiation: flying high in a niche business
• We consider CALC a niche player in China’s aircraft leasing market, providing a one-stop capacity management service
• Near-term catalysts would be strong 2014 results, new ad hoc orders and further realisation of finance lease receivables
• Initiating with a Buy (1) rating; we see the stock as highly undervalued given its strong net-profit growth in 2015-16E
Source: FactSet, Daiwa forecasts
Industrials / China
China Aircraft Leasing Group1848 HK
Target (HKD): 12.10Upside: 31.8%19 Mar price (HKD): 9.18
Buy (initiation)
OutperformHoldUnderperformSell
1
2
3
4
5
80
116
153
189
225
5
7
9
11
13
Jul-14 Oct-14 Jan-15
Share price performance
CALG (LHS) Relative to HSI (RHS)
(HKD) (%)
12-month range 5.02-12.50Market cap (USDbn) 0.693m avg daily turnover (USDm) 2.80Shares outstanding (m) 586Major shareholder CE Aerospace (36.7%)
Financial summary (HKD)Year to 31 Dec 14E 15E 16ERevenue (m) 1,148 1,734 2,370Operating profit (m) 883 1,351 1,838Net profit (m) 341 466 609Core EPS (fully-diluted) 0.653 0.796 1.040EPS change (%) 73.8 21.8 30.7Daiwa vs Cons. EPS (%) 28.1 13.3 22.8PER (x) 14.1 11.5 8.8Dividend yield (%) 1.8 2.6 3.4DPS 0.165 0.239 0.312PBR (x) 4.3 3.3 2.6EV/EBITDA (x) 21.0 17.0 14.2ROE (%) 31.1 32.4 32.8
Kelvin Lau(852) 2848 [email protected]
How do we justify our view?How do we justify our view?

Industrials / China 1848 HK
20 March 2015
- 2 -
A competitive company in a niche business .................................................................................. 6
A competitive business model .................................................................................................... 6
Aircraft leasing a profitable niche business ................................................................................ 9
Strong market potential in China .................................................................................................. 11
Continuous capacity growth in China to drive aircraft leasing ................................................. 11
Positive catalysts for the short and long term............................................................................... 14
Favourable earnings outlook a short-term share-price catalyst ............................................... 14
One-stop service to gain market share a long-term catalyst ..................................................... 15
Valuation and recommendation ................................................................................................... 17
Valuation .................................................................................................................................... 17
Recommendation ....................................................................................................................... 17
Risks ........................................................................................................................................... 18
Background ............................................................................................................................... 20
Industry overview ...................................................................................................................... 21
Contents

Industrials / China 1848 HK
20 March 2015
- 3 -
Growth outlook CALC: net profit growth (2011-17E)
We forecast CALC’s growth to outpace the capacity growth of China’s aviation sector, which we forecast to increase at a CAGR of 10% for 2015-20E, due to it gaining increasing market share as a start-up company. We forecast its fleet to expand at a CAGR of 49% for 2014-16, from 44 aircraft at the end of 2014 to 90 by the end of 2016. For leasing orders, which come mainly from China’s big-3 airlines – Air China (753 HK, HKD7.03, Hold [3]), China Eastern Airlines (670 HK, HKD4.09, Hold [3]) and China Southern Airlines (1055 HK, HKD4.55, Outperform [2]) – 19 of the estimated 23 new leasing contracts for 2015 were already secured at the end of 2014. As such, we think 45% YoY net-profit growth for 2015E is achievable.
Source: Company, Daiwa forecasts
Valuation CALC: forward PER (since listing on 11 July 2014-present)
The stock is trading currently at 2015-16E PERs of 9-12x, in line with the median PERs for the sector of 9-11x, and at a 2015E PEG of 0.37x which is lower than the median PEG of 0.65x for the sector. We believe the CALC stock deserves a higher valuation, as we forecast much higher EPS growth of 22-31% YoY for 2015-16, versus the median for the sector of 16-17%.
Source: Bloomberg, Daiwa forecasts
Earnings revisions CALC: consensus earnings revisions (2014-15E)
The Bloomberg-consensus EPS forecasts for FY15-16 have risen gradually, as the stock was only listed on 11 July 2014. Our 2015-16E EPS are 13-23% above consensus, as we believe the consensus’s forecasts do not factor in the earnings growth from the acquisition of 100 Airbus A320 aircraft announced on 6 November 2014. We see more upside than downside risk to our earnings forecasts, as there may be more ad hoc leasing orders through the buying and leasing of second-hand aircraft, and higher-than-expected realisation of finance lease receivables.
Source: Bloomberg
How do we justify our view?
Growth outlook
Valuation
Earnings revisions
0%
20%
40%
60%
80%
100%
0
100
200
300
400
500
600
700
800
FY11 FY12 FY13 FY14E FY15E FY16E FY17E
Net profit (LHS) YoY growth (RHS)
(HKDm)
6
8
10
12
14
16
Jul-1
4
Jul-1
4
Aug-
14
Aug-
14
Sep-
14
Sep-
14
Oct
-14
Oct
-14
Oct
-14
Nov
-14
Nov
-14
Dec
-14
Dec
-14
Jan-
15
Jan-
15
Feb-
15
Feb-
15
Mar
-15
Trading PER Average + 1SD -1 SD
(PER)
0.50
0.60
0.70
0.80
0.90
1.00
1.10
Aug-14 Sep-14 Oct-14 Nov-14 Dec-14 Jan-15 Feb-15 Mar-15
(HKD)
FY15E FY16E
Buy (initiation)
OutperformHoldUnderperformSell
1
2
3
4
5

Industrials / China 1848 HK
20 March 2015
- 4 -
Key assumptions
Profit and loss (HKDm)
Cash flow (HKDm)
Source: FactSet, Daiwa forecasts
Year to 31 Dec 2009 2010 2011 2012 2013 2014E 2015E 2016ETotal fleet size (no.) 0 0 10 16 25 44 67 90No. of realization transaction (no.) n.a. n.a. n.a. n.a. 1 4 6 10Ad hoc orders (no.) 0.0 0.0 10.0 6.0 8.0 8.0 3.0 3.0
Year to 31 Dec 2009 2010 2011 2012 2013 2014E 2015E 2016EFinance lease income n.a. n.a. 223 364 478 750 1,053 1,325Operting lease income n.a. n.a. 0 84 145 218 382 545Other Revenue n.a. n.a. 0 0 64 180 300 500Total Revenue 0 0 223 448 687 1,148 1,734 2,370Other income 0 0 0 0 0 0 0 0COGS 0 0 (24) (39) (91) (185) (243) (332)SG&A 0 0 0 0 0 0 0 0Other op.expenses 0 0 (0) (31) (54) (80) (140) (200)Operating profit 0 0 199 377 541 883 1,351 1,838Net-interest inc./(exp.) 0 0 (124) (250) (330) (473) (759) (1,064)Assoc/forex/extraord./others 0 0 3 1 (2) (2) (2) (2)Pre-tax profit 0 0 78 128 210 408 591 772Tax 0 0 (27) (33) (37) (86) (125) (163)Min. int./pref. div./others 0 0 0 0 0 (0) (0) (0)Net profit (reported) 0 0 51 95 173 322 466 609Net profit (adjusted) 0 0 51 95 173 341 466 609EPS (reported)(HKD) n.a. n.a. 0.153 0.253 0.376 0.616 0.796 1.040EPS (adjusted)(HKD) n.a. n.a. 0.153 0.253 0.376 0.653 0.796 1.040EPS (adjusted fully-diluted)(HKD) n.a. n.a. 0.153 0.253 0.376 0.653 0.796 1.040DPS (HKD) 0.000 0.000 0.165 0.051 0.115 0.165 0.239 0.312EBIT 0 0 199 377 541 883 1,351 1,838EBITDA 0 0 199 408 596 963 1,492 2,038
Year to 31 Dec 2009 2010 2011 2012 2013 2014E 2015E 2016EProfit before tax 0 0 78 128 210 408 591 772Depreciation and amortisation 0 0 0 31 54 80 140 200Tax paid 0 0 (27) (33) (37) (86) (125) (163)Change in working capital 0 0 177 (35) 1,103 1,499 2,282 3,701Other operational CF items 0 0 121 252 328 473 759 1,064Cash flow from operations 0 0 349 343 1,658 2,374 3,647 5,574Capex 0 0 (584) (3,678) (5,601) (7,371) (10,023) (10,023)Net (acquisitions)/disposals 0 0 (2) 0 0 0 0 0Other investing CF items 0 0 0 0 0 0 0 0Cash flow from investing 0 0 (586) (3,678) (5,601) (7,371) (10,023) (10,023)Change in debt 0 0 436 3,230 5,504 5,980 8,552 7,176Net share issues/(repurchases) 0 0 0 390 89 47 0 0Dividends paid 0 0 0 0 (53) (53) (97) (140)Other financing CF items 0 0 (127) (302) (306) (473) (759) (1,064)Cash flow from financing 0 0 309 3,318 5,234 5,500 7,696 5,972Forex effect/others 0 0 0 0 0 0 0 0Change in cash 0 0 72 (16) 1,292 503 1,320 1,523Free cash flow 0 0 (235) (3,335) (3,943) (4,997) (6,376) (4,449)
Financial summary

Industrials / China 1848 HK
20 March 2015
- 5 -
Balance sheet (HKDm)
Key ratios (%)
Source: FactSet, Daiwa forecasts
Company profile
China Aircraft Leasing Group (CALC) is the largest independent aircraft lessor in China, managing a fleet of 44 aircraft as at the end of 2014. CALC was listed in Hong Kong on 11 July 2014.
As at 31 Dec 2009 2010 2011 2012 2013 2014E 2015E 2016ECash & short-term investment 0 0 90 73 1,367 1,871 3,191 4,714Inventory 0 0 0 0 0 0 0 0Accounts receivable 0 0 106 808 2,183 3,575 3,603 3,182Other current assets 0 0 8 79 116 185 220 258Total current assets 0 0 203 960 3,667 5,630 7,014 8,154Fixed assets 0 0 1 1,541 1,487 2,109 4,972 7,775Goodwill & intangibles 0 0 0 0 0 0 0 0Other non-current assets 0 0 3,136 4,388 7,679 10,838 13,646 15,471Total assets 0 0 3,340 6,889 12,833 18,577 25,632 31,400Short-term debt 0 0 370 374 2,821 3,874 4,857 5,559Accounts payable 0 0 0 0 0 0 0 0Other current liabilities 0 0 238 87 249 413 624 853Total current liabilities 0 0 609 461 3,070 4,287 5,481 6,412Long-term debt 0 0 2,486 5,713 8,615 12,827 18,319 22,687Other non-current liabilities 0 0 10 20 189 189 189 189Total liabilities 0 0 3,105 6,195 11,875 17,304 23,989 29,287Share capital 0 0 235 619 743 790 790 790Reserves/R.E./others 0 0 0 76 195 464 834 1,303Shareholders' equity 0 0 235 695 939 1,254 1,624 2,093Minority interests 0 0 0 0 20 20 20 20Total equity & liabilities 0 0 3,340 6,889 12,833 18,577 25,632 31,400EV 5,377 5,377 8,144 11,391 15,466 20,228 25,381 28,928Net debt/(cash) 0 0 2,767 6,014 10,069 14,831 19,984 23,531BVPS (HKD) n.a. n.a. 0.699 1.846 2.045 2.141 2.772 3.573
Year to 31 Dec 2009 2010 2011 2012 2013 2014E 2015E 2016ESales (YoY) n.a. n.a. n.a. 100.6 53.4 67.2 51.0 36.6EBITDA (YoY) n.a. n.a. n.a. 105.0 45.8 61.7 54.9 36.6Operating profit (YoY) n.a. n.a. n.a. 89.5 43.5 63.1 53.1 36.0Net profit (YoY) n.a. n.a. n.a. 84.8 81.3 97.8 36.6 30.7Core EPS (fully-diluted) (YoY) n.a. n.a. n.a. 64.8 48.7 73.8 21.8 30.7Gross-profit margin n.a. n.a. 89.3 91.2 86.7 83.8 86.0 86.0EBITDA margin n.a. n.a. 89.3 91.2 86.7 83.8 86.0 86.0Operating-profit margin n.a. n.a. 89.2 84.3 78.8 76.9 77.9 77.6Net profit margin n.a. n.a. 23.1 21.2 25.1 29.7 26.9 25.7ROAE n.a. n.a. 43.9 20.5 21.1 31.1 32.4 32.8ROAA n.a. n.a. 3.1 1.9 1.7 2.2 2.1 2.1ROCE n.a. n.a. 12.9 7.6 5.6 5.8 6.3 6.7ROIC n.a. n.a. 8.7 5.8 5.0 5.1 5.7 6.1Net debt to equity n.a. n.a. 1,179.1 865.6 1,072.8 1,182.6 1,230.8 1,124.3Effective tax rate n.a. n.a. 34.3 25.9 17.8 21.1 21.1 21.1Accounts receivable (days) n.a. n.a. 86.4 372.3 794.7 915.2 755.3 522.5Current ratio (x) n.a. n.a. 0.3 2.1 1.2 1.3 1.3 1.3Net interest cover (x) n.a. n.a. 1.6 1.5 1.6 1.9 1.8 1.7Net dividend payout n.a. n.a. 107.6 20.2 30.7 26.8 30.0 30.0Free cash flow yield 0.0 0.0 n.a. n.a. n.a. n.a. n.a. n.a.
Financial summary continued …

Industrials / China 1848 HK
20 March 2015
- 6 -
A competitive company in a niche business
We believe CALC’s distinctive business model will help it gain sizeable market share in China’s aircraft leasing market up to 2020.
A competitive business model
Focused on a one-stop solution CALC is the largest independent aircraft lessor in China in terms of total number of aircraft, with 44 in service and 100 on order (100 Airbus A320) at the end of 2014. It aims to provide a one-stop aircraft solution for
airlines, which includes aircraft leasing, aircraft trading, aircraft disposal and aircraft management services. Its aircraft types focus on the Airbus A320/A330 and Boeing B737 series. It also has an option to order 20 C919 manufactured in China. CALC targets operating leases, even though in accounting terms these leases are recorded as financing leases, as the present value of the rental income and residual value often represents a significant portion of the original cost of the aircraft. Its customers are mainly Chinese airlines, while commercial banks in China provide CALC with its funding needs. It has domestic leasing platforms in Tianjin and Shanghai, and an overseas platform in Dublin.
CALC: a one-stop aircraft solutions provider
Source: Company
CALCAircraft
manufacturersAirbusBoeing
PartnersAirbusBoeing
Financial InstitutionsChina Development
BankThe Export-Import
Bank of ChinaICBC (Asia)
Bank of TaiwanChina Everbright
High Quality airlines customers
Air China, China Southern Airlines,
China Eastern Airlines, Shenzhen Airlines, Qingdao
Airlines, Shandong Airlines, Sichuan Airlines, Air India
Airlines/ cargo companies
Aircraft parts/ materials recyclers
Purchase aircraft
Provide aircraft
Realize finance lease receivables
Pay cash
Providing financing services
Financing
Aircraft leasing income (recurring)
Provide aircraft leasing and other value-addedservices
Acquire ageing and retiring aircraft
Income from old aircraft sale and leaseback
Income from the sale of disassembled aircraft parts
Recycle disassembled old aircraft engines and parts
$1
$2
$3
Existing business/ revenue
Future business/ revenue
$ Income flow

Industrials / China 1848 HK
20 March 2015
- 7 -
Cost advantages from its dual platform Compared with local Chinese leasing companies, CALC has a cost advantage by buying aircraft through its overseas subsidiary in Dublin, which makes it exempt from paying the import tax in China (around 5% of the aircraft cost). This tax exemption allows CALC to expand its business overseas more easily than leasing subsidiaries of Chinese banks (like BOC Aviation), which as a result find themselves less competitive in the overseas markets. When it comes to leasing aircraft to China-based airlines, CALC imports an aircraft purchased in Ireland back to its China-registered subsidiary in Tianjin, and then leases it to the airline, which takes out the lease on the aircraft. As the transaction is then between two Chinese companies, the Chinese airline can enjoy an exemption from withholding tax (currently 12% of the aircraft’s cost) which airlines have to pay if they are leasing from foreign lessors. To that end, CALC’s leases have a price advantage over global peers’ leases when leasing to airlines in China.
Realisation of finance lease receivables improves cash flow CALC focuses on operating leases with an average duration of 12 years, which is at the higher end of the 5-12-year lease range that is the industry norm. As far as CALC is concerned, a long lease term allows more stable cash inflow for each aircraft it leases out. Apart from the positive impact on its cash flow, the long lease contract also allows CALC to resell the lease to banks to realise a gain (also referred to as ‘realisation’) and collect cash in advance before the contract matures. Operating leases have an IRR of around 8%, which is attractive to banks and institutional investors, especially those leased to major carriers, such as the big-3 airlines in China. We estimate that for every transaction involving the realisation of receivables on a finance lease, CALC would reap around HKD20m for each Airbus A320 and HKD40-50m for each Airbus A330. Based on our expectation for increasing realisation as a result of CALC’s increasing fleet size, we estimate it will realise finance lease receivables on 6 aircraft in 2015 and 10 aircraft in 2016. We believe this is achievable given CALC signed a strategic cooperation agreement with Bank of Communications on 17 March 2015 to realise not more than 20 aircraft within 3 years.

Industrials / China 1848 HK
20 March 2015
- 8 -
CALC: business model
Source: Company
Aircraft disposal capability adds value to the current business On 3 December 2014, CALC entered into an MOU with the Harbin Government to establish an aircraft disassembly plant – the China Aircraft Disassembly Centre (CADC) – with a total investment of USD2bn (which includes USD1.5bn for the purchase of old aircraft). The business targets both domestic and overseas customers. Management expects the plant to commence operations in 2017, and sees it breaking even in terms of bottom line during the first year of operation. CALC’s capability in handling aircraft disposal puts it at an advantage to other lessors, because many airlines are not only looking at capacity expansion, but may also need to dispose of their old, less fuel-efficient aircraft over the next few years. Most lessors, including the top-2 global players, US-based International Lease Finance Corporation (ILFC) and GE Capital Aviation Services (GECAS), do not have the capability to handle aircraft disposal. As such, the CADC gives CALC an edge over competitors and allows it to offer more comprehensive solutions for airlines’ capacity management.
Also, the aircraft disposal business itself is a niche business, in which currently only US players, such as AirSale, AAR Corporation and AJW Aviation, are involved. According to CALC’s guidance, the CADC should return a net profit margin of around 20-30% in the long term. As such, we consider this investment to be long-term positive for CALC.
Conduct technical review of the aircraft
Structure aircraft acquisition financing
with selected banks/financial
institutions
Identify potential aircraft acquisition
opportunities
Pair aircraft with appropriate lease
arrangements
- Re-delivery of aircraft
- Realisation of the long-term lease receivables
Lease and deliver aircraft to airline
customers
Receive constant cash inflow of lease income that match
the repayment instalments of the
long-term bank borrowings
- Re-financing of the existing long-term bank borrowings
- Re-marketing or re-leasing of aircraft
- Maintain the aircraft ownership until the maturity of the lease
For direct aircraft purchase and lease transactions
For aircraft sale and leaseback transactions
--- Denotes future business activities

Industrials / China 1848 HK
20 March 2015
- 9 -
Key Asia-based airlines: recent purchases with buybacksDate Model From/to Cathay Pacific Airways 1/3/2013 Purchased 3 B747-8 freighters Boeing
Purchased the option to purchase 5 B777-200F Boeing Disposal of 4 B747-400 converted freighters Boeing
China Eastern Airlines 13/6/2014 Purchased 80 B737 series aircraft Boeing
Disposed of 15 B737-300 Boeing Disposed of 5 B757 aircraft Boeing
28/2/2014 Purchased 70 A320 NEO70 Airbus Disposed of 7 A300-600 Airbus
23/11/2012 Purchased 60 A320 series aircraft Airbus Disposed of 8 CRJ Airbus Disposed of 10 EMB Airbus
27/4/2012 Purchased 20 B777-300ER Boeing Disposed of 5 A340-600 Boeing
17/10/2011 Purchased 15 A330 series Airbus Disposed of 5 A340-300 Airbus
China Southern Airlines 16/5/2014 Purchased 30 A320 series Airbus
Purchased 50 A320 NEO series Airbus Disposed of 6 ERJ145 Airbus
Sources: Companies
Other competitive advantages over peers Apart from its aircraft disassembly plant and the ability to make Chinese airlines exempt from withholding tax, CALC’s strong sales network in China also gives it a leg-up over its foreign peers. CALC’s business model is centred around project finance (ie, financing based on individual aircraft) rather than on the company’s balance sheet. This type of model contains its exposure to the risk of an airline defaulting on its lease payments. In comparison to local competitors, which are mostly financed by Chinese banks, CALC is able to leverage up more easily, given that it falls under the auspices of the Ministry of Commerce (MOFCOM), which is considered to be more flexible than the China Banking Regulatory Commission (CBRC), the regulator for bank-affiliated aviation leasing companies. Also, CALC focuses on operating leases (whereas banks focus on finance leases), which enables airlines to take leased aircraft off their balance sheets. This practice is welcomed by airlines as it means they do not need to bear the depreciation and interest expenses. Finally, CALC has better expertise in aircraft leasing than banks’ management teams, and can therefore offer more solutions to airlines seeking aircraft and their disposal.
CALC: competitive advantages Against Chinese banks
1) More flexibility on leveraging 2) Focuses on operating leases which allows it to keep aircraft off-the
airlines’ balance sheets. 3) Provides solutions for aircraft disposal
Against foreign lessors
4) Better sales network in China 5) Exemption from withholding tax 6) Financing based on individual aircraft which lowers the risk in case
customers default 7) Provides solutions for aircraft disposal
Source: Daiwa
Aircraft leasing a profitable niche business
High entry barriers to the industry According to Ascend, an independent aviation consultant, aircraft leasing is one of the most profitable subsectors within the aviation supply chain in terms of ROIC. In addition, according to the latest margin comparison from Bloomberg for 2013 results, the margins are higher for aircraft leasing companies than for airlines and aircraft manufacturing companies. The major reason is the high entry barriers for the aircraft leasing business due to the high capex involved, and the importance of management expertise. Similar to airlines, aircraft leasing involves buying aircraft and leasing them out, which requires substantial capex and high cash outflow. If the leasing company cannot find lessees or sufficient financing facilities (especially common for small leasing companies), they could encounter a high financial burden, and possibly even bankruptcy. This situation also encourages large airlines to lease from reputable leasing companies, rather than small players. Furthermore, aircraft leasing is a niche business and requires a lot of industry knowledge. Expertise is very important when it comes to aircraft portfolio management. Knowing what aircraft to invest in, when to buy, how many to purchase, etc, is crucial. And it’s a similar case for aircraft disposal. Timing is particularly critical, as the lessor would not want to have too many aircraft returning at the same time, especially during an industry downturn.

Industrials / China 1848 HK
20 March 2015
- 10 -
ROIC comparison of different players in aircraft leasing industry
Source: Bloomberg
Global aircraft leasing companies: net-profit margin comparison
Aircraft leasing companies
Net profit margin (2014) Airport companies
Net profit margin (2014)
DORIC NIMROD AIR TWO LTD 79.92% Auckland Intl Airport Ltd 57.50%AVOLON HOLDINGS LTD 31.73% SHANGHAI INTERNATIONAL AIR-A 36.85%DORIC NIMROD AIR THREE LTD 31.00% Xiamen International Air-A 36.63%CHINA AIRCRAFT LEASING GROUP 29.71% Grupo Aeroport Del Pacific-B 26.90%Aercap Holdings Nv 27.25% Airports Of Thailand Pcl 25.12%FLY LEASING LTD-ADR 14.57% BEIJING CAPITAL INTL AIRPO-H 18.32%AIRCASTLE LTD 10.78% Guangzhou Baiyun Internati-A 15.90%Willis Lease Finance Corp 2.40% Shenzhen Airport Co-A 8.96%Airline companies Japan Airport Terminal Co 5.07%HAINAN AIRLINES CO-B 14.34% CHINA BAOAN GROUP-A 3.66%JAPAN AIRLINES CO LTD 11.62% Malaysia Airports Hldgs Bhd 0.24%AIR NEW ZEALAND LTD5.54% Aircraft manufacturing companies SINGAPORE AIRLINES LTD 4.94% RAYTHEON COMPANY 9.47%ANA HOLDINGS INC 3.75% NORTHROP GRUMMAN CORP 8.28%AIR CHINA LTD-H 1.07% LOCKHEED MARTIN CORP 7.21%CATHAY PACIFIC AIRWAYS 0.68% BAE SYSTEMS PLC 6.02%CHINA EASTERN AIRLINES CO-H 0.03% BOEING CO/THE 5.99%GARUDA INDONESIA PERSERO TBK -0.74% HUNTINGTON INGALLS INDUSTRIE 5.59%PAL HOLDINGS INC -1.44% ALLIANT TECHSYSTEMS INC 3.65%CHINA SOUTHERN AIRLINES CO-H -2.10% Avichina Industry & Technology 3.61%QANTAS AIRWAYS LTD -37.74% AIRBUS GROUP NV 1.99%
FINMECCANICA SPA 0.15%EMBRAER SA -0.86%
Source: Bloomberg
Downside protection on asset value Every lessor needs to bear the risk of asset depreciation and changes in asset value due to industry volatility, as the aircraft is on the lessor’s book. Some lessors, such as CALC, buy Residual Value Insurance (RVI) to secure the residual value and avoid any potential impairment loss that might need to be written-off in the case of an industry downturn. Even though an additional cost on insurance expenses would be incurred, having RVI protects CALC from any potential impairment loss in the future, as the aviation industry is extremely volatile.
Moreover, upon the expiration of the aircraft lease agreements, the lessee needs to return the aircraft in the same condition as it first received it from the lessor (the industry often refers to this as ‘Full life return conditions’) or such other condition as stipulated in the relevant lease agreements.
0%
1%
2%
3%
4%
5%
6%
7%
8%
9%
10%
Aircraft leasing Aircraft manufacturer Airport Airline
ROIC
Industrials / China 1848 HK
20 March 2015
- 11 -
Strong market potential in China
We expect China’s aviation market to continue to expand, and as such believe the aircraft leasing business will sustain robust growth, at least for the next 5 years.
Continuous capacity growth in China to drive aircraft leasing
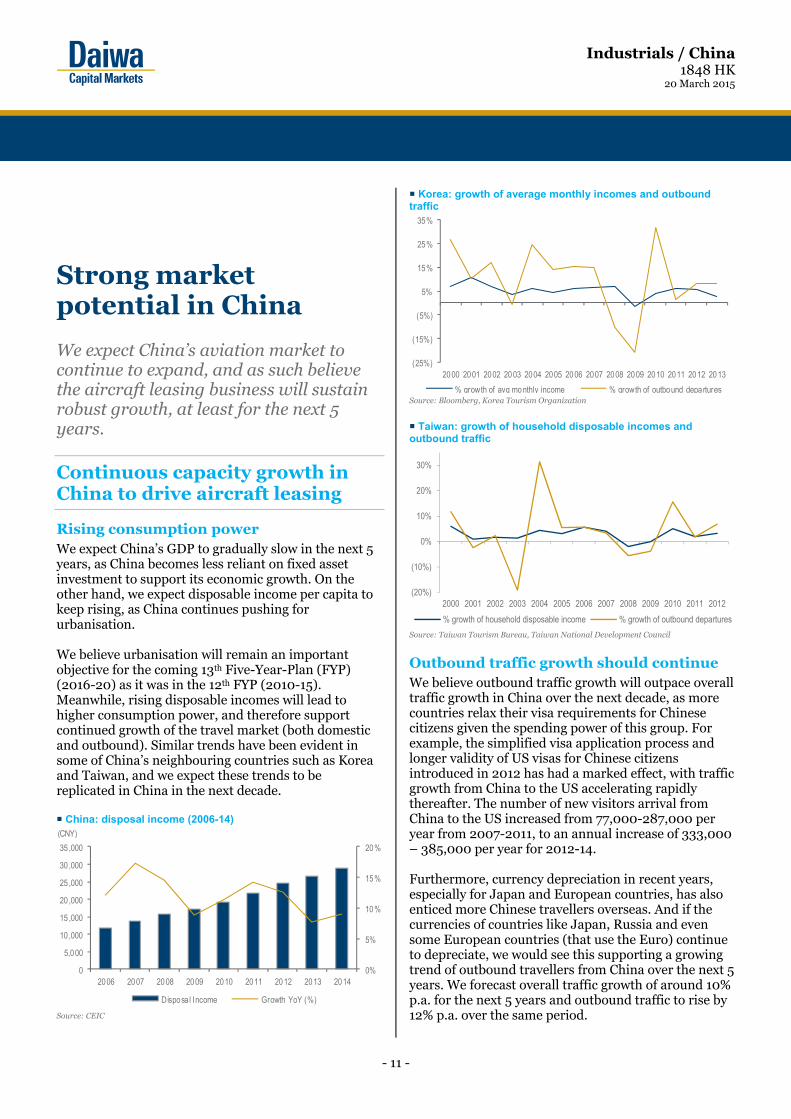
Rising consumption power We expect China’s GDP to gradually slow in the next 5 years, as China becomes less reliant on fixed asset investment to support its economic growth. On the other hand, we expect disposable income per capita to keep rising, as China continues pushing for urbanisation. We believe urbanisation will remain an important objective for the coming 13th Five-Year-Plan (FYP) (2016-20) as it was in the 12th FYP (2010-15). Meanwhile, rising disposable incomes will lead to higher consumption power, and therefore support continued growth of the travel market (both domestic and outbound). Similar trends have been evident in some of China’s neighbouring countries such as Korea and Taiwan, and we expect these trends to be replicated in China in the next decade. China: disposal income (2006-14)
Source: CEIC
Korea: growth of average monthly incomes and outbound traffic
Source: Bloomberg, Korea Tourism Organization
Taiwan: growth of household disposable incomes and outbound traffic
Source: Taiwan Tourism Bureau, Taiwan National Development Council
Outbound traffic growth should continue We believe outbound traffic growth will outpace overall traffic growth in China over the next decade, as more countries relax their visa requirements for Chinese citizens given the spending power of this group. For example, the simplified visa application process and longer validity of US visas for Chinese citizens introduced in 2012 has had a marked effect, with traffic growth from China to the US accelerating rapidly thereafter. The number of new visitors arrival from China to the US increased from 77,000-287,000 per year from 2007-2011, to an annual increase of 333,000 – 385,000 per year for 2012-14. Furthermore, currency depreciation in recent years, especially for Japan and European countries, has also enticed more Chinese travellers overseas. And if the currencies of countries like Japan, Russia and even some European countries (that use the Euro) continue to depreciate, we would see this supporting a growing trend of outbound travellers from China over the next 5 years. We forecast overall traffic growth of around 10% p.a. for the next 5 years and outbound traffic to rise by 12% p.a. over the same period.
0%
5%
10%
15%
20%
0
5,000
10 ,000
15 ,000
20 ,000
25 ,000
30 ,000
35 ,000
2006 2007 2008 2009 2010 2011 2012 2013 2014
Disposa l Income Growth YoY (%)
(CNY)
(25%)
(15%)
(5%)
5%
15%
25%
35%
2000 2001 2002 2003 2004 2005 2006 2007 2008 2009 2010 2011 2012 2013
% growth of avg monthly income % growth of outbound departures
(20%)
(10%)
0%
10%
20%
30%
2000 2001 2002 2003 2004 2005 2006 2007 2008 2009 2010 2011 2012
% growth of household disposable income % growth of outbound departures

Industrials / China 1848 HK
20 March 2015
- 12 -
China: outbound traffic
Source: Beijing Tourism Board, Shanghai Tourism Board
Still demand for more capacity, especially narrow-body aircraft With the prospect of growing traffic for the airline industry in China, domestic airlines have continued ordering more aircraft for future capacity expansion. Currently, the big-3 airlines have a total order book of 1,135 aircraft for Airbus and Boeing, which is slightly more than half of the current operating fleet in China. Also, we believe the rise of regional airlines and low-cost carriers will provide an extra boost to capacity in coming years. We forecast airlines’ capacity to increase by a CAGR of 10% during the 13th FYP, which would be only slightly lower than the 11% CAGR planned under the 12th FYP. It follows then that demand for aircraft leasing in China should remain stable, at least for the next 5 years. China: airline capacity growth for the big-3 airlines
Source: Company
China: aircraft delivery schedule (2015-16E)
2015 2016AC 68 45CEA 75 45CSA 52 12Total 195 102
Source: Companies
China top-4 airlines’ fleet portfolio (by type)
Source: Air China, China Eastern Airlines, China Southern Airlines, Hainan Airlines
Within order books, we see a higher proportion of narrow-body aircraft on order. In our view, the major reason for this is that narrow-body aircraft are still a key aircraft for the Chinese carriers, serving domestic routes and short-haul international flights, on which the Chinese airlines future capacity deployment would focus. Even though we expect a growing trend to use more wide-body aircraft at busy airports like Beijing and Shanghai, we believe the emergence of more regional airlines and low-cost carriers (which usually use narrow-body planes) would help alleviate the decline in the proportion of narrow-body aircraft to total fleets. According to industry consultant Ascend, narrow-body aircraft will still account for 77% of total commercial passenger aircraft by 2031. This data implies a strong business opportunity for CALC, as its current fleet mainly comprises narrow-body aircraft. What’s more, we expect the dominance of the Airbus A320 (a popular narrow-body aircraft) in CALC’s fleet profile to rise after the delivery of its 100 aircraft currently on order. China: airline fleet expansion (2013-31)
2013E 2021E
CAGR from
2013 -21E 2031E
CAGR from
2013 -31E
Narrow-body 1,656 2,667 6.1% 4,161 5.3%Wide-body 206 391 8.3% 770 7.6%Regional jet 125 323 12.6% 456 7.5%Total commercial passenger aircraft 1,987 3,381 6.9% 5,387 5.7%Narrow-body to total commercial aircraft % 83.3% 78.9% N/A 77.2%Cargo aircraft 93 N/A N/A N/A
Source: Ascend Report
-20%
0%
20%
40%
60%
80%
100%
120%
0
1,000,000
2,000,000
3,000,000
4,000,000
5,000,000
6,000,000
7,000,000
2009 2010 2011 2012 2013 2014
(Trip)
No. of Trips (LHS) Growth (YoY%)(RHS)
(20%)
0%
20%
40%
60%
80%
0
50,000
100,000
150,000
200,000
250,000
2000
2001
2002
2003
2004
2005
2006
2007
2008
2009
2010
2011
2012
2013
2014
AC (LHS) CEA (LHS) CSA (LHS)
AC Growth (RHS) CEA Growth (RHS) CSA Growth (RHS)
(ASK)
33.5%
7.2%
42.2%2.7%
1.3%0.5%
3.7%
0.9%0.3%
0.7%
6.8%
A320/321 series
A330 series
B737 series
B747/757
B747F/757F/777F
A300-600R
A319
A340-600
A380-800
Business jet
Others

Industrials / China 1848 HK
20 March 2015
- 13 -
CALC: fleet breakdown by aircraft type (as of 31 December 2014)
Source: Company
Aircraft leasing still a good option As mentioned, we expect more new regional airlines and low-cost carriers to emerge in China over the next decade. Aircraft leasing (both financing and operating leases) would provide a good option for these start-up airlines to launch their operations, as it would not require them to outlay large amounts of capex upfront. Moreover, aircraft leasing affords the airlines greater flexibility to manage their capacity, especially during industry downturns. By maintaining a steady proportion of both self-owned and leased aircraft (normal for most carriers), airlines can easily cut back on capacity by choosing not to renew operating leases. They can also use their finance leases to preserve more cash during industry downturns. While we expect 2015 to be a good year for Chinese airlines in terms of low jet-fuel prices (we assume an average oil price of USD75/bbl in 2015), the big-3 China airlines’ free cash flow is likely to remain negative over the 2015-16 period, as the airlines continue to face large cash outflows in the face of weak profitability. As such, we see aircraft leasing continuing to play an important role in capacity expansion for the big-3 airlines in China.
Big-3 operating lease trend (as % of total fleet)
Source: Company
Leased commercial aircraft (1981-2013) 1981 1986 1991 1996 2001 2006 2011 2013Leased commercial aircraft 190 498 1,345 2,280 3,475 5,831 7,303 7,601Total commercial aircraft 5,793 6,975 8,900 11,322 13,749 16,819 19,370 20,532% of leased to total aircraft: 3.3% 7.1% 15.1% 20.1% 25.3% 34.7% 37.7% 37.0%
Source: Ascend Report
Airbus 330 series
4 Boeing B737 NG5
Airbus A319/321/321
series35
20%
25%
30%
35%
40%
2009 2010 2011 2012 2013 1H14
AC CEA CSA

Industrials / China 1848 HK
20 March 2015
- 14 -
Positive catalysts for the short and long term
Strong earnings growth and investors having a better understanding of its business model could lead to rerating for CALC. Also, CADC should add value to CALC in the long term.
Favourable earnings outlook a short-term share-price catalyst
Strong earnings growth for 2014-16E As a result of the low base in 2014 (a total fleet of just 44 aircraft at the end of 2014), we see large YoY expansion in CALC’s fleet over the 2015-16E period, which in turn should translate into a large YoY rise in net profit during the period. As such, we forecast the company’s fleet size to increase by a CAGR of 43% and its EPS by 22-31% YoY over 2015-16. We see more upside than downside for net profit given that 19 aircraft leases have been signed for 2015 already, and 7 for 2016, versus our estimate of 23 new aircraft leases for each year. We believe strong net profit growth in 2014-16E would lead to a further rerating of the stock, which is currently trading at a 2015E PER of just 11.5x. CALC: fleet expansion (2011-16E)
Source: Company, Daiwa forecasts
CALC: leasing statusDelivery date 2014 2015 2016Papers signed 19 19 7Non-secured 0 1 13
Source: Company
Further upside for new leases Apart from the acquisition of the 100 Airbus A320 aircraft announced on 6 November 2014, which includes 74 A320 NEOs, 10 A321-200 CEOs and 16 A320-200 CEOs, we expect CALC to announce some ad hoc orders in 2015-16, including aircraft bought from the second-hand market to be leased out to customers. We assume 3 more ad hoc aircraft leases will be signed per year over 2015-16, apart from the committed 100 A320 deliveries. We believe CALC will continue to seek opportunities to achieve a good return, not only from new deliveries but also from purchasing on the second-hand market. CALC has a track record of second-hand purchases, having expanded its fleet partly through ad hoc aircraft orders, especially in 2011-12. We believe 3 ad-hoc aircraft leases per year is not very aggressive given that we expect the company to realise around 5 aircraft per year through selling the lease contracts to banks. Further news on debt financing alleviates concerns about placement Considering CALC’s aggressive expansion plan, we believe many investors are concerned about whether the company can continue to gain sufficient financing facilities. And some seem to think there is a good chance CALC will seek a share placement to raise funds, especially as the share price has rallied strongly since listing on 11 July 2014. However, we believe CALC will focus on debt financing in the near term, such as bank borrowings, corporate bonds and convertible bonds to support its financing. And any announcement by the company of a further increase in debt facilities from banks or the issuance of bonds would help allay fears of a potential share placement. Based on our estimates, CALC’s balance sheet and gearing should be able to support the 100 aircraft acquired from Airbus and 3 ad hoc additional aircraft leasing contracts per year.
0%
10%
20%
30%
40%
50%
60%
70%
80%
0
20
40
60
80
100
2011 2012 2013 2014 2015E 2016E
Fleet size (LHS) YoY growth (%, RHS)

Industrials / China 1848 HK
20 March 2015
- 15 -
One-stop service to gain market share a long-term catalyst
CADC likely to bear fruit by 2017 By our calculations, 100 aircraft need to be replaced in China every year. Therefore, it follows that there would be a steady number of aircraft needed to be disposed of every year. In order to capitalise on this opportunity, CALC is in the process of setting up an aircraft disassembly plant, CADC, in Harbin to handle aircraft disposal. In addition, the plant should generate considerable revenue from the resale of aircraft components, which are often even higher in value than an aircraft itself when retired (details in the table below). As such, we are positive on the business outlook for CADC in the long term, as we see more and more airlines in China needing to dispose of aircraft over the next few years, as will even lessors such as ICBC Aviation, which has over the past 3 years become engaged more in the business of operating leases. We expect CADC to make a positive earnings contribution to CALC starting from 2017, when the plant is scheduled to start operations.
CALC: aircraft disassembly project Goal: To build a disassembly plant capable of dismantling 50 aircraft per
year initially, with a target to ramp up capacity to dismantle 100 aircraft per year in the long term
To explore overseas markets and become one of the largest disassembly companies
Total Investment: USD2bn Location: Harbin, Heilongjiang Province Capacity: Target to dismantle 10-20 aircraft per year at the initial stage Production capacity will gradually ramp up to dismantling 50
aircraft per year initially Facilities: Professional dismantling equipment, aircraft material maintenance
and certification centre, temperature and humidity control warehouse, aviation museum and training centre, logistics and distribution centre, staff dormitory, parking apron, and other infrastructure
Parts to be disassembled: High-value parts: engines, APUs, landing gear Major parts: hydraulic pressure systems, control systems,
avionics, seats, survival equipment, etc. Non-major parts: wirings, pipelines, cabin decorations, airframes,
etc. Income: The market price for a retired aircraft is around USD5-10m, the
income for one dismantled aircraft could reach USD10-15m
Source: Company
Market-share gains in the long term Ascend forecasts a net increase of 200 commercial aircraft every year from 2014-18E in China. If we assume a fixed ratio of 40% using leases (either financial or operating leases), we estimate 80 new aircraft would require leases every year from 2014-18E. According to CALC’s management, operating leases account for around 25% of the total market. We therefore estimate 50 new operating leases would be available in the market every year. Of the 50 new operating leases every year, Ascend estimates Chinese lessors’ market share to increase consistently, reaching 55% in 2018, from 40% in 2014. Leased commercial aircraft (1981-2013) 2014E 2015E 2016E 2017E 2018E CAGR
Leased commercial aircraft 911 987 1,061 1,137 1,211 7.4%Total commercial aircraft 2,277 2,467 2,652 2,842 3,027 7.4%% of leased to total aircraft: 40.0% 40.0% 40.0% 40.0% 40.0%
Source: Ascend Report
Market share of Chinese lessors
2007 2008 2009 2010 2011 2012 2013 2014E 2015E 2016E 2017E 2018E CAGRChinese lessors (a) 43 75 111 150 196 238 302 364 414 509 591 666 28.3%Foreign lessors 431 463 468 483 494 477 497 546 572 552 546 545 2.2%Total aircraft under lease (b) 474 538 579 633 690 715 799 910 986 1061 1137 1211 8.9%(a)/(b) 9.1% 13.9% 19.2% 23.7% 28.4% 33.3% 37.8% 40.0% 42.0% 48.0% 52.0% 55.0%
Source: Ascend Report

Industrials / China 1848 HK
20 March 2015
- 16 -
Moreover, we estimate around 100 aircraft would need to be replaced every year in addition to the net increase of 200 aircraft as mentioned for every year (ie, a total of 300 aircraft entering the China market every year). If we assume 25% would be renewed under operating leases, there would be additional opportunity of 25 aircraft per year (ie, a total 75 aircraft per year available for new operating lease opportunities). As CALC is the largest operating lease lessor in China, the average age of CALC’s aircraft is relatively young, and given its aforementioned competitive advantages, we see a good chance for CALC to capture the opportunity from replacement demand through operating leases. In a later section, we further discuss the market fundamentals of aircraft leasing in China. Order books of the big-3 airlines (as at January 2015)
Airbus Boeing TotalAC 167 256 423 CEA 258 212 470 CSA 265 179 444 Total 690 647 1,337
Source: Boeing, Airbus
Big-3 vs. CALC: comparison of average age of fleet (1H14)
Source: Company
0 1 2 3 4 5 6 7 8
CALC*
AC
CEA
CSA
Av erage age of f leet

Industrials / China 1848 HK
20 March 2015
- 17 -
Valuation and recommendation
CALC stock looks undervalued currently considering the prospects for strong net-profit growth from 2015-16E. We look for a rerating over the next 12 months.
Valuation
CALC is worth a higher multiple CALC stock is trading currently at 2015-16E PERs of 9-12x, in line with the median PERs for the sector of 9-11x, and at a 2015E PEG of 0.37x which is lower than the median PEG of 0.65x for the sector. We think CALC stock deserves a higher valuation, as we forecast much higher EPS growth of 22-31% YoY for 2015-16, versus the median for the sector of 16-17%. The major reason for its better-than-peer EPS growth is the continuous stronger growth in Chinese airlines’ capacity in 2015-16E compared with the global market. CALC: forward PER (listed-present)
Source: Bloomberg, Daiwa forecast
High gearing is due to financing structure Some investors may be concerned about the high gearing of CALC, and believe it does not justify the stock trading at a higher valuation. However, we believe its high gearing is due to the fact that its target financing ratio for every aircraft is 90% debt and 10% equity financing, while other leasing companies rely more on equity financing.
The advantage of higher leverage would be the much higher ROE achieved compared with peers, and also the less chance of a share placement in the secondary market. CALC currently has USD1.9bn in borrowing facilities according to management, which we believe should be sufficient to support its financing for the next 2 years. Therefore, we are not concerned about the high gearing and consider it a structural issue for CALC related to the financing of its aircraft. For this reason, we estimate the company’s net gearing level will remain at a similar level of around 1,100-1,200% over our forecast horizon, and do not believe it would affect its dividend policy of 30% of net profit. Global peers: ROE and net debt equity comparison
Bloomberg ROE (%) Net debt/
Equity (%)
Name Code FY13 FY14E FY13 FY14E
Aircraft leasing China Aircraft Leasing Group* 1848 HK 21.1 31.1 1,072.8 1,182.6Aircastle Ltd AYR US 2.7 5.2 187.4 210.8Aercap Holdings Nv AER US 13.2 15.8 244.6 374.7Air Lease Corp AL US 9.1 10.5 221.3 232.0Fly Leasing Ltd-Adr FLY US 6.2 6.4 286.0 354.1Willis Lease Finance Corp WLFC US n.a. n.a. 364.4 n.a.Capital Lease Aviation Plc CLA LN n.a. n.a. 85.4 85.1Total Weighted average 10.3 13.3 n.a. n.a. High n.a. n.a. n.a. n.a. Low n.a. n.a. n.a. n.a. Median 10.4 12.8 231.7 302.1
Source: Bloomberg, *Daiwa forecasts
Recommendation
We initiate coverage of CALC with a Buy (1) rating and DCF-based 12-month target price of HKD12.10. Our target price is based on DCF valuation (WACC of 4.9% and terminal growth rate of 0%) , as we believe this type of valuation best reflects the value of CALC’s future aircraft leases. Also, DCF can factor in the contribution of CADC as well. According to our DCF valuation, we expect free cash flow to turn positive in 2020 when the capex on the 100 Airbus aircraft and CADC would be over. Our target price implies 2015E and 2016E PERs of 15x and 12x, which are both higher than the median for the sector. However, as mentioned earlier, we consider this premium to be justified given what we regard as CALC’s strong net profit growth prospects compared with other global aircraft leasing companies. We believe the strong net-profit growth led by its portfolio expansion will provide strong fundamentals to attract more attention from investors. We expect a further rerating for the stock when more investors
6
8
10
12
14
16
Jul-1
4
Jul-1
4
Aug-
14
Aug-
14
Sep-
14
Sep-
14
Oct
-14
Oct
-14
Oct
-14
Nov
-14
Nov
-14
Dec
-14
Dec
-14
Jan-
15
Jan-
15
Feb-
15
Feb-
15
Mar
-15
Trading PER Average + 1SD -1 SD
(PER)

Industrials / China 1848 HK
20 March 2015
- 18 -
understand the company’s business model and recognize its growth potential. CALC: sensitivity of DCF analysis (2015-25E)
Discount rate
NPV of FCF
(HKDm) Terminal value at 2025 (HKDm)
PV of terminal
value
Enterprise value
(HKDm)
Equity value
(HKDm)
Equity value per share
(HKD) 4.4% -2070 59169 38454 36385 12854 21.94.5% -2115 57856 37242 35127 11596 19.84.6% -2160 56599 36086 33927 10395 17.74.7% -2204 55396 34983 32779 9248 15.84.8% -2248 54242 33930 31681 8150 13.94.9% -2292 53136 32922 30631 7099 12.15.0% -2335 52074 31958 29624 6092 10.45.1% -2377 51054 31035 28658 5127 8.85.2% -2419 50073 30151 27732 4200 7.25.3% -2461 49129 29302 26842 3311 5.75.4% -2502 48219 28488 25987 2456 4.2
Source: Daiwa forecast
Risks
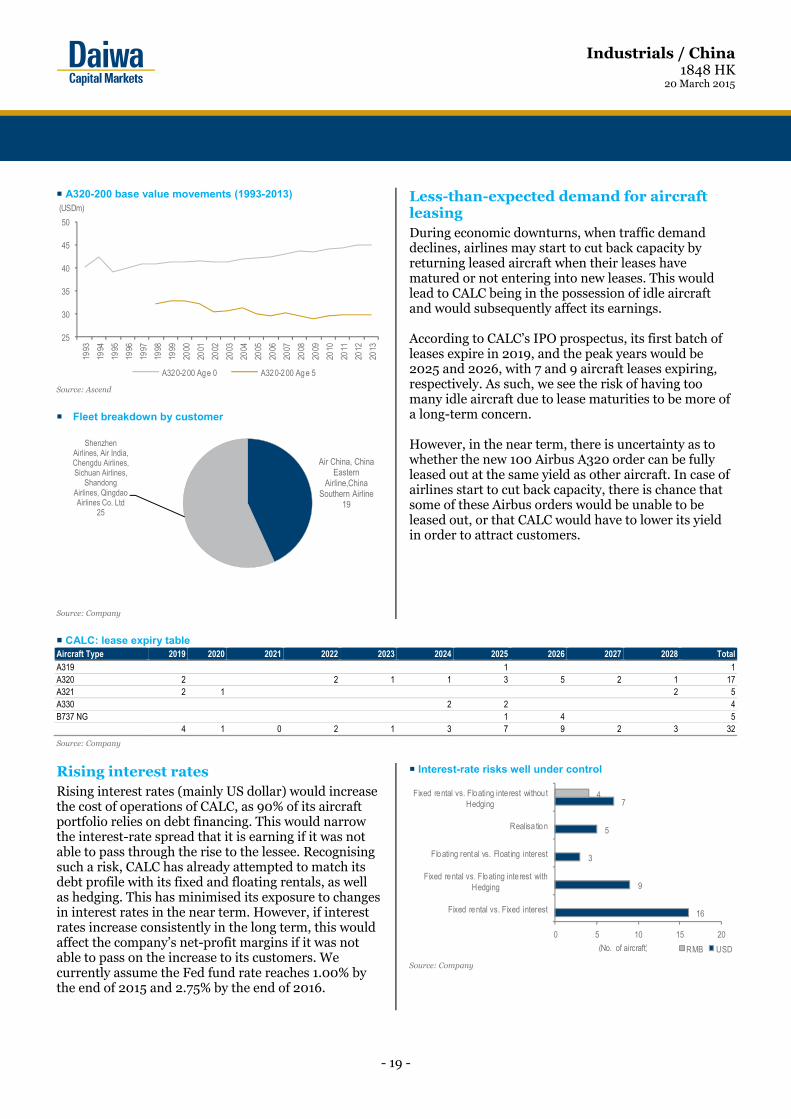
Share placement As mentioned, aircraft leasing is a capital-intensive industry. There is a risk that CALC is no longer able to find debt financing at a reasonable interest rate. If this were to happen, there is a risk that CALC would go to the secondary market for a share placement to support the financing of its aircraft expansion in the future. At the moment, we do not include any potential share placement in our modelling, as we believe its current cash flow is sufficient to support its expansion until 2016. Customers paying late, or not paying at all As it takes huge sums of money to obtain aircraft, any late payment or default on payment by a customer could pose constraints on CALC’s financial liquidity. Under normal industry practice, leasing companies are able to take away the leased aircraft and lease it to another customer in the case of its customers failing to pay. Therefore, it is often the case that even though airlines face financial difficulties during economic crises, they would not delay their payments to their lessor, as this would affect their daily operations. However, if a default does occur, CALC would face the risk of not being able to lease out the aircraft again to another customer. Concentration on just a few suppliers and customers In terms of suppliers, CALC relies heavily on Airbus and Boeing, focusing only on Airbus A320 and A330 series and Boeing B737 series aircraft. While it can be considered positive that CALC focuses on these 3 types of aircraft given that they are the most popular aircraft types in China and tend to retain their value globally,
the downside is that CALC could have less bargaining power over aircraft prices unless it buys in bulk. Also, it could be affected by a potential delay in the delivery schedule or any technical fault with these aircraft. On the customer side, at the end of 2014, CALC had only 9 customers, mostly from China. Therefore, it is heavily reliant on the demand from these few customers and the China macro environment. A321-200 base value movements (1993-2013)
Source: Ascend
A330-200 base value movements (1993-2013)
Source: Ascend
B737 (NG)-800 base value movements (1993-2013)
Source: Ascend
25
30
35
40
45
50
55
1993
1994
1995
1996
1997
1998
1999
2000
2001
2002
2003
2004
2005
2006
2007
2008
2009
2010
2011
2012
2013
A321-200 Age 0 A321-200 Age 5
(USDm)
25
35
45
55
65
75
85
95
105
1993
1994
1995
1996
1997
1998
1999
2000
2001
2002
2003
2004
2005
2006
2007
2008
2009
2010
2011
2012
2013
A330-200 Age 0 A330-200 Age 5
(USDm)
25
30
35
40
45
50
1993
1994
1995
1996
1997
1998
1999
2000
2001
2002
2003
2004
2005
2006
2007
2008
2009
2010
2011
2012
2013
B737 (NG)-800 Series Age 0 B737 (NG)-800 Series Age 5
(USDm)
Industrials / China 1848 HK
20 March 2015
- 19 -
A320-200 base value movements (1993-2013)
Source: Ascend
Fleet breakdown by customer
Source: Company
Less-than-expected demand for aircraft leasing During economic downturns, when traffic demand declines, airlines may start to cut back capacity by returning leased aircraft when their leases have matured or not entering into new leases. This would lead to CALC being in the possession of idle aircraft and would subsequently affect its earnings. According to CALC’s IPO prospectus, its first batch of leases expire in 2019, and the peak years would be 2025 and 2026, with 7 and 9 aircraft leases expiring, respectively. As such, we see the risk of having too many idle aircraft due to lease maturities to be more of a long-term concern. However, in the near term, there is uncertainty as to whether the new 100 Airbus A320 order can be fully leased out at the same yield as other aircraft. In case of airlines start to cut back capacity, there is chance that some of these Airbus orders would be unable to be leased out, or that CALC would have to lower its yield in order to attract customers.
CALC: lease expiry table Aircraft Type 2019 2020 2021 2022 2023 2024 2025 2026 2027 2028 TotalA319 1 1A320 2 2 1 1 3 5 2 1 17A321 2 1 2 5A330 2 2 4B737 NG 1 4 5
4 1 0 2 1 3 7 9 2 3 32
Source: Company
Rising interest rates Rising interest rates (mainly US dollar) would increase the cost of operations of CALC, as 90% of its aircraft portfolio relies on debt financing. This would narrow the interest-rate spread that it is earning if it was not able to pass through the rise to the lessee. Recognising such a risk, CALC has already attempted to match its debt profile with its fixed and floating rentals, as well as hedging. This has minimised its exposure to changes in interest rates in the near term. However, if interest rates increase consistently in the long term, this would affect the company’s net-profit margins if it was not able to pass on the increase to its customers. We currently assume the Fed fund rate reaches 1.00% by the end of 2015 and 2.75% by the end of 2016.
Interest-rate risks well under control
Source: Company
25
30
35
40
45
50
1993
1994
1995
1996
1997
1998
1999
2000
2001
2002
2003
2004
2005
2006
2007
2008
2009
2010
2011
2012
2013
A320-200 Age 0 A320-200 Age 5
(USDm)
Air China, China Eastern
Airline,China Southern Airline
19
Shenzhen Airlines, Air India, Chengdu Airlines, Sichuan Airlines,
Shandong Airlines, Qingdao Airlines Co. Ltd
25
16
9
3
5
74
Fixed rental vs. Fixed interest
Fixed rental vs. Floating interest withHedging
Floating rental vs. Float ing interest
Realisa tion
Fixed rental vs. Floating interest withoutHedging
0 5 10 15 20
RMB USD(No. of aircraft)

Industrials / China 1848 HK
20 March 2015
- 20 -
Background
CALC was founded in 2006, and is headquartered in Hong Kong. The company was listed on the Hong Kong Stock Exchange on 11 July 2014. At the end of 2014, CALC’s fleet size had reached 44 aircraft. The founder of CALC, Mr. Poon Ho Man, is the chairman of Friedmann Pacific Investment Holdings.
He has over 18 years of experience in direct investment, structured finance and investment banking, of which more than 9 years has been in the aviation sector. With his extensive cross-border investment experience, Dr. Poon has had a solid track record in asset privatisation in China since 2000, covering sectors such as infrastructure, finance, energy and consumer goods.
CALC: organisational chart (2014)
Source: Company
CALC: revenue breakdown (2013)
Source: Company
Public Shareholders
China EverbrightGroup
Mr. POON Ho Man
China Aerospace Science and Technology Corporation
30.94%
CCB International
CE AerospaceFriedmann Pacific
Asset Management Limited
Prosper Victory
CALC (1848 HK)
China EverbrightLimited
China Aerospace Investment Holdings
Ltd
Vandi InvestmentsEasy Smart
35.33% 6.45% 3.1% 1.68% 22.5%
100%
100%100% 100%89.99%
50.5%
Finance lease income69.6%
Operating lease income21.2%
Other income9.3%

Industrials / China 1848 HK
20 March 2015
- 21 -
CALC: management profile (2014)CHEN Shuang
Non-Executive Director since August 2013 and also the Chairman of the firm. Chen is also the Director and Deputy General Manager of China Everbright Holdings and the CEO of China Everbright Limited. He is responsible for reviewing the Group's overall strategic planning and business development.
POON Ho Man
CEO and Executive Director of the firm since March 2006. Poon is the founder of CACL. He is responsible for formulating and reviewing the Group's strategic planning and managing its overall business operations. He has more than 7 years of experience in the aircraft leasing industry in China.
LIU Wanting Executive Director, Senior Vice President, Head of Commercial. Liu joined the firm in June 2006 and is responsible for managing the commercial, marketing and banking operations and business development. She focuses on the aircraft leasing and financing businesses. Liu has more than 7 years of experience in the aircraft leasing industry in China.
TANG Chi Chun
Non-executive Director since August 2013. Tang is responsible for business development and advising on the financial related operations of the Group. He is an executive director and the CFO of CEL. He was a director of Everbright Securities from February 2008 to January 2011.
GUO Zibin Non-executive Director since March 2014. Guo is a member of the Board, but does not participate in the day-to-day management of the business operations. He has been the vice general manager of China Aerospace since February 2012.
FAN Yan Hok Independent Non-executive Director since September 2013. Fan currently holds directorships in various companies such as China Everbright International, HKC (Holdings) Limited and First Pacific.
NG Ming Wah, Charles
Independent Non-executive Director since September 2013. Ng was an independent non-executive director of CEL from November 1993 to May 2013; China Molybdenum from December 2006 to August 2012; and the Board of Dalian Port from November 2005 to March 2011.
ZHANG Chongqing Independent Non-executive Director since September 2013. Zhang is the Vice President of China Group Association and the Vice President of the China Market Association.
SUN Quan Independent Non-executive Director since September 2013. Sun is the Executive Director and CEO of China Capital Impetus Assets Management. He is also the General Manager of Beijing Dejoer Investment.
Source: Company
Industry overview
Four main types of lessors in the China aircraft leasing market Chinese lessors can be categorised by their ownership structure, including affiliates of commercial banks, affiliates of airlines, affiliates of aircraft manufacturers and independent lessors. Commercial bank affiliates Most of the aircraft leasing companies in China are affiliates of Chinese banks, such as BOC Aviation, ICBC Leasing and BOCOM Leasing. Their advantage is the strong financial backup they receive from their banking parent, which enables them to obtain favourable terms of financing. At the same time, these companies can leverage on their reputation while negotiating with aircraft manufacturers or airline operators. They mostly focus on finance leases and the earnings, mainly from the interest rate spread, they can obtain from sales-and-leaseback contracts. The disadvantage is their less in-depth professional knowledge compared with independent lessors and also that they are under the supervision of the CBRC, which means less flexibility on leveraging. Airline affiliates Changjiang Leasing, Hong Kong Aviation Capital and Hong Kong International Aviation Leasing are the examples in this category. Hainan Airlines has equity interests in all 3 of these lessors. The advantage is that they have support for leasing demand. However, the disadvantage is that their fleet profiles and growth opportunities mostly rely on their parent. Also, we believe it is difficult for them to obtain third-party business other than the business from their parent.
Aircraft manufacturer affiliates AVIC International Leasing is the only major manufacturer-owned lessor in China. AVIC International can introduce aircraft leasing customers to its parent company. The advantage is their cost on aircraft purchases from the parent should be better than from other parties. However, their choice of fleet may be limited to those produced by the parent. For example, AVIC International focuses mostly on the MA60 turboprop aircraft. At the end of 2013, 17 of its 23 aircraft in service were MA60. Independent lessors Independent lessors are more flexible than other lessors in selecting the appropriate aircraft for their clients and can tailor-make lease plans for airlines. This compares with the other lessors mentioned above, which can generally only provide the aircraft chosen by their parent company’s airline or airline manufacturer. Independent lessors are also able to expand their customer base more freely than can affiliates of airlines. Also, compared with other lessors, independent lessors usually have more in-depth industry knowledge, which gives them flexibility in terms of providing a wide range of fleet management services to their airline customers, such as CALC’s aircraft disassembly services. Examples in this category are CALC and Dragon Aviation Leasing.

Industrials / China 1848 HK
20 March 2015
- 22 -
Competitive analysis Categories of Chinese lessors* Examples Comparative advantages Independent lessors CALC, Dragon Aviation,
COMSYS Aviation Have greater flexibility in terms of leveraging. Focus on operating leases, therefore can help airlines book their leased aircraft as off-balance sheet items. Able to handle aircraft disposal. No withholding tax required compared with foreign lessors, and usage of project financing leads to less risk. Possess better sales networks in China.
Affiliates of commercial banks
BOC Aviation, ICBC Leasing Co., CDB Leasing Company and BoCom Leasing
Able to obtain better financing terms for aircraft acquisitions through their strong ties with parent companies
Affiliates of airlines Changjiang Leasing Company, Hong Kong International Aviation Leasing and Hong Kong Aviation Capital
Can expand their fleets more rapidly through sale and leaseback transactions with parent companies
Affiliates of aircraft manufacturers AVIC International Leasing
Ensure supply and schedule of delivery of aircraft
Source: Company
Note: *base on ownership structure
20 largest aircraft leasing companies in China in 2013Lessor Aircraft in service Market shareILFC 152 19.0%GECAS 118 14.8%ICBC Leasing Co* 60 7.5%Changjiang Leasing Company* 53 6.6%CDB Leasing Company* 52 6.5%BBAM LLC 43 5.4%Air Lease Corporation 38 4.8%BoCom Leasing* 37 4.6%China Aircraft Leasing Limited* 25 3.1%Aviation Capital Group 24 3.0%AVIC International Leasing* 23 2.9%SMBC Aviation Capital 21 2.6%Aircastle Adivsor LLC 15 1.9%AWAS 14 1.8%BOC Aviation 14 1.8%Dragon Aviation Leasing Company* 13 1.6%Standard Chartered Aviation Finance 9 1.1%ORIX Aviation 8 1.0%AerCap 7 0.9%CIT Aerospace 6 0.8%Comsys Aviation Leasing Co Ltd* 6 0.8%Others 61 7.6%Total 799 100%* Chinese lessors
Source: Company prospectus
Note: None of the above, except for AerCap and China Aircraft Leasing Limited, is a listed company. The above companies lease aircraft to China's airlines.
Background of leasing companies
Dragon Aviation Leasing Not listed. Services include operating leases, sales & leaseback agreements, aircraft trading, asset management. Headquartered in Beijing. Was established on 26 October 2006 in Beijing, and created to respond to the growing demand for aircraft in China and other Asian countries. Shareholders include : CAS (formerly China Aviation Supplies Import & Export Group Corporation) 50%, AerCap 16.7%, CA-CIB Airfinance S.A 16.7%, East Epoch Limited 16.7%.
COMSYS Aviation Leasing Not listed. A small aircraft and engine leasing company backed by Hong Kong capital. Established in July 2012. The company's portfolio consists mainly of narrow-body Boeing and Airbus aircraft bought from airlines.
Changjiang Leasing Company
Not listed. Founded in June 2000. Changjiang Leasing is engaged in the trading and leasing of aircraft and other aviation equipment in the domestic and overseas markets. It is a leading China-based aircraft leasing company, with a core competitive edge in financing, asset management, risk management as well as comprehensive services. As at 31 December 2012, Changjiang Leasing had a portfolio of 72 owned and managed aircraft.
Hong Kong International Aviation Leasing
Not listed. Was incorporated in Hong Kong in February 2007. It is a professional leasing company of Hainan Airlines Group specializing in equipment leasing of aircraft, aviation materials and also engaged in the leasing of ships, yachts and other businesses. Leased assets include more than 20 aircraft, one luxury yacht and one aircraft engine etc. Referring to the business scale, it has become Hong Kong's leading professional leasing company. Its main business lines include finance leasing, operating leasing and sale-leaseback rents. Provides customers with high-quality personalised lease options.
Source: Company

Industrials / China 1848 HK
20 March 2015
- 23 -
Peer valuation
Bloomberg Trading Share price
Market Cap
PER (x)
PBR (x)
ROE (%)
EPS growth (%)
Name Code Currency (USDm) Rating FY14E FY15E FY16E FY14E FY15E FY16E FY14E FY15E FY16E FY14E FY15E FY16E
Aircraft leasing China Aircraft Leasing Group* 1848HK HKD 9.18 692.97 Buy 14.1 11.5 8.8 4.3 3.3 2.6 31.1 32.4 32.8 73.8 21.8 30.7Aircastle Ltd AYRUS USD 22.71 1838.37 NR 15.4 11.4 10.3 1.1 1.0 0.9 5.2 8.3 9.2 (13.7) 35.9 10.6Aercap Holdings Nv AERUS USD 43.97 9335.64 NR 9.1 8.4 8.0 1.1 1.1 0.9 15.8 11.8 11.9 82.6 8.5 5.2Air Lease Corp ALUS USD 38.43 3941.32 NR 16.4 13.9 11.8 1.4 1.3 1.2 10.5 11.0 11.8 33.6 18.0 17.5Fly Leasing Ltd-Adr FLYUS USD 15.38 637.24 NR 11.8 11.1 8.5 0.9 0.7 0.7 6.4 8.7 10.5 (6.9) 6.5 31.4Willis Lease Finance Corp WLFCUS USD 19.18 159.80 NR 17.4 17.4 13.7 n.a. n.a. n.a. n.a. n.a. 3.7 292.9 - 27.3Capital Lease Aviation Plc CLALN GBp 20.50 28.86 NR 8.4 7.4 7.4 n.a. n.a. n.a. n.a. n.a. n.a. n.a. 13.9 -Avolon Holdings Ltd AVOLUS USD 21.77 1762.33 NR 10.3 7.3 6.3 1.3 1.1 1.0 13.3 15.4 16.0 38.2 40.2 17.1Doric Nimrod Air Two Ltd DNA2LN GBp 238.50 606.56 NR n.a. n.a. n.a. n.a. n.a. n.a. n.a. n.a. n.a. n.a. n.a. n.a.Doric Nimrod Air Three Ltd DNA3LN GBp 109.88 355.87 NR n.a. n.a. n.a. n.a. n.a. n.a. n.a. n.a. n.a. n.a. n.a. n.a. Weighted average 11.2 9.6 8.5 1.2 1.1 1.0 12.8 11.6 12.0 53.7 15.9 11.0 High 17.4 17.4 13.7 4.3 3.3 2.6 31.1 32.4 32.8 292.9 40.2 31.4 Low 8.4 7.3 6.3 0.9 0.7 0.7 5.2 8.3 3.7 (13.7) 0.0 0.0 Median 12.9 11.2 8.6 1.2 1.1 0.9 11.9 11.4 11.8 38.2 15.9 17.3Other leasing(including ship, machinery, etc.) Aerocentury Corp ACYUS USD 11.61 17.92 NR n.a. 11.8 n.a. n.a. n.a. n.a. n.a. n.a. n.a. n.a. n.a. n.a.Global Ship Lease Inc-Cl A GSLUS USD 5.32 292.17 NR n.a. 64.1 26.9 n.a. n.a. n.a. n.a. n.a. 4.0 n.a. n.a. 138.6Electro Rent Corp ELRCUS USD 10.41 250.93 NR 12.0 12.7 11.4 n.a. n.a. n.a. 10.1 n.a. 12.8 (5.4) (5.7) 11.0Cai International Inc CAPUS USD 23.70 492.68 NR 9.0 8.1 7.6 1.2 1.0 0.9 13.6 12.9 12.5 (7.3) 10.8 7.0First Ship Lease Trust FSLTSP SGD 0.12 54.69 NR n.a. n.a. n.a. n.a. n.a. n.a. n.a. n.a. n.a. n.a. n.a. n.a.Grenkeleasing Ag GLJGR EUR 105.28 1651.97 NR 24.7 21.0 18.7 3.1 2.8 2.5 13.3 13.6 13.7 28.5 17.5 12.4Chailease Holding Co Ltd 5871TT TWD 80.00 2784.74 NR 12.6 11.1 9.6 2.6 2.3 2.0 21.6 21.4 21.2 21.1 13.3 15.1Fuyo General Lease Co Ltd 8424JP JPY 4435.00 1110.78 NR 10.3 9.5 8.8 n.a. 0.7 0.6 n.a. 7.4 7.7 (25.0) 9.2 7.6Group Lease Public Co Ltd GLTB THB 11.50 383.00 NR 44.2 31.1 25.0 3.5 3.9 3.6 10.3 13.1 23.0 (16.9) 42.3 24.3Marubeni Constr Mat Lease 9763JP JPY 270.00 76.57 NR n.a. n.a. n.a. n.a. n.a. n.a. n.a. n.a. n.a. n.a. n.a. n.a.Mitsubishi Ufj Lease & Finan 8593JP JPY 607.00 4496.58 NR 15.0 12.9 11.5 1.1 1.0 0.9 7.5 7.9 8.2 (2.6) 16.9 11.8Tokai Lease Co Ltd 9761JP JPY 231.00 66.75 NR n.a. n.a. n.a. n.a. n.a. n.a. n.a. n.a. n.a. n.a. n.a. n.a.Capital Lease Aviation Plc 5CVGR EUR 0.26 26.65 NR 0.1 0.1 0.1 n.a. n.a. n.a. n.a. n.a. n.a. n.a. 13.9 -Global Ship Lease Inc-Cl A 37HAGR EUR 4.84 292.17 NR n.a. 62.3 26.1 n.a. n.a. n.a. n.a. n.a. 4.0 n.a. n.a. 138.6Total Weighted average 14.9 15.8 12.6 1.6 1.5 1.4 10.8 11.4 12.3 4.6 14.4 18.4 High 44.2 64.1 26.9 3.5 3.9 3.6 21.6 21.4 23.0 28.5 42.3 138.6 Low 0.1 0.1 0.1 1.1 0.7 0.6 7.5 7.4 4.0 (25.0) (5.7) 0.0 Median 12.3 12.7 11.5 2.6 1.7 1.5 11.8 13.0 12.5 (5.4) 13.6 12.1
Source: Bloomberg, *Daiwa forecasts
Note: share prices as of 19 March 2015

Industrials / China 1848 HK
20 March 2015
- 24 -
Daiwa’s Asia Pacific Research Directory
HONG KONG
Hiroaki KATO (852) 2532 4121 [email protected] Regional Research Head
Kosuke MIZUNO (852) 2848 4949 / (852) 2773 8273
Regional Research Co-head
John HETHERINGTON (852) 2773 8787 [email protected] Regional Deputy Head of Asia Pacific Research
Rohan DALZIELL (852) 2848 4938 [email protected] Regional Head of Product Management
Kevin LAI (852) 2848 4926 [email protected] Chief Economist for Asia ex-Japan; Macro Economics (Regional)
Christie CHIEN (852) 2848 4482 [email protected] Macro Economics (Regional)
Junjie TANG (852) 2773 8736 [email protected] Macro Economics (China)
Jonas KAN (852) 2848 4439 [email protected] Head of Hong Kong and China Property
Leon QI (852) 2532 4381 [email protected] Banking (Hong Kong, China); Broker (China); Insurance (China)
Anson CHAN (852) 2532 4350 [email protected] Consumer (Hong Kong/China)
Jamie SOO (852) 2773 8529 [email protected] Gaming and Leisure (Hong Kong/China)
Dennis IP (852) 2848 4068 [email protected] Power; Utilities; Renewables and Environment (Hong Kong/China)
John CHOI (852) 2773 8730 [email protected] Head of Hong Kong and China Internet; Regional Head of Small/Mid Cap
Joey CHEN (852) 2848 4483 [email protected] Steel (China)
Kelvin LAU (852) 2848 4467 [email protected] Head of Transportation (Hong Kong/China); Transportation (Regional)
Brian LAM (852) 2532 4341 [email protected] Transportation – Aviation (Hong Kong/China); Railway; Construction and Engineering (China)
Jibo MA (852) 2848 4489 [email protected] Head of Custom Products Group
Thomas HO (852) 2773 8716 [email protected] Custom Products Group
PHILIPPINES
Bianca SOLEMA (63) 2 737 3023 [email protected] Utilities and Energy
SOUTH KOREA
Sung Yop CHUNG (82) 2 787 9157 [email protected] Pan-Asia Co-head/Regional Head of Automobiles and Components; Automobiles; Shipbuilding; Steel
Mike OH (82) 2 787 9179 [email protected] Banking; Capital Goods (Construction and Machinery)
Iris PARK (82) 2 787 9165 [email protected] Consumer/Retail
Jun Yong BANG (82) 2 787 9168 [email protected] Oil; Chemicals; Tyres
Thomas Y KWON (82) 2 787 9181 [email protected] Pan-Asia Head of Internet & Telecommunications; Software – Internet/On-line Game
TAIWAN
Rick HSU (886) 2 8758 6261 [email protected] Head of Regional Technology; Head of Taiwan Research; Semiconductor/IC Design (Regional)
Steven TSENG (886) 2 8758 6252 [email protected] IT/Technology Hardware (PC Hardware)
Christine WANG (886) 2 8758 6249 [email protected] IT/Technology Hardware (Automation); Pharmaceuticals and Healthcare; Consumer
Kylie HUANG (886) 2 8758 6248 [email protected] IT/Technology Hardware (Handsets and Components)
Helen CHIEN (886) 2 8758 6254 [email protected] Small/Mid Cap
INDIA
Punit SRIVASTAVA (91) 22 6622 1013 [email protected] Head of India Research; Strategy; Banking/Finance
Saurabh MEHTA (91) 22 6622 1009 [email protected] Capital Goods; Utilities
SINGAPORE
Ramakrishna MARUVADA (65) 6499 6543 [email protected] Head of Singapore Research; Telecommunications (China/ASEAN/India)
Royston TAN (65) 6321 3086 [email protected] Oil and Gas; Capital Goods
David LUM (65) 6329 2102 [email protected] Property and REITs
Evon TAN (65) 6499 6546 [email protected] Property and REITs
Jame OSMAN (65) 6321 3092 [email protected] Telecommunications (ASEAN/India); Pharmaceuticals and Healthcare; Consumer (Singapore)

Industrials / China 1848 HK
20 March 2015
- 25 -
Daiwa’s Offices
Office / Branch / Affiliate Address Tel Fax
DAIWA SECURITIES GROUP INC
HEAD OFFICE Gran Tokyo North Tower, 1-9-1, Marunouchi, Chiyoda-ku, Tokyo, 100-6753 (81) 3 5555 3111 (81) 3 5555 0661
Daiwa Securities Trust Company One Evertrust Plaza, Jersey City, NJ 07302, U.S.A. (1) 201 333 7300 (1) 201 333 7726
Daiwa Securities Trust and Banking (Europe) PLC (Head Office) 5 King William Street, London EC4N 7JB, United Kingdom (44) 207 320 8000 (44) 207 410 0129
Daiwa Europe Trustees (Ireland) Ltd Level 3, Block 5, Harcourt Centre, Harcourt Road, Dublin 2, Ireland (353) 1 603 9900 (353) 1 478 3469
Daiwa Capital Markets America Inc Financial Square, 32 Old Slip, New York, NY10005, U.S.A. (1) 212 612 7000 (1) 212 612 7100
Daiwa Capital Markets America Inc. San Francisco Branch 555 California Street, Suite 3360, San Francisco, CA 94104, U.S.A. (1) 415 955 8100 (1) 415 956 1935
Daiwa Capital Markets Europe Limited 5 King William Street, London EC4N 7AX, United Kingdom (44) 20 7597 8000 (44) 20 7597 8600
Daiwa Capital Markets Europe Limited, Frankfurt Branch Trianon Building, Mainzer Landstrasse 16, 60325 Frankfurt am Main, Federal Republic of Germany
(49) 69 717 080 (49) 69 723 340
Daiwa Capital Markets Europe Limited, Paris Representative Office 36, rue de Naples, 75008 Paris, France (33) 1 56 262 200 (33) 1 47 550 808
Daiwa Capital Markets Europe Limited, Geneva Branch 50 rue du Rhône, P.O.Box 3198, 1211 Geneva 3, Switzerland (41) 22 818 7400 (41) 22 818 7441
Daiwa Capital Markets Europe Limited, Moscow Representative Office
Midland Plaza 7th Floor, 10 Arbat Street, Moscow 119002, Russian Federation
(7) 495 641 3416 (7) 495 775 6238
Daiwa Capital Markets Europe Limited, Bahrain Branch 7th Floor, The Tower, Bahrain Commercial Complex, P.O. Box 30069, Manama, Bahrain
(973) 17 534 452 (973) 17 535 113
Daiwa Capital Markets Hong Kong Limited Level 28, One Pacific Place, 88 Queensway, Hong Kong (852) 2525 0121 (852) 2845 1621
Daiwa Capital Markets Singapore Limited 6 Shenton Way #26-08, DBS Building Tower Two, Singapore 068809, Republic of Singapore
(65) 6220 3666 (65) 6223 6198
Daiwa Capital Markets Australia Limited Level 34, Rialto North Tower, 525 Collins Street, Melbourne, Victoria 3000, Australia
(61) 3 9916 1300 (61) 3 9916 1330
DBP-Daiwa Capital Markets Philippines, Inc 18th Floor, Citibank Tower, 8741 Paseo de Roxas, Salcedo Village, Makati City, Republic of the Philippines
(632) 813 7344 (632) 848 0105
Daiwa-Cathay Capital Markets Co Ltd 14/F, 200, Keelung Road, Sec 1, Taipei, Taiwan, R.O.C. (886) 2 2723 9698 (886) 2 2345 3638
Daiwa Securities Capital Markets Korea Co., Ltd. One IFC, 10 Gukjegeumyung-Ro, Yeouido-dong, Yeongdeungpo-gu, Seoul, 150-876, Korea
(82) 2 787 9100 (82) 2 787 9191
Daiwa Securities Capital Markets Co Ltd, Beijing Representative Office
Room 301/302,Kerry Center, 1 Guanghua Road,Chaoyang District, Beijing 100020, People’s Republic of China
(86) 10 6500 6688 (86) 10 6500 3594
Daiwa SSC Securities Co Ltd 45/F, Hang Seng Tower, 1000 Lujiazui Ring Road, Pudong, Shanghai 200120, People’s Republic of China
(86) 21 3858 2000 (86) 21 3858 2111
Daiwa Securities Capital Markets Co. Ltd, Bangkok Representative Office
18th Floor, M Thai Tower, All Seasons Place, 87 Wireless Road, Lumpini, Pathumwan, Bangkok 10330, Thailand
(66) 2 252 5650 (66) 2 252 5665
Daiwa Capital Markets India Private Ltd 10th Floor, 3 North Avenue, Maker Maxity, Bandra Kurla Complex, Bandra East, Mumbai – 400051, India
(91) 22 6622 1000 (91) 22 6622 1019
Daiwa Securities Capital Markets Co. Ltd, Hanoi Representative Office
Suite 405, Pacific Palace Building, 83B, Ly Thuong Kiet Street, Hoan Kiem Dist. Hanoi, Vietnam
(84) 4 3946 0460 (84) 4 3946 0461
DAIWA INSTITUTE OF RESEARCH LTD
HEAD OFFICE 15-6, Fuyuki, Koto-ku, Tokyo, 135-8460, Japan (81) 3 5620 5100 (81) 3 5620 5603
MARUNOUCHI OFFICE Gran Tokyo North Tower, 1-9-1, Marunouchi, Chiyoda-ku, Tokyo, 100-6756 (81) 3 5555 7011 (81) 3 5202 2021
New York Research Center 11th Floor, Financial Square, 32 Old Slip, NY, NY 10005-3504, U.S.A. (1) 212 612 6100 (1) 212 612 8417
London Research Centre 3/F, 5 King William Street, London, EC4N 7AX, United Kingdom (44) 207 597 8000 (44) 207 597 8550

Industrials / China 1848 HK
20 March 2015
- 26 -
Disclaimer
This publication is produced by Daiwa Securities Group Inc. and/or its non-U.S. affiliates, and distributed by Daiwa Securities Group Inc. and/or its non-U.S. affiliates, except to the extent expressly provided herein. This publication and the contents hereof are intended for information purposes only, and may be subject to change without further notice. Any use, disclosure, distribution, dissemination, copying, printing or reliance on this publication for any other purpose without our prior consent or approval is strictly prohibited. Neither Daiwa Securities Group Inc. nor any of its respective parent, holding, subsidiaries or affiliates, nor any of its respective directors, officers, servants and employees, represent nor warrant the accuracy or completeness of the information contained herein or as to the existence of other facts which might be significant, and will not accept any responsibility or liability whatsoever for any use of or reliance upon this publication or any of the contents hereof. Neither this publication, nor any content hereof, constitute, or are to be construed as, an offer or solicitation of an offer to buy or sell any of the securities or investments mentioned herein in any country or jurisdiction nor, unless expressly provided, any recommendation or investment opinion or advice. Any view, recommendation, opinion or advice expressed in this publication may not necessarily reflect those of Daiwa Securities Capital Markets Co. Ltd., and/or its affiliates nor any of its respective directors, officers, servants and employees except where the publication states otherwise. This research report is not to be relied upon by any person in making any investment decision or otherwise advising with respect to, or dealing in, the securities mentioned, as it does not take into account the specific investment objectives, financial situation and particular needs of any person. Daiwa Securities Group Inc., its subsidiaries or affiliates, or its or their respective directors, officers and employees from time to time have trades as principals, or have positions in, or have other interests in the securities of the company under research including derivatives in respect of such securities or may have also performed investment banking and other services for the issuer of such securities. The following are additional disclosures. Japan Daiwa Securities Co. Ltd. and Daiwa Securities Group Inc. Daiwa Securities Co. Ltd. is a subsidiary of Daiwa Securities Group Inc. Investment Banking Relationship
Within the preceding 12 months, The subsidiaries and/or affiliates of Daiwa Securities Group Inc. * has lead-managed public offerings and/or secondary offerings (excluding straight bonds) of the securities of the following companies: Modern Land (China) Co. Ltd (1107 HK); econtext Asia Ltd (1390 HK); Lotte Shopping Co (023530 KS); Rexlot Holdings Ltd (555 HK); Neo Solar Power Corp (3576_TT); Accordia Golf Trust (AGT SP); Hua Hong Semiconductor Ltd (1347 HK).
*Subsidiaries of Daiwa Securities Group Inc. for the purposes of this section shall mean any one or more of: Daiwa Capital Markets Hong Kong Limited (大和資本市場香港有限公司), Daiwa Capital Markets Singapore Limited, Daiwa Capital Markets Australia Limited, Daiwa Capital Markets India Private Limited, Daiwa-Cathay Capital Markets Co., Ltd., Daiwa Securities Capital Markets Korea Co., Ltd. Hong Kong This research is distributed in Hong Kong by Daiwa Capital Markets Hong Kong Limited (大和資本市場香港有限公司) (“DHK”) which is regulated by the Hong Kong Securities and Futures Commission. Recipients of this research in Hong Kong may contact DHK in respect of any matter arising from or in connection with this research. Ownership of Securities For “Ownership of Securities” information, please visit BlueMatrix disclosure Link at https://daiwa3.bluematrix.com/sellside/Disclosures.action. Investment Banking Relationship For “Investment Banking Relationship”, please visit BlueMatrix disclosure Link at https://daiwa3.bluematrix.com/sellside/Disclosures.action. Relevant Relationship (DHK) DHK may from time to time have an individual employed by or associated with it serves as an officer of any of the companies under its research coverage. DHK market making DHK may from time to time make a market in securities covered by this research.
Singapore This research is distributed in Singapore by Daiwa Capital Markets Singapore Limited and it may only be distributed in Singapore to accredited investors, expert investors and institutional investors as defined in the Financial Advisers Regulations and the Securities and Futures Act (Chapter 289), as amended from time to time. By virtue of distribution to these category of investors, Daiwa Capital Markets Singapore Limited and its representatives are not required to comply with Section 36 of the Financial Advisers Act (Chapter 110) (Section 36 relates to disclosure of Daiwa Capital Markets Singapore Limited’s interest and/or its representative’s interest in securities). Recipients of this research in Singapore may contact Daiwa Capital Markets Singapore Limited in respect of any matter arising from or in connection with the research. Australia This research is distributed in Australia by Daiwa Capital Markets Stockbroking Limited and it may only be distributed in Australia to wholesale investors within the meaning of the Corporations Act. Recipients of this research in Australia may contact Daiwa Capital Markets Stockbroking Limited in respect of any matter arising from or in connection with the research. Ownership of Securities For “Ownership of Securities” information, please visit BlueMatrix disclosure Link at https://daiwa3.bluematrix.com/sellside/Disclosures.action. India This research is distributed by Daiwa Capital Markets India Private Limited (DAIWA) which is an intermediary registered with Securities & Exchange Board of India. This report is not to be considered as an offer or solicitation for any dealings in securities. While the information in this report has been compiled by DAIWA in good faith from sources believed to be reliable, no representation or warranty, express of implied, is made or given as to its accuracy, completeness or correctness. DAIWA its officers, employees, representatives and agents accept no liability whatsoever for any loss or damage whether direct, indirect, consequential or otherwise howsoever arising (whether in negligence or otherwise) out of or in connection with or from any use of or reliance on the contents of and/or omissions from this document. Consequently DAIWA expressly disclaims any and all liability for, or based on or relating to any such information contained in or errors in or omissions in this report. Accordingly, you are recommended to seek your own legal, tax or other advice and should rely solely on your own judgment, review and analysis, in evaluating the information in this document. The data contained in this document is subject to change without any prior notice DAIWA reserves its right to modify this report as maybe required from time to time. DAIWA is committed to providing independent recommendations to its Clients and would be happy to provide any information in response to any query from its Clients. This report is strictly confidential and is being furnished to you solely for your information. The information contained in this document should not be reproduced (in whole or in part) or redistributed in any form to any other person. We and our group companies, affiliates, officers, directors and employees may from time to time, have long or short positions, in and buy sell the securities thereof, of company(ies) mentioned herein or be engaged in any other transactions involving such securities and earn brokerage or other compensation or act as advisor or have the potential conflict of interest with respect to any recommendation and related information or opinion. DAIWA prohibits its analyst and their family members from maintaining a financial interest in the securities or derivatives of any companies that the analyst cover. This report is not intended or directed for distribution to, or use by any person, citizen or entity which is resident or located in any state or country or jurisdiction where such publication, distribution or use would be contrary to any statutory legislation, or regulation which would require DAIWA and its affiliates/ group companies to any registration or licensing requirements. The views expressed in the report accurately reflect the analyst’s personal views about the securities and issuers that are subject of the Report, and that no part of the analyst’s compensation was, is or will be directly or indirectly, related to the recommendations or views expressed in the Report. This report does not recommend to US recipients the use of Daiwa Capital Markets India Private Limited or any of its non – US affiliates to effect trades in any securities and is not supplied with any understanding that US recipients will direct commission business to Daiwa Capital Markets India Private Limited. Taiwan This research is distributed in Taiwan by Daiwa-Cathay Capital Markets Co., Ltd and it may only be distributed in Taiwan to institutional investors or specific investors who have signed recommendation contracts with Daiwa-Cathay Capital Markets Co., Ltd in accordance with the Operational Regulations Governing Securities Firms Recommending Trades in Securities to Customers. Recipients of this research in Taiwan may contact Daiwa-Cathay Capital Markets Co., Ltd in respect of any matter arising from or in connection with the research. Philippines This research is distributed in the Philippines by DBP-Daiwa Capital Markets Philippines, Inc. which is regulated by the Philippines Securities and Exchange Commission and the Philippines Stock Exchange, Inc. Recipients of this research in the Philippines may contact DBP-Daiwa Capital Markets Philippines, Inc. in respect of any matter arising from or in connection with the research. DBP-Daiwa Capital Markets Philippines, Inc. recommends that investors independently assess, with a professional advisor, the specific financial risks as well as the legal, regulatory, tax, accounting, and other consequences of a proposed transaction. DBP-Daiwa Capital Markets Philippines, Inc. may have positions or may be materially interested in the securities in any of the markets mentioned in the publication or may have performed other services for the issuers of such securities. For relevant securities and trading rules please visit SEC and PSE Link at http://www.sec.gov.ph/irr/AmendedIRRfinalversion.pdf and http://www.pse.com.ph/ respectively. Thailand
This research is distributed to only institutional investors in Thailand primarily by Thanachart Securities Public Company Limited (“TNS”).
This report is prepared by analysts who are employed by Daiwa Securities Group Inc. and/or its non-U.S. affiliates. While the information is from sources believed to be reliable, neither the information nor the forecasts shall be taken as a representation or warranty for which Thanachart Securities Public Company Limited, Daiwa Securities Group Inc. nor any of their respective parent, holding, subsidiaries or affiliates, nor any of their respective directors, officers, servants and employees incur any responsibility. This report is provided to you for informational purposes only and it is not, and is not to be construed as, an offer or an invitation to make an offer to sell or buy any securities. Neither Thanachart Securities Public Company Limited, Daiwa Securities Group Inc. nor any of their respective parent, holding, subsidiaries or affiliates, nor any of their respective directors, officers, servants and employees accept any liability whatsoever for any

Industrials / China 1848 HK
20 March 2015
- 27 -
direct or consequential loss arising from any use of this research or its contents.
The information and opinions contained herein have been compiled or arrived at from sources believed reliable. However, Thanachart Securities Public Company Limited, Daiwa Securities Group Inc. nor any of their respective parent, holding, subsidiaries or affiliates, nor any of their respective directors, officers, servants and employees make no representation or warranty, express or implied, as to their accuracy or completeness. Expressions of opinion herein are subject to change without notice. The use of any information, forecasts and opinions contained in this report shall be at the sole discretion and risk of the user.
Daiwa Securities Group Inc. and/or its non-U.S. affiliates perform and seek to perform business with companies covered in this research. Thanachart Securities Public Company Limited, Daiwa Securities Group Inc., their respective parent, holding, subsidiaries or affiliates, their respective directors, officers, servants and employees may have positions and financial interest in securities mentioned in this research. Thanachart Securities Public Company Limited, Daiwa Securities Group Inc., their respective parent, holding, subsidiaries or affiliates may from time to time perform investment banking or other services for, or solicit investment banking or other business from, any entity mentioned in this research. Therefore, investors should be aware of conflict of interest that may affect the objectivity of this research. United Kingdom This research report is produced by Daiwa Capital Markets Europe Limited and/or its affiliates and is distributed in the European Union, Iceland, Liechtenstein, Norway and Switzerland. Daiwa Capital Markets Europe Limited is authorised and regulated by The Financial Conduct Authority (“FCA”) and is a member of the London Stock Exchange, Eurex and NYSE Liffe. Daiwa Capital Markets Europe Limited and/or its affiliates may, from time to time, to the extent permitted by law, participate or invest in other financing transactions with the issuers of the securities referred to herein (the “Securities”), perform services for or solicit business from such issuers, and/or have a position or effect transactions in the Securities or options thereof and/or may have acted as an underwriter during the past twelve months for the issuer of such securities. In addition, employees of Daiwa Capital Markets Europe Limited and/or its affiliates may have positions and effect transactions in such securities or options and may serve as Directors of such issuers. Daiwa Capital Markets Europe Limited may, to the extent permitted by applicable UK law and other applicable law or regulation, effect transactions in the Securities before this material is published to recipients. This publication is intended for investors who are not Retail Clients in the United Kingdom within the meaning of the Rules of the FCA and should not therefore be distributed to such Retail Clients in the United Kingdom. Should you enter into investment business with Daiwa Capital Markets Europe’s affiliates outside the United Kingdom, we are obliged to advise that the protection afforded by the United Kingdom regulatory system may not apply; in particular, the benefits of the Financial Services Compensation Scheme may not be available. Daiwa Capital Markets Europe Limited has in place organisational arrangements for the prevention and avoidance of conflicts of interest. Our conflict management policy is available at http://www.uk.daiwacm.com/about-us/corporate-governance-regulatory . Regulatory disclosures of investment banking relationships are available at https://daiwa3.bluematrix.com/sellside/Disclosures.action. Germany This document is distributed in Germany by Daiwa Capital Markets Europe Limited, Niederlassung Frankfurt which is regulated by BaFin (Bundesanstalt fuer Finanzdienstleistungsaufsicht) for the conduct of business in Germany. Bahrain
This research material is distributed by Daiwa Capital Markets Europe Limited, Bahrain Branch, regulated by The Central Bank of Bahrain and holds Investment Business Firm – Category 2 license and having its official place of business at the Bahrain World Trade Centre, South Tower, 7th floor, P.O. Box 30069, Manama, Kingdom of Bahrain. Tel No. +973 17534452 Fax No. +973 535113
This material is provided as a reference for making investment decisions and is not intended to be a solicitation for investment. Investment decisions should be made at your own discretion and risk. Accordingly, no representation or warranty, express or implied, is made as to and no reliance should be placed on the fairness, accuracy, completeness or correctness of the information and opinions contained in this document, Content herein is based on information available at the time the research material was prepared and may be amended or otherwise changed in the future without notice. All information is intended for the private use of the person to whom it is provided without any liability whatsoever on the part of Daiwa Capital Markets Europe Limited, Bahrain Branch, any associated company or the employees thereof. If you are in doubt about the suitability of the product or the research material itself, please consult your own financial adviser. Daiwa Capital Markets Europe Limited, Bahrain Branch retains all rights related to the content of this material, which may not be redistributed or otherwise transmitted without prior consent. United States This report is distributed in the U.S. by Daiwa Capital Markets America Inc. (DCMA). It may not be accurate or complete and should not be relied upon as such. It reflects the preparer’s views at the time of its preparation, but may not reflect events occurring after its preparation; nor does it reflect DCMA’s views at any time. Neither DCMA nor the preparer has any obligation to update this report or to continue to prepare research on this subject. This report is not an offer to sell or the solicitation of any offer to buy securities. Unless this report says otherwise, any recommendation it makes is risky and appropriate only for sophisticated speculative investors able to incur significant losses. Readers should consult their financial advisors to determine whether any such recommendation is consistent with their own investment objectives, financial situation and needs. This report does not recommend to U.S. recipients the use of any of DCMA’s non-U.S. affiliates to effect trades in any security and is not supplied with any understanding that U.S. recipients of this report will direct commission business to such non-U.S. entities. Unless applicable law permits otherwise, non-U.S. customers wishing to effect a transaction in any securities referenced in this material should contact a Daiwa entity in their local jurisdiction. Most countries throughout the world have their own laws regulating the types of securities and other investment products which may be offered to their residents, as well as a process for doing so. As a result, the securities discussed in this report may not be eligible for sales in some jurisdictions. Customers wishing to obtain further information about this report should contact DCMA: Daiwa Capital Markets America Inc., Financial Square, 32 Old Slip, New York, New York 10005 (telephone 212-612-7000). Ownership of Securities For “Ownership of Securities” information please visit BlueMatrix disclosure Link at https://daiwa3.bluematrix.com/sellside/Disclosures.action. Investment Banking Relationships For “Investment Banking Relationships” please visit BlueMatrix disclosure link at https://daiwa3.bluematrix.com/sellside/Disclosures.action. DCMA Market Making For “DCMA Market Making” please visit BlueMatrix disclosure link at https://daiwa3.bluematrix.com/sellside/Disclosures.action. Research Analyst Conflicts For updates on “Research Analyst Conflicts” please visit BlueMatrix disclosure link at https://daiwa3.bluematrix.com/sellside/Disclosures.action. The principal research analysts who prepared this report have no financial interest in securities of the issuers covered in the report, are not (nor are any members of their household) an officer, director or advisory board member of the issuer(s) covered in the report, and are not aware of any material relevant conflict of interest involving the analyst or DCMA, and did not receive any compensation from the issuer during the past 12 months except as noted: no exceptions. Research Analyst Certification For updates on “Research Analyst Certification” and “Rating System” please visit BlueMatrix disclosure link at https://daiwa3.bluematrix.com/sellside/Disclosures.action. The views about any and all of the subject securities and issuers expressed in this Research Report accurately reflect the personal views of the research analyst(s) primarily responsible for this report (or the views of the firm producing the report if no individual analysts[s] is named on the report); and no part of the compensation of such analyst(s) (or no part of the compensation of the firm if no individual analyst[s)] is named on the report) was, is, or will be directly or indirectly related to the specific recommendations or views contained in this Research Report.
The following explains the rating system in the report as compared to relevant local indices, unless otherwise stated, based on the beliefs of the author of the report.
"1": the security could outperform the local index by more than 15% over the next 12 months. "2": the security is expected to outperform the local index by 5-15% over the next 12 months. "3": the security is expected to perform within 5% of the local index (better or worse) over the next 12 months. "4": the security is expected to underperform the local index by 5-15% over the next 12 months. "5": the security could underperform the local index by more than 15% over the next 12 months. Additional information may be available upon request. Japan - additional notification items pursuant to Article 37 of the Financial Instruments and Exchange Law (This Notification is only applicable where report is distributed by Daiwa Securities Co. Ltd.) If you decide to enter into a business arrangement with us based on the information described in materials presented along with this document, we ask you to pay close attention to the following items. • In addition to the purchase price of a financial instrument, we will collect a trading commission* for each transaction as agreed beforehand with you. Since commissions may be included in
the purchase price or may not be charged for certain transactions, we recommend that you confirm the commission for each transaction. • In some cases, we may also charge a maximum of ¥ 2 million (including tax) per year as a standing proxy fee for our deposit of your securities, if you are a non-resident of Japan.
Industrials / China 1848 HK
20 March 2015
- 28 -
• For derivative and margin transactions etc., we may require collateral or margin requirements in accordance with an agreement made beforehand with you. Ordinarily in such cases, the amount of the transaction will be in excess of the required collateral or margin requirements.
• There is a risk that you will incur losses on your transactions due to changes in the market price of financial instruments based on fluctuations in interest rates, exchange rates, stock prices, real estate prices, commodity prices, and others. In addition, depending on the content of the transaction, the loss could exceed the amount of the collateral or margin requirements.
• There may be a difference between bid price etc. and ask price etc. of OTC derivatives handled by us. • Before engaging in any trading, please thoroughly confirm accounting and tax treatments regarding your trading in financial instruments with such experts as certified public accountants.
*The amount of the trading commission cannot be stated here in advance because it will be determined between our company and you based on current market conditions and the content of each transaction etc.
When making an actual transaction, please be sure to carefully read the materials presented to you prior to the execution of agreement, and to take responsibility for your own decisions regarding the signing of the agreement with us. Corporate Name: Daiwa Securities Co. Ltd. Financial instruments firm: chief of Kanto Local Finance Bureau (Kin-sho) No.108 Memberships: Japan Securities Dealers Association, The Financial Futures Association of Japan Japan Securities Investment Advisers Association Type II Financial Instruments Firms Association