Embed Size (px)
Citation preview

Supported by:
based on a decision of the German Bundestag
100% Renewables Cities and Regions Roadmap
INITIAL ENERGY STATUS REPORT
Kisumu County, Kenya

i
Initial Status Report for Kisumu County The material in this publication is copyrighted. Content from this report may be used for non-commercial
purposes, provided it is attributed to the source.
ICLEI - Local Government for Sustainability-Africa
Cape Town, South Africa
October 2020
Author:
Ms Carine Buma (ICLEI Africa Secretariat)
Reviewers (in alphabetical order):
Mr. Bukachi Nickson (Energy and Petroleum Regulatory Authority, Kenya); Ms. Dania Petrik (ICLEI Africa
Secretariat); Mr. David Hoepfl (ICLEI World Secretariat); Mr. Edwin Omwenga (Ministry of Energy, Kenya);
Mr. Evans Gichana (County Government of Kisumu); Mr. Felix Odhiambo (County Government of Kisumu);
Mr. Jan-Albrecht Harrs (ICLEI World Secretariat); Ms. Laura Noriega (ICLEI World Secretariat); Ms. Nachi
Majoe (ICLEI Africa Secretariat); Mr. Takunda Mambo (ICLEI Africa Secretariat); Ms. Rebecca Cameron
(ICLEI Africa Secretariat); Mr. Rohit Sen (ICLEI World Secretariat); Mr. William Okoyo (County government
of Kisumu); and other members of the Kisumu County 100%RE project implementation team.
Acknowledgements
This report was produced as part of the project 100% Renewables Cities and Regions Roadmap, or 100%RE
for short, implemented by ICLEI and funded by the International Climate Initiative (IKI) of the Federal
Ministry for the Environment, Nature Conservation and Nuclear Safety (BMU) of Germany.
The authors would like to thank the stakeholders from the 100% RE project implementation team of
Kisumu County, representatives from the Ministry of Energy, (especially Mr. Edwin Omwenga and Eng. Kiva
Isaac), REREC, KPLC, EPRA, and others. All opinions expressed, as well as any omissions or potential errors
are the responsibility of the authors alone.

ii
EXECUTIVE SUMMARY
The 100% RE Cities and Networks Roadmap project (100% RE) started in May 2019 and is being implemented in Kenya, Indonesia and Argentina by ICLEI. The project is funded by the International Climate Initiative (IKI) of Germany’s Federal Ministry for the Environment, Nature Conservation and Nuclear Safety (BMU). The project’s aim is to:
• Support cities and regions to effectively implement local climate action, by developing a roadmap towards 100% RE;
• Contribute to national climate and energy targets of the Nationally Determined Contributions (NDCs); and
• Support the achievement of policy objectives including enhanced energy security, improved energy efficiency and job creation.
In Kenya, the project is implemented in three counties: Kisumu, Nakuru and Mombasa counties, with Kisumu as the focal county and Nakuru and Mombasa as network counties. This report is compiled as part of the 100% RE project, to inform the project team and stakeholders about the existing renewable energy projects and policies in Kisumu County, as well as the potential for various renewable energy technologies that can be rolled out in the county. The first chapter of this report provides an overview of Kisumu County, focusing on its climate, economy, demographic features, environmental challenges and energy access rates. The chapter provides context of the county’s situation while highlighting the aims and objectives of the 100% RE project. The second chapter provides a deep-dive into the energy generation and consumption sectors in Kenya, with a special focus on Kisumu County, while looking at electricity and fuel price trends as well as GHG emissions. Chapter 3 follows with an analysis of the policy and regulatory framework at both national and local level, and highlights key players in the country’s energy sector. Chapter 4 captures the RE generation potential of Kisumu County, comparing it to national generation capacity. It also identifies some current and future renewable energy projects in the county. Kisumu County’s energy access and RE targets are captured in Chapter 5. Chapter 6 highlights current and future energy projects in the county, as well as applicable business and ownership models in the energy sector. Finally, Chapter 7 identifies enablers and barriers to the transition to total reliance on renewable energy in Kisumu County, and proposes recommendations for the county to consider.

iii
CONTENTS Executive summary ........................................................................................................................... ii
List of tables ..................................................................................................................................... v
List of figures .................................................................................................................................... v
List of acronyms .............................................................................................................................. vi
1. INTRODUCTION ......................................................................................................................... 1
1.1. Aim and objectives ...................................................................................................................... 1
1.2. County overview ......................................................................................................................... 1
1.2.1. Population .............................................................................................................................................. 1
1.2.2. Geography ............................................................................................................................................... 2
1.2.3. Economy .................................................................................................................................................. 2
1.2.4. Current environmental challenges ............................................................................................... 3
2. ENERGY PROFILE OF KISUMU COUNTY ..................................................................................... 5
2.1. Electricity/energy mix for installed generation capacity ........................................................ 5
2.1.1. National level ................................................................................................................. 5
2.1.2. Kisumu County level...................................................................................................... 6
2.2. Energy consumption ................................................................................................................... 6
2.2.1. Electricity ....................................................................................................................... 6
2.2.2. Heating and cooling ....................................................................................................... 8
2.2.3. Cooking ........................................................................................................................... 8
2.2.4. Transport ....................................................................................................................... 9
2.3. Actors in the electricity sector ................................................................................................. 10
2.4. Electricity and fuel prices in Kenya ......................................................................................... 11
2.4.1. Electricity prices .......................................................................................................... 11
2.4.2. Fuel prices .................................................................................................................... 14
2.5. GHG emission profiles and trends ........................................................................................... 14
2.5.1. National level ............................................................................................................... 14
2.5.2. Kisumu County level.................................................................................................... 15
3. REGULATORY, POLICY AND LEGAL FRAMEWORKS FOR RENEWABLE ENERGY ....................... 16
3.1. National level ............................................................................................................................. 16
3.2. Kisumu County level ................................................................................................................. 18
3.3. Roles and responsibilities of the national and county government in the energy sector ... 19
3.4. Renewable energy project approval process .......................................................................... 21

iv
3.4.1. Feed-in tariff policy ..................................................................................................... 23
4. KISUMU COUNTY RENEWABLE ENERGY RESOURCE POTENTIAL ............................................ 24
4.1. National level ............................................................................................................................. 24
4.2. Kisumu County level ................................................................................................................. 24
4.2.1. Solar energy ................................................................................................................. 25
4.2.2. Wind energy ................................................................................................................. 26
4.2.3. Biomass ........................................................................................................................ 26
4.2.4. Hydropower ................................................................................................................. 26
4.2.5. Geothermal energy ...................................................................................................... 26
5. LOCAL RENEWABLE ENERGY AND ENERGY EFFICIENCY TARGETS AND COMMITMENTS IN
KISUMU COUNTY ............................................................................................................................ 27
5.1. Objectives and targets in the county’s draft Sustainable Energy Policy ............................... 27
5.2. Programmes and targets in the Kisumu CIDP II ..................................................................... 28
5.2.1. Renewable Energy for Sustainable Development ..................................................... 28
5.2.2. Energy Production and Audit ..................................................................................... 29
5.2.3. Energy Services and Prospecting ............................................................................... 29
6. CURRENT AND FUTURE RENEWABLE ENERGY AND ENERGY EFFICIENCY PROJECTS .............. 29
6.1. Current and future energy projects in Kisumu County .......................................................... 29
6.2. Business models ........................................................................................................................ 31
6.2.1. Public Private Partnerships (PPPs)............................................................................ 32
6.2.2. Power Purchase Agreements (PPAs) ......................................................................... 32
6.2.3. Pay-As-You-Go (PAYG) ................................................................................................ 33
6.2.4. Feed-in Tariff (FiT) ...................................................................................................... 33
6.3. Ownership model of renewable energy .................................................................................. 33
6.3.1. Asset shareholding in PPP .......................................................................................... 34
6.3.2. Purely public asset ...................................................................................................... 34
6.4. Financial structures .................................................................................................................. 34
6.4.1 Private sector finance in Kenya
6.4.2 Access to finance in Kenya
7. CONCLUSION AND RECOMMENDATIONS ................................................................................. 37
7.1. Enablers and barriers ............................................................................................................... 37
7.2. Recommendations .................................................................................................................... 39
Appendices ..................................................................................................................................... 41
REFERENCES ................................................................................................................................... 44

v
LIST OF TABLES
Table 1: Kisumu County: A snapshot ................................................................................................... 3 Table 2.1: Power generation mix in Kenya (2017/2018) .................................................................. 5 Table 2.2: Electricity generation plants in Kisumu County ................................................................ 6 Table 2.3: Electricity consumption in Kisumu County (2018) .......................................................... 8 Table 2.4: Actors in Kenya’s power landscape, relevant to Kisumu County...................................10 Table 2.5: Approved electricity retail tariffs for control period (2018/2019) ..............................12 Table 2.6: Off-peak periods for electricity prices in Kenya ..............................................................13 Table 2.7: Kisumu County’s GHG emissions for energy-related sectors in 2015 ...........................15 Table 2.8: GHG emission reduction targets in Kisumu County ........................................................16 Table 3.1: National policy, legislation and strategy relevant to RE in Kisumu County ..................16 Table 3.2: Energy policy of the Kisumu County government...........................................................18 Table 3.3: Roles of national and county government in Kenya’s energy structure .......................19 Table 3.4: Licences and other clearances to be obtained .................................................................22 Table 3.5: Feed-in tariff values for RE projects below 10MW .........................................................23 Table 3.6: Feed-in tariff values for RE projects above 10MW .........................................................23 Table 4.1: RE potential in Kisumu County based on findings from master's thesis Table 4.2: Solar energy generation potential in Kisumu County (2015) ........................................26 Table 5.1: Policy objectives and targets for promoting SE4All goals of Kenya at county level .....27 Table 5.2: Targets and key performance indicators for RE and sustainable development in Kisumu County ....................................................................................................................................28 Table 5.3: Key performance indicators and targets for energy production and audit in Kisumu County ..................................................................................................................................................29 Table 5.4: Targets and key performance indicators of energy services and prospecting .............29 Table 6.1: Summary of current and future energy projects in kisumu county ..............................30 Table 6.2: Summary of selected investors in Kenya .........................................................................36
LIST OF FIGURES Figure 1: Kisumu County’s location in Kenya ....................................................................................................... 2 Figure 2.1: Access to electricity and clean cooking: globally, in sub-Saharan Africa, and Kenya .... 7 Figure 2.2: Percentage distribution of conventional households by lighting fuel type (2019) ....... 7 Figure 2.3: Percentage distribution of conventional households by cooking fuel type (2019) ....... 9 Figure 2.4: Motor vehicles registered in Kenya (2007 to 2018) ................................................................ 10 Figure 2.5: Kenya’s electricity prices by tariff (November 2013 to March 2020) .............................. 13 Figure 2.6: Fixed-charge trends per tariff group (2013 to 2020) ............................................................. 13 Figure 2.7: Fuel price trends in Nairobi, Kenya since 2010 ......................................................................... 14 Figure 2.8: Updated emissions projection for Kenya (November 2016) ............................................... 15 Figure 3.1: Start-up procedures for RE generation ........................................................................................ 22 Figure 4.1: Summary of Kenya’s RE potential (2020) .................................................................................... 24

vi
LIST OF ACRONYMS AECF Africa Enterprise Challenge Fund
BAU Business as usual
CGK County Government of Kenya
CIDP County Integrated Development Plan
CSA Climate Smart Agriculture
DFID Department for International Development
EEP Energy and Environment Partnership
EEPCo Ethiopian Electric Power Corporation
EPP Emergency Power Producer
EPRA Energy and Petroleum Regulatory Authority
GDC Geothermal Development Company
GHG Greenhouse Gas
GHI Global Horizontal Irradiance
IPP Independent Power Producer
KenGen Kenya Electricity Generating Company
KETRACO Kenya Electricity Transmission Company
KNBS Kenya National Bureau of Statistics
KPLC Kenya Power and Lighting Company
LPG Liquified Petroleum Gas
MOE Ministry of Energy
NREL National Renewable Energy Laboratory
PAYG Pay As You Go
PPA Power Purchase Agreement
PPP Public Private Partnership
REP Rural Electrification Programme
RERAC Renewable Energy Resource Advisory Committee
REREC Rural Electrification and Renewable Energy Corporation
SACCOS Savings and Credit Cooperative Societies
TANESCO Tanzania Electric Supply Company Limited
UETCL Uganda Electricity Transmission Company Limited
UNFCCC United Nations Framework Convention on Climate Change

1. INTRODUCTION The 100% RE Cities and Network Roadmap project started in May 2019 and is being implemented in Kenya, Indonesia and Argentina by ICLEI. The project is funded by the International Climate Initiative (IKI) of Germany’s Federal Ministry for the Environment, Nature Conservation and Nuclear Safety (BMU). The project aims to:
• Support cities and regions to effectively implement local climate action, by developing a roadmap towards 100% RE;
• Contribute to national climate and energy targets of the Nationally Determined Contributions (NDCs); and
• Support the achievement of policy objectives including enhanced energy security, improved energy efficiency and job creation.
In Kenya, the project is implemented in three counties: Kisumu, Nakuru and Mombasa, with Kisumu as the focal county and Nakuru and Mombasa as network counties. This report is compiled as part of the 100% RE project, to inform the project team and stakeholders about the existing renewable energy projects and policies in Kisumu County, as well as the potential for various renewable energy technologies that can be rolled out in the county.
1.1. AIM AND OBJECTIVES
The purpose of this report is to provide insight into the policies, structures and stakeholders within the energy sector of Kisumu County, and to create a baseline for the county’s current energy scenario.
This report therefore examines the following areas:
● The renewable energy status and renewable energy projects under the ownership and/or supervision of the County Government of Kisumu;
● The policy, legal and institutional framework of Kisumu County with respect to the development of renewable energy projects;
● The sources, processes and availability of funding mechanisms to the renewable energy sector in the county; and
● The potential limitations and opportunities of a transition towards 100% RE in Kisumu County.
1.2. COUNTY OVERVIEW Kisumu County is one of the forty-seven (47) counties created through the devolved system of governance by the Constitution of Kenya 2010, delineated as county number 42. This section presents a general overview of Kisumu County, including its population, geography, economy and current environmental challenges.
1.2.1. Population The county’s population in 2019 totalled approximately 1,155,574 people, with about 49% male and 51% female. The most densely populated sub-county in 2019 was Kisumu Central, with 4,737 people per km2, while the Muhoroni sub-county was the least densely populated, with 234 people per km2. By

the end of 2022, it is projected that Kisumu Central’s population density will be 7,244 people per km2 while Muhoroni’s will grow to 306 people per km2.
1.2.2. Geography Kisumu County lies to the west of Kenya, between longitudes 33020’ East and 350 20’ East and latitude 00 20’ South and 00 50’ South (see Figure 1.1 below). The county is one of five that border Lake Victoria.
FIGURE 1: KISUMU COUNTY’S LOCATION IN KENYA
1.2.3. Economy Kisumu County serves as the main commercial and transport hub for the western part of Kenya and the East African region. The major economic activities taking place in the county include subsistence farming, livestock keeping, fishing, rice farming, sugar cane farming, and small-scale trading.1 The county’s economy is mainly composed of micro, small and medium entrepreneurs (SMEs). These SMEs are however faced with a range of challenges, amongst which are the inability of small firms to enjoy economies of scale; limited access to credit facilities; a small talent pool and inadequate marketing structures/infrastructure.2 Industrial activities also contribute to the economic growth of the county. Kisumu County has three state-owned sugar mills: Chemelil, Muhoroni and Miwani. It also has one privately-owned called Kibos. Kisumu County is also the base for Kenya Breweries, which provides an opportunity for sorghum farmers to invest in sorghum production to sustain industry demand. The county also hosts Equator bottlers, which processes, bottles, sells and distributes Coca Cola products in the entire western region. Ballast manufacturers, paint-producing plants, and steel and cement factories are also among the industries in the county. Together these industries present a major need to improve energy access in the county, particularly from renewable sources. 1 Infotrak. 2015. Kisumu County. Available http://countytrak.infotrakresearch.com/kisumu-county/ 2 County Government of Kisumu. 2018. Kisumu County Integrated Development Plan II (2018 – 2022). Available https://www.kisumu.go.ke/wp-content/uploads/2018/11/Kisumu-CIDP.pdf

Under the second medium-term plan (MTP II) of Kenya Vision 2030, Kisumu County was intended to benefit from the following projects:
• Development of Special Economic Zones (SEZs): Consultations to identify suitable land for the proposed Kisumu SEZ are almost complete.
• Development of Small and Medium Enterprise (SME) Parks: The development of master plans and structural designs for Nairobi, Nakuru, Mombasa, Eldoret and Kisumu as per the CIDP II (2018).3
1.2.4. Current environmental challenges Climate change poses significant environmental challenges for Kisumu County as evidenced by the frequent floods, droughts and water shortages that even affect power supply. Poor drainage systems and solid waste management are also environmental challenges.4 The main human activities contributing to environmental degradation in the county include unsustainable land use practices, poor soil and water management practices, deforestation, overgrazing and pollution. Air and noise pollution are also challenges, mainly derived from the industrial sector. In addition to these challenges, many sectoral policies and laws are not in harmony with each other and with the Constitution. These include policies and laws concerning agriculture, land, water, forestry, trade and industry, which have significant implications for the environment. Furthermore, the weak enforcement of laws and policies remains a major issue of concern in the county.5 Table 1 presents a snapshot of the geography, demographics, government, economy, and access to energy status of Kisumu County. TABLE 1: KISUMU COUNTY: A SNAPSHOT
Sector Description
Geography
Location: The county borders Vihiga County to the northwest, Nandi County to the northeast, Kericho County to the east, Nyamira to the south, Homa Bay to the south and Siaya to the west.6
Climate/Weather: Tropical climate; mean annual temperature of 23oC with maximum temperature ranges between 25oC and 35oC and annual minimum temperature ranges between 16oC and 18oC. Average annual rainfall varies from 1000 to 1800 mm during the long rains (March to May) and 450 to 600 mm during the short rains (September to November).7
3 County Government of Kisumu, 2018. 4 Ibid. 5County Government of Kisumu. 2019a. Kisumu County Environment Policy 2019. Available https://bit.ly/2WbVovv
6 County Government of Kisumu, 2018. 7 Ibid

Land area (2019) 2085 km2, compared to a national land area of 580,895.4 km2
Demographics
Population (2019) The county has a population of 1,155,574, (51% female and 49% male), compared to a national population of 47,564,296.8
Household size (2019) 3.8 people per household in the county, compared to a national average of 3.9.9
Population density (2019)
554 people per km2 in Kisumu county, compared to 82 people per km2 in Kenya.
Number of households (2019)
300,745 with a mean household size of 3.8 10 , compared to 12143,913 households nationally.
Government
County capital: Kisumu City
Number of sub-counties and wards
7 sub-counties (Kisumu East, Kisumu West, Kisumu Central, Muhoroni, Nyando, Seme and Nyakach) and 35 wards (see Annex A for details.)
Economy
Resources: Agricultural land, fisheries, water and industry
Tourist attractions: Lake Victoria, Impala Park, Kisumu Museum, Kit Mikayi Cultural Centre, Ndere Island National Park, Luanda Magere cultural site, Okore Kogonda, and Songhor pre-historic site.
Financial services: The county hosts a branch of the Central Bank of Kenya and is served with 33 commercial bank branches, many microfinance institutions, agency banking services and Sacco’s.
Main economic activities/industries:
Dominant primary-sector economy: Subsistence farming, livestock keeping, fishing, rice farming, sugar cane farming, and small-scale trading. There is also quarrying and sand harvesting, sugar processing, cement, ballast and lime production, food processing, bottling, amongst others.
Main infrastructure Kisumu International Airport
Access to energy
Grid electrification rate (2019)
52.6%
Electricity consumption 250.3 GWh as at 2015.11
Energy for cooking (2019)
The use of firewood, charcoal and paraffin for cooking is prevalent in the county at 49.6%, 22.2% and 7.8% respectively.
8 Kenya National Bureau of Statistics. 2019b. Kenya Population and Housing Census, Vol II: Distribution of Population by Administrative Units. Available https://bit.ly/3nLcE6f 9 Kenya National Bureau of Statistics. 2020. Kenya Economic Survey. Nairobi: Kenya. Available https://bit.ly/30YCjyq 10 Kenya National Bureau of Statistics. 2019a. Kenya Population and Housing Census Volume 1: Population by County and Sub-county. Available https://bit.ly/33Rhyql 11 County Government of Kisumu, 2018.

Total number of customers supplied by utility grid (2020)
235,287 customers
Total number of streetlights (March 2020)
458 street lights, with a consumption of 282.01 MWh
Total utility scale installed power generation capacity (2020)
• Hydro: Sondu Mirui (60 MW), Sango’ro (21 MW) • Thermal: Muhoroni GT1 (28 MW), Muhoroni GT2 (28 MW) • Biomass from sugar factories (own consumption), 21 MW
2. ENERGY PROFILE OF KISUMU COUNTY
2.1. ELECTRICITY/ENERGY MIX FOR INSTALLED GENERATION CAPACITY
2.1.1. National level The current status of renewable energy in Kenya’s electricity generation stands at 93%, contributed mainly by a mix of solar, wind, hydro and geothermal energy.12 The national power generation entity in Kenya, KenGen, owns approximately 74% of the electricity generation capacity, with Independent Power Producers (IPPs) owning about 26%. Other entities such as the Emergency Power Producers (EPPs) and the Rural Electrification Programme (REP, Government of Kenya) own a smaller proportion of the generation capacity. A fraction of the electrical energy in the country also comes from imports (from UETCL, TANESCO, and EEPCO). There is regular importation and exportation of electrical energy as well. Table 2.1 presents the actors in Kenya’s utility-scale electricity generation sector and their corresponding contributions to the energy mix.
TABLE 2.1: POWER GENERATION MIX IN KENYA (2017/2018)13
Source (GWh)
Hydropower Wind Solar Geothermal
Thermal Total
KenGen 3,186 47.5 0 3,868 888 7,989 IPPs - - - 2495 2,495 REP* 0 0.124 0.0 0 46.9 47 EPP 0 Imports 171 SYSTEM TOTAL 10,702
The country is also host to the first and largest grid-connected biogas plant in Africa. The Gorge Farm Energy Park in Naivasha produces 2 megawatts (MW) of electricity, using part of its generation in the farm and feeding the surplus to the utility grid, through a PPA that was signed in 2016.14 The biogas
12 Africa Oil and Power. 2020. Invest in the Energy Sector of Kenya: Kenya Special Report. Africa Energy series. Available https://bit.ly/34UMUeK 13 Kenya Power and Lighting Company. 2018. Annual report and financial statement for the year ended 30th June 2018. Available https://bit.ly/313r6g1 14 Kamadi, G. 2017. Africa’s first connected biogas plant powers up. Thomson Reuters Foundation. Available https://reut.rs/33SZOus

produced is burned in two engines, producing both electricity and heat. A detailed table showing all the power plants owned by each generating entity, the type of power plant and its generation capacity in 2018 in Kenya is found in Appendix B of this report.
2.1.2. Kisumu County level The main sources of RE that have been exploited in the county for electricity generation are hydropower and biomass. The power plants in Kisumu County are mostly owned by KenGen, which owns both hydro and thermal power generation plants in the county.15 This is shown in Table 2.2 below. The power generated from the power plants is fed into the main national utility grid operated by Kenya Power (KPLC). Three sugar factories in the county also use biomass (bagasse) for their own electricity generation with a combined installed capacity of 21 MW.16 It is also worth noting that Agrekko was decommissioned in 2016, and replaced by the Muhoroni Gas Turbines.
TABLE 2.2: ELECTRICITY GENERATION PLANTS IN KISUMU COUNTY17
Plant name
Plant type
Owner Installed capacity (MW)
Effective capacity (MW)
Electricity generation (GWh) 2013/14 2014/15 2015/16 2016/17 2017/18
Sondu Miriu
Hydro KenGen 60 60 351 376 419 282 388
Sango’ro Hydro KenGen 21 20 109 125 140 90 129 Muhoroni gas turbine
Thermal KenGen 30 28 - - - 108 65.5
Aggreko Thermal EPP - - 94 63 50 - - 3 sugar factories (Chemelil, Muhoroni, Miwani)
Bagasse - 21 - - - 82.3 (2015)18
- -
2.2. ENERGY CONSUMPTION
2.2.1. Electricity Kenya is amongst the top 20 countries with the largest electricity access deficit in the world, with a recorded 13 million people without access to electricity in 2018. With an electrification rate of 75% in 2018, the country has however been exemplary as amongst the top 3 countries with an annualised 7.5% increase in electrification between 2010 and 2018.19 Access to clean cooking in the country is however still a challenge as it falls below the global and regional averages, as illustrated in Figure 2.1.
15 KenGen. N.d. Sondu Miriu Power Station. Website accessed December 2019. Available https://bit.ly/3apQBei. 16 County Government of Kisumu. 2016. Draft Sustainable Energy Policy 2016. 17 Kenya Power and Lighting Company Limited, 2018. 18 County Government of Kisumu, 2016. 19 IEA, IRENA, UNSD, World Bank, WHO. 2020. Tracking SDG 7: The Energy Progress Report. World Bank, Washington DC.
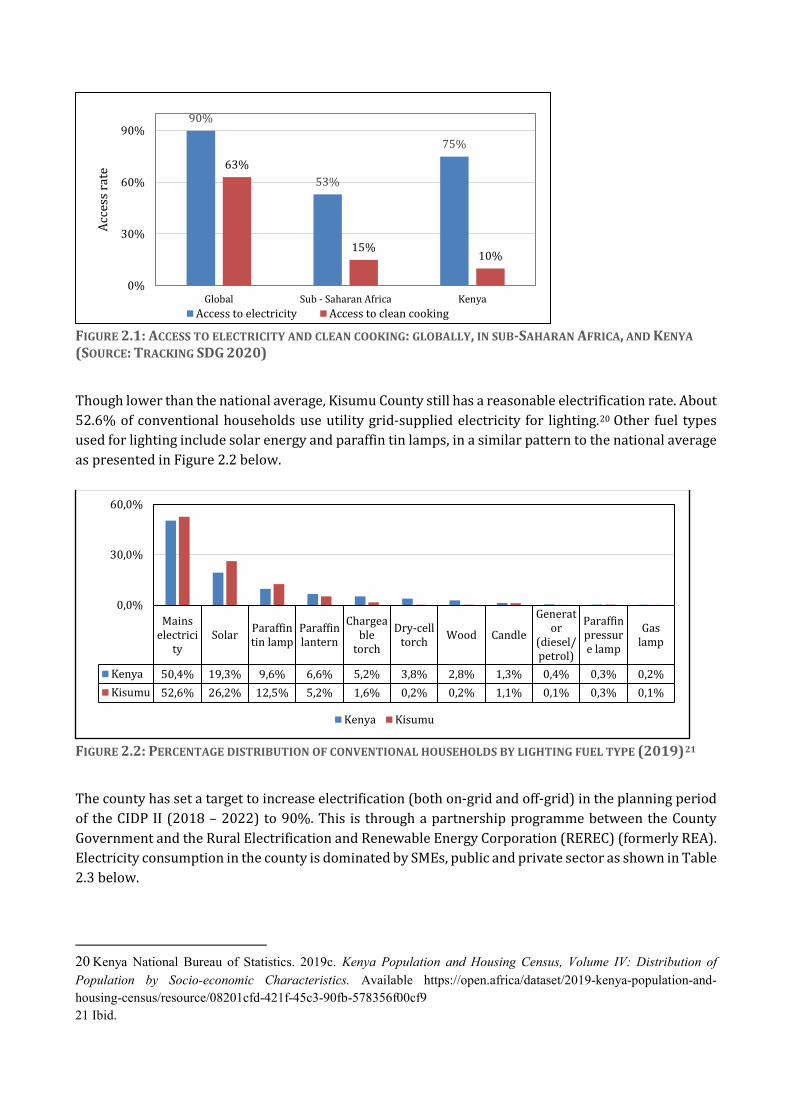
FIGURE 2.1: ACCESS TO ELECTRICITY AND CLEAN COOKING: GLOBALLY, IN SUB-SAHARAN AFRICA, AND KENYA (SOURCE: TRACKING SDG 2020)
Though lower than the national average, Kisumu County still has a reasonable electrification rate. About 52.6% of conventional households use utility grid-supplied electricity for lighting.20 Other fuel types used for lighting include solar energy and paraffin tin lamps, in a similar pattern to the national average as presented in Figure 2.2 below.
FIGURE 2.2: PERCENTAGE DISTRIBUTION OF CONVENTIONAL HOUSEHOLDS BY LIGHTING FUEL TYPE (2019)21
The county has set a target to increase electrification (both on-grid and off-grid) in the planning period of the CIDP II (2018 – 2022) to 90%. This is through a partnership programme between the County Government and the Rural Electrification and Renewable Energy Corporation (REREC) (formerly REA). Electricity consumption in the county is dominated by SMEs, public and private sector as shown in Table 2.3 below.
20 Kenya National Bureau of Statistics. 2019c. Kenya Population and Housing Census, Volume IV: Distribution of Population by Socio-economic Characteristics. Available https://open.africa/dataset/2019-kenya-population-and-housing-census/resource/08201cfd-421f-45c3-90fb-578356f00cf9 21 Ibid.
90%
53%
75%
63%
15%10%
0%
30%
60%
90%
Global Sub - Saharan Africa Kenya
Acce
ss ra
te
Access to electricity Access to clean cooking
Mainselectrici
tySolar Paraffin
tin lampParaffinlantern
Chargeable
torch
Dry-celltorch Wood Candle
Generator
(diesel/petrol)
Paraffinpressure lamp
Gaslamp
Kenya 50,4% 19,3% 9,6% 6,6% 5,2% 3,8% 2,8% 1,3% 0,4% 0,3% 0,2%Kisumu 52,6% 26,2% 12,5% 5,2% 1,6% 0,2% 0,2% 1,1% 0,1% 0,3% 0,1%
0,0%
30,0%
60,0%
Kenya Kisumu

TABLE 2.1: ELECTRICITY CONSUMPTION IN KISUMU COUNTY (2018)
Consumer category Number of consumers per category
Annual energy consumption per category (GWh)
Consumption as a percentage of total consumption in county (%)
Households 116,332 9.5 5.8
SMEs (small commercial) 594,904 48.4 29.5 Private sector within top 100 consumers 55 55.3 33.7
Public sector within top 100 consumers 15 8.3 5.0
F9 (company installations) 461 0 0.0 Street lighting 86 0.1 0.1 Other public and private sector consumers 111,857 42.5 25.9
Subtotal supplied by KPLC 823,710 164.1 100 Sugar industry’s own generation in Kisumu County Sugar industry’s own generation 3 86.2 52.522 Approximated total 823,713 250.3 152.5
(Source: KPLC, 2018) As of February 2020, the county’s electricity peak demand stood at 1,926 MW, with a total of 235,287 customers connected to the utility grid. This is in addition to a total of about 458 street lights, amounting to a capacity of 282.1 MW for street lighting.23
2.2.2. Heating and cooling Generally, there is less need for household heating and air conditioning in Kisumu County due to its tropical climate. Therefore, the energy consumed for heating from wood fuel, fuel oil, agricultural residues and other oil products is negligible.24
2.2.3. Cooking Like many sub-Saharan countries, Kenya relies largely on biomass for cooking. As of 2019, the main fuels used for cooking in Kenya were firewood, liquefied petroleum gas (LPG) and charcoal, which stood at 55.1%, 23.9% and 11.6% respectively. This means more effort needs to be put into this sector for the country to meet SDG 7.2 of reaching universal access to clean cooking.25
This trend is similar in Kisumu County. As per the 2019 national census, the main fuels used for cooking were firewood, charcoal and paraffin, at 49.6%, 22.2%, and 7.8% respectively. The use of LPG in the county also stood out at 18.7%. This shows a slight improvement from 2015 statistics, where the use of firewood, charcoal and paraffin for cooking were 58.2%, 29.3% and 7.1% respectively.26 The percentage
22 Considering KPLS’s distribution in the county and the sugar industry generation, the sugar industry consumes 52.5% of the total electrical energy available in the county. 23 Kinyanjui, B. 2020. Kenya Power and Lighting Company Limited: Interview and email exchange with author. August 2020. 24 County Government of Kisumu, 2018. 25 Kenya National Bureau of Statistics, 2019c. 26 Ibid.

distribution of conventional households according to the main fuels used for cooking in 2019, both at national and county level, are illustrated in Figure 2.3 below.
FIGURE 2.3: PERCENTAGE DISTRIBUTION OF CONVENTIONAL HOUSEHOLDS BY COOKING FUEL TYPE (2019)
An estimated 14,300 premature deaths were reported to have occurred in Kenya in 2010 as a result of indoor pollutants resulting from cooking with traditional stoves.27 With a significant percentage of the population already having access to electricity in Kenya, and with over 93% contribution of RE to the total electricity generation mix in the country, a special focus needs to be paid to increasing the uptake of clean cooking solutions, both at national and county levels. This will also contribute to meeting the NDC targets of reducing emissions in the country to 30% compared to the business-as-usual (BAU) scenario in Kenya, as well as the SDG 7.2 of universal access to clean cooking.
2.2.4. Transport The Kisumu Transport Bill 2019 28 provides information on matters relating to traffic, street lights, county roads, public transport roads, light rail, and the establishment of the county inspectorate for transport. There are 1,678 registered vehicles within Kisumu County, belonging to 29 SACCOs.29 Data on the number of vehicles owned by each SACCO can be found in Appendix C. Figure 2.4 is an illustration of the number of registered vehicles in Kenya between 2007 and 2018. In the draft Kisumu County Sustainable Energy Policy, the county’s emissions from the transport sector were estimated to be 2.74% in comparison to the total in Kenya, based on a weighted average percentage of vehicles in the county. Hence, emissions from the transport sector of Kisumu were 0.2MtCO2e based on the projections of the NCCAP in 2015.30
27 Dubey S, Adovor E, Rysankova D, Portale E, and Koo B. 2019. Beyond Connections: Access to electricity and clean cooking in Kenya based on the multitier framework survey and data analysis. Available https://bit.ly/3jNL0D4 28 County Government of Kisumu. 2019b. The Kisumu County Transport Bill, 2019. Available https://bit.ly/375wpPI 29 National Transport and Safety Authority. 2020. Email correspondence with Mr William Okoyo, October 2020 30 County Government of Kisumu, 2016.
Firewood Gas (LPG) Charcoal Paraffin Electricity Biogas SolarKenya 55,1% 23,9% 11,6% 7,8% 0,9% 0,5% 0,2%Kisumu 49,6% 18,7% 22,2% 7,8% 0,9% 0,6% 0,2%
0,0%
20,0%
40,0%
60,0%
Kenya Kisumu

FIGURE 2.4: MOTOR VEHICLES REGISTERED IN KENYA (2007 TO 2018)31
2.3. ACTORS IN THE ELECTRICITY SECTOR
Kenya’s electricity subsector is unbundled into generation, transmission, distribution and retail. The Ministry of Energy (MoE) is in charge of policy formulation, while the Energy and Petroleum Regulatory Authority (EPRA) is in charge of technical and economic regulation of the energy sector. Electricity generation, transmission and distribution in Kisumu County is dominated by actors operating at the national level. These entities and their roles in the electricity sector as per the Energy Act, 2019 have been summarised in Table 2.4 below.32 TABLE 2.2: ACTORS IN KENYA’S POWER LANDSCAPE, RELEVANT TO KISUMU COUNTY
Entity Role Generation Kenya Electricity Generating Company (KenGen)
The company accounts for about 75% of installed capacity from various power generation sources that include hydropower, thermal, geothermal and wind. 33 Four of its generating plants are located in Kisumu County: Sondu Miriu and Sang’oro (owned by KenGen) which contribute 60 MW and 20.2 MW respectively to the national grid 34 and two small thermal power plants in Muhoroni.
Geothermal Development Company
A fully-owned government Special Purpose Vehicle (SPV) intended to undertake surface exploration of geothermal fields, as well as undertake exploratory appraisal and production, including drilling, developing and managing proven steam fields and entering into steam sales agreements with investors.
Independent Power Producers (IPPs)
Private investors in the power sector involved in generation under the FiT Policy. Collectively, they account for about 26% of the country’s installed capacity from thermal, geothermal and bagasse. None of the 12 IPP plants were found to be in Kisumu County.
Distribution
31 CEIC. 2019. Kenya Motor Vehicles sales. Available https://bit.ly/33OSJeG 32 Government of Kenya. 2019. The Energy Act 2019. Nairobi: Kenya. Available https://bit.ly/33ilzlA 33 Republic of Kenya. 2018. Updated Least Cost Power Development Plan: Study period: 2017-2037. Available https://bit.ly/2Up04wR 34 KenGen, 2019.

The Kenya Power and Lighting Company (KPLC)
The KPLC is governed by the State Corporations Act and is responsible for electricity transmission and all distribution systems in Kenya. The transmission system comprises 220kV, 132kV and 66kV transmission lines. The ownership structure is such that 50.1% belongs to the National Social Security Fund (NSSF) and the GoK and private shareholders own 49.9%.
Private distribution companies
This is currently the sole mandate of the KPLC (at time of writing)35
Transmission Kenya Electricity Transmission Company (KETRACO)
100% owned by the Government of Kenya; its mandate is to plan, design, construct, own, operate and maintain new high voltage (132 kV and above) electricity transmission infrastructure that will form the backbone of the National Transmission Grid and regional inter-connections.
KPLC The KPLC is also involved in the transmission sector to a lesser extent.
Others The Energy and Petroleum Regulatory Authority (EPRA)
EPRA has regulatory control over the energy sector in Kenya, including RE. Hence, any licence, supervision of compliance with conditions of the licences, sanctions and penalties for non-compliance to requirements of RE policies in Kisumu County will be issued and enforced by EPRA.
REREC REREC is of primary importance due to its primary role of expanding rural electrification and the promotion of RE in the local population. REREC plays a central role in the legislation, research and development, and international collaborations that promote the use of RE.
RERAC RERAC is an inter-ministerial committee that advises the Cabinet Secretary for Energy and Petroleum on criteria for the allocation of renewable resources, licensing of RE resource areas, management of water towers and catchment areas, development of multi-purpose projects such as dams and reservoirs for power generation, and management and development of RE sources.
2.4 ELECTRICITY AND FUEL PRICES IN KENYA
2.4.1 Electricity prices Electricity prices in Kenya were relatively constant between 2015 and 2018. However, in 2018, electricity prices were changed twice: in July and in October. In July 2018, electricity tariffs were reviewed by the Energy Regulatory Commission (now EPRA), where it reduced the lifeline threshold from 50 kWh to 10 kWh and removed fixed charges for all customer categories. While a large section of the domestic lifeline customers, small commercial and large manufacturers enjoyed a reduction in electricity bills, some domestic ordinary customers had an increase in their bills, hence the need for the tariff review in October 2018. These tariffs are again being reviewed. The amendments and the overall electricity tariff structure in Kenya are illustrated in Table 2.5, which contains tariffs for peak demand periods.
35 Republic of Kenya, 2018.

TABLE 2.3: APPROVED ELECTRICITY RETAIL TARIFFS FOR CONTROL PERIOD (2018/2019)36
Code Customer Energy limit kWh/month
Charge method
Number of customers
Unit 1st July 2018
1st Nov. 2018
DC Domestic Fixed Ksh/month 0 0 DC1 Domestic
consumer 1 0-10 Energy 5734815 Ksh/kWh 12 10
DC1 Domestic consumer 1
11-100 Energy Ksh/kWh 15.8 10
DC2 Domestic consumer 2
>100 Energy 516,977 Ksh/kWh 15.8 15.8
SC1 Small commercial 1
0-100 Energy 177,089 Ksh/kWh 15.6 10
SC2 Small commercial 2
>100-15000
Energy 86027 Ksh/kWh 15.6 15.6
CI1 Comm./industrial
>15,000 Fixed energy demand
3,096 Ksh/month Ksh/kWh Ksh/kVA
0 12 800
0 12 800
CI2 Comm./industrial
No limit Fixed energy demand
381 Ksh/month Ksh/kWh Ksh/kVA
0 10.9 520
0 10.9 520
CI3 Comm./industrial
No limit Fixed energy demand
53 Ksh/month Ksh/kWh Ksh/kVA
0 10.5 270
0 10.5 270
C14 Comm./industrial
No limit Fixed energy demand
38 Kshs/month Ksh/kWh Ksh/kVA
10.3 220
10.3 220
C15 Comm./industrial
No limit Fixed energy demand
32 Ksh/month Ksh/kWh Ksh/kVA
0 10.1 220
0 10.1 220
SL Street lighting No limit Fixed energy 8478 Ksh/month Ksh/kWh
0 7.5
0 7.5
Source: ERC Press statement, October 2018 Electricity price trends in Kenya from 2013 to date are illustrated in Figure 2.5 below.
36 Energy Regulatory Commission. 2018. Press statement on reviewed retail electricity tariff for the 2018/2019 tariff control period, effective 1st November 2019. 31st October 2018. Available https://bit.ly/2vsO6IU.
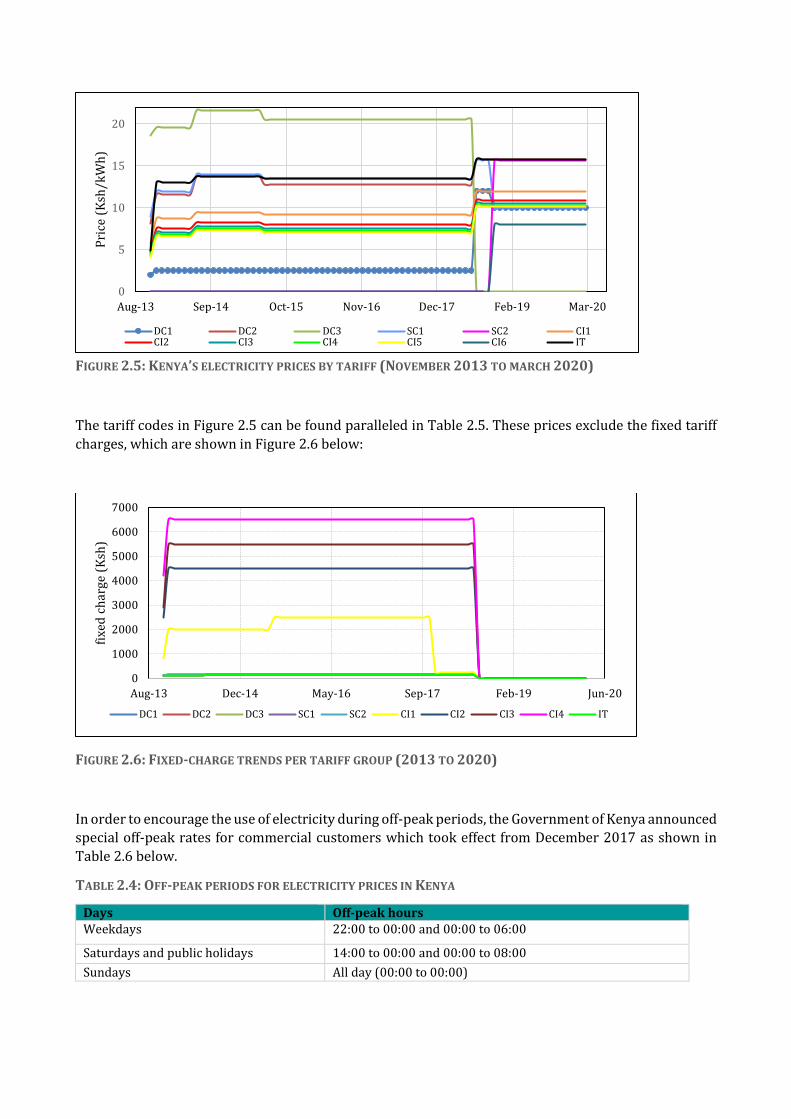
FIGURE 2.5: KENYA’S ELECTRICITY PRICES BY TARIFF (NOVEMBER 2013 TO MARCH 2020)
The tariff codes in Figure 2.5 can be found paralleled in Table 2.5. These prices exclude the fixed tariff charges, which are shown in Figure 2.6 below:
FIGURE 2.6: FIXED-CHARGE TRENDS PER TARIFF GROUP (2013 TO 2020)
In order to encourage the use of electricity during off-peak periods, the Government of Kenya announced special off-peak rates for commercial customers which took effect from December 2017 as shown in Table 2.6 below.
TABLE 2.4: OFF-PEAK PERIODS FOR ELECTRICITY PRICES IN KENYA
Days Off-peak hours Weekdays 22:00 to 00:00 and 00:00 to 06:00
Saturdays and public holidays 14:00 to 00:00 and 00:00 to 08:00 Sundays All day (00:00 to 00:00)
0
5
10
15
20
Aug-13 Sep-14 Oct-15 Nov-16 Dec-17 Feb-19 Mar-20
Pric
e (K
sh/k
Wh)
DC1 DC2 DC3 SC1 SC2 CI1CI2 CI3 CI4 CI5 CI6 IT
0
1000
2000
3000
4000
5000
6000
7000
Aug-13 Dec-14 May-16 Sep-17 Feb-19 Jun-20
fixed
cha
rge
(Ksh
)
DC1 DC2 DC3 SC1 SC2 CI1 CI2 CI3 CI4 IT

According to the tariff structure, CI1-CI5 customers operating at 100% production capacity during on-peak and off-peak hours are given a 5% discount for off-peak consumption upon satisfactory confirmation by the KPLC that their production is at 100%. This additional 5% discount is not included in the tariffs displayed above.
2.4.2 Fuel prices As in any other country, the prices of petroleum products in Kenya are subject to a number of factors, both internal and external, which results in price fluctuation. These prices are consistently updated by EPRA every 14th day of the month. Figure 2.8 illustrates fuel price trends in Nairobi since 2010, with petrol the most expensive, followed by diesel and kerosene. The price difference between Nairobi and Kisumu is minimal and follows the same trend.
FIGURE 2.77: FUEL PRICE TRENDS IN NAIROBI, KENYA SINCE 201037
2.5 GHG EMISSION PROFILES AND TRENDS
2.5.1 National level Kenya’s total GHG emissions in 2013 were 60.2 million metric tons of carbon dioxide equivalent (MtCO2e), totalling 0.13% of global GHG emissions. The agricultural sector emitted 62.8% of total emissions, followed by the energy sector (31.2%), industrial sector (4.6%) and waste sector (1.4%)38. Kenya has however made ambitious commitments to reduce its GHG emissions, and a significant part of these commitments is dependent on clean energy transitions through the use of RE sources. For instance, Kenya’s Intended Nationally Determined Contribution (INDC) commits to reducing GHG emissions by 30% (143 MtCO2e) relative to business-as-usual levels by 203039, contingent on receiving international finance, investment, technology development and transfer, and capacity-building support. The INDC notes that Kenya will build upon the National Climate Change Action Plan (NCCAP) actions
37 Bukachi, N. 2020. EPRA: Email exchange with author (August 2020) 38 Climatelinks.org. 2017. Greenhouse Gas Emissions Factsheet: Kenya. Available https://bit.ly/39TO5fV 39 Republic of Kenya, Ministry of Environment and Natural Resources. 2015. Kenya’s Intended Nationally Determined Contribution (INDC). 23rd July 2015. Available https://bit.ly/2TQ0yM9
30,00
50,00
70,00
90,00
110,00
130,00
150,00
Sep-
10
Apr-
11
Nov
-11
May
-12
Dec-
12
Jun-
13
Jan-
14
Jul-1
4
Feb-
15
Sep-
15
Mar
-16
Oct
-16
Apr-
17
Nov
-17
May
-18
Dec-
18
Jul-1
9
Jan-
20
Aug-
20
Feb-
21
Fuel
pum
p pr
ice
(Ksh
/L)
Petrol Diesel Kerosene

through (1) expansion of geothermal, solar, and wind energy production, (2) enhancement of energy and resource efficiency, (3) progress towards achieving tree cover of at least 10% of Kenya’s land area, (4) increased use of clean energy technologies to reduce overreliance on wood fuels, (5) adoption of low carbon and efficient transport, (6) use of Climate Smart Agriculture (CSA) in line with the National CSA Framework, and (7) improved waste management (such as waste recycling, landfill gas management). The GHG emission projections that were presented in Kenya’s Second National Communication to the UNFCCC report in 201540 were updated in 201741. As per the updates, the overall projection of BAU emissions in 2030 remained roughly the same at 143 MtCO2e, but there were some significant sectoral changes. Figure 2.9 below presents the November 2016 updated emission projections.
FIGURE 2.8: UPDATED EMISSIONS PROJECTION FOR KENYA (NOVEMBER 2016)
2.5.2 Kisumu County level As part of the draft Kisumu County Sustainable Energy Policy, Kisumu County level GHG emissions were estimated from the GHG emissions inventory for Kenya’s second national communication to the UNFCCC. Emissions were calculated for various sectors related to energy in the county using 2015 data, and the results are presented below in Table 2.7:
TABLE 2.5: KISUMU COUNTY’S GHG EMISSIONS FOR ENERGY-RELATED SECTORS IN 201542
Sector GJG Emissions in 2015 (MtCO2e)
% contribution to total emissions
Forestry 0.65 36.6% Agriculture 0.43 24.2% Energy demand 0.25 13.9% Electricity generation 0.11 6.4%
40 National Environment Management Authority, Government of Kenya. 2015. Second National Communication to the United Nations Framework Convention on Climate Change. Available https://bit.ly/39Qv8ed 41 Republic of Kenya, Ministry of Environment and Natural Resources. 2017. Kenya’s Nationally Determined Contribution (NDC): Update of Kenya’s Emission Baseline Projections and Impact on NDC Target Resources. Available https://bit.ly/2INnNjK 42 County Government of Kisumu, 2016.

In order to help meet Kenya’s INDC, Kisumu County set the following GHG emission reduction targets:
TABLE 2.6: GHG EMISSION REDUCTIONS TARGETS IN KISUMU COUNTY
MtCO2e 2015 2020 2030 Emissions in business-as-usual scenario 1.78 2.14 3.16 Emission reductions target in line with INDC (-30%) - 1.50 2.21
3 REGULATORY, POLICY AND LEGAL FRAMEWORKS FOR RENEWABLE ENERGY
Kenya is one of the leading countries in terms of policies, frameworks and action plans to enable an increase in energy-access rates, with a special preference for renewable energy sources. The devolved system of governance in the country, as well as the power vested in the county governments by the Energy Act 2019, gives counties more responsibility in developing energy policies and frameworks. This section of the report discusses relevant policies and regulations, as well as the roles of national and local government in the energy sector.
3.1 NATIONAL LEVEL Most of the policies influencing the renewable energy sector in Kenya are provided in or backed by the Energy Act 2019. The regulations, policies and legal frameworks in Kenya’s power and renewable energy sector have been detailed in the situational analysis report43. Hence, this section of the status report mainly focuses on the most relevant policies for achieving 100% RE in Kisumu County.
TABLE 3.1: NATIONAL POLICY, LEGISLATION AND STRATEGY RELEVANT TO RE IN KISUMU COUNTY44
Policy/strategy
Relevance
Least Cost Power Development Plan (LCPDP)
The LCPDP is a Kenyan Energy Sector Report intended to guide the power sector on the status, generation and transmission expansion opportunities, as well as resource requirements for expansion programmes. Timelines for RE project implementation in Kenya are driven by the LCPDP, not counties. For instance, all RE generation plans in Kisumu county must be included in the LCPDP and there must be harmony between county energy plans and the LCPDP.
The Energy (Mini-Grid) Regulations, 2018
Given that RE transition in Kisumu County will entail the development of mini-grids in areas far from the national grid, the regulations pertaining to this sector are quite relevant. EPRA was expected to publish the Mini-Grid Regulations and the Regulatory Impact Assessment for public comment in the second half of 2019.
43 The National Situational Analysis is one of the deliverables of the 100% RE project, focusing on enablers and barriers to increasing renewable energy roll-out at the national level. This initial status report should be read in conjunction with the National Situational Analysis. 44 USAID/Power Africa. 2019. Off-Grid Market Assessment For Kenya. Available https://bit.ly/39pIqNA

Sustainable Energy for All (SE4All) Action Agenda
Kenya opted in to the SE4All Initiative and has developed an action agenda, which is a sector-wide, long-term vision for 2015–2030. The agenda outlines how the country will achieve its SE4All goals of universal access to modern energy services, increase the rate of energy efficiency, and increase to 80% the share of RE in the energy mix by 2030.
REREC- Strategic Plan 2017–2021
This strategic plan focuses on the rolling out of RE and mini-grids in achieving REREC’s electrification targets for public facilities. The plan provides a roadmap for electrification of public facilities and nearby households. By 2020, the plan projects to electrify 28,323 public facilities, 3,787 of which will be off-grid areas electrified through solar PV.
Kenya National Electrification Strategy 2018
Off-grid solutions are a major component of the National Electrification Strategy launched in 2018. It expects to provide 2 million of the expected 5.7 million new connections required for universal electricity access by 2022 in Kenya. Hence, the least cost and most effective electrification solutions in this electrification strategy are an important consideration for Kisumu County during its transition to 100% RE.
Kenya Electricity Sector Investment Prospectus, 2018–2022
The current Kenya Electricity Sector Investment Prospectus was developed by energy sector institutions. It presents investment and financing opportunities in geothermal development, power generation, electricity transmission and distribution, off-grid electrification, and energy efficiency. This investment prospectus outlines areas for mobilisation of resources and multi-stakeholder engagement to facilitate implementation of priority projects in the electricity sector. It also presents the opportunity for increased private-sector participation across all sub-sectors through the private-public partnerships framework, feed-in tariffs, and renewable energy auctions frameworks, among other things.
Feed-in Tariff (FiT) Policy (2008) – amended 2010, 2012
The FiT Policy offers a framework for electricity generated from RE sources (specifically wind, biomass and small hydro) in order to safeguard the investments made by the respective developers in undertaking feasibility studies; and to boost the development of RE sources for electricity generation. FiTs allow power producers to sell RE generated electricity to the off-taker (KPLC) at a predetermined tariff for a given period.45 The FiTs per RE technology are detailed in the FiT policy.
The VAT Act 2018 and Finance Act 2020
The VAT Act 2013 exempted all specialised solar equipment and accessories from paying VAT. However, the Act restricts specialised equipment to only those used in the development and generation of wind and solar energy, including deep-cycle batteries which use or store solar power. The introduction of 8% VAT on petroleum products (including kerosene) in this policy amongst other measures, significantly increases the price of kerosene and may render kerosene unaffordable for the off-grid community. This may increase the demand for solar lighting devices. However, on the 30th of June 2020, the President of Kenya enacted the Finance Act, effective from July 2020, which will result in the introduction of 14% VAT on off-grid solar products that were exempted in the previous Finance Act46.
Data Protection Bill 2018
This is a relevant bill to the RE sector and particularly in the ‘towards 100% RE’ project given its extensive data needs. One provision likely to affect off-grid energy companies is the condition for transfer of data out of Kenya, which prevents employees and customer data from being transmitted or stored in another country unless that country also has similar data protection regulations.
Kenya’s Nationally
Kenya’s Nationally Determined Contributions are one of the drivers of RE developments in the country and Kisumu County. In 2015, Kenya committed to
45 Ministry of Energy. 2012. Feed-in-tariffs policy on wind, biomass, small hydro, geothermal, biogas, and solar resource generation electricity. Revision, December 2012. Available https://bit.ly/3jNIH2V 46 Republic of Kenya. 2020. The Finance Act 2020. Kenya Gazette Supplement No. 104 (Acts No. 8). Nairobi: Kenya. Available https://bit.ly/3lFu1TW

Determined Contributions
reducing its GHG emissions by 30% by 2030 relative to the BAU scenario of 143 MtCO2eq; and in line with its sustainable development agenda. This is also subject to international support in the form of finance, investment, technology development and transfer, and capacity building.47
The Public Private Partnership (PPP) Act 2013
The Kenyan Parliament enacted the Public Private Partnerships Act 2013, to provide for the participation of the private sector in the financing, construction, development, operation and maintenance of infrastructure projects of the government through concessions or other contractual arrangements. The Act also established the Public Private Partnership Unit to regulate, monitor and supervise the implementation of project agreements on infrastructure.48
Energy (Solar Photovoltaic Systems) Regulations 2012
These regulations, made under Section 110 of the Energy Act 2006, provide rules and standards for the installation of solar photovoltaic (PV) systems in Kenya. They apply to a solar PV system manufacturer, importer, vendor, technician, contractor, system owner, and to solar PV system installation and consumer devices.
Energy (Electricity Licensing) Regulations 201249
These regulations apply to any person who engages or intends to engage in the generation, transmission, distribution and supply of electrical energy in Kenyaas per the requirements of the Energy Act. 50 Under the Licensing Regulations, no permit or licence is required to generate electricity where the electricity generated does not exceed 1 MW and is generated for own consumption. A permit is however required for the generation and supply of electrical energy not exceeding 3 MW and a licence is required for generation, transmission, distribution or supply of electrical energy exceeding 3 MW.51
Kenya Electricity Grid Code52
The Kenya Electricity Grid Code is the primary technical document of the electricity supply industry (ESI), collating the majority of the technical regulations covering the generation, transmission, distribution and supply of electrical energy.53
3.2 KISUMU COUNTY LEVEL The county government of Kisumu has developed policies and strategies to ensure an increase in energy access, in line with the SE4All Kenyan Action Agenda as well as other policies as outlined in Table 3.2. TABLE 3.2: ENERGY POLICY OF THE KISUMU COUNTY GOVERNMENT
Plan/Policy Description The Kisumu County Draft Sustainable Energy Policy 2016
This policy was prepared by the County Government of Kisumu, as part of the county’s constitutional mandate to regulate energy and energy targets, in line with the targets and measures set out in the SE4All Kenya’s Action
47 Republic of Kenya, Ministry of Environment and Natural Resources, 2015. 48 Njoroge Regeru and Co. Advocates. N.d. The growing trend of Public Private Partnership in Kenya. Available https://bit.ly/3nJEnEg 49 Republic of Kenya. 2012a. The Energy (solar photovoltaic systems) Regulations, 2012. Available https://bit.ly/34Oo5RT 50 Republic of Kenya. 2012b. the Energy (Electricity Licensing) Regulations, 2012. Available https://bit.ly/34Uh8i2 51 Anjarwalla & Khanna. 2018. Electricity Regulation in Kenya. Available https://www.lexology.com/library/detail.aspx?g=a60ba402-d259-4894-a495-da0c9bf85fcb 52 Energy Regulatory Commission. 2008. Kenya Electricity Grid Code. Nairobi: Kenya. Available https://bit.ly/3lwC1GW 53 S2BIOM. 2008. Factsheet: Kenya Electricity Grid Code. Available https://s2biom.vito.be/node/2282
Agenda and other relevant policies in the country. It also contains policy interventions per objective and target in the county.
The Kisumu County Draft Energy Masterplan 2017
This masterplan details the access to electricity and access to clean cooking status of the county through a household survey that was conducted. It also points out the challenges faced by the county in increasing access to energy and proposes policy recommendations for the county. The current energy mix, energy demand and actors are also outlined in this document. The masterplan is planned to be completed in the 2020/2021 financial year.
The Kisumu County Integrated Development Plan (2018 – 2022)
As inferred from the name, this is a county development plan developed every 5 years. The current CIDP in Kisumu County is the second, valid for 2018 to 2022. This CIDP II cuts across all the county departments and is currently being reviewed.
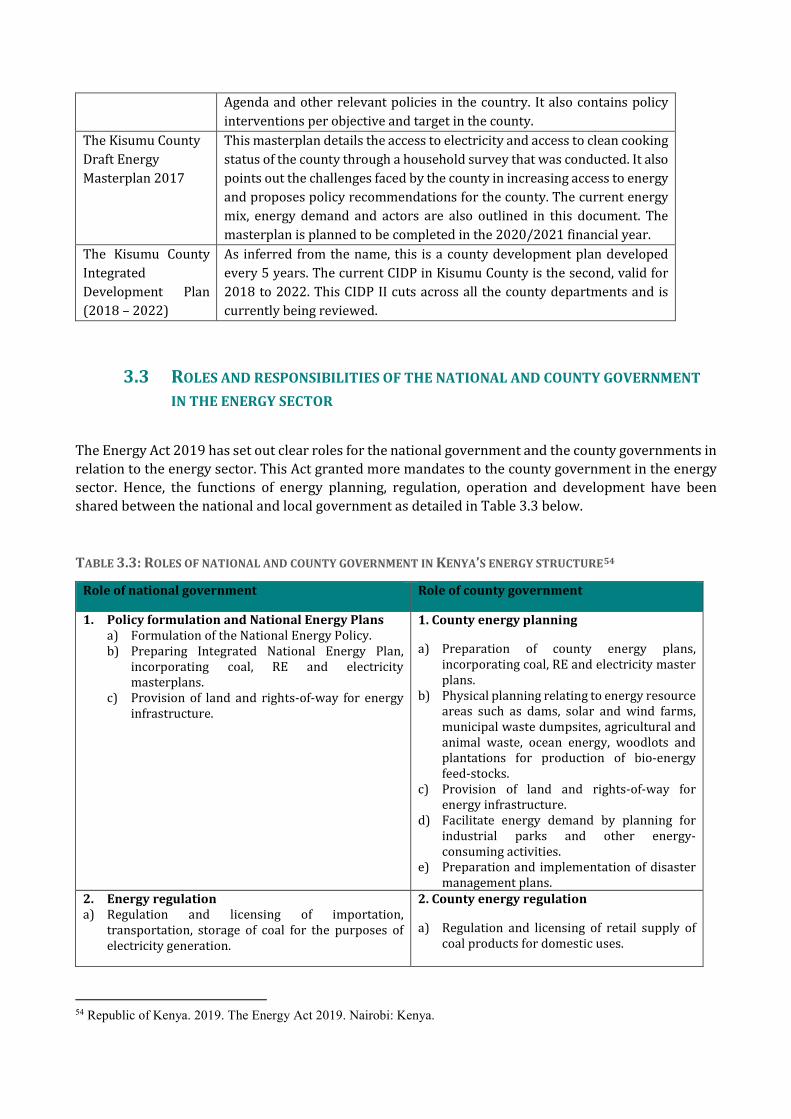
3.3 ROLES AND RESPONSIBILITIES OF THE NATIONAL AND COUNTY GOVERNMENT IN THE ENERGY SECTOR
The Energy Act 2019 has set out clear roles for the national government and the county governments in relation to the energy sector. This Act granted more mandates to the county government in the energy sector. Hence, the functions of energy planning, regulation, operation and development have been shared between the national and local government as detailed in Table 3.3 below.
TABLE 3.3: ROLES OF NATIONAL AND COUNTY GOVERNMENT IN KENYA’S ENERGY STRUCTURE54
Role of national government Role of county government
1. Policy formulation and National Energy Plans a) Formulation of the National Energy Policy. b) Preparing Integrated National Energy Plan,
incorporating coal, RE and electricity masterplans.
c) Provision of land and rights-of-way for energy infrastructure.
1. County energy planning
a) Preparation of county energy plans, incorporating coal, RE and electricity master plans.
b) Physical planning relating to energy resource areas such as dams, solar and wind farms, municipal waste dumpsites, agricultural and animal waste, ocean energy, woodlots and plantations for production of bio-energy feed-stocks.
c) Provision of land and rights-of-way for energy infrastructure.
d) Facilitate energy demand by planning for industrial parks and other energy-consuming activities.
e) Preparation and implementation of disaster management plans.
2. Energy regulation a) Regulation and licensing of importation,
transportation, storage of coal for the purposes of electricity generation.
2. County energy regulation
a) Regulation and licensing of retail supply of coal products for domestic uses.
54 Republic of Kenya. 2019. The Energy Act 2019. Nairobi: Kenya.

b) Regulation and licensing of production, conversion, distribution, supply, marketing and use of RE.
c) Regulation and licensing of generation, importation, exportation, transmission, distribution, retail and use of electrical energy.
d) Approval of energy purchase agreements as well as network service and common user facility contracts.
e) Protection of consumer, investor and other stakeholder interests.
f) Preparation and enforcement of regulations and standards.
g) Formulation of national codes for energy efficiency and conservation in buildings.
h) Issuance of energy-saving certificates to enhance energy efficiency and conservation.
i) Setting, reviewing and adjustment of energy tariffs and tariff structures.
j) Resolution of complaints and disputes between parties over any matter in the energy sector.
k) Prosecution of offences under the Energy Act
l) Certification of electrical workers and contractors, solar system installation technicians and contractors.
b) Regulation and licensing of biomass and charcoal producers, transporters and distributors.
c) Customise national codes for energy efficiency and conservation in buildings to local conditions.
d) Regulation and licensing of retail petroleum service stations.
e) Regulation and licensing of county gas reticulation systems.
f) Regulation and licensing of designated parking for petroleum tankers.
g) Regulation and licensing of biogas systems.

3. Energy operations and development
a) Generation importation and exportation of coal, geothermal and other energy based natural resources.
b) Transportation and storage of coal.
c) Generation, transmission, distribution (including reticulation) and retail of electricity.
d) Collect and maintain energy data.
e) Implementation of the rural electrification programme and management of the rural electrification programme fund.
f) Undertake feasibility studies and maintain data with a view to availing the same to developers of energy resources and infrastructure.
g) Provide technical and other capacity-building support to county governments.
h) Administration and management of the Sovereign Wealth Fund, the Consolidated Energy Fund, and the National Energy Conservation Fund.
i) Providing security for energy infrastructure including power plants, control centres, electricity supply lines and substations.
3. County energy operations and development
a) Electricity and gas reticulation.
b) Provide and maintain adequate street lighting.
c) Collect and maintain energy data.
d) Implementation of county electrification projects.
e) Undertake feasibility studies and maintain data with a view to availing the same to developers of energy resources and infrastructure.
f) Establishment of energy centres for promotion of renewable energy technologies, energy efficiency and conservation.
g) Security of energy infrastructure (power plants, control centres, electricity supply lines and substations).
h) Undertake energy efficiency and conservation measures within the county.
3.4 RENEWABLE ENERGY PROJECT APPROVAL PROCESS Despite ample availability of RE resources in Kenya and the Feed-in Tariff Policy in place, actual investment in RE remains relatively small. One of the challenges in developing investments in this sector is a lack of clear, up-to-date information about how to obtain the various licences and clearances required to construct and operate an energy project. The Renewable Energy Portal55 hosted by the EPRA website has been created to improve the dissemination of regulatory information by collecting all licence information in one place and displaying it in a simple, user-friendly format. In order to build and operate a renewable energy project in Kenya, a number of clearances need to be obtained from various stakeholders. The number of clearances to be obtained are based on the particular RE technology in question. Of the twenty-two clearances applicable to investors in the RE sector, six are sector-specific, three are general clearances related to the environment; seven are the general clearances required to open a company in Kenya, and six are related to land/leasing of the area to construct the power plant.
55 Energy and Petroleum Regulatory Authority (EPRA). N.d. The Renewable Energy Portal. Available https://renewableenergy.go.ke

Figure 3.1 below illustrates the sequence of clearances that need to be obtained by the investor. It also includes the four general land-related clearances to be obtained from the applicable local government (assuming that almost every investor has to acquire land rights and construct a power plant). The clearances also depend on the magnitude of the project.
FIGURE 3.1: START-UP PROCEDURES FOR RE GENERATION Since not all investors must obtain all twenty-two clearances, Table 3.4 below clarifies which clearance must be obtained by which investor.
TABLE 3.4: LICENCES AND OTHER CLEARANCES TO BE OBTAINED
Clearance Wind Biomass Hydro Geothermal Biogas Solar 7 clearances to establish a company
Approval for Expression of Interest
Exploration Authorisation x x x x x Civil Aviation Clearance x x x x x
EIA Licence Water Abstraction Permit x x x x
Rent Clearance Certificate
Rates Clearance Land Registration Resource Licence x x x x x
0. Establish a company
1. Approval for Expression of
Interest (MoE)
2. Exploration Authorisation (MoE)
3. Clearance (Kenya Civil Aviation
Authority)
4. Environmental Imapct Assessment
License (NEMA)
5. Water Abstraction Permit (WRMA)
6. Lease Agreement with the Kenya
Wildlife Service (park) or Kenya Forest Service (forest)
7. Rent Clearance Certificate (Land
commission)
8. Rates Clearance Certificate (Local
Government)
9. Land Registration (Ministry of Lands)
10. Resource Licence (MoE)
11. Electricity Generation Licence
12. Complete PPA with KPLC
13. Approval of PPA (EPRA)
14. Change of User (Local Government)
15. Development Permit (Local Government)

Electricity Generation Licence
PPA with KPLC Approval of PPA from EPRA
Approval of Change of Use
Development Permit Total 11 10 11 12 10 10 : needs to be obtained x : does not need to be obtained
3.4.1 Feed-in tariff policy The Power Purchase Agreement is guided by the feed-in tariff. The FiT Policy in Kenya was first introduced in 2008, and revised in 2010 and 2012 (the most recent version). This FiT tariff policy is currently under review and the country is working towards having an auction policy. The FiT guarantees fixed rates and connection to the grid for electricity generated from renewable energy sources. Projects are eligible for the FiT if they are of a certain size and based on wind, biomass, small hydro-power, geothermal, biogas or solar. Table 3.5 below is a summary of the components of the FiT Policy 2012. TABLE 3.5: FEED-IN TARIFF VALUES FOR RE PROJECTS BELOW 10 MW56
TABLE 3.6: FEED-IN TARIFF VALUES FOR RE PROJECTS ABOVE 10 MW
56Ministry of Energy, 2012.

More details on the clearances, issuing authority, duration, fees and requirements can be obtained from the renewable energy portal which is hosted by the EPRA website.
4 KISUMU COUNTY RENEWABLE ENERGY RESOURCE POTENTIAL
4.1 NATIONAL LEVEL Kenya is leading the continent in renewable energy production and aims to attain a 100% green energy mix by 2030.57 With a mix of solar, wind, hydro and geothermal energy providing approximately 93% of the country’s energy needs, Kenya is pioneering renewable power in Africa. The Energy Act 2019 instituted the development of RE resource maps of the country within 12 months after its enactment in March 2020, and more detailed studies are expected to be conducted in this regard. A summary of Kenya’s renewable energy potential can be found in Figure 4.1 below.
WIND Proven potential as high as 346W/m2 and wind speeds over 6m/s
SOLAR Relatively stable off grid PV market with insolation estimated at more than 23,000 tWh/year
BIOMASS Cogeneration using charcoal, wood-fuel and agricultural waste. Total estimated generation is 193 MW
GEOTHERMAL Proven potential as high as 10,000 MW along key sites in the Rift Valley
HYDROPOWER Potential of 1000 MW from small scale hydropower plants
BIOGAS Potential to produce over 130 MW of power
FIGURE 4.1: SUMMARY OF KENYA’S RE POTENTIAL (2020)58
4.2 KISUMU COUNTY LEVEL The main sources of energy within Kisumu County as per the CIDP II are electricity and thermal (firewood, charcoal, kerosene, LPG, biogas and solar) energy. The county has not fully tapped into the potential of solar power and RE in general. A few studies have also managed to estimate the renewable energy generation potential in the county. One such study was conducted by a master’s student in 201759 on the renewable electricity status in Kenya, paying attention to the electricity demand, RE
57 Africa Oil and Power, 2020. 58 Ibid. 59 Dieuwertje, K.D. 2017. Renewable Electricity in Kenya. Utrecht University, Master’s Thesis. Available https://dspace.library.uu.nl/handle/1874/354634
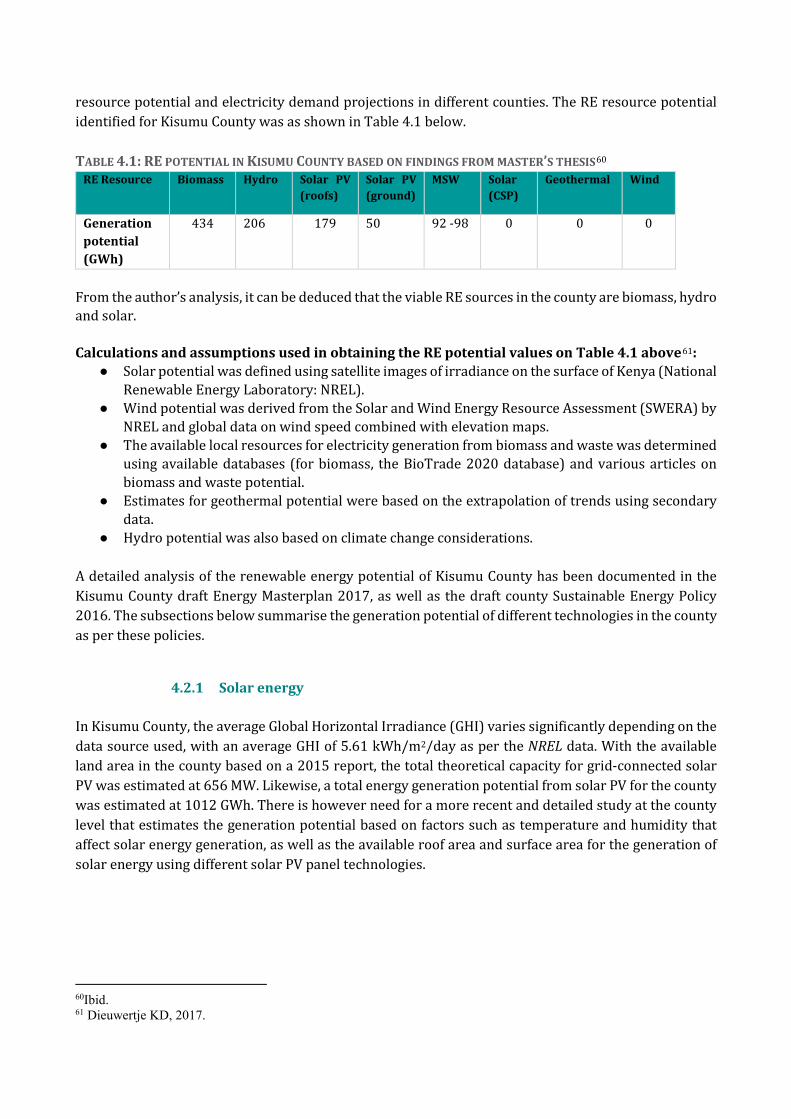
resource potential and electricity demand projections in different counties. The RE resource potential identified for Kisumu County was as shown in Table 4.1 below. TABLE 4.1: RE POTENTIAL IN KISUMU COUNTY BASED ON FINDINGS FROM MASTER’S THESIS60
RE Resource Biomass Hydro Solar PV (roofs)
Solar PV (ground)
MSW Solar (CSP)
Geothermal Wind
Generation potential (GWh)
434 206 179 50 92 -98 0 0 0
From the author’s analysis, it can be deduced that the viable RE sources in the county are biomass, hydro and solar. Calculations and assumptions used in obtaining the RE potential values on Table 4.1 above61:
● Solar potential was defined using satellite images of irradiance on the surface of Kenya (National Renewable Energy Laboratory: NREL).
● Wind potential was derived from the Solar and Wind Energy Resource Assessment (SWERA) by NREL and global data on wind speed combined with elevation maps.
● The available local resources for electricity generation from biomass and waste was determined using available databases (for biomass, the BioTrade 2020 database) and various articles on biomass and waste potential.
● Estimates for geothermal potential were based on the extrapolation of trends using secondary data.
● Hydro potential was also based on climate change considerations. A detailed analysis of the renewable energy potential of Kisumu County has been documented in the Kisumu County draft Energy Masterplan 2017, as well as the draft county Sustainable Energy Policy 2016. The subsections below summarise the generation potential of different technologies in the county as per these policies.
4.2.1 Solar energy In Kisumu County, the average Global Horizontal Irradiance (GHI) varies significantly depending on the data source used, with an average GHI of 5.61 kWh/m2/day as per the NREL data. With the available land area in the county based on a 2015 report, the total theoretical capacity for grid-connected solar PV was estimated at 656 MW. Likewise, a total energy generation potential from solar PV for the county was estimated at 1012 GWh. There is however need for a more recent and detailed study at the county level that estimates the generation potential based on factors such as temperature and humidity that affect solar energy generation, as well as the available roof area and surface area for the generation of solar energy using different solar PV panel technologies.
60Ibid. 61 Dieuwertje KD, 2017.

TABLE 4.2: SOLAR ENERGY GENERATION POTENTIAL IN KISUMU COUNTY (2015)62
Total area (km2) Daily irradiation (kWh/m2/day)
Theoretical capacity (MWp)
Theoretical annual electrical energy generation (GWh)
7,872.6 5.61 656 1012
4.2.2 Wind Data from various sources depict that the county does not have potential to generate wind energy for commercial purposes. There is however the possibility of small, distributed wind generation sites in the county for own use. Kisumu County’s wind speed at 80m hub height ranges from 3-5 m/s according to IRENA’s 3TIER’s Global Wind dataset. The upper range of speeds can be found in the south of Kisumu in the Sondu area, with speeds of approximately 4.8 m/s at 80m hub height, and to the east of the county in Koru at speeds of approximately 4.3 m/s. It is however necessary for a detailed study on the wind energy generation potential of the county to be carried out. This analysis will inform the county government on potential areas where wind energy could be considered for powering public buildings or even for hybrid power generation.
4.2.3 Biomass One of Kisumu’s main agricultural activities is sugar cane farming by large-scale and small-scale farmers in Muhoroni and parts of Nyando constituencies. There are currently three sugar milling companies in Kisumu County, which are Muhoroni, Chemelil and Kibos. These sugar millers use bagasse, a residue from sugar cane processing, for electricity generation to meet their own cumulative demand of 21 MW. With a bagasse output of approximately 714,766 tonnes in 2015, the millers in Kisumu County have the potential to generate between 238 to 255 GWh of electricity. Using a capacity factor of 57% for 300 days of generation, the theoretical capacity in Kisumu County is 58-62 MW.
4.2.4 Hydropower Kisumu County has an optimised potential of 160 MW of run-off river hydropower projects, both large scale and small scale, which is 2% of the national potential. The county also has the potential to develop small hydropower plants (<10 MW) along various rivers in the county.
4.2.5 Geothermal energy No geothermal resource exists in Kisumu County. 62 County Government of Kisumu, 2016.

5 LOCAL RENEWABLE ENERGY AND ENERGY EFFICIENCY TARGETS AND COMMITMENTS IN KISUMU COUNTY
Kenya’s SE4All goal is to ensure universal access to electricity and modern clean cooking solutions, to increase the share of renewable energy to 80% of the country’s energy mix and to double the rate of improvement of energy efficiency by 2030. The County Government of Kisumu has set out its objectives which are geared towards promoting Kenya’s SE4All goal. The policy aims to achieve the following interrelated objectives and related targets. The draft Kisumu County Sustainable Energy Policy contains details on possible interventions that could be used to meet the targets indicated below.
5.1 OBJECTIVES AND TARGETS IN THE COUNTY’S DRAFT SUSTAINABLE ENERGY POLICY
TABLE 5.1: POLICY OBJECTIVES AND TARGETS FOR PROMOTING SE4ALL GOALS OF KENYA AT COUNTY LEVEL63
Policy objective Targets Enhance access to affordable and reliable electricity
• Increase the household electrification rate to 70% by the end of 2017 and ensure electricity access to all households in the county by 2020.
• Public sector – electrify all trading centres and primary schools by 2017.
Promote access to modern clean cooking solutions
• Uptake of briquette use by households (%): 2.9% in 2017; 4% in 2020; 6% in 2022
• Uptake of biogas by households (%): 1.7% in 2017; 4.71% in 2020; 5.8% in 2022
• Uptake of ethanol stoves by households (%): 1% in 2020; 1.5% in 2022
• Uptake of efficient cook stoves by households (%): 39.21% in 2017; 43.5% in 2020; 48.17% in 2022
• Uptake of LPG by households (%): 13.6% in 2017: 15% in 2020: 18.6% in 2022
Prioritise and promote the development and use of RE sources
• Contribute towards the national target of 80% renewable energy in the energy mix by 2030.
Promote the efficient use of energy
• Contribute towards the national target of doubling the rate of energy efficiency by 2030.
• Energy saving targets of at least 10% by 2017, 18% by 2020, and 30% by 2022 in public institutions.
Promote low-carbon and energy-efficient modes of transport
• Contribute towards Kisumu County’s emission reduction target of 30% by 2020 below BaU scenario of 2.14MtCO2e.
Promote waste-to-energy technologies
• No target.
63 County Government of Kisumu, 2016.

Promote sustainable management and efficient use of biomass
• Increase the forest cover to 1% by 2017; 2.5% by 2020; 4% by 2022.
5.2 PROGRAMMES AND TARGETS IN THE KISUMU CIDP II As per Kisumu County’s CIDP II, the county has set a target of achieving 90% electrification by the end of 2022 through a partnership programme between the county government and REREC.64 This CIDP II also sets targets of increasing RE access and RE projects in the county on a yearly basis till the end of the plan period, 2022. Furthermore, the Kisumu CIDP II contains sectoral plans for the plan period, with the energy sector as one of the sectors with programmes and corresponding targets. The tables below outline the targets in energy-related sectors in Kisumu County as per the 2018-2022 CIDP. It also specifies the budget for each plan.
5.2.1 Renewable Energy for Sustainable Development The objective of this programme is to reduce the cost of energy through source diversification. The programme has as its expected outcomes: improved security, reduced cost of power, increased business hours (24-hour economy), and increased number of households using clean energy TABLE 5.2: TARGETS AND KEY PERFORMANCE INDICATORS FOR RE AND SUSTAINABLE DEVELOPMENT IN KISUMU COUNTY65
Key sub-programme
Base-line
Key output Key performance indicator
Target years Year 1 (2018)
Year 2
Year 3
Year 4
Year 5
Budget
Solar floodlights for powering markets, schools and health facilities
100 Solar lights No. of solar lights installed
35 35 35 35 35 70M
Integrated solar-powered water pumping from boreholes
Reduced water pumping costs
No. of solar water pumps installed
- 10 10 10 15 35M
Promotion of ethanol Jikos/ energy conservation Jikos in every ward
Reduced GHG emissions Improved tree cover
No. of households adopting ethanol Jikos
1400 1400 1400 1400 1400 20M
Community solar integrated power box installation in 4 sub-counties
Improve energy access Improve security; business growth
No. of solar boxes installed
1 1 1 1 - 20M
Biogas plants school feeding (ECD programme)
- Reduced energy cost in ECD institutions
No. of biogas plants installed
20 50 50 50 30 20M
64 County Government of Kisumu, 2018. 65 Ibid.

5.2.2 Energy Production and Audit The objective of this programme is to increase access to energy in the county. The expected outcomes of this programme will be an increase in the number of electrified markets and dispensaries.
TABLE 5.3: KEY PERFORMANCE INDICATORS AND TARGETS FOR ENERGY PRODUCTION AND ENERGY AUDIT IN KISUMU COUNTY
Sub- programme
Key outcome Baseline Key performance indicator
Target years Year 1
Year 2 Year 3
Year 4
Year 5
Total budget
Rural electrification
Electrification of market centres and dispensaries
54 markets and 5 dispensaries connected
No. of market centres, dispensaries connected
20 20 20 20 20 GoK, REA
Energy audit
No. of public facilities audited
3 hospitals audited
No. of public facilities audited
3 3 3 3 3 10M
5.2.3 Energy Services and Prospecting The objective of this programme is to license and regulate downstream petroleum activities. The expected outcome of the programme is to have compliant LPG and petroleum retail stations and a county energy masterplan.
TABLE 5.4: TARGETS AND KEY PERFORMANCE INDICATORS OF ENERGY SERVICES AND PROSPECTING
Sub-programme
Key outcome Baseline Key performance indicator
Target years Year 1
Years 2
Year 3
Year 4
Year 5
Total budget
Energy regulation
No. of new and existing petrol stations inspected
50 petrol stations inspected
Valid licences issued
50M
Energy planning
County energy masterplan
County energy masterplan in place
Copies of the masterplan availed to relevant stakeholders
1 10M
6 CURRENT AND FUTURE RENEWABLE ENERGY AND ENERGY EFFICIENCY PROJECTS
6.1 CURRENT AND FUTURE ENERGY PROJECTS IN KISUMU COUNTY The implemented RE projects as per Kisumu County’s CIDP II have been outlined in Section 4.2 of this report. The majority of these implemented projects include solar street lighting projects in public facilities spread throughout the sub-counties within this county as per 2018’s statistics. A few other

implemented projects include domestic biogas plants (5 plants), solar-power coolers (4) and 5 school-hub solar equipment. The section that follows outlines ongoing or up-coming energy projects in Kisumu County: TABLE 6.1: SUMMARY OF CURRENT AND FUTURE ENERGY PROJECTS IN KISUMU COUNTY
Project name
Location Funder Implementer Project details
40 MWp Kisumu solar power plant
Kisumu County
Through PPA
Ergon Solair Africa, a subsidiary of Ergon Solair PBC America
The installation of a 40 MWp solar plant in Kisumu county, in over 100 hectares of roadside land by Ergon Solair Africa was recently approved by EPRA, and will be commissioned in 2023. The generated electricity will be fed to the national grid through a power purchase agreement with KPLC at a rate of 7.5 US cents.66
Kopere solar park power project67
5 km from the centre of Kopere in Kisumu District, Nandi County, Kenya
African Development Bank (AfDB) and the Climate Investment Fund provide concessional loan68
The Project is to be built, owned and operated by Voltalia S.A, who hold 100% of the SPV (Kopere Solar Park Ltd) and will act as the EPC contractor.
The design, construction and operation of a 50 MWp solar PV power project under a 20-year ‘take or pay’ PPA. Also involves the construction of a 33/132 kV substation and a 1.8km transmission line with a way-leave of 40m connecting to the existing 132 kV Lessos-Muhoroni transmission line at Pylon 87 to evacuate the electricity to the national grid via an existing 132 kV high voltage network operated by KPLC.
Completion of the transmission line between the Olkaria geothermal power plant and the counties of western Kenya by March 202069
Olkaria-Lessos-Kisumu high-voltage line
- KPLC has entrusted the work to the Indian company, Kalpataru Power Transmission, and the Chinese companies Shanghai Siyuan Electric and Nari Group
Building a 220 kV/400 kV high-voltage line 300 km long. This will replace an existing 132 kV line that was undergoing power loss. The Kenyan authorities estimate that the future infrastructure will save up to 2 billion Kenyan shillings (nearly $20 million) per year.
The Olkaria-Lessos-Kisumu high voltage power line construction project70
-
GoK through a loan from the Japan International Cooperatio
Marubeni Corporation, a major Japanese commercial group. The work on the field is being carried out by Fuji
The new unit will increase Olkaria’s geothermal plant capacity from 185 MW to 255 MW. The geothermal energy production site is undergoing other developments, including the extension of the Olkaria I power plant and the construction of unit 6, with a capacity of 70 MW.
66 Takouleu, JM. 2020. Kenya: Kisumu Solar power plant (40 MWp) to be operational by December 2023. Available https://bit.ly/36XMDul 67 African Development Bank Group. 2018. Kopere solar park power project in Kisumu district Nandi County. Available https://bit.ly/3d8Ggow 68 Groenendaal, B. 2018. Kenya: 50MW Kopere Solar Park concludes funding agreement. Available https://bit.ly/30ZBjdq 69 Africa Energy Portal. 2019. Kenya: Olkaria power plant will supply the West by March 2020. Available https://bit.ly/2xBVfXR
70 Fidelis, J. 2019. Kenya to construct a new geothermal transmission line. Available https://bit.ly/2GRVcvZ

n Agency (JICA).
Electric, its Japanese partner.
New off-grid Solar Centre in Kisumu, by Azuri Technologies71.
Kisumu county
-N/A Azuri Technologies, a provider of PAYG solar home technology for off-grid systems in Africa
The Off-grid Solar Centre features the latest solar home solutions from Azuri, including Azuri’s new energy-efficient 32-inch solar satellite TV and home lighting system. The centre also provides face-to-face customer support in addition to servicing and repairs.
The Masogo-Nyang’oma Green Energy Resource Centre
Kisumu County
CGK -
The County Government of Kisumu is currently undertaking construction of a flagship Green Energy Regional Centre at Masogo-Nyang’oma ward in Muhoroni sub-county, which will act as a centre of excellence and the technical outreach arm of the county on matters of renewable energy. The centre will offer technical training on renewable energy technologies and demonstrations of biogas, solar, wind, briquetting, clean cooking techniques, etc.
Clean cooking mechanisms
Kisumu County
CGK -
280 bio-ethanol cook stoves have been acquired for distribution and there are plans to acquire more. There are plans to put up a commercial biogas plant at Jaramogi Oginga Odinga Teaching and Referral Hospital (JOOTRH) and domestic systems at the county Vocational Training Centres (VTC) for awareness creation.
Operation Nyangile (Kerosene Lantern) Out
Kisumu County
CGK -
A total of 930 solar lanterns have been distributed to the vulnerable communities especially those with school-going children. This programme is expected to continue.
Energy Audits
Kisumu County
CGK - Conducted annual energy audits in six health facilities in collaboration with KAM and implemented Solar Water heating facility at one facility (Kombewa Hospital). The audits will help to improve energy conservation and efficiency measures.
High Mast Floodlights and Streetlights (HMFL)
Kisumu County
CGK - Total of 235 HMFL have been implemented in various market centres, beaches and other public utility areas.
6.2 BUSINESS MODELS
A business model is a description of how a business makes profit, taking into consideration the pricing and cost of its goods and services.72 The dominant business models in the power sector thus far have been feed-in-tariffs, which are backed by a public or government entity and are subject to changing policies and regulations, and the Power Purchase Agreements (PPAs) which are often backed by a
71 Energy Northern Perspective. 2019. Azuri opens new Off-grid Solar Centre in Kisumu, Kenya. 30 September 2019. Available https://bit.ly/2vvPcna
72 Kopp, CM. 2020. Business models. Available https://www.investopedia.com/terms/b/businessmodel.asp

corporate buyer or off-taker.73 The following business models are those applicable to the power sector in Kenya, with a focus on examples relevant to Kisumu County.
6.2.1 Public Private Partnerships (PPPs) As per Kenya’s Public Private Partnership Act of 2014, 74 “public private partnership” means an arrangement between a contracting authority and a private party, under which a private party:
i. undertakes to perform a public function or provide a service on behalf of the contracting authority;
ii. receives a benefit for performing a public function by way of: compensation from public fund; charges or fees collected by the private party from users or consumers of a service provided to them; or a combination of such compensation and such charges or fees; and
iii. Is generally liable for risks arising from the performance of the function in accordance with the terms of the project agreement.
In order to realise its vision for 2030, Kenya plans to establish its infrastructure projects principally through PPPs. To support this, there was a PPP Act created in 2013 which provides for the participation of the private sector in the financing, construction, development, operation and maintenance of infrastructure projects of the government through concessions or other contractual arrangements. Amongst the ongoing or planned PPP projects in the power sector is the establishment of a 980 MWt coal plant; a two-phase Geothermal Development Project to generate a total of 1,200 MW, among many other projects.75 Also, to enhance the government’s intent for accelerated investment in geothermal power generation, KenGen is working in close collaboration with the National Treasury to develop a 140 MW geothermal power plant in Olkaria 6 through a Public Private Partnership (PPP). At the county level, the County Government of Kisumu recently published a tender for the installation of off-grid solar systems to supply public utility infrastructure, and has announced its preference for a PPP.
6.2.2 Power Purchase Agreements (PPAs) A Power Purchase Agreement (PPA) often refers to a long-term electricity supply agreement between two parties, usually between a power producer and a customer (an electricity consumer or trader). The PPA defines the conditions of the agreement, such as the amount of electricity to be supplied, negotiated prices, accounting, and penalties for non-compliance.76
In Kenya, the only actor in the electricity distribution sector is KPLC, which is 50.1% government owned and sources electricity from KenGen, GDC and IPPs through PPAs.77 Typical tariff structures include capacity charges, energy charges and/or fuel charge. Tariff structures for small and large renewable energy projects are subject to the Feed-in Tariffs (FiT) Policy 2012.78 Most PPAs are foreign funded and
73 Rossetto N, Reis PC, & Glachant J. 2019. New business models in electricity: the heavy, the light, and the ghost. Available https://bit.ly/3jRwmuw 74 AFSLF, PPPIRC. N.d. PPP country profile, Kenya. Available https://bit.ly/2GZ69Md 75 Njoroge Regeru Co. Advocates. N.d. 76 NEXT. N.d. What is a PPA (Power Purchase Agreement)? Available https://www.next-kraftwerke.com/knowledge/ppa-power-purchase-agreement 77 United States Energy Association. 2018. Kenyan Electric Utilities and Regulators Train on PPAs and PPPs. Available https://bit.ly/3iRNtLq 78 http://admin.theiguides.org/Media/Documents/FiT%20Policy%202012.pdf
their tariffs are denominated in dollars which pushes up the cost of electricity. Also, most IPPs are selling power to KPLC at a price that is much higher than KenGen’s rate.79 In 2018, KPLC spent almost 15 times more to buy power from IPPs compared to buying from KenGen, passing the high bill onto consumers. There is therefore a need for IPP power price regulation.
6.2.3 Pay-As-You-Go (PAYG) The PAYG model originated in Kenya and addresses the key challenges of extending end-user finance and collecting payments from remote customers who often have limited cash flow. PAYG companies, at this point, typically provide basic lighting and mobile phone charging services.80 In Kenya, Philips has recently introduced a solar lamp PAYG product and Greenlight Planet is reportedly planning to introduce a range of solar home systems (SHSs). Most of the companies that provide PAYG technologies and products are foreign owned and managed. The participation of locally owned and managed companies in this sector is limited. In terms of installations, some of the major market players are M-KOPA, Solar-power, Mobisol, Pawame, and BBOXX.
6.2.4 Feed-in Tariff (FiT) The Ministry of Energy (MoE) has encouraged potential IPPs to carry out feasibility studies on RE generation on the basis of which PPAs with the off-taker can be negotiated.81 The FiT Policy offers a framework for electricity generated from RE sources (specifically wind, biomass and small hydro) in order to safeguard the investments made by the respective developers in undertaking feasibility studies; and to boost the development of RE sources for electricity generation.82
6.3 OWNERSHIP MODEL OF RENEWABLE ENERGY All untapped RE sources under or on the surface of the Kenyan national territory are vested in the national government, except where any rights have been granted or vested in any other person by or under any written law.83 This means that no RE resources in Kisumu County could be exploited without the respective permit, licence or authorisation from the national government.
The common ownership models in Kenya’s power sector are: private-sector based, utility based and hybrid (combination of private and utility based). The dominant ownership model in Kenya’s mini-grid sector is the utility-based ownership model, where REREC (formally the Rural Electrification Authority) develops mini-grid sites throughout the country, while the national utility KPLC manages, operates and maintains the mini-grids.84 Below are some of the ownership models applicable in Kenya’s power sector.
79 Amadala, V. 2019. Independent power producers pushing bills up. Available https://bit.ly/3nTSXt0 80 Sanyal S, Prins J, Visco F, and Pinchot A. 2016. Stimulating Pay-As-You-Go Energy Access In Kenya And Tanzania: The Role Of Development Finance. Available https://bit.ly/2QLVjLo 81 Mukuha N, Shah P and Field, R. 2019. New Energy Act Embraces Renewable Energy. Available https://bit.ly/2UIh4wM 82 The Ministry of Energy, 2012. 83 Rodl & Partner. 2017. Developments in the regulatory framework for renewable energy in Kenya: Energy Bill 2017. Available https://bit.ly/2xvfEO9 84 USAID. 2018.What ownership models are used for mini-grids. Available https://bit.ly/370h9nd

6.3.1 Asset shareholding in PPP Entities in Kenya’s power sector which are partially state owned are KenGen and KPLC. The government owns 50.1% of KPLC and 70% of KenGen. The other entities in Kenya’s power sector are either solely government owned or totally privately owned.
6.3.2 Purely public asset There are a few entities in the Kenyan power sector owned solely by the government. These are the Kenya Electricity Transmission and Lighting Company (KETRACO) which is charged with constructing new transmission infrastructure, and the Geothermal Development Company (GDC) which develops geothermal resources through surface exploration and drilling.
6.4 FINANCIAL STRUCTURES
6.4.1 Private sector finance in Kenya
i. Micro-Finance Institutions Micro-finance institutions (MFIs) provide customer financing for Solar Home Systems (SHS) in Kenya, but play a much smaller role than PAYG. This is partially due to the ticket size of a typical SHS compared to an MFI loan, where MFI products typically cost more than $500. PAYG companies are also more willing to provide financing to unbanked customers, while MFIs typically prefer customers with existing credit histories. MFI partnerships with SHS companies have been supported by donors, but still face some issues: MFIs do not have the technical expertise to install and maintain the products; SHS companies often have agents in the same areas as MFIs, so they end up competing against each other for customers; and unlike PAYG systems, MFIs cannot so easily and reversibly enforce payments, which can lead to non-payment issues.
ii. Mobile money Mobile money started in Kenya and provided an ideal platform to facilitate the growth of PAYG, which is the primary method for collecting payments among SHS companies. There are more than 49 mobile loan applications in Kenya. Though the applications have enabled easy access to loans, ranging from a few dollars to hundreds of dollars, lately there has been an outcry from Parliament and the Central Bank of Kenya to regulate the high interest rates charged by mobile lenders.
iii. M-Akiba: crowd-based lending for development M-Akiba is a tax-free retail bond issued by the Government of Kenya that offers investors a coupon rate of 10% repaid over three years.85 It is listed on the Nairobi Securities Exchange and the proceeds are used to finance infrastructure and developmental projects. Transactions are conducted on the existing M-Pesa platform, a mobile money transfer and borrowing service, which keeps transaction costs low and so maintains low overall cost of capital. With a minimum investment of KSH 3 000, it enables everyday citizens to participate in capital markets while raising capital at below-market rates. The bond’s success stems from its innovative use of digital platforms to reduce transaction costs and tax-free investments. Despite a lower-than-expected bond purchase, M-Akiba still stands as the first mobile
85 Covenant of Mayors in Sub-Saharan Africa. 2019. Financing Climate And Energy Action in African Cities: Case Studies from 10 cities across Sub-Saharan Africa. Available https://bit.ly/3dtakfq

treasury instrument to be sold in Africa. There are significant opportunities to enhance this financing model that could be a game changer for financing at the local level.
6.4.2 Access to finance in Kenya The financial sector in Kenya is starting to embrace the RE sector. Most RE companies initially offered their own financing services to customers. Financial institutions are now starting to take over this financing component from RE companies.86 One good example is Equity Bank, which is taking on an increased role in the distribution of solar home systems and cook stoves. Very few private partners have a balance sheet that would justify corporate finance for the huge capital costs of these ventures. Project Finance is therefore more appropriate for them. The government can play a part in making the projects more bankable by: coupling the generation build-own-transfers (BOTs) with full off-take PPs and where the off-taker is not creditworthy, offering guarantees for the off-taker’s obligations; offering tax concessions, since taxes greatly reduce project cash flow; supporting the project in the form of subsidies, guarantees or indemnities; offering land and other logistical facilities to reduce capital costs; and coordinating and expediting approvals, permits and consents.87
i. Corporate finance Kenya has clearly been a “first mover” in sub-Saharan Africa from the perspective that its off-grid companies have attracted substantial corporate finance. There are few examples of international investors active in the off-grid sector in Africa that have not invested in Kenya. However, this early flow of equity investment into Kenya’s off-grid market has made it difficult for many off-grid companies to attract follow-on capital (equity) from investors worried about market concentration and country risk. First investors, such as NovaStar, KIVA, Acumen, and DOB Foundation, and front-running grantors, such as AECF and EEP, are now targeting more productive-use companies (e.g., solar water pumping) or financing the solar sector’s logistics value chains. This same dynamic is also true for grants.88 SHS companies have been able to attract meaningful private financing, so many donors are now reluctant to provide grants since they perceive the sector as having matured and moved beyond the need for grant financing. In some respects, this is true, but there are still some areas that could benefit from grant financing.
ii. Equity There are two main issues facing equity investment in the Kenyan market:
a) Current investors (mainly impact investors but some private equity funds and development finance institutions) have already invested and have not exited. This makes it difficult to invest in new off-grid companies and recycle capital in the market, because many investors have either reached saturation limits or are concerned about investing in new off-grid companies that compete with early investments.
b) There is an erroneous assumption that the equity market is saturated, which is discouraging to new investors. Further, potential new investors have been dissuaded by initially high company
86 Mokveld, K and von Eije, S. 2018. Final energy report Kenya. Available https://bit.ly/2SQq7v3 87 Business Daily. 2019. Public-private ties right for electricity financing in Kenya. Available https://bit.ly/39lfINO 88 Power Africa. 2019. Off-grid solar market assessment, Kenya. Available https://bit.ly/3dmoBKF

valuations, which can make it difficult to participate in a later equity round. Identifying additional new investors and demonstrating the market potential is an important next step for stakeholders.
iii. Debt
The development of this space has been supported by donors over the years to create viable options for companies. From these efforts, lenders such as SunFunder and SIMA Fund have emerged as market-based financing options with more flexible lending terms than local commercial banks, for example. As companies have grown in Kenya, ticket sizes for debt have also grown, but this has made it more difficult for smaller companies to obtain financing. This has led to the rise of crowdfunding companies (Trine, Lendahand, and Bettervest to name a few) as an alternative, where debt with local banks has been successful for larger companies taking on multi-million dollar facilities.
iv. Grants Grants were one of the main catalysts in the Kenyan SHS market during the early stages of the sector from 2010 to 2015. Main grantors included AECF funds from DFID and EEP, which provided grants to most large international companies such as Fenix, Mobisol, BBOXX, and several others. Today both AECF and EEP are focused on providing finance to more locally owned companies, productive-use appliances, and women-owned companies. EEP has also done additional work in mini-grids and C&I. AECF still funds locally owned SHS companies across Africa but has refrained from previously funded markets of SHS. The World Bank has provided funding for KOSAP, which will provide grants for companies that expand their operations to serve the identified underserved counties. TABLE 6.2: SUMMARY OF SELECTED INVESTORS IN KENYA
Name Summary Finance type
SunFunder Provides debt financing to solar companies (including off-grid). It has financed about 45 companies with over 60 total debt facilities. Investors include Overseas Private Investment Corporation and the Rockefeller Foundation.
Debt
Responsability Acts as asset manager in the field of devilment investments and offers professionally managed investment solutions to private institutional and public investors. Its main targets are non-listed firms in emerging and developing economies.
Debt and equity
Frontier Investment Management
Provides equity mezzanine capital and short-term debt. Debt and equity
CrossBoundary Finances mini-grids and other off-grid solar projects. Debt and equity
Energy and Environment Partnership Africa
Multi-donor fund that provides early stage grant and catalytic financing for clean energy. Fund is managed by the Nordic Development Fund.
Debt and grants
Africa Enterprise Challenge Fund Renewable Energy and Adaptation to Climate Technologies in sub-Saharan Africa
Supports SHS and mini-grid companies with a focus on access and climate change mitigation, supported by the Swedish International Development Cooperation Agency and United Kingdom Department of International Development.
Debt and grants
Sunref Provides long-term loans to local banks to support green growth as well as technical assistance for local banks to be able to provide loans to companies in this area, supported by the French Development Agency (Agence Francaise de Developpement).
Debt

7 CONCLUSION AND RECOMMENDATIONS This Kisumu County initial status report has identified the energy demand, energy supply and power generation mix in the county. It has also examined the renewable energy generation potential in the county, relevant energy policies as well as the financial and ownership models in place to enable the roll-out of renewable energy projects in the county. The key findings, barriers, enablers and recommendations for the county are outlined below.
7.1 ENABLERS AND BARRIERS
Enablers:
• Ability to develop, build, operate and regulate energy projects in the county: Unlike many other countries in Africa, the government of Kenya has given county governments the mandate to develop county energy plans, build, own and operate energy plants as well as issue licences for some energy projects in the county. This in itself reduces the project approval process and lag time for projects whose licences can be issued by the county government. It also makes it possible for counties to develop projects based on their priorities, needs and available resources.
• Ability to partner with international development organisations and the private sector to build, own and operate projects: A number of development partners and international organisations are present in the county. For instance, as part of the Covenant of Mayors in sub- Saharan Africa (CoM SSA) initiative, Expertise France is supporting Kisumu County to develop their sustainable energy access and climate action plan, of which access to energy is a key focus. Hence through these projects, there is room for the capacity building and project development within the county.
• A dedicated energy department at the county level: The County has a dedicated department
in charge of matters related to energy within the county, the Department of Energy and Industrialisation. This department is able to work hand-in-hand with other departments as well as the national departments to roll out renewable energy projects in the county. It also makes processes easier for development partners willing to work in energy-related projects in the county.
• Availability of renewable energy resources in the county: Kisumu County is endowed with generous RE resources for potential exploitation, especially from hydro, solar and biomass energy. This creates the opportunity to meet the county’s energy needs while minimising GHG emissions from the energy sector.
• Availability of a framework for the development of county energy plans: The Ministry of Energy has developed the Energy Planning Framework for counties. The framework acts as a template and guiding document for counties to use in developing their county energy plans, which later fit into the National Energy Plan.
• A well-structured energy sector with clear roles and responsibilities: The Energy Act 2019
outlines clear roles and responsibilities of the different stakeholders in the country’s energy sector. It also presents the mandates of the national government as well as the local government in the energy sector. This creates the opportunity for different departments to work together while avoiding duplication of efforts.

• Sound alignment of national and local strategies, plans and policies on access to energy and the renewable energy sector: Kenya is one of the leading countries on the continent with a very robust policy landscape in the energy sector. The Energy Act 2019 guides all matters related to energy in the country. Other plans and strategies such as the Least Cost Power Development Plan, the Kenya National Electrification Strategy and the Kenya Last Mile Connectivity Programme, amongst other policies like the Finance Act and the FiT policy, have been well developed to increase access to energy in the country, with a special focus on energy sourced from RE sources. Similarly, the county government has developed policies such as the Kisumu County Energy Masterplan, the draft Sustainable Energy Policy, and the County Integrated Development Plan to guide the achievement of their energy access targets, which are very much aligned with the national targets.
• Existence of guidelines for the RE project approval process: Even though there is still a need for improvement in the understanding of the processes, licences and stakeholders needed for rolling out an energy project in the county, the RE portal hosted by the EPRA website provides a very detailed and well-structured breakdown of the clearances, stakeholders, fees and time required for obtaining a renewable energy project licence for the different renewable energy technologies. This makes it easier for development partners and stakeholders involved to understand the process needed to obtain a licence and build/own/operate RE projects in the counties.
• Incentives provided to renewable energy generating plants through the Feed-in Tariff
policy: The FiT policy in Kenya was first implemented in 2008, and updated in 2008 and then 2012. With this instrument, development partners are incentivised to feed electricity generated from renewable energy into the utility grid.
• The presence of active stakeholders both at county and national level: Even with the ongoing Covid-19 situation, the project implementation team, which is made up of representatives from different departments in the county were ready to contribute enormously to the success of the 100% RE project. Such zeal and commitment will encourage more development partners to work with county authorities to develop energy projects.
Barriers:
The following are the main barriers faced by the county’s energy sector.
• Inadequate data and information about the county’s energy sector: Availability of information about the county’s energy sector is hard to come by, and even aggravated by the unavailability of publications on the county’s website. It is recommended that the county government or the communication department maintains an up-to date website of the county in collaboration with the Department of Energy and Industrialisation. There are available documents developed by the county government that have not been uploaded to the website.
• Insufficient power distribution network: In as much as the county has a number of power generation plants, almost 52.6% of the county has access to electricity supplied by the utility grid. Based on the fact that all power generation facilities in the county above 1 MW of generation

capacity (apart from the sugar plants’ own generation) feed into the grid, it is important for the county to come up with and incentivise strategies that will enable access to electricity for communities far off from the grid, as well as initiatives that will increase the electrification rate in sparsely populated areas in the county.
• Unavailability of detailed studies on the RE potential of the county: Most of the available reports on the renewable energy potential of the county are based on estimates. This makes it difficult to quantify the actual generation potential from different renewable energy sources. Hence, there is need to carry out such studies in the county, so as to map out areas that are feasible for commercial level RE generation as well as small-capacity power generation.
• Unreliability and unaffordability of electricity: Another challenge faced by the county is that of unreliable and unaffordable electricity access in the county. Any initiatives that will subsidise electricity and energy prices in the county will enhance the electricity access rate.
• Extensive financial resource constraints: Financial resources are inadequate to implement
RE and climate change projects. This is clearly shown by the county’s low budget allocation of 0.001%. The financial constraints also affect the ability to sustain projects in the county.
• Limited technical capacity of RE technologies: There is inadequate technical know-how on
specialised technologies extending from their design, capabilities, and in-field maintenance. This extends from wind energy, solar, and tidal/ocean.
• Limited knowledge at the community level on renewable systems: There is inadequate
knowledge at the community level to propose projects or programmes in RE and climate change that is revealed during public participation.
7.2 RECOMMENDATIONS Based on the current status, barriers and enablers to a 100% RE transition in the county, the following are some key recommendations:
• Perform detailed feasibility studies to assess RE potential: There is a need for detailed feasibility studies to assess the RE generation potential from various technologies in the county. It is only through such studies that the return on investment in such projects can be assessed.
• Create strategies to increase access to clean cooking: With less than 20% of the county’s population using clean sources of energy for cooking, more efforts need to be put in place to enable the transition from the traditional use of biomass fuels for cooking to cleaner cooking fuels such as electricity, solar energy, LPG and biogas. This can be done by setting targets and putting in place relevant strategies and regulations.
• Build capacity and raise awareness: In order to enable the county’s transition to RE, there
needs to be an awareness-raising strategy in place to help the community to understand the advantages of using clean energy. The county’s technical staff also needs to be educated about the various renewable energy technologies and trained to develop action plans, as well as monitor and report on progress made over time in meeting RE transition targets.

• Increase gender diversification and inclusion across roles and positions in the energy
sector: While the men in the field are extremely competent and supportive with project development, there seems to be very little participation from women. For the purposes of promoting equality and encouraging the adoption of different perspectives from project ideation through to inception and development, more women should be encouraged to join the renewable energy sector, and in all possible areas.
• Create a data repository hosted by the county government’s website: Access to county-level
data is a challenge across different sectors. It is recommended that the county government or the Department of Energy and Industrialisation puts in place a task team that will source data related to energy in the county, update the county government’s website and maintain the database. This will make information readily available for the county, development partners or other organisations willing to implement energy projects in the county. Key content to include would be information and data related to the RE approval process, RE potential of the county, access to electricity, access to clean cooking, energy projects in the county, etc.
• Develop sound action plans to implement county energy goals and targets: While the county has developed policies and targets through the draft Energy Masterplan, the draft Sustainable Energy Policy, and the CIDP amongst others, there is need for the development of action plans to accompany each of the targets and goals. Such an action plan needs to be informed by an analysis of the baseline scenario, growth projections, energy modelling, cost analysis, impact analysis, etc.
• Enforce appropriate RE project development processes and tracking: Not all projects are being tracked as they should. Tracking will protect both communities and investors who are stakeholders in these projects, ensuring that there is alignment with national and local objectives. The data would also feed directly into the repository mentioned above.

APPENDICES Appendix A: Kenya’s energy demand Demand and consumer statistics for Kenya (2007 to 2017)
Appendix B: Generation contribution of existing power plants in Kenya Generation contribution of existing power plants in Kenya (2012/13-2016/17)89
Resource type Capacity (MW) as at 30/06/2017
Energy purchased in GWh
Installed Effective90 2012/13 2013/14
2014/15
2015/16
2016/17
2017/18
KenGen power generation plants Hydro plants Tana 20.0 20.0 108 69 108 109 71 Kamburu 94.2 90.0 520 421 358 434 384 Gitaru 225.0 216.0 1,036 830 710 862 775 Kindaruma 72.0 70.5 252 201 165 208 183 Masinga 40.0 40.0 148 206 138 127 169 Kiambere 168.0 164.0 1,129 979 718 996 938 Turkwel 106.0 105.0 545 719 551 426 402 Sondu Miriu 60.0 60.0 393 351 376 419 282 Sangóro 21.0 20.0 110 109 125 140 90 Small Hydros 11.7 11.2 57 59 60 63 44 Hydro Total 818 797 4,298 3,944 3,308 3,784 3,339 Thermal plants Kipevu I Diesel 73.5 52.3 185.2 219.9 156.5 128.6 211.3 Kipevu III Diesel 120.0 115.0 320.7 524.2 299.0 181.4 512.1 Embakasi GT 30.0 28.0 27.3 41.3 4.1 0.6 0.2 Muhoroni GT 30.0 27.0 108.0
89 Republic of Kenya, 2018. 90 Contracted output from the station under normal operating conditions.

Garissa & Lamu 26.9 27.6 11.7 12.4 Garissa Temporary Plant (Aggreko)
21.0 18.6
Thermal Total 254 222 560 813 492 342 832 Geothermal plants Olkaria I 45.0 44.0 369 352 333 331 195 Olkaria II 105.0 101.0 696 712 756 814 791 Eburru Hill 2.5 2.2 9 7 11 10 0 Olkaria Mobile Wellheads
80.6 77.8 23 53 196 357 472
Olkaria IV 140.0 140.0 0 32 1064 976 852 Olkaria I 4 & 5 140.0 140.0 744 1055 968 Geothermal Total 513 505 1096 1156 3104 3542 3279 Wind farms Ngong 25.5 25.5 13.9 17.6 37.7 56.7 63.2 KenGen Total 1,610 1,550 5,968 5,931 6,943 7,725 7,513 Government of Kenya (REP) Thermal 26.2 17.0 26.0 29.8 35.1 39.9 40.8 Solar 0.550 0.520 0.6 0.8 0.9 0.8 0.5 Wind 0.660 0.494 0.7 0.4 0.0 0.000 0.003 Total Off-grid 27 18 27 31 36 41 41 Independent Power Producers (IPPs) Iberafrica I&II (Thermal)
108.5 108.5 592 550 198 128 252
Tsavo (Thermal) 74.0 74.0 178 152 83 39 121 Thika Power (Thermal)
87.0 87.0 454 233 70 168
Biojule Kenya Ltd (Biogas)
2.0 2.0 0 0.7
Mumias (Cogeneration)
26.0 21.5 71 57 14 0 0
OrPower 4 (Geothermal)
139 139 503 851 955 1066 1172
Rabai Power (Thermal)
90.0 90.0 443 633 609 536 606
Imenti Tea Factory (Feed-in plant - hydro)
0.3 0.3 0.7 0.1 0.5 0.7 0.3
Gikira (Small hydro)
0.514 0.514 0.4 1.6 1.9 0.9
Triumph Diesel (Thermal)
83.0 83.0 4.8 81.8 83
Gulf Power (Thermal)
80.32 80.32 60 8 61
Regen-Teremi (Hydro)
5.00 5.00 1
IPP Total 696 691 1,788 2,698 2,160 1,934 2,466 Emergency Power Producers (EPP) Aggreko Power 0 0.0 261 94 63 50 1

EPP Total 0 0 261 94 63 50 1 Imports UETCL 41 83 76 65 180 TANESCO 1.2 1.3 0.6 0.0 0.0 EEPCO 2.1 2.8 2.6 3.4 Total Imports 42 87 79 67 184 SYSTEM TOTAL 2,333 2,259 8,087 8,840 9,280 9,817 10,205
Appendix C: Number of public vehicles in Kisumu County by SACCO, 202091
91 National Transport and Safety Authority. 2020. Obtained through email correspondence with Mr. William Okoyo, October 2020
SACCO NAME Number of Vehicles1 MAKOMA 312 MAMAKON 543 3KRA 354 MOA RELIANT 355 MAMBOLINE 596 USENGE SHUTTLE 207 HOMA BAY 578 VICTOLIMITED 1019 KIKASA SACCO 43
10 KAMTCO SACCO 9211 KITOMA SACCO 10012 UYOMA KISUMU 5513 EBENEZER SACCO 13514 K2BU SACCO 4515 NILE PERCH 7016 GREAT NYANZA 3417 ACACIA SACCO 3118 LAKEBELT 8519 KISTAG SACCO 23320 SOMALINE 5221 ETONGREEN 3022 TRANSCOUNTY 10023 KIHOMI SACCO 3924 MINIDCO SACCO 3525 PERISKA 3326 KISUMU MPYA 1727 SPARKLINE SACCO 1528 NYANAM SACCO 729 KIBORA SACCO 35
TOTAL 1678

REFERENCES African Development Bank Group. 2018. Kopere solar park power project in Kisumu district Nandi County. Available https://bit.ly/3d8Ggow Africa Energy Portal. 2019. Kenya: Olkaria power plant will supply the West by March 2020. July 2019. Available https://bit.ly/2xBVfXR Africa Oil and Power. 2020. Invest in the energy sector of Kenya: Kenya special report. Africa Energy series. Available https://bit.ly/311CzN0 AFSLF, PPPIRC. N.d. PPP country profile - Kenya. Available https://bit.ly/2GZ69Md Amadala, V. 2019. Independent power producers pushing bills up. Available https://bit.ly/3nTSXt0 Anjarwalla & Khanna. 2018. Electricity Regulation in Kenya. Available https://www.lexology.com/library/detail.aspx?g=a60ba402-d259-4894-a495-da0c9bf85fcb Bukachi, N. 2020. EPRA: Email exchange with author October, 2020 Business Daily. 2019. Public-private ties right for electricity financing in Kenya. Available https://bit.ly/39lfINO CEIC. 2019. Kenya Motor Vehicles Sales. Available https://bit.ly/33OSJeG Climatelinks.org. 2017. Greenhouse Gas Emissions Factsheet: Kenya. Available https://bit.ly/39TO5fV County Government of Kisumu. 2016. Draft Sustainable Energy Policy 2016. Kisumu, Kenya County Government of Kisumu. 2018. Kisumu County Integrated Development Plan II (2018 – 2022). Available https://www.kisumu.go.ke/wp-content/uploads/2018/11/Kisumu-CIDP.pdf County Government of Kisumu. 2019a. Kisumu County Environment Policy 2019. Available https://bit.ly/2WbVovv County Government of Kisumu. 2019b. The Kisumu County Transport Bill 2019. Available https://bit.ly/375wpPI Covenant of Mayors in Sub-Saharan Africa. 2019. Financing Climate And Energy Action in African Cities: Case Studies from 10 cities across Sub-Saharan Africa. Available https://bit.ly/3dtakfq Dieuwertje, K.D. 2017. Renewable Electricity in Kenya. Utrecht University, Master’s Thesis. Available https://dspace.library.uu.nl/handle/1874/354634
Dubey S, Adovor E, Rysankova D, Portale E, and Koo B. 2019. Beyond Connections: Access to electricity and clean cooking in Kenya based on the multitier framework survey and data analysis. Available https://bit.ly/3jNL0D4 Energy Northern Perspective. 2019. Azuri opens new Off-grid Solar Centre in Kisumu, Kenya. 30 September 2019. Available https://bit.ly/2vvPcna Energy and Petroleum Regulatory Authority (EPRA). N.d. The Renewable Energy Portal. Available https://renewableenergy.go.ke Energy Regulatory Commission. 2008. Kenya Electricity Grid Code. Nairobi: Kenya. Available https://bit.ly/3lwC1GW Energy Regulatory Commission. 2018. Press statement on reviewed retail electricity tariff for the 2018/2019 tariff control period, effective 1st November 2019. 31st October 2018. Available https://bit.ly/2vsO6IU Government of Kenya. 2019. The Energy Act 2019. Nairobi: Kenya. Available https://bit.ly/33ilzlAIEA, Groenendaal, B. 2018. Kenya: 50MW Kopere Solar Park concludes funding agreement. Available https://bit.ly/30ZBjdq IRENA, UNSD, World Bank, WHO. 2020. Tracking SDG 7: The Energy Progress Report. World Bank, Washington DC. © World Bank. License: Creative Commons Attribution—Non-commercial 3.0 IGO (CC BY-NC3.0 IGO). Infotrak. 2015. Kisumu County. Available http://countytrak.infotrakresearch.com/kisumu-county/ John, F. 2019. Kenya to construct a new geothermal transmission line. Constructionreviewonline.com. Available https://bit.ly/2GRVcvZ Kamadi, G. 2017. Africa’s first connected biogas plant powers up. Thomson Reuters Foundation. Available https://reut.rs/33SZOus Kinyanjui, B. 2020. Kenya Power and Lighting Company Limited: Interview and email exchange with author. August 2020. KenGen. N.d. Sondu Miriu Power Station. Website accessed December 2019. Available https://bit.ly/2UIgHSU Kenya National Bureau of Statistics. 2019a. Kenya Population and Housing Census Volume I: Population by County and Sub-county. Available https://bit.ly/33Rhyql Kenya National Bureau of Statistics. 2019b. Kenya Population and Housing Census, Volume II: Distribution of Population by Administrative Units. Available https://bit.ly/3nLcE6f

Kenya National Bureau of Statistics. 2019c. Kenya Population and Housing Census, Volume IV: Distribution of Population by Socio-economic Characteristics. Available https://open.africa/dataset/2019-kenya-population-and-housing-census/resource/08201cfd-421f-45c3-90fb-578356f00cf9 Kenya National Bureau of Statistics. 2020. Kenya Economic Survey. Nairobi: Kenya. Available https://bit.ly/30YCjyq Kenya Power and Lighting Company Limited (KPLC). 2018. Annual report and financial statements for the year ended 30th June 2018. Available https://bit.ly/311ovDr Kopp, C.M. 2020. Business models. Available https://www.investopedia.com/terms/b/businessmodel.asp Ministry of Energy. 2012. Feed-in-tariffs policy on wind, biomass, small hydro, geothermal, biogas, and solar resource generation electricity. Revision, December 2012. Available https://bit.ly/3jNIH2V Mokveld, K and von Eije, S. 2018. Final Energy Report: Kenya. Available https://bit.ly/2SQq7v3 Mukuha N, Shah P, and Field R. 2019. New Energy Act Embraces Renewable Energy. Available https://bit.ly/2UIh4wM National Environment Management Authority, Government of Kenya. 2015. Second National Communication to the United Nations Framework Convention on Climate Change. Available https://bit.ly/39Qv8ed NEXT. N.d. What is a PPA (Power Purchase Agreement)? Available https://www.next-kraftwerke.com/knowledge/ppa-power-purchase-agreement Njoroge Regeru and Co. Advocates. N.d. The growing trend of Public Private Partnership in Kenya. Available https://bit.ly/3nJEnEg Power Africa. 2019. Off-grid solar market assessment Kenya. Available https://bit.ly/2FlRdXR Republic of Kenya. 2012a. The Energy (solar photovoltaic systems) Regulations, 2012. Available https://bit.ly/34Oo5RT Republic of Kenya. 2012b. The Energy (Electricity Licensing) Regulations, 2012. Available https://bit.ly/34Uh8i2 Republic of Kenya. 2018. Updated Least Cost Power Development Plan: Study period: 2017-2037. Available https://bit.ly/2Up04wR Republic of Kenya. 2019. The Energy Act 2019. Nairobi: Kenya.

Republic of Kenya. 2020. The Finance Act 2020. Kenya Gazette Supplement No. 104 (Acts No. 8). Nairobi: Kenya. Available https://bit.ly/3lFu1TW Republic of Kenya, Ministry of Environment and Natural Resources. 2015. Kenya’s Intended Nationally Determined Contribution (INDC). 23rd July 2015. Available https://bit.ly/2TQ0yM9 Republic of Kenya, Ministry of Environment and Natural Resources. 2017. Kenya’s Nationally Determined Contribution (NDC): Update of Kenya’s Emission Baseline Projections and Impact on NDC Target Resources. January 2017. Available https://bit.ly/2INnNjK Rodl & Partner. 2017. Developments in the regulatory framework for renewable energy in Kenya: Energy Bill 2017. Available https://bit.ly/2xvfEO9 Rossette N, Reis PC, and Glachant J-M. 2019. New business models in electricity: the heavy, the light and the ghost. Available https://bit.ly/3jRwmuw Sanyal S, Prins J, Visco F, and Pinchot A. 2016. Stimulating Pay-As-You-Go Energy Access In Kenya And Tanzania: The Role Of Development Finance. Available https://bit.ly/2QLVjLo S2BIOM. 2008. Factsheet: Kenya Electricity Grid Code. Available https://s2biom.vito.be/node/2282 Stimatracker.com. N.d. Electricity cost in Kenya. Available https://www.stimatracker.com/ Takouleu, J.M. 2020. Kenya: Kisumu Solar power plant (40 MWp) to be operational by December 2023. Available https://bit.ly/36XMDul USAID, Power Africa. 2019. off-Grid Market Assessment for Kenya. Available https://bit.ly/39pIqNA United States Energy Association. 2018. Kenyan Electric Utilities and Regulators Train on PPAs and PPPs. Available https://bit.ly/3iRNtLq

Supported by:
based on a decision of the German Bundestag
The 100% Renewables Cities and Regions Roadmap project is implemented by ICLEI – Local Governments for Sustainability and funded by the German
Federal Ministry for the Environment, Nature Conservation and Nuclear Safety (BMU) through the International Climate Initiative (IKI).
http://renewablesroadmap.iclei.org/