Embed Size (px)
Citation preview

1Project Sciurus Trial Insights
Project Sciurus Trial Insights: Findings from 300 Domestic
V2G Units in 2020
Lowering your emissions through innovation in transport and energy infrastructure
May 2021
>320 V2G Unitsinstalled in homes throughout the UK
The first UK manufactured V2G chargepoint
Customer App keeping the customer in control of charging
Platform to aggregate and optimise V2G units
Significant V2G hardware cost reduction
Simple customer proposition
>750MWhof energy offset through V2G

2Project Sciurus Trial Insights
1 Executive Summary..................................................................................
2 Introduction................................................................................................
3 Analysis Overview....................................................................................
3.1 EV Plug-in Behaviour.............................................................................
3.2 Effect of Lockdown ...............................................................................
3.3 Customer Archetypes ...........................................................................
3.4 Analysis of Household Demand Data.................................................
4 REVOLVE Model.........................................................................................
5 Model Input Assumptions.......................................................................
5.1 V2G Units.................................................................................................
5.2 Tariff Design............................................................................................
5.3 Firm Frequency Response (FFR) Prices.............................................
5.4 Dynamic Containment...........................................................................
5.5 Household Demand Data......................................................................
6 V2G Value Assessment............................................................................
6.1 Value of V2G Using Tariff Optimisation and FFR..............................
6.2 Effect of Lockdown on Value................................................................
6.3 Feasibility and Value of Dynamic Containment................................
6.4 Impact of TCR and Export DUoS........................................................
6.5 Segmentation into EV Battery Capacities..........................................
6.6 Segmentation into Archetypes.............................................................
7 High Level Business Case......................................................................
8 Participant Survey Insights and Implications for Proposition......
8.1 Discussionontheimpactofthesefindingsontheproposition.......
9 Conclusions & Recommendations.......................................................
10 Appendix:CustomerArchetypeDefinitions......................................
3
5
5
7
9
11
13
14
15
15
16
17
18
18
19
19
19
21
22
23
24
25
26
27
28
30
Contents

3 Project Sciurus Trial Insights
There are now over 320 V2G units installed in homes across the UK. These units are provided to customers in conjunction with a customer app through which they can set their preferences for the charging parameters and remain in control of when their vehicle is ready to use. The V2G units are aggregated, optimised and scheduled by the Kaluza Intelligent Energy platform in order to make money and support the grid. Finally, the customers have a simple proposition where they get paid a fixedrateforeverykWhthatisexported.
This report has analysed the plug-in behaviour of customers in the Sciurus trial over twelve months, between January 2020 and December 2020. The V2G chargepoint plug-in data was used as an input into the Cenex REVOLVE model in order to simulate the potential revenue available across the V2G asset portfolio, when optimised against cost. This was combined with the insights from a participant survey that covered about half of the trial participants. Twelve different customer archetypes were represented, but the most common customer archetypes were ‘The Run-around’ and ‘TheRetired Professional’, both of which have a highplug-in availability.
AkeyfactorinfluencingthevaluecapturedbyV2Gis driving energy (i.e. the energy required by the EVtoperformits journeys),whichhassignificantvariation by customer archetype. When V2G isable to access grid services (Firm Frequency Response or Dynamic Containment) then plug-in availability becomes a second value driver. For V2G, on an incremental basis, the most valuable V2Garchetypeis‘TheRetiredProfessional’.
The Sciurus project has now reached its conclusion after what became a three-year innovation project. The project started with a hugely ambitious scope of developing, building and installing 1,000 domestic Vehicle-to-Grid (V2G) units in order to develop an understanding of the potential value of V2G, as well as exploring customer acceptance and behaviour. As is common with innovative projects, there have been significant challenges anddifficultiesalongtheway,andanecessaryrescoping of the project. Nevertheless, the project has still been able to achieve something quite remarkable, and now stands as the world’s largest domesticV2G trial to date.
1 Executive Summary

4Project Sciurus Trial Insights
However, the initial capital cost is still a barrier for them, so this cost should be reduced in the structure of the proposition.
If the incremental capital cost of V2G hardware can be reduced to around £1,000 then the payback period forV2G could comfortably be below fiveyears.
In summary, the project found that to make the most from V2G organisations must target the right customer archetypewith a sufficiently sizedEVbattery, using a solution that is able to capture value from grid services and wholesale price spikes, whilst engaging well with the customers to help them understand the benefits V2G canprovide to them personally.
Lockdowns during 2020 affected the EV plug-in availability by increasing it to 70% over the year (compared with 57% pre-lockdown). Both represent a significant behaviour changecompared with non-V2G plug-in availability of around 30%-40%. The annual equivalent driving energy was reduced to around 1,757 kWh, areductionof670kWhfrompre-lockdownlevels.
The simulated annual revenue from V2G using tariff optimisation was £340 compared with an unmanaged charger. Including Firm Frequency Response provision from V2G this figure risesto £513 (an increase of £29/kW) and includingDynamic Containment it rises to £725 (an increaseof£64/kW).Bycontrast,smartcharging(not using V2G) can capture £120 from tariff optimisation. Finally, whilst providing Dynamic Containment is lucrative, there are technical challenges in providing the services from a portfolio of V2G units.
It should be noted that upcoming changes to the structure of charges in domestic tariffs will reduce the annual revenue possible from V2G tariff optimisation by around 50%. The project also identified thatEVswithbatterysizesof40kWhorabovewereabletocapturemorerevenuethrough V2G tariff optimisation than smaller battery sizes.
However, the Sciurus project set out to evaluate more than economic value for V2G, but also customer acceptance and behaviour. It is encouraging to see that participation in the Sciurus trial alleviated the vast majority of participants’concernsregardingV2Gtechnology.Participants also reported that it was important to them that their next EV had V2G capability. This demonstrates that there are domestic customers that are ready for a V2G proposition.

5 Project Sciurus Trial Insights
use. The V2G units are aggregated, optimised, and scheduled by the Kaluza Intelligent Energy platform in order to make money and support the grid. Finally, the customers have a simple proposition where they get paidafixedrateforeverykWhthatisexported.
By October 2019 the one hundredth V2G unit was installed, which means that by the end of 2020 there was at least 12 months of real-world data for over 100 units. It was this data that has been used for the majority of the analysis in this report.
The Sciurus project has now reached its conclusion at the end of what has become a three-year innovation project. The project started in April 2018 with OVO Energy, Cenex, Nissan and Indra. It had a hugely ambitious scope of manufacturing and installing 1,000 V2G units in homes across the UK in just two years. The project combined experts in energy, transport, and infrastructure to develop a real-world domestic solution for V2G which was to be proved through the roll out of the V2G units in real homes across the UK. The project aimed to create both technology and business cases to prove the economic, environmental and societal value of V2G.
In time it became clear that some aspects of the original scope were a step too far. There was a limit to the number of customers in the UK that had a compatible EV (i.e. a Nissan Leaf) and were willing and able to have a V2G unit installed. It also took longer than expected for the designed V2G unit to gain CHAdeMO certification. As a result, the targetnumber of units was reduced to between 300 and 400, and the duration was increased to three years, to provide extra time to get units installed and gather data from them. As is common in innovation projects thereweresignificantchallengesanddifficultiesalongthe way. Nevertheless, the project was still been able to achieve something quite remarkable, and stands as theworld’slargestdomesticV2Gtrialtodate.
There are now over 320 V2G units installed in homes across the UK. These units are provided to customers in conjunction with a customer app through which they can set their preferences for the charging parameters and remain in control of when their vehicle is ready to
2 Introduction
3 Analysis OverviewIn previous analysis on the project, the data collected between Q4 2019 and Q1 2020 was analysed. This report goes further by:
- Analysing the data for the whole of 2020.
- Assessing the impact of the multiple lockdowns on the dataset.
- Quantifying the differences in the data when assigning customers to archetypes.
- Comparing data with results from a participant survey.
Data from each of the V2G chargepoints has been collected throughout the trial. This data includes energy flows to and from theEV, the plug-in status and theState of Charge (SoC) of the EV battery. An online participant survey was also completed by some of the trial participants during the summer of 2020.
First, the V2G chargepoint data from 2020 was cleaned and analysed. Then the household demand data recorded during 2020 was also analysed. The V2G data was then cross referenced with the responses from the customers survey, to link the data to customer archetypes. Finally, the data was input into the Cenex REVOLVE model to provide an assessment of potential revenue for different customers, time periods and input assumptions.

6Project Sciurus Trial Insights
This data has been summarised as the total driving energy per week for each vehicle on the trial in Figure 1.Theimpactofthefirstnational lockdown(from1stApril) can clearly be seen as a darker band in the figure.Lowerdrivingenergycanalsobeseen in thefirstandlastweeksoftheyearduetotheChristmasholidays.Thefigurealsoshowshownewparticipantsjoined the trial incrementally throughout the year, as the number of vehicles increases.
The data from the V2G chargepoints was cleaned to remove records that were either duplicated or otherwise spurious. This resulted in a total of data for 305 chargepoints being taken forwards for analysis and modelling. The charging session times and dates were used to determine all the periods the vehicles were plugged in. The SoC recorded at the beginning and end of each charging session, combined with the known battery capacity of each vehicle, was used to derive approximate driving energy demands for each vehicle every time it was unplugged.
3 Analysis of 2020 Chargepoint Data
6Project Sciurus Trial Insights
Figure 1: Weekly Driving EnergyHeatmap
After weighting the total driving energy based on how long each EV was in the trial, a histogram of the annual equivalent total driving energy was produced (see Figure 2). The mean annual equivalent driving energy was1,757kWh.Takingthecombinedenergy consumption of a Nissan Leaf (265 Whpermile),thisisequivalentto6,630 miles per year. This is slightly lower than the national average of 7,400for2019andislikelyreflectiveofthe impact of the various lockdowns.
Annual Equivalent Driving Energy (kWh)
[0, 5
00]
[500
, 100
0][1
000,
1,5
00]
1,50
0, 2
,000
][2
,000
, 2,5
00]
[2,5
00, 3
,000
][3
,000
, 3,5
00]
[3,5
00, 4
,000
][4
,000
, 4,5
00]
[4,5
00, 5
,000
][5
,000
, 5,5
00]
[5,5
00, 6
,000
][6
,000
, 6,5
00]
[6,5
00, 7
,000
]
Cou
nt o
f EVs
0
10
20
30
40
50
60
70
80
Figure 2: Histogram of Annual Equivalent Driving Energy
Driving Energy

7 Project Sciurus Trial Insights
Responses from the participant survey tell us that 75% of the participants plug in their EV after every trip (see Figure 4). This already represents a behaviour change compared to normal EV plug in behaviour, which is typically every few days. If the participant survey is representative of behaviour across the trial, then the availability levels we are seeing in the chargepoint data is already at the high end of what is possible, i.e., much higher plug-in rates are not possible.
The time that the EV is plugged in to the V2G chargepoint and available for charging (i.e. availability) was calculated for each chargepoint. Again, the data is presented as a weekly average heatmap for each EV in Figure 3. As previously, we see the impact of the firstnationallockdowninAprilsignificantlyincreasingthe EV availability. It should be noted however, that the four vertical green bands in the data set (weeks 14, 18, 27 & 31) are due to data collection issues rather than the underlying behaviour.
3.1 EV Plug-in Behaviour
Figure 3:
Heatmap of Weekly Availability per EV
Figure 4:
Participant survey Response on Plug-In Frequency
4%
75%
18%
3%
How often do you plug in your EV at home?(141 Responses)
Only when it needs a chargeAfter every tripAfter the last trip of the dayEvery couple of days
Only when it needs a charge
Every couple of days
After the last trip of the day
After every trip
Availability Heatmap

8Project Sciurus Trial Insights
Outliers are denoted as dots. The bottom plot in Figure 5 shows the spread of the total charging sessions throughout the year. The number of sessions ramp up throughout the year as the number of participants on the trial increases.
Figure 5 shows a box plot of EV availability across the portfolio by month. The box in the plot denotes the central two quartiles of the distribution (i.e., 50% of the data), and the ‘whiskers’ show the limits ofthe remaining data. The line in the box denotes the median value.
Figure 5:
Monthly Availability Box Plot (top), Charging Sessions Distribution Across Year (bottom)
Figure 6:
Distribution of Plug in/Unplug Times
The chargepoint data was also analysed to understand when trial participants were plugging in and unplugging their vehicles. The resulting distribution is shown in Figure 6. This shows the percentage of EVs that either plug in or unplug during in each hour of the day. The mean value across the year is shown for each hour.
As expected, there is a peak of plug-in events at 5pm on weekdays. Unplugging events peak at 8am on weekdays, but there is a plateau of unplug events between 11am and 6pm. The weekend distributions show a later peak in unplug times, and an earlier peak in plug-in times. This results in a higher overall EV availability at weekends.
8Project Sciurus Trial Insights
Plug in/Unplug Times
Monthly Availability

9 Project Sciurus Trial Insights
Figure 7 shows a distribution of the duration of charging sessions both before and during lockdown. In both cases, most charging sessions are very short, followed by a peak at around 18 hours. Subsequent peaks then occur 24 hours apart, showing the pattern of EVs being left to charge overnight and then for subsequent days at a time.
3.1 EV Plug-in Behaviour
Figure 7: Charging Session Duration Distribution
Arguably, the only ‘normal’ period of 2020 in termsof driving behaviour was at the start of the year until shortly before the first national lockdown.The remainder of 2020 included differing levels for restrictions on movement for most of the country. A summary of these periods is provided in Figure 8. Figure 8:
2020 Lockdown Dates
3.2 Effect of Lockdown
01 Jan to 31 Mar
01 Apr to 04 Jul
05 Jul to 04 Nov
05 Nov to 01 Dec
02 Dec to 31 Dec
01 Apr to 31 Dec
Pre-Lockdown
National Lockdown 1
Tiered Lockdown 1
National Lockdown 2
Tiered Lockdown 2
Lockdown
Session Duration Distribution During Lockdown

10Project Sciurus Trial Insights
Table 1: Mean EV Availability for Lockdown Periods
In someof the above figureswe caneasily seeanimpact of these restrictions on the data collected. One of the key value drivers of V2G operation is EV Availability. The impact of the restrictions upon availability has been shown in Figure 9. In the distributions following the Pre-lockdown period, we see the peak shift to the right.
Figure 9:
Distributions of EV Availability for Each Restriction Period
10Project Sciurus Trial Insights
This shows that the amount of time EVs were left plugged in had increased. The impact on the mean EV availability is shown in Table 1. Note that the Tiered Lockdown 2 covers only a short period including the Christmas Holidays, which likely contributed to the high mean.
PERIOD MEAN AVAILABILITY
Pre-lockdown
NationalLockdown 1
TieredLockdown 1
TieredLockdown 2
NationalLockdown 2
01 JANUARY - 31 MARCH 68%
01 APRIL - 04 JULY 72%
05 JULY - 04 NOVEMBER 67%
05 NOVEMBER - 01 DECEMBER 72%
02 DECEMBER - 31 DECEMBER 75%
Availability During Lockdown

11 Project Sciurus Trial Insights
An additional complication in the data arises from the fact that when the survey was taken, people were not using their vehicles in a typical way because of the coronavirus pandemic. This may well have led to respondents self-identifying more with archetypes such as the Retired Professional, with a lower vehicle usage.
The count of the identified archetypes (i.e. predictedarchetypes from the questions) from the survey respondents is shown in Figure 10. This shows that themost common archetype identifiedwas theRun-around (EV as 2nd Car), with the Retired Professional in second place. Together these represent over a third of all respondents.
During the summer of 2020 OVO Energy sent out a survey to participants in the trial. The survey included questions that could help classify the respondents into one of the several V2G archetypes that were created early on in the project (see the Cenex project report ‘IntroductiontoCustomerArchetypes’).
137 respondents to the survey were able to be classified into archetypes. A summary of thearchetypedefinitions is provided in theAppendix ofthis report. There was also an additional question where the customer could essentially self-identify their EVusagebehaviourandthusprovideaclassificationof themselves. However, in only 15 cases the self-identifiedarchetypematchedthearchetypepredictedfrom the earlier questions.
3.3 Customer Archetypes
5
15
3
14
1
6
19
10
22
29
94
Archetype of Survery Respondents
First Generation EV Owner
The Conservative Eco-ProfessionalThe Eco Young Professional
The Eco-Professional
The Mid-level Manager
The City Estate Agent (Citybased)The Family Car
The One Car Wonder
The Retired Professional
The Run-around (EV as 2ndCar)
The Self-employed Taxi Driver(e.g. UBER)Utility-Style Fleet Vans(Council vehicles/ energysuppliers)
Archetype of Survey Respondents
Figure 10: Count of Identified Archetypes in Survey Respondents

12Project Sciurus Trial Insights
Of the survey respondents, 131 were able to be matched with chargepoint data collected during the trial. Due to the peculiarities of 2020 (with multiple national lockdowns periods) only the first portion ofthe year up to 23rd March was taken for the following analysis. For 131 participants in the V2G trial, where we could match the V2G unit data with respondents
to the survey, the mean EV plug-in availability (i.e. percentage of the time the EV was plugged in) and mean annual equivalent driving energy (i.e. equivalent totalnumberofkWhusedbytheEVfordrivingoverafull year) was calculated. The results of this analysis are shown in Table 2.
COUNT (PRE-LOCKDOWN) MEAN ANNUAL EQUIVALENTDRIVING ENERGY (kWh)MEAN AVAILABILITY
Utility-Style Fleet Vans
The Self-employed Taxi Driver
The Run-around (EV as 2nd Car)
The One Car Wonder
The Retired Professional
4 4,931
3,331
2,423
1,755
2,041
ARCHETYPE NAME
55%
6 69%
22 69%
19 77%
7 66%
The Family Car
The Eco-Professional
The Conservative Eco-Professional
The Eco Young Professional
3,103
2,309
2,527
2,048
13 74%
13 65%
3 57%
12 73%
The City Estate Agent (City based)
First Generation EV Owner
TOTAL
1,321
2,422
2,402
5 80%
2 74%
106 71%
Table 2: Comparison of EV Usage Across Archetypes
Whilst there does appear to be some variance inthe means for the different archetypes, given the difference in means and the size of the samples, it is notimmediatelyclearifthedifferencesaresignificant.Inordertodeterminestatisticalsignificance,ANOVA* was used.
* Analysis of Variance: a collection of statistical tools used to analyse the differences between means in a data set.
When analysing the mean EV availability we wereunable to reject the null hypothesis (that all population meanswereequal),obtainingapvalueof0.47.Whenanalysing the mean annual equivalent driving energy however, we could reject the null hypothesis with a p value of 0.03. This suggests that the variance in the meansacrossthearchetypesisstatisticallysignificantfor the annual equivalent driving energy, but not for the EV availability.

13 Project Sciurus Trial Insights
Plotting the weekly average driving energy over the entire year for each archetype as a heatmap (Figure 11),doesshowwhatappearstobesignificant
Figure 11: Driving Energy Heatmap for Each Archetype
Figure 12: Availability
Heatmap for Each Archetype
Unfortunately, the data collected during the trial for the household demandwas not of sufficient qualityto be used in the modelling work. There were periods of time where data was missing for almost the entire dataset, and additional periods where data was missing on individual sites.
Around 15% of the households contained less than half the number of data records expected. The remaining datahadsignificantnumbersofspuriousvalues(suchas negative demand during the night). The combination of these factors meant that this data set was abandoned.
differences in energy for a few of the archetypes during the pre-lockdown period. A similar heatmap for average availability is shown in Figure 12.
13 Project Sciurus Trial Insights
3.4 Analysis of Household Demand Data
Average Driving Energy per Archetype
Average Availability per Archetype

14Project Sciurus Trial Insights
The model optimises the charging/discharging behaviour of individual EVs on a minimum cost basis using the import and export tariffs available to the EV. Whilstthemodelcoversanentireyear,itdoesthisbyoptimising weekly blocks one at a time. Each EV in the model has an associated driving energy and plug-in availability data set for the year. It also includes the local electricity demand for the site or building(s) the chargepoint is connected to. The chargepoint is assumed to be behind-the-meter and so, by discharging the EV, the local demand can be offset.
The chargepoints in the model can also be aggregated up and offered to provide grid services. Themodel stacks the available flexibility inherent inthe chargepoints to build up the grid service product window requirements. To provide a grid service, aminimum capacity (inMW)must be held in eitheran upwards or downwards (or both) direction, for the specified grid service periods. During the entireservice periods, themodelmust also hold sufficientstored energy/demand reduction (or battery headroom) to meet a minimum length of call of the grid service product. Note that whilst this headroom/footroom is held, the model does not currently simulate the actual calls due to the additional modelling complication this adds.
The modelling for this work package has been performed using the Cenex REVOLVE model. REVOLVE is a perfect foresight optimisation model capable of simulating the charging/discharging behaviour of large numbers of EVs at half hourly granularity over a year.
4 REVOLVE Model
14Project Sciurus Trial Insights
KEY FEATURES:
• Simulates charging/discharging of up to a few hundred EVs
• Customisable constraints on max charging / discharging power to allow modelling of specificorgenericV2Gunits
• Customisable constraints on max/min storage capacity of EVs to allow modelling ofspecificorgenericvehicles
• Constraints on EV availability (plug-in times) and requirement to make journeys (energy demand)
• Modelling of: - charging/discharging losses - half-hourly varying import and export tariffs - flexibilityofcharging/dischargingforthe provision of grid services
• Simulation of local PV generation
• Optimises EV charging/discharging against behind-the-meter value streams and grid services
• Customisable warranty constraint modelling throughoptionallimitingofmaximumkWhof V2G provision per vehicle per day
• Evaluation of the impact of battery degradation costs on V2G revenue streams

15 Project Sciurus Trial Insights
Models are inherently approximations of the real world and rely on a range of assumptions. These include areas such as hardware assumptions, price assumptions, and behaviour assumptions. The key assumptions used in this analysis are set out within the following sections. Further assumptions implicit in the operation of the model itself can be found in section 4.
Parameters to represent the Indra V2G units used in the trial are as follows:
Max Charge Rate
5 Model Input Assumptions
Figure 13: Cenex REVOLVE Model Diagram
Because the model is a perfect foresight model, it provides an upper bound on the revenue that can be earned through the V2G options modelled. In reality there will be deteriorations in the value through EV availability forecasting error and potentially price forecasting error.
In order to quantify the value provided by V2G, the model firstperformsanUnmanagedrun.Inthis,allEVschargeup to full as soon as they are plugged in. This run is used to create an energy cost baseline. Subsequently, an Optimised run is performed. In this run the charging and discharging behaviour is optimised on the basis of minimum cost.
15 Project Sciurus Trial Insights
5.1 V2G Units
Parameter Value
Max Discharge Rate
ChargingEfficiency
DischargingEfficiency
6 kW
6 kW
98%
92%Table 3: V2G Unit Parameters
Charge Point UsageData / Telemetry
Data
Full Year Journey Demand & Plug In
Data Set (Half Hourly)Use Case Data
Set
Processing /Re-simulating
Charging / DischargingSchedule
Tariffs, Grid Services
Local Demand / PV Generation / Storage
Costs, Revenues,Charging Behaviour, Grid Services Offered
Optimise toMaximiseRevenue

16Project Sciurus Trial Insights
SPOT prices (MID)
5.1 V2G Units
5.2 Tariff Design
Element Import Tariff
DUoS
TNUoS
Levies
Yes
LV Network Domestic, effective April 2020. (WPD West Midlands)
Table 4: Tariff Components
Figure 14: Mean Tariff Prices Throughout the week
A half hourly import and export tariff was constructed. The primary component of these was the half hourly SPOT market prices for the trial period obtained from Elexon. For the import tariff, DUoS, TNUoS and the Capacity Market (CM) supplier charge were added to the relevanthalf hours.Finally, a5p/kWhadditionalcharge to cover other levies was added.
For the export tariff, SPOT prices were combined with the relevant DUoS export tariff. The purpose of the tariff constructionwastoproduceatariffthatfairlyreflectsthemarginal costs of an energy supplier to provide energy to the customer. Note that it has been assumed that the customer is settled on a half hourly basis.
Export Tariff
Yes
CM Supplier Charge
6.5 p/kWh 4pm-7pm (Midlands)
3.5 p/kWh
0.79 p/kWh 4pm-7pm Nov-Feb Weekdays
LV Generation NHH or Aggregate HH / LV Generation Aggregated
6.5 p/kWh 4pm-7pm (Midlands)
None
None
The mean (across the whole year) import tariff throughout the week is given in Figure 14, which clearly shows the daily tariff shape dominated by the TNUoS and peak rate DUoS charges.
0
0.05
0.1
0.15
0.2
0.25
Mon
00:
00M
on 0
4:00
Mon
08:
00M
on 1
2:00
Mon
16:
00M
on 2
0:00
Tue
00:0
0Tu
e 04
:00
Tue
08:0
0Tu
e 12
:00
Tue
16:0
0Tu
e 20
:00
Wed
00:
00W
ed 0
4:00
Wed
08:
00W
ed 1
2:00
Wed
16:
00W
ed 2
0:00
Thu
00:0
0Th
u 04
:00
Thu
08:0
0Th
u 12
:00
Thu
16:0
0Th
u 20
:00
Fri 0
0:00
Fri 0
4:00
Fri 0
8:00
Fri 1
2:00
Fri 1
6:00
Fri 2
0:00
Sat 0
0:00
Sat 0
4:00
Sat 0
8:00
Sat 1
2:00
Sat 1
6:00
Sat 2
0:00
Sun
00:0
0Su
n 04
:00
Sun
08:0
0Su
n 12
:00
Sun
16:0
0Su
n 20
:00
£/kW
h
Import Export

17 Project Sciurus Trial Insights
The range of prices used for the tariff is shown in Figure 15. This shows some extremes in prices. The key variable in the price through the year is the SPOT price component, which has given rise to this variability. A price spike can be seen in week 37, with further spikes in weeks 49 and 10. Additionally it can be seen that through the summer weeks prices got very low on occasions.
5.3 Firm Frequency Response (FFR) Prices
0
0.1
0.2
0.3
0.4
0.5
0.6
0.7
0.8
1 3 5 7 9 11 13 15 17 19 21 23 25 27 29 31 33 35 37 39 41 43 45 47 49 51£/
kWh
Week Number
Weekly Import Prices Ranges
Min - Max Range Median Price
0
0.1
0.2
0.3
0.4
0.5
0.6
0.7
0.8
1 3 5 7 9 11 13 15 17 19 21 23 25 27 29 31 33 35 37 39 41 43 45 47 49 51
£/kW
h
Week Number
Weekly Import Prices Ranges
Min - Max Range Median Price Figure 15: Import Price Weekly Ranges for 2020
Figure 17: Low Frequency Static FFR Prices
Figure 16: Dynamic Low and High FFR Prices
Prices for providing the FFR service were derived fromclearingpricesofNationalGrid’s trialFFRauctions between 07/12/19 and 13/06/20. The auctions split FFR products into six four-hour blocks in a day (EFA blocks), and also into a Dynamic Low and High (DLH) product and a Low Frequency Static (LFS) product. The price structure was simplified to enter it into theREVOLVE model.

18Project Sciurus Trial Insights
5.4 Dynamic Containment
As part of their renewal of balancing services, National Grid have designed a new product called Dynamic Containment. This is a post-fault fast acting balancing service. At the time of writing, the requirements of the service provision are clear, and the product has already had a soft launch.
For the purposes of the modelling work, the following parameters have been assumed:
Provision of the product was set to single full days and the price was kept the same for each day across the year.
Availability Price
Parameter Value
Utilisation Percentage
Minimum Delivery Volume
Capacity Headroom Held
£17/MW/h
0.55%
Equivalent to 15 min at full power
10% of declaredpower
Table 5: Dynamic Containment Parameters
Figure 18: Histogram of Annual Household
Demand
5.5 Household Demand Data
As mentioned previously, the demand data collected duringthetrialwasnotofsufficientqualitytobeused.So instead, a proxy household demand data set was used. The data used is taken from the Low Carbon London study by UKPN, which provided high quality half hourly household demand data.
The data was selected to give a realistic distribution ofhouseholddemandprofiles.Ahistogramofthetotalannual demand is shown in Figure 18.

19 Project Sciurus Trial Insights
However, we do know that 2020 was not a typical year in terms of EV usage. Due to COVID-19, EVs were being driven less and plugged in for longer than under normal circumstances. Analysing the value made during different weeks of the year can give some additional insight as shown in the following section.
6.1 Value of V2G Using Tariff Optimisation and FFR
Thefirstmodelrunsperformedwerewiththefullyearof data. However, as participants joined the trial at different points during the year, some work was done to normalise the results on a per EV and per week basis. These normalised results could then be summed up to give a per EV per year result, which can be seen in Table 6. Due to constraints within the model itself, all EVswereassumedtohave40kWhbatterycapacity(the most common size) for this run. FFR was the only grid service used in this model run. Results are stated in terms of an annual saving versus an unmanaged charging option (i.e. where the EV charges to full as soon as it is plugged in)
19 Project Sciurus Trial Insights
This section discusses the result from running the whole of the chargepoint data for 2020 (along with the other parameters outlined above in section 4) in the Cenex REVOLVE model.
6 V2G Value Assessment
Optimised Smart
Run Annual Per Customer Revenue
Optimised V2G
Optimised V2G +FFR
£120
£340
£513
Table 6: Full Year Results
The Optimised Smart run gives the value of a uni-directional chargepoint optimised against the time varying tariff. The Optimised V2G uses the same import and export tariff, but a bi-directional V2G chargepoint.ThefinalrunallowsthepossibilityoftheV2G units to offer FFR. The revenue for each of these runs is calculated by comparing against an unmanaged chargepoint using the same time of use tariff settled on a half hourly basis.
These summary results show an incremental value of V2G above Smart of £220 per year. However, by adding in FFR an additional £173 can be captured.
6.2 Effect of Lockdown on Value
Results from the model runs were output at a weekly level to see the effects of the different lockdown periods on the revenue and EV usage. Figure 19 demonstrates the changes in tariff optimisation value throughout the year.

20Project Sciurus Trial InsightsFigure 19: Weekly Tariff Optimisation Values from 2020 Model Run
0
10
20
30
40
50
60
70
80
90
100
£-
£2.00
£4.00
£6.00
£8.00
£10.00
£12.00
£14.00
1 3 5 7 9 11 13 15 17 19 21 23 25 27 29 31 33 35 37 39 41 43 45 47 49 51
kWh
Week Number
Value of Optimised Smart Per EV (£) Value of Optimised V2G Per EV (£)Mean Driving Energy (kWh)
From the figure we can see that the value in eachweek for both the Optimised Smart and the Optimised V2G are strongly correlated. There is a noticeable dip in revenues from week 12 just before the firstnational lockdown. Revenues then recover slowly as the year progresses. As the optimisation is based on the shifting of the charging energy, one driver of the revenue is the driving energy in each week. This is plottedonthefigureasthedashedlineandshowsastrong correlation to the values of both smart and V2G optimisation.
There are also spikes in the value, particularly for V2G and most noticeably in weeks 37 and 49. By comparing thisfigurewithFigure 14 showing the maximum tariff prices in each week, we see that these value spikes match up with the tariff price spikes.
From the Optimised + FFR run, the weekly FFR revenue was extracted from the model and is shown in Figure 20. The mean EV availability has also been added to thefigure,andthecorrelationbetweenthelinescanbeseen. Note that weeks 13, 18, 27 and 31 are showing lower availability due to data collection issues in those weeks and should therefore be counted as spurious results.
20Project Sciurus Trial Insights
40%
45%
50%
55%
60%
65%
70%
75%
80%
85%
£-
£0.50
£1.00
£1.50
£2.00
£2.50
£3.00
£3.50
£4.00
£4.50
£5.00
1 3 5 7 9 11 13 15 17 19 21 23 25 27 29 31 33 35 37 39 41 43 45 47 49 51
Week Number
Absolute FFR Value Per EV (£) Mean Availability per week (%)

21 Project Sciurus Trial Insights
Optimised V2G + DC
Run Annual Per Customer Revenue
£725
Table 7: Full Year Results for DC
Nevertheless, the early prices seen of £17/MW/h aresignificantlyhigherthanFFR.TheannualrevenueperEV is shown in Table 7.
• The initiated response must be within 0.5 second, with full response by 1 second.
• Assets must be aggregated up to a minimum of 1MW.
• Whilstassetscanbeaggregatedwithinasingle Grid Supply Point (GSP), the frequency must be measured locally at each asset to within 0.01 Hz error.
• 20 Hz settlement metering must be installed.
• StateofEnergyrulesprescribethat100MWofDC provision must be backed by a Minimum Energy Requirementofatleast25MWh(equivalentto15min at full power) of energy and must recover energy (a MinimumEnergyRecoveryRequirement)of5MWh per settlement period (equivalent to 3 min at full power) using the baseline.
National grid has recently performed a soft launch of the new Dynamic Containment (DC) product. This is a fast-responding post fault balancing service. Although it is early days in terms of the provision of the service, the prices for provision are encouraging, and since this is a faster responding service than FFR it is likely that this will always trade at a premium relative to FFR. WhilsttheprovisionofDCistheoreticallypossiblebyV2G units, there are a number of conditions that add both cost and complexity to the provision.
6.3 Feasibility and Value of Dynamic Containment
Splitting this value down into weeks (Figure 21) we can see a strong correlation between the mean availability in the week and the value captured from DC.
These are:
40%
45%
50%
55%
60%
65%
70%
75%
80%
85%
90%
£-
£2.00
£4.00
£6.00
£8.00
£10.00
£12.00
1 3 5 7 9 11 13 15 17 19 21 23 25 27 29 31 33 35 37 39 41 43 45 47 49 51
Week Number
Absolute DC Value Per EV (£) Mean Availability per week (%)
Figure 21: Weekly Value of DC per EV from 2020 Model Run

22Project Sciurus Trial Insights
Optimised Smart
Run Annual Per Customer Revenue
£83
Figure 22: Mean Import and Export Tariff prices
6.4 Impact of TCR and Export DUoS
There are two significant changes looming to thechargesofenergyfordomesticpremises.Thefirstofthese brought by the Targeted Charging Review (TCR) is the removal of time of use based TNUoS charges (specifically the Transmission Demand Residual).This change, now due to be implemented in April 2023,willseeitreplacedwithabandedfixedcharge.
The second change is that from April 2021 DUoS export rates for domestic premises become shaped rather than flat.Theimpactofthesetwochangesisareductioninpeak import prices, and an increase in peak export prices. These changes can be seen in Figure 22.
0
0.05
0.1
0.15
0.2
0.25
Mon
00:
00M
on 0
4:00
Mon
08:
00M
on 1
2:00
Mon
16:
00M
on 2
0:00
Tue
00:0
0Tu
e 04
:00
Tue
08:0
0Tu
e 12
:00
Tue
16:0
0Tu
e 20
:00
Wed
00:
00W
ed 0
4:00
Wed
08:
00W
ed 1
2:00
Wed
16:
00W
ed 2
0:00
Thu
00:0
0Th
u 04
:00
Thu
08:0
0Th
u 12
:00
Thu
16:0
0Th
u 20
:00
Fri 0
0:00
Fri 0
4:00
Fri 0
8:00
Fri 1
2:00
Fri 1
6:00
Fri 2
0:00
Sat 0
0:00
Sat 0
4:00
Sat 0
8:00
Sat 1
2:00
Sat 1
6:00
Sat 2
0:00
Sun
00:0
0Su
n 04
:00
Sun
08:0
0Su
n 12
:00
Sun
16:0
0Su
n 20
:00
£/kW
h
Import Pre TCR Export Pre TCR Import Post TCR Export Post TCR
Table 8: Full Year Results for Revised Tariff
The REVOLVE model was run for the full year with these revised tariffs (Import No TNUoS, Export Shaped DUoS) in place. The resulting revenue per customer can be seen in Table 8. The result is a 50% decrease in value for V2G (excluding any grid services). Optimised V2G £173

23 Project Sciurus Trial Insights23 Project Sciurus Trial Insights
During the trial data on the battery capacity of each EV in the trial was collected. Participants were segmented by the different battery capacities of their
6.5 Segmentation into EV Battery Capacities
vehicles, and a model run was performed to understand how EV battery capacity could affect the revenue available to V2G optimisation. The results are shown in Table 9.
BATTERY CAPACITY:
Optimised Smart
24 kWh
£102
Annual Per Customer Revenue
30 kWh
£134
40 kWh
£100
62 kWh
£105
Optimised V2G £313 £344 £352 £358
Incremental V2G £211 £210 £252 £253
No. of Participants 37 81 163 24
The value of the Smart optimisation shows no real pattern by battery capacity. This is because the driver for value with a uni-directional chargepoint is the total driving energy rather than battery size, and this total driving energy varies between segments. However, the incremental V2G value (i.e. difference between Optimised V2G and Optimised Smart) does show an increase in value of 20% for the larger battery capacities.
Whilst this couldbedue todifferences in theplug-intimes or availability within the different segments, it is more likely due to the EVs with larger batteries being able to provide greater arbitrage volumes. This could be because when EVs plug in partially drained the larger batteries can still discharge more during any immediate higher priced periods.
Table 9: Full Year Results by EV Battery Capacity

24Project Sciurus Trial Insights
Figure 23: Annual per EV Simulated Revenues
6.6 Segmentation into Archetypes
Using the archetype classification provided by theparticipant survey, groups of each customer archetype were created from the trial data. These groups were then run through the REVOLVE model with all the data for them that was present in 2020. The value of the Smart Optimisation, the incremental value of V2G, and incremental value from FFR for each archetype is shown in Figure 23.
The results in Figure 23 are ordered by the incremental valueoftheV2Goptimisation.WecanclearlyseethatThe Retired Professional archetype has the highest incremental V2G value. However, the optimised Smart values are in almost the reverse order, with the Utility-Style Fleet Vans having the highest value. If all revenue streams are added, then the Self-Employed Taxi Driver becomes the highest. This demonstrates the point that the archetype choice is important for different technical solutions.
These results do have the caveat that 2020 was not an average year for both driving and plug-in behaviour.
£-
£50
£100
£150
£200
£250
£300
The Retired Profes
sional
The Conservati
ve Eco
-Professio
nal
First G
eneratio
n EV Owner
The City Esta
te Agent (C
ity base
d)
The Self-employe
d Taxi D
river
The Family
Car
The Run-around (EV as 2nd Car)
The One Car Wonder
The Eco-Professional
The Eco Young Professio
nal
Utility-Style Flee
t Van
s
Optimised Smart Value Incremental V2G Value Incremental FFR Value

25 Project Sciurus Trial Insights
There are some changes in the future that could potentially have positive impacts on the business case. Firstly, whilst the outcome of the Access and Forward Looking Charges SCR is still unknown, however this may have a positive effect on V2G revenue. In recent years we have seen an increase in SPOT price volatility. If this trend continues, (which is likely) then revenues fromV2Gcouldincreaseinthefuture.Andfinally,theBalancing Mechanism (BM) is currently undergoing reforms with the aim of lowering barriers to entry. The BM could provide a significant revenue stream for aportfolio of V2G assets rather like those created in this trial.
Itisverydifficulttomodelthisuncertaintyontherevenueof V2G, however a simple more positive alternative is presentedasathirdscenario.ThisisthefinalcolumninTable 11 and gives the payback of V2G with the lower hardware costs and ignoring any detrimental impact of theTCR.Weare not saying that theTCRwill notbe implemented, but rather this represents a scenario where other positive factors compensate for the impact of the TCR. Under this scenario, the payback period becomes favourable under all three revenue options.
Using the results from the analysis, a simple financialmodelwas created to assess the businesscase for domestic V2G. The following additional assumptions were made:• Incremental hardware and installation cost of V2G chargepoint above Smart chargepoint: £3,700
• Device replacement rate over a three-year period: 5%
Given that domestic EV drivers would normally buy a Smart charger if they could accommodate one, the incremental case for a V2G charger above a Smart charger is presented here. In order to calculate this, both incremental costs of hardware (above Smart) and incremental revenues are used. The impact of the TCR (occurring from April 2023) has also been accounted for, which reduces revenues significantly from thesecond year of the payback calculation onwards. The simple payback of the V2G unit is calculated and shown in Table 11. At the end of the trial, the incremental hardware cost was around £3,700. However, with mass production, this cost could come down further, and so an alternative case with £1,000 incremental hardware cost is also presented as a second scenario.
Theses results show that there is a need for the hardware cost to come down further to make the case for V2G economic in this use case. However, with the hardware cost reduction, and at least one additional revenue stream (such as FFR or DC) the payback times become very reasonable.
7 High Level Business Case
REVENUE OPTION
Optimised V2G
Current V2G Hardware Cost
>30
Simple Payback Period (years)
Incremental V2G Hardware Cost at £1,000
9
Incremental V2G Hardware Cost at £1,000 & Without TCR
5
Optimised V2G + FFR 14 4 3
Optimised V2G + DC 8 2 2
Table 11: Payback Periods

26Project Sciurus Trial Insights
Figure 24: Results from Survey Question on V2G Importance
Figure 25: Results from Survey Question on Likelihood of Nissan EV Purchase
Participants were asked how important it is for them for their next EV purchase to be V2G capable. 73% of respondents said it was either important or highly important (see Figure 24).
The online participant survey that was sent out to participants in the Summer of 2020, was responded to by 145 participants, 140 of which completed the full survey of 20 questions. Highlights of the results are provided in this section.
8 Participant Survey Insights and Implications for Proposition
26Project Sciurus Trial Insights
4%6%
17%
33%
40%
How important is it for you that your next EV purchase is V2G-capable?
Not at all importantNot very importantIn the middleImportantHighly Important
Beyond that, they were then asked if only Nissan provided V2G, how likely it would be that they next buy a Nissan EV. The results in Figure 25 show 61% of respondents saying that it would be likely or highly likely. It seems clear that the V2G capability on the EV has promoted brand loyalty.
Whenparticipantswereaskedhowlikely they would be to purchase V2G hardware at a series of price points, the results (see Figure 26 on the following page) were less encouraging. Only 20% of respondents were likely or highly likely to purchase the V2G hardware at the lowest price point tested of £3,000 to £3,500. The cost of installed hardware within the trial was £4,700 plus VAT, which shows that prices need to reduce further to encourage uptake. Alternatively, funding propositions that avoid a high initial capital outlay by the customer need to be considered.
9%
9%
21%
28%
33%
If Nissan continues to be the only car manufacturer with fully electric V2G-enabled vehicles in the UK, how likely
is it that your next EV purchase will be a Nissan EV?
Highly unlikelyUnlikelyIn the middleLikelyHighly likely
9%
9%
21%
28%
33%
If Nissan continues to be the only car manufacturer with fully electric V2G-enabled vehicles in the UK, how likely
is it that your next EV purchase will be a Nissan EV?
Highly unlikelyUnlikelyIn the middleLikelyHighly likely
If Nissan continues to be the only car manufacturer with fully electric V2G-enabled vehicles in the UK, how likely is it that your next EV purchase will be a Nissan EV?

27 Project Sciurus Trial Insights
In the survey the project asked participants what their concerns were (if any) both at the start of the trial, and after having experience of using the V2G charger. At the start of the trial, respondents reported a number of concerns, of which the main ones are shown in Figure 27. The most reported concern was battery degradation, followed by reliability.
Only a minority of respondents had no concerns. This contrasts with the responses after having experience with using the charger (Figure 28) when the vast majority of respondents had no concerns anymore. This shows that the trial itself went a long way to alleviating participants’ concerns and buildingconfidenceintheV2Gtechnologyandsolution provided.
8.1Discussionontheimpactofthesefindingsontheproposition
0%10%20%30%40%50%60%70%80%90%
100%
£3,000 to £3,500 £3,500 to £4,000 £4,000 to £4,500 £4,500 to £5,000
How likely are you to purchase the V2G charger at the following prices (inclusive of hardware, installation and
VAT)?
Highly likelyLikelyIn the middleUnlikelyHighly unlikely
Figure 26: Results from Survey Question on Likelihood of Purchasing V2G Hardware
Figure 27: Results from Survey Question on Concerns Before Trial
Figure 28: Results from Survey Question on Concerns After Trial
05
10152025303540
None Battery degradation
Reliability Car not charged
Costs Useability
Grouped Main Concerns Mentioned At the Start of the Trial
0102030405060708090100
None
Minor T
ech I
ssues
Tech I
ssue -
Can't p
rehea
t EV
Range
(loss)
Degrad
ation
(neg
ative
)
Degrad
ation
(pos
itive)
Compla
ints
Grouped Main Changes to EV Noticed After Using V2G Charger

28Project Sciurus Trial Insights
Using the data from 2020, the project found that using the optimisation model the average annual revenue that could be made with a V2G chargepoint was £340. If FFR was included as a revenue stream, then this rose to £513 (an increase of £29/kW).However,of thisrevenue£120of itcouldbecaptured by an optimised Smart (uni-directional) chargepoint.
DynamicContainmentprovidesasignificantextravalue,howevertherearealsosignificantchallengesto implementing Dynamic Containment with a portfolio of V2G chargepoints. A V2G chargepoint providing tariff optimisation and Dynamic Containment could capture up to £725 (an increase of£64/kW)peryear.
The value that V2G can make through tariff optimisation is highly correlated with the volume of the driving energy, while the value V2G can make from either FFR or DC, is highly correlated with the EV plug-in availability (i.e. the total amount of time the EV is plugged in).
Price spikes occurring in the wholesale market, (if accessiblebyV2G)provideasignificantopportunityfor revenue. In weeks with price spikes, V2G was able to capture twice the revenue than the average week.
The net impact of removal of time of use based TNUoS charges (through the TCR) and a shaped export DUoS element to the tariff, is a 50% reduction in annual revenue captured by V2G.
Out of survey respondents (which covered about half of the trial participants) twelve different archetypes were represented. The most common archetypeswere‘TheRun-around’and‘TheRetiredProfessional’.Thesearchetypesarecharacterisedby a high plug-in availability making them very suitable for V2G.
From the data collected within the trial the project found statistically significant evidence that thedriving energy of different archetypes does vary. However, the projectwas unable to confirm fromthedatathattheEVavailabilityvariessignificantlybetween archetypes.
For V2G, on an incremental basis the most valuablecustomerarchetypefromthedatais‘TheRetired Professional’. This archetype has one ofthe highest EV plug-in availabilities. However, on an absolute basis and including the FFR revenue stream, the most valuable V2G archetype is the ‘Self-EmployedTaxiDriver’.
Lockdowns affected the data collected in the trial by increasing the plug-in availability of the EVs during periods of lockdown. The annual availability during 2020was70%,significantlyhigher than the57%seen during pre-lockdown levels. Both represent a significantbehaviourchangecomparedwithnon-V2G plug-in availability of around 30% - 40%. The annual equivalent driving energy was also reduced toaround1,757kWh,areductionof670kWhfrompre-lockdown levels.
This analysis of the Sciurus trial of over 320 V2G units during 2020 has provided thefollowingfindingsandinsights.
9 Conclusions & Recommendations
28Project Sciurus Trial Insights

29 Project Sciurus Trial Insights29 Project Sciurus Trial Insights
WhilstthecostofV2Ghardwarehasbeenreducedsignificantly by this project, the cost is still toohigh for most customers and in order to make the financialbusinesscasestackup for theoperator.It is clear that a reduction to the incremental cost of a V2G chargepoint (above a Smart chargepoint) is necessary. To make the business case viable, an additional revenue stream to a tariff-based optimisation must be considered. FFR, DC or the Balancing Mechanism may provide these opportunities.
EVswith battery sizesof 40 kWhandaboveareable to yield about 20% higher annual V2G revenue than smaller battery sizes.
Participation in the trial was able to alleviate the vast majority of concerns that participants had with V2G technology.
Three quarters of participants surveyed think that it is important to have V2G capability in their next EV as a result of engaging with this trial.
V2G capability in vehicles inspires brand loyalty, with 61% of participants surveyed saying they would be likely to purchase a Nissan EV if Nissan were the only manufacturer with fully electric V2G-enabled vehicles available in the UK.
WhendesigningtheV2Goptimisationandrequiredback-end systems, the ability to capitalise on wholesale price spikes should be included, as this providesignificantrevenueiftheycanberespondedto.
Theinitialfinancialoutlayforcustomersshouldbereduced, either via hardware cost reductions, or a revised proposition.
EVwithbatteriesof40kWhandaboveshouldbetargeted in preference to smaller batteries.
Domestic V2G propositions are suitable for a range of archetypes, however the ‘Utility-Style FleetVans’shouldbe targetedbeing thehighestvaluearchetype (excluding grid services).
The Dynamic Containment product could offer a significantincreaseinV2Grevenue.Thefeasibilityof providing this service with a portfolio of V2G assets should be investigated.
From the project and analysis above, the following recommendations are given:
Key information:
Primary User:
Vehicle:

30Project Sciurus Trial Insights
Thisissomeoneintheir50’sor60’swhoisanearlyadopter of technology. They already have PV on their home, and now an off-street V2G charger. They are very energy concious and would like to maximise battery life. The car is an early EV, used for commuting in the day but spends most of the rest of the time plugged in at home.
V2G Location:
No. of EVs using chargepoint:
V2G Availability:
Potential no. in the UK:
10Appendix:CustomerArchetypeDefinitions
First Generation EV Owner
Key information:
Home
1
40-60%
1k - 10k
Primary User: Usage:
Age Range:Income Bracket:Employment Status:Vehicle Ownership Type:Battery Life Conservation:Primary Motivation:
40-60VariedEmployedOwnedHighEnvironmental
Parking Pattern:Type of trips:Percentage of plugged-intime used for charging:Charging Location:
TECHNOLOGY PROGRESSION BEV
PHEV
N/A2020
PredictableShort/Medium
20-40%
Mostly at this location
Vehicle: Location:
Battery Size:Type of vehicle:
SmallMidsize car
Building ownership type:On-site renewables:Parking Location:
OwnerYesVaried
2030 2040

31 Project Sciurus Trial Insights
Key information:
Primary User:
Vehicle:
This‘Self-employedTaxiDriver’doesmostoftheircharging at an off-street home chargepoint. Their vehicle is used regularly with unpredictable shift patterns. Their high mileage and frugal mindset drives them towards a low running cost EV option.
V2G Location:
No. of EVs using chargepoint:
V2G Availability:
Potential no. in the UK:
Key information:
Home
1
40-60%
100k - 1M
Primary User: Usage:
Age Range:Income Bracket:Employment Status:Vehicle Ownership Type:Battery Life Conservation:Primary Motivation:
VariedBasic RateEmployedOwnedMediumFinancial
Parking Pattern:Type of trips:Percentage of plugged-intime used for charging:Charging Location:
TECHNOLOGY PROGRESSION BEV
PHEV
N/A2020
UnpredictableShort/Medium
40-60%
Mostly at this location
Vehicle: Location:
Battery Size:Type of vehicle:
MediumMidsize car
Building ownership type:On-site renewables:Parking Location:
TenantNoOff-street
2030 2040
The Self-employed Taxi Driver (eg UBER)

32Project Sciurus Trial Insights
The‘CityEstateAgent’hastheirV2Gchargepointat home, to power their small EV optimised for urban use. The EV is used for regular short trips during the day and is always plugged in overnight. They rent their home, and likely have use of another car.
V2G Location:
No. of EVs using chargepoint:
V2G Availability:
Potential no. in the UK:
Key information:
Home
1
40-60%
10k - 100k
Primary User: Usage:
Age Range:Income Bracket:Employment Status:Vehicle Ownership Type:Battery Life Conservation:Primary Motivation:
VariedVariedEmployedCompany vehicleLowFinancial
Parking Pattern:Type of trips:Percentage of plugged-intime used for charging:Charging Location:
TECHNOLOGY PROGRESSION BEV
PHEV
N/A2020
UnpredictableShort/Medium
40-60%
Mostly at this location
Vehicle: Location:
Battery Size:Type of vehicle:
SmallSmall car
Building ownership type:On-site renewables:Parking Location:
TenantNoVaried
2030 2040
Usage:
Location:
The City Estate Agent (City based)

33 Project Sciurus Trial Insights
Key information:
Primary User:
Vehicle:
Themiddle-aged ‘ConservativeEco-Professional’is a higher rate tax payer with an off-street home V2G unit. They are strongly motivated by environmentalbenefitsand likelyhavePVpanelson their home. They own a midsize EV on which the battery is leased, so they will use it in accordance with the warranty conditions.
V2G Location:
No. of EVs using chargepoint:
V2G Availability:
Potential no. in the UK:
Key information:
Home
Few
40-60%
1M - 10M
Primary User: Usage:
Age Range:Income Bracket:Employment Status:Vehicle Ownership Type:Battery Life Conservation:Primary Motivation:
40-60Higher rateEmployedOwnedHighEnvironmental
Parking Pattern:Type of trips:Percentage of plugged-intime used for charging:Charging Location:
TECHNOLOGY PROGRESSION BEV
PHEV
N/A2020
PredictableShort/Medium
20-40%
Varied
Vehicle: Location:
Battery Size:Type of vehicle:
MediumSmall car
Building ownership type:On-site renewables:Parking Location:
Owner Most likelyOff-street
2030 2040
The Conservative Eco-Professional

34Project Sciurus Trial Insights
The ‘Retired Professional’ has a high-incomebackground and is socially and environmentally conscious. They have PV on their home and are interested in the synergy with their midsized EV and off-street home V2G charger. The EV is used mostly for short or medium journeys during the day and is plugged in when not in use.
V2G Location:
No. of EVs using chargepoint:
V2G Availability:
Potential no. in the UK:
Key information:
Home
1
60-100%
1M - 10M
Primary User: Usage:
Age Range:Income Bracket:Employment Status:Vehicle Ownership Type:Battery Life Conservation:Primary Motivation:
Over 60Basic rateRetiredOwnedHighEnvironmental
Parking Pattern:Type of trips:Percentage of plugged-intime used for charging:Charging Location:
TECHNOLOGY PROGRESSION BEV
PHEV
N/A2020
PredictableShort/Medium
20-40%
Mostly at this location
Vehicle: Location:
Battery Size:Type of vehicle:
MediumMidsize car
Building ownership type:On-site renewables:Parking Location:
OwnerYesOff-street
2030 2040
Usage:
Location:
The Retired Professional

35 Project Sciurus Trial Insights
Key information:
Primary User:
Vehicle:
Themiddle-aged‘Eco-Professional’ leasesanewmidsized EV which they plug in at the off-street home V2G chargepoint. They are an early adopter of new technology and may have PV on the home they own. They are a higher income earner and plug the car in overnight and mostly at weekends. They use their car mostly for commuting. They replace their car every 3-4 years. The core differencebetweenthe‘Eco-Professional’andthe‘Conservative Eco-Professional’ is the ownershipmodel for the vehicle (owned or leased).
V2G Location:
No. of EVs using chargepoint:
V2G Availability:
Potential no. in the UK:
The Eco-Professional
Key information:
Home
Few
40-60%
1M - 10M
Primary User: Usage:
Age Range:Income Bracket:Employment Status:Vehicle Ownership Type:Battery Life Conservation:Primary Motivation:
40-60Higher rateEmployedLeasedMediumEnvironmental
Parking Pattern:Type of trips:Percentage of plugged-intime used for charging:Charging Location:
TECHNOLOGY PROGRESSION BEV
PHEV
N/A2020
PredictableVaried
20-40%
Varied
Vehicle: Location:
Battery Size:Type of vehicle:
VariedMidsize car
Building ownership type:On-site renewables:Parking Location:
Owner Most likelyOff-street
2030 2040

36Project Sciurus Trial Insights
The‘EcoYoungProfessional’hasaV2Gchargerathome, but not necessarily off-street parking. They have strong environmental concerns but being only low/medium income have a second hand EV. This is used mostly for short and medium journeys, and they are interested in maximising the battery life.
V2G Location:
No. of EVs using chargepoint:
V2G Availability:
Potential no. in the UK:
Key information:
Home
1
0-40%
1M - 10M
Primary User: Usage:
Age Range:Income Bracket:Employment Status:Vehicle Ownership Type:Battery Life Conservation:Primary Motivation:
25 - 40Basic rateEmployedOwnedHighEnvironmental
Parking Pattern:Type of trips:Percentage of plugged-intime used for charging:Charging Location:
TECHNOLOGY PROGRESSION BEV
PHEV
N/A2020
PredictableShort/Medium
20-40%
Mostly at this location
Vehicle: Location:
Battery Size:Type of vehicle:
SmallSmall car
Building ownership type:On-site renewables:Parking Location:
TenantNoVaried
2030 2040
Usage:
Location:
The Eco Young Professional
37 Project Sciurus Trial Insights
Key information:
Primary User:
Vehicle:
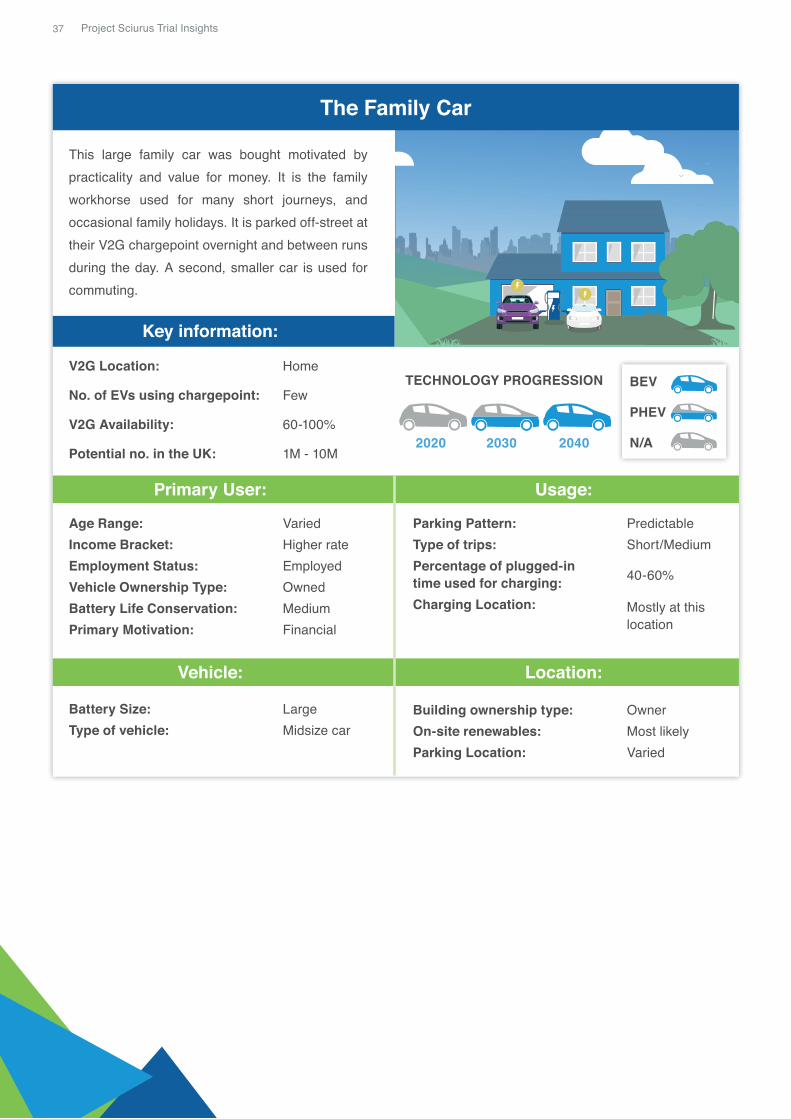
This large family car was bought motivated by practicality and value for money. It is the family workhorse used for many short journeys, and occasional family holidays. It is parked off-street at their V2G chargepoint overnight and between runs during the day. A second, smaller car is used for commuting.
V2G Location:
No. of EVs using chargepoint:
V2G Availability:
Potential no. in the UK:
Key information:
Home
Few
60-100%
1M - 10M
Primary User: Usage:
Age Range:Income Bracket:Employment Status:Vehicle Ownership Type:Battery Life Conservation:Primary Motivation:
VariedHigher rateEmployedOwnedMediumFinancial
Parking Pattern:Type of trips:Percentage of plugged-intime used for charging:Charging Location:
TECHNOLOGY PROGRESSION BEV
PHEV
N/A2020
PredictableShort/Medium
40-60%
Mostly at thislocation
Vehicle: Location:
Battery Size:Type of vehicle:
LargeMidsize car
Building ownership type:On-site renewables:Parking Location:
Owner Most likelyVaried
2030 2040
The Family Car

38Project Sciurus Trial Insights
The ‘Mid-level Manager’ has an off-street V2Gchargepoint used to charge a large vehicle. This is a company car and they are a high earner, motivated more by paying less tax than by environmental sustainability. The EV has an unpredictable parking/charging pattern but is mostly charged at home.
V2G Location:
No. of EVs using chargepoint:
V2G Availability:
Potential no. in the UK:
Key information:
Home
1
40-60%
1M - 10M
Primary User: Usage:
Age Range:Income Bracket:Employment Status:Vehicle Ownership Type:Battery Life Conservation:Primary Motivation:
25-40Higher rateEmployedCompany VehicleMediumFinancial
Parking Pattern:Type of trips:Percentage of plugged-intime used for charging:Charging Location:
TECHNOLOGY PROGRESSION BEV
PHEV
N/A2020
UnpredictableVaried
20-40%
Mostly at this location
Vehicle: Location:
Battery Size:Type of vehicle:
LargeMidsize car
Building ownership type:On-site renewables:Parking Location:
OwnerNoOff-street
2030 2040
Usage:
Location:
The Mid-level Manager (Company PHEV owner)

39 Project Sciurus Trial Insights
Key information:
Primary User:
Vehicle:
This archetype has a home based V2G chargepoint serving a family’s small second car. The usertypically does short journeys only (such as school and shopping runs), with another car used for longer journeys. The EV therefore has a low annual mileage and spends much of its time pligged in at home.Theuserisdrivenbyabalanceoffinancial,social and environmental reasons.
V2G Location:
No. of EVs using chargepoint:
V2G Availability:
Potential no. in the UK:
The Run-around (EV as 2nd Car)
Key information:
Home
Few
60-100%
1M - 10M
Primary User: Usage:
Age Range:Income Bracket:Employment Status:Vehicle Ownership Type:Battery Life Conservation:Primary Motivation:
40- 60VariedEmployedOwnedMediumVaried
Parking Pattern:Type of trips:Percentage of plugged-intime used for charging:Charging Location:
PredictableShort/Medium
0-20%
Mostly at thislocation
Vehicle: Location:
Battery Size:Type of vehicle:
SmallSmall car
Building ownership type:On-site renewables:Parking Location:
Owner Most likelyOff-street
TECHNOLOGY PROGRESSION BEV
PHEV
N/A2020 2030 2040

40Project Sciurus Trial Insights
The ‘One Car Wonder’ is owned by a family astheir single workhorse vehicle, doing both school and commuter runs. The family are middle-to-low earners, hence having a single vehicle for the family and therefore the vehicle must be extremely versatile. The car is a large family vehicle (eg Ford S-Max) and it is likely to be second-hand. They have a V2G chargepoint at home, but not necessarily off-street parking. It is parked overnight, and the owners look to maximise battery life. The family is primarily motivated by value-for-money.
V2G Location:
No. of EVs using chargepoint:
V2G Availability:
Potential no. in the UK:
The One Car Wonder
Key information:
Home
1
40-60%
1M - 10M
Primary User: Usage:
Age Range:Income Bracket:Employment Status:Vehicle Ownership Type:Battery Life Conservation:Primary Motivation:
25-40Basic rateEmployedOwnedHighVaried
Parking Pattern:Type of trips:Percentage of plugged-intime used for charging:Charging Location:
UnpredictableVaried
40-60%
Mostly at this location
Vehicle: Location:
Battery Size:Type of vehicle:
LargeMidsize car
Building ownership type:On-site renewables:Parking Location:
OwnerNoOff-street
TECHNOLOGY PROGRESSION BEV
PHEV
N/A2020 2030 2040Usage:
Location:

41 Project Sciurus Trial Insights
This archetype works for a utility, council or similar andoperateafleetvehicle.Thesearesmallvans(often convertedFordFiesta’s or similar) used tocarry small volume of tools and equipment between domestic appointments. The vehicle is owned by a company but kept by the driver and charged at home or on public networks. The home that the unit is connected to is not the property of the company and therefore it is unlikely that the company would support V2G activities with the vehicle at these premises unless it improves the battery life or earns financialbenefitsforthecompany.
V2G Location:
No. of EVs using chargepoint:
V2G Availability:
Potential no. in the UK:
Utility-Style Fleet Vans (Council vehicles / energy suppliers)
Key information:
Home
Few
40-60%
10k - 100k
Primary User: Usage:
Age Range:Income Bracket:Employment Status:Vehicle Ownership Type:Battery Life Conservation:Primary Motivation:
N/AN/AN/AFleetLowFinancial
Parking Pattern:Type of trips:Percentage of plugged-intime used for charging:Charging Location:
TECHNOLOGY PROGRESSION BEV
PHEV
N/A2020
PredictableShort/Medium
40-60%
Mostly at thislocation
Vehicle: Location:
Battery Size:Type of vehicle:
MediumVan
Building ownership type:On-site renewables:Parking Location:
Owner NoVaried
2030 2040

42Project Sciurus Trial Insights
VIEW ALL
Usage:
Location:
A Fresh look at V2GValue Propositions
V2G Market Study
Freeing up the Locked Down Grid
Understanding the True Value of V2G
V2GB - Vehicle to Grid Britain
Commercial Viability of V2G
Further Reading

43 Project Sciurus Trial Insights
CenexHolywell BuildingHolywell ParkAshby RoadLoughboroughLeicestershireLE11 3UZ
Tel: 01509 642 500Email: [email protected]:www.cenex.co.uk
YoucanfindoutmoreaboutourworkonV2G, along with downloading a range of
free, public reports, from our website:
www.cenex.co.uk