Embed Size (px)
Citation preview
670/013 2.0
Green Fleet Technology Study for Public
Transport
February 2015
Prepared by Cenex for the Public Procurement of Innovation in Action Network
(PPIA)
Author Steve Carroll, Technical Specialist, Cenex
Approved Chris Walsh, Head of Technical Support and Consultancy, Cenex
670/013 2.0 2
Executive Summary
Background and methodology
The Public Procurement of Innovation in Action Network (PPIA) commissioned Cenex to undertake a mobility
technology foresighting study. The aim of the study was to inform the network of the main technological
advances and future developments in transport which address the challenge of mitigating climate change. The
report focuses on alternative drivetrain technologies and fuels that offer carbon reduction from city buses,
although technologies relevant to taxis are also discussed. The analysis focuses on the likely performance of
short-medium term solutions (< 10 years) and suggests some demand side measures and practises which can
be implemented to assist in the transition to cleaner public transport fleets. The study draws on technology
information from industry technology roadmaps, interviews with technology providers and industry experts.
Future demand for public transport vehicles and current procurement practises are established from the PPIA
network cities.
Technology Foresighting
The main technologies expected to assist the transition to low carbon buses and cars in cities are briefly
summarised below.
670/013 2.0 3
For buses,
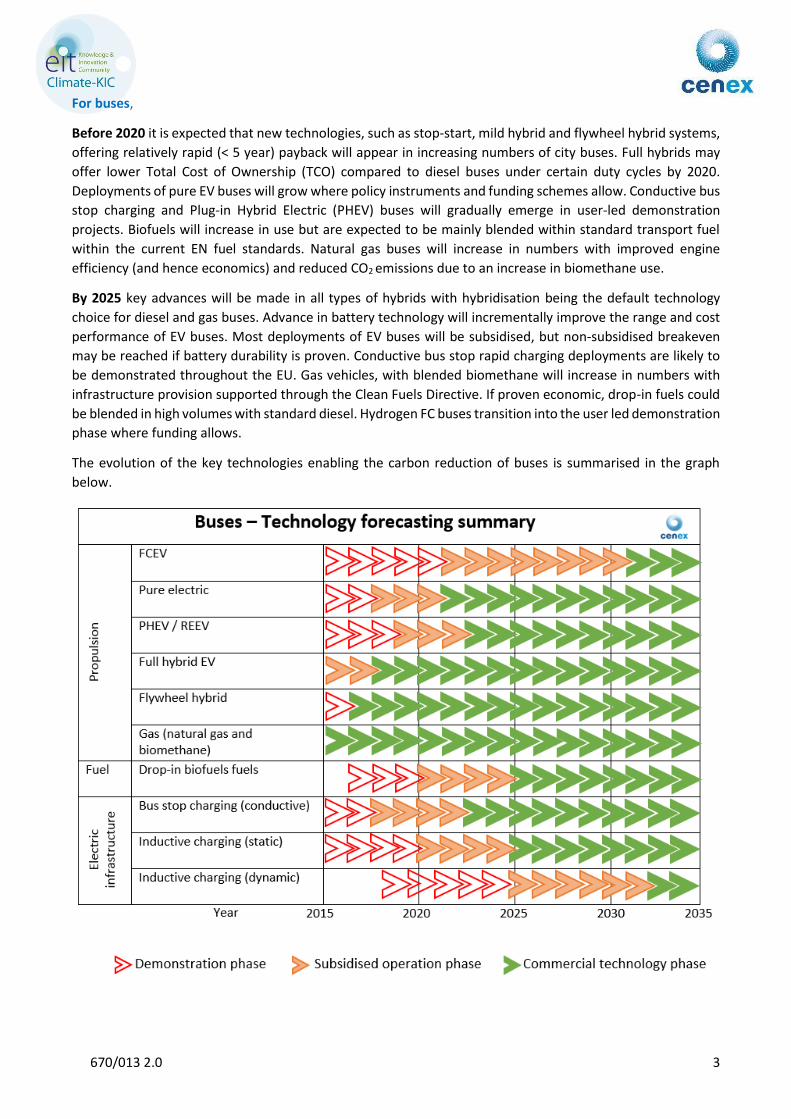
Before 2020 it is expected that new technologies, such as stop-start, mild hybrid and flywheel hybrid systems,
offering relatively rapid (< 5 year) payback will appear in increasing numbers of city buses. Full hybrids may
offer lower Total Cost of Ownership (TCO) compared to diesel buses under certain duty cycles by 2020.
Deployments of pure EV buses will grow where policy instruments and funding schemes allow. Conductive bus
stop charging and Plug-in Hybrid Electric (PHEV) buses will gradually emerge in user-led demonstration
projects. Biofuels will increase in use but are expected to be mainly blended within standard transport fuel
within the current EN fuel standards. Natural gas buses will increase in numbers with improved engine
efficiency (and hence economics) and reduced CO2 emissions due to an increase in biomethane use.
By 2025 key advances will be made in all types of hybrids with hybridisation being the default technology
choice for diesel and gas buses. Advance in battery technology will incrementally improve the range and cost
performance of EV buses. Most deployments of EV buses will be subsidised, but non-subsidised breakeven
may be reached if battery durability is proven. Conductive bus stop rapid charging deployments are likely to
be demonstrated throughout the EU. Gas vehicles, with blended biomethane will increase in numbers with
infrastructure provision supported through the Clean Fuels Directive. If proven economic, drop-in fuels could
be blended in high volumes with standard diesel. Hydrogen FC buses transition into the user led demonstration
phase where funding allows.
The evolution of the key technologies enabling the carbon reduction of buses is summarised in the graph
below.
670/013 2.0 4
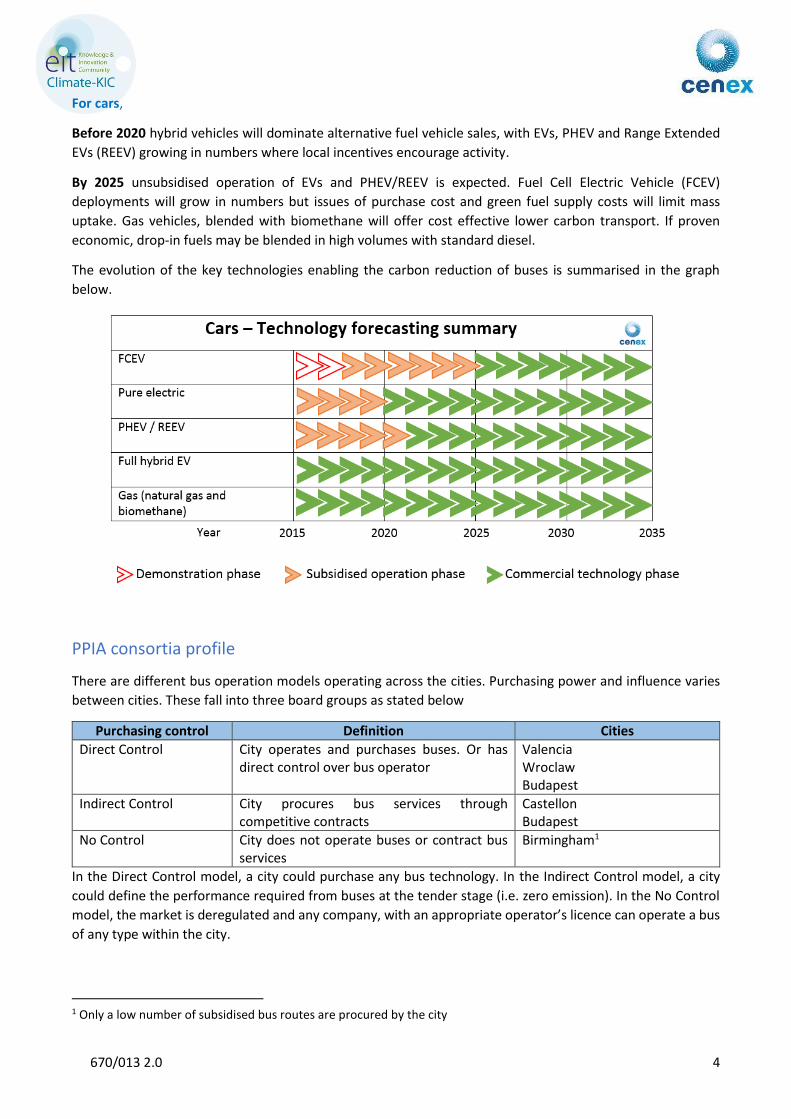
For cars,
Before 2020 hybrid vehicles will dominate alternative fuel vehicle sales, with EVs, PHEV and Range Extended
EVs (REEV) growing in numbers where local incentives encourage activity.
By 2025 unsubsidised operation of EVs and PHEV/REEV is expected. Fuel Cell Electric Vehicle (FCEV)
deployments will grow in numbers but issues of purchase cost and green fuel supply costs will limit mass
uptake. Gas vehicles, blended with biomethane will offer cost effective lower carbon transport. If proven
economic, drop-in fuels may be blended in high volumes with standard diesel.
The evolution of the key technologies enabling the carbon reduction of buses is summarised in the graph
below.
PPIA consortia profile
There are different bus operation models operating across the cities. Purchasing power and influence varies
between cities. These fall into three board groups as stated below
Purchasing control Definition Cities
Direct Control City operates and purchases buses. Or has direct control over bus operator
Valencia Wroclaw Budapest
Indirect Control City procures bus services through competitive contracts
Castellon Budapest
No Control City does not operate buses or contract bus services
Birmingham1
In the Direct Control model, a city could purchase any bus technology. In the Indirect Control model, a city
could define the performance required from buses at the tender stage (i.e. zero emission). In the No Control
model, the market is deregulated and any company, with an appropriate operator’s licence can operate a bus
of any type within the city.
1 Only a low number of subsidised bus routes are procured by the city
670/013 2.0 5
Within the PPIA cities, there are a total of nearly 3,500 buses required before 2030. This is split by
Budapest (1,000), Birmingham (1,500), Valencia (840), Wroclaw (315) and Castellon (75). Over 1,600 buses
(43% of current bus stock) are required to be procured within the next 5 years.
A review of the alternative technology status across the PPIA cities shows that only 5% of the city buses use
alternative fuels. The most popular alternative fuel is natural gas, operated in Budapest, Castellon and
Valencia. Hybrid buses are the next most popular technology, accounting for 2% of the buses; the vast majority
of these are operated in Birmingham, where were purchased through a national subsidy programme. There
are no electric buses currently in permanent service, although seven are being procured by Budapest. No
specific targets for emission reduction from buses existed within the cities.
The main perceived barriers to low carbon bus technology deployment in the PPIA cities is cost. Other barriers
include capital cost priorities in procurement, lack of knowledge, lack of influence and lack of CO2 reduction
targets and incentives.
Summary of technology supplier engagement
Mainstream bus manufacturers feel that low carbon vehicle innovation is progressing at a sufficiently rapid
pace driven by legislative requirements and consumer demands for low running costs. Scope for progressing
innovation beyond the planned technology development cycles of mainstream manufacturers is limited.
Smaller volume manufacturers and environmental technology system developers are willing to innovate in
much quicker timeframes at lower costs thanks to flexible management, design, change control and
production systems. The key barrier to collaborative procurement highlighted by most manufacturers is
differing technical standards (RHD, LHD, furnishings, no of doors, no of seats etc.) between buyers. This
increases complexity and diminishes cost savings of high order volumes. Some manufacturers commented
that a simple way of reducing cost may be for a consortium of buyers to move towards a standardisation of
certain components in future bus procurements (e.g. motor, fuel cell supplier, furnishing supplier etc.). A
higher order volume based on standardised components would enable suppliers to reduce unit cost.
Demand Side Measures
The report has been prepared based on the technology foresight as determined by the supply chain. Cities
need to question whether the outcomes being promised by the supply chain will enable them to meet their
regulatory duties regarding air pollution and climate change in the required timeframe and at a cost
commensurate with their value. As many EU cities fail to meet their mandatory air quality targets cities may
need to take a more proactive role, deploying a range of demand side measures to create a credible demand
for zero emission and environmentally sustainable urban mobility.
Cities have a number of demand side tools which can be used to make them an attractive place to deploy
low carbon vehicles. These include direct procurement methods, policy measures and other complimentary
actions. The report highlights
Procurement processes alone are unlikely to be sufficient in accelerating the development of major
low carbon innovations in whole bus systems, and in some cases cities have little direct control of the
procurement of busses and taxis
A number of demand side tools are available to encourage the introduction of low carbon technologies
into public transport fleets
A demand side strategy should be developed focused on achieving specific aims and incorporating a
range of measures. A demand side action plan should include sending long term signals to the
market, requiring progressive improvements in the sustainability of transport solutions
670/013 2.0 6
It is noted that the overall (e.g. including health system) cost of air pollution should be
taken into account. The Clean Vehicle Directive mandates a method for this; however this is not
widely adopted
Implementation Case Studies
Three case studies are provided that show examples of how technologies identified within the forecasting
exercise could be incorporated within public transport fleets, and where demand side actions can be used to
bring forward the deployment or the reduce cost of environmental technologies.
A Fuel Cell Buses case study demonstrates that by entering discussions with FCH JU and potential
project partners the PPIA cities could enter fuel cell bus deployment projects, allowing buses and
infrastructure to be brought into the cities in advance of mass deployment activity
A Retro-fit Hybrid Systems for Buses case study demonstrates that through supplier engagement
products can be introduced onto city buses in the short term which may be capable of reducing CO2
emissions by up to 15% whilst allowing a payback of < 5 years
An EV and FCEV Vehicles for Taxis case study shows a scenario where applying market engagement
with an incentive programme may accelerate EV and FCEV deployment in to taxi fleets
Conclusion
The report concludes with the following suggestions to assist in the implementation of technologies into fleets
Ensure accurate costing mechanisms (TCO) are incorporated in vehicle/service procurement and
tenders
Work within the PPIA group, or locally within each city, to ensure that rigorous, holistic environmental
goals are set on a city-wide level
Ensure environmental criteria are evaluated within tender bids as set out in the mandatory
requirements of the Clean Vehicle Directive
Engage with the technology supplier community, bus manufacturers and operators under FCP
methodology to investigate methods for ensuring innovative new technologies, such as those
highlighted in Section 5.2 Detailed Technology Study for Buses, can be adopted into upcoming short
term bus orders or retro fitted to existing bus stock
For the medium term engage with the technology supplier community, bus manufacturers and
operators under FCP methodology to investigate best way for cities to adopt, procure and reduce costs
from medium term technologies such as pure EV, PHEV etc buses
For the longer term develop partnerships and working groups with industry stakeholders. Collaborate
to join funded demonstration projects to allow the installation of infrastructure and operational TCO
models to be created
Work to modify procurement processes to be able to take a wider range of sustainability factors
Develop demand side action plans to ensure cities offer an attractive environment for the
development and deployment of lower carbon vehicles
670/013 2.0 7
Table of Contents
1 Introduction ................................................................................................................................................. 8
2 Vehicle and Fuel Technologies .................................................................................................................... 9
3 Current State of the Art Implementations ................................................................................................ 11
3.1 Bus Technologies ............................................................................................................................... 12
3.2 EV Infrastructure Implementation Case Studies for Buses ............................................................... 16
3.3 Car technologies for taxi and car club use......................................................................................... 17
3.4 e-car Club Implementation ................................................................................................................ 18
3.5 eBicycle Club Implementation ........................................................................................................... 19
4 Emission Reduction Directives .................................................................................................................. 21
4.1 Renewable Energy Directive .............................................................................................................. 21
4.2 Clean Fuels Directive ......................................................................................................................... 21
4.3 Clean Vehicles Directive .................................................................................................................... 21
4.4 CO2 regulation ................................................................................................................................... 22
5 Technology Foresighting............................................................................................................................ 23
5.1 Technology traffic light reviews ........................................................................................................ 25
5.2 Detailed Technology Study for Buses ................................................................................................ 31
6 City Engagement ........................................................................................................................................ 33
6.1 Summary of Questionnaire Responses ............................................................................................. 34
7 Supplier Engagement................................................................................................................................. 40
8 Demand Side Measures ............................................................................................................................. 42
8.1 Demand Side Measures ..................................................................................................................... 42
8.2 Examples of Demand Side Tools ........................................................................................................ 43
8.3 Demand Side Action Plan Example .................................................................................................... 46
9 Implementation Case Studies .................................................................................................................... 48
9.1 Fuel Cell Buses Case Study................................................................................................................. 49
9.2 Retrofit Bus Technology Supply Case Study ...................................................................................... 51
9.3 Electric and Fuel Cell Vehicles for Taxis ............................................................................................. 53
10 Conclusions and next steps ................................................................................................................... 55
Appendix A: Technology introductions ............................................................................................................. 56
Appendix B: Road maps ..................................................................................................................................... 62
Appendix C: List of project consultees .............................................................................................................. 63
Appendix D: References .................................................................................................................................... 64
670/013 2.0 8
1 Introduction Public Procurement in Action (PPIA) is a Climate-KIC funded network that aims to increase understanding of
the range and effectiveness of public procurement of innovation (PPI) and pre-commercial procurement (PCP)
methodologies. The PPIA network consists of Birmingham (lead partner), Wroclaw, Budapest, Valencia and
Castellon.
The PPIA network commissioned Cenex, a team of independent, not-for-profit low carbon vehicle technology
experts, to undertake a mobility technology foresighting study. The aim of the study was to inform the network
of the main technological advances and future developments in transport which address the challenge of
limiting climate change.
The study also examined the network members’ purchasing cycles, aligning them with the release of
environmental technologies to inform the timely future inclusion of environmental technology within the
public fleets. In addition, the report outlines a number of demand side measures that cities can employ to help
transform the market for green and sustainable mobility and enable them to also address air pollution along
with reducing their carbon emissions.
The report covers transport options relevant to city buses, taxis, e-car clubs and e-bike clubs. However the
main focus of the report is on the alternative drivetrain technologies and fuels that can offer carbon reduction
from city buses. Although the report considers technologies and fuels which are available within a 20 year
time frame (2015 – 2035), the focus of the analysis is on the performance of short-medium term solutions (<
10 years).
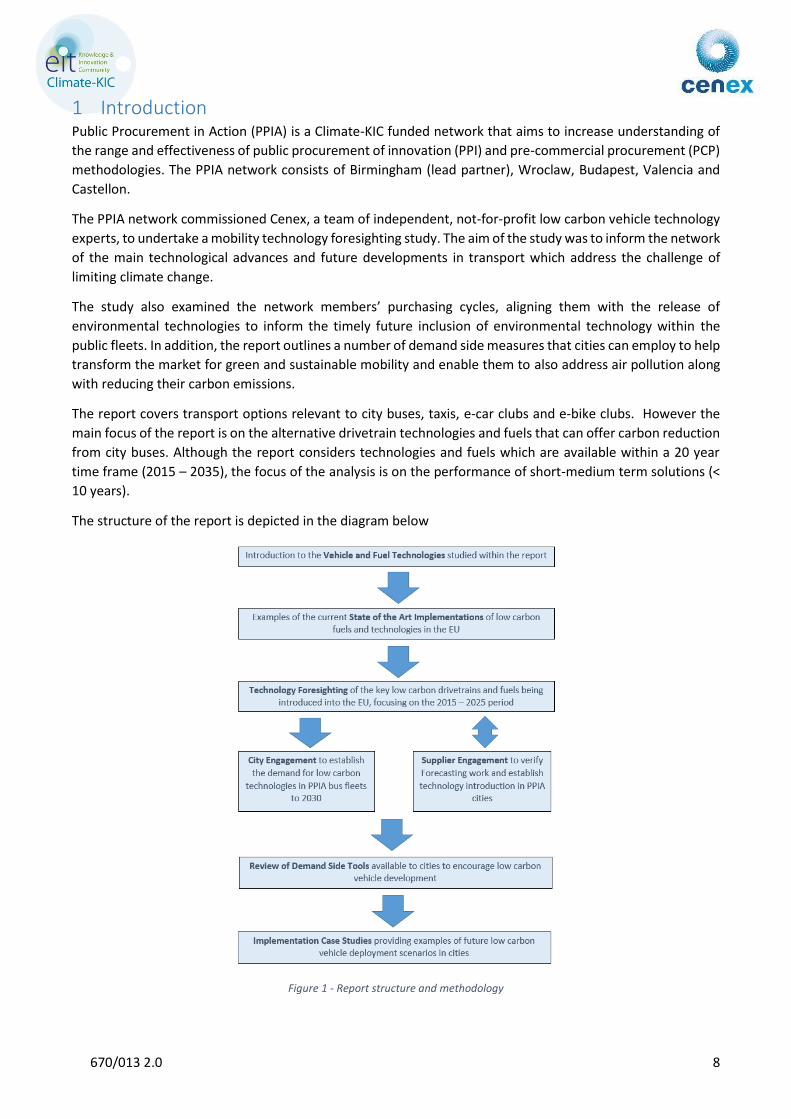
The structure of the report is depicted in the diagram below
Figure 1 - Report structure and methodology
670/013 2.0 9
2 Vehicle and Fuel Technologies
The alternative drivetrain technologies and fuels discussed in this report are briefly described in the tables
below. A more detailed description is available in Appendix A.
Alternative drivetrains
Pure electric vehicle (EV) Vehicle powered purely by electricity which is generally stored in a traction battery
Hybrid electric vehicle (HEV) Uses a combination of an Internal Combustion Engine (ICE) and one or more electric motors to power the vehicle
Plug-in hybrid EV (PHEV) Hybrid vehicle with a relatively large traction battery able to be charged from an external electricity supply, typically offering a modest electric only driving range
Range Extended EV (REEV) A pure electric vehicle with the ability to charge the traction battery from an on-board generator, typically powered by petrol or diesel or fuel cell technology
Flywheel hybrid Uses the rotation of a flywheel to store energy normally lost during breaking and deceleration events. This energy is then fed back into the drive line during subsequent driving events to reduce the fuel required
Hydraulic hybrid Uses pressurised fluid to store energy normally lost during breaking and deceleration events. This energy is then fed back into the drive line during subsequent driving events to reduce the diesel fuel required
Fuel Cell EV (FCEV) Combines hydrogen and air through a fuel cell to create electricity, which is then used to propel the vehicle
Alternative fuel engines ICE vehicle modified to run on alternative fuels such as biofuels, natural gas and LPG
Table 1 - Brief introduction to alternative drivetrains
This chapter introduces the main low carbon fuels and technologies discussed throughout the report
Key points
The report covers transport options relevant to city buses, taxis, e-car clubs and e-bike clubs
However the main focus of the report is on the alternative drivetrain technologies and fuels that
can offer carbon reduction from city buses
Although the report considers technologies and fuels which are to become available within a 20
year time frame, the focus of the analysis is on likely performance of short-medium term
solutions (< 10 years)
670/013 2.0 10
Alternative fuels and electric vehicle charging technology
High blend biofuels Blends of fossil and biofuels above those allowed under the current diesel (EN590) and petrol (EN228) European standards
Drop-in fuels Biofuels that can be blended up to 100% with fossil fuels and maintain the current diesel (EN590) and petrol (EN228) European standards
Pure Plant Oil (PPO) 100% vegetable oil
Natural gas A fossil fuel costing of mainly methane
Biomethane A sustainable road transport fuel consisting of mainly methane. Biomethane is chemically similar and interchangeable with natural gas as a fuel
Liquefied Petrol Gas (LPG) A fossil fuel costing of mainly propane or butane
Hydrogen Hydrogen is a chemical element that can be used to power vehicles, either through direct combustion or a fuel cell
Conductive charging Electric vehicle charging where vehicle is plugged into the electricity supply network
Static inductive charging Wireless charging. Uses an electromagnetic field to transfer energy to the vehicle whilst it is stationary. The vehicle does not have to be plugged in
Dynamic inductive charging Wireless charging. Uses an electromagnetic field to transfer energy to the vehicle whilst it is moving
Table 2 - Brief introduction to alternative fuels
670/013 2.0 11
3 Current State of the Art Implementations
The tables below give examples of how and where alternative technologies for buses, cars and electric
infrastructure are being integrated or trialled in the transport system. A colour coded maturity rating has been
applied to the technologies presented, which is defined in Table 3 below.
This chapter provides examples of low carbon technology implementations around the EU. Public
domain information was used to summarise state of the art examples of low carbon bus, taxi, e-car
club and e-bike club operations.
Key points
For buses
Gas vehicles and trolley buses are mature, widely used and commercially competitive
technologies offering lower carbon and cleaner public transport throughout the EU
Electric-hybrid, biodiesel and ethanol buses are also mature technologies, however their use
within the EU is limited due to financial factors. Deployments are highly dependent on local grant
and tax regimes
Conductively charged electric buses are being purchased throughout the EU in limited numbers
under user-led demonstration and evaluation trials
Inductively charged electric buses are being demonstrated in limited numbers through
manufacturer-led demonstration trials
Plug-in hybrid and FCEV buses are taking part in manufacturer-led and grant funded
demonstration trials in the EU
For cars
Hybrid, gas and flexi-fuel cars are mature, widely used and commercially competitive
technologies offering lower carbon and cleaner public transport throughout the EU
Pure EVs and PHEV/REEV are also mature technologies, however their use within the EU is
limited due to financial factors. Deployments are highly dependent on local grant and tax regimes
FCEV cars are taking part in manufacturer-led demonstration trials in the EU. This is expected to
advance to user-led demonstration and evaluation trials during 2015/16 as commercial product
becomes available in the EU from Hyundai and Toyota.
For e-car and e-bike schemes
While Paris boasts the world leading Autolib electric car club (commenced in 2011, currently has
over 150,000 members) the rest of Europe has limited EV car club activity
Following the popularity of city cycle schemes, electric cycle schemes are likely to be introduced
to attract people to use cycles on longer or more strenuous journeys or to attract potential users
who are new to cycling or still find bikes too strenuous to use as a city transport. These schemes
are in their infancy with limited implementation throughout the EU
670/013 2.0 12
Maturity Rating
Description
1 Prototype stage
2 Demonstration (manufacturer-led)
3 Demonstration end-user evaluation (user-led)
4 Mature tech but low volume deployment due to product, infrastructure or cost limitations
5 Mature commercially competitive technology, high volume use Table 3 – Maturity rating key
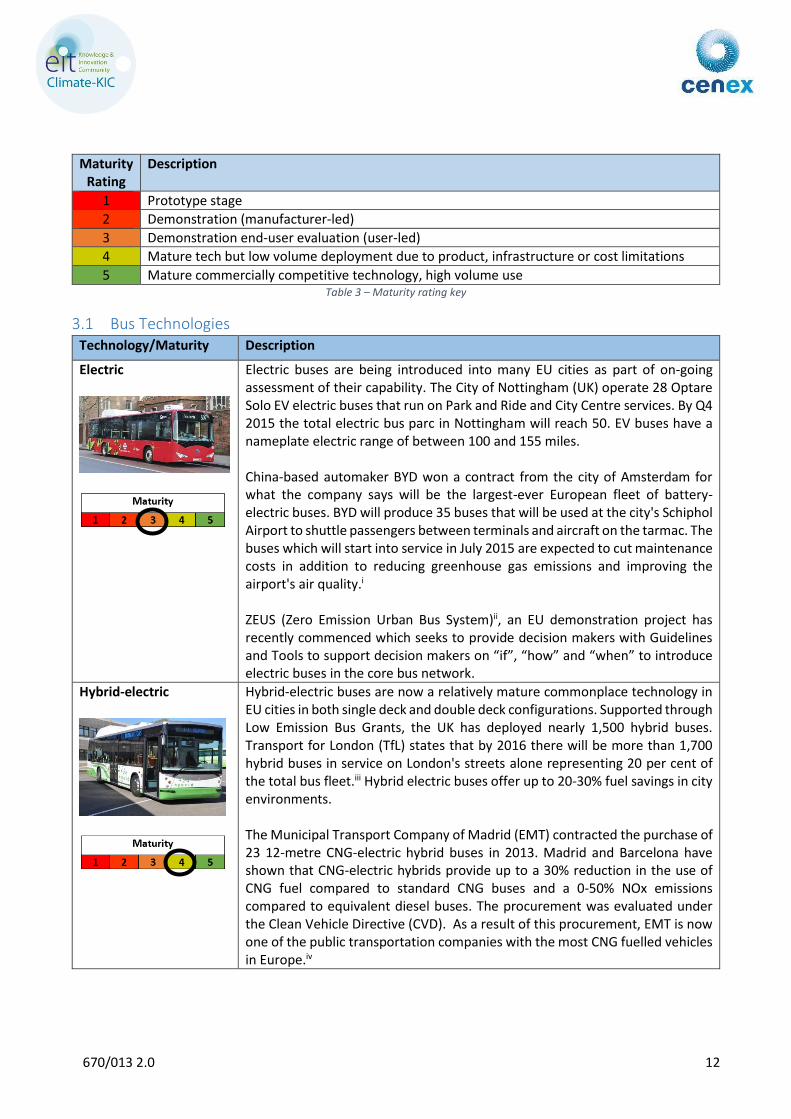
3.1 Bus Technologies Technology/Maturity Description
Electric
Electric buses are being introduced into many EU cities as part of on-going assessment of their capability. The City of Nottingham (UK) operate 28 Optare Solo EV electric buses that run on Park and Ride and City Centre services. By Q4 2015 the total electric bus parc in Nottingham will reach 50. EV buses have a nameplate electric range of between 100 and 155 miles. China-based automaker BYD won a contract from the city of Amsterdam for what the company says will be the largest-ever European fleet of battery-electric buses. BYD will produce 35 buses that will be used at the city's Schiphol Airport to shuttle passengers between terminals and aircraft on the tarmac. The buses which will start into service in July 2015 are expected to cut maintenance costs in addition to reducing greenhouse gas emissions and improving the airport's air quality.i ZEUS (Zero Emission Urban Bus System)ii, an EU demonstration project has recently commenced which seeks to provide decision makers with Guidelines and Tools to support decision makers on “if”, “how” and “when” to introduce electric buses in the core bus network.
Hybrid-electric
Hybrid-electric buses are now a relatively mature commonplace technology in EU cities in both single deck and double deck configurations. Supported through Low Emission Bus Grants, the UK has deployed nearly 1,500 hybrid buses. Transport for London (TfL) states that by 2016 there will be more than 1,700 hybrid buses in service on London's streets alone representing 20 per cent of the total bus fleet.iii Hybrid electric buses offer up to 20-30% fuel savings in city environments. The Municipal Transport Company of Madrid (EMT) contracted the purchase of 23 12-metre CNG-electric hybrid buses in 2013. Madrid and Barcelona have shown that CNG-electric hybrids provide up to a 30% reduction in the use of CNG fuel compared to standard CNG buses and a 0-50% NOx emissions compared to equivalent diesel buses. The procurement was evaluated under the Clean Vehicle Directive (CVD). As a result of this procurement, EMT is now one of the public transportation companies with the most CNG fuelled vehicles in Europe.iv
670/013 2.0 13
Plug-in Hybrid
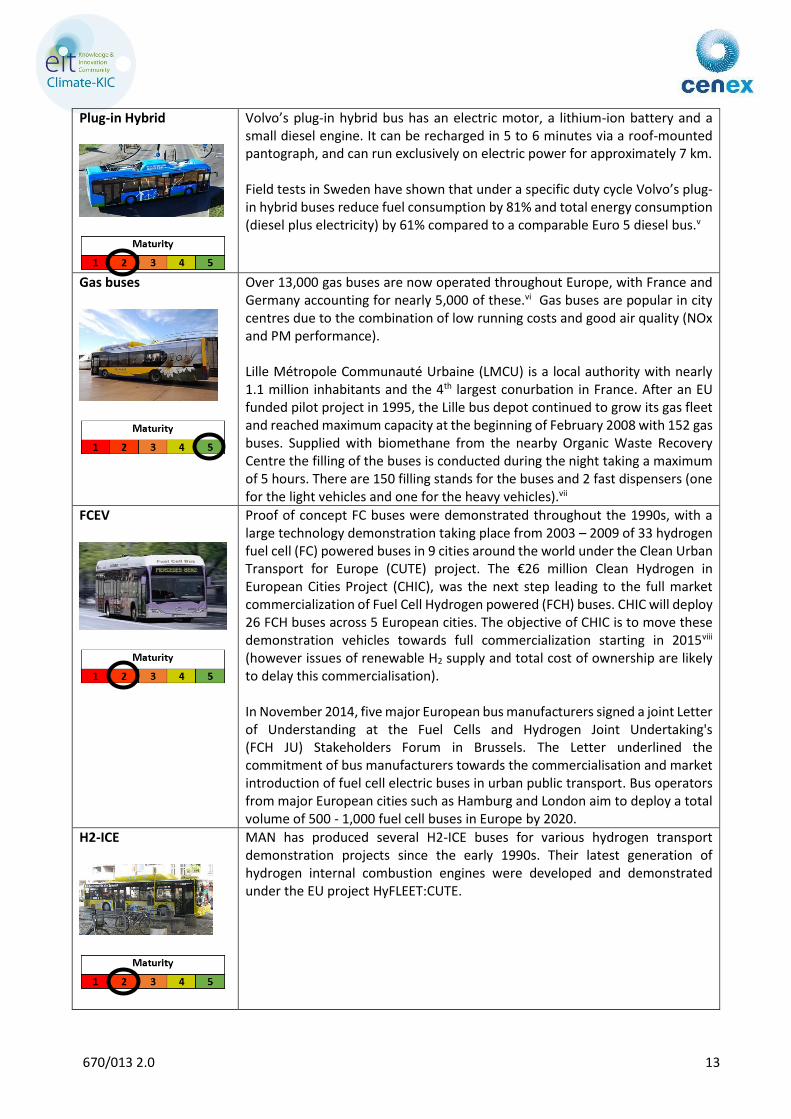
Volvo’s plug-in hybrid bus has an electric motor, a lithium-ion battery and a small diesel engine. It can be recharged in 5 to 6 minutes via a roof-mounted pantograph, and can run exclusively on electric power for approximately 7 km. Field tests in Sweden have shown that under a specific duty cycle Volvo’s plug-in hybrid buses reduce fuel consumption by 81% and total energy consumption (diesel plus electricity) by 61% compared to a comparable Euro 5 diesel bus.v
Gas buses
Over 13,000 gas buses are now operated throughout Europe, with France and Germany accounting for nearly 5,000 of these.vi Gas buses are popular in city centres due to the combination of low running costs and good air quality (NOx and PM performance). Lille Métropole Communauté Urbaine (LMCU) is a local authority with nearly 1.1 million inhabitants and the 4th largest conurbation in France. After an EU funded pilot project in 1995, the Lille bus depot continued to grow its gas fleet and reached maximum capacity at the beginning of February 2008 with 152 gas buses. Supplied with biomethane from the nearby Organic Waste Recovery Centre the filling of the buses is conducted during the night taking a maximum of 5 hours. There are 150 filling stands for the buses and 2 fast dispensers (one for the light vehicles and one for the heavy vehicles).vii
FCEV
Proof of concept FC buses were demonstrated throughout the 1990s, with a large technology demonstration taking place from 2003 – 2009 of 33 hydrogen fuel cell (FC) powered buses in 9 cities around the world under the Clean Urban Transport for Europe (CUTE) project. The €26 million Clean Hydrogen in European Cities Project (CHIC), was the next step leading to the full market commercialization of Fuel Cell Hydrogen powered (FCH) buses. CHIC will deploy 26 FCH buses across 5 European cities. The objective of CHIC is to move these demonstration vehicles towards full commercialization starting in 2015viii (however issues of renewable H2 supply and total cost of ownership are likely to delay this commercialisation). In November 2014, five major European bus manufacturers signed a joint Letter of Understanding at the Fuel Cells and Hydrogen Joint Undertaking's (FCH JU) Stakeholders Forum in Brussels. The Letter underlined the commitment of bus manufacturers towards the commercialisation and market introduction of fuel cell electric buses in urban public transport. Bus operators from major European cities such as Hamburg and London aim to deploy a total volume of 500 - 1,000 fuel cell buses in Europe by 2020.
H2-ICE
MAN has produced several H2-ICE buses for various hydrogen transport demonstration projects since the early 1990s. Their latest generation of hydrogen internal combustion engines were developed and demonstrated under the EU project HyFLEET:CUTE.
670/013 2.0 14
Flywheel hybrid energy storage
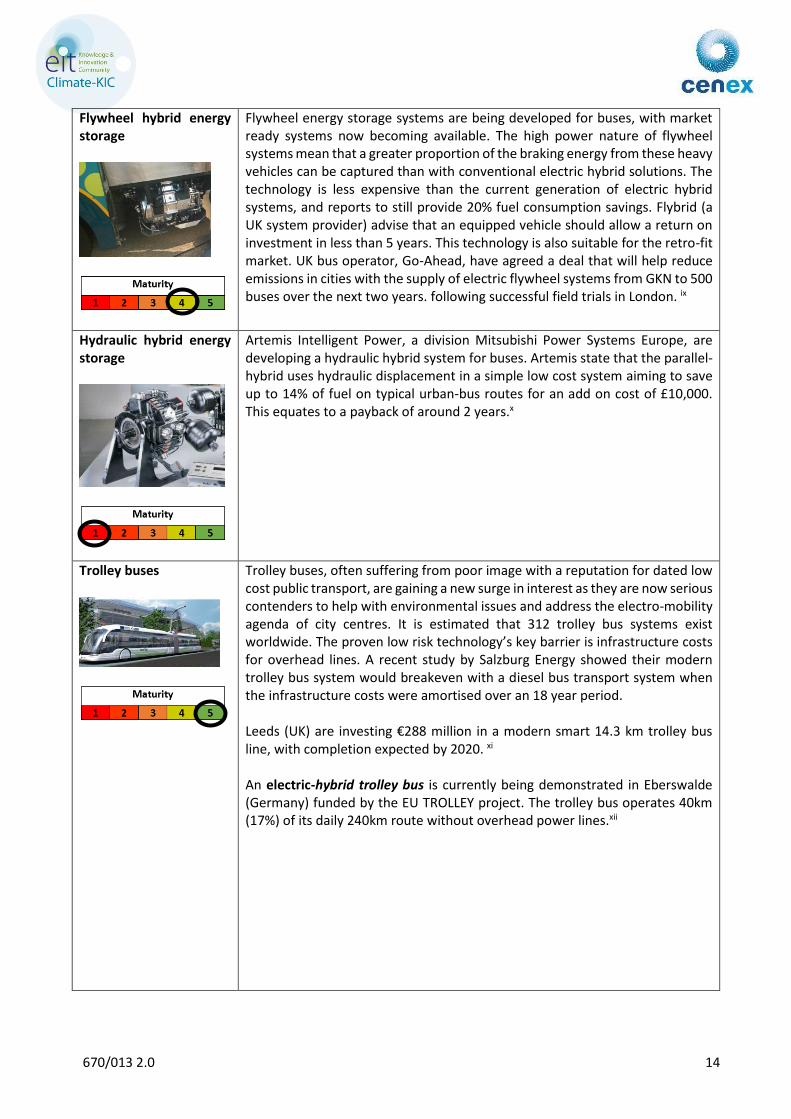
Flywheel energy storage systems are being developed for buses, with market ready systems now becoming available. The high power nature of flywheel systems mean that a greater proportion of the braking energy from these heavy vehicles can be captured than with conventional electric hybrid solutions. The technology is less expensive than the current generation of electric hybrid systems, and reports to still provide 20% fuel consumption savings. Flybrid (a UK system provider) advise that an equipped vehicle should allow a return on investment in less than 5 years. This technology is also suitable for the retro-fit market. UK bus operator, Go-Ahead, have agreed a deal that will help reduce emissions in cities with the supply of electric flywheel systems from GKN to 500 buses over the next two years. following successful field trials in London. ix
Hydraulic hybrid energy storage
Artemis Intelligent Power, a division Mitsubishi Power Systems Europe, are developing a hydraulic hybrid system for buses. Artemis state that the parallel-hybrid uses hydraulic displacement in a simple low cost system aiming to save up to 14% of fuel on typical urban-bus routes for an add on cost of £10,000. This equates to a payback of around 2 years.x
Trolley buses
Trolley buses, often suffering from poor image with a reputation for dated low cost public transport, are gaining a new surge in interest as they are now serious contenders to help with environmental issues and address the electro-mobility agenda of city centres. It is estimated that 312 trolley bus systems exist worldwide. The proven low risk technology’s key barrier is infrastructure costs for overhead lines. A recent study by Salzburg Energy showed their modern trolley bus system would breakeven with a diesel bus transport system when the infrastructure costs were amortised over an 18 year period. Leeds (UK) are investing €288 million in a modern smart 14.3 km trolley bus line, with completion expected by 2020. xi An electric-hybrid trolley bus is currently being demonstrated in Eberswalde (Germany) funded by the EU TROLLEY project. The trolley bus operates 40km (17%) of its daily 240km route without overhead power lines.xii
670/013 2.0 15
Flexi-fuel (ethanol) buses
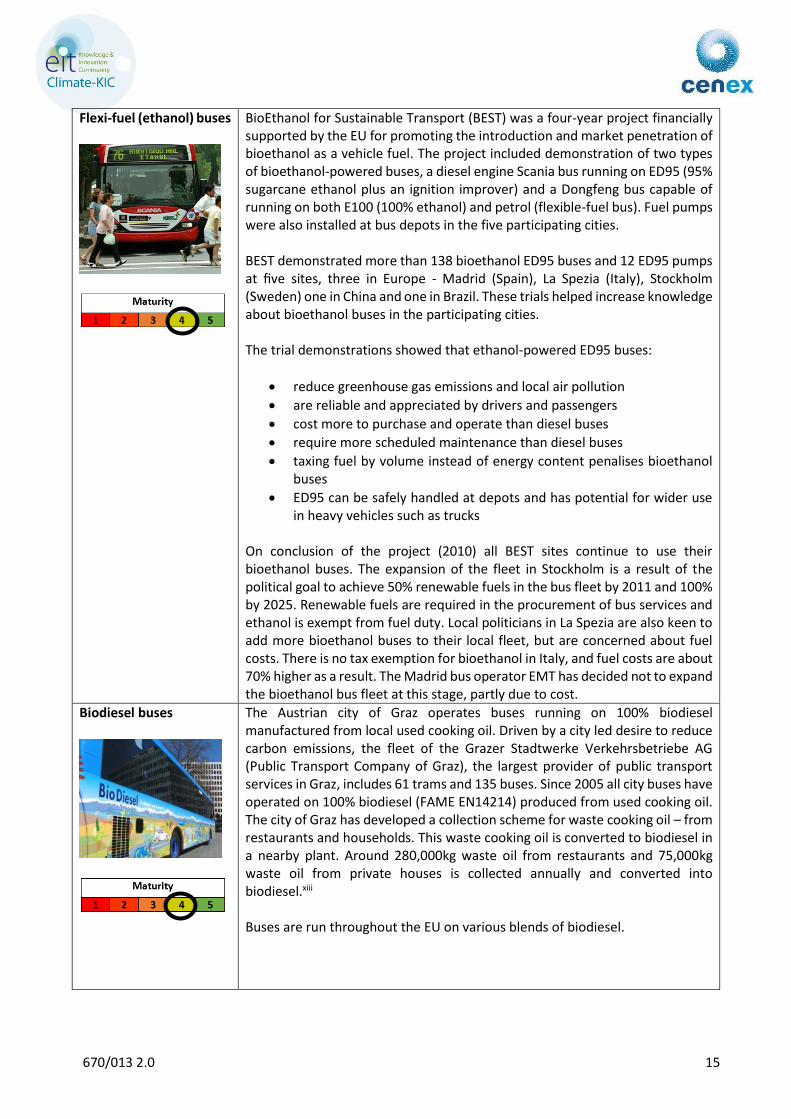
BioEthanol for Sustainable Transport (BEST) was a four-year project financially supported by the EU for promoting the introduction and market penetration of bioethanol as a vehicle fuel. The project included demonstration of two types of bioethanol-powered buses, a diesel engine Scania bus running on ED95 (95% sugarcane ethanol plus an ignition improver) and a Dongfeng bus capable of running on both E100 (100% ethanol) and petrol (flexible-fuel bus). Fuel pumps were also installed at bus depots in the five participating cities. BEST demonstrated more than 138 bioethanol ED95 buses and 12 ED95 pumps at five sites, three in Europe - Madrid (Spain), La Spezia (Italy), Stockholm (Sweden) one in China and one in Brazil. These trials helped increase knowledge about bioethanol buses in the participating cities. The trial demonstrations showed that ethanol-powered ED95 buses:
reduce greenhouse gas emissions and local air pollution
are reliable and appreciated by drivers and passengers
cost more to purchase and operate than diesel buses
require more scheduled maintenance than diesel buses
taxing fuel by volume instead of energy content penalises bioethanol buses
ED95 can be safely handled at depots and has potential for wider use in heavy vehicles such as trucks
On conclusion of the project (2010) all BEST sites continue to use their bioethanol buses. The expansion of the fleet in Stockholm is a result of the political goal to achieve 50% renewable fuels in the bus fleet by 2011 and 100% by 2025. Renewable fuels are required in the procurement of bus services and ethanol is exempt from fuel duty. Local politicians in La Spezia are also keen to add more bioethanol buses to their local fleet, but are concerned about fuel costs. There is no tax exemption for bioethanol in Italy, and fuel costs are about 70% higher as a result. The Madrid bus operator EMT has decided not to expand the bioethanol bus fleet at this stage, partly due to cost.
Biodiesel buses
The Austrian city of Graz operates buses running on 100% biodiesel manufactured from local used cooking oil. Driven by a city led desire to reduce carbon emissions, the fleet of the Grazer Stadtwerke Verkehrsbetriebe AG (Public Transport Company of Graz), the largest provider of public transport services in Graz, includes 61 trams and 135 buses. Since 2005 all city buses have operated on 100% biodiesel (FAME EN14214) produced from used cooking oil. The city of Graz has developed a collection scheme for waste cooking oil – from restaurants and households. This waste cooking oil is converted to biodiesel in a nearby plant. Around 280,000kg waste oil from restaurants and 75,000kg waste oil from private houses is collected annually and converted into biodiesel.xiii Buses are run throughout the EU on various blends of biodiesel.
670/013 2.0 16
PPO
Whilst pockets of vegetable oil powered buses exist, the lack of endorsed product from vehicle manufacturers complicates warranty situations and leads to numerous retrofit market solutions trialled with varying success. The lack of manufacturer support, variability in biofuel quality and conversion system quality and lack of government incentives, hampers the uptake of PPO biofuel vehicles. PPO was unsuccessfully trialled in Eindhoven in 2007, the trial was stopped due to high maintenance costs and high soot emissions from the buses.xiv Conversely a successful trial in Hasselt (Belgium) led to over 70 buses being converted to PPO in 2007. There is no recent case study evidence of PPO use in buses, therefore it is assumed that few systems are currently in use in the EU bus fleet.
3.2 EV Infrastructure Implementation Case Studies for Buses Conductive charging
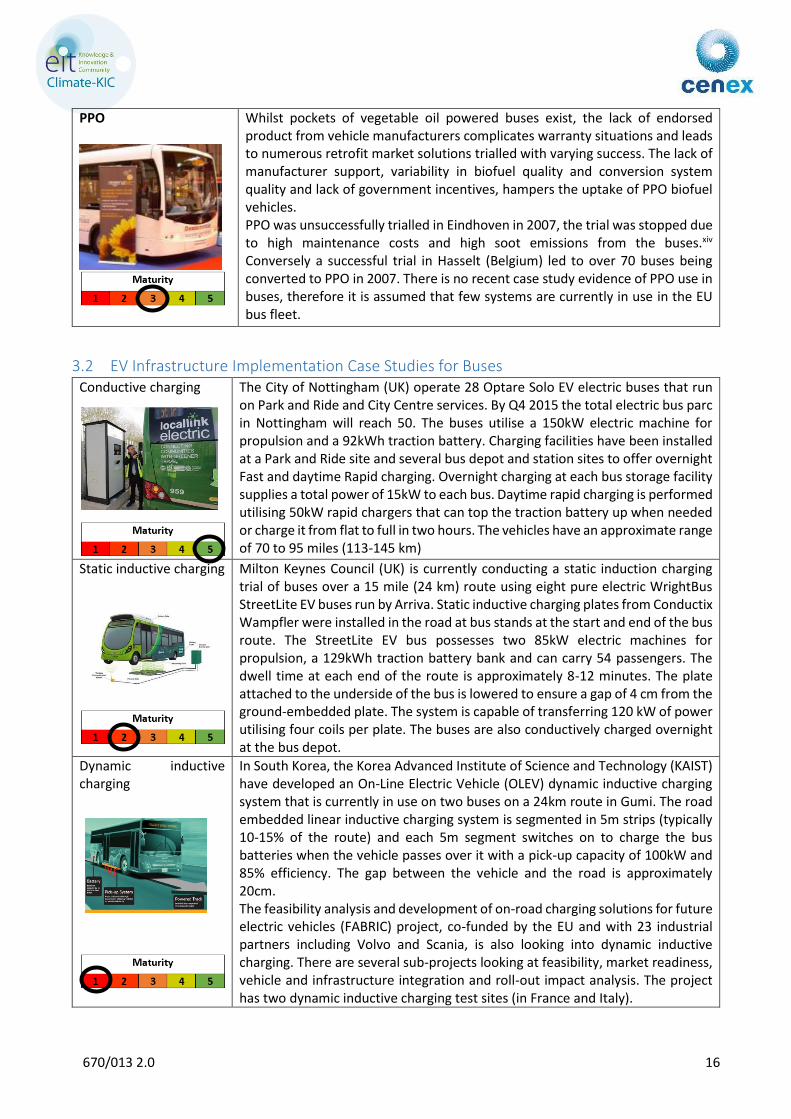
The City of Nottingham (UK) operate 28 Optare Solo EV electric buses that run on Park and Ride and City Centre services. By Q4 2015 the total electric bus parc in Nottingham will reach 50. The buses utilise a 150kW electric machine for propulsion and a 92kWh traction battery. Charging facilities have been installed at a Park and Ride site and several bus depot and station sites to offer overnight Fast and daytime Rapid charging. Overnight charging at each bus storage facility supplies a total power of 15kW to each bus. Daytime rapid charging is performed utilising 50kW rapid chargers that can top the traction battery up when needed or charge it from flat to full in two hours. The vehicles have an approximate range of 70 to 95 miles (113-145 km)
Static inductive charging
Milton Keynes Council (UK) is currently conducting a static induction charging trial of buses over a 15 mile (24 km) route using eight pure electric WrightBus StreetLite EV buses run by Arriva. Static inductive charging plates from Conductix Wampfler were installed in the road at bus stands at the start and end of the bus route. The StreetLite EV bus possesses two 85kW electric machines for propulsion, a 129kWh traction battery bank and can carry 54 passengers. The dwell time at each end of the route is approximately 8-12 minutes. The plate attached to the underside of the bus is lowered to ensure a gap of 4 cm from the ground-embedded plate. The system is capable of transferring 120 kW of power utilising four coils per plate. The buses are also conductively charged overnight at the bus depot.
Dynamic inductive charging
In South Korea, the Korea Advanced Institute of Science and Technology (KAIST) have developed an On-Line Electric Vehicle (OLEV) dynamic inductive charging system that is currently in use on two buses on a 24km route in Gumi. The road embedded linear inductive charging system is segmented in 5m strips (typically 10-15% of the route) and each 5m segment switches on to charge the bus batteries when the vehicle passes over it with a pick-up capacity of 100kW and 85% efficiency. The gap between the vehicle and the road is approximately 20cm. The feasibility analysis and development of on-road charging solutions for future electric vehicles (FABRIC) project, co-funded by the EU and with 23 industrial partners including Volvo and Scania, is also looking into dynamic inductive charging. There are several sub-projects looking at feasibility, market readiness, vehicle and infrastructure integration and roll-out impact analysis. The project has two dynamic inductive charging test sites (in France and Italy).
670/013 2.0 17
3.3 Car technologies for taxi and car club use Technology/Maturity Description
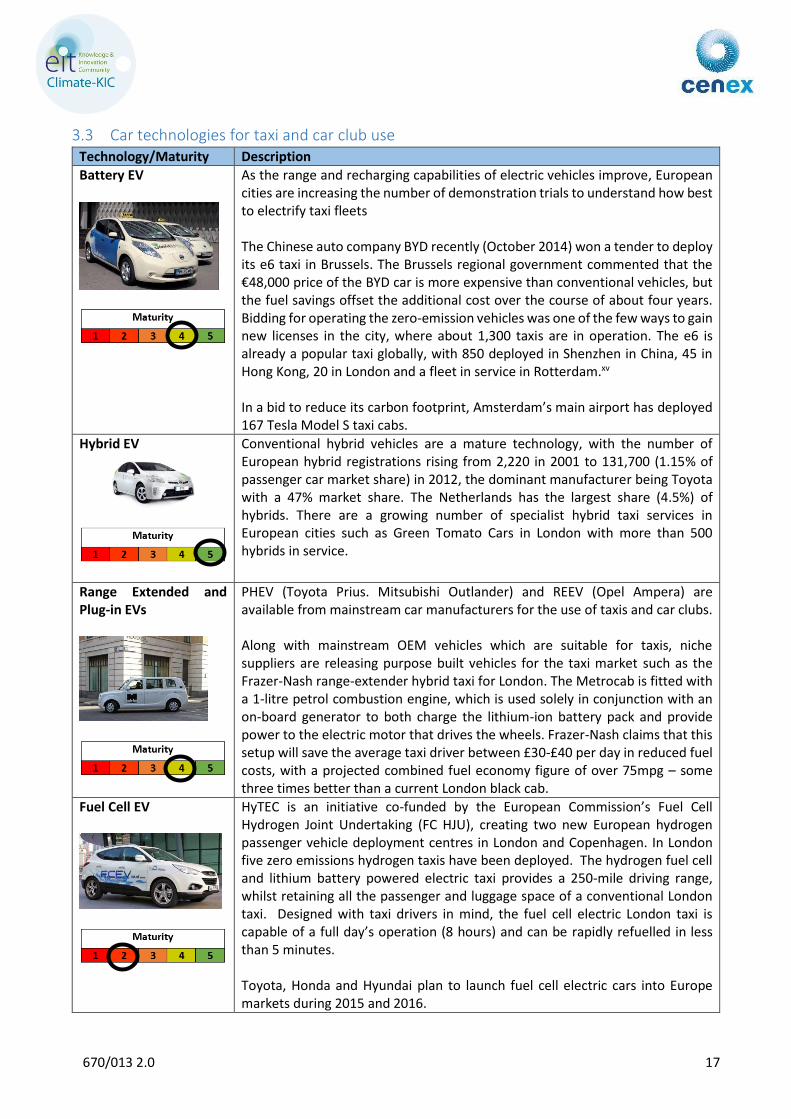
Battery EV
As the range and recharging capabilities of electric vehicles improve, European cities are increasing the number of demonstration trials to understand how best to electrify taxi fleets The Chinese auto company BYD recently (October 2014) won a tender to deploy its e6 taxi in Brussels. The Brussels regional government commented that the €48,000 price of the BYD car is more expensive than conventional vehicles, but the fuel savings offset the additional cost over the course of about four years. Bidding for operating the zero-emission vehicles was one of the few ways to gain new licenses in the city, where about 1,300 taxis are in operation. The e6 is already a popular taxi globally, with 850 deployed in Shenzhen in China, 45 in Hong Kong, 20 in London and a fleet in service in Rotterdam.xv In a bid to reduce its carbon footprint, Amsterdam’s main airport has deployed 167 Tesla Model S taxi cabs.
Hybrid EV
Conventional hybrid vehicles are a mature technology, with the number of European hybrid registrations rising from 2,220 in 2001 to 131,700 (1.15% of passenger car market share) in 2012, the dominant manufacturer being Toyota with a 47% market share. The Netherlands has the largest share (4.5%) of hybrids. There are a growing number of specialist hybrid taxi services in European cities such as Green Tomato Cars in London with more than 500 hybrids in service.
Range Extended and Plug-in EVs
PHEV (Toyota Prius. Mitsubishi Outlander) and REEV (Opel Ampera) are available from mainstream car manufacturers for the use of taxis and car clubs. Along with mainstream OEM vehicles which are suitable for taxis, niche suppliers are releasing purpose built vehicles for the taxi market such as the Frazer-Nash range-extender hybrid taxi for London. The Metrocab is fitted with a 1-litre petrol combustion engine, which is used solely in conjunction with an on-board generator to both charge the lithium-ion battery pack and provide power to the electric motor that drives the wheels. Frazer-Nash claims that this setup will save the average taxi driver between £30-£40 per day in reduced fuel costs, with a projected combined fuel economy figure of over 75mpg – some three times better than a current London black cab.
Fuel Cell EV
HyTEC is an initiative co-funded by the European Commission’s Fuel Cell Hydrogen Joint Undertaking (FC HJU), creating two new European hydrogen passenger vehicle deployment centres in London and Copenhagen. In London five zero emissions hydrogen taxis have been deployed. The hydrogen fuel cell and lithium battery powered electric taxi provides a 250-mile driving range, whilst retaining all the passenger and luggage space of a conventional London taxi. Designed with taxi drivers in mind, the fuel cell electric London taxi is capable of a full day’s operation (8 hours) and can be rapidly refuelled in less than 5 minutes. Toyota, Honda and Hyundai plan to launch fuel cell electric cars into Europe markets during 2015 and 2016.
670/013 2.0 18
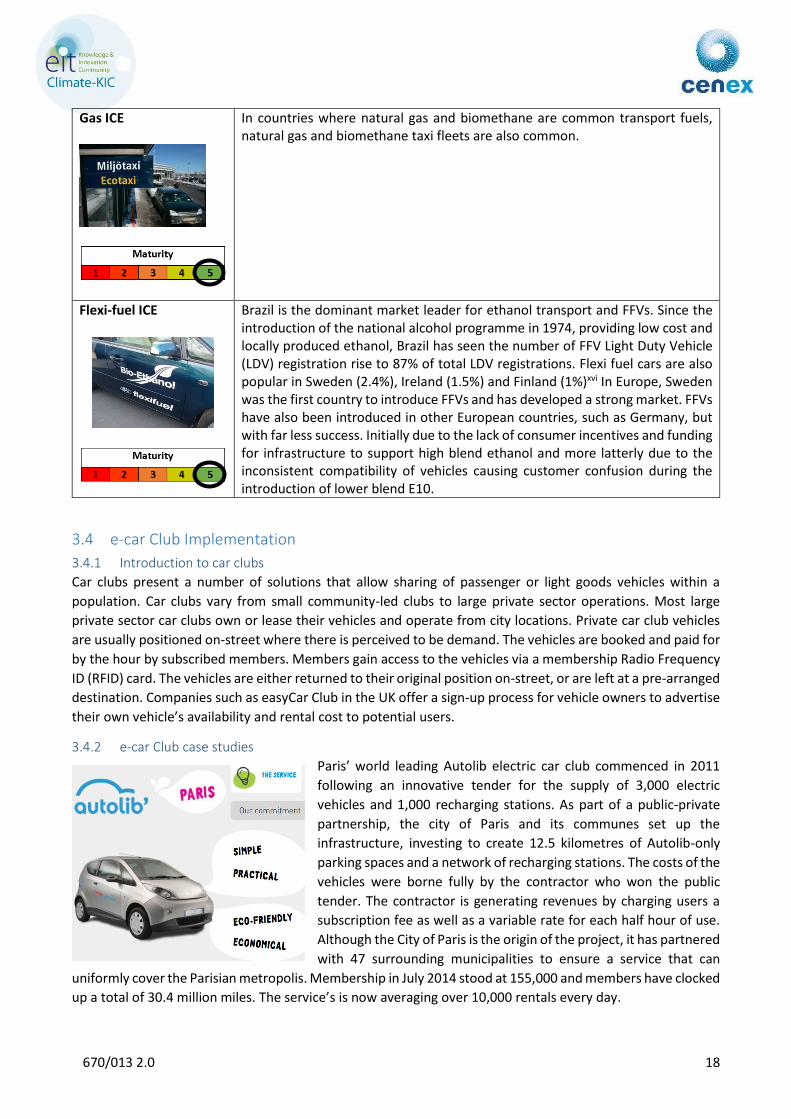
Gas ICE
In countries where natural gas and biomethane are common transport fuels, natural gas and biomethane taxi fleets are also common.
Flexi-fuel ICE
Brazil is the dominant market leader for ethanol transport and FFVs. Since the introduction of the national alcohol programme in 1974, providing low cost and locally produced ethanol, Brazil has seen the number of FFV Light Duty Vehicle (LDV) registration rise to 87% of total LDV registrations. Flexi fuel cars are also popular in Sweden (2.4%), Ireland (1.5%) and Finland (1%)xvi In Europe, Sweden was the first country to introduce FFVs and has developed a strong market. FFVs have also been introduced in other European countries, such as Germany, but with far less success. Initially due to the lack of consumer incentives and funding for infrastructure to support high blend ethanol and more latterly due to the inconsistent compatibility of vehicles causing customer confusion during the introduction of lower blend E10.
3.4 e-car Club Implementation
3.4.1 Introduction to car clubs
Car clubs present a number of solutions that allow sharing of passenger or light goods vehicles within a
population. Car clubs vary from small community-led clubs to large private sector operations. Most large
private sector car clubs own or lease their vehicles and operate from city locations. Private car club vehicles
are usually positioned on-street where there is perceived to be demand. The vehicles are booked and paid for
by the hour by subscribed members. Members gain access to the vehicles via a membership Radio Frequency
ID (RFID) card. The vehicles are either returned to their original position on-street, or are left at a pre-arranged
destination. Companies such as easyCar Club in the UK offer a sign-up process for vehicle owners to advertise
their own vehicle’s availability and rental cost to potential users.
3.4.2 e-car Club case studies
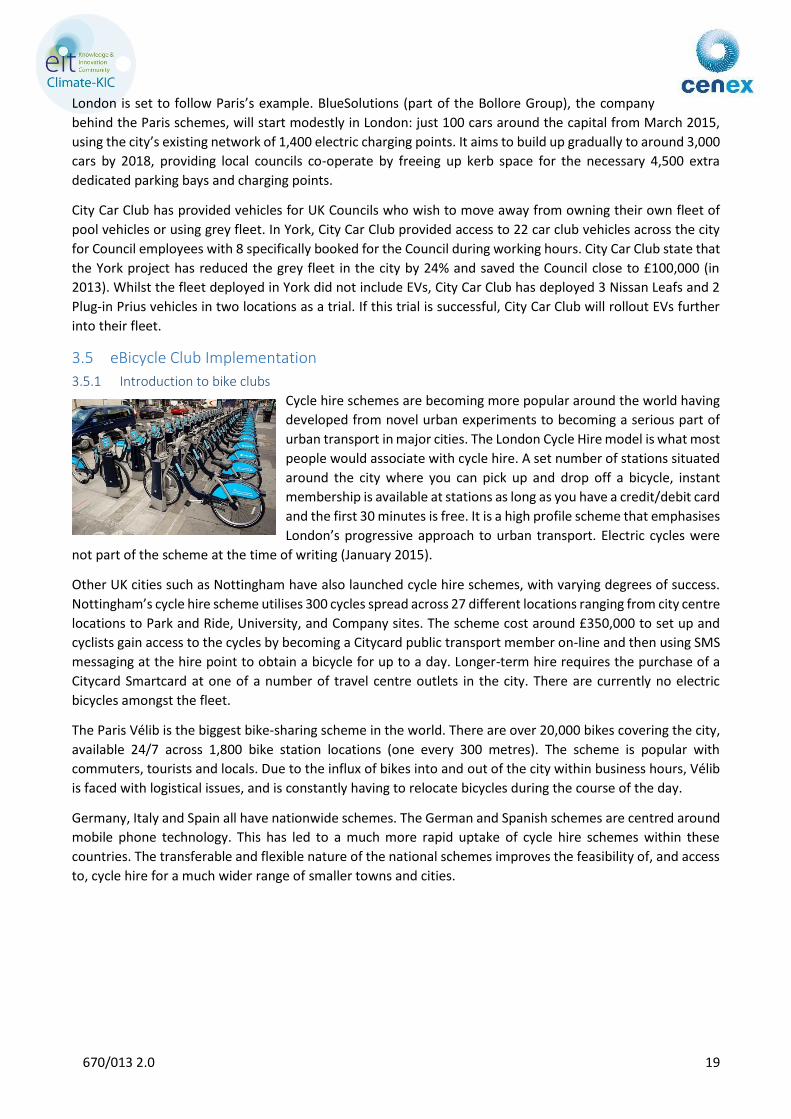
Paris’ world leading Autolib electric car club commenced in 2011
following an innovative tender for the supply of 3,000 electric
vehicles and 1,000 recharging stations. As part of a public-private
partnership, the city of Paris and its communes set up the
infrastructure, investing to create 12.5 kilometres of Autolib-only
parking spaces and a network of recharging stations. The costs of the
vehicles were borne fully by the contractor who won the public
tender. The contractor is generating revenues by charging users a
subscription fee as well as a variable rate for each half hour of use.
Although the City of Paris is the origin of the project, it has partnered
with 47 surrounding municipalities to ensure a service that can
uniformly cover the Parisian metropolis. Membership in July 2014 stood at 155,000 and members have clocked
up a total of 30.4 million miles. The service’s is now averaging over 10,000 rentals every day.
670/013 2.0 19
London is set to follow Paris’s example. BlueSolutions (part of the Bollore Group), the company
behind the Paris schemes, will start modestly in London: just 100 cars around the capital from March 2015,
using the city’s existing network of 1,400 electric charging points. It aims to build up gradually to around 3,000
cars by 2018, providing local councils co-operate by freeing up kerb space for the necessary 4,500 extra
dedicated parking bays and charging points.
City Car Club has provided vehicles for UK Councils who wish to move away from owning their own fleet of
pool vehicles or using grey fleet. In York, City Car Club provided access to 22 car club vehicles across the city
for Council employees with 8 specifically booked for the Council during working hours. City Car Club state that
the York project has reduced the grey fleet in the city by 24% and saved the Council close to £100,000 (in
2013). Whilst the fleet deployed in York did not include EVs, City Car Club has deployed 3 Nissan Leafs and 2
Plug-in Prius vehicles in two locations as a trial. If this trial is successful, City Car Club will rollout EVs further
into their fleet.
3.5 eBicycle Club Implementation
3.5.1 Introduction to bike clubs
Cycle hire schemes are becoming more popular around the world having
developed from novel urban experiments to becoming a serious part of
urban transport in major cities. The London Cycle Hire model is what most
people would associate with cycle hire. A set number of stations situated
around the city where you can pick up and drop off a bicycle, instant
membership is available at stations as long as you have a credit/debit card
and the first 30 minutes is free. It is a high profile scheme that emphasises
London’s progressive approach to urban transport. Electric cycles were
not part of the scheme at the time of writing (January 2015).
Other UK cities such as Nottingham have also launched cycle hire schemes, with varying degrees of success.
Nottingham’s cycle hire scheme utilises 300 cycles spread across 27 different locations ranging from city centre
locations to Park and Ride, University, and Company sites. The scheme cost around £350,000 to set up and
cyclists gain access to the cycles by becoming a Citycard public transport member on-line and then using SMS
messaging at the hire point to obtain a bicycle for up to a day. Longer-term hire requires the purchase of a
Citycard Smartcard at one of a number of travel centre outlets in the city. There are currently no electric
bicycles amongst the fleet.
The Paris Vélib is the biggest bike-sharing scheme in the world. There are over 20,000 bikes covering the city,
available 24/7 across 1,800 bike station locations (one every 300 metres). The scheme is popular with
commuters, tourists and locals. Due to the influx of bikes into and out of the city within business hours, Vélib
is faced with logistical issues, and is constantly having to relocate bicycles during the course of the day.
Germany, Italy and Spain all have nationwide schemes. The German and Spanish schemes are centred around
mobile phone technology. This has led to a much more rapid uptake of cycle hire schemes within these
countries. The transferable and flexible nature of the national schemes improves the feasibility of, and access
to, cycle hire for a much wider range of smaller towns and cities.
670/013 2.0 20
3.5.2 eCycle schemes
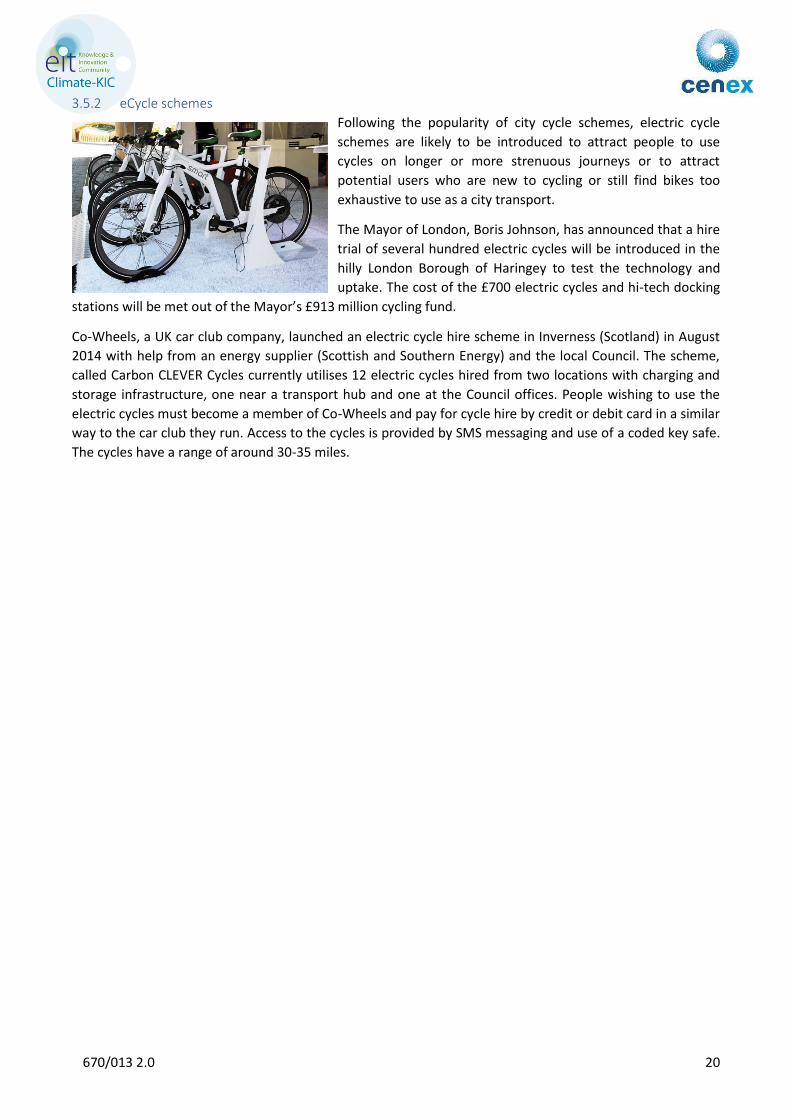
Following the popularity of city cycle schemes, electric cycle
schemes are likely to be introduced to attract people to use
cycles on longer or more strenuous journeys or to attract
potential users who are new to cycling or still find bikes too
exhaustive to use as a city transport.
The Mayor of London, Boris Johnson, has announced that a hire
trial of several hundred electric cycles will be introduced in the
hilly London Borough of Haringey to test the technology and
uptake. The cost of the £700 electric cycles and hi-tech docking
stations will be met out of the Mayor’s £913 million cycling fund.
Co-Wheels, a UK car club company, launched an electric cycle hire scheme in Inverness (Scotland) in August
2014 with help from an energy supplier (Scottish and Southern Energy) and the local Council. The scheme,
called Carbon CLEVER Cycles currently utilises 12 electric cycles hired from two locations with charging and
storage infrastructure, one near a transport hub and one at the Council offices. People wishing to use the
electric cycles must become a member of Co-Wheels and pay for cycle hire by credit or debit card in a similar
way to the car club they run. Access to the cycles is provided by SMS messaging and use of a coded key safe.
The cycles have a range of around 30-35 miles.
670/013 2.0 21
4 Emission Reduction Directives
The main pieces of European legislation driving the transition to lower carbon transport use in cities are
described below.
4.1 Renewable Energy Directive Under the Renewable Energy Directive (RED) each Member State has a renewable energy supply target for its gross final energy consumption for 2020. This target is in line with the overall '20-20-20' goal2 for the EU. Moreover, the share of energy from renewable sources in the transport sector must amount to at least 10% of final energy consumption in the EU by 2020. The Member States are to establish national action plans which set the share of energy from renewable sources consumed in transport, as well as in the production of electricity and heating, for 2020.
4.2 Clean Fuels Directive The Clean Fuels Directive (adopted by the European Parliament and the Council on 29 September 2014)
requires Member States to develop national policy frameworks for the market development of alternative
fuels and their infrastructure. The agreement requires EU-wide standards (such as a common plug) for electric
vehicles, standardised refuelling equipment and consumer information – all based on methodology to be
established by the Commission. Member States will have to define national policy frameworks, such as
national targets and objectives, which set minimum requirements for alternative fuels (the Commission had
initially proposed mandatory targets set by the EU). They will be able to choose whether or not to include
hydrogen as an alternative fuel. Member States will have two years to adopt national provisions to comply
with the Directive. Infrastructure should be installed by 2020 – 2030 dependent on the infrastructure type (EV,
Gas or Hydrogen).
4.3 Clean Vehicles Directive The Directive on the Promotion of Clean and Energy Efficient Road Transport Vehicles (2009/33/EC) aims at a
broad market introduction of clean and energy-efficient vehicles to improve the environmental performance
2 The EU 20-20-20 goals include targets to reduce emissions of greenhouse gases by 20% by 2020, to increase energy efficiency to save 20% of EU energy consumption by 2020, to reach 20% of renewable energy in the total energy consumption in the EU by 2020 and to reach 10% of biofuels in the total consumption of vehicles by 2020.
The main pieces of European legislation driving the transition to lower carbon transport use in cities
are described in this chapter.
Key points
The Renewable Energy Directive contains a target for renewable energy from each member state.
This includes a requirement for a 10% renewable energy contribution in transport across the EU
by 2020.
The Clean Fuels Directive (adopted by the European Parliament and the Council on 29 September
2014) requires Member States to develop national policy frameworks for the market development
of alternative fuels and their infrastructure.
The Clean Vehicle Directive requires that environmental impacts linked to the operation over the
lifetime of vehicles are taken into account in public procurement purchase decisions.
EU CO2 regulation sets mandatory emission reduction targets for new cars sold within the EU
670/013 2.0 22
of transport. It requires that environmental impacts linked to the operation over the lifetime of
vehicles are taken into account in public procurement purchase decisions. It defines common rules on how to
monetise impacts and calculate the operational lifetime costs for energy consumption, CO2 emissions and
pollutant emissions (NOx, NMHC, PM) of vehicles. The lifetime mileage is multiplied by the corresponding
value of energy consumption or emissions per kilometre and by the respective cost per unit of energy or
emission. The Directive is expected to accelerate broad market introduction of clean and energy-efficient road
transport. The Directive was adopted on 30 March 2009 and has been integrated into national legislation in
all EU Member States.
4.4 CO2 regulation European Union legislation sets mandatory emission reduction targets for new cars. This legislation is the
cornerstone of the EU's strategy to improve the fuel economy of cars sold on the European market. The fleet
average to be achieved by all new cars is 130 grams of CO2 per kilometre (g/km) by 2015 – with the target
phased in from 2012 - and 95g/km by 2021. The 2015 and 2021 targets represent reductions of 18% and 40%
respectively compared with the 2007 fleet average of 158.7g/km. In terms of fuel consumption, the 2015
target is approximately equivalent to 5.6 litres per 100 km (l/100 km) of petrol or 4.9 l/100 km of diesel. The
2021 target equates to approximately 4.1 l/100 km of petrol or 3.6 l/100 km of diesel.
Whilst similar regulation is in place for vans, there is no current CO2 regulation for buses. However the
European Commission intends in 2015 to propose legislation which would require CO2 emissions from new
Heavy Duty Vehicles (HDV) to be certified, reported and monitored.xvii
670/013 2.0 23
5 Technology Foresighting
This chapter presents a review of technologies for cars and buses which can assist in the
decarbonisation of public transport. The review examines the expected future performance of these
technologies and the likely timelines for implementation. Information was sourced from publically
available technology roadmaps, discussions with technology suppliers and industry experts and
Cenex’s own knowledge base.
Key points
This section presents an aggregated EU wide summary (derived from industry roadmaps) of the likely future
developments in mainstream bus and passenger car technologies, focusing mainly on the period 2015 – 2025
Local incentives and tax regimes significantly alter the economics of low carbon vehicle deployments. The
cost assessment presented has attempted to estimate future Total Cost of Ownership (TCO) performance
with no local incentives applied
For buses
Before 2020 it is expected that new technologies, such as stop-start, mild hybrid and flywheel hybrid
systems, offering relatively rapid (<5 year) pack back will appear in increasing numbers in city buses. Full
hybrids are expected to potentially offer lower TCO under certain duty cycles by 2020. Pure EV bus
deployments, whilst growing in numbers, will be limited by costs and questions over battery durability.
Conductive bus stop charging and PHEV buses will gradually emerge in user-led demonstration projects.
Biofuels will increase in use but are expected to be mainly blended within standard transport fuel within the
current EN fuel standards. Natural gas buses will increase in numbers with improved engine efficiency (and
hence cost proposition) and reduced CO2 due to the increase of biomethane use. Higher blends of biofuels
will be used in opportunistic fleets looking for significant carbon reduction
By 2025 key advances will be made in all types of hybrid with hybridisation being the default technology
choice. Advance in battery technology will incrementally improve the range and cost performance of EV
buses. Subsidised deployment will grow the numbers of and availability of EV buses with non-subsidised
breakeven costs being reached if battery durability is proven. Conductive bus stop rapid charging
deployments will be demonstrated throughout the EU. Gas vehicles, with blended biomethane will also
increase in numbers with infrastructure provision supported through the Clean Fuels Directive. If proven
economic, drop-in fuels could be blended in high volumes with standard diesel. Hydrogen FC buses will be
evaluated in user-led demonstration and evaluation trials, where funding exists. Pure DME and PPO may be
used by opportunistic fleets looking for significant carbon reduction
For cars
Before 2020 hybrid vehicles dominate alternative fuel vehicle sales, with EVs and PHEV/REEV growing in
numbers where local incentives encourage activity
By 2025 unsubsidised operation of EVs and PHEV/REEV is expected. FCEV deployments will grow in numbers
but issues of purchase cost and green fuel supply costs hamper mass uptake. Gas vehicles, blended with
biomethane offer cost effective lower carbon transport. If proven economic, drop-in fuels may be blended
in high volumes with standard diesel
670/013 2.0 24
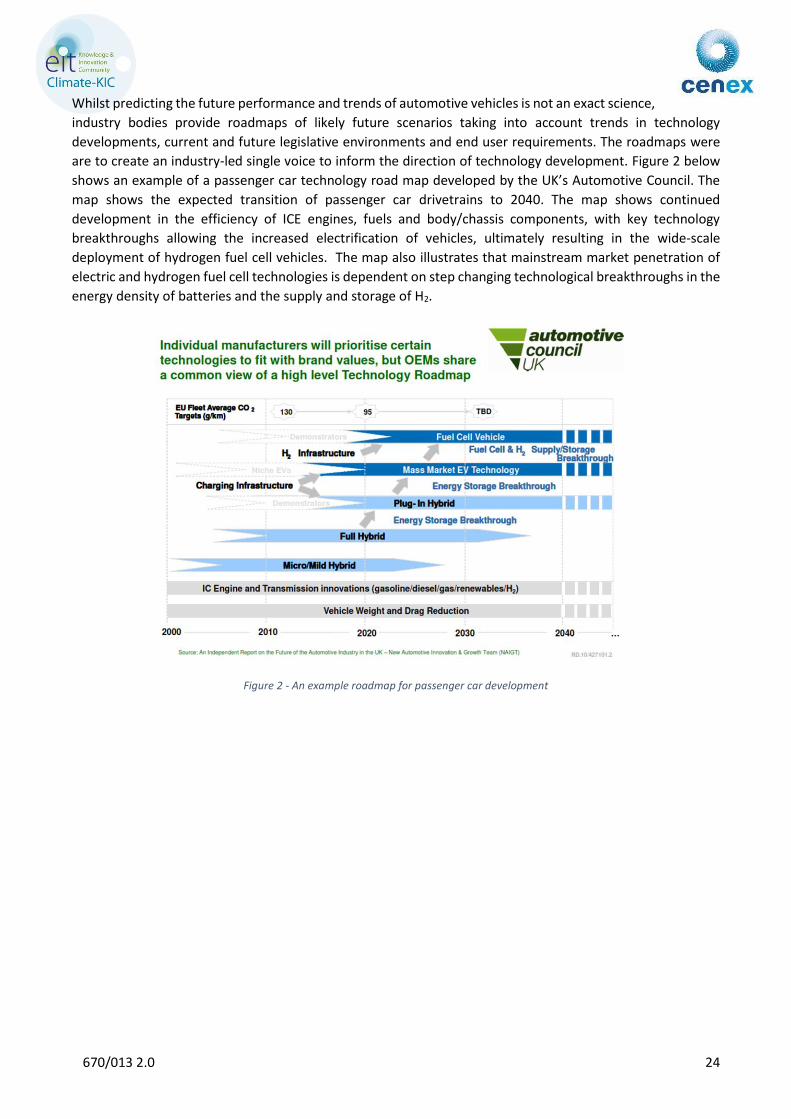
Whilst predicting the future performance and trends of automotive vehicles is not an exact science,
industry bodies provide roadmaps of likely future scenarios taking into account trends in technology
developments, current and future legislative environments and end user requirements. The roadmaps were
are to create an industry-led single voice to inform the direction of technology development. Figure 2 below
shows an example of a passenger car technology road map developed by the UK’s Automotive Council. The
map shows the expected transition of passenger car drivetrains to 2040. The map shows continued
development in the efficiency of ICE engines, fuels and body/chassis components, with key technology
breakthroughs allowing the increased electrification of vehicles, ultimately resulting in the wide-scale
deployment of hydrogen fuel cell vehicles. The map also illustrates that mainstream market penetration of
electric and hydrogen fuel cell technologies is dependent on step changing technological breakthroughs in the
energy density of batteries and the supply and storage of H2.
Figure 2 - An example roadmap for passenger car development
670/013 2.0 25
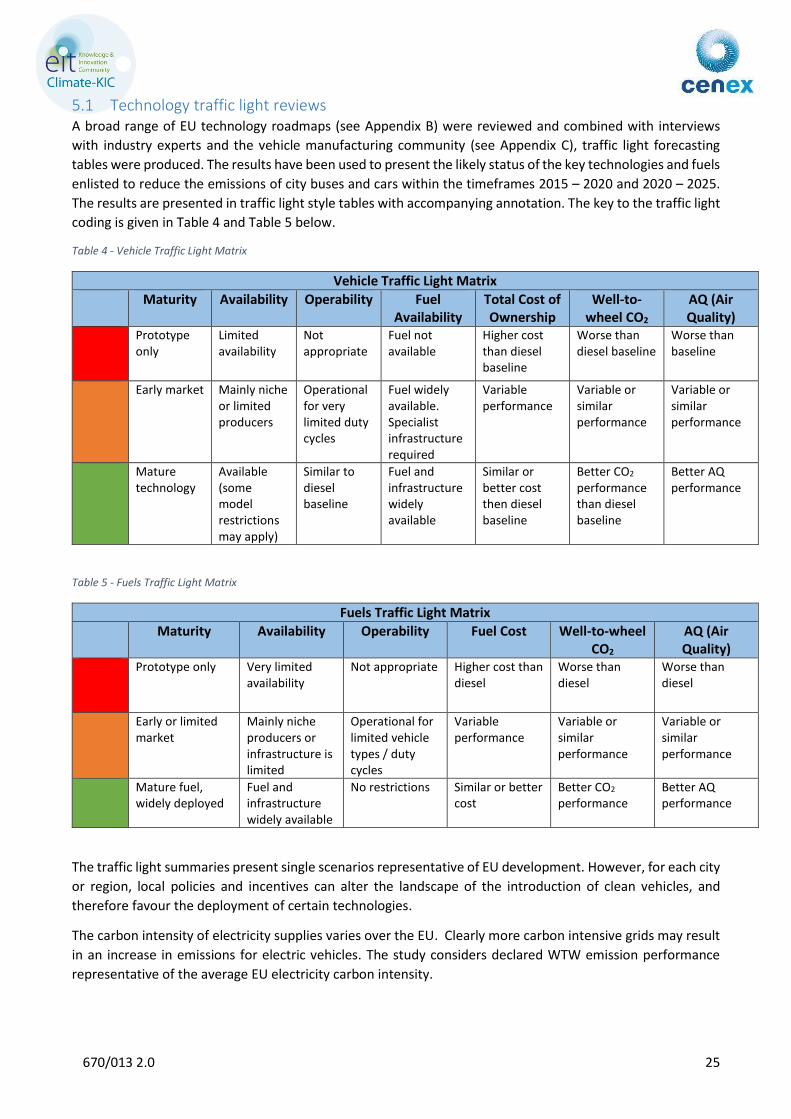
5.1 Technology traffic light reviews A broad range of EU technology roadmaps (see Appendix B) were reviewed and combined with interviews
with industry experts and the vehicle manufacturing community (see Appendix C), traffic light forecasting
tables were produced. The results have been used to present the likely status of the key technologies and fuels
enlisted to reduce the emissions of city buses and cars within the timeframes 2015 – 2020 and 2020 – 2025.
The results are presented in traffic light style tables with accompanying annotation. The key to the traffic light
coding is given in Table 4 and Table 5 below.
Table 4 - Vehicle Traffic Light Matrix
Vehicle Traffic Light Matrix
Maturity Availability Operability Fuel Availability
Total Cost of Ownership
Well-to-wheel CO2
AQ (Air Quality)
Prototype only
Limited availability
Not appropriate
Fuel not available
Higher cost than diesel baseline
Worse than diesel baseline
Worse than baseline
Early market Mainly niche or limited producers
Operational for very limited duty cycles
Fuel widely available. Specialist infrastructure required
Variable performance
Variable or similar performance
Variable or similar performance
Mature technology
Available (some model restrictions may apply)
Similar to diesel baseline
Fuel and infrastructure widely available
Similar or better cost then diesel baseline
Better CO2 performance than diesel baseline
Better AQ performance
Table 5 - Fuels Traffic Light Matrix
Fuels Traffic Light Matrix
Maturity Availability Operability Fuel Cost Well-to-wheel CO2
AQ (Air Quality)
Prototype only Very limited availability
Not appropriate Higher cost than diesel
Worse than diesel
Worse than diesel
Early or limited market
Mainly niche producers or infrastructure is limited
Operational for limited vehicle types / duty cycles
Variable performance
Variable or similar performance
Variable or similar performance
Mature fuel, widely deployed
Fuel and infrastructure widely available
No restrictions Similar or better cost
Better CO2 performance
Better AQ performance
The traffic light summaries present single scenarios representative of EU development. However, for each city
or region, local policies and incentives can alter the landscape of the introduction of clean vehicles, and
therefore favour the deployment of certain technologies.
The carbon intensity of electricity supplies varies over the EU. Clearly more carbon intensive grids may result
in an increase in emissions for electric vehicles. The study considers declared WTW emission performance
representative of the average EU electricity carbon intensity.
670/013 2.0 26
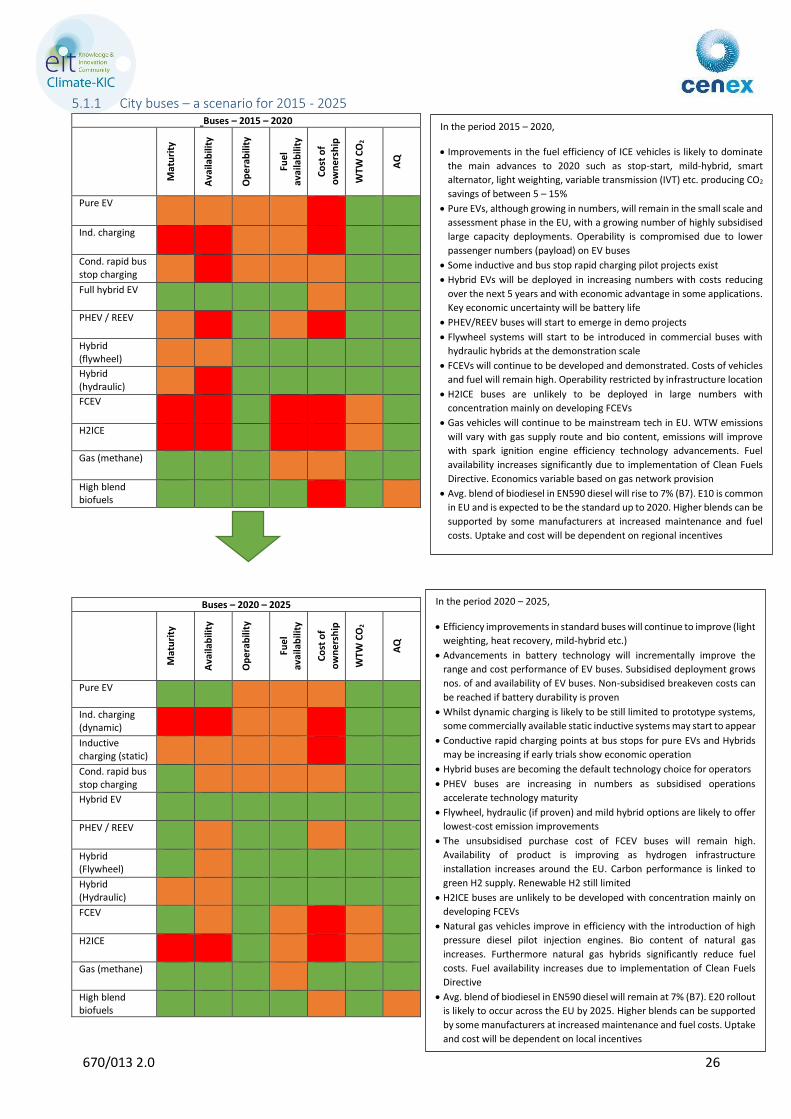
5.1.1 City buses – a scenario for 2015 - 2025 Buses – 2015 – 2020
Mat
uri
ty
Ava
ilab
ility
Op
era
bili
ty
Fue
l
avai
lab
ility
Co
st o
f o
wn
ers
hip
WTW
CO
2
AQ
Pure EV
Ind. charging
Cond. rapid bus stop charging
Full hybrid EV
PHEV / REEV
Hybrid (flywheel)
Hybrid (hydraulic)
FCEV
H2ICE
Gas (methane)
High blend biofuels
Buses – 2020 – 2025
Mat
uri
ty
Ava
ilab
ility
Op
era
bili
ty
Fue
l
avai
lab
ility
Co
st o
f o
wn
ers
hip
WTW
CO
2
AQ
Pure EV
Ind. charging (dynamic)
Inductive charging (static)
Cond. rapid bus stop charging
Hybrid EV
PHEV / REEV
Hybrid (Flywheel)
Hybrid (Hydraulic)
FCEV
H2ICE
Gas (methane)
High blend biofuels
In the period 2015 – 2020,
Improvements in the fuel efficiency of ICE vehicles is likely to dominate
the main advances to 2020 such as stop-start, mild-hybrid, smart
alternator, light weighting, variable transmission (IVT) etc. producing CO2
savings of between 5 – 15%
Pure EVs, although growing in numbers, will remain in the small scale and
assessment phase in the EU, with a growing number of highly subsidised
large capacity deployments. Operability is compromised due to lower
passenger numbers (payload) on EV buses
Some inductive and bus stop rapid charging pilot projects exist
Hybrid EVs will be deployed in increasing numbers with costs reducing
over the next 5 years and with economic advantage in some applications.
Key economic uncertainty will be battery life
PHEV/REEV buses will start to emerge in demo projects
Flywheel systems will start to be introduced in commercial buses with
hydraulic hybrids at the demonstration scale
FCEVs will continue to be developed and demonstrated. Costs of vehicles
and fuel will remain high. Operability restricted by infrastructure location
H2ICE buses are unlikely to be deployed in large numbers with
concentration mainly on developing FCEVs
Gas vehicles will continue to be mainstream tech in EU. WTW emissions
will vary with gas supply route and bio content, emissions will improve
with spark ignition engine efficiency technology advancements. Fuel
availability increases significantly due to implementation of Clean Fuels
Directive. Economics variable based on gas network provision
Avg. blend of biodiesel in EN590 diesel will rise to 7% (B7). E10 is common
in EU and is expected to be the standard up to 2020. Higher blends can be
supported by some manufacturers at increased maintenance and fuel
costs. Uptake and cost will be dependent on regional incentives
In the period 2020 – 2025,
Efficiency improvements in standard buses will continue to improve (light
weighting, heat recovery, mild-hybrid etc.)
Advancements in battery technology will incrementally improve the
range and cost performance of EV buses. Subsidised deployment grows
nos. of and availability of EV buses. Non-subsidised breakeven costs can
be reached if battery durability is proven
Whilst dynamic charging is likely to be still limited to prototype systems,
some commercially available static inductive systems may start to appear
Conductive rapid charging points at bus stops for pure EVs and Hybrids
may be increasing if early trials show economic operation
Hybrid buses are becoming the default technology choice for operators
PHEV buses are increasing in numbers as subsidised operations
accelerate technology maturity
Flywheel, hydraulic (if proven) and mild hybrid options are likely to offer
lowest-cost emission improvements
The unsubsidised purchase cost of FCEV buses will remain high.
Availability of product is improving as hydrogen infrastructure
installation increases around the EU. Carbon performance is linked to
green H2 supply. Renewable H2 still limited
H2ICE buses are unlikely to be developed with concentration mainly on
developing FCEVs
Natural gas vehicles improve in efficiency with the introduction of high
pressure diesel pilot injection engines. Bio content of natural gas
increases. Furthermore natural gas hybrids significantly reduce fuel
costs. Fuel availability increases due to implementation of Clean Fuels
Directive
Avg. blend of biodiesel in EN590 diesel will remain at 7% (B7). E20 rollout
is likely to occur across the EU by 2025. Higher blends can be supported
by some manufacturers at increased maintenance and fuel costs. Uptake
and cost will be dependent on local incentives
670/013 2.0 27
5.1.2 Buses 2030 to 2035
Whilst efficient ICE buses, coupled with increases in biofuel use are still expected to dominate transport
deployments towards 2030, ERTRAC (European Road Transport Research Advisory Council) foresees the
electrification of the European bus system as being the end-game of technology change beyond 2030.
2013/14 saw the introduction of legislation by leading EU cities focusing on zero emissions, mainly driven by
air quality improvements but are also likely to provide associated carbon benefit (e.g. proposed ULEZ for
London, and the Netherlands Ministry of Infrastructure and the Environment Green Deal with the ambition to
completely change the Dutch public transport buses to zero-emission by 2025). Assuming technology trials of
zero emission transport continue to be successful it is likely that other cities will follow suit.
The deployment of pure ICE engines in city public transport systems is likely to start to decline, with high blend
biofuel use being preferred for powering long distance or out of city transport systems.
670/013 2.0 28
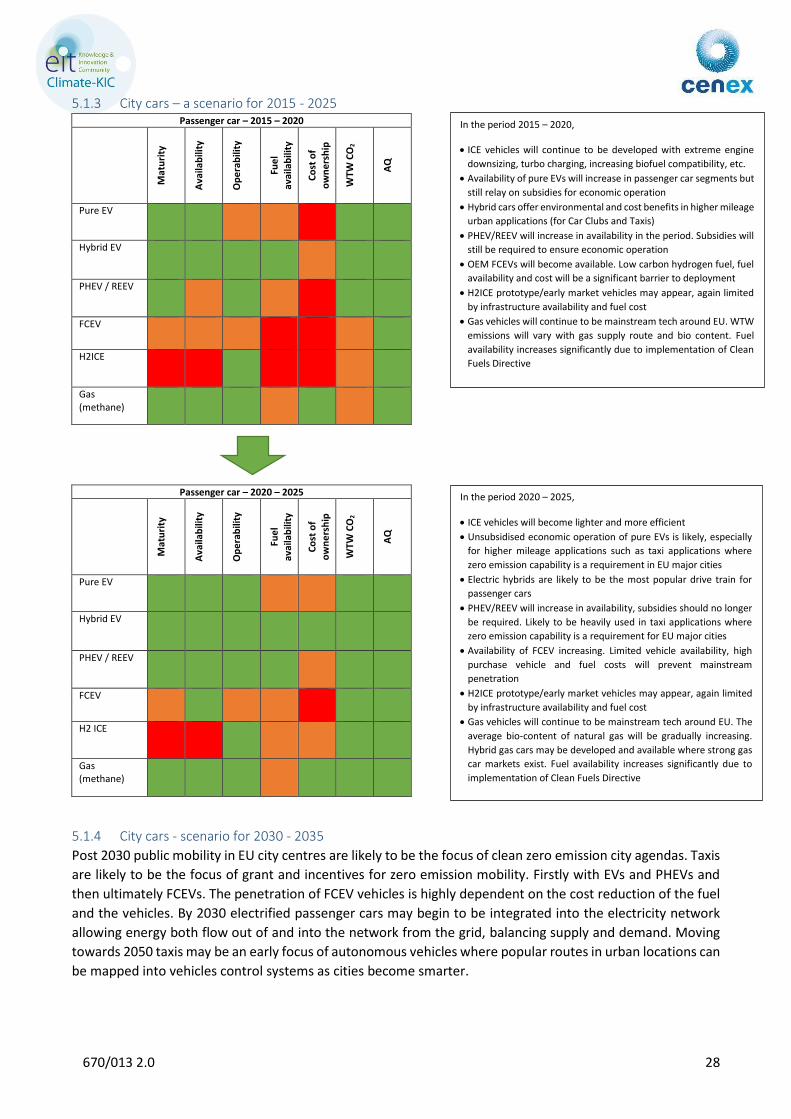
5.1.3 City cars – a scenario for 2015 - 2025 Passenger car – 2015 – 2020
Mat
uri
ty
Ava
ilab
ility
Op
era
bili
ty
Fue
l
avai
lab
ility
Co
st o
f o
wn
ers
hip
WTW
CO
2
AQ
Pure EV
Hybrid EV
PHEV / REEV
FCEV
H2ICE
Gas (methane)
Passenger car – 2020 – 2025
Mat
uri
ty
Ava
ilab
ility
Op
era
bili
ty
Fue
l
avai
lab
ility
Co
st o
f o
wn
ers
hip
WTW
CO
2
AQ
Pure EV
Hybrid EV
PHEV / REEV
FCEV
H2 ICE
Gas (methane)
5.1.4 City cars - scenario for 2030 - 2035
Post 2030 public mobility in EU city centres are likely to be the focus of clean zero emission city agendas. Taxis
are likely to be the focus of grant and incentives for zero emission mobility. Firstly with EVs and PHEVs and
then ultimately FCEVs. The penetration of FCEV vehicles is highly dependent on the cost reduction of the fuel
and the vehicles. By 2030 electrified passenger cars may begin to be integrated into the electricity network
allowing energy both flow out of and into the network from the grid, balancing supply and demand. Moving
towards 2050 taxis may be an early focus of autonomous vehicles where popular routes in urban locations can
be mapped into vehicles control systems as cities become smarter.
In the period 2020 – 2025,
ICE vehicles will become lighter and more efficient
Unsubsidised economic operation of pure EVs is likely, especially
for higher mileage applications such as taxi applications where
zero emission capability is a requirement in EU major cities
Electric hybrids are likely to be the most popular drive train for
passenger cars
PHEV/REEV will increase in availability, subsidies should no longer
be required. Likely to be heavily used in taxi applications where
zero emission capability is a requirement for EU major cities
Availability of FCEV increasing. Limited vehicle availability, high
purchase vehicle and fuel costs will prevent mainstream
penetration
H2ICE prototype/early market vehicles may appear, again limited
by infrastructure availability and fuel cost
Gas vehicles will continue to be mainstream tech around EU. The
average bio-content of natural gas will be gradually increasing.
Hybrid gas cars may be developed and available where strong gas
car markets exist. Fuel availability increases significantly due to
implementation of Clean Fuels Directive
In the period 2015 – 2020,
ICE vehicles will continue to be developed with extreme engine
downsizing, turbo charging, increasing biofuel compatibility, etc.
Availability of pure EVs will increase in passenger car segments but
still relay on subsidies for economic operation
Hybrid cars offer environmental and cost benefits in higher mileage
urban applications (for Car Clubs and Taxis)
PHEV/REEV will increase in availability in the period. Subsidies will
still be required to ensure economic operation
OEM FCEVs will become available. Low carbon hydrogen fuel, fuel
availability and cost will be a significant barrier to deployment
H2ICE prototype/early market vehicles may appear, again limited
by infrastructure availability and fuel cost
Gas vehicles will continue to be mainstream tech around EU. WTW
emissions will vary with gas supply route and bio content. Fuel
availability increases significantly due to implementation of Clean
Fuels Directive
670/013 2.0 29
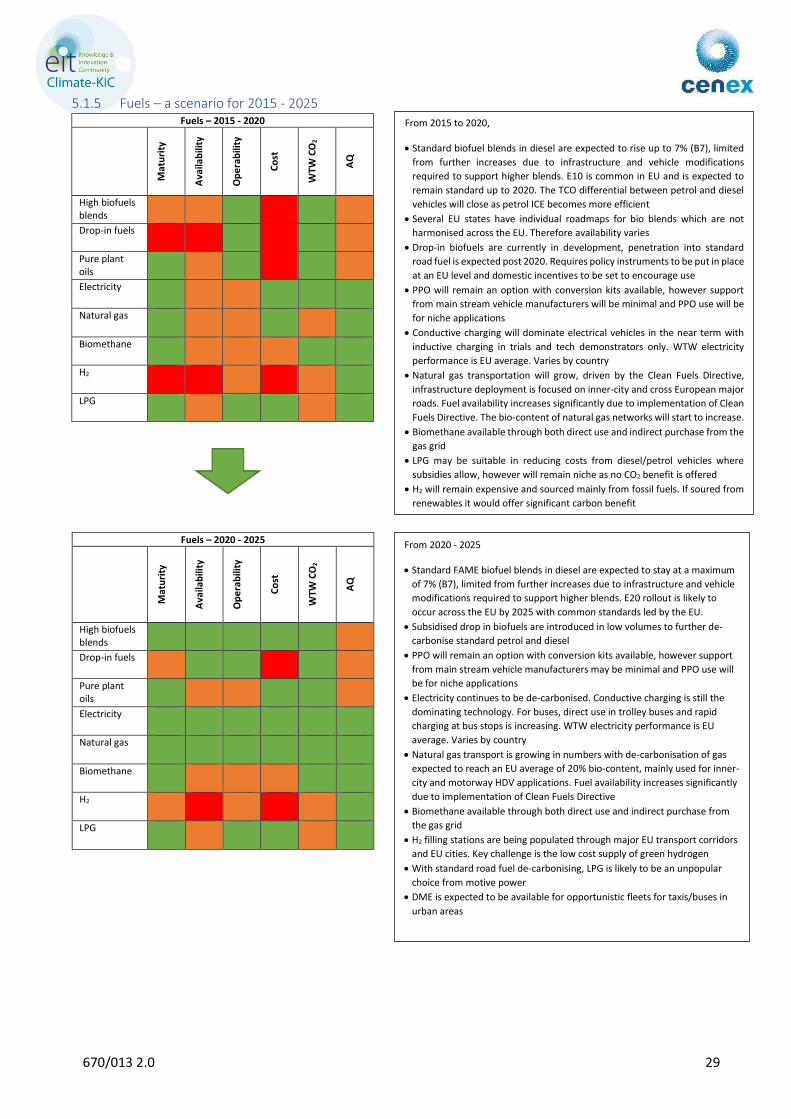
5.1.5 Fuels – a scenario for 2015 - 2025 Fuels – 2015 - 2020
Mat
uri
ty
Ava
ilab
ility
Op
era
bili
ty
Co
st
WTW
CO
2
AQ
High biofuels blends
Drop-in fuels
Pure plant oils
Electricity
Natural gas
Biomethane
H2
LPG
Fuels – 2020 - 2025
Mat
uri
ty
Ava
ilab
ility
Op
era
bili
ty
Co
st
WTW
CO
2
AQ
High biofuels blends
Drop-in fuels
Pure plant oils
Electricity
Natural gas
Biomethane
H2
LPG
From 2020 - 2025
Standard FAME biofuel blends in diesel are expected to stay at a maximum
of 7% (B7), limited from further increases due to infrastructure and vehicle
modifications required to support higher blends. E20 rollout is likely to
occur across the EU by 2025 with common standards led by the EU.
Subsidised drop in biofuels are introduced in low volumes to further de-
carbonise standard petrol and diesel
PPO will remain an option with conversion kits available, however support
from main stream vehicle manufacturers may be minimal and PPO use will
be for niche applications
Electricity continues to be de-carbonised. Conductive charging is still the
dominating technology. For buses, direct use in trolley buses and rapid
charging at bus stops is increasing. WTW electricity performance is EU
average. Varies by country
Natural gas transport is growing in numbers with de-carbonisation of gas
expected to reach an EU average of 20% bio-content, mainly used for inner-
city and motorway HDV applications. Fuel availability increases significantly
due to implementation of Clean Fuels Directive
Biomethane available through both direct use and indirect purchase from
the gas grid
H2 filling stations are being populated through major EU transport corridors
and EU cities. Key challenge is the low cost supply of green hydrogen
With standard road fuel de-carbonising, LPG is likely to be an unpopular
choice from motive power
DME is expected to be available for opportunistic fleets for taxis/buses in
urban areas
From 2015 to 2020,
Standard biofuel blends in diesel are expected to rise up to 7% (B7), limited
from further increases due to infrastructure and vehicle modifications
required to support higher blends. E10 is common in EU and is expected to
remain standard up to 2020. The TCO differential between petrol and diesel
vehicles will close as petrol ICE becomes more efficient
Several EU states have individual roadmaps for bio blends which are not
harmonised across the EU. Therefore availability varies
Drop-in biofuels are currently in development, penetration into standard
road fuel is expected post 2020. Requires policy instruments to be put in place
at an EU level and domestic incentives to be set to encourage use
PPO will remain an option with conversion kits available, however support
from main stream vehicle manufacturers will be minimal and PPO use will be
for niche applications
Conductive charging will dominate electrical vehicles in the near term with
inductive charging in trials and tech demonstrators only. WTW electricity
performance is EU average. Varies by country
Natural gas transportation will grow, driven by the Clean Fuels Directive,
infrastructure deployment is focused on inner-city and cross European major
roads. Fuel availability increases significantly due to implementation of Clean
Fuels Directive. The bio-content of natural gas networks will start to increase.
Biomethane available through both direct use and indirect purchase from the
gas grid
LPG may be suitable in reducing costs from diesel/petrol vehicles where
subsidies allow, however will remain niche as no CO2 benefit is offered
H2 will remain expensive and sourced mainly from fossil fuels. If soured from
renewables it would offer significant carbon benefit

670/013 2.0 30
5.1.6 Road fuels 2030 - 2035
According to ERTRAC, by 2030 the availability of biomass, liquid and gaseous biofuels have reached a limit of
20% substitution in fossil fuels. Vehicle engines are hybridised and optimised to use high quality drop-in fuels.
Electrified vehicles represent up to 33% of all vehicle sales and green electricity is available through a large
recharging infrastructure, as well as renewable hydrogen from a network of hydrogen filling stations. CNG,
including hybrids, is very well established in the mobility sector. For HD vehicles, full electric vehicles come to
play only in city distribution and buses. ERTRAC expect the total the market share of new registered alternative
vehicles has the potential to approach 50%.
670/013 2.0 31
5.2 Detailed Technology Study for Buses
The most detailed technology roadmap for buses is the Preparing a Low CO2 Technology Roadmap for Buses
report by Ricardo-AEA for the UK’s Low Carbon Vehicle Partnership.
Figure 3 below shows the results of an analysis that compares the payback period of low carbon technologies
against the WTW CO2 benefit available.3 Being a UK-based technology study, the analysis presents results for
both single and double decker buses. The following should also be noted
The study includes technologies which are available in other automotive applications but not yet
commercially available in buses
The study is specific to the UK but broadly representative of EU performance
Local subsidies for environmental technologies distort the true economic performance of
technologies. The figure below shows the payback period of the bus technologies with no subsidies
applied
A brief introduction to the low carbon technologies in this section is provided in Appendix A. The
descriptions draw heavily on the source report
3 Assumptions: 40,000 miles per annum, 8 mpg single decker, 6 mpg double decker, diesel 50 p/l, cng 60.3 p/kg, electricity 8.5ppkwh, performance modelled over the London bus cycle
Key points
The most detailed publically available technology roadmap and analysis for buses is the Preparing
a Low CO2 Technology Roadmap for Buses report by Ricardo-AEA for the UK’s Low Carbon Vehicle
Partnership
The analysis highlights fourteen lower carbon options which offer economic payback within the
typical lifetime of a city bus today. Seven of these options offer payback within a five year period
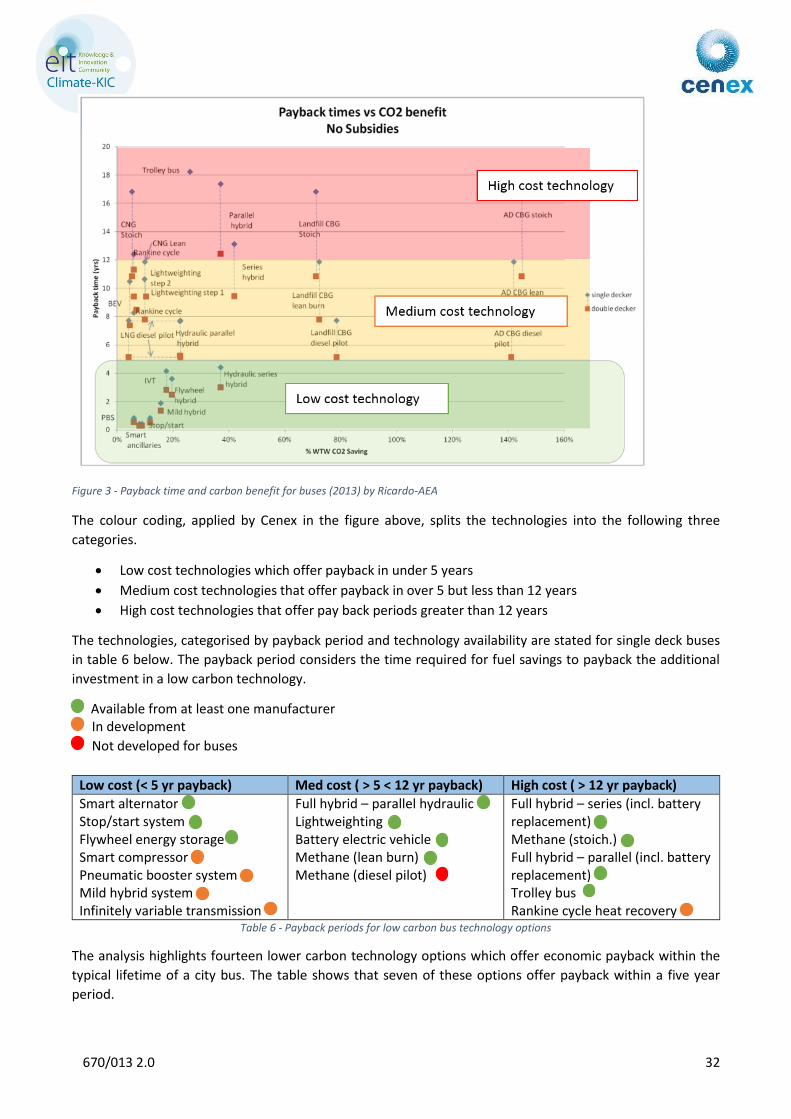
670/013 2.0 32
Figure 3 - Payback time and carbon benefit for buses (2013) by Ricardo-AEA
The colour coding, applied by Cenex in the figure above, splits the technologies into the following three
categories.
Low cost technologies which offer payback in under 5 years
Medium cost technologies that offer payback in over 5 but less than 12 years
High cost technologies that offer pay back periods greater than 12 years
The technologies, categorised by payback period and technology availability are stated for single deck buses
in table 6 below. The payback period considers the time required for fuel savings to payback the additional
investment in a low carbon technology.
Available from at least one manufacturer In development
Not developed for buses
Low cost (< 5 yr payback) Med cost ( > 5 < 12 yr payback) High cost ( > 12 yr payback)
Smart alternator Stop/start system Flywheel energy storage Smart compressor Pneumatic booster system Mild hybrid system Infinitely variable transmission
Full hybrid – parallel hydraulic Lightweighting Battery electric vehicle Methane (lean burn) Methane (diesel pilot)
Full hybrid – series (incl. battery replacement) Methane (stoich.) Full hybrid – parallel (incl. battery replacement) Trolley bus Rankine cycle heat recovery
Table 6 - Payback periods for low carbon bus technology options
The analysis highlights fourteen lower carbon technology options which offer economic payback within the
typical lifetime of a city bus. The table shows that seven of these options offer payback within a five year
period.
670/013 2.0 33
6 City Engagement
The PPIA partner cities were issued with a questionnaire followed by a phone interview which sought to gain
an understanding of the following issues for the study cities:
Number of buses and their purchasing cycles
Bus requirements
Technological understanding and aspirations
Experiences with low carbon technology
Purchasing priorities and targets
Barriers to aggregated public procurement
The personnel interview are listed in Appendix C.
Extensive answers were given in relation to bus ownership and contracts. As a result of taxis being operated
by a number of private companies, very limited information was available on taxi operation within the cities.
Similarly, no data was available for car share schemes. The summary below describes issues relating to bus
operations only, which is the main focus of this report.
This section summarises a high level survey undertaken to establish the extent of low carbon
technology adoption in the PPIA cities and identify low carbon vehicle experiences, barriers and
enablers.
Key points
The purchasing power of cities varied, some cities were in direct control of purchasing buses
whereas in other cities buses were operated by private companies
Between the PPIA cities, there are a total of nearly 3,500 new buses required before 2030. This is
split by Budapest (1,000), Birmingham (1,500), Valencia (840), Wroclaw (315) and Castellon (75).
Over 1,600 buses (43% of current bus stock) are required to be procured within the next 5 years
A review of the alternative technology status across the PPIA cities showed that just 5% of the city
buses use alternative fuels. The most popular alternative fuel is natural gas, operated in Budapest,
Castellon and Valencia. Hybrid buses are the next most popular, accounting for 2% of buses; the
vast majority of these are operated in Birmingham, where a national subsidy programme exists.
There are no electric buses currently in permanent service, although seven are being procured by
Budapest
The main perceived barrier to low carbon bus technology deployment in the PPIA cities is cost.
Other barriers include capital cost priorities in procurement, lack of knowledge, lack of influence
and lack of CO2 reduction targets and incentives
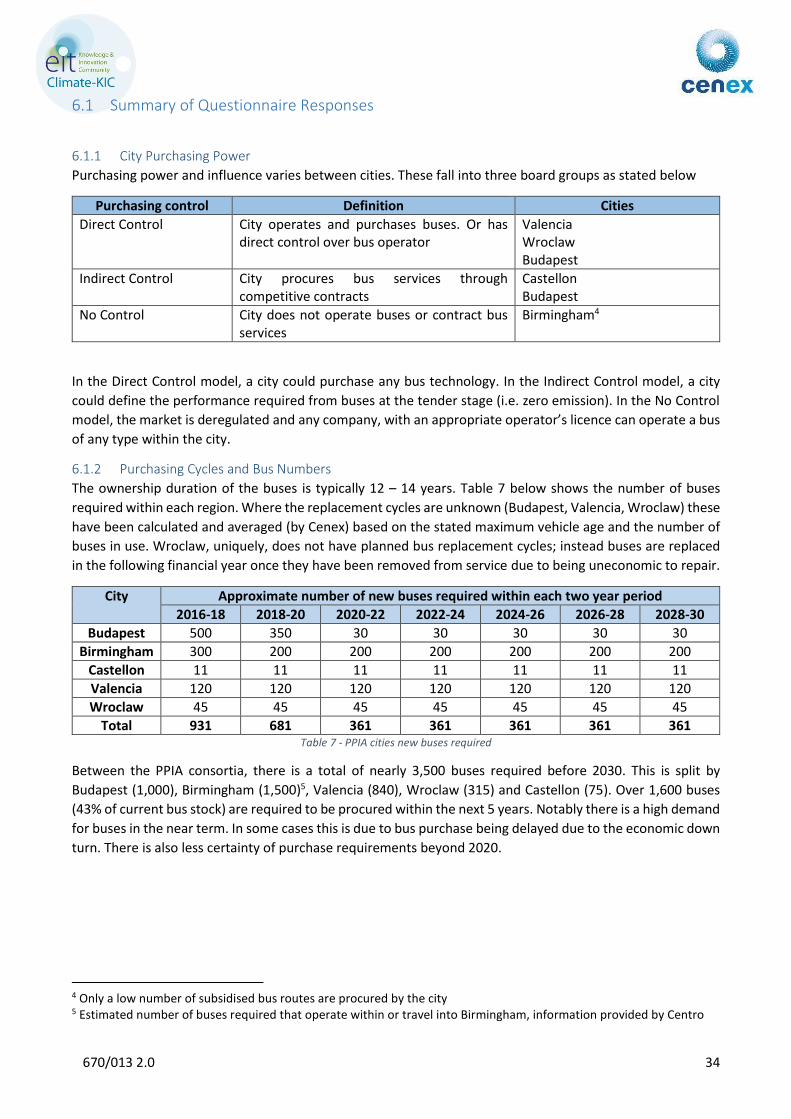
670/013 2.0 34
6.1 Summary of Questionnaire Responses
6.1.1 City Purchasing Power
Purchasing power and influence varies between cities. These fall into three board groups as stated below
Purchasing control Definition Cities
Direct Control City operates and purchases buses. Or has direct control over bus operator
Valencia Wroclaw Budapest
Indirect Control City procures bus services through competitive contracts
Castellon Budapest
No Control City does not operate buses or contract bus services
Birmingham4
In the Direct Control model, a city could purchase any bus technology. In the Indirect Control model, a city
could define the performance required from buses at the tender stage (i.e. zero emission). In the No Control
model, the market is deregulated and any company, with an appropriate operator’s licence can operate a bus
of any type within the city.
6.1.2 Purchasing Cycles and Bus Numbers
The ownership duration of the buses is typically 12 – 14 years. Table 7 below shows the number of buses
required within each region. Where the replacement cycles are unknown (Budapest, Valencia, Wroclaw) these
have been calculated and averaged (by Cenex) based on the stated maximum vehicle age and the number of
buses in use. Wroclaw, uniquely, does not have planned bus replacement cycles; instead buses are replaced
in the following financial year once they have been removed from service due to being uneconomic to repair.
City Approximate number of new buses required within each two year period
2016-18 2018-20 2020-22 2022-24 2024-26 2026-28 2028-30
Budapest 500 350 30 30 30 30 30
Birmingham 300 200 200 200 200 200 200
Castellon 11 11 11 11 11 11 11
Valencia 120 120 120 120 120 120 120
Wroclaw 45 45 45 45 45 45 45
Total 931 681 361 361 361 361 361 Table 7 - PPIA cities new buses required
Between the PPIA consortia, there is a total of nearly 3,500 buses required before 2030. This is split by
Budapest (1,000), Birmingham (1,500)5, Valencia (840), Wroclaw (315) and Castellon (75). Over 1,600 buses
(43% of current bus stock) are required to be procured within the next 5 years. Notably there is a high demand
for buses in the near term. In some cases this is due to bus purchase being delayed due to the economic down
turn. There is also less certainty of purchase requirements beyond 2020.
4 Only a low number of subsidised bus routes are procured by the city 5 Estimated number of buses required that operate within or travel into Birmingham, information provided by Centro
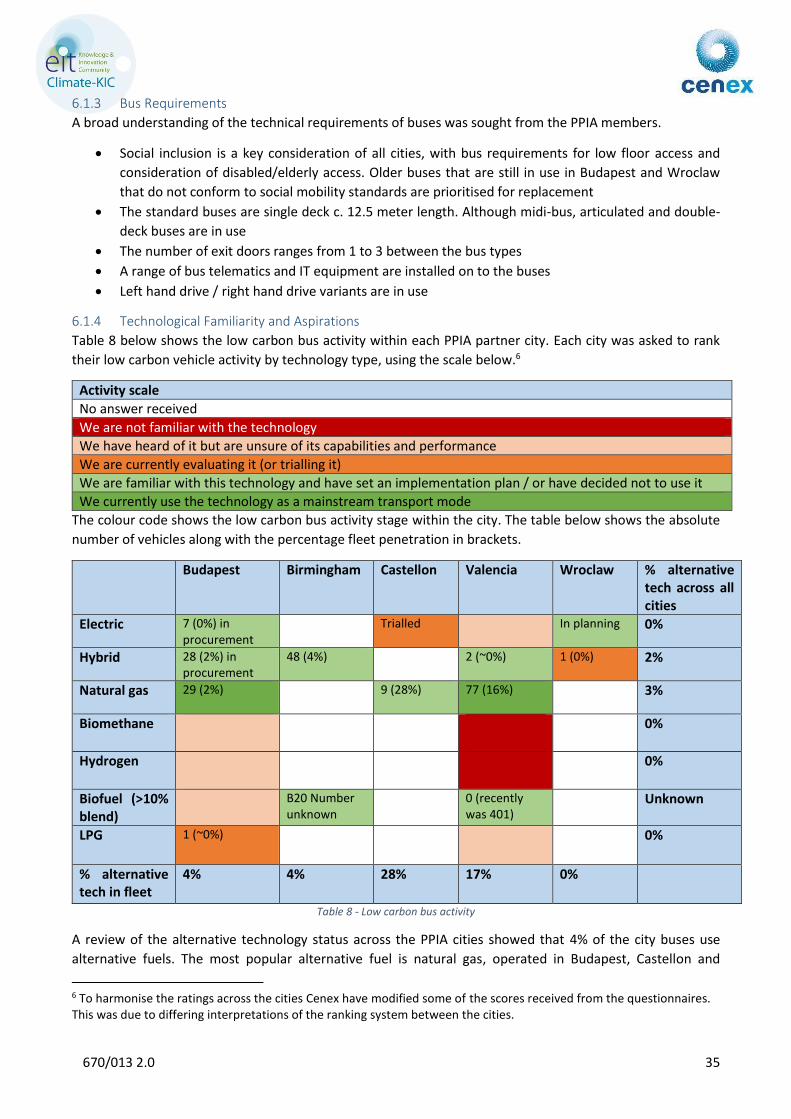
670/013 2.0 35
6.1.3 Bus Requirements
A broad understanding of the technical requirements of buses was sought from the PPIA members.
Social inclusion is a key consideration of all cities, with bus requirements for low floor access and
consideration of disabled/elderly access. Older buses that are still in use in Budapest and Wroclaw
that do not conform to social mobility standards are prioritised for replacement
The standard buses are single deck c. 12.5 meter length. Although midi-bus, articulated and double-
deck buses are in use
The number of exit doors ranges from 1 to 3 between the bus types
A range of bus telematics and IT equipment are installed on to the buses
Left hand drive / right hand drive variants are in use
6.1.4 Technological Familiarity and Aspirations
Table 8 below shows the low carbon bus activity within each PPIA partner city. Each city was asked to rank
their low carbon vehicle activity by technology type, using the scale below.6
Activity scale
No answer received
We are not familiar with the technology
We have heard of it but are unsure of its capabilities and performance
We are currently evaluating it (or trialling it)
We are familiar with this technology and have set an implementation plan / or have decided not to use it
We currently use the technology as a mainstream transport mode
The colour code shows the low carbon bus activity stage within the city. The table below shows the absolute
number of vehicles along with the percentage fleet penetration in brackets.
Budapest Birmingham Castellon Valencia Wroclaw % alternative tech across all cities
Electric 7 (0%) in procurement
Trialled In planning 0%
Hybrid 28 (2%) in procurement
48 (4%) 2 (~0%) 1 (0%) 2%
Natural gas 29 (2%) 9 (28%) 77 (16%) 3%
Biomethane 0%
Hydrogen 0%
Biofuel (>10% blend)
B20 Number unknown
0 (recently was 401)
Unknown
LPG 1 (~0%) 0%
% alternative tech in fleet
4% 4% 28% 17% 0%
Table 8 - Low carbon bus activity
A review of the alternative technology status across the PPIA cities showed that 4% of the city buses use
alternative fuels. The most popular alternative fuel is natural gas, operated in Budapest, Castellon and
6 To harmonise the ratings across the cities Cenex have modified some of the scores received from the questionnaires. This was due to differing interpretations of the ranking system between the cities.
670/013 2.0 36
Valencia, which is used in 3% of the bus population. Hybrid buses are the next most popular,
accounting for 2% of the alternative fuel bus population; the vast majority of these are operated in
Birmingham, which were purchased through a national subsidy programme. There are no electric buses
currently in permanent service, although seven are being procured by Budapest.
The cities with the greatest proportion of alternatively fuelled vehicles are Castellon and Valencia, which run
28% and 17% of their respective bus fleets on natural gas.
Across the range of cities and councils there was no experience or understanding of biomethane or hydrogen
use in buses. In all other areas there is some technological experience across the member cities which could
be shared within the group.
It is noteworthy that until a recent tax change which increased the cost of biodiesel, Valencia operated 401
diesel buses on a B20 blend of biodiesel, which resulted in Valencia operating 100% of buses on alternative
transport fuels.
During the interviews it was apparent that all cities desire to increase the number of hybrid and electric buses
with their fleets.
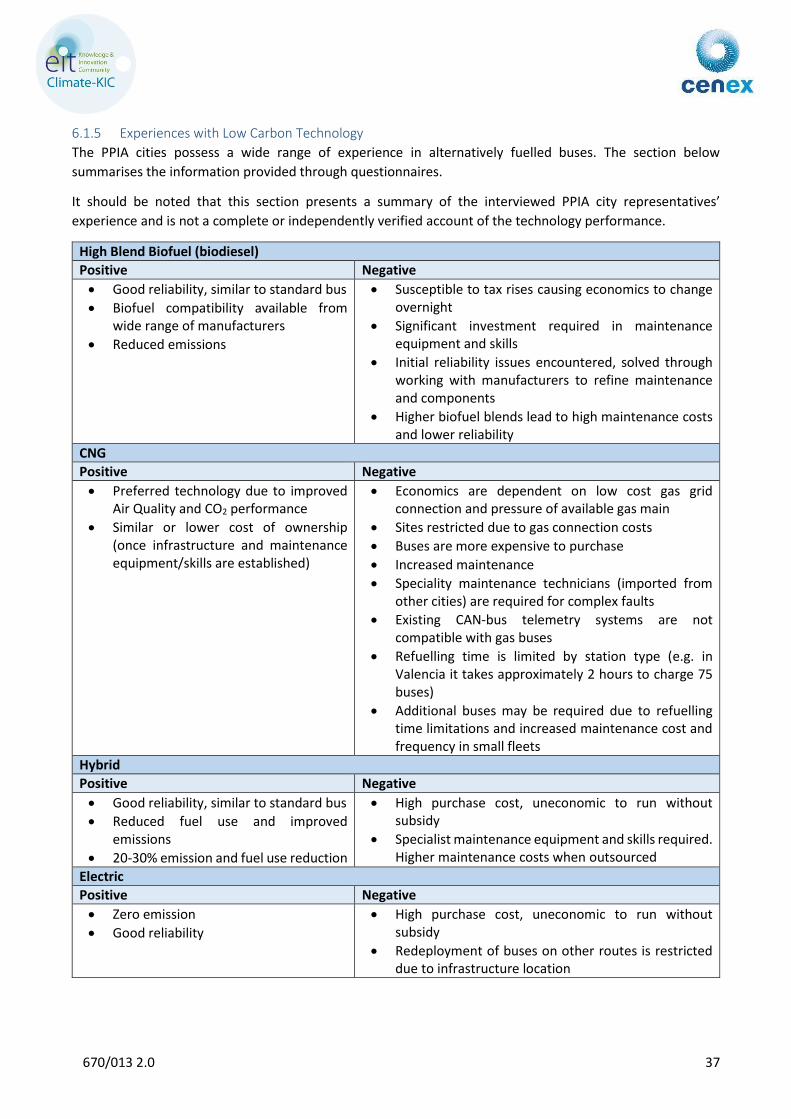
670/013 2.0 37
6.1.5 Experiences with Low Carbon Technology
The PPIA cities possess a wide range of experience in alternatively fuelled buses. The section below
summarises the information provided through questionnaires.
It should be noted that this section presents a summary of the interviewed PPIA city representatives’
experience and is not a complete or independently verified account of the technology performance.
High Blend Biofuel (biodiesel)
Positive Negative
Good reliability, similar to standard bus
Biofuel compatibility available from wide range of manufacturers
Reduced emissions
Susceptible to tax rises causing economics to change overnight
Significant investment required in maintenance equipment and skills
Initial reliability issues encountered, solved through working with manufacturers to refine maintenance and components
Higher biofuel blends lead to high maintenance costs and lower reliability
CNG
Positive Negative
Preferred technology due to improved Air Quality and CO2 performance
Similar or lower cost of ownership (once infrastructure and maintenance equipment/skills are established)
Economics are dependent on low cost gas grid connection and pressure of available gas main
Sites restricted due to gas connection costs
Buses are more expensive to purchase
Increased maintenance
Speciality maintenance technicians (imported from other cities) are required for complex faults
Existing CAN-bus telemetry systems are not compatible with gas buses
Refuelling time is limited by station type (e.g. in Valencia it takes approximately 2 hours to charge 75 buses)
Additional buses may be required due to refuelling time limitations and increased maintenance cost and frequency in small fleets
Hybrid
Positive Negative
Good reliability, similar to standard bus
Reduced fuel use and improved emissions
20-30% emission and fuel use reduction
High purchase cost, uneconomic to run without subsidy
Specialist maintenance equipment and skills required. Higher maintenance costs when outsourced
Electric
Positive Negative
Zero emission
Good reliability
High purchase cost, uneconomic to run without subsidy
Redeployment of buses on other routes is restricted due to infrastructure location
670/013 2.0 38
Key findings from the interviews were (anecdotal evidence provided only)
Higher initial costs are experienced with alternative technologies due to infrastructure and
maintenance equipment/skills provision
Higher maintenance costs are observed if specialist personnel are contracted to do maintenance
Cities with established fleets and infrastructure (such as gas vehicles in Budapest) report lower or
similar total costs of ownership for gas buses
Hybrid and electric vehicles are currently uneconomic in all cities without the assistance of funding
6.1.6 Purchasing Constraints and Priorities
All cities agreed that the main purchasing constraint on bus technology was purchase price. More
environmentally friendly, higher cost buses can only be purchased if subsidies are given. Buses are seen as an
essential service, especially to low income or mobility-impaired citizens. The costs of running a bus fleet are
ultimately reflected in the ticket cost.
Where environmental standards exist in purchasing contracts, these were generally limited to Euro standard
compliance for both new and second hand buses. Introducing environmental criteria was viewed as difficult
due to increasing the costs of bus operation. Only one city cited the inclusion of the EU mandatory Clean
Vehicles Directive in their purchasing criteria. It is assumed that the majority of cities were either unaware of
its use in procurement, or did not incorporate the Directive into purchasing decisions.
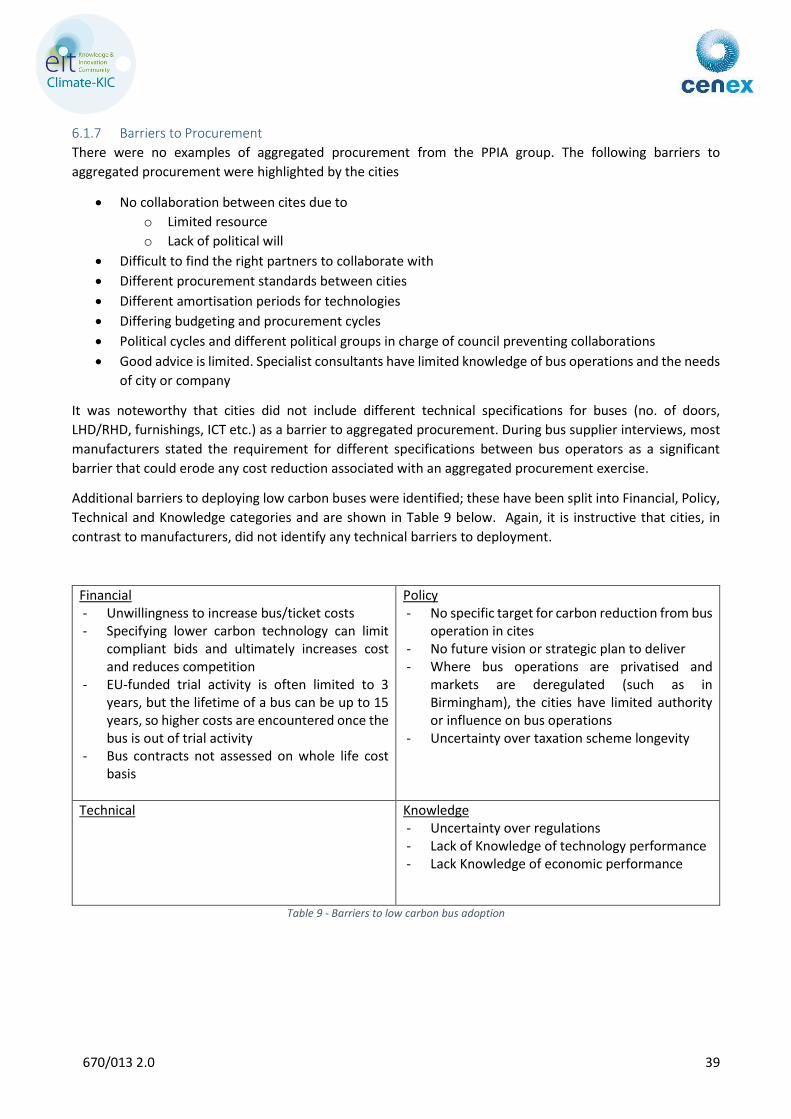
670/013 2.0 39
6.1.7 Barriers to Procurement
There were no examples of aggregated procurement from the PPIA group. The following barriers to
aggregated procurement were highlighted by the cities
No collaboration between cites due to
o Limited resource
o Lack of political will
Difficult to find the right partners to collaborate with
Different procurement standards between cities
Different amortisation periods for technologies
Differing budgeting and procurement cycles
Political cycles and different political groups in charge of council preventing collaborations
Good advice is limited. Specialist consultants have limited knowledge of bus operations and the needs
of city or company
It was noteworthy that cities did not include different technical specifications for buses (no. of doors,
LHD/RHD, furnishings, ICT etc.) as a barrier to aggregated procurement. During bus supplier interviews, most
manufacturers stated the requirement for different specifications between bus operators as a significant
barrier that could erode any cost reduction associated with an aggregated procurement exercise.
Additional barriers to deploying low carbon buses were identified; these have been split into Financial, Policy,
Technical and Knowledge categories and are shown in Table 9 below. Again, it is instructive that cities, in
contrast to manufacturers, did not identify any technical barriers to deployment.
Financial - Unwillingness to increase bus/ticket costs - Specifying lower carbon technology can limit
compliant bids and ultimately increases cost and reduces competition
- EU-funded trial activity is often limited to 3 years, but the lifetime of a bus can be up to 15 years, so higher costs are encountered once the bus is out of trial activity
- Bus contracts not assessed on whole life cost basis
Policy - No specific target for carbon reduction from bus
operation in cites - No future vision or strategic plan to deliver - Where bus operations are privatised and
markets are deregulated (such as in Birmingham), the cities have limited authority or influence on bus operations
- Uncertainty over taxation scheme longevity
Technical
Knowledge - Uncertainty over regulations - Lack of Knowledge of technology performance - Lack Knowledge of economic performance
Table 9 - Barriers to low carbon bus adoption
670/013 2.0 40
7 Supplier Engagement
Vehicle and component suppliers were engaged to discuss the cost reductions associated with larger orders
and also the ability of procurement to advance or reduce the cost of lower carbon technologies.
Mainstream manufacturers feel that low carbon innovation is progressing at a sufficiently rapid pace driven
by legislative requirements and consumer demands for low running costs. Scope for progressing innovation
beyond the planned technology development cycles of mainstream manufacturers is limited. They feel under
constant pressure to improve fuel consumption and reduce costs. This results in constant innovations (such
as weight reduction and improvements in engine efficiency) which are applied throughout a bus
manufacturer’s product range. Bus manufacturers also have different views on consumer’s future technology
preferences. For example, Volvo are concentrating on the development of hybrid and plug-in hybrid buses
whilst Scania’s main focus is on supporting biofuels and gas.
Smaller volume manufacturers and environmental technology system developers can innovate in much
quicker timeframes and at lower costs thanks to more flexible management, design, change control and
production systems. A large order would allow significant investment in R&D budgets or production
equipment. These suppliers typically provide systems such as smart ancillaries, fly-wheel and hydraulic
hybrids. However, potential purchasers then run the risks associated with buying from smaller volume
suppliers with lower development and customer support budgets, where less mature technology is brought
to market earlier.
Barriers to collaborative procurement highlighted by bus manufacturers included;
Differing technical standards (RHD, LHD, furnishings, no of doors, no of seats etc.) will increase
complexity and diminish cost savings of high order volumes. This was highlighted as the main barrier
Manufacturing facilities are tailored to producing buses for their local environment
Bus operators want to be distinctive and have different buses to competitors
Bus manufacturers are innovating to supply all customers with reduced capital and running costs
within bus designs, there is little scope for further innovation
Barriers to collaborative procurement highlighted by car manufacturers were
Taxis are often bought in small numbers by disparate groups
Technology suppliers were interviewed to understand their drivers for low carbon technology
development and barriers to accelerating the introduction of low carbon products to market
Key points
Mainstream manufacturers feel that low carbon innovation is progressing at a sufficiently rapid
pace, driven by legislative requirements and consumer demands for low running costs
Smaller volume manufacturers and environmental technology system developers are willing to
innovate in much quicker timeframes at lower costs thanks to flexible management, design,
change control and production systems
The key barrier to collaborative procurement highlighted by manufacturers is the differing
technical standards (RHD, LHD, furnishings, no of doors, no of seats etc.) between buyers which
increases complexity and diminish cost savings of high order volumes

670/013 2.0 41
There is little interest in EV taxis for cities (UK only), infrastructure provision is complex
which represents a significant barrier
Vehicle manufacturers stated that cost reductions of up to 10% were common for large orders, however
anecdotal evidence from operators suggested that in some instances discounts of 25% or more were offered
for EV orders along with infrastructure hardware being gifted from EV manufacturers.
670/013 2.0 42
8 Demand Side Measures
Although cities have a need for affordable, low carbon, zero emission mobility solutions there are supply side
and demand side barriers (as identified in this report) that hinder their adoption. Cities should take a more
proactive role in creating the market conditions that enable the transformation needed to accelerate the
introduction of solutions to the market, through the use of a range of demand side measures.
8.1 Demand Side Measures Demand side measures are systems and processes that the cities can implement to create the market
conditions that make the supply of low carbon vehicles attractive to vehicle and service providers. A report on
demand side measures prepared for the TRANSFORM Project (CENEX 2014)xviii concluded that procurement
measures would have a greater impact when implemented in conjunction with other demand side measures.
One simple reason for this is that direct procurements of vehicles by a city authority are relatively small, and
in the case of bus and taxis, it is the service that is often procured and/or licenced. Other reasons relate to the
complex nature of public transport supply chains and long product development cycles of vehicles.
It is recommended that for cities wishing to speed up the deployment of affordable low carbon vehicles
should develop a strategy or series of action plans that have high level buy-in within the city and include the
following types of demand side measures
Procurement Using purchasing power to buy desired products and services
Local policy measures Changing the operational environment to encourage environmentally friend
technologies
Other complementary actions
Cities have a number of demand side tools which can be used to make it an attractive place to deploy
low carbon vehicles. These include direct procurement methods, policy measures and other
complimentary actions. This section provides a brief overview of the tools at a cities disposal and gives
an example of a demand side action plan. Demand side action plans should be developed to create the
market conditions suitable for attracting low carbon vehicles.
Key points
Procurement processes alone are likely to be insufficient to accelerate the development of low
carbon innovations, and in many cases Cities have little direct control of the procurement of busses
and taxis. Procurement measures would have a greater impact when implemented in conjunction
with other demand side measures
A number of demand side tools are available to assist in the introduction of low carbon
technologies into public transport fleets
A demand side strategy should be developed focused on achieving specific aims and
incorporating a range of measures. A demand side action plan should include sending long term
signals to the market, requiring progressive improvements in the sustainability of transport
solutions
It is noted that real cost of air pollution should be taken into account. The Clean Vehicle Directive
mandates a method for this however it does not appear to be widely adopted in the PPIA cities
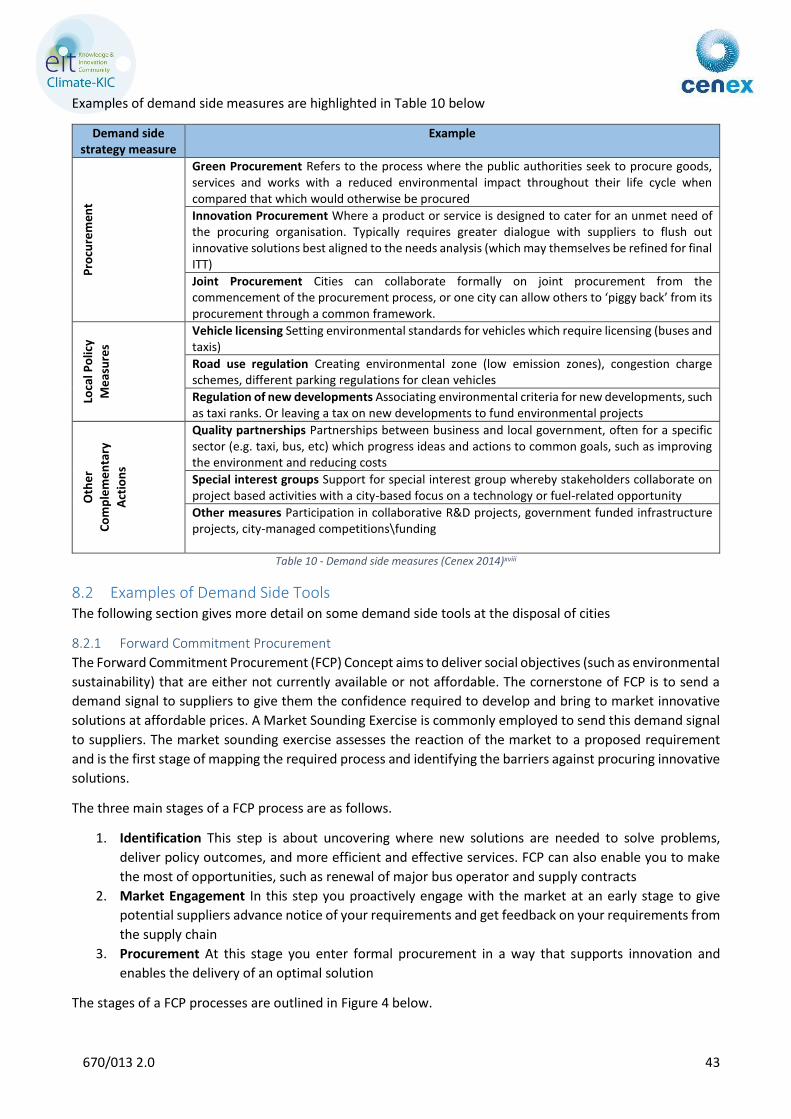
670/013 2.0 43
Examples of demand side measures are highlighted in Table 10 below
Demand side strategy measure
Example
Pro
cure
men
t
Green Procurement Refers to the process where the public authorities seek to procure goods, services and works with a reduced environmental impact throughout their life cycle when compared that which would otherwise be procured
Innovation Procurement Where a product or service is designed to cater for an unmet need of the procuring organisation. Typically requires greater dialogue with suppliers to flush out innovative solutions best aligned to the needs analysis (which may themselves be refined for final ITT)
Joint Procurement Cities can collaborate formally on joint procurement from the commencement of the procurement process, or one city can allow others to ‘piggy back’ from its procurement through a common framework.
Loca
l Po
licy
Me
asu
res
Vehicle licensing Setting environmental standards for vehicles which require licensing (buses and taxis)
Road use regulation Creating environmental zone (low emission zones), congestion charge schemes, different parking regulations for clean vehicles
Regulation of new developments Associating environmental criteria for new developments, such as taxi ranks. Or leaving a tax on new developments to fund environmental projects
Oth
er
Co
mp
lem
en
tary
Act
ion
s
Quality partnerships Partnerships between business and local government, often for a specific sector (e.g. taxi, bus, etc) which progress ideas and actions to common goals, such as improving the environment and reducing costs
Special interest groups Support for special interest group whereby stakeholders collaborate on project based activities with a city-based focus on a technology or fuel-related opportunity
Other measures Participation in collaborative R&D projects, government funded infrastructure projects, city-managed competitions\funding
Table 10 - Demand side measures (Cenex 2014)xviii
8.2 Examples of Demand Side Tools The following section gives more detail on some demand side tools at the disposal of cities
8.2.1 Forward Commitment Procurement
The Forward Commitment Procurement (FCP) Concept aims to deliver social objectives (such as environmental
sustainability) that are either not currently available or not affordable. The cornerstone of FCP is to send a
demand signal to suppliers to give them the confidence required to develop and bring to market innovative
solutions at affordable prices. A Market Sounding Exercise is commonly employed to send this demand signal
to suppliers. The market sounding exercise assesses the reaction of the market to a proposed requirement
and is the first stage of mapping the required process and identifying the barriers against procuring innovative
solutions.
The three main stages of a FCP process are as follows.
1. Identification This step is about uncovering where new solutions are needed to solve problems,
deliver policy outcomes, and more efficient and effective services. FCP can also enable you to make
the most of opportunities, such as renewal of major bus operator and supply contracts
2. Market Engagement In this step you proactively engage with the market at an early stage to give
potential suppliers advance notice of your requirements and get feedback on your requirements from
the supply chain
3. Procurement At this stage you enter formal procurement in a way that supports innovation and
enables the delivery of an optimal solution
The stages of a FCP processes are outlined in Figure 4 below.
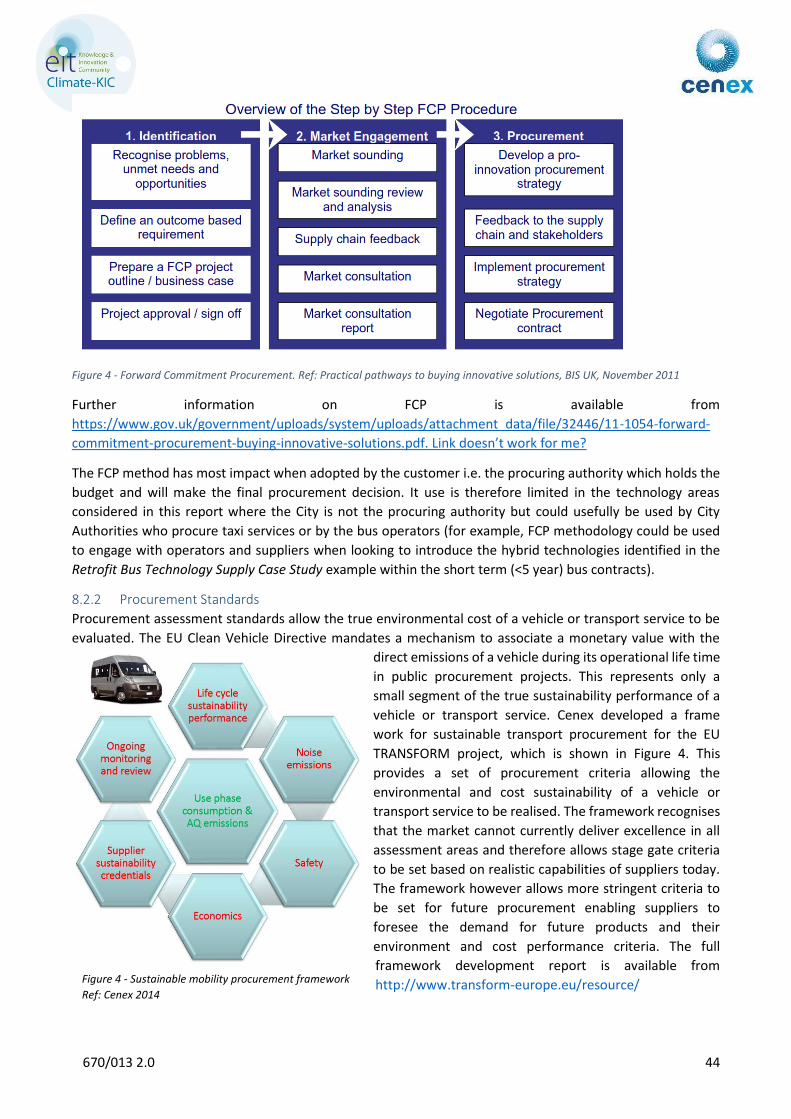
670/013 2.0 44
Figure 4 - Forward Commitment Procurement. Ref: Practical pathways to buying innovative solutions, BIS UK, November 2011
Further information on FCP is available from
https://www.gov.uk/government/uploads/system/uploads/attachment_data/file/32446/11-1054-forward-
commitment-procurement-buying-innovative-solutions.pdf. Link doesn’t work for me?
The FCP method has most impact when adopted by the customer i.e. the procuring authority which holds the
budget and will make the final procurement decision. It use is therefore limited in the technology areas
considered in this report where the City is not the procuring authority but could usefully be used by City
Authorities who procure taxi services or by the bus operators (for example, FCP methodology could be used
to engage with operators and suppliers when looking to introduce the hybrid technologies identified in the
Retrofit Bus Technology Supply Case Study example within the short term (<5 year) bus contracts).
8.2.2 Procurement Standards
Procurement assessment standards allow the true environmental cost of a vehicle or transport service to be
evaluated. The EU Clean Vehicle Directive mandates a mechanism to associate a monetary value with the
direct emissions of a vehicle during its operational life time
in public procurement projects. This represents only a
small segment of the true sustainability performance of a
vehicle or transport service. Cenex developed a frame
work for sustainable transport procurement for the EU
TRANSFORM project, which is shown in Figure 4. This
provides a set of procurement criteria allowing the
environmental and cost sustainability of a vehicle or
transport service to be realised. The framework recognises
that the market cannot currently deliver excellence in all
assessment areas and therefore allows stage gate criteria
to be set based on realistic capabilities of suppliers today.
The framework however allows more stringent criteria to
be set for future procurement enabling suppliers to
foresee the demand for future products and their
environment and cost performance criteria. The full
framework development report is available from
http://www.transform-europe.eu/resource/ Figure 4 - Sustainable mobility procurement framework
Ref: Cenex 2014
670/013 2.0 45
8.2.3 Total Cost of Ownership
When evaluating the economic performance of any purchase it is good practise to use total cost of ownership
(TCO) methodology. This is especially relevant when assessing the performance of low emission vehicles due
to the greater upfront costs. However the reduction is other costs, such as maintenance and fuel costs over
the lifetime of the vehicles is still not always assessed within tender programmes which are focused on short
term capital cost savings. Ensuring TCO methodology is applied during vehicle assessments and costing by
cities and their suppliers will assist in the introduction of cleaner vehicles.
8.2.4 Clean Vehicle Directive (Costing Externalities)
The health risks of air pollution are extremely serious. Poor air quality increases respiratory ailments like
asthma and bronchitis, heightens the risk of life-threatening conditions like cancer, and burdens health care
systems with substantial medical costs. Air pollution is therefore a major public health concern, and can be
valued in terms of an economic cost. Across the EU, the economic cost of air pollution has been estimated to
range between 330 billion and 940 billion per year in 2010, taking into account labour productivity losses and
other direct economic damages. In the UK, the particulate matter has been estimated to be equivalent to
nearly 29,000 premature deaths, and to an associated loss of population life of 340,000 years.xix The Clean
Vehicle Directive mandates a method for public authorities to cost in the health impacts of transport purchases
and services.
8.2.5 Low Emission Zones
A Low Emission Zone (LEZ) is a traffic pollution charge scheme with the aim of reducing the tailpipe emissions
of vehicles in cities. Only vehicles that do not conform to higher emission standards are charged, the others
may enter the controlled zone free of charge. LEZ traditionally mandate minimum Euro standard of vehicles
in a city. However, London (UK) is currently taking this initiative one step further and is consulting on an Ultra-
Low Emission Zone (ULEZ). The ULEZ would require all vehicles driving in central London to meet new exhaust
emission standards. If approved, the ULEZ would take effect from 2020, and apply 24 hours a day, 7 days a
week. A vehicle that does not meet the ULEZ standards could still be driven in central London but a daily charge
would have to have been paid to do so. The ULEZ would include additional requirements for buses, taxis and
private hire vehicles:
A requirement that all taxis and new private hire vehicles presented for licensing from 2018 would
need to be zero emission capable
A reduction in the age limit for all non-zero emission capable taxis from 2020 from 15 to 10 years
Investment in the bus fleet so that all double deck buses operating in central London will be hybrid
and all single deck buses will be zero emission (at source) by 2020.
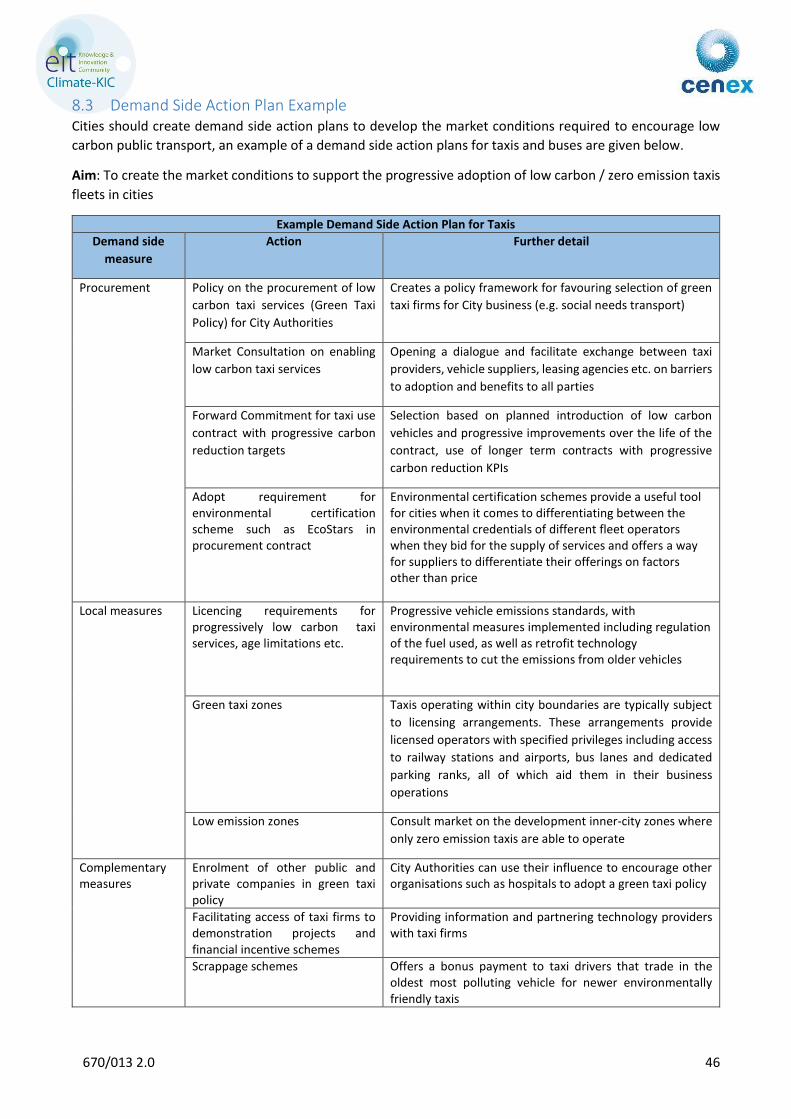
670/013 2.0 46
8.3 Demand Side Action Plan Example Cities should create demand side action plans to develop the market conditions required to encourage low
carbon public transport, an example of a demand side action plans for taxis and buses are given below.
Aim: To create the market conditions to support the progressive adoption of low carbon / zero emission taxis
fleets in cities
Example Demand Side Action Plan for Taxis
Demand side
measure
Action Further detail
Procurement Policy on the procurement of low
carbon taxi services (Green Taxi
Policy) for City Authorities
Creates a policy framework for favouring selection of green
taxi firms for City business (e.g. social needs transport)
Market Consultation on enabling
low carbon taxi services
Opening a dialogue and facilitate exchange between taxi
providers, vehicle suppliers, leasing agencies etc. on barriers
to adoption and benefits to all parties
Forward Commitment for taxi use
contract with progressive carbon
reduction targets
Selection based on planned introduction of low carbon
vehicles and progressive improvements over the life of the
contract, use of longer term contracts with progressive
carbon reduction KPIs
Adopt requirement for environmental certification scheme such as EcoStars in procurement contract
Environmental certification schemes provide a useful tool for cities when it comes to differentiating between the environmental credentials of different fleet operators when they bid for the supply of services and offers a way for suppliers to differentiate their offerings on factors other than price
Local measures Licencing requirements for progressively low carbon taxi services, age limitations etc.
Progressive vehicle emissions standards, with environmental measures implemented including regulation of the fuel used, as well as retrofit technology requirements to cut the emissions from older vehicles
Green taxi zones Taxis operating within city boundaries are typically subject
to licensing arrangements. These arrangements provide
licensed operators with specified privileges including access
to railway stations and airports, bus lanes and dedicated
parking ranks, all of which aid them in their business
operations
Low emission zones Consult market on the development inner-city zones where
only zero emission taxis are able to operate
Complementary measures
Enrolment of other public and private companies in green taxi policy
City Authorities can use their influence to encourage other organisations such as hospitals to adopt a green taxi policy
Facilitating access of taxi firms to demonstration projects and financial incentive schemes
Providing information and partnering technology providers with taxi firms
Scrappage schemes Offers a bonus payment to taxi drivers that trade in the oldest most polluting vehicle for newer environmentally friendly taxis
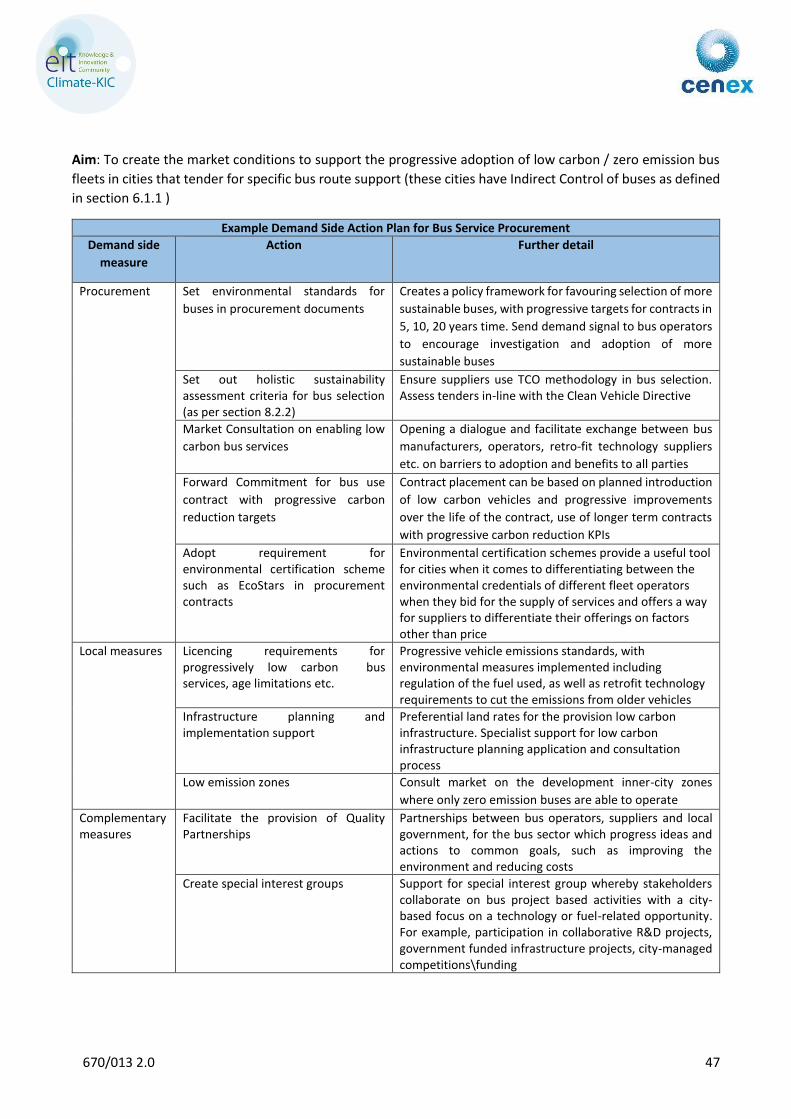
670/013 2.0 47
Aim: To create the market conditions to support the progressive adoption of low carbon / zero emission bus
fleets in cities that tender for specific bus route support (these cities have Indirect Control of buses as defined
in section 6.1.1 )
Example Demand Side Action Plan for Bus Service Procurement
Demand side
measure
Action Further detail
Procurement Set environmental standards for
buses in procurement documents
Creates a policy framework for favouring selection of more
sustainable buses, with progressive targets for contracts in
5, 10, 20 years time. Send demand signal to bus operators
to encourage investigation and adoption of more
sustainable buses
Set out holistic sustainability assessment criteria for bus selection (as per section 8.2.2)
Ensure suppliers use TCO methodology in bus selection. Assess tenders in-line with the Clean Vehicle Directive
Market Consultation on enabling low
carbon bus services
Opening a dialogue and facilitate exchange between bus
manufacturers, operators, retro-fit technology suppliers
etc. on barriers to adoption and benefits to all parties
Forward Commitment for bus use
contract with progressive carbon
reduction targets
Contract placement can be based on planned introduction
of low carbon vehicles and progressive improvements
over the life of the contract, use of longer term contracts
with progressive carbon reduction KPIs
Adopt requirement for environmental certification scheme such as EcoStars in procurement contracts
Environmental certification schemes provide a useful tool for cities when it comes to differentiating between the environmental credentials of different fleet operators when they bid for the supply of services and offers a way for suppliers to differentiate their offerings on factors other than price
Local measures Licencing requirements for progressively low carbon bus services, age limitations etc.
Progressive vehicle emissions standards, with environmental measures implemented including regulation of the fuel used, as well as retrofit technology requirements to cut the emissions from older vehicles
Infrastructure planning and implementation support
Preferential land rates for the provision low carbon infrastructure. Specialist support for low carbon infrastructure planning application and consultation process
Low emission zones Consult market on the development inner-city zones
where only zero emission buses are able to operate
Complementary measures
Facilitate the provision of Quality Partnerships
Partnerships between bus operators, suppliers and local government, for the bus sector which progress ideas and actions to common goals, such as improving the environment and reducing costs
Create special interest groups Support for special interest group whereby stakeholders collaborate on bus project based activities with a city-based focus on a technology or fuel-related opportunity. For example, participation in collaborative R&D projects, government funded infrastructure projects, city-managed competitions\funding
670/013 2.0 48
9 Implementation Case Studies
This section presents possible future scenarios as examples of the deployment of lower carbon vehicles within
the cities, focusing on the following three case studies.
Fuel cell buses
Retro-fit developments for standard buses
Electric and fuel cell vehicles for taxis
Low carbon vehicle technology deployments can be accelerated through collaboration, demonstration
and dialogue with suppliers. This section demonstrates how the demand side tools available to cities
can be used to accelerate the deployment of low carbon technologies
Key points
Three case studies are provided showing examples of how the technologies identified within the
forecasting exercise could be incorporated within public transport fleets, and where collaborative
or forward commitment procurement can be used to bring forward the deployment or the reduce
cost of environmental technologies
A Fuel Cell Buses case study demonstrates that by entering discussions with FCH JU and potential
project partners the PPIA cities could enter fuel cell bus deployment projects, allowing buses and
infrastructure to be brought into the cities in advance of mass deployment activity
A Retro-fit Hybrid Systems for Buses case study demonstrates that through supplier engagement
products can be introduced onto city buses in the short term which may be capable of reducing
CO2 emissions by up to 15% whilst allowing a payback of < 5 years
An EV and FCEV Vehicles for Taxis case study shows a scenario where applying market engagement
with an incentive programme may accelerate EV and FCEV deployment in to taxi fleets
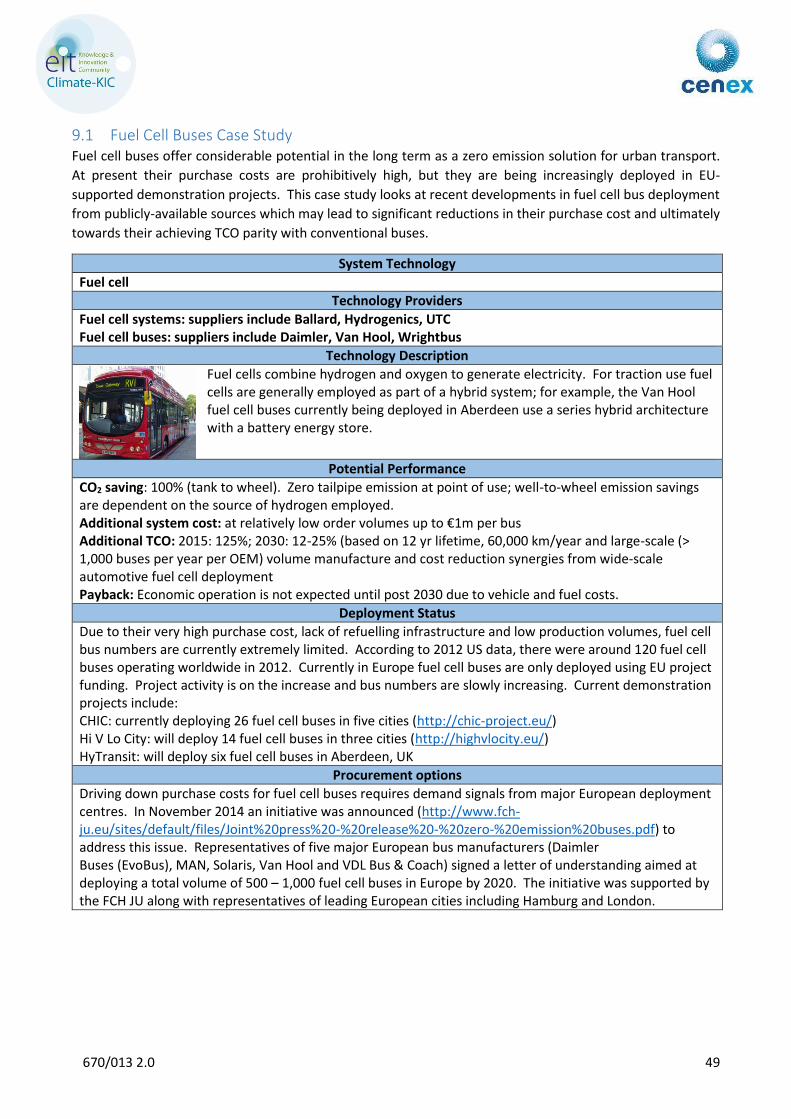
670/013 2.0 49
9.1 Fuel Cell Buses Case Study Fuel cell buses offer considerable potential in the long term as a zero emission solution for urban transport.
At present their purchase costs are prohibitively high, but they are being increasingly deployed in EU-
supported demonstration projects. This case study looks at recent developments in fuel cell bus deployment
from publicly-available sources which may lead to significant reductions in their purchase cost and ultimately
towards their achieving TCO parity with conventional buses.
System Technology
Fuel cell
Technology Providers
Fuel cell systems: suppliers include Ballard, Hydrogenics, UTC Fuel cell buses: suppliers include Daimler, Van Hool, Wrightbus
Technology Description
Fuel cells combine hydrogen and oxygen to generate electricity. For traction use fuel cells are generally employed as part of a hybrid system; for example, the Van Hool fuel cell buses currently being deployed in Aberdeen use a series hybrid architecture with a battery energy store.
Potential Performance
CO2 saving: 100% (tank to wheel). Zero tailpipe emission at point of use; well-to-wheel emission savings are dependent on the source of hydrogen employed. Additional system cost: at relatively low order volumes up to €1m per bus Additional TCO: 2015: 125%; 2030: 12-25% (based on 12 yr lifetime, 60,000 km/year and large-scale (> 1,000 buses per year per OEM) volume manufacture and cost reduction synergies from wide-scale automotive fuel cell deployment Payback: Economic operation is not expected until post 2030 due to vehicle and fuel costs.
Deployment Status
Due to their very high purchase cost, lack of refuelling infrastructure and low production volumes, fuel cell bus numbers are currently extremely limited. According to 2012 US data, there were around 120 fuel cell buses operating worldwide in 2012. Currently in Europe fuel cell buses are only deployed using EU project funding. Project activity is on the increase and bus numbers are slowly increasing. Current demonstration projects include: CHIC: currently deploying 26 fuel cell buses in five cities (http://chic-project.eu/) Hi V Lo City: will deploy 14 fuel cell buses in three cities (http://highvlocity.eu/) HyTransit: will deploy six fuel cell buses in Aberdeen, UK
Procurement options
Driving down purchase costs for fuel cell buses requires demand signals from major European deployment centres. In November 2014 an initiative was announced (http://www.fch-ju.eu/sites/default/files/Joint%20press%20-%20release%20-%20zero-%20emission%20buses.pdf) to address this issue. Representatives of five major European bus manufacturers (Daimler Buses (EvoBus), MAN, Solaris, Van Hool and VDL Bus & Coach) signed a letter of understanding aimed at deploying a total volume of 500 – 1,000 fuel cell buses in Europe by 2020. The initiative was supported by the FCH JU along with representatives of leading European cities including Hamburg and London.
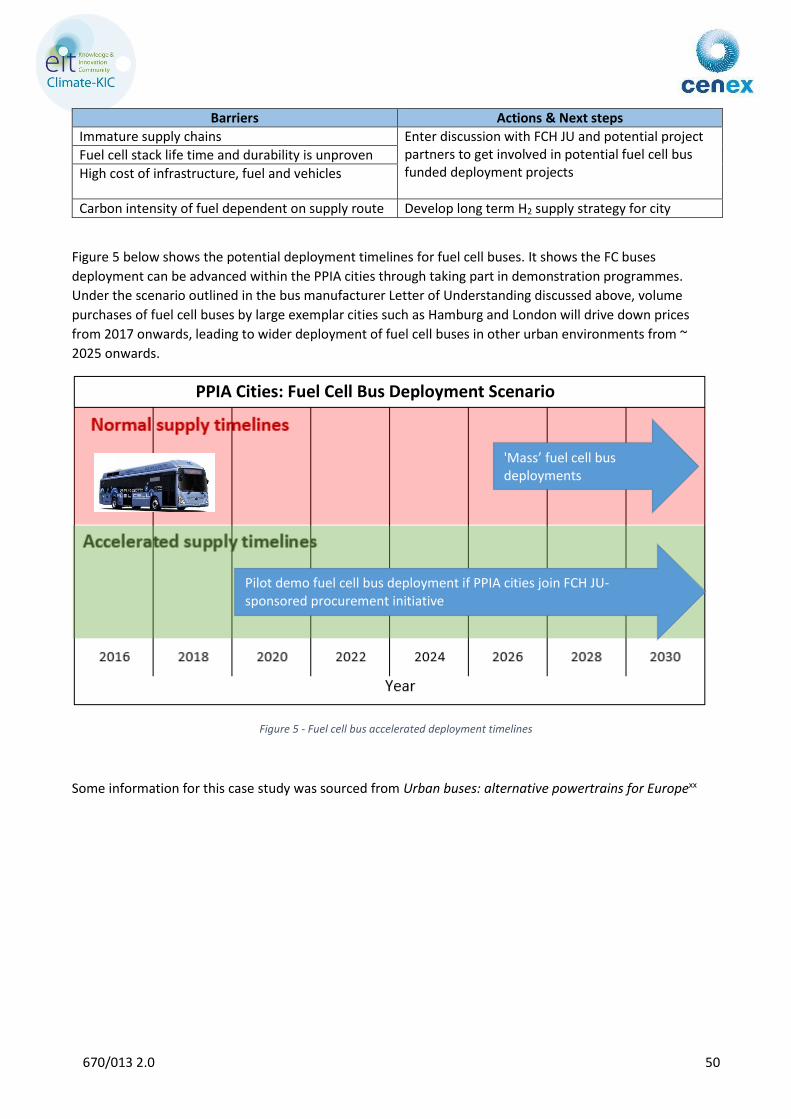
670/013 2.0 50
Barriers Actions & Next steps
Immature supply chains Enter discussion with FCH JU and potential project partners to get involved in potential fuel cell bus funded deployment projects
Fuel cell stack life time and durability is unproven
High cost of infrastructure, fuel and vehicles
Carbon intensity of fuel dependent on supply route Develop long term H2 supply strategy for city
Figure 5 below shows the potential deployment timelines for fuel cell buses. It shows the FC buses
deployment can be advanced within the PPIA cities through taking part in demonstration programmes.
Under the scenario outlined in the bus manufacturer Letter of Understanding discussed above, volume
purchases of fuel cell buses by large exemplar cities such as Hamburg and London will drive down prices
from 2017 onwards, leading to wider deployment of fuel cell buses in other urban environments from ~
2025 onwards.
Figure 5 - Fuel cell bus accelerated deployment timelines
Some information for this case study was sourced from Urban buses: alternative powertrains for Europexx
PPIA Cities: Fuel Cell Bus Deployment Scenario
'Mass’ fuel cell bus deployments
Pilot demo fuel cell bus deployment if PPIA cities join FCH JU-sponsored procurement initiative
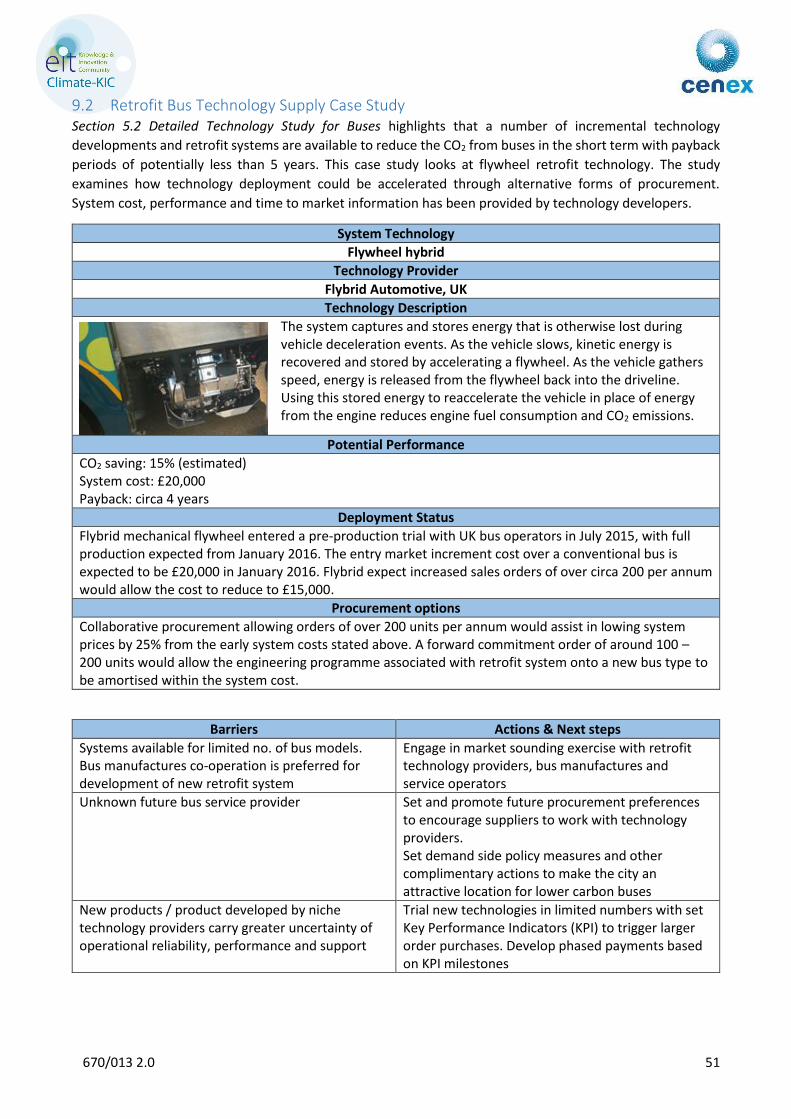
670/013 2.0 51
9.2 Retrofit Bus Technology Supply Case Study Section 5.2 Detailed Technology Study for Buses highlights that a number of incremental technology
developments and retrofit systems are available to reduce the CO2 from buses in the short term with payback
periods of potentially less than 5 years. This case study looks at flywheel retrofit technology. The study
examines how technology deployment could be accelerated through alternative forms of procurement.
System cost, performance and time to market information has been provided by technology developers.
System Technology
Flywheel hybrid
Technology Provider
Flybrid Automotive, UK
Technology Description
The system captures and stores energy that is otherwise lost during vehicle deceleration events. As the vehicle slows, kinetic energy is recovered and stored by accelerating a flywheel. As the vehicle gathers speed, energy is released from the flywheel back into the driveline. Using this stored energy to reaccelerate the vehicle in place of energy from the engine reduces engine fuel consumption and CO2 emissions.
Potential Performance
CO2 saving: 15% (estimated) System cost: £20,000 Payback: circa 4 years
Deployment Status
Flybrid mechanical flywheel entered a pre-production trial with UK bus operators in July 2015, with full production expected from January 2016. The entry market increment cost over a conventional bus is expected to be £20,000 in January 2016. Flybrid expect increased sales orders of over circa 200 per annum would allow the cost to reduce to £15,000.
Procurement options
Collaborative procurement allowing orders of over 200 units per annum would assist in lowing system prices by 25% from the early system costs stated above. A forward commitment order of around 100 – 200 units would allow the engineering programme associated with retrofit system onto a new bus type to be amortised within the system cost.
Barriers Actions & Next steps
Systems available for limited no. of bus models. Bus manufactures co-operation is preferred for development of new retrofit system
Engage in market sounding exercise with retrofit technology providers, bus manufactures and service operators
Unknown future bus service provider Set and promote future procurement preferences to encourage suppliers to work with technology providers. Set demand side policy measures and other complimentary actions to make the city an attractive location for lower carbon buses
New products / product developed by niche technology providers carry greater uncertainty of operational reliability, performance and support
Trial new technologies in limited numbers with set Key Performance Indicators (KPI) to trigger larger order purchases. Develop phased payments based on KPI milestones
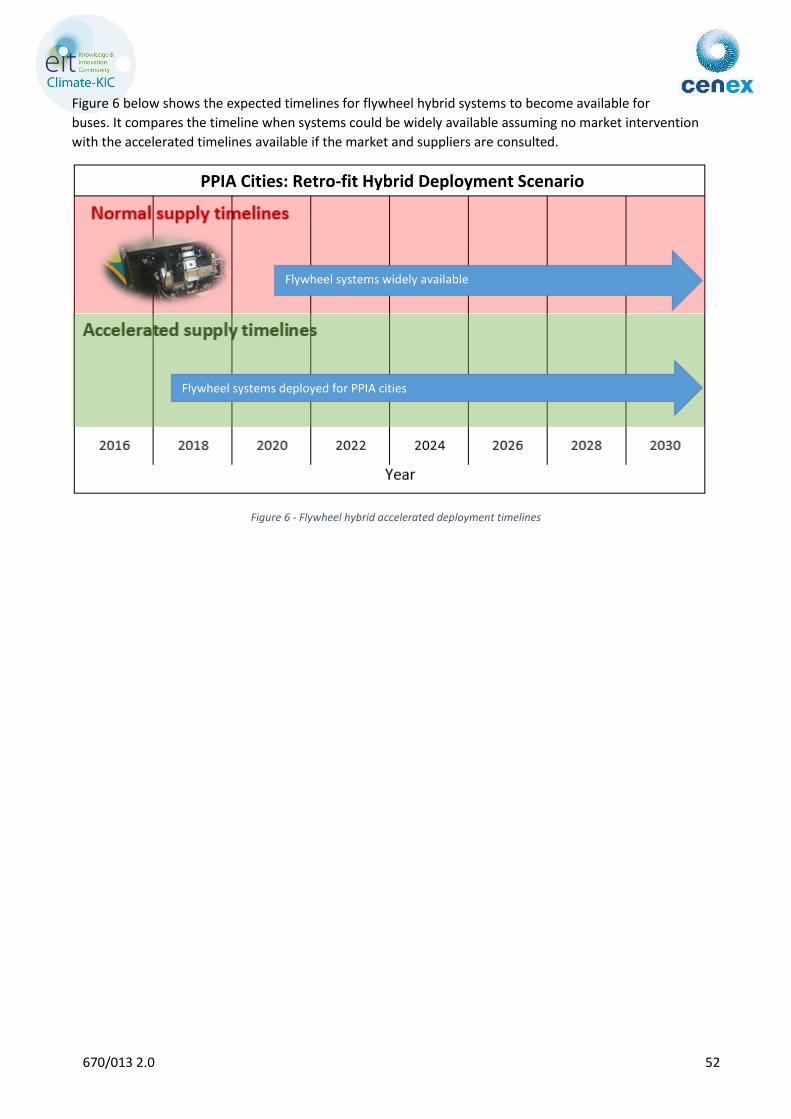
670/013 2.0 52
Figure 6 below shows the expected timelines for flywheel hybrid systems to become available for
buses. It compares the timeline when systems could be widely available assuming no market intervention
with the accelerated timelines available if the market and suppliers are consulted.
Figure 6 - Flywheel hybrid accelerated deployment timelines
PPIA Cities: Retro-fit Hybrid Deployment Scenario
Flywheel systems deployed for PPIA cities
Flywheel systems widely available
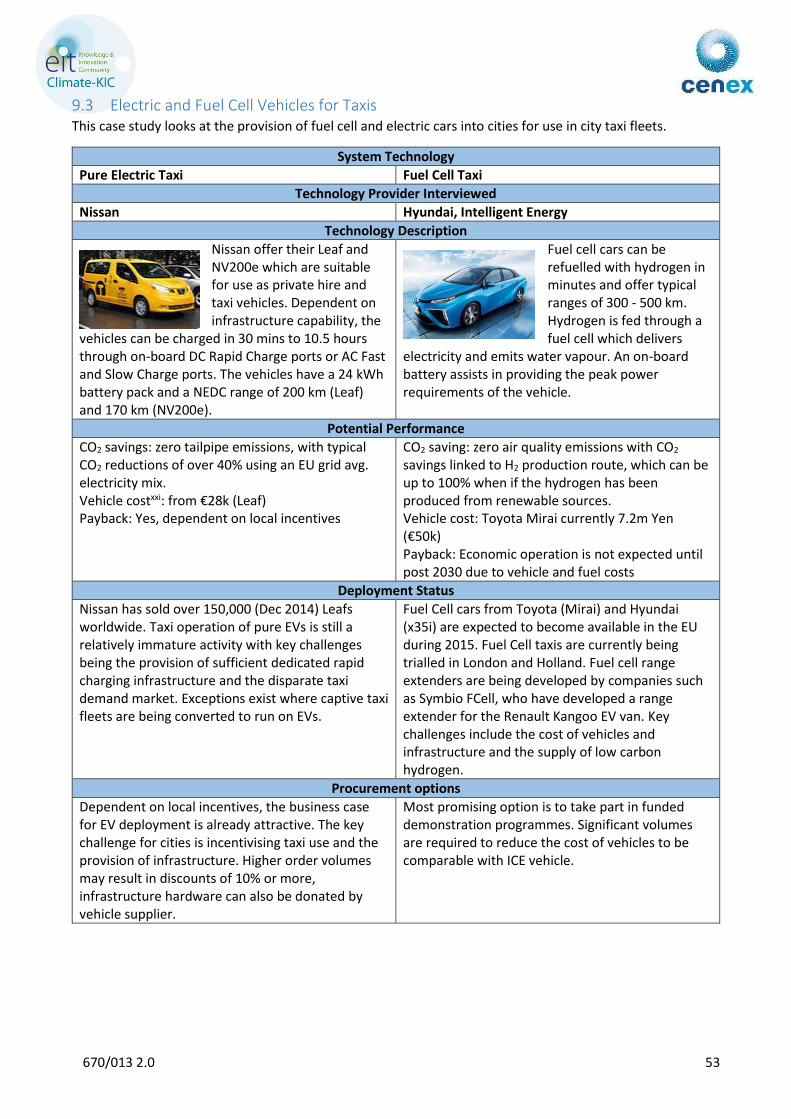
670/013 2.0 53
9.3 Electric and Fuel Cell Vehicles for Taxis This case study looks at the provision of fuel cell and electric cars into cities for use in city taxi fleets.
System Technology
Pure Electric Taxi Fuel Cell Taxi
Technology Provider Interviewed
Nissan Hyundai, Intelligent Energy
Technology Description
Nissan offer their Leaf and NV200e which are suitable for use as private hire and taxi vehicles. Dependent on infrastructure capability, the
vehicles can be charged in 30 mins to 10.5 hours through on-board DC Rapid Charge ports or AC Fast and Slow Charge ports. The vehicles have a 24 kWh battery pack and a NEDC range of 200 km (Leaf) and 170 km (NV200e).
Fuel cell cars can be refuelled with hydrogen in minutes and offer typical ranges of 300 - 500 km. Hydrogen is fed through a fuel cell which delivers
electricity and emits water vapour. An on-board battery assists in providing the peak power requirements of the vehicle.
Potential Performance
CO2 savings: zero tailpipe emissions, with typical CO2 reductions of over 40% using an EU grid avg. electricity mix. Vehicle costxxi: from €28k (Leaf) Payback: Yes, dependent on local incentives
CO2 saving: zero air quality emissions with CO2 savings linked to H2 production route, which can be up to 100% when if the hydrogen has been produced from renewable sources. Vehicle cost: Toyota Mirai currently 7.2m Yen (€50k) Payback: Economic operation is not expected until post 2030 due to vehicle and fuel costs
Deployment Status
Nissan has sold over 150,000 (Dec 2014) Leafs worldwide. Taxi operation of pure EVs is still a relatively immature activity with key challenges being the provision of sufficient dedicated rapid charging infrastructure and the disparate taxi demand market. Exceptions exist where captive taxi fleets are being converted to run on EVs.
Fuel Cell cars from Toyota (Mirai) and Hyundai (x35i) are expected to become available in the EU during 2015. Fuel Cell taxis are currently being trialled in London and Holland. Fuel cell range extenders are being developed by companies such as Symbio FCell, who have developed a range extender for the Renault Kangoo EV van. Key challenges include the cost of vehicles and infrastructure and the supply of low carbon hydrogen.
Procurement options
Dependent on local incentives, the business case for EV deployment is already attractive. The key challenge for cities is incentivising taxi use and the provision of infrastructure. Higher order volumes may result in discounts of 10% or more, infrastructure hardware can also be donated by vehicle supplier.
Most promising option is to take part in funded demonstration programmes. Significant volumes are required to reduce the cost of vehicles to be comparable with ICE vehicle.
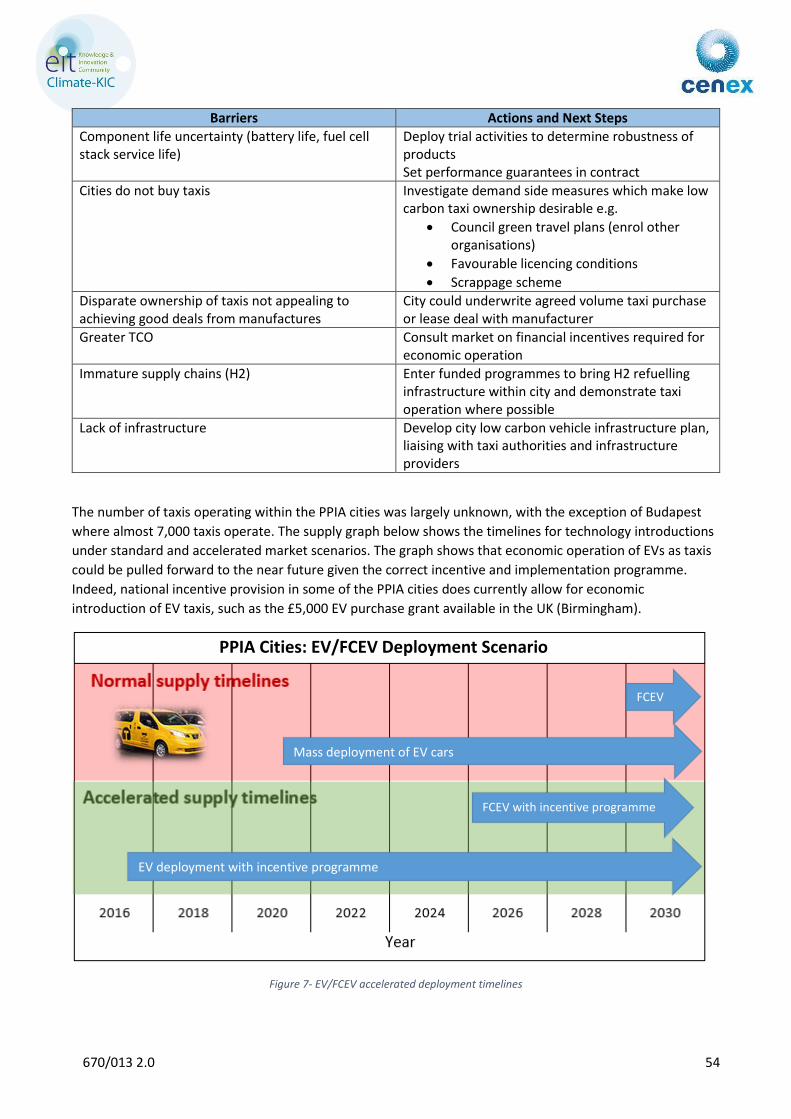
670/013 2.0 54
Barriers Actions and Next Steps
Component life uncertainty (battery life, fuel cell stack service life)
Deploy trial activities to determine robustness of products Set performance guarantees in contract
Cities do not buy taxis Investigate demand side measures which make low carbon taxi ownership desirable e.g.
Council green travel plans (enrol other organisations)
Favourable licencing conditions
Scrappage scheme
Disparate ownership of taxis not appealing to achieving good deals from manufactures
City could underwrite agreed volume taxi purchase or lease deal with manufacturer
Greater TCO Consult market on financial incentives required for economic operation
Immature supply chains (H2) Enter funded programmes to bring H2 refuelling infrastructure within city and demonstrate taxi operation where possible
Lack of infrastructure Develop city low carbon vehicle infrastructure plan, liaising with taxi authorities and infrastructure providers
The number of taxis operating within the PPIA cities was largely unknown, with the exception of Budapest
where almost 7,000 taxis operate. The supply graph below shows the timelines for technology introductions
under standard and accelerated market scenarios. The graph shows that economic operation of EVs as taxis
could be pulled forward to the near future given the correct incentive and implementation programme.
Indeed, national incentive provision in some of the PPIA cities does currently allow for economic
introduction of EV taxis, such as the £5,000 EV purchase grant available in the UK (Birmingham).
Figure 7- EV/FCEV accelerated deployment timelines
FCEV
Mass deployment of EV cars
EV deployment with incentive programme
FCEV with incentive programme
PPIA Cities: EV/FCEV Deployment Scenario
670/013 2.0 55
10 Conclusions and next steps Cities desire low carbon and clean transport that provides efficient and safe means of meeting the mobility
needs of its occupants. Technology is available that can deliver these goals. However this technology is not
being brought to market at the pace required to allow cities to meet their aspirations (or in some cases, legal
air quality requirements). This results in higher carbon emissions and air quality emission in cities, with
ultimate global warming impacts and detrimental health impacts on city occupants.
The PPIA cities have recognised this short coming and have sought to understand the technologies available
and the demand side tools available to bring technology to market quicker.
Industry roadmaps for buses and cars ultimately point to full electrification and fuel cell operation, with mass
penetration being achieved post 2030. This assumes on a number of technical challenges will be overcome to
enable reliable, cost effective and zero emission technologies to dominate the public transport markets. For
short-medium term technologies to be implemented within the foreseeable replacement cycles of the PPIA
city vehicles, this study has highlighted a number of carbon reduction options. For newer drivetrain
technologies (e.g. hybrid, electric, fuel cell), the key driver is likely to be national incentive schemes which
allow early adoption of technologies. The following actions are recommended to ensure lower carbon bus and
taxi technologies can be implemented in the short, medium and long term.
Ensure accurate costing mechanisms (TCO) are incorporated in vehicle/service procurement and
tenders
Work within the PPIA group, or locally within each city, to ensure that rigorous, holistic environmental
goals are set on a city-wide level
Ensure environmental criteria are evaluated within tender bids as set out in the mandatory
requirements of the Clean Vehicle Directive
Engage with the technology supplier community, bus manufacturers and operators under FCP
methodology to investigate methods for ensuring innovative new technologies, such as those
highlighted in Section 5.2 Detailed Technology Study for Buses Detailed Technology Study for
Busesand case studies, can be adopted into upcoming short term bus orders or retro fitted to existing
bus stock
For the medium term engage with the technology supplier community, bus manufacturers and
operators under FCP methodology to investigate best way for cities to adopt, procure and reduce costs
from medium term technologies such as pure EV, PHEV etc buses
For the longer term develop partnerships and working groups with industry stakeholders. Collaborate
to join funded demonstration projects to allow the installation of infrastructure and operational TCO
models to be created
Work to modify procurement processes to be able to take a wider range of sustainability factors
Develop demand side action plans to ensure cities offer an attractive environment for the
development and deployment of lower carbon vehicles
This work was carried out by Cenex for the PPIA network, commissioned through Birmingham City Council. The
information presented is based on data received from public domain sources, independent experts, technology
providers and PPIA network cities.
While the information is provided in good faith, the ideas presented in the report must be subject to further
investigation, and take into account other factors not presented here, before being taken forward. Therefore
the authors disclaim liability for any investment decisions made on the basis of the review.
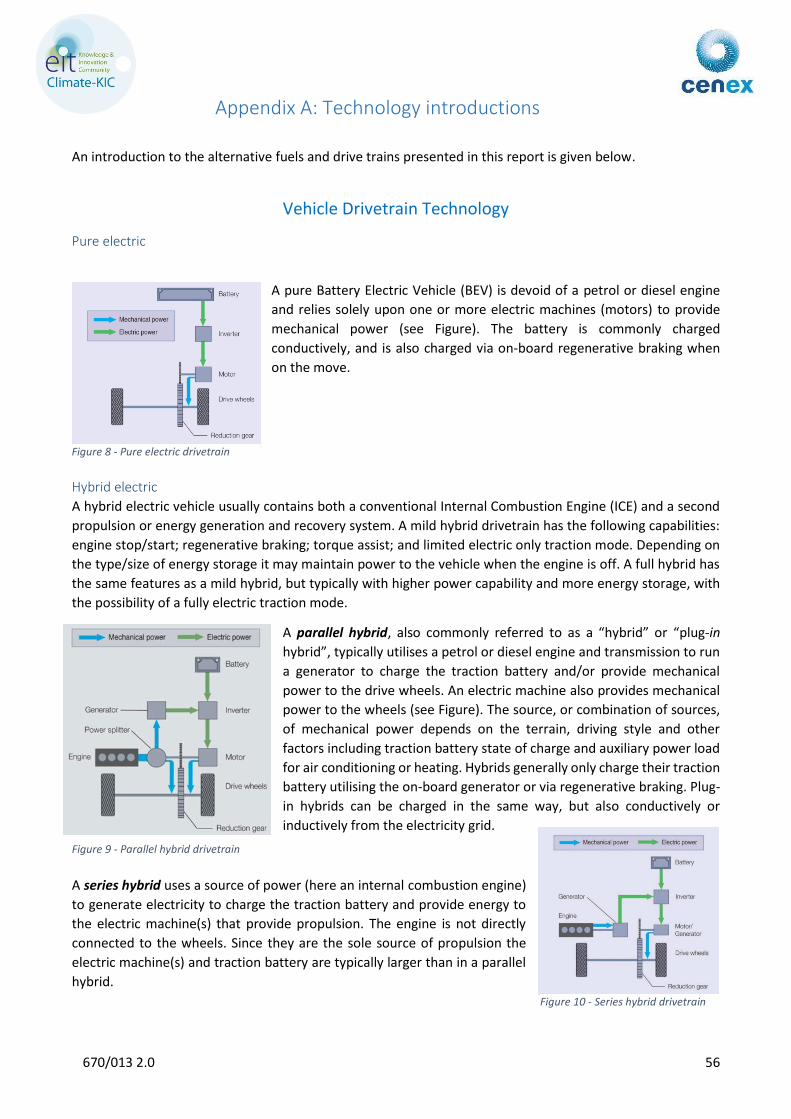
670/013 2.0 56
Appendix A: Technology introductions
An introduction to the alternative fuels and drive trains presented in this report is given below.
Vehicle Drivetrain Technology
Pure electric
A pure Battery Electric Vehicle (BEV) is devoid of a petrol or diesel engine
and relies solely upon one or more electric machines (motors) to provide
mechanical power (see Figure). The battery is commonly charged
conductively, and is also charged via on-board regenerative braking when
on the move.
Hybrid electric
A hybrid electric vehicle usually contains both a conventional Internal Combustion Engine (ICE) and a second
propulsion or energy generation and recovery system. A mild hybrid drivetrain has the following capabilities:
engine stop/start; regenerative braking; torque assist; and limited electric only traction mode. Depending on
the type/size of energy storage it may maintain power to the vehicle when the engine is off. A full hybrid has
the same features as a mild hybrid, but typically with higher power capability and more energy storage, with
the possibility of a fully electric traction mode.
A parallel hybrid, also commonly referred to as a “hybrid” or “plug-in
hybrid”, typically utilises a petrol or diesel engine and transmission to run
a generator to charge the traction battery and/or provide mechanical
power to the drive wheels. An electric machine also provides mechanical
power to the wheels (see Figure). The source, or combination of sources,
of mechanical power depends on the terrain, driving style and other
factors including traction battery state of charge and auxiliary power load
for air conditioning or heating. Hybrids generally only charge their traction
battery utilising the on-board generator or via regenerative braking. Plug-
in hybrids can be charged in the same way, but also conductively or
inductively from the electricity grid.
A series hybrid uses a source of power (here an internal combustion engine)
to generate electricity to charge the traction battery and provide energy to
the electric machine(s) that provide propulsion. The engine is not directly
connected to the wheels. Since they are the sole source of propulsion the
electric machine(s) and traction battery are typically larger than in a parallel
hybrid.
Figure 8 - Pure electric drivetrain
Figure 9 - Parallel hybrid drivetrain
Figure 10 - Series hybrid drivetrain
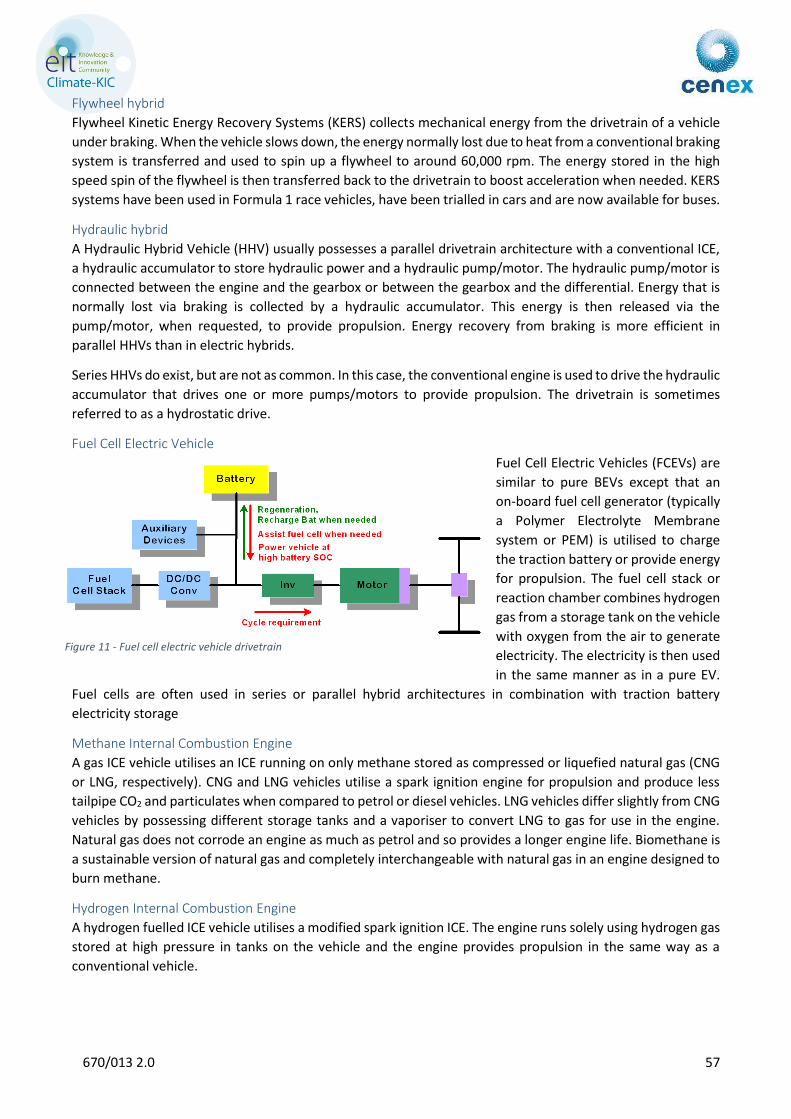
670/013 2.0 57
Flywheel hybrid
Flywheel Kinetic Energy Recovery Systems (KERS) collects mechanical energy from the drivetrain of a vehicle
under braking. When the vehicle slows down, the energy normally lost due to heat from a conventional braking
system is transferred and used to spin up a flywheel to around 60,000 rpm. The energy stored in the high
speed spin of the flywheel is then transferred back to the drivetrain to boost acceleration when needed. KERS
systems have been used in Formula 1 race vehicles, have been trialled in cars and are now available for buses.
Hydraulic hybrid
A Hydraulic Hybrid Vehicle (HHV) usually possesses a parallel drivetrain architecture with a conventional ICE,
a hydraulic accumulator to store hydraulic power and a hydraulic pump/motor. The hydraulic pump/motor is
connected between the engine and the gearbox or between the gearbox and the differential. Energy that is
normally lost via braking is collected by a hydraulic accumulator. This energy is then released via the
pump/motor, when requested, to provide propulsion. Energy recovery from braking is more efficient in
parallel HHVs than in electric hybrids.
Series HHVs do exist, but are not as common. In this case, the conventional engine is used to drive the hydraulic
accumulator that drives one or more pumps/motors to provide propulsion. The drivetrain is sometimes
referred to as a hydrostatic drive.
Fuel Cell Electric Vehicle
Fuel Cell Electric Vehicles (FCEVs) are
similar to pure BEVs except that an
on-board fuel cell generator (typically
a Polymer Electrolyte Membrane
system or PEM) is utilised to charge
the traction battery or provide energy
for propulsion. The fuel cell stack or
reaction chamber combines hydrogen
gas from a storage tank on the vehicle
with oxygen from the air to generate
electricity. The electricity is then used
in the same manner as in a pure EV.
Fuel cells are often used in series or parallel hybrid architectures in combination with traction battery
electricity storage
Methane Internal Combustion Engine
A gas ICE vehicle utilises an ICE running on only methane stored as compressed or liquefied natural gas (CNG
or LNG, respectively). CNG and LNG vehicles utilise a spark ignition engine for propulsion and produce less
tailpipe CO2 and particulates when compared to petrol or diesel vehicles. LNG vehicles differ slightly from CNG
vehicles by possessing different storage tanks and a vaporiser to convert LNG to gas for use in the engine.
Natural gas does not corrode an engine as much as petrol and so provides a longer engine life. Biomethane is
a sustainable version of natural gas and completely interchangeable with natural gas in an engine designed to
burn methane.
Hydrogen Internal Combustion Engine
A hydrogen fuelled ICE vehicle utilises a modified spark ignition ICE. The engine runs solely using hydrogen gas
stored at high pressure in tanks on the vehicle and the engine provides propulsion in the same way as a
conventional vehicle.
Figure 11 - Fuel cell electric vehicle drivetrain
670/013 2.0 58
Biodiesel Internal Combustion Engine
A vehicle that utilises 100% biodiesel as a fuel is usually powered by a diesel engine with some slight
modifications to the fuel system to incorporate a heating element in the fuel tank to prevent gelling (or
crystallisation) of the fuel at low temperatures.
Pure Plant Oil (Vegetable Oil) Internal Combustion Engine
A vehicle that utilises 100% Pure Plant Oil (PPO) as a fuel is also usually powered by a diesel engine.
Modifications to the fuel system are similar to biodiesel vehicles. Some vehicles possess two fuel tanks, one
containing diesel and one containing PPO. The vehicle is usually started on diesel and automatically switched
to PPO when the engine is warm enough to reduce the viscosity of PPO. Single tank vehicles are available, but
modifications to the cold start system and/or addition of electric heating to the cylinder block must be made
(depending on the fuel injection system used).
Diesel Pilot Engine
Westport gas fuelled diesel pilot ignited (diesel cycle) engine. Gas and a small amount of diesel fuel is injected
direct into the cylinder. The engine is lean burn (with excess air). Fuel handling on vehicle is LNG and therefore
does not lend itself to direct grid supply. Westport currently only manufacture 15l/12l engines which are
overpowered for bus applications. Would require new small engine adaptation.
Lean Burn Gas Engine
A dedicated gas fuelled spark ignited (Otto) engine installed from new or re-engined into an existing bus,
burning natural gas from the grid. The engine is lean burn (with excess air) or mixed mode lean/stoich. Fuel
consumption is approx. 25% poorer than diesel.
Lean Burn Gas Engine
Description: an OEM designed gas fuelled spark ignited (Otto) engine installed from new or re-engined into an
existing bus, burning natural gas from the grid. The engine is stoichiometric (no excess air) with three way
catalyst, fuel consumption approx. 30% poorer than diesel. Engine out CO2 is consequently ~1% poorer than
diesel.
Flexi-fuel
A vehicle that is termed Flexi-fuel is a vehicle that contains an Internal Combustion Engine that can run on
more than one fuel at the same time from the same fuel tank. Commonly these are spark ignition engine
vehicles that can run on petrol or a mixture of petrol and ethanol. The fuel mixture is detected and the ignition
timing altered automatically to cater for the fuel present.
Smart Alternator
Control of alternator excitation so that the alternator only charges the battery under deceleration (overrun)
conditions. Technology can be retrofitted.
Smart Compressor
Control of compressor parasitic load on engine either via depressurisation and/or declutching , the compressor
can be disengaged when not required. With smart control the compressor is only engaged when the vehicle
is in deceleration (overrun) phase, significantly reducing idle and on-load parasitic energy consumption.
Technology can be retrofitted.
Pneumatic Booster System
Compressed air from vehicle braking system is injected into the engine air manifold to improve vehicle
acceleration. This allows an earlier gear shift (short shifting) so engine operates more in efficient engine speed
/ load range. Suitable for retrofit.
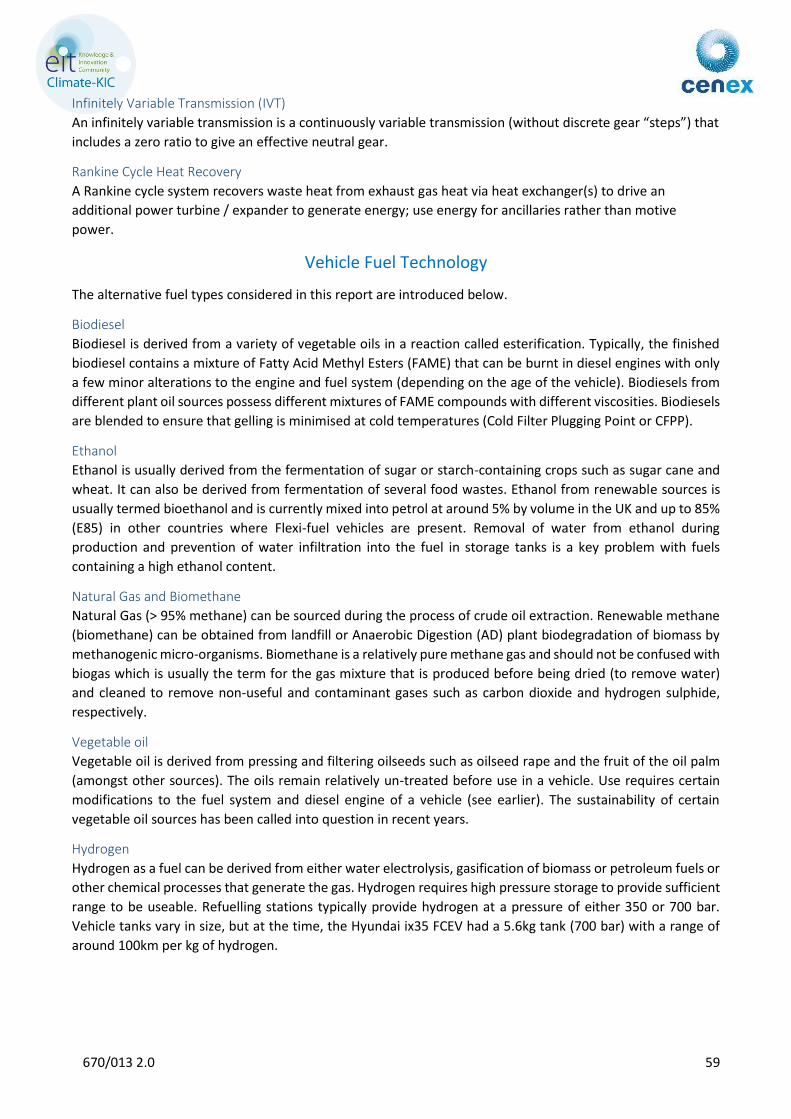
670/013 2.0 59
Infinitely Variable Transmission (IVT)
An infinitely variable transmission is a continuously variable transmission (without discrete gear “steps”) that
includes a zero ratio to give an effective neutral gear.
Rankine Cycle Heat Recovery
A Rankine cycle system recovers waste heat from exhaust gas heat via heat exchanger(s) to drive an
additional power turbine / expander to generate energy; use energy for ancillaries rather than motive
power.
Vehicle Fuel Technology
The alternative fuel types considered in this report are introduced below.
Biodiesel
Biodiesel is derived from a variety of vegetable oils in a reaction called esterification. Typically, the finished
biodiesel contains a mixture of Fatty Acid Methyl Esters (FAME) that can be burnt in diesel engines with only
a few minor alterations to the engine and fuel system (depending on the age of the vehicle). Biodiesels from
different plant oil sources possess different mixtures of FAME compounds with different viscosities. Biodiesels
are blended to ensure that gelling is minimised at cold temperatures (Cold Filter Plugging Point or CFPP).
Ethanol
Ethanol is usually derived from the fermentation of sugar or starch-containing crops such as sugar cane and
wheat. It can also be derived from fermentation of several food wastes. Ethanol from renewable sources is
usually termed bioethanol and is currently mixed into petrol at around 5% by volume in the UK and up to 85%
(E85) in other countries where Flexi-fuel vehicles are present. Removal of water from ethanol during
production and prevention of water infiltration into the fuel in storage tanks is a key problem with fuels
containing a high ethanol content.
Natural Gas and Biomethane
Natural Gas (> 95% methane) can be sourced during the process of crude oil extraction. Renewable methane
(biomethane) can be obtained from landfill or Anaerobic Digestion (AD) plant biodegradation of biomass by
methanogenic micro-organisms. Biomethane is a relatively pure methane gas and should not be confused with
biogas which is usually the term for the gas mixture that is produced before being dried (to remove water)
and cleaned to remove non-useful and contaminant gases such as carbon dioxide and hydrogen sulphide,
respectively.
Vegetable oil
Vegetable oil is derived from pressing and filtering oilseeds such as oilseed rape and the fruit of the oil palm
(amongst other sources). The oils remain relatively un-treated before use in a vehicle. Use requires certain
modifications to the fuel system and diesel engine of a vehicle (see earlier). The sustainability of certain
vegetable oil sources has been called into question in recent years.
Hydrogen
Hydrogen as a fuel can be derived from either water electrolysis, gasification of biomass or petroleum fuels or
other chemical processes that generate the gas. Hydrogen requires high pressure storage to provide sufficient
range to be useable. Refuelling stations typically provide hydrogen at a pressure of either 350 or 700 bar.
Vehicle tanks vary in size, but at the time, the Hyundai ix35 FCEV had a 5.6kg tank (700 bar) with a range of
around 100km per kg of hydrogen.
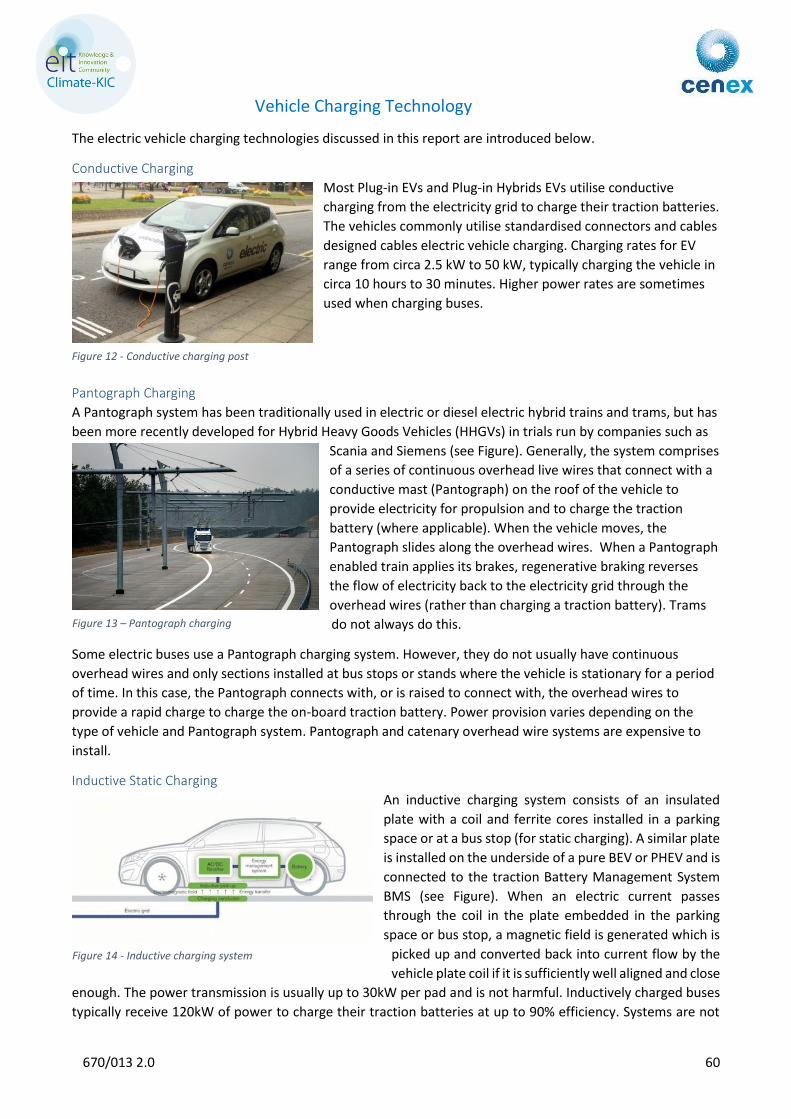
670/013 2.0 60
Vehicle Charging Technology
The electric vehicle charging technologies discussed in this report are introduced below.
Conductive Charging
Most Plug-in EVs and Plug-in Hybrids EVs utilise conductive
charging from the electricity grid to charge their traction batteries.
The vehicles commonly utilise standardised connectors and cables
designed cables electric vehicle charging. Charging rates for EV
range from circa 2.5 kW to 50 kW, typically charging the vehicle in
circa 10 hours to 30 minutes. Higher power rates are sometimes
used when charging buses.
Pantograph Charging
A Pantograph system has been traditionally used in electric or diesel electric hybrid trains and trams, but has
been more recently developed for Hybrid Heavy Goods Vehicles (HHGVs) in trials run by companies such as
Scania and Siemens (see Figure). Generally, the system comprises
of a series of continuous overhead live wires that connect with a
conductive mast (Pantograph) on the roof of the vehicle to
provide electricity for propulsion and to charge the traction
battery (where applicable). When the vehicle moves, the
Pantograph slides along the overhead wires. When a Pantograph
enabled train applies its brakes, regenerative braking reverses
the flow of electricity back to the electricity grid through the
overhead wires (rather than charging a traction battery). Trams
do not always do this.
Some electric buses use a Pantograph charging system. However, they do not usually have continuous
overhead wires and only sections installed at bus stops or stands where the vehicle is stationary for a period
of time. In this case, the Pantograph connects with, or is raised to connect with, the overhead wires to
provide a rapid charge to charge the on-board traction battery. Power provision varies depending on the
type of vehicle and Pantograph system. Pantograph and catenary overhead wire systems are expensive to
install.
Inductive Static Charging
An inductive charging system consists of an insulated
plate with a coil and ferrite cores installed in a parking
space or at a bus stop (for static charging). A similar plate
is installed on the underside of a pure BEV or PHEV and is
connected to the traction Battery Management System
BMS (see Figure). When an electric current passes
through the coil in the plate embedded in the parking
space or bus stop, a magnetic field is generated which is
picked up and converted back into current flow by the
vehicle plate coil if it is sufficiently well aligned and close
enough. The power transmission is usually up to 30kW per pad and is not harmful. Inductively charged buses
typically receive 120kW of power to charge their traction batteries at up to 90% efficiency. Systems are not
Figure 12 - Conductive charging post
Figure 13 – Pantograph charging
Figure 14 - Inductive charging system
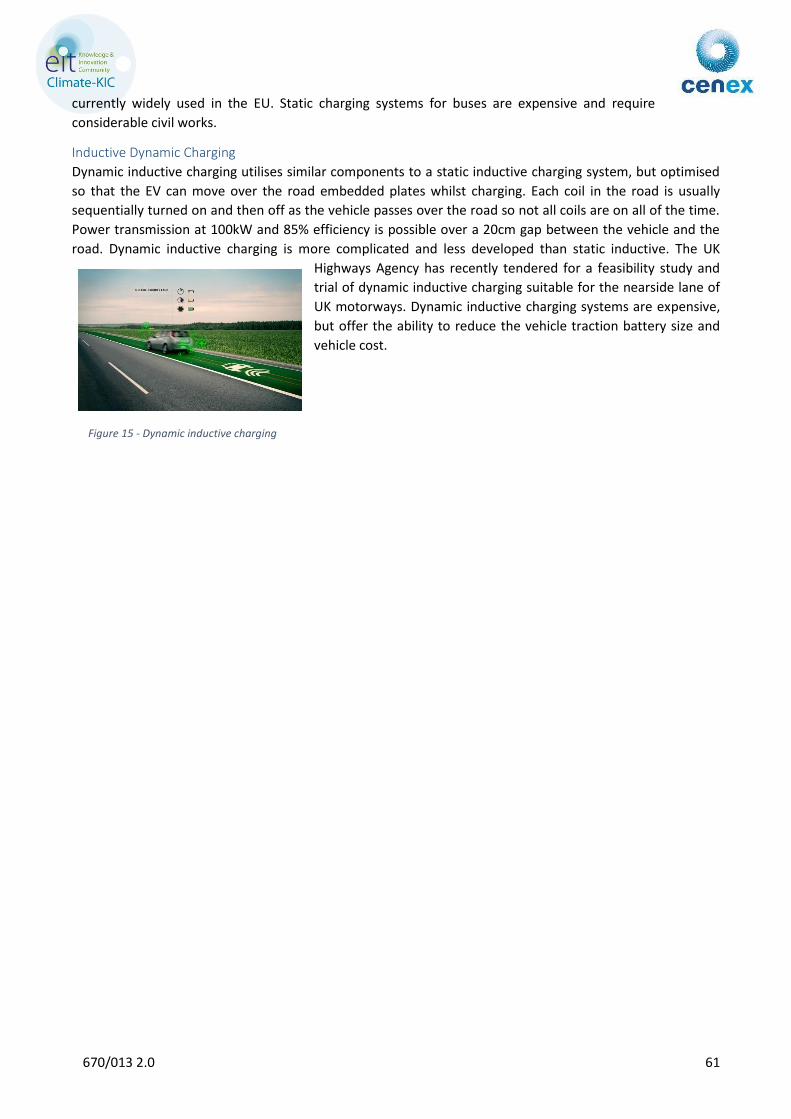
670/013 2.0 61
currently widely used in the EU. Static charging systems for buses are expensive and require
considerable civil works.
Inductive Dynamic Charging
Dynamic inductive charging utilises similar components to a static inductive charging system, but optimised
so that the EV can move over the road embedded plates whilst charging. Each coil in the road is usually
sequentially turned on and then off as the vehicle passes over the road so not all coils are on all of the time.
Power transmission at 100kW and 85% efficiency is possible over a 20cm gap between the vehicle and the
road. Dynamic inductive charging is more complicated and less developed than static inductive. The UK
Highways Agency has recently tendered for a feasibility study and
trial of dynamic inductive charging suitable for the nearside lane of
UK motorways. Dynamic inductive charging systems are expensive,
but offer the ability to reduce the vehicle traction battery size and
vehicle cost.
Figure 15 - Dynamic inductive charging
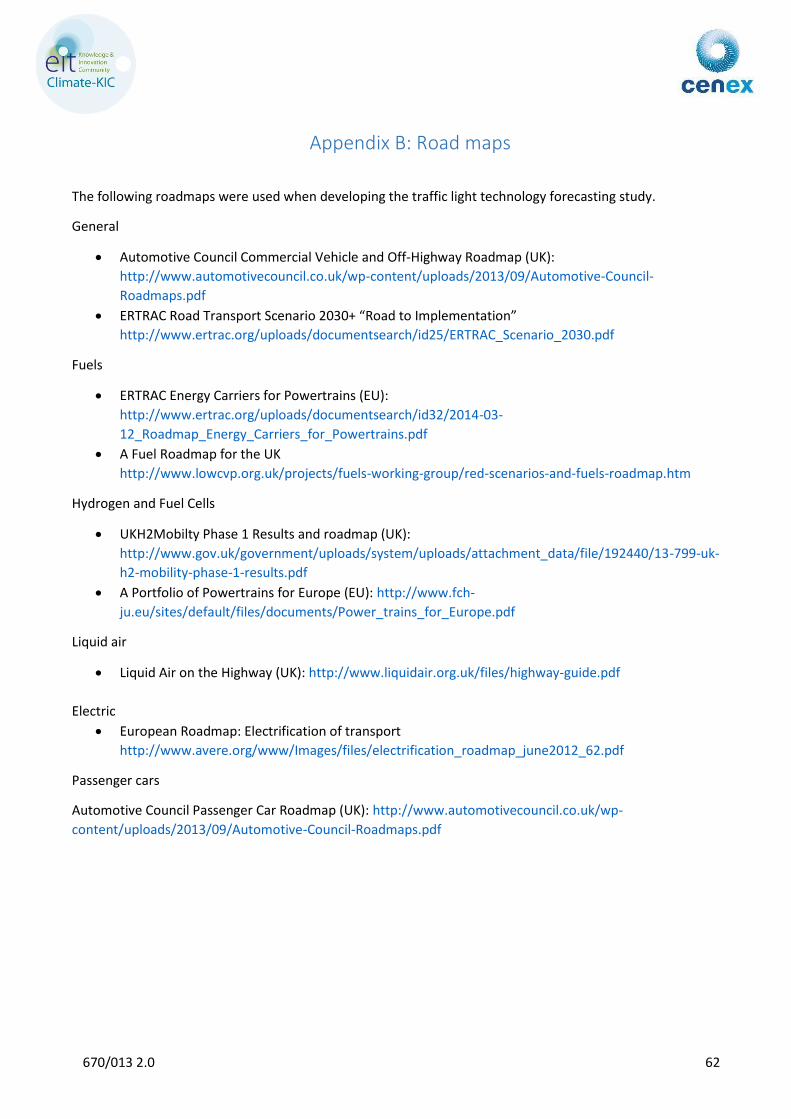
670/013 2.0 62
Appendix B: Road maps
The following roadmaps were used when developing the traffic light technology forecasting study.
General
Automotive Council Commercial Vehicle and Off-Highway Roadmap (UK):
http://www.automotivecouncil.co.uk/wp-content/uploads/2013/09/Automotive-Council-
Roadmaps.pdf
ERTRAC Road Transport Scenario 2030+ “Road to Implementation”
http://www.ertrac.org/uploads/documentsearch/id25/ERTRAC_Scenario_2030.pdf
Fuels
ERTRAC Energy Carriers for Powertrains (EU):
http://www.ertrac.org/uploads/documentsearch/id32/2014-03-
12_Roadmap_Energy_Carriers_for_Powertrains.pdf
A Fuel Roadmap for the UK
http://www.lowcvp.org.uk/projects/fuels-working-group/red-scenarios-and-fuels-roadmap.htm
Hydrogen and Fuel Cells
UKH2Mobilty Phase 1 Results and roadmap (UK):
http://www.gov.uk/government/uploads/system/uploads/attachment_data/file/192440/13-799-uk-
h2-mobility-phase-1-results.pdf
A Portfolio of Powertrains for Europe (EU): http://www.fch-
ju.eu/sites/default/files/documents/Power_trains_for_Europe.pdf
Liquid air
Liquid Air on the Highway (UK): http://www.liquidair.org.uk/files/highway-guide.pdf
Electric
European Roadmap: Electrification of transport
http://www.avere.org/www/Images/files/electrification_roadmap_june2012_62.pdf
Passenger cars
Automotive Council Passenger Car Roadmap (UK): http://www.automotivecouncil.co.uk/wp-
content/uploads/2013/09/Automotive-Council-Roadmaps.pdf
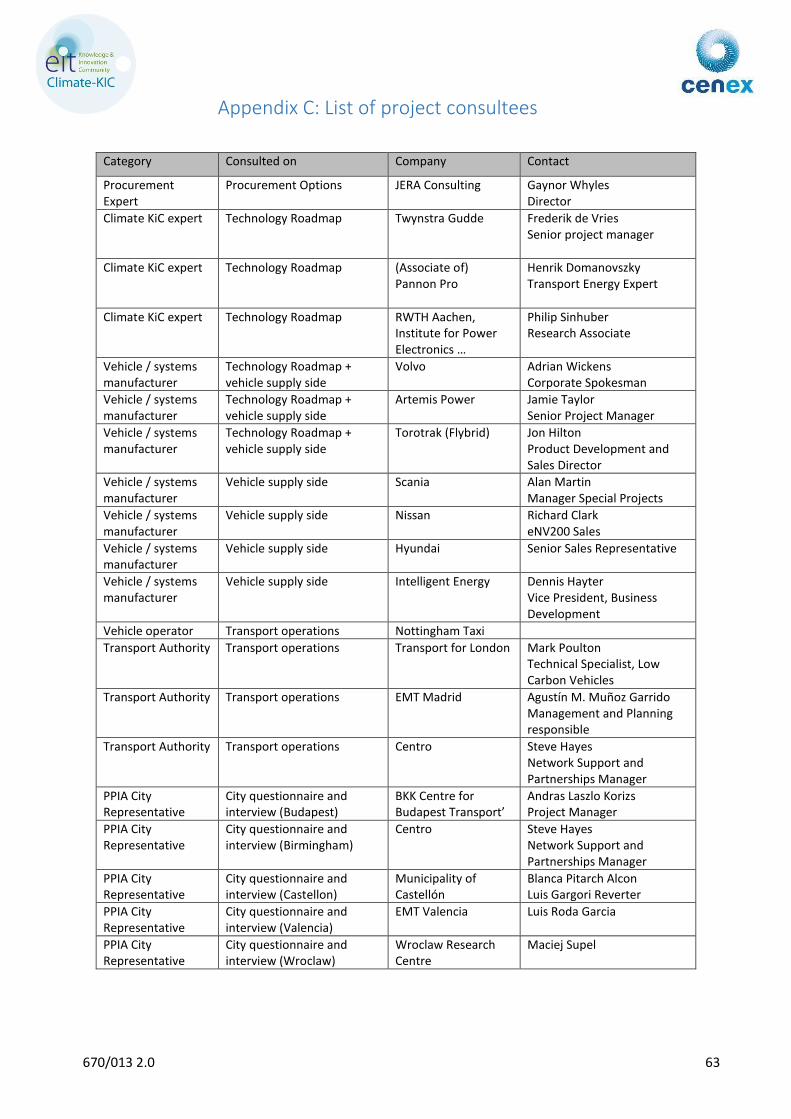
670/013 2.0 63
Appendix C: List of project consultees
Category Consulted on Company Contact
Procurement Expert
Procurement Options JERA Consulting Gaynor Whyles Director
Climate KiC expert Technology Roadmap
Twynstra Gudde Frederik de Vries Senior project manager
Climate KiC expert Technology Roadmap (Associate of) Pannon Pro
Henrik Domanovszky Transport Energy Expert
Climate KiC expert Technology Roadmap RWTH Aachen, Institute for Power Electronics …
Philip Sinhuber Research Associate
Vehicle / systems manufacturer
Technology Roadmap + vehicle supply side
Volvo Adrian Wickens Corporate Spokesman
Vehicle / systems manufacturer
Technology Roadmap + vehicle supply side
Artemis Power Jamie Taylor Senior Project Manager
Vehicle / systems manufacturer
Technology Roadmap + vehicle supply side
Torotrak (Flybrid) Jon Hilton Product Development and Sales Director
Vehicle / systems manufacturer
Vehicle supply side Scania Alan Martin Manager Special Projects
Vehicle / systems manufacturer
Vehicle supply side Nissan Richard Clark eNV200 Sales
Vehicle / systems manufacturer
Vehicle supply side Hyundai Senior Sales Representative
Vehicle / systems manufacturer
Vehicle supply side Intelligent Energy Dennis Hayter Vice President, Business Development
Vehicle operator Transport operations Nottingham Taxi
Transport Authority Transport operations Transport for London Mark Poulton Technical Specialist, Low Carbon Vehicles
Transport Authority Transport operations EMT Madrid Agustín M. Muñoz Garrido Management and Planning responsible
Transport Authority Transport operations Centro Steve Hayes Network Support and Partnerships Manager
PPIA City Representative
City questionnaire and interview (Budapest)
BKK Centre for Budapest Transport’
Andras Laszlo Korizs Project Manager
PPIA City Representative
City questionnaire and interview (Birmingham)
Centro Steve Hayes Network Support and Partnerships Manager
PPIA City Representative
City questionnaire and interview (Castellon)
Municipality of Castellón
Blanca Pitarch Alcon Luis Gargori Reverter
PPIA City Representative
City questionnaire and interview (Valencia)
EMT Valencia Luis Roda Garcia
PPIA City Representative
City questionnaire and interview (Wroclaw)
Wroclaw Research Centre
Maciej Supel
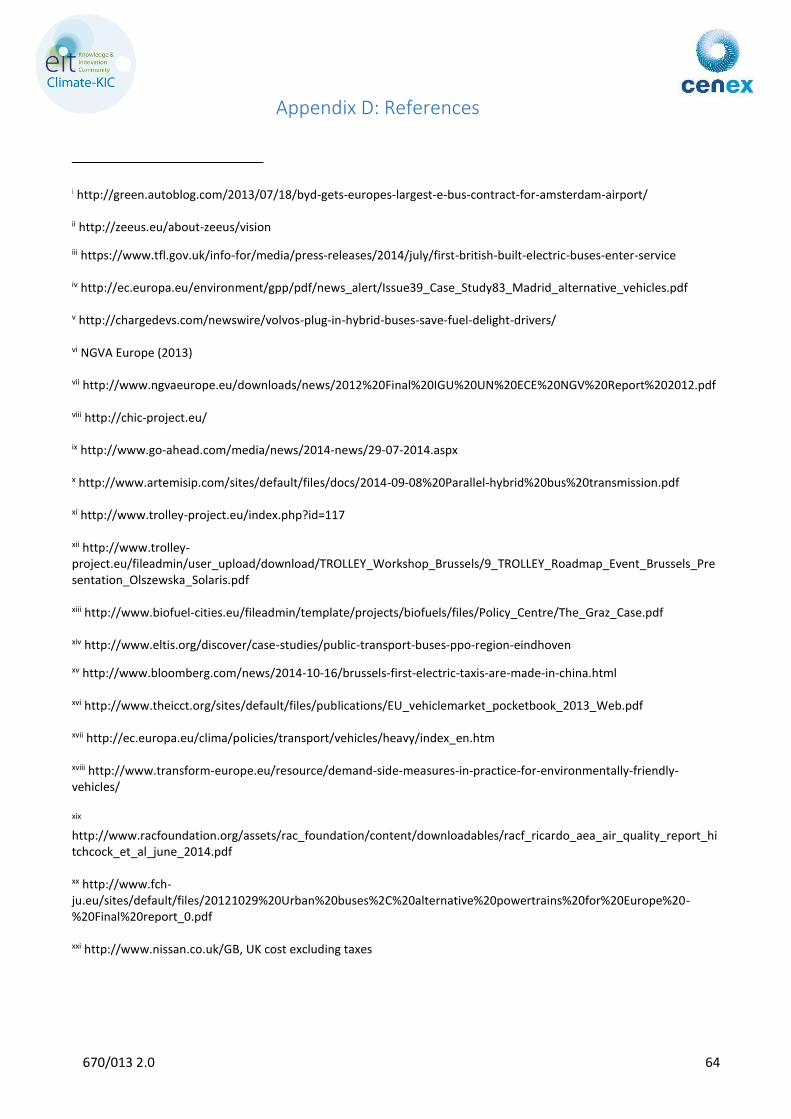
670/013 2.0 64
Appendix D: References
i http://green.autoblog.com/2013/07/18/byd-gets-europes-largest-e-bus-contract-for-amsterdam-airport/ ii http://zeeus.eu/about-zeeus/vision
iii https://www.tfl.gov.uk/info-for/media/press-releases/2014/july/first-british-built-electric-buses-enter-service iv http://ec.europa.eu/environment/gpp/pdf/news_alert/Issue39_Case_Study83_Madrid_alternative_vehicles.pdf v http://chargedevs.com/newswire/volvos-plug-in-hybrid-buses-save-fuel-delight-drivers/ vi NGVA Europe (2013) vii http://www.ngvaeurope.eu/downloads/news/2012%20Final%20IGU%20UN%20ECE%20NGV%20Report%202012.pdf viii http://chic-project.eu/ ix http://www.go-ahead.com/media/news/2014-news/29-07-2014.aspx x http://www.artemisip.com/sites/default/files/docs/2014-09-08%20Parallel-hybrid%20bus%20transmission.pdf xi http://www.trolley-project.eu/index.php?id=117 xii http://www.trolley-project.eu/fileadmin/user_upload/download/TROLLEY_Workshop_Brussels/9_TROLLEY_Roadmap_Event_Brussels_Presentation_Olszewska_Solaris.pdf xiii http://www.biofuel-cities.eu/fileadmin/template/projects/biofuels/files/Policy_Centre/The_Graz_Case.pdf xiv http://www.eltis.org/discover/case-studies/public-transport-buses-ppo-region-eindhoven
xv http://www.bloomberg.com/news/2014-10-16/brussels-first-electric-taxis-are-made-in-china.html xvi http://www.theicct.org/sites/default/files/publications/EU_vehiclemarket_pocketbook_2013_Web.pdf xvii http://ec.europa.eu/clima/policies/transport/vehicles/heavy/index_en.htm xviii http://www.transform-europe.eu/resource/demand-side-measures-in-practice-for-environmentally-friendly-vehicles/ xix http://www.racfoundation.org/assets/rac_foundation/content/downloadables/racf_ricardo_aea_air_quality_report_hitchcock_et_al_june_2014.pdf xx http://www.fch-ju.eu/sites/default/files/20121029%20Urban%20buses%2C%20alternative%20powertrains%20for%20Europe%20-%20Final%20report_0.pdf xxi http://www.nissan.co.uk/GB, UK cost excluding taxes