Embed Size (px)
Citation preview
Infrastructure Financing Challenges in Southeast Asia
Alfredo PerdigueroDirector, Regional Cooperation and Coordination Division
Southeast Asia DepartmentAsian Development Bank
Policy Dialogue on Infrastructure Financing Strategies for Southeast Asia
Manila, 29 August 2017

Infrastructure is still critical to Asia6
78
91
01
1
Natu
tal L
og
of
GD
P p
er
cap
ita (
20
10
$)
0 2 4 6 8 10 12
Infrastructure Index
Infrastructure and GDP per capita
Note: Infrastructure index is computed based on first principal component of infrastructure stocks in roads, airport, electricity, telephone, mobile, broadband, water and sanitation. Higher values represent greater infrastructure availability.Source: ADB estimates based on data from World Development Indicators and PovcalNet, World Bank

Infrastructure is still critical to Asia0
10
20
30
40
50
Po
vert
y R
ate
0 2 4 6
Infrastructure Index
Infrastructure and poverty
Note: Infrastructure index is computed based on first principal component of infrastructure stocks in roads, airport, electricity, telephone, mobile, broadband, water and sanitation. Higher values represent greater infrastructure availability.Source: ADB estimates based on data from World Development Indicators and PovcalNet, World Bank

Asia surpassed other developing countries in infrastructure provision
1.1
2.7
1.9
2.2
18.9
6.8
8.1
9.1
15.80.5
3.5
1.09.1
6.9
0.2
5.21.4
1.0
0.8
1.1
4.8
0 500 1,000 1,500 2,000 2,500
Hongkong, ChinaIndia
Korea, Rep. ofPhilippinesAzerbaijan
BruneiViet NamMalaysiaPR ChinaThailandPakistan
IndonesiaCambodia
Kyrgyz RepublicLao PDR
BangladeshNepal
MyanmarKazakhstan
OECDOther Developing Countries
ADB DMCs
Final Year Initial Year 0 1 2 3 4 5 6
Malaysia
Republic of Korea
People’s Republic of China
Thailand
India
Azerbaijan
Pakistan
Indonesia
Viet Nam
Cambodia
Philippines
Kazakhstan
Bangladesh
Nepal
Mongolia
Kyrgyz Republic
OECD
Other Developing Countries
ADB DMCs
Road Density and Annual Growth Road Quality, 2015
Figures refer to annualized growth rate (2000-2010). Initial year is between 1996-2004 while Final Year is between 2006-2010.Regional averages are calculated with land area as weightsSource: International Road Federation (2012); World Development Indicators, World BankCited in Meeting Asia’s Infrastructure Needs, ADB, 2017
Regional averages of quality are calculated with length of road as weightsSource: World Economic ForumCited in Meeting Asia’s Infrastructure Needs, ADB, 2017

But more infrastructure is still neededElectricity Generation Capacity Transmission and Distribution Loss
Figures refer to annualized growth rate (2000-2012). Regional averages are calculated with population as weightsSource: International Energy Statistics, US Energy Information AdministrationCited in Meeting Asia’s Infrastructure Needs, ADB, 2017
Regional averages are calculated with total electricity generated as weightsSource: World Bank Development Indicators, World BankCited in Meeting Asia’s Infrastructure Needs, ADB, 2017

Key challenge: huge need forinfrastructure investment in Asia
982
557
152
53
$1,744 billion* (5.9% of GDP)
2016-2030 ($26.1 trillion; 2015 prices)
Energy (Electricity)
Transport
Telecommunications
Water and Sanitation
379
242
95
34
$750 billion
2010-2020 ($8.1 trillion; 2008 prices)
Note: Figures above the bars are annual average investment needs;Investment needs as % of GDP is based on the annual average of projected GDP for the period indicated* estimates in 2016-2030 are adjusted for climate mitigation and adaptation costs
Source: Meeting Asia’s Infrastructure Needs, ADB, 2017; Seamless Asia, ADB and ADBI, 2009
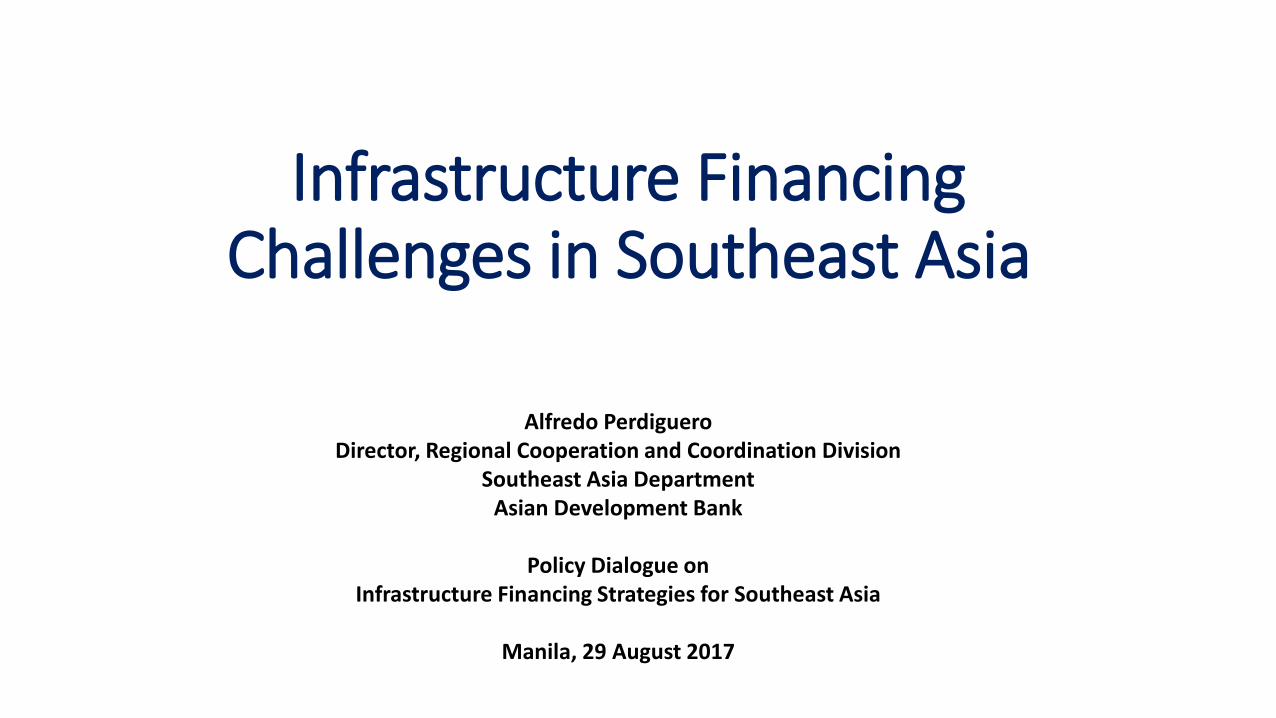
Infrastructure investment needs vary across sub-regions
Note: Pakistan and Afghanistan are included in South Asia. *** Climate-adjusted estimates include climate mitigation and climate proofing costs, but not include other adaptation costs, especially those associated with sea level rise.
Source: Meeting Asia’s Infrastructure Needs, ADB, 2017
Investment
Needs
Annual
Average
Investment
Needs as
% of GDP
Investment
Needs
Annual
Average
Investment
Needs as
% of GDP
Central Asia 492 33 6.8 565 38 7.8
East Asia 13,781 919 4.5 16,062 1,071 5.2
South Asia* 5,477 365 7.6 6,347 423 8.8
Southeast Asia 2,759 184 5.0 3,147 210 5.7
The Pacific 42 2.8 8.2 46 3.1 9.1
Asia and the Pacific 22,551 1,503 5.1 26,166 1,744 5.9
Region
Baseline Estimates Climate-adjusted Estimates **
Infrastructure Investment by Region: Asia and the Pacific 2016-2030 ($ billion, 2015 prices)

Investment in infrastructure:considerable variations by country
Note: Figures above bars are average infrastructure investment as % of GDP, computed for the period 2010-14Public sector includes central government budget only. Actual budget investments except Armenia, Bhutan, Georgia, Maldives, Myanmar and Thailand, which are planned or estimated budget investmentsSource: Meeting Asia’s Infrastructure Needs, ADB, 2017
Average Infrastructure Investment (% of GDP)
6.8 6.6
5.7 5.4 5.14.9
4.3 4.23.7
2.6 2.6 2.5 2.3 2.2 2.1 2.1 1.9 1.8
-
1.0
2.0
3.0
4.0
5.0
6.0
7.0
8.0
Public Private
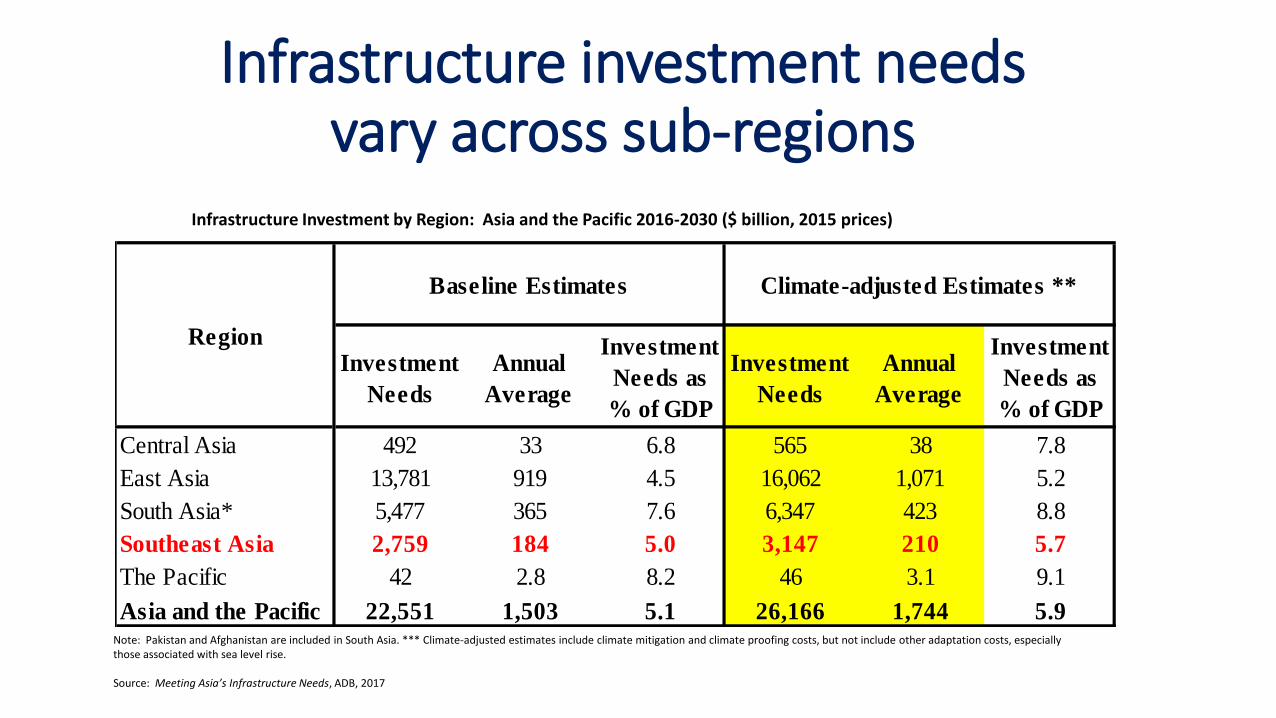
Infrastructure investment gaps –$102 billion or 4.1% of GDP
Infrastructure Investments and Gaps: Asia and the Pacific 2016-2020 ($ billion, 2015 prices)
Note: Number in parentheses refer to number of countries. For example, the 7 Southeast Asian countries in the estimation include Cambodia, Indonesia, Malaysia, Myanmar, Philippines, Thailand and Viet Nam.The gap as a % of GDP is based on the annual average of projected GDP from 2016 to 2020.
Source: Meeting Asia’s Infrastructure Needs, ADB, 2017
Annual
NeedsGap
Gap
(% of GDP)
Total Asia-Pacific (25) 881 1,340 459 2.4
Total without PRC (24) 195 503 308 5.0
Selected Central Asia Countries (3) 6 12 7 3.1
Selected South Asia Countries (8) 134 329 195 5.7
Selected Southeast Asia Countries (7) 55 157 102 4.1
Selected Pacific Countries (5) 1 2 2 6.9
Climate-adjusted EstimatesEstimated Current
Investment (2015)

How to close the gaps?
• Reforms
• Institutions
• Finance

Reforms should continueFiscal space in developing Asia (% of GDP)
Source: Meeting Asia’s Infrastructure Needs, ADB, 2017; Ahmad (2015); World Bank 2017
▪ Fiscal reforms to enhance sustainabilityof government finances and publicinfrastructure investments
▪ Increase tax revenues for capital spending- indicative targets: tax/GDP=18%- remove loopholes in tax system- good governance in tax collection
▪ Manage current and future liabilities- set annual budgets within medium-term fiscal frameworks
- monitor regularly governmentliabilities
Tax revenues to GDP (%)
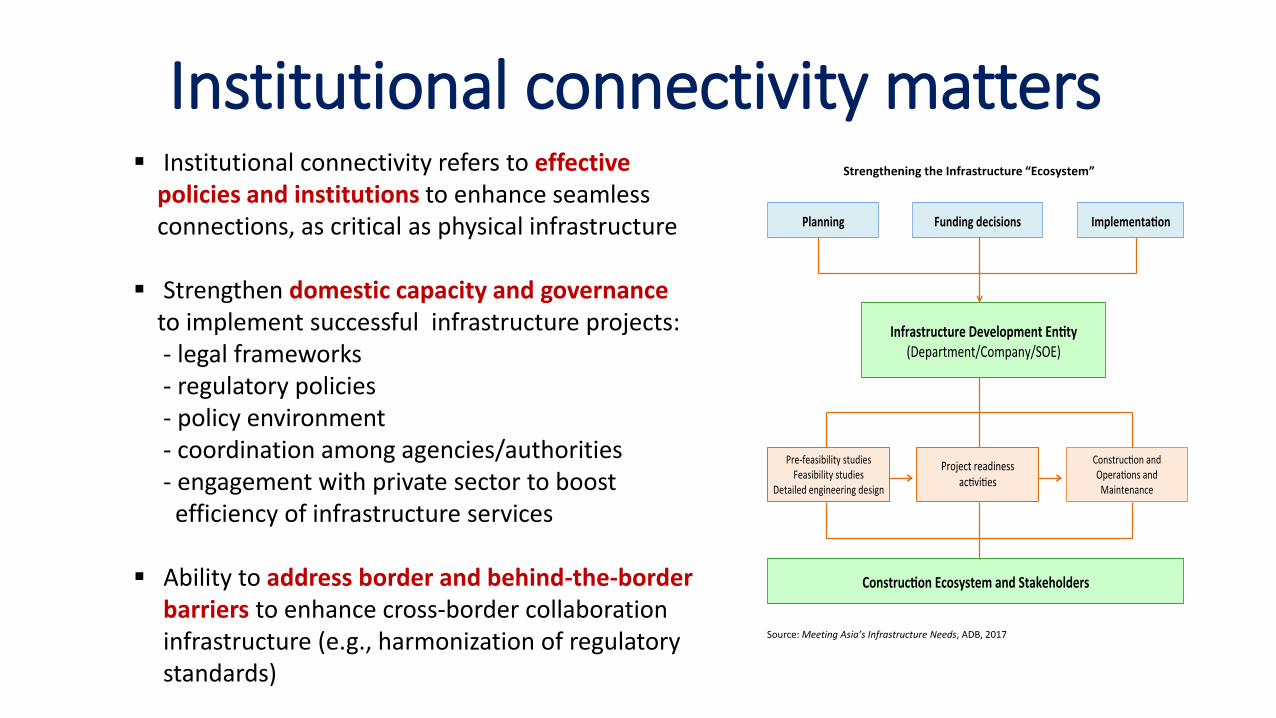
Institutional connectivity matters▪ Institutional connectivity refers to effective
policies and institutions to enhance seamlessconnections, as critical as physical infrastructure
▪ Strengthen domestic capacity and governanceto implement successful infrastructure projects:- legal frameworks- regulatory policies- policy environment- coordination among agencies/authorities- engagement with private sector to boostefficiency of infrastructure services
▪ Ability to address border and behind-the-borderbarriers to enhance cross-border collaboration infrastructure (e.g., harmonization of regulatorystandards)
Strengthening the Infrastructure “Ecosystem”
Source: Meeting Asia’s Infrastructure Needs, ADB, 2017

Financing is still keyInfrastructure investment by financing source, excluding PRC, 2016-2020 (annual average, $ billion in 2015 prices)
Source: Meeting Asia’s Infrastructure Needs, ADB, 2017
▪ Efficiency in public financing- direct fiscal support through capital spending
- strong public support facilitatesprivate capital financing
▪ Strengthen private sector support mechanisms- enhance efficiency of existingmodes of private financing
- making PPP work (i.e., transparencyof projects; enforceable contracts)

Conclusion
▪ Despite progress in infrastructure provision in the last decade, Southeast Asia needs $3.1trillion (in 2015 prices), or $210 billion per year, for infrastructure investment in 2016-2030
▪ The aggregate figures mask wide variations in infrastructure investment gap acrossSoutheast, and actual needs are likely to be higher than these estimates as morecomprehensive infrastructure investment data is produced
▪ Innovative solutions and reforms, involving both public and private sectors, are needed toeffectively utilize Asia’s large savings for infrastructure development and bridge financinggaps
▪ But to sustain infrastructure development, need to overcome obstacles, includinggovernance, capacity, and institutional issues in developing Asia

ASEAN Infrastructure Fund (AIF)

Why AIF?
Objective: Channel regional resources for long-term financing of regional infrastructure development
• Huge financing demand for infrastructure development
• Sizable regional savings and forex reserves
“If the wealth tied up in reserves were invested either domestically in infrastructure or in a fully diversified long-term way in global capital markets…this is comparable to the gains thought to be achievable from the next round of trade liberalization, to global foreign aid, or to spending on key social sectors in a number of countries.”—
Lawrence Summers, Reflections on Global Account Imbalances and Emerging Markets Reserve Accumulation, March 2006

AIF as an ASEAN Initiative
• In 2006, the ASEAN Finance Ministers called for the setting up of a fund to pool foreign exchange reserves to finance infrastructure development
• In 2009, ASEAN asked ADB to provide technical and financial support
• In 2011, the AIF Shareholders Agreement was signed
• In 2012, AIF was established as a corporate entity and was granted exemptions from taxes and foreign exchange controls.
AIF Governance• All 10 ASEAN member-states and ADB are AIF shareholders;
All equity fully paid between 2012-2015
• All Shareholders are represented in the Board
• Board Chairmanship is every two years; Malaysia is current chair
• Fully administered by ADB
• Two Board meetings held every year: (in May at ADB Headquarters and in November in country of incumbent ASEAN Chair; For 2017: Philippines)

AIF Equity structure
ASEAN
ADB
Subtotal
Hybrid Capital
($million)
ASEANBrunei Darussalam
CambodiaIndonesiaLao PDRMalaysiaMyanmarPhilippinesSingaporeThailandViet Nam
335.210.0
0.1120.0
0.1150.0
0.115.015.015.015.0
ADB 150
TOTAL 485.2

The Role of ADB
• ADB has three important roles:
(i) Shareholder: ADB provided $150 million equity
(ii) Administrator: ADB formed an inter-departmental working group to support AIF administration
(iii) Cofinancier: ADB provided cofinancing of $2,089 million to all 8 AIF projects;
• All relevant ADB policies apply to AIF operations & administration

AIF Projects(as of end-May 2017)
Country Project
AIF Funding
($ million)
Indonesia Java–Bali 500kV Power Transmission Crossing Project 25
Indonesia Metropolitan Sanitation Management Investment Project 40
Viet Nam Ha Noi and Ho Chi Minh City Power Grid Development
Sector Project
100
Indonesia Sustainable and Inclusive Energy Program 100
Myanmar GMS East–West Economic Corridor Eindu to Kawkareik
Road Improvement Project
20
Lao PDR Second GMS Corridor Towns Development Project 10
Indonesia Electricity Grid Strengthening – Sumatra Program 25
Indonesia Integrated Participatory Development and Management
of Irrigation Program
100
TOTAL 420

AIF PortfolioBy Sector Amount ($million) Share (%)
Energy 250 59.52
Urban/Water 50 11.90
Transport 20 4.76
Others 100 23.81
TOTAL (actual) 420 100.00
By Country Amount ($million) Share (%)
Indonesia 290 69.05
Viet Nam 100 23.81
Myanmar 20 4.76
Lao PDR 10 2.38
TOTAL 420 100.00
The AIF
portfolio is
expected to
reach $700
million by the
end of 2017.

Concluding notes
•AIF fully operational…
•… can and should grow significantly bigger to further support ASEAN infrastructure development

www.adb.org