Embed Size (px)
Citation preview
Prepublication Copy: Uncorrected proofs Page 1
CONFERENCE PROCEEDINGS 14
Information Needs To Support State and LocalTransportation Decision Making into the 21st Century
Proceedings of a ConferenceIrvine, CaliforniaMarch 2–5, 1997
Sponsored by
Transportation Research BoardBureau of Transportation StatisticsFederal Highway AdminstrationFederal Transit AdministrationAmerican Association of State Highway and Transportation OfficialsAssociation of Metropolitan Planning Organizations
TRANSPORTATION RESEARCH BOARD
NATIONAL RESEARCH COUNCIL
NATIONAL ACADEMY PRESSWASHINGTON, D.C. 1997

Prepublication Copy: Uncorrected proofs Page 2
TRANSPORTATION RESEARCH BOARD1997 EXECUTIVE COMMITTEE
Chairman: David N. Wormley, Dean of Engineering, Pennsylvania StateUniversity, University Park
Vice Chairman: Sharon D. Banks, General Manager, AC Transit, Oakland,California
Executive Director: Robert E. Skinner, Jr., Transportation Research Board
Brian J. L. Berry, Lloyd Viel Berkner Regental Professor, University of Texas atDallas
Lillian C. Borrone, Director, Port Commerce Department, The Port Authority of NewYork and New Jersey, New York City (Past Chairman, 1995)
David G. Burwell, President, Rails-to-Trails Conservancy, Washington, D.C.E. Dean Carlson, Secretary, Kansas Department of Transportation, TopekaJames N. Denn, Commissioner, Minnesota Department of Transportation, St. PaulJohn W. Fisher, Director, ATLSS Engineering Research Center, and Professor of
Civil and Environmental Engineering, Lehigh University, Bethlehem,Pennsylvania
Dennis J. Fitzgerald, Executive Director, Capital District Transportation Authority,Albany, New York
David R. Goode, Chairman, President, and CEO, Norfolk Southern Corporation,Norfolk, Virginia
Delon Hampton, Chairman and CEO, Delon Hampton & Associates, Chartered,Washington, D.C.
Lester A. Hoel, Hamilton Professor, Department of Civil Engineering, University ofVirginia, Charlottesville
James L. Lammie, Director, Parsons Brinckerhoff, Inc., New York CityBradley L. Mallory, Secretary of Transportation, Commonwealth of Pennsylvania,
HarrisburgRobert E. Martinez, Secretary of Transportation, Commonwealth of Virginia,
RichmondJeffrey J. McCaig, President and CEO, Trimac Corporation, Calgary, Alberta,
CanadaMarshall W. Moore, Director, North Dakota Department of Transportation, BismarckCraig E. Philip, President, Ingram Barge Company, Nashville, Tennessee Andrea Riniker, Deputy Executive Director, Port of Seattle, Seattle, WashingtonJohn M. Samuels, Vice President—Operating Assets, Consolidated Rail
Corporation, Philadelphia, PennsylvaniaWayne Shackelford, Commissioner, Georgia Department of Transportation, AtlantaLes Sterman, Executive Director, East-West Gateway Coordinating Council, St.
Louis, MissouriJoseph M. Sussman, JR East Professor and Professor of Civil and Environmental
Engineering, Massachusetts Institute of Technology, Cambridge (PastChairman, 1994)
Prepublication Copy: Uncorrected proofs Page 3
James W. van Loben Sels, Director, California Department of Transportation,Sacramento (Past Chairman, 1996)
Martin Wachs, Director, University of California Transportation Center, and Professorof Civil Engineering and City and Regional Planning, University of California,Berkeley
David L. Winstead, Secretary, Maryland Department of Transportation, Baltimore-Washington International Airport, Maryland
Mike Acott, President, National Asphalt Pavement Association, Lanham, Maryland(ex officio)
Roy A. Allen, Vice President, Research and Test Department, Association ofAmerican Railroads, Washington, D.C. (ex officio)
Joe N. Ballard (Lt. Gen., U.S. Army), Chief of Engineers and Commander, U.S. ArmyCorps of Engineers, Washington, D.C. (ex officio)
Andrew H. Card, Jr., President and CEO, American Automobile ManufacturersAssociation, Washington, D.C. (ex officio)
Kelley S. Coyner, Acting Administrator, Research and Special ProgramsAdministration, U.S. Department of Transportation (ex officio)
Thomas J. Donohue, President and CEO, American Trucking Associations, Inc.,Alexandria, Virginia (ex officio)
Mortimer L. Downey, Deputy Secretary, Office of the Secretary, U.S. Department ofTransportation (ex officio)
Thomas M. Downs, Chairman and President, National Railroad PassengerCorporation, Washington, D.C. (ex officio)
Francis B. Francois, Executive Director, American Association of State Highwayand Transportation Officials, Washington, D.C. (ex officio)
David Gardiner, Assistant Administrator, Office of Policy, Planning and Evaluation,Environmental Protection Agency, Washington, D.C. (ex officio)
Jane F. Garvey, Administrator, Federal Aviation Administration, U.S. Department ofTransportation (ex officio)
John E. Graykowski, Acting Administrator, Maritime Administration, U.S.Department of Transportation (ex officio)
Gloria J. Jeff, Acting Administrator, Federal Highway Administration, U.S.Department of Transportation (ex officio)
T. R. Lakshmanan, Director, Bureau of Transportation Statistics, U.S. Department ofTransportation (ex officio)
Gordon J. Linton, Administrator, Federal Transit Administration, U.S. Department ofTransportation (ex officio)
Ricardo Martinez, Administrator, National Highway Traffic Safety Administration,U.S. Department of Transportation (ex officio)
William W. Millar, President, American Public Transit Association, Washington, D.C.(ex officio)
Jolene M. Molitoris, Administrator, Federal Railroad Administration, U.S.Department of Transportation (ex officio)
Prepublication Copy: Uncorrected proofs Page 4
Conference Proceedings 14ISSN 1073-1652ISBN 0-309-06206-3
Subscriber CategoriesIA planning and administrationIB energy and environmentV aviationVI public transitVII railVIII freight transportation (multimodal)IX marine transportation
Transportation Research Board publications are available by ordering individual publications directly from theTRB Business Office, through the Internet at http://www.nas.edu/trb/index.html, or by annual subscriptionthrough organizational or individual affiliation with TRB. Affiliates and library subscribers are eligible forsubstantial discounts. For further information, contact the Transportation Research Board Business Office,National Research Council, 2101 Constitution Avenue, N.W., Washington, D.C. 20418 (telephone 202-334-3214; fax 202-334-2519; or e-mail [email protected]).
Printed in the United States of America
NOTICE: The conference that is the subject of this report was approved by the Governing Board of theNational Research Council, whose members are drawn from the councils of the National Academy ofSciences, the National Academy of Engineering, and the Institute of Medicine. The members of thecommittee responsible for the report were chosen for their special competencies and with regard forappropriate balance.
This report has been reviewed by a group other than the authors according to procedures approvedby a Report Review Committee consisting of members of the National Academy of Sciences, the NationalAcademy of Engineering, and the Institute of Medicine.
The views expressed in the presentations contained in this report are those of the authors and donot necessarily reflect the views of the committee, the Transportation Research Board, the NationalResearch Council, or the sponsors of the conference.
The conference was sponsored by the Transportation Research Board; the Bureau ofTransportation Statistics, Federal Highway Administration, and Federal Transit Administration of the U.S.Department of Transportation; the American Association of State Highway and Transportation Officials; andthe Association of Metropolitan Planning Organizations.
Prepublication Copy: Uncorrected proofs Page 5
Steering Committee for the Conference on Information Needs To Support State andLocal Decision Making into the 21st Century
Chair: Alan E. Pisarski, Falls Church, VirginiaLarry King, Pennsylvania Department of TransportationRonald F. Kirby, Metropolitan Washington Council of GovernmentsYsela Llort, Florida Department of TransportationRichard W. Miller, Kansas Department of TransportationNeil J. Pedersen, Maryland Department of TransportationKenneth W. Shiatte, New York State Department of TransportationRobert T. Sicko, Puget Sound Regional Council of GovernmentsMary Lynn Tischer, Virginia Department of TransportationDiane Wacker, Texas Department of TransportationC. Michael Walton, University of Texas at Austin
TRB Data Committee and Task Force Chairs
Alan E. Pisarski, Falls Church, Virginia: Task Force on National Data Needs and RequirementsCharles L. Purvis, Metropolitan Transportation Commission: Committee on Urban Transportation Data andInformation SystemsRonald W. Tweedie, New York State Department of Transportation: Committee on StatewideTransportation Data and Information SystemsCheryl C. Stecher, Applied Management Planning Group: Task Force on Travel Survey MethodsWende A. O’Neill, Utah State University: Task Force on Geographic Information Systems forTransportation (GIS-T)Roger G. Petzold, Federal Highway Administration: Committee on Computer TechnologyRussell B. Capelle, Boston Metropolitan Planning Organization: Committee on Freight TransportationData
Liaison Members
David Hensing, American Association of State Highway and Transportation OfficialsGary Maring, Federal Highway AdministrationRolf R. Schmitt, Bureau of Transportation StatisticsJanet Oakley, Association of Metropolitan Planning OrganizationsRichard Steinman, Federal Transit Administration
Conference Consultants
Christopher R. Fleet, Front Royal, VirginiaLisa Wormser, Two Heads CommunicationsGil Schamess, Two Heads Communications
Transportation Research Board StaffRobert E. Spicher, Director, Technical ActivitiesAlice J. Watland, Senior Program OfficerJames A. Scott, Senior Program OfficerPierre-Marc Daggett, Administrative AssistantNancy A. Ackerman, Director, Reports and Editorial ServicesNaomi Kassabian, Associate Editor
Prepublication Copy: Uncorrected proofs Page 6
Foreword
The Intermodal Surface Transportation Efficiency Act of 1991 (ISTEA) established newrequirements for data development and dissemination that have had an impact onfederal, state, and local transportation planning processes across the United States.As transportation professionals look ahead to the 21st century and the reauthorizationof ISTEA, broadscale and rapid changes will surely challenge transportation decisionmaking and affect future needs for data to support sound transportation planning.
The conference provided an opportunity for participants to (a) identify the typesof data that are critical for planning and policy analysis; (b) identify data-collectionrequirements; (c) discuss the appropriate roles of and relationships among federal,state, and local agencies in the context of data collection and dissemination; and (d)review the impact of technological advances on data collection and dissemination.
OBJECTIVE AND PRODUCT
Participants developed recommendations regarding the data needed to improve stateand local transportation decision making in the future. Among the critical information-related challenges are how to (a) take advantage of new data-collection anddissemination technologies; (b) improve data-collection efficiency with no new netburden; (c) produce and deliver the right information to decision makers; (d) effectivelymeasure system performance; and (e) respond to new demands for information fromthe public and other organizations. A major focus of the conference was thedevelopment of findings to assist the U.S. Department of Transportation and otherfederal agencies in their development of new data-related activities aimed atimproving transportation planning at all levels of government.
The invitation-only conference included participants from state departments oftransportation (DOTs), metropolitan planning organizations (MPOs), and federalagencies providing broad representation of the transportation planning and policycommunities. Significant effort was made to include a full spectrum of policy,management, and front-line analysts who have extensive experience in answeringpolicy questions, supporting the planning process, and responding to federal reportingrequirements.
CONFERENCE FORMAT
Working Groups
Each of the conference participants was assigned to one of six working groups. Theassignments ensured that each group was geographically and institutionally diverse.Each of the six groups addressed the same set of six data issues during each of threedifferent breakout sessions, applying a different context during each session. Thegroups were each led by the following moderator-facilitator teams made up of an MPOrepresentative and a state DOT representative:
Prepublication Copy: Uncorrected proofs Page 7
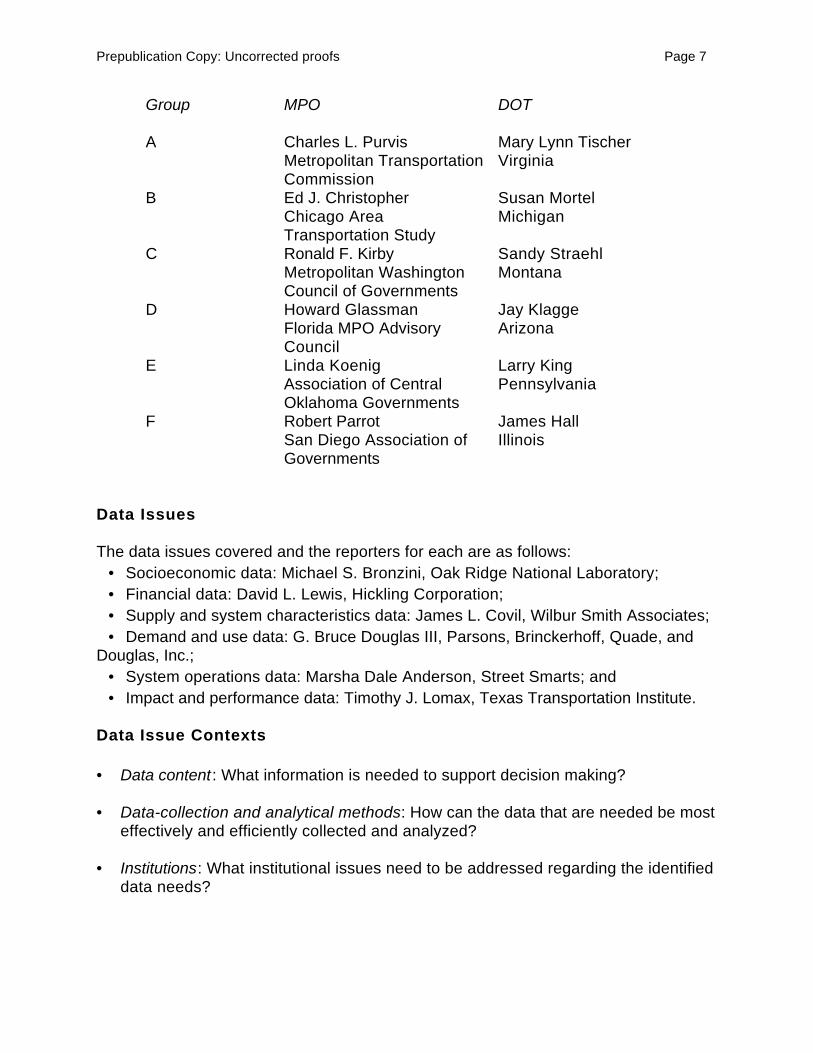
Group MPO DOT
A Charles L. Purvis Mary Lynn TischerMetropolitan TransportationCommission
Virginia
B Ed J. Christopher Susan MortelChicago AreaTransportation Study
Michigan
C Ronald F. Kirby Sandy StraehlMetropolitan WashingtonCouncil of Governments
Montana
D Howard Glassman Jay KlaggeFlorida MPO AdvisoryCouncil
Arizona
E Linda Koenig Larry KingAssociation of CentralOklahoma Governments
Pennsylvania
F Robert Parrot James HallSan Diego Association ofGovernments
Illinois
Data Issues
The data issues covered and the reporters for each are as follows: • Socioeconomic data: Michael S. Bronzini, Oak Ridge National Laboratory; • Financial data: David L. Lewis, Hickling Corporation; • Supply and system characteristics data: James L. Covil, Wilbur Smith Associates; • Demand and use data: G. Bruce Douglas III, Parsons, Brinckerhoff, Quade, andDouglas, Inc.; • System operations data: Marsha Dale Anderson, Street Smarts; and • Impact and performance data: Timothy J. Lomax, Texas Transportation Institute.
Data Issue Contexts
• Data content: What information is needed to support decision making?
• Data-collection and analytical methods: How can the data that are needed be mosteffectively and efficiently collected and analyzed?
• Institutions: What institutional issues need to be addressed regarding the identifieddata needs?
Prepublication Copy: Uncorrected proofs Page 8
CONTENTS
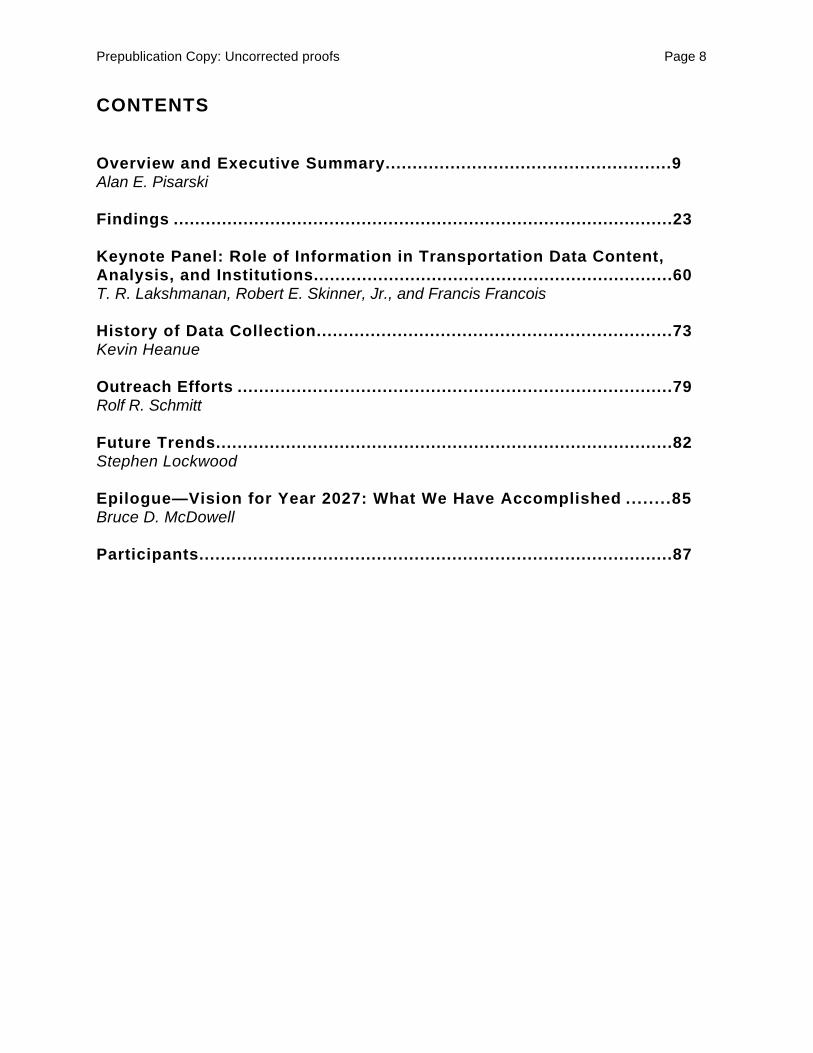
Overview and Executive Summary.....................................................9Alan E. Pisarski
Findings .............................................................................................23
Keynote Panel: Role of Information in Transportation Data Content,Analysis, and Institutions...................................................................60T. R. Lakshmanan, Robert E. Skinner, Jr., and Francis Francois
History of Data Collection..................................................................73Kevin Heanue
Outreach Efforts .................................................................................79Rolf R. Schmitt
Future Trends.....................................................................................82Stephen Lockwood
Epilogue—Vision for Year 2027: What We Have Accomplished ........85Bruce D. McDowell
Participants........................................................................................87
Prepublication Copy: Uncorrected proofs Page 9
Overview and Executive Summary
Alan E. Pisarski
More is expected of transportation today than ever before. Its roles and functions aredirected at multitudes of social and economic goals. Local and state officials needaccess to increasingly diverse and complex information for transportation decisions.Yet there is greater focus on economy in current data-collection practice than everbefore, and many traditional sources of transportation data, such as the decennialcensus and the Highway Performance Monitoring System (HPMS), are coming underclose scrutiny. An immensely talented and disciplined group of transportationprofessionals was assembled for the Conference on Information Needs To SupportState and Local Decision Making into the 21st Century to address the conundrum ofhow to obtain the right data for state and local decision making without adding to thedata-collection burden on states and metropolitan planning organizations (MPOs). Thechallenge was to maintain focus on a topic that is almost unlimited in its scale andscope.
The conference was in fact the first of what will clearly need to be a series of manymeetings to deal with state and MPO data needs. Many of these will be specialtyconferences at which the expertise is made available to address specific subjects ingreat detail. Many specialty events, such as the Census 2000 conferences, the HPMSreview process, the metropolitan environmental data needs conferences, and thediscussions on the North American Free Trade Agreement (NAFTA) cross-borderfreight statistics, have already occurred and will continue in the future. This conferenceon state and local information needs provides a framework, a context, for those otheractivities. The observations and proposed directions that have resulted will providebroad guidance for priority setting at future conferences and for demarcating theboundaries of research efforts to come, establishing the agenda for state andmetropolitan transportation data collection far into the next century.
First, a note is in order about the nature of “findings.” Participants at this conferencerepresented a diversity of views from data users across the transportation community.Given this broad range of perspectives, the observations and suggestions voiced atthe conference were varied and sometimes even at odds. Accordingly, the findingsreported in these proceedings represent a selection of the large number ofobservations that were aired and discussed at the event. This selection represents theconference steering committee’s view of concerns and findings that were widely heldand characterized by many participants as critical. The findings are not, however,“consensus” findings or recommendations of all the participants and should not beconstrued as such.
The role of technology in changing how data are collected, manipulated, displayed,and disseminated will become increasingly important and dramatic in transportationdata collection. Conference participants conveyed a strong sense that thetransportation industry is on the cusp of a revolution in data-collection methodologiesthat will produce needed data faster, more inexpensively, and with less intrusion on
Prepublication Copy: Uncorrected proofs Page 10
respondents. Old methods, such as mail-out paper questionnaires, although not madecompletely obsolete by current technology, are thought to be largely replaceable bydigital means that use electronic surveillance technologies, administrative records,and computerized instrumentation. Intelligent transportation systems (ITS) areforeseen as playing a strong role in these developments. These new tools will createnew opportunities in terms of speed and efficiency and also create new issues, suchas concerns about privacy and the loss of special data because of changes intechnological methods. Several of these issues are treated in detail in the section onfindings.
One of the key terms today in most discussions about transportation isglobalization, which refers to the international economic forces that affect even themost local of issues and decisions. This aspect of transportation today has spawned anew or expanded role for central statistical agencies: state and local agencies needthe input of an agency or agencies that monitor world trends in economics,demography, and technology and that can interpret these trends and describe theirimplications for local policy and planning. Groups such as the American Association ofState Highway and Transportation Officials (AASHTO) and the Association ofMetropolitan Planning Organizations (AMPO) will also have a role in interpreting anddisseminating these trends from the perspective of their members.
Not surprisingly, the call for “more data” was heard again and again. Although thisclamor can be interpreted simply as evidence of the insatiability of “data junkies,”conference participants repeatedly spelled out the increasing pressure on thetransportation community to support a host of societal goals while minimizingunintended consequences. Evidence of new goals—such as welfare reform and newenvironmental standards for particulates—arose at the conference. Each of thesegoals and prospective outcomes needs to be anticipated, described, forecast,measured, monitored, and reported either to meet federal, state, or local requirementsor to inform constituencies, stakeholders, and investors.
Participants were nearly unanimous in their views on their relationships to thefederal government. The word “partnership” was often used to describe the nature ofthe new role in data collection and other statistical relationships between levels ofgovernment. The traditional model, in which the federal government sets rules andmandates for required data-collection processes, was widely agreed to be outdatedand no longer workable. A new future was foreseen, built on collegial agreementsabout goals and shared effort based on a “bottom-up” process rather than a “top-down” system. Participants recognized that achieving this vision of a new professionalstructure for transportation data collection will require significant effort on the part of allinvolved and will not be accomplished without dedication and cooperation.
UNANTICIPATED OUTCOMES
The nearly uniform views among state and metropolitan officials regarding data needs,problems, and opportunities were, perhaps, a surprising outcome of the conference.The conference steering committee went to considerable pains to ensure that theseparate needs of MPO and state representatives would be representedindependently and that the conference would not be a zero-sum game, one in which
Prepublication Copy: Uncorrected proofs Page 11
one group could only gain at another’s expense. In conference preparations thesteering committee even considered an option in which state and local officials wouldcaucus separately to consider shared issues and problems. This option was presentedto the assembly, but because compelling separate needs did not exist among theparticipants, no interest in individualized sessions materialized.
Arguments for ending certain kinds of data collection brought forth the point thatlegislatively based requirements, which drive the work programs of states andmetropolitan areas, specifically or implicitly mandate much of current data collection.Data are seldom collected experimentally or because the information is of the “nice toknow” variety. There was much research-based data collection in the earlydevelopment of the modern transportation planning process, but such data collectiontoday is rare compared with that for operational or planning needs. Current datacollection is also more limited because of the high costs of collection and thestringencies of data-collection budgets. It would be necessary to terminate thelegislated mandates before the data requirements could be abolished.
Many participants voiced concerns about data budgets. Data collection takes alarge share of planning and policy budgets in both states and metropolitan areas.These costs place pressure on data analysis resources as well as on other planningactivities. The focus for future collection methods will be on reducing the costs andimproving the speed of collection rather than on reducing the quantities of datacollected. Increased efficiency in collection was recognized as the best mechanism forreducing the share of agency budgets going to data collection.
An important factor in the ability to control the scale and costs of data collection, ascited by a number of participants in different contexts, is that public policy concernstoday and in the future will frequently target the needs of smaller target populationsrather than the broad needs of the total population. Such groups as householdswithout vehicles, transit or bicycle users, racial and ethnic minorities, or those onwelfare will be the focus of policy and planning response. These groups are oftenlimited in number in the population and may be difficult to access, measure, anddescribe with statistical quality. For example, in a survey population of 1,000 work-triprespondents, there would be about 50 transit users and about 5 bicycle users.
The advent of the Internet and the increasing ease of data transfer gave rise tomuch closer treatment of subjects such as data sharing. The sense of the group wasthat economy of effort comes about by using all sources as effectively as possible. Thismeans ensuring, by the most effective means possible, that newly developed data aremade broadly available, that others with whom data might be shared are aware of newsources, and that access to information is pervasive and effective. Coordination of datasharing was seen as a strong federal or nationally centralized responsibility.
The interest in other sources of data also emphasized more strongly than in thepast the need for greater definitional compatibility among data sets and the greaterneed for statistical standards and adequate descriptors of data quality. Discussionsand suggestions related to mechanisms for standardization of definitions, procedures,and documentation were forthcoming in several sectors. In particular, agreed-upondefinitions were believed to be critical for the early development stages of ITStechnologies. The upcoming era of greater data interdependence will generate new
Prepublication Copy: Uncorrected proofs Page 12
responsibility for coordination and compatibility, again identified as a centralized,nationwide role.
This quality of interdependence affected the organization of the conferencefindings. The findings on data content do not always concisely differentiate among theareas. Socioeconomic areas overlap those on demand and use, system operationsareas overlap those on supply and system characteristics, and several categoriesoverlap the impact and performance category. These demarcations are not critical tounderstanding the overall set of findings. There is a further potential for overlapbetween the findings on data methods and those on institutions, and the boundarieshere are often unclear as well. Many of the methodological issues will requireinstitutional innovation as well as technological innovation. As a general guide, if aproblem is of a substantive nature and could be resolved by research, it is consideredmethodological in character; if it requires government agencies or private players towork out new arrangements for joint efforts, it is deemed to be institutional. Grey areasabound; for example, working out ways to use ITS data capabilities to meet the needfor planning data will almost certainly involve a combination of methodological andinstitutional changes.
A welcome surprise, recognized only in retrospect after several days of seriouswork, was that the whole conference period was characterized by a certain buoyancy.There was a wealth of optimism and excitement about the future and about the abilitiesof the transportation profession to respond to the needs that the future will bring.
MAJOR FINDINGS
In the following sections, the major findings of the conference, reflecting a selection ofthe observations presented at the event and the steering committee’s ordering of major concerns expressed by participants, are presented in italics and followed insome cases by explanatory material. These findings transcend specific subject areasand have broader impacts or applications. The classification of these items may differslightly from that in the Findings section of these proceedings, which was organized forease of reading. The findings appear in three categories based on the conferenceprocess: content, methods, and institutions.
Although overlap was inevitable, the three categories indicate a greater degreeof emphasis on, respectively, the what, the how, and the who of a specific data need.Proposed approaches to methods and institutional arrangements often converged.
This overview is followed by the detailed Findings section, which containsobservations from among those aired during the working sessions. Severalpresentations from the conference conclude these proceedings.
Content
Questions of data needs are always difficult to classify and summarize. There was anoutpouring of data needs at the conference, much of which reaffirmed past needs insometimes modified form. Those for improved collection and use of traditional data areidentified as baseline needs. Many of the needs expressed were new and associated
Prepublication Copy: Uncorrected proofs Page 13
with developing trends or new policy concerns; these needs for collection and use ofnew data items are classified here as emerging needs.
Socioeconomic Data: Baseline Needs
Basic federal socioeconomic data continue to be necessary, including basic data-collection programs (such as the decennial census in its complete form, the ConsumerExpenditure Survey, and the Commodity Flow Survey); federally sponsored state-level data collections such as employment statistics; key indicator estimation programssuch as the Consumer Price Index; and compilations such as County BusinessPatterns.
Census data remain critical as a tool in transportation decision making. Thelong-form survey should be continued for 2000, and the Bureau of the Census wasencouraged to solicit the input of its federal, state, and local transportation customerson instituting continuous measurement of census data elements.
The Nationwide Personal Transportation Survey (NPTS) should be structured to allow MPOs to assist in increasing sample size and adding questions for their areas.Currently, NPTS data are not available in sufficient geographic detail.
The federal government and the states could help make employment recordsmore readily available to MPOs and, if necessary, obtain any additional data requiredto make site-level information available.
Socioeconomic Data: Emerging Needs
Welfare reform is expected to affect travel demand significantly, and the success ofwelfare reform depends in part on transportation. Data that could serve to forecast thiseffect are lacking. Variables such as race, income, and education should beincorporated into travel demand models and other analytical components of thetransportation planning process.
Better data are needed to identify relationships between economic productivityand transportation investment.
Data on trade and tourism, including transportation characteristics such asmodes used, are needed to examine the impact of international activity on states andlocalities. Especially needed are data on trade among the North American Free TradeAgreement (NAFTA) partners. Data on supporting infrastructure, such as internationalport and airport facilities and warehousing, are also needed.
Better data should be obtained on the relationship between land use and bothtransportation demand and investment.
Financial Data: Baseline Needs
Credible estimates of income and clear, accurate information on revenue sourcesshould be determined for states and metropolitan areas. Forecast horizons, riskassessments, and project cost estimates should be more realistic. Past revenueforecasting problems should be documented and the investment community should
Prepublication Copy: Uncorrected proofs Page 14
be engaged in investigating how to better meet the needs of the federal, state, andlocal transportation agencies in this area.
Among the key inputs suggested to improve state and MPO forecasts areearlier provision of forecasts of expected financial aid from the federal government.
Financial Data: Emerging Needs
Research was suggested on the economic value of the transportation system,described as a capital stock measure at present and potential capacity and includingthe lease or sale value of rights-of-way.
Financial forecasting would greatly benefit from better fleet data, including thevalue and number of privately owned vehicles and the size and capital value of state,local, and transit authority vehicle fleets.
Unneeded Data
The area of financial data was one of the rare ones in which unneeded data wereidentified. The sense of those who felt burdened by reporting requirements was that data requirements on federal project forms should be streamlined. It was believed thatmuch of what is currently called for is not needed.
Supply and System Characteristics Data: Baseline Needs
States and MPOs need a variety of data on the extent, capacity, condition, and otherphysical characteristics of all components of the transportation system, including links,terminals, and other supporting facilities for all modes.
The HPMS program review is a useful exercise and should be continued. TheSection 15 reporting requirements for transit systems should be reviewed. On thebasis of these reviews conducted in cooperation with data providers, the federalgovernment should revise these requirements to be more responsive to state and localneeds and input.
HPMS and Section 15 data have value at the local and state levels. Greaterinvolvement of the states and MPOs, as both collectors and users of the data, wouldhelp ensure quality. The U.S. Department of Transportation (DOT) was urged to reviseHPMS requirements with state, MPO, and local input and to ensure that the revisionsallow use of existing state and MPO data. The MPO preference is for a bottom-up,consistent, and standardized scheme for compiling HPMS data. Privatization of HPMSand Section 15 reporting might also be feasible, and it was suggested that thispossibility be researched.
Standard methods should be facilitated for flexible collection of data onpavement and intermodal system deterioration. A partnership between AMPO andAASHTO is essential to developing a needs-based, multiuser inventory that is usefulto states and MPOs, not just to the federal government.
Several data needs were placed in the context of a desired, readily available,nationwide transportation facility and service data base with a geographic accuracy
Prepublication Copy: Uncorrected proofs Page 15
typical of maps of 1:100,000 scale or more detailed, covering all urban and rural areasof the country.
Supply and System Characteristics Data: Emerging Needs
A substantial array of data needs were identified with regard to linking system datawith data on system use and surroundings, including such information as commodityand passenger flows linked to individual transportation facilities.
The data refer to obtaining information on the condition of the facility itself, thecharacter of transit and private-vehicle service conditions on the facility, andinformation about the characteristics of the surrounding area.
Demand and Use Data: Baseline Needs
Data on the demand for and use of transportation should support multimodal planningand cross-modal comparisons. Such data should provide information about the scaleand character of passenger and freight demand by socioeconomic populationcategories and economic establishments. These data should also permit assessmentof demand at national, regional, and local levels and should provide for the calculationof corridor-level throughput.
Much of the demand and use data traditionally collected is still needed.However, origin-destination data should be of higher quality and should be collectedat a greater level of geographic and temporal detail. Specific data needs relating togeneral system use were identified in detail, including origin-destination patterns oftravel and goods movement by type of facility and mode.
Demand and Use Data: Emerging Needs
Data should be gathered on the effects of strategies to influence system use. Suchstrategies include traveler information, transportation system management (TSM), andtransportation demand management (TDM).
More and better data should be collected on “special generators,” includinghospitals, sports events, airports, and tourist attractions to identify effects on traffic ofspecial events by type and size of event.
Freight demand data have been neglected in transportation planning. Increased just-in-time freight deliveries and the impact of international trade on allsectors of the economy demand greater focus on freight data needs.
System Operations Data: Baseline Needs
System use and performance measures should be based wherever possible on dataobtained efficiently and unobtrusively from traffic operations systems. In particular,operations data should be used to measure system reliability and congestion.
Prepublication Copy: Uncorrected proofs Page 16
All levels of government should cooperate to develop a definition of highwayreliability, and the states, MPOs, AMPO, and AASHTO were widely viewed as thelogical leaders to collect data on reliability.
A pilot study should be conducted to collect and analyze data on systemdowntime, which are needed to make investment decisions and evaluate economicdevelopment plans, and data that describe the impact of downtime (e.g., wintersnowstorm recovery in the Northeast) on economic activity, particularly because just-in-time freight delivery is becoming more prevalent. DOT the logical agency tospearhead this effort.
Currently there is no single agreed-on measure for congestion. Better datashould be collected to promote the understanding of congestion and develop commonmeasures and definitions.
System Operations Data: Emerging Needs
Data are needed to evaluate responses to scheduled disruptions (such asconstruction) or unanticipated incidents (such as accidents). Information is needed ontraffic impacts and other characteristics during construction periods or catastrophessuch as bridge failures, as well as information on the effectiveness of otheroperational responses.
Just-in-time freight activities create new operations issues and data demands.Questions need to be answered concerning typical turnaround time at marine and airterminals and factors affecting choice of routing for commercial shipments.
Impact and Performance Data: Baseline Needs
MPOs and state departments of transportation should collect performance and impactdata to be fed back into the system design and transportation improvement process.The system should be measured in terms of overall performance and systemperformance for the user (i.e., user perception of performance). Political leadersshould be asked what performance indicators most interest them as well as how dataon performance can be presented to them in understandable ways and integrated intotheir decision-making process.
Measures of customer satisfaction should be developed and integrated intosystem performance evaluation, particularly user perceptions of the reliability of thesystem and reactions to variability in travel times and quality of trips. Data on speed,safety, and cost across roads and modes are consistently needed to provide a basisfor evaluating the transportation system’s success in serving the user.
A lexicon of definitions of accessibility and mobility should be compiled, takinginto consideration what definitions are likely to be easily understood and used bydecision makers.
Better data should be obtained to evaluate the extent to which the transportationsystem provides access to employment, services, and recreation, as well as theconnection between access to all transportation modes and neighborhood character(i.e., aesthetics, noise levels, safety).
Prepublication Copy: Uncorrected proofs Page 17
More data should be collected to determine the effects on the economy at thenational, state, and regional levels of all decisions affecting the transportation system,including investment, lack of investment, system changes, and service changes.
Better data on the security and safety of the transportation system should becollected.
More and better data should be gathered to evaluate the effect of thetransportation system and decisions affecting it on the environment, particularlyaccurate emissions data for all relevant modes. Data also are needed that measurethe transportation system’s energy use and energy consumption by type of user.
More and better data should be obtained that describe the effects of thetransportation system on communities, urban form, and populations.
Methods
Customer focus should be strengthened.Customer focus involves interaction among transportation data providers, users,
and decision makers. Data providers must improve their understanding of (andresponsiveness to) the needs of data users. Data users must become smartercustomers, understanding better what data providers can do and helping providersdesign and defend their data programs. Data users must also better understand theneeds of their customers, the transportation decision makers, to better define whatdata to collect, what models to develop, and how to show results in the most effectiveforms.
To the extent that agencies seeking or requiring information understand theimportance of involving data producers in discussions of what type of data should becollected and how, the end-use data will be strengthened. The criterion for successfuldata activity is its relevance in the context of a broad canvas of community desires. TheTransportation Research Board (TRB) was often named as the lead agent forconvening research and discussion on information pertaining directly to transportationagencies’ mission in serving the customer, such as travel comfort, system damage,safety, and delay data.
Data professionals were urged to learn about, use, and improve on recognizedmethods for discovering and measuring customers’ needs and attitudes. Focus groupsand surveys were often mentioned as valuable means for collecting the views ofsystem users. Demonstrating the value and relevance of data was considered crucialto continued success with this audience, particularly at the local level, as concerns forindividual privacy become more prevalent and as funds for data activities becomemore scarce.
States and MPOs should pay closer attention to how information is presented tothe public and to officials.
Many problems faced by transportation data professionals are rooted in theinability to display data in clear, concise, and compelling ways to decision makers,rather than in the data issues themselves. Geographic information systems (GIS),graphics, and other communications tools are important assets.
Prepublication Copy: Uncorrected proofs Page 18
Profiles of innovative state and local practices should be synthesized.Throughout the conference, participants cited the Cooperative Research
Programs of TRB as the natural mechanisms for compiling national profiles of methodsthat work for data collection, analysis, and dissemination and for identifying currentinnovative practices. A special effort within the National Cooperative HighwayResearch Program (NCHRP) and the Transit Cooperative Research and DevelopmentProgram (TCRP) focused on data and data development would be desirable.
The Bureau of Transportation Statistics (BTS) and its partners on the FederalGeographic Data Committee should continue to work with other DOT officers, states,MPOs, and industry groups to implement and maintain the nationwide geographicdata base for transportation. Federal agencies should work with state and localpartners to develop common formats and definitions for geographic data, to sponsorresearch on improved methods of geographic data integration, and to support stateand MPO efforts to build and update the national picture with local data.
Fiscal constraints on data budgets prompted participants to turn their attentionto the economies that new technologies can yield for data activity, including fasterexchange and the ability to relate and more easily synthesize or compare differenttypes of information. The costs and challenges of these still-new approaches werealso weighed: one suggestion was that NCHRP study the costs of creating a GIS database of transportation systems that would include both state and metropolitan data; itwas also suggested that NCHRP produce a synthesis of successes and failures todate.
The role of the federal agencies would be to coordinate with state and localgovernments to maintain and update the system, to explore an ITS connection, and tolook into funding for state and local transitions from their current GIS systems to anational version. All levels of government should cooperate with the private sector(especially freight organizations) with regard to data that are needed for the nationalGIS transportation data base. For example, it was suggested that all levels ofgovernment coordinate with public and private rail agencies to develop a data base ofrailroad crossings and add it to the GIS data base.
Public and private agencies at all levels of government should participate inensuring that ITS and other information-intensive technologies contribute high-quality,usable data for transportation planning.
Almost all advanced information technologies pose both opportunities andsignificant challenges for data producers and users. Much attention is being devotedto the potential of ITS for improving the efficiency and performance of state andmetropolitan transportation systems. These emerging technologies also haveprofound implications for data collection, storage, and distribution to meet their ownneeds as well as for other applications. Capturing and sifting the vast amount of dataproduced through ITS to obtain those data sets of value to public policy and planningwill be a significant challenge.
Prepublication Copy: Uncorrected proofs Page 19
Research on methods used by states and local governments to forecast orestimate transportation revenue from all sources (federal, state, local) for planning,programming, and cash flow management should be enhanced, including how stateshandle risk and uncertainty.
Reliable revenue forecasts are critical to compliance with financial constraintrequirements on state and metropolitan planning under ISTEA. An important aspect ofsuch forecasting is credible risk analysis of uncertainties. “Cost creep”—the expansionof project scope to incorporate ancillary elements—is a part of risk assessment thatneeds to be addressed.
TRB was named as a possible facilitator of research into this issue. It wassuggested that NCHRP conduct a research project on revenue forecasting methodsused by states and local governments, including the handling of risk and uncertainty.The TRB Committee on Finance was encouraged to compile sources and methods forrevenue source forecasting, building on existing work.
MPO and state efforts to develop methods for substate financial forecastsderived from higher-level forecasts (i.e., “step-down forecasts”) should be coordinated,perhaps by AMPO and AASHTO.
The continuation of the decennial census short and long forms in 2000 isimportant to transportation planning and should be supported.
Federal funding limitations for census activities were recognized to be barriersto obtaining extremely detailed data. However, much is at stake for all organizationsinterested in sound data.
The BTS-sponsored study by TRB on changes needed to transportation modelsand other analytical methods should be expanded, perhaps as part of the TravelModel Improvement Program. A major goal of the new joint effort would be adaptingthese methods to use continuous measurement of census data instead of a singleestimate each decade.
Research should support the development of analytical tools for state andmetropolitan transportation planners to use and evaluate data from a continuous-measurement program produced by the Bureau of the Census (i.e., the AmericanCommunity Survey), instead of a single decennial cross-sectional census. Potentialresearch into such tools could be conducted as part of NCHRP or by universityresearchers.
AASHTO and AMPO are in a position to foster improvements to Census 2000,such as faster results, more detail, and better-quality data.
States and MPOs should work with DOT to develop methodologies,performance measures, analytic tools, and techniques to help assess the contributionsto and impacts of transportation on quality of life (both personal mobility and otherimportant goals of community life).
Cross-modal system performance measures that address societal, economic,and other broad goals are critically needed to take transportation decision makingbeyond costs to real choices. Access and mobility are particular areas of interest.Because social equity is of increasing concern in transportation, measures to addressthis issue are critical.
Federal support is needed to study the comparability of system performancedata across modes, with periodic updates to suggest ways of improving comparability.
Prepublication Copy: Uncorrected proofs Page 20
Research and assembly of profiles on state and local practices should focus on whichmeasures of performance make sense. Measures of reliability, delay, systemperformance by time of day, and the impacts of maintenance and construction are alsoneglected areas. Research is also needed on methods and data collected to developperformance measures that are better oriented toward customer needs.
One aspect of research on performance measures could be cognitive researchon their comprehensibility to decision makers and the public. The question arose, Isthe level-of-service measure easily understood, or are the more esoteric measuresequally valuable and understandable? Are performance measures at too broad ageographic level (areawide measures) to be sensitive to changes in transportationimprovements?
Research or a pilot project should be conducted on the creation of subareaemployment data sets, methods, federal data enhancement, and private sourceacquisition and use. A collaborative effort could be launched by BTS, TRB, DOT, andthe U.S. Department of Labor. Market research models, institutional data sharing, and“piggybacking” on existing survey instruments should be encouraged to increase theavailability of detailed employment data without adding significantly to the collectionburden.
The implications of disaggregated data for transportation could be evaluated bystate departments of labor and the Bureau of Labor Statistics (BLS). Trade-offsbetween the need for detailed data on employment at small-area detail and the needfor protection against disclosure of sensitive data should be addressed in a way thatpermits more effective public data sources to be created.
Federal, state, and local transportation agencies should develop a consensuson the principles of full accounting for transportation costs. A peer review of currentmethods of full-cost analysis should be conducted as well as of the principles andinformation on full-cost accounting approaches to include social, economic, andenvironmental considerations and the needs of both system users and nonusers.Information on how to measure and quantify quality of life and the transportationsystem’s impact on it could be monitored, synthesized, and disseminated by DOT.
This issue is of particular concern with regard to existing facilities, which shouldbe evaluated as part of congestion management system analysis. Proposed projectsare generally evaluated through an environmental impact study or major investmentanalysis. Environmental analysis should take a long-term view, and relevant data arenot now collected.
Institutions
Partnerships are needed to create win-win relationships between data gatherers anddata users, both among jurisdictions and between the public and private sectors.
Data need ownership, care, and feeding, but convincing various jurisdictions toaccept responsibility is a problem. Each level of government needs to define its role asa stakeholder in data management. The Texas Department of Transportation recentlyissued a statement of policy in this regard, which can be considered a model.
Data needs for the general good are especially vulnerable to becoming“orphaned” when private providers do not perceive the profitability of collecting and
Prepublication Copy: Uncorrected proofs Page 21
providing the data, and when no agency perceives the usefulness of the data for itsspecific jurisdiction.
The states and MPOs do not have the resources to investigate the full range of transportation data available. Although BTS does produce a data catalogue, theagency’s efforts in this area could be expanded and a compendium of secondary datasources added. Information on how to fuse secondary data and transportation datashould be included.
The public sector in transportation spends considerably less per professionalon providing access to data resources than many other sectors, including medicineand agriculture. Given the high value of data to the field, this situation ought to beremedied. A comprehensive catalogue of data sources is needed, but the sector’sneed goes beyond that, perhaps even to a clearinghouse that would store anddisseminate all publicly available transportation data, as well as provide technicalassistance to its customers. Any such effort should include points of contact for datasources to assist potential users in determining data quality.
BTS’s National Transportation Library could assign staff to be responsible forclearinghouse functions such as providing assistance in locating alternative datasources and distributing responsibility for acquiring, storing, and providing access todata. AASHTO and AMPO could provide clearinghouse functions with regard toinformation on institutional processes at state DOTs and MPOs, for example, detailingthe procedures used to develop performance measures.
A consortium of federal modal agencies and state, regional, and localtransportation agencies should be convened to determine key data elements,conventions, and protocols.
Differences in data-collection and analysis methods among transportationagencies at all governmental levels hinder the exchange of valuable information. It isnecessary that an effective coordination process for data exchange be created, onethat relies on common formats, flexibility, aggregation, sampling, and methods. Forexample, it would be helpful if all DOT surface transportation agencies had mutuallyconsistent financial data bases that incorporated standard items and accountingpractices.
DOT is the logical agent to provide guidelines for standardizing a variety of dataand data-collection methodologies, such as those pertaining to causal relationshipsfor safety, but the department should not itself establish standards.
BTS should relate local data over time by using compatible formatting andmeasurements for data sets collected at different times. The agency might alsodevelop a data dictionary for critical transportation inventory elements to enablebottom-up distribution of data elements for creation and maintenance of a baseinventory.
Federal agencies that collect and use data related to household and populationdata (e.g., census data and labor statistics) should be more responsive to state andlocal priorities and input.
BTS was encouraged to represent state and MPO needs to the federal agencyproducers of population, household, and labor data during design. Although collectionof basic census data is a federal responsibility, many participants believed that it wasextremely important for AASHTO and AMPO to have the opportunity to include state
Prepublication Copy: Uncorrected proofs Page 22
and local add-ons. State and local governments should support census programsdesigned to obtain local input.
Public agencies and private entities should increase coordination regardingdata access. Collaborative agreements with trade organizations could be useful to thiseffort, and cost sharing or purchase of data should be considered. Public-privatepartnerships and new institutional relationships should be explored for developmentand distribution of data.
The scarcity of resources for data led to numerous proposals for increasedattention to public-private partnerships, data sharing, and “piggybacking” of datacollection among public agencies.
It was suggested that BTS take the lead facilitating access to and use of privatedata through “win-win” arrangements such as buying or sharing data, partnering, andprivatizing collection, analysis, and storage.
Democratic access to data was discussed as an important federal enforcementissue. For example, several MPOs and states are frustrated at being unable to gainaccess to ES202 employment data. The federal government, which funds collection ofthese data through the U.S. Department of Labor, should also take a hand in ensuringaccess for states and MPOs. Federal guidelines and principles were suggested forbalanced public-private partnerships for data collection and dissemination. Severalparticipants believed that agencies should be more willing to purchase or trade betterpublic and private data. It was noted that many MPOs already purchase or barter data.
Partnerships with private data holders were considered by most participants tobe crucial to getting better data, particularly with regard to freight. However, thecompetitive environment among freight companies, and the attendant proprietarynature of their data, poses a significant obstacle to realizing this goal.
In the area of financial data, federally guided methods or institutionalarrangements were called for to provide specific information from the federalgovernment to states and from states to MPOs. It was urged that financial and supplyand system characteristics data be integrated and made available to decision makerswho participate in financially constrained planning.
To assist all data-collection efforts undertaken by state and local agencies, itwas suggested that these agencies develop partnerships with universities and privatecompanies, which might assist specifically in improving collection methodologies.
The Truck Inventory and Use Survey (TIUS) and the Commodity Flow Survey(CFS) should be used more widely. It would be helpful if BTS and the Bureau of theCensus could adapt the surveys to better meet needs at the state and MPO levels. Aworking group with national freight stakeholders could be coordinated by TRB, BTS,AMPO, and AASHTO, with the goal of sharing data and protecting confidentiality.
Urban freight movement is a neglected area of study, although it has becomeincreasingly important as the scope of long-range metropolitan planning hasexpanded to include private transportation operations. More attention is needed tothis topic. Among the subjects in need of research are estimation methods of expectedlevels of freight activity (by tonnage and other measures) at intermodal facilities.
International trade flow data are available, but are not being used efficiently.The national commodity flow survey is a recent effort that contributed to filling in theknowledge base about domestic trade. Methods to improve the use of global trade
Prepublication Copy: Uncorrected proofs Page 23
flow data are still needed. Also needed is national monitoring of freight technologiesaffecting port capacities.
A national freight working group could encourage better relationships betweenthe public and private sectors and open discussion of such key elements as how to getfreight flow information without jeopardizing the privacy of companies. Nationalassociations and federal agencies could work with national private-sector businesses(i.e., freight shippers and carriers) to determine their data needs from transportationagencies and what data sharing could be realized. Likewise, DOT should reviewexisting data sets to ensure accurate and usable freight data that are appropriatelyaggregated to support transportation planning and decision making at state and locallevels while maintaining private-sector confidentiality.
Agencies at all levels of government should step up efforts to address the linkbetween transportation and land use. Research into land use models should beimproved, and DOT is the logical agency to lead this effort.
The effect of transportation improvements on land use development and thelinkage between land use and transportation are long-standing concerns. Improvedland use models and performance measures may require data not collected today.
However, funding is scarce for land use modeling integration, which hampersMPO efforts to interface land use and transportation models. The traditional support bythe Department of Housing and Urban Development for land use modeling has beenlong gone and was never replaced. DOT should continue to emphasize therelationship between transportation and land use through its research and fundingpriorities.
FindingsDuring the working group process, a three-part framework was used to address theseparate but overlapping and interdependent contexts for data users: content,methods, and institutions. Each of these three categories shared the goal of improvingdata activities to support state and local decision making. However, each category haddistinct characteristics that called for it to be addressed somewhat differently than theother two.
Discussions of data content were characterized by brainstorming anddevelopment of wish lists for data-collection efforts, for which subsequent discussionsof methods and institutions clarified the priorities. Action items for methods andinstitutions that relate most directly to specific data topics are presented in the Contentsection.
Proposed approaches to methods and institutional arrangements oftenconverged. Both categories led workshop participants to devise solutions that cutacross several topic areas, with the potential to address numerous transportation dataneeds at the same time. Recommendations regarding methods involved significantchanges to collection, storage, analysis, and interpretation techniques. Also eligible forconsideration in this category were general proposals for synthesizing information,documenting state and local practices, and using technologies in new ways to
Prepublication Copy: Uncorrected proofs Page 24
generate, evaluate, or display data. Institutional recommendations highlighted theneed for significant leadership on a specific issue, a major shift in an institution’s roleor function, or creation of a new relationship between or among institutions.
As noted in the Overview and Executive Summary, the findings reported hereare a selection of the numerous observations and suggestions generated at theconference. The selection reflects the conference steering committee’s ordering ofcritically important concerns and recommendations that were expressed byconference attendees.
CONTENT
Socioeconomic Data
Conference participants generally agreed that most federal data efforts shouldcontinue and that states and metropolitan planning organizations (MPOs) should bemore closely involved in tailoring data activities to their tasks. Programs singled out asespecially important to transportation decision making include the following: • Compilations such as County Business Patterns, produced by the Bureau of theCensus; • Basic data-collection programs such as the decennial census in its complete form,the Consumer Expenditure Survey (produced by the Bureau of Labor Statistics), andthe Commodity Flow Survey (produced by the Bureau of Transportation Statistics); • Federally sponsored state-level data collections such as employment statistics;and • Key indicator estimation programs such as the Consumer Price Index.
Demographic s
The census and its companion, the Nationwide Personal Transportation Survey(NPTS), sponsored by the Federal Highway Administration and other U.S. Departmentof Transportation (DOT) modal administrations, were recognized as core programsamong federal data efforts. The impending shift from an extensive decennial census toannual surveys (i.e., continuous measurement, also called the American CommunitySurvey) could affect the characteristics of data collected to document changes inhouseholds, a category of data on which demands have grown as the goals oftransportation planning processes have broadened to include consideration ofindividual behavior, community character, economic effects of transportationinvestment, and environmental enhancement as well as mitigation. Demographic dataidentified as particularly crucial to transportation decision making are the following:
• Data on emerging and critical population subgroups, including the disabled, theelderly, those affected by welfare reform, immigrants, low-income households, andzero-vehicle households;
Prepublication Copy: Uncorrected proofs Page 25
• Household characteristics of nonpermanent-resident households (“snowbirds,”who move to warm climates in the winter; migrant workers; and students); and • Vehicle ownership and availability as household characteristics.
The increasing complexity of the state and local decision-making processes,coupled with technological advances such as geographic information systems (GIS),have prompted both a need and an expectation for greater geographic detail in thecollection and presentation of data. Yet these expectations must be met within thecontext of current government downsizing, federal budget constraints, and thechanging process for collecting census and other demographic information.Conference participants recommended combining a short federal form for collectingbaseline data with an option for state and local governments to add questions for afee. This approach could also work for the collection of other household data. Forexample, allowing the addition of questions to NPTS would enable states and localgovernments to collect additional data while reducing up-front administrative costs.Many participants suggested that the transferability of household travel demandinformation from the NPTS to local applications also be explored.
Migration and employment patterns are among the data elements for whichparticipants requested much greater geographic detail. Nontraditional data sources,such as chambers of commerce and tourist bureaus, can provide information on tripstaken by pleasure travelers. However, concerns exist about the availability and qualityof employment data in formats that will be useful for transportation decision making.For example, although welfare reform is expected to affect travel demand significantly,data for forecasting this effect are lacking. Specific employment data needs arepresented in the section on Economics.
Participants encouraged the Bureau of Transportation Statistics (BTS) torepresent state and MPO needs to the federal producers of population, household,and labor data during design of data-collection programs, including the AmericanCommunity Survey conducted by the Census Bureau. Although collection of basiccensus data is a federal responsibility, most participants believed that it was extremelyimportant for the American Association of State Highway and Transportation Officials(AASHTO) and the Association of Metropolitan Planning Organizations (AMPO) tohave the opportunity to include state and local add-ons. State and local governmentsshould support census programs designed to obtain local input. States and MPOswere generally considered to be jointly responsible for collecting non-census-relatedtransportation data.
Economic s
Globalization is prompting the need for analysis of international macroeconomic datato provide background for state and local transportation decision making. The federalgovernment was identified as the most appropriate agent for collection and analysis ofsuch data, but states and MPOs need ready access to this information because theyneed to know about shifts in global trade that might affect state and local transportationservices. Better data are also needed to identify relationships between economicproductivity and transportation investment, including the following:
Prepublication Copy: Uncorrected proofs Page 26
• Changes in patterns of building and development; • Tax data that reflect economic activity; • Military base abandonments and conversions and direct and indirect spending bythe military on communities; • Housing market data, such as housing costs; • Numbers of tourists and visitors, as well as location and time of visits and methodof travel; • Business establishment characteristics; and • Use of transportation investment incentives to support business locations.
Some conference participants called for data on trade and tourism to becollected among partners in the North American Free Trade Agreement (NAFTA), toexamine the impact of international activity on states and localities. Trade and tourismdata should include transportation characteristics, such as modes used. Data shouldbe obtained on supporting infrastructure such as international port and airport facilitiesand warehousing. Access to employment data is inadequate in most states, according to manyparticipants. Information that should be made more accessible by either the federal orstate governments, private companies, or both in partnership, include • Employment and worker characteristics by economic sector, worker residence,and place of work for small geographic units (i.e., traffic analysis zones); • Accurate and comprehensive geocoding of employment to traffic analysis zones; • Characteristics of multiple-job holders; • Labor force availability and wages; • Transportation-system access to employment opportunities; • ES202 employment data (e.g., employment estimates based on business taxrecords); • Shifts in population and employment, including changes in work location and workbehavior of the individual (e.g., telecommuting responses); and • State-level employment and labor.
Land Use
The impact of transportation improvements on land use development and the linkagebetween land use and transportation are long-standing concerns. Although new datamay be necessary to improve land use models and performance measures,fragmentation of state and local responsibilities has hampered previous efforts atcoordination. Conference participants described the following land use data asimportant for transportation decision making: • Tax assessment data for base-year models;
Prepublication Copy: Uncorrected proofs Page 27
• Surveys of local land use policies; • Economic development plans; • Land use ratios for commercial, industrial, and institutional sectors per capita; • Suitability of vacant land for various purposes, as determined by policy, physical,and market criteria; and • Values of land overlaid against transportation improvements. The need to improve transportation models goes hand in hand with the need toprovide more and better land use data. Large MPOs were often seen to have a primaryrole, along with federal and state governments, in tying parcel-level land use data totransportation models, especially in matching the models with data and format.However, funding is scarce for land use modeling integration, which hampers MPOefforts to interface land use and transportation models. Despite these difficulties, model capabilities and data availability are beingimproved in a parallel fashion at both the national and metropolitan levels. Anoverarching objective of these efforts is to capture trips that are hidden in traditionalorigin-destination analysis, especially errands and social activities that take place ontrips between work and home. Several MPOs (e.g., the Portland Metropolitan ServiceDistrict and the Puget Sound Regional Council) are shifting from fixed origin-destination models to activity-based models. Other MPOs have taken actions toimprove the linkage between data sets that are relevant to modeling. For example, theNorth Central Texas Council of Governments provides information on regional trafficpatterns and vehicle emissions in compatible data bases. DOT and the EnvironmentalProtection Agency (EPA) jointly sponsor the Travel Model Improvement Program(TMIP), which supports training and regional information centers for MPOs; dataresearch relevant to transportation, land use, and air quality modeling; investigation ofshort-term improvements to existing models; and longer-term development of newmodels such as the Transportation Analysis Simulation System (TRANSIMS).
Discussion of models at the conference generally concentrated on the “chickenand egg” dilemma: models designed around existing data often limit analysis to“working where the light is good,” whereas models designed around policy issueswithout concerns for existing data cannot be calibrated or substantiated. Modelerswere encouraged to join other data users in their dialogue with data providers toensure the development of new data resources to support new modelingrequirements.
Improvements in Socioeconomic Data
Demographics
[1] There was wide agreement that the long-form survey should be continued inCensus 2000, and that organizations at all levels of governments with a stake in soundtransportation data should support the efforts of the Bureau of the Census in this
Prepublication Copy: Uncorrected proofs Page 28
regard. The Bureau of the Census was encouraged to seek the input of its federal,state, and local transportation customers in instituting continuous measurement.
[2] BTS should continue to be diligent in protecting state and local needs for censusdata, particularly the data collected by the long-form survey. AASHTO and AMPO arein a position to foster improvements the Census 2000, such as faster results andbetter-quality data.
[3] The BTS-sponsored study by the Transportation Research Board (TRB) on changesneeded to transportation models and other analytical methods should be expanded,perhaps as part of TMIP. A major goal of the new joint effort would be adapting thesemethods to use continuous census data instead of a single estimate each decade.
[4] MPOs need to be more closely involved in obtaining, correcting, and gainingaccess to detailed addresses for use in Census 2000. The Bureau of the Censusshould develop a new allocation method for nongeocoded addresses, assign land useclasses, and involve MPOs in solving address problems by identifying a sworn MPOagent to pinpoint local address corrections. Among the areas in need of additionalattention in Census 2000 are methods for reporting characteristics of households withmultiple residences. The Census Bureau should also provide better resolution of thePublic Use Microdata Sample (PUMS) and small-geography versions of the DataAccess and Dissemination System (DADS) and should provide custom cross-tabulations for small geography.
[5] Several steps could be taken to address the need for better data on populationshifts. First, BTS could undertake a national effort, perhaps in concert with U.S. tourismagencies, to develop a better definition of tourist activity (i.e., dynamics). Second,research should be conducted to develop a method for forecasting immigration andusing forecasts to measure expected state and regional impacts.
[6] The ability of states and MPOs to use NPTS as a data-collection mechanism shouldbe enhanced through strengthened support for add-on samples, as well as byallowing states and local governments to add questions of local interest. DOT is thelogical agency to lead this effort and to evaluate the cost-effectiveness of expandingthe NPTS to provide greater geographic detail. TRB or perhaps FHWA might reviewthe experiences of state DOTs and MPOs in adding samples to NPTS.
[7] The federal government and the states should help make employment recordsmore readily available to MPOs and, if necessary, obtain any additional data requiredto make site-level information available.
Small-area data such as those collected through the census PUMS files couldbe useful if they are made more widely available, and many participants advisedcollecting PUMS data for more areas and in more detail than before. The federalgovernment and state departments of transportation were also encouraged to facilitatedevelopment of a protocol for getting data from state employment departments.Federal leadership was widely viewed as key to helping labor and employment

Prepublication Copy: Uncorrected proofs Page 29
agencies understand the transportation need for such data. BTS was often urged toevaluate states with successful data-sharing programs for employment-site data toidentify best practices. AMPO and AASHTO were suggested as partners to work withBTS to investigate sources for this type of data and to improve intergovernmentalcommunication.
Economics
[8] Data on trade and tourism, including transportation characteristics such as modesused, are needed to examine the impact of international activity on states andlocalities. Especially needed are data on trade among NAFTA partners. Data onsupporting infrastructure, such as international port and airport facilities andwarehousing, are also needed.
[9] Macroeconomic and external factors drive changes in travel need. Someconference participants called for BTS to analyze background changes and their travelimplications and cited National Cooperative Highway Research Program (NCHRP)Project 2-20, Economic Trends and Multimodal Transportation Requirements, as astart. TRB was often suggested as the logical organization to synthesize profiles ofstate and local practice for short-term national forecasts and regional methods.
[10] There was strong support for DOT’s efforts to identify international trade corridorsand provide MPOs and states with access to analyses of global and macroeconomictrends affecting transportation.
[11] There was general agreement that the Commodity Flow Survey (CFS) wasimportant to transportation planning and should continue. Given the widely expressedconcern about the geographic detail of existing data, many participants specified thatthe states and MPOs should work with BTS and the Bureau of the Census to developcommodity flow data at the county level.
International trade flow data are available but many participants believed thatsuch data are being used inefficiently. Although the CFS contributed to filling in theknowledge base about domestic trade, methods to improve the use of global tradeflow data are still needed, as well as national monitoring of freight technologies thataffect port capacities.
[12] Research or a pilot project should be conducted on the creation of subareaemployment data sets, methods, federal data enhancement, and private sourceacquisition and use. A collaborative effort could be launched by BTS, TRB, DOT, andthe U.S. Department of Labor. Market research models, institutional data-sharing, and“piggybacking” on existing survey instruments should be encouraged to increase theavailability of detailed employment data without adding significantly to the collectionburden.
State departments of labor and the Bureau of Labor Statistics (BLS) couldcollaborate to evaluate the implications of disaggregated data for transportation. WithBLS, DOT was encouraged to build a workplace address file similar to the Master
Prepublication Copy: Uncorrected proofs Page 30
Address File that will be available to MPOs for review and correction. Someparticipants suggested that AMPO identify problems and potential solutions forcollection, correction, and access to addresses at the regional level.
Land Use
[13] Agencies at all levels of government should step up efforts to address the linkbetween transportation and land use. DOT could lead the way in developing researchto improve land use models and should continue to emphasize the relationshipbetween transportation and land use through its research and funding priorities.States were encouraged to form closer working relationships with local governmentsto develop a linkage model between land use and demographic forecastingprocesses.
[14] Pilot studies are needed on innovative data-collection methods for linking traveldemand (both passenger and freight) and system performance to land use. Forexample, land uses could be related by individual parcel, travel behavior, and tripgeneration (vehicle, pedestrians, total person-travel) for the development planningprocess. Methodologies for collecting data include loop detectors and observerscollecting passenger vehicle data. The FHWA project on average vehicle occupancymay be useful for improving the passenger data.
[15] BTS and TMIP were encouraged to develop guidelines for conversion from anorigin-destination approach to an activity approach to modeling and forecasting.Models should be developed and enhanced using more than the traditionalhousehold survey and methodologies. Other data could include establishment andactivity data to pinpoint the purposes of trips that start or end at places other than homeor work.
MPOs need assistance in adapting existing models and should be involved indeveloping a new modeling process as well as supportive tools such as surveys to tietravel measurement to measurement of daily activity.
Financial Data
Transportation decision makers need more financial information in a wider variety offormats than ever before: as inputs to major investment studies, to aid in analyzingalternative financing for transportation projects, and to forecast revenue that will beavailable for maintenance, system management, and new projects. The costs oftransportation to the user, the value of time, and the need to price transportationservices fairly are of concern in decision making.
Revenue Forecasting
Under the Intermodal Surface Transportation Efficiency Act (ISTEA), reliable revenueforecasts are critical to compliance with the requirement for fiscal constraint in state
Prepublication Copy: Uncorrected proofs Page 31
and metropolitan planning. An important aspect of such forecasting is credible riskanalysis of uncertainties. “Cost creep”—the expansion of project scope to incorporateancillary elements—is a part of risk assessment that many conference participantsbelieve needs attention.
Numerous conference participants cited the lack of credible, clear informationon revenue sources as a significant stumbling block for current financially constrainedtransportation planning processes. For example, many MPOs have difficulty estimating(or relying on local estimates of) transit revenues because subsidies, cost of operation,and prices that will affect transit revenue streams are driven by policy.
In several cases, revenue data could be improved by access to betterinformation earlier in the decision-making process: financial-aid forecasts from thefederal government are a key input, as are better estimates of local transportation taxrevenue and expenditures, and data on the suballocation of state resources fortransportation improvements. Several participants pointed out that data availability isonly a partial solution because data sets are not comparable and mutual trust is oftenlacking among key decision makers at all levels of government. A single, publiclyaccessible, national financial data set appeared on the wish list of several workinggroups, although with the acknowledgment that partnerships are crucial to realizingsuch an objective.
Data on current and long-range changes to the revenue stream are alsoneeded. For investments already made, participants called for clear measurements offinancial performance and data for fiscal management, including debt service, pay-as-you-go financing, and level of bonded indebtedness.
Specific data needs relating to revenue from taxes were identified as follows: • Truck registration data from the International Registration Plan (IRP) and truck usecharacteristics from the International Fuel Tax Agreement (IFTA); • Federal and state sales tax revenue; • Sales and fuel tax revenues by fuel type and changes to revenue with changes invehicle fuel economy; and • Expenditures on fuel taxes by businesses and households as a percentage ofincome, and other variables indicating the impacts of fuel taxes.
Specific data needs relating to revenue from other sources were identified asfollows: • Long-range substate-level financial projections; • Financial impacts of transportation system pricing (tolls, parking policies, and soforth); • Identification of finance streams to support maintenance; • Cash-flow prediction at all levels of government, including identification of currentand future revenue (needed for all levels of government); • Returns on different investment strategies, including tax increment, specialassessment districts, and developer impact fees;
Prepublication Copy: Uncorrected proofs Page 32
• Relationships of toll charges to revenues for both new and established facilities; • Carrier revenues; and • Data for toll facility analysis, including usage and the value of time.
Alternative FinancingAlthough decision makers are taking a closer look at alternative methods forsupporting transportation projects, such as toll financing and private development oroperation, the specific risks and potential benefits of these approaches are difficult topredict. Accurate forecasts of toll revenues are of particular concern to MPOs andstates. Cost-benefit data for these financing methods are needed, along with tools toassess the risks at which public funds may be placed. Transportation agencies wereencouraged to reach out to members of the private-sector financial community withexpertise in taxation and revenue estimation for assistance in devising methods andapplying them to toll revenue forecasting.
The impact of toll facilities on demand is also difficult to determine and deservesmore attention. Several current NCHRP projects address the costs of time, includingNCHRP Project 2-18 (2), Valuation of Travel-Time Savings and Predictability inCongested Conditions for Highway User-Cost Estimation. However, these studies donot focus on MPO-oriented needs regarding the value of time, and the work should beextended to reflect this consideration. In addition, information is needed on thefollowing elements: the impacts of different pricing on use and shifts in use of thesystem across all modes; innovative financing and new forms of revenue (e.g.,charges on telecommunications); and the state of the economy (this could perhaps beincluded through a set of adjustment factors for different trip purposes, economy, andmodes). Analysis of differential pricing options should consider who pays for travel(i.e., individual or company).
Other needs were identified as follows: • Data on the statutory limits on creative financing; • Comparison and feasibility analysis of public-private partnerships; and • Administrative costs associated with privatization.
Costs and Assets Cost and expenditure data should include • Capital and operating costs of maintaining and managing existing and futuretransportation systems; • Clear articulation of prices and costs for programs and services; • Costs for infrastructure imposed by development, such as water, sewer, and otherpublic services; • Data for life-cycle costing; • Right-of-way, construction, and raw materials cost estimates; • Capital costs; • Expenditures by all levels of government by highway functional class;
Prepublication Copy: Uncorrected proofs Page 33
• Expenditures by revenue source; • Data base on letting costs; and • Highway and other transportation cost allocations.
The fiscal value of the transportation system—including the lease or sale valueof rights-of-way—and the opportunity costs of delayed investments wererecommended for further research and documentation, as well as the value of publicand private fleets (e.g., public transit bus fleets, rolling stock, safety and public worksvehicles, and privately owned vehicles). Some participants recommended theinclusion of state DOT administrative costs (i.e., salaries and expenses) in the state-level assessment of system values and costs. Small-city and rural financial data forurban and rural allocations should also be included.
Conference participants acknowledged the need to include many morevariables in cost accounting than ever before, including quantified values for theenvironmental and social impacts of transportation decisions.
Although much new fiscal information is needed or new forms for existing datamay be called for, many conference participants agreed that the data on federalproject forms could be streamlined and that much of what is currently included is notneeded.
Improvements in Financial Data
Revenue Forecasting
[1] TRB was encouraged to review current methods used by states and localgovernments to forecast or estimate transportation revenue from all sources (federal,state, and local) for planning, programming, and cash-flow management, includinghow states handle risk and uncertainty. The study should document past problemswith revenue forecasting. The TRB Finance Committee was encouraged to build onexisting work to compile sources and methods for revenue source forecasting,perhaps engaging the investment community in investigating how to better meet theneeds of the federal, state, and local transportation agencies in this area of datacollection.
[2] Numerous participants suggested that AMPO and AASHTO coordinate efforts todevelop methods for substate-level forecasts derived from higher-level forecasts (i.e.,“step-down forecasts”).
[3] An NCHRP report was suggested on how public information campaigns affecttransportation revenue, financial operations, and budgets; and on ways to linkbudgeting and financing. Groups whose input would prove useful in preparing thereport include the National Governors Association, the National Conference of StateLegislatures, state treasurers, and the Government Finance Officers Association.
Prepublication Copy: Uncorrected proofs Page 34
Alternative Financing
[4] Reliable methods and accurate documentation for estimating revenue from tollprojects should be developed, including near- and long-term elasticity effects ondemand for the affected facility and the system at large.
[5] Greater attention should be paid to methods for analyzing fiscal risk in relation tothe use of private funds. A nationwide inventory could be conducted by TRB, DOT, theGovernment Finance Officers Association, or a consortium of the three, to determinethe effects of toll facilities on demand and revenue with comparisons of projected andactual demand and revenue.
[6] The financial impacts of alternative and innovative revenue sources should bestudied (e.g., weight-distance charges, toll roads, and charges for use of public rights-of-way and for use of air rights for telecommunications and fiber optics). The studyshould include an inventory of what is successful, what the most accurate measuresare, impacts of legislation, and the state of the art.
[7] Information on institutional arrangements for financial management of toll facilitiesshould be compiled, perhaps by AASHTO.
Costs and Assets
[8] Research was suggested on the economic value of the transportation system,described as a capital stock measure at present and potential capacity and includingthe lease or sale value of rights-of-way. The size and capital value of state, local, andtransit authority vehicle fleets should also be documented.
[9] Local and state governments should develop methods to identify reasons for costoverruns and should develop or participate in the development of an inventory of riskfactors in project costing.
[10] Citing the need for research into methods for collecting continuous information onthe costs of the transportation system (e.g., operational costs and capital improvementexpenditures and outlays), several conference participants suggested an NCHRPpooled-fund study in this area. A goal of the study would be to develop a data unit tomeasure per-mile actual costs by project.
[11] Federal, state, and local transportation agencies should develop a consensus onthe principles of full accounting for transportation costs. A peer review of currentmethods of full-cost analysis was suggested, perhaps under the auspices of TRB,which would lead to development of such principles to include social, economic, andenvironmental considerations and the needs of both system users and nonusers. Inaddition, some participants requested a national effort to monitor, synthesize, anddisseminate information on how to measure and quantify quality of life and the
Prepublication Copy: Uncorrected proofs Page 35
transportation system’s impact on it. DOT was suggested as the logical agency to carryout such an effort.
Partnerships
[12] Data on project costs and federal revenue should be made more widely availableto MPOs to assist them in developing financially constrained plans, transportationimprovement programs, major investment analyses, and so forth. TRB was urged tofacilitate cooperation among states, MPOs, and local governments to develop amethod for validating financial data, addressing the need for trust among all players.
Supply and System Characteristics Data
The transportation system is a collection of many components, including networks,facilities, services, and vehicles. The size, extent, connectivity, age, and physicalcondition of these components provide the basic description of the supply oftransportation for decision makers. Except for vehicle fleet data, most of thesecharacteristics can be measured for geographically specific facilities and links on thetransportation network.
Conference attendees emphasized that the transportation system to bemeasured included all modes of transportation, the linkages among the modes, andthe linkages between intercity and metropolitan systems. Attendees also emphasizedthat data should include both public and private transportation, reflecting the growingstate and local interest in freight transportation, which is dominated by the privatesector.
Network s and Facilities
Transportation networks—roads, pedestrian and bicycle facilities, railroads, pipelines,terminals, ports, and airports, maintenance facilities, and other physical manifestationson the landscape—are the most visible components of the system. Data needs relatedto this physical infrastructure were identified as follows: • Greater geographic detail about the location and connectivity of the transportationinfrastructure, including supporting facilities such as park-and-ride lots, rail-highwaygrade crossings, and data-collection sites (e.g., traffic counting locations); • Capacity and speed measures for the facilities and network links in the geographicdata base; • Operating restrictions, such as truck size and weight limits and passenger vehicleoccupancy restrictions, by time of day; • Tolls and other facility-specific charges; • Functional class and urban or rural class of each highway segment;
Prepublication Copy: Uncorrected proofs Page 36
• Frequently updated condition measures, particularly with regard to long-termpavement performance and deterioration rates, for bridges, arterial and local streetsystems, and other physical infrastructure; • Inventory of materials used in construction and maintenance; and • Information on jurisdiction to identify the agency or company responsible formaintenance and operation of the facility so that data on supply and cost can berelated.
Transportation Service The existence of physical transportation infrastructure is a necessary but not sufficientcondition for connecting locations: service must also be provided. Service is almostuniversal for private motorists and users of small trucks, but fewer roads can be usedby larger trucks. Except for charter service, most for-hire buses operate on fixed routeson limited portions of the highway network at certain times. Service on rail networksalso follows specific schedules and routes, usually constrained by ownership ortrackage rights. Geographically specific information on transportation service is thusindispensable to fully understanding the extent, connectivity, and condition of thesupply of transportation.
As identified by conference participants, specific data needs for transportationservice parallel those for transportation facilities and networks: location, connectivity,and capacity of public transit, passenger and freight railroads, waterborne commerce,air passenger and cargo networks, trucking, and intermodal services. Some services,such as paratransit, water taxi, and air taxi, must be measured in terms of areascovered instead of specific routes. In both areawide and route-specific service,connectivity and capacity must be measured by time of day.
Conference attendees widely recognized the importance of condition data,which are primarily related to the vehicles operated by the service provider. The needto identify transit and paratransit services operated in compliance with the Americanswith Disabilities Act was also stated.
ITS Infrastructure Conference attendees recognized the increasing importance of intelligenttransportation systems (ITS) to the operation of transportation facilities and services,as well as the value of ITS as a new data source. ITS infrastructure includes facility-specific control systems (such as freeway intersections with ramp meters) andcommunications networks that often parallel the transportation facilities and modesbeing served. Data on the location and other characteristics of ITS infrastructure musttherefore be linked with other geographic data on transportation infrastructure tounderstand the extent and effectiveness of ITS technology.
Linkages Between Transportation System and Areal Data
As described in the section on Impact and Performance Data, decision makers areconcerned as much with how the transportation system interacts with its surroundingsas with the system itself. To link data on the transportation system—including itsphysical infrastructure, services, and communications infrastructure—with data on the
Prepublication Copy: Uncorrected proofs Page 37
systems in surrounding areas, conference attendees recommended several steps,outlined in the section on Improvements in Supply and System Characteristics Data.
Vehicle Fleet s
Except for pipelines, transportation facilities and services require fleets of vehicles,trains, planes, and vessels to move people and goods. Several attendees emphasizedthe need for data on vehicle fleet sizes, characteristics such as age, and geographicdistribution. Support was voiced in particular for the Truck Inventory and Use Survey,which measures a variety of vehicle characteristics for commercial and private trucks,vans, and minivans. The need for similar data on other vehicles, such as buses andpublicly owned vehicles, was also noted.
Reassessment Several of the potential building blocks for the desired transportation data set—including the Highway Performance Monitoring System, the National Bridge Inventory,and the Section 15 transit reports—are being reassessed by federal, state, and transitindustry partners. Participants recognized that these reassessments are under wayand urged that the recommended changes to those federal reporting systems beimplemented.
Improvements in Supply and System Characteristics Data
Networks and Facilities
[1] A nationwide geographic data base was requested at a scale of 1:100,000 or more,identifying the location and connectivity of transportation networks and facilities—including highways, rail lines, bridges, bikeways, pedestrian facilities, pipelines,passenger and freight terminals, intermodal facilities such as ports and park-and-ridelots, supporting facilities such as transit garages, rail-highway grade crossings, anddata-collection sites such as traffic counting locations. BTS and its partners on theFederal Geographic Data Committee (including the U.S. Geological Survey) shouldcontinue to work with DOT’s other modal administrations, states, and MPOs toimplement fully this transportation data base, which can also be linked to areawidedata on population, economic activity, and the environment.
[2] States and MPOs should work with BTS and its partners to keep the nationwidegeographic data base up to date, especially with regard to condition measures,particularly for long-term pavement performance and deterioration rates; for bridgesand arterial and local street systems; and for other physical infrastructure.
Transportation Service
[3] Government agencies at all levels should consider geographic data ontransportation service, including service by the private sector and less conventionalservice such as paratransit, as integral to a full understanding of the extent,connectivity, and condition of the supply of transportation and to an understanding of
Prepublication Copy: Uncorrected proofs Page 38
how well the transportation system complies with special laws such as the Americanswith Disabilities Act.
ITS Infrastructure
[4] BTS and its partners on the Federal Geographic Data Committee could work withMPOs, the DOT Joint Program Office, and private groups such as ITS America todevelop agreed-on definitions of ITS infrastructure and services and to incorporate ITSinfrastructure into the nationwide geographic data base for transportation.
Linkages Between Transportation System and Areal Data
[5] Compatibility is needed between the geographic referencing system used to collectand publish census data—the Topological Integrated Geographic Encoding andReference (TIGER) system—and the nationwide geographic data base for thetransportation network. Several participants suggested that DOT and the Bureau of theCensus work together to create this interface.
[6] The populations, employment, and economic activities covered by transportationfacilities and services should be measured for geographic accessibility.
[7] Land uses and historic features in and along rights-of-way should be classified andinventoried.
Vehicle Fleets
[8] The Truck Inventory and Use Survey (TIUS) and the CFS should be adapted formore widespread use at the state and MPO levels. BTS and the Bureau of the Censusare the logical partners to carry out this task.
Reassessment
[9] DOT should continue the HPMS and Section 15 program reviews and shouldrevise these requirements to be more responsive to state and local needs and input.Many conference participants characterized the MPOs as preferring a bottom-up,consistent, and standardized scheme for compiling HPMS data. Privatization of HPMSand Section 15 reporting might also be feasible and should be researched.
Standard methods for flexible collection of data on pavement and intermodalsystem deterioration should be facilitated. A partnership between AMPO and AASHTOwas broadly viewed as essential to developing a needs-based, multiuser inventory formonitoring such data that would be useful to states and MPOs, not just to the federalgovernment. Integration of a single monitoring system was suggested, from whichusers could take the highway data needed.
Prepublication Copy: Uncorrected proofs Page 39
Demand and Use Data
Conference participants generally agreed that data on demand for and use oftransportation should support multimodal planning and cross-modal comparisons.Information about the scale and character of passenger and freight demand should bebroken out by socioeconomic population categories and economic establishments.Data bases on demand characteristics should permit assessment of demand atnational, regional, and local levels and should provide for the calculation of corridor-level throughput. Information on demand should also encompass unquantifiable data,such as impacts on land use of political influence and non-data-driven decisionmaking.
Much of the demand and use data traditionally collected is still needed. Inaddition, better quality is needed for traditional origin-destination (O-D) data, whichshould be collected at a greater level of geographic and temporal detail.
User Behavior and Characteristics
The greatest number of identified traveler demand and use data needs fell under thecategory of user behavior and characteristics. Specific data needs related to thisrecommendation were identified as follows: • Activity by location, including data on land use, housing, and employment; • Trip generation by age; • Journey to work by mode and trip length; • Latent demand and induced demand; • Time of day of travel; • Use of time and deferral of trips; • Trip chaining; • Work schedule changes and incidences of telecommuting and teleshopping; • Actual versus theoretical trip routing; • External travel distribution; • Local travel of out-of-town visitors, including business travelers, a commondefinition of which should be developed; • Migration patterns of “snowbirds” (i.e., people who move to warm climates in thewinter); • Identification and measurement of customer satisfaction; • Nonwork trip demand; • Characteristics of the transportation disadvantaged; • Changing trip generation characteristics; • Social characteristics of users by mode; • Demand characteristics of the elderly; and • Usage characteristics by mode (vehicles per unit time, loadings, people versusfreight).

Prepublication Copy: Uncorrected proofs Page 40
Freight
Freight data have been neglected in transportation planning. The following demandand use data needs were identified with regard to freight: • Freight movement by mode; • Enhanced statistics on commodity flow; • Freight demand by time (just-in-time delivery data, in particular); • Accurate O-D and movement characteristics data for international freight; • Border crossing information by vehicle type and by origin and destination; • Port data; • Cargo moving in transit through the United States; and • Inter- and intracity freight and goods content.
System Use
It was the sense of the conference discussions that decision makers want to enhancetheir understanding of the composition of the traffic flow on facilities (i.e., the kind ofvehicles and the nature of the passengers and freight being carried, not simply vehiclecounts). Specific data needs in this regard include • Different vehicle types broken out by origin and destination (i.e., use versus FHWAclassification of roadways); • O-D patterns of passenger travel and goods movement by purpose and by daily,weekly, or seasonal variation; • Traffic counts, traffic volumes on highways, and passenger ridership on transit; • Personal trips by alternative modes (e.g., light rail and bicycle); • Vehicle use characteristics by type of vehicle (e.g., occupancy and classification),especially for high-occupancy vehicles); • Vehicle miles traveled (VMT) and traffic counts; • Travel time; • More relevant characteristics of trip production and attraction; and • Airport and ground access demand.
Conference attendees recognized the continuing importance of relating systemuse and surrounding land use patterns and economic activities, citing the followingamong specific data needs: • Impact of different urban designs on travel behavior; • Trip generation for land use development types, including trip length, mode, andpurpose; and
Prepublication Copy: Uncorrected proofs Page 41
• Trip attraction data.
An expanded area of interest in system use is special generators, such as theoccasional major event (e.g., a national or international sporting event) or largespecial-use facility (e.g., a hospital) that generates exceptional traffic demands. Theincreasing importance of tourist demand and the interest in and use of recent eventssuch as the Atlanta Olympics as proving grounds for transportation technologiesstrengthen this interest.
Specific data needs related to this recommendation were identified as follows: • Trip-generation and distribution data on fixed special generators such ashospitals, prisons, universities, tourist attractions, and airports; • Trip-generation and distribution data on special events; and • Traffic impacts of special events by type and size of event.
Improvements in Demand and Use Data
User Behavior and Characteristics
[1] Higher-quality data should be collected on personal travel behavior, including trips,trip length, purpose, mode, time, and location or flows. Nuances such as trip chainingand mode shifts within trips should be captured.
[2] Data should be gathered on the impacts of strategies to influence system use,including traveler information, transportation system management (TSM),transportation demand management (TDM), and price and service elasticities.
[3] The Federal Transit Administration (FTA) and the Federal Aviation Administration(FAA) should be encouraged to conduct cognitive research on the influence ofperceptions of security and safety on demand for transportation service (in particular,transit and airplane travel).
Freight
[4] Increased just-in-time freight deliveries and the impact of international trade on allsectors of the economy demand greater focus on freight data needs. BTS wasencouraged to work with its federal partners to make national data on domesticcommodity flows, international trade, trucking, and other aspects of freighttransportation more specific to states and MPOs. BTS could also work with states andMPOs to foster local freight studies and to link local studies with the national data sets.
System Use
[5] A variety of new tools should be developed for continued multimodal O-D datagathering. Collection and analysis methods are especially important for data on
Prepublication Copy: Uncorrected proofs Page 42
vehicle occupancy and person trips, trip purposes, nonwork travel, and trip chaining.New cost-effective methods are needed for evaluation of vehicle traffic and forhousehold interviews, diaries, mode-neutral data collection, and household trips.
[6] Data “mining” of existing sources would help locate existing and identify missingdata on trip generation, which are widely available. TRB could conduct such a review,and FHWA could fund research into the traffic impacts of special generators andconstruction.
[7] More research is needed on the best ways of estimating passenger trips on barrier-free transit fare systems (systems that allow advance, one-point payment for all fares);for example, by looking at revenue streams to estimate passengers. More research isalso needed into the effect of transit-oriented development on trip generation.
System Operations Data
System operations data should be based wherever possible on data obtainedefficiently and unobtrusively from traffic and transit operations. Such data can form thebasis for understanding demand and system performance. For example, analyzingsystem volume against capacity, especially during peak hours, provides an importantsnapshot of demand for a specific facility. Information on when and how manytravelers violate transit fare policies or high-occupancy-vehicle (HOV) restrictions cansupport reassessments of policies as well as enforcement.
The working groups acknowledged that system operations measures are onlyas good as the definitions on which they rely and the performance goals they support.Agreed-on definitions were recommended for such indicators as reliability andcongestion. Transportation officials at all levels were urged to address the need forsuch definitions and to acknowledge and address the parallel universes of userperception and actual system performance. Additional discussion of the role ofcustomer perceptions in assessing system operations and performance can be foundin the section on Impact and Performance Data.
Reliability and Congestion
One important but underexamined aspect of reliability is its variation by time of day,day of week, time of year, and weather conditions. Information on personal dwell times(average time an individual spends in traffic or transit), is also valuable and needs tobe designed, collected, and analyzed. Several participants suggested travel-timestudies, broken out by mode for door-to-door travel and for transfers.
Several attempts have been made to define congestion for the purposes ofmeasuring system performance (including NCHRP Report 398, QuantifyingCongestion, to be published in 1997). However, the relative nature of congestion—itsvaried manifestation on systems of different sizes and its subjective perception byindividuals—is an obstacle to the development of a single standard measure.
Prepublication Copy: Uncorrected proofs Page 43
Nonetheless, the working groups suggested several ways to articulate congestionmeasures: • Collect and organize data to distinguish between congestion that results fromincidents (nonrecurring) and that from capacity restraints (recurring), including incidentdata, vehicle volume and speeds, and location, extent, and duration of congestion; • Refine data to evaluate the economic impacts of congestion; • Measure the effects of human factors on traffic flow; • Break out systemwide versus local (e.g., corridor versus intersection) congestionmanagement measures; • Collect and compare data on traveler perceptions of what constitutes congestionversus measurable congestion; and • Maintain data on vehicle occupancy per hour, particularly for HOV lanes.
Data are especially needed to evaluate responses to scheduled disruptions(e.g., construction), special generators (e.g., special events), or unanticipatedincidents. For example, information on the traffic impacts and nontraffic characteristicsof catastrophes such as bridge failures is needed, so that data can be modeled andused to develop alternative routing plans (e.g., the conversion of two-way streets toone way by time periods). Information on the effectiveness of signals, signal inventory,and operation during construction periods is also needed.
Freight Operations
Freight operations are largely private. The proprietary nature of much freightinformation has posed a challenge for documenting systemwide transportationoperations. Data on freight activity that are needed include turnaround time at marineand air terminals; factors affecting choice of routing for commercial shipments; andtruck arrival times at delivery destinations. Some participants suggested betterdocumentation of the value and impact of weigh-in-motion systems on truck safety.Many conference participants also suggested that knowing the effect of system pricingon freight planning would be helpful, particularly with regard to just-in-time delivery.
Jurisdictional Coordination
Systems operators do not typically interact or exchange data across local and stateboundaries. This traditional, jurisdictional approach presents a barrier to usingoperations data for regional or statewide decision making. Policies to promoteintermodalism—such as unified regional transit passes and the establishment ofintermodal hubs for freight—rely on the quality of data sharing and partnership amongvarious jurisdictions. In addition, new information technologies (i.e., intelligenttransportation systems) demand compatibility among local system components to befully effective. Conference participants cited these trends to highlight the need forgreater local-local and state-local coordination of system operational information.
Prepublication Copy: Uncorrected proofs Page 44
Improvements in System Operations Data
Reliability and Congestion
[1] All levels of government should cooperate to develop a definition of highwayreliability. AMPO and AASHTO should take the lead in collecting data on reliability(e.g., travel time).
[2] Better data should be collected to promote the understanding of congestion anddevelop common measures and definitions. The feasibility of developing definitions ofcongestion and delay should be evaluated and the impact of these factors on systemperformance by mode should be examined.
DOT could provide funding for a study by the Institute of TransportationEngineers (ITE) or a similar organization to attempt to define congestion and delay,and also to measure their effect on different subpopulations and changes in effect byseason. Such a study could build on the findings of NCHRP Report 398, QuantifyingCongestion. A federal pilot study, conducted with metropolitan areas and states, wouldhelp to develop a methodology for analyzing recurrent versus incident-relatedcongestion, including traffic congestion due to special events.
Congestion monitoring will continue to be the prime responsibility of the localoperator (state highway system, local public works department, MPO, etc.). Withrespect to nonhighway congestion, a new methodology is needed to characterizecongestion and delay by nonhighway modes (e.g., transit, pedestrian, airline).Additional funding to support this might come from FTA.
[3] A pilot study was called for, perhaps under DOT’s sponsorship and hosted by ametropolitan area or state, to collect and analyze data on the economic effect ofsystem downtime (e.g., winter snowstorm recovery in the Northeast). This informationwas widely believed to be necessary for investment decisions and evaluation ofeconomic development plans, particularly because just-in-time freight delivery isbecoming more prevalent.
Freight Operations
[4] Estimation of trip activity rates, such as the method developed by ITE, shouldinclude freight-generation and distribution equations for urban area orientation and forsite and land use orientation.
Urban freight movement was generally agreed to be a neglected area of studythat has become increasingly important as the scope of long-range metropolitanplanning has expanded to include private transportation operations. Among thesubjects in need of research are estimation methods of level of freight activity (by tonand other measures) at intermodal facilities.
[5] Federal agencies should take the lead in exploring and facilitating integration ofprivate freight data with sufficient privacy protection, for example, by examining BLS

Prepublication Copy: Uncorrected proofs Page 45
and Census Bureau practices and initiating discussions with the private sector. Statesand MPOs should talk to shippers first and should make the integration operational.
Time-of-delivery data are needed for transportation planning and systemoperations. The port authorities, states, and MPOs need to work together to integratethe data, with the states and MPOs taking the lead.
[6] MPOs and states should convene a forum to address the fragmentation ofresponsibility for system operations. Coordination is especially needed to facilitatedata exchange to implement and collect information from ITS. It was suggested thatfederal guidelines for ITS development include all potential data customers and thatFHWA provide funds to make this possible. States were urged to demonstrateleadership in gathering the appropriate players together.
Impact and Performance Data
Through the eyes of the user, system performance looks quite different from the facilityperformance that transportation managers measure. Many conference participantsdescribed the level-of-service measure for highways as too limited for assessingtransportation operational performance, particularly in light of the increased focus onintermodalism and customer orientation. However, a broadly acceptable alternativehas proved elusive and will require detailed study and consensus.
Performance Measures
Conference participants urged research to better orient performance measures towardcustomer perceptions and behavior regarding the reliability of the system, variability intravel times, and quality of trip. It was widely believed that measures of customersatisfaction should be a routine part of the evaluation of system performance and thatqualitative measurements should be developed to evaluate the system’s ability tomove people and goods by corridors and specific locations.
Many participants called for federal support to improve the comparability ofsystem performance data across modes, with periodic updates. Research andcompilation of state and local practices would focus on which measures ofperformance make the most sense for assessing system reliability, delay, performanceby time of day, and the impacts of maintenance and construction on the transportationsystem.
One aspect of research into performance measures could be cognitive researchon their comprehensibility to decision makers and the public. The question arosewhether level of service is easily understood or whether the more esoteric measuresare equally valuable and understandable. Another question was whether performancemeasures are at too broad a geographic level (areawide measures) to be sensitive tochanges in transportation improvements.
The following factors were often recommended for measurement to accuratelyassess performance in terms of user perceptions (using neutral data on systemoperations as a baseline):
Prepublication Copy: Uncorrected proofs Page 46
• Travel times and speeds that the customer considers effective for all modescompared with perceived and actual times and speeds; • Amount of delay acceptable to the user broken out by time of day; • User costs; • Value of user’s time; • User sensitivity to toll charges; • Quality of trip (for which an agreed-on definition should be developed, taking intoaccount the customer’s perceptions); • User mode preferences; • User benefits relative to benefits to nonusers; and • Customers’ views about traffic-calming strategies.
Communities, Safety, and the Environment
Many participants believed that the impact of transportation on communities shouldalso be better documented. Cross-modal system performance measures that addresssocietal, economic, and other broad goals are needed to move transportation decisionmaking beyond capital cost assessments to choices that make the most sense forparticular communities. Specific data needs relating to this recommendation wereidentified as follows: • Impact of current system and decisions affecting it on different socioeconomicgroups; • Measurements of quality of life; • A sustainability index; • Social impact of transportation alternatives, primarily bicycling and walking; and • Measurements of negative impacts of transportation improvements (e.g., noise,vibration, inconvenience, damage to community cohesiveness, effect on propertyvalues).
Access and mobility are particular areas of interest. Because social equity is ofincreasing concern in transportation, measures to address these issues were seen ascritical. Data are needed to aid in evaluating the extent to which the transportationsystem provides access to employment, services, and recreation, as well as theconnection between access to all transportation modes and neighborhood character(i.e., aesthetics, noise levels, safety). Data on the level of mobility afforded by bicycleuse and walking, as well as on system support of those modes and the impact ofinvestments in system support, were also requested.
Numerous participants noted the quality and availability of safety impact andperformance data for highway and transit incidents and fatalities; however, oneparticipant noted that more attention should be paid to personal safety (i.e., risks ofcrime). This comment highlights two important, emerging needs in transportation data.First, measuring system performance in terms of characteristics (number of automobileor rail accidents) can be complemented by a fuller consideration of customer
Prepublication Copy: Uncorrected proofs Page 47
preferences (concerns about carjacking on the highway or personal theft on publictransit). Second, the best sources of data on personal safety, and especially on userperception and reaction, may be nontraditional sources, such as municipal police,eyewitness accounts, or the media. Participants supported the continued collectionand distribution of the following information: • Rates of fatal and nonfatal accidents by mode; • Fatality and injury rates for automobile passengers; • Customers’ perceptions of safety (including personal safety) and the impact onchoice of mode; and • Correlation of delay and accidents.
In addition to vehicle inventory and use data cited in previous sections, datacollection was suggested on the effects of the following factors on air quality and theenvironment, in part to meet the new air quality conformity regulations: • System elements not harmful to the environment; • Accurate emissions data for all relevant modes; • Acceleration and deceleration; • Transit ridership; • Variety of and user responses to TDM programs and congestion pricing; • System conduciveness to use of alternative modes, including bicycling, walking,and ferries; • Environmental justice, the interaction between environmental considerations andconcerns for social equity; and • Inventory of important habitats, to be used as a red-flag tool for future impactanalyses.
Discussions at the conference reaffirmed the need to characterize the effects ofthe whole transportation system on land use and urban form. Transferable data arelacking with which to measure transportation behavior changes related to differentland use scenarios, reduced trip rates, trip length, and mode choice.
Economic Impacts
The role of transportation in a region’s economic performance deserves greaterattention, according to numerous workshop participants. Data needs include • Economic impact of congestion (especially on freight movement); • Impact on personal and business incomes of transportation system decisions; and • Economic impacts of transportation programs designed to reduce energyconsumption or environmental degradation.
Prepublication Copy: Uncorrected proofs Page 48
Performance measures for freight movement should be defined in terms of thecharacteristics and services most valued by the trade community, including ease ofaccess to ports, efficient processing and permitting, and streamlined cross-borderinspections.
Improvements in Impact and Performance Data
Performance Measures
[1] Research was called for to develop new level-of-service concepts that wouldreplace the current measures and would focus on customers’ perception of service.TRB, NCHRP, and the Transit Cooperative Research Program (TCRP) were named aspossible partners to conduct such research.
Some participants recommended that a consortium of states, MPOs, and DOTidentify an acceptable substitute for measurement of level of service, perhapsincorporating a measure of customer satisfaction or linking level of service to such ameasure. TRB was encouraged to spearhead such an effort.
It was also suggested that DOT, AASHTO, and AMPO convene groups usingperformance measures to share information and discuss ways to produce usefuloutcomes for transportation decision makers. AMPO could ask political leaders howdata on performance could be presented to them so that it is understandable and canbe integrated into their decision-making process as well as which performanceindicators they are most interested in.
Participants often expressed the conviction that transportation decision makersat all levels should be involved in defining the customer, identifying customer needs,and integrating user evaluation of the system into planning and decision making.MPOs and state departments of transportation were identified as the appropriateagencies to collect performance and impact data that would be fed back into thesystem design and transportation improvement processes. The collection and analysisprocesses should be designed to capture information on the system, the users, themeasurable performance of the system, and the user’s perception of systemperformance.
[2] Before-and-after studies of project effectiveness were called for. The question aroseas to how the effectiveness of improvements can be measured. Of particular interestwere measures of effectiveness for ITS implementation.
Communities, Safety, and the Environment
[3] A lexicon of definitions of accessibility and mobility should be compiled, givingconsideration to definitions that are likely to be easily understood and used bydecision makers.
[4] More and better data should be obtained that describe the impacts of thetransportation system on communities, urban form, and populations. DOT coulddevelop methodologies, performance measures, analytic tools, guidance, and

Prepublication Copy: Uncorrected proofs Page 49
techniques to help states and MPOs assess the contributions to and impacts oftransportation on quality of life (both personal mobility and other important goals ofcommunity life) and to communicate those impacts clearly to the public.
[5] Better data on the security and safety of the transportation system should becollected. Federal, state, and local agencies should collaborate to define core items forsafety data collection and establish linkages between safety and other data bases.Participants expressed concern about the efficiency and effectiveness of methodsused for safety assessment.
[6] More and better data should be gathered to evaluate the impact of thetransportation system and decisions affecting it on the environment.
[7] Efforts to compile data on fragmentation of habitat need to be coordinated, andthese data need to be related to geographic information on transportation networksand facilities. Several participants named EPA, DOT, the U.S. Fish and WildlifeService, and U.S. Geological Survey as possible collaborators to address this need.
[8] Many participants called for an alternative to the current method for obtaining airquality data through traffic sampling, which was widely seen as burdensome to thestates and resulting in data of questionable quality. Traffic sampling is currently underexamination in the HPMS review process. It was suggested that DOT and EPA involveTRB in research into a better approach to traffic sampling, especially with regard to airquality data.
[9] Data are needed that measure the transportation system’s energy use and energyconsumption by type of user.
Economic Impacts
[10] More data should be collected to determine the impacts on the economy at thenational, state, and regional levels of all decisions affecting the transportation system,including investment, lack of investment, system changes, and service changes.
[11] A frequent request was for the development of performance measures suitable tofreight. TRB and DOT could lead an effort to develop such a measure. A cost-benefitanalysis for truck freight operations was suggested for use by states and MPOs thatwould include a yearly update of truck vehicle operations, time, safety compliancecosts, capital cost, and environmental compliance costs. This area of research wasrecognized to be highly controversial and complex.
[12] AASHTO, FHWA, FTA, BTS, and the Office of Management and Budget wereencouraged to work together to develop comprehensive measures of time by valueand purpose for economic evaluation of long-range plans.
Prepublication Copy: Uncorrected proofs Page 50
METHODS
Many suggestions regarding data methods were similar from one topic discussion toanother. Areas mentioned in all or nearly all six topic discussions are customerorientation, ways to improve how data are shared and presented, and public-privatedata coordination. The need to harness new technologies to enhance data efforts wasa major theme of discussions about methods.
Defining the Customer
In discussions of socioeconomic and financial data, the customer was most ofteninterpreted as the data user (i.e., transportation staff or decision maker). Especially indiscussions of the Highway Performance Monitoring System (HPMS) and Section 15transit system reporting requirements, participants believed that a valuable way toameliorate the data-burden dilemma is to promote the understanding that dataproducers are also data users at various times. To the extent that agencies seeking orrequiring information understand the importance of involving data producers indiscussions of what type of data should be collected and how, the end-use data will bestrengthened. One group recommended that the federal government developguidelines to build a sense of ownership and to ensure uniformity among collectors ofoperational data at all levels of government.
In discussions of system supply, operations, demand, and impact, the customerreferred to was usually the transportation system user, and the criterion for successfuldata activity was its relevance in the context of a broad canvas of community desires.TRB was often named as the lead agent for fostering research and discussion oninformation pertaining directly to transportation agencies’ missions in serving thecustomer, such as travel comfort, system damage, safety, and delay data.
Some participants indicated that the public sector does not understand how tocollect and analyze the data on customer perspective most relevant to systemoperations and performance (this criticism was aimed more at the highway sector thanthe transit sector). User input and responses to information about traffic performanceand system reliability in all modes were mentioned for inclusion in evaluations ofefficiency, a concern that reflects the groups’ frequent discussions of user-orientedalternatives to the level-of-service criteria, which measure vehicle flow. This problemwas believed to be a priority for attention and a current obstacle to the development ofrelevant measures of the impact and performance of the transportation system.
Presenting Information
Many problems faced by transportation data professionals are rooted less in the dataissues themselves than in the absence of clear, concise, and compelling ways todemonstrate data to decision makers. GIS, graphics, and other communications toolsare important assets, along with local demonstration projects that can show officials
Prepublication Copy: Uncorrected proofs Page 51
the effects of specific approaches (e.g., toll charges, transit express service, and HOVlanes) on metropolitan travel.
Conference participants gave special consideration to the needs andresponsibilities of decision makers representing system users (e.g., elected orappointed officials). Demonstrating the value and relevance of data was consideredcrucial to continued success with this audience, particularly at the local level, asconcerns for individual privacy become more prevalent and as funds for data activitiesbecome more scarce. One working group strongly recommended closer attention tothe interaction—and often the discrepancy—between the public decision-makingprocess and the technical process. Visually compelling presentation methods thatcould demonstrate the impacts of transportation proposals are lacking, and theintegration of graphic displays into metropolitan travel demand forecasting wasencouraged. For example, MPOs need to enhance the display of the transportationsimulation networks they use to characterize highway and transit lines in their datafiles. Currently, the networks are abstract interpretations and may not covergeographic areas to the extent needed for metropolitan and statewide transportationimprovement programming. Many conference participants called for better ways topresent data at a scale appropriate to the task (e.g., long-range planning, forecastingand modeling, major investment analysis, or short-term transportation improvementprogramming).
New Technologies
Geographic Information Systems and Global Positioning System
In addition to their value for presentations and visual analysis, geographic informationsystems (GIS) have many potential applications: assessing system characteristics,evaluating methods for addressing system capacity requirements against an accuratebackdrop of environmental and historic resources, documenting land use and travelpatterns, and even tracking financial data. Among the most consistent suggestionswas improved linkage between GIS and travel demand software. Global PositioningSystem (GPS) technologies can increase the accuracy of GIS systems by collectingreal-time data on system operations. New technologies can yield economies for dataactivity, including faster exchange and the ability to layer and more easily synthesizeor compare different types of information.
GIS and new, high-resolution imaging technologies can provide the moredetailed land use and transportation profiles necessary for increasingly sophisticatedmodeling and forecasting processes. Participants discussed ways to capture detaileddata on trip making (trip length, chaining, purpose, etc.) through the GPS devicesdeployed in rental cars. These data could then be used to study visitor trip patternsand purposes.
Of special interest to several conference participants was the potential forintegrating financial data with data on supply and system characteristics in GIS, whichcould then be made available to decision makers who participate in financially
Prepublication Copy: Uncorrected proofs Page 52
constrained planning. In general, financial cost accounting and revenue projectionreceived a great deal of attention in many of the discussions of data methods.
GIS and GPS technologies could be applied to determining site specificity forall data items. For example, all data on supply and system characteristics could begeocoded and referenced to a GIS-based system. Performance, incident, and safetydata could also be integrated into such a system.
Intelligent Transportation Systems
Much attention is being devoted to the potential of ITS for improving the efficiency andperformance of state and metropolitan transportation systems. These emergingtechnologies also have profound implications for data collection, storage, anddistribution. Capturing and sifting the vast amount of data produced through ITS will bea significant challenge.
Participants at the conference believed that the impact on transportationdecision making of technologies such as the Internet and other telecommunicationsadvances is an important area for federal agencies to monitor. It was suggested thatthis be done in partnership with other appropriate federal agencies (e.g., the FederalCommunications Commission).
Many agencies, organizations, and private companies have a stake in thesuccess of ITS, but no clear leadership has emerged to address the data collection,planning, and programming opportunities inherent in these technologies, particularlythe extraordinary capabilities they possess to break down information by time of dayand by individual user (for example, ITS could be instrumental for evaluating HOVuse). Conference participants recommended specific roles of agencies andorganizations, which are described at the end of this section.
The level of detail made possible through ITS contributes to greater concern forindividual privacy. The question of how to protect the confidentiality of informationprovided by respondents to surveys is certainly not new, but the malleable boundariesof the Information Age have elevated this concern. Less-intrusive data-collectioninstruments were called for.
The quality and usability of ITS data were discussed by most participants, withthe caveat that “more is not necessarily better.” One working group described thedanger of “stuff overload” and urged the retention of traditional data methods,particularly for collection and presentation, because not everyone is proficient in theuse of advanced information technologies. Methods for sampling from continuallyincoming ITS data may need further attention, a concern that one participantcompared with the concern about the shift to continuous census data collection. Arelated observation was that although technologies such as the Internet makewidespread data collection more feasible, such tools are still far from being inuniversal use. Research is needed into potential selection bias in reliance on theInternet as a survey instrument.

Prepublication Copy: Uncorrected proofs Page 53
Improving Data Methods
Defining the Customer
[1] Data professionals at all levels were urged to learn about, use, and improve onrecognized methods for discovering and measuring customers’ needs and attitudes.Focus groups and surveys were often mentioned as valuable means of collecting theviews of system users.
Presenting Information
[2] DOT should continue support for the development of linkages between geographicsystems and transportation data bases with the goal of improved presentation ofinformation to decision makers and the public.
New Technologies: GIS and GPS
[3] Government agencies and private organizations at all levels (national, state, andlocal) should have a role in making optimal use of GIS and GPS for data storage,synthesis, analysis, and presentation.
[4] Research is needed into the costs of creating a GIS data base of transportationsystems that would include both state and metropolitan data, including an inventory ofsuccesses and failures to date. Several participants believed that NCHRP was theappropriate leader for such research.
[5] BTS and its partners on the Federal Geographic Data Committee should continueto work with other DOT officers, states, MPOs, and industry groups to implement andmaintain the nationwide geographic data base for transportation. Federal agencieswould work with state and local partners to develop common formats and definitionsfor geographic data, to sponsor research on improved methods of geographic dataintegration, and to support state and MPO efforts to build and update the nationalpicture with local data.
[6] States and MPOs should be primarily responsible for the integration oftransportation data into GIS-based systems, perhaps with financial assistance fromDOT through a pilot study. State and local police were suggested as logical agents toimplement the GPS for accident site locations. For example, the Kansas State Patrol isamong those already using GPS devices to locate accidents.
[7] Because remotely sensed data from satellites available to civilians are improving inresolution, variety, and cost-effectiveness, a major new coordinated effort isrecommended to bring these data to state DOTs and MPOs. Members of the FederalGeographic Data Committee (including BTS and the U.S. Geological Survey) couldwork with states and MPOs in this effort.
Prepublication Copy: Uncorrected proofs Page 54
New Technologies: Intelligent Transportation Systems
[8] States and MPOs should be key players in ensuring that ITS technologies aredesigned to collect system operations data and that ITS data can be used to validatetransportation models. TRB and DOT were encouraged to monitor emerging ITStechnologies and relevant regulations to ensure that state and local data needs aremet and that information derived from these systems is useful in state and localdecision making.
[9] The federal government should continue to coordinate priority-setting for the useand maintenance of ITS data. DOT-sponsored pilot studies could examine newtechnologies to collect vehicle occupancy and classification data that contribute toenhancing the transportation planning process. ITS America, AASHTO, and privateorganizations were encouraged to work with the agencies funding ITS to ensure thatcomponents are built into these systems to support data reduction, retention, anddissemination to enhance the systems’ usefulness for planning and programming.DOT, TRB, and AASHTO were suggested as partners in the research anddevelopment of software aggregation tools to allow formatting and summarizing of ITSoperational data for planning.
[10] Transportation agencies should work with the National Governors Association andNational Conference of State Legislatures to develop model state legislation for theprotection of the privacy of respondents using the Internet and other advanced media,and to ensure the confidentiality of data. Cognitive research could also be carried outon privacy issues to determine how people feel about being “tracked.”
INSTITUTIONS
An understanding of the relative roles of organizations at the national, state,metropolitan, and local levels is integral to the discussion of how institutions shouldsupport data activities for state and local decision making. An overview of these roles,with proposals from conference participants for strengthening them, precedes thesections containing general recommendations for institutions.
National Organizations
AASHTO and AMPO were widely viewed as leaders in determining or initiating jointactions between states and MPOs, documenting best practices, and facilitatingcontinuing education of transportation professionals. These organizations also are in apowerful position to suggest legislative changes that will improve data activities.
As important partners in ongoing research, proper storage, and widespreaddissemination of data, these organizations frequently coordinate peer review andresearch into means for enhancing data. Discussions at the conference highlightedthe need to strengthen the clearinghouse role of AASHTO and AMPO, as well as torecognize the importance of these groups as liaisons with federal agencies and othernational organizations.

Prepublication Copy: Uncorrected proofs Page 55
Federal Agencies
It was widely agreed that the federal government is responsible for “universe” data(e.g., national samples, national activity factors, global trade data) and plays a majorrole in the collection, analysis, and dissemination of financial data. Strengthenedpartnerships were called for between DOT and other key federal agencies such as theU.S. Department of Commerce, Federal Communications Commission, and U.S.Geological Survey so transportation-related data from these agencies can be mademore compatible with transportation data as well as more useful to decision makers. Atleast one opportunity already exists in this regard: coordination of data ontransportation and other geographic information such as data on land use through theFederal Geographic Data Committee, chartered by an Executive Order to create theNational Spatial Data Infrastructure.
As the primary agent for supporting research into data methods andcoordinating data standards, the federal government was called on to lead the way, inclose collaboration with the states and MPOs, in the review and establishment of aclearinghouse of local and state data methods. The federal approach to data activitiesshould mirror the institutional shift in other areas of governmental practice, from a “top-down” to a “bottom-up” process for policy setting. In data activities, this changetranslates into a federal emphasis on aggregating data instead of requiring it withinparameters that reflect little state and local input.
Specific actions that BTS, FHWA, FTA, and DOT’s other modal administrationscould take with regard to increasing their responsiveness to state and metropolitanpriorities include the following: • Completion of the evaluation of the Highway Performance Monitoring System andimplementation of the resulting recommendations, • Assessment of functional classification systems for highways and other modes, • Consolidation of FHWA and FTA reporting requirements, • Improvement of state and MPO access to comparative cost and revenue data, and • Support of conflict mediation approaches to resolve disagreements over data(national organizations such as AASHTO and AMPO were also encouraged to takethis position).
Current federal efforts in technology sharing, transfer, and training weregenerally described as having great value. Continued efforts in this direction gainedbroad support among participants. However, federal legislation was sometimesrecommended to remove barriers to the sharing of data among institutions, betweenthe public and private sectors, and among levels of government.
Prepublication Copy: Uncorrected proofs Page 56
States
Serving as brokers between the federal government and the MPOs, and focusedincreasingly on partnership and outreach to nontraditional agencies, states were seenas stakeholders in removing barriers to effective data activity, especially data sharing.State DOTs are data “customers” who must fulfill the requirements of statewidetransportation policy as defined by the governor and legislatures. States also gatherdata, specifically on system characteristics, functional classification of highways andrights-of-way, project finance, and geography. Statewide clearinghouses wereencouraged, especially for GIS data. States have a role in coordinating data standardsand in priority setting for data collection. Training, technical assistance, university staffdevelopment, and funding for data research remain important functions for the state.Also important is the need for a statewide direction for transportation policy.
Metropolitan Planning Organizations
MPOs were attributed with a major role in promoting public participation; outreach tonontraditional agencies and groups has become more important in recent years. Likefederal and state governments, MPOs also are focusing on the need to strengthenpartnerships.
As data collectors, MPOs are responsible for regional data, and many MPOshave made strides in bartering or buying data. For example, the Metropolitan AreaRegional Council in Kansas City purchases business and economic data, and theKansas Department of Transportation has purchased employment data for the state’sMPOs from other state agencies and from private marketing firms.
The data methods for which MPOs are best known are the various modelingprocesses for land use, air quality, and trip forecasting. In the research arena, MPOsfrequently host pilot studies of innovative methods.
Local Agencies and Authorities
Local governments collect local road system data; conduct or participate incomprehensive land use planning, zoning, and issuing of building permits; coordinateservices related to transportation, including environmental protection and safety; andmaintain jurisdictional data (e.g., information on city limits). Transit authorities collectand maintain transit data. Local governments also are data customers in the sensethat decisions to propose specific projects may be influenced by such information.
Local transportation departments are responsible for detailed safety data andkeep close tabs on system characteristics and conditions (e.g., through operationsdata, bridge data, and functional classification of rights-of-way). These agencies alsohave the closest contact with the public. They therefore can have important insightsinto the performance of and demand for local systems.

Prepublication Copy: Uncorrected proofs Page 57
Strengthening Institutional Roles
Partnership
[1] Data gatherers and data users should form partnerships and determine clearresponsibilities for specific data activities, both among jurisdictions and between thepublic and private sectors.
Data need ownership, care, and feeding, but convincing various jurisdictions toaccept the responsibility is a problem. Each level of government needs to define itsrole as a stakeholder in data management. The Texas Department of Transportationrecently issued a statement of policy in this regard, which can be considered a model.
Data needs for the general good are especially vulnerable to becoming“orphaned” when private providers do not perceive the profitability of collecting andproviding the data, and when no agency perceives the usefulness of the data for itsspecific jurisdiction.
[2] States and MPOs do not have the resources to investigate the full range of transportation data available. Although BTS does produce a data catalogue, efforts inthis area should be expanded and a compendium of secondary data sources added.Information on how to fuse secondary and transportation data should be included.
The public sector in transportation spends considerably less per professionalon providing access to data resources than many other sectors, including those formedicine and agriculture. Given the high value of data to the field, this situation oughtto be remedied. A comprehensive catalogue of data sources is needed, but thesector’s need goes beyond that, perhaps even to a clearinghouse that would store anddisseminate all publicly available transportation data, as well as provide technicalassistance to its customers. Any such effort should include points of contact for datasources to assist potential users in determining data quality.
BTS’s National Transportation Library could assign staff to be responsible forclearinghouse functions such as providing assistance in locating alternative datasources and distributing responsibility for acquiring, storing, and providing access todata. AASHTO and AMPO could provide clearinghouse functions with regard toinformation on institutional processes at state DOTs and MPOs, for example, detailingthe procedures used to develop performance measures.
[3] Public-private partnerships and new institutional relationships for development anddistribution of data should be explored.
To assist all data-collection efforts undertaken by state and local agencies,partnerships with universities and private companies were suggested, which mightassist specifically in improving collection methodologies.
Democratic access to data was discussed as an important federal enforcementissue. For example, several MPOs and states are frustrated by the inaccessibility ofES202 employment data. The federal government, which funds collection of thesedata through the U.S. Department of Labor, was encouraged to take a hand inensuring access for states and MPOs. Federal guidelines and principles weresuggested for balanced public-private partnerships for data collection and
Prepublication Copy: Uncorrected proofs Page 58
dissemination. Several participants believed that agencies should be more willing topurchase or trade better-quality public and private data.
In the area of financial data, federally guided methods or institutionalarrangements were called for to provide specific information from the federalgovernment to states and from states to MPOs.
[4] Public agencies and private entities should increase coordination regarding dataaccess. Collaborative agreements with trade organizations could be useful to thiseffort, and cost-sharing or purchase of data should be considered.
Partnerships with private data holders were considered by most participants tobe crucial to getting better-quality data, particularly with regard to employment andfreight data. However, the competitive environment among private companies and theattendant proprietary nature of their data pose a significant obstacle to realizing thisgoal.
It was suggested that BTS take the lead in facilitating access to and use ofprivate data through “win-win” arrangements such as buying or sharing data,partnering, and privatizing collection, analysis, and storage.
[5] National research on data sharing between metropolitan areas and states wasfrequently requested, and numerous participants suggested a training syllabus ondata sharing and partnerships.
Participants expressed interest in making data resources available foridentifying comparable metropolitan areas and finding ways to discuss issues relatedto transferable parameters and comparable travel behavior data. Examples of dataand tools for discussion include HPMS, household travel surveys, and instrumentedversus uninstrumented ITS miles. A proposed study was described that would besimilar to the Characteristics of Urban Transportation Demand (CUTD). DOT alreadyfunds a research project on how states or MPOs can share nationwide travel surveydata (or any other national data sources), for example, how locales can “borrow”NPTS data to meet their own needs.
[6] A consortium of federal modal agencies and state, regional, and localtransportation agencies should determine key data elements, conventions, andprotocols. TRB could facilitate this process.
Differences in data-collection and analysis methods among transportationagencies at all governmental levels hinders the exchange of valuable information. It isnecessary that an effective coordination process for data exchange be created, onethat relies on common formats, flexibility, aggregation, sampling, and methods. Forexample, it would be helpful if all DOT surface transportation agencies had mutuallyconsistent financial data bases that incorporated standard items and accountingpractices.
DOT is a logical agent to provide guidelines for standardizing a variety of dataand data-collection methodologies, such as those pertaining to causal relationshipsfor safety, but it should not itself establish standards.
BTS could relate local data over time by making use of compatible formattingand measurements for data sets collected at different times. It might also develop a

Prepublication Copy: Uncorrected proofs Page 59
data dictionary for critical transportation inventory elements to enable bottom-updistribution of data elements for creation and maintenance of a base inventory.
New Technology: GIS and ITS
[7] The U.S.Geological Survey, ITS America, the Joint Program Office of DOT, andBTS were encouraged to cooperate in developing a national GIS. Federal agenciescould coordinate with state and local governments to maintain and update the system,to explore an ITS connection, and to look into funding for state and local transitionsfrom their current GIS systems to a national version. All levels of government shouldcooperate with the private sector (especially freight) with regard to data needed for anational GIS transportation data base. For example, it was suggested that all levels ofgovernment coordinate with public and private rail agencies to develop a data base ofrailroad crossings and add it to the GIS data base.
Freight
[8] A forum between public-sector data stakeholders and national freight stakeholderswas suggested by many participants, with the goal of sharing data. TRB, BTS, AMPO,and AASHTO were among the groups identified to coordinate such a forum.
This national forum would go far toward encouraging better relationshipsbetween the public and private sectors and toward opening discussion of such keyelements as how to get freight flow information without jeopardizing the privacy ofcompanies. National associations and federal agencies should work with nationalprivate-sector businesses in the freight industry to determine what data they need fromtransportation agencies and what data sharing could be realized. The TRB Committeeon Freight Transportation Data can help define free or fee-based freight data sources,and bartering is also a possibility. DOT could review existing data sets to ensureaccurate and usable freight information that is appropriately aggregated to supporttransportation planning and decision making at state and local levels whilemaintaining private-sector confidentiality.
Air Quality and Other Environmental Data
[9] DOT, EPA, and TRB were encouraged to convene a dialogue between thetransportation and environmental (i.e., air quality) communities. Topics that could bebroached at a transportation environmental roundtable include the need for educationon how the emissions performance process works, discussions of needs in analyticalaccuracy, weaknesses in current air quality models and methods for addressing themin new models, and the need for tools to evaluate broader externalities related toimpacts of improvements after implementation.
Prepublication Copy: Uncorrected proofs Page 60
KEYNOTE PANEL
Role of Information in Transportation Data Content,Analysis, and Institutions
T. R. Lakshmanan, Bureau of Transportation StatisticsRobert E. Skinner, Jr., Transportation Research BoardFrancis Francois, American Association of State Highway and Transportation Officials
The focus of this conference is the importance of data to support state and localtransportation decision making from identification all the way through to interpretation.Substantial changes are under way, including accountability, performancemeasurement, a broadening of the current mission within individual agencies andorganizations, creation of new programs and new projects, and addition of new talentsand skills. The panelists were asked to help set the scene for discussion ofopportunities and challenges within this framework.
T.R. Lakshmanan
This is a very important conference, likely to contribute to the efforts that BTS, TRB,AASHTO, AMPO, and their many customers plan to pursue. The conference programcalls on the participants to develop recommendations to help improve state and localtransportation decision making in the future. That is a broad and challengingassignment. We are dealing with a period of considerable socioeconomic change,three aspects of which I would like to discuss.
The first aspect is the ongoing upheaval in technology. Everybody knows thatinformation technology is symbolic of the kind of technologies that are beingintroduced. Such technologies are transforming the production system and thetransportation system.
The second aspect is the evolution under way in the institutions governingtransportation. Until congressional action is complete on the New EconomicCrossroads Transportation Efficiency Act (NEXTEA) submitted by the Clintonadministration, we will not know to what extent the institutional context fortransportation programs will be changed. The expectation is high that there may beinstitutional innovations in terms of greater flexibility, devolution, and new financialinstruments. A further institutional innovation is the notion of accountability ingovernment. We have to justify our agency resources in terms of the final services weprovide our consumers.
The third aspect, which is less tangible but very significant, is culturalbackground, one element of which is the end-of-the-century view. Leaders who set thepublic agenda often talk about the challenges of the 21st century, the necessarypreparations, and the bridge to get there. I mention cultural background because of
Prepublication Copy: Uncorrected proofs Page 61
those metaphors relating to the way we begin to think about the future oftransportation. Therefore, it is critical that we better understand the nature of ongoingchange as we use such metaphors.
First, a few views on the value of information. The famous lexicographerSamuel Johnson talks about the value of counting. Counting is what we statisticiansdo. We count and collect data to make the vague and indefinite clear and precise.John Locke, the English philosopher who greatly influenced both the English andAmerican Constitutions, said, "I attribute what little I know to my having not beenashamed to ask for information." It is paramount to seek knowledge from the data thatyou have gathered. To go one step farther, transportation information is for decisionsupport.
There are two important aspects of counting: counting transportation andmaking transportation count. In counting transportation, you always ask threequestions: Are we counting the right thing? Are we researching the right phenomenonor process? Are we looking for information and a knowledge base to support decisionmaking? If the answer to the first question is yes, it is best to ask, Are we measuringthose things correctly? Are we measuring outcomes? How appropriate are ourmeasures of outputs and inputs? How reliable, timely, and consistent are the data?
There are a number of prerequisites to making transportation count. You mustbe able to distribute the data extensively, to exchange the data, and to engage in datafusion, that is, the merging and juxtapositioning of diverse data bases. Data fusion isvery important for data analysis, and great advances have occurred in that area in thepast few years. By merging or juxtaposing the information that becomes available fromvery different sources, you can see new relationships and infer new connections.
We interpret and analyze the data and gain increased understanding oftransportation patterns and trends, all the while guided by three types of decisionperspectives—strategic, management, and operational. If the perspective is strategic,you ask, What do I want to do in the future? What investments are appropriate?
From a management perspective, you need to know what objectives should beachieved and to what extent the information is useful to management. These fourquestions cover the management perspective: • How can we support good management decisions on the basis of data andanalysis? • Is the information used appropriately to support the decisions? (This is the criticalquestion.) • Are the information and knowledge producers gaining the confidence of theprofessionals involved, as well as that of policy makers? • What can be done to improve matters?
From the operational perspective, the change in information technology hasproduced large quantities of data, and the vastly expanding data base can, ifstructured properly, provide decision support to operate transportation systems. Thekey question is, How can we use the enormous richness of data to develop guidancefor management and for operational planning in transport agencies?
Prepublication Copy: Uncorrected proofs Page 62
This conference is significant in terms of identifying the information necessary tosupport state and metropolitan decision making. We are witnessing and anticipatefurther enormous structural changes in transportation. We should think of the emergingtransportation system at the state level in a dynamic, not in a static context.
Most people know that the programs that we have today are really solutions foryesterday's problems. For each of these programs, interest groups and support groupshave developed over the years. Where are the interest and support groups for thedynamic, future-oriented enterprise in which we are now involved? Perhaps theparticipants in this conference have that role. This conference may be a turning point,developing a response to the dynamic situation. What can we possibly learn, or whatshould we attempt to learn here?
The total gross domestic product (GDP) in the United States in 1995 was about$7,240 billion. That is the value of goods and services produced in a typical year, ofwhich the transportation-related share is $771 billion, or about 11 percent. Incomparison, education has only a 7 percent share and health has 14 percent. Elevenpercent of the net income produced in the country is from the transportation sector, sotransportation is a really big player.
Most of the transport GDP is produced by the private sector. Only 18 percent isproduced in the public sector, namely, state, local, and federal (including theDepartment of Defense). To make efficient and effective choices, improvedtransportation information and knowledge are critical for choices in the privatetransport sector. A major purpose of transport information programs is to help thefunctioning of private transport markets.
Of the 18 percent of the GDP produced by the public sector, only 15 percent isattributable to federal sources. Of the 78 percent produced by state and local sectors,most of the value added in public-sector transportation is at the state and local levels,not at the federal level. The remaining 7 percent is generated by the Department ofDefense, which buys a lot of planes, ships, and transport infrastructure. If mistakes aremade in the state and local systems because of poor information, one can say thatthey are much more inimical to U.S. economy and productivity than similardeficiencies at the federal and local levels. Of course, the private sector is dominant.
Some changes are also taking place in the context of all transportation systems.As the great American philosopher Yogi Berra said, "The future ain't what it used tobe." In the last 25 years, per capita income went up as the population grew 30percent and the GDP grew nearly 100 percent. Now look at some of the transportationaspects of the economy, keeping in mind the 100 percent increase in GDP. The valueof international trade in constant dollars increased more than 475 percent from 1970 to1995. International trade in goods as a proportion of GDP was 8 percent in 1970 andalmost 20 percent in 1995. (Note that this is 20 percent of the 1995 GDP, which istwice as high as that in 1970.)
Enormous growth in transportation, taxing the existing infrastructure system,took place during this period. Domestic freight registered a 65 percent increase.International waterborne trade increased 93 percent, almost the same rate of increaseas the GDP during in the same period. In addition, intercity truck ton-miles grew 124percent and aviation freight ton-miles witnessed a 465 percent increase.
Prepublication Copy: Uncorrected proofs Page 63
During the same period there were basic changes in the economy. Thefirst aspect of this change is what I call a “dematerialized” economy, by which I meanthat the economy is using fewer materials and less energy per dollar of GDP thanbefore. Look at some traditional materials such as steel, cement, and paper, whichformed the backbone of the industrial economy. For $1 of GDP (in constant dollars)from 1950 to 1990, fewer materials were used than before, in spite of a much richerand varied economy and our consumption of more goods and services. We arebecoming less and less material- and energy-intensive than before. More of the valueis being added in lighter goods, higher-value goods, and information and knowledge-based services.
The dematerialized economy has obvious implications for transportation.Markets have become global. We sell our products, import goods for our productionand consumption, and visit leisure-time destinations all over the world. The nature ofour transportation institutions is changing as well. In the past 20 years, we deregulatedtransportation services and privatized many transport activities, and a variety ofincentives are being offered to promote private financial participation in infrastructureinvestments as well as in some infrastructure services. In some countries—NewZealand, for example—this trend toward privatization of transport infrastructureservices is quite advanced.
Another development is the incorporation of transportation into productionactivities. Some producers do not engage in the final assembly of a product. Logisticalcompanies collect (on a “just-in-time” basis) various component parts for assemblyand delivery. Thus, production and transportation are becoming highly intertwined.
According to 1995 statistics for exports from metropolitan areas, Detroit,Michigan, is the largest exporter in the country; San Jose, California, is the secondlargest. There's a great difference in the ranking of the top 10 metropolitan areas andthe ranking of exporters.
Another major change is taking place. Twenty years ago nobody could havepredicted the regional shift between 1980 and 1993 in port trade. The East Coast,particularly New York and New Jersey, was dominant in 1980; now West Coast portsare dominant. This shift took place in a very short time, suggesting that change is afootin terms of where goods are coming from and where they are going as well as what isbeing exported and where it is going.
On the basis of data from the Commodity Flow Survey, eight high-valuecommodities with a reported worth of more than $5,000 per ton account for only 2.1percent of the total tonnage moved in the country, yet they account for 41.2 percent ofthe total value of goods. These items include computers, instruments, electrical andother machinery, apparel, and transport equipment. Half of the value is in a few high-value, light commodities that account for only 4 percent of the total tonnage, whereasraw materials, natural resources, food products, heavy industrial products, and the likeaccount for 96 percent of the tonnage and half of the total value.
A change in the structure of the economy is under way—changes in sectoralcomposition and in structural and spatial aspects, with corresponding implications fortransportation. External markets are going to grow much more rapidly in transportation.The demand for transportation, indeed for all kinds of service in transportation(vehicles, infrastructure services, traffic control, etc.), is growing more rapidly abroad.
Prepublication Copy: Uncorrected proofs Page 64
In the first two or three decades of the next century, transport demand is going to bedominated by Asia and Latin America. As American transportation firms participate inmeeting this demand, what consequences will follow for the U.S. system?
In many growing industries, the half-life of a new product is very short, just a fewyears. What is being produced is changing, and production inputs are likely to changefrequently. What is being transported is changing how it is being transported. Thesefundamental changes are rapidly taking place in the transport system.
Information technologies allow two kinds of improvement: we are able to do“old” things—things we have done before—faster, more cheaply, and more reliablyand safely; and new activities are available. Information technology also providesmajor support for transportation operations. Information technology is very differentfrom earlier major transportation innovations. For innovations like jet aircraft or thediesel engine to spread broadly, the industry had essentially to sacrifice still-functioning equipment, which slowed the spread of the new technology.
Information technology, however, essentially complements transporttechnology. Information technology makes existing transport equipment function betterand more productively and therefore it is developing very quickly. It permits oldertransport services to be cheaper and better and also enables the introduction of newtransportation services. The computerized reservation system, for example, is not onlya reservation and booking system but has allowed many new services for theairlines—financial analysis, marketing, leisure travel services, and so forth. Thechanges created by information technology have been taking place for some time, butwhen the way we work and interact with others changes because of informationtechnology innovations, bigger changes may be in store.
Just to complete the story, demography is destiny. If a demographic changeoccurs now, we will experience the consequences 15 to 25 years later, like thepassage of the baby boomer generation through the seven ages of man. Theanticipated aging of the population in the next 15 years is a case in point fortransportation.
Keep these dynamic economic, demographic, spatial, and institutional changesin mind as you think during this conference about what we need to do and what can bedone. Some of these dynamic factors operate in the short term, and others develop inthe long term. Ultimately we are concerned about conversion of information intoknowledge to support state and local transportation decision making. What level andtype of investments are appropriate? What kinds of safety provisions should wedevelop? What management initiatives can be supported by the availableinformation? What guidance is provided by the information for operational activities?
At BTS we are trying to democratize the access of information to all ourcustomers, using devices like the Internet, CD-ROMs, other data products, or otherkinds of mechanisms. It is most important to realize that social gains are high whenyou decentralize knowledge in an emerging era—the 21st century—when a largenumber of institutions will be making decisions. Information is the glue that holds theseinstitutions together and coordinates their activities.
The more information that we make available by democratizing data access fora larger number of data users, the more new knowledge will be created and the betterwill be decisions made by customers. In the private sector, information provision,

Prepublication Copy: Uncorrected proofs Page 65
knowledge creation, and better decision making are constantly occurring assubcontractors provide ideas for the prime contractors and vice versa.
The last issue I want to discuss is measuring the performance of systems andagencies. Two kinds of measurement are involved: how well the transportation systemis doing and how well individual transportation agencies are doing. As you know, agreat deal of information is being collected by information technologies on theoperational activities of transportation agencies. For example, in aviation, a largevolume of information about normal operations is collected by air traffic controllers,radar, inspectors, and weather forecasters. For instance, during a Boeing 777 flight,data on 700 flight parameters are collected eight times a second. Analysis of thesedata along with the data on the ground can reveal what kind of weather and otherconditions lie ahead for the planes that come through an hour later, 20 minutes later,15 minutes later, and so on. From a safely perspective, this information is terriblyimportant. When a confluence of unusual events and special circumstances producesa disastrous result out of simultaneous occurrences of what would otherwise becommon events, the system collapses. In other cases, the gradual evolution ofprocedures, aging of aircraft, or an interaction of factors can lead to dangers. In suchcases, analysis of large amounts of data could predict what is novel and what isdifferent, and we could anticipate potential threats to safety so as to take effectivecountermeasures.
If you look at certain daily travel patterns in metropolitan areas—to determinewhat the peak times are, where there may be special patterns, and why the informallyobserved traffic delay patterns on a Monday and Friday seem to be somewhat differentfrom those on Tuesdays, Wednesdays, and Thursdays—can these patterns bechecked by using information from intelligent transportation systems? If the differencesexist, why are they occurring? What are the reasons? What can we learn for futureoperational guidance and for future traffic control actions, if any? There is a largepotential for operational guidance and for safety actions.
I noted earlier that the second area of institutional performance refers to thevarious state and local agencies and the federal transportation agencies. Theseagencies receive resources from society and perform certain activities. How do theyaccount for their resources in terms of the value of the services they perform? Thisaccountability issue is here to stay in the current political environment.
The Government Performance and Reporting Act at the federal level and theactions it calls for as well as the activities in some states like Florida, Minnesota,Oregon, and Wisconsin in establishing “benchmarks” and in performance accountingcall for measures to evaluate transportation agency performance and the collectionand analysis of necessary data.
These are not easy tasks to perform in terms of information, analysis, andguiding objectives. Further, there is a major cultural transition as we move away from aworld where we were mainly concerned with measuring inputs such as budgets andperson years and outputs such as miles of roadway and track to the use of outcomemeasures such as mobility, economic consequences such as productivity, andunintended consequences such as environmental degradation and safety problems.
It is going to take some time to identify what measures to choose for theoutcome and output variables that measure performance in this way. The requisite
Prepublication Copy: Uncorrected proofs Page 66
knowledge is going to take some long-term learning. However, once you choose ameasure, how to determine that measure is important. Does the measure you chosereally capture the concept behind what you want to measure? Is it measuring itproperly? Is the sampling method appropriate? Is it timely? Those kinds of questionsare relevant to setting up a performance measurement system.
In all of this, BTS can help. This conference is the beginning of the road. Toquote from an ancient source: Let it first blossom, then bear fruit and then ripen.
Robert E. Skinner, Jr.
I have developed a list of eight points about transportation research, some of which wein transportation research know instinctively but don't remind ourselves of oftenenough or explain to others. Several of these points apply to transportation informationand data needs.
The first point—and by far the most important—is that transportation data andinformation matter. There are a host of decisions for which data and information areprerequisites. We know these to be information needs related to making investmentdecisions, operational decisions, design decisions, and performance assessments.Stated differently, the lack of appropriate information also matters and can do so inunfortunate ways. The goal is to affect decision making, not to collect data for the sakeof data.
The second point is that data collection programs, just like research programs,are a tough sell. The creation of BTS may have bucked that trend. At one level,everyone appreciates the value of information, but the appreciation of informationdoes not necessarily translate into support for data collection programs. The payoffsfor data collection are, in many cases, long term. The linkage to improved decisionmaking from data is often ambiguous, and the whole notion of benefits and costs fordata collection programs is uncertain. So when times are tough—and budgetary timesseem to be perpetually tough for those of us involved in public-sector programs—it canbe hard to generate sustained support for data programs. At a time when we aredeferring critical maintenance on infrastructure systems, what chance do data and, forthat matter, research programs stand? The implication is that it is incumbent on us tobuild cases to demonstrate why data are important, how they affect specific decisions,and how they have affected past decisions and will affect future decisions.
Third, data collection programs appear fragmented and disorganized, andactually, in many cases, they are fragmented and disorganized, sometimes for veryunderstandable reasons. After all, our transportation system is incrediblydecentralized. We have tens of thousands of owners of transportation infrastructure,tens of thousands of private suppliers and contractors who provide service, tens ofthousands of institutional users, and tens of millions of individual users. We also havean incredible mix of data collectors at different levels of government, both in the publicand private sectors, and an incredible mix of users, with different perspectives anddifferent needs. At one level our aim is to rationalize and coordinate all of these data

Prepublication Copy: Uncorrected proofs Page 67
collection efforts, but at another, we need to recognize that fragmentation, even a littlebit of chaos, is inevitable in this enterprise that we call data collection.
Fourth, data collection programs must address tomorrow's needs, notyesterday's or even today's. There is a trap—a trap we're all well aware of—that wemay institutionalize data collection programs that are geared to yesterday's needs. Ifwe do that, the results are irrelevant, and that makes it very hard to develop thesupport that we need for new data collection programs or even to sustain support forexisting ones. For example, the revolution in information and communicationstechnology is going to have profound effects on transportation because it affects ourchoices about where we live and our notions about the workplace and where, how,and when we work, and it has already changed how goods are manufactured anddistributed. The question remains, Are we collecting the kind of information that willhelp decision makers anticipate and understand these changes and adapt to themeffectively?
Fifth, there are some questions that data, even excellent data, cannot answer ormeaningfully address. For example, there are many questions related to highwaysafety for which we will never collect enough accident data or traffic exposure data tocome up with reliable estimates. Can you imagine collecting enough data to assessthe benefits of changing edge stripes on the side of the highway from 4 inches to 6inches? Sometimes we just have to decide what we can do and what we can't.Perhaps we will never find a satisfactory way to characterize congestion. I hope that isnot the case, but if it is, it will not be because of our inability to go out and collect thedata, but because we aren't able to agree on the right measure for congestion. Givenour limited resources and the need to demonstrate relevance, we should be extremelypragmatic about what we can and cannot achieve with new data collection efforts. Andperhaps we need to be absolutely ruthless in examining data collection efforts that arealready under way.
Sixth, as with so many other things in life, balance is important in data collectionprograms. No one really knows what the right mix of data collection and informationgathering programs should be, and we have no methodological way of determining it.But we do know that we need to touch a lot of bases in developing a program, and wehave to make a lot of tough, hard choices and trade-offs. We need data for planning,for aiding and improving design, for system management, and for assessingperformance. We also need data oriented toward local, state, and national needs and,increasingly, toward international needs.
We want continuing data to monitor system performance. Sometimes we needto collect special purpose data when unusual opportunities arise. For example, theNorthridge earthquake in California provided opportunities to observe travel behaviorsthat were perhaps unprecedented and to collect information about those changes.
We need data to help us with our immediate needs. We need data for ourlong-term needs. In this conference the question of balance is going to be foremost inmany people's minds.
Seventh, as with other activities that some people perceive to be of marginalimportance, data collection and information gathering programs need champions. Wehave been fortunate to have had some champions, some of whom are with us today,who have been laboring in this vineyard for a long time. But they can't do it alone.

Prepublication Copy: Uncorrected proofs Page 68
There is some good news, and, of course, if there's good news, there's badnews. The good news is that every phase of transportation has information and dataneeds, almost every position in every agency in some sense depends on data.Therefore, data collection should be everybody's business. The bad news is that whensomething becomes everybody's business, there is a tendency, a human tendency, forit to become nobody's business. So one of our challenges is to try and educate peopleabout the need for data collection and information gathering efforts and to try to enlistsome champions, not just from the data community, if that's the right word, but from themainstream, operational side of transportation agencies.
My eighth and final point is that the devil is in the details. My observations havebeen relatively straightforward. The hard part lies ahead—dealing with the details andthe specifics: • What information should be collected? • How will it be collected? • Who will collect it? • Exactly how will this information be used? • Who decides and who pays? • What should the balance be between public and private agency responsibilities,government at different levels, the collectors versus the users? • How should data be stored and disseminated? • What level of abstraction is appropriate? • How do we assess whether the data we are collecting are being used asexpected? In fact, we need data about data to determine when we need to makechanges in our data collection programs.
Questions like these will be very close to the surface in all the discussions here.I am looking forward to a stimulating, interesting, and, I hope, an influential conference.
Francis Francois
My role here is to try to give some perspective on this conference from the standpointof AASHTO and its member departments, 30 of which are represented here. Statedepartments of transportation (DOTs), have been major data users for a long period oftime. When they were highway agencies only, they worried about the performance ofthe highway system, and indeed they still do; they worried about the capacity of thesystem, and they still do; and they worried about the safety of the system, and they stilldo. They have gathered and looked at statistics for years on these aspects of thehighway system. More recently, they have had to work with environmental issues andgather data to look at air quality, water quality, and many other aspects.
Prepublication Copy: Uncorrected proofs Page 69
As transportation agencies and not just highway agencies, which most of ourmember departments now are, the world has enlarged considerably. As a result of theIntermodal Surface Transportation and Efficiency Act (ISTEA) we need to look at thedata relating to intermodal issues in each state—rail, aviation, water, pipeline, trucking,and other issues—more than we did before. As planners, we also, in most states, havea role in programming public resources to meet transportation needs. Andincreasingly, particularly as transportation becomes multimodal, we have to look atwhat the entire transportation system is doing. All of this takes data.
We also need to be concerned with the relationships among state, local, andmetropolitan governments, especially since ISTEA was passed. This has caused us tolook at issues from a statewide perspective. Some state transportation agencies usedto confine their viewpoint primarily to the area outside their cities and metropolitanareas. That is no longer possible. We now also need to be aware of issues in citiesand metropolitan areas.
We tend to look at data in an attempt to help improve the revenue stream thatflows through a state transportation agency, whether from the state legislature—inthose infrequent times when they are willing to give more money—or whether fromCongress. Over the last few years, a major activity of every state transportationagency's statistical and data staff has been generating formulas to see how funds canbe allocated to their own benefit as opposed to someone else's.
AASHTO has dealt with the requirements of the transportation system usingdata from the U.S. Department of Transportation (DOT) and AASHTO data to puttogether a statistically sound estimate of the requirements of the nation's transportationsystem in its several modes. We looked at both highways and transit, which is what willbe funded under the reauthorized legislation, as well as a number of other modes andissues.
AASHTO has stayed out of the formula issue, but clearly individual memberdepartments have not. The reauthorization battle is under way in Congress. A numberof different players are already on the field. There is the Step 21 bill, which has at least22 states as its sponsors. Opposing them are the 16 ISTEA Works states. They opposeeach other in this sense: Step 21 lists, compared with ISTEA, some 38 winners and 14losers. ISTEA Works lists 36 winners and 16 losers.
Then there's the administration's bill, the National Economic CrossroadsTransportation Efficiency Act (NEXTEA), which offers strong support for BTS,something that AASHTO had requested. The new legislation would strengthen BTSand its program in several areas, asking that the Bureau look at transportation issuesglobally, not just nationally, and enhance the relevance of their work to state and localgovernments. The administration is also disposed toward the use of BTS resources tohelp the states do a better job, for instance, conducting training programs. We hopethat Congress will be so disposed also. The bill would improve the effectiveness andefficiency of the data-sharing activities of BTS.
There are other players in the field and many ideas as to what the transportationprogram itself at the federal level ought to be, and they will obviously affect many of theissues that we're dealing with here.
Planning roles vary considerably among the states. A typical, relatively ruralstate that has few urbanized areas, very little transit, and highways as the primary way
Prepublication Copy: Uncorrected proofs Page 70
of moving people and a relatively stable population has one viewpoint of the kinds ofdata that it needs. That typical state is trying to operate within a relatively stableenvironment and does not need the kind of data needed by urbanized statesconcerned with rapid new growth, changing industries, and air and water qualityissues. Many of the concerns of those states are reflected in the activities of AASHTO'sStanding Committee on Planning. AASHTO is trying to look at the diversity among andbetween the states and to satisfy their different needs.
The Comprehensive Transportation Information and Planning System (CTIPS)was created mainly to work with a number of the larger urban states in making betterdata available to them. Unfortunately, CTIPS is not a well child and that is one of thereasons AASHTO is so deeply involved in this conference.
The states are now engaged in evaluating the Highway PerformanceMonitoring System (HPMS). Looking at the results of a recent survey, it is quite clearthat states have a variety of viewpoints on HPMS and what ought to be done with it.
This brings up a key issue: the difference between what the federal governmentneeds and what the state and local governments need, which is more important, andhow to sort out the roles between states and MPOs and between local governmentsand the federal government. Should we meet all data needs and at what costs andwith what resources?
The agenda for this conference zeros in on six transportation data areas, andthe background material gives many thought-provoking comments on these dataareas: socioeconomics, finance, supply system and characteristics, demand and use,system operations, and impact and performance. We also need to think about datacollection and methods, and institutional issues. All of these are important to the states,more important to some states perhaps than to others.
What are some of the issues that the state DOTs want to discuss? What answersare they searching for? Quite obviously, one is the costs and other resources that areinvolved. In a time of constrained resources, are there more efficient ways to gatherdata? Do you have to do it yourself? Can you get it somewhere else? Who does it?How is it done? What are the best ways of doing it?
Whatever data systems are put together, there must be recognition of theuniqueness of each state. Our 52 member departments—the 50 states, District ofColumbia, and Puerto Rico—are all different. No two are the same in governmentalstructure, transportation systems, geography, or makeup of the population, and thedata systems we use have to recognize that. The system should relate to the state, itsMPOs, and its cities and its counties. If it is not built and centered on this basis, it willnot be well received and well used. In addition, data systems must be flexible. Thereare many changing needs, and there will be many new ones.
What is the best way to access our data? Is the Internet an answer? Is it theanswer? Are CD-ROMs a better tool for certain kinds of data? Magnetic disk? Magnetictape? Printed reports? The medium may be different for different kinds of data and forthe different entities, public and private, that need to use it.
How do we ensure that the quality of the data is good? To a great extent, itdepends on a better understanding of statistical methods. Statistical methods need tobe emphasized more at BTS and in the states than they have been in the past. Youcan get a lot of mileage out of a small amount of data if it is statistically sound. So
Prepublication Copy: Uncorrected proofs Page 71
quality of data is very important. If you can't trust the data, the information will not beused.
What's the role of the private sector in all of this? Can the private sector be adata provider for us, at least in certain areas? Talking intermodally, we must rely on theprivate sector because it includes the airlines, the railroads, and the truckingcompanies. The last are very jealous of their operational data, as you know.
But can we go beyond that? Are there private-sector sources for our informationneeds and would it be better and cheaper to use those resources? Ultimately, what isbest done by the federal government, the states, the MPOs, the cities, and the countieswith respect to collecting and analyzing data? The institutional roles need to be betterunderstood and thought through. This was never really done because until ISTEAthere wasn't any great need for it in most areas. The new approaches to planning inISTEA, at least those concepts of it that are here to stay, are good. But to make themwork, we have to work together, understand each other, and sort out our respectiveroles.
The big challenge is to look at transportation as a system. Ultimately, it is asystem that involves highways, railways, water, aviation, and pipelines, all of whichfunction together to provide the transportation needs of our industries, our businesses,and our people. Unless we who are responsible in the public sector for guiding andproviding transportation facilities recognize that, we are not going to do the kind of jobthat should be done.
There are tremendous ties between transportation and the economy, ties thatare important to each state, to the people who live there, and to every city and county.They are important to political leaders because it's the local economy that makes upthe economy of the nation.
Why are these ties important? Take, for example, just-in-time deliveries. In 1990the automobile industry handled 25 percent of its deliveries on a just-in-time basis; in1997 that number is 95 percent and climbing toward 100. What that means for eachstate is that if the road system is down, the factory is down, deliveries are down, andincomes are down for everyone. It means that if there is a major snowstorm and ittakes 4 days to clear the roads rather than the 3 days it might take using more modernequipment, a full day has been cut out of just-in-time deliveries, causing a lot ofinefficiency in the national economy.
We need to understand what the role of transportation is in attracting andkeeping industry. The state of Wisconsin has just finished locating all of its principalemployers relative to the state's highway and transportation network using the GlobalPositioning System. In this manner they can understand why industries are locatedwhere they are and what the role of just-in-time delivery is for the state, as well as theimportance of the transportation system to the development of the state economy.Governors, state economic development agencies, and MPOs should be asking whatthey can do for their regional economy.
TRB Special Report 234, Data for Decisions, contains a two-page list ofdeficiencies in our transportation data. Although we have improved in some areas,most of those deficiencies still exist. The leading deficiency was the lack of data onsupply and demand, commodity flow, and passenger flow. A strong argument wasmade in the report that effective transportation planning cannot be done until those two
Prepublication Copy: Uncorrected proofs Page 72
kinds of flows—who's moving where and why—are understood both from a personaltransport and from a freight standpoint.
Are other federal mandates coming that will require data use? The final versionof a national freight transportation policy by was recently issued by the U.S.Department of Transportation. This is intended as a final policy statement to guidefederal decisions affecting freight transportation across all modes. Of course, whateverdecisions the federal government makes affect each of the states.
DOT's interest is to ensure that the nation has a safe, reliable, and efficientfreight transportation system that supports economic growth and internationalcompetitiveness both now and in the future. It includes highways, airports, rail facilities,ports, pipelines, waterways, intermodal transportation, and freight carriers andshippers. The policy statement allows for variations in state, regional, and localconditions, requirements, and resources, but we need to provide the state, local, andregional viewpoints.The federal government intends to make decisions on the basis of this policy.
The issue of the managing and monitoring systems established under ISTEAstill exists. We need to understand what is happening with respect to managementsystems. Louisiana, Washington, and Oregon are moving along very well with theirmanagement systems. In Oregon information is gathered and used to explain stateprogramming decisions to the public.
What does AASHTO want of this particular conference? What new resources dowe need? Is there more research that needs to be done? What are some of the areasthat need research? What other kinds of resources do we need?
I come back to the issue of training programs. How do we communicate witheach other more effectively than we now do? Are the Local Technical AssistanceProgram (LTAP) centers useful to local governments? Are there ways we can useLTAP to bring them into the data arena better than we do?
It has been suggested that we ought to revitalize the old state road conferencesand make them transportation conferences; the states, cities, counties, and MPOswould all meet once a year for 2 or 3 days and talk through what issues they'remutually working on and why and what their goals are within a state.
What are the new challenges that we're going to face? I don't think we know atthis point. We do know that we are entering a new century. What are some of thethings that lie ahead? Linking our transportation data and decision process with theland use decision process is very difficult to do, but it is considered necessary by manypeople. Transportation has been reactive for too long. We've taken whatever land usedecision was made and tried to make it work. However, transportation should lead theland use decision process, not follow it, but that means a much closer workingrelationship between the transportation community and the planning and zoningcommunity, the development community, and city and county officials. What alternativeis there? All involved parties need to work together to design limited access, todetermine capacities, and to design workable solutions. It will not be easy, but if weintend to manage the transportation system, we ultimately must do it.
Transportation and the economy, transportation and the environment,transportation and the computer age—what more do we need to know from a dataviewpoint to deal with these areas? And how do we analyze the data? Will our
Prepublication Copy: Uncorrected proofs Page 73
transportation technology change in terms of the kinds of transportation we need andhow we transport things?
Looking ahead 10, 20, 30, 40, 50 years, undoubtedly things will change ascomputers continue to develop. Therefore, we need to construct data systems that willallow us to identify trends and do some planning while they are still trends so thatwhen they become reality, we can work with them.
Look at the century now ending. It came in with railroads as the backbone ofeverything. There was a net of railroads, including urban railroads, that covered thecountry. You could travel on streetcars, literally, from New York to Chicago and backagain. All that is gone. There still are railroads, but they now serve a different purpose,and except for the Amtrak lines, they do not move people.
At the beginning of this century the automobile was a toy, but it is now anecessity that every American wants and needs to live in the kind of society that we'vebuilt. No one would have imagined in 1900 that we would move most of our goods bytruck, but we do. The airplane was invented during this 100 years and has alsobrought about drastic changes.
So I think it's safe to predict that we'll see new transportation technologies andnew uses for computers as we look ahead. How do we put together data systems, dataanalyses, and trend analyses that will allow us to meet these challenges? That is whywe are here at this conference. Given the leadership that you have here, I'm certain itwill happen.
History of Data Collection
Kevin Heanue, Federal Highway Administration
I'd like to dedicate this history to the late Jim McDonald, who for 40 years, much of itwith FHWA, was a true believer in and advocate of analytically based and data-basedplanning. I doubt that there was a data conference that he missed, and as we carry onhis work, he is in a way partly responsible for our being here.
For all of us, it helps to reflect on where we've been in relation to data programsand how we've justified them at various times. So I want to take three cuts at history interms of time, the evolution of transportation technology, and some of the applicationsof data, mostly in the highway program.
My interest and my bias are knowing how to convince Congress to invest intransportation and how to convince the public that there's a need to invest in newcapacity. In my job, I am challenged on those two fronts every day.
When I was asked if I'd make this presentation, I happened to be reading a newbook on Meriwether Lewis of Lewis and Clark fame. The introductory chapters areabout the Colonial and pre-Colonial periods in the United States. The Lewis and Clarkexpedition was really about transportation, economic development, and economiccompetitiveness—how to reach the Northwest in a way to prevent the Russians frommoving into that territory and to beat the British to it. The expedition explored parts ofthe Louisiana Territory, where the French were charging a tariff in New Orleans for all
Prepublication Copy: Uncorrected proofs Page 74
the goods coming down the Mississippi. Transportation then was very central, and thetaxes associated with international trade were equally central to the young nation.
My next source is America’s Highways, a 220-year history of highways writtenby a group of FHWA retirees at the time of the Bicentennial. On the basis of that text, Iwant to talk about a series of firsts.
I was struck by the fact that early transportation in this country was intermodal.There really were no options. You shipped goods by boat as much as possible or youtraveled by horseback or as a pedestrian on trails because there were relatively fewroads.
The first federally funded road appeared in 1755 when General Braddock drovea military road west from northern Virginia in the French and Indian War. It's nowroughly the route of Virginia Route 7. This single-purpose, one-effort road disappeared3 years later because it wasn't maintained.
The first real road in the country, according to the FHWA history, was not builtuntil 1775. It took the entire Colonial period almost up to the time of independencebefore you could make the trip from New York to Philadelphia by land with a wagon.
In the Colonial period, I found the first application of the “soft match.” Countryroad authorities required all men—landholders, freemen, indentured servants, andslaves—to serve time maintaining the roads. It was a broadly based requirement, butyou could contribute either your time or your money to the effort.
In Maryland and Virginia, I found the first MPOs. In the counties, eight land-owning men made all the road decisions. The MPO concept comes in because theGovernor could veto any of their decisions. In the Colonial period, we also have thedevelopment of the first state transportation plan. In 1791 in Pennsylvania, a plan wassubmitted to the state legislature laying out toll roads, roads that would remain free,and sites of canals.
Surprisingly, in President Washington's administration, we had the firstapplication of innovative financing. Colonel Ebenezer Zane of Wheeling, Virginia,asked Congress for a franchise to construct a road into Ohio. He said to Congress thathe didn’t want them to pay him anything to build this road; he would build it with hisown funds. He asked for a square mile of land at each of the three major rivercrossings, and said that he would earn enough money back to pay for the road.Congress granted him the franchise, he built the road, and it was very successful. Alsoof interest, Congress said, "You have to operate ferries at each of these threecrossings, and federal judges will set the tolls."
During Jefferson's term as President, we find the first National TransportationPlan. Submitted at the request of the Senate, it was characterized as "comprehensive"and "forward-looking." The plan consisted of an inventory of the transportationresources of the country—roads and canals. The FHWA historians describe it in termsrelevant to all plans since:"Unfortunately, it had little immediate effect on U.S. transportation policy."
In America’s Highways there's a discussion by Secretary Gallatin, thenSecretary of the Treasury, that has many firsts in it. Gallatin uses macroeconomics todescribe how toll roads contribute to the national wealth. He also describes abenefit-cost analysis and the role of interest costs in doing that analysis. With respectto deficit financing, he goes out of his way to say that there are still public benefits even
Prepublication Copy: Uncorrected proofs Page 75
if a toll road becomes defunct. The bondholders lose, but the public still gains becausethe infrastructure exists. There is even a discussion of “induced travel,” outlining thevalue of benefits from diverted traffic and new traffic in the form of loads that couldn'tbe carried without the investment. We ought to try to resurrect some of those principlesand put them in more of our reports to Congress today.
I'm going to skip over the 1800s. There's just too much—toll roads, canals,railroads, steamboats, and the changing role of government. It's a fascinating period,but I want to digress a bit and talk about the evolution of technology. In a paper by BillGarrison about 10 or 15 years ago, he talked about the evolution of transportationfacilities and how, through much of history, the sail and the horse and oxen were theonly means of transportation. Speed was governed by the ability to sail or the ability ofa horse to move on its own or pull a wagon.
Then in the 1800s, within a short period of time, an enormous change wasbrought about by relatively few inventions. The steam engine brought us both therailroad and the steamboat, orders-of-magnitude improvements in efficiency. Then theinternal combustion engine was invented and we had both highway and air travel,another order-of-magnitude change only 60 years after the steam engine. Next,another increment occurred with the jet engine, which opened up international travelin a way that the piston engines hadn't. After that we have to think in increments ofchange; no order-of-magnitude changes are on the horizon. Technology, particularlyinformation technology, may bring us order-of-magnitude changes in behavior. We'llhave to see.
The evolution of information technology begins with the history of FHWA’spredecessor agencies, the Bureau of Public Roads (BPR) and before that the Office ofRoad Inquiry. In 1894, the Office of Road Inquiry sent maps of the then-known roads tomost of the counties in the eastern states and asked county officials to correct themaps and add any new roads. Thus, this new agency was in the data business withinits first year.
A very important point timewise for this conference is 1904, when thegroundwork was laid for the highway statistics program. Every county in the UnitedStates received one of 60,000 questionnaires asking about taxation and sources ofrevenue, road laws, total expenditures for roads, length of roads, and surface types ofall roads—the first national inventory. The survey was conducted only in rural areasbecause it was believed that the cities had their own resources and that the federalgovernment didn't have to get involved at that time. Nevertheless, those datacategories of 1904 have carried through into our highway statistics today. I guess weshould ask ourselves whether we still need them after almost 100 years.
I was struck by the fact that the inventory listed 2,150,000 miles of roads and78,000 cars. Cars were used primarily in the city because the rural roads still weren'tgood enough in 1904. Amazingly, we now accommodate the most automobiles thatwe've ever had on less than twice the number of road miles that we had at the time ofthe automobile’s invention.
Next I would like to shift to early attempts at planning. Statewide planning wasbegun in pilot states. Thus, counting traffic and weighing trucks became the beginningof the scientific basis for looking at surface transportation. A landmark occurred in1925 in Maine, where planners established a relationship among population, vehicle
Prepublication Copy: Uncorrected proofs Page 76
ownership, and traffic, forming the basis for making 5-year travel forecasts for the firsttime.
Urban transportation planning first occurred in 1927 in Cleveland with theRegional Area Traffic Survey. Federal, state, county, and city officials cooperated in thefirst metropolitan urban transportation study, and BPR paid 50 percent of the cost. Inthe 1920s one of the best pieces of legislation to affect the highway program, theHayden-Cartwright Act, set aside 1.5 percent for planning and research. (It didn't haveto be spent, but up to 1.5 percent could be set aside.) Highway planning surveys wereset up in 1934, and the systematic data collection that has been the backbone of thehighway and then the transit programs dates back in a comprehensive way to thatpoint. As traffic grew, something significantly better than the two-lane road wasevolving in the urban areas, the urban parkways, which were quite different from therural primary highways.
In a series of landmark reports to Congress in the 1930s and 1940s (Toll Roadsand Free Roads, Interregional Highways, and Highway Needs of the NationalDefense), BPR did a very effective, analytically based job of characterizing the natureof the highway problem and options for addressing it, primarily the need for a higherclass of highways. All this was leading up to the achievement 20 years later of theInterstate system.
Another big landmark occurred in 1936 when the Pennsylvania legislatureauthorized studies leading to the Pennsylvania Turnpike, which opened in 1940, thefirst long-distance freeway.
In 1941, the first year of World War II, Congress in the first Defense Act set aside$10 million for postwar highway planning. In terms of today's dollar, that must beequivalent to $100 million. (Planning was really respected in those days.) In 1944,there was a major highway bill looking toward postwar highway construction on theroads that had not been maintained during the war. A key point in the 1944 act wasurban eligibility. For the first time the federal government funded roads within urbanareas, the urban extensions of the rural primary system.
The late 1940s to the early 1960s was the age of the large-scale urbantransportation studies characterized by massive home interview surveys coupled withexternal urban traffic surveys on major roads. These were incredible efforts of datacollection and processing in precomputer days. I recall coming to work for FHWA at theend of that period and seeing rooms of cartons filled with punched cards containinghome interview survey results. About 90 percent of the urban studies was datacollection and 10 percent was analysis. They were, in effect, a one-shot analysisbecause there was no ability to continually analyze the data or to establish acontinuing planning process.
During that period a tremendous debate was going on between those whobelieved that the only way to do urban transportation planning was with a largeinventory of data and those who believed in the emerging mathematical simulations,the first traffic models. I credit Al Voorhees, who in 1955 wrote a paper titled "GeneralTheory of Traffic Flow," as being the true founder of traffic modeling. The paperevolved from his Yale Bureau of Highway Traffic thesis, and it won the Institute ofTransportation Engineers President's Paper Award that year. His work permitted themovement from data-based studies to simulations using small sample surveys.
Prepublication Copy: Uncorrected proofs Page 77
Voorhees was also a promoter of small sample home interviews for calibrationpurposes.
At that time I happened to be assigned as a trainee to the Hartford study thatVoorhees, then with the Automobile Safety Foundation, was directing. When thegravity models didn't seem to be working, we made 200 home interviews in order tocalibrate the models and continue the study.
Governor Ribicoff of Connecticut at the time wanted to complete the ConnecticutInterstate program in 4 years, for which traffic forecasts were needed. Voorhees wasbrought in with some FHWA staff and got the job done. The late Lee Mertz went toHartford and taught them how to compute trees for traffic assignment. As I recall, theyhad a Burroughs data processing computer. With 78 zones and a fairly lean network,computing the trees took 22 hours, something we do in seconds now. That was thenature of urban planning in those days.
There were three schools of urban transportation planning. FHWA (BPR) waspromoting a gravity model trip-generation approach. Doug Carroll, then Director of theChicago Area Transportation Study (CATS) and later Director of Tri-State RegionalPlanning Commission in New York, led another analytic school that I'm going tocharacterize as a geography-based methodology. A group of professors from theUniversity of Pennsylvania who conducted the Penn-Jersey Study, which became theDelaware Valley Study, formed another competing school. After Doug Carroll hiredLee Mertz for Tri-State, Mertz returned to FHWA.
The 1962 Highway Act mandated urban transportation planning. The NationalEnvironmental Protection Act in 1970 and the first Earth Day changed forever thenature of the highway planning business. In 1964, the Urban Mass TransportationAdministration, now the Federal Transit Administration, evolved as a part of theDepartment of Housing and Urban Development (HUD). Late in that period HUD’s 701comprehensive planning program ended, leaving transportation planning on its own.
At TRB conferences in the 1970s those interested in metropolitan planningheard a lot of talk about emerging "third generation” models, but they never appeared.We are just now on the verge of reinventing the planning process, and it is hoped thatthe TRANSIMS project may result in our next-generation model.
The year 1990 brought ISTEA and its linkage to the Clean Air Act. Theintermodal nature of ISTEA resulted in significant changes in planning that will berecalled as future histories are written.
Reauthorization 1996: what does it mean for planning? I am personally proudof the accomplishments we've made in transportation planning, but I think we have todo a lot better. We still have major problems in reaching the right audiences with theright message. Let me make the following comments:
1. It's a personal frustration of mine that the current reauthorization is notanalytically based. There was a lot of outreach and input on how to restructure ISTEA.Everyone agreed that there should be minor restructuring, but the planning communitydidn't bring an analytical base to that process.
2. Next I stress the importance of a more effective dialogue with Congress. Idon't think that cost estimates do the job. We've lost credibility by describing toCongress the dollars we could spend if the “needs estimates” were provided to us in
Prepublication Copy: Uncorrected proofs Page 78
program dollars. Instead we should talk in terms of the economic benefits these dollarswill bring as investments.
3. The current planning process is not geared to intelligent transportationsystems (ITS). To access funds under ISTEA in metropolitan areas, you have to gothrough the metropolitan planning process and then through the statewide planningprocess with their project plans.Our planning process tools are structured around providing new capacity, adding anincrement of a lane, 2,000 vehicles an hour. They're not geared to the incrementalimprovements that ITS deals with.
4. A successful planning process ends with a transition to project development,and we are not doing very well with that transition. Recently I looked at anEnvironmental Impact Statement on a major project to see how planning was covered.The four alternatives studied were described in only four pages, but the transitalternative got less than a page, and the no-build alternative got a page and a half,most of which was a description of the geography of the route, where it would go, andwhat it would cross. There were four pages on what deicing compounds would do tothe adjacent flora and fauna, and four pages on one endangered bird species andhow it might be affected. Despite the enormous annual investment in metropolitanplanning, we have a “disconnect” between our environmental analysis and the projectdevelopment.
There's a highway project in California, the biggest one in the country todaywith 1,500 homes and over 3,000 people to be displaced. The project was justified interms of capacity as determined in the Highway Capacity Manual: Adjacent routeswould be operated at Level of Service D if the project were not built, and a Level ofService C could be achieved if the project were built. That's the reasoning to convince3,000 people who are going to lose their homes that this project is needed.
5. On the international scene, I find myself reaching for international answers todomestic questions these days. Certainly in the Pacific Rim countries, you can observein action ITS concepts that are just being talked about in the United States. As forinnovative finance, look to both Europe and Asia for sucessful ideas. We've got toopen our eyes to the world.
6. I'd like to close with a preview of a TRB report on sustainability, an issue thatis going to be significant for the next 20 or 30 years. The theory of sustainability asksthe question, How do we meet the needs of the present without compromising theability of future generations to meet their needs? The National Academy of Sciencesappointed a committee to study transportation and a sustainable environment. U.S.transportation does have a sustainability problem, not with the criteria pollutantsaddressed today through the Clean Air Act or with fuel availability, for which manyresources and alternatives exist. Global warming, biodiversity, and habitat loss arethree sustainability issues described in the report in some detail. I believe that theenvironmentalists are going to be concerned once that report comes out and say,"What are you going to do about it?"
Global warming is a global problem. We could shut down U.S. surfacetransportation today, and only 5 percent of the global problem would have gone away;95 percent of it is still there. It requires a long-term, worldwide solution.
Prepublication Copy: Uncorrected proofs Page 79
Outreach Efforts
Rolf R. Schmitt, Bureau of Transportation Statistics
In summarizing the outreach efforts for this conference, my comments are based oninsights gained from participation in several forums, including Session 78 on dataneeds for state and local decision making at TRB's Annual Meeting last January, inwhich many of you participated; many committee meetings at the TRB Annual Meeting;meetings of the Association of Metropolitan Planning Organizations (AMPO), theUrban and Regional Information Systems Association (URISA), and AASHTOcommittees, particularly the Standing Committee on Planning.
We also experimented with outreach via the Internet. The Internet is still ayoung and evolving technology, evolving so rapidly that sometimes we areoverwhelmed by it. Our Internet site for this conference did not get much use, partlybecause we spent so much time figuring out how to make it work and how to makepeople aware of it. Nevertheless, it shows great promise for future efforts.
To give an idea of the Internet's explosive growth and the problems ofmanaging it, 18,000 documents were downloaded from the BTS site in the month ofJanuary, an increase of 80 percent over the previous 6 months, and there's no end insight to that growth pattern. BTS will keep the data needs site on the Internet as a wayof getting the results of this conference out to the global community.
What are some of the things we've learned from these outreach activities? We see clearly that the importance of data and information is growing for a
number of reasons and that this importance is belied by our tendency to apologize forthe need to collect data. In times of budget constraints, agencies will spend money onfixing potholes rather than on collecting data on them. However, if we don't collect thedata on potholes, how are we going to know which potholes are the most important todeal with first? This tendency to apologize for the need to collect data rather thandemand resources for data collection seems to be partly because data collection is anafterthought in the budget process.
Yet there was a time when data collection was considered very important.Although little was known about travel demand, forces of change in transportation, andfinding solutions to transportation problems, there was an appreciation for data andinformation.
The growing importance of information is underscored by the enormous amountof reorganizing, reengineering, restructuring, resizing, and rethinking in statedepartments of transportation (DOTs). The same is probably true for metropolitanplanning organizations (MPOs).
State are talking about downsizing and trying to deliver on the more-for-lessmantra. Several state DOTs assume that information systems will be the magic bulletfor delivering more services with fewer people. These states are seeking better waysto handle data and are asking what kinds of data are relevant to more efficientoperations. The importance of accountability is very real at all levels of government. Performance measurement is an issue that is not going away.

Prepublication Copy: Uncorrected proofs Page 80
Although AASHTO has been very strong in telling the federal government not toget involved in state-level performance measurement, particularly in terms of tellingthe states what to do, the states recognize that they must do performancemeasurement for their own purposes.
Technology is also changing the supply and demand for transportation data.Intelligent transportation systems, geographic information systems (GIS), and theInternet are technologies for effective collection, analysis, display, and distribution ofdata.
Successful efforts to democratize data access have created a whole newcustomer base. In the past, transportation information was available only to the bigMPOs and the states that could spin nine-track tapes and manage punched cards. Now, however, anyone with a microcomputer can access enormous amounts ofinformation on CD-ROM or download it from the Internet. The smallest agency or localcitizens group can do more analysis today than the big agencies did years ago.
Along with the ability to distribute so much data to a wider user communitycomes the job of explaining to this new customer base how to use the sophisticateddata sets. My favorite example is the Truck Inventory and Use Survey, in which severaldifferent variables represent the weight of the truck. The appropriate variable dependson the application. It is an enormous task to provide the educational and technicalsupport needed to help a broader community use these powerful data sets effectively.The job continues to grow as the community expands and finds new applications fordata.
Data needs also change with apparent shifts in state DOT planning horizons,which appear to be moving from a traditional 20-year to a 10-, 6-, or 5-year cycle, moreclosely linked with the state legislature and with programming of reconstruction andother investments. The data requirements to support shorter-term, locally specificactions are quite intensive.
Data needs are also being driven by new or reemerging topics such as freighttransportation. Goods movement has not been a major concern for most state DOTsand MPOs for years, but freight is a hot topic today, a new frontier for both datacollection and the development of analytical methods for state DOTs and MPOs.
I spent much of last summer on some state field visits, dovetailing those visitswith FHWA’s parallel effort to review the Highway Performance Monitoring System(HPMS). The initial focus of the visits was to look at internal versus external data flows. We found that most data flows are internal to state DOTs and suspect that the same istrue for MPOs. For example, the area of programming involves collecting informationon highway condition to feed into models that identify where to do next month'srepaving. The data collection, model run, and decision making are all internal to thestate DOT.
We should not ignore these internal flows and focus just on external flow amongstates, MPOs, and federal agencies. Help with management of these internal flows interms of technical assistance may be central to the role of AASHTO, TRB, AMPO, andeven the federal sponsors. Federal and association sponsors collectively wish toadvance the state of the art in facilitating both internal and external data flows. We arenot here to say what should be done; rather we are seeking ways to identify and sharethe best practices for accomplishing data collection.
Prepublication Copy: Uncorrected proofs Page 81
We have had surprisingly few calls for improving consistency and standardsetting. On the one hand, such improvements would support easier comparisonsamong jurisdictions and reduce costs by achieving economies of scale in developingmethods of data collection and analysis. On the other hand, improved consistencymay not support the current diversity of decision-making environments. We do notwant a lowest common denominator that serves no one.
There is an enormous diversity in decision making, data collectionarrangements, and assorted institutional arrangements. Urban-area traffic counting isa good example. Some states do traffic counts for MPOs. In other states, or other partsof the same state, the MPO may do the counts under contract to the state, or the MPOmay do its own counts.
With respect to external flows among levels of government, we have observedseveral different models of data sharing. The traditional models are national surveysand censuses. Many local data needs are met with journey-to-work data from thedecennial census, the Commodity Flow Survey (CFS), the forthcoming AmericanTravel Survey (ATS), and the Nationwide Personal Transportation Survey (NPTS).Although these data collections are designed initially to meet national needs, topicsare often included or a large enough sample is used to support state and localapplications. With NPTS, states and MPOs may pay to have larger samples taken intheir areas to support local applications. HPMS is a very different model because it is astate-based sample implemented by the states to create a national picture.
The National Spatial Data Infrastructure (NSDI) is another model for datasharing, established to create an electronic map of the United States. Counties aresupposed to share their geographic data bases with states, which in turn sharegeographic data with the national government. NSDI recognizes that those doing themost detailed work are at the local level and that GIS standards would provide thetechnical ability to merge the local maps into a national picture. Establishingstandards and requiring everyone to share data raises all sorts of interestinginstitutional problems, which are often—perhaps unfairly—called “unfundedmandates.”
Another model is local incident reporting, best illustrated by the Fatal AccidentReporting System (FARS). Local police officers report all fatal crashes in a consistentformat; the results are totaled and reported to the federal government. A problem withthis model is that police officers are more concerned with aiding the injured andrestoring traffic than filling out reports. Incomplete data often result.
Missing data in incident reports involving trucks are resolved by a follow-upeffort called Trucks Involved in Fatal Accidents (TIFA), which provides yet anothermodel. The federal government pays for postcrash interviews to obtain data missing inthe original accident reports. This model was recommended by Lee Mertz as a goodone for improving data quality in general by using follow-up teams on a sample oruniverse basis.
Another model is establishment reporting, in which government agencies fill outreports to other agencies, such as the Section 15 reporting system for transit, andprivate-sector establishments report to regulatory agencies, such as the SurfaceTransportation Board.
Prepublication Copy: Uncorrected proofs Page 82
The final model is loosely described as synthetic data. This model includes themany cases in which data are generated from models that the rest of the world maytreat as actual observations. We do this with economic data in the form of input-outputtables and locally when we report trends based on applications of the four-step traveldemand forecasting process to turn small samples of information into traffic flows.
In conclusion, we have seen through this outreach a period of great institutionaland technological change. These changes are often unnerving but also hold greatpromise. There is a tendency in our business to hope that technology will bail us out.Historically, technology has come up short, as I often articulate in a speech about GIS,“25 years of broken promises, but there's still hope." However, recent improvements inmonitoring and control systems, in data delivery media, and even in GIS softwaresuggest that the promise of technology may come true this time.
Will technology fundamentally change the game and open up newpossibilities? Certainly the development of computerized logistics managementsystems and electronic data interchange affects the freight side. Can governmentagencies find ways to meet public data needs by capturing data from those systemsinstead of using obtrusive surveys?
The way in which we monitor truck weights is an example of how technologycan reduce costs, reduce respondent burden, and improve data quality. It can alsochange the nature of the data being collected. Formerly, when we pulled trucks overand put them on a portable scale, we could learn from the driver what was in the truck,where it was going, and so forth. However, the results were biased because manytruckers bypassed the scales. It was also expensive to have personnel on site to makethe measurements. Now we use weigh-in-motion equipment. The truckers are notimpeded, we get more observations, and data collection costs are reduced. Unfortunately, this very efficient, very effective system tells us only the axle weight andspacing of each truck. We no longer know what is in the truck or any characteristics ofthe driver.
Changing technology may help us do what we used to do more efficiently, buttechnology can fundamentally change the kinds of information obtained.
Future Trends
Stephen Lockwood, Parsons, Brinckerhoff, Quade & Douglas, Inc.
This conference has a very broad focus, as defined by the six data areas to becovered, many of which reflect a federally driven historical preoccupation with capitalfacilities provision and preservation and data systems that relate to capital stockissues, whether for asset management or asset investment.
It is increasingly important to focus on data relating to the core responsibilities ofstate and local governments (as distinct from the federal government) as the owners ofthe infrastructure itself, namely, service provision and system performance. As wemove into the 21st century, making the delivery of service more efficient will become acentral focus of institutions that own transportation infrastructure. The institutional
Prepublication Copy: Uncorrected proofs Page 83
mission will focus increasingly on the provision of service through systems operationsand demand management as distinct from construction and preservation. This missionwill include an increased focus on performance management in addition to assetmanagement and will affect both data needs and data development.
The performance orientation will include data focused on service attributes, aset of attributes that go well beyond the indicators that preoccupied our data systemsin the past, which were principally costs, capacity, volume, and speed—the traditionalasset- management-oriented data items.
What households and commercial users want today is reliability, safety andsecurity, navigation aids, and Yellow Pages data. However, our data systems areentirely focused on costs, capacity, and speed, to the exclusion of the rest. Thus, whatcustomers want and what our changing economy demands require a set of data itemsthat we're not currently addressing. We need to move toward a performance focus andbegin to recognize data that reflect operations and management system status andother kinds of customer-related information.
In the course of producing this new kind of information related to serviceattributes that reflect performance, we're going to be looking at new data sources; atnew players, both public and private; at a very different framework of technology andinstitutions than in the past.
Much of this information is going to be produced as a by-product of intelligenttransportation systems (ITS), which are organized around the production of real-timeinformation for operational management of the system and customer information inreal time during system use.This same information will be useful for the planning, budgeting, and policy-makingfunctions that traditional data systems have historically served at the state and federallevels.
A major change will be the attitude toward this information. In ITS, informationitself is a form of service and has a service functionality, service value, or maybe evena market value. It is not hard to imagine the existence of a relatively complete profile ofsystem performance and origin-destination matrix on a link-by-link, hour-by-hour, oreven minute-by-minute basis—a huge database—used for operations but alsoavailable for purposes that are not operational, such as planning and policydevelopment.
ITS promises to produce a data flood. It may not be visible to most of us at thisconference because those who are producing this information are not part of thisconstituency. I think that's something we need to be concerned about. The ITScommunity has developed a systematic architecture for transportation systemsoperation built around a rigorously defined network of automated data collectionanalysis and transfer covering much (although not all) of the same substantive dataitems. At other conferences, largely outside the orbit of most of us here today, othertransportation professionals are outlining their data needs, how they're going todistribute the data, and defining the standards and protocols for the data items, thedata descriptions, the performance specifications. A major investment is being made.
If we're going to have any impact on that process, we need to get involved inITS architecture development. This architecture presents a rigorous, well-thought-outframework that
Prepublication Copy: Uncorrected proofs Page 84
• Recognizes that there are a variety of data users who are providing transportationfunctions in an operations and management sense, • Includes a communications system to collect and transmit that information amongthe parties who agree to use it, and • Has an institutional framework involving many players outside our normal orbit,such as law enforcement agencies and private-sector service providers.
In the future, many data-intensive services will be provided by the private sectorvia in-vehicle devices supplied by “independent service providers” who will developlarge data bases that may be of interest.
My main message, therefore, is that a great deal of new data is already beingdeveloped by parties outside this room, with policies and standards being set byparties outside this room. New technologies are constantly being developed relating todata storage, and decisions about those technologies are being made by partiesoutside this room. There are multiple users for the information that's beingdeveloped, customers in real time, system operators who come from the sameinstitutions that many of us represent. I believe this represents an important gapbetween the planning and the operations community that we need to really work hardto overcome. We're the stakeholders who stand to gain by bridging this gap.
It is estimated that between the public and the private sectors, the ITS industrywill invest some $450 billion in the next 15 years in information-based services andproducts. No one is going to come to us and say, "How would you like to have this dataformatted for your purposes?" We have to go to them. We need to develop newrelationships.
In developing new relationships between operators (who have data) andplanners (who want data), several key challenges must be met, particularly where theprivate sector is involved, such as privacy and disclosure issues and proprietary data.In the future, our major challenge will be too much data rather than inadequate data.
However, the opportunity to grapple with the substantial new sources ofinformation that ITS promises—and to shape their development in ways that may bemore suitable to our interests—is one we must work to capitalize on. The increasedfocus on systems performance and the development of ITS information systemsrepresent a tremendous challenge, and we must pay attention.
In any case, I'll leave you with the sense that in the future we'll either be hereplaying the same game that we've been playing for the last 20 years, only with lessmoney, or we can be part of what is an enormously rich and dynamic environment interms of transportation-related information that brings its own issues, its ownchallenges. The best expression of our understanding of what the future holds will bethat the next conference or another conference of this nature should bring these twocommunities together for our mutual benefit.
Prepublication Copy: Uncorrected proofs Page 85
EPILOGUE
Vision for the Year 2027: What We Have
Accomplished
Bruce D. McDowell, Intergovernmental Management Associates
These comments are offered from the future to describe the 30 years of achievement ininformation systems that could result from the findings of this conference. It is the year2027. The U.S. Department of Transportation (DOT), state departments oftransportation, and metropolitan planning organizations are all linked by a commonperformance-based geographic information system (GIS). Each of these agenciesuses the system to manage its own programs for peak performance. Data reportingbetween agencies is no longer necessary: any report an agency needs can bedesigned and downloaded from the common GIS the same day.
This modern data system has allowed DOT to demonstrate the performance ofthe nation's intermodal transportation system in maintaining the United States’ statusamong the most productive and competitive nations of the world, in improving andprotecting the environment, in conserving energy and other natural resources, inpromoting social and environmental justice, and in ensuring that the quality of life inAmerica remains the envy of the world’s other nations. Using the common datasystem, DOT has also convinced Congress to raise transportation funding to adequatelevels.
These great strides were possible because of a meeting among the best mindsin America’s transportation data community in March 1997. That symposium in Irvine,California, led to insights about how to harness the full potential of new GIStechnologies developed in the late twentieth century to serve the needs of all of thenation’s transportation agencies.
The task was not easy for a number of reasons. First, the federal budget wastight, putting great financial pressures on state and local resources. Second, thenecessary performance measures were neither agreed on nor widely available. Third,data collection and reporting requirements were still duplicative, burdensome, andprone to significant opposition.
The key breakthrough occurred near the end of the Irvine conference, whenmost participants realized that their agencies were all working toward the sameperformance goals and needed the same kinds of performance measures, although atdifferent levels of detail and on different map scales. When conference participantsrealized that the rapidly evolving GIS technologies allowed them to move back andforth between these different scales with minimal effort and to help each other stay upto date with virtually no duplication of effort, the data budgets that they had believed tobe inadequate became equal to the task. Pooled data began to meet everyone's

Prepublication Copy: Uncorrected proofs Page 86
needs more effectively and efficiently and even began to meet unanticipated needs ofthe numerous interest groups and citizens who were more involved in transportationplanning processes after ISTEA and its proposed successor, NEXTEA. The planningprocess itself became much quicker and more effective because of the new federalregulations.
Another important breakthrough at the conference was the agreement that stepsshould be taken to ensure that all transportation data would have unquestionablevalidity and objectivity, so that transportation policy debates would not be marred byunproductive squabbles over the quality of the information.
These agreements resulted in a gradual reversal of the dangerous but growingtrend in the late 1990s toward reducing the amount of transportation data beingcollected. That trend, generated by the burdens of duplicative data collection andreporting requirements, was exactly the opposite of what the times called for. Forexample, ISTEA had established several new performance goals in 1991 that neededmore, not less, data support. But, the inefficient data systems of that time wereburdening the statewide and metropolitan planning processes and stressing the verytight planning budgets in the 1990s.
In addition, Congress had passed the Government Performance and ResultsAct in 1993, calling on all federal agencies to develop results-oriented, performance-based budgeting. Quantitative performance measures were at the heart of that effort,just as they were at the heart of meeting ISTEA's objectives. But the data burdens ofthe day were such that FHWA issued a draft strategic reevaluation of the HighwayPerformance Monitoring System (HPMS) just 2 months before the 1997 Irvineconference requesting comments on a series of proposals, most of which would havecut back on the amount of data that would be reported to Congress. The basic thrustwas to reduce data burdens by reducing data, rather than to reduce burdens by moreclosely aligning the intergovernmental transportation goals of the federal, state, andlocal transportation agencies, and integrating the performance measures of thoseagencies to meet their similar management goals.
The Irvine conference played a decisive role in directing the HPMSreevaluation back toward fuller use of the emerging information technologies toenhance performance data, while reducing the burdens of special data collectionrequirements not tied to the needs of all the parties. This redirection kept HPMSevolving steadily toward the kind of exemplary performance and results-measuringmechanism that Congress and the electorate were coming to expect in the latter part ofthe 20th century.
The key concept endorsed by the Irvine conference was that all the datarequired should be natural by-products of the data needed for managing theirprograms effectively, efficiently, and equitably, and being held accountable forprogram results. Only if the managers and their constituencies are relying on thosesame data to help achieve desired performance and results can others be assuredthat the data are accurate.
Fortunately, other events were occurring at the time of the Irvine conference thatreenforced the ideas and solutions put forward there. For example, the FederalGeographic Data Committee (FGDC) was taking initiatives to coordinate a host ofrelated federal agency data activities. FGDC had just added state and county
Prepublication Copy: Uncorrected proofs Page 87
members to begin forging the vital intergovernmental data links on which the presentintegrated GIS system depends.
President Clinton and Vice President Gore also were strong supporters of thecreation of the National Spatial Data Infrastructure (NSDI), which provided the broaderframework that now hosts the 21st-century tracking system for transportationperformance and results. Much of the intellectual underpinning for NSDI wasdeveloped by the Mapping Sciences Committee of the National Academy of Sciencesin the mid-1990s.
By the mid-1990s, the National Academy of Public Administration (NAPA) had amajor study under way on the future of the federal mapping, surveying, and chartingagencies, which eventually brought government-wide efficiencies that led to the robustand highly integrated GIS system of today.
On this 30th anniversary of the 1997 Irvine conference, I want to express theappreciation of the entire transportation community for the seminal work of that smallband of far-sighted souls who charted a new direction into the new century. All of ourprograms would be greatly diminished without the vital contributions these visionariesmade at a crucial turning point in history.
PARTICIPANTS
Glen Ahlert, MPO Staff Director, Lee County MPO, Southwest Florida Regional Planning Council,P.O. Box 3455, North Fort Myers, FL 33918-3455.Marsha Dale Anderson, President, Street Smarts, 3400 McClure Bridge Road, Bdg D, Ste A,Duluth, GA 30136-3281.Robert Arch, Director of Transportation, Washington County Planning Commission, 100 W.Washington, Room 320, Hagerstown, MD 21740.Jerry Baldwin, Librarian/Information Services, Minnesota Department of Transportation, B-23Transportation Bldg., 395 J. Ireland Blvd, St. Paul, MN 55155.Gene Bandy, Manager of Technical Services, Baltimore Metropolitan Council, 601 N. HowardStreet, Baltimore, MD 21201.Franis T. Banerjee, Assistant General Manager, Los Angeles City Department of Transportation,221 North Figueroa Street, Suite 500, Los Angeles, CA 90012.William S. Beetle, Director, Transportation Systems Planning, New Jersey Department ofTransportation, 1035 Parkway Avenue, CN609, Trenton, NJ 08626.Duane Bentz, Planning Engineer, North Dakota Department of Transportation, 608 East BoulevardAvenue, Bismarck, ND 58505-0700.Cell Bernardino, Deputy Director, Strategic Planning & Administration, Department of Public Works,2000 14th Street, NW, 6th Floor, Washington, DC 20009.Phil Boyd, Director of Transportation, Atlanta Regional Commission, 200 Northcreek Suite 300,Atlanta, GA 30327.Michael S. Bronzini, Director, Center for Transportation Analysis, Oak Ridge National Laboratory,Bldg 4500N, Room H34, MS 6207, P.O. Box 2008, Oak Ridge, TN 37831-6207.Deborah Buchacz, CTIPS Coordinator, AASHTO, 444 North Capitol Street, NW, Suite 249,Washington, DC 20001.Coan Bueche, Chief, Planning Division, Lousiana Department of Transportation and Development,P.O. Box 94245, Capitol Station, Baton Rouge, LA 70804-9245.Carolee Bush, Information Services Manager, Bureau of Transportation Statistics, 400 7th Street,SW, Room 3430, K-20, Washington, DC 20590.Mori Byington, Traffic Planning Director, Bannock Planning Organization, 280 South Arthur Avenue,Pocatello, ID 83204, Larry Caldwell, Principal Transportation Engineer, Virginia Department ofTransportation , 1401 E. Broad Street , Richmond, VA 23219.
Prepublication Copy: Uncorrected proofs Page 88
James Y. Campbell , Director of Planning , South Carolina Department of Transportation , P.O. Box191 , Columbia, SC 29202.Russell B. Cappelle, Jr., Chief Transporttion Planner, Central Transportation Planning Staff,Boston Metropolitan Planning Organization, 10 Park Plaza, Suite 2150, Boston, MA 02116-3968.Frank Ching, President, Ching Corporation, 29 Crafts Street, Suite 470, Newton, MA 02160.Ed Christopher, Chicago Area Transportation Study, Director of Information Services, 300 WestAdams Street, Chicago, IL 60606.David Clawson, Program Director, AASHTO, 444 North Capitol Street, NW, Suite 249,Washington, DC 20001.Chapin Cook, Director, Genesee County Metropolitan Planning Commission, 1101 Beach Street,Room 223, Flint, MI 48502-1470.James L. Covil, Senior Vice President, Wilbur Smith Associates, P.O. Box 92, Columbia, SC29202-0092.Michael Curtit, Missouri Highway and Transportation Department, Highway and TransportationBldg., P.O. Box 270, Jefferson City, MO 65102.Carol D. Cutshall, Director, Bureau of Environment, Department of Transportation, P.O. Box 7965,Room 451, Madison, WI 53707-7965.Pierre-Marc Daggett, Transportation Research Board, National Research Council, 2101 ConstitutionAvenue, NW, Washington, DC 20418.Sandeep Dey, Executive Director, West Michigan Shoreline Regional Development Commision,P.O. Box 387, Muskegon, MI 49443-0387.G. Bruce Douglas III, Principal Associate, Parsons-Brinckerhoff, 465 Spring Park Place, Herndon,VA 22070.Kenneth J. Dueker, Director, Center for Urban Studies, Portland State University, P.O. Box 751,Portland, OR 97207-0751.John Duncan, Director, Portland Area Comprehensive Transportation Study, 233 Oxford Street,Portland, ME 04101.David Dysard, Transportation Director, Toledo Metropolitan Area Council of Governments, P.O.Box 9508, Toledo, OH 43697.William Ebersold, Director, Office of Statistical and Economic Analysis, Maritime Administration, 4007th Street, SW, MAR-450, Washington, DC 20590.Nathan Erlbaum, Associate Transportation Analyst, New York Department of Transportation, 1220Washington Ave., Albany, NY 12232.Jerry Everett, Metropolitan Planning Division, Federal Highway Administration, 400 7th Street, SW,HPM-22, Washington, DC 20590.Chuck Fergen, Financial Analyst, Department of Transportation, 700 E. Broadway, Pierre, SD57501-2586.Christopher R. Fleet, 176 Cavalli Court, Front Royal, VA 22630.Mark Ford, Manager, Policy/Research Section, Oregon Department of Transportation, 555 13thStreet, NE, Salem, OR 97310.Francis B. Francois, Executive Director, AASHTO, 444 N. Capitol Street, N.W. #249, Washington,D.C. 20001.John W. Fuller, Professor, Urban & Regional Planning, University of Iowa, 340 Jessup Hall, IowaCity, IA 52242-1316.Philip Fulton, Associate Director of Statistical Programs and Services, Bureau of TransportationStatistics, U. S. Department of Transportation, 400 7th Street, SW, Rm 3430 K-20, Washington,DC 20590.Jim Getzewich, Chief, Highway Performance Division, Federal Highway Administration, 400 7thStreet, SW, HPM-20, Washington, DC 20590.Howard Glassman, Executive Director, Florida MPO Advisory Council, 605 Suwannee Street, MS28B, Tallahassee, FL 32399.K. Micque Glitman, Director of Planning, Agency of Transportation, State Administration Building,Montpelier, VT 05633.Bruce Gordon, Manager, Transportation Statistics Office, Florida Department of Transportation, 605Suwannee Street (MS-27), Tallahassee, FL 32399-0450.David L. Greene, Senior Research Staff, Oak Ridge National Laboratory, Bethel Valley Road, POBox 2008, MS-6207 4500N, Oak Ridge, TN 37831-6207.

Prepublication Copy: Uncorrected proofs Page 89
Jim Gruver, Chief, Information Management and Analysis Team, Federal Highway Administration,400 7th Street, SW, HEP-10, Washington, DC 20590.James Hall, Illinois Department of Transportation, 2300 S. Dirksen Parkway, Springfield, IL 62764.Kevin E. Heanue, Director, Office of Environment & Planning, Federal Highway Administration, 4007th Street, SW, Washington, DC 20590.David Hensing, Deputy Executive Director, AASHTO, 444 North Capitol Street, NW, Suite 249,Washington, DC 20001.Pat Hu, Group Leader, Oak Ridge National Lboratory, Bldg 3156, MS 6073, PO Box 2008, OakRidge, TN 37831-6073.Tom Kane, Executive Director, Des Moines Area MPO, Argonne Armory Building, 602 East FirstStreet, Des Moines, IA 50307.Ed Kashuba, Chief, National Data Management and Dissemination Division, Federal HighwayAdministration, 400 7th Street, SW, HPM-40, Washington, DC 20590.Ronald F. Kirby, Director, Department of Transportation Planning, Metropolitan Washington Councilof Governments, 777 North Capitol Street, NE, Suite 300, Washington, DC 20002-4226.Jay Klagge, Chief, Transportation Planning Group, Department of Transportation, 206 S. 17thAvenue, Room 300B, Phoenix, AZ 85007.Joanne Koegel, Director of Transportation, Sacramento Area Council of Governments, 3000 SStreet Suite 300, Sacramento, CA 95816.Linda Koenig, Division Director, Community Development, Planning & Services, Association ofCentral Oklahoma Governments, 6600 North Harvey Place, Suite 200, Oklahoma City, OK 73116-7913.T. R. Lakshmanan, Director, Bureau of Transportation Statistics, U. S. Department ofTransportation, 400 7th Street, SW, Rm 3430, K-1, Washington, DC 20590.Kenneth E. Lantz, Jr., Transportation Planning Engineer, Virginia Department of Transportation,1401 East Broad Street, Room 207, Richmond, VA 23219.Roy E. Lave, Chairman/CEO, Systan, Inc., P.O Box U, Los Altos, CA 94023.Calvin W. Leggett, Director Planning & Programs, NC Department of Transportation, P.O. Box25201, Raleigh, NC 27611.David L. Lewis, President, Hickling Corporation, 1010 Wayne Ave., Suite 300, Silver Spring, MD20910-5600.Edward Limoges, Chief Demographic Forecaster, Southeast Michigan Council of Governments, 660Plaza Drive, Suite 1900, Detroit, MI 48226.Ysela Llort, State Transportation Planner, Florida DOT, 605 Suwannee Street, Tallahassee, FL32399-0450.Stephen C. Lockwood, Vice President, Parsons Brinckerhoff, 3200 Tower Oaks Blvd., Rockville,MD 20852.Timothy J. Lomax, Research Engineer, Texas A&M University, Texas Transportation Institute,College Station, TX 77843-3135.Gary Maring, Director, Office of Highway Information Management, Federal Highway Adminstration,400 7th Street, SW, Room 3324, HPP-10, Washington, DC 20590.Ronald McCready, Transportation Research Board, National Research Council, 2101 ConstitutionAvenue, NW, Washington, DC 20418.Bruce McDowell, President, Intergovernmental Management Associates, 10408 GainesboroughRoad, Potomac, MD 20854.John A. McDowell, Chief Information Officer, Department of Transportation, P.O. Box 778, Dover,DE 19903.Michael D. Meyer, Georgia Institute of Technology, Mason Bldg 128, School of Civil &Environmental Engineering, 790 Atlantic Drive, Atlanta, GA 30332-0355.Ray Mickelson, Transportation Planning Administrator, Idaho Transportation Department, P.O. Box7129, 3311 W. State Street, Boise, ID 83707-1129.Richard W. Miller, Transportation Systems Evaluation Engineer, Kansas Department ofTransportation, Bureau of Transportation Planning, 217 SE Fourth Street, Topeka, KS 66603-3504.Ed Milton, Traffic Safety Programs Traffic Records Licensing Team, NHTSA, 400 7th Street, SW,Washington, DC 20590.Susan Mortel, Assistant Deputy Director,, Bureau of Transportation Planning, Michigan Departmentof Transportation, 425 West Ottawa Street, Lansing, MI 48909.
Prepublication Copy: Uncorrected proofs Page 90
Paul Mullen, Omaha–Council Bluffs Metropolitan Area Planning Agency, 2222 Cuming Street,Omaha, NE 68102-4328.Wende A. O'Neill, Associate Professor, Utah State University, Department of Civil andEnvironmental Engineering, Logan, UT 84322-4110.Janet Oakley, Association of Metropolitan Planning Organizations, 1700 K Street, NW,Washington, DC 20036.Maile Paalani, Budget Analyst, Wisconsin Department of Transportation, Room 132B, P.O. Box7910, Madison, WI 53709-7910.Shiva K. Pant, Director of Transportation, County of Fairfax, 12055 Government Center Parkway#1034, Fairfax, VA 22035-5511.Bob Parrott, Director of Research, San Diego Association of Governments, 401 B Street Suite 800,San Diego, CA 92101.Neil J. Pedersen, Director, Office of Planning, State Highway Administration, Maryland Departmentof Transportation, 707 N. Calvert Street, Baltimore, MD 21203.Roger Petzold, GIS Team Leader, Federal Highway Administration, 400 7th Street, SW, HEP-10,Room 3301, Washington, DC 20590.Henry L. Peyrebrune, Transportation Consultant, 420 Delaware Avenue, Delmar, NY 12054.Steven M. Pickrell, Vice President, Cambridge Systematics, Inc., 1300 Clay Street, Suite 1010,Oakland, CA 94612.Alan E. Pisarski, Transportation Consultant:, 6501 Waterway Drive, Falls Church, VA 22044-1328.Charles L. Purvis, Senior Transportation Planner, Metropolitan Transportation Commission, 10118th Street, Oakland, CA 94607-4700.Brian Rawson, Director, Retooling Texas DOT, Texas Department of Transportation, 125 East11th Street, Austin, TX 78701-2483.Michael Rossetti, Volpe National Transportation Systems Center, Kendall Square, Cambridge, MA02142-9998.Raymond Rought, Director of Aeronautics, Minnesota Department of Transportation, TranportationBuilding, 395 John Ireland Boulevard, St. Paul, Minnesota 55155.Phillip A. Salopek, Chief, Journey-to-Work and Migration Statistics, Bureau of the Census,Population Division, Washington, D.C. 20233.Elias Samaan, Transportation Director, Northeastern Indiana Regional Coordinating Council, OneEast Main Street Room 630, Fort Wayne, IN 468022.Gil Schamess, Two Heads, P.O. Box 75192, Washington, DC 20013.Rolf R. Schmitt, Associate Director for Transportation Studies, Analysis and Data Development,Bureau of Transportation Statistics, 400 7th Street, SW, Room 3430, K-10, Washington, DC20590.Isaac Shafran, Director of Transportation Planning, Louis Berger International, Inc., 1819 H StreetNW, Suite 900, Washington, DC 20006.Kenneth W. Shiatte, Assistant Commissioner & Chief Engineer, New York State DOT, 1220Washington Avenue, Albany, NY 12232.Brian Shorten, Executive Director, Fargo-Moorhead Metropolitan Council of Governments, CasePlaza Center, One 2nd Street North, Suite 232, Fargo, ND 58102.Robert T. Sicko, Principal Planner, Puget Sound Regional Council, 1011 Western Avenue, Suite500, Seattle, WA 98104.Kenneth L. Sieckmeyer, Transportation Planning Manager, Nebraska Department of Roads, P.O.Box 94759, Lincoln, NE 68509-4759.Cliff Sinnott, Executive Director, Rockingham Planning Commission, 121 Water Street, Exeter, NH03833.Robert E. Skinner, Jr., Transportation Research Board, National Research Council, 2101Constitution Avenue, NW, Washington, DC 20418.Jeff Smith, Maryland Department of Transportation, 707 N. Calvert Street, Room 415, Baltimore,MD 21202.Susan Stack, Office of Highway Safety, Safety Management & Policy Division, Federal HighwayAdministration, 400 7th Street, SW, HHS-20, Washington, DC 20590.Cheryl C. Stecher, President, Applied Management Planning Group, 12300 Wilshire Boulevard,Suite 430, Los Angeles, CA 90025.Richard Steinmann, Federal Transit Administration, 400 7th Street, SW, TBP-11, Washington, DC20590.
Prepublication Copy: Uncorrected proofs Page 91
Timothy Stewart, Director, Lincoln/Lancaster Planning Department, City County Building, 555 S.10th Street, Lincoln, NE 75808.Martha J. Tate-Glass, California Department of Transportation, Transportation System InformationProgram, 1120 N Street, MS 38, Sacramento, CA 95814.Thomas TenEyck, Director,Bureau of Planning and Research, Pennsylvania Department ofTransportation, 6th Floor, Forum Place, 555 Walnut Street, Harrisburg, PA 17120.Dennis L. Tice, Deputy Director, Iowa Department of Transportation, 800 Lincoln Way, Ames, IA50010.Mary Lynn Tischer, Policy and Planning Director, Virginia Department of Transportation, 1401 EastBroad Street, Richmond, VA 23219-2039.James P. Toohey, Assistant Secretary, Transit Research, Department of Transportation, P. O. Box47372, Olympia, WA 98504-372.Geraldine (Gerry) Turner, Chief Economomist, Department of Motor Vehicles, P.O. Box 27412,Richmond, VA 23269-0001.Ronald W. Tweedie, Director,Planning Bureau, New York State Department of Transportation, 1220Washington Ave, Bldg. 4, Room 115, Albany, NY 12232-0001.Robert Vaughan, Executive Director, Yuma MPO, 200 West First Street, Yuma, AZ 85364.Randall E. Wade, Chief, Statewide System Planning, Wisconsin Department of Transportation,P.O. Box 7913, Room 901, Madison, WI 53707-7913.Preston Jay Waite, Chief, Demographic Statistical Methods Division, Bureau of the Census,Washington, DC 20323.C. Michael Walton, Professor, University of Texas at Austin, Department of Civil Engineering, E.Cockrell Jr. Hall #4.2, Austin, TX 78712-1076.Alice J. Watland, Transportation Research Board, National Research Council, 2101 ConstitutionAvenue, NW, Washington, DC 20418.Richard (Dick) Weaver, Deputy Director, Project Development, California Department ofTransportation, 1120 N Street, MS-28, Sacramento, CA 95814.George V. Wickstrom, Urban Transportation Planning Consultant, 3013 McComas Avenue,Kensington, MD 20895.Juanita Wieczoreck, Executive Director, Dover/Kent MPO, P.O. Box 383, Dover, DE 19903.Linda Wilson, Executive Director, Casper Area MPO, 200 North David Street, Casper, WY 82601.Ellis Woodall, Transportation Planner, Georgia Department of Transportation, 2 Capitol SquareRm.360, Altanta, GA 30334.Lisa Wormser, Two Heads, P.O. Box 75192, Washington, DC 20013.Thabet Zakaria, Delaware Valley Regional Planning Commission, 111 S. Independence Mall East,Philadelphia, PA 19106.Robert Zarnetske, Acting Assistant Director for Information Technology, Bureau of TransportationStatistics, U. S. Department of Transportation, 400 7th Street, SW, Rm 3430 K-50, Washington,DC 20590.
Prepublication Copy: Uncorrected proofs Page 92
The Transportation Research Board is a unit of the National Research Council, which serves the NationalAcademy of Sciences and the National Academy of Engineering. The Board’s mission is to promote innovation andprogress in transportation by stimulating and conducting research, facilitating the dissemination of information, andencouraging the implementation of research results. The Board's varied activities annually draw on approximately 4,000engineers, scientists, and other transportation researchers and practitioners from the public and private sectors andacademia, all of whom contribute their expertise in the public interest. The program is supported by state transportationdepartments, federal agencies including the component administrations of the U.S. Department of Transportation, andother organizations and individuals interested in the development of transportation.
The National Academy of Sciences is a private, nonprofit, self-perpetuating society of distinguished scholarsengaged in scientific and engineering research, dedicated to the furtherance of science and technology and to their usefor the general welfare. Upon the authority of the charter granted to it by the Congress in 1863, the Academy has amandate that requires it to advise the federal government on scientific and technical matters. Dr. Bruce M. Alberts ispresident of the National Academy of Sciences.
The National Academy of Engineering was established in 1964, under the charter of the National Academy ofSciences, as a parallel organization of outstanding engineers. It is autonomous in its administration and in the selectionof its members, sharing with the National Academy of Sciences the responsibility for advising the federal government.The National Academy of Engineering also sponsors engineering programs aimed at meeting national needs,encourages education and research, and recognizes the superior achievements of engineers. Dr. William A. Wulf ispresident of the National Academy of Engineering.
The Institute of Medicine was established in 1970 by the National Academy of Sciences to secure the servicesof eminent members of appropriate professions in the examination of policy matters pertaining to the health of thepublic. The Institute acts under the responsibility given to the National Academy of Sciences by its congressionalcharter to be an adviser to the federal government and, upon its own initiative, to identify issues of medical care,research, and education. Dr. Kenneth I. Shine is president of the Institute of Medicine.
The National Research Council was organized by the National Academy of Sciences in 1916 to associate thebroad community of science and technology with the Academy's purpose of furthering knowledge and advising thefederal government. Functioning in accordance with general policies determined by the Academy, the Council hasbecome the principal operating agency of both the National Academy of Sciences and the National Academy ofEngineering in providing services to the government, the public, and the scientific and engineering communities. TheCouncil is administered jointly by both the Academies and the Institute of Medicine. Dr. Bruce M. Alberts and Dr. WilliamA. Wulf are chairman and vice chairman, respectively, of the National Research Council.