Embed Size (px)
Citation preview

Information for Our Shareholders Q2
April – June 2009
Half Year Financial Report 2009
Driving Change

2 Half Year Financial Report / Quarterly Report 2/2009
Financial Highlights / Contents
Contents03 Highlights Second Quarter 200904 Major Events04 Share Performance05 Report Second Quarter 2009 05 Business Performance Second Quarter 2009 07 Regional Performance 09 Business Sector Performance12 Half Year Financial Report 2009 12 Underlying Economic Conditions 12 Sectors of Importance for Henkel 12 Business Performance First Half 2009 12 Statement of Income 13 Balance Sheet 14 Cash Flow Statement 14 Capital Expenditures 14 Acquisitions and Divestments 14 Employees 14 Research and Development 14 Outlook 14 Underlying Economic Conditions
15 Opportunities and Risks 15 Sales and Profits Forecast for 200916 Interim Consolidated Financial Statements
Second Quarter 2009 and First Half 2009 16 Consolidated Statement of Income 18 Consolidated Balance Sheet 19 Consolidated Cash Flow Statement 20 Consolidated Statement of Recognized Income
and Expense20 Selected Explanatory Notes 20 Statement of Changes in Equity 21 Group Segment Report by Business Sector 23 Earnings per Share 23 Changes in Treasury Stock 23 Accounting and Valuation Policies 23 Scope of Consolidation 24 Acquisition of the National Starch Businesses25 Responsibility Statement26 Report of the Audit Committee of the
Supervisory Board27 Credits / Calendar
Henkel: Financial Highlights
in million euros Q2/2008 Q2/2009 Change1) 1 – 6/2008 1 – 6/2009 Change1)
Sales 3,668 3,485 – 5.0 % 6,830 6,743 –1.3 %
Operating profit (EBIT) 113 279 >100.0 % 433 497 14.6 %
Laundry & Home Care 92 119 28.8 % 192 226 18.0 %
Cosmetics / Toiletries 98 100 2.8 % 185 191 3.4 %
Adhesive Technologies 192 95 – 50.8 % 342 142 – 58.5 %
Return on sales (EBIT) in % 3.1 8.0 4.9 pp 6.3 7.4 1.1 pp
Earnings before tax 53 219 >100.0 % 354 385 8.8 %
Net earnings 42 150 >100.0 % 265 271 2.3 %
Net earnings after minority interests 38 143 >100.0 % 257 260 1.2 %
Earnings per preferred share in euros 0.09 0.33 >100.0 % 0.60 0.61 1.5 %
Earnings per ordinary share in euros 0.09 0.33 >100.0 % 0.59 0.60 1.5 %
Return on capital employed (ROCE) in % 5.0 9.1 4.1 pp 9.9 8.2 –1.7 pp
Capital expenditures on property, plant and equipment 126 100 – 20.6 % 234 185 – 20.9 %
Research and development expenses 98 103 5.1 % 184 202 9.8 %
Number of employees (as of June 30) 57,5932) 51,819 –10.0 % 57,5932) 51,819 –10.0 %1) Calculated on the basis of units of 1,000 euros2) Prior-year figures adjusted; basis: permanent employees excluding trainees
pp = percentage points
Adjusted earnings figuresin million euros Q2/2008 Q2/2009 Change1) 1 – 6/2008 1 – 6/2009 Change1)
Adjusted operating profit (EBIT)2) 372 308 –17.2 % 690 543 – 21.3 %
Adjusted return on sales (EBIT)2) in % 10.1 8.7 –1.4 pp 10.1 8.1 – 2.0 pp
Adjusted earnings before tax2) 312 248 – 20.5 % 611 431 – 29.5 %
Adjusted net earnings after minority interests2)
227 162
– 28.6 %
445 292
– 34.4 %
Adjusted earnings per preferred share2) in euros 0.52 0.37 – 28.8 % 1.03 0.68 – 34.0 %1) Calculated on the basis of units of 1,000 euros 2) Adjusted for one-time gains/charges and restructuring charges
pp = percentage points

3 Half Year Financial Report / Quarterly Report 2/2009
Highlights / Innovations
Highlights Second Quarter 2009
Key Financials
Organic sales: minus 5.3 percent» Laundry & Home Care: plus 6.3 percent» Cosmetics/Toiletries: plus 3.5 percent » Adhesive Technologies: minus 15.4 percent
Adjusted1) operating profit (EBIT): minus 17.2 percent
Adjusted1) earnings per preferred share (EPS): minus 28.8 percent
1) Adjusted for one-time gains (0 million euros), one-time charges (4 million euros) and restructuring charges (25 million euros)
Key Facts
Laundry & Home Care with strong profit growth
Cosmetics/Toiletries with continued good sales and profits performance
Adhesive Technologies with negative organic sales growth but slight improvement on first quarter performance
Growth regions with positive organic sales development
Net working capital improved by 1.4 percentage points to 11.7 percent of sales
Sale of the consumer adhesive brands Duck, Painter’s Mate Green and Easy Liner in the USA and Canada
Purex Complete 3-in-1
Launched in the USA, innovative Purex
Complete 3-in-1 laundry sheets combine
the performance of a detergent along
with heat-activated softener and anti-
static ingredients that are released in
the drier to prevent electrostatic accu-
mulation in the wash load.
Schwarzkopf Drei Wetter Taft Ultra Silk Touch With Schwarzkopf Drei Wetter Taft
Ultra Silk Touch, Europe’s styling mar-
ket leader Taft has succeeded in com-
bining seemingly incompatible oppo-
sites: a 24-hour ultra-strong hold and
silky-smooth hair. The new styling line
includes a hair spray, a styling foam, a
cream gel and a wax.
Loctite 5188
Loctite 5188 flange sealant is particularly
suitable for engines, gears and pumps.
It remains highly flexible even under
prolonged thermal and chemical load-
ing, offering excellent adhesion to me-
tallic substrates – especially aluminum.
Its extensibility compensates for micro
motions resulting from vibration and
pressure or temperature fluctuations.
Innovations

4 Half Year Financial Report / Quarterly Report 2/2009
Major Events / Share Performance
Major Events
Dipl.-Ing. Albrecht Woeste, Chairman of the Supervisory
Board and of the Shareholders’ Committee of Henkel AG
& Co. KGaA, announced at the company’s Annual General
Meeting of April 20, 2009 that he would be resigning
his positions in these corporate bodies in September
2009. He has recommended that Dr. Simone Bagel-Trah
be elected as his successor.
Henkel has once again been recognized as an ethical
company. For the second time in succession, the Ethi-
sphere Institute and Forbes Magazine, both of the USA,
have included Henkel in their “World’s Most Ethical
Companies” ranking. Aside from Henkel, there is only
one other German company in the list, for which the
selection criteria include corporate social responsibility,
management style and innovative strength.
Share Performance
The second quarter of 2009 saw significant increases in
share prices on the world’s stock exchanges, with the
DAX gaining 17.7 percent.
In the brightening market environment, Henkel’s
preferred shares also posted an increase, rising by 8.5 per-
cent from 20.48 euros to 22.23 euros. This meant that
our shares underperformed compared to their peers
in the consumer goods sector, as reflected by the rise
of 17.7 percent in the Dow Jones Euro Stoxx Consumer
Goods Index.
The annual report, our quarterly reports, current
data on Henkel shares as well as company news,
financial reports and company presentations
can be found on the Investor Relations website at
www.henkel.com/ir.
Performance of Henkel Preferred Share Versus Market in Q2 2009in euros
27
25
23
21
19
17
Henkel preferred share
DJ Euro Stoxx Consumer Goods (indexed)
DAX (indexed)
March 2009 June 2009
20.48 eurosMarch 31, 2009
22.23 eurosJune 30, 2009

5 Half Year Financial Report / Quarterly Report 2/2009
Report Second Quarter 2009 » Business Performance
Report Second Quarter 2009
Business Performance Second Quarter 2009
In a persistently difficult market environment, our 2009
second quarter sales came in at 3,485 million euros,
5.0 percent below the figure for the prior-year period.
After adjusting for foreign exchange, sales declined by
4.8 percent. In organic terms, i.e. after adjusting for
foreign exchange and acquisitions/divestments, sales
improved slightly compared to the first quarter of this
year, but remained 5.3 percent below the level of the
second quarter of 2008.
The performance of our business sectors was very
mixed. Our consumer businesses Laundry & Home Care
and Cosmetics/Toiletries were able to successfully con-
tinue the positive trend of previous quarters with organic
growth rates of 6.3 percent and 3.5 percent respectively.
The performance of the Cosmetics/Toiletries business
sector once again matched the strong growth posted in
the first quarter. The increase achieved by Laundry &
Home Care is the highest since the first quarter of 2007.
The decline in organic sales at Adhesive Technologies
amounted to 15.4 percent and is due to the volume de-
crease suffered by its major customer industries. Com-
pared to the first quarter of 2009, however, this consti-
tutes an improvement of 2.8 percentage points.
Gross margin increased compared to the second quar-
ter of 2008 by 3.9 percentage points to 45.3 percent. While
it was positively influenced by the decrease in raw mate-
rial prices, the still low level of capacity utilization at
Adhesive Technologies had a negative effect. The gross
margin of the prior-year quarter was burdened by major
restructuring charges.
Marketing, selling and distribution expenses de-
creased by 5.3 percent. After adjusting for restructuring
charges, they remained at the prior-year level. We spent
a total of 103 million euros on research and develop-
ment, corresponding to a share of sales of 3.0 percent
(plus 0.3 percentage points). Administrative expenses
decreased by 24.8 percent. After adjusting for restructur-
ing charges, the decline was 3.2 percent. Restructuring
charges were 25 million euros; in the prior-year quarter
these amounted to 256 million euros as a result of the
“Global Excellence” program and the integration of the
National Starch businesses. Of this figure, 6 million euros
was attributable to the integration of the National Starch
businesses and 19 million euros to ordinary activities.
The distribution of the restructuring charges between
the various expense items in the income statement is
explained on page 16. The positive balance of other
operating income and charges decreased from 9 mil-
lion euros to 1 million euros.
Due primarily to the restructuring charges burden
on the prior-year quarter, operating profit (EBIT) rose by
145 percent, from 113 million euros to 279 mil lion euros.
After adjusting for restructuring charges (25 million
euros) and one-time expenses (4 million euros in consul-
tancy charges related to the integration of the National
Starch businesses), adjusted operating profit (“adjusted
EBIT”) decreased by 17.2 percent, from 372 million euros
to 308 million euros. This is primarily attributable to
the decrease in earnings at the Adhesive Technologies
business sector.
Price and volume effects1)
in percent
Organic sales
growth
of which price
of which volume
Laundry & Home Care 6.3 5.1 1.2
Cosmetics / Toiletries 3.5 1.1 2.4
Adhesive Technologies –15.4 5.7 – 21.1
Henkel Group – 5.3 4.5 – 9.81) Calculated on the basis of units of 1,000 euros

6 Half Year Financial Report / Quarterly Report 2/2009
Report Second Quarter 2009 » Business Performance
Return on sales (EBIT margin) amounted to 8.0 per cent.
Adjusted return on sales (“adjusted EBIT margin”) fell from
10.1 percent to 8.7 percent. Return on capital employed
(ROCE) increased from 5.0 percent to 9.1 percent.
Our investment result fell from 24 million euros to
–4 million euros. This decline is essentially the result of
the sale of our participation in Ecolab in November 2008.
Net interest expense improved by 28 million euros from
–84 million euros to –56 million euros, largely due to
lower interest rates compared to the previous year. The
financial result remained stable overall at –60 million
euros. Our tax rate amounted to 31.5 percent.
Due to the increase in EBIT, net earnings for the quar-
ter improved by 257 percent from 42 million euros to
150 million euros. After minority interests totaling 7 mil-
lion euros, net earnings for the quarter amounted to
143 million euros (prior-year quarter: 38 million euros).
Adjusted quarterly net earnings after minority interests
amounted to 162 million euros compared to 227 million
euros in the same period last year. Earnings per preferred
share (EPS) increased from 0.09 euros to 0.33 euros. The
adjusted figure was 0.37 euros compared to 0.52 euros
in the prior-year quarter.
Sales1) in million euros Q2 1 – 6
2009 3,485 6,743
2008 3,668 6,830
Change versus previous year – 5.0 % –1.3 %1) Calculated on the basis of units of 1,000 euros
EBIT1) in million euros Q2 1 – 6
2009 279 497
2008 113 433
Change versus previous year >100 % 14.6 %
After adjusting for foreign exchange >100 % 17.4 %1) Calculated on the basis of units of 1,000 euros
Net earnings for the quarter/half year after minority interestsin million euros Q2 1 – 6
2009 143 260
2008 38 257
Change versus previous year >100 % 1.2 %
Earnings per preferred sharein euros Q2 1 – 6
2009 0.33 0.61
2008 0.09 0.60
Change versus previous year >100 % 1.5 %
Sales development1) in percent Q2 1 – 6
Change versus previous year – 5.0 –1.3
Foreign exchange – 0.2 – 0.5
After adjusting for foreign exchange – 4.8 – 0.8
Acquisitions/divestments 0.5 5.3
Organic – 5.3 – 6.11) Calculated on the basis of units of 1,000 euros
Return on sales (EBIT)in percent Q2 1 – 6
2009 8.0 7.4
2008 3.1 6.3
Change versus previous year 4.9 pp 1.1 pp
pp = percentage points
7 Half Year Financial Report / Quarterly Report 2/2009
Report Second Quarter 2009 » Regional Performance
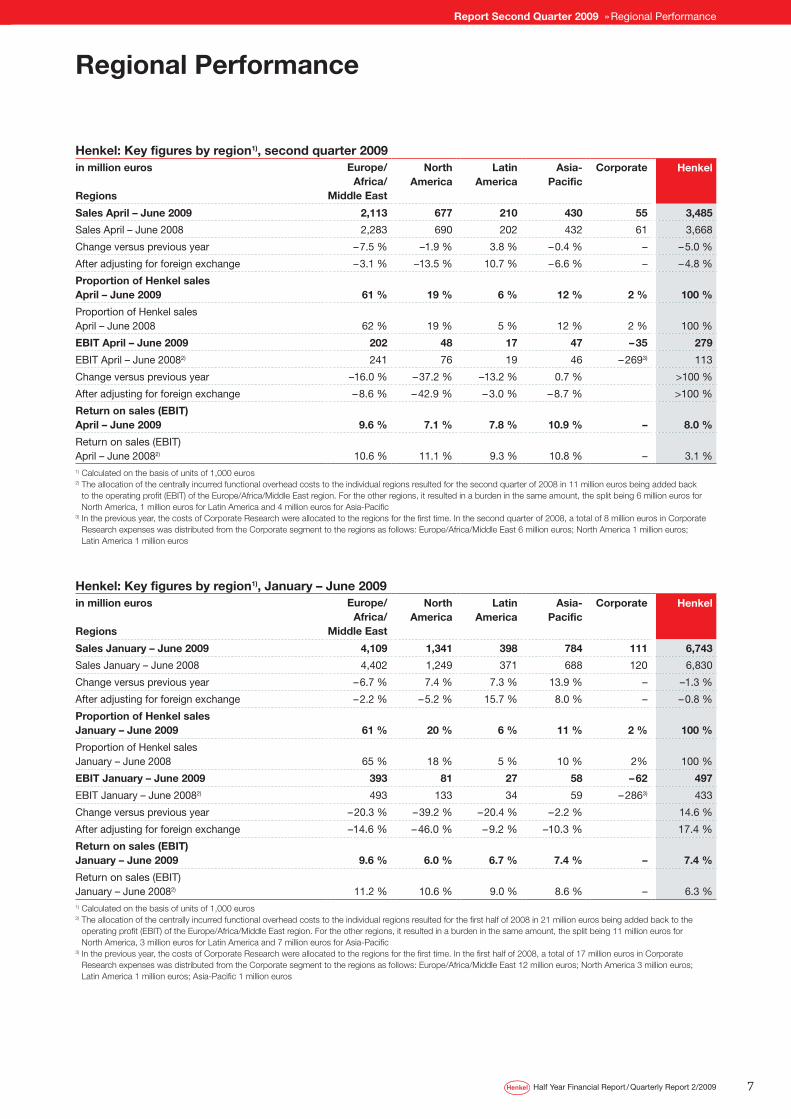
Regional Performance
Henkel: Key figures by region1), second quarter 2009in million euros Regions
Europe/ Africa/
Middle East
North America
Latin America
Asia- Pacific
Corporate
Henkel
Sales April – June 2009 2,113 677 210 430 55 3,485
Sales April – June 2008 2,283 690 202 432 61 3,668
Change versus previous year – 7.5 % –1.9 % 3.8 % – 0.4 % – – 5.0 %
After adjusting for foreign exchange – 3.1 % –13.5 % 10.7 % – 6.6 % – – 4.8 %
Proportion of Henkel sales April – June 2009
61 %
19 %
6 %
12 %
2 %
100 %
Proportion of Henkel salesApril – June 2008
62 %
19 %
5 %
12 %
2 %
100 %
EBIT April – June 2009 202 48 17 47 – 35 279
EBIT April – June 20082) 241 76 19 46 – 2693) 113
Change versus previous year –16.0 % – 37.2 % –13.2 % 0.7 % >100 %
After adjusting for foreign exchange – 8.6 % – 42.9 % – 3.0 % – 8.7 % >100 %
Return on sales (EBIT) April – June 2009
9.6 %
7.1 %
7.8 %
10.9 %
–
8.0 %
Return on sales (EBIT) April – June 20082)
10.6 %
11.1 %
9.3 %
10.8 %
–
3.1 %
1) Calculated on the basis of units of 1,000 euros2) The allocation of the centrally incurred functional overhead costs to the individual regions resulted for the second quarter of 2008 in 11 million euros being added back
to the operating profit (EBIT) of the Europe/Africa/Middle East region. For the other regions, it resulted in a burden in the same amount, the split being 6 million euros for North America, 1 million euros for Latin America and 4 million euros for Asia-Pacific
3) In the previous year, the costs of Corporate Research were allocated to the regions for the first time. In the second quarter of 2008, a total of 8 million euros in Corporate Research expenses was distributed from the Corporate segment to the regions as follows: Europe/Africa/Middle East 6 million euros; North America 1 million euros; Latin America 1 million euros
Henkel: Key figures by region1), January – June 2009in million euros Regions
Europe/ Africa/
Middle East
North America
Latin America
Asia- Pacific
Corporate
Henkel
Sales January – June 2009 4,109 1,341 398 784 111 6,743
Sales January – June 2008 4,402 1,249 371 688 120 6,830
Change versus previous year – 6.7 % 7.4 % 7.3 % 13.9 % – –1.3 %
After adjusting for foreign exchange – 2.2 % – 5.2 % 15.7 % 8.0 % – – 0.8 %
Proportion of Henkel sales January – June 2009
61 %
20 %
6 %
11 %
2 %
100 %
Proportion of Henkel salesJanuary – June 2008
65 %
18 %
5 %
10 %
2%
100 %
EBIT January – June 2009 393 81 27 58 – 62 497
EBIT January – June 20082) 493 133 34 59 – 2863) 433
Change versus previous year – 20.3 % – 39.2 % – 20.4 % – 2.2 % 14.6 %
After adjusting for foreign exchange –14.6 % – 46.0 % – 9.2 % –10.3 % 17.4 %
Return on sales (EBIT) January – June 2009
9.6 %
6.0 %
6.7 %
7.4 %
–
7.4 %
Return on sales (EBIT) January – June 20082)
11.2 %
10.6 %
9.0 %
8.6 %
–
6.3 %
1) Calculated on the basis of units of 1,000 euros2) The allocation of the centrally incurred functional overhead costs to the individual regions resulted for the first half of 2008 in 21 million euros being added back to the
operating profit (EBIT) of the Europe/Africa/Middle East region. For the other regions, it resulted in a burden in the same amount, the split being 11 million euros for North America, 3 million euros for Latin America and 7 million euros for Asia-Pacific
3) In the previous year, the costs of Corporate Research were allocated to the regions for the first time. In the first half of 2008, a total of 17 million euros in Corporate Research expenses was distributed from the Corporate segment to the regions as follows: Europe/Africa/Middle East 12 million euros; North America 3 million euros; Latin America 1 million euros; Asia-Pacific 1 million euros

8 Half Year Financial Report / Quarterly Report 2/2009
Report Second Quarter 2009 » Regional Performance
In the Europe/Africa/Middle East region, organic sales
were 3.7 percent below the level for the second quarter
of 2008. While Laundry & Home Care and Cosmetics/Toi-
letries were able to achieve a gratifying increase in their
respective sales figures, Adhesive Technologies posted a
decline in the double-digit percentage range. In Africa/
Middle East, we once again achieved double-digit organic
growth, while performance in Western Europe includ-
ing Germany was regressive. The growth rate in Eastern
Europe recovered slightly compared to the first quarter.
Operating profit attributable to the Europe/Africa/Middle
East region fell by 8.6 percent after adjusting for foreign
exchange. Return on sales decreased by 1.0 percentage
points to 9.6 percent due to developments in the Adhesive
Technologies business sector.
Organic sales in North America decreased by 10.2 per-
cent. The difficult market environment prevailing in the
region led to Adhesive Technologies posting a substantial
decline in sales. Developments at Cosmetics/Toiletries
were slightly regressive. Sales of the Laundry & Home
Care business sector showed an encouraging increase.
Operating profit adjusted for foreign exchange fell by
42.9 percent. There was a decrease in the return on sales
of all three business sectors, the overall figure easing
4.0 percentage points to 7.1 percent.
Organic sales in the Latin America region increased
by 3.9 percent with all business sectors contributing.
Operating profit, on the other hand, decreased by 3.0 per-
cent after adjusting for foreign exchange. Return on
sales fell by 1.5 percentage points to 7.8 percent, due to
developments at Adhesive Technologies and Cosmetics/
Toiletries.
In the Asia-Pacific region, organic sales fell by 10.0 per-
cent compared to the second quarter of 2008. A gratifying
increase in sales at the Cosmetics/Toiletries business sec-
tor was offset by a significant decline at Adhesive Tech-
nologies. With the closure of our Laundry & Home Care
operations in China at the beginning of the year, sales
of this business sector also declined. Operating profit
adjusted for foreign exchange decreased by 8.7 percent.
Due to the good performance of the Laundry & Home Care
business sector, return on sales came in at 10.9 percent,
matching the level of the prior-year quarter.
In our growth regions of Eastern Europe, Africa/
Middle East, Latin America and Asia (excluding Japan),
sales fell by 1.5 percent to 1,317 million euros, represent-
ing 37.8 percent of consolidated sales. Organic growth
amounted to 2.3 percent. While our Laundry & Home
Care and Cosmetics/Toiletries businesses continued to
post double-digit organic sales growth, sales generated
by Adhesive Technologies showed a substantial decrease
due to weaknesses in Eastern Europe and Asia.

9 Half Year Financial Report / Quarterly Report 2/2009
Report Second Quarter 2009 » Performance by Business Sector
In the second quarter of 2009, Laundry & Home Care
posted the highest rise in organic sales – 6.3 percent –
since the first quarter of 2007, significantly outperform-
ing our relevant markets. Foreign exchange exerted a
negative impact of 1.9 percent. The growth regions of
Eastern Europe, Africa/Middle East and Latin America
continued to deliver strong sales with, in some cases,
double-digit rates of increase. Following a sluggish start
to the year, we also posted a gratifying rise in organic
sales in Western Europe and North America.
Operating profit (EBIT) increased by 28.8 percent to
119 million euros. After adjusting for foreign exchange,
the rise was an even more respectable 34.1 percent. While
the prior-year quarter was characterized by appreciably
increasing material costs, raw material prices continued
to ease in the period under review. Selling price increases
implemented in a number of markets together with our
successful measures to reduce costs and enhance effi-
ciency also contributed to the improvement achieved.
With this strong increase in earnings, return on sales also
improved compared to the second quarter of the previous
year – by 2.1 percentage points to 11.2 percent. Return on
capital employed (ROCE) likewise increased significantly,
by 3.3 percentage points to 17.8 percent.
Sales reported by our Laundry segment showed a sub-
stantial rise. In particular, our biggest brands worldwide,
Persil and Purex, posted disproportionate organic im-
provement. Purex benefited from the successful launch
of Purex Complete 3-in-1 in the USA. These innovative
laundry sheets combine the performance of a detergent
along with heat-activated softener and anti-static ingredi-
ents that are released in the drier to prevent electrostatic
accumulation in the wash load.
Sales of the Home Care segment likewise continued to
follow an upward trend, with the fastest rates of increase
occurring in Eastern Europe and Africa/Middle East. In
particular, our largest dishwashing detergent brand
Pril saw sales rise in both regions, making a substantial
contribution to the improvement achieved. And in the
case of our machine dishwashing detergents marketed
in Western Europe, we were able – with the launch of
Somat 9 offering an odor neutralizer and an extra-dry
effect – to expand the number of functions available to
consumers.
Outlook
Given the current difficult environment, we intend to
expand our market positions in 2009 and once again
outperform our relevant markets. Implemented cost-
reducing measures, particularly those relating to the
“Global Excellence” restructuring program, will support
the development of our operating profit.
Laundry & Home Care
Sales1) in million euros Q2 1 – 6
2009 1,058 2,071
2008 1,012 2,043
Change versus previous year 4.4 % 1.3 %1) Calculated on the basis of units of 1,000 euros
EBIT1) in million euros Q2 1 – 6
2009 119 226
2008 92 192
Change versus previous year 28.8 % 18.0 %
After adjusting for foreign exchange 34.1 % 21.4 %1) Calculated on the basis of units of 1,000 euros
Return on sales (EBIT)in percent Q2 1 – 6
2009 11.2 10.9
2008 9.1 9.4
Change versus previous year 2.1 pp 1.5 pp
pp = percentage points
Sales development1) in percent Q2 1 – 6
Change versus previous year 4.4 1.3
Foreign exchange –1.9 – 2.0
After adjusting for foreign exchange 6.3 3.3
Acquisitions/divestments – –
Organic 6.3 3.31) Calculated on the basis of units of 1,000 euros

10 Half Year Financial Report / Quarterly Report 2/2009
Report Second Quarter 2009 » Performance by Business Sector
With an organic growth rate of 3.5 percent in the sec-
ond quarter of 2009 versus an already very strong prior-
year quarter, the Cosmetics/Toiletries business sector
again continued the positive trend of recent years. We
significantly outperformed our relevant markets, which
exhibited negative development overall in a very difficult
economic environment. After adjusting for foreign ex-
change, growth amounted to 2.4 percent. In the regions
of Eastern Europe, Asia and Latin America especially,
growth remained strong. The increase achieved in West-
ern Europe was also noteworthy.
This business success was further reflected in an in-
crease in operating profit to 100 million euros, a rise of
4.2 percent after adjusting for foreign exchange. Return
on sales grew compared to the already high prior-year
quarter by 0.2 percentage points to 12.7 percent. Return
on capital employed (ROCE) amounted to 18.3 percent.
The Hair Cosmetics segment continued to perform very
well with further expansion in our market positions in all
categories and gains in market share to record levels. The
Hair Care and Colorants businesses turned in a particular-
ly positive performance, aided by the continuing roll-out
of the new brand Syoss, the new Gliss line Asia Straight
and the new Schauma shampoo Hairactive for Men. The
positive trend in the Colorants category continued with
the support of our Essential Colors innovation and the
market launch of Palette 10 Minutes Coloration.
In the Body Care segment, our Dial brand in the USA
continued to do exceptionally well. Worthy of particular
mention is the continuing progress being made with
the roll-out of our Anti Oxidant body wash and also the
enduring success of our 3D Odor Defense body wash
from Dial for Men. Also very successful in the body wash
segment was the Fa brand which generated significant
revenue and market share increases in Europe following
the introduction of the shower products Cream & Oil
and Fresh & Oil.
In the Skin Care segment, the focus was on the launch
of the new Diadermine line Dr. Caspari.
And in the Oral Care segment, the launch of the
new Theramed variant Arctic White generated positive
momentum.
With increasingly negative development character-
izing the global professional hairdressing market, our
Hair Salon business significantly outperformed its sector.
Here, the focus of our activities was on the relaunch of
Bonacure and the introduction of two new sublines from
Igora. We continued to drive the successful international
roll-out of our innovative Essensity brand.
Outlook
Given the current difficult environment, we intend to
expand our market positions in 2009 and once again
outperform our relevant markets. Implemented cost-
reducing measures, particularly those relating to the
“Global Excellence” restructuring program, will support
the development of our operating profit.
Cosmetics/Toiletries
Sales1) in million euros Q2 1 – 6
2009 790 1,510
2008 779 1,487
Change versus previous year 1.5 % 1.6 %1) Calculated on the basis of units of 1,000 euros
EBIT1) in million euros Q2 1 – 6
2009 100 191
2008 98 185
Change versus previous year 2.8 % 3.4 %
After adjusting for foreign exchange 4.2 % 4.5 %1) Calculated on the basis of units of 1,000 euros
Return on sales (EBIT)in percent Q2 1 – 6
2009 12.7 12.6
2008 12.5 12.4
Change versus previous year 0.2 pp 0.2 pp
pp = percentage points
Sales development1) in percent Q2 1 – 6
Change versus previous year 1.5 1.6
Foreign exchange – 0.9 –1.1
After adjusting for foreign exchange 2.4 2.7
Acquisitions/divestments –1.1 – 0.8
Organic 3.5 3.51) Calculated on the basis of units of 1,000 euros

11 Half Year Financial Report / Quarterly Report 2/2009
Report Second Quarter 2009 » Performance by Business Sector
Adhesive Technologies
With the markets stabilizing, albeit at a low level, the
Adhesive Technologies business sector was able to sub-
stantially improve the quality of its results in this second
quarter compared to the first quarter of 2009.
Sales adjusted for foreign exchange decreased by
13.9 percent and organically by 15.4 percent compared
to the second quarter of 2008, the reporting period that
featured the acquired National Starch businesses for the
very first time. Sales in all regions – with the exception
of Latin America – remained below prior-year levels.
Due to volume decreases and the attendant lower
capacity utilization levels, operating profit adjusted for
foreign exchange fell by 48.2 percent. Included in this
figure is 4 million euros in consultancy charges resulting
from the integration of the National Starch businesses.
The early introduction of measures to adapt capacity and
reduce costs, and also the launch of a number of innova-
tive products, served to significantly improve earnings
compared to the first quarter. Year-on-year return on sales
fell by 4.7 percentage points to 6.0 percent and return
on capital employed (ROCE) decreased by 13.2 percentage
points to 5.1 percent.
The performance of the Adhesives for Craftsmen and Con-
sumers segment was impacted by the continuing recession
in the building industry and particularly the slump in
activity encountered in the UK, Spain and the USA.
The generally lower level of construction activity
also adversely influenced developments in the Building
Adhesives segment, although business in the Middle East
region continued to improve.
The decline in the Packaging, Consumer Goods and
Construction Adhesives segment was relatively minor. The
slight decrease in demand for consumer goods was, how-
ever, also reflected in our business performance here.
The global reduction in manufacturing output among
our industrial customers again significantly impacted
the development of our Specialty Adhesives and Surface Treat-
ment segment. However, in this difficult environment
especially, we were able to benefit from our position
– acknowledged in the market – as a supplier of innova-
tive problem solutions. In April, for example, our metal
pretreatment product TecTalis received the PACE Award
as the ecologically and economically most significant
automotive ancillaries innovation of 2008.
Our Electronics segment continued to suffer from the
general market weakness affecting the semiconductors
industry.
Outlook
Our objective in 2009 is again to outperform our relevant
markets. The synergies arising from the integration of
the National Starch businesses and the improvement
in our cost structure brought about by the measures
implemented in 2008 will support the development of
our operating profit.
Sales1) in million euros Q2 1 – 6
2009 1,582 3,051
2008 1,816 3,180
Change versus previous year –12.9 % – 4.1 %1) Calculated on the basis of units of 1,000 euros
EBIT1) in million euros Q2 1 – 6
2009 95 142
2008 192 342
Change versus previous year – 50.8 % – 58.5 %
After adjusting for foreign exchange – 48.2 % – 55.8 %1) Calculated on the basis of units of 1,000 euros
Return on sales (EBIT)in percent Q2 1 – 6
2009 6.0 4.7
2008 10.7 10.8
Change versus previous year – 4.7 pp – 6.1 pp
pp = percentage points
Sales development1) in percent Q2 1 – 6
Change versus previous year –12.9 – 4.1
Foreign exchange 1.0 0.8
After adjusting for foreign exchange –13.9 – 4.9
Acquisitions/divestments 1.5 11.7
Organic –15.4 –16.61) Calculated on the basis of units of 1,000 euros

12 Half Year Financial Report / Quarterly Report 2/2009
Half Year Financial Report 2009
Underlying Economic Conditions
The first half of 2009 saw a significant fall in economic
activity.
The decline has been especially apparent in the de-
veloped markets of North America, Western Europe and
Japan. The emerging economies presented a mixed pic-
ture: although some countries in Asia and Eastern Europe
likewise suffered under the influences of the economic
and financial crisis, the performance of China and India
remained robust. With the exception of Mexico, Latin
America was also less adversely affected.
The prevailing crisis is particularly noticeable in the
industrial sector, with significant rates of decline in output
being registered in most countries. While consumer spend-
ing also suffered under the effects of the recession, this
sector has assumed the role of economic stabilizer. Apart
from some luxury items and more expensive consumer
goods, for which there was a substantial fall in demand,
private consumption remained relatively stable. However,
the share of products marketed under private labels fur-
ther increased.
Inflation rates and raw material prices declined.
Sectors of Importance for Henkel
The crisis in the automotive industry remains especially
severe. Although Germany and other countries have been
able to generate a temporary revival in the market with
their scrappage and similar support programs, a sub-
stantial overall decline in automobile production could
not be avoided.
The mechanical engineering and metal industries also
experienced a heavy decrease in production output.
The electronics sector, on the other hand, has been
able to recover slightly in the course of the year, albeit
from a very low base. Chip production has been expand-
ing for a few months now.
The packaging industry has suffered no more than
moderate decreases in production, with the consumer-
aligned segments in particular faring relatively well.
The crisis in the construction industry has continued
in many countries of Europe, while in the USA there are
gradual signs of an end to the lengthy building slump.
Business Performance First Half 2009
Statement of Income
Despite the difficult market situation, we achieved sales
of 6,743 million euros in the first half of 2009, just 1.3 per-
cent below the level for the first half of 2008. A major
contributor in this regard was the National Starch busi-
nesses consolidated since April 3, 2008. After adjusting
for foreign exchange, sales fell by 0.8 percent, and by
6.1 percent organically (i.e. adjusted for foreign exchange
and acquisitions/divestments).
Business sector performance was very mixed: while
the consumer businesses Laundry & Home Care and
Cosmetics/Toiletries were able to successfully continue
their positive growth trend, posting organic growth rates
of 3.3 percent and 3.5 percent respectively, sales of the
Adhesive Technologies business sector decreased organi-
cally by 16.6 percent as a result of the difficult situation
encountered by major customer industries around the
world.
Gross margin increased compared to the prior-year
period by 1.0 percentage points to 44.8 percent. While it
was positively influenced by the decrease in raw material
prices, the low level of capacity utilization at Adhesive
Technologies had a negative effect. The gross margin of
the prior-year period was burdened by major restructur-
ing charges.
Marketing, selling and distribution expenses de-
creased by 1.4 percent with their share of sales remain-
ing stable at 29 percent. We spent a total of 202 mil-
lion euros on research and development, corresponding
to a share of sales of 3.0 percent (+0.3 percentage points).
Administrative expenses decreased by 11.0 percent. After
adjusting for restructuring charges, they rose by 2.3 per-
Half Year Financial Report 2009
Price and volume effects1)
in percent
Organic sales
growth
of which price
of which volume
Laundry & Home Care 3.3 6.3 – 3.0
Cosmetics / Toiletries 3.5 1.1 2.4
Adhesive Technologies –16.6 5.2 – 21.8
Henkel Group – 6.1 4.5 –10.61) Calculated on the basis of units of 1,000 euros

13 Half Year Financial Report / Quarterly Report 2/2009
Half Year Financial Report 2009
cent. It should be noted in this regard that the National
Starch businesses acquired on April 3, 2008 were not
included in the financials for the first quarter of last
year. Restructuring charges fell from 262 million euros
to 41 million euros. Of this amount, 17 million euros was
attributable to the integration of the National Starch
businesses and 24 million euros to ordinary activities.
The distribution of the restructuring charges between
the various expense items in the income statement is
explained on page 17. The positive balance of other
operating income and charges decreased from 26 mil-
lion euros to 5 mil lion euros. Included in other operat-
ing income is 3 mil lion euros arising from the release of
provisions for pensions and similar obligations.
Despite the decrease in earnings in the Adhesive
Technologies business sector, operating profit (EBIT) in-
creased by 14.6 percent from 433 million euros to 497 mil-
lion euros . The prior-year period was characterized by
restructuring charges and the first-time consolidation
of the National Starch businesses effective April 3, 2008.
After adjusting for restructuring charges (41 mil lion
euros) and one-time expenses (8 million euros in con-
sultancy costs related to the integration of the National
Starch businesses) and also one-time gains (3 million
euros from the release of provisions for pensions and
similar obligations), adjusted operating profit (“adjusted
EBIT”) decreased by 21.3 percent from 690 million euros
to 543 million euros.
Return on sales (EBIT margin) amounted to 7.4 per-
cent. Adjusted return on sales (“adjusted EBIT margin”)
decreased from 10.1 percent to 8.1 percent. This is pri-
marily attributable to the significant decline in earnings
at the Adhesive Technologies business sector already
mentioned above. Return on capital employed (ROCE)
eased accordingly, from 9.9 percent to 8.2 percent.
Our investment result fell from 43 million euros to
–4 million euros, essentially due to the sale of our partici-
pation in Ecolab in November 2008. Net interest expense
improved by 14 million euros from –122 million euros to
–108 million euros. This is largely due to lower interest
rates compared to the previous year. The financial result
decreased from –79 million euros to –112 million euros.
The tax rate amounted to 29.6 percent.
Net earnings for the half year rose by 2.3 percent to
271 million euros. After minority interests totaling
11 million euros, net earnings for the half year were
260 million euros (first half year 2008: 257 million euros).
Adjusted half-yearly net earnings after minority interests
amounted to 292 million euros compared to 445 million
euros in the first six months of 2008. Earnings per pre-
ferred share (EPS) rose by 1.5 percent to 0.61 euros. The
adjusted figure was 0.68 euros compared to 1.03 euros
in the first half of 2008.
Balance Sheet
Compared to the end of 2008, the balance sheet total
increased slightly by 105 million euros to 16,278 mil-
lion euros. While non-current assets remained largely
constant, current assets rose by 111 million euros to
4,924 million euros. Liquid funds/marketable securities
grew significantly from 338 million euros to 709 million
euros. There was a substantial decrease in assets held
for sale following the disposal of the afore-mentioned
consumer adhesive brands in the USA and Canada in
the second quarter.
Shareholders’ equity including minority interests de-
creased from 6,535 million euros to 6,408 million euros.
This was due to earnings for the half year amounting to
271 million euros being offset by negative translation
differences of 71 million euros, actuarial losses in respect
of pension obligations amounting to 67 million euros,
valuation losses on derivative hedging transactions rec-
ognized in equity in the amount of 8 million euros, and
other changes that yielded a net decrease of 20 million
euros. The dividend payout for the previous fiscal year
amounting to 232 million euros (of which Henkel AG
& Co. KGaA 224 million euros) further reduced share-
holders’ equity. The equity ratio (shareholders’ equity
including minority interests as a percentage of total as-
sets) showed a slight decline of 0.9 percentage points to
39.4 percent.
Under non-current liabilities, the senior bond issued
in March 2009 in the amount of 1.0 billion euros and
the floating rate note resulted in an increase totaling
some 1.4 billion euros. The proceeds were used to redeem
short-term borrowings and boost our liquid funds. These

14 Half Year Financial Report / Quarterly Report 2/2009
Capital Expenditures
Capital expenditures on property, plant and equipment
for continuing operations amounted to 185 million euros,
compared to 234 million euros in the previous year. In
addition, we invested a total of 13 million euros in intan-
gible assets (previous year: 9 million euros).
Acquisitions and Divestments
On May 29, 2009, we sold our operations involving the
consumer adhesive brands Duck, Painter’s Mate Green
and Easy Liner in the USA and Canada to Shurtape Tech-
nologies, LLC of Hickory, North Carolina, USA.
Employees
As of June 30, 2009, we had 51,819 employees (June 30,
2008: 57,593). This represents a decrease of 10.0 percent.
The proportion of employees working outside Germany
was 81.7 percent.
Research and Development
Expenses for research and development increased to
202 million euros (+9.8 percent), corresponding to an R&D
ratio of 3.0 percent of sales (previous year: 2.7 percent).
Outlook
Underlying Economic Conditions
We continue to expect 2009 to be a year of pronounced
recession. There are still no clear signs of any imminent
upturn. The news and indicators available still do not
provide a uniform picture. Order intake continues to
decline – albeit at a slower rate than before – indicat-
ing that industrial production is still on a downward
slope. Consumers are also likely to be reluctant to make
major purchases due to apprehension at the prospect
of an increase in unemployment. On the positive side,
the low inflation rates and declining energy prices are
stabilizing the real income of private households, with
economic packages also being introduced to stimulate
national economies.
Although private consumption has served to cushion
the economic downturn, this support could – despite the
still currently positive consumer climate indicators –
Half Year Financial Report 2009 » Outlook
capital market transactions have enabled us to cover our
entire foreseeable financing requirement of the next
few years with long-term borrowings. The decrease in
short-term provisions for taxes is primarily due to the tax
payment arising from the sale of our Ecolab participation
in November 2008.
Net debt increased versus the end of the previous
year by 122 million euros to 3,914 million euros. Com-
pared to the end of the first quarter, net debt declined
by 176 million euros. We define net debt as borrowings
less liquid funds and – commencing with the present
interim report as of June 30, 2009 – less any positive or
plus any negative fair value of hedging contracts cover-
ing those borrowings. In taking into account the current
fair value of such hedging instruments, we are able to
improve the informative content of the net debt metric.
As of June 30, 2009, the net positive fair value of these
derivatives amounted to 144 million euros (December 31,
2008: 89 million euros).
Cash Flow Statement
Cash flow from operating activities increased compared
to the prior-year period by 378 million euros to 440 mil-
lion euros. Positive developments in our net working
capital, particularly with respect to inventories, resulted
in a significant inflow of funds.
Cash flow from investing activities (–151 million
euros) remained roughly at the level of the prior-year
period after adjusting for the high level of outflows that
occurred in the first six months of 2008 as a result of the
acquisition of the National Starch businesses. During the
period under review, the outflow of funds was reduced
compared to the previous year by virtue of lower invest-
ments in property, plant and equipment and higher
proceeds from asset disposals.
Cash flow from financing activities (87 million euros)
resulted from an outflow of funds due to dividend and
interest payments that were slightly above the level of
the prior-year period, offset by an inflow of short-term
finance. In the previous year, cash flow from financing
activities was heavily influenced by the one-time effect
arising from loans taken out to finance the acquisition
of the National Starch businesses.

15 Half Year Financial Report / Quarterly Report 2/2009
dwindle in some regions during the second half of 2009,
particularly in Europe where increasing unemployment
is expected. On the other hand, the economic stimulus
program introduced in the USA will primarily benefit
private consumption, with tax breaks underpinning the
purchasing power of many consumers.
The automotive industry is unlikely to climb its way
out of the current crisis in the short term. The stimulus
packages introduced in various countries are not ex-
pected to generate any enduring momentum.
The mechanical engineering sector will need to adjust
to further decreases in production in some countries
in view of the persistently low level of orders received.
The prospects for the electronics industry have slightly
improved. However, production levels are still very low
following the heavy decline of earlier months.
In the coming months, the packaging sector will
likely continue to be supported by the relatively non-
cyclical food and semiluxuries segments. The metals
industry, which has been heavily impacted by the reces-
sion, can be expected to recover slightly from its current
low volume levels.
The outlook for the building sector remains gloomy
on a global scale. While the USA may have bottomed out,
the construction industry in Western Europe is likely to
further contract to a degree. The prospects in the growth
regions are somewhat more favorable. With the economic
cycle there moving into an upturn, a revival in construc-
tion activity can be expected.
Opportunities and Risks
Despite the worldwide recession, we see opportunities
emanating from a large number of innovative products
which all three of our business sectors will be launch-
ing onto the market. The decline in raw material prices
compared to the previous year will also have a positive
effect. Opportunities should likewise arise from our
determination to pursue our three strategic priorities,
which are to:
» Achieve our full business potential
» Focus more on our customers
» Strengthen our global team
We see particular risk in any persistence of the recession
beyond 2009. There are additional risks that arise from
the global trend among our customers toward consolida-
tion, and in the possibility of increasing competition, to
which we would need to respond with a further increase
in our market investments.
Further specific opportunities and risks are discussed
in the individual business sector reports in our Annual
Report 2008.
Sales and Profits Forecast for 2009
We expect that the difficult market conditions currently
prevailing in the real economy and also in the financial
markets will persist through 2009. The general economic
climate and its further development remain rather dif-
ficult to predict.
Nevertheless, we are confident of outperforming our
relevant markets in terms of organic sales growth (i.e.
growth after adjusting for foreign exchange and acqui-
sitions/divestments). We have introduced a number of
further measures on the operational side from which we
expect positive momentum to develop. These activities
and also relief from easing raw material prices will sup-
port the development of our operating profit (EBIT) and
earnings per preferred share (EPS) – adjusted in each case
for one-time gains/charges and restructuring charges.
For the third quarter of 2009 we expect our consumer
businesses to continue to perform well – albeit with a
degree of deceleration. Our expectation for the Adhe-
sive Technologies business sector is that it will develop
similarly to or slightly better than in the second quarter
of 2009.
The outlook for the fourth quarter of 2009 is unclear
due to continuing uncertainties regarding the likely
development of the economic parameters governing
the markets of relevance for Henkel. This also reduces
the reliability of any forecast made with respect to the
year as a whole. As soon as our markets allow properly
reasoned assumptions, we will communicate quantified
expectations for full fiscal 2009.
Half Year Financial Report 2009 » Outlook

16 Half Year Financial Report / Quarterly Report 2/2009
Consolidated Statement of Income
in million euros Q2/2008 % Q2/2009 % Change
Sales 3,668 100.0 3,485 100.0 – 5.0 %
Cost of sales1) – 2,149 – 58.6 –1,906 – 54.7 –11.3 %
Gross profit 1,519 41.4 1,579 45.3 3.9 %
Marketing, selling and distribution expenses1) – 1,063 – 29.0 –1,007 – 28.8 – 5.3 %
Research and development expenses – 98 – 2.7 –103 – 3.0 5.1 %
Administrative expenses1) – 254 – 6.9 –191 – 5.5 – 24.8 %
Other operating income 37 1.0 33 0.9 –10.8 %
Other operating charges – 28 – 0.7 – 32 – 0.9 14.3 %
Operating profit (EBIT) 113 3.1 279 8.0 >100.0 %
Investment result 24 0.7 – 4 – 0.1 >100.0 %
Net interest – 84 – 2.3 – 56 –1.6 – 33.3 %
Financial result – 60 –1.6 – 60 –1.7 –
Earnings before tax 53 1.5 219 6.3 >100.0 %
Taxes on income –11 – 0.3 – 69 – 2.0 >100.0 %
Net earnings 42 1.2 150 4.3 >100.0 %
– Attributable to minority shareholders 4 – 0.1 7 – 0.2 75.0 %
– Attributable to shareholders of Henkel AG & Co. KGaA 38 1.1 143 4.1 >100.0 %1) Restructuring charges second quarter 2009: 25 million euros (comparative figures for the prior-year period in parentheses: 256 million euros), of which: cost of sales
12 million euros (129 million euros); marketing, selling and distribution expenses 7 million euros (61 million euros); research and development expenses 2 million euros (1 million euros); administrative expenses 4 million euros (65 million euros)
Interim Consolidated Financial Statements Second Quarter 2009 » Consolidated Statement of Income
Earnings per share (basic)in euros Q2/2008 Q2/2009 Change
Ordinary shares 0.09 0.33 >100.0 %
Non-voting preferred shares 0.09 0.33 >100.0 %
Earnings per share (diluted)in euros Q2/2008 Q2/2009 Change
Ordinary shares 0.07 0.33 >100.0 %
Non-voting preferred shares 0.08 0.33 >100.0 %
Adjusted earnings figuresin million euros Q2/2008 Q2/2009
EBIT (as reported) 113 279
One-time gains – 3 –
One-time charges 6 4
Restructuring charges1) 256 25
Adjusted EBIT 372 308
Adjusted return on sales (EBIT) in % 10.1 8.7
Adjusted net earnings after minority interests 227 162
Adjusted earnings per preferred share in euros 0.52 0.371) In Q2/2009: 6 million euros from the integration of the National Starch businesses and 19 million euros from ordinary activities
17 Half Year Financial Report / Quarterly Report 2/2009
Consolidated Statement of Income
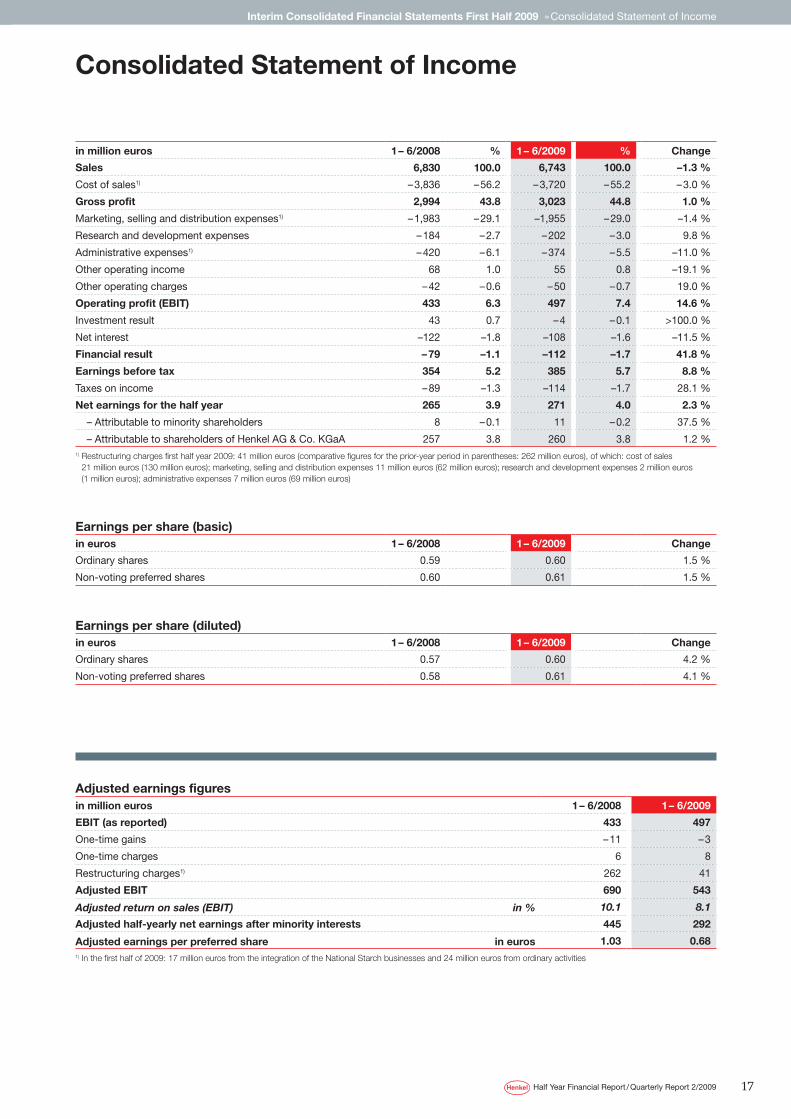
in million euros 1 – 6/2008 % 1 – 6/2009 % Change
Sales 6,830 100.0 6,743 100.0 –1.3 %
Cost of sales1) – 3,836 – 56.2 – 3,720 – 55.2 – 3.0 %
Gross profit 2,994 43.8 3,023 44.8 1.0 %
Marketing, selling and distribution expenses1) – 1,983 – 29.1 –1,955 – 29.0 –1.4 %
Research and development expenses – 184 – 2.7 – 202 – 3.0 9.8 %
Administrative expenses1) – 420 – 6.1 – 374 – 5.5 –11.0 %
Other operating income 68 1.0 55 0.8 –19.1 %
Other operating charges – 42 – 0.6 – 50 – 0.7 19.0 %
Operating profit (EBIT) 433 6.3 497 7.4 14.6 %
Investment result 43 0.7 – 4 – 0.1 >100.0 %
Net interest –122 –1.8 –108 –1.6 –11.5 %
Financial result – 79 –1.1 –112 –1.7 41.8 %
Earnings before tax 354 5.2 385 5.7 8.8 %
Taxes on income – 89 –1.3 –114 –1.7 28.1 %
Net earnings for the half year 265 3.9 271 4.0 2.3 %
– Attributable to minority shareholders 8 – 0.1 11 – 0.2 37.5 %
– Attributable to shareholders of Henkel AG & Co. KGaA 257 3.8 260 3.8 1.2 %1) Restructuring charges first half year 2009: 41 million euros (comparative figures for the prior-year period in parentheses: 262 million euros), of which: cost of sales
21 million euros (130 million euros); marketing, selling and distribution expenses 11 million euros (62 million euros); research and development expenses 2 million euros (1 million euros); administrative expenses 7 million euros (69 million euros)
Interim Consolidated Financial Statements First Half 2009 » Consolidated Statement of Income
Earnings per share (basic)in euros 1 – 6/2008 1 – 6/2009 Change
Ordinary shares 0.59 0.60 1.5 %
Non-voting preferred shares 0.60 0.61 1.5 %
Earnings per share (diluted)in euros 1 – 6/2008 1 – 6/2009 Change
Ordinary shares 0.57 0.60 4.2 %
Non-voting preferred shares 0.58 0.61 4.1 %
Adjusted earnings figuresin million euros 1 – 6/2008 1 – 6/2009
EBIT (as reported) 433 497
One-time gains – 11 – 3
One-time charges 6 8
Restructuring charges1) 262 41
Adjusted EBIT 690 543
Adjusted return on sales (EBIT) in % 10.1 8.1
Adjusted half-yearly net earnings after minority interests 445 292
Adjusted earnings per preferred share in euros 1.03 0.681) In the first half of 2009: 17 million euros from the integration of the National Starch businesses and 24 million euros from ordinary activities

18 Half Year Financial Report / Quarterly Report 2/2009
Interim Consolidated Financial Statements First Half 2009 » Consolidated Balance Sheet
Consolidated Balance Sheet
Assetsin million euros Dec. 31, 20081) % June 30, 2009 %
Intangible assets 8,491 52.5 8,411 51.7
Property, plant and equipment 2,361 14.6 2,338 14.4
Financial assets 24 0.1 23 0.1
Other financial assets 172 1.1 206 1.3
Income tax refund claims 3 – 2 –
Other non-current assets 4 – 18 0.1
Deferred taxes 305 1.9 356 2.2
Non-current assets 11,360 70.2 11,354 69.8
Inventories 1,482 9.2 1,334 8.2
Trade accounts receivable 1,847 11.4 1,967 12.1
Other financial assets 575 3.6 561 3.4
Other current assets 256 1.6 169 1.0
Income tax refund claims 202 1.2 154 0.9
Liquid funds/Marketable securities 338 2.1 709 4.4
Assets held for sale 113 0.7 30 0.2
Current assets 4,813 29.8 4,924 30.2
Total assets 16,173 100.0 16,278 100.0
Shareholders’ equity and liabilitiesin million euros Dec. 31, 20081) % June 30, 2009 %
Subscribed capital 438 2.7 438 2.7
Capital reserve 652 4.0 652 4.0
Retained earnings 6,805 42.0 6,747 41.4
Gains and losses recognized in equity –1,411 – 8.7 –1,489 – 9.1
Equity excluding minority interests 6,484 40.0 6,348 39.0
Minority interests 51 0.3 60 0.4
Equity including minority interests 6,535 40.3 6,408 39.4
Pensions and similar obligations 833 5.2 878 5.4
Long-term income tax provisions 177 1.1 122 0.7
Other long-term provisions 336 2.1 298 1.8
Long-term borrowings 2,402 14.9 3,768 23.1
Non-current financial liabilities 77 0.5 92 0.6
Other non-current liabilities 9 0.1 32 0.2
Deferred taxes 413 2.5 470 2.9
Non-current liabilities 4,247 26.4 5,660 34.7
Current income tax provisions 343 2.1 200 1.2
Other current provisions 964 5.9 926 5.7
Short-term borrowings 1,817 11.2 999 6.1
Trade accounts payable 1,678 10.4 1,673 10.3
Current financial liabilities 272 1.7 155 1.0
Other current liabilities 306 1.9 239 1.5
Income tax liabilities 11 0.1 18 0.1
Current liabilities 5,391 33.3 4,210 25.9
Total equity and liabilities 16,173 100.0 16,278 100.01) Adjusted due to changes in the provisional purchase price allocation pertaining to the acquisition of the National Starch businesses
19 Half Year Financial Report / Quarterly Report 2/2009
Interim Consolidated Financial Statements First Half 2009 » Consolidated Cash Flow Statement
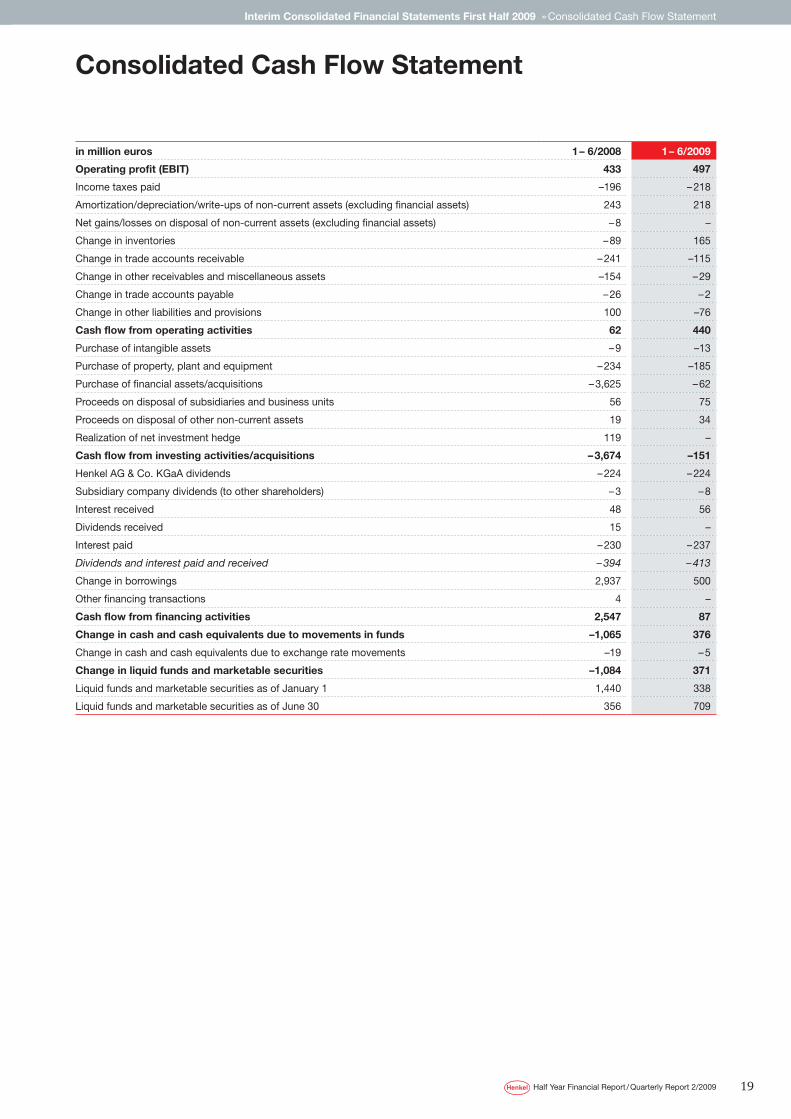
in million euros 1 – 6/2008 1 – 6/2009
Operating profit (EBIT) 433 497
Income taxes paid –196 – 218
Amortization/depreciation/write-ups of non-current assets (excluding financial assets) 243 218
Net gains/losses on disposal of non-current assets (excluding financial assets) – 8 –
Change in inventories – 89 165
Change in trade accounts receivable – 241 –115
Change in other receivables and miscellaneous assets –154 – 29
Change in trade accounts payable – 26 – 2
Change in other liabilities and provisions 100 –76
Cash flow from operating activities 62 440
Purchase of intangible assets – 9 –13
Purchase of property, plant and equipment – 234 –185
Purchase of financial assets/acquisitions – 3,625 – 62
Proceeds on disposal of subsidiaries and business units 56 75
Proceeds on disposal of other non-current assets 19 34
Realization of net investment hedge 119 –
Cash flow from investing activities/acquisitions – 3,674 –151
Henkel AG & Co. KGaA dividends – 224 – 224
Subsidiary company dividends (to other shareholders) – 3 – 8
Interest received 48 56
Dividends received 15 –
Interest paid – 230 – 237
Dividends and interest paid and received – 394 – 413
Change in borrowings 2,937 500
Other financing transactions 4 –
Cash flow from financing activities 2,547 87
Change in cash and cash equivalents due to movements in funds –1,065 376
Change in cash and cash equivalents due to exchange rate movements –19 – 5
Change in liquid funds and marketable securities –1,084 371
Liquid funds and marketable securities as of January 1 1,440 338
Liquid funds and marketable securities as of June 30 356 709
Consolidated Cash Flow Statement

20 Half Year Financial Report / Quarterly Report 2/2009
Interim Consolidated Financial Statements First Half 2009 / Selected Explanatory Notes
Consolidated Statement of Recognized Income and Expense
in million euros 1 – 6/2008 1 – 6/2009
Net earnings for the half year 265 271
Foreign exchange effects – 235 –71
Financial instruments – 56 – 8
Actuarial gains/losses – 36 – 67
Share of net profits of associates 14 –
Other gains and losses recognized in equity 5 –
Gains and losses recognized directly in equity – 308 –146
Total earnings for the period – 43 125
– Attributable to minority shareholders –2 10
– Attributable to shareholders of Henkel AG & Co. KGaA – 41 115
Statement of Changes in Equity
in million euros Gains and losses recognized in equity
Ordinary shares
Pre-ferred
shares
Trea-sury
stock
Capital reserve
Re-tained earn-ings
Transla-tion
differ-ences
Financial instru-ments
Minority interests
Total
At January 1, 2008 260 178 –119 652 6,082 –1,298 –112 63 5,706
Distributions – – – – – 224 – – – 3 – 227
Sale of treasury stock – – 3 – – – – – 3
Net earnings – – – – 257 – – 8 265
Foreign exchange effects – – – – – – 226 – – 9 – 235
Financial instruments – – – – – – – 56 – – 56
Actuarial gains and losses – – – – – 36 – – – – 36
Other gains and losses recognized in equity – – – – 22 – – – 2 20
At June 30, 2008 260 178 –116 652 6,101 –1,524 –168 57 5,440
At December 31, 2008/ January 1, 2009 260 178 –115 652 6,920 –1,199 – 212 51 6,535
Distributions – – – – – 224 – – – 8 – 232
Sale of treasury stock – – – – – – – – –
Net earnings – – – – 260 – – 11 271
Foreign exchange effects – – – – – – 70 – –1 – 71
Financial instruments – – – – – – – 8 – – 8
Actuarial gains and losses – – – – 67 – – – – 67
Other gains and losses recognized in equity – – – – – 27 – – 7 – 20
At June 30, 2009 260 178 –115 652 6,862 –1,269 – 220 60 6,408

21 Half Year Financial Report / Quarterly Report 2/2009
Selected Explanatory Notes » Group Segment Report by Business Sector
Group Segment Report
by Business Sector1)
Second quarter 2009in million euros
Laundry & Home
Care
Cos metics/ Toiletries
Adhesives for Crafts-
men and Consumers
Industrial Adhesives
Total Adhesive
Tech- nologies
Operating business
sectors total
Corporate
Henkel
Sales April – June 2009 1,058 790 467 1,115 1,582 3,430 55 3,485
Change from previous year 4.4 % 1.5 % –14.4 % –12.2 % –12.9 % – 4.9 % – – 5.0 %
Proportion of Group sales 30 % 23 % 13 % 32 % 45 % 98 % 2 % 100 %
Sales April – June 2008 1,012 779 546 1,270 1,816 3,607 61 3,668
EBITDA April – June 2009 146 112 62 94 156 414 – 30 384
EBITDA April – June 2008 119 110 71 168 239 468 –194 274
Change from previous year 22.3 % 2.3 % –12.9 % – 44.3 % – 34.9 % –11.6 % – 39.7 %
Return on sales (EBITDA) April – June 2009 13.8 % 14.1 % 13.4 % 8.4 % 9.9 % 12.1 % – 11.0 %
Return on sales (EBITDA) April – June 2008 11.8 % 14.0 % 13.2 % 13.2 % 13.2 % 13.0 % – 7.5 %
Amortization/depreciation and write-ups of trademark rights, other rights and property, plant and equipment April – June 2009 27 12 12 49 61 100 5 105
of which impairment losses April – June 2009 1 – – – – 1 – 1
of which write-ups April – June 2009 – – – – – – – –
Amortization/depreciation and write-ups of trademark rights, other rights and property, plant and equipment April – June 2008 27 12 12 35 47 86 75 161
of which impairment losses April – June 2008 17 – 1 4 5 22 48 70
of which write-ups April – June 2008 – – – – – – – –
EBIT April – June 2009 119 100 50 45 95 314 – 354) 279
EBIT April – June 2008 92 98 59 133 192 382 – 2695) 113
Change from previous year 28.8 % 2.8 % –15.5 % – 66.6 % – 50.8 % –18.0 % – >100 %
Return on sales (EBIT) April – June 2009 11.2 % 12.7 % 10.9 % 4.0 % 6.0 % 9.2 % – 8.0 %
Return on sales (EBIT) April – June 2008 9.1 % 12.5 % 11.0 % 10.5 % 10.7 % 10.6 % – 3.1 %
Capital employed April – June 20092) 2,653 2,186 1,240 6,277 7,517 12,356 –161 12,195
Capital employed April – June 20082) 2,532 2,133 1,306 2,914 4,220 8,885 191 9,076
Change from previous year 4.8 % 2.5 % – 5.1 % >100 % 14.6 % 39.1 % – 34.4 %
Return on capital employed (ROCE) April – June 2009 17.8 % 18.3 % 16.4 % 2.8 % 5.1 % 10.2 % – 9.1 %
Return on capital employed (ROCE) April – June 2008 14.5 % 18.3 % 18.4 % 18.3 % 18.3 % 17.2 % – 5.0 %
Capital expenditures (excl. financial assets) April – June 2009 47 11 18 20 38 96 16 112
Capital expenditures (excl. financial assets) April – June 2008 25 1 19 35 54 80 49 129
Operating assets April – June 20093) 3,902 2,772 1,523 7,101 8,624 15,298 371 15,669
Operating liabilities April – June 2009 1,092 785 359 1,143 1,502 3,379 532 3,911
Net operating assets employed April – June 20093) 2,810 1,987 1,164 5,958 7,122 11,919 –161 11,758
Operating assets April – June 20083) 3,771 2,717 1,631 4,120 5,751 12,239 499 12,738
Operating liabilities April – June 2008 1,120 796 408 1,468 1,876 3,792 306 4,098
Net operating assets employed April – June 20083) 2,651 1,921 1,223 2,652 3,875 8,447 193 8,640
1) Calculated on the basis of units of 1,000 euros 2) Including goodwill at cost prior to any accumulated amortization in accordance with IFRS 3.79b 3) Including goodwill at net book value 4) Including the restructuring charges of 6 million euros for the National Starch businesses. The ordinary restructuring charges are allocated to the operating business sectors5) In the previous year, the costs of Corporate Research were allocated to the business sectors for the first time. In the second quarter of 2008, a total of 8 million euros in
Corporate Research expenses was distributed from the Corporate segment to the business sectors as follows: Laundry & Home Care 3 million euros; Cosmetics/Toiletries 2 million euros; Adhesive Technologies 3 million euros

22 Half Year Financial Report / Quarterly Report 2/2009
Selected Explanatory Notes » Group Segment Report by Business Sector
Group Segment Report
by Business Sector1)
January – June 2009in million euros
Laundry & Home
Care
Cos metics/ Toiletries
Adhesives for Crafts-
men and Consumers
Industrial Adhesives
Total Adhesive
Tech- nologies
Operating business
sectors total
Corporate
Henkel
Sales January – June 2009 2,071 1,510 877 2,174 3,051 6,632 111 6,743
Change from previous year 1.3 % 1.6 % –14.3 % 0.8 % – 4.1 % –1.2 % – –1.3 %
Proportion of Group sales 31 % 22 % 13 % 32 % 45 % 98 % 2 % 100 %
Sales January – June 2008 2,043 1,487 1,023 2,157 3,180 6,710 120 6,830
EBITDA January – June 2009 280 214 105 160 265 759 – 44 715
EBITDA January – June 2008 246 209 125 300 425 880 – 204 676
Change from previous year 13.7 % 2.9 % –16.0 % – 46.8 % – 37.7 % –13.7 % – 5.7 %
Return on sales (EBITDA) January – June 2009 13.5 % 14.1 % 12.0 % 7.3 % 8.7 % 11.4 % – 10.6 %
Return on sales (EBITDA) January – June 2008 12.1 % 14.0 % 12.3 % 13.9 % 13.4 % 13.1 % – 9.9 %
Amortization/depreciation and write-ups of trademark rights, other rights and property, plant and equipment January – June 2009 54 23 24 99 123 200 18 218
of which impairment losses January – June 2009 1 – 2 6 8 9 – 9
of which write-ups January – June 2009 – – – – – – – –
Amortization/depreciation and write-ups of trademark rights, other rights and property, plant and equipment January – June 2008 54 24 24 59 83 161 82 243
of which impairment losses January – June 2008 18 – 1 4 5 23 48 71
of which write-ups January – June 2008 – – – – – – – –
EBIT January – June 2009 226 191 81 61 142 559 – 624) 497
EBIT January – June 2008 192 185 101 241 342 719 – 2865) 433
Change from previous year 18.0 % 3.4 % – 20.2 % – 74.7 % – 58.5 % – 22.3 % – 14.6 %
Return on sales (EBIT) January – June 2009 10.9 % 12.6 % 9.3 % 2.8 % 4.7 % 8.4 % – 7.4 %
Return on sales (EBIT) January – June 2008 9.4 % 12.4 % 10.0 % 11.2 % 10.8 % 10.7 % – 6.3 %
Capital employed January – June 20092) 2,700 2,236 1,259 6,198 7,457 12,393 –199 12,194
Capital employed January – June 20082) 2,549 2,133 1,289 2,590 3,879 8,561 152 8,713
Change from previous year 5.9 % 4.8 % – 2.4 % >100 % 92.2 % 44.8 % – 40.0 %
Return on capital employed (ROCE) January – June 2009 16.7 % 17.1 % 12.9 % 2.0 % 3.8 % 9.0 % – 8.2 %
Return on capital employed (ROCE) January – June 2008 15.0 % 17.3 % 15.8 % 18.6 % 17.7 % 16.8 % – 9.9 %
Capital expenditures (excl. financial assets) January – June 2009 83 22 31 67 98 203 23 226
Capital expenditures (excl. financial assets) January – June 2008 68 21 36 62 98 187 56 243
Operating assets January – June 20093) 3,967 2,815 1,541 7,054 8,595 15,377 366 15,743
Operating liabilities January – June 2009 1,107 777 358 1,166 1,524 3,408 565 3,973
Net operating assets employed January – June 20093) 2,860 2,038 1,183 5,888 7,071 11,969 –199 11,770
Operating assets January – June 20083) 3,818 2,721 1,614 3,529 5,143 11,682 425 12,107
Operating liabilities January – June 2008 1,146 798 407 1,212 1,619 3,563 273 3,836
Net operating assets employed January – June 20083) 2,672 1,923 1,207 2,317 3,524 8,119 152 8,271
1) Calculated on the basis of units of 1,000 euros 2) Including goodwill at cost prior to any accumulated amortization in accordance with IFRS 3.79b 3) Including goodwill at net book value 4) Including the restructuring charges of 17 million euros for the National Starch businesses. The ordinary restructuring charges are allocated to the operating business
sectors5) In the previous year, the costs of Corporate Research were allocated to the business sectors for the first time. In the first half of 2008, a total of 17 million euros in
Corporate Research expenses was distributed from the Corporate segment to the business sectors as follows: Laundry & Home Care 8 million euros; Cosmetics/Toiletries 3 million euros; Adhesive Technologies 6 million euros
23 Half Year Financial Report / Quarterly Report 2/2009
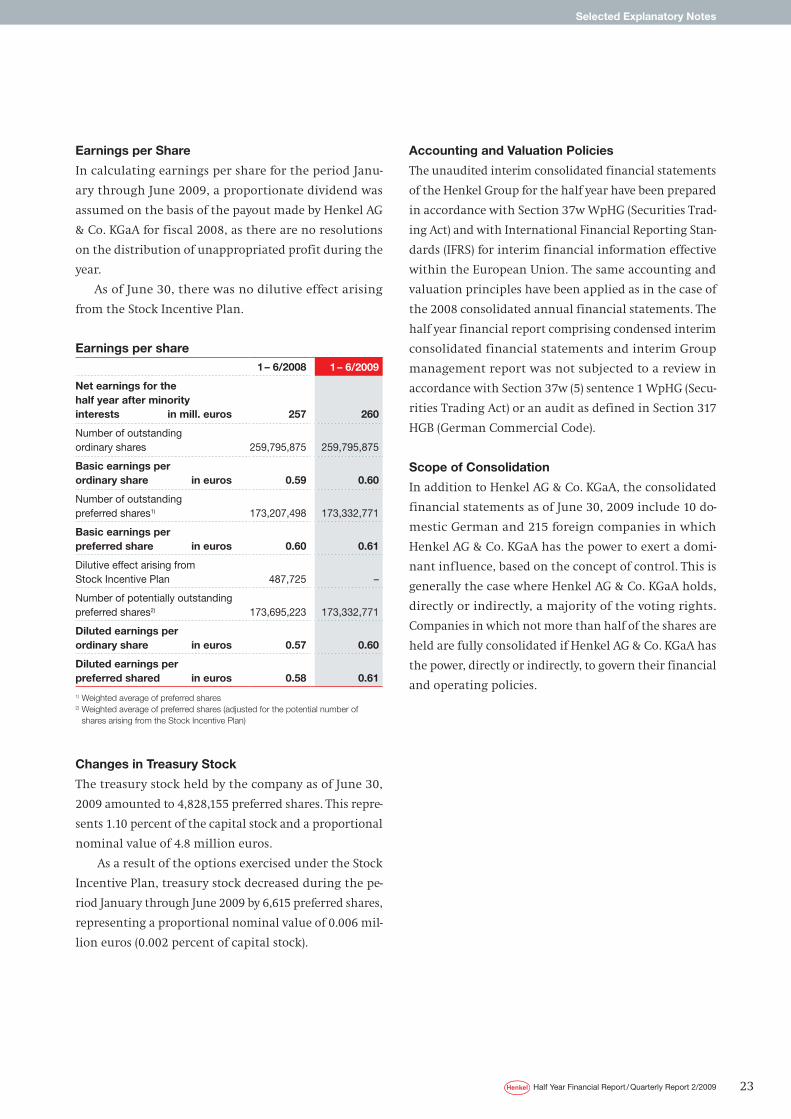
Earnings per Share
In calculating earnings per share for the period Janu-
ary through June 2009, a proportionate dividend was
assumed on the basis of the payout made by Henkel AG
& Co. KGaA for fiscal 2008, as there are no resolutions
on the distribution of unappropriated profit during the
year.
As of June 30, there was no dilutive effect arising
from the Stock Incentive Plan.
Earnings per share1 – 6/2008 1 – 6/2009
Net earnings for the half year after minorityinterests in mill. euros
257
260
Number of outstanding ordinary shares
259,795,875
259,795,875
Basic earnings per ordinary share in euros
0.59
0.60
Number of outstanding preferred shares1)
173,207,498
173,332,771
Basic earnings per preferred share in euros
0.60
0.61
Dilutive effect arising from Stock Incentive Plan
487,725
–
Number of potentially outstanding preferred shares2)
173,695,223
173,332,771
Diluted earnings per ordinary share in euros
0.57
0.60
Diluted earnings per preferred shared in euros
0.58
0.61
1) Weighted average of preferred shares 2) Weighted average of preferred shares (adjusted for the potential number of
shares arising from the Stock Incentive Plan)
Changes in Treasury Stock
The treasury stock held by the company as of June 30,
2009 amounted to 4,828,155 preferred shares. This repre-
sents 1.10 percent of the capital stock and a proportional
nominal value of 4.8 million euros.
As a result of the options exercised under the Stock
Incentive Plan, treasury stock decreased during the pe-
riod January through June 2009 by 6,615 preferred shares,
representing a proportional nominal value of 0.006 mil-
lion euros (0.002 percent of capital stock).
Accounting and Valuation Policies
The unaudited interim consolidated financial statements
of the Henkel Group for the half year have been prepared
in accordance with Section 37w WpHG (Securities Trad-
ing Act) and with International Financial Reporting Stan-
dards (IFRS) for interim financial information effective
within the European Union. The same accounting and
valuation principles have been applied as in the case of
the 2008 consolidated annual financial statements. The
half year financial report comprising condensed interim
consolidated financial statements and interim Group
management report was not subjected to a review in
accordance with Section 37w (5) sentence 1 WpHG (Secu-
rities Trading Act) or an audit as defined in Section 317
HGB (German Commercial Code).
Scope of Consolidation
In addition to Henkel AG & Co. KGaA, the consolidated
financial statements as of June 30, 2009 include 10 do-
mestic German and 215 foreign companies in which
Henkel AG & Co. KGaA has the power to exert a domi-
nant influence, based on the concept of control. This is
generally the case where Henkel AG & Co. KGaA holds,
directly or indirectly, a majority of the voting rights.
Companies in which not more than half of the shares are
held are fully consolidated if Henkel AG & Co. KGaA has
the power, directly or indirectly, to govern their financial
and operating policies.
Selected Explanatory Notes

24 Half Year Financial Report / Quarterly Report 2/2009
Selected Explanatory Notes
Acquisition of the National Starch Businesses
On April 3, 2008, we acquired the Adhesives and Electron-
ic Materials divisions of the National Starch & Chemicals
Company following the takeover of the latter by Akzo
Nobel. The purchase price according to the contract dated
August 13, 2007, a so-called back-to-back agreement, was
3.7 billion euros (2.7 billion pounds sterling).
The acquired National Starch businesses and the
associated assets and liabilities have been disclosed at
fair value in this present half year financial report in
accordance with IFRS 3 “Business Combinations”. The
allocation of the acquisition costs to the acquired assets,
liabilities and contingent liabilities (purchase price allo-
cation) has now been completed based on IFRS 3.
Reconciliation of purchase price with goodwill as of April 3, 2008in million euros
Purchase price 3,676
Purchase price adjustments based on provisions of the sale agreement 272
Fair value of cash flow hedge – 332
Adjusted purchase price 3,616
Incidental acquisition costs 26
Cost of acquisition of the National Starch businesses 3,642
Book values of the acquired assets and liabilities – 640
Difference 3,002
Customer relationships 289
Technologies 215
Trademarks and brands 98
Other intangible assets 61
Other assets and liabilities 3
Deferred taxes – 227
Goodwill 2,563

25 Half Year Financial Report / Quarterly Report 2/2009
Half Year Financial Report 2009 » Responsibility Statement
Responsibility Statement
To the best of our knowledge, and in accordance with the
applicable accounting principles for interim financial
reporting, the interim consolidated financial statements
give a true and fair view of the assets, liabilities, financial
position and profit or loss of the Group, and the interim
management report of the Group includes a fair review
of the development and performance of the business and
the position of the Group, together with a description of
the principal opportunities and risks associated with the
expected development of the Group for the remaining
months of the financial year.
Düsseldorf, July 31, 2009
Henkel Management AG,
Personally Liable Partner of
Henkel AG & Co. KGaA
The Management Board
Kasper Rorsted
Thomas GeitnerDr. Friedrich Stara
Dr. Lothar Steinebach
Hans Van Bylen

26 Half Year Financial Report / Quarterly Report 2/2009
Half Year Financial Report 2009 » Report of the Audit Committee of the Supervisory Board
Report of the Audit Committee of the Supervisory Board
In the meeting of August 3, 2009, the Audit Committee
was provided explanatory details by the Management
Board and the external auditors KPMG concerning the
half year financial report, and also the review report
prepared by KPMG as commissioned by the Management
Board in compliance with the International Standard on
Review Engagements (ISRE 2410). This review gave rise to
no reservations or objections. The Audit Committee has
approved and endorses the half year financial report.
Düsseldorf, August 3, 2009
Chairman of the Audit Committee
Bernhard Walter

27 Half Year Financial Report / Quarterly Report 2/2009
Credits / Calendar
Calendar
Publication of Report
for the Third Quarter/Nine Months 2009:
Wednesday, November 11, 2009
Press Conference for Fiscal 2009
and Analysts’ Conference 2010:
Thursday, February 25, 2010
Annual General Meeting of
Henkel AG & Co. KGaA 2010:
Monday, April 19, 2010
Up-to-date facts and figures on Henkel also
available on the internet: www.henkel.com
Credits
Published by:
Henkel AG & Co. KGaA
40191 Düsseldorf, Germany
Phone: +49 (0)211/7 97-0
© 2009 Henkel AG & Co. KGaA
Edited by:
Corporate Communications, Investor Relations
Coordination: Oliver Luckenbach, Jens Bruno Wilhelm,
Wolfgang Zengerling
English Translation: Paul Knighton
Concept and Design: Kirchhoff Consult AG, Hamburg
Photographs: Henkel
Produced by: Schotte, Krefeld
Date of publication of this report:
August 5, 2009
Corporate Communications
Phone: +49 (0)211 797-3533
Fax: +49 (0)211 798-2484
E-mail: [email protected]
Investor Relations
Phone: +49 (0)211 797-3937
Fax: +49 (0)211 798-2863
E-mail: [email protected]
The collage on the cover is a mosaic. It is composed of
more than 300 portraits of Henkel employees as well as
logos and photos of products of our top brands. We would
like to thank all of the employees who agreed to let us
take their picture.
This document contains forward-looking statements which are based on the current estimates and assumptions made by the corporate management of
Henkel AG & Co. KGaA. Forward-looking statements are characterized by the use of words such as expect, intend, plan, predict, assume, believe, estimate,
anticipate and similar formulations. Such statements are not to be understood as in any way guaranteeing that those expectations will turn out to be
accurate. Future performance and the results actually achieved by Henkel AG & Co. KGaA and its affiliated companies depend on a number of risks and
uncertainties and may therefore differ materially from the forward-looking statements. Many of these factors are outside Henkel’s control and cannot
be accurately estimated in advance, such as the future economic environment and the actions of competitors and others involved in the marketplace.
Henkel neither plans nor undertakes to update any forward-looking statements.
This report is printed on PROFIsilkFSC from Sappi. The paper is made from pulp bleached without chlorine. It con-
sists of wood fibers originating from sustainably managed forests and certified according to the rules of the Forest
Stewardship Council (FSC). The printing inks contain no heavy metals. All product names are registered trademarks of Henkel AG & Co. KGaA, Düsseldorf, or its affiliated companies.