Embed Size (px)
Citation preview
Fourth Quarter 2009 Report to Shareholders
BMO Financial Group Reports Strong Fourth Quarter Results
Strong Net Income Reflects Good Revenue Growth, as BMO’s Focus on Customers is Yielding Results, and
Effective Expense Management
Personal and Commercial Banking Canada Continues to Deliver Robust Revenue and Net Income Growth
and Improvement in Competitive Position
Tier 1 Capital Ratio Remains Strong, at 12.24%
Financial Results Highlights:
Fourth Quarter 2009: • Net income of $647 million, up $87 million or 16% from a year ago • EPS1 of $1.11 and cash EPS2 of $1.13, both up $0.05 from a year ago
• Revenue increased 6.3% and expenses were reduced by 2.2% from a year ago
• Provision for credit losses of $386 million, down $79 million from a year ago. There was a $150 million increase in the general allowance last year and no change in the current quarter.
Fiscal 2009: • Net income of $1,787 million, compared with $1,978 million a year ago • EPS of $3.08 compared with $3.76 a year ago and cash EPS of $3.14 compared with $3.83 a year ago • Income Before Credit Provisions and Income Taxes of $3.7 billion in fiscal 2009, up from $3.3 billion a year ago • Provision for credit losses of $1,603 million comprised of specific provisions of $1,543 million and an increase in the general allowance of $60
million, compared with a provision for credit losses of $1,330 million a year ago comprised of specific provisions of $1,070 million and an increase in
the general allowance of $260 million • Adjusted cash EPS2 of $4.02 after excluding certain capital markets environment charges of $355 million after tax ($0.66 per share), severance costs
of $80 million after tax ($0.15 per share) in the second quarter and an increase in the general allowance of $39 million after tax ($0.07 per share) in
the third quarter
Toronto, November 24, 2009 – For the fourth quarter ended October 31, 2009, BMO Financial Group reported net income of $647 million or $1.11 per common share. Canadian personal and commercial banking reported strong results with net income of $394 million, up $70 million or 22% from a year ago. Today, we announced a first-quarter 2010 dividend of $0.70 per common share, unchanged from the preceding quarter and reflective of an annual dividend of $2.80 per common share. “Defining great customer experience means delivering in ways that are rooted in customer choice – with consistency at every interaction. It’s a disciplined approach that, for us, is yielding results,” said Bill Downe, President and Chief Executive Officer, BMO Financial Group. “Particularly during this past year, individuals and businesses needed to know that their banker would be there for them. BMO stood by its customers, listened, helped them make sense of the environment as it related to their individual circumstances and worked with them to make sure they were well-positioned for the recovery. By doing so, we also attracted new customers looking for a better banking experience. “P&C Canada had another very good quarter, with $394 million of net income, up 22% from a year ago. Commercial banking continues to experience strong growth, with revenue up $55 million or 16%. Our market share for loans to small and medium-size businesses

BMO Financial Group Fourth Quarter Report 2009 • 1
increased from the prior year. Our efforts to reach out to customers and help them save money and choose the best products for them are working. We have narrowed the gap to the industry leader on both personal and commercial loyalty scores relative to a year ago. “BMO Capital Markets results for the quarter were strong. Although net income was in line with a year ago, in 2008 we benefited from significant income tax recoveries. There were improved corporate banking revenues and underwriting fees increased. In 2009, we saw very strong revenue growth, with relatively modest expense growth which reflected focused cost control. Net income for the year was up 49% to more than $1 billion. “Private Client Group delivered good revenue growth in its business lines for the second consecutive quarter, reflective of improved equity markets and a continued focus on attracting new client assets. Net income was up strongly from a year ago, when results were affected by capital markets environment charges, and down somewhat from the third quarter which benefited from a recovery of prior periods’ taxes. Our U.S. retail banking franchise saw net income consistent with the third quarter and up from a year ago. Our focus on new customer acquisitions, lending and deposit gathering is enhancing our reputation in the U.S. Midwest as a bank that is here to help. “Our businesses gained strength over the course of 2009 as we have achieved strong revenue growth while keeping a firm grip on expenses. We maintained tight control over staffing levels and supplier costs while continuing to leverage opportunities for process simplification. We enter 2010 with strong capital and liquidity and the confidence of knowing that our consistent approach is turning customers into advocates. While we expect credit losses to remain elevated into 2010, we believe that we are well positioned for further growth as the economy improves,” concluded Mr. Downe.
1 All earnings per share (EPS) measures in this document refer to diluted EPS unless specified otherwise. 2 The adjustments that change results under generally accepted accounting principles (GAAP) to cash results are outlined in the Non-GAAP Measures section at the end of Management’s Discussion and Analysis
(MD&A), where such non-GAAP measures and their closest GAAP counterparts are outlined. Adjusted cash EPS is also a non-GAAP measure; please see details in the Notable Items section and also the GAAP and
Related Non-GAAP Measures section.
2 • BMO Financial Group Fourth Quarter Report 2009
Segment Overview P&C Canada
Net income was a strong $394 million, up $70 million or 22% from a year ago. Revenue increased across each of our personal, commercial and cards businesses, led by volume growth across most products and improved net interest margin. There was particularly strong growth in personal and commercial deposits. Good revenue growth together with effective management of operating expenses, while investing for the future, has resulted in strong cash operating leverage of 8.7%. Our strategy, of focusing on providing an excellent customer experience and improving productivity, is working. We have narrowed the gap to the industry leader on both personal and commercial loyalty scores relative to a year ago. In personal banking, we focus on product offers that are consistent with our brand promises, such as BMO SmartSteps. Since the launch of this offer, more than 100,000 BMO customers have taken advantage of at least one of the steps we recommend to make more from their hard-earned money. The First Home Essentials kit, targeted to potential homebuyers and launched in November 2008, proved very popular and helpful to customers over the course of the past year. We continue to focus on expanding and upgrading our branch network in priority markets and on driving revenue growth and customer loyalty through effective use of our robust performance management system. In fiscal 2009, we opened 12 new branches, redeveloped 20 and closed two. We also closed 93 Instore branches, responding to our customers’ preference for the full-service branches offering professional advice and relationship management capabilities, combined with the convenience of electronic banking channels. In commercial banking, our goal is to become the bank of choice for businesses across Canada. We rank second in Canadian business market share. We are leveraging this success to grow revenues by having value-added conversations with our customers, offering them both business and personal solutions and delivering on a complete customer experience as a trusted advisor that meets all their financial needs. In the cards business, we are the largest MasterCard issuer in Canada. We have simplified and enhanced our entire suite of credit card products by eliminating annual fees for 400,000 customers and doubling AIR MILES rewards for another 1.2 million customers, providing a best in class product offering for our customers. We are growing our cards business with prudent credit management and have a low credit loss rate relative to our peers. Today, we announced that we have signed a definitive agreement to purchase the Diners Club North American franchise from Citigroup, a transaction that on completion will more than double BMO’s corporate card business. The deal gives BMO exclusive rights to issue Diners Club cards to corporate and professional clients in the United States and Canada, and will add net receivables of almost US$1 billion. Diners Club is recognized around the world as a premier card program for employee Travel & Entertainment expense cards and the North American franchise also benefits from worldwide MasterCard acceptance. The acquisition will immediately enhance our competitive position by placing us among the top commercial card issuers in North America. The transaction, subject to satisfactory completion of certain closing conditions including regulatory approval, is anticipated to close before March 31, 2010.
P&C U.S. (all amounts in U.S. $)
Net income was $23 million, up $12 million from a year ago. Results benefited from reductions in integration costs and changes in the Visa litigation accrual. Higher levels of impaired loans and the costs of managing this portfolio have reduced net income in the quarter by $12 million (by $9 million a year ago). Cash net income was $39 million, including a severance charge of $2.4 million after tax, on a basis that adjusts for the impact of impaired loans, integration costs and the Visa litigation accrual. This is in line with the last five quarters where cash net income on this basis had exceeded $40 million. Deposits grew $1.5 billion or 7.7%. The deposit increase reflects our continued commitment to provide the right products and services for our customers. We have maintained our number two ranking for retail deposit market share in our Chicago area markets while network banks lost market share. We are maintaining our focus on new customer acquisition in both the consumer and commercial businesses, while continuing to make loans and provide deposit services to our customers and prudently manage expenses. Mortgage originations have moderated in the quarter but remain strong with some growth in new home buyer activity. We continue to focus on the customer experience as reflected in our sustained high loyalty scores. Our retail net promoter score was 44 for 2009, compared with 42 in 2008, while the average scores of our large bank competitors declined. These efforts have positioned us well as we come out of the current economic downturn. Given the economic environment in fiscal 2009 and its impact on our loan portfolios, we have strengthened our review and monitoring processes. We have also added expertise to our problem loan resolution teams to help our customers and to ensure effective management of our exposures.
BMO Financial Group Fourth Quarter Report 2009 • 3
Private Client Group (PCG)
Net income in the fourth quarter increased $26 million or 32% from the same quarter a year ago to $110 million. Results a year ago included charges of $31 million ($19 million) after tax associated with the decision to purchase certain holdings from our U.S. clients in the difficult market environment. The BMO Life Assurance acquisition increased net income by $9 million. Revenues were lower in the brokerage businesses but effective expense control contributed to improved results. Net income for the quarter decreased $10 million from the third quarter. Results in the prior quarter included a $23 million recovery of prior periods’ income taxes. Our lines of business achieved good revenue growth for the second consecutive quarter, as we remain focused on continuing to deliver the high level of service and advice that our clients expect, especially in the current economic environment. PCG net income excluding the insurance business was $69 million, up $16 million or 29% from the third quarter. Revenue grew by 6.1% as there was continued improvement in equity markets and we maintained our focus on attracting new client assets. Assets under management and administration improved by $9 billion or 3.7%. Net income in the insurance business was $41 million, a decrease of $26 million from the third quarter due primarily to that quarter’s $23 million recovery of income taxes. PCG announced the expansion of the exchange traded fund (ETF) product suite by launching nine new funds to offer a total of 13 funds. The ETF product line is part of our commitment to providing our clients with the most diverse group of products and solutions, and the best education and support in the field of investments, a testament to our dedication to helping clients make sense of their finances. BMO remains the only major Canadian financial institution to offer a family of these low-cost, easy-to-understand, risk-diversifying investment products. The Globe and Mail ranked BMO InvestorLine best of the bank-owned brokerages in its 2009 online brokerage rankings.
BMO Capital Markets
Net income for the quarter was $289 million, in line with the prior year. However, results a year ago benefited from a $52 million recovery of prior periods’ income taxes and a higher proportion of tax-exempt revenue. In this quarter, there were no capital markets environment charges. The prior year included largely offsetting gains and losses with respect to the capital markets environment. Revenue for the quarter increased $172 million from a year ago to $894 million. Corporate banking revenues increased significantly primarily as a result of higher lending fees and higher net interest income. Equity and debt underwriting fees were also up from the prior year. Trading revenues were down from a year ago and investment securities gains increased. To better serve clients with a more focused and integrated capital markets business, on November 16, 2009, we announced our definitive agreement with Paloma Securities, L.L.C to hire its securities lending team and acquire assets used in the securities lending business of Paloma Securities. The addition of this team will allow BMO Capital Markets to increase the scope of our existing North American securities lending operations. The transaction, which is subject to regulatory approval, is expected to close in mid-December.
Our continued commitment to our clients is being noticed. During the quarter, BMO Capital Markets received the best FX Bank Canadian Dollar award from FX Week in their annual rankings and was named the best foreign exchange bank in Canada by European CEO magazine. We also achieved the top market share and research quality rankings in the Canadian Fixed Income annual survey conducted by Greenwich Associates, an independent research firm. BMO Capital Markets was involved in 131 new issues in the quarter including 25 corporate debt and 27 government debt deals, eight issues of preferred shares and 71 common equity transactions, raising $45.8 billion, down $4.8 billion from the previous quarter.
Corporate Services
The net loss was $171 million for the quarter, with approximately two-thirds due to provisions for credit losses and the balance to low revenue. The net loss improved appreciably from the third quarter. There was a significant improvement in revenue and provisions for credit losses were better compared to the third quarter. The net loss of $171 million in the quarter, compared with a net loss of $150 million in the prior year. Reduced revenues were partially offset by lower provisions for credit losses. Net interest income and net income have improved in Corporate Services in each quarter of 2009 due in part to management actions and more stable market conditions. BMO employs a methodology for segmented reporting purposes whereby expected credit losses are charged to the operating groups quarterly based on their share of expected credit losses. The difference between quarterly charges based on expected losses and required quarterly provisions based on actual losses, as well as changes in the general allowance are charged (or credited) to Corporate Services.
Caution
The foregoing sections contain forward-looking statements. Please see the Caution Regarding Forward-Looking Statements.
Medium-Term Performance Targets BMO has medium-term objectives of, over time, increasing EPS by an average of 10% per year, earning average ROE of between 17% and 20%, achieving average annual cash operating leverage of at least 2 percentage points, and maintaining a strong regulatory capital position.
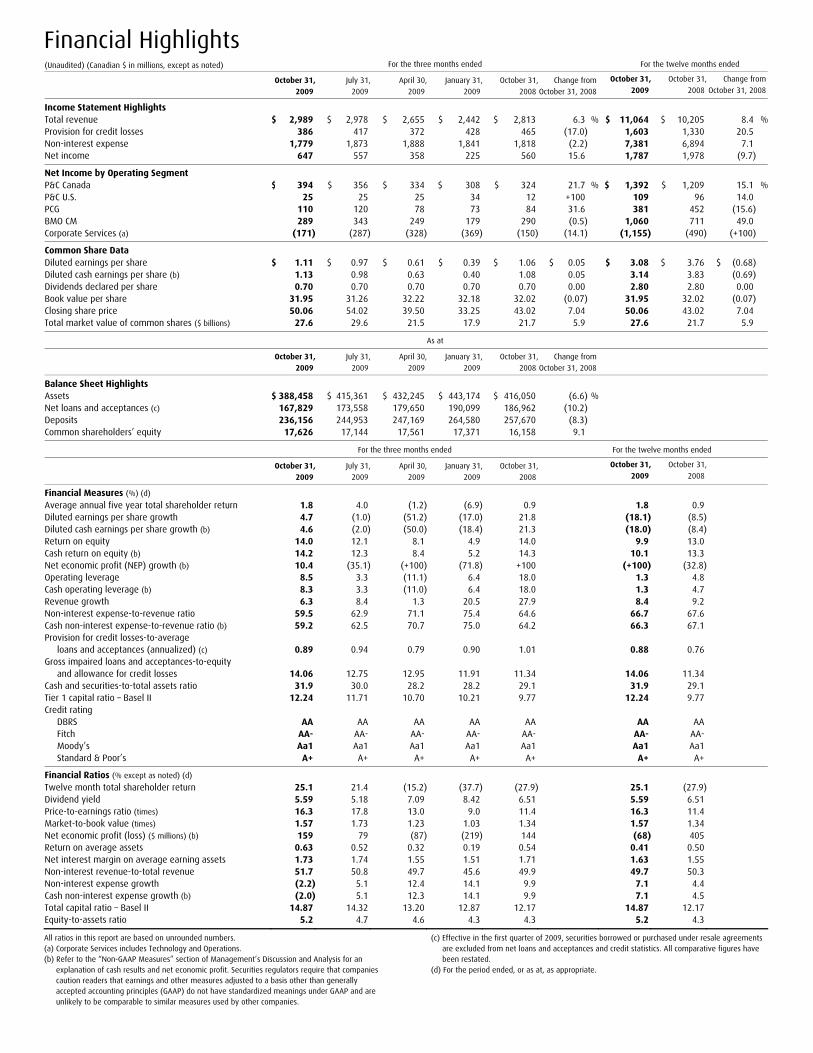
Financial Highlights (Unaudited) (Canadian $ in millions, except as noted) For the three months ended For the twelve months ended
October 31, 2009
July 31,
2009
April 30,
2009
January 31,
2009
October 31,
2008
Change from
October 31, 2008
October 31,
2009
October 31,
2008
Change from
October 31, 2008
Income Statement Highlights Total revenue $ 2,989 $ 2,978 $ 2,655 $ 2,442 $ 2,813 6.3 % $ 11,064 $ 10,205 8.4 %Provision for credit losses 386 417 372 428 465 (17.0) 1,603 1,330 20.5 Non-interest expense 1,779 1,873 1,888 1,841 1,818 (2.2) 7,381 6,894 7.1 Net income 647 557 358 225 560 15.6 1,787 1,978 (9.7)
Net Income by Operating Segment
P&C Canada $ 394 $ 356 $ 334 $ 308 $ 324 21.7 % $ 1,392 $ 1,209 15.1 %P&C U.S. 25 25 25 34 12 +100 109 96 14.0 PCG 110 120 78 73 84 31.6 381 452 (15.6)BMO CM 289 343 249 179 290 (0.5) 1,060 711 49.0 Corporate Services (a) (171) (287) (328) (369) (150) (14.1) (1,155) (490) (+100)
Common Share Data Diluted earnings per share $ 1.11 $ 0.97 $ 0.61 $ 0.39 $ 1.06 $ 0.05 $ 3.08 $ 3.76 $ (0.68) Diluted cash earnings per share (b) 1.13 0.98 0.63 0.40 1.08 0.05 3.14 3.83 (0.69) Dividends declared per share 0.70 0.70 0.70 0.70 0.70 0.00 2.80 2.80 0.00 Book value per share 31.95 31.26 32.22 32.18 32.02 (0.07) 31.95 32.02 (0.07) Closing share price 50.06 54.02 39.50 33.25 43.02 7.04 50.06 43.02 7.04 Total market value of common shares ($ billions) 27.6 29.6 21.5 17.9 21.7 5.9 27.6 21.7 5.9
As at October 31,
2009 July 31,
2009
April 30,
2009
January 31,
2009
October 31,
2008
Change from
October 31, 2008
Balance Sheet Highlights Assets $ 388,458 $ 415,361 $ 432,245 $ 443,174 $ 416,050 (6.6) % Net loans and acceptances (c) 167,829 173,558 179,650 190,099 186,962 (10.2) Deposits 236,156 244,953 247,169 264,580 257,670 (8.3) Common shareholders’ equity 17,626 17,144 17,561 17,371 16,158 9.1
For the three months ended For the twelve months ended
October 31,
2009 July 31,
2009
April 30,
2009
January 31,
2009
October 31,
2008
October 31,
2009
October 31,
2008
Financial Measures (%) (d) Average annual five year total shareholder return 1.8 4.0 (1.2) (6.9) 0.9 1.8 0.9 Diluted earnings per share growth 4.7 (1.0) (51.2) (17.0) 21.8 (18.1) (8.5) Diluted cash earnings per share growth (b) 4.6 (2.0) (50.0) (18.4) 21.3 (18.0) (8.4) Return on equity 14.0 12.1 8.1 4.9 14.0 9.9 13.0 Cash return on equity (b) 14.2 12.3 8.4 5.2 14.3 10.1 13.3 Net economic profit (NEP) growth (b) 10.4 (35.1) (+100) (71.8) +100 (+100) (32.8) Operating leverage 8.5 3.3 (11.1) 6.4 18.0 1.3 4.8 Cash operating leverage (b) 8.3 3.3 (11.0) 6.4 18.0 1.3 4.7 Revenue growth 6.3 8.4 1.3 20.5 27.9 8.4 9.2 Non-interest expense-to-revenue ratio 59.5 62.9 71.1 75.4 64.6 66.7 67.6 Cash non-interest expense-to-revenue ratio (b) 59.2 62.5 70.7 75.0 64.2 66.3 67.1 Provision for credit losses-to-average loans and acceptances (annualized) (c) 0.89 0.94 0.79 0.90 1.01 0.88 0.76 Gross impaired loans and acceptances-to-equity and allowance for credit losses 14.06 12.75 12.95 11.91 11.34 14.06 11.34 Cash and securities-to-total assets ratio 31.9 30.0 28.2 28.2 29.1 31.9 29.1 Tier 1 capital ratio – Basel II 12.24 11.71 10.70 10.21 9.77 12.24 9.77 Credit rating DBRS AA AA AA AA AA AA AA Fitch AA- AA- AA- AA- AA- AA- AA- Moody’s Aa1 Aa1 Aa1 Aa1 Aa1 Aa1 Aa1 Standard & Poor’s A+ A+ A+ A+ A+ A+ A+ Financial Ratios (% except as noted) (d) Twelve month total shareholder return 25.1 21.4 (15.2) (37.7) (27.9) 25.1 (27.9) Dividend yield 5.59 5.18 7.09 8.42 6.51 5.59 6.51 Price-to-earnings ratio (times) 16.3 17.8 13.0 9.0 11.4 16.3 11.4 Market-to-book value (times) 1.57 1.73 1.23 1.03 1.34 1.57 1.34 Net economic profit (loss) ($ millions) (b) 159 79 (87) (219) 144 (68) 405 Return on average assets 0.63 0.52 0.32 0.19 0.54 0.41 0.50 Net interest margin on average earning assets 1.73 1.74 1.55 1.51 1.71 1.63 1.55 Non-interest revenue-to-total revenue 51.7 50.8 49.7 45.6 49.9 49.7 50.3 Non-interest expense growth (2.2) 5.1 12.4 14.1 9.9 7.1 4.4 Cash non-interest expense growth (b) (2.0) 5.1 12.3 14.1 9.9 7.1 4.5 Total capital ratio – Basel II 14.87 14.32 13.20 12.87 12.17 14.87 12.17 Equity-to-assets ratio 5.2 4.7 4.6 4.3 4.3 5.2 4.3
All ratios in this report are based on unrounded numbers. (a) Corporate Services includes Technology and Operations. (b) Refer to the “Non-GAAP Measures” section of Management’s Discussion and Analysis for an
explanation of cash results and net economic profit. Securities regulators require that companies caution readers that earnings and other measures adjusted to a basis other than generally accepted accounting principles (GAAP) do not have standardized meanings under GAAP and are unlikely to be comparable to similar measures used by other companies.
(c) Effective in the first quarter of 2009, securities borrowed or purchased under resale agreements are excluded from net loans and acceptances and credit statistics. All comparative figures have been restated.
(d) For the period ended, or as at, as appropriate.
4 • BMO Financial Group Fourth Quarter Report 2009
Management’s Discussion and Analysis MD&A commentary is as of November 24, 2009. Unless otherwise indicated, all amounts are in Canadian dollars and have been derived from financial
statements prepared in accordance with Canadian generally accepted accounting principles (GAAP). The MD&A should be read in conjunction with the unaudited
consolidated financial statements for the period ended October 31, 2009, included in this document, and the annual MD&A for the year ended October 31, 2008,
included in BMO’s 2008 Annual Report. The material that precedes this section comprises part of this MD&A.
Bank of Montreal uses a unified branding approach that links all of the organization’s member companies. Bank of Montreal, together with its subsidiaries, is known as BMO Financial Group. As such, in this document, the names BMO and BMO Financial Group mean Bank of Montreal, together with its subsidiaries.
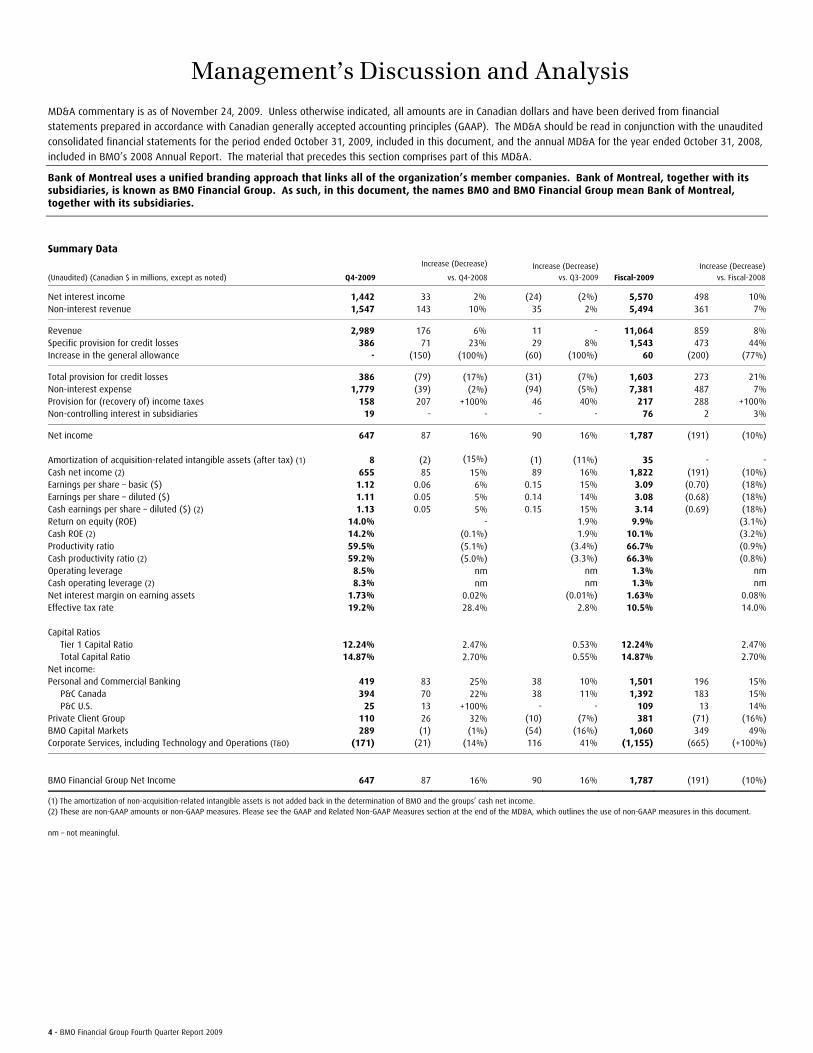
Summary Data
(Unaudited) (Canadian $ in millions, except as noted) Q4-2009
Increase (Decrease)
vs. Q4-2008
Increase (Decrease)
vs. Q3-2009 Fiscal-2009
Increase (Decrease)
vs. Fiscal-2008
Net interest income 1,442 33 2% (24) (2%) 5,570 498 10%Non-interest revenue 1,547 143 10% 35 2% 5,494 361 7%
Revenue 2,989 176 6% 11 - 11,064 859 8%Specific provision for credit losses 386 71 23% 29 8% 1,543 473 44%Increase in the general allowance - (150) (100%) (60) (100%) 60 (200) (77%)
Total provision for credit losses 386 (79) (17%) (31) (7%) 1,603 273 21%Non-interest expense 1,779 (39) (2%) (94) (5%) 7,381 487 7%Provision for (recovery of) income taxes 158 207 +100% 46 40% 217 288 +100%Non-controlling interest in subsidiaries 19 - - - - 76 2 3%
Net income 647 87 16% 90 16% 1,787 (191) (10%) Amortization of acquisition-related intangible assets (after tax) (1) 8 (2) (15%) (1) (11%) 35 - -Cash net income (2) 655 85 15% 89 16% 1,822 (191) (10%)Earnings per share – basic ($) 1.12 0.06 6% 0.15 15% 3.09 (0.70) (18%)Earnings per share – diluted ($) 1.11 0.05 5% 0.14 14% 3.08 (0.68) (18%)Cash earnings per share – diluted ($) (2) 1.13 0.05 5% 0.15 15% 3.14 (0.69) (18%)Return on equity (ROE) 14.0% - 1.9% 9.9% (3.1%)Cash ROE (2) 14.2% (0.1%) 1.9% 10.1% (3.2%)Productivity ratio 59.5% (5.1%) (3.4%) 66.7% (0.9%)Cash productivity ratio (2) 59.2% (5.0%) (3.3%) 66.3% (0.8%)Operating leverage 8.5% nm nm 1.3% nmCash operating leverage (2) 8.3% nm nm 1.3% nmNet interest margin on earning assets 1.73% 0.02% (0.01%) 1.63% 0.08%Effective tax rate 19.2% 28.4% 2.8% 10.5% 14.0% Capital Ratios Tier 1 Capital Ratio 12.24% 2.47% 0.53% 12.24% 2.47% Total Capital Ratio 14.87% 2.70% 0.55% 14.87% 2.70%Net income: Personal and Commercial Banking 419 83 25% 38 10% 1,501 196 15% P&C Canada 394 70 22% 38 11% 1,392 183 15% P&C U.S. 25 13 +100% - - 109 13 14%Private Client Group 110 26 32% (10) (7%) 381 (71) (16%)BMO Capital Markets 289 (1) (1%) (54) (16%) 1,060 349 49%Corporate Services, including Technology and Operations (T&O) (171) (21) (14%) 116 41% (1,155) (665) (+100%)
BMO Financial Group Net Income 647 87 16% 90 16% 1,787 (191) (10%)
(1) The amortization of non-acquisition-related intangible assets is not added back in the determination of BMO and the groups’ cash net income. (2) These are non-GAAP amounts or non-GAAP measures. Please see the GAAP and Related Non-GAAP Measures section at the end of the MD&A, which outlines the use of non-GAAP measures in this document. nm – not meaningful.
BMO Financial Group Fourth Quarter Report 2009 • 5
Management’s Responsibility for Financial Information BMO’s 2009 Annual Report will contain a statement signed by the President & Chief Executive Officer (CEO) and the Chief Financial Officer (CFO) outlining management’s responsibility for financial information contained in the report. In addition, BMO’s CEO and CFO are expecting to sign certifications relating to the appropriateness of the financial disclosures in our annual filings and the design and effectiveness of our disclosure controls and procedures and internal control over financial reporting. BMO’s internal control over financial reporting includes policies and procedures that: pertain to the maintenance of records that in reasonable detail accurately and fairly reflect the transactions and dispositions of the assets of BMO; provide reasonable assurance that transactions are recorded as necessary to permit preparation of the financial statements in accordance with Canadian generally accepted accounting principles and the requirements of the Securities and Exchange Commission in the United States, as applicable; ensure receipts and expenditures of BMO are being made only in accordance with authorizations of management and directors of BMO; and provide reasonable assurance regarding prevention or timely detection of unauthorized acquisition, use or disposition of BMO’s assets that could have a material effect on the financial statements. Because of its inherent limitations, internal control over financial reporting can provide only reasonable assurance and may not prevent or detect misstatements. Further, projections of any evaluation of effectiveness to future periods are subject to the risk that controls may become inadequate because of changes in conditions, or that the degree of compliance with the policies or procedures may deteriorate. There were no changes in our internal control over financial reporting in fiscal 2009 that materially affected, or are reasonably likely to materially affect, our internal control over financial reporting. BMO Financial Group’s management, under the supervision of the CEO and CFO, has evaluated the effectiveness of our internal control over financial reporting using the framework and criteria established in Internal Control – Integrated Framework, issued by the Committee of Sponsoring Organizations of the Treadway Commission. Based on this evaluation, management is expecting to conclude that internal control over financial reporting was effective as of October 31, 2009. BMO will file the applicable CEO and CFO certifications with the Canadian Securities Administrators and the SEC in the United States in December 2009 when we file our Annual Report and other annual disclosure documents. As in prior quarters, BMO’s audit committee reviewed this document, including the unaudited interim consolidated financial statements, and BMO’s Board of Directors approved the document prior to its release. A comprehensive discussion of our businesses, strategies and objectives can be found in Management’s Discussion and Analysis in BMO’s 2008 Annual Report, which can be accessed on our website at www.bmo.com/investorrelations. Readers are also encouraged to visit the site to view other quarterly financial information.
Caution Regarding Forward-Looking Statements Bank of Montreal’s public communications often include written or oral forward-looking statements. Statements of this type are included in this document, and may be included in other filings with Canadian securities regulators or the U.S. Securities and Exchange Commission, or in other communications. All such statements are made pursuant to the safe harbour provisions of, and are intended to be forward-looking statements under, the United States Private Securities Litigation Reform Act of 1995 and any applicable Canadian securities legislation. Forward-looking statements may involve, but are not limited to, comments with respect to our objectives and priorities for 2009 and beyond, our strategies or future actions, our targets, expectations for our financial condition or share price, and the results of or outlook for our operations or for the Canadian and U.S. economies. By their nature, forward-looking statements require us to make assumptions and are subject to inherent risks and uncertainties. There is significant risk that predictions, forecasts, conclusions or projections will not prove to be accurate, that our assumptions may not be correct and that actual results may differ materially from such predictions, forecasts, conclusions or projections. We caution readers of this document not to place undue reliance on our forward-looking statements as a number of factors could cause actual future results, conditions, actions or events to differ materially from the targets, expectations, estimates or intentions expressed in the forward-looking statements. The future outcomes that relate to forward-looking statements may be influenced by many factors, including but not limited to: general economic and market conditions in the countries in which we operate; interest rate and currency value fluctuations; changes in monetary policy; the degree of competition in the geographic and business areas in which we operate; changes in laws; judicial or regulatory proceedings; the accuracy and completeness of the information we obtain with respect to our customers and counterparties; our ability to execute our strategic plans and to complete and integrate acquisitions; critical accounting estimates; operational and infrastructure risks; general political conditions; global capital market activities; the possible effects on our business of war or terrorist activities; disease or illness that impacts on local, national or international economies; disruptions to public infrastructure, such as transportation, communications, power or water supply; and technological changes. We caution that the foregoing list is not exhaustive of all possible factors. Other factors could adversely affect our results. For more information, please see the discussion on pages 30 and 31 of the BMO 2008 Annual Report, which outlines in detail certain key factors that may affect our future results. When relying on forward-looking statements to make decisions with respect to Bank of Montreal, investors and others should carefully consider these factors, as well as other uncertainties and potential events, and the inherent uncertainty of forward-looking statements. Bank of Montreal does not undertake to update any forward-looking statement, whether written or oral, that may be made, from time to time, by the organization or on its behalf, except as required by law. The forward-looking information contained in this document is presented for the purpose of assisting our shareholders in understanding our financial position as at and for the periods ended on the dates presented and our strategic priorities and objectives, and may not be appropriate for other purposes. Assumptions about the level of asset sales, expected asset sale prices, net funding cost, credit quality and risk of default and losses on default of the underlying assets of the structured investment vehicles were material factors we considered when establishing our expectations regarding the structured investment vehicles discussed in this document, including the amount to be drawn under the BMO liquidity facilities and the expectation that the first-loss protection provided by the subordinate capital notes will exceed future losses. Key assumptions included that assets would continue to be sold with a view to reducing the size of the structured investment vehicles, under various asset price scenarios, and that the level of defaults and losses will be consistent with the credit quality of the underlying assets and our current expectations regarding challenging market conditions continuing. Assumptions about the level of defaults and losses on defaults were material factors we considered when establishing our expectation of the future performance of the transactions that Apex Trust has entered into. Key assumptions included that the level of defaults and losses on defaults would be consistent with historical experience. Material factors that were taken into account when establishing our expectations of the future risk of credit losses in Apex Trust and risk of loss to BMO included industry diversification in the portfolio, initial credit quality by portfolio, the first-loss protection incorporated into the structure and the hedges that BMO has entered into. Assumptions about the performance of the Canadian and U.S. economies as well as overall market conditions and their combined effect on the bank’s business, including those described under the heading Economic Outlook, are material factors we consider when determining our strategic priorities, objectives and expectations for our business. In determining our expectations for economic growth, both broadly and in the financial services sector, we primarily consider historical economic data provided by the Canadian and U.S. governments and their agencies.
Regulatory Filings Our continuous disclosure materials, including our interim filings, annual MD&A and audited consolidated financial statements, our Annual Information Form and the Notice of Annual Meeting of Shareholders and Proxy Circular are available on our website at www.bmo.com/investorrelations, on the Canadian Securities Administrators’ website at www.sedar.com and on the EDGAR section of the SEC’s website at www.sec.gov. We expect to file our fiscal 2009 year end continuous disclosure materials on or about December 14, 2009.

6 • BMO Financial Group Fourth Quarter Report 2009
Economic Outlook The Canadian economy has likely emerged from recession, with domestic-led growth more than offsetting weakness in exports. Consumer spending has trended moderately higher since the spring in response to record-low interest rates, with auto sales almost returning to pre-recession levels. Housing markets have fully recovered from last year’s slump in sales and prices amid improved affordability. Supported by continued low interest rates, domestic demand should continue to expand in 2010, sustaining growth in personal credit and residential mortgages. However, business investment and loan growth will likely lag the recovery given low rates of capacity utilization and continued weakness in exports in the face of a strong Canadian dollar and soft U.S. demand. The unemployment rate is expected to decline next year as the recovery gains strength. However, the excess capacity in the economy should keep inflation low and, together with a strong currency, encourage the Bank of Canada to hold overnight interest rates steady until next summer. Firmer commodity prices should strengthen the Canadian dollar, lifting it above parity with the U.S. dollar in 2010. The U.S. economy is recovering from its worst downturn in seven decades, with growth resuming as a result of expansive monetary and fiscal policies. Housing markets have stabilized in response to record affordability and tax incentives for first-time home buyers. Consumer spending has turned up modestly, but will likely remain soft in the face of high rates of joblessness and elevated debt levels, restraining personal loan demand. Business investment has started to improve, though it will likely remain constrained by excess capacity, restricting loan growth. The unemployment rate is projected to hover near a quarter-century high of 10% in 2010. To promote a durable recovery, the Federal Reserve is expected to hold overnight rates near zero until next September. Certain capital markets activities should continue to strengthen as credit markets and the economy improve. This Economic Outlook section contains forward-looking statements. Please see the Caution Regarding Forward-Looking Statements. Effects of the Capital Markets Environment on Fourth Quarter Results
No charges in respect of the capital markets environment have been designated as notable items this quarter in light of the relative insignificance of the amounts. Further details are provided in the Financial Instruments in the Difficult Credit Environment section and in the BMO Capital Markets section.
Foreign Exchange
The Canadian dollar equivalents of BMO’s U.S. dollar-denominated net income, revenues, expenses, provisions for credit losses and income taxes were decreased relative to the fourth quarter of 2008 and third quarter of 2009 by the weakening of the U.S. dollar. The average Canadian/U.S. dollar exchange rate in the fourth quarter, expressed in terms of the Canadian dollar cost of a U.S. dollar, fell by 3% from a year ago and by 2% from the average of the third quarter. Over the course of fiscal 2009, the U.S. dollar strengthened relative to the Canadian dollar, raising the Canadian dollar equivalents of BMO’s U.S. dollar-denominated net income, revenues, expenses, provisions for credit losses and income taxes relative to fiscal 2008. The following table indicates the relevant average Canadian/U.S. dollar exchange rates and the impact of changes in the rates. Effects of U.S. Dollar Exchange Rate Fluctuations on BMO’s Results Q4-2009
(Canadian $ in millions, except as noted) vs. Q4-2008 vs. Q3-2009
Fiscal-2009 vs
Fiscal-2008
Canadian/U.S. dollar exchange rate (average)
Current period 1.0827 1.0827 1.1648 Prior period 1.1107 1.1102 1.0321Increased (decreased) revenue (20) (20) 363Decreased (increased) expense 12 12 (216)Decreased (increased) provision for credit losses 6 6 (125)Decreased (increased) income taxes (1) (1) 24
Increased (decreased) net income (3) (3) 46
At the start of each quarter, BMO assesses whether to enter into hedging transactions that are expected to partially offset the pre-tax effects of exchange rate fluctuations in the quarter on our expected U.S. dollar-denominated net income for that quarter. As such, the hedging activities partially mitigate the impact of exchange rate fluctuations within a single quarter; however, the hedging transactions are not designed to offset the impact of year-over-year or quarter-over-quarter fluctuations in exchange rates. The U.S. dollar strengthened in the first and second quarters, and weakened quite markedly over the course of the third quarter. The U.S. dollar strengthened modestly in the fourth quarter, as the exchange rate increased from Cdn$1.0775 per U.S. dollar at July 31, 2009 to an average of Cdn$1.0827 in the fourth quarter. Hedging transactions lowered pre-tax net income by $1 million for the quarter and $2 million for the year. The gain or loss from hedging transactions in future periods will be determined by both future currency fluctuations and the amount of underlying future hedging transactions, since the transactions are entered into each quarter in relation to expected U.S. dollar-denominated net income for the next three months. The effect of currency fluctuations on our investments in foreign operations is discussed in the Income Taxes section. Other Value Measures
Net economic profit was $159 million in the current quarter (see the Non-GAAP Measures section), compared with $144 million in the fourth quarter of 2008 and $79 million in the third quarter. The total shareholder return (TSR) on an investment in BMO common shares was 25.1% for the twelve months ended October 31, 2009. BMO’s average annual TSR for the five-year period ended October 31, 2009 was 1.8%.

BMO Financial Group Fourth Quarter Report 2009 • 7
Net Income Q4 2009 vs Q4 2008
Net income was $647 million for the fourth quarter of 2009, up $87 million or 16% from a year ago. Earnings per share were $1.11, compared with $1.06. No charges in respect of the capital markets environment have been designated as notable items this quarter in light of the relative insignificance of the amounts. Results a year ago included notable items totalling $195 million ($125 million after tax) and were comprised of capital markets environment charges of $45 million ($27 million after tax) recorded in BMO Capital Markets and Private Client Group and a $150 million ($98 million after tax) increase in the general allowance for credit losses. The impact of those notable items was mitigated by a $73 million recovery of prior periods’ income taxes. Notable items are summarized at the end of the MD&A. Specific provisions for credit losses were $386 million, up $71 million from a year ago due to higher levels of impaired loans. P&C Canada net income was a strong $394 million, up $70 million or 22%. There was volume growth across most products and improved net interest margin. P&C U.S. net income increased by Cdn$13 million (by US$12 million) to Cdn$25 million. Results benefited from reductions in integration costs and changes in the Visa litigation accrual. Higher levels of impaired loans and the costs of managing this portfolio have reduced net income in the quarter by US$12 million (US$9 million a year ago). Cash net income was US$39 million, including a severance charge of US$2.4 million after tax, on a basis that adjusts for the impact of impaired loans, integration costs and the Visa litigation accrual. This was in line with the last five quarters where cash net income on this basis had exceeded US$40 million. Private Client Group net income increased $26 million or 32%. Results a year ago included a charge of $31 million ($19 million after tax) associated with the decision to purchase certain holdings from our U.S. clients. The BMO Life Assurance acquisition increased net income in the current quarter by $9 million while there were lower revenues in our brokerage businesses as well as lower expenses, due to active expense management. BMO Capital Markets net income was in line with the prior year. Results a year ago benefited from a $52 million recovery of prior periods’ income taxes. They also reflected a net $14 million ($8 million after tax) of charges in respect of the capital markets environment. The prior year’s tax rate was also lowered by a higher proportion of tax-exempt income. Revenues rose $172 million or 24% due to higher corporate banking revenue and underwriting fees. Corporate Services net loss increased $21 million or 14% from a year ago due to reduced revenues, offset in part by lower provisions for credit losses mainly as a result of a $150 million increase in the general allowance a year ago. The decline in revenues primarily related to lower mark-to-market gains on hedging activities than in the prior year, the impact of credit card securitizations completed in the latter part of 2008 and lower one-time securitization gains than in 2008.
Q4 2009 vs Q3 2009
Net income increased $90 million or 16%. Results in the third quarter were reduced by a $60 million ($39 million after tax) increase in the general allowance for credit losses, as summarized in the Notable Items section. In P&C Canada, net income increased $38 million or 11%. Revenue rose $32 million or 2.3%, driven by volume growth and an improved net interest margin. Expenses fell $28 million or 3.7% due to lower capital taxes and lower severance costs. P&C U.S. net income of US$23 million was consistent with last quarter. Revenue was up primarily due to improved loan spreads and the impact of more days in the current quarter. Expenses increased largely due to higher marketing and severance costs. Cash net income was US$39 million, including a severance charge of US$2.4 million after tax, on a basis that adjusts for the impact of impaired loans, integration costs and the Visa litigation accrual. On a comparably-adjusted basis, cash net income was in line with last quarter. Private Client Group net income decreased $10 million or 7.4% as the third quarter benefited from a $23 million recovery of prior periods’ income taxes. Revenue increased $24 million or 4.7% due primarily to higher fee-based and commission revenue in Full-Service Investing and higher fee-based revenue in mutual funds on increased client assets. Non-interest expense increased $4 million or 0.9% primarily due to higher revenue-based costs. BMO Capital Markets net income decreased $54 million or 16% from the third quarter, which was an exceptionally strong quarter. The quarter benefited from increased fees from mergers and acquisitions and equity underwriting, although they were offset by lower trading revenues and debt underwriting fees. Lower net interest income was due to reduced corporate banking and trading net interest income and lower revenues from our interest-rate-sensitive businesses. Corporate Services net loss improved by $116 million from the third quarter. There were higher revenues due to mark-to-market gains on hedging activities compared to losses in the prior quarter and, as a result of management actions and a more stable market environment, a lower negative carry on certain asset-liability interest rate positions and a reduced cost of carry on previous quarters funding activities that were undertaken to enhance our strong liquidity position. There were lower provisions for credit losses, mainly due to a $60 million increase in the general allowance in the third quarter. Fiscal 2009 vs Fiscal 2008
Net income decreased $191 million or 9.7% to $1,787 million. Net income for fiscal 2009 was lowered by a net $474 million after tax of notable items, comprised of $521 million ($355 million after tax) of certain charges related to the capital markets environment, $118 million ($80 million after tax) of severance costs and a $60 million ($39 million after tax) increase in the general allowance for credit losses. Net income in fiscal 2008 was lowered by notable items totalling $426 million after tax, comprised of $388 million ($260 million after tax) of certain capital markets environment charges and a $260 million ($166 million after tax) increase in the general allowance for credit losses. Fiscal 2009 had good revenue growth and effective expense control, but these increases were more than offset by increased provisions for credit losses and higher income taxes.
8 • BMO Financial Group Fourth Quarter Report 2009
In P&C Canada, net income increased $183 million or 15%. Revenue increased $385 million or 7.9% driven by volume growth across most products, an improved net interest margin, higher cards and payment service revenue and higher activity fees, partially offset by lower revenue from securitizations and mutual fund products. Expenses increased $107 million or 3.9% primarily due to increases in employee benefit costs, performance-based compensation, occupancy costs and payment services costs, partially offset by lower initiatives spending and savings from lower staff levels. P&C U.S. net income decreased US$1 million or 0.6%. The impact of impaired loans reduced net income by US$46 million in 2009 compared to US$22 million in 2008. Revenue increased US$14 million or 1.5% and non-interest expense decreased US$4 million or 0.6%. On a basis that adjusts for the impact of impaired loans, integration costs, the Visa litigation accrual and last year’s gain on the sale of a portion of our investment in Visa, cash net income was US$162 million and increased US$13 million or 8.7% versus last year. On a similarly-adjusted basis, revenue increased US$81 million or 8.7% reflecting strong deposit generation, a full year of our Wisconsin acquisitions (US$33 million) and increased gains on the sale of mortgages. Expenses increased US$38 million or 5.3% largely reflecting a full year of our Wisconsin acquisitions (US$26 million). Private Client Group net income decreased $71 million or 16% from fiscal 2008, reflective of challenging equity markets and a low interest rate environment. Charges associated with the decision to purchase certain holdings from our U.S. clients in the difficult environment were lower by $8 million after tax in 2009. Results in 2009 also benefited from the $23 million recovery of prior periods’ income taxes and the BMO Life Assurance acquisition. BMO Capital Markets net income increased $349 million or 49% to $1,060 million. Results for 2009 were affected by charges of $355 million after tax related to the capital markets environment. Results in 2008 were affected by charges of $260 million after tax. Improved performance was attributable to significantly increased trading revenues and corporate banking revenues. Revenues from our interest-rate-sensitive businesses also performed very well in the first half of the year, as we took advantage of market opportunities. Corporate Services net loss rose $665 million from a year ago to $1,155 million, driven in large part by lower revenues, higher provisions for credit losses due to our expected loss provisioning methodology, net of a lower general allowance recorded in 2009, and higher severance costs. The lower revenues primarily relate to a negative carry on certain asset-liability interest rate positions as a result of changes in market interest rates, the impact of funding activities that were undertaken to enhance our strong liquidity position, mark-to-market losses on hedging activities compared to gains in the prior year and the impact of credit card securitizations completed in 2008.
Revenue BMO analyzes consolidated revenues on a GAAP basis. However, like many banks, BMO analyzes revenue of its operating groups and associated ratios computed using revenue on a taxable equivalent basis (teb). This basis includes an adjustment that increases GAAP revenues and the GAAP provision for income taxes by an amount that would raise revenues on certain tax-exempt securities to a level equivalent to amounts that would incur tax at the statutory rate. The offset to the group teb adjustments is reflected in Corporate Services revenues and income tax provisions. Total revenue in the current quarter increased $176 million or 6.3% from a year ago to $2.99 billion. There was good growth in all of the operating groups and a reduction in Corporate Services. Revenue increased $11 million or 0.4% from the third quarter. Revenue for fiscal 2009 increased $859 million or 8.4% to $11.1 billion. The weaker U.S. dollar in the current quarter decreased revenue growth by $20 million or 0.6% from the third quarter and by $20 million or 0.7% from a year ago. The U.S. dollar was stronger, on average, over the course of fiscal 2009 and increased revenue growth by $363 million or 3.5% year over year. Changes in net interest income and non-interest revenue are reviewed in the sections that follow. Net Interest Income
Net interest income in the current quarter increased $33 million or 2.4% from a year ago. BMO’s overall net interest margin improved 2 basis points, driven by P&C Canada due mainly to favourable prime rates relative to BA rates and actions to mitigate the impact of rising long-term funding costs. Average earning assets increased $3 billion or 1%, driven by Private Client Group as a result of the inclusion of BMO Life Assurance in 2009 and loan growth in Private Banking. Relative to the third quarter, net interest income decreased $24 million or 1.6%. This was mostly driven by a reduction in average earning assets of $3 billion due to the weaker U.S. dollar. There were declines in BMO Capital Markets and P&C U.S., partially offset by growth in P&C Canada and Private Client Group. In fiscal 2009, net interest income increased $498 million or 9.8%, driven by the growth in average earning assets of $15 billion with increases in all groups except P&C Canada which was affected by the securitization of low-margin mortgages and the planned runoff of the mortgage broker portfolio. BMO’s overall net interest margin on earning assets for the fourth quarter of 2009 was 1.73%, or 2 basis points higher than in the fourth quarter of the prior year and 1 basis point lower than in the third quarter. The main drivers of the change in total bank margin are the individual group margins, the change in the magnitude of each operating group’s assets and the level of net interest income recorded in Corporate Services. The year-over-year increase of 2 basis points was mainly due to higher net interest margin in P&C Canada, partially offset by reduced net interest income in Corporate Services and the inclusion of BMO Life Assurance in Private Client Group in 2009. Relative to a year ago, net interest margin was higher by 34 basis points in P&C Canada. The increase was driven by favourable prime rates relative to BA rates and actions to mitigate the impact of rising long-term funding costs, along with the impact of deposit growth outpacing loan growth and the
BMO Financial Group Fourth Quarter Report 2009 • 9
securitization of low-margin mortgages. Those increases were partially offset by lower mortgage refinancing fees and interest received on tax refunds in the prior year. In P&C U.S., net interest margin improved by 26 basis points year over year due to strong deposit generation. Private Client Group net interest margin decreased by 188 basis points with approximately two-thirds due to BMO Life Assurance, which increased assets with no change to net interest income. The remaining decrease was due mainly to lower deposit income in the brokerage businesses as a result of lower spreads. BMO Capital Markets net interest margin fell 2 basis points from a year ago, with reductions in interest–rate-sensitive businesses partly offset by higher spreads in trading and corporate lending business. P&C Canada net interest margin improved 5 basis points relative to the third quarter, mainly due to actions to mitigate the impact of rising long-term funding costs and higher volumes in more profitable products, partially offset by lower mortgage
refinancing fees. Corporate Services net interest income improved relative to the third quarter, due in part to management actions and a more stable market environment, resulting in a lower negative carry on certain asset-liability interest rate positions and a reduced cost of carry on previous quarters funding activities that were undertaken to enhance our strong liquidity position. Relative to a year ago, Corporate Services net interest income declined slightly primarily due to the impact of credit card securitizations completed in the latter part of 2008. In fiscal 2009, BMO’s overall net interest margin rose 8 basis points. The increase was in part due to the impact of securitizing low-spread mortgages and deposit growth outpacing loan growth in P&C Canada. There were also higher spreads in corporate lending and interest-rate-sensitive businesses as well as increased trading net interest income in BMO Capital Markets. These increases were offset in large part by reduced net interest income in Corporate Services.
Net Interest Margin (teb)*
(In basis points) Q4-2009
Increase (Decrease) vs.
Q4-2008
Increase(Decrease) vs.
Q3-2009 Fiscal-2009
Increase (Decrease) vs.
Fiscal-2008
P&C Canada 322 34 5 313 29P&C U.S. 326 26 13 312 12
Personal and Commercial Client Group 323 33 7 313 26Private Client Group 291 (188) (2) 334 (144)BMO Capital Markets 81 (2) (21) 100 31Corporate Services, including Technology and Operations (T&O) ** nm nm nm nm nm
Total BMO 173 2 (1) 163 8
Total Canadian Retail*** 321 19 4 317 21
* Net interest margin is disclosed and computed with reference to average earning assets, rather than total assets. This basis provides a more relevant measure of margins and changes in margins. Operating group margins are stated on a teb basis while total BMO margin is stated on a GAAP basis.
** Corporate Services net interest income is negative and lowers BMO’s overall net interest margin to a greater degree in 2009 than in prior years. *** Total Canadian retail margin represents the net interest margin of the combined Canadian business of P&C Canada and Private Client Group. nm - not meaningful
Non-Interest Revenue
Non-interest revenue increased $143 million or 10% from a year ago. The improvement was in part attributable to the prior year’s $45 million of charges related to the capital markets environment as outlined in the Notable Items section. They comprised $228 million of charges in securities gains (losses) other than trading, a reduction of $30 million in other revenue and a $213 million increase in trading non-interest revenue. There was strong growth in BMO Capital Markets primarily due to reduced investment securities charges. The group also benefited from higher lending and underwriting fees, offset by reduced trading revenues as the prior year had particularly strong interest rate and foreign exchange trading revenues. Private Client Group non-interest revenue also grew strongly, due to reduced charges associated with the decision to purchase certain holdings from our U.S. clients in the difficult market environment and the contribution from the BMO Life Assurance acquisition. In addition, there were higher insurance revenues, partially offset by lower mutual fund revenues. Securitization revenues increased $34 million from the fourth quarter a year ago to $201 million, largely due to securitizing credit card loans. Revenues included gains of $21 million on the sale of loans for new securitizations, down $13 million from a year ago, and gains of $125 million on sales of loans to revolving securitization vehicles, up $27 million from a year ago. Securitizations have resulted in the recognition of less interest income ($173 million less)
in the quarter, as well as reduced credit card fees ($123 million less) and lower provisions for credit losses ($53 million less). The combined impact of securitizing assets in the current and prior periods decreased pre-tax income in the current quarter by $42 million. We securitize loans primarily to obtain alternate sources of cost-effective funding. In the quarter, we securitized $798 million of residential mortgage loans. Securitizations are detailed in Note 4 to the unaudited consolidated financial statements. Relative to the third quarter, non-interest revenue increased $35 million or 2.2%. There were increased non-interest revenues in all of the operating groups except BMO Capital Markets. Private Client Group non-interest revenue increased due to higher revenue in the brokerage businesses and higher fee-based revenue in mutual funds on increased client assets. Corporate Services non-interest revenues rose primarily due to mark-to-market gains on hedging activities compared to losses in the prior quarter. BMO Capital Markets non-interest revenue fell due to lower trading revenues, which decreased from the unusually high levels of the third quarter to more normal levels. This reduction was partially offset by lower investment securities losses and higher lending and mergers and acquisition fees. In fiscal 2009, non-interest revenue increased $361 million or 7.0%. There was growth in P&C Canada due to higher revenue from the cards and payment services businesses and strong growth in BMO Capital Markets due to higher trading revenues. Private Client Group non-interest revenue decreased as there were reductions in securities commissions and fees as well as mutual fund revenues in
10 • BMO Financial Group Fourth Quarter Report 2009
the weaker equity markets environment. Corporate Services revenue was also lower, primarily due to mark-to-market losses on hedging activities compared to gains in the prior year, largely offset by higher securitization revenues. Non-Interest Expense
Non-interest expense decreased $39 million or 2.2% from a year ago to $1,779 million. There were decreases in each of the groups except Private Client Group and Corporate Services, which both increased modestly. The weaker U.S. dollar reduced expense growth by $12 million or 0.7 percentage points, partially offset by higher expenses of $15 million from the impact of acquired businesses. Decreased expenses were reflected in lower salaries expense due to fewer staff, and reductions in computer costs, professional fees and capital taxes. Performance-based compensation was modestly higher and benefits costs increased. Cash operating leverage was 8.3% in the current quarter. Non-interest expense decreased $94 million or 5.0% from the third quarter. Performance-based compensation decreased $57 million. Computer costs were lower than in the third quarter. There were also lower capital taxes and deposit insurance costs as FDIC deposit insurance premiums were higher in the prior quarter primarily due to a special assessment. The weaker U.S. dollar reduced expense growth by $12 million or 0.6%. In fiscal 2009, non-interest expense increased $487 million or 7.1% to $7,381 million. Close to two-thirds of the increase was attributable to the $216 million impact of the stronger U.S. dollar and the $109 million impact of operating and integration costs of new acquisitions. Expense growth was reflected in higher employee costs, premises and equipment, and deposit insurance premiums that are included in other expenses. Cash operating leverage was 1.3% for fiscal 2009. Risk Management
Financial markets continued to stabilize as key economic data is showing a recovery is underway. However, the labour market remains weak and will continue to impact credit quality. Commercial and Corporate Portfolios that continue to show particular pressure, include U.S. commercial real estate, forest products and manufacturing. We anticipate that provisions will remain elevated going forward and if the economic recovery continues, could show some improvement in the latter part of 2010.
Specific provisions for credit losses for the quarter totalled $386 million and there was no increase in the general allowance. Specific provisions totalled $357 million in the third quarter of 2009 and $315 million in the fourth quarter of 2008. Provisions totalled $465 million a year ago and $417 million in the third quarter of 2009. There was a $60 million increase in the general allowance in the third quarter of 2009 and a $150 million increase in the comparable quarter a year ago.
BMO employs a methodology for segmented reporting purposes whereby expected credit losses are charged to the operating groups quarterly based on their share of expected credit losses. The difference between quarterly charges based on expected losses and required quarterly provisions based on actual losses, as well as changes in the general allowance, are charged (or credited) to Corporate Services. The following paragraph outlines provisions for credit losses by operating group based on actual
losses for the quarter, rather than as reported on an expected loss basis. Based on actual credit losses, in the fourth quarter of 2009, BMO recorded a $386 million specific provision for credit losses. It was comprised of $124 million in P&C Canada, $149 million in P&C U.S., $20 million in PCG and $93 million in BMO Capital Markets. In the third quarter of 2009, BMO’s $357 million specific provision for credit losses was comprised of $131 million in P&C Canada, $134 million in P&C U.S., $7 million in Private Client Group and $85 million in BMO Capital Markets. Based on actual credit losses, in the fourth quarter of 2008, BMO’s $315 million specific provision for credit losses was comprised of $99 million in P&C Canada, $100 million in P&C U.S., $(4) million recovery in Private Client Group and $120 million provision in BMO Capital Markets.
Specific provisions this quarter represented an annualized 89 basis points of average net loans and acceptances, compared with 81 basis points in the third quarter. For fiscal 2009, the full year ratio was 85 basis points, compared with 61 basis points a year ago and a 39 basis point average over the past five fiscal years. Effective in the first quarter of 2009, we began reporting credit statistics on a basis that excludes securities borrowed or purchased under resale agreements from loans. All comparative figures have been restated.
Provisions for credit losses for fiscal 2009 totalled $1,603 million. Specific provisions for credit losses totalled $1,543 million and there was a $60 million increase in the general allowance for credit losses. Provisions for credit losses in 2008 totalled $1,330 million, comprised of $1,070 million of specific provisions and a $260 million increase in the general allowance.
New impaired loan formations totalled $735 million in the quarter, up from $549 million in the preceding quarter but down from $806 million in the same quarter a year ago. U.S.-related formations continued to account for over half of BMO’s total new formations. There were $3 million of impaired loan sales in the current quarter, compared with $40 million of impaired loan sales in the third quarter of 2009 and no sales in the same quarter a year ago. Total gross impaired loans were $3,297 million at the end of the current reporting period, up from $2,913 million at the end of the third quarter and up from $2,387 million at the end of 2008.
The total allowance for credit losses was $1,902 million, compared with $1,798 million in the preceding quarter. Allowances were comprised of a specific allowance of $596 million and a general allowance of $1,306 million. The general allowance is maintained to cover impairment in the existing credit portfolio that cannot yet be associated with specific loans and is assessed on a quarterly basis. The general allowance increased $3 million from the end of the previous quarter due to the foreign exchange impact.
BMO’s loan book continues to be comprised largely of more stable consumer and commercial portfolios which represented 80.0% of the loan portfolio at the end of the quarter, up from 78.9% in the third quarter and 73.8% a year ago. The changes were mainly due to a decrease in corporate loans. In Canada approximately 88% of the consumer portfolio is comprised of secured loans, excluding credit card loans. In the United States, the consumer portfolio totals approximately US$15 billion and is primarily comprised of three main asset classes: residential first mortgages (37%), home equity products (34%) and indirect automobile loans (27%).

BMO Financial Group Fourth Quarter Report 2009 • 11
BMO’s market risk and liquidity and funding management practices and key measures are outlined on pages 77 to 82 of BMO’s 2008 Annual Report. As described at the end of fiscal 2008, certain positions were transferred from our trading portfolio to our available-for-sale portfolio in the fourth quarter of 2008. These positions, however, remained in our Comprehensive VaR and Issuer Risk measures throughout the fourth quarter of fiscal 2008. The removal of these positions from our Comprehensive VaR and Issuer Risk measures in the first quarter is the primary reason for the decrease in our Trading and Underwriting Market Value Exposure (MVE) and Earnings Volatility (EV). The interest rate risk associated with these positions is captured in our Interest Rate Risk (accrual) MVE measures. A lower credit spread environment throughout the year also contributed to the decrease in MVE and EV year over year. There were no significant changes to our trading and underwriting market risk management practices over the quarter. There was no significant change in our structural market risk management practices during the quarter. Structural earnings risk arising from interest rate and foreign exchange rate
movements has increased from the prior year end, as reflected in the 12-month earnings volatility measure in the attached table. The increase from 2008 is attributable to the lower interest rate environment, as further reductions in interest rates reduce yields on assets more than rates paid on deposits. Structural interest rate sensitivity to an immediate parallel increase or decrease of 100 and 200 basis points in the yield curve is disclosed in the attached table. This sensitivity analysis is performed and disclosed by many financial institutions and facilitates comparison with our peer group. The changes in sensitivities from 2008 reflect the low interest rate environment.
There have been no significant changes to the levels of liquidity and funding risk over the quarter. We remain satisfied that our liquidity and funding management framework provides us with a sound position, even in times of stress. This Risk Management section contains forward-looking statements. Please see the Caution Regarding Forward-Looking Statements.
12 • BMO Financial Group Fourth Quarter Report 2009
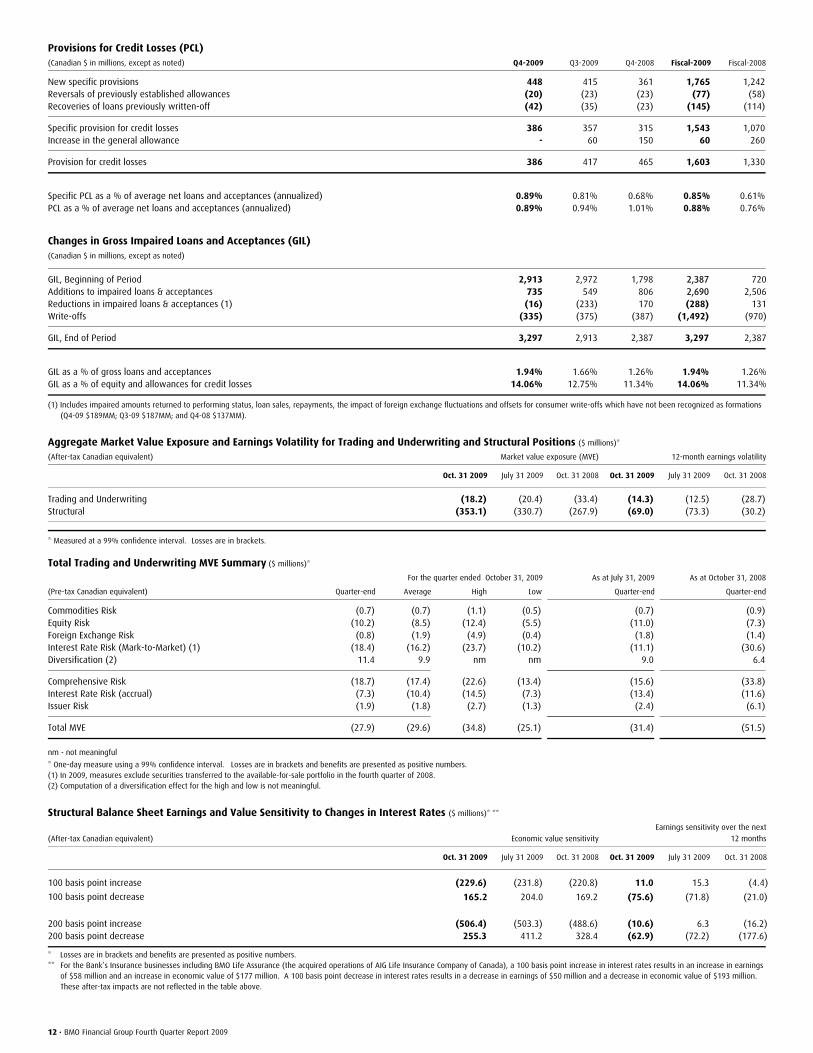
Provisions for Credit Losses (PCL) (Canadian $ in millions, except as noted) Q4-2009 Q3-2009 Q4-2008 Fiscal-2009 Fiscal-2008
New specific provisions 448 415 361 1,765 1,242Reversals of previously established allowances (20) (23) (23) (77) (58)Recoveries of loans previously written-off (42) (35) (23) (145) (114)
Specific provision for credit losses 386 357 315 1,543 1,070Increase in the general allowance - 60 150 60 260
Provision for credit losses 386 417 465 1,603 1,330
Specific PCL as a % of average net loans and acceptances (annualized) 0.89% 0.81% 0.68% 0.85% 0.61%PCL as a % of average net loans and acceptances (annualized) 0.89% 0.94% 1.01% 0.88% 0.76%
Changes in Gross Impaired Loans and Acceptances (GIL) (Canadian $ in millions, except as noted)
GIL, Beginning of Period 2,913 2,972 1,798 2,387 720Additions to impaired loans & acceptances 735 549 806 2,690 2,506Reductions in impaired loans & acceptances (1) (16) (233) 170 (288) 131Write-offs (335) (375) (387) (1,492) (970)
GIL, End of Period 3,297 2,913 2,387 3,297 2,387
GIL as a % of gross loans and acceptances 1.94% 1.66% 1.26% 1.94% 1.26%GIL as a % of equity and allowances for credit losses 14.06% 12.75% 11.34% 14.06% 11.34%
(1) Includes impaired amounts returned to performing status, loan sales, repayments, the impact of foreign exchange fluctuations and offsets for consumer write-offs which have not been recognized as formations (Q4-09 $189MM; Q3-09 $187MM; and Q4-08 $137MM).
Aggregate Market Value Exposure and Earnings Volatility for Trading and Underwriting and Structural Positions ($ millions)* (After-tax Canadian equivalent) Market value exposure (MVE) 12-month earnings volatility
Oct. 31 2009 July 31 2009 Oct. 31 2008 Oct. 31 2009 July 31 2009 Oct. 31 2008
Trading and Underwriting (18.2) (20.4) (33.4) (14.3) (12.5) (28.7)Structural (353.1) (330.7) (267.9) (69.0) (73.3) (30.2)
* Measured at a 99% confidence interval. Losses are in brackets.
Total Trading and Underwriting MVE Summary ($ millions)* For the quarter ended October 31, 2009 As at July 31, 2009 As at October 31, 2008
(Pre-tax Canadian equivalent) Quarter-end Average High Low Quarter-end Quarter-end
Commodities Risk (0.7) (0.7) (1.1) (0.5) (0.7) (0.9)Equity Risk (10.2) (8.5) (12.4) (5.5) (11.0) (7.3)Foreign Exchange Risk (0.8) (1.9) (4.9) (0.4) (1.8) (1.4)Interest Rate Risk (Mark-to-Market) (1) (18.4) (16.2) (23.7) (10.2) (11.1) (30.6)Diversification (2) 11.4 9.9 nm nm 9.0 6.4
Comprehensive Risk (18.7) (17.4) (22.6) (13.4) (15.6) (33.8)Interest Rate Risk (accrual) (7.3) (10.4) (14.5) (7.3) (13.4) (11.6)Issuer Risk (1.9) (1.8) (2.7) (1.3) (2.4) (6.1)
Total MVE (27.9) (29.6) (34.8) (25.1) (31.4) (51.5)
nm - not meaningful
* One-day measure using a 99% confidence interval. Losses are in brackets and benefits are presented as positive numbers. (1) In 2009, measures exclude securities transferred to the available-for-sale portfolio in the fourth quarter of 2008. (2) Computation of a diversification effect for the high and low is not meaningful.
Structural Balance Sheet Earnings and Value Sensitivity to Changes in Interest Rates ($ millions)* **
(After-tax Canadian equivalent) Economic value sensitivity
Earnings sensitivity over the next
12 months
Oct. 31 2009 July 31 2009 Oct. 31 2008 Oct. 31 2009 July 31 2009 Oct. 31 2008
100 basis point increase (229.6) (231.8) (220.8) 11.0 15.3 (4.4)
100 basis point decrease 165.2 204.0 169.2 (75.6) (71.8) (21.0)
200 basis point increase (506.4) (503.3) (488.6) (10.6) 6.3 (16.2)200 basis point decrease 255.3 411.2 328.4 (62.9) (72.2) (177.6) * Losses are in brackets and benefits are presented as positive numbers. ** For the Bank’s Insurance businesses including BMO Life Assurance (the acquired operations of AIG Life Insurance Company of Canada), a 100 basis point increase in interest rates results in an increase in earnings
of $58 million and an increase in economic value of $177 million. A 100 basis point decrease in interest rates results in a decrease in earnings of $50 million and a decrease in economic value of $193 million. These after-tax impacts are not reflected in the table above.
BMO Financial Group Fourth Quarter Report 2009 • 13
Income Taxes As explained in the Revenue section, management assesses BMO’s consolidated results and associated provisions for income taxes on a GAAP basis. We assess the performance of the operating groups and associated income taxes on a taxable equivalent basis and report accordingly.
The provision for income taxes increased $207 million from the fourth quarter of 2008 and $46 million from the third quarter of 2009, to $158 million. The effective tax rate for the quarter was 19.2%, compared with a recovery rate of 9.2% in the fourth quarter of 2008 and a tax expense rate of 16.4% in the third quarter of 2009. The income tax provision for fiscal 2009 increased $288 million from fiscal 2008 to $217 million, resulting in an effective tax rate of 10.5%. This compares to a tax recovery of $71 million, resulting in a recovery rate of 3.6% for 2008.
Results reflect prior periods’ income tax recoveries of $23 million in the third quarter and $73 million in the fourth quarter a year ago.
The higher effective tax rate in fiscal 2009 was primarily due to reductions in the proportion of income from lower-tax-rate jurisdictions and lower recoveries of prior periods’ income taxes.
BMO hedges the foreign exchange risk arising from its investments in U.S. operations by funding the investments in U.S. dollars. Under this program, the gain or loss from hedging and the unrealized gain or loss from translation of the investments in U.S. operations are charged or credited to shareholders’ equity. For income tax purposes, the gain or loss on the hedging activities attracts an income tax charge or credit in the current period, which is charged or credited to shareholders’ equity, while the associated unrealized gain or loss on the investments in U.S. operations does not attract income taxes until the investments are liquidated. The income tax charge/benefit arising from a hedging gain/loss is a function of the fluctuation in U.S. rates from period to period. Hedging of the investments in U.S. operations has given rise to an income tax recovery in shareholders’ equity of $12 million for the quarter and income tax charge of $382 million for the year. Refer to the Consolidated Statement of Changes in Shareholders’ Equity included in the unaudited consolidated financial statements for further details.
Capital Management Regulatory capital requirements for the consolidated entity are determined on a Basel II basis. BMO uses the Advanced Internal Ratings Based (AIRB) Approach to determine credit risk-weighted assets in our portfolio and the Standardized Approach to determine operational risk-weighted assets. We were granted a waiver by the Office of the Superintendent of Financial Institutions Canada (OSFI), our regulator, ending after fiscal 2010, to apply the Standardized Approach in determining the credit risk-weighted assets of our subsidiary Harris Bankcorp, Inc. Market risk-weighted assets are primarily determined using the Internal Models Approach, but the Standardized Approach is used for some exposures. At October 31, 2009, BMO’s Tier 1 Capital Ratio was 12.24%, with Tier 1 capital of $20.5 billion and risk-weighted assets (RWA) of $167.2 billion. The ratio remains strong, increasing 247 basis points from 9.77% at October 31, 2008 and 53 basis points from 11.71% at the end of the third quarter. The increase from the third quarter was primarily due to lower RWA and higher retained earnings. The increase from 2008 year end was due to both growth in capital and lower RWA. Our strong capital position provides flexibility in the execution of our business growth strategies and positions us well for possible regulatory changes that may be forthcoming. Tier 1 capital increased from October 31, 2008 primarily due to net capital issuances in fiscal 2009. The impact of those issuances was partially offset by an increase in certain Basel II deductions and the impact of a new Basel II requirement we adopted on November 1, 2008, whereby investments in non-consolidated entities and substantial investments, excluding insurance subsidiaries held prior to January 1, 2007, are deducted 50% from Tier 1 capital and 50% from Tier 2 capital. The bank’s incremental investment in one of our insurance subsidiaries, to support the insurance company acquisition completed in the second quarter, is also subject to a deduction of 50% from Tier 1 capital and 50% from Tier 2 capital. Previously, these deductions were taken from Tier 2 capital. Tier 1 capital was relatively unchanged from the third quarter. RWA decreased $24.4 billion from October 31, 2008 primarily due to the impact of a weaker U.S. dollar that decreased the translated value of U.S. dollar-denominated RWA, lower market risk RWA, and lower credit risk RWA mainly as a result of lower corporate and commercial loan volumes and lower trading exposures. The impact of the foregoing reductions was partially offset by the impact of credit migration that affected loan and securitization credit risk RWA. Relative to the third quarter, RWA decreased $4.4 billion primarily due to the lower corporate and commercial loan volumes, partially offset by higher credit risk RWA due to securitization exposures. Basel II credit risk RWA will change with the underlying economic environment. Credit risk RWA levels in 2010 will be influenced by asset growth, credit migration levels and the value of the U.S. dollar. We expect that total RWA will increase in future years as a result of pending regulatory changes that have been announced for 2010 and beyond. BMO’s Total Capital Ratio was 14.87% at October 31, 2009. The ratio increased 270 basis points from a year ago and 55 basis points from 14.32% in the third quarter. Our Tangible Common Equity to RWA ratio was 9.21%, up from 7.47% at the end of fiscal

14 • BMO Financial Group Fourth Quarter Report 2009
2008 and from 8.71% in the third quarter. BMO’s capital ratios remain strong relative to both our Canadian and international peer groups. During the fourth quarter, 3,254,000 shares were issued due to the exercise of stock options, share exchanges and the Dividend Reinvestment and Share Purchase Plan. We did not repurchase any Bank of Montreal common shares under our common share repurchase program during the fiscal year. On November 19, 2009, we announced that the Toronto Stock Exchange and OSFI have approved BMO’s normal course issuer bid under which we may purchase up to 15 million common shares, being approximately 2.7% of the public float, between December 2, 2009 and December 1, 2010. Our share repurchase program is primarily used to offset, over time, the impact of dilution caused by issuing shares through the exercise of stock options, our dividend reinvestment plan and convertible shares. On November 24, 2009, BMO’s Board of Directors declared a quarterly dividend payable to common shareholders of $0.70 per share, unchanged from a year ago and from the preceding quarter. The common dividend is payable February 26, 2010, to shareholders of record on February 1, 2010. Common shareholders who, in lieu of cash, elect to have this dividend reinvested in additional common shares under BMO’s Shareholder Dividend Reinvestment and Share Purchase Plan, will receive a two per cent discount from the average market price of the common shares (as defined in the Plan).
Qualifying Regulatory Capital Basel II Regulatory Capital and Risk-Weighted Assets
(Canadian $ in millions) Q4-2009 Q4-2008
Common shareholders’ equity 17,132 15,974Non-cumulative preferred shares 2,571 1,996Innovative Tier 1 Capital Instruments 2,907 2,486Non-controlling interest in subsidiaries 26 39Goodwill and excess intangible assets (1,569) (1,635)Accumulated net after-tax unrealized losses from available-for-
sale equity securities (2) (15)Net Tier 1 Capital 21,065 18,845Securitization-related deductions (168) (115)Expected loss in excess of allowance – AIRB approach (61) -Substantial investments (374) -Other deductions - (1)Adjusted Tier 1 Capital 20,462 18,729Subordinated debt 4,236 4,175Trust subordinated notes 800 800Eligible general allowance for credit losses 296 494Total Tier 2 Capital 5,332 5,469Securitization-related deductions (7) (6)Expected loss in excess of allowance – AIRB approach (60) -Substantial investments/investment in insurance subsidiaries (868) (871)Adjusted Tier 2 Capital 4,397 4,592Total Capital 24,859 23,321
Risk-Weighted Assets (RWA)
(Canadian $ in millions) Q4-2009 Q4-2008
Credit risk 143,098 163,616Market risk 6,578 11,293Operational risk 17,525 16,699Total risk-weighted assets 167,201 191,608
Eligible Dividends Designation
For the purposes of the Income Tax Act (Canada) and any similar provincial and territorial legislation, BMO designates all dividends paid or deemed to be paid on both its common and preferred shares after December 31, 2005, as "eligible dividends" unless indicated otherwise. Credit Rating
BMO’s senior debt credit ratings were unchanged in the quarter. All four ratings are indicative of high-grade, high-quality issues. They remain: DBRS (AA); Fitch (AA-); Moody’s (Aa1); and Standard & Poor’s (A+). During the fourth quarter, Moody’s placed the rating under review for downgrade, citing pressure on U.S. earnings and the potential for higher loan losses in the market environment. Moody’s ratings outlook for the majority of Canada’s major banks is negative. The other three ratings agencies continue to maintain their ratings with a stable outlook.
BMO Financial Group Fourth Quarter Report 2009 • 15
Financial Instruments in the Difficult Credit Environment Pages 62 to 67 of BMO’s 2008 annual report provided enhanced disclosure related to financial instruments that, effective in 2008, markets started to consider to be carrying higher risk. Readers are encouraged to review that disclosure to assist in understanding the nature of BMO’s exposures at October 31, 2009 that are discussed in the sections that follow. Consumer Loans
In Canada, our consumer portfolio totals $74.9 billion and is comprised of three main asset classes: residential mortgages (49%), instalment and other personal loans (47%) and credit card loans (4%).
In the United States, our consumer portfolio totals US$16 billion and is also primarily comprised of three asset classes: residential first mortgages (37 %), home equity products (34%) and indirect automobile loans (27%). The sections below discuss subprime mortgage loans, Alt-A mortgage loans and home equity products, portfolios that are of increased investor interest in today’s environment. Subprime First Mortgage Loans
In the United States, we have US$0.29 billion (US$0.25 billion at October 31, 2008) of first mortgage loans that had subprime characteristics at the date of authorization. A small portion of the above is in respect of uninsured loans with a loan-to-value ratio above 80% at issuance. A modest $18.5 million, or 6.29% ($5.4 million or 2.14% at October 31, 2008), of the portfolio was 90 days or more in arrears. This compares with a rate of 2.77% on BMO’s total U.S. first mortgage loan portfolio. BMO also has net exposure of US$101 million (US$159 million at October 31, 2008) to a business that purchased distressed mortgages (including subprime mortgages) at a discounted price. In Canada, BMO does not have any subprime mortgage programs. BMO mortgage lending decisions incorporate a full assessment of the customer and loan structure. Credit score is only one component of the adjudication process and consequently we do not categorize loans based upon credit scores alone. Alt-A First Mortgage Loans
In the United States, Alt-A loans are generally considered to be loans for which borrower qualifications are subject to limited verification. The U.S. loan portfolio had two loan programs that met this definition – our Easy Doc and No Doc programs. The programs were discontinued in the third quarter of 2008. Loans under the No Doc program, which comprise most of the exposure in this class, required strong minimum credit bureau scores of 660 and strong maximum loan-to-value ratios of 80% (90% with private mortgage insurance). Due to these lending requirements, the credit quality of our Alt-A portfolio is sound and the loans have performed relatively well. In the United States, our direct Alt-A loans total US$1.2 billion (US$1.6 billion at October 31, 2008). Of this, $65 million or 5.23% was 90 days or more in arrears ($10 million or 0.62% at October 31, 2008). In Canada, we do not have a mortgage program that we consider Alt-A. In the past, we may have chosen to not verify income or employment for certain customers where there were other strong characteristics supporting the credit worthiness of a loan as part of our credit adjudication process; however, this approach is no longer in use. Our Newcomers to Canada/non-
resident mortgage program permits limited income verification but has other strong qualification criteria. There was approximately $2.4 billion ($2.2 billion at October 31, 2008) outstanding under this program. Of this, only $12 million or 0.50% was 90 days or more in arrears ($11 million or 0.51% at October 31, 2008), reflecting the strong credit quality of these loans. Home Equity Products
In the United States, we have a US$5.1 billion home equity loan portfolio, which amounted to 3.1% of BMO’s total loan portfolio as of October 31, 2009. Of the total portfolio, loans of US$321 million (US$300 million at October 31, 2008) were extended to customers with original credit bureau scores of less than 620, and would be categorized as subprime loans (US$535 million authorized) if included in the mortgage portfolio. Of this amount, only US$7 million or 2.10% was 90 days or more in arrears (US$2 million and 0.81% at October 31, 2008). BMO also offered loans under two limited documentation programs within the home equity portfolio in the United States that would be categorized as Alt-A if they were in the first mortgage loans portfolio. The amount authorized under these programs was US$1.0 billion and US$0.6 billion was outstanding, unchanged from October 31, 2008. Loans made under these programs have the same strong credit score and loan-to-value requirements as the first mortgage portfolio and, as such, the portfolio has performed well. As at October 31, 2009, US$6 million or 0.95% of the portfolio was greater than 90 days in arrears, little changed from October 31, 2008. This compares with a rate of 1.10% (0.57% at October 31, 2008) for BMO’s total U.S. home equity loan portfolio. We discontinued offering these programs in the third quarter of 2008. We also consider home equity loans to customers with credit bureau scores above 620 but below 660 to be a higher-risk component of the loan portfolio. This component of the portfolio was US$0.3 billion and US$7 million or 2.10% of these loans were greater than 90 days in arrears (US$3 million and 0.90% at October 31, 2008). In Canada, we have a $16.8 billion ($13.8 billion at October 31, 2008) home equity line of credit portfolio. Authorized amounts total $29.5 billion ($25.4 billion at October 31, 2008). Home equity loans very rarely exceed loan-to-value ratios of 80% at issuance. The home equity line of credit portfolio is high-quality, with only 0.11% of the loans in the portfolio in arrears 90 days or more (0.08% at October 31, 2008). Of these lines of credit, one product line is offered only in first mortgage position and represents approximately 61% of the total portfolio. The others include a blend of first mortgage and subordinate positions. We also have a $0.2 billion home equity instalment loan portfolio on which $2 million of loans are in arrears 90 days or more. Leveraged Finance
Leveraged finance loans are defined by BMO as loans to private equity businesses and mezzanine financings where our assessment indicates a higher level of credit risk. BMO has limited exposure to leveraged finance loans, representing less than 1% of our total assets, with $3.6 billion outstanding as at October 31, 2009 ($5.9 billion authorized), essentially unchanged from October 31, 2008. Of this amount, $201 million or 5.6% was
16 • BMO Financial Group Fourth Quarter Report 2009
classified as impaired ($234 million and 6.5% at October 31, 2008). Monoline Insurers and Credit Derivative Product Companies
BMO’s direct exposure to companies that specialize in providing default protection amounted to $256 million ($573 million at October 31, 2008) in respect of the mark-to-market value of counterparty derivatives and $19 million (unchanged from October 31, 2008) in respect of the mark-to-market value of traded credits. The cumulative adjustment for counterparty credit risk recorded against these exposures was $20.2 million at October 31, 2009 ($32.4 million at July 31, 2009 and $60 million at October 31, 2008). Approximately 28% of the $256 million gross exposure is related to counterparties rated AAA by S&P and a further 32% is related to A-rated counterparties. The balance is largely related to counterparties for which ratings have been withdrawn. At October 31, 2008, 88% of the $573 million exposure was related to counterparties rated AA or better by S&P. Moody’s credit ratings are lower. The notional value of direct contracts involving monoline insurers and credit derivative product companies was approximately $3.8 billion (approximately $4.5 billion at October 31, 2008). Most contracts with these companies relate to collateralized debt obligations and credit default swaps within our trading portfolio and provide protection against losses arising from defaults. These instruments have minimal subprime exposure. Certain Credit Derivative Product counterparty exposures are discussed further in the following Exposures to Other Select Financial Instruments section. BMO also held $901 million ($1,176 million at October 31, 2008) of securities insured by monoline insurers, of which $630 million were municipal bonds. Approximately 91% (approximately 79% at October 31, 2008) of the municipal bond portfolio is rated investment grade, including the benefits of the insurance guarantees. Approximately 77% (approximately 68% at October 31, 2008) of the municipal bond holdings have ratings exclusive of the insurance guarantees and all of those are rated investment grade. BMO-Sponsored Canadian Securitization Vehicles BMO sponsors various Canadian securitization vehicles that fund assets originated by either BMO or its customers. Of those that fund bank originated assets, two hold Canadian residential mortgage loans transferred from BMO while the third holds credit card loans transferred from BMO. BMO’s investment in the asset-backed commercial paper (“ABCP”) of the two residential mortgage vehicles totalled $55 million ($32 million at July 31, 2009 and $509 million at October 31, 2008). Market conditions have improved significantly since October 31, 2008. BMO provides $5.1 billion in liquidity facilities to these vehicles and no amounts have been drawn on the facilities. The credit card securitization vehicle issues only term asset-backed securities and does not issue ABCP. As a result, we do not provide any liquidity facilities to this vehicle. We hold $269 million of subordinated notes issued by the credit card securitization vehicle (unchanged from October 31, 2008). Notes issued pursuant to the mortgage programs are rated R-1 (high) by DBRS and Prime-1 by Moody’s. The senior notes issued pursuant to the credit card programs are rated AAA by DBRS and Aaa by Moody’s.
We also sponsor customer securitization vehicles in Canada that provide customers with financing. These vehicles hold assets transferred by our customers. Some customer securitization vehicles are funded directly by BMO and others are funded in the market. We directly fund customer securitization vehicles holding $719 million of assets, including exposure to $42 million of Canadian residential mortgage loans with subprime or Alt-A characteristics. Notes issued by the market funded customer securitization vehicles are rated R-1 (high) by DBRS and Prime-1 by Moody’s and account for $5.8 billion ($11.0 billion at October 31, 2008) of BMO’s liquidity support facility, which remains undrawn. The assets of each of these market funded customer securitization vehicles consist primarily of diversified pools of Canadian auto receivables and Canadian residential mortgages. These asset classes, combined, account for 68% of the aggregate assets of these vehicles. Their assets include $382 million of Canadian residential mortgage loans with subprime or Alt-A characteristics. BMO’s ABCP holdings of the market funded customer securitization vehicles totalled $328 million at October 31, 2009 ($671 million at July 31, 2009 and $2.1 billion at October 31, 2008), most of which reflects BMO’s decision to invest a portion of its excess structural liquidity in ABCP. No losses have been recorded on BMO’s investment in the ABCP of these vehicles. BMO-Sponsored U.S. Securitization Vehicle
BMO provides committed liquidity support facilities of US$5.7 billion (US$8.2 billion at October 31, 2008) to our U.S. multi-seller ABCP vehicle. Approximately 58% of the vehicle’s commitments have been rated by Moody’s or S&P, and virtually all of these are rated investment grade. Approximately US$807 million of the commitments are insured by monolines, primarily MBIA and Ambac, the ratings of which were downgraded during the third quarter. The downgrades of the monoline insurers have no impact on the performance of the underlying assets. The vehicle holds exposures secured by a variety of asset classes including mid-market and corporate loans, and commercial real estate and auto loans. The vehicle has US$4.4 billion of commercial paper outstanding (US$6.5 billion at October 31, 2008). The ABCP of the conduit is rated A1 by S&P and P1 by Moody’s. BMO has not invested in the conduit’s ABCP. Outstanding commercial paper has consistently been purchased by third-party investors, notwithstanding market disruptions, and pricing levels are in line with those of top-tier ABCP conduits in the United States. Credit Protection Vehicle
We also sponsor Apex Trust (Apex), a Canadian special purpose vehicle that has 12 tranches of diversified corporate credits, each of which has the benefit of first-loss protection. The 12 tranches in Apex have exposure to approximately 450 corporate credits that are diversified by geographic region and industry. Approximately 70% of the corporate credits are rated investment grade (25% rated higher than BBB, 46% rated BBB and 29% rated below investment grade). There have been minimal changes to the ratings of the corporate credits in the fourth quarter. A number of the ratings on the underlying companies are on watch or under review for downgrade. In the third and fourth quarters, we put in place hedges that reduced BMO’s risk exposure to Apex to levels that are not
BMO Financial Group Fourth Quarter Report 2009 • 17
expected to expose BMO to significant loss. No realized losses have been experienced in the vehicle to date and the likelihood of realized losses exceeding the level of the hedges we have is considered remote given the level of first-loss protection on the tranches and the strength of the underlying corporate credits. BMO has entered into credit default swap contracts on the net notional positions in the structure with the swap counterparties and into offsetting swaps with the vehicle. Apex has issued $2.2 billion of notes (Notes) with remaining terms of four and seven years. After giving effect to the hedges we entered into, BMO has no net exposure through the Apex Notes to realized credit losses in the tranches. BMO’s gross exposure before considering the offsetting hedges is $815 million. Another party has a $600 million exposure to the Notes through a total return swap with BMO. Realized credit losses in Apex would only be incurred should losses on defaults on the underlying credits exceed the first-loss protection on a tranche. A significant majority of Apex’s positions benefit from substantial first-loss protection and there has been minimal change in these levels during the quarter. A senior funding facility of $1.13 billion has been made available to Apex, with BMO providing $1.03 billion of that facility. During the third quarter, we entered into a transaction that hedges the first $515 million of loss exposure on our committed exposure under the senior funding facility. As of October 31, 2009, $112 million ($214 million at July 31, 2009) was advanced through BMO’s committed share of the senior facility to fund collateral calls arising from changes in mark-to-market values of the underlying credit default swaps. In the fourth quarter, we recorded $50 million of charges in respect of Apex, comprised of the one-time $25 million net cost of entering into the hedge on our $815 million Note exposure and a $25 million mark-to-market loss on the hedge of the first $515 million of exposure on the loan facility, which resulted from credit spreads tightening during the quarter. Two tranches have lower levels of first-loss protection than others. If losses were realized by Apex investors on the full notional amounts of $1,217 million represented by the two weakest tranches, BMO’s exposure would be nil given the hedges in place. Each of the other 10 tranches, which have a net notional amount of $20.6 billion, is rated from A (low) to AAA and has significant first-loss protection, ranging from 13.0% to 29.4% with a weighted average of 23.5%. Structured Investment Vehicles
We provide senior-ranked funding support through BMO liquidity facilities for two BMO-managed Structured Investment Vehicles (SIVs), Links Finance Corporation (Links) and Parkland Finance Corporation (Parkland). At October 31, 2009, amounts drawn on the facilities totalled US$5.8 billion and €597 million (US$6.4 billion and €622 million at July 31, 2009). The liquidity facilities totalled US$6.0 billion for Links and €627 million for Parkland at October 31, 2009. Advances under the liquidity facilities rank ahead of the SIVs’ subordinated capital notes. Consistent with the strategy of selling assets in an orderly and value-sensitive manner and as a result of weak but improving market conditions, the pace of asset sales was measured during the quarter, though higher than in the previous quarter. We anticipate that the SIVs will continue the strategy of selling assets in an orderly manner based upon market conditions and that asset
sales in the current quarter will be modest. The total amount drawn under the liquidity facilities is impacted by a number of factors including the pace and price of asset sales. Amounts funded are expected to decrease from current levels based on these factors. While the assets of the SIVs will mature over time, a significant portion is expected to be repaid in the period between 2010 and 2012. The SIVs' capital noteholders will continue to bear the economic risk from actual losses up to the full amount of their investment. The book value of the subordinated capital notes in Links and Parkland at October 31, 2009 was US$866 million and €150 million, respectively. The par value of the assets held by Links and Parkland totalled US$7.1 billion and €752 million, respectively, reduced from US$7.8 billion and €774 million at July 31, 2009. The market value of the assets held by Links and Parkland, including hedges and cash equivalents, totalled US$5.5 billion and €631 million, respectively, compared with US$5.6 billion and €598 million at July 31, 2009. During the quarter, there were maturities and repayments of assets totalling US$277 million in Links and €11 million in Parkland as well as par value asset sales of US$442 million in Links and €10 million in Parkland. While the market value of Links assets is currently lower than the senior debt outstanding, BMO believes that the first-loss protection provided by the subordinate capital notes exceeds future expected losses. The market value of Parkland assets increased in the quarter and now exceeds the amount of senior debt outstanding. The asset quality of Links remains high. Based on market value, approximately 51% of debt securities are rated Aa3 or better by Moody’s (55% at July 31, 2009 and 84% at October 31, 2008) with 91% rated investment grade. Approximately 47% are rated AA- or better by S&P (49% at July 31, 2009 and 73% at October 31, 2008) with 92% rated investment grade. Certain of the debt security ratings are on credit watch, for downgrade. The senior notes of the SIVs have ratings consistent with BMO’s senior debt ratings of Aa1 (Moody’s) and A+ (S&P). On October 27, 2009, Moody’s placed the long-term senior debt ratings of Links and Parkland on review for possible downgrade as a result of its review of BMO’s long-term debt ratings. The SIVs hold a diversified mix of debt securities and the mix of securities is largely unchanged from October 31, 2008. Caution Given the uncertainty in the capital markets environment, our capital markets instruments could experience further valuation gains and losses due to changes in market value. This Financial Instruments in the Difficult Credit Environment section contains forward-looking statements. Please see the Caution Regarding Forward-Looking Statements.
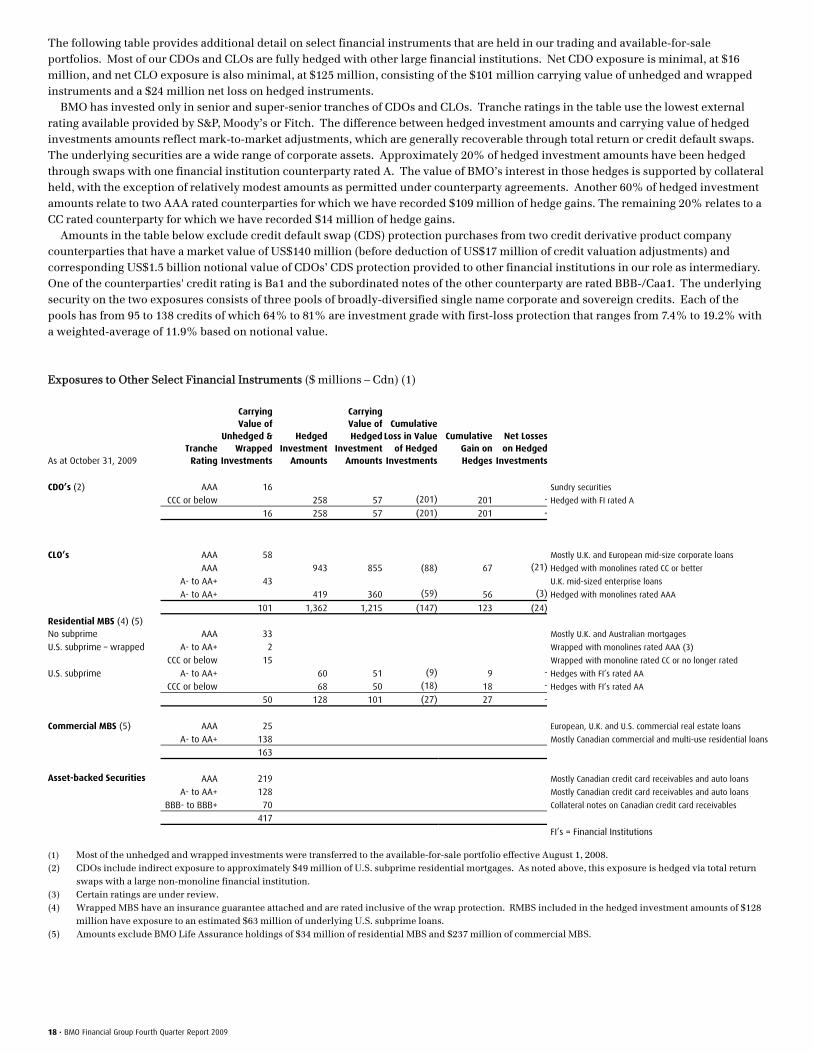
18 • BMO Financial Group Fourth Quarter Report 2009
The following table provides additional detail on select financial instruments that are held in our trading and available-for-sale portfolios. Most of our CDOs and CLOs are fully hedged with other large financial institutions. Net CDO exposure is minimal, at $16 million, and net CLO exposure is also minimal, at $125 million, consisting of the $101 million carrying value of unhedged and wrapped instruments and a $24 million net loss on hedged instruments. BMO has invested only in senior and super-senior tranches of CDOs and CLOs. Tranche ratings in the table use the lowest external rating available provided by S&P, Moody’s or Fitch. The difference between hedged investment amounts and carrying value of hedged investments amounts reflect mark-to-market adjustments, which are generally recoverable through total return or credit default swaps. The underlying securities are a wide range of corporate assets. Approximately 20% of hedged investment amounts have been hedged through swaps with one financial institution counterparty rated A. The value of BMO’s interest in those hedges is supported by collateral held, with the exception of relatively modest amounts as permitted under counterparty agreements. Another 60% of hedged investment amounts relate to two AAA rated counterparties for which we have recorded $109 million of hedge gains. The remaining 20% relates to a CC rated counterparty for which we have recorded $14 million of hedge gains. Amounts in the table below exclude credit default swap (CDS) protection purchases from two credit derivative product company counterparties that have a market value of US$140 million (before deduction of US$17 million of credit valuation adjustments) and corresponding US$1.5 billion notional value of CDOs’ CDS protection provided to other financial institutions in our role as intermediary. One of the counterparties' credit rating is Ba1 and the subordinated notes of the other counterparty are rated BBB-/Caa1. The underlying security on the two exposures consists of three pools of broadly-diversified single name corporate and sovereign credits. Each of the pools has from 95 to 138 credits of which 64% to 81% are investment grade with first-loss protection that ranges from 7.4% to 19.2% with a weighted-average of 11.9% based on notional value. Exposures to Other Select Financial Instruments ($ millions – Cdn) (1)
As at October 31, 2009 Tranche
Rating
Carrying Value of
Unhedged &Wrapped
Investments
HedgedInvestment
Amounts
CarryingValue of Hedged
Investment Amounts
Cumulative Loss in Value
of Hedged Investments
Cumulative Gain on Hedges
Net Losses on Hedged
Investments
CDO’s (2) AAA 16 Sundry securities
CCC or below 258 57 (201) 201 - Hedged with FI rated A
16 258 57 (201) 201 -
CLO’s AAA 58 Mostly U.K. and European mid-size corporate loans
AAA 943 855 (88) 67 (21) Hedged with monolines rated CC or better
A- to AA+ 43 U.K. mid-sized enterprise loans
A- to AA+ 419 360 (59) 56 (3) Hedged with monolines rated AAA
101 1,362 1,215 (147) 123 (24)
Residential MBS (4) (5) No subprime AAA 33 Mostly U.K. and Australian mortgages
U.S. subprime – wrapped A- to AA+ 2 Wrapped with monolines rated AAA (3)
CCC or below 15 Wrapped with monoline rated CC or no longer rated
U.S. subprime A- to AA+ 60 51 (9) 9 - Hedges with FI’s rated AA
CCC or below 68 50 (18) 18 - Hedges with FI’s rated AA
50 128 101 (27) 27 -
Commercial MBS (5) AAA 25 European, U.K. and U.S. commercial real estate loans
A- to AA+ 138 Mostly Canadian commercial and multi-use residential loans
163
Asset-backed Securities AAA 219 Mostly Canadian credit card receivables and auto loans
A- to AA+ 128 Mostly Canadian credit card receivables and auto loans
BBB- to BBB+ 70 Collateral notes on Canadian credit card receivables
417
FI’s = Financial Institutions
(1) Most of the unhedged and wrapped investments were transferred to the available-for-sale portfolio effective August 1, 2008. (2) CDOs include indirect exposure to approximately $49 million of U.S. subprime residential mortgages. As noted above, this exposure is hedged via total return
swaps with a large non-monoline financial institution. (3) Certain ratings are under review. (4) Wrapped MBS have an insurance guarantee attached and are rated inclusive of the wrap protection. RMBS included in the hedged investment amounts of $128
million have exposure to an estimated $63 million of underlying U.S. subprime loans. (5) Amounts exclude BMO Life Assurance holdings of $34 million of residential MBS and $237 million of commercial MBS.
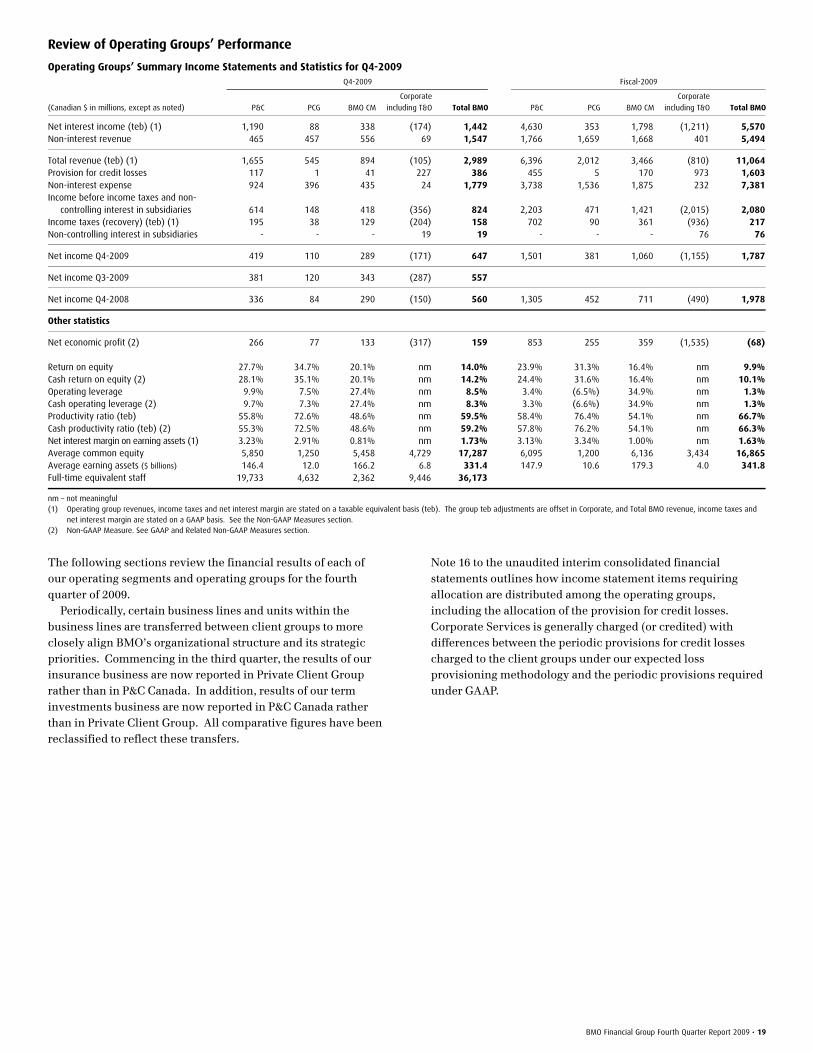
BMO Financial Group Fourth Quarter Report 2009 • 19
Review of Operating Groups’ Performance
Operating Groups’ Summary Income Statements and Statistics for Q4-2009 Q4-2009 Fiscal-2009
(Canadian $ in millions, except as noted) P&C PCG BMO CM
Corporate
including T&O Total BMO P&C PCG BMO CM
Corporate
including T&O Total BMO
Net interest income (teb) (1) 1,190 88 338 (174) 1,442 4,630 353 1,798 (1,211) 5,570Non-interest revenue 465 457 556 69 1,547 1,766 1,659 1,668 401 5,494
Total revenue (teb) (1) 1,655 545 894 (105) 2,989 6,396 2,012 3,466 (810) 11,064Provision for credit losses 117 1 41 227 386 455 5 170 973 1,603Non-interest expense 924 396 435 24 1,779 3,738 1,536 1,875 232 7,381Income before income taxes and non- controlling interest in subsidiaries 614 148 418 (356) 824 2,203 471 1,421 (2,015) 2,080Income taxes (recovery) (teb) (1) 195 38 129 (204) 158 702 90 361 (936) 217Non-controlling interest in subsidiaries - - - 19 19 - - - 76 76
Net income Q4-2009 419 110 289 (171) 647 1,501 381 1,060 (1,155) 1,787
Net income Q3-2009 381 120 343 (287) 557
Net income Q4-2008 336 84 290 (150) 560 1,305 452 711 (490) 1,978
Other statistics
Net economic profit (2) 266 77 133 (317) 159 853 255 359 (1,535) (68)
Return on equity 27.7% 34.7% 20.1% nm 14.0% 23.9% 31.3% 16.4% nm 9.9%Cash return on equity (2) 28.1% 35.1% 20.1% nm 14.2% 24.4% 31.6% 16.4% nm 10.1%Operating leverage 9.9% 7.5% 27.4% nm 8.5% 3.4% (6.5%) 34.9% nm 1.3%Cash operating leverage (2) 9.7% 7.3% 27.4% nm 8.3% 3.3% (6.6%) 34.9% nm 1.3%Productivity ratio (teb) 55.8% 72.6% 48.6% nm 59.5% 58.4% 76.4% 54.1% nm 66.7%Cash productivity ratio (teb) (2) 55.3% 72.5% 48.6% nm 59.2% 57.8% 76.2% 54.1% nm 66.3%Net interest margin on earning assets (1) 3.23% 2.91% 0.81% nm 1.73% 3.13% 3.34% 1.00% nm 1.63%Average common equity 5,850 1,250 5,458 4,729 17,287 6,095 1,200 6,136 3,434 16,865Average earning assets ($ billions) 146.4 12.0 166.2 6.8 331.4 147.9 10.6 179.3 4.0 341.8Full-time equivalent staff 19,733 4,632 2,362 9,446 36,173
nm – not meaningful (1) Operating group revenues, income taxes and net interest margin are stated on a taxable equivalent basis (teb). The group teb adjustments are offset in Corporate, and Total BMO revenue, income taxes and
net interest margin are stated on a GAAP basis. See the Non-GAAP Measures section. (2) Non-GAAP Measure. See GAAP and Related Non-GAAP Measures section.
The following sections review the financial results of each of our operating segments and operating groups for the fourth quarter of 2009. Periodically, certain business lines and units within the business lines are transferred between client groups to more closely align BMO’s organizational structure and its strategic priorities. Commencing in the third quarter, the results of our insurance business are now reported in Private Client Group rather than in P&C Canada. In addition, results of our term investments business are now reported in P&C Canada rather than in Private Client Group. All comparative figures have been reclassified to reflect these transfers.
Note 16 to the unaudited interim consolidated financial statements outlines how income statement items requiring allocation are distributed among the operating groups, including the allocation of the provision for credit losses. Corporate Services is generally charged (or credited) with differences between the periodic provisions for credit losses charged to the client groups under our expected loss provisioning methodology and the periodic provisions required under GAAP.
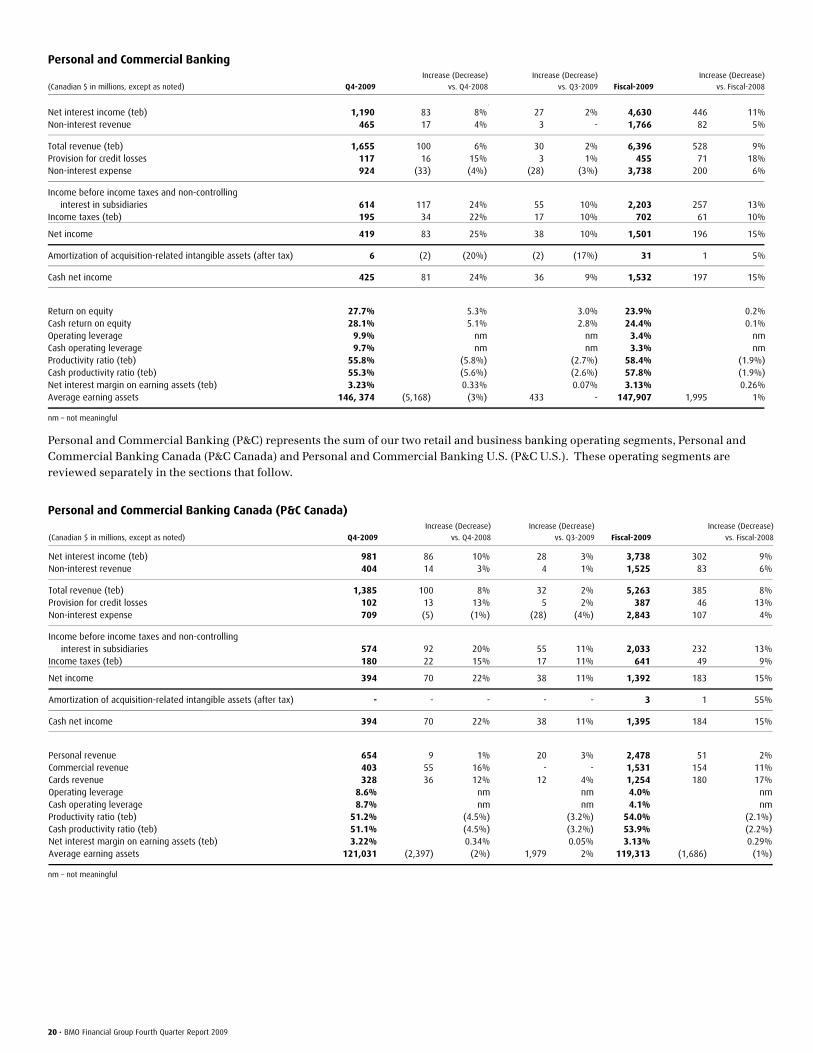
20 • BMO Financial Group Fourth Quarter Report 2009
Personal and Commercial Banking
(Canadian $ in millions, except as noted) Q4-2009
Increase (Decrease)
vs. Q4-2008
Increase (Decrease)
vs. Q3-2009 Fiscal-2009
Increase (Decrease)
vs. Fiscal-2008
+
Net interest income (teb) 1,190 83 8% 27 2% 4,630 446 11%Non-interest revenue 465 17 4% 3 - 1,766 82 5%
Total revenue (teb) 1,655 100 6% 30 2% 6,396 528 9%Provision for credit losses 117 16 15% 3 1% 455 71 18%Non-interest expense 924 (33) (4%) (28) (3%) 3,738 200 6%
Income before income taxes and non-controlling interest in subsidiaries 614 117 24% 55 10% 2,203 257 13%Income taxes (teb) 195 34 22% 17 10% 702 61 10%
Net income 419 83 25% 38 10% 1,501 196 15%
Amortization of acquisition-related intangible assets (after tax) 6 (2) (20%) (2) (17%) 31 1 5%
Cash net income 425 81 24% 36 9% 1,532 197 15%
Return on equity 27.7% 5.3% 3.0% 23.9% 0.2%Cash return on equity 28.1% 5.1% 2.8% 24.4% 0.1%Operating leverage 9.9% nm nm 3.4% nmCash operating leverage 9.7% nm nm 3.3% nmProductivity ratio (teb) 55.8% (5.8%) (2.7%) 58.4% (1.9%)Cash productivity ratio (teb) 55.3% (5.6%) (2.6%) 57.8% (1.9%)Net interest margin on earning assets (teb) 3.23% 0.33% 0.07% 3.13% 0.26%Average earning assets 146, 374 (5,168) (3%) 433 - 147,907 1,995 1%
nm – not meaningful
Personal and Commercial Banking (P&C) represents the sum of our two retail and business banking operating segments, Personal and Commercial Banking Canada (P&C Canada) and Personal and Commercial Banking U.S. (P&C U.S.). These operating segments are reviewed separately in the sections that follow.
Personal and Commercial Banking Canada (P&C Canada)
(Canadian $ in millions, except as noted) Q4-2009
Increase (Decrease)
vs. Q4-2008
Increase (Decrease)
vs. Q3-2009 Fiscal-2009
Increase (Decrease)
vs. Fiscal-2008
Net interest income (teb) 981 86 10% 28 3% 3,738 302 9%Non-interest revenue 404 14 3% 4 1% 1,525 83 6%
Total revenue (teb) 1,385 100 8% 32 2% 5,263 385 8%Provision for credit losses 102 13 13% 5 2% 387 46 13%Non-interest expense 709 (5) (1%) (28) (4%) 2,843 107 4%
Income before income taxes and non-controlling interest in subsidiaries 574 92 20% 55 11% 2,033 232 13%Income taxes (teb) 180 22 15% 17 11% 641 49 9%
Net income 394 70 22% 38 11% 1,392 183 15%
Amortization of acquisition-related intangible assets (after tax) - - - - - 3 1 55%
Cash net income 394 70 22% 38 11% 1,395 184 15%
Personal revenue 654 9 1% 20 3% 2,478 51 2%Commercial revenue 403 55 16% - - 1,531 154 11%Cards revenue 328 36 12% 12 4% 1,254 180 17%Operating leverage 8.6% nm nm 4.0% nmCash operating leverage 8.7% nm nm 4.1% nmProductivity ratio (teb) 51.2% (4.5%) (3.2%) 54.0% (2.1%)Cash productivity ratio (teb) 51.1% (4.5%) (3.2%) 53.9% (2.2%)Net interest margin on earning assets (teb) 3.22% 0.34% 0.05% 3.13% 0.29%Average earning assets 121,031 (2,397) (2%) 1,979 2% 119,313 (1,686) (1%)
nm – not meaningful
BMO Financial Group Fourth Quarter Report 2009 • 21
Q4 2009 vs Q4 2008 Net income was a strong $394 million, up $70 million or 22% from a year ago. Revenue rose $100 million or 7.8%, driven by volume growth across most products, an improved net interest margin, cards and payments services revenue, net investment securities gains and higher activity fees, partially offset by lower securitization revenues. Net interest margin increased by 34 basis points. The increase was driven primarily by favourable prime rates relative to BA rates and actions to mitigate the impact of rising long-term funding costs, along with the impact of deposit growth outpacing loan growth and the securitization of low-margin mortgages. These factors were partially offset by lower mortgage refinancing fees and interest received on tax refunds in the prior year. In the personal banking segment, revenue increased $9 million or 1.4%, driven by volume growth in higher-spread loans and deposits, favourable prime rates relative to BA rates and actions to mitigate the impact of rising long-term funding costs partially offset by reductions in mortgage refinancing fees and securitization revenue. Homeowner Readiline growth drove personal loan growth of 13% year over year. Market share decreased from the prior year due to actions taken to maintain the quality of the portfolio. Our mortgage loan balances declined from a year ago, due to securitization and the runoff of our broker-channel and third-party loans and, as expected, mortgage market share decreased from a year ago. Over the long-term, our goal is to grow market share and we are highly focused on improving this business through process improvements, sales force productivity gains and further expansion in order to meet our goals. Personal deposits increased 13% year over year. The combination of improved performance management, investment in our branch network, simplified product offerings and customers’ preferences for bank deposits in uncertain market conditions contributed to this growth. Market share increased year over year and we remain confident with the actions we are taking to generate growth. In the commercial banking segment, revenue increased $55 million or 16% due to growth in deposits, net investment securities gains, higher activity fees and favourable prime rates relative to BA rates. Deposit balances grew 7.7%, reflecting our customers’ attraction to the security of bank deposits in the current environment and our focus on meeting our customers’ banking needs. While loan balances decreased 2.3% from a year ago due to economic weakness and continued competition, our market share increased from the prior year and we continued to rank second in Canadian business banking market share of small and mid-size businesses. Cards and Payment Services revenue increased $36 million or 12% due to balance growth, spread improvement and higher payment service revenue. Non-interest expense decreased $5 million or 0.8%, primarily due to lower initiatives expense, lower capital taxes and savings
from lower staff levels, partially offset by increases in employee benefits costs and performance-based compensation. The group’s cash operating leverage was 8.7%. We continue to invest strategically to improve our competitive position and, mindful of the current economic environment, to tightly manage our operating expenses. Average loans and acceptances, including securitized loans, increased $1.8 billion or 1.3% from a year ago and personal and commercial deposits grew $9.2 billion or 10%. Q4 2009 vs Q3 2009
Net income increased $38 million or 11%. Revenue increased $32 million or 2.3%, driven by volume growth and improved net interest margin. Net interest margin improved 5 basis points due to actions to mitigate the impact of rising long-term funding costs and higher volumes in more profitable products, partially offset by lower mortgage refinancing fees. Non-interest expense decreased $28 million or 3.7% primarily due to lower capital taxes and lower severance costs. Average loans and acceptances including securitized loans increased $1.1 billion or 0.8% from the last quarter while commercial deposits increased $0.7 billion or 2.5%. Personal and term deposits were unchanged. Fiscal 2009 vs Fiscal 2008
Net income increased $183 million or 15% to $1,392 million. Revenue increased $385 million or 7.9%, driven by volume growth across most products, an improved net interest margin, higher cards and payment service revenue and higher activity fees, partially offset by lower revenue from securitizations and mutual fund products. Net interest margin increased 29 basis points. Approximately one-half of the increase was due to securitizing low-margin mortgages, while one-quarter of the increase was attributable to deposit growth outpacing loan growth. The remainder was due to favourable prime rates relative to BA rates and actions to mitigate the impact of rising long-term funding costs, partially offset by lower mortgage refinancing fees and interest received on tax refunds in the prior year. Non-interest expense increased $107 million or 3.9% primarily due to increases in employee benefits costs, performance-based compensation and occupancy and payment services costs, partially offset by lower initiatives spending and savings from lower staff levels. All comparative figures have been reclassified to reflect the third quarter 2009 transfer of BMO’s insurance business to PCG from P&C Canada and the transfer of the term investment business from PCG to P&C Canada.
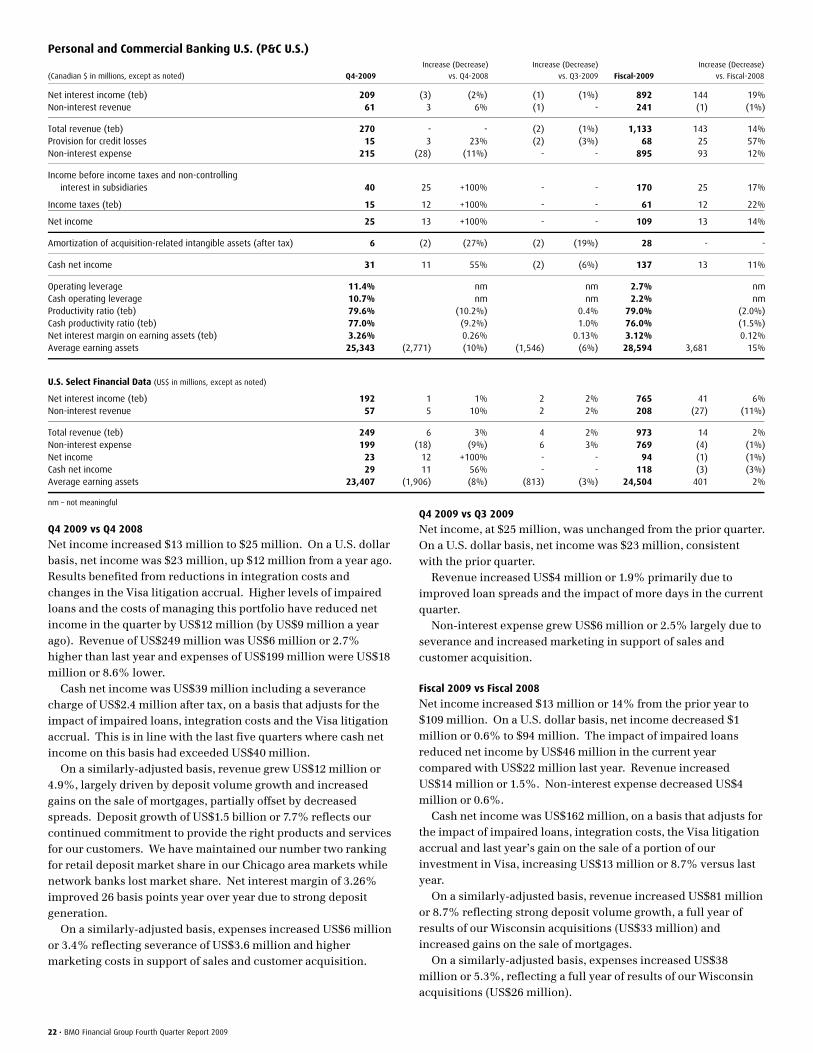
22 • BMO Financial Group Fourth Quarter Report 2009
Personal and Commercial Banking U.S. (P&C U.S.)
(Canadian $ in millions, except as noted) Q4-2009
Increase (Decrease)
vs. Q4-2008
Increase (Decrease)
vs. Q3-2009 Fiscal-2009
Increase (Decrease)
vs. Fiscal-2008
Net interest income (teb) 209 (3) (2%) (1) (1%) 892 144 19%Non-interest revenue 61 3 6% (1) - 241 (1) (1%)
Total revenue (teb) 270 - - (2) (1%) 1,133 143 14%Provision for credit losses 15 3 23% (2) (3%) 68 25 57%Non-interest expense 215 (28) (11%) - - 895 93 12%
Income before income taxes and non-controlling interest in subsidiaries 40 25 +100% -
-
170 25 17%
Income taxes (teb) 15 12 +100% - - 61 12 22%
Net income 25 13 +100% - - 109 13 14%
Amortization of acquisition-related intangible assets (after tax) 6 (2) (27%) (2) (19%) 28 - -
Cash net income 31 11 55% (2) (6%) 137 13 11%
Operating leverage 11.4% nm nm 2.7% nmCash operating leverage 10.7% nm nm 2.2% nmProductivity ratio (teb) 79.6% (10.2%) 0.4% 79.0% (2.0%)Cash productivity ratio (teb) 77.0% (9.2%) 1.0% 76.0% (1.5%)Net interest margin on earning assets (teb) 3.26% 0.26% 0.13% 3.12% 0.12%Average earning assets 25,343 (2,771) (10%) (1,546) (6%) 28,594 3,681 15%
U.S. Select Financial Data (US$ in millions, except as noted)
Net interest income (teb) 192 1 1% 2 2% 765 41 6%Non-interest revenue 57 5 10% 2 2% 208 (27) (11%)
Total revenue (teb) 249 6 3% 4 2% 973 14 2%Non-interest expense 199 (18) (9%) 6 3% 769 (4) (1%)Net income 23 12 +100% - - 94 (1) (1%)Cash net income 29 11 56% - - 118 (3) (3%)Average earning assets 23,407 (1,906) (8%) (813) (3%) 24,504 401 2%
nm – not meaningful
Q4 2009 vs Q4 2008
Net income increased $13 million to $25 million. On a U.S. dollar basis, net income was $23 million, up $12 million from a year ago. Results benefited from reductions in integration costs and changes in the Visa litigation accrual. Higher levels of impaired loans and the costs of managing this portfolio have reduced net income in the quarter by US$12 million (by US$9 million a year ago). Revenue of US$249 million was US$6 million or 2.7% higher than last year and expenses of US$199 million were US$18 million or 8.6% lower. Cash net income was US$39 million including a severance charge of US$2.4 million after tax, on a basis that adjusts for the impact of impaired loans, integration costs and the Visa litigation accrual. This is in line with the last five quarters where cash net income on this basis had exceeded US$40 million. On a similarly-adjusted basis, revenue grew US$12 million or 4.9%, largely driven by deposit volume growth and increased gains on the sale of mortgages, partially offset by decreased spreads. Deposit growth of US$1.5 billion or 7.7% reflects our continued commitment to provide the right products and services for our customers. We have maintained our number two ranking for retail deposit market share in our Chicago area markets while network banks lost market share. Net interest margin of 3.26% improved 26 basis points year over year due to strong deposit generation. On a similarly-adjusted basis, expenses increased US$6 million or 3.4% reflecting severance of US$3.6 million and higher marketing costs in support of sales and customer acquisition.
Q4 2009 vs Q3 2009
Net income, at $25 million, was unchanged from the prior quarter. On a U.S. dollar basis, net income was $23 million, consistent with the prior quarter. Revenue increased US$4 million or 1.9% primarily due to improved loan spreads and the impact of more days in the current quarter. Non-interest expense grew US$6 million or 2.5% largely due to severance and increased marketing in support of sales and customer acquisition. Fiscal 2009 vs Fiscal 2008
Net income increased $13 million or 14% from the prior year to $109 million. On a U.S. dollar basis, net income decreased $1 million or 0.6% to $94 million. The impact of impaired loans reduced net income by US$46 million in the current year compared with US$22 million last year. Revenue increased US$14 million or 1.5%. Non-interest expense decreased US$4 million or 0.6%. Cash net income was US$162 million, on a basis that adjusts for the impact of impaired loans, integration costs, the Visa litigation accrual and last year’s gain on the sale of a portion of our investment in Visa, increasing US$13 million or 8.7% versus last year. On a similarly-adjusted basis, revenue increased US$81 million or 8.7% reflecting strong deposit volume growth, a full year of results of our Wisconsin acquisitions (US$33 million) and increased gains on the sale of mortgages. On a similarly-adjusted basis, expenses increased US$38 million or 5.3%, reflecting a full year of results of our Wisconsin acquisitions (US$26 million).
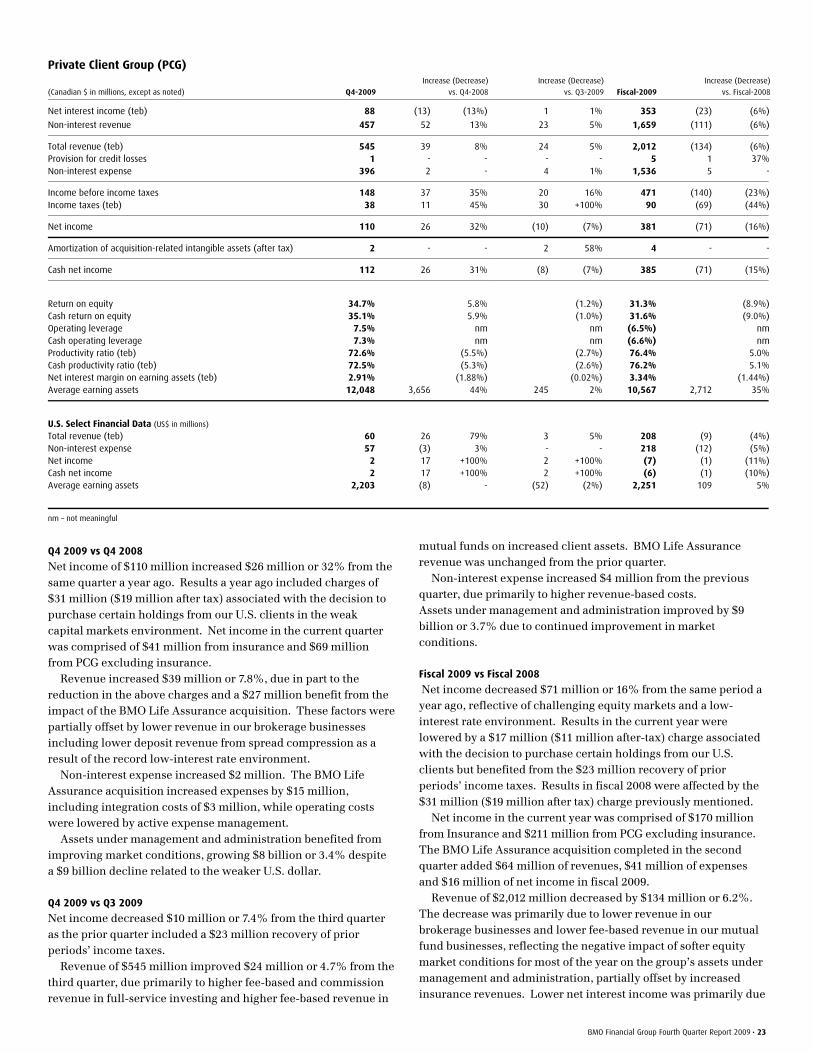
BMO Financial Group Fourth Quarter Report 2009 • 23
Private Client Group (PCG)
(Canadian $ in millions, except as noted) Q4-2009
Increase (Decrease)
vs. Q4-2008
Increase (Decrease)
vs. Q3-2009 Fiscal-2009
Increase (Decrease)
vs. Fiscal-2008
Net interest income (teb) 88 (13) (13%) 1 1% 353 (23) (6%)
Non-interest revenue 457 52 13% 23 5% 1,659 (111) (6%)
Total revenue (teb) 545 39 8% 24 5% 2,012 (134) (6%)Provision for credit losses 1 - - - - 5 1 37%Non-interest expense 396 2 - 4 1% 1,536 5 -
Income before income taxes 148 37 35% 20 16% 471 (140) (23%)Income taxes (teb) 38 11 45% 30 +100% 90 (69) (44%)
Net income 110 26 32% (10) (7%) 381 (71) (16%)
Amortization of acquisition-related intangible assets (after tax) 2 - - 2 58% 4 - -
Cash net income 112 26 31% (8) (7%) 385 (71) (15%)
Return on equity 34.7% 5.8% (1.2%) 31.3% (8.9%)Cash return on equity 35.1% 5.9% (1.0%) 31.6% (9.0%)Operating leverage 7.5% nm nm (6.5%) nmCash operating leverage 7.3% nm nm (6.6%) nmProductivity ratio (teb) 72.6% (5.5%) (2.7%) 76.4% 5.0%Cash productivity ratio (teb) 72.5% (5.3%) (2.6%) 76.2% 5.1%Net interest margin on earning assets (teb) 2.91% (1.88%) (0.02%) 3.34% (1.44%)Average earning assets 12,048 3,656 44% 245 2% 10,567 2,712 35%
U.S. Select Financial Data (US$ in millions) Total revenue (teb) 60 26 79% 3 5% 208 (9) (4%)Non-interest expense 57 (3) 3% - - 218 (12) (5%)Net income 2 17 +100% 2 +100% (7) (1) (11%)Cash net income 2 17 +100% 2 +100% (6) (1) (10%)Average earning assets 2,203 (8) - (52) (2%) 2,251 109 5%
nm – not meaningful
Q4 2009 vs Q4 2008
Net income of $110 million increased $26 million or 32% from the same quarter a year ago. Results a year ago included charges of $31 million ($19 million after tax) associated with the decision to purchase certain holdings from our U.S. clients in the weak capital markets environment. Net income in the current quarter was comprised of $41 million from insurance and $69 million from PCG excluding insurance. Revenue increased $39 million or 7.8%, due in part to the reduction in the above charges and a $27 million benefit from the impact of the BMO Life Assurance acquisition. These factors were partially offset by lower revenue in our brokerage businesses including lower deposit revenue from spread compression as a result of the record low-interest rate environment. Non-interest expense increased $2 million. The BMO Life Assurance acquisition increased expenses by $15 million, including integration costs of $3 million, while operating costs were lowered by active expense management. Assets under management and administration benefited from improving market conditions, growing $8 billion or 3.4% despite a $9 billion decline related to the weaker U.S. dollar. Q4 2009 vs Q3 2009
Net income decreased $10 million or 7.4% from the third quarter as the prior quarter included a $23 million recovery of prior periods’ income taxes. Revenue of $545 million improved $24 million or 4.7% from the third quarter, due primarily to higher fee-based and commission revenue in full-service investing and higher fee-based revenue in
mutual funds on increased client assets. BMO Life Assurance revenue was unchanged from the prior quarter. Non-interest expense increased $4 million from the previous quarter, due primarily to higher revenue-based costs. Assets under management and administration improved by $9 billion or 3.7% due to continued improvement in market conditions. Fiscal 2009 vs Fiscal 2008
Net income decreased $71 million or 16% from the same period a year ago, reflective of challenging equity markets and a low-interest rate environment. Results in the current year were lowered by a $17 million ($11 million after-tax) charge associated with the decision to purchase certain holdings from our U.S. clients but benefited from the $23 million recovery of prior periods’ income taxes. Results in fiscal 2008 were affected by the $31 million ($19 million after tax) charge previously mentioned. Net income in the current year was comprised of $170 million from Insurance and $211 million from PCG excluding insurance. The BMO Life Assurance acquisition completed in the second quarter added $64 million of revenues, $41 million of expenses and $16 million of net income in fiscal 2009. Revenue of $2,012 million decreased by $134 million or 6.2%. The decrease was primarily due to lower revenue in our brokerage businesses and lower fee-based revenue in our mutual fund businesses, reflecting the negative impact of softer equity market conditions for most of the year on the group’s assets under management and administration, partially offset by increased insurance revenues. Lower net interest income was primarily due
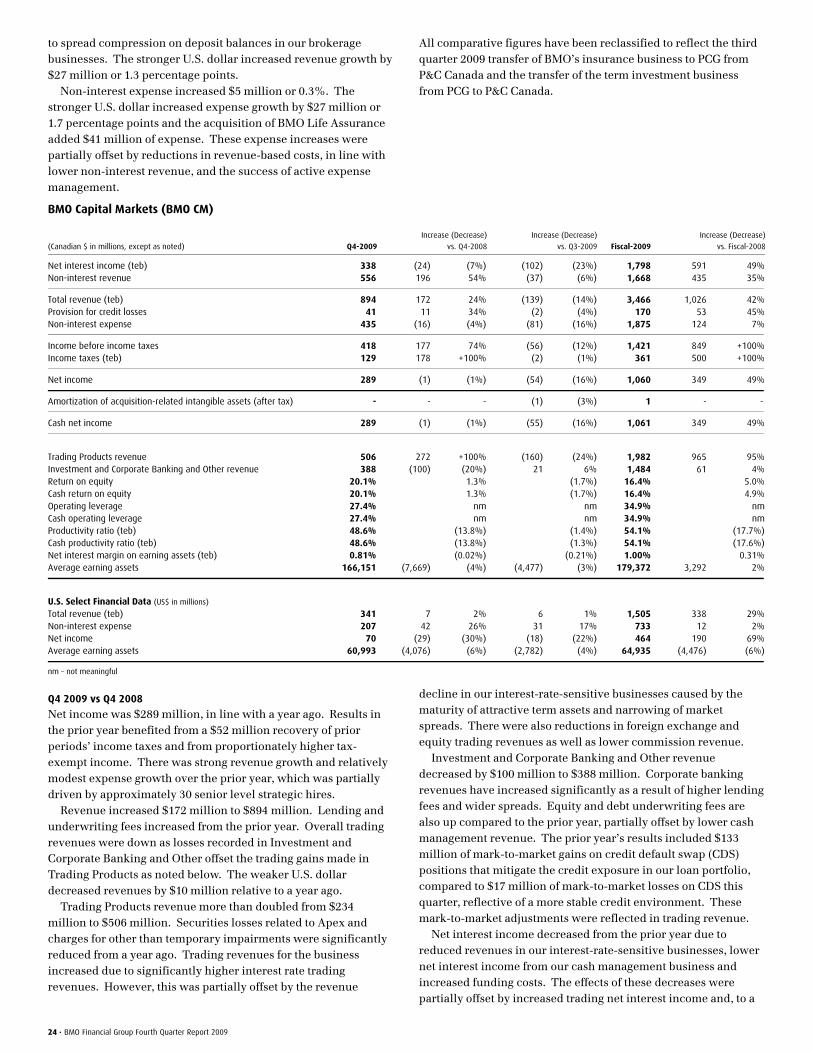
24 • BMO Financial Group Fourth Quarter Report 2009
to spread compression on deposit balances in our brokerage businesses. The stronger U.S. dollar increased revenue growth by $27 million or 1.3 percentage points. Non-interest expense increased $5 million or 0.3%. The stronger U.S. dollar increased expense growth by $27 million or 1.7 percentage points and the acquisition of BMO Life Assurance added $41 million of expense. These expense increases were partially offset by reductions in revenue-based costs, in line with lower non-interest revenue, and the success of active expense management.
All comparative figures have been reclassified to reflect the third quarter 2009 transfer of BMO’s insurance business to PCG from P&C Canada and the transfer of the term investment business from PCG to P&C Canada.
BMO Capital Markets (BMO CM)
(Canadian $ in millions, except as noted) Q4-2009
Increase (Decrease)
vs. Q4-2008
Increase (Decrease)
vs. Q3-2009 Fiscal-2009
Increase (Decrease)
vs. Fiscal-2008
Net interest income (teb) 338 (24) (7%) (102) (23%) 1,798 591 49%Non-interest revenue 556 196 54% (37) (6%) 1,668 435 35%
Total revenue (teb) 894 172 24% (139) (14%) 3,466 1,026 42%Provision for credit losses 41 11 34% (2) (4%) 170 53 45%Non-interest expense 435 (16) (4%) (81) (16%) 1,875 124 7%
Income before income taxes 418 177 74% (56) (12%) 1,421 849 +100%Income taxes (teb) 129 178 +100% (2) (1%) 361 500 +100%
Net income 289 (1) (1%) (54) (16%) 1,060 349 49%
Amortization of acquisition-related intangible assets (after tax) - - - (1) (3%) 1 - -
Cash net income 289 (1) (1%) (55) (16%) 1,061 349 49%
Trading Products revenue 506 272 +100% (160) (24%) 1,982 965 95%Investment and Corporate Banking and Other revenue 388 (100) (20%) 21 6% 1,484 61 4%Return on equity 20.1% 1.3% (1.7%) 16.4% 5.0%Cash return on equity 20.1% 1.3% (1.7%) 16.4% 4.9%Operating leverage 27.4% nm nm 34.9% nmCash operating leverage 27.4% nm nm 34.9% nmProductivity ratio (teb) 48.6% (13.8%) (1.4%) 54.1% (17.7%)Cash productivity ratio (teb) 48.6% (13.8%) (1.3%) 54.1% (17.6%)Net interest margin on earning assets (teb) 0.81% (0.02%) (0.21%) 1.00% 0.31%Average earning assets 166,151 (7,669) (4%) (4,477) (3%) 179,372 3,292 2%
U.S. Select Financial Data (US$ in millions) Total revenue (teb) 341 7 2% 6 1% 1,505 338 29%Non-interest expense 207 42 26% 31 17% 733 12 2%Net income 70 (29) (30%) (18) (22%) 464 190 69%Average earning assets 60,993 (4,076) (6%) (2,782) (4%) 64,935 (4,476) (6%)
nm – not meaningful
Q4 2009 vs Q4 2008
Net income was $289 million, in line with a year ago. Results in the prior year benefited from a $52 million recovery of prior periods’ income taxes and from proportionately higher tax-exempt income. There was strong revenue growth and relatively modest expense growth over the prior year, which was partially driven by approximately 30 senior level strategic hires. Revenue increased $172 million to $894 million. Lending and underwriting fees increased from the prior year. Overall trading revenues were down as losses recorded in Investment and Corporate Banking and Other offset the trading gains made in Trading Products as noted below. The weaker U.S. dollar decreased revenues by $10 million relative to a year ago. Trading Products revenue more than doubled from $234 million to $506 million. Securities losses related to Apex and charges for other than temporary impairments were significantly reduced from a year ago. Trading revenues for the business increased due to significantly higher interest rate trading revenues. However, this was partially offset by the revenue
decline in our interest-rate-sensitive businesses caused by the maturity of attractive term assets and narrowing of market spreads. There were also reductions in foreign exchange and equity trading revenues as well as lower commission revenue. Investment and Corporate Banking and Other revenue decreased by $100 million to $388 million. Corporate banking revenues have increased significantly as a result of higher lending fees and wider spreads. Equity and debt underwriting fees are also up compared to the prior year, partially offset by lower cash management revenue. The prior year’s results included $133 million of mark-to-market gains on credit default swap (CDS) positions that mitigate the credit exposure in our loan portfolio, compared to $17 million of mark-to-market losses on CDS this quarter, reflective of a more stable credit environment. These mark-to-market adjustments were reflected in trading revenue. Net interest income decreased from the prior year due to reduced revenues in our interest-rate-sensitive businesses, lower net interest income from our cash management business and increased funding costs. The effects of these decreases were partially offset by increased trading net interest income and, to a
BMO Financial Group Fourth Quarter Report 2009 • 25
lesser extent, improved corporate banking net interest income. Net interest margin decreased 2 basis points from the prior year with reductions in interest-rate-sensitive businesses partly offset by higher trading net interest income and increased spreads in corporate lending. No charges in respect of the capital markets environment have been designated as notable items this quarter. The net impact of the following items did not have a significant effect on our results: a charge of $50 million ($34 million after tax) in respect of the credit protection vehicle Apex, half of which was in respect of the one time cost of the hedge put in place in the fourth quarter; a charge of $17 million ($11 million after tax) of trading losses on CDS used to manage the credit exposure on the loan portfolio, and $17 million ($12 million after tax) of charges for other than temporary impairment for assets held in the available for sale portfolio. These items were largely offset by gains on credit valuation adjustments of $61 million ($42 million after tax) and a $24 million gain ($16 million after tax) on assets held that were subject to the agreement referred to as the Montreal Accord. In the prior year, there was a net charge of $14 million ($8 million after tax), comprised of largely offsetting items that related to the capital markets environment. Non-interest expense decreased $16 million or 3.7% due to lower employee compensation costs and decreased information technology costs. The weaker U.S. dollar decreased expenses by $5 million. The group’s cash operating leverage was 27.4%, driven by the increased revenue and decreased expenses.
Q4 2009 vs Q3 2009 Net income decreased $54 million or 16% from the third quarter, which was particularly strong. Revenue was $139 million or 14% lower due to significantly lower trading revenue and decreased corporate banking net interest income. Debt underwriting fees and revenues from our interest-rate-sensitive businesses also decreased. These revenue decreases were partially offset by increases in lending fees and merger and acquisition fees. Non-interest expense was $81 million or 16% lower, primarily due to lower employee compensation costs. Fiscal 2009 vs Fiscal 2008
Net income increased $349 million or 49% to a record $1,060 million, as revenues grew 42% with a comparatively low 7.1% increase in expenses. Revenue increased $1,026 million to $3,466 million. The strong financial performance resulted from our businesses’ ability to capitalize on opportunities presented by high levels of market volatility, while maintaining an appropriate risk-return profile. This year’s results reflected the strength and resilience of our core businesses and the continued benefit of maintaining a diversified portfolio. Revenue growth was largely driven by significantly higher interest rate and equity trading revenue as well as corporate banking revenues. Corporate banking revenue increased significantly from the previous year despite the reduction in lending assets due to improved spreads and higher lending fees. Conditions were mixed for our investment banking businesses. Equity underwriting revenues increased as corporate clients sought to strengthen their balance sheets. In contrast, mergers and acquisition activity decreased due to lower market activity. Commission revenue was also down. Non-interest expense increased $124 million to $1,875 million, primarily due to increased employee costs, consistent with improved business performance, and higher allocated costs. Severance costs of $29 million ($19 million after tax) were comparable with a year earlier. Net income taxes were low in 2008 as results included $134 million of recoveries of prior periods’ income taxes and a higher proportion of tax-exempt income.
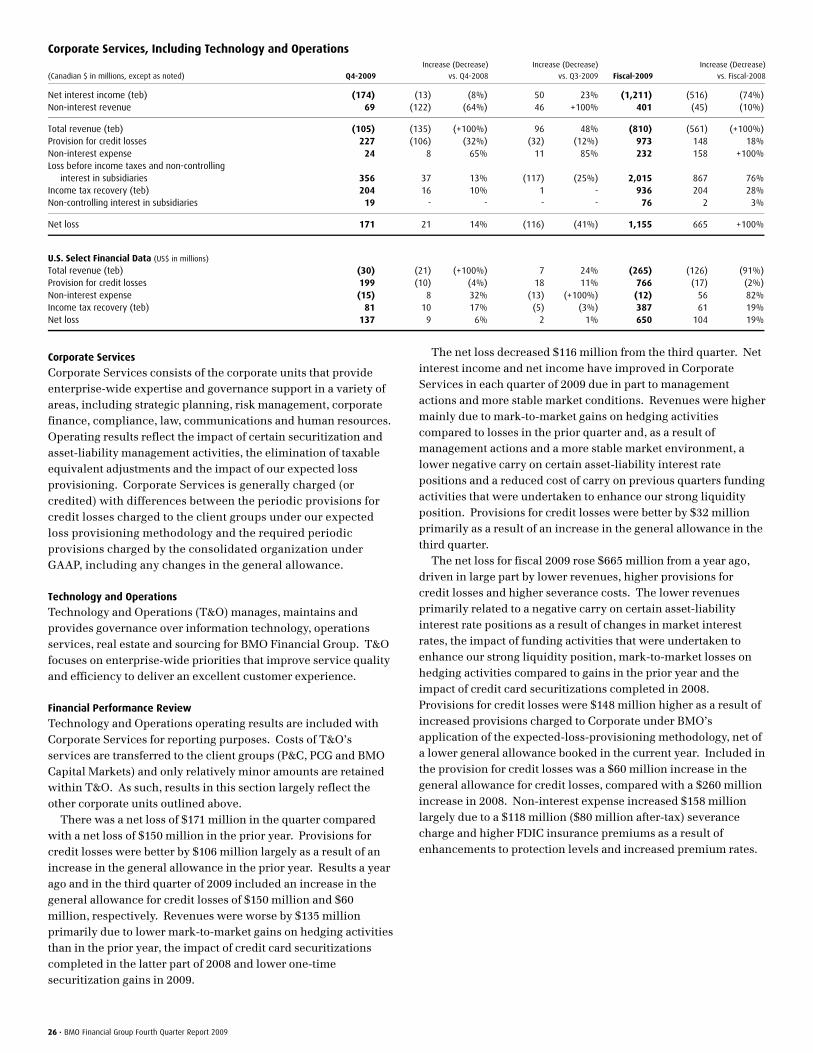
26 • BMO Financial Group Fourth Quarter Report 2009
Corporate Services, Including Technology and Operations
(Canadian $ in millions, except as noted) Q4-2009
Increase (Decrease)
vs. Q4-2008
Increase (Decrease)
vs. Q3-2009 Fiscal-2009
Increase (Decrease)
vs. Fiscal-2008
Net interest income (teb) (174) (13) (8%) 50 23% (1,211) (516) (74%)Non-interest revenue 69 (122) (64%) 46 +100% 401 (45) (10%)
Total revenue (teb) (105) (135) (+100%) 96 48% (810) (561) (+100%)Provision for credit losses 227 (106) (32%) (32) (12%) 973 148 18%Non-interest expense 24 8 65% 11 85% 232 158 +100%Loss before income taxes and non-controlling interest in subsidiaries 356 37 13% (117) (25%) 2,015 867 76%Income tax recovery (teb) 204 16 10% 1 - 936 204 28%Non-controlling interest in subsidiaries 19 - - - - 76 2 3%
Net loss 171 21 14% (116) (41%) 1,155 665 +100%
U.S. Select Financial Data (US$ in millions) Total revenue (teb) (30) (21) (+100%) 7 24% (265) (126) (91%)Provision for credit losses 199 (10) (4%) 18 11% 766 (17) (2%)Non-interest expense (15) 8 32% (13) (+100%) (12) 56 82%Income tax recovery (teb) 81 10 17% (5) (3%) 387 61 19%Net loss 137 9 6% 2 1% 650 104 19%
Corporate Services
Corporate Services consists of the corporate units that provide enterprise-wide expertise and governance support in a variety of areas, including strategic planning, risk management, corporate finance, compliance, law, communications and human resources. Operating results reflect the impact of certain securitization and asset-liability management activities, the elimination of taxable equivalent adjustments and the impact of our expected loss provisioning. Corporate Services is generally charged (or credited) with differences between the periodic provisions for credit losses charged to the client groups under our expected loss provisioning methodology and the required periodic provisions charged by the consolidated organization under GAAP, including any changes in the general allowance. Technology and Operations
Technology and Operations (T&O) manages, maintains and provides governance over information technology, operations services, real estate and sourcing for BMO Financial Group. T&O focuses on enterprise-wide priorities that improve service quality and efficiency to deliver an excellent customer experience. Financial Performance Review
Technology and Operations operating results are included with Corporate Services for reporting purposes. Costs of T&O’s services are transferred to the client groups (P&C, PCG and BMO Capital Markets) and only relatively minor amounts are retained within T&O. As such, results in this section largely reflect the other corporate units outlined above. There was a net loss of $171 million in the quarter compared with a net loss of $150 million in the prior year. Provisions for credit losses were better by $106 million largely as a result of an increase in the general allowance in the prior year. Results a year ago and in the third quarter of 2009 included an increase in the general allowance for credit losses of $150 million and $60 million, respectively. Revenues were worse by $135 million primarily due to lower mark-to-market gains on hedging activities than in the prior year, the impact of credit card securitizations completed in the latter part of 2008 and lower one-time securitization gains in 2009.
The net loss decreased $116 million from the third quarter. Net interest income and net income have improved in Corporate Services in each quarter of 2009 due in part to management actions and more stable market conditions. Revenues were higher mainly due to mark-to-market gains on hedging activities compared to losses in the prior quarter and, as a result of management actions and a more stable market environment, a lower negative carry on certain asset-liability interest rate positions and a reduced cost of carry on previous quarters funding activities that were undertaken to enhance our strong liquidity position. Provisions for credit losses were better by $32 million primarily as a result of an increase in the general allowance in the third quarter. The net loss for fiscal 2009 rose $665 million from a year ago, driven in large part by lower revenues, higher provisions for credit losses and higher severance costs. The lower revenues primarily related to a negative carry on certain asset-liability interest rate positions as a result of changes in market interest rates, the impact of funding activities that were undertaken to enhance our strong liquidity position, mark-to-market losses on hedging activities compared to gains in the prior year and the impact of credit card securitizations completed in 2008. Provisions for credit losses were $148 million higher as a result of increased provisions charged to Corporate under BMO’s application of the expected-loss-provisioning methodology, net of a lower general allowance booked in the current year. Included in the provision for credit losses was a $60 million increase in the general allowance for credit losses, compared with a $260 million increase in 2008. Non-interest expense increased $158 million largely due to a $118 million ($80 million after-tax) severance charge and higher FDIC insurance premiums as a result of enhancements to protection levels and increased premium rates.
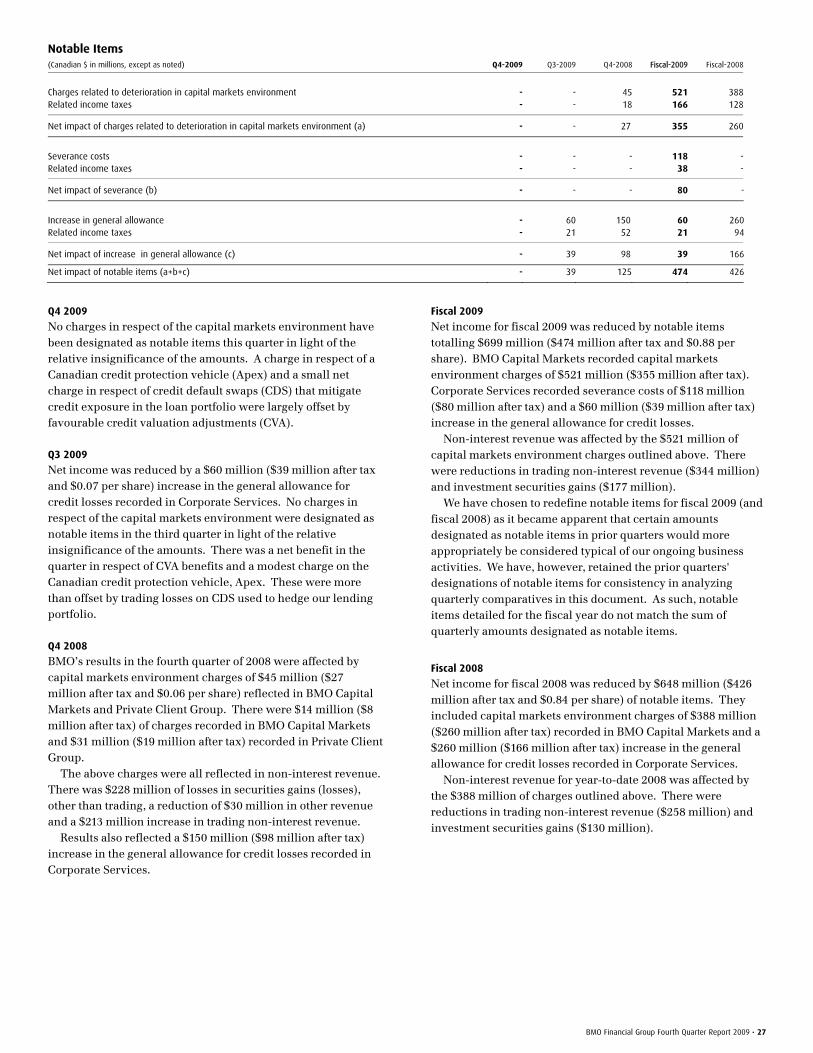
BMO Financial Group Fourth Quarter Report 2009 • 27
Notable Items (Canadian $ in millions, except as noted) Q4-2009 Q3-2009 Q4-2008 Fiscal-2009 Fiscal-2008
Charges related to deterioration in capital markets environment - - 45 521 388Related income taxes - - 18 166 128
Net impact of charges related to deterioration in capital markets environment (a) - - 27 355 260
Severance costs - - - 118 -Related income taxes - - - 38 -
Net impact of severance (b) - - - 80 -
Increase in general allowance - 60 150 60 260Related income taxes - 21 52 21 94
Net impact of increase in general allowance (c) - 39 98 39 166
Net impact of notable items (a+b+c) - 39 125 474 426
Q4 2009
No charges in respect of the capital markets environment have been designated as notable items this quarter in light of the relative insignificance of the amounts. A charge in respect of a Canadian credit protection vehicle (Apex) and a small net charge in respect of credit default swaps (CDS) that mitigate credit exposure in the loan portfolio were largely offset by favourable credit valuation adjustments (CVA). Q3 2009
Net income was reduced by a $60 million ($39 million after tax and $0.07 per share) increase in the general allowance for credit losses recorded in Corporate Services. No charges in respect of the capital markets environment were designated as notable items in the third quarter in light of the relative insignificance of the amounts. There was a net benefit in the quarter in respect of CVA benefits and a modest charge on the Canadian credit protection vehicle, Apex. These were more than offset by trading losses on CDS used to hedge our lending portfolio. Q4 2008
BMO’s results in the fourth quarter of 2008 were affected by capital markets environment charges of $45 million ($27 million after tax and $0.06 per share) reflected in BMO Capital Markets and Private Client Group. There were $14 million ($8 million after tax) of charges recorded in BMO Capital Markets and $31 million ($19 million after tax) recorded in Private Client Group. The above charges were all reflected in non-interest revenue. There was $228 million of losses in securities gains (losses), other than trading, a reduction of $30 million in other revenue and a $213 million increase in trading non-interest revenue. Results also reflected a $150 million ($98 million after tax) increase in the general allowance for credit losses recorded in Corporate Services.
Fiscal 2009
Net income for fiscal 2009 was reduced by notable items totalling $699 million ($474 million after tax and $0.88 per share). BMO Capital Markets recorded capital markets environment charges of $521 million ($355 million after tax). Corporate Services recorded severance costs of $118 million ($80 million after tax) and a $60 million ($39 million after tax) increase in the general allowance for credit losses. Non-interest revenue was affected by the $521 million of capital markets environment charges outlined above. There were reductions in trading non-interest revenue ($344 million) and investment securities gains ($177 million). We have chosen to redefine notable items for fiscal 2009 (and fiscal 2008) as it became apparent that certain amounts designated as notable items in prior quarters would more appropriately be considered typical of our ongoing business activities. We have, however, retained the prior quarters' designations of notable items for consistency in analyzing quarterly comparatives in this document. As such, notable items detailed for the fiscal year do not match the sum of quarterly amounts designated as notable items.
Fiscal 2008
Net income for fiscal 2008 was reduced by $648 million ($426 million after tax and $0.84 per share) of notable items. They included capital markets environment charges of $388 million ($260 million after tax) recorded in BMO Capital Markets and a $260 million ($166 million after tax) increase in the general allowance for credit losses recorded in Corporate Services. Non-interest revenue for year-to-date 2008 was affected by the $388 million of charges outlined above. There were reductions in trading non-interest revenue ($258 million) and investment securities gains ($130 million).
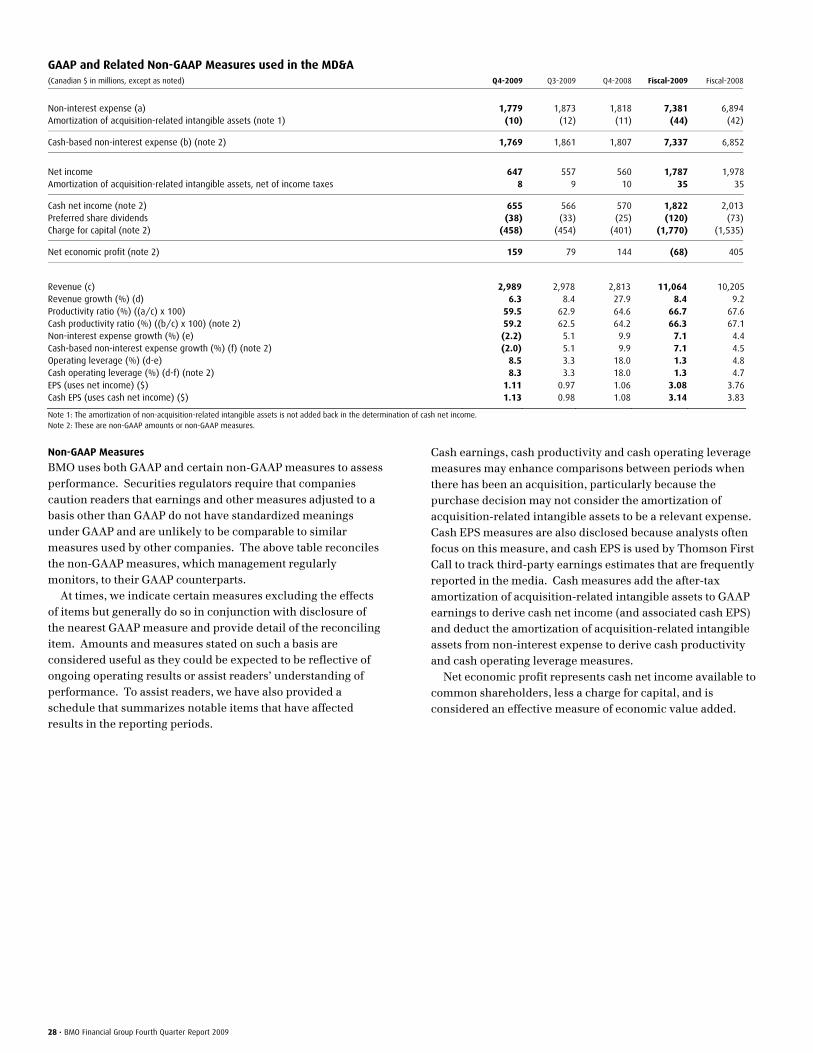
28 • BMO Financial Group Fourth Quarter Report 2009
GAAP and Related Non-GAAP Measures used in the MD&A (Canadian $ in millions, except as noted) Q4-2009 Q3-2009 Q4-2008 Fiscal-2009 Fiscal-2008
Non-interest expense (a) 1,779 1,873 1,818 7,381 6,894Amortization of acquisition-related intangible assets (note 1) (10) (12) (11) (44) (42)
Cash-based non-interest expense (b) (note 2) 1,769 1,861 1,807 7,337 6,852
Net income 647 557 560 1,787 1,978Amortization of acquisition-related intangible assets, net of income taxes 8 9 10 35 35
Cash net income (note 2) 655 566 570 1,822 2,013Preferred share dividends (38) (33) (25) (120) (73)Charge for capital (note 2) (458) (454) (401) (1,770) (1,535)
Net economic profit (note 2) 159 79 144 (68) 405
Revenue (c) 2,989 2,978 2,813 11,064 10,205Revenue growth (%) (d) 6.3 8.4 27.9 8.4 9.2Productivity ratio (%) ((a/c) x 100) 59.5 62.9 64.6 66.7 67.6Cash productivity ratio (%) ((b/c) x 100) (note 2) 59.2 62.5 64.2 66.3 67.1Non-interest expense growth (%) (e) (2.2) 5.1 9.9 7.1 4.4Cash-based non-interest expense growth (%) (f) (note 2) (2.0) 5.1 9.9 7.1 4.5Operating leverage (%) (d-e) 8.5 3.3 18.0 1.3 4.8Cash operating leverage (%) (d-f) (note 2) 8.3 3.3 18.0 1.3 4.7EPS (uses net income) ($) 1.11 0.97 1.06 3.08 3.76Cash EPS (uses cash net income) ($) 1.13 0.98 1.08 3.14 3.83 Note 1: The amortization of non-acquisition-related intangible assets is not added back in the determination of cash net income. Note 2: These are non-GAAP amounts or non-GAAP measures.
Non-GAAP Measures
BMO uses both GAAP and certain non-GAAP measures to assess performance. Securities regulators require that companies caution readers that earnings and other measures adjusted to a basis other than GAAP do not have standardized meanings under GAAP and are unlikely to be comparable to similar measures used by other companies. The above table reconciles the non-GAAP measures, which management regularly monitors, to their GAAP counterparts. At times, we indicate certain measures excluding the effects of items but generally do so in conjunction with disclosure of the nearest GAAP measure and provide detail of the reconciling item. Amounts and measures stated on such a basis are considered useful as they could be expected to be reflective of ongoing operating results or assist readers’ understanding of performance. To assist readers, we have also provided a schedule that summarizes notable items that have affected results in the reporting periods.
Cash earnings, cash productivity and cash operating leverage measures may enhance comparisons between periods when there has been an acquisition, particularly because the purchase decision may not consider the amortization of acquisition-related intangible assets to be a relevant expense. Cash EPS measures are also disclosed because analysts often focus on this measure, and cash EPS is used by Thomson First Call to track third-party earnings estimates that are frequently reported in the media. Cash measures add the after-tax amortization of acquisition-related intangible assets to GAAP earnings to derive cash net income (and associated cash EPS) and deduct the amortization of acquisition-related intangible assets from non-interest expense to derive cash productivity and cash operating leverage measures. Net economic profit represents cash net income available to common shareholders, less a charge for capital, and is considered an effective measure of economic value added.

BMO Financial Group Fourth Quarter Report 2009 • 29
Interim Consolidated Financial Statements
Consolidated Statement of Income
(Unaudited) (Canadian $ in millions, except as noted) For the three months ended For the twelve months ended
October 31, 2009
July 31,
2009
April 30,
2009
January 31,
2009
October 31,
2008
October 31,2009
October 31,
2008
Interest, Dividend and Fee Income Loans $ 1,835 $ 1,920 $ 1,955 $ 2,250 $ 2,554 $ 7,960 $ 10,614 Securities 448 494 665 820 744 2,427 3,191 Deposits with banks 19 23 48 96 182 186 930
2,302 2,437 2,668 3,166 3,480 10,573 14,735
Interest Expense Deposits 672 789 1,097 1,483 1,590 4,041 7,341 Subordinated debt 32 24 30 49 61 135 222 Capital trust securities and preferred shares 20 20 19 21 23 80 91 Other liabilities 136 138 187 286 397 747 2,009
860 971 1,333 1,839 2,071 5,003 9,663
Net Interest Income 1,442 1,466 1,335 1,327 1,409 5,570 5,072 Provision for credit losses (Note 3) 386 417 372 428 465 1,603 1,330
Net Interest Income After Provision for Credit Losses 1,056 1,049 963 899 944 3,967 3,742
Non-Interest Revenue Securities commissions and fees 250 240 235 248 270 973 1,105 Deposit and payment service charges 205 206 204 205 203 820 756 Trading revenues 163 273 63 224 435 723 546 Lending fees 149 140 148 119 120 556 429 Card fees 29 35 33 24 58 121 291 Investment management and custodial fees 87 85 84 88 87 344 339 Mutual fund revenues 128 119 106 114 140 467 589 Securitization revenues 201 202 262 264 167 929 513 Underwriting and advisory fees 116 101 103 77 66 397 353 Securities gains (losses), other than trading 14 (12) (42) (314) (252) (354) (315) Foreign exchange, other than trading 14 1 25 13 (4) 53 80 Insurance income 86 85 64 60 56 295 237 Other 105 37 35 (7) 58 170 210
1,547 1,512 1,320 1,115 1,404 5,494 5,133
Net Interest Income and Non-Interest Revenue 2,603 2,561 2,283 2,014 2,348 9,461 8,875
Non-Interest Expense Employee compensation (Note 9) 1,047 1,122 1,129 1,087 1,007 4,385 3,976 Premises and equipment (Note 2) 302 313 339 327 338 1,281 1,241 Amortization of intangible assets (Note 2) 50 48 54 51 48 203 183 Travel and business development 81 73 73 82 95 309 328 Communications 58 55 57 51 57 221 202 Business and capital taxes (3) 19 13 15 11 44 42 Professional fees 97 91 82 92 113 362 384 Other 147 162 141 136 157 586 546
1,779 1,883 1,888 1,841 1,826 7,391 6,902
Restructuring Reversal (Note 10) - (10) - - (8) (10) (8)
Income Before Provision for (Recovery of) Income Taxes and Non-Controlling Interest in Subsidiaries 824 688 395 173 530 2,080 1,981 Provision for (Recovery of) Income taxes 158 112 18 (71) (49) 217 (71)
666 576 377 244 579 1,863 2,052 Non-controlling interest in subsidiaries 19 19 19 19 19 76 74
Net Income $ 647 $ 557 $ 358 $ 225 $ 560 $ 1,787 $ 1,978
Preferred share dividends $ 38 $ 33 $ 26 $ 23 $ 25 $ 120 $ 73 Net income available to common shareholders $ 609 $ 524 $ 332 $ 202 $ 535 $ 1,667 $ 1,905 Average common shares (in thousands) 550,495 547,134 543,634 520,020 503,004 540,294 502,062 Average diluted common shares (in thousands) 554,151 549,968 544,327 523,808 506,591 542,313 506,697
Earnings Per Share (Canadian $) Basic $ 1.12 $ 0.97 $ 0.61 $ 0.39 $ 1.06 $ 3.09 $ 3.79 Diluted 1.11 0.97 0.61 0.39 1.06 3.08 3.76 Dividends Declared Per Common Share 0.70 0.70 0.70 0.70 0.70 2.80 2.80
The accompanying notes are an integral part of these interim consolidated financial statements. Certain comparative figures have been reclassified to conform with the current period’s presentation.
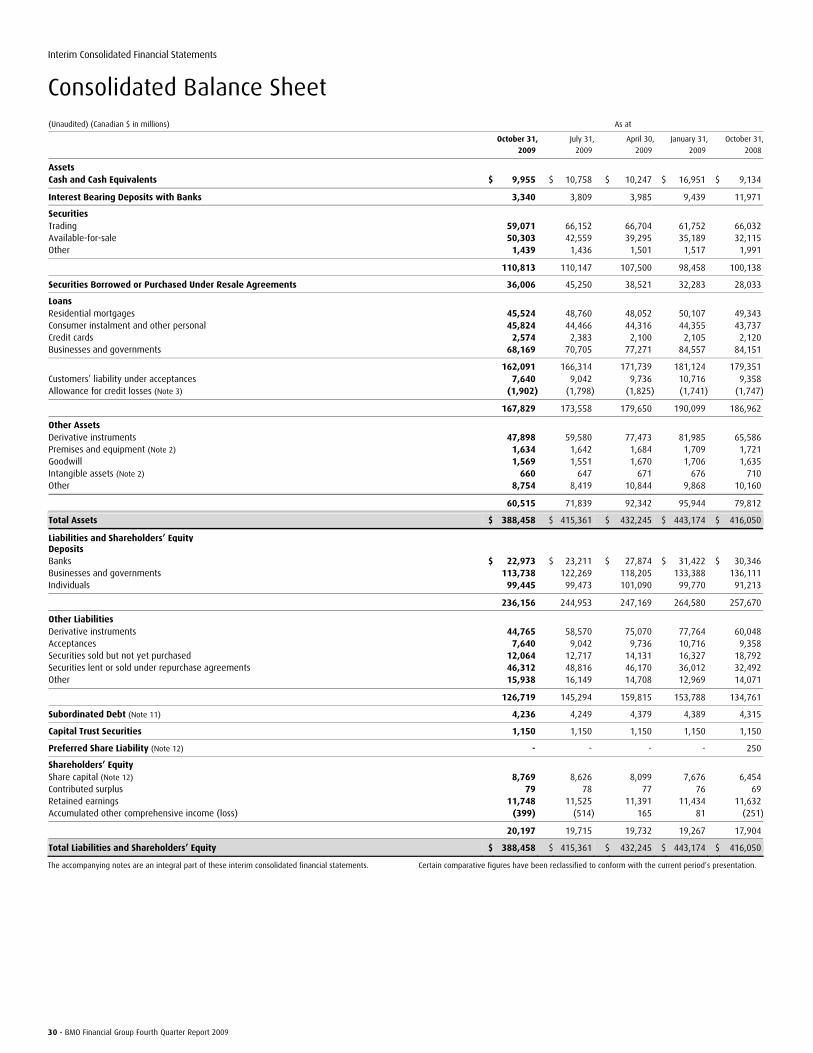
30 • BMO Financial Group Fourth Quarter Report 2009
Interim Consolidated Financial Statements
Consolidated Balance Sheet
(Unaudited) (Canadian $ in millions) As at
October 31, 2009
July 31,
2009
April 30,
2009
January 31,
2009
October 31,
2008
Assets Cash and Cash Equivalents $ 9,955 $ 10,758 $ 10,247 $ 16,951 $ 9,134
Interest Bearing Deposits with Banks 3,340 3,809 3,985 9,439 11,971
Securities Trading 59,071 66,152 66,704 61,752 66,032 Available-for-sale 50,303 42,559 39,295 35,189 32,115 Other 1,439 1,436 1,501 1,517 1,991
110,813 110,147 107,500 98,458 100,138
Securities Borrowed or Purchased Under Resale Agreements 36,006 45,250 38,521 32,283 28,033
Loans Residential mortgages 45,524 48,760 48,052 50,107 49,343 Consumer instalment and other personal 45,824 44,466 44,316 44,355 43,737 Credit cards 2,574 2,383 2,100 2,105 2,120 Businesses and governments 68,169 70,705 77,271 84,557 84,151
162,091 166,314 171,739 181,124 179,351 Customers’ liability under acceptances 7,640 9,042 9,736 10,716 9,358 Allowance for credit losses (Note 3) (1,902) (1,798) (1,825) (1,741) (1,747)
167,829 173,558 179,650 190,099 186,962
Other Assets Derivative instruments 47,898 59,580 77,473 81,985 65,586 Premises and equipment (Note 2) 1,634 1,642 1,684 1,709 1,721 Goodwill 1,569 1,551 1,670 1,706 1,635 Intangible assets (Note 2) 660 647 671 676 710 Other 8,754 8,419 10,844 9,868 10,160
60,515 71,839 92,342 95,944 79,812
Total Assets $ 388,458 $ 415,361 $ 432,245 $ 443,174 $ 416,050
Liabilities and Shareholders’ Equity Deposits Banks $ 22,973 $ 23,211 $ 27,874 $ 31,422 $ 30,346 Businesses and governments 113,738 122,269 118,205 133,388 136,111 Individuals 99,445 99,473 101,090 99,770 91,213
236,156 244,953 247,169 264,580 257,670
Other Liabilities Derivative instruments 44,765 58,570 75,070 77,764 60,048 Acceptances 7,640 9,042 9,736 10,716 9,358 Securities sold but not yet purchased 12,064 12,717 14,131 16,327 18,792 Securities lent or sold under repurchase agreements 46,312 48,816 46,170 36,012 32,492 Other 15,938 16,149 14,708 12,969 14,071
126,719 145,294 159,815 153,788 134,761
Subordinated Debt (Note 11) 4,236 4,249 4,379 4,389 4,315
Capital Trust Securities 1,150 1,150 1,150 1,150 1,150
Preferred Share Liability (Note 12) - - - - 250
Shareholders’ Equity Share capital (Note 12) 8,769 8,626 8,099 7,676 6,454 Contributed surplus 79 78 77 76 69 Retained earnings 11,748 11,525 11,391 11,434 11,632 Accumulated other comprehensive income (loss) (399) (514) 165 81 (251)
20,197 19,715 19,732 19,267 17,904
Total Liabilities and Shareholders’ Equity $ 388,458 $ 415,361 $ 432,245 $ 443,174 $ 416,050
The accompanying notes are an integral part of these interim consolidated financial statements. Certain comparative figures have been reclassified to conform with the current period’s presentation.
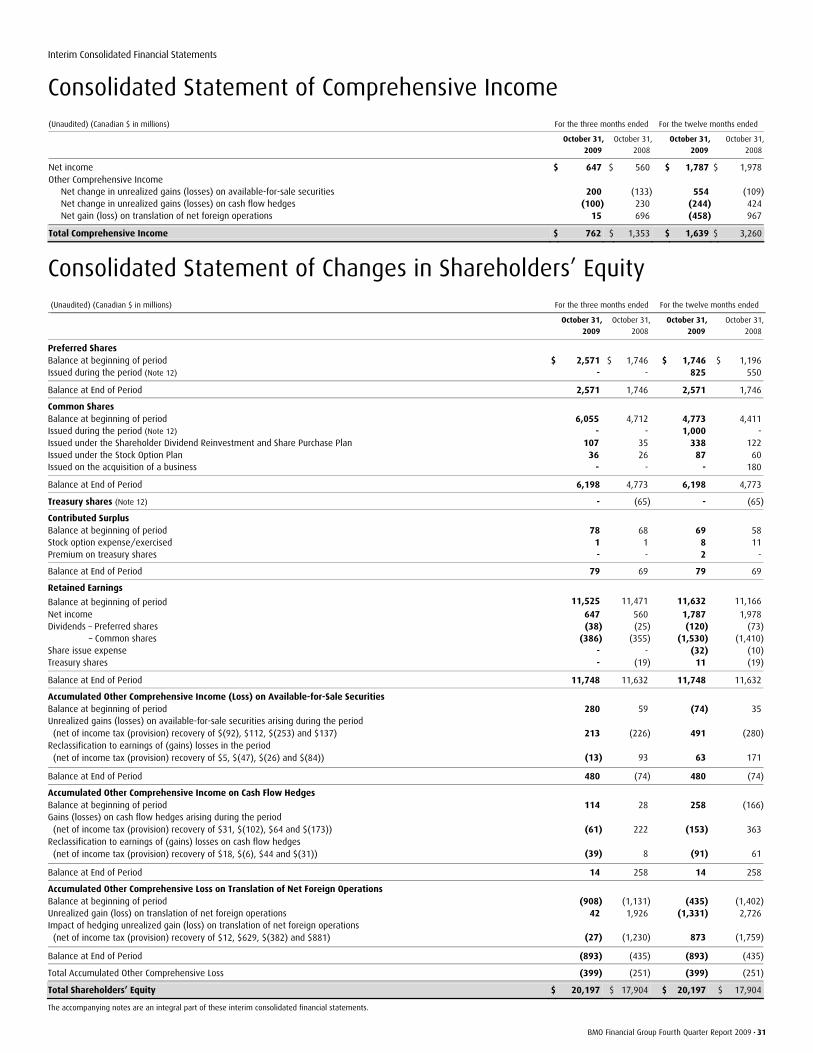
BMO Financial Group Fourth Quarter Report 2009 • 31
Interim Consolidated Financial Statements
Consolidated Statement of Comprehensive Income
(Unaudited) (Canadian $ in millions) For the three months ended For the twelve months ended
October 31, 2009
October 31,
2008
October 31, 2009
October 31,
2008
Net income $ 647 $ 560 $ 1,787 $ 1,978 Other Comprehensive Income Net change in unrealized gains (losses) on available-for-sale securities 200 (133) 554 (109) Net change in unrealized gains (losses) on cash flow hedges (100) 230 (244) 424 Net gain (loss) on translation of net foreign operations 15 696 (458) 967
Total Comprehensive Income $ 762 $ 1,353 $ 1,639 $ 3,260
Consolidated Statement of Changes in Shareholders’ Equity
(Unaudited) (Canadian $ in millions) For the three months ended For the twelve months ended
October 31, 2009
October 31,
2008
October 31, 2009
October 31,
2008
Preferred Shares Balance at beginning of period $ 2,571 $ 1,746 $ 1,746 $ 1,196 Issued during the period (Note 12) - - 825 550
Balance at End of Period 2,571 1,746 2,571 1,746
Common Shares Balance at beginning of period 6,055 4,712 4,773 4,411 Issued during the period (Note 12) - - 1,000 - Issued under the Shareholder Dividend Reinvestment and Share Purchase Plan 107 35 338 122 Issued under the Stock Option Plan 36 26 87 60 Issued on the acquisition of a business - - - 180
Balance at End of Period 6,198 4,773 6,198 4,773
Treasury shares (Note 12) - (65) - (65)
Contributed Surplus Balance at beginning of period 78 68 69 58 Stock option expense/exercised 1 1 8 11 Premium on treasury shares - - 2 -
Balance at End of Period 79 69 79 69
Retained Earnings
Balance at beginning of period 11,525 11,471 11,632 11,166
Net income 647 560 1,787 1,978 Dividends – Preferred shares (38) (25) (120) (73) – Common shares (386) (355) (1,530) (1,410)Share issue expense - - (32) (10)Treasury shares - (19) 11 (19)
Balance at End of Period 11,748 11,632 11,748 11,632
Accumulated Other Comprehensive Income (Loss) on Available-for-Sale Securities Balance at beginning of period 280 59 (74) 35 Unrealized gains (losses) on available-for-sale securities arising during the period (net of income tax (provision) recovery of $(92), $112, $(253) and $137) 213 (226) 491 (280)Reclassification to earnings of (gains) losses in the period (net of income tax (provision) recovery of $5, $(47), $(26) and $(84)) (13) 93 63 171
Balance at End of Period 480 (74) 480 (74)
Accumulated Other Comprehensive Income on Cash Flow Hedges Balance at beginning of period 114 28 258 (166)Gains (losses) on cash flow hedges arising during the period (net of income tax (provision) recovery of $31, $(102), $64 and $(173)) (61) 222 (153) 363 Reclassification to earnings of (gains) losses on cash flow hedges (net of income tax (provision) recovery of $18, $(6), $44 and $(31)) (39) 8 (91) 61
Balance at End of Period 14 258 14 258
Accumulated Other Comprehensive Loss on Translation of Net Foreign Operations Balance at beginning of period (908) (1,131) (435) (1,402)Unrealized gain (loss) on translation of net foreign operations 42 1,926 (1,331) 2,726 Impact of hedging unrealized gain (loss) on translation of net foreign operations (net of income tax (provision) recovery of $12, $629, $(382) and $881) (27) (1,230) 873 (1,759)
Balance at End of Period (893) (435) (893) (435)
Total Accumulated Other Comprehensive Loss (399) (251) (399) (251)
Total Shareholders’ Equity $ 20,197 $ 17,904 $ 20,197 $ 17,904
The accompanying notes are an integral part of these interim consolidated financial statements.
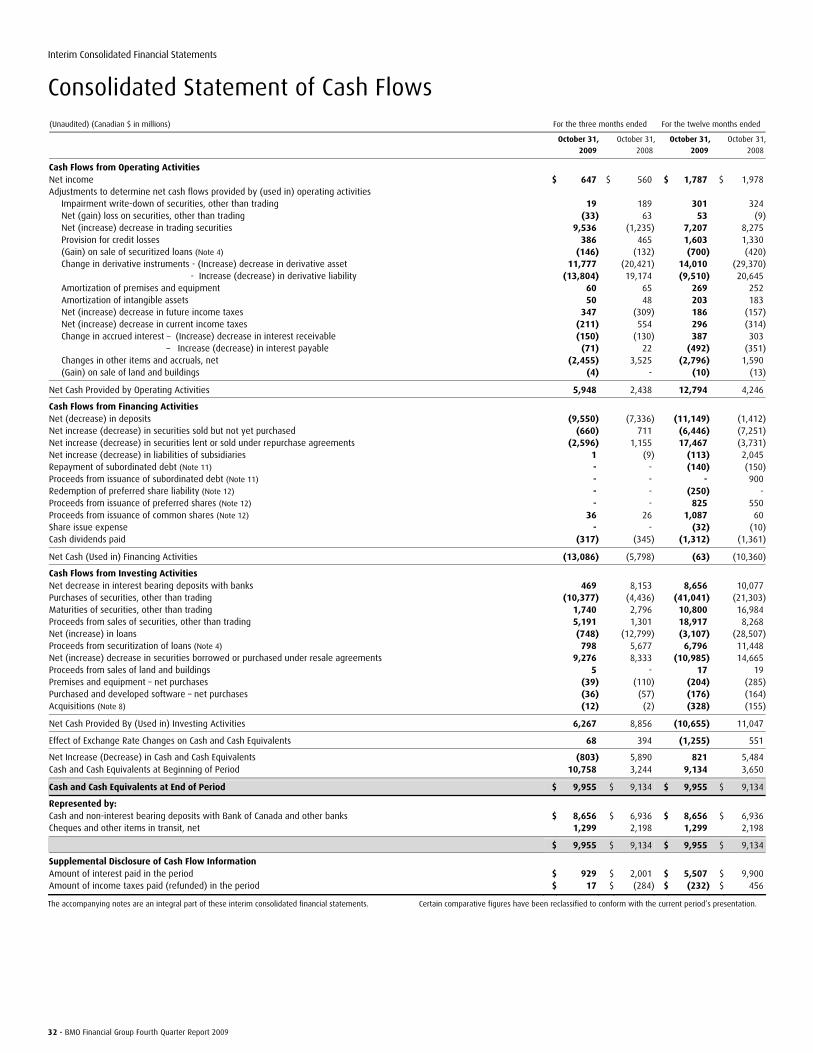
32 • BMO Financial Group Fourth Quarter Report 2009
Interim Consolidated Financial Statements
Consolidated Statement of Cash Flows
(Unaudited) (Canadian $ in millions) For the three months ended For the twelve months ended
October 31, 2009
October 31,
2008
October 31, 2009
October 31,
2008
Cash Flows from Operating Activities Net income $ 647 $ 560 $ 1,787 $ 1,978 Adjustments to determine net cash flows provided by (used in) operating activities Impairment write-down of securities, other than trading 19 189 301 324 Net (gain) loss on securities, other than trading (33) 63 53 (9) Net (increase) decrease in trading securities 9,536 (1,235) 7,207 8,275 Provision for credit losses 386 465 1,603 1,330 (Gain) on sale of securitized loans (Note 4) (146) (132) (700) (420) Change in derivative instruments - (Increase) decrease in derivative asset 11,777 (20,421) 14,010 (29,370) - Increase (decrease) in derivative liability (13,804) 19,174 (9,510) 20,645 Amortization of premises and equipment 60 65 269 252 Amortization of intangible assets 50 48 203 183 Net (increase) decrease in future income taxes 347 (309) 186 (157) Net (increase) decrease in current income taxes (211) 554 296 (314) Change in accrued interest – (Increase) decrease in interest receivable (150) (130) 387 303 – Increase (decrease) in interest payable (71) 22 (492) (351) Changes in other items and accruals, net (2,455) 3,525 (2,796) 1,590 (Gain) on sale of land and buildings (4) - (10) (13)
Net Cash Provided by Operating Activities 5,948 2,438 12,794 4,246
Cash Flows from Financing Activities Net (decrease) in deposits (9,550) (7,336) (11,149) (1,412)Net increase (decrease) in securities sold but not yet purchased (660) 711 (6,446) (7,251)Net increase (decrease) in securities lent or sold under repurchase agreements (2,596) 1,155 17,467 (3,731)Net increase (decrease) in liabilities of subsidiaries 1 (9) (113) 2,045 Repayment of subordinated debt (Note 11) - - (140) (150)Proceeds from issuance of subordinated debt (Note 11) - - - 900 Redemption of preferred share liability (Note 12) - - (250) - Proceeds from issuance of preferred shares (Note 12) - - 825 550 Proceeds from issuance of common shares (Note 12) 36 26 1,087 60 Share issue expense - - (32) (10)Cash dividends paid (317) (345) (1,312) (1,361)
Net Cash (Used in) Financing Activities (13,086) (5,798) (63) (10,360)
Cash Flows from Investing Activities Net decrease in interest bearing deposits with banks 469 8,153 8,656 10,077 Purchases of securities, other than trading (10,377) (4,436) (41,041) (21,303)Maturities of securities, other than trading 1,740 2,796 10,800 16,984 Proceeds from sales of securities, other than trading 5,191 1,301 18,917 8,268 Net (increase) in loans (748) (12,799) (3,107) (28,507)Proceeds from securitization of loans (Note 4) 798 5,677 6,796 11,448 Net (increase) decrease in securities borrowed or purchased under resale agreements 9,276 8,333 (10,985) 14,665 Proceeds from sales of land and buildings 5 - 17 19 Premises and equipment – net purchases (39) (110) (204) (285)Purchased and developed software – net purchases (36) (57) (176) (164)Acquisitions (Note 8) (12) (2) (328) (155)
Net Cash Provided By (Used in) Investing Activities 6,267 8,856 (10,655) 11,047
Effect of Exchange Rate Changes on Cash and Cash Equivalents 68 394 (1,255) 551
Net Increase (Decrease) in Cash and Cash Equivalents (803) 5,890 821 5,484 Cash and Cash Equivalents at Beginning of Period 10,758 3,244 9,134 3,650
Cash and Cash Equivalents at End of Period $ 9,955 $ 9,134 $ 9,955 $ 9,134
Represented by: Cash and non-interest bearing deposits with Bank of Canada and other banks $ 8,656 $ 6,936 $ 8,656 $ 6,936 Cheques and other items in transit, net 1,299 2,198 1,299 2,198
$ 9,955 $ 9,134 $ 9,955 $ 9,134
Supplemental Disclosure of Cash Flow Information Amount of interest paid in the period $ 929 $ 2,001 $ 5,507 $ 9,900 Amount of income taxes paid (refunded) in the period $ 17 $ (284) $ (232) $ 456
The accompanying notes are an integral part of these interim consolidated financial statements. Certain comparative figures have been reclassified to conform with the current period’s presentation.
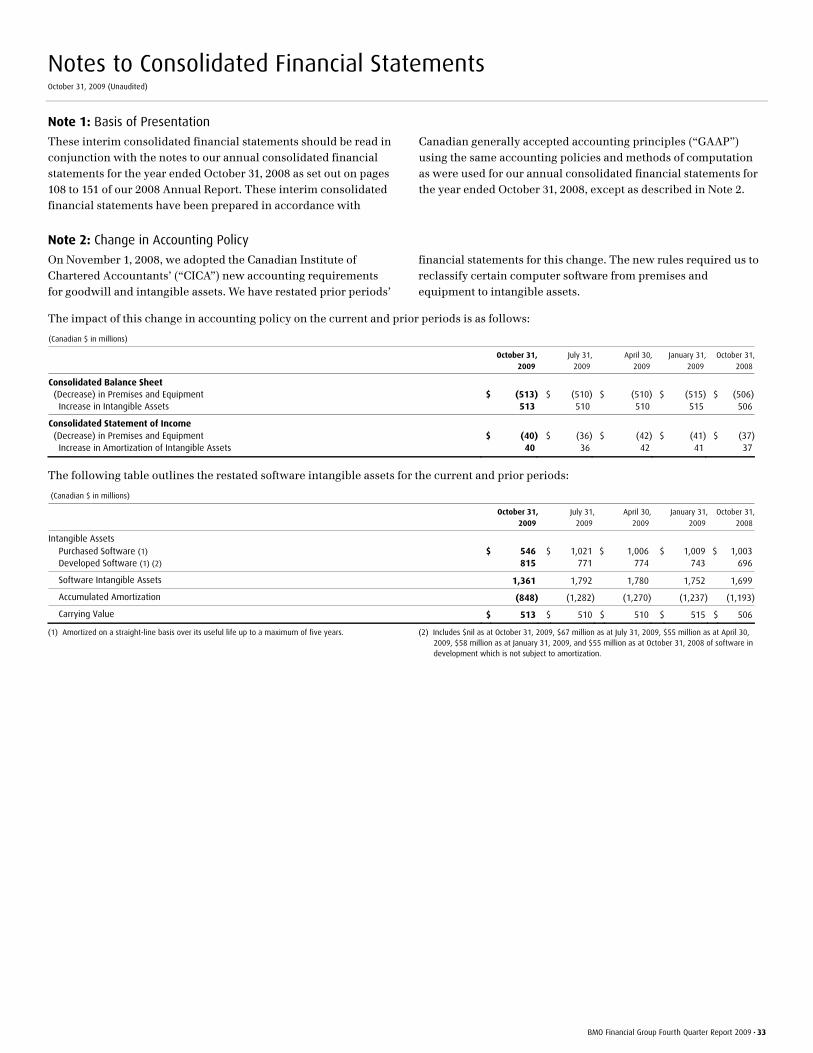
BMO Financial Group Fourth Quarter Report 2009 • 33
Notes to Consolidated Financial Statements October 31, 2009 (Unaudited)
Note 1: Basis of Presentation
These interim consolidated financial statements should be read in conjunction with the notes to our annual consolidated financial statements for the year ended October 31, 2008 as set out on pages 108 to 151 of our 2008 Annual Report. These interim consolidated financial statements have been prepared in accordance with
Canadian generally accepted accounting principles (“GAAP”) using the same accounting policies and methods of computation as were used for our annual consolidated financial statements for the year ended October 31, 2008, except as described in Note 2.
Note 2: Change in Accounting Policy
On November 1, 2008, we adopted the Canadian Institute of Chartered Accountants’ (“CICA”) new accounting requirements for goodwill and intangible assets. We have restated prior periods’
financial statements for this change. The new rules required us to reclassify certain computer software from premises and equipment to intangible assets.
The impact of this change in accounting policy on the current and prior periods is as follows:
(Canadian $ in millions)
October 31, 2009
July 31,
2009 April 30,
2009
January 31,
2009
October 31,
2008
Consolidated Balance Sheet (Decrease) in Premises and Equipment $ (513) $ (510) $ (510) $ (515) $ (506) Increase in Intangible Assets
513 510 510 515 506
Consolidated Statement of Income (Decrease) in Premises and Equipment $ (40) $ (36) $ (42) $ (41) $ (37) Increase in Amortization of Intangible Assets
40 36 42 41 37
The following table outlines the restated software intangible assets for the current and prior periods:
(Canadian $ in millions)
October 31, 2009
July 31,
2009 April 30,
2009
January 31,
2009
October 31,
2008
Intangible Assets Purchased Software (1) $ 546 $ 1,021 $ 1,006 $ 1,009 $ 1,003 Developed Software (1) (2)
815 771 774 743 696
Software Intangible Assets 1,361 1,792 1,780 1,752 1,699
Accumulated Amortization (848) (1,282) (1,270) (1,237) (1,193)
Carrying Value $ 513 $ 510 $ 510 $ 515 $ 506
(1) Amortized on a straight-line basis over its useful life up to a maximum of five years. (2) Includes $nil as at October 31, 2009, $67 million as at July 31, 2009, $55 million as at April 30, 2009, $58 million as at January 31, 2009, and $55 million as at October 31, 2008 of software in development which is not subject to amortization.
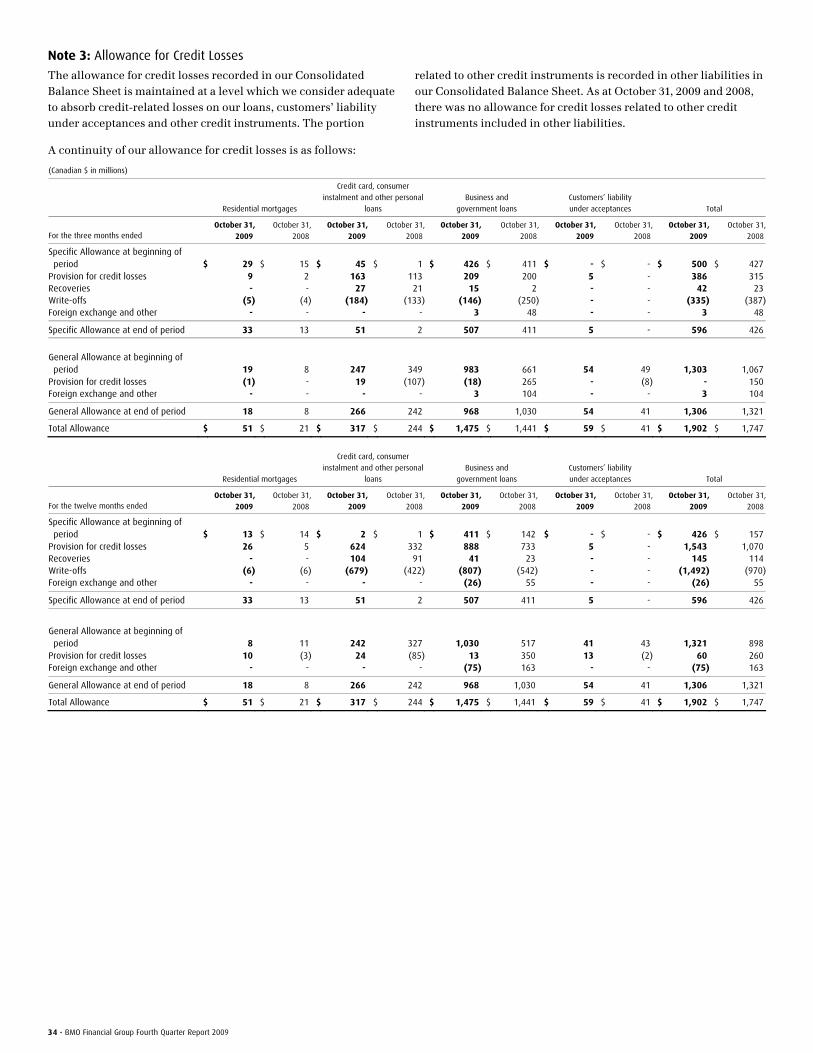
34 • BMO Financial Group Fourth Quarter Report 2009
Note 3: Allowance for Credit Losses
The allowance for credit losses recorded in our Consolidated Balance Sheet is maintained at a level which we consider adequate to absorb credit-related losses on our loans, customers’ liability under acceptances and other credit instruments. The portion
related to other credit instruments is recorded in other liabilities in our Consolidated Balance Sheet. As at October 31, 2009 and 2008, there was no allowance for credit losses related to other credit instruments included in other liabilities.
A continuity of our allowance for credit losses is as follows:
(Canadian $ in millions)
Residential mortgages
Credit card, consumer
instalment and other personal
loans
Business and
government loans
Customers’ liability
under acceptances Total
For the three months ended October 31,
2009
October 31,
2008
October 31, 2009
October 31,
2008
October 31, 2009
October 31,
2008
October 31, 2009
October 31,
2008
October 31, 2009
October 31,
2008
Specific Allowance at beginning of period $ 29 $ 15 $ 45 $ 1 $ 426 $ 411 $ - $ - $ 500 $ 427 Provision for credit losses 9 2 163 113 209 200 5 - 386 315 Recoveries - - 27 21 15 2 - - 42 23 Write-offs (5) (4) (184) (133) (146) (250) - - (335) (387)Foreign exchange and other - - - - 3 48 - - 3 48
Specific Allowance at end of period 33 13 51 2 507 411 5 - 596 426
General Allowance at beginning of period 19 8 247 349 983 661 54 49 1,303 1,067 Provision for credit losses (1) - 19 (107) (18) 265 - (8) - 150 Foreign exchange and other - - - - 3 104 - - 3 104
General Allowance at end of period 18 8 266 242 968 1,030 54 41 1,306 1,321
Total Allowance $ 51 $ 21 $ 317 $ 244 $ 1,475 $ 1,441 $ 59 $ 41 $ 1,902 $ 1,747
Residential mortgages
Credit card, consumer
instalment and other personal
loans
Business and
government loans
Customers’ liability
under acceptances Total
For the twelve months ended October 31,
2009
October 31,
2008
October 31, 2009
October 31,
2008
October 31, 2009
October 31,
2008
October 31, 2009
October 31,
2008
October 31, 2009
October 31,
2008
Specific Allowance at beginning of period $ 13 $ 14 $ 2 $ 1 $ 411 $ 142 $ - $ - $ 426 $ 157 Provision for credit losses 26 5 624 332 888 733 5 - 1,543 1,070 Recoveries - - 104 91 41 23 - - 145 114 Write-offs (6) (6) (679) (422) (807) (542) - - (1,492) (970)Foreign exchange and other - - - - (26) 55 - - (26) 55
Specific Allowance at end of period 33 13 51 2 507 411 5 - 596 426
General Allowance at beginning of period 8 11 242 327 1,030 517 41 43 1,321 898 Provision for credit losses 10 (3) 24 (85) 13 350 13 (2) 60 260 Foreign exchange and other - - - - (75) 163 - - (75) 163
General Allowance at end of period 18 8 266 242 968 1,030 54 41 1,306 1,321
Total Allowance $ 51 $ 21 $ 317 $ 244 $ 1,475 $ 1,441 $ 59 $ 41 $ 1,902 $ 1,747
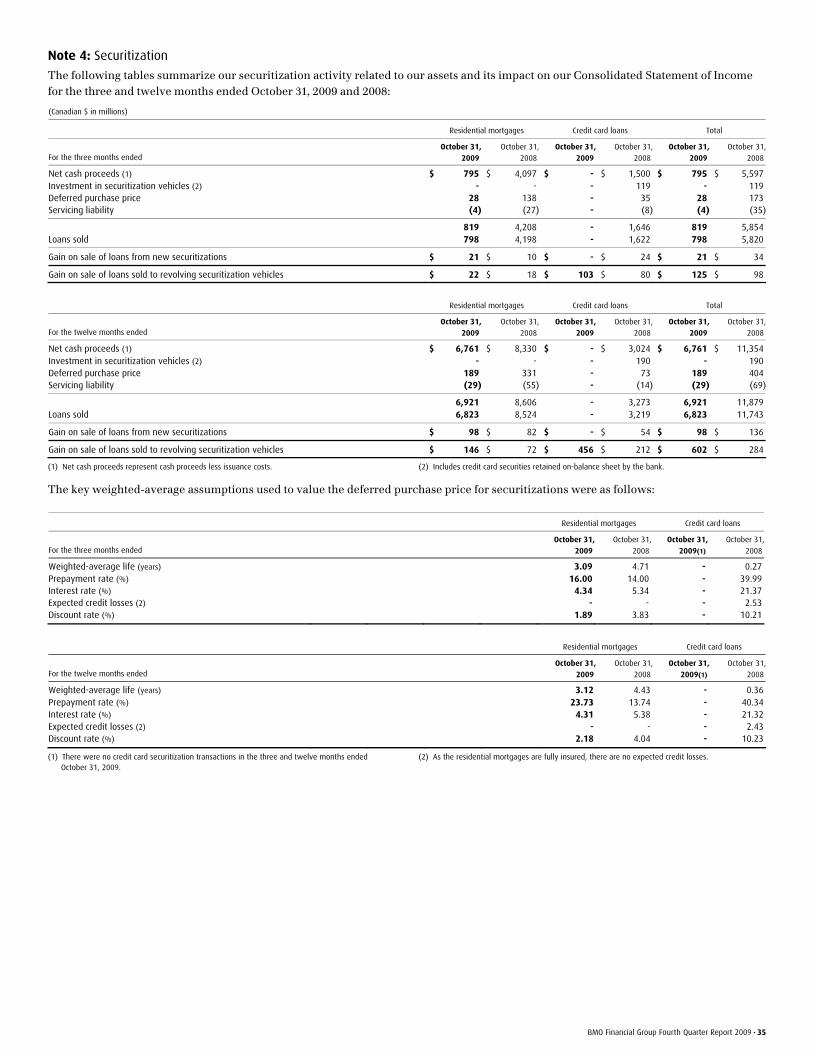
BMO Financial Group Fourth Quarter Report 2009 • 35
Note 4: Securitization
The following tables summarize our securitization activity related to our assets and its impact on our Consolidated Statement of Income for the three and twelve months ended October 31, 2009 and 2008:
(Canadian $ in millions)
Residential mortgages Credit card loans Total
For the three months ended October 31,
2009
October 31,
2008
October 31, 2009
October 31,
2008
October 31, 2009
October 31,
2008
Net cash proceeds (1) $ 795 $ 4,097 $ - $ 1,500 $ 795 $ 5,597 Investment in securitization vehicles (2) - - - 119 - 119 Deferred purchase price 28 138 - 35 28 173 Servicing liability (4) (27) - (8) (4) (35)
819 4,208 - 1,646 819 5,854 Loans sold 798 4,198 - 1,622 798 5,820
Gain on sale of loans from new securitizations $ 21 $ 10 $ - $ 24 $ 21 $ 34
Gain on sale of loans sold to revolving securitization vehicles $ 22 $ 18 $ 103 $ 80 $ 125 $ 98
Residential mortgages Credit card loans Total
For the twelve months ended October 31,
2009
October 31,
2008
October 31, 2009
October 31,
2008
October 31, 2009
October 31,
2008
Net cash proceeds (1) $ 6,761 $ 8,330 $ - $ 3,024 $ 6,761 $ 11,354 Investment in securitization vehicles (2) - - - 190 - 190 Deferred purchase price 189 331 - 73 189 404 Servicing liability (29) (55) - (14) (29) (69)
6,921 8,606 - 3,273 6,921 11,879 Loans sold 6,823 8,524 - 3,219 6,823 11,743
Gain on sale of loans from new securitizations $ 98 $ 82 $ - $ 54 $ 98 $ 136
Gain on sale of loans sold to revolving securitization vehicles $ 146 $ 72 $ 456 $ 212 $ 602 $ 284
(1) Net cash proceeds represent cash proceeds less issuance costs. (2) Includes credit card securities retained on-balance sheet by the bank.
The key weighted-average assumptions used to value the deferred purchase price for securitizations were as follows:
Residential mortgages Credit card loans
For the three months ended October 31,
2009
October 31,
2008
October 31, 2009(1)
October 31,
2008
Weighted-average life (years) 3.09 4.71 - 0.27 Prepayment rate (%) 16.00 14.00 - 39.99 Interest rate (%) 4.34 5.34 - 21.37 Expected credit losses (2) - - - 2.53 Discount rate (%) 1.89 3.83 - 10.21
Residential mortgages Credit card loans
For the twelve months ended October 31,
2009
October 31,
2008
October 31, 2009(1)
October 31,
2008
Weighted-average life (years) 3.12 4.43 - 0.36 Prepayment rate (%) 23.73 13.74 - 40.34 Interest rate (%) 4.31 5.38 - 21.32 Expected credit losses (2) - - - 2.43 Discount rate (%) 2.18 4.04 - 10.23
(1) There were no credit card securitization transactions in the three and twelve months ended October 31, 2009.
(2) As the residential mortgages are fully insured, there are no expected credit losses.
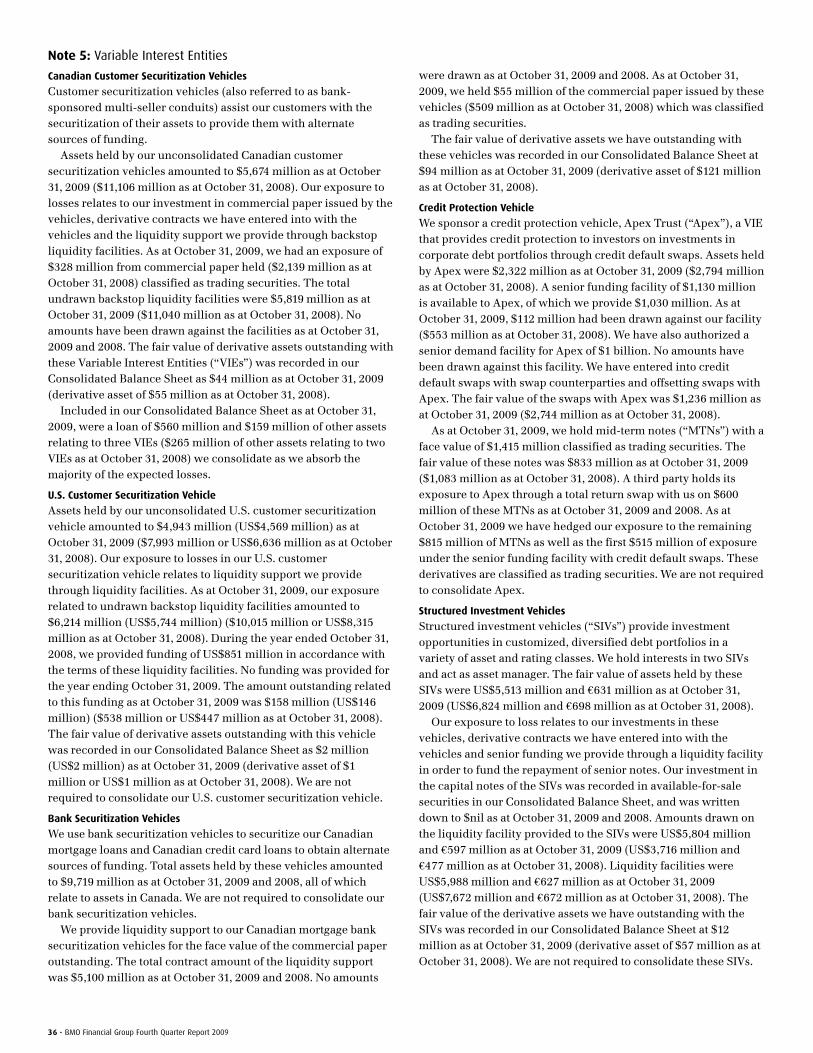
36 • BMO Financial Group Fourth Quarter Report 2009
Note 5: Variable Interest Entities
Canadian Customer Securitization Vehicles
Customer securitization vehicles (also referred to as bank-sponsored multi-seller conduits) assist our customers with the securitization of their assets to provide them with alternate sources of funding. Assets held by our unconsolidated Canadian customer securitization vehicles amounted to $5,674 million as at October 31, 2009 ($11,106 million as at October 31, 2008). Our exposure to losses relates to our investment in commercial paper issued by the vehicles, derivative contracts we have entered into with the vehicles and the liquidity support we provide through backstop liquidity facilities. As at October 31, 2009, we had an exposure of $328 million from commercial paper held ($2,139 million as at October 31, 2008) classified as trading securities. The total undrawn backstop liquidity facilities were $5,819 million as at October 31, 2009 ($11,040 million as at October 31, 2008). No amounts have been drawn against the facilities as at October 31, 2009 and 2008. The fair value of derivative assets outstanding with these Variable Interest Entities (“VIEs”) was recorded in our Consolidated Balance Sheet as $44 million as at October 31, 2009 (derivative asset of $55 million as at October 31, 2008). Included in our Consolidated Balance Sheet as at October 31, 2009, were a loan of $560 million and $159 million of other assets relating to three VIEs ($265 million of other assets relating to two VIEs as at October 31, 2008) we consolidate as we absorb the majority of the expected losses.
U.S. Customer Securitization Vehicle
Assets held by our unconsolidated U.S. customer securitization vehicle amounted to $4,943 million (US$4,569 million) as at October 31, 2009 ($7,993 million or US$6,636 million as at October 31, 2008). Our exposure to losses in our U.S. customer securitization vehicle relates to liquidity support we provide through liquidity facilities. As at October 31, 2009, our exposure related to undrawn backstop liquidity facilities amounted to $6,214 million (US$5,744 million) ($10,015 million or US$8,315 million as at October 31, 2008). During the year ended October 31, 2008, we provided funding of US$851 million in accordance with the terms of these liquidity facilities. No funding was provided for the year ending October 31, 2009. The amount outstanding related to this funding as at October 31, 2009 was $158 million (US$146 million) ($538 million or US$447 million as at October 31, 2008). The fair value of derivative assets outstanding with this vehicle was recorded in our Consolidated Balance Sheet as $2 million (US$2 million) as at October 31, 2009 (derivative asset of $1 million or US$1 million as at October 31, 2008). We are not required to consolidate our U.S. customer securitization vehicle.
Bank Securitization Vehicles
We use bank securitization vehicles to securitize our Canadian mortgage loans and Canadian credit card loans to obtain alternate sources of funding. Total assets held by these vehicles amounted to $9,719 million as at October 31, 2009 and 2008, all of which relate to assets in Canada. We are not required to consolidate our bank securitization vehicles. We provide liquidity support to our Canadian mortgage bank securitization vehicles for the face value of the commercial paper outstanding. The total contract amount of the liquidity support was $5,100 million as at October 31, 2009 and 2008. No amounts
were drawn as at October 31, 2009 and 2008. As at October 31, 2009, we held $55 million of the commercial paper issued by these vehicles ($509 million as at October 31, 2008) which was classified as trading securities. The fair value of derivative assets we have outstanding with these vehicles was recorded in our Consolidated Balance Sheet at $94 million as at October 31, 2009 (derivative asset of $121 million as at October 31, 2008).
Credit Protection Vehicle
We sponsor a credit protection vehicle, Apex Trust (“Apex”), a VIE that provides credit protection to investors on investments in corporate debt portfolios through credit default swaps. Assets held by Apex were $2,322 million as at October 31, 2009 ($2,794 million as at October 31, 2008). A senior funding facility of $1,130 million is available to Apex, of which we provide $1,030 million. As at October 31, 2009, $112 million had been drawn against our facility ($553 million as at October 31, 2008). We have also authorized a senior demand facility for Apex of $1 billion. No amounts have been drawn against this facility. We have entered into credit default swaps with swap counterparties and offsetting swaps with Apex. The fair value of the swaps with Apex was $1,236 million as at October 31, 2009 ($2,744 million as at October 31, 2008). As at October 31, 2009, we hold mid-term notes (“MTNs”) with a face value of $1,415 million classified as trading securities. The fair value of these notes was $833 million as at October 31, 2009 ($1,083 million as at October 31, 2008). A third party holds its exposure to Apex through a total return swap with us on $600 million of these MTNs as at October 31, 2009 and 2008. As at October 31, 2009 we have hedged our exposure to the remaining $815 million of MTNs as well as the first $515 million of exposure under the senior funding facility with credit default swaps. These derivatives are classified as trading securities. We are not required to consolidate Apex.
Structured Investment Vehicles
Structured investment vehicles (“SIVs”) provide investment opportunities in customized, diversified debt portfolios in a variety of asset and rating classes. We hold interests in two SIVs and act as asset manager. The fair value of assets held by these SIVs were US$5,513 million and €631 million as at October 31, 2009 (US$6,824 million and €698 million as at October 31, 2008). Our exposure to loss relates to our investments in these vehicles, derivative contracts we have entered into with the vehicles and senior funding we provide through a liquidity facility in order to fund the repayment of senior notes. Our investment in the capital notes of the SIVs was recorded in available-for-sale securities in our Consolidated Balance Sheet, and was written down to $nil as at October 31, 2009 and 2008. Amounts drawn on the liquidity facility provided to the SIVs were US$5,804 million and €597 million as at October 31, 2009 (US$3,716 million and €477 million as at October 31, 2008). Liquidity facilities were US$5,988 million and €627 million as at October 31, 2009 (US$7,672 million and €672 million as at October 31, 2008). The fair value of the derivative assets we have outstanding with the SIVs was recorded in our Consolidated Balance Sheet at $12 million as at October 31, 2009 (derivative asset of $57 million as at October 31, 2008). We are not required to consolidate these SIVs.
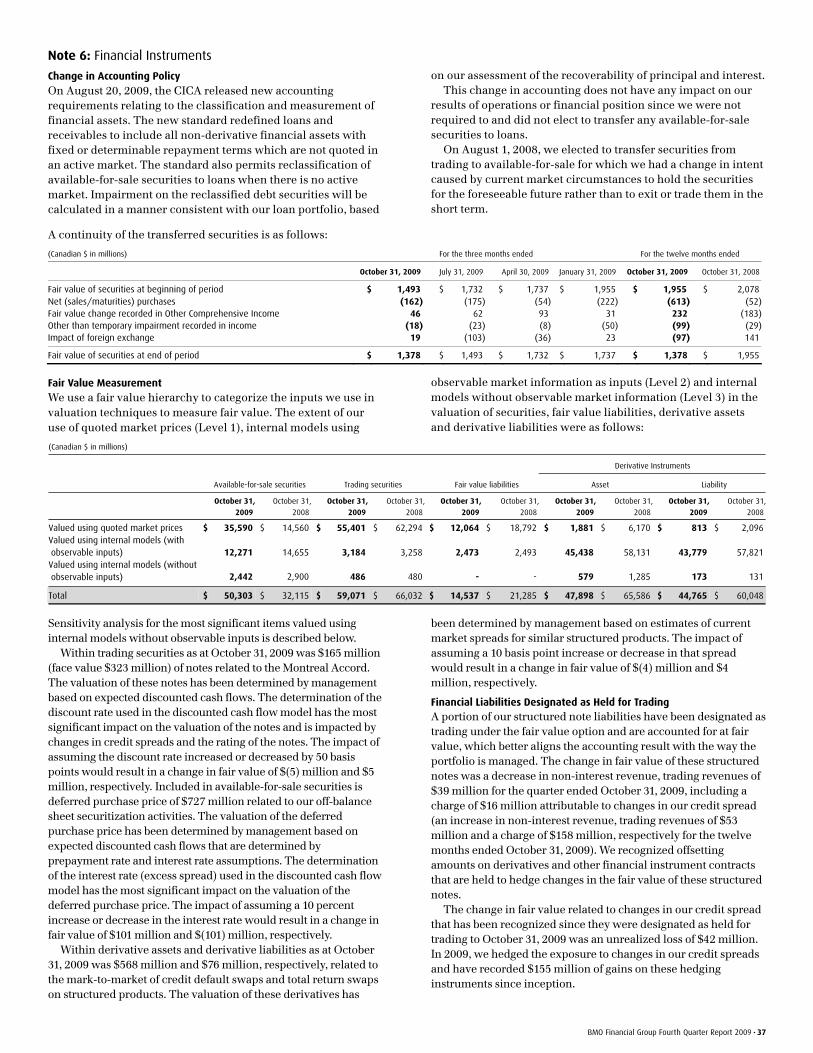
BMO Financial Group Fourth Quarter Report 2009 • 37
Note 6: Financial Instruments
Change in Accounting Policy On August 20, 2009, the CICA released new accounting requirements relating to the classification and measurement of financial assets. The new standard redefined loans and receivables to include all non-derivative financial assets with fixed or determinable repayment terms which are not quoted in an active market. The standard also permits reclassification of available-for-sale securities to loans when there is no active market. Impairment on the reclassified debt securities will be calculated in a manner consistent with our loan portfolio, based
on our assessment of the recoverability of principal and interest. This change in accounting does not have any impact on our results of operations or financial position since we were not required to and did not elect to transfer any available-for-sale securities to loans. On August 1, 2008, we elected to transfer securities from trading to available-for-sale for which we had a change in intent caused by current market circumstances to hold the securities for the foreseeable future rather than to exit or trade them in the short term.
A continuity of the transferred securities is as follows:
(Canadian $ in millions) For the three months ended For the twelve months ended
October 31, 2009 July 31, 2009 April 30, 2009 January 31, 2009 October 31, 2009 October 31, 2008
Fair value of securities at beginning of period $ 1,493 $ 1,732 $ 1,737 $ 1,955 $ 1,955 $ 2,078 Net (sales/maturities) purchases (162) (175) (54) (222) (613) (52)Fair value change recorded in Other Comprehensive Income 46 62 93 31 232 (183)Other than temporary impairment recorded in income (18) (23) (8) (50) (99) (29)Impact of foreign exchange 19 (103) (36) 23 (97) 141
Fair value of securities at end of period $ 1,378 $ 1,493 $ 1,732 $ 1,737 $ 1,378 $ 1,955
Fair Value Measurement We use a fair value hierarchy to categorize the inputs we use in valuation techniques to measure fair value. The extent of our use of quoted market prices (Level 1), internal models using
observable market information as inputs (Level 2) and internal models without observable market information (Level 3) in the valuation of securities, fair value liabilities, derivative assets and derivative liabilities were as follows:
(Canadian $ in millions)
Derivative Instruments
Available-for-sale securities Trading securities Fair value liabilities Asset Liability
October 31,
2009 October 31,
2008
October 31, 2009
October 31,
2008
October 31, 2009
October 31,
2008
October 31, 2009
October 31,
2008
October 31, 2009
October 31,
2008
Valued using quoted market prices $ 35,590 $ 14,560 $ 55,401 $ 62,294 $ 12,064 $ 18,792 $ 1,881 $ 6,170 $ 813 $ 2,096 Valued using internal models (with observable inputs) 12,271 14,655 3,184 3,258 2,473 2,493 45,438 58,131 43,779 57,821 Valued using internal models (without observable inputs) 2,442 2,900 486 480 - - 579 1,285 173 131
Total $ 50,303 $ 32,115 $ 59,071 $ 66,032 $ 14,537 $ 21,285 $ 47,898 $ 65,586 $ 44,765 $ 60,048
Sensitivity analysis for the most significant items valued using internal models without observable inputs is described below. Within trading securities as at October 31, 2009 was $165 million (face value $323 million) of notes related to the Montreal Accord. The valuation of these notes has been determined by management based on expected discounted cash flows. The determination of the discount rate used in the discounted cash flow model has the most significant impact on the valuation of the notes and is impacted by changes in credit spreads and the rating of the notes. The impact of assuming the discount rate increased or decreased by 50 basis points would result in a change in fair value of $(5) million and $5 million, respectively. Included in available-for-sale securities is deferred purchase price of $727 million related to our off-balance sheet securitization activities. The valuation of the deferred purchase price has been determined by management based on expected discounted cash flows that are determined by prepayment rate and interest rate assumptions. The determination of the interest rate (excess spread) used in the discounted cash flow model has the most significant impact on the valuation of the deferred purchase price. The impact of assuming a 10 percent increase or decrease in the interest rate would result in a change in fair value of $101 million and $(101) million, respectively. Within derivative assets and derivative liabilities as at October 31, 2009 was $568 million and $76 million, respectively, related to the mark-to-market of credit default swaps and total return swaps on structured products. The valuation of these derivatives has
been determined by management based on estimates of current market spreads for similar structured products. The impact of assuming a 10 basis point increase or decrease in that spread would result in a change in fair value of $(4) million and $4 million, respectively.
Financial Liabilities Designated as Held for Trading A portion of our structured note liabilities have been designated as trading under the fair value option and are accounted for at fair value, which better aligns the accounting result with the way the portfolio is managed. The change in fair value of these structured notes was a decrease in non-interest revenue, trading revenues of $39 million for the quarter ended October 31, 2009, including a charge of $16 million attributable to changes in our credit spread (an increase in non-interest revenue, trading revenues of $53 million and a charge of $158 million, respectively for the twelve months ended October 31, 2009). We recognized offsetting amounts on derivatives and other financial instrument contracts that are held to hedge changes in the fair value of these structured notes. The change in fair value related to changes in our credit spread that has been recognized since they were designated as held for trading to October 31, 2009 was an unrealized loss of $42 million. In 2009, we hedged the exposure to changes in our credit spreads and have recorded $155 million of gains on these hedging instruments since inception.
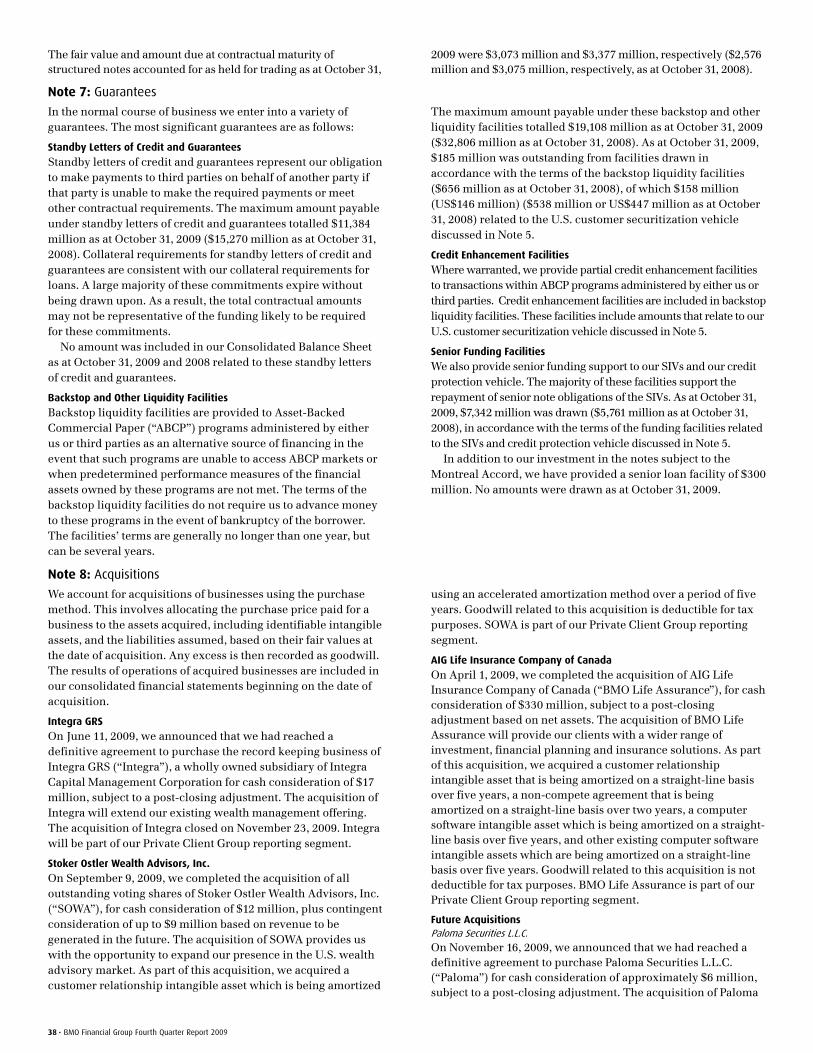
38 • BMO Financial Group Fourth Quarter Report 2009
The fair value and amount due at contractual maturity of structured notes accounted for as held for trading as at October 31,
2009 were $3,073 million and $3,377 million, respectively ($2,576 million and $3,075 million, respectively, as at October 31, 2008).
Note 7: Guarantees
In the normal course of business we enter into a variety of guarantees. The most significant guarantees are as follows:
Standby Letters of Credit and Guarantees Standby letters of credit and guarantees represent our obligation to make payments to third parties on behalf of another party if that party is unable to make the required payments or meet other contractual requirements. The maximum amount payable under standby letters of credit and guarantees totalled $11,384 million as at October 31, 2009 ($15,270 million as at October 31, 2008). Collateral requirements for standby letters of credit and guarantees are consistent with our collateral requirements for loans. A large majority of these commitments expire without being drawn upon. As a result, the total contractual amounts may not be representative of the funding likely to be required for these commitments. No amount was included in our Consolidated Balance Sheet as at October 31, 2009 and 2008 related to these standby letters of credit and guarantees.
Backstop and Other Liquidity Facilities Backstop liquidity facilities are provided to Asset-Backed Commercial Paper (“ABCP”) programs administered by either us or third parties as an alternative source of financing in the event that such programs are unable to access ABCP markets or when predetermined performance measures of the financial assets owned by these programs are not met. The terms of the backstop liquidity facilities do not require us to advance money to these programs in the event of bankruptcy of the borrower. The facilities’ terms are generally no longer than one year, but can be several years.
The maximum amount payable under these backstop and other liquidity facilities totalled $19,108 million as at October 31, 2009 ($32,806 million as at October 31, 2008). As at October 31, 2009, $185 million was outstanding from facilities drawn in accordance with the terms of the backstop liquidity facilities ($656 million as at October 31, 2008), of which $158 million (US$146 million) ($538 million or US$447 million as at October 31, 2008) related to the U.S. customer securitization vehicle discussed in Note 5.
Credit Enhancement Facilities Where warranted, we provide partial credit enhancement facilities to transactions within ABCP programs administered by either us or third parties. Credit enhancement facilities are included in backstop liquidity facilities. These facilities include amounts that relate to our U.S. customer securitization vehicle discussed in Note 5.
Senior Funding Facilities We also provide senior funding support to our SIVs and our credit protection vehicle. The majority of these facilities support the repayment of senior note obligations of the SIVs. As at October 31, 2009, $7,342 million was drawn ($5,761 million as at October 31, 2008), in accordance with the terms of the funding facilities related to the SIVs and credit protection vehicle discussed in Note 5. In addition to our investment in the notes subject to the Montreal Accord, we have provided a senior loan facility of $300 million. No amounts were drawn as at October 31, 2009.
Note 8: Acquisitions
We account for acquisitions of businesses using the purchase method. This involves allocating the purchase price paid for a business to the assets acquired, including identifiable intangible assets, and the liabilities assumed, based on their fair values at the date of acquisition. Any excess is then recorded as goodwill. The results of operations of acquired businesses are included in our consolidated financial statements beginning on the date of acquisition.
Integra GRS On June 11, 2009, we announced that we had reached a definitive agreement to purchase the record keeping business of Integra GRS (“Integra”), a wholly owned subsidiary of Integra Capital Management Corporation for cash consideration of $17 million, subject to a post-closing adjustment. The acquisition of Integra will extend our existing wealth management offering. The acquisition of Integra closed on November 23, 2009. Integra will be part of our Private Client Group reporting segment.
Stoker Ostler Wealth Advisors, Inc. On September 9, 2009, we completed the acquisition of all outstanding voting shares of Stoker Ostler Wealth Advisors, Inc. (“SOWA”), for cash consideration of $12 million, plus contingent consideration of up to $9 million based on revenue to be generated in the future. The acquisition of SOWA provides us with the opportunity to expand our presence in the U.S. wealth advisory market. As part of this acquisition, we acquired a customer relationship intangible asset which is being amortized
using an accelerated amortization method over a period of five years. Goodwill related to this acquisition is deductible for tax purposes. SOWA is part of our Private Client Group reporting segment.
AIG Life Insurance Company of Canada On April 1, 2009, we completed the acquisition of AIG Life Insurance Company of Canada (“BMO Life Assurance”), for cash consideration of $330 million, subject to a post-closing adjustment based on net assets. The acquisition of BMO Life Assurance will provide our clients with a wider range of investment, financial planning and insurance solutions. As part of this acquisition, we acquired a customer relationship intangible asset that is being amortized on a straight-line basis over five years, a non-compete agreement that is being amortized on a straight-line basis over two years, a computer software intangible asset which is being amortized on a straight-line basis over five years, and other existing computer software intangible assets which are being amortized on a straight-line basis over five years. Goodwill related to this acquisition is not deductible for tax purposes. BMO Life Assurance is part of our Private Client Group reporting segment.
Future Acquisitions Paloma Securities L.L.C. On November 16, 2009, we announced that we had reached a definitive agreement to purchase Paloma Securities L.L.C. (“Paloma”) for cash consideration of approximately $6 million, subject to a post-closing adjustment. The acquisition of Paloma
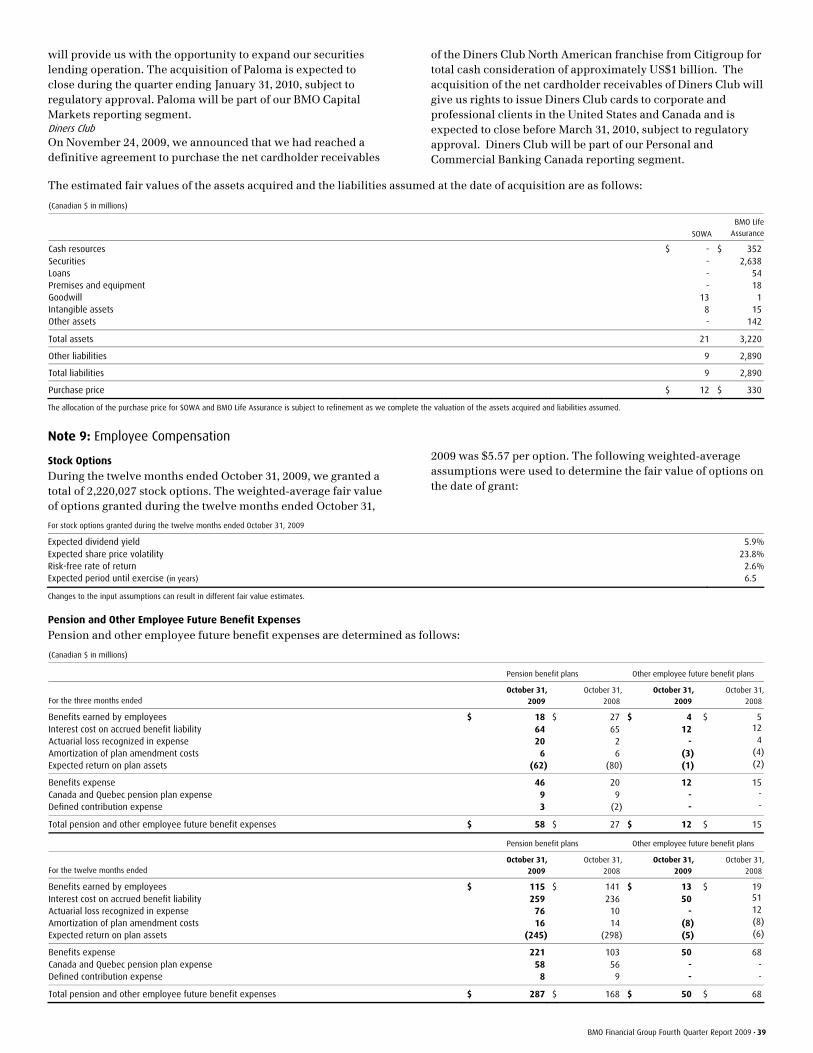
BMO Financial Group Fourth Quarter Report 2009 • 39
will provide us with the opportunity to expand our securities lending operation. The acquisition of Paloma is expected to close during the quarter ending January 31, 2010, subject to regulatory approval. Paloma will be part of our BMO Capital Markets reporting segment. Diners Club On November 24, 2009, we announced that we had reached a definitive agreement to purchase the net cardholder receivables
of the Diners Club North American franchise from Citigroup for total cash consideration of approximately US$1 billion. The acquisition of the net cardholder receivables of Diners Club will give us rights to issue Diners Club cards to corporate and professional clients in the United States and Canada and is expected to close before March 31, 2010, subject to regulatory approval. Diners Club will be part of our Personal and Commercial Banking Canada reporting segment.
The estimated fair values of the assets acquired and the liabilities assumed at the date of acquisition are as follows:
(Canadian $ in millions)
SOWA
BMO Life
Assurance
Cash resources $ - $ 352 Securities - 2,638 Loans - 54 Premises and equipment - 18 Goodwill 13 1 Intangible assets 8 15 Other assets - 142
Total assets 21 3,220
Other liabilities 9 2,890
Total liabilities 9 2,890
Purchase price $ 12 $ 330
The allocation of the purchase price for SOWA and BMO Life Assurance is subject to refinement as we complete the valuation of the assets acquired and liabilities assumed.
Note 9: Employee Compensation
Stock Options
During the twelve months ended October 31, 2009, we granted a total of 2,220,027 stock options. The weighted-average fair value of options granted during the twelve months ended October 31,
2009 was $5.57 per option. The following weighted-average assumptions were used to determine the fair value of options on the date of grant:
For stock options granted during the twelve months ended October 31, 2009
Expected dividend yield 5.9% Expected share price volatility 23.8% Risk-free rate of return 2.6% Expected period until exercise (in years) 6.5
Changes to the input assumptions can result in different fair value estimates.
Pension and Other Employee Future Benefit Expenses
Pension and other employee future benefit expenses are determined as follows:
(Canadian $ in millions)
Pension benefit plans Other employee future benefit plans
For the three months ended October 31,
2009 October 31,
2008
October 31, 2009
October 31,
2008
Benefits earned by employees $ 18 $ 27 $ 4 $ 5 Interest cost on accrued benefit liability 64 65 12 12
Actuarial loss recognized in expense 20 2 - 4
Amortization of plan amendment costs 6 6 (3) (4)
Expected return on plan assets (62) (80) (1) (2)
Benefits expense 46 20 12 15 Canada and Quebec pension plan expense 9 9 - -
Defined contribution expense 3 (2) - -
Total pension and other employee future benefit expenses $ 58 $ 27 $ 12 $ 15
Pension benefit plans Other employee future benefit plans
For the twelve months ended October 31,
2009 October 31,
2008
October 31, 2009
October 31,
2008
Benefits earned by employees $ 115 $ 141 $ 13 $ 19 Interest cost on accrued benefit liability 259 236 50 51
Actuarial loss recognized in expense 76 10 - 12
Amortization of plan amendment costs 16 14 (8) (8)
Expected return on plan assets (245) (298) (5) (6)
Benefits expense 221 103 50 68 Canada and Quebec pension plan expense 58 56 - - Defined contribution expense 8 9 - -
Total pension and other employee future benefit expenses $ 287 $ 168 $ 50 $ 68
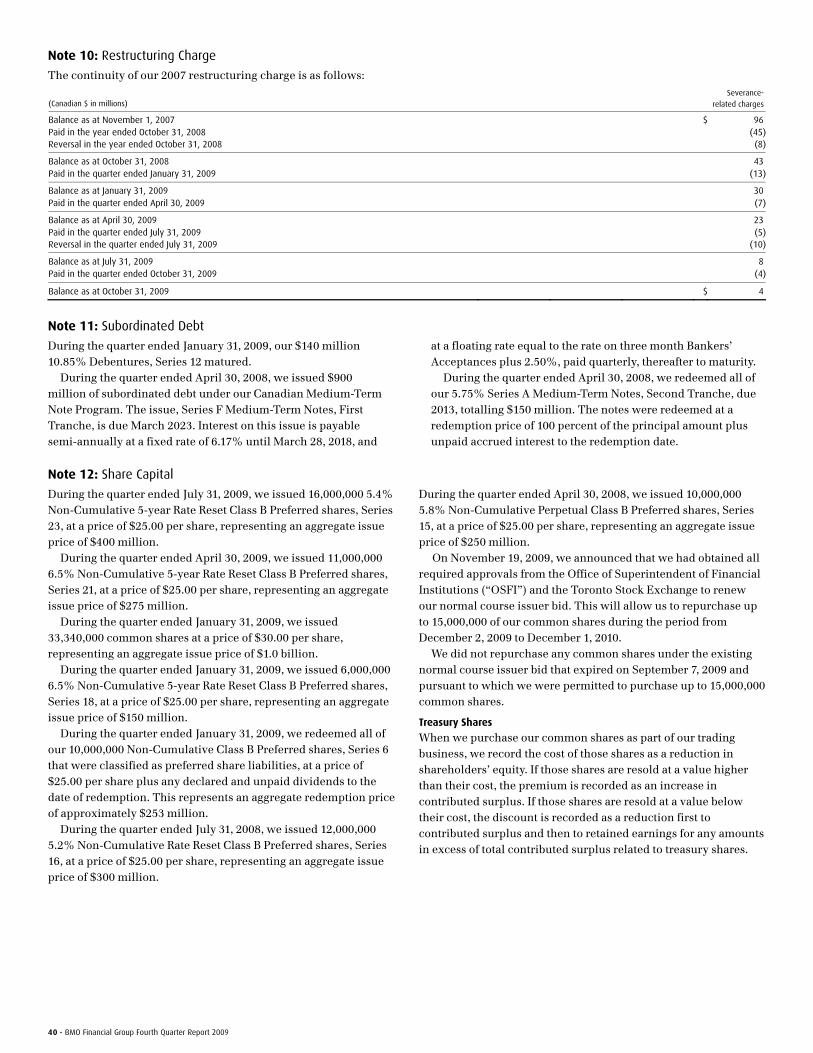
40 • BMO Financial Group Fourth Quarter Report 2009
Note 10: Restructuring Charge
The continuity of our 2007 restructuring charge is as follows:
(Canadian $ in millions) Severance-
related charges
Balance as at November 1, 2007 $ 96 Paid in the year ended October 31, 2008 (45)Reversal in the year ended October 31, 2008 (8)
Balance as at October 31, 2008 43 Paid in the quarter ended January 31, 2009 (13)
Balance as at January 31, 2009 30 Paid in the quarter ended April 30, 2009 (7)
Balance as at April 30, 2009 23 Paid in the quarter ended July 31, 2009 (5)Reversal in the quarter ended July 31, 2009 (10)
Balance as at July 31, 2009 8 Paid in the quarter ended October 31, 2009 (4)
Balance as at October 31, 2009 $ 4
Note 11: Subordinated Debt
During the quarter ended January 31, 2009, our $140 million 10.85% Debentures, Series 12 matured. During the quarter ended April 30, 2008, we issued $900 million of subordinated debt under our Canadian Medium-Term Note Program. The issue, Series F Medium-Term Notes, First Tranche, is due March 2023. Interest on this issue is payable semi-annually at a fixed rate of 6.17% until March 28, 2018, and
at a floating rate equal to the rate on three month Bankers’ Acceptances plus 2.50%, paid quarterly, thereafter to maturity. During the quarter ended April 30, 2008, we redeemed all of our 5.75% Series A Medium-Term Notes, Second Tranche, due 2013, totalling $150 million. The notes were redeemed at a redemption price of 100 percent of the principal amount plus unpaid accrued interest to the redemption date.
Note 12: Share Capital
During the quarter ended July 31, 2009, we issued 16,000,000 5.4% Non-Cumulative 5-year Rate Reset Class B Preferred shares, Series 23, at a price of $25.00 per share, representing an aggregate issue price of $400 million. During the quarter ended April 30, 2009, we issued 11,000,000 6.5% Non-Cumulative 5-year Rate Reset Class B Preferred shares, Series 21, at a price of $25.00 per share, representing an aggregate issue price of $275 million. During the quarter ended January 31, 2009, we issued 33,340,000 common shares at a price of $30.00 per share, representing an aggregate issue price of $1.0 billion. During the quarter ended January 31, 2009, we issued 6,000,000 6.5% Non-Cumulative 5-year Rate Reset Class B Preferred shares, Series 18, at a price of $25.00 per share, representing an aggregate issue price of $150 million. During the quarter ended January 31, 2009, we redeemed all of our 10,000,000 Non-Cumulative Class B Preferred shares, Series 6 that were classified as preferred share liabilities, at a price of $25.00 per share plus any declared and unpaid dividends to the date of redemption. This represents an aggregate redemption price of approximately $253 million. During the quarter ended July 31, 2008, we issued 12,000,000 5.2% Non-Cumulative Rate Reset Class B Preferred shares, Series 16, at a price of $25.00 per share, representing an aggregate issue price of $300 million.
During the quarter ended April 30, 2008, we issued 10,000,000 5.8% Non-Cumulative Perpetual Class B Preferred shares, Series 15, at a price of $25.00 per share, representing an aggregate issue price of $250 million. On November 19, 2009, we announced that we had obtained all required approvals from the Office of Superintendent of Financial Institutions (“OSFI”) and the Toronto Stock Exchange to renew our normal course issuer bid. This will allow us to repurchase up to 15,000,000 of our common shares during the period from December 2, 2009 to December 1, 2010. We did not repurchase any common shares under the existing normal course issuer bid that expired on September 7, 2009 and pursuant to which we were permitted to purchase up to 15,000,000 common shares.
Treasury Shares
When we purchase our common shares as part of our trading business, we record the cost of those shares as a reduction in shareholders’ equity. If those shares are resold at a value higher than their cost, the premium is recorded as an increase in contributed surplus. If those shares are resold at a value below their cost, the discount is recorded as a reduction first to contributed surplus and then to retained earnings for any amounts in excess of total contributed surplus related to treasury shares.
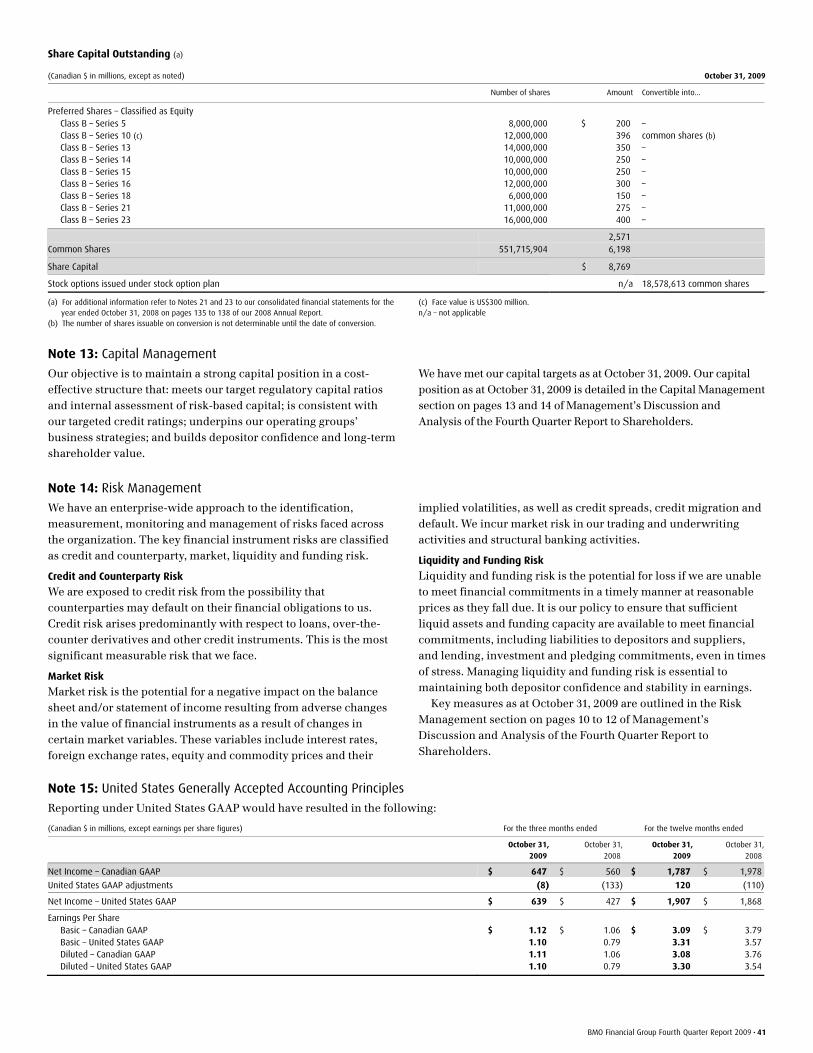
BMO Financial Group Fourth Quarter Report 2009 • 41
Share Capital Outstanding (a)
(a) For additional information refer to Notes 21 and 23 to our consolidated financial statements for the year ended October 31, 2008 on pages 135 to 138 of our 2008 Annual Report.
(b) The number of shares issuable on conversion is not determinable until the date of conversion.
(c) Face value is US$300 million. n/a – not applicable
Note 13: Capital Management
Our objective is to maintain a strong capital position in a cost-effective structure that: meets our target regulatory capital ratios and internal assessment of risk-based capital; is consistent with our targeted credit ratings; underpins our operating groups’ business strategies; and builds depositor confidence and long-term shareholder value.
We have met our capital targets as at October 31, 2009. Our capital position as at October 31, 2009 is detailed in the Capital Management section on pages 13 and 14 of Management’s Discussion and Analysis of the Fourth Quarter Report to Shareholders.
Note 14: Risk Management
We have an enterprise-wide approach to the identification, measurement, monitoring and management of risks faced across the organization. The key financial instrument risks are classified as credit and counterparty, market, liquidity and funding risk.
Credit and Counterparty Risk
We are exposed to credit risk from the possibility that counterparties may default on their financial obligations to us. Credit risk arises predominantly with respect to loans, over-the-counter derivatives and other credit instruments. This is the most significant measurable risk that we face.
Market Risk
Market risk is the potential for a negative impact on the balance sheet and/or statement of income resulting from adverse changes in the value of financial instruments as a result of changes in certain market variables. These variables include interest rates, foreign exchange rates, equity and commodity prices and their
implied volatilities, as well as credit spreads, credit migration and default. We incur market risk in our trading and underwriting activities and structural banking activities.
Liquidity and Funding Risk
Liquidity and funding risk is the potential for loss if we are unable to meet financial commitments in a timely manner at reasonable prices as they fall due. It is our policy to ensure that sufficient liquid assets and funding capacity are available to meet financial commitments, including liabilities to depositors and suppliers, and lending, investment and pledging commitments, even in times of stress. Managing liquidity and funding risk is essential to maintaining both depositor confidence and stability in earnings. Key measures as at October 31, 2009 are outlined in the Risk Management section on pages 10 to 12 of Management’s Discussion and Analysis of the Fourth Quarter Report to Shareholders.
Note 15: United States Generally Accepted Accounting Principles
Reporting under United States GAAP would have resulted in the following:
(Canadian $ in millions, except earnings per share figures) For the three months ended For the twelve months ended
October 31,
2009 October 31,
2008
October 31,2009
October 31,
2008
Net Income – Canadian GAAP $ 647 $ 560 $ 1,787 $ 1,978
United States GAAP adjustments (8) (133) 120 (110)
Net Income – United States GAAP $ 639 $ 427 $ 1,907 $ 1,868
Earnings Per Share Basic – Canadian GAAP $ 1.12 $ 1.06 $ 3.09 $ 3.79 Basic – United States GAAP 1.10 0.79 3.31 3.57 Diluted – Canadian GAAP 1.11 1.06 3.08 3.76 Diluted – United States GAAP 1.10 0.79 3.30 3.54
(Canadian $ in millions, except as noted) October 31, 2009
Number of shares Amount Convertible into...
Preferred Shares – Classified as Equity Class B – Series 5 8,000,000 $ 200 – Class B – Series 10 (c) 12,000,000 396 common shares (b) Class B – Series 13 14,000,000 350 – Class B – Series 14 10,000,000 250 – Class B – Series 15 10,000,000 250 – Class B – Series 16 12,000,000 300 – Class B – Series 18 6,000,000 150 – Class B – Series 21 11,000,000 275 – Class B – Series 23 16,000,000 400 –
2,571 Common Shares 551,715,904 6,198
Share Capital $ 8,769
Stock options issued under stock option plan n/a 18,578,613 common shares

42 • BMO Financial Group Fourth Quarter Report 2009
Other-than-Temporary Impairment
During the quarter ended July 31, 2009, we adopted new United States guidance issued by the Financial Accounting Standards Board which amended the impairment assessment guidance and recognition principles of other-than-temporary impairment for debt securities and enhanced the presentation and disclosure requirements for debt and equity securities. Under the new guidance, if a debt security is determined to be other-than-temporarily impaired, the amount of the impairment equal to the credit loss will be recorded in income and the remaining
impairment charge will be recorded in other comprehensive income. Under Canadian GAAP, all impairment is recorded in income. As a result of the adoption of this new guidance, we recorded a cumulative-effect adjustment to reclassify $28 million before tax ($19 million after tax) from retained earnings to other comprehensive income as of May 1, 2009 for United States GAAP reporting purposes. There were no impairment charges recorded in other comprehensive income subsequent to adoption.
BMO Financial Group Fourth Quarter Report 2009 • 43
Note 16: Operating and Geographic Segmentation Operating Groups We conduct our business through operating groups, each of which has a distinct mandate. We determine our operating groups based on our management structure and therefore these groups, and results attributed to them, may not be comparable with those of other financial services companies. We evaluate the performance of our groups using measures such as net income, revenue growth, return on equity, net economic profit and non-interest expense-to-revenue (productivity) ratio, as well as cash operating leverage. Personal and Commercial Banking Personal and Commercial Banking (“P&C”) is comprised of two operating segments: Personal and Commercial Banking Canada and Personal and Commercial Banking U.S. Personal and Commercial Banking Canada Personal and Commercial Banking Canada (“P&C Canada”) offers a full range of consumer and business products and services, including: everyday banking, financing, investing and credit cards, as well as a full suite of commercial and capital market products and financial advisory services, through a network of branches, telephone banking, online banking, mortgage specialists and automated banking machines. Effective in the third quarter of 2009, the results of our term deposits business are included in P&C Canada rather than Private Client Group, where the business is now better aligned with P&C Canada’s retail product strategy. Prior periods have been restated to reflect this reclassification. Personal and Commercial Banking U.S. Personal and Commercial Banking U.S. (“P&C U.S.”) offers a full range of products and services to personal and business clients in select U.S. Midwest markets through branches and direct banking channels such as telephone banking, online banking and a network of automated banking machines. Private Client Group Private Client Group (“PCG”) brings together all of our wealth management businesses. Operating under the BMO brand in Canada and Harris in the United States, PCG serves a full range of client segments, from mainstream to ultra-high net worth, as well as select institutional market segments. We offer our clients a broad range of wealth management products and solutions, including full-service, online brokerage and insurance in Canada, and private banking and investment products in Canada and the United States. Effective in the third quarter of 2009, all of our insurance operations are included within PCG, bringing our insurance capabilities and skill sets together as part of our wealth management offering. Prior periods have been restated to reflect this reclassification. BMO Capital Markets BMO Capital Markets (“BMO CM”) combines all of our businesses serving corporate, institutional and government clients. In Canada and the United States, its clients span a broad range of industry sectors. BMO CM also serves clients in the United Kingdom, Europe, Asia and Australia. It offers clients complete financial solutions, including equity and debt underwriting, corporate lending and project financing, mergers and acquisitions, advisory services, merchant banking, securitization, treasury and market risk management, debt and equity research and institutional sales and trading. Corporate Services Corporate Services includes the corporate units that provide expertise and governance support in areas such as strategic planning, law, finance, internal audit, risk management, corporate communications, economics, corporate marketing, human resources and learning. Operating results include revenues and expenses associated with certain securitization activities, the
hedging of foreign-source earnings and activities related to the management of certain balance sheet positions and our overall asset liability structure. Technology and Operations (“T&O”) manages, maintains and provides governance over our information technology, operations services, real estate and sourcing. T&O focuses on enterprise-wide priorities that improve quality and efficiency to deliver an excellent customer experience. Operating results for T&O are included with Corporate Services for reporting purposes. However, costs of T&O services are transferred to the three operating groups. As such, results for Corporate Services largely reflect the other corporate units outlined above. Corporate Services also includes residual revenues and expenses representing the differences between actual amounts earned or incurred and the amounts allocated to operating groups. Basis of Presentation The results of these operating segments are based on our internal financial reporting systems. The accounting policies used in these segments are generally consistent with those followed in the preparation of our consolidated financial statements as disclosed in Notes 1 and 2. Notable accounting measurement differences are the taxable equivalent basis adjustment and the provision for credit losses, as described below. Taxable Equivalent Basis We analyze net interest income on a taxable equivalent basis (“teb”) at the operating group level. This basis includes an adjustment which increases GAAP revenues and the GAAP provision for income taxes by an amount that would raise revenues on certain tax-exempt securities to a level that would incur tax at the statutory rate. The operating groups’ teb adjustments are eliminated in Corporate Services. Analysis on a teb basis neutralizes the impact of investing in tax-exempt or tax-advantaged securities rather than fully taxable securities with higher yields. It reduces distortions in net interest income related to the choice of tax-advantaged and taxable investments. Provisions for Credit Losses Provisions for credit losses are generally allocated to each group based on expected losses for that group over an economic cycle. Differences between expected loss provisions and provisions required under GAAP are included in Corporate Services. Inter-Group Allocations Various estimates and allocation methodologies are used in the preparation of the operating groups’ financial information. We allocate expenses directly related to earning revenue to the groups that earned the related revenue. Expenses not directly related to earning revenue, such as overhead expenses, are allocated to operating groups using allocation formulas applied on a consistent basis. Operating group net interest income reflects internal funding charges and credits on the groups’ assets, liabilities and capital, at market rates, taking into account relevant terms and currency considerations. The offset of the net impact of these charges and credits is reflected in Corporate Services. Geographic Information We operate primarily in Canada and the United States but we also have operations in the United Kingdom, Europe, the Caribbean and Asia, which are grouped in Other countries. We allocate our results by geographic region based on the location of the unit responsible for managing the related assets, liabilities, revenues and expenses, except for the consolidated provision for credit losses, which is allocated based upon the country of ultimate risk.
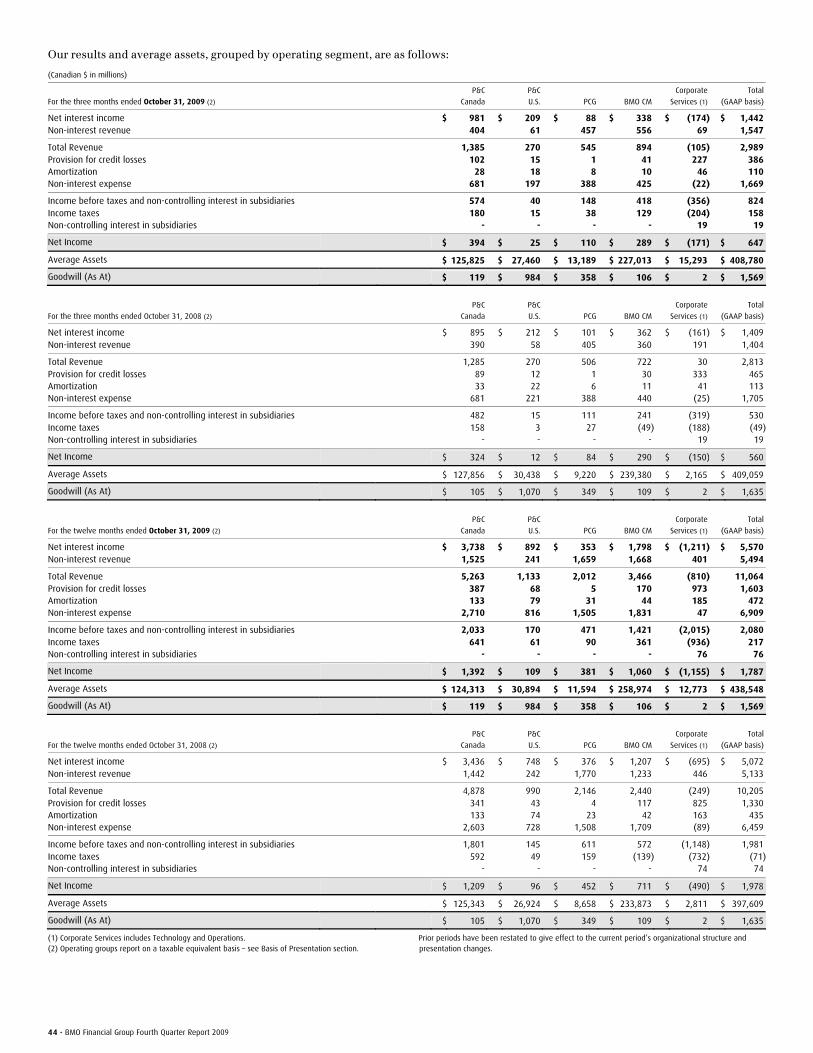
44 • BMO Financial Group Fourth Quarter Report 2009
Our results and average assets, grouped by operating segment, are as follows:
(Canadian $ in millions)
For the three months ended October 31, 2009 (2)
P&C
Canada
P&C
U.S. PCG BMO CM
Corporate
Services (1)
Total
(GAAP basis)
Net interest income $ 981 $ 209 $ 88 $ 338 $ (174) $ 1,442 Non-interest revenue 404 61 457 556 69 1,547
Total Revenue 1,385 270 545 894 (105) 2,989 Provision for credit losses 102 15 1 41 227 386 Amortization 28 18 8 10 46 110 Non-interest expense 681 197 388 425 (22) 1,669
Income before taxes and non-controlling interest in subsidiaries 574 40 148 418 (356) 824 Income taxes 180 15 38 129 (204) 158 Non-controlling interest in subsidiaries - - - - 19 19
Net Income $ 394 $ 25 $ 110 $ 289 $ (171) $ 647
Average Assets $ 125,825 $ 27,460 $ 13,189 $ 227,013 $ 15,293 $ 408,780
Goodwill (As At) $ 119 $ 984 $ 358 $ 106 $ 2 $ 1,569
For the three months ended October 31, 2008 (2)
P&C
Canada
P&C
U.S. PCG BMO CM
Corporate
Services (1)
Total
(GAAP basis)
Net interest income $ 895 $ 212 $ 101 $ 362 $ (161) $ 1,409 Non-interest revenue 390 58 405 360 191 1,404
Total Revenue 1,285 270 506 722 30 2,813 Provision for credit losses 89 12 1 30 333 465 Amortization 33 22 6 11 41 113 Non-interest expense 681 221 388 440 (25) 1,705
Income before taxes and non-controlling interest in subsidiaries 482 15 111 241 (319) 530 Income taxes 158 3 27 (49) (188) (49)Non-controlling interest in subsidiaries - - - - 19 19
Net Income $ 324 $ 12 $ 84 $ 290 $ (150) $ 560
Average Assets $ 127,856 $ 30,438 $ 9,220 $ 239,380 $ 2,165 $ 409,059
Goodwill (As At) $ 105 $ 1,070 $ 349 $ 109 $ 2 $ 1,635
For the twelve months ended October 31, 2009 (2)
P&C
Canada
P&C
U.S. PCG BMO CM
Corporate
Services (1)
Total
(GAAP basis)
Net interest income $ 3,738 $ 892 $ 353 $ 1,798 $ (1,211) $ 5,570 Non-interest revenue 1,525 241 1,659 1,668 401 5,494
Total Revenue 5,263 1,133 2,012 3,466 (810) 11,064 Provision for credit losses 387 68 5 170 973 1,603 Amortization 133 79 31 44 185 472 Non-interest expense 2,710 816 1,505 1,831 47 6,909
Income before taxes and non-controlling interest in subsidiaries 2,033 170 471 1,421 (2,015) 2,080 Income taxes 641 61 90 361 (936) 217 Non-controlling interest in subsidiaries - - - - 76 76
Net Income $ 1,392 $ 109 $ 381 $ 1,060 $ (1,155) $ 1,787
Average Assets $ 124,313 $ 30,894 $ 11,594 $ 258,974 $ 12,773 $ 438,548
Goodwill (As At) $ 119 $ 984 $ 358 $ 106 $ 2 $ 1,569
For the twelve months ended October 31, 2008 (2)
P&C
Canada
P&C
U.S. PCG BMO CM
Corporate
Services (1)
Total
(GAAP basis)
Net interest income $ 3,436 $ 748 $ 376 $ 1,207 $ (695) $ 5,072 Non-interest revenue 1,442 242 1,770 1,233 446 5,133
Total Revenue 4,878 990 2,146 2,440 (249) 10,205 Provision for credit losses 341 43 4 117 825 1,330 Amortization 133 74 23 42 163 435 Non-interest expense 2,603 728 1,508 1,709 (89) 6,459
Income before taxes and non-controlling interest in subsidiaries 1,801 145 611 572 (1,148) 1,981 Income taxes 592 49 159 (139) (732) (71)Non-controlling interest in subsidiaries - - - - 74 74
Net Income $ 1,209 $ 96 $ 452 $ 711 $ (490) $ 1,978
Average Assets $ 125,343 $ 26,924 $ 8,658 $ 233,873 $ 2,811 $ 397,609
Goodwill (As At) $ 105 $ 1,070 $ 349 $ 109 $ 2 $ 1,635
(1) Corporate Services includes Technology and Operations. (2) Operating groups report on a taxable equivalent basis – see Basis of Presentation section.
Prior periods have been restated to give effect to the current period’s organizational structure and presentation changes.
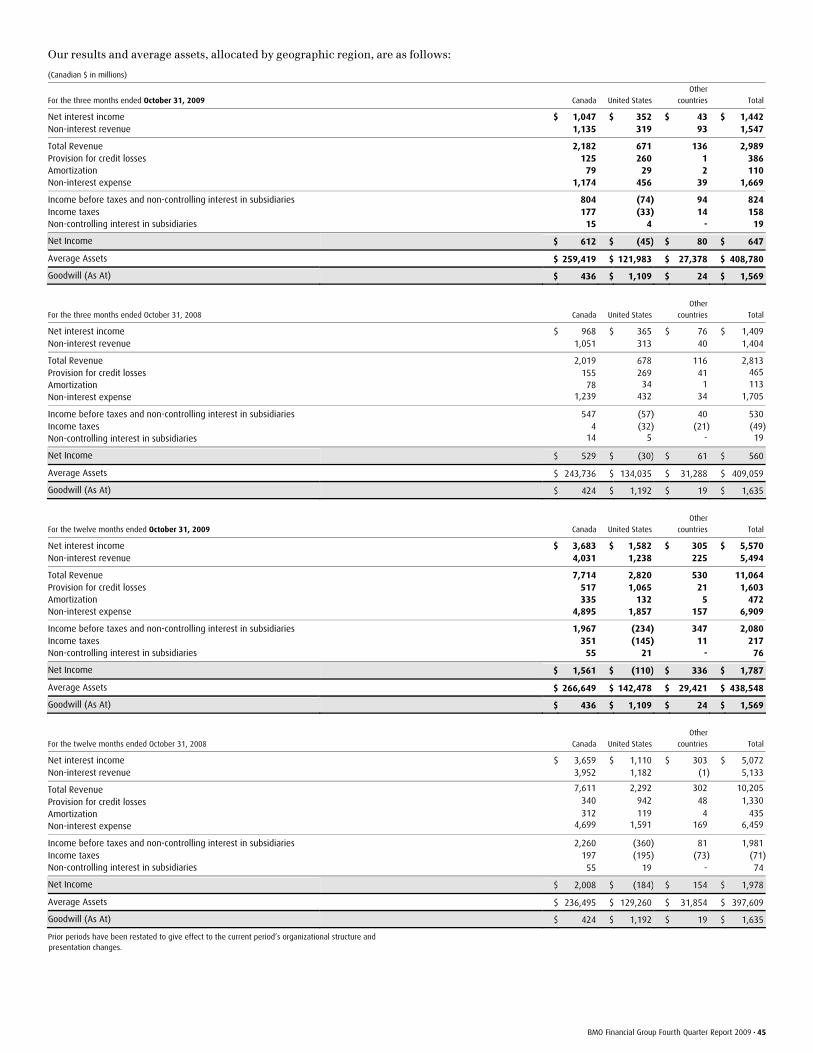
BMO Financial Group Fourth Quarter Report 2009 • 45
Our results and average assets, allocated by geographic region, are as follows:
(Canadian $ in millions)
For the three months ended October 31, 2009 Canada United States
Other
countries Total
Net interest income $ 1,047 $ 352 $ 43 $ 1,442 Non-interest revenue 1,135 319 93 1,547
Total Revenue 2,182 671 136 2,989 Provision for credit losses 125 260 1 386 Amortization 79 29 2 110 Non-interest expense 1,174 456 39 1,669
Income before taxes and non-controlling interest in subsidiaries 804 (74) 94 824 Income taxes 177 (33) 14 158 Non-controlling interest in subsidiaries 15 4 - 19
Net Income $ 612 $ (45) $ 80 $ 647
Average Assets $ 259,419 $ 121,983 $ 27,378 $ 408,780
Goodwill (As At) $ 436 $ 1,109 $ 24 $ 1,569
For the three months ended October 31, 2008 Canada United States
Other
countries Total
Net interest income $ 968 $ 365 $ 76 $ 1,409 Non-interest revenue 1,051 313 40 1,404
Total Revenue 2,019 678 116 2,813 Provision for credit losses 155 269 41 465 Amortization 78 34 1 113 Non-interest expense 1,239 432 34 1,705
Income before taxes and non-controlling interest in subsidiaries 547 (57) 40 530 Income taxes 4 (32) (21) (49)Non-controlling interest in subsidiaries 14 5 - 19
Net Income $ 529 $ (30) $ 61 $ 560
Average Assets $ 243,736 $ 134,035 $ 31,288 $ 409,059
Goodwill (As At) $ 424 $ 1,192 $ 19 $ 1,635
For the twelve months ended October 31, 2009 Canada United States
Other
countries Total
Net interest income $ 3,683 $ 1,582 $ 305 $ 5,570 Non-interest revenue 4,031 1,238 225 5,494
Total Revenue 7,714 2,820 530 11,064 Provision for credit losses 517 1,065 21 1,603 Amortization 335 132 5 472 Non-interest expense 4,895 1,857 157 6,909
Income before taxes and non-controlling interest in subsidiaries 1,967 (234) 347 2,080 Income taxes 351 (145) 11 217 Non-controlling interest in subsidiaries 55 21 - 76
Net Income $ 1,561 $ (110) $ 336 $ 1,787
Average Assets $ 266,649 $ 142,478 $ 29,421 $ 438,548
Goodwill (As At) $ 436 $ 1,109 $ 24 $ 1,569
For the twelve months ended October 31, 2008 Canada United States
Other
countries Total
Net interest income $ 3,659 $ 1,110 $ 303 $ 5,072 Non-interest revenue 3,952 1,182 (1) 5,133
Total Revenue 7,611 2,292 302 10,205
Provision for credit losses 340 942 48 1,330
Amortization 312 119 4 435 Non-interest expense 4,699 1,591 169 6,459
Income before taxes and non-controlling interest in subsidiaries 2,260 (360) 81 1,981 Income taxes 197 (195) (73) (71)Non-controlling interest in subsidiaries 55 19 - 74
Net Income $ 2,008 $ (184) $ 154 $ 1,978
Average Assets $ 236,495 $ 129,260 $ 31,854 $ 397,609
Goodwill (As At) $ 424 $ 1,192 $ 19 $ 1,635
Prior periods have been restated to give effect to the current period’s organizational structure and presentation changes.
INVESTOR AND MEDIA PRESENTATION
Investor Presentation Materials Interested parties are invited to visit our website at www.bmo.com/investorrelations to review this quarterly news release, presentation materials and a supplementary financial information package online.
Quarterly Conference Call and Webcast Presentations Interested parties are also invited to listen to our quarterly conference call on Tuesday, November 24, 2009, at 2:00 p.m. (EST). At that time, senior BMO executives will comment on results for the quarter and respond to questions from the investor community. The call may be accessed by telephone at 416-695-9753 (from within Toronto) or 1-888-789-0089 (toll-free outside Toronto). A replay of the conference call can be accessed until Monday, March 1, 2010, by calling 416-695-5800 (from within Toronto) or 1-800-408-3053 (toll-free outside Toronto) and entering passcode 3278113. A live webcast of the call can be accessed on our website at www.bmo.com/investorrelations. A replay can be accessed on the site until Monday, March 1, 2010.
Media Relations Contacts Ralph Marranca, Toronto, [email protected], 416-867-3996 Ronald Monet, Montreal, [email protected], 514-877-1873
Investor Relations Contacts Viki Lazaris, Senior Vice-President, [email protected], 416-867-6656 Steven Bonin, Director, [email protected], 416-867-5452 Andrew Chin, Senior Manager, [email protected], 416-867-7019
Chief Financial Officer Russel Robertson, Chief Financial Officer [email protected], 416-867-7360
Corporate Secretary Blair Morrison, Senior Vice-President, Deputy General Counsel, Corporate Affairs & Corporate Secretary [email protected], 416-867-6785
Shareholder Dividend Reinvestment and Share Purchase Plan Average market price August 2009 $52.31 ($51.26*) September 2009 $53.73 October 2009 $51.23 * reflects 2% discount for dividend reinvestment For dividend information, change in shareholder address or to advise of duplicate mailings, please contact Computershare Trust Company of Canada 100 University Avenue, 9th Floor Toronto, Ontario M5J 2Y1 Telephone: 1-800-340-5021 (Canada and the United States) Telephone: (514) 982-7800 (international) Fax: 1-888-453-0330 (Canada and the United States) Fax: (416) 263-9394 (international) E-mail: [email protected]
For other shareholder information, please contact Bank of Montreal Shareholder Services Corporate Secretary’s Department One First Canadian Place, 21st Floor Toronto, Ontario M5X 1A1 Telephone: (416) 867-6785 Fax: (416) 867-6793 E-mail: [email protected] For further information on this report, please contact Bank of Montreal Investor Relations Department P.O. Box 1, One First Canadian Place, 18th Floor Toronto, Ontario M5X 1A1 To review financial results online, please visit our website at www.bmo.com
® Registered trade-mark of Bank of Montreal Annual Meeting 2010
The next Annual Meeting of Shareholders will be held on
Tuesday, March 23, 2010, in Winnipeg, Manitoba.