Embed Size (px)
Citation preview

Copyright©2012 Research Institute for Economics & Business Administration – Kobe University.
Received April 26, 2012; accepted July 4, 2012
* I appreciate financial supports from JSPS KAKENHI (Grant Number 23530391), the Kansai University Research Grants (Grant-in-Aid for Encouragement of Scientists in 2011), and Ishii Memorial Securities Research Promotion Foundation (Grant-in-Aid for Research 22-04).
† Corresponding Author. Address Kansai University, 3-3-35 Yamatecho, Suita, Osaka 5648680, JAPAN.Telephone +81(6)6368-1348 E-mail [email protected]
Information Content of Analysts’ Stock Ratings and Earnings Forecasts in the Presence of Management Earnings Forecasts*
ABSTRACT
This paper evaluates the informativeness of analysts’ ratings and earnings forecast information contained in analyst reports beyond what is publicly provided by management earnings forecasts. Using only analyst reports that have been released practically simultaneously with management forecasts, I find that both analysts’ ratings and earnings forecasts have incremental information content conditional on management forecasts. Further analysis also reveals that analysts’ earnings forecasts are significantly more accurate than concurrently-announced management earnings forecasts. Overall, the findings in this paper present strong evidence that analysts offer informational value to the market beyond information that is provided by company management.
JEL Classification: G14; D82; G24; M41Key Words: Analysts’ Roles in Financial Markets; Analysts’ Stock Ratings; Analysts’ Earnings Forecasts; Management Earnings Forecasts
Koji Ota†
Faculty of CommerceKansai university
1. Introduction
Analyst reports provided by equity analysts are commonly used in the major stock markets of the world. Although the history of the so-called Western-style analyst reports in Japan is relatively short, they have been available since 1993 when Nomura Research Institute began publishing them. Numerous other stock brokerage firms soon followed suit. As of September 2007, 36 brokerage firms own equity research divisions or research institutes in Japan, with over 800 equity analysts belonging

The Japanese Accounting Review, 2 (2012), 87-11688
to these firms (Analyst Directory 2007; Nikkei Research Inc.). Most global investment banks, including Goldman Sachs, JP Morgan Chase, and Credit Suisse are among these firms.
Analyst reports are the final products of a process involving the collection, evaluation, and dissemination of information related to firms’ future prospects, and those published in Japan are comparable to those in other countries.1 However, there is one unique feature of the analyst reports published in Japan that is not found in other countries: they include information on current management earnings forecasts along with analysts’ earnings forecasts. This is because listed firms in Japan are required to provide forecasts of next year’s earnings under the disclosure guidelines prescribed by Japanese stock exchanges; therefore, management forecast information is publicly available. This practice dates to 1974, when the Tokyo Stock Exchange sent a letter to listed firms requesting the disclosure of forecasts of key accounting information. After some changes in the disclosure guidelines, Japanese corporate managers are now required to provide annual forecasts of next year’s sales, operating profit, recurring profit, net income, and dividends at quarterly and annual earnings announcements. In addition to periodic disclosure at earnings announcements, Japanese managers are also required to announce revised forecasts immediately when there is a significant change in previously published forecasts (e.g., ±10% of a sales forecast, ±30% of an earnings forecast, any change in a dividends forecast). This unique feature of analyst reports published in Japan motivated me to undertake this study.
Security analyst reports have been the subject of extensive empirical study over the past three decades. Many of these studies have investigated the stock market’s reaction to the release of information contained in analyst reports using a short event window; these are often called information content studies. However, most information content studies on analyst reports assume that the reports provide new information to the market and are not concurrent with other public releases. If this assumption does not hold, there is a possibility that analysts are merely publicizing or reiterating information that is already public. This possibility is not well considered in the current literature (Asquith, Mikhail, and Au, 2005).
This paper investigates the informativeness of analysts’ ratings and earnings forecasts conditional on the information contained in management earnings forecasts. I use 2,277 analyst reports publicized for the two-year period from July 2005 through June 2007 about 399 firms. I first replicate previous studies and find that both analysts’ ratings and earnings forecast revisions provide independent information to the stock market. Then, I examine the timing of the publication of analyst reports relative to the announcement of management earnings forecasts. Investigating the timing of the release of analyst reports helps understand the value that analysts bring to the market. First, analysts’ value may lie in their ability to interpret publicly available information through their expertise. Second, analysts’ service may lie in their ability to collect and process a wide variety of information through independent research (Park and Pincus, 2000; Ivković and Jegadeesh, 2004). While analysts’ roles as collectors of new information are well documented in the literature, their roles as interpreters of public information have not been thoroughly explored. Corporate insiders’ views of future earnings are probably one of the most important sources of public information. Thus, investigating the informativeness of information contained in analyst reports after controlling for the
1 Foreign securities firms operating in Japan appear to have a standard format for the report, and therefore their analyst reports are very similar to those used in other countries. On the other hand, analyst reports publicized by domestic securities firms are slightly different from those issued by foreign securities firms. Domestic brokerage firms usually employ a five-category system for rating stocks (strong buy, buy, hold, sell, and strong sell) and do not issue target prices, while foreign brokerage firms have a three-category system for rating stocks (buy, hold, and sell) and publicize target prices.

Ota: Information Content of Analysts’ Stock Ratings and Earnings Forecasts in the Presence ofManagement Earnings Forecasts
89
impact of management forecasts will help shed light on whether analysts possess valuable expertise to interpret public information.
After examining the timing of the publication of analyst reports, I find that over half of the analyst reports are issued on the day after the announcement of management earnings forecasts. These analyst reports are released almost simultaneously with management forecasts because the announcement of management forecasts usually takes place after the market closes, and analyst reports are disseminated to clients before the market opens the next day. Thereafter, I investigate the informativeness of analysts’ ratings and earnings forecasts on the subsample of concurrently released analyst reports, and find that both analysts’ ratings and earnings forecasts have incremental information content beyond information provided by management earnings forecasts. Controlling for the impact of actual earnings surprises does not alter the results. These findings suggest that the stock market considers the information contained in analyst reports more credible than that in management forecasts.
In order to gain insights into the market’s reliance on analysts’ forecasts, I examine the ex post forecast accuracy of management earnings forecasts and concurrently released analysts’ earnings forecasts. The results reveal that analysts’ forecasts are significantly more accurate than management forecasts. This may offer a clue to why the market relies more on analysts’ outlooks than corporate managers’ views of future earnings. Security analysts appear to possess expertise to process public information and supply the market with new analysis and assessment on a company’s future performance.
The remainder of this paper is organized in the following manner. The next section summarizes prior research. Section 3 describes the data and the sample. Section 4 discusses the empirical results. Section 5 provides the results of a battery of sensitivity tests. The last section presents the conclusion.
2. Prior Research
Early research on analyst reports investigates the information content of analysts’ stock ratings and earnings forecasts separately. For example, Elton, Gruber, and Grossman (1986) examine the market reaction to analysts’ rating changes using monthly returns, and find that upgrades to strong buy earn an average abnormal return of 1.91%, while downgrades to strong sell produce an average abnormal return of –0.38% in the month of rating changes. Womack (1996) examines not only stock price reactions but also volume reactions to stock rating changes to and from the most extreme buy and sell categories. He finds that upgrades to the buy rating and downgrades to the sell rating earn size-adjusted returns of 3.0% and –4.7%, respectively, and generate 190% and 300% of normal volume, respectively, in the three-day event period surrounding the release of rating changes. Other studies investigating changes in analysts’ ratings also find positive associations between abnormal returns and the direction of the rating change (Barber, Lehavy, McNichols, and Trueman, 2001; Ivković and Jegadeesh, 2004).
The information content of analysts’ earnings forecasts has also been extensively investigated. Abdel-khalik and Ajinkya (1982) examine the impact of 288 earnings forecast revisions by Merrill Lynch analysts on stock prices for the 1977–78 period and find significant abnormal returns during the publication week of the revisions. Studies using larger sample sizes also document evidence consistent with analysts’ earnings forecast revisions having information content (Lys and Sohn, 1990; Stickel, 1991).
More recent research has simultaneously examined the information content of analysts’ ratings,

The Japanese Accounting Review, 2 (2012), 87-11690
earnings forecasts, and other elements in the reports. For example, Francis and Soffer (1997) examine the relative informativeness of analysts’ ratings and earnings forecast revisions and find that analysts’ rating changes and earnings forecast revisions both affect stock prices. Stickel (1995) also investigates the information content of analysts’ ratings and earnings forecast revisions using almost 17,000 observations and obtain results consistent with the Francis and Soffer study. He also finds that the magnitude of the recommendation revision, reputation of the analyst, size of the brokerage house, and size of the sample firm all influence stock prices. Brav and Lehavy (2003) extend Francis and Soffer’s work by incorporating target prices as a source of information. Their evidence indicates that target price revisions are informative and provide significant incremental information over and above that contained in analysts’ stock ratings and earnings forecast revisions. Moreover, Asquith et al. (2005) consider the written content of a report in conjunction with the three summary measures: analysts’ ratings, earnings forecasts, and target prices. After a thorough investigation of 1,126 analyst reports, they find that the strength of analysts’ arguments provide significant information to the market beyond the three summary variables.
Thus, the information content of analyst reports has been widely investigated. However, these information content studies assume that the publication of analyst reports does not occur with other public releases. If this is not the case, there is a possibility that the observed market reaction is triggered by the information in public releases and not by that in analyst reports. In order to deal with this concurrent event problem, many studies rerun the analysis in the robustness tests on the subsample of observations that occur independently (Francis and Soffer, 1997; Brav and Lehavy, 2003; Asquith et al., 2005). In this paper, instead of circumventing the problem of simultaneous public announcements by using a subsample, I directly control for the impact of public releases and examine the incremental informativeness of analyst reports.
My work also relates to a stream of research that investigates the value that analysts bring to the market. Ivković and Jegadeesh (2004) document that the information content of analysts’ rating changes and earnings forecast revisions is the weakest during the week after earnings announcement and increases through the final week before the next earnings announcement. On the basis of this finding, they conjecture that the value of analysts’ stock ratings and earnings forecasts stems more from their independent collection of information than from their interpretation of public information. However, they exclude from their analysis the analysts’ rating changes and earnings forecast revisions that occur around the earnings announcement date, which accounts for approximately 25% of the entire sample, citing difficulty in disentangling the price reaction. Asquith et al. (2005) also find that 53% of the 1,126 analyst reports examined are published around the dates of other public releases, particularly earnings announcements. They analyze these reports and obtain statistically weaker but significant results supporting the informativeness of analyst reports. On the basis of the results obtained, Asquith et al. surmise that analysts have a role in interpreting other public releases. However, since they did not directly control for the impact of other simultaneous announcements, they could not clearly determine whether the market reaction was triggered by information from analyst reports or from concurrent public releases. Thus, they suggest that future studies on analyst reports should address the question of whether these analyst reports with other information releases contain new or merely interpretive information. In this study, I focus on the analyst reports that are contemporaneous with one of the most important releases of public information to the market—earnings guidance provided by management—in order to investigate whether analysts add value to the market beyond what is publicly disseminated by corporate managers.
Ota: Information Content of Analysts’ Stock Ratings and Earnings Forecasts in the Presence ofManagement Earnings Forecasts
91
3. Sample and Data
In this study, I examined 2,405 analyst reports provided by one of the three leading brokerage firms in Japan for the two-year period from July 2005 through June 2007. Other data necessary to carry out the empirical tests in the following sections are collected from NEEDS-FinancialQUEST, a commercial database provided by Nikkei Media Marketing Inc., and Kaisha Shikihou ( Japan Company Handbook), a quarterly publication on listed firms in Japan issued by Toyo Keizai Inc.
The analyst reports cover 442 firms and are written by 52 sell-side analysts. Of the 2,405 analyst reports, 127 are initiations of coverage and one is a stoppage of coverage, and these are omitted from the sample. This leads to a final sample of 2,277 analyst reports for 399 firms written by 51 sell-side analysts. The number of reports per analyst varies from 1 to 167, with a mean (median) of 48.9 (26.0) reports.2 The number of reports per sample firm also varies from 1 to 18, with a mean (median) of 5.7 (6.0) reports.
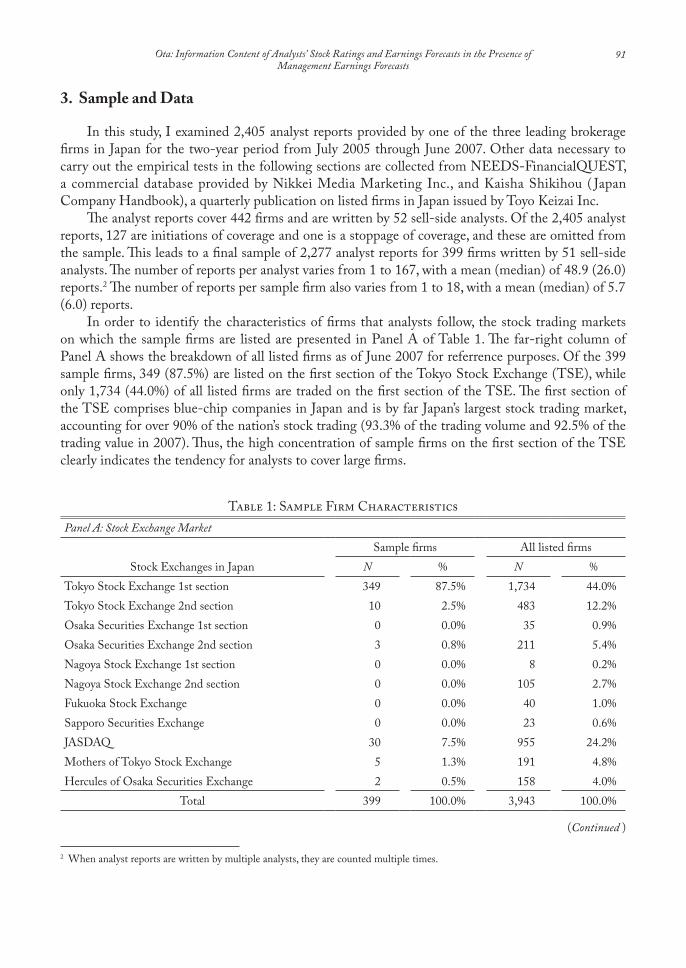
In order to identify the characteristics of firms that analysts follow, the stock trading markets on which the sample firms are listed are presented in Panel A of Table 1. The far-right column of Panel A shows the breakdown of all listed firms as of June 2007 for referrence purposes. Of the 399 sample firms, 349 (87.5%) are listed on the first section of the Tokyo Stock Exchange (TSE), while only 1,734 (44.0%) of all listed firms are traded on the first section of the TSE. The first section of the TSE comprises blue-chip companies in Japan and is by far Japan’s largest stock trading market, accounting for over 90% of the nation’s stock trading (93.3% of the trading volume and 92.5% of the trading value in 2007). Thus, the high concentration of sample firms on the first section of the TSE clearly indicates the tendency for analysts to cover large firms.
2 When analyst reports are written by multiple analysts, they are counted multiple times.
Table 1: Sample Firm CharacteristicsPanel A: Stock Exchange Market
Sample firms All listed firmsStock Exchanges in Japan N % N %
Tokyo Stock Exchange 1st section 349 87.5% 1,734 44.0%Tokyo Stock Exchange 2nd section 10 2.5% 483 12.2%Osaka Securities Exchange 1st section 0 0.0% 35 0.9%Osaka Securities Exchange 2nd section 3 0.8% 211 5.4%Nagoya Stock Exchange 1st section 0 0.0% 8 0.2%Nagoya Stock Exchange 2nd section 0 0.0% 105 2.7%Fukuoka Stock Exchange 0 0.0% 40 1.0%Sapporo Securities Exchange 0 0.0% 23 0.6%JASDAQ 30 7.5% 955 24.2%Mothers of Tokyo Stock Exchange 5 1.3% 191 4.8%Hercules of Osaka Securities Exchange 2 0.5% 158 4.0%
Total 399 100.0% 3,943 100.0%
(Continued )

The Japanese Accounting Review, 2 (2012), 87-11692
Panel B: Industry
33 sectors designated by Securities Identification Code Committee (SICC)
Sample firms All listed firmsN % N %
Fishery, Agriculture & Forestry 0 0.0% 11 0.3%Mining 2 0.5% 7 0.2%Construction 20 5.0% 216 5.5%Foods 0 0.0% 153 3.9%Textiles & Apparels 1 0.3% 81 2.1%Pulp & Paper 4 1.0% 28 0.7%Chemicals 38 9.5% 219 5.6%Pharmaceuticals 18 4.5% 52 1.3%Oil & Coal Products 0 0.0% 14 0.4%Rubber Products 4 1.0% 21 0.5%Glass & Ceramic Products 11 2.8% 73 1.9%Iron & Steel 7 1.8% 57 1.4%Nonferrous Metals 8 2.0% 43 1.1%Metal Products 8 2.0% 100 2.5%Machinery 28 7.0% 252 6.4%Electric Appliances 57 14.3% 313 7.9%Transportation Equipment 21 5.3% 107 2.7%Precision Instruments 8 2.0% 53 1.3%Other Products 17 4.3% 117 3.0%Electric Power & Gas 5 1.3% 25 0.6%Land Transportation 9 2.3% 66 1.7%Marine Transportation 3 0.8% 18 0.5%Air Transportation 0 0.0% 6 0.2%Warehousing & Harbor Transportation Services 0 0.0% 44 1.1%Information & Communication 0 0.0% 364 9.2%Wholesale Trade 18 4.5% 393 10.0%Retail Trade 49 12.3% 393 10.0%Banks 0 0.0% 98 2.5%Securities & Commodity Futures 0 0.0% 40 1.0%Insurance 0 0.0% 11 0.3%Other Financing Business 10 2.5% 58 1.5%Real Estate 18 4.5% 135 3.4%Services 35 8.8% 375 9.5%
Total 399 100.0% 3,943 100.0%Note: This table presents a summary of sample firm characteristics. 399 firms that are covered by analyst reports in this study are referred to as sample firms in the table. The breakdown of all listed firms, 3,943 firms as of June 2007, by stock exchange market and industry is shown for reference purposes in the far-right column.
(-Continued )

Ota: Information Content of Analysts’ Stock Ratings and Earnings Forecasts in the Presence ofManagement Earnings Forecasts
93
The industry classification of the sample firms is also shown in Panel B along with the breakdown of all listed firms. Sample firms in Pharmaceuticals, Electric Appliances, and Transportation Equipment have ratios almost twice as high as those of all listed firms. As an export-oriented country, many household-name companies in Japan, such as Toyota, Honda, Sony, Panasonic, and Takeda Pharmaceutical, belong to these industries. In addition, 131 of the 399 sample firms are used to calculate Japan’s benchmark Nikkei 225 stock index. Taken together, the sample firms that analysts follow tend to be large, well-known blue-chip companies in Japan.
The analyst reports in this study use a five-category system to rate stocks (strong buy, buy, hold, sell, and strong sell). Table 2 presents the matrix of 2,277 changes in analysts’ ratings. The bottom row of the table shows that 9.4% of current analysts’ ratings are strong buy, 36.7% are buy, 49.2% are hold, 4.7% are sell, and none of the analysts’ ratings is strong sell. This finding is consistent with many other studies. Analysts appear to be reluctant to issue sell or strong sell ratings. Further, Table 2 also shows that there are 101 upgrades, 146 downgrades, and 1,980 reiterations. It appears that analysts are also hesitant to change analysts’ ratings. In the following tests, I combine hold and sell ratings into one category and convert the five-category system into a three-category system (strong buy, buy, and hold/sell).3
In addition to stock ratings, analysts also provide forecasts of key accounting figures for one or more future years. The key accounting figures include sales, operating profit, recurring profit, net income, EPS, CFPS, and dividends per share. In the following analysis, I use only sales, operating profit, recurring profit, and net income.
Table 3 summarizes the frequency of sales and earnings forecast revisions as well as forecast horizons. Forecast horizons vary from one-year ahead to three-years ahead. The one-year-ahead forecast is defined as the earliest year for which actual earnings had not been announced by the sample firm. Of the 2,277 analyst reports examined, 2,053 reports provide one-year-ahead forecasts, 1,977 reports provide two-year-ahead forecasts, and only 596 reports supply three-year-ahead forecasts. I do not calculate sales and earnings forecast revisions from two successive in time reports because occasionally analysts do not write reports on the same firm for months. Therefore, when previous sales and earnings forecasts are not
Table 2: Matrix of Changes in Analysts’ Stock RatingsNew Rating
Old Rating Strong Buy Buy Hold Sell Strong Sell TotalStrong Buy 198c 21b 14b 0b 0b 233Buy 15a 753c 82b 2b 0b 852Hold 2a 61a 1,002c 27b 0b 1,092Sell 0a 1a 22a 77c 0b 100Strong Sell 0a 0a 0a 0a 0c 0
Total 215 836 1,120 106 0 2,277% 9.4% 36.7% 49.2% 4.7% 0 100%
Note: This table shows the matrix of changes in analysts’ stock ratings. There are 101 upgrades (a), 146 downgrades (b), and 1,980 reiterations (c).
3 This treatment has been commonly used in other studies as well. For example, Francis and Soffer (1997) treat strong buy as buy and strong sell as sell, and Stickel (1995), using only changes in analysts’ ratings, also regards hold as sell.

The Japanese Accounting Review, 2 (2012), 87-11694
reported in a single analyst report, the report is treated as missing sales and earnings forecasts.With regard to the 2,053 one-year-ahead sales forecasts, 995 (48.5%) are upward revisions, 622
(30.3%) are unchanged from previous forecasts, and 436 (21.2%) are downward revisions. In sales forecasts, the number of upward revisions is more than twice the number of downward revisions. The forecast revisions of three types of earnings forecasts, operating profit, recurring profit, and net income, are more evenly distributed. For example, of the 2,053 one-year-ahead operating profit forecasts, 739 (36.0%) are upward revisions, 662 (32.2%) are unchanged from previous forecasts, and 652 (31.8%) are downward revisions. The distribution of two- and three-year-ahead forecast revisions of earnings forecasts are similar to that of one-year-ahead forecast revisions. It appears that analysts simultaneously change the three types of earnings forecasts in the same direction.
One noticeable finding that is evident from Table 3 is that there are fewer reiterations in sales and earnings forecasts than stock ratings. Approximately 30% of sales and earnings forecasts are unchanged from previous forecasts, while over 80% of stock ratings are reiterations. This suggests that it takes more for analysts to change stock ratings than to revise sales and earnings forecasts.
Table 3: Analysts’ Sales and Earnings Forecasts
Forecasted Item Revisions
One-year-ahead Two-year-ahead Three-year-aheadN % N % N %
Sales
Upward 995 48.5% 937 47.4% 249 41.8%Unchanged 622 30.3% 630 31.9% 250 41.9%Downward 436 21.2% 410 20.7% 97 16.3%Total 2,053 100.0% 1,977 100.0% 596 100.0%
Operating Profit
Upward 739 36.0% 727 36.8% 229 38.4%Unchanged 662 32.2% 638 32.3% 224 37.6%Downward 652 31.8% 612 31.0% 143 24.0%Total 2,053 100.0% 1,977 100.0% 596 100.0%
Recurring Profit
Upward 793 38.6% 773 39.1% 238 39.9%Unchanged 627 30.5% 598 30.2% 217 36.4%Downward 633 30.8% 606 30.7% 141 23.7%Total 2,053 100.0% 1,977 100.0% 596 100.0%
Net Income
Upward 830 40.4% 790 40.0% 246 41.3%Unchanged 587 28.6% 597 30.2% 216 36.2%Downward 636 31.0% 590 29.8% 134 22.5%Total 2,053 100.0% 1,977 100.0% 596 100.0%
Note: This table summarizes the frequency of sales and earnings forecast revisions and of the forecast horizons. Of the 2,277 analyst reports reviewed, 2,053 reports provide one-year-ahead sales and earnings forecasts, 1,977 reports provide two-year-ahead sales and earnings forecasts, and 596 reports provide three-year-ahead sales and earnings forecasts.

Ota: Information Content of Analysts’ Stock Ratings and Earnings Forecasts in the Presence ofManagement Earnings Forecasts
95
4. Empirical Results
4.1 Information Content of Analysts’ Stock RatingsFirst, I investigate the share price reaction to the release of analysts’ stock rating information. The
market reaction to an analyst report published on day 0 is measured as the compounded abnormal return over days 0 to +1, CAR(0,+1). This allows for a possible delay in the market’s reaction to the release of new information contained in analyst reports.4 Daily abnormal returns are calculated using the conventional market model (Campbell, Lo, and McKinlay, 1996; MacKinlay, 1997). The market model parameters are generated from a 100-day estimation period from 130 trading days through 31 trading days before the release of the analyst report.
The market reactions to analysts’ rating changes, analysts’ rating levels, and both analysts’ rating changes and levels are investigated using the following regressions.
CAR(0,+1) = a 1UPGRADE + a 2REITERATE + a 3DNGRADE + e , (1a)
CAR(0,+1) = a 1STRBUY + a 2BUY + a 3HOLDESELL + e , and (1b)
CAR(0,+1) = a 1UPSTRBUY + a 2UPBUY + a 3RESTRBUY + a 4REBUY + a 5REHOLDSELL +a 6DNBUY + a 7DNHOLDSELL + e , (1c)
where UPGRADE is an indicator variable taking the value of one if analysts’ ratings are upgraded and zero otherwise, REITERATE is an indicator variable taking the value of one if analysts’ rating are unchanged and zero otherwise, DNGRADE is an indicator variable taking the value of one if analysts’ ratings are downgraded and zero otherwise, STRBUY is an indicator variable taking the value of one if analysts’ ratings are strong buy and zero otherwise, BUY is an indicator variable taking the value of one if analysts’ ratings are buy and zero otherwise, HOLDSELL is an indicator variable taking the value of one if analysts’ ratings are hold or sell and zero otherwise, UPSTRBUY is an indicator variable taking the value of one if analysts’ ratings are upgraded to strong buy and zero otherwise, UPBUY is an indicator variable taking the value of one if analysts’ ratings are upgraded to buy and zero otherwise, RESTRBUY is an indicator variable taking the value of one if analysts’ ratings are unchanged from strong buy and zero otherwise, REBUY is an indicator variable taking the value of one if analysts’ ratings are unchanged from buy and zero otherwise, REHOLDSELL is an indicator variable taking the value of one if analysts’ ratings are unchanged from hold or sell and zero otherwise, DNBUY is an indicator variable taking the value of one if analysts’ ratings are downgraded to buy and zero otherwise, and DNHOLDSELL is an indicator variable taking the value of one if analysts’ ratings are downgraded to hold or sell and zero otherwise.
The estimated results of Eqs. (1a), (1b), and (1c) are presented in Panel A of Table 4. The results of Eq. (1a) indicate that the ordering of market reactions to stock rating changes is consistent with expectations (UPGRADE > REITERATE > DOWNGRADE). The estimated coefficients show that upgrades, reiterations, and downgrades are associated with average market responses of 4.54%, 0.36%, and −4.18%, respectively, and are all statistically significant at the 1% level. The results of estimating Eq. (1b) also exhibit the expected ordering of coefficients (STRBUY > BUY > HOLDSELL). Strong
4 The empirical results obtained in the following subsections are qualitatively similar when the abnormal return on day 0, AR(0), and the compounded abnormal return over days –1 to +1, CAR(–1,+1), are used.

The Japanese Accounting Review, 2 (2012), 87-11696
Table 4: Information Content of Analysts’ Stock RatingsPanel A: Information Content of Rating Levels and Changes
(1a) (1b) (1c)Coefficient t-statistic Coefficient t-statistic Coefficient t-statistic
UPGRADE 0.0454 11.40**REITERATE 0.0036 3.71**DNGRADE −0.0418 −8.179**STRBUY 0.0192 5.11**BUY 0.0075 4.98**HOLDSELL −0.0040 −2.92**UPSTRBUY 0.0635 5.51**UPBUY 0.0435 8.99**RESTRBUY 0.0154 4.04**REBUY 0.0052 3.40**REHOLDESELL 0.0002 0.16 DNBUY −0.0206 −1.83 DNHOLDSELL −0.0457 −8.13**adj.R2 0.1059 0.0273 0.1106N 2,053 2,053 2,053
Panel B: F tests for the Incremental Information Content of Rating Changes and LevelsInformativeness of rating changes conditional on rating levels: (1b) against (1c)
H0 : UPSTRBUY = RESTRBUY, UPBUY = REBUY = DNBUY, and REHOLDSELL = DNHOLDSELLF-statistic 48.97**
Informativeness of rating levels conditional on rating changes: (1a) against (1c)H0 : UPSTRBUY = UPBUY, RESTRBUY = REBUY = REHOLDSELL, and DNBUY = DNHOLDSELL
F-statistic 3.66**Note: This table presents the results of estimating the following OLS regressions.CAR(0,+1) = a 1UPGRADE + a 2REITERATE + a 3DNGRADE + e , (1a)CAR(0,+1) = a 1STRBUY + a 2BUY + a 3HOLDESELL + e , and (1b)CAR(0,+1) = a 1UPSTRBUY + a 2UPBUY + a 3RESTRBUY + a 4REBUY + a 5REHOLDSELL + a 6DNBUY + a 7DNHOLDSELL + e , (1c)where CAR(0,+1) is the cumulative abnormal stock return (raw return minus the market model predicted return) over a two day window comprising the day of the analyst report release and the following trading day, UPGRADE is an indicator variable taking the value of one if analysts’ ratings are upgraded and zero otherwise, REITERATE is an indicator variable taking the value of one if analysts’ ratings are unchanged and zero otherwise, DNGRADE is an indicator variable taking the value of one if analysts’ ratings are downgraded and zero otherwise, STRBUY is an indicator variable taking the value of one if analysts’ ratings are strong buy and zero otherwise, BUY is an indicator variable taking the value of one if analysts’ ratings are buy and zero otherwise, HOLDSELL is an indicator variable taking the value of one if analysts’ ratings are hold or sell and zero otherwise, UPSTRBUY is an indicator variable taking the value of one if analysts’ ratings are upgraded to strong buy and zero otherwise, UPBUY is an indicator variable taking the value of one if analysts’ ratings are upgraded to buy and zero otherwise, RESTRBUY is an indicator variable taking the value of one if analysts’ ratings are unchanged from strong buy and zero otherwise, REBUY is an indicator variable taking the value of one if analysts’ ratings are unchanged from buy and zero otherwise, REHOLDSELL is an indicator variable taking the value of one if analysts’ ratings are unchanged from hold or sell and zero otherwise, DNBUY is an indicator variable taking the value of one if analysts’ ratings are downgraded to buy and zero otherwise, and DNHOLDSELL is an indicator variable taking the value of one if analysts’ ratings are downgraded to hold or sell and zero otherwise. t-statistics are calculated using White (1980) heteroskedasticity-consistent standard errors. ** and * represent two-tailed significance at the 0.01 and 0.05 levels.

Ota: Information Content of Analysts’ Stock Ratings and Earnings Forecasts in the Presence ofManagement Earnings Forecasts
97
buy and buy ratings are associated with average price increases of 1.92% and 0.75%, respectively, while hold/sell ratings are associated with an average price decline of 0.40%. The estimated coefficients are also all statistically significant at the 1% level.
The results of Eqs. (1a) and (1b) indicate that analysts’ stock rating changes and stock rating levels are both individually informative to the market. Eq. (1c) investigates the effects of rating changes and rating levels on market prices conditional on one another. The results of Eq. (1c) display an interesting ordering of estimated coefficients (UPSTRBUY > UPBUY > RESTRBUY > REBUY > REHOLDSELL > DNBUY > DNHOLDSELL). This ordering suggests that the direction of rating changes (upgrade, reiteration, and downgrade) is a more decisive factor in explaining the market reaction than the level of analysts’ ratings (strong buy, buy, and hold/sell). However, when the direction of rating changes is the same, the rating level appears to determine the magnitude of the market reaction. For example, when newly released analysts’ ratings are unchanged from the previous ratings (RESTRBUY, REBUY, and REHOLDSELL), reiterations of strong buy, buy, and hold/sell ratings are associated with average market responses of 1.54%, 0.52%, and 0.02%, respectively. This is true with rating upgrades as well as rating downgrades. Upgrades to strong buy trigger a higher average price rise than upgrades to buy, 6.35% versus 4.35%, while downgrades to hold/sell evoke a further average price decline than downgrades to buy, −4.57% versus −2.06%.
The F-tests reported in Panel B of Table 4 investigate whether the changes in and levels of analysts’ ratings explain stock returns conditional on one another by comparing the explanatory power of Eq. (1c) with that of Eqs. (1b) and (1a). First, if the rating change is an important factor in explaining share price reactions beyond the rating level, then the null hypothesis of UPSTRBUY = RESTRBUY, UPBUY = REBUY = DNBUY, and REHOLDSELL = DNHOLDSELL would be rejected. The F-test comparing the explanatory power of Eq. (1b) with that of Eq. (1c) rejects the null hypothesis at the 1% level (F-statistic = 48.97), which indicates the incremental informativeness of rating changes conditional on rating levels. Next, if the rating level adds explanatory power beyond that conveyed by the rating change, then the null hypothesis of UPSTRBUY = UPBUY, RESTRBUY = REBUY = REHOLDSELL, and DNBUY = DNHOLDSELL would be rejected. The F-test comparing the explanatory power of Eq. (1a) with that of Eq. (1c) rejects the null hypothesis at the 1% level (F-statistic = 3.66), thereby suggesting the incremental informativeness of rating levels conditional on rating changes. Overall, the results of the joint tests in Panel B indicate that both rating changes and rating levels have incremental information content over one another.
4.2 Information Content of Analysts’ Sales and Earnings ForecastsNext, I investigate the share price reaction to the release of analysts’ sales and earnings forecast
information. The sales and earnings forecast revisions are defined as
Current analyst forecast − Previous analyst forecastForecast Revison =MVE at the beginning of the fiscal year
,
where both current and previous analysts’ forecasts are one-year-ahead sales and earnings forecasts reported in a single analyst report.
Using the forecast revisions defined above, the following regressions are estimated.
CAR(0,+1) = β 0 + β 1ΔSALES + e , (2a)

The Japanese Accounting Review, 2 (2012), 87-11698
CAR(0,+1) = β 0 + β 1ΔOPEPROFIT + e , (2b)
CAR(0,+1) = β 0 + β 1ΔRECURPROFIT + e , (2c)
CAR(0,+1) = β 0 + β 1ΔNETINCOME + e , and (2d)
CAR(0,+1) = β 0 + β 1ΔSALES + β 2ΔOPEPROFIT + β 3ΔRECURPROFIT + β 4ΔNETINCOME + e , (2e)
where ΔSALES is a revision of analysts’ one-year-ahead sales forecasts deflated by the MVE at the beginning of the fiscal year, ΔOPEPROFIT is a revision of analysts’ one-year-ahead operating profit forecasts deflated by the MVE at the beginning of the fiscal year, ΔRECURPROFIT is a revision of analysts’ one-year-ahead recurring profit forecasts deflated by the MVE at the beginning of the fiscal year, and ΔNETINCOME is a revision of analysts’ one-year-ahead net income forecasts deflated by the MVE at the beginning of the fiscal year.
The results of estimating Eqs. (2a) through (2e) are presented in Table 5. The estimated coefficients of Eqs. (2a) through (2d) are all statistically significantly positive at the 5% level or higher, which suggests that sales and the three types of earnings forecasts are all informative to the stock market on a stand-alone basis. However, in terms of the explanatory power of these regressions, ΔRECURPROFIT has the highest adj.R2 value, 0.0807, followed by 0.0760 for ΔOPEPROFIT, 0.0282 for ΔNETINCOME, and 0.0058 for ΔSALES. It appears that analysts’ recurring profit forecasts are more informative to the market than sales and other earnings forecasts. When all four variables (ΔSALES, ΔOPEPROFIT, ΔRECURPROFIT, and ΔNETINCOME) are included in the regression model (2e), only the estimated coefficient of ΔRECURPROFIT remains statistically significant, 0.7330 (t-statistic = 2.99), while those of other variables become insignificant.
The results of both univariate and multivariate tests indicate that among analysts’ sales and the three types of earnings forecasts, recurring profit forecasts provide the most valuable information to the market. On the basis of this finding, I use analysts’ recurring profit forecasts as analysts’ earnings forecasts in the following analysis.
4.3 Information Content of Analysts’ Stock Ratings and Earnings ForecastsThus far, the analysis has investigated the information content of analysts’ stock ratings and
earnings forecast revisions separately. In this section, I examine the market reaction to analysts’ rating changes, rating levels, and earnings forecast revisions, each of which is conditional on the others. I augment Eq. (1c) by adding revisions of analysts’ one-year-ahead recurring profit forecasts (ΔRECURPROFIT), which I use here as a proxy for analysts’ earnings forecast revisions (ΔAEF ).
CAR(0,+1) = g 1UPSTRBUY + g 2UPBUY + g 3RESTRBUY + g 4REBUY + g 5REHOLDSELL + g 6DNBUY + g 7DNHOLDSELL + g 8ΔAEF + e , (3)
where UPSTRBUY is an indicator variable taking the value of one if analysts’ ratings are upgraded to strong buy and zero otherwise, UPBUY is an indicator variable taking the value of one if analysts’ ratings are upgraded to buy and zero otherwise, RESTRBUY is an indicator variable taking the value of one if analysts’ ratings are unchanged from strong buy and zero otherwise, REBUY is an indicator variable taking the value of one if analysts’ ratings are unchanged from buy and zero otherwise,
Ota: Information Content of Analysts’ Stock Ratings and Earnings Forecasts in the Presence ofManagement Earnings Forecasts
99
REHOLDSELL is an indicator variable taking the value of one if analysts’ ratings are unchanged from hold or sell and zero otherwise, DNBUY is an indicator variable taking the value of one if analysts’ ratings are downgraded to buy and zero otherwise, DNHOLDSELL is an indicator variable taking the value of one if analysts’ ratings are downgraded to hold or sell and zero otherwise, and ΔAEF is a revision of analysts’ one-year-ahead recurring profit forecasts deflated by the MVE at the beginning of the fiscal year.
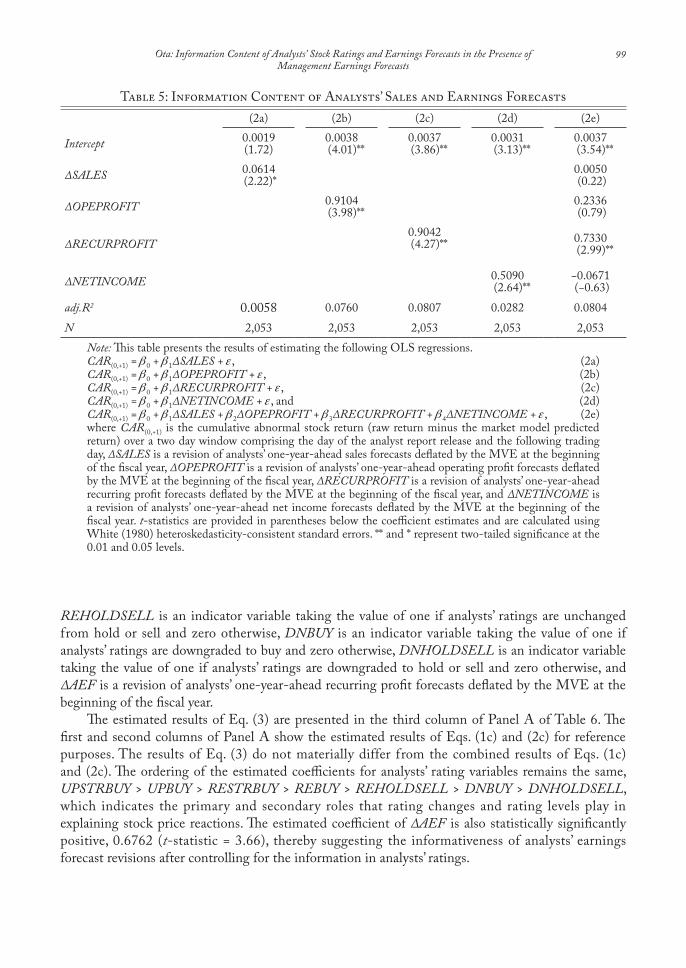
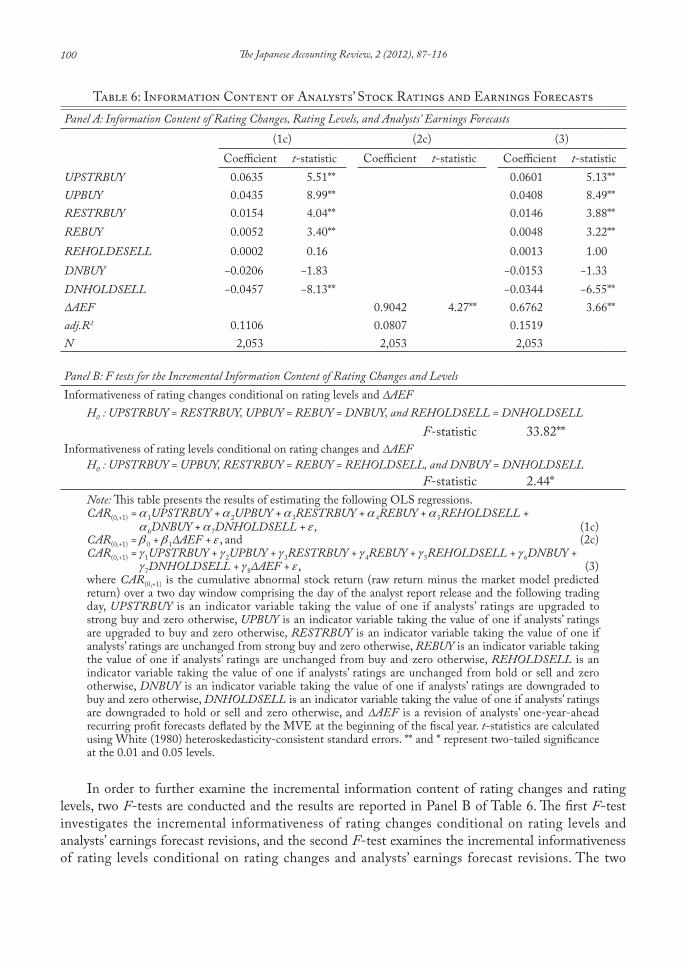
The estimated results of Eq. (3) are presented in the third column of Panel A of Table 6. The first and second columns of Panel A show the estimated results of Eqs. (1c) and (2c) for reference purposes. The results of Eq. (3) do not materially differ from the combined results of Eqs. (1c) and (2c). The ordering of the estimated coefficients for analysts’ rating variables remains the same, UPSTRBUY > UPBUY > RESTRBUY > REBUY > REHOLDSELL > DNBUY > DNHOLDSELL, which indicates the primary and secondary roles that rating changes and rating levels play in explaining stock price reactions. The estimated coefficient of ΔAEF is also statistically significantly positive, 0.6762 (t-statistic = 3.66), thereby suggesting the informativeness of analysts’ earnings forecast revisions after controlling for the information in analysts’ ratings.
Table 5: Information Content of Analysts’ Sales and Earnings Forecasts(2a) (2b) (2c) (2d) (2e)
Intercept 0.0019(1.72)
0.0038 (4.01)**
0.0037 (3.86)**
0.0031 (3.13)**
0.0037 (3.54)**
ΔSALES 0.0614 (2.22)*
0.0050 (0.22)
ΔOPEPROFIT 0.9104 (3.98)**
0.2336 (0.79)
ΔRECURPROFIT0.9042
(4.27)** 0.7330 (2.99)**
ΔNETINCOME 0.5090 (2.64)**
−0.0671 (−0.63)
adj.R2 0.0058 0.0760 0.0807 0.0282 0.0804N 2,053 2,053 2,053 2,053 2,053
Note: This table presents the results of estimating the following OLS regressions.CAR(0,+1) = β 0 + β 1ΔSALES + e , (2a)CAR(0,+1) = β 0 + β 1ΔOPEPROFIT + e , (2b)CAR(0,+1) = β 0 + β 1ΔRECURPROFIT + e , (2c)CAR(0,+1) = β 0 + β 1ΔNETINCOME + e , and (2d)CAR(0,+1) = β 0 + β 1ΔSALES + β 2ΔOPEPROFIT + β 3ΔRECURPROFIT + β 4ΔNETINCOME + e , (2e)where CAR(0,+1) is the cumulative abnormal stock return (raw return minus the market model predicted return) over a two day window comprising the day of the analyst report release and the following trading day, ΔSALES is a revision of analysts’ one-year-ahead sales forecasts deflated by the MVE at the beginning of the fiscal year, ΔOPEPROFIT is a revision of analysts’ one-year-ahead operating profit forecasts deflated by the MVE at the beginning of the fiscal year, ΔRECURPROFIT is a revision of analysts’ one-year-ahead recurring profit forecasts deflated by the MVE at the beginning of the fiscal year, and ΔNETINCOME is a revision of analysts’ one-year-ahead net income forecasts deflated by the MVE at the beginning of the fiscal year. t-statistics are provided in parentheses below the coefficient estimates and are calculated using White (1980) heteroskedasticity-consistent standard errors. ** and * represent two-tailed significance at the 0.01 and 0.05 levels.
The Japanese Accounting Review, 2 (2012), 87-116100
In order to further examine the incremental information content of rating changes and rating levels, two F-tests are conducted and the results are reported in Panel B of Table 6. The first F-test investigates the incremental informativeness of rating changes conditional on rating levels and analysts’ earnings forecast revisions, and the second F-test examines the incremental informativeness of rating levels conditional on rating changes and analysts’ earnings forecast revisions. The two
Table 6: Information Content of Analysts’ Stock Ratings and Earnings ForecastsPanel A: Information Content of Rating Changes, Rating Levels, and Analysts’ Earnings Forecasts
(1c) (2c) (3)Coefficient t-statistic Coefficient t-statistic Coefficient t-statistic
UPSTRBUY 0.0635 5.51** 0.0601 5.13**UPBUY 0.0435 8.99** 0.0408 8.49**RESTRBUY 0.0154 4.04** 0.0146 3.88**REBUY 0.0052 3.40** 0.0048 3.22**REHOLDESELL 0.0002 0.16 0.0013 1.00 DNBUY −0.0206 −1.83 −0.0153 −1.33 DNHOLDSELL −0.0457 −8.13** −0.0344 −6.55**ΔAEF 0.9042 4.27** 0.6762 3.66**adj.R2 0.1106 0.0807 0.1519N 2,053 2,053 2,053
Panel B: F tests for the Incremental Information Content of Rating Changes and LevelsInformativeness of rating changes conditional on rating levels and ΔAEF
H0 : UPSTRBUY = RESTRBUY, UPBUY = REBUY = DNBUY, and REHOLDSELL = DNHOLDSELLF-statistic 33.82**
Informativeness of rating levels conditional on rating changes and ΔAEFH0 : UPSTRBUY = UPBUY, RESTRBUY = REBUY = REHOLDSELL, and DNBUY = DNHOLDSELL
F-statistic 2.44*Note: This table presents the results of estimating the following OLS regressions.CAR(0,+1) = a 1UPSTRBUY + a 2UPBUY + a 3RESTRBUY + a 4REBUY + a 5REHOLDSELL + a 6DNBUY + a 7DNHOLDSELL + e , (1c)CAR(0,+1) = β 0 + β 1ΔAEF + e , and (2c)CAR(0,+1) = g 1UPSTRBUY + g 2UPBUY + g 3RESTRBUY + g 4REBUY + g 5REHOLDSELL + g 6DNBUY + g 7DNHOLDSELL + g 8ΔAEF + e , (3)where CAR(0,+1) is the cumulative abnormal stock return (raw return minus the market model predicted return) over a two day window comprising the day of the analyst report release and the following trading day, UPSTRBUY is an indicator variable taking the value of one if analysts’ ratings are upgraded to strong buy and zero otherwise, UPBUY is an indicator variable taking the value of one if analysts’ ratings are upgraded to buy and zero otherwise, RESTRBUY is an indicator variable taking the value of one if analysts’ ratings are unchanged from strong buy and zero otherwise, REBUY is an indicator variable taking the value of one if analysts’ ratings are unchanged from buy and zero otherwise, REHOLDSELL is an indicator variable taking the value of one if analysts’ ratings are unchanged from hold or sell and zero otherwise, DNBUY is an indicator variable taking the value of one if analysts’ ratings are downgraded to buy and zero otherwise, DNHOLDSELL is an indicator variable taking the value of one if analysts’ ratings are downgraded to hold or sell and zero otherwise, and ΔAEF is a revision of analysts’ one-year-ahead recurring profit forecasts deflated by the MVE at the beginning of the fiscal year. t-statistics are calculated using White (1980) heteroskedasticity-consistent standard errors. ** and * represent two-tailed significance at the 0.01 and 0.05 levels.

Ota: Information Content of Analysts’ Stock Ratings and Earnings Forecasts in the Presence ofManagement Earnings Forecasts
101
F-statistics in Panel B, 33.82 and 2.44, both reject the null hypotheses of no incremental information content of rating changes and rating levels at the 5% level or higher. Overall, these results indicate that neither analysts’ stock ratings nor analysts’ earnings forecast revisions subsume the information of the other.
4.4 Timing and Frequency of Analyst Report PublicationsMost analyst reports published in Japan include information on management sales and earnings
forecasts along with analysts’ forecasts. In fact, of the 2,053 analyst reports examined, 2,037 (99.2%) contained the figures of the most recently publicized management forecasts. This is because Japanese firms are required by the stock exchange disclosure guidelines to provide one-year-ahead sales and earnings forecasts at quarterly and annual earnings announcements. In addition, when a significant change in previously published forecasts arises (±10% of sales forecasts, ±30% of earnings forecasts), corporate managers in Japan are required to announce revised forecasts immediately. A survey conducted in 2006 reveales that 3,790 of the 3,831 listed firms (98.9%) provided management forecasts in that year. Thus, management forecasts are publicly available in Japan and existing evidence documents that they provide valuable information to financial analysts and investors (Conroy, Harris, and Park, 1998; Conroy, Eades, and Harris, 2000; Ota, 2010).
This section examines the timing and frequency of analyst report publications relative to the announcement dates of management earnings forecasts. I compute the number of trading days between the analyst report publication date and the previously and subsequently announced management forecast date. Figure 1(A) presents the frequency of analyst reports at various points in time relative to the following announcement of management forecasts. It is clear from the figure that few reports are published before the releases of management forecasts. In fact, only 43 of the 2,037 analyst reports are published within 10 trading days (two weeks) before the release of management forecasts. The figure also reveals that the issuance of analyst reports is concentrated in the interval between 50 and 69 trading days before the release of the following management forecasts. The average (median) number of trading days between the analyst report publication date and the subsequent management forecast announcement date is 55.9 (58.0).
Figure 1(B) presents the frequency of analyst reports at various points in time relative to the most recently announced management forecasts. It is evident from the figure that over half of the analyst reports (1,062 of 2,037 or 52.1% of all reports) are published on the day after the management forecast announcement. A high frequency of analyst report publications is also observed over the next several days. The average (median) number of trading days between the analyst report publication date and the most recent management forecast announcement date is 10.7 (1.0). The finding that over half of the analyst report publications are driven by the public announcement of management forecasts is not exactly unexpected, as a majority of management forecasts are released at quarterly and annual earnings announcements and earlier studies document that analysts’ ratings and earnings forecast revisions are concentrated on the earnings announcement day and following several days (Stickel, 1989; Bowen, Davis, and Matsumoto, 2002; Ivković and Jegadeesh, 2004). This is also consistent with the finding shown in Figure 1(A) that a large fraction of analyst reports are published 50 to 69 trading days (10 to 14 weeks) before the following announcement of management forecasts because the length of the period corresponds approximately to the length of a fiscal quarter.
One aspect of the release of management forecasts and analyst reports that requires special attention is the time of day when they are published. Stock exchanges in Japan require listed companies to make timely disclosures of material corporate information such as financial results and

The Japanese Accounting Review, 2 (2012), 87-116102
543628146
7197
178202
626603
75
1117
118
0
100
200
300
400
500
600
700
-1-2-3-4-5-6-7-8-9-10-19
-20-29
-30-39
-40-49
-50-59
-60-69
-70-79
-80-89
-90-99
Under -100
Num
ber of analyst reports
1,062
185
65 56 31 29 27 25 24 1882 62 68 42 33 18 24 21
165
0
200
400
600
800
1,000
1,200
1 2 3 4 5 6 7 8 9 10 11-15
16-20
21-25
26-30
31-35
36-40
41-45
46-50
Over 50
Num
ber o
f ana
lyst r
epor
ts
Note: This figure presents the frequency of analyst reports at various points in time relative to the following management forecast announcement date. The total number of analyst reports with management forecast information is 2,037.
Note: This figure presents the frequency of analyst reports at various points in time relative to the most recent management forecast announcement date. The total number of analyst reports with management forecast information is 2,037.
Trading days until the following management forecast announcement
Trading days after the previous management forecast announcement
Figure 1(A): Frequency of Analyst Reports Prior to The Issuance of Management Forecasts
Figure 1(B): Frequency of Analyst Reports Subsequent to The Issuance of Management Forecasts

Ota: Information Content of Analysts’ Stock Ratings and Earnings Forecasts in the Presence ofManagement Earnings Forecasts
103
forecasts through the Timely Disclosure Network (TDnet). Once the information is disclosed on TDnet for public inspection, trading in shares based on the information is exempt from the insider trading regulation. The Company Announcement Disclosure Service, which is a part of TDnet, keeps records of such disclosed information, and the database shows that the vast majority of company announcements are made public after the market closes at 3 p.m. and particularly on Fridays. This is presumably done to give the market sufficient time to digest newly released information and to avoid sudden fluctuations in stock prices. As a result, there is a one-day discrepancy between the management forecast announcement date and the date when the market actually incorporates the information. On the other hand, analyst reports are usually prepared and disseminated to clients in the early morning before the market opens at 9 a.m. Thus, the 1,062 analyst reports that are published the day after the announcement of management forecasts are released practically simultaneously with management forecasts.
4.5 Information Content of Analysts’ Forecasts in the Presence of Concurrently Announced Management Forecasts
In the following sections, I use the subsample of analyst reports published the day after the announcement of management forecasts, which are the 1,062 analyst reports in Figure 1(B). The simultaneously announced subsample provides an ideal opportunity, with less concern for other events taking place, to investigate the incremental information content of analysts’ ratings and earnings forecasts conditional on the publicly available management forecast information. There are three cases where concurrent announcements occur, and different treatments must be applied in each case.
Case 1: Simultaneous releases of analyst reports and management forecasts at quarterly earnings announcements.
This is probably the most contaminated case of the three. Since only annual earnings forecasts are provided by both analysts and management, the surprise element in actual quarterly earnings cannot be controlled for. However, it can be argued that if there is a surprise in actual quarterly earnings, it may be reflected in the company’s contemporaneously released annual earnings forecasts. Figure 2(A) illustrates the decomposition of surprise elements at quarterly earnings announcements. I divide the revision of analysts’ earnings forecasts, ΔAEF, into two components, ΔMEF_PAEF and ΔAEF_MEF. The former is the difference between current management earnings forecasts (MEF) and previous analysts’ earnings forecasts (PAEF), and the latter is the difference between current analysts’ earnings forecasts (AEF) and current management forecasts (MEF). As with ΔAEF, both variables are deflated by the MVE at the beginning of the fiscal year. The former component represents the surprise element brought by the release of new management earnings forecasts, while the latter captures the surprise element conveyed by the publication of new analysts’ earnings forecasts. If analysts’ earnings forecasts have informational value beyond concurrently released management earnings forecasts, ΔAEF_MEF will add some explanatory power in explaining share price reactions. I use the following regression model to investigate the impact.
CAR(0,+1) = d 1UPSTRBUY + d 2UPBUY + d 3RESTRBUY + d 4REBUY + d 5REHOLDSELL + d 6DNBUY + d 7DNHOLDSELL + d 8ΔMEF_PAEF + d 9ΔAEF_MEF + e , (4)

The Japanese Accounting Review, 2 (2012), 87-116104
where UPSTRBUY is an indicator variable taking the value of one if analysts’ ratings are upgraded to strong buy and zero otherwise, UPBUY is an indicator variable taking the value of one if analysts’ ratings are upgraded to buy and zero otherwise, RESTRBUY is an indicator variable taking the value
Day K+1
MEFAnnounced
MarketOpening
∆MEF_PAEF
Day K
9 a.m. 3 p.m.
MarketClosing
AEFPublished Published
∆AEF_MEF
PAEF
Day K+1
Et & t+1Announced
MarketOpening
∆MEF_PAEF
Day K
9 a.m. 3 p.m.
MarketClosing
t+1Published
PAEF & t+1tPublished
∆AEF_MEF t+1
∆EARNSURP t
t+1
AEFMEFPAEF
Note: This figure illustrates the decomposition of surprise elements at quarterly earnings announcements (Case 1) and at announcements of revisions of management forecasts (Case 3). ΔMEF_PAEF = MEF − PAEF and ΔAEF_MEF = AEF – MEF, where MEF is management recurring profit forecasts, AEF is analysts’ recurring profit forecasts, and PAEF is analysts’ previous recurring profit forecasts. All forecasts are one-year-ahead annual forecasts and are deflated by the MVE at the beginning of the fiscal year.
Note: This figure illustrates the decomposition of surprise elements at annual earnings announcements (Case 2). ΔMEF_PAEFt+1 = MEFt+1 − PAEFt+1, ΔAEF_MEFt+1 = AEFt+1 – MEFt+1, and ΔEARNSURPt = Et – PAEFt , where MEFt+1 is management recurring profit forecasts for year t + 1, PAEFt+1 is analysts’ previous recurring profit forecasts for year t + 1, AEFt+1 is analysts’ recurring profit forecasts for year t + 1, Et is actual recurring profit for year t , and PAEFt is analysts’ previous recurring profit forecasts for year t. All forecasts are one-year-ahead annual forecasts except for PAEFt+1, which are two-year-ahead annual forecasts at the time of the publication. All variables are deflated by the MVE at the beginning of the fiscal year.
Figure 2(A): Decomposition of Surprise Elements in Cases 1 and 3
Figure 2(B): Decomposition of Surprise Elements in Case 2

Ota: Information Content of Analysts’ Stock Ratings and Earnings Forecasts in the Presence ofManagement Earnings Forecasts
105
of one if analysts’ ratings are unchanged from strong buy and zero otherwise, REBUY is an indicator variable taking the value of one if analysts’ ratings are unchanged from buy and zero otherwise, REHOLDSELL is an indicator variable taking the value of one if analysts’ ratings are unchanged from hold or sell and zero otherwise, DNBUY is an indicator variable taking the value of one if analysts’ ratings are downgraded to buy and zero otherwise, DNHOLDSELL is an indicator variable taking the value of one if analysts’ ratings are downgraded to hold or sell and zero otherwise, ΔMEF_PAEF is management recurring profit forecasts minus analysts’ previous recurring profit forecasts (MEF − PAEF ) deflated by the MVE at the beginning of the fiscal year, and ΔAEF_MEF is analysts’ recurring profit forecasts minus management recurring profit forecasts (AEF – MEF ) deflated by the MVE at the beginning of the fiscal year. All earnings forecasts are one-year-ahead annual forecasts.
Case 2: Simultaneous releases of analyst reports and management forecasts at annual earnings announcements.
This is the most complicated case of the three. In addition to the two types of earnings forecasts for the upcoming year, MEF and AEF, actual earnings for the recently completed year are also announced at the same time. Figure 2(B) depicts the surprise elements at annual earnings announcements. As with Case 1, I use ΔMEF_PAEF and ΔAEF_MEF to capture the surprise components brought by two current earnings forecasts. For the surprise element conveyed by actual earnings, I define ΔEARNSURP as the difference between actual earnings and previous analysts’ earnings forecasts for the recently completed year. The following regression is used to assess these impacts.
CAR(0,+1) = d 1UPSTRBUY + d 2UPBUY + d 3RESTRBUY + d 4REBUY + d 5REHOLDSELL + d 6DNBUY + d 7DNHOLDSELL + d 8ΔMEF_PAEF + d 9ΔAEF_MEF + (5) d 10ΔEARNSURP + e ,
where ΔEARNSRUP is actual recurring profit for the recently completed year minus previous analysts’ recurring profit forecasts for the recently completed year deflated by the MVE at the beginning of the recently completed year. The definitions of other variables are the same as those in Eq. (4).
Case 3: Simultaneous releases of analyst reports and management forecasts at announcements of revisions of management earnings forecasts.
This is the ideal case of the three for inspecting the respective informativeness of analysts’ and management earnings forecasts. Companies’ managers are required by the disclosure guidelines prescribed by the stock exchanges to announce revised forecasts immediately when there is a significant change in previously published forecasts (±10% of sales forecasts and ±30% of earnings forecasts). Thus, the forecast revisions occur without prior notice and usually without other concurrent announcements. The regression model employed in Case 3 is the same as Case 1, which is Eq. (4). Only the sample observations used for estimation differ between Case 3 and Case 1.
The results of the analysis using the subsample of 1,062 analyst reports issued simultaneously with management forecasts are presented in Table 7. The first and second columns in Panel A show the results of estimating Eqs. (3) and (4) using all observations in the subsample. Eq. (3) ignores

The Japanese Accounting Review, 2 (2012), 87-116106
the management earnings forecast information contained in analyst reports and uses revisions of analysts’ earnings forecasts, ΔAEF, while Eq. (4) includes the management forecast information and splits ΔAEF into two components, ΔMEF_PAEF and ΔAEF_MEF. The estimation results of Eq. (3) are similar to those reported in Table 6. The estimated coefficient of ΔAEF is significantly positive, 1.3159, indicating the informativeness of analysts’ earnings forecasts. The results of Eq. (4) show that the estimated coefficients of ΔMEF_PAEF and ΔAEF_MEF are 1.3464 and 1.1256, respectively, and are both significant at the 1% level. These findings indicate that neither companies’ earnings forecasts nor analysts’ earnings forecasts subsume the information of the other.
Panel B of Table 7 reports the results of two F-tests that investigate the incremental information content of rating changes and rating levels using Eq. (4) with all observations in the subsample. The first F-test examines the incremental information content of rating changes conditional on rating levels and management and analysts’ earnings forecasts. The F-statistic obtained is 13.17, which is significant at the 1% level. This indicates the incremental informativeness of rating changes beyond information contained in rating levels and two types of earnings forecasts. The second F-test investigates the incremental information content of rating levels conditional on rating changes and two types of earnings forecasts. It rejects the null hypothesis of no information content of rating levels at the 10% level (F-statistic = 2.28). These somewhat weaker results of the two F-tests, compared with those reported in Table 6, may be attributed to the reduction in the sample size. The ordering of the estimated coefficients for analysts’ stock rating variables remains the same, UPSTRBUY > UPBUY > RESTRBUY > REBUY > REHOLDSELL > DNBUY > DNHOLDSELL, thereby suggesting the primary and secondary roles of rating changes and rating levels in explaining stock price reactions.
The third, fourth, and fifth columns of Panel A of Table 7 present the estimated results for Cases 1, 2, and 3, respectively. Of the 1,062 analyst reports that are issued contemporaneously with management forecasts, 694 are announced at quarterly earnings announcements (Case 1), 217 at annual earnings announcements (Case 2), and 151 at announcements of revisions of management forecasts (Case 3). The estimation results of Eq. (4) in Case 1 are similar to those with all observations in the second column. The estimated coefficients of ΔMEF_PAEF and ΔAEF_MEF are both significantly positive, 0.9671 and 1.0593, which indicates the incremental informativeness of analysts’ earnings forecasts conditional on management earnings forecasts, and vice versa. One notable finding in Case 1 is that adj.R2 is 0.0977, which is much lower than the other two cases. The low explanatory power in Case 1 may be attributed to the lack of control for the impact of the announcement of actual quarterly earnings.
The estimation results of Eq. (5) in Case 2 reveal that while the estimated coefficients of ΔMEF_PAEF and ΔAEF_MEF are both significantly positive, 1.4973 and 0.9039, the coefficient of ΔEARNSURP is positive, 0.1040, but not statically significant. These findings suggest that the announcement of actual annual earnings does not convey valuable information to the market beyond information contained in corporate managers’ next-year earnings forecasts and analysts’ forecasts. This is not unpredicted considering the results reported in prior research. For example, Conroy et al. (1998) and Conroy et al. (2000) document that the market reaction to the surprise component of management earnings forecasts is much more pronounced than to the unexpected component of actual earnings at annual earnings announcements. Ota (2010) also finds that the value relevance of actual earnings almost disappears once the impact of management earnings forecasts is accounted for. It appears that the market is more concerned with analysts’ and corporate insiders’ views of future earnings than the mere publication of historical numbers.
There are only 151 observations for estimating Eq. (4) in Case 3, and they contain neither

Ota: Information Content of Analysts’ Stock Ratings and Earnings Forecasts in the Presence ofManagement Earnings Forecasts
107Ta
ble
7: In
form
atio
n C
onte
nt o
f A
naly
sts’
Fore
cast
s in
The
Pres
ence
of
Con
curr
entl
y A
nnou
nced
Man
agem
ent
Ear
ning
sFo
reca
sts
Pane
l A: I
nfor
mat
ion C
onten
t of R
atin
g Cha
nges,
Rat
ing L
evels
, Ana
lysts’
Ear
ning
s For
ecasts
, and
Man
agem
ent E
arni
ngs F
oreca
stsIg
norin
g m
anag
emen
t ea
rnin
gs fo
reca
sts(A
ll ob
serv
atio
ns) (
3)
Inclu
ding
man
agem
ent
earn
ings
fore
casts
(All
obse
rvat
ions
) (4)
Cas
e 1:
At q
uarte
rly ea
rnin
gs
anno
unce
men
ts (4
)
Cas
e 2:
At a
nnua
l ear
ning
s an
noun
cem
ents
(5)
Cas
e 3:
At n
on-p
erio
dic f
orec
ast
revi
sions
(4)
Coe
fficie
ntt-
statis
ticC
oeffi
cient
t-sta
tistic
Coe
fficie
ntt-
statis
ticC
oeffi
cient
t-sta
tistic
Coe
fficie
ntt-
statis
ticU
PSTR
BUY
0.05
932.
82**
0.06
102.
85**
0.05
002.
23 *
0.09
1136
.58*
*n/
an/
aU
PBU
Y0.
0300
4.05
**0.
0309
4.20
**0.
0308
2.26
*0.
0290
2.91
**0.
0341
3.01
**RE
STRB
UY
0.01
482.
37 *
0.01
612.
57**
0.02
132.
70**
0.00
450.
22 *
−0.0
080
−0.7
3 RE
BUY
0.00
492.
18 *
0.00
592.
50 *
0.00
170.
60
0.01
662.
99**
0.01
091.
78 †
REH
OLD
ESEL
L0.
0020
1.08
0.
0022
1.20
0.
0014
0.65
0.
0049
1.05
0.
0050
0.89
D
NBU
Y−0
.016
7−1
.12
−0.0
156
−1.0
4 −0
.011
7−0
.75
−0.0
598
−8.8
3**
n/a
n/a
DN
HO
LDSE
LL−0
.046
5−4
.36*
*−0
.045
1−4
.23*
*−0
.048
1−3
.37*
*−0
.010
9−0
.94
−0.0
704
−2.4
8 *ΔA
EF1.
3159
6.65
**ΔM
EF_P
AEF
1.34
646.
58**
0.96
713.
50**
1.49
735.
41**
1.45
383.
73**
ΔAEF
_MEF
1.12
565.
31**
1.05
933.
44**
0.90
391.
99 *
1.15
043.
26**
ΔEAR
NSU
RP0.
1040
0.25
ad
j.R2
0.20
920.
2103
0.09
770.
2343
0.44
19N
1,06
21,
062
694
217
151
Pane
l B: F
tests
for t
he In
crem
enta
l Inf
orm
ation
Con
tent o
f Rat
ing C
hang
es an
d Le
vels
(All
Obs
erva
tions
)In
form
ativ
enes
s of r
atin
g ch
ange
s con
ditio
nal o
n ra
ting
leve
ls, an
alys
ts’ ea
rnin
gs fo
reca
sts, a
nd m
anag
emen
t ear
ning
s for
ecas
tsH
0 : U
PSTR
BUY
= RE
STRB
UY,
UPB
UY
= RE
BUY
= D
NBU
Y, an
d RE
HO
LDSE
LL =
DN
HO
LDSE
LLF-
statis
tic13
.17*
*In
form
ativ
enes
s of r
atin
g le
vels
cond
ition
al on
ratin
g ch
ange
s, an
alys
ts’ ea
rnin
gs fo
reca
sts, a
nd m
anag
emen
t ear
ning
s for
ecas
tsH
0 : U
PSTR
BUY
= U
PBU
Y, R
ESTR
BUY
= RE
BUY
= RE
HO
LDSE
LL, a
nd D
NBU
Y =
DN
HO
LDSE
LLF-
statis
tic2.
28†
N
ote:
This
tabl
e pr
esen
ts th
e re
sults
of e
stim
atin
g th
e fo
llowi
ng O
LS re
gres
sions
usin
g on
ly th
e su
bsam
ple
of a
naly
st re
ports
that
are
pub
liciz
ed si
mul
tane
ously
with
man
agem
ent
earn
ings
fore
casts
(1,0
62 re
ports
).C
AR(0
,+1) =
g 1U
PSTR
BUY
+ g2U
PBU
Y + g
3RES
TRBU
Y + g
4REB
UY
+ g5R
EHO
LDSE
LL +
g 6D
NBU
Y + g
7DN
HO
LDSE
LL +
g 8ΔA
EF +
e,
(3)
CAR
(0,+
1) =
d1U
PSTR
BUY
+ d2U
PBU
Y + d
3RES
TRBU
Y + d
4REB
UY
+ d5R
EHO
LDSE
LL +
d6D
NBU
Y + d
7DN
HO
LDSE
LL +
d8Δ
MEF
_PAE
F + d
9ΔAE
F_M
EF +
e, a
nd
(4)
CAR
(0,+
1) =
d1U
PSTR
BUY
+ d2U
PBU
Y + d
3RES
TRBU
Y + d
4REB
UY
+ d5R
EHOL
DSE
LL +
d6D
NBU
Y + d
7DN
HOL
DSE
LL +
d8Δ
MEF
_PAE
F + d
9ΔAE
F_M
EF +
d10
ΔEAR
NSU
RP +
e,
(5)
wher
e ΔM
EF_P
AEF
is m
anag
emen
t rec
urrin
g pr
ofit f
orec
asts
(MEF
) min
us a
naly
sts’ p
revio
us re
curri
ng p
rofit
fore
casts
(PAE
F) d
eflat
ed b
y th
e M
VE
at th
e be
ginn
ing
of th
e fis
cal
year,
ΔAE
F_M
EF is
analy
sts’ c
urre
nt re
curri
ng p
rofit
fore
casts
(AEF
) min
us m
anag
emen
t rec
urrin
g pr
ofit f
orec
asts
(MEF
) defl
ated
by
the M
VE
at th
e beg
inni
ng o
f the
fisc
al ye
ar, an
d ΔE
ARN
SRU
P is
actu
al re
curri
ng p
rofit
for t
he re
cent
ly co
mpl
eted
yea
r min
us p
revio
us a
naly
sts’ r
ecur
ring
profi
t for
ecas
ts fo
r the
rece
ntly
com
plet
ed y
ear d
eflat
ed b
y th
e M
VE
at th
e be
ginn
ing
of th
e re
cent
ly co
mpl
eted
year.
Oth
er v
ariab
les a
re d
efine
d in
Tab
le 6.
t-sta
tistic
s are
calcu
lated
usin
g W
hite
(198
0) h
eter
oske
dasti
city-
cons
isten
t sta
ndar
d er
rors.
**, *
, and
†
repr
esen
t two
-tail
ed si
gnifi
canc
e at t
he 0
.01,
0.05
, and
0.1
0 lev
els.
The Japanese Accounting Review, 2 (2012), 87-116108
upgrade to strong buy nor downgrade to hold/sell. Thus, the two indicator variables in Eq. (4), UPSTRBUY and DNHOLDSELL, cannot be estimated. As with Cases 1 and 2, the estimated coefficients of ΔMEF_PAEF and ΔAEF_MEF are both significantly positive, 1.4538 and 1.1504, thereby indicating the incremental information content of management and analysts’ earnings forecasts conditional on one another. Case 3 also exhibits the highest adj.R2 value, 0.4419. This may be attributable to the fact that Case 3 provides the most ideal setting for testing the information content of analysts’ and management forecasts because no other confounding events take place at non-periodic revisions of management forecasts.
Overall, the results reported in Table 7 indicate that neither companies’ earnings forecasts nor concurrently released analysts’ earnings forecasts subsume the information of the other. Analysts’ stock rating information also possesses incremental information content beyond information provided by the two types of earnings forecasts. These findings suggest that analysts are not merely conveying the information disclosed by managers, but rather are bringing value to the stock market by providing their insights on the firm’s future performance. The incremental informativeness of analysts’ forecasts in the presence of management forecasts can also be construed as an indication of the stock market relying more on analysts’ earnings forecasts than on management earnings forecasts. This possibility is further explored in the next section.
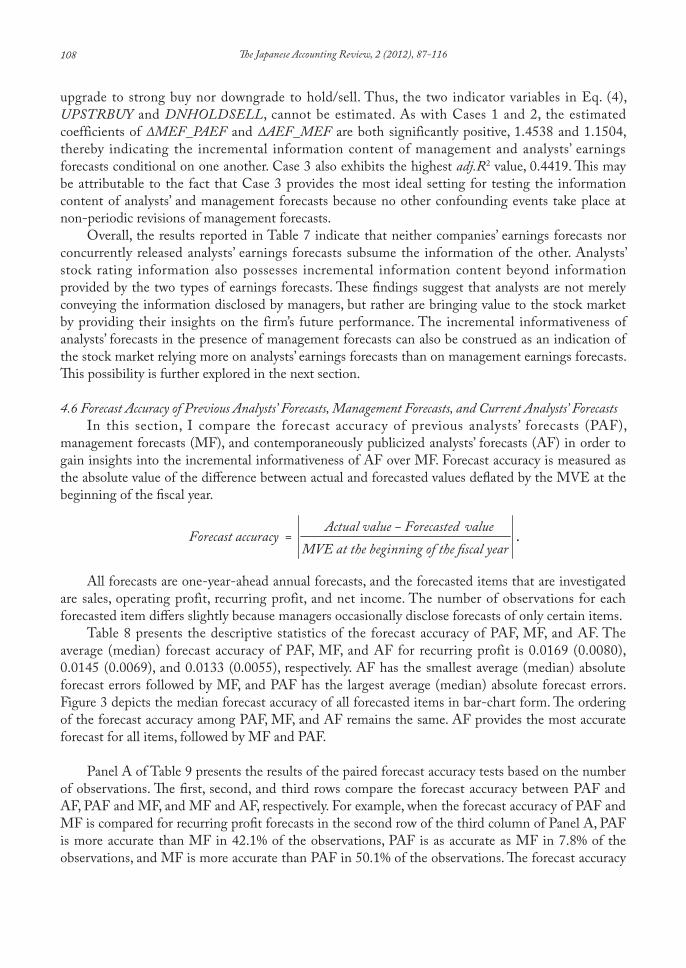
4.6 Forecast Accuracy of Previous Analysts’ Forecasts, Management Forecasts, and Current Analysts’ ForecastsIn this section, I compare the forecast accuracy of previous analysts’ forecasts (PAF),
management forecasts (MF), and contemporaneously publicized analysts’ forecasts (AF) in order to gain insights into the incremental informativeness of AF over MF. Forecast accuracy is measured as the absolute value of the difference between actual and forecasted values deflated by the MVE at the beginning of the fiscal year.
Actual value − Forecasted valueForecast accuracy =
MVE at the beginning of the fiscal year.
All forecasts are one-year-ahead annual forecasts, and the forecasted items that are investigated are sales, operating profit, recurring profit, and net income. The number of observations for each forecasted item differs slightly because managers occasionally disclose forecasts of only certain items.
Table 8 presents the descriptive statistics of the forecast accuracy of PAF, MF, and AF. The average (median) forecast accuracy of PAF, MF, and AF for recurring profit is 0.0169 (0.0080), 0.0145 (0.0069), and 0.0133 (0.0055), respectively. AF has the smallest average (median) absolute forecast errors followed by MF, and PAF has the largest average (median) absolute forecast errors. Figure 3 depicts the median forecast accuracy of all forecasted items in bar-chart form. The ordering of the forecast accuracy among PAF, MF, and AF remains the same. AF provides the most accurate forecast for all items, followed by MF and PAF.
Panel A of Table 9 presents the results of the paired forecast accuracy tests based on the number of observations. The first, second, and third rows compare the forecast accuracy between PAF and AF, PAF and MF, and MF and AF, respectively. For example, when the forecast accuracy of PAF and MF is compared for recurring profit forecasts in the second row of the third column of Panel A, PAF is more accurate than MF in 42.1% of the observations, PAF is as accurate as MF in 7.8% of the observations, and MF is more accurate than PAF in 50.1% of the observations. The forecast accuracy

Ota: Information Content of Analysts’ Stock Ratings and Earnings Forecasts in the Presence ofManagement Earnings Forecasts
109
Table 8: Descriptive Statistics of The Forecast Accuracy of Previous Analysts’ Forecasts, Management Forecasts, and Current Analysts’ Forecasts with Management Forecasts and Current Analysts’ Forecasts Being Announced Simultaneously
Average S.D. Min 1Qrt Median 3Qrt Max
Previous analysts’ forecasts (PAF)
SALES 0.0658 0.1000 0.0001 0.0108 0.0307 0.0849 1.4304OPEPROFIT 0.0150 0.0233 0.0000 0.0032 0.0075 0.0183 0.2709RECURPROFIT 0.0169 0.0278 0.0000 0.0033 0.0080 0.0191 0.2793NETINCOME 0.0145 0.0282 0.0000 0.0023 0.0058 0.0152 0.3827
Management forecasts (MF)
SALES 0.0541 0.0898 0.0000 0.0080 0.0244 0.0638 1.1950OPEPROFIT 0.0130 0.0215 0.0000 0.0024 0.0064 0.0152 0.2544RECURPROFIT 0.0145 0.0249 0.0000 0.0024 0.0069 0.0164 0.2546NETINCOME 0.0119 0.0259 0.0000 0.0019 0.0049 0.0116 0.4357
Current analysts’ forecasts (AF)
SALES 0.0478 0.0821 0.0000 0.0064 0.0191 0.0558 1.1950OPEPROFIT 0.0119 0.0204 0.0000 0.0023 0.0055 0.0134 0.2627RECURPROFIT 0.0133 0.0241 0.0000 0.0023 0.0055 0.0138 0.2711NETINCOME 0.0115 0.0236 0.0000 0.0017 0.0044 0.0107 0.2650
Note: This table presents the descriptive statistics of the forecast accuracy of previous analysts’ forecasts, management forecasts, and current analysts’ forecasts contained in analyst reports that are publicized simultaneously with management forecasts. The forecast accuracy is measured as the absolute value of the difference between actual and forecasted values deflated by the MVE at the beginning of the fiscal year. All forecasts are one-year-ahead annual forecasts and the forecasted items that are investigated are sales (SALES), operating profit (OPEPROFIT), recurring profit (RECURPROFIT), and net income (NETINCOME).
0.000
0.001
0.002
0.003
0.004
0.005
0.006
0.007
0.008
0.009
Sale Operating Profit Recurrint Profit Net Income
Fore
cast
accu
racy
PAF MF AF
Note: This figure depicts the median forecast accuracy of previous analysts’ forecasts (PAF), management forecasts (MF), and current analysts’ forecasts (AF) contained in analyst reports that are publicized simultaneously with management forecasts. The forecast accuracy is measured as the absolute value of the difference between actual and forecasted values deflated by the MVE at the beginning of the fiscal year. All forecasts are one-year-ahead annual forecasts and the forecasted items that are investigated are sales (SALES), operating profit (OPEPROFIT), recurring profit (RECURPROFIT), and net income (NETINCOME). Note that the median sales forecast accuracy is scaled by one-fifth to make it comparable to others.
Median forecast accuracy of PAF, MF, and AF
Figure 3: Forecast Accuracy of PAF, MF, and AF.

The Japanese Accounting Review, 2 (2012), 87-116110Ta
ble
9: F
orec
ast
Acc
urac
y C
ompa
riso
ns B
etw
een
Prev
ious
Ana
lyst
s’ Fo
reca
sts,
Man
agem
ent
Fore
cast
s, an
d C
urre
nt A
naly
sts’
Fore
cast
s wit
h M
anag
emen
t Fo
reca
sts a
nd C
urre
nt A
naly
sts’
Fore
cast
s Bei
ng A
nnou
nced
Sim
ulta
neou
uly
Pane
l A: P
aire
d Fo
reca
st Ac
cura
cy T
ests B
ased
on th
e Num
ber o
f Obs
erva
tions
SALE
SO
PEPR
OFI
TRE
CURP
ROFI
TN
ETIN
COM
EPa
irsA
ccur
acy
N%
N%
N%
N%
Prev
ious
anal
ysts’
fo
reca
sts (P
AF)
vs.
Cur
rent
anal
ysts’
fo
reca
sts (A
F)
PAF
mor
e acc
urat
e12
011
.3%
149
15.0
%18
917
.8%
201
18.9
%PA
F eq
uals
AF
368
34.6
%38
438
.6%
371
34.9
%34
932
.9%
AF
mor
e acc
urat
e57
554
.1%
462
46.4
%50
247
.3%
511
48.2
%To
tal
1,06
310
0.0%
995
100.
0%1,
062
100.
0%1,
061
100.
0%Pr
evio
us an
alys
ts’
fore
casts
(PA
F)vs
.C
urre
nt an
alys
ts’
fore
casts
(AF)
PAF
mor
e acc
urat
e39
737
.3%
407
40.9
%44
742
.1%
409
38.5
%PA
F eq
uals
AF
928.
7%82
8.2%
837.
8%10
29.
6%A
F m
ore a
ccur
ate
574
54.0
%50
650
.9%
532
50.1
%55
051
.8%
Tota
l1,
063
100.
0%99
510
0.0%
1,06
210
0.0%
1,06
110
0.0%
Prev
ious
anal
ysts’
fo
reca
sts (P
AF)
vs.
Cur
rent
anal
ysts’
fo
reca
sts (A
F)
PAF
mor
e acc
urat
e31
029
.2%
327
32.9
%33
631
.6%
357
33.6
%PA
F eq
uals
AF
166
15.6
%13
313
.4%
141
13.3
%17
716
.7%
AF
mor
e acc
urat
e58
755
.2%
535
53.8
%58
555
.1%
527
49.7
%To
tal
1,06
310
0.0%
995
100.
0%1,
062
100.
0%1,
061
100.
0%
Pane
l B: P
aire
d St
atist
ical T
ests o
f For
ecast
Accu
racy
betw
een
Prev
ious A
nalys
ts’ F
oreca
sts, M
anag
emen
t For
ecasts
, and
Cur
rent
Ana
lysts’
For
ecasts
SALE
SO
PEPR
OFI
TRE
CURP
ROFI
TN
ETIN
COM
E
Pairs
Paire
dt-
test
Wilc
oxon
test
Paire
dt-
test
Wilc
oxon
test
Paire
dt-
test
Wilc
oxon
test
Paire
dt-
test
Wilc
oxon
test
PAF
vs. A
F12
.18*
*16
.72*
*10
.47*
*12
.93*
*10
.15*
*12
.88*
*8.
80**
12.2
9**
PAF
vs. M
F6.
09**
7.21
**5.
56**
5.26
**5.
72**
5.04
**7.
39**
7.26
**M
F vs
. AF
4.29
**8.
39**
4.17
**6.
28**
3.93
**7.
03**
1.65
† 4.
19**
Not
e: Th
is ta
ble
pres
ents
the
resu
lts o
f pai
red
fore
cast
accu
racy
tests
bet
ween
pre
viou
s ana
lysts
’ for
ecas
ts (P
AF)
, man
agem
ent f
orec
asts
(MF)
, and
cur
rent
ana
lysts
’ for
ecas
ts (A
F)
cont
aine
d in
ana
lyst
repo
rts th
at a
re p
ublic
ized
sim
ulta
neou
sly w
ith m
anag
emen
t for
ecas
ts. Th
e fo
reca
st ac
cura
cy is
mea
sure
d as
the
abso
lute
valu
e of
the
diffe
renc
e be
twee
n ac
tual
and
fore
caste
d va
lues
defl
ated
by t
he M
VE
at th
e beg
inni
ng o
f the
fisc
al ye
ar. A
ll fo
reca
sts ar
e one
-yea
r-ah
ead
annu
al fo
reca
sts an
d th
e for
ecas
ted
item
s inv
estig
ated
are s
ales (
SALE
S),
oper
atin
g pr
ofit (
OPE
PRO
FIT)
, rec
urrin
g pr
ofit (
RECU
RPRO
FIT)
, and
net
inco
me
(NET
INCO
ME)
. The
mea
n an
d m
edia
n di
ffere
nces
in fo
reca
st ac
cura
cy a
re st
atist
ically
teste
d us
ing
the p
aire
d t-
test
and
Wilc
oxon
sign
ed-r
ank
test,
and
the r
espe
ctiv
e tes
t sta
tistic
s are
repo
rted
in P
anel
B. **
, *, a
nd †
repr
esen
t two
-tai
led si
gnifi
canc
e at t
he 0
.01,
0.05
, and
0.1
0 le
vels.

Ota: Information Content of Analysts’ Stock Ratings and Earnings Forecasts in the Presence ofManagement Earnings Forecasts
111
test between MF and AF for recurring profit forecasts in the third row of the third column of Panel A reveals that MF is more accurate than AF in 31.6% of the observations, MF is as accurate as AF in 13.3% of the observations, and AF is more accurate than MF in 55.1% of the observations. The results of other forecasted items are similar to those of recurring profit forecasts.
The mean and median differences in forecast accuracy between PAF and AF, PAF and MF, and MF and AF are statistically tested using the paired t-test and Wilcoxon signed-rank test, and the results are reported in Panel B of Table 9. The results of both statistical tests indicate that AF is significantly more accurate than PAF, MF is significantly more accurate than PAF, and AF is significantly more accurate than MF for all forecasted items at the 1% level except for the mean difference between MF and AF for net income, which is statistically significant only at the 10% level.
Overall, the results presented in Table 9 reveal that management forecasts are more accurate than previous analysts’ forecasts but less accurate than concurrently released analysts’ forecasts. The superiority of current analysts’ forecasts over management forecasts in terms of forecast accuracy may explain the stock market’s greater reliance on current analysts’ forecasts over management forecasts.
5. Additional Analysis
5.1 The Impact of Ex Post Forecast Accuracy on the Information Content of Analysts’ Earnings ForecastsThe findings in the previous sections show that current analysts’ earnings forecasts are
informative to the market and significantly more accurate than concurrently announced management earnings forecasts. This raises the question of whether the stock market reacts to current analysts’ earnings forecasts unconditionally, even when analysts’ forecasts are ex post less accurate than management forecasts.
In order to answer this question, I use two subsamples of analyst reports in which current analysts’ earnings forecasts are (i) ex post more accurate than management earnings forecasts and (ii) ex post less accurate than management earnings forecasts. The results of re-estimating Eq. (4) with the two subsamples are reported in Table 10.
The first column of Table 10 shows the estimated results of Eq. (4) using all observations. The second and third columns of Table 10 present the estimated results for subsamples (i) and (ii), respectively. The estimated coefficients of ΔMEF_PAEF are both significantly positive: 1.1320 for the subsample (i) and 0.9890 for the subsample (ii). However, while the estimated coefficient of ΔAEF_MEF for subsample (i) is significantly positive, 1.1263 (t-statistic = 4.93), the estimated coefficient for subsample (ii) is not statistically significant, 0.4773 (t-statistic = 1.00). These findings indicate that the market responds to analysts’ earnings forecasts only when they provide better forecasts than corporate managers. It appears that the stock market is able to discern the relative ex post forecast accuracy of analysts’ earnings forecasts and reacts only to those forecasts that are ex post more accurate than management forecasts.
5.2 The Impact of Other Firm-Specific FactorsPrior literature has identified a number of factors associated with the market reaction to the
release of analysts’ stock ratings and earnings forecasts. First, firm size and the number of analysts following a firm are often used as proxies for the amount of pre-disclosure information available for a firm (Atiase, 1985; Stickel, 1995; Asquith et al., 2005). Since less information is likely to be available to investors about smaller or less widely-followed firms, the market reaction to the release

The Japanese Accounting Review, 2 (2012), 87-116112
of analysts’ ratings and earnings forecasts is expected to be greater in magnitude for these firms than for larger or more widely-followed firms. Second, Michaely and Womack (1999) document that the mean excess returns around buy recommendations are lower when the recommendations are made by underwriters rather than by non-underwriters, thereby suggesting that the market discounts the value of underwriter buy recommendations compared to those of non-underwriters. Third, analysts with better reputations are expected to have more influence than others on the stock market. Stickel (1995) finds that rating upgrades (downgrades) from first-team All-American analysts trigger an incremental price increase (decrease) of 1.18% (–0.79%) beyond that associated with non-All-Americans. Fourth, Skinner and Sloan (2002) document that growth firms with high market-to-book ratios exhibit an asymmetrically large negative price response to negative surprises of actual
Table 10: The Impact of Ex Post Forecast Accuracy on The Information Content ofAnalysts’ and Management Earnings Forecasts
All observations (i) AEF more accurate than MEF
(ii) AEF less accurate than MEF
Coefficient t-statistic Coefficient t-statistic Coefficient t-statisticUPSTRBUY 0.0610 2.85** 0.0474 2.01 * 0.0942 49.71 *UPBUY 0.0309 4.20** 0.0323 4.01** 0.0464 3.17**RESTRBUY 0.0161 2.57** 0.0146 1.68 0.0186 1.96 REBUY 0.0059 2.50 * 0.0079 2.70** 0.0031 0.71 REHOLDESELL 0.0022 1.20 0.0043 1.76 0.0008 0.23 DNBUY −0.0156 −1.04 0.0146 1.57 –0.0442 –1.87 DNHOLDSELL −0.0451 −4.23** −0.0608 −4.02** −0.0483 −2.21 *ΔMEF_PAEF 1.3464 6.58** 1.1320 4.32** 0.9890 2.77**ΔAEF_MEF 1.1256 5.31** 1.1263 4.93** 0.4773 1.00 adj.R2 0.2103 0.1762 0.1416N 1,062 585 336
Note: This table examines the impact of the relative ex post forecast accuracy between current analysts’ earnings forecasts (AEF) and management earnings forecasts (MEF) on the incremental information content of these earnings forecasts. The following regression model is estimated using only the subsample of analyst reports that are publicized concurrently with management forecasts.CAR(0,+1) = d 1UPSTRBUY + d 2UPBUY + d 3RESTRBUY + d 4REBUY + d 5REHOLDSELL + d 6DNBUY + d 7DNHOLDSELL + d 8ΔMEF_PAEF + d 9ΔAEF_MEF + e , (4)where CAR(0,+1) is the cumulative abnormal stock return (raw return minus the market model predicted return) over a two day window comprising the day of the analyst report release and the following trading day, UPSTRBUY is an indicator variable taking the value of one if analysts’ ratings are upgraded to strong buy and zero otherwise, UPBUY is an indicator variable taking the value of one if analysts’ ratings are upgraded to buy and zero otherwise, RESTRBUY is an indicator variable taking the value of one if analysts’ ratings are unchanged from strong buy and zero otherwise, REBUY is an indicator variable taking the value of one if analysts’ ratings are unchanged from buy and zero otherwise, REHOLDSELL is an indicator variable taking the value of one if analysts’ ratings are unchanged from hold or sell and zero otherwise, DNBUY is an indicator variable taking the value of one if analysts’ ratings are downgraded to buy and zero otherwise, DNHOLDSELL is an indicator variable taking the value of one if analysts’ ratings are downgraded to hold or sell and zero otherwise, ΔMEF_PAEF is management recurring profit forecasts (MEF) minus analysts’ previous recurring profit forecasts (PAEF) deflated by the MVE at the beginning of the fiscal year, and ΔAEF_MEF is analysts’ current recurring profit forecasts (AEF) minus management recurring profit forecasts (MEF) deflated by the MVE at the beginning of the fiscal year. All earnings forecasts are one-year-ahead annual forecasts. t-statistics are calculated using White (1980) heteroskedasticity-consistent standard errors. ** and * represent two-tailed significance at the 0.01 and 0.05 levels.

Ota: Information Content of Analysts’ Stock Ratings and Earnings Forecasts in the Presence ofManagement Earnings Forecasts
113
earnings. Asquith et al. (2005) also report similar results for rating downgrade announcements.Thus, on the basis of the findings in prior studies, I investigate the impact of five firm-specific
factors—firm size, analyst following, analyst reputation, underwriting relationship, and firm growth—on market reaction to the simultaneous releases of management earnings forecasts and analysts’ rating and earnings forecasts. One problem associated with this test is that the sample must be divided into good and bad news because the signs of estimated coefficients of certain factors are predicted to vary depending on the content of the news. For example, while the sign of the estimated coefficient of firm size is expected to be negative for good news, the opposite sign is predicted for bad news. Concurrent announcements of management and analysts’ forecasts make it more difficult to distinguish whether the announcements contain good or bad news overall. Therefore, I divide the sample by the sign of CAR, which means that if an announcement is associated with a positive (negative) CAR, it is considered to be good (bad) news.
I estimate a version of Eq. (4) modified to include proxies for firm size, analyst following, analyst reputation, underwriting relationship, and firm growth.
CAR(0,+1) = d 1UPSTRBUY + d 2UPBUY + d 3RESTRBUY + d 4REBUY + d 5REHOLDSELL + d 6DNBUY + d 7DNHOLDSELL + d 8ΔMEF_PAEF + d 9ΔAEF_MEF + d 10SIZE + (6) d 11NUMANAL + d 12STAR + d 13UNDWRITE + d 14BMR + e ,
where SIZE is the log of market value of equity, NUMANAL is the number of analysts following the firm as reported by IFIS Consensus Data, STAR is an indicator variable taking the value of one if the analyst is chosen as the top analyst at least once in the Nikkei Veritas analyst rankings during the 2005–2007 period and zero otherwise, UNDWRITE is an indicator variable taking the value of one if the brokerage house is the lead managing underwriter of the firm and zero otherwise, and BMR is the firm’s book-to-market ratio. The definitions of other variables are the same as those in Eq. (4).
The first and second columns of Table 11 present the results of estimating Eq. (6) on the good news and bad news subsamples, respectively. The results indicate that although the signs of the estimated coefficients of these firm-specific variables are generally consistent with the expected signs, their statistical significance is weak. The only significant variables are STAR for the good news subsample and NUMANAL and BMR for the bad news subsample. These findings suggest that analysts with better reputations have a more positive impact on the market in the case of good news, and that the market reaction is less negative for more widely-followed firms and more negative for higher growth firms in the case of bad news.
With regard to analyst report variables, the noteworthy results from Table 7 still hold. The estimated coefficients of ΔMEF_PAEF and ΔAEF_MEF are positive and significant for both subsamples; this indicates that the information content of management and analysts’ earnings forecasts remains intact after controlling for the impact of other firm-specific factors.
6. Conclusion
The literature on financial analysts asserts that there are two main sources of value that analysts bring to the market (Park and Pincus, 2000; Ivković and Jegadeesh, 2004). First, analysts’ value may lie in their skills to interpret public signals through their expertise. Second, analysts’ service may lie in their ability to acquire private signals through their independent research. While analysts’ roles as acquirers of new

The Japanese Accounting Review, 2 (2012), 87-116114
information through their own research are well documented in the literature, their roles as interpreters of public information have not been thoroughly explored thus far (Asquith et al., 2005).
The primary goal of this paper is to investigate whether analysts possess valuable expertise for interpreting public information. Toward this goal, I examine the incremental informativeness of analyst reports released contemporaneously with companies’ earnings forecasts, which is probably one of the most important sources of public information. Using 2,277 analyst reports published during the two-year period from July 2005 through June 2007 covering 399 firms, I first replicate prior research and find that both analysts’ ratings and earnings forecast revisions are informative to the market. Next, I examine the timing of the publication of analyst reports relative to the announcement of companies’ earnings forecasts. I find that over half of the analyst reports (1,062 reports) are issued on the day after the announcement of management earnings forecasts. Since the vast majority of companies announce earnings forecasts after the market closes for the day and analysts disseminate
Table 11: The Impact of Other Firm-Specific Factors on The Information Content ofAnalysts’ and Management Earnings Forecasts
Good News (Positive CAR) Bad News (Negative CAR)Expected Sign Coefficient t-statistic Expected Sign Coefficient t-statistic
UPSTRBUY + 0.0638 2.89** + n/aUPBUY + 0.0384 2.36** + n/aRESTRBUY ? 0.0426 2.61** ? –0.0559 –3.17**REBUY ? 0.0281 1.78 * ? –0.0522 –3.24**REHOLDESELL ? 0.0249 1.68 * ? –0.0587 –3.63**DNBUY – n/a – –0.0729 –3.40**DNHOLDSELL – n/a – –0.0968 –4.95**ΔMEF_PAEF + 0.7453 3.34** + 0.9507 3.74**ΔAEF_MEF + 0.9960 3.60** + 0.6201 2.57**SIZE – 0.0004 0.32 + 0.0006 0.46 NUMANAL – –0.0005 –1.30 + 0.0007 1.66 *STAR + 0.0021 2.70** – –0.0038 –0.70 UNDWRITE – 0.0084 1.64 – –0.0061 –1.34 BMR ? 0.0025 0.50 + 0.0225 3.63**adj.R2 0.0961 0.2685N 557 505
Note: This table examines the impact of other firm-specific factors on the incremental information content of analysts’ and management earnings forecasts. The following regression model is estimated using only the subsample of analyst reports that are publicized concurrently with management forecasts.CAR(0,+1) = d 1UPSTRBUY + d 2UPBUY + d 3RESTRBUY + d 4REBUY + d 5REHOLDSELL + d 6DNBUY + d 7DNHOLDSELL + d 8ΔMEF_PAEF + d 9ΔAEF_MEF + d 10SIZE + d 11NUMANAL + d 12STAR + d 13UNDWRITE + d 14BMR + e ,where SIZE is the log of market value of equity, NUMANAL is the number of analysts following the firm as reported by IFIS Consensus Data, STAR is an indicator variable taking the value of one if the analyst is chosen as the top analyst at least once in the Nikkei Veritas analyst rankings during the 2005-2007 period and zero otherwise, UNDWRITE is an indicator variable taking the value of one if the brokerage house is the lead managing underwriter of the firm and zero otherwise, and BMR is the firm’s book-to-market ratio. Other variables are defined in Table 10. t-statistics are calculated using White (1980) heteroskedasticity-consistent standard errors. ** and * represent one-tailed significance at the 0.01 and 0.05 levels.

Ota: Information Content of Analysts’ Stock Ratings and Earnings Forecasts in the Presence ofManagement Earnings Forecasts
115
the reports for their clients before the market opens the next morning, these analyst reports are practically released contemporaneously with management forecasts.
Thereafter, I investigate the information content of analysts’ ratings and earnings forecasts using only the subsample of analyst reports that occur with management earnings forecasts. I find that analysts’ ratings and earnings forecasts have incremental information content beyond information provided by management forecasts. Controlling for the impact of actual earnings at annual earnings announcements does not materially change the results.
The results of the incremental informativeness of analysts’ forecasts in the presence of management forecasts indicate that the market relies more on analysts’ forecasts than on management forecasts. When the ex post forecast accuracy of management earnings forecasts and concurrently released analysts’ earnings forecasts is compared, the results show that analysts’ forecasts are significantly more accurate than management forecasts. This finding may partially explain why investors depend more on analysts’ outlooks than on corporate managers’ views of future earnings.
In summary, this paper presents strong evidence that the stock market reacts to forecast information contained in an analyst report beyond forecast information that is publicly disseminated by companies’ managers. The stock market’s reaction may be justified by the ex post higher accuracy of analysts’ earnings forecasts than simultaneously announced management earnings forecasts. These findings indicate that security analysts are not merely reiterating publicly announced information, but are adding value to the market by providing new analysis and assessment of companies’ future performance.
REFERENCES
ABDEL-KHALIK, R., AND B. AJINKYA. 1982. Returns to informational advantages: The case of analysts’ forecast revisions. The Accounting Review 57 (October): 661-680.
ASQUITH, P., M. MIKHAIL, AND A. AU. 2005. Information content of equity analyst reports. Journal of Financial Economics 75 (February): 245-282.
ATIASE, R. 1985. Predisclosure information, firm capitalization, and security price behavior around earnings announcements. Journal of Accounting Research 23 (Spring): 21-36.
BARBER, B., R. LEHAVY, M. MCNICHOLS, AND B. TRUEMAN. 2001. Can investors profit from the prophets? Security analyst recommendations and stock returns. The Journal of Finance 56 (Spring): 531-563.
BOWEN, R., A. DAVIS, AND D. MATSUMOTO. 2002. Do conference calls affect analysts’ forecasts? The Accounting Review 77 (April): 285-316.
BRAV, A., AND R. LEHAVY, 2003. An empirical analysis of analysts’ target prices: short-term informativeness and long-term dynamics. The Journal of Finance 58 (October): 1933-1967.
CAMPBELL, J., A. LO, AND C. MACKINLAY. 1996. The Econometrics of Financial Markets. Princeton University Press, Princeton, NJ.CONROY, R., K. EADES, AND R. HARRIS. 2000. A test of the relative pricing effects of dividends and earnings: Evidence from
simultaneous announcements in Japan. The Journal of Finance 55 ( June): 1199-1227.CONROY, R., R. HARRIS, AND Y. PARK. 1998. Fundamental information and share prices in Japan: Evidence from earnings surprises
and management predictions. International Journal of Forecasting 14 ( June): 227-244.ELTON, E., M. GRUBER, AND S. GROSSMAN. 1986. Discrete expectational data and portfolio performance. The Journal of Finance 41
( July): 699-713.FRANCIS, J., AND L. SOFFER. 1997. The relative informativeness of analysts’ stock recommendations and earnings forecast revisions.
Journal of Accounting Research 35 (Autumn): 193-211.IVKOVIĆ, Z., AND N. JEGADEESH. 2004. The timing and value of forecast and recommendation revisions. Journal of Financial
Economics 73 (September): 433-463.LYS, T., AND S. SOHN. 1990. The association between revisions of financial analysts’ earnings forecasts and security-price changes.
Journal of Accounting and Economics 13 (December): 341-363.MACKINLAY, C. 1997. Event studies in economics and finance. Journal of Economic Literature 35 (March): 13-39.MICHAELY, R., AND K. WOMACK. 1999. Conflict of interest and the credibility of underwriter analyst recommendations. The
Review of Financial Studies 12: 653-686.OTA, K. 2010. The value relevance of management forecasts and their impact on analysts’ forecasts: Empirical evidence from Japan.

The Japanese Accounting Review, 2 (2012), 87-116116
Abacus 46 (March): 28-59.PARK, C., AND M. PINCUS. 2000. Market reactions to changes in analyst consensus recommendations following quarterly earnings
announcements. Unpublished Working Paper, Hong Kong University of Science and Technology.SKINNER, D., AND R. SLOAN. 2002. Earnings surprises, growth expectations, and stock returns or don’t let an earnings torpedo sink
your portfolio. Review of Accounting Studies 7 ( June): 289-312.STICKEL, S. 1989. The timing of and incentives for annual earnings forecasts near interim earnings announcements. Journal of
Accounting and Economics 11 (Special Issue) ( July): 275-292.STICKEL, S. 1991. Common stock returns surrounding earnings forecast revisions: More puzzling evidence. The Accounting Review
66 (April): 402-416.STICKEL, S. 1995. The anatomy of the performance of buy and sell recommendations. Financial Analysts Journal 51 (September-
October): 25-39.WHITE, H. 1980. A heteroskedasticity-consistent covariance matrix estimator and a direct test for heteroskedasticity. Econometrica
48 (May): 817-838.WOMACK, K. 1996. Do brokerage analysts’ recommendations have investment value? The Journal of Finance 51 (March): 137-167.