Embed Size (px)
Citation preview
INFO 2000 Course Review
•Course Review
•Exam paper format
INFO 2000 Course Review
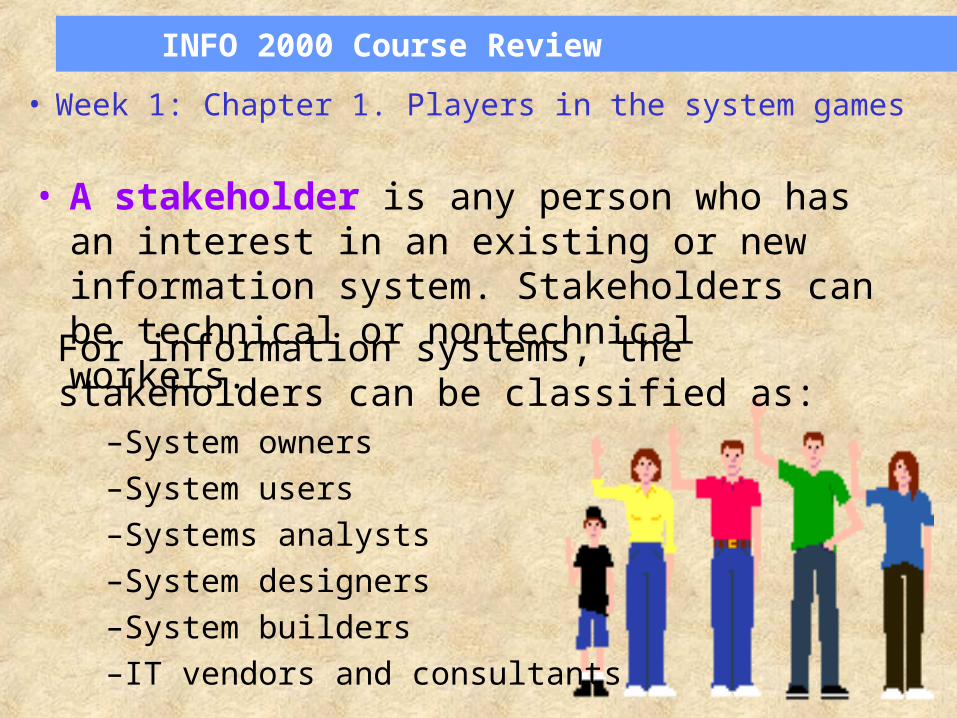
• Week 1: Chapter 1. Players in the system games
For information systems, the stakeholders can be classified as:
–System owners–System users–Systems analysts–System designers–System builders–IT vendors and consultants
• A stakeholder is any person who has an interest in an existing or new information system. Stakeholders can be technical or nontechnical workers.
INFO 2000 Course Review
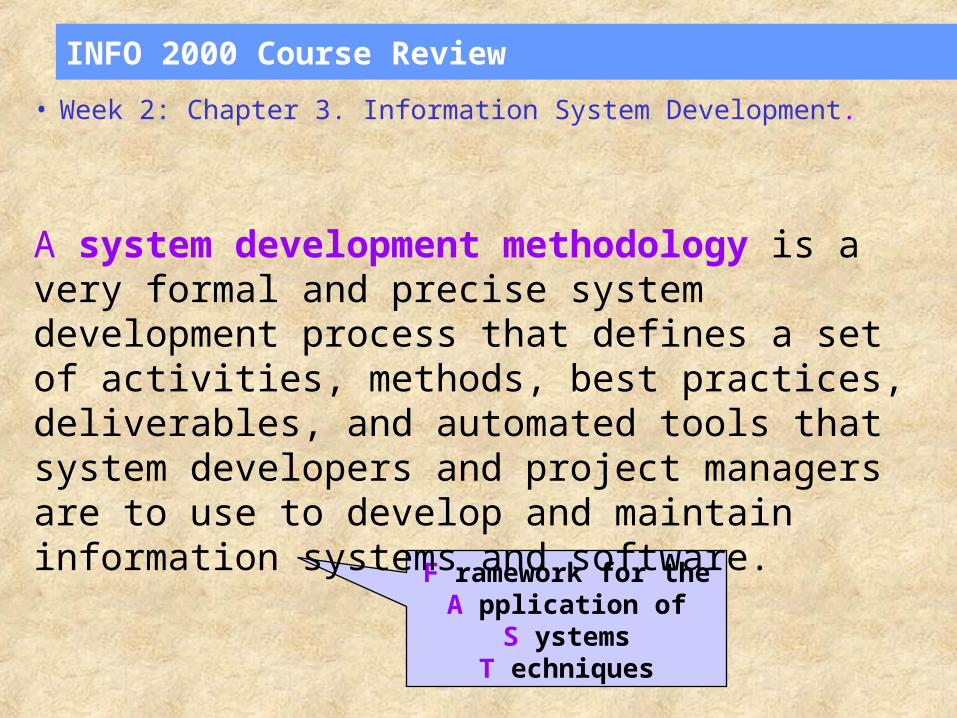
• Week 2: Chapter 3. Information System Development.
F ramework for theA pplication of
S ystemsT echniques
A system development methodology is a very formal and precise system development process that defines a set of activities, methods, best practices, deliverables, and automated tools that system developers and project managers are to use to develop and maintain information systems and software.
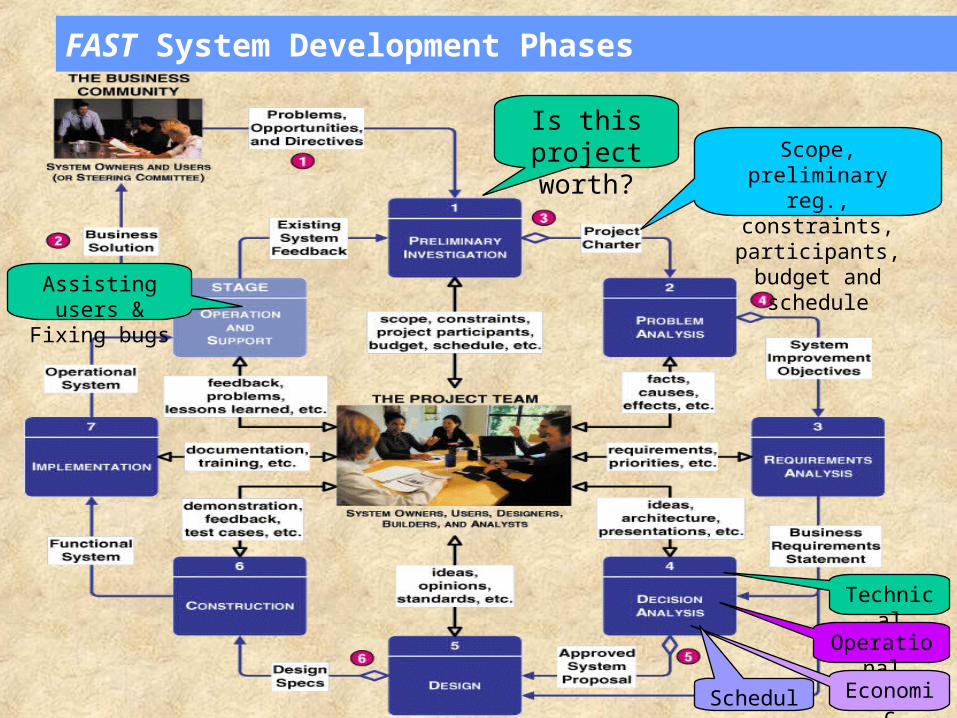
FAST System Development Phases
Is this project worth? Scope, preliminary reg.,
constraints, participants, budget and schedule
Technical
Operational
EconomicSchedule
Assisting users &Fixing bugs
INFO 2000 Course Review
• Week 3-4: Chapter 8. Process Modeling
Process modeling is a technique for organizing and documenting the structure and flow of data through a system’s processes, and/or the logic, policies, and procedures to be implemented by a system’s processes.
A data flow diagram (DFD) is a tool (and type of process model) that depicts the flow of data through a system and the work or processing performed by that system.
DFDs have become a popular tool for business process redesign.
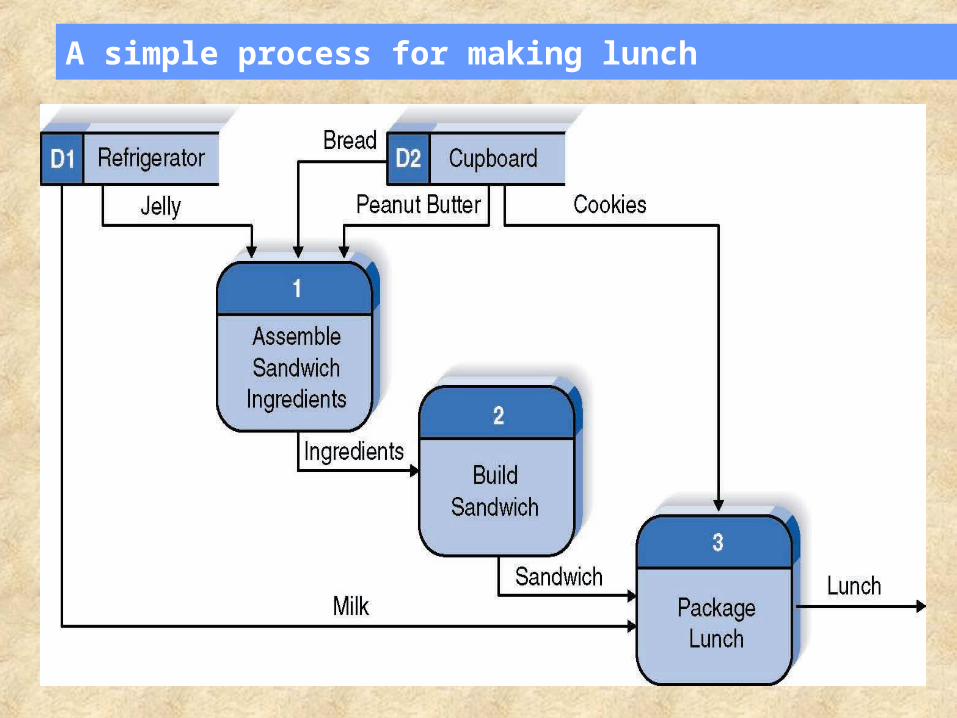
A simple process for making lunch
Data Flow Diagram Symbols
Four basic symbols
• Process
• Data flow
• Data store
• External entity/agent
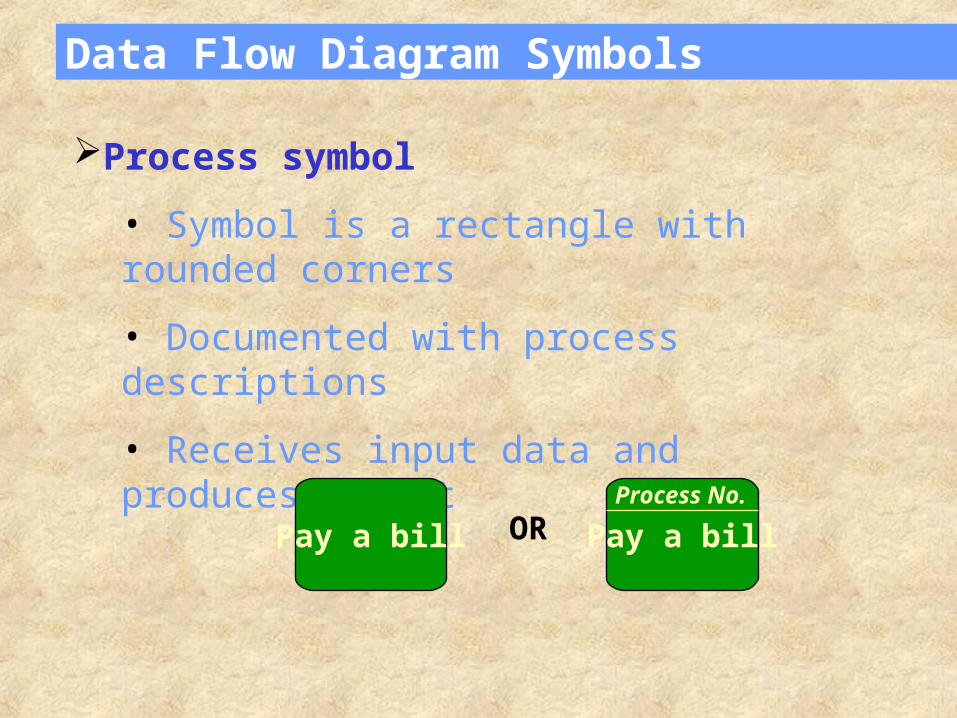
Data Flow Diagram Symbols
Process symbol
• Symbol is a rectangle with rounded corners
• Documented with process descriptions
• Receives input data and produces output
Pay a bill Pay a billORProcess No.
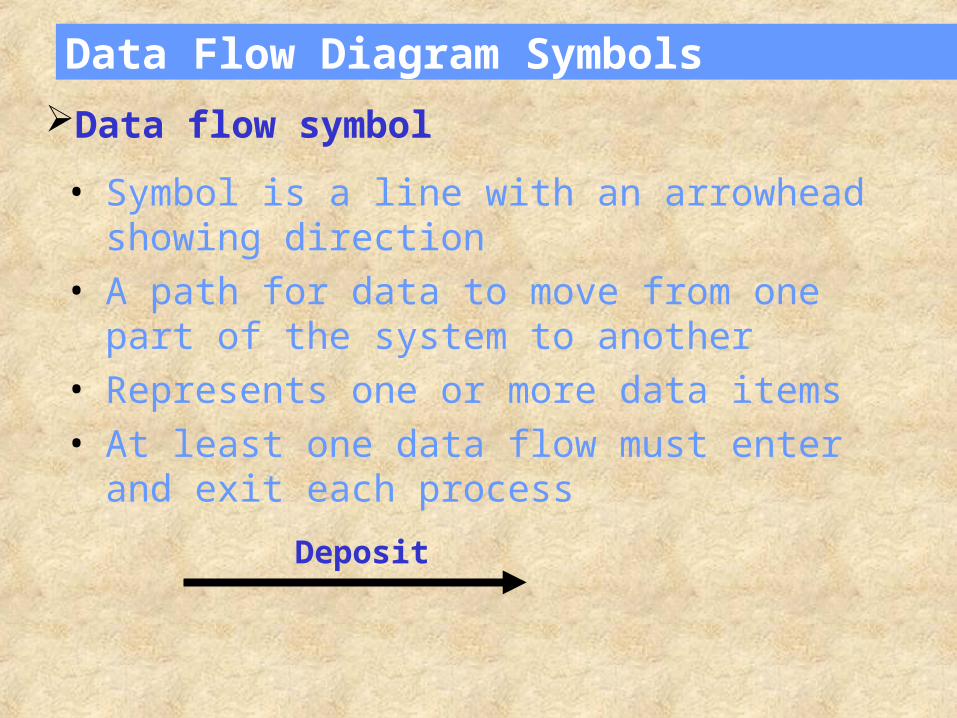
Data Flow Diagram Symbols
Data flow symbol
• Symbol is a line with an arrowhead showing direction
• A path for data to move from one part of the system to another
• Represents one or more data items• At least one data flow must enter and exit each
process
Deposit
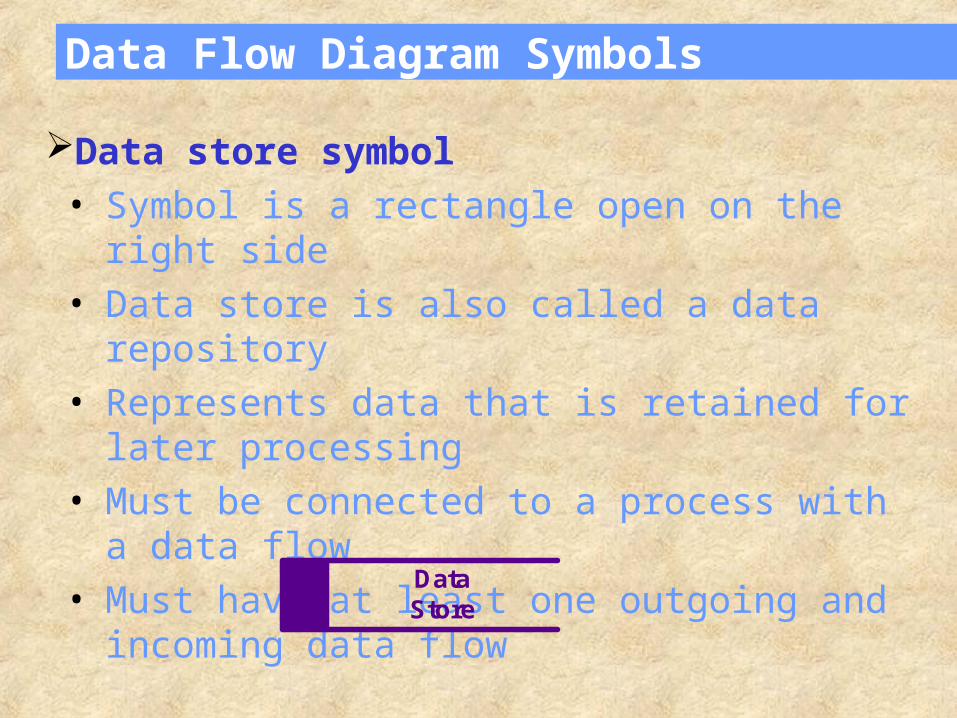
Data Flow Diagram Symbols
Data store symbol• Symbol is a rectangle open on the right side• Data store is also called a data repository• Represents data that is retained for later
processing• Must be connected to a process with a data flow• Must have at least one outgoing and incoming
data flow
DataStore
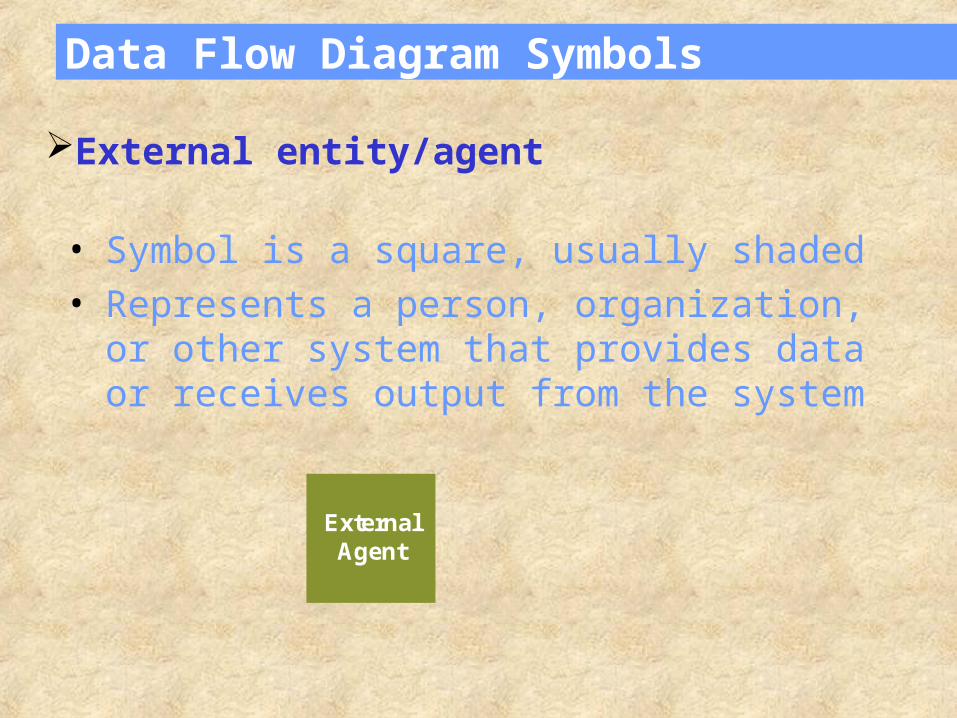
Data Flow Diagram Symbols
External entity/agent
• Symbol is a square, usually shaded• Represents a person, organization, or other
system that provides data or receives output from the system
ExternalAgent
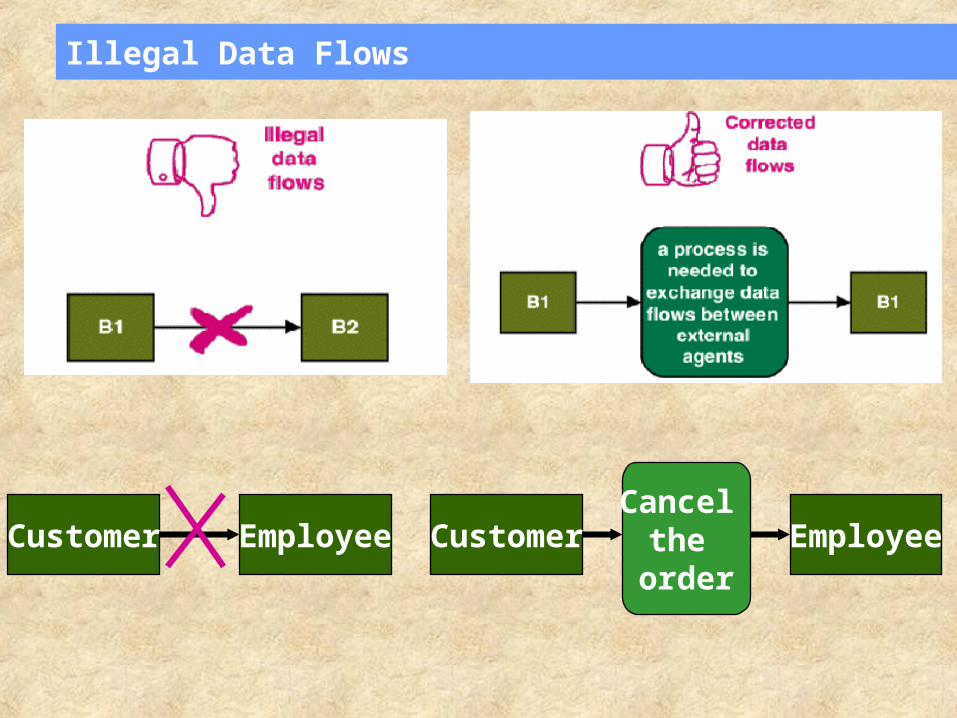
Illegal Data Flows
Customer Employee Customer EmployeeCancel
the order
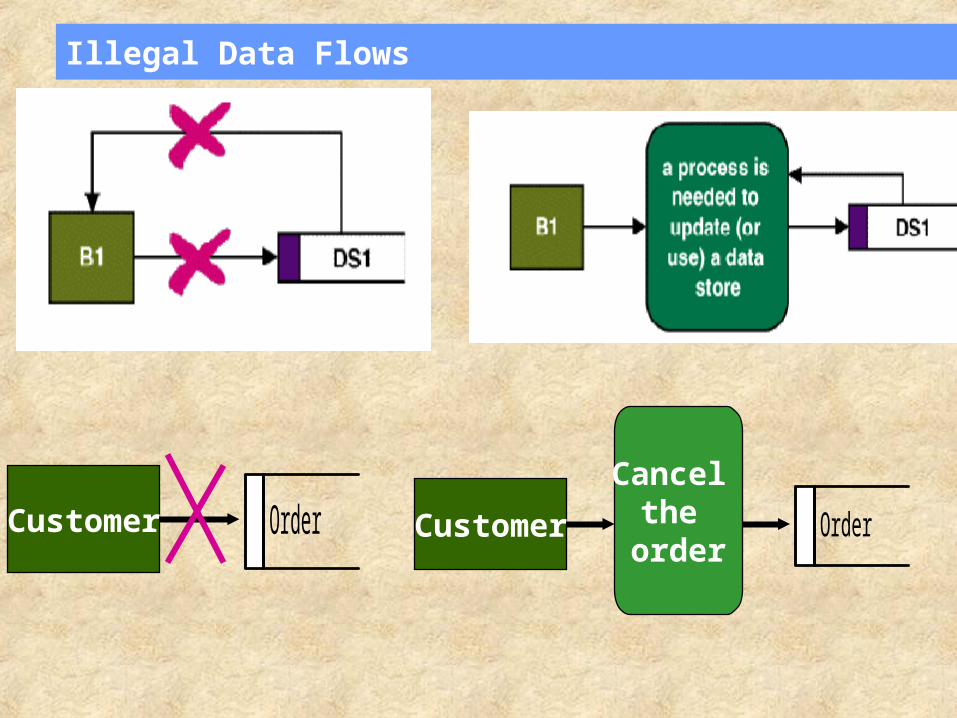
Illegal Data Flows
Customer Order Customer Order
Cancel the
order
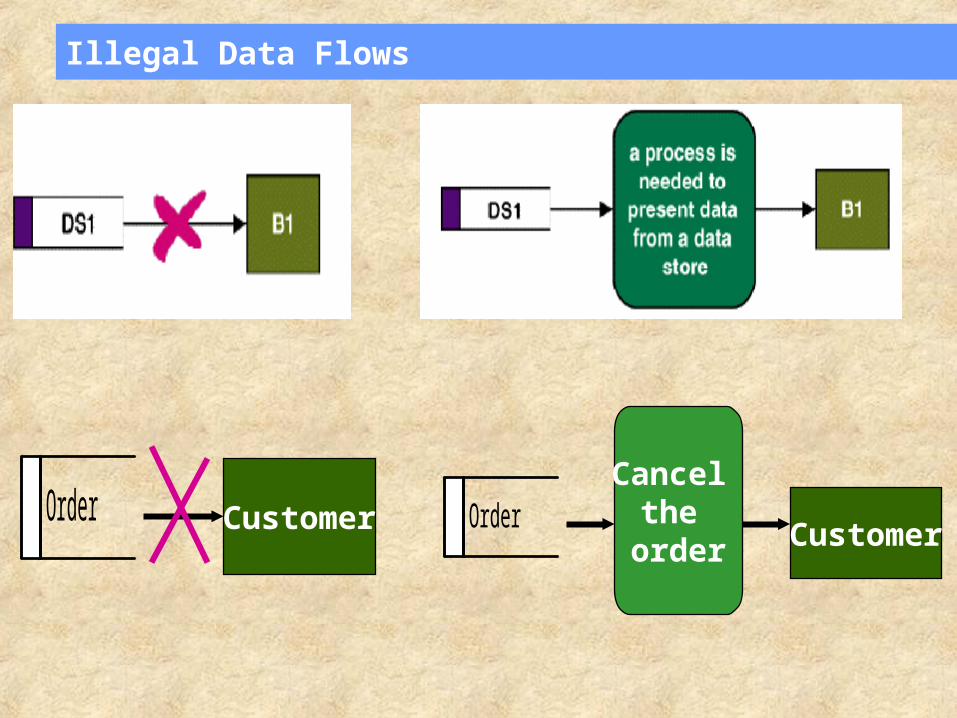
Illegal Data Flows
CustomerOrderCustomer
OrderCancel
the order
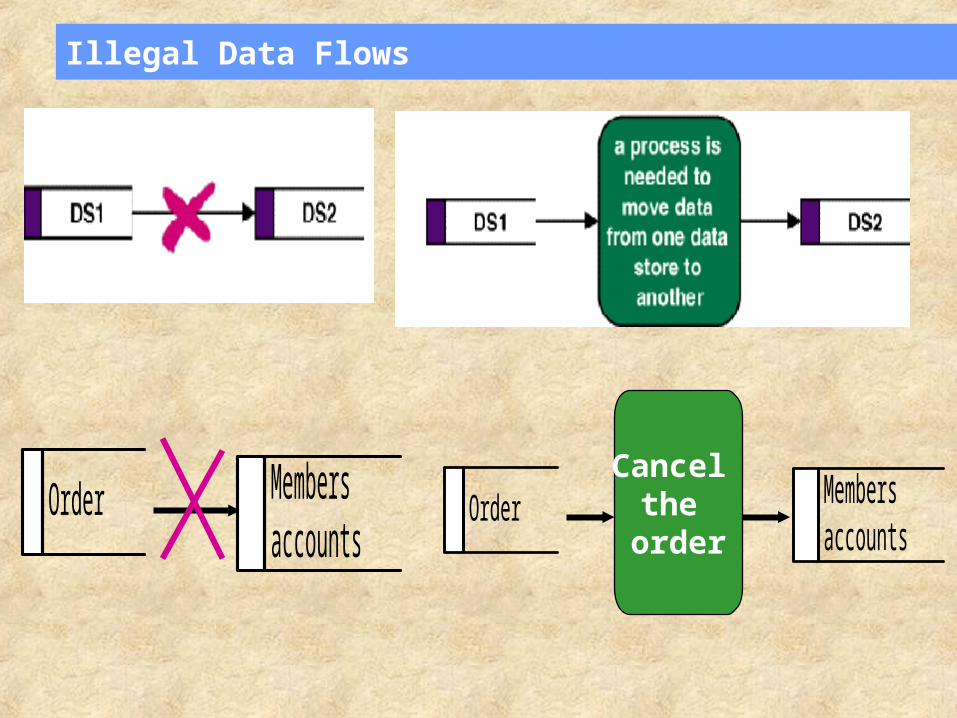
Illegal Data Flows
Order Membersaccounts
OrderCancel
the order
Membersaccounts
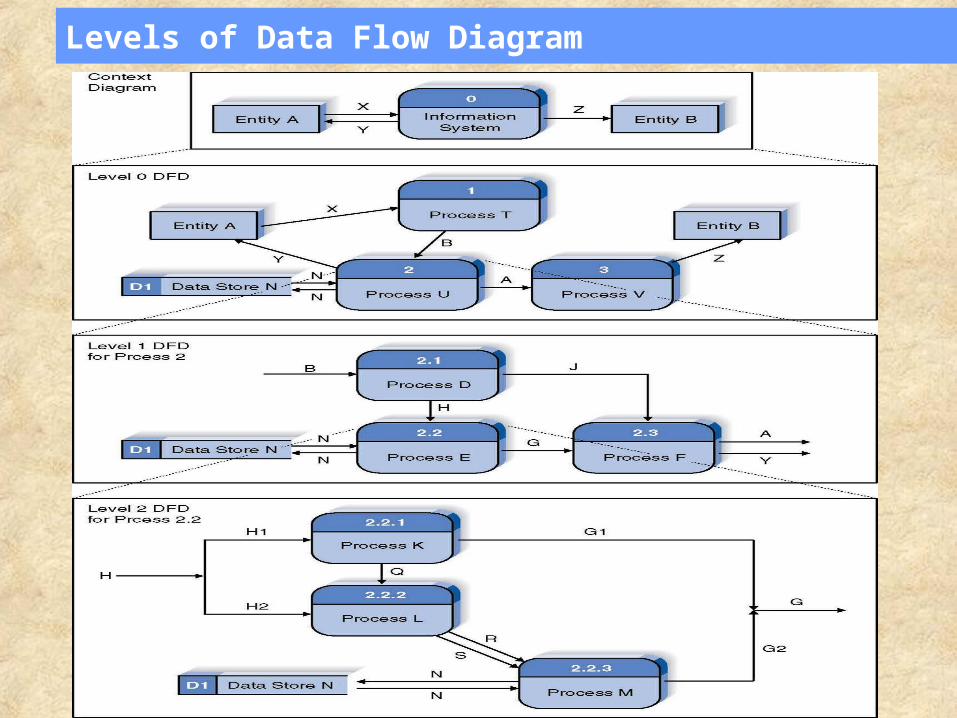
Levels of Data Flow Diagram
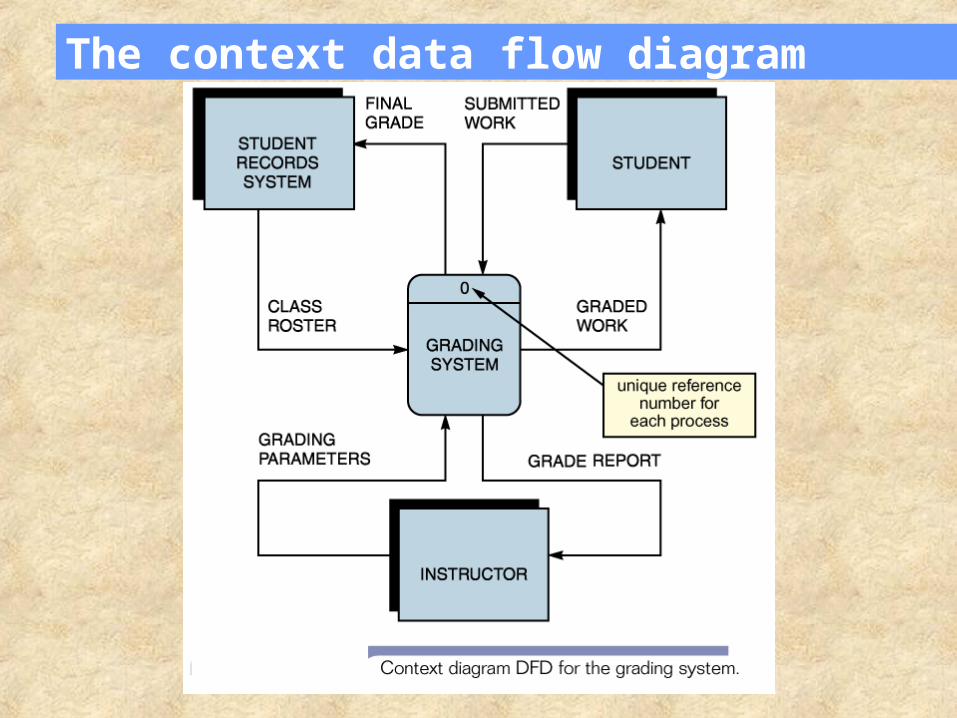
The context data flow diagram
• The first DFD in every business process is the Context data flow diagram.
• Top-level view that shows the systems’ boundaries and scope
• Represent the results of fact-finding
• One process symbol, numbered 0 (zero) is drawn in the center
• Each context diagram must fit on one page
• Process name in the context diagram should be the name of the information system
Rules for creating context data flow diagram
• Start by placing a single process symbol in the center of the page. The symbol represents the entire information system, and you identify it as process 0
• Then place the external agents around the perimeter of the page and use data flows to connect the entities to the central process
• Do not show any data stores in a context diagram because data stores are internal to the system
• Place the external agents around the central process and label them
• Create labeled input and output data flows between the external agents and the central system
The context data flow diagram
Diagram 0
• A context diagram provides the most general view of an information system
• Diagram 0 zoom in on the context diagram and shows major processes, data flows and data stores.
• Each process in diagram 0 has a reference number.
• Diagram 0 also represents the external agents and data flows that appear in the context diagram
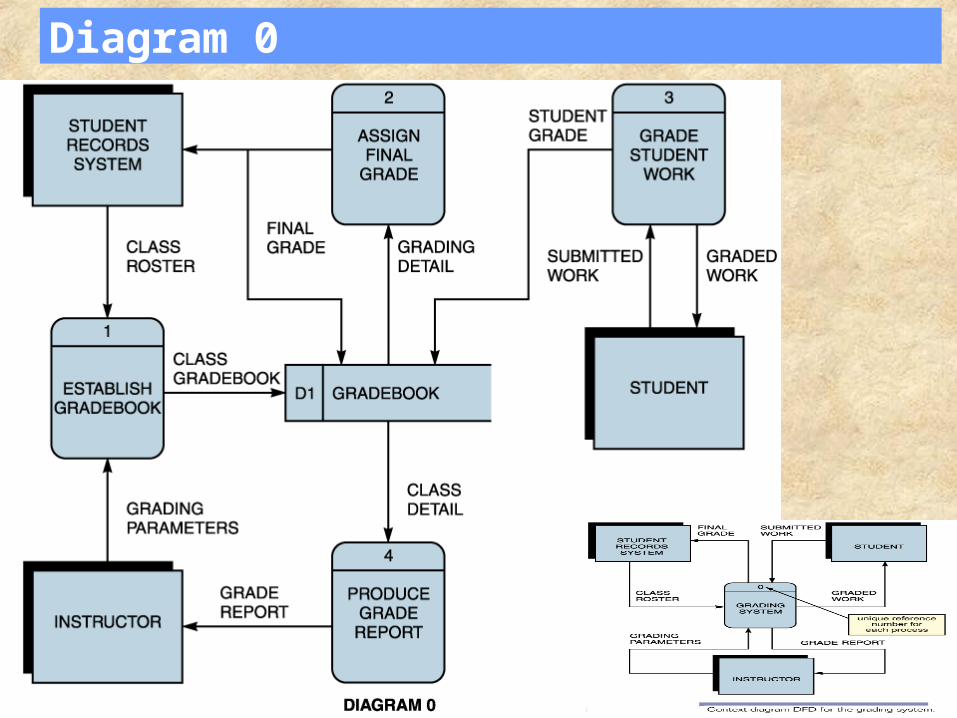
Diagram 0
INFO 2000 Course Review
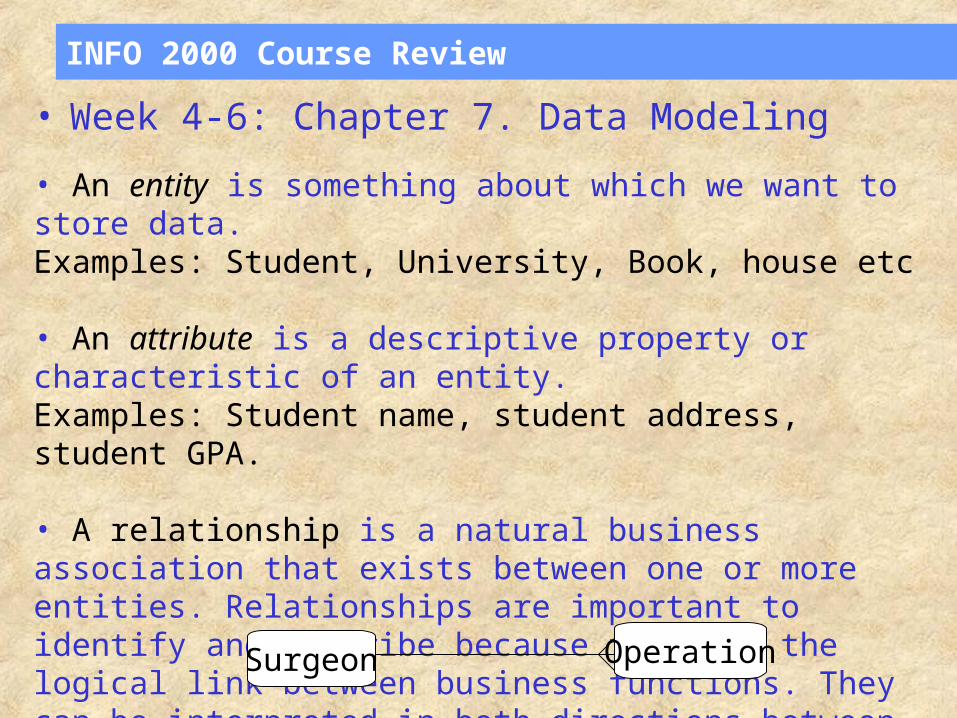
• Week 4-6: Chapter 7. Data Modeling
• An entity is something about which we want to store data.Examples: Student, University, Book, house etc
• An attribute is a descriptive property or characteristic of an entity.Examples: Student name, student address, student GPA.
• A relationship is a natural business association that exists between one or more entities. Relationships are important to identify and describe because they are the logical link between business functions. They can be interpreted in both directions between multiple entities.Example:
Surgeon Operation
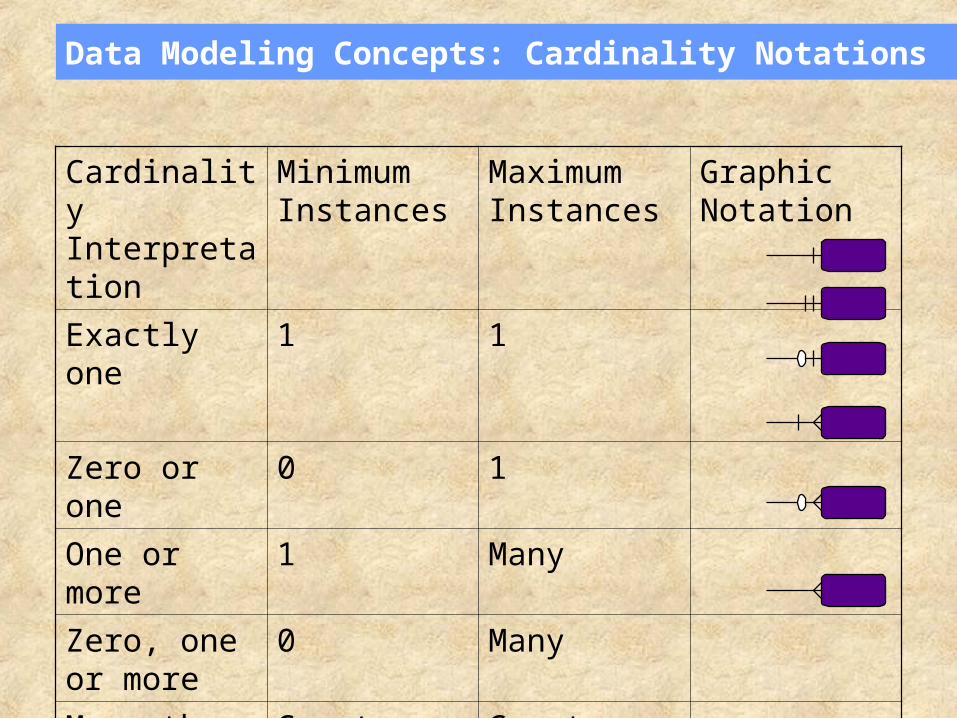
Data Modeling Concepts: Cardinality Notations
Cardinality Interpretation
Minimum Instances
Maximum Instances
Graphic Notation
Exactly one 1 1
Zero or one 0 1
One or more 1 Many
Zero, one or more
0 Many
More than one Greater than 1 Greater than 1
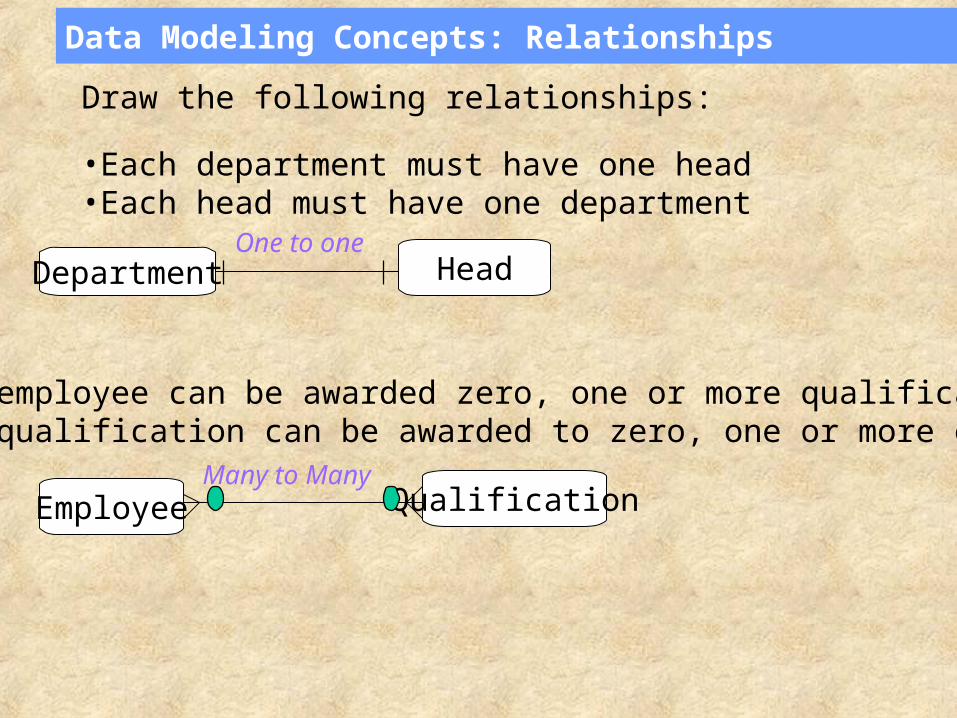
Data Modeling Concepts: Relationships
Draw the following relationships:
•Each department must have one head•Each head must have one department
•Each employee can be awarded zero, one or more qualifications•Each qualification can be awarded to zero, one or more employees
Department HeadOne to one
Employee QualificationMany to Many
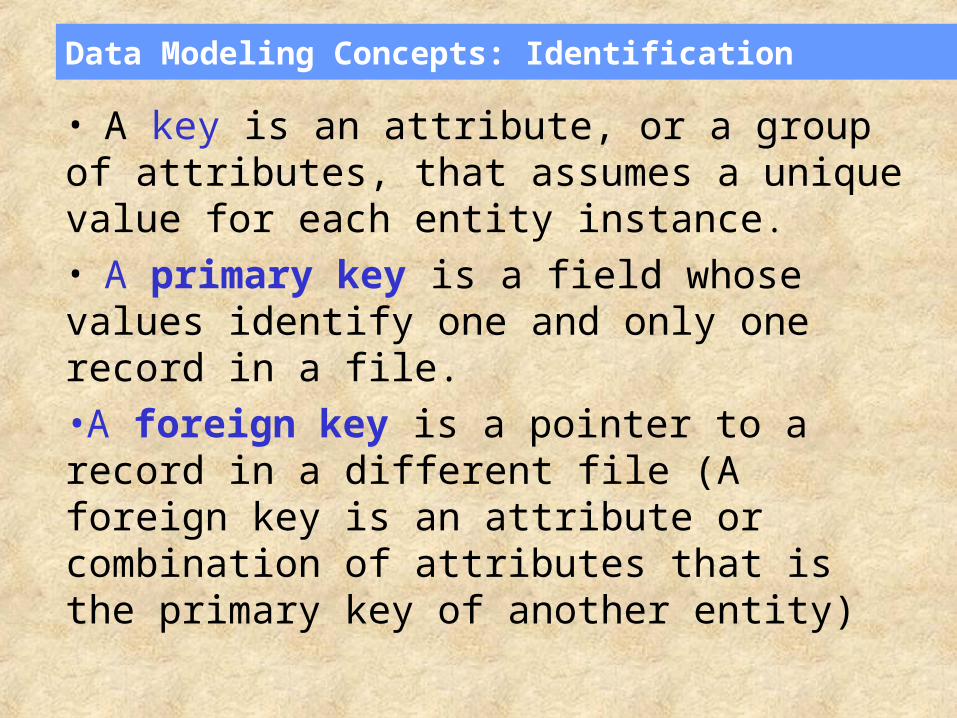
Data Modeling Concepts: Identification
• A key is an attribute, or a group of attributes, that assumes a unique value for each entity instance.
• A primary key is a field whose values identify one and only one record in a file.
•A foreign key is a pointer to a record in a different file (A foreign key is an attribute or combination of attributes that is the primary key of another entity)
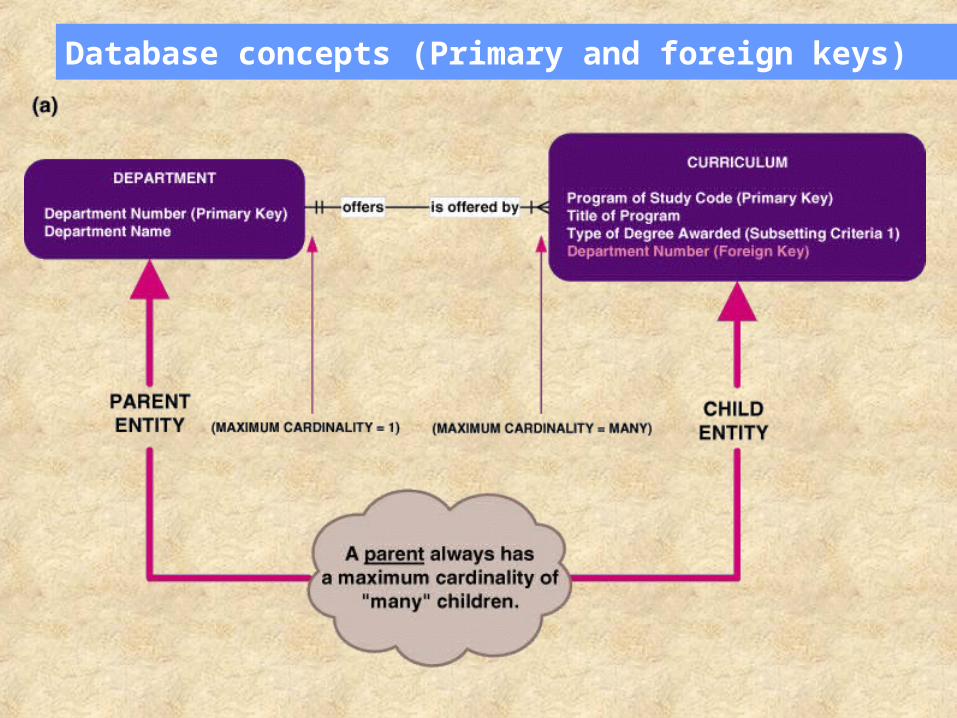
Database concepts (Primary and foreign keys)
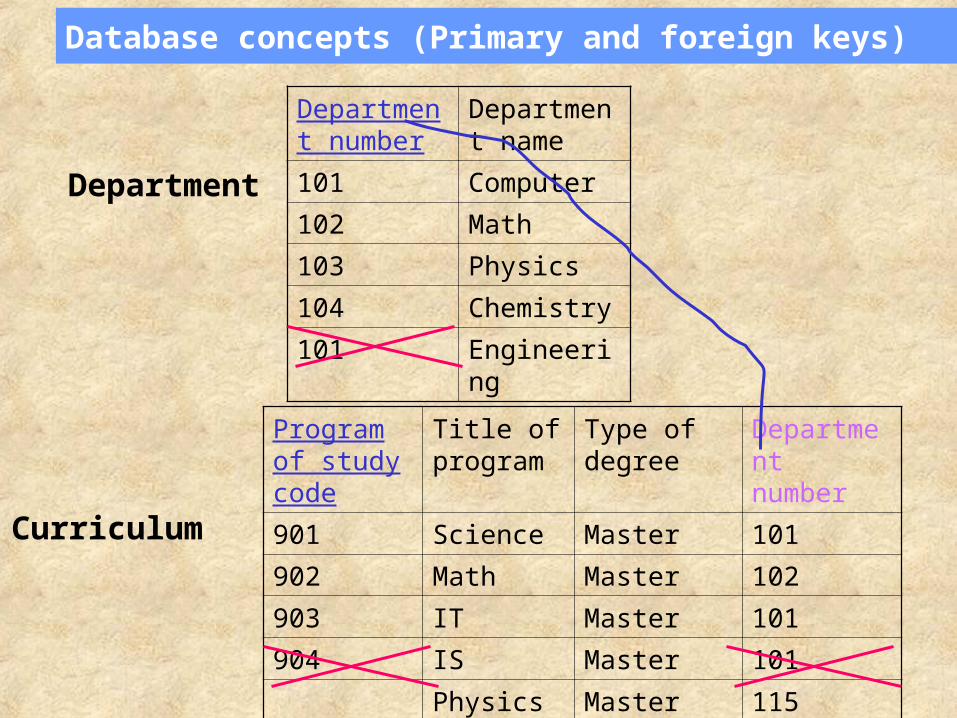
Database concepts (Primary and foreign keys)
Department number
Department name
101 Computer
102 Math
103 Physics
104 Chemistry
101 Engineering
Department
Program of study code
Title of program
Type of degree
Department number
901 Science Master 101
902 Math Master 102
903 IT Master 101
904 IS Master 101
Physics Master 115
Curriculum
INFO 2000 Course Review
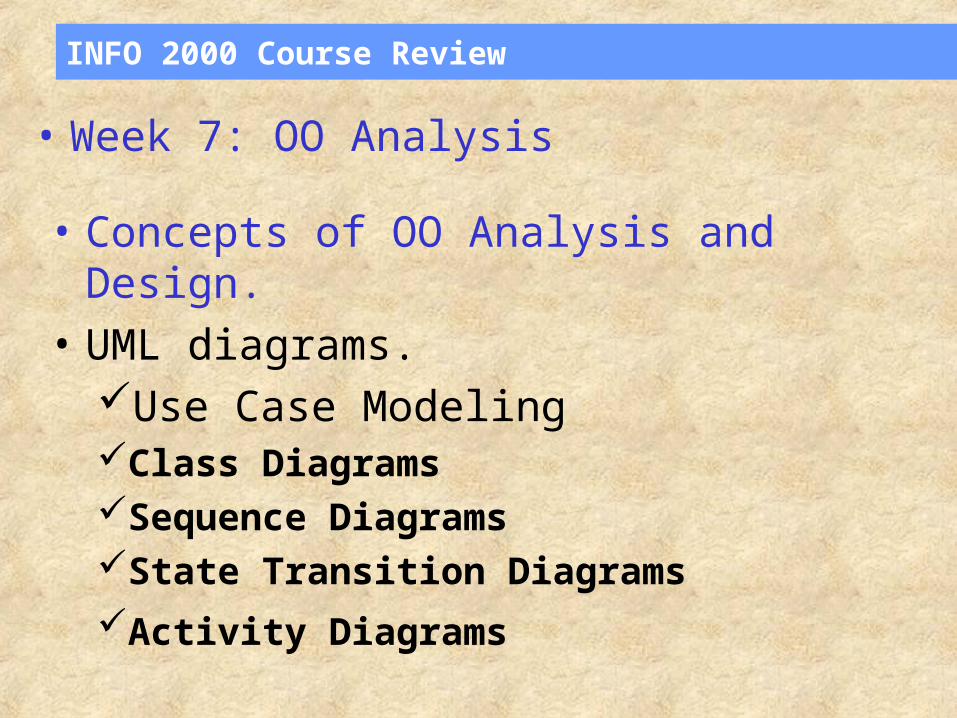
• Week 7: OO Analysis
• Concepts of OO Analysis and Design.
• UML diagrams. Use Case ModelingClass DiagramsSequence DiagramsState Transition Diagrams
Activity Diagrams
INFO 2000 Course Review
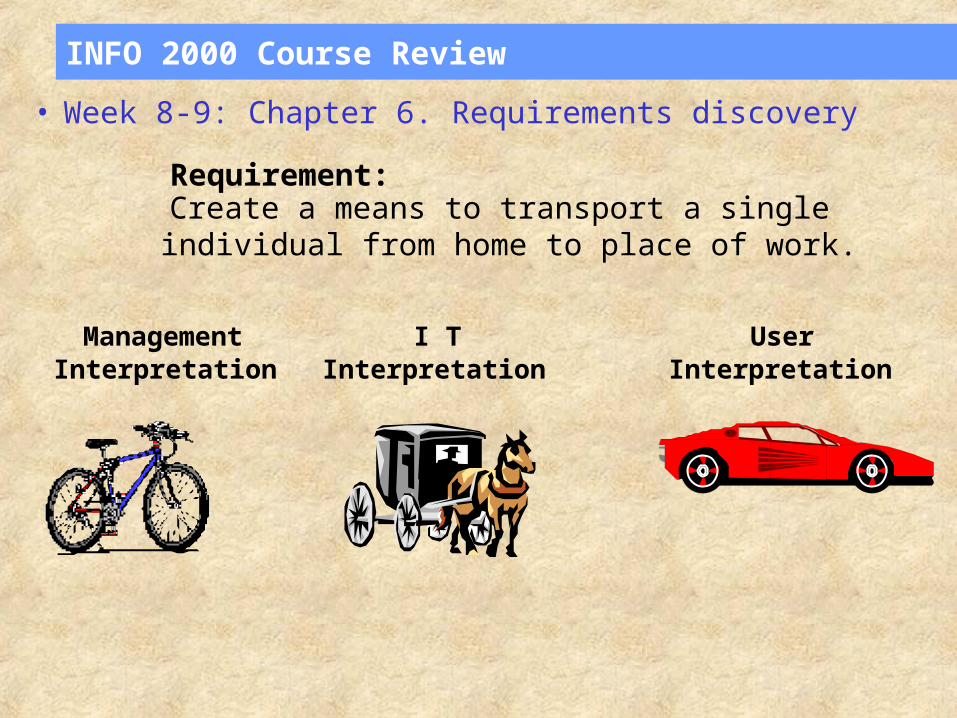
• Week 8-9: Chapter 6. Requirements discovery
Requirement:Create a means to transport a singleindividual from home to place of work.
ManagementInterpretation
I TInterpretation
UserInterpretation
INFO 2000 Course Review
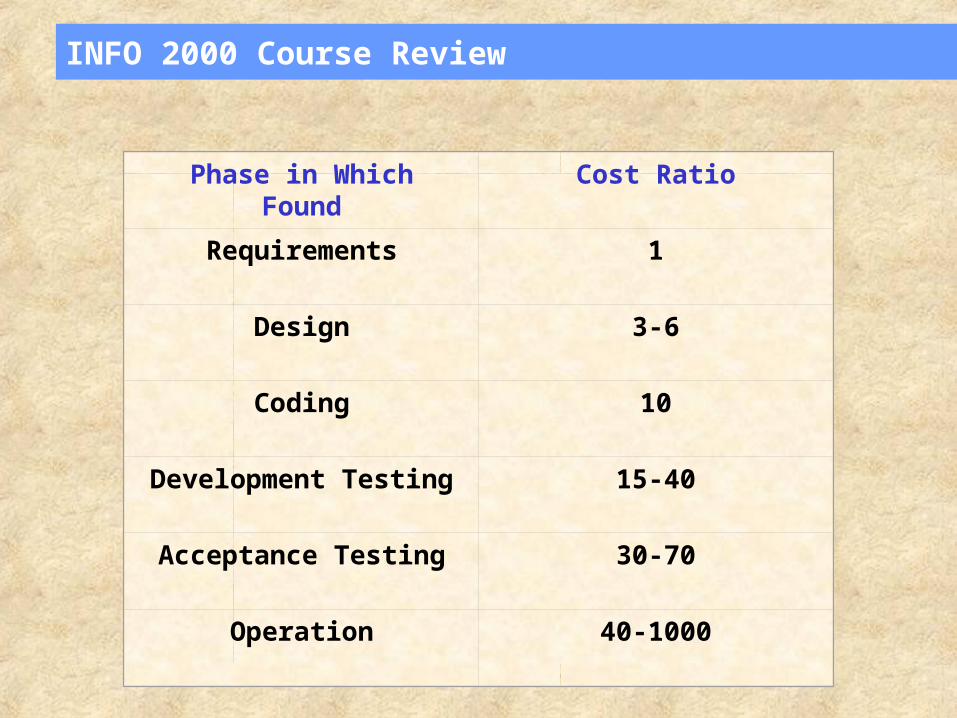
Phase in Which Found Cost Ratio
Requirements 1
Design 3-6
Coding 10
Development Testing 15-40
Acceptance Testing 30-70
Operation 40-1000
INFO 2000 Course Review
• Questionnaires.
• Research and site visits.
• Observation of the work environment.
• Interviews.
• Prototyping.
• Joint requirements planning (JRP).
• Use case modeling and documenting
INFO 2000 Course Review
• Week 10: Chapter 10. Feasibility Analysis
• Operational feasibility is a measure of how well the solution will work in the organization. It is also a measure of how people feel about the system/project.
• Technical feasibility is a measure of the practicality of a specific technical solution and the availability of technical resources and expertise.
• Schedule feasibility is a measure of how reasonable the project timetable is?
• Economic feasibility is a measure of the cost-effectiveness of a project or solution.
INFO 2000 Course Review
• Week 11 Chapters 10, 12, 13, 14, 15 Systems Design
• Input design• Output design• Interface design
Types of outputs
• Internal outputs
• External outputs
• Turnaround outputs
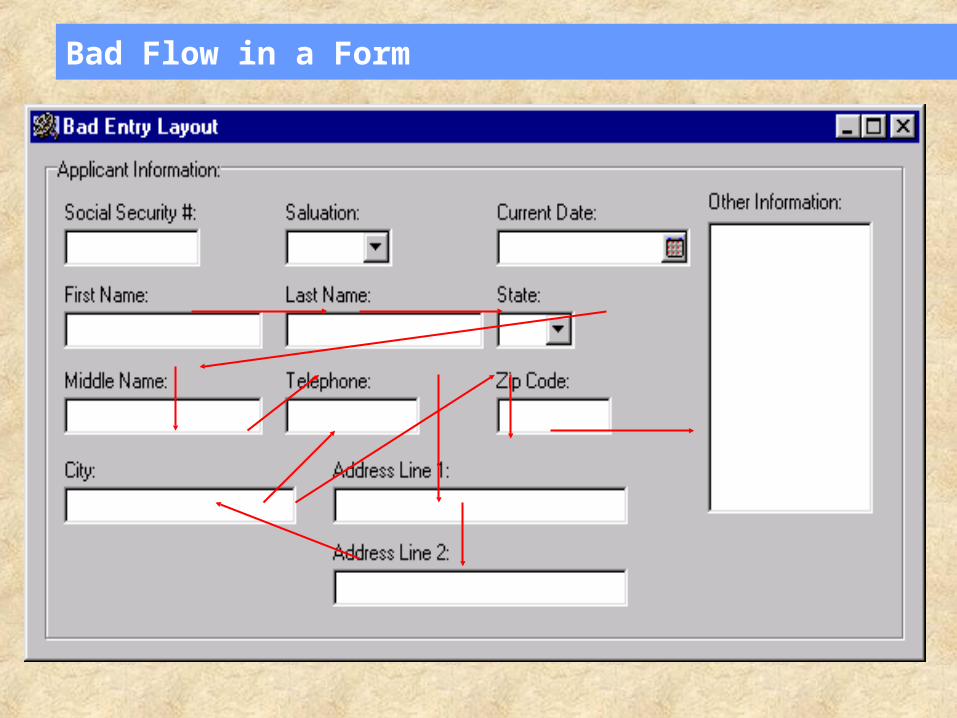
Bad Flow in a Form
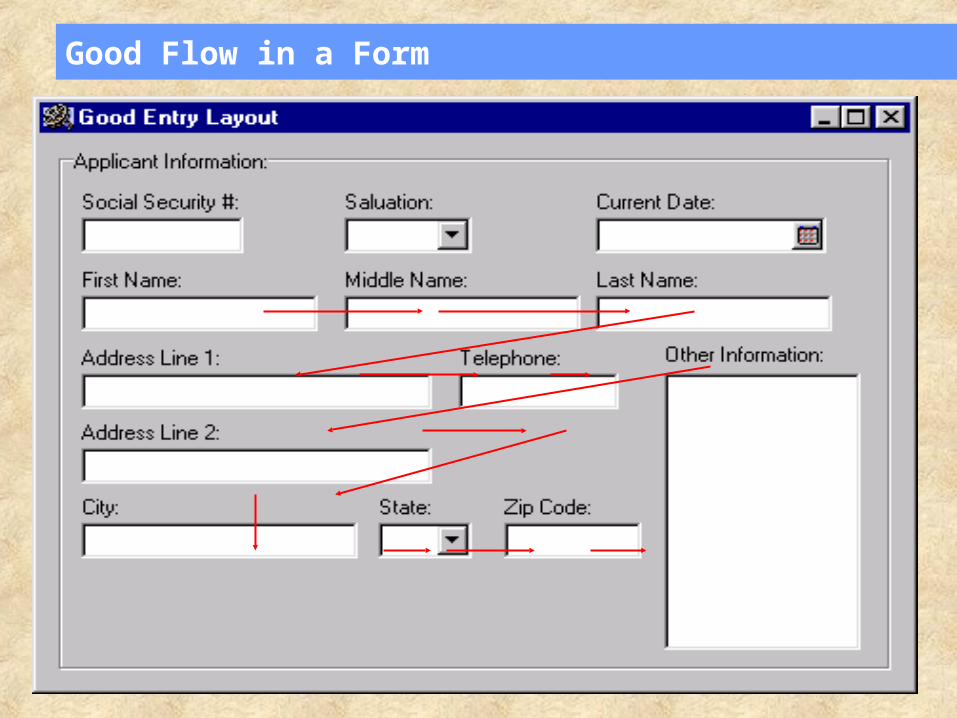
Good Flow in a Form
INFO 2000 Course Review
• Week 12: Chapter 4. Project Management and Software Quality Assurance
A project is a sequence of unique, complex, and connected activities having one goal or purpose and that must be completed by specific time, within budget, and according to specification.
Project management is the process of scoping, planning, staffing, organizing, directing, and controlling the development of an acceptable system at a minimum cost within a specified time frame.
Project Management Tools & Techniques
A PERT chart is a graphical network model that depicts a project’s tasks and the relationships between those tasks.
A Gantt chart is a simple horizontal bar chart that depicts project tasks against a calendar. Each bar represents a named project task. The tasks are listed vertically in the left-hand column. The horizontal axis is a calendar timeline.
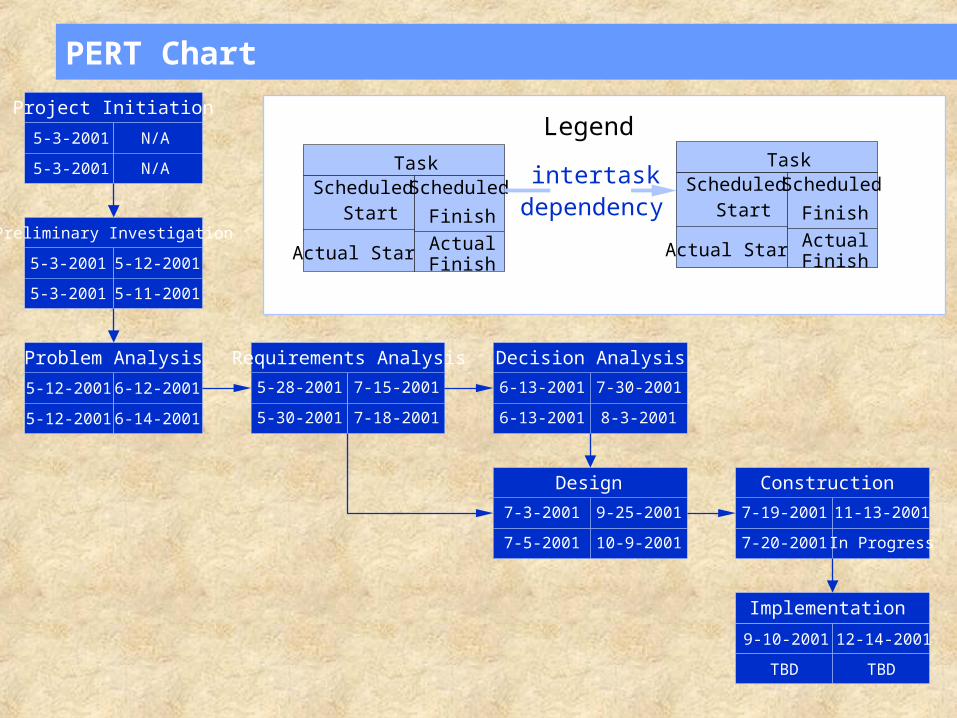
PERT Chart
5-3-2001 5-12-2001
5-3-2001 5-11-2001
Preliminary Investigation
5-12-2001 6-12-2001
5-12-2001 6-14-2001
Problem Analysis
5-28-2001 7-15-2001
5-30-2001 7-18-2001
Requirements Analysis
6-13-2001 7-30-2001
6-13-2001 8-3-2001
Decision Analysis
9-10-2001 12-14-2001
TBD TBD
Implementation
7-19-2001 11-13-2001
7-20-2001 In Progress
Construction
7-3-2001 9-25-2001
7-5-2001 10-9-2001
Design
5-3-2001 N/A
5-3-2001 N/A
Project Initiation
ScheduledStart
Scheduled
Finish
Actual Start ActualFinish
Taskintertask
dependency
Legend
ScheduledStart
Scheduled
Finish
Actual Start ActualFinish
Task
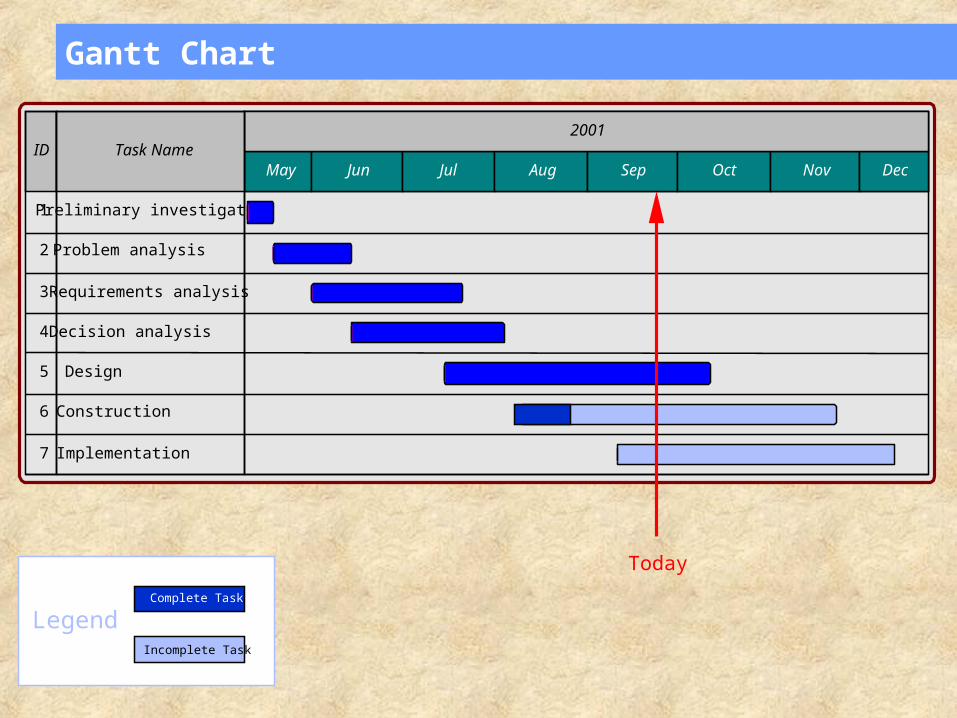
Gantt Chart
Incomplete Task
Complete Task
Legend
ID
1
2
3
4
5
6
7
Preliminary investigation
Problem analysis
Requirements analysis
Decision analysis
Design
Construction
Implementation
May Jun Jul Aug Sep Oct Nov Dec
2001Task Name
Today
Software Quality Assurance
• Understand the terms Quality, Software Quality, Software Quality Assurance,
• Understand the need for quality assurance of software products
• Capability Maturity Model (CMM)
Format of the paper
• Total time – 2 hours + 10 minutes reading time• Total Questions - Eight Questions • Combination of theoretical and practical questions• Easy for those students who regularly attended their
lectures and tutorials.• Very difficult for those students who were not regular in
their lectures and tutorials.
INFO 2000 Paper Format
Two Questions from Process Modeling (Chapter 8)
One Question about diagram zero and other general question about dataflow diagrams
INFO 2000 Paper Format
One Question about Use Case Modeling and description
• Identify actors and use case• Create a use case diagram• Complete use case description document
INFO 2000 Paper Format
Two Questions about Entity Relationship diagram
INFO 2000 Paper Format
One Question about feasibility analysis (Chapter 9)
INFO 2000 Paper Format
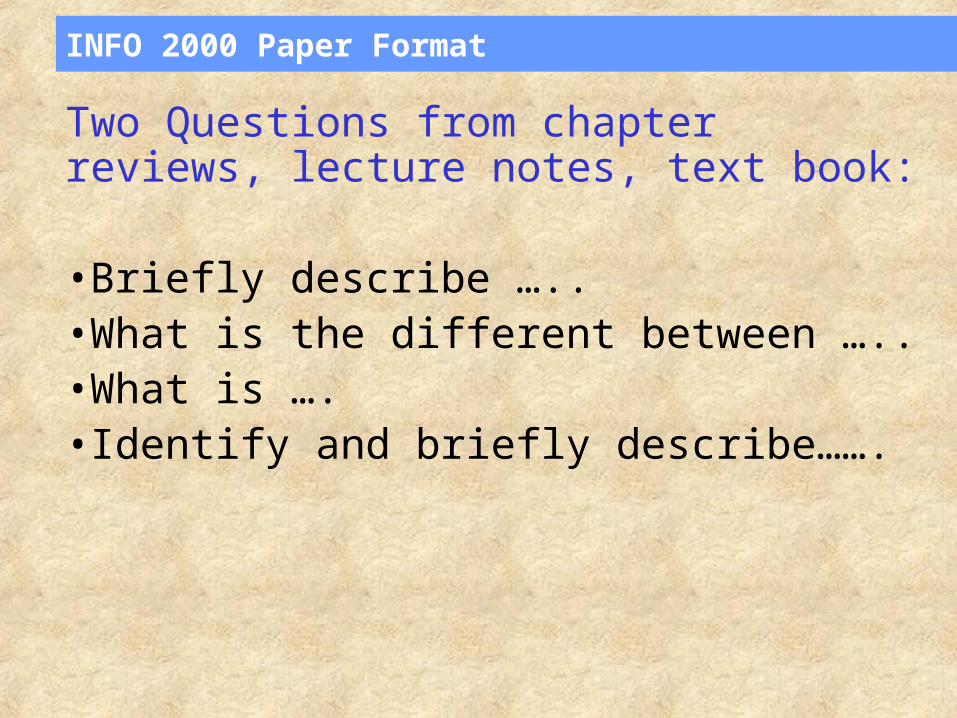
Two Questions from chapter reviews, lecture notes, text book:
•Briefly describe …..•What is the different between …..•What is ….•Identify and briefly describe…….
INFO 2000 Paper Format
GOOD LUCK