Embed Size (px)
Citation preview
Influencer Marketing and Purchase Intentions
How does influencer marketing affect purchase intentions?
Ida Kristin Johansen & Camilla Sveberg Guldvik
Supervisor: Leif E. Hem
Master thesis in Marketing and Brand Management
NORWEGIAN SCHOOL OF ECONOMICS
This thesis was written as a part of the Master of Science in Economics and Business
Administration at NHH. Please note that neither the institution nor the examiners are
responsible − through the approval of this thesis − for the theories and methods used, or results
and conclusions drawn in this work.
Norwegian School of Economics
Bergen, Spring, 2017
2
Abstract
Influencer marketing has been experiencing a wave of popularity the last years, and
predicted to be the marketing strategy of 2017. Since influencer marketing is a relatively new
term, it has no academic definition, and a scarce theoretical foundation exists. Earlier research
on influencer marketing has mainly focused on identifying influencers and if they are
perceived to be credible. To the best of our knowledge there has been no research investigating
the relationship between influencer marketing and purchase intention. Therefore, this master
thesis sets out to investigate how influencer marketing affects consumers’ purchase intentions
based on the theoretical framework Theory of Reasoned Action. By studying how influencer
marketing affects the theoretical framework, we combine the fields of marketing strategy with
consumer behaviour. In addition, we have examined how influencer marketing measures up
against regular online advertisement. A modified experiment was conducted through the
means of an online questionnaire distributed through Facebook. The questionnaire generated
responses from 180 respondents, and the results show as expected that influencer marketing
positively influences consumers’ “attitude towards the behaviour”, and has no effect on
consumer “subjective norm” in the Theory of Reasoned Action framework. However, more
surprisingly the results show that influencer marketing has no direct effect on consumers
purchase intention, and that influencer marketing is not a more efficient marketing strategy
than regular online advertisement. Still, we encourage more research into the field of
influencer marketing to further examine this result.
3
Preface
This thesis is written as a part of our Master Degree in Economics and Business
Administration at the Norwegian School of Economics (NHH). Both authors have specialized
in Marketing and Brand Management, and this thesis account for 30 credits within this major.
The purpose of the thesis is to contribute to the field of influencer marketing, by examine the
relative effectiveness influencer marketing has on consumers’ purchase intentions.
The reason behind the choice of topic was our common interest in the field, and after
looking the latest marketing trends, there was one word that especially stood out; Influencer
marketing. Furthermore, this field of research became even more interesting when we found
out that there is a lack of research conducted on influencer marketing in general. During our
education in Marketing and Brand Management at NHH we learned about the challenges
marketers face in terms of influencing consumers through traditional marketing strategies,
which intrigued and inspired us to looked at how influencer marketing could potentially
influence consumer behavior.
The process of writing this thesis has been both interesting and challenging, but most
importantly we have learned a lot from theoretical insight into the field of influencer marketing
and consumers’ behavior, to methodological procedures for conducting a research study. The
end product has provided some interesting results, and hopefully it can motivate to further
research.
We would like to direct a special thanks to our advisor Leif E. Hem, for his valuable
feedback and excellent commitment to the advisor task. Finally, we would also like to thank
everyone who responded to our online questionnaire, as well as family and friends for great
encouragement and support during the writing process.
Bergen, 17.06.2017
-------------------------------- --------------------------------
Ida Kristin Johansen Camilla Sveberg Guldvik

4
Contents
ABSTRACT .................................................................................................................................. 2
PREFACE .................................................................................................................................... 3
CONTENTS ................................................................................................................................. 4
1. INTRODUCTION .................................................................................................................. 8
2. THEORY............................................................................................................................. 12
2.1 INFLUENCER MARKETING ......................................................................................................... 12
2.1.1 Defining Influencer Marketing ....................................................................................... 13
2.1.2 What is Influencer Marketing? ...................................................................................... 14
2.1.3 History ............................................................................................................................ 15
2.1.4 The Benefits of Influencer Marketing ............................................................................ 16
2.2 WORD OF MOUTH.................................................................................................................. 18
2.2.1 The Psychological Mechanisms of WOM ....................................................................... 18
2.2.2 Rationale behind WOM ................................................................................................. 20
2.3 WOM COMMUNICATION ........................................................................................................ 22
2.4 OPINION LEADERSHIP .............................................................................................................. 22
2.4.1 Dimensions of Opinion Leadership ................................................................................ 23
2.4.2 What Drives Opinion Leadership? ................................................................................. 23
2.5 PURCHASE INTENTIONS ........................................................................................................... 24
2.5.1 Attitudes ........................................................................................................................ 25
2.5.2 Theory of Purchase Intention ......................................................................................... 27
2.5.3 The Theory of Reasoned Action and The Theory of Reasoned Action ........................... 28
2.5.4 The Theory of Planned Behavior .................................................................................... 29
2.5.5 Attitudes Towards the Advertisement ........................................................................... 31
3. RESEARCH MODELS AND HYPOTHESES ............................................................................... 34
3.1 RESEARCH QUESTION .............................................................................................................. 34
3.1.1 Modifications of the TRA Model .................................................................................... 35
3.1.2 Conceptual Model .......................................................................................................... 35
3.1.3 Hypotheses .................................................................................................................... 37
4. RESEARCH METODOLOGY .................................................................................................. 39
4.1 RESEARCH STRATEGY............................................................................................................... 39
4.2 RESEARCH DESIGN .................................................................................................................. 39
5
4.2.1 Experiment ..................................................................................................................... 40
4.2.2 The Classical Experiment ............................................................................................... 41
4.2.3 Experimental Design ...................................................................................................... 43
4.2.4 Instrumental Design ...................................................................................................... 43
4.2.5 Pilot Test ........................................................................................................................ 44
4.2.6 Questionnaire ................................................................................................................ 46
4.2.7 Manipulation Checks ..................................................................................................... 47
4.3 MEASUREMENT ..................................................................................................................... 47
4.3.1 Independent Variable .................................................................................................... 48
4.3.2 Dependent Variable ....................................................................................................... 49
4.3.3 Mediator Variable .......................................................................................................... 49
4.3.4 Manipulation Check ....................................................................................................... 50
4.3.5 Control Variables ........................................................................................................... 50
4.4 DATA COLLECTION .................................................................................................................. 51
4.4.1 Sampling ........................................................................................................................ 51
5. RESULTS ........................................................................................................................... 54
5.1 DESCRIPTIVE STATISTICS .......................................................................................................... 54
5.1.1 Descriptive Analysis Control Variables........................................................................... 55
5.1.2 Descriptive Analysis Manipulation Checks..................................................................... 57
5.1.3 Chronbachs Alpha .......................................................................................................... 57
5.2 T-TEST .................................................................................................................................. 57
5.2.1 Testing the Hypotheses .................................................................................................. 58
5.3 ANOVA ............................................................................................................................... 61
5.3.1 ANOVA Assumptions...................................................................................................... 61
5.3.2 Testing the Hypotheses .................................................................................................. 63
4.4. 3 Conclusion ......................................................................................................................... 67
6. DISCUSSION ..................................................................................................................... 69
6.1 SUMMARY OF RESULTS ............................................................................................................ 69
6.2 THEORETICAL IMPLICATIONS ..................................................................................................... 70
6.2.1 H1................................................................................................................................... 70
6.2.2 H2a ................................................................................................................................ 72
6.2.3 H2b ................................................................................................................................ 74
6.2.4 H3................................................................................................................................... 75
6.2.5 Control Variables ........................................................................................................... 76
6
6.2.6 Conclusion ...................................................................................................................... 78
7. LIMITATIONS AND FURTHER RESEARCH ............................................................................. 79
7.1 STRENGHTS AND LIMITATIONS .................................................................................................. 79
7.2 RELIABILITY ............................................................................................................................ 81
7.2.1 Internal Reliability .......................................................................................................... 81
7.2.2 External Reliability ......................................................................................................... 81
7.3 VALIDITY ............................................................................................................................... 83
7.3.1 Statistical Conclusion Validity ........................................................................................ 83
7.3.2 Internal Validity ............................................................................................................. 84
7.3.3 External Validity ............................................................................................................. 86
7.4 ETHICS .................................................................................................................................. 87
7.5 SUGGESTION FOR FURTHER RESEARCH ....................................................................................... 87
7.6 CONCLUSION ......................................................................................................................... 89
8. REFERENCES ...................................................................................................................... 90
APPENDIX ............................................................................................................................... 100
7
LIST OF FIGURES
Figure 1: Overview of the theories’ relationship ………………….………………………..13
Figure 2: The evolution of WOM theory……………………………………………………21
Figure 3: What drives opinion leadership…………………………………………………...24
Figure 4: The TRA model…………………………………………………………………...28
Figure 5: The TPB model…………………………………………....………....……………30
Figure 6: The dual – mediation hypothesis model…………………...………….…………..32
Figure 7: Influencer marketing affecting the TRA model…………………………………..34
Figure 8: Proposed conceptual model……………………………………………………….36
Figure 9: Research design…………………………………………………………………...42
Figure 10: Experimental conditions…………………………………..……………………..43
Figure 11: Distribution blogs read last week………………………………………………..56
Figure 12: Distribution of hours online last week…………………………………………..56
Figure 13: Overview of the results from t-test……………………………………………...60
Figure 14: Overview Influencer Marketing………………………………………………...67
Figure 15: Overview Regular Online Advertisement………………………………………68
LIST OF TABLES
Table 1: Descriptive statistics respondents full dataset…………………………………….54
Table 2: Paired samples t-test………………………………………………………………58
Table 3: Paired samples t-test……………………………………………………………....59
Table 4: Paired samples t-test………………………………………………………………60
Table 5: Direct effect……………………………………………………………………….64
Table 6: Attitudes…………………………………………………………………………..65
Table 7: Subjective norm…………………………………………………………………..66
Table 8: Summary of results……………………………………………………………….69
8
1. Introduction
No matter where we turn, we are being exposed to advertisements. On TV, cinemas,
online papers, podcasts, out in the street, in stores, and so on. Advertisements are everywhere,
and they are fighting to get our attention. Also, they are losing their effectiveness because we
are becoming blind in the advertisement jungle, and consumers tend to view them as noise
(Wang et al., 2016). According to Infolinks, a digital advertising platform, only 14 percent of
their respondents were able to recall the last advertisement they saw and identify its message
(Talaverna, 2015). Paid services as Spotify and Netflix where you pay a premium price to
escape advertisements are fairly popular (Talaverna, 2015). Even tools like ad blocking, that
keeps you from having to see advertisements online, are widely used (Dogtiev, 2016). There
is no question, we are being exposed to a lot of ads.
Marketers are fighting to find the best way to influence the consumers, and marketing
techniques where they try to “camouflage” the advertisements have developed. Product
placement, content marketing and influencer marketing are some of the strategies where
marketers try to influence consumers without being perceived as noise. Influencer marketing
however, seems to be the buzzword, as several units have predicted it to be the marketing
strategy of 2017 (Harrison, 2017; Patel, 2016; Talaverna, 2015). In Influencer marketing
brands use influencers, “normal people” with thousands of followers in their social media
accounts, to drive the brand’s message (Tapinfluence, 2017). The influencers collaborate with
companies by creating a post about the brand’s product or service, and are being payed for
their efforts to get the word out (Tapinfluence, 2017). The influencers are engaging in all kinds
of social media platforms, but blogs, Facebook, Youtube, Instagram and Twitter are the most
effective ones (Markethub, 2016). A typical example of an influencer marketing campaign
would be a girl on Instagram with around 10.000 followers who receives a dress from a
company in exchange for writing a review about the product, or a blogger with double as many
readers writing a review about a shampoo and getting paid from the company to do that.
The predictions of being the marketing strategy of 2017 are being made with good
reason; Influencer marketing allows marketers to connect with consumers more directly,
organically and at scale. Also, their messages can be amplified while seducing their target
audience (Talaverna, 2015). Influencer marketing is still a relatively new term, but even
though it lacks a strong academically foundation, several marketing and PR companies have
done research where they find strong numbers in favor of influencer marketing. Berger and
the Keller Fay Group (2016) found in their research that influencers are being perceived as
9
more credible, believable and knowledgeable, and that 82% are highly likely to follow an
influencers advice. The fact that influencer marketing is a relatively new marketing strategy
creates arbitrage opportunities, and Tapinfluence together with Nielsen, found in 2016 that
influencer marketing gives a “Return on investments” (ROI) 11 times higher than traditional
forms of digital marketing (Tapinfluence & Nielsen, 2016). Further, the consumer market
research company Nielsen found in 2012 that 92% trust recommendations from individuals
rather than brands (Nielsen, 2012). In the theory part we have dedicated a whole section to
influencer marketing, and will elaborate further and look at different perspectives.
Higher ROI, more credible and believable, less interrupting than regular ads, arbitrage
opportunities, new technology, changing markets, and predictions of being one of the most
important marketing trends of 2017, are arguments that triggers further exploration of
influencer marketing. Moreover, our overarching goal is to gain a better understanding of
influencer marketing and why it is such a successful marketing strategy. However, not all
perspectives can be covered. In a marketing context one can imagine many ways in which
influencer marketing can affect and create value as a marketing strategy. Godey et al. (2016)
found that social media marketing has a significant positive effect on brand equity and on the
two main dimensions; brand awareness and brand image. One direction for this thesis could
be to look more into the research of Godey et al., (2016) and see if the specific social media
marketing strategy influencer marketing will affect the same way, or we could look at the
additional dimensions of brand equity. Further, one can rationalize that influencer marketing
can affect consumers in different ways as their attitudes, actual behavior, commodity talk/word
of mouth, brand loyalty, satisfaction etc. The research on influencer marketing is relatively
scarce, and Godey et al., (2016) have covered the brand equity specter. Thus we aim to cover
pieces of the other part, and our interest is to explore influencer marketing and its effect on
consumer behavior. The reason is partly based on our own observations in the influencer
marketing jungle. What caught our attention from own experience is that influencers very
often are being used by brands to promote new products. Their posts on the chosen social
media often explain how a product/service works, or discusses the quality and uniqueness of
the product/service. In other words, the brands try to use the influencers to make consumers
buy their product. They are trying to affect their purchase intentions. Moreover, purchase
intentions has been a popular research field as a part of attitude studies (Bagozzi et al., 1979;
Ostrom 1969) and are being routinely used in various advertising domains as, tracking studies,
brand evaluations and brand extensions (Spears & Singh, 2004). In addition, purchase
intentions can be used as a tool to measure effective marketing, since it is widely used by
10
marketing managers to forecast future sales or market share (Morwitz, 2014). Purchase
intentions have various applications and can be used to measure different perspectives. One
of the aims of this thesis is to give additional perspectives to purchase intentions. Thus, the
goal is to interpret how influencer marketing affects a consumer’s purchase intention in order
for marketers to make better decisions, and if it is an effective tool at all. Our research question
in this thesis is therefore:
RQ1: What effect has influencer marketing on consumers’ purchase intention, and how is the
purchase intention being affected?
When searching to answer this question, we were looking for behavioral models that
could explain why consumers have a certain behavior. The theory of reasoned action (TRA),
is a model that explains how different factors as “normative subjects” and “behavioral
attitudes” affect a consumer’s intention to a certain behavior. In our case, that certain behavior
we try to explain is purchase intention. The model is recognized and has been widely used to
describe and change different behavior. It has also been further developed by several
researchers to improve its weaknesses. A deeper elaboration of this model will be presented
in chapter 2, and in chapter 3 we will give an amplification of how the TRA model is being
used in order to answer our research question.
To our knowledge there are no studies that have investigated the relationship between
influencer marketing and purchase intentions. This study aims to contribute with new
information to a previously unexplored area of research. However, the study will not be able
to cover all aspects of influencer marketing and purchase intention, but only a few chosen
aspects. Also, there are several models and theories that can explain purchase intentions. This
study may serve as a foundation for further research of influencer marketing and behavior, but
also serve as a motivator to more research on influencer marketing in general. Because of
resource limitations and to simplify the process this thesis will limit its findings to the
Norwegian market. The respondents will only be Norwegian, and the survey was developed
considering Norwegian customers with Norwegian social media examples and products.
The introduction has shed light to why influencer marketing should be a field of interest
for researchers, and addressed the research topic. This thesis will proceed as following;
Chapter 2 presents and reviews relevant theory that serves as a foundation for our proposed
hypothesis. Chapter 3 presents the research model and our hypotheses. In chapter 4 the
research methodology will be presented where we provide an in-depth presentation of research

11
design, data collection and variables. In chapter 5 the results from our research will be
presented, and in chapter 6 an elaboration of the findings will be given. Finally, in chapter 7 a
presentation of the limitations and quality of the research design, as well as suggestions for
future research, will be given.
12
2. Theory
In this chapter, an elaboration of the relevant theories for our research questions will
be presented. These theories have been used as a background to develop our hypotheses which
will be presented in the next chapter. Our research question consists of two different
components; influencer marketing and purchase intentions. In this part we will unwrap the two
terms and explore the theory and what is lying behind. The structure of this chapter will be
divided into these two main parts.
The first section of the theory will look at influencer marketing, and as have already
been mentioned and will be elaborated more on later, is a relatively new term with no
academically definition. We have uncovered that influencer marketing can be partly
rationalized by two already existing theories; word-of-mouth (WOM) and opinion leadership.
First we will therefore try to explain this relationship more thoroughly. Second, a deeper
elaboration of influencer marketing will be given, followed by an introduction to WOM theory
and opinion leadership. The second section of this chapter studies purchase intentions with a
focus on the theory around attitudes, purchase intentions, the TRA model and attitude towards
the ad. The explanation of these choices will be given in the respective parts.
2.1 Influencer Marketing
This part of the paper will try to give a better understanding of what influencer
marketing is by looking at different perspectives. By diving into the influencer marketing
theory we have as mentioned discovered a relationship between influencer marketing; WOM
and opinion leadership. WOM can easily be mistaken with influencer marketing, but when a
consumer is propagating a message through WOM, influencer marketing is the process and
WOM is often the medium (Markethub, 2016). As will be elaborated on later, the linear
model is a WOM communication model that uses opinion leaders because they are WOM-
spreading consumers. This links WOM with opinion leadership which leads us to the next
theory. Opinion leaders are defined as “individuals who exert an unequal amount of
influence on the decision of others” (Rogers & Cartano, 1962, p.435). In this definition we
find similarities to influencer marketing, and opinion leadership has widely been used to
explain influencer marketing (Feick & Price 1987; Kozinets et al. 2010), but what
distinguish the influencers from these phenomena are their different consumer behaviors of
ongoing communication by ordinary consumers to a mass audience of strangers (McQuarrie
et al.,, 2012).
13
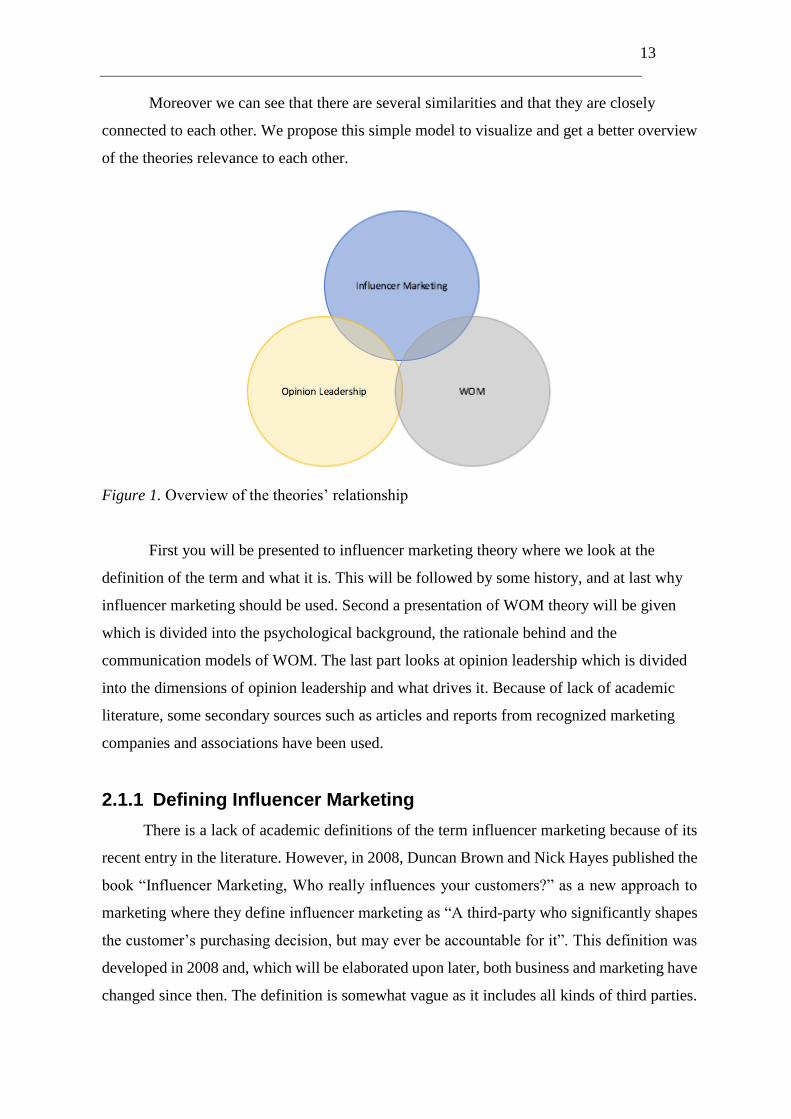
Moreover we can see that there are several similarities and that they are closely
connected to each other. We propose this simple model to visualize and get a better overview
of the theories relevance to each other.
Figure 1. Overview of the theories’ relationship
First you will be presented to influencer marketing theory where we look at the
definition of the term and what it is. This will be followed by some history, and at last why
influencer marketing should be used. Second a presentation of WOM theory will be given
which is divided into the psychological background, the rationale behind and the
communication models of WOM. The last part looks at opinion leadership which is divided
into the dimensions of opinion leadership and what drives it. Because of lack of academic
literature, some secondary sources such as articles and reports from recognized marketing
companies and associations have been used.
2.1.1 Defining Influencer Marketing
There is a lack of academic definitions of the term influencer marketing because of its
recent entry in the literature. However, in 2008, Duncan Brown and Nick Hayes published the
book “Influencer Marketing, Who really influences your customers?” as a new approach to
marketing where they define influencer marketing as “A third-party who significantly shapes
the customer’s purchasing decision, but may ever be accountable for it”. This definition was
developed in 2008 and, which will be elaborated upon later, both business and marketing have
changed since then. The definition is somewhat vague as it includes all kinds of third parties.
14
This indicates that friends recommending something to each other or online reviews in forums
are influencer marketing. When looking at how the term is being used in daily life, one tends
to associate influencers with a certain type of people, typically a more influential crowd.
The Word of Mouth Marketing Association (WOMMA), the official trade association
dedicated to WOM and social media marketing, defines influencer marketing as “identifying
key communities and opinion leaders who are likely to talk about products and have the ability
to influence the opinions of others” (WOMMA, 2016). This definition is slightly more in line
with today's marketing practice, but also meet some challenges. Marketers today talk about
micro-influencers, and the advantages of marketing through normal people with less influence
because of the brands’ impact on them (Tomoson, 2015). Influencer marketing has been a part
of the marketing presence for a while, and have already started to develop. The terms
“communities” and “opinion leaders”, are thus not in full accordance with today's marketing
practices.
Marketing companies themselves have created definitions of what influencer
marketing is, and Tapinfluence, one of the leading influencer marketing companies, describes
it as “a type of marketing that focuses on using key leaders to drive your brand’s message to
the larger market”(Tapinfluence, 2017). Markethub, another leading influencer marketing
company has a similar description; “influencer marketing involves recruiting thought leaders
and authorities within your niche to broadcast your message to a wider audience” (Markethub,
2016). Marketing companies are using similar definitions which mirrors the daily usage of the
term. This thesis has, based on this, applied the latter practical definitions. As the foundation
now is made, we will look more into what influencer marketing is.
2.1.2 What is Influencer Marketing?
The theoretical definitions have now been presented, but what is really influencer marketing?
As mentioned, influencer marketing is not yet anchored in academia, but there are signs of
change. The Keller Fay Group, a leading market research company focusing on consumer
WOM and social influence, did a research together with marketing professor at the Warton
School of the University, Dr. Jonah Berger. In their research they found that influencers are
“a reliable and credible channel with a real impact in swaying consumer behavior” (The Keller
Fay Group and Berger, 2016). In their study they found many benefits with influencer
marketing, and they will be presented later in this chapter.
Influencer marketing is easily described as marketing on social media that focuses on
15
using influencers to drive a brand’s message to the larger market (Tapinfluence, 2017). An
influencer is a lesser-known and less popular social media user than the celebrities of the
world, however, still with impact. They are a sort of opinion leaders, but not celebrities and
neither totally “normal people”. Why does some people have more influence than others? Is it
because of their status or job responsibility? How connected they are in social or business
networks? Their personality? The deep subject knowledge? Or just the case of right place and
time? Maybe it can be a combination, but as far as one knows, there is no formula to follow
(Brown & Hayes, 2008).
These influencers collaborate with companies, and are being payed for their efforts
either by cash or free products or services to get the word out (Tapinfluence, 2017). Basically
they are sharing the brand’s products or services through their platform(s), either by being
straightforward and posting it as an advertisement, or in a subtler way like e.g. having a
product casually on a table. The influencers are engaging in all kinds of social media platforms,
but blogs, Facebook, Youtube, Instagram and Twitter are the most effective ones, with blogs
as being the most impact full (Markethub, 2016).
For years, brands themselves have been contacting the influencers of their interest, but
recently, new companies have developed because of the shift in the social media marketing
practice and the demand for further services. These companies create databases where they
gather influencers in different fields. In this way, companies can filter through the databases
and find influencers suitable for their brand or product/service. Thusly, by benefiting from
these services, brands are able to streamline their social media marketing by tracing the best
suitable influencers, but also reduce the time searching the suitable ones.
2.1.3 History
In terms of history for ordinary consumers to acquire an audience, institutional
mediation has been required (McQuarrie et al., 2012). Hundreds of years ago, the common
perception was that a certain group of people like church leaders, royalty and heads of wealthy
families had greater rights to knowledge and opinions than everyday people. Until 20 - 30
years ago, consumers were restricted to a limited entertainment field with fixed TV programs,
government-approved radio stations, and untouchable cinema stars. There was an accepted
truth that certain others in power could decide when and what we could relate to. It was only
those in the government, international corporation, or those published in widely respected
media and journals that could acquire global coverage (Brown & Hayes, 2008). The audience
16
was historically only available to institutionally located professionals (McCracken, 1986).
With the technological development, the game of influence changed. Computers,
phones, web and wireless connection developed a whole new arena open to everyone.
Together with the rise of social media technologies, WOM marketing arose. People started to
share opinions, insights, experiences and perspectives in several different forms as text,
images, audio and videos through blogs, podcasts, forums, vlogs etc. WOM formalizes the
process of tapping into everyday conversations, and maps out how to use those conversations
as a marketing tactic (Brown & Hayes, 2008). It can easily be mistaken with influencer
marketing, but when a consumer is propagating a message through WOM, influencer
marketing is the process, and WOM is often the medium (Markethub, 2016b). An elaboration
of WOM will be presented later. However, with the changes in technology and in the
marketplace, ordinary consumers are now able to influence larger crowds (McQuarrie et al.,
2012). Now, we all have a voice.
2.1.4 The Benefits of Influencer Marketing
The marketing agency Tapinfluence did a study together with Nielsen in 2016, where
they found that influencer marketing gives a “Return on investments” 11 times higher than
traditional forms of digital marketing (Tapinfluence & Nielsen, 2016). In the same study,
Nielsen and Tapinfluence found that consumers who had been exposed to influencer
marketing purchased significantly more products in each purchase occasion than the control
group that had been exposed to traditional online marketing. Also they registered a competitive
shift away from competitors’ products. The reason for increased sales were several. First, with
influencer marketing it has to be true engagement. Consumers themselves actively seek the
social media platform compared to a regular online advertisement where it even may or may
not have been seen. Second, influencer marketing creates a halo effect that the influencer carry
over to the brand it creates content for (Tapinfluence & Nielsen, 2016).
The Keller Fay Group and Berger (2016) found that influencers have up to 22,2 times
more “buying conversations” that include product recommendations each week than an
average consumer. Additionally, they find that influencers have more impact than an average
person, whereas 82% of the consumers were “highly likely” to follow an influencer
recommendation, and 73% for average persons. Also, they are more direct in their
recommendations than the general population when recommending something, with 74%
encouraging someone to buy or try something compared to 66% of the general population.
17
Influencers are being perceived as more credible, believable, knowledgeable, and they are
better at explaining how the product works (Berger & The Keller Fay Group, 2016).
An additional advantage with influencer marketing is the secondary effects as reusing
influencer content, which can fuel a brand’s whole social media pipeline. Not only is the brand
being distributed to the influencers’ audiences, but it is also more cost effective than using
internal design teams. Also, when the campaign is done, consumers will still have the
opportunity to view the products/services, which gives influencer marketing campaigns an
ongoing effect (Nielsen & Tapinfluence, 2016).
As mentioned, Berger and the Keller Fay Group (2016) found in their research that
influencers are being perceived as more credible, believable and knowledgeable, and that 82%
are highly likely to follow an influencers advice. Compared to celebrities that may help to
increase brand awareness, influencers will drive the product engagement even further and
increase sales and brand loyalty (Tapinfluence, 2017b). The influencers are very often focused
on a specific niche, which easier can result in increased engagement around a product. When
partnering with an influencer, it is more likely that the influencer is interested in your product
compared to a celebrity. Also, it is easier to know who the followers of the influencers are
than of a celebrity. Thus it is easier to target the right influencers. As a cosmetic brand you
don't know how many of the celebrity's fans actually cares about cosmetics. With a makeup
influencer on the other hand, you are targeting the right consumers more efficient. These
influencers will create content as product descriptions, how to use them etc., which creates a
high value. As this marketing strategy, at least for now, is a more cost efficient way of
marketing, a cosmetic brand can partner with 40 makeup-obsessed influencers whose audience
includes passionate cosmetic enthusiasts than one celebrity who may or may not even use your
product (Tapinfluence, 2017b).
Through their content, influencers are able to show their genuine love for their product
recommendations. Because they have a more similar social status than e.g. celebrities,
consumers perceive them as more trustworthy. Still, they are popular enough in their small
circle to be revered and looked to for recommendations and advice (Tapinfluence, 2017b).
As already presented, history and the technologic development has caused new
demands. Advertisements online are overwhelming, and try wherever they can to steal one's
attention. For the reason that people try to escape advertisements, programs as adblocks have
started to develop. These programs allow consumers to avoid advertisements by blocking them
in film clips, movies or removing them as disrupters on a webpage. Page fair and Adobe
presents in their report from 2014 that 40% of the Millennials are using adblock. However,
18
adblocks cannot block content, which is one of the reasons influencer marketing is effective
(Dahan, 2016).
2.2 Word of Mouth
As mentioned earlier, WOM is being explained as the medium and influencer marketing
as the process. There is therefore a connection between influencer marketing and WOM. Thus,
the rationale behind WOM will also explain a lot of the psychology behind influencer
marketing.
Either we are looking for a new dentist or a place to find new curtains, we often tend
to turn to our friends or family for advice. The higher the risk in what we are searching for,
like the economic risk of buying a new car, the more we are engaging in finding information
(Hoyer, MacInnis & Pieters, 2012). According to Nielsen, 92% believe in recommendations
from family and friends rather than all types of advertising (Nielsen, 2012). This phenomenon
is called WOM, and is defined as “oral or written recommendation by a satisfied customer to
the prospective customers of a good or service” (Business dictionary, 2017). Terms as
electronic WOM (eWOM) have developed, but because there is a conceptual closeness of
eWOM and traditional WOM communication only WOM will be elaborated upon. The
literature expects the consumer motives identified in traditional WOM to be of relevance also
for eWOM (Hennig-Thurau et al., 2004). First a presentation of the underlying psychological
mechanisms of WOM will be given, followed by an explanation of WOM affecting models,
and finally a presentation of WOM in regards to marketing.
2.2.1 The Psychological Mechanisms of WOM
Several have been trying to study what is thought to be the most powerful marketing
tool in regards of influence on consumers’ evaluations, WOM (Laczniak, DeCarlo and
Ramaswarni, 2001). However, only a few studies have explicitly addressed the specific
motives underlying WOM communication behavior (Sundaram et al., 1998). Already in 1966,
long before WOM marketing was a marketing practice, psychologist Ernest Dichter, who
studied motivation and applied it to marketing, created the most prominent study on how
WOM advertising works. Thus, an elaboration of his study will be given. Dichter finds that if
a consumer thinks that an advertisement is a sales tool rather than an information channel, he
feels threatened. Thus he will turn to WOM as a solution for his buying problem. If the
consumer perceive the advertisement as the atmosphere of WOM, friendly and an unbiased
19
authority, the consumer will relax and tend to accept the recommendation.
Dichter (1966) looks at the psychology behind WOM and study both speaker
motivation and listener motivation. Speaker motivation is based on the fact that a speaker will
talk about a product or service if the talking itself, or the expected action from the listener will
create some kind of satisfaction. Moreover, speaker motivation is divided into four different
involvement categories; “product-involvement” - When a consumer experience a distinctly
pleasurable or non-pleasurable experience which have the tendency to call for mental
repetition in the form of speech whenever a fitting occasion offers itself, “Self-involvement”
- the consumer use the talk to self-confirm and reassure himself in front of others in order to
gain attention, show connoisseurship, feeling like a pioneer, etc., “Other-involvement” - the
consumer need to share the enthusiasm and benefits of things enjoyed with another person.
The products or services works as a tool to express sentiments of love, care, and friendship
etc, “Message-involvement” - describes the skepticism and the advertisement consciousness
of consumers. Consumers are aware of advertisements’ effects and they have also started to
accept them as of entertainment value.
The listener motivation is primarily concerned about two key conditions; that the
person who recommends is interested in him and his well-being, and that the speaker’s
experience and knowledge about the product are convincing. Seven divisions were defined as
main sources of potentially successful recommendations; Commercial authorities, celebrities,
connoisseurs (someone with a close and authentic contact with a product, but not professional.
They are still consumers, and are perceived by the listener as someone like himself, but with
more special product knowledge), sharers of interest, intimates (friends and family), people of
goodwill (the listener perceives the speaker as a person with genuine interest in his well-
being), bearers of tangible evidence (ex before/after pictures).
To summarize Ditchers WOM theory, for a speaker to share a product
recommendation, some kind of psychological, not material, reward is expected. The non-
material reward is the most basic motivation for the listener to accept the recommendation.
For an advertiser to fulfill this psychological role is difficult.
Regardless of its intuitive plausibility and prominence, Dichter's work has a main
weakness as there is no detailed information about the development of typology (Hennig-
Thurau et al., 2004). Engel, Blackwell, and Miniard (1993) modified Dichter’s typology,
renaming the categories and introducing an additional motive—dissonance reduction— which
they see as a reason for articulating negative WOM communication only. The most
comprehensive study on motives for WOM communication however, is conducted by
20
Sundaram et al. (1998). They identify eight motives for consumer WOM, where several
corresponds with the original findings of Dichter (1966) and Engel, Blackwell and Miniard
(1993). An awareness of the weaknesses of Dichter’s (1966) study have been given, but
because it is perceived as the most prominent study and that others have derived their studies
from it, we have chosen to use it.
2.2.2 Rationale behind WOM
Kozinets et al. (2010) developed a model, which not only presents the rationale, but
also overview the theoretical development as a series of three evolutionary shifts where all
currently coexist and each pertains to different circumstances.
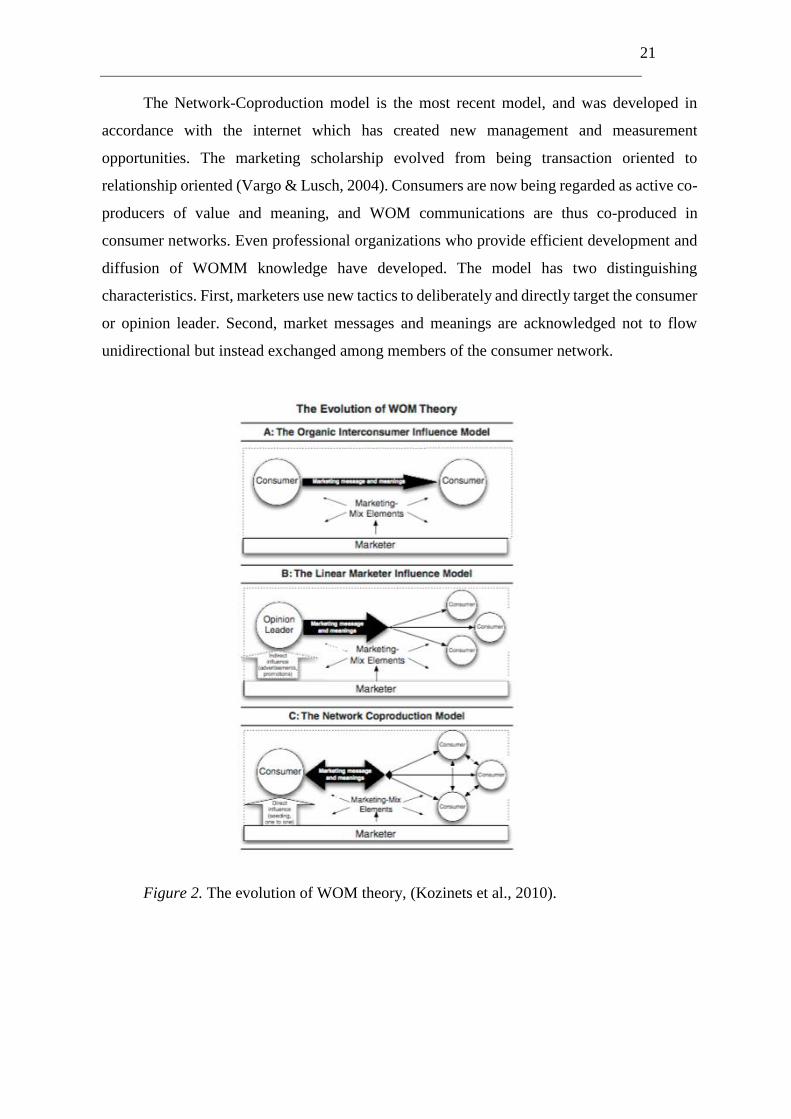
In the simplest (and earliest) interpretation of consumer WOM, the organic
interconsumer influence model, there is an organic interconsumer influence where there is a
communication between two consumers without any direct prompting, influence or
measurement by marketers. The motivation lies in helping others, warn them about poor
service, and/or communicate status (Arndt 1967; Engel, Kegerreis, and Blackwell 1969;
Gatignon and Robertson 1986, cited in Kozinets et al., 2010). In this model, WOM develops
naturally among consumers through innovative and performance effective product
notifications through advertising and promotions (Bass 1969; Whyte 1954, cited in Kozinets
et al., 2010).
The linear model is the second model that is developed. With an advancing marketing
scholarship and practice, WOM began to emphasize the importance of influential consumers
in the WOM process (e.g., Feick and Price 1987; King and Summers 1976, cited in Kozinets,
2010), and the Linear marketer influence model was developed. Marketers became interested
in attempting to influence the credible, influential and WOM-spreading consumers. Now,
marketers attempt to influence consumer WOM through traditional
marketing as advertising and promotions. To use opinion leaders is one strategy in this model.
21
The Network-Coproduction model is the most recent model, and was developed in
accordance with the internet which has created new management and measurement
opportunities. The marketing scholarship evolved from being transaction oriented to
relationship oriented (Vargo & Lusch, 2004). Consumers are now being regarded as active co-
producers of value and meaning, and WOM communications are thus co-produced in
consumer networks. Even professional organizations who provide efficient development and
diffusion of WOMM knowledge have developed. The model has two distinguishing
characteristics. First, marketers use new tactics to deliberately and directly target the consumer
or opinion leader. Second, market messages and meanings are acknowledged not to flow
unidirectional but instead exchanged among members of the consumer network.
Figure 2. The evolution of WOM theory, (Kozinets et al., 2010).
22
2.3 WOM Communication
Dichter (1966) described the psychology that lies behind WOM, and Kozinets et al.
(2010) developed a model that presents the rationale. Further, a presentation of WOM in
connection to marketing will be given. Kozinets et al. (2010) looks at the WOM
communication; market based messages and associated meanings, and the reception by the
intended audience. They find that it is being influenced by four important factors.
First, “character narratives”, personal enduring stories or particular expressed character
types, are affecting the communication. People have archetypal patterns in how they offer
perspectives that unfold over time, even though the narratives vary. A blogger who self-
identify herself with a loving mom will create a narrative stressing kindness, helpfulness and
caring. Second, WOM communication situates while embedded in a particular forum such as
schools, dinner parties, bars, social networking web sites, blogs, etc. Third, communal norms
will affect expressions, transmissions and reception of a message and its meaning, and varies
based on the size of the community, their interest, social class, among other factors. Fourth,
the promotional characteristics of the WOMM campaign, such as the product’s brand equity
and the type of product, will affect the message and meaning of the WOM communication.
These four elements work to change the art of the WOMM message and its associated
meanings in order to transform them from a commercial promotion to communally valuable
information (Kozinets, et al., 2010).
2.4 Opinion Leadership
As mentioned before, research has shown that consumers trust others’ opinions more
than formal marketing sources of information as advertising. Interpersonal sources are being
used to reduce risk and to make both store and brand choices (Flynn, Goldsmith & Eastman,
1996). Sometimes, we trust certain peoples’ opinions more than others, and this can formally
be termed as opinion leadership. Opinion leadership occur when consumers verbally influence
others, and Rogers and Cartano (1962) defines it as “individuals who exert an unequal amount
of influence on the decision of others” (p.435), and studies done since that time is all based on
their early study (Flynn et al., 1996).
Opinion leaders or market mavens (Feick and Price 1987; Kozinets et al. 2010) has
been a widely used term to explain influencer marketing, but what distinguish the influencers
from these phenomena is their different consumer behavior of ongoing communication by
ordinary consumers to a mass audience of strangers (McQuarrie, Miller & Phillips, 2012).
23
However, the closest we have been able to find a theory that explains influencers is the
research of McQuarrie et al. (2012), which is similar to the opinion leaders. They propose the
Megaphone effect as a phenomenon where consumers are able to grab the “megaphone” for
themselves without any institutional certification or enablement, and reach out to a large
audience. They do however only look at a certain type of influencers; bloggers. These persons
gain audience by blogging in a way that numerous of consumers begin to follow their posts.
Once a consumer gains a large audience, this can be converted into institutional access and
further leveraged thereby, but prior institutional mediation is no longer required for audience
access. Even though both influencer marketing and the megaphone effect is similar to opinion
leadership, it is not equal. Further we will look more into opinion leadership to better
understand the differences.
2.4.1 Dimensions of Opinion Leadership
As in many fields, several studies have been done on the same topic, and with opinion
leadership the studies were rather narrow. Myers and Robertson (1972) thus created a study
where they look at the many dimensions of opinion leadership. They find that opinion
leadership for a particular topic comes from the opinion leader’s perceived knowledge, interest
and frequency of discussion about a topic. They also look at opinion leaders’ communication
and find that as with “non-opinion leaders”, there is a two-way process where opinion leaders
also tend to receive some influence from others. Also, their study supported earlier studies
when it comes to innovativeness of opinion leaders as many have described them as
innovators. However, that they are higher on innovativeness, likes to try out new things, is
more correct. A person who is an opinion leader in one topic, may also be perceived as an
opinion leader in related topics.
However, what is important to note is that an opinion leader is not a dominant leader
influencing a passive set of followers. It is only relatively more influential than the average
person, and is also a recipient of influence (Myers & Robertson, 1972).
2.4.2 What Drives Opinion Leadership?
As mentioned earlier, Dichter (1966) propose that involvement with the product class
is a driver for WOM. Several studies of opinion leadership have found similar correlations
with product involvement and opinion leadership, where involvement has been accepted as
the motive for opinion leadership (Reynolds & Darden 1971; Summers 1970, cited in Richins
24
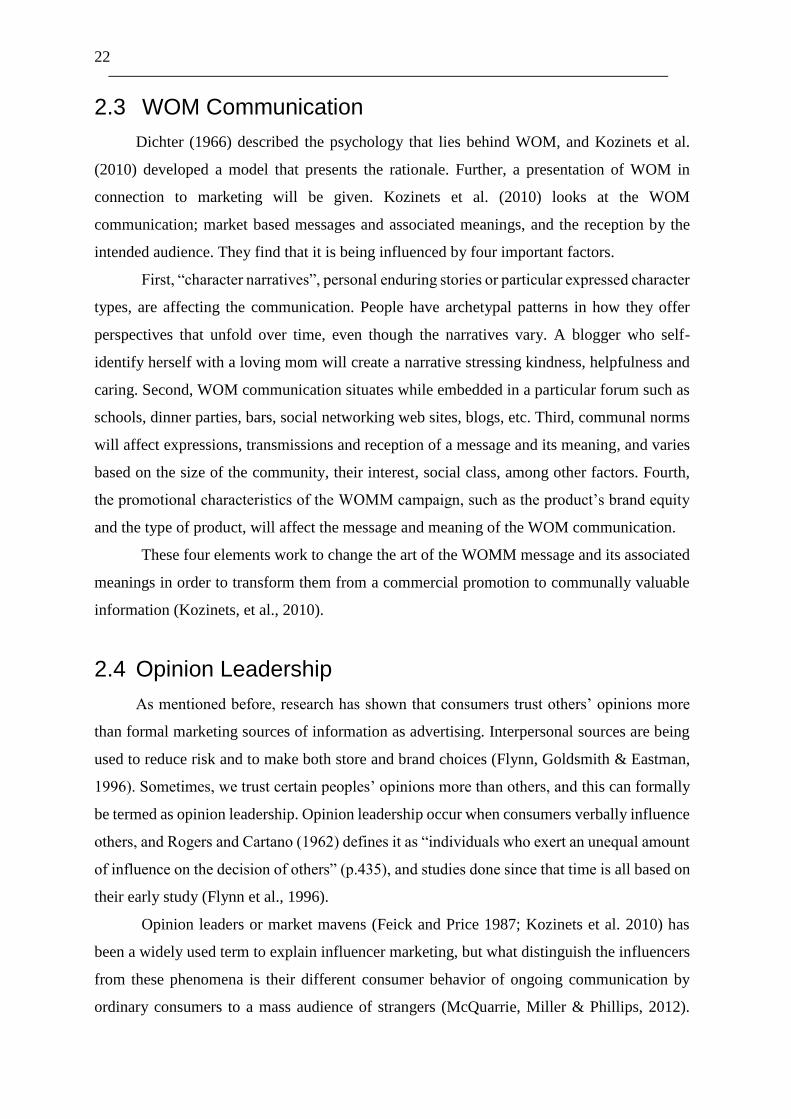
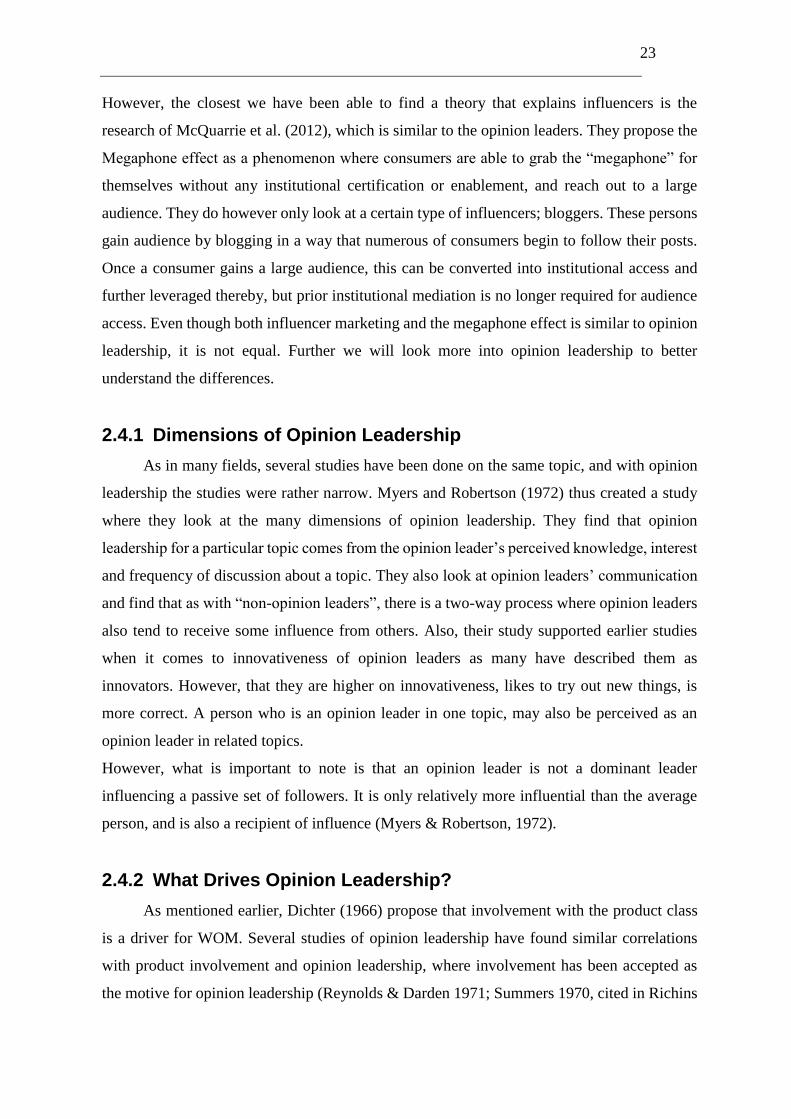
& Root-Shaffer, 1988). Richins and Root-Shaffer (1988) thus propose a model, implied by
consumer behavior writers where involvement drive opinion leadership, which again drives
WOM.
Figure 3. What drives opinion leadership, (Richins & Root-Shaffer, 1988)
The limitations with this model is however the fact that, as Dichter (1966, p. 148)
suggests “experience with the product (or service) produces a tension which is not eased by
the use of the product alone, but must be channeled by way of talk, recommendation, and
enthusiasm…”. It is dubious whether all types of product “excitement” or involvement result
in opinion leadership. The product involvement literature suggests that product involvement
is situational or it can be long term and enduring. Therefore, Richins and Root-Shaffer’s
(1988) model propose that enduring involvement is expected to result in opinion leadership
which in turn results in WOM, whereas situational involvement is only expected to result in
WOM. Another finding is that opinion leadership has the strongest effect when the WOM
include information and advice giving.
To summarize, enduring involvement results in opinion leadership, not situational. Richins
and Root-Shaffer’s (1988) research also finds that there is a relationship between opinion
leadership and WOM.
2.5 Purchase Intentions
Purchase intention is the second main factor in our research question, thus we need to
dig deeper into the theory behind. Researchers have proposed a relationship of dependence
between purchase intention and attitudes, even though it has not been properly established
(Spears & Singh, 2004). Moreover, Lutz (1991) propose that this relationship is necessary as
without, attitude measurements are counterproductive and ambiguous. Next, several models
have been created in order to explain the relationship, whereas Ajzen and Fishbein’s theory of
reasoned action (TRA) (1980) and Fazio’s process model (1989) are well known (Lutz, 1991).
Because of this relationship, the next chapters will in addition to elaborate upon purchase
25
intentions, also address attitudes and corresponding models. Fazio’s model gained a lot of
support, but the TRA model has been regarded as strong concerning marketing and marketing
decisions (Lutz, 1991). Hence, because of our research question, the TRA model will be
focused on. We will start with the fundamentals and go through attitudes. Following a
presentation of purchase intentions will be given, ending with some insight of attitude models.
Then, an elaboration of the literature about attitudes towards the advertisement will be
presented because this may influence attitude towards the brand and purchase intentions.
2.5.1 Attitudes
An attitude is defined as an overall evaluation that expresses how much we like or
dislike an object, issue, person, or action (Petty, Unnava & Strathman, 1991). They can be
learned and tend to persist over time. The reason we can have attitudes towards brands, product
categories and advertisements is that our attitudes reflect the overall evaluation (Hoyer et al.,
2013). Attitudes have a cognitive function by guiding our thoughts, an affective function by
influencing our feelings, and a conative function by affecting our behavior. In our study it is
the conative function that is of most interest. Because of the functions attitudes have, marketers
need to change the attitudes in order to influence consumer decision making and change
consumer behavior. In particular, to affect purchase intentions, attitudes needs to be changed.
According to Hoyer et al., (2013) there are five dimensions that describes attitudes:
The first is favorability, how much we like/dislike an attitude object. The second is attitude
accessibility, how easily an attitude can be remembered. The third is attitude confidence, how
strongly we hold an attitude. The fourth is attitude persistence, the endurance of the attitude.
The fifth is resistance, how hard it is to change an attitude. Furthermore, according to Krosnick
and Smith (1994) the following four dimensions are also relevant for describing attitudes;
intensity - how strong the affective response is, importance - how important we consider the
attitude to be, knowledge - how strongly the attitude is relevant to existing knowledge in
memory, and direct exposure - a direct contact with the object will enhance the attitude. For
marketers it is important to consider all of these dimensions as they together form strong
attitudes towards the brand or product. This will in turn influence consumers’ purchase
intentions (Spears & Singh, 2004). When it comes to attitude strength, Priester et al. (2004)
found in their research that attitude strength plays an important role on consideration and brand
choice. The authors argue that attitude guides consideration considerably more for strongly
held attitudes, and that consideration of a brand mediates the influence of attitudes and attitude
26
strength on choice.
Further, according to Wilson, Lindsey, & Schooler (2000) attitudes can be divided into
two categories; explicit and implicit. Explicit attitudes require a deliberate thought process,
and are therefore considered more conscious (Dempsey & Mitchell, 2010). Implicit attitudes,
on the other hand, have a more unconscious process and therefore considered more automatic
(Dempsey & Mitchell, 2010). Thus there is a difference in the formation of these attitudes.
Madhavaram and Appan (2010) argues that explicit attitudes form as a result of being exposed
to arguments and propositions, while implicit attitude forms when being exposed to a stimulus
from an object. From our marketing perspective, explicit attitudes can be formed after
consumers’ exposure to persuasions arguments in influencer marketing. Implicit attitudes can
be formed after consumers unconsciously are being exposed to the brand/product through
influencer marketing. The difference between explicit and implicit attitudes are therefore of
great interest in formation of attitudes through communication tools like influencer marketing
(Lutz, 1991).
Moreover, attitudes are interesting in our research because they can affect our thoughts,
feelings and behaviors. It has been an interesting field also for researchers who have proposed
various theories explaining how thoughts are related to attitudes when consumers process
information and decision making (Hoyer et al., 2013). “The direct or imagined experience” is
the first theory and says that when a consumer elaborates on actual experience with a product
or service, it can help them form positive or negative attitudes. That is one of the reasons of
why companies allow test-driving a new car or create movie previews for consumers to watch.
The second theory is “reasoning by analogy or category”, and the rationale behind it is that
consumers form attitudes by comparing it to other products or to a particular product category.
Brands serve on this if consumers favor their brand and transfers their positive opinions of a
product to the other products. “Value driven attitudes” is the third theory and explains that a
consumer’s values may affect its attitudes. This also mean that the values might affect attitudes
towards a brand. “Social identity-based attitude generation” is the fourth theory, and propose
that the social identity a consumer have may affect his or her attitudes towards a product or a
brand. Consumers who perceive themselves as athletic might have a more positive attitude
towards a certain sports brand (Hoyer et al,. 2013).
Consumers may also go through a more analytical process for attitude construction.
The consumers create cognitive responses when being exposed to marketing stimuli or other
information, and for attitudes based on the cognitive responses. Expectancy-value models that
explains this process have been created, but Fishbein and Ajzen’s TRA model is the first to
27
address behavioral intention. It is also the first model to recognize that there are situations or
factors that limit the influence of attitude on behavior (Benoit, 2017). Hence, an elaboration
of the TRA model follows after the theory of purchase intention.
2.5.2 Theory of Purchase Intention
Purchase intention can be described as the cognitive behavior regarding the intention to
buy a particular brand (Shah et al., 2012). Spears and Singh (2004) defines purchase intention
as “an individual’s conscious plan to make an effort to purchase a brand”. Consumers’
purchase decisions is a complex process and purchase intention is a part of this process (Kotler
& Armstrong, 2010). Ghosh (1990) states that understanding consumers purchase intentions
is of great importance, as it relates to consumers’ behavior, perception and attitude, and can
therefore be used to predict the buying process.
Furthermore, Kotler and Armstrong (2010) suggests that the consumer's decision
making process consist of five stages; need recognition, information search, evaluation of
alternatives, purchase decision, and post purchase behavior. First, the consumers will discover
that they have a need for a product or service. Second, to satisfy this need the consumers will
search for information both from past experiences and from external sources. Third,
consumers will evaluate the alternatives that are available and form an attitude towards these.
What affects these attitudes depends on the individual consumer and the specific buying
situation. Sometimes consumers use careful calculations and logical thinking, other times
consumers buy on impulse. Also, to form these attitudes consumers turn to friends, family,
online review, opinion leaders, or salespersons for advice. Fourth, after forming these attitudes
about the alternatives the consumer ranks the brands and form a purchase intention. Generally,
consumers will purchase the most preferred brand. However, the attitude of others and
unexpected situational factors might come between the purchase intention and the purchase
decision. Thus, preferences and even purchase intentions do not always result in actual
purchase choice. Fifth, consumers will evaluate the purchase which will decide whether the
consumer will regret or repeat the purchase.
From this we can conclude that attitudes and purchase intention is closely related.
Several researchers have attempted to look at the relationship between attitudes and purchase
intentions. Two theories that explains this relationship is the theory of reasoned action (TRA)
and the theory of planned behavior (TPB) (Fishbein & Ajzen, 1980; Ajzen, 1991). These
theories will further be elaborated.
28
2.5.3 The Theory of Reasoned Action and The Theory of Reasoned
Action
Further we will look at an expectancy-value model that explains how consumers form
and change attitudes based on the beliefs/knowledge they have about an object or action, and
their evaluation of these particular beliefs (Hoyer et al., 2013). The TRA is a rational choice
model that examines how consumers justify their behavior. It was originally developed in 1967
by Fishbein, and was further developed by Fishbein and Ajzen in 1980. TRA is widely used
as a basis for marketing decisions (Lutz, 1991), as the theory helps to understand which factors
drives consumers’ behavioral intentions and that intention for a specific behavior can predict,
explain or influence the actual use (Hoyer et al., 2013). Behavior is the transmission of
intention or perceived behavioral control into action. Behavioral intention is an indication of
how hard people are willing to try and of how much effort they are planning to exert in order
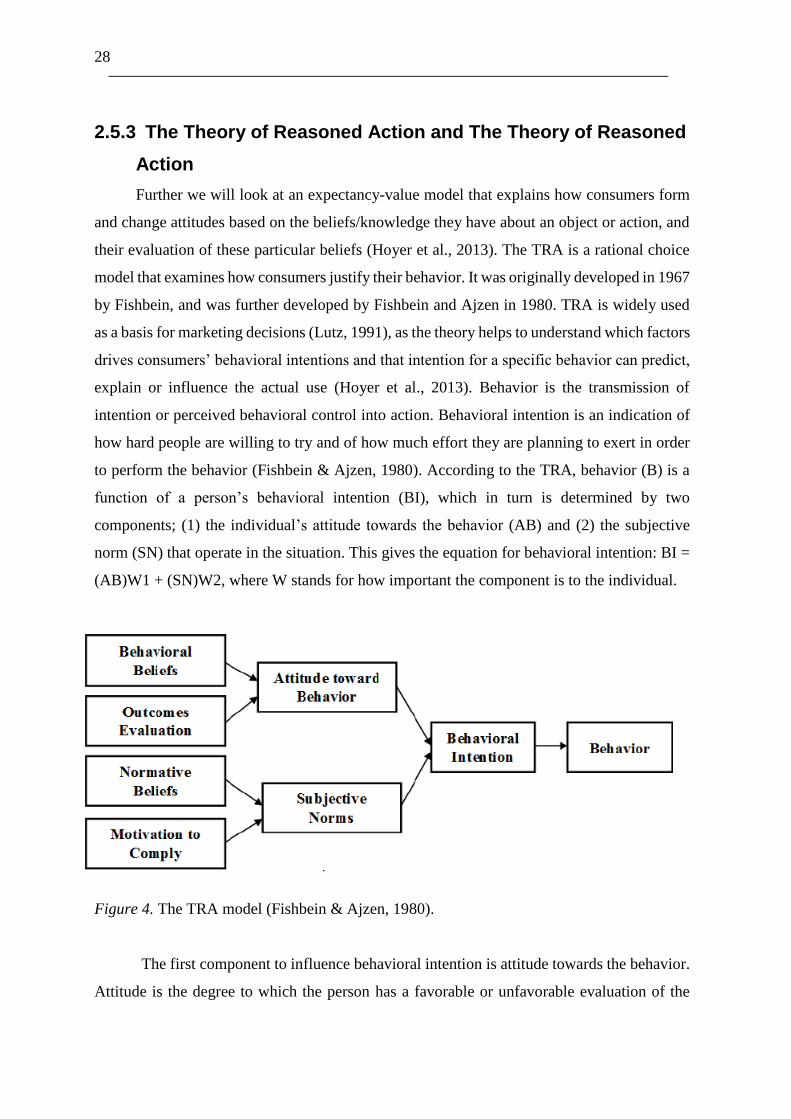
to perform the behavior (Fishbein & Ajzen, 1980). According to the TRA, behavior (B) is a
function of a person’s behavioral intention (BI), which in turn is determined by two
components; (1) the individual’s attitude towards the behavior (AB) and (2) the subjective
norm (SN) that operate in the situation. This gives the equation for behavioral intention: BI =
(AB)W1 + (SN)W2, where W stands for how important the component is to the individual.
Figure 4. The TRA model (Fishbein & Ajzen, 1980).
The first component to influence behavioral intention is attitude towards the behavior.
Attitude is the degree to which the person has a favorable or unfavorable evaluation of the
29
behavior in question, and attitude is learned and tend to persist over time (Schwartz, 2006).
Attitude towards the behaviors is influenced by the consumers’ beliefs about the consequences
of engaging in a certain behavior, and an evaluation of the significance of those consequences
(Fishbein & Ajzen, 1980). Meaning that if a consumer believes the consequences of
performing the behavior outweigh the negative ones, he or she is likely to form a positive
attitude toward a specific behavior. A favorable attitude will then strengthen the behavioral
intention and thus strengthen the likelihood that the behavior will be performed (Ajzen, 1991).
The second component to influence behavioral intention is the subjective norm (SN).
The subjective norm is normative beliefs that results from social pressure (Hoyer et al., 2013).
It is influenced by the consumers’ normative beliefs; what significant others feels about the
behavior. These significant others can be family, friends, co-workers and so forth (Fishbein &
Ajzen, 2005). Then this normative belief can either be strengthened or weakened by the
consumers’ motivation to comply with those significant others (Fishbein & Ajzen, 1980). The
stronger social pressure, the stronger the subjective norm will be in influencing behavioral
intention (Ajzen, 1991).
In summary, according to this theory a behavior will be determined by both personal
attitudes and social pressure from significant others opinions about the behavior.
2.5.4 The Theory of Planned Behavior
Although the TRA has proven to be an effective and useful theory for marketers, the
theory has distinctive limitations (Ajzen, 1991). One of the main criticisms against the TRA
is that it only predicts behavior in situations where consumers have full control over own
behavior. Ajzen (1991) therefore developed the theory of planned behavior (TPB). This model
is an extension of the TRA, and include a third component; perceived behavioral control. This
component takes into account that consumers have the intentions to perform a behavior, but
that the behavior might be hindered by factors limiting their control over the behavior (Ajzen,
1991). The perceived behavioral control is influenced by consumers’ control beliefs, which is
consumers’ beliefs about the presence or absence of those factors that make performing the
behavior easier or difficult, and perceived power to perform the behavior. Thus, the stronger
beliefs consumers have about their ability to perform the behavior, the stronger the behavioral
intention will be (Ajzen, 1991).
30
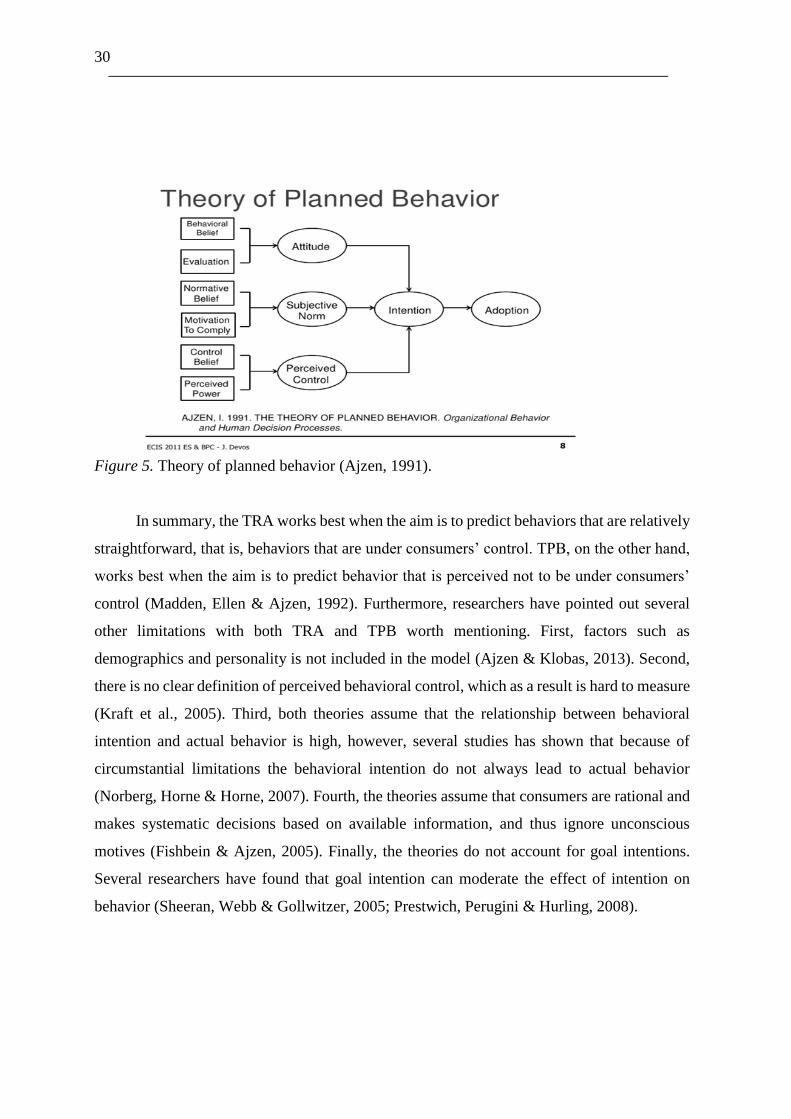
Figure 5. Theory of planned behavior (Ajzen, 1991).
In summary, the TRA works best when the aim is to predict behaviors that are relatively
straightforward, that is, behaviors that are under consumers’ control. TPB, on the other hand,
works best when the aim is to predict behavior that is perceived not to be under consumers’
control (Madden, Ellen & Ajzen, 1992). Furthermore, researchers have pointed out several
other limitations with both TRA and TPB worth mentioning. First, factors such as
demographics and personality is not included in the model (Ajzen & Klobas, 2013). Second,
there is no clear definition of perceived behavioral control, which as a result is hard to measure
(Kraft et al., 2005). Third, both theories assume that the relationship between behavioral
intention and actual behavior is high, however, several studies has shown that because of
circumstantial limitations the behavioral intention do not always lead to actual behavior
(Norberg, Horne & Horne, 2007). Fourth, the theories assume that consumers are rational and
makes systematic decisions based on available information, and thus ignore unconscious
motives (Fishbein & Ajzen, 2005). Finally, the theories do not account for goal intentions.
Several researchers have found that goal intention can moderate the effect of intention on
behavior (Sheeran, Webb & Gollwitzer, 2005; Prestwich, Perugini & Hurling, 2008).
31
2.5.5 Attitudes Towards the Advertisement
Advertising plays an important role for companies in their marketing communication
activities, since attitudes towards the advertisement can influence attitudes towards the brand
and thus purchase intentions (Hoyer et al., 2013). First of all, how does advertising works?
The first formal model to explain this concept was AIDA, and still, this model dominates the
academic literature (Vakratsas & Ambler, 1999). The AIDA model from 1898 describes a
common hierarchy of events that occur when consumers view an advertisement. Each letter
stands for an event (Smith & Taylor, 2004); A - attention, the advertisement attracts the
attention of the consumers, I - interest, the advertisement raises the interest for consumers, D
- desire, the advertisement convinces the consumer to desire the displayed product/service, A
- action, consumers are lead towards taking action by purchasing the product/service. The
AIDA model is thus useful for marketing managers when developing advertising. However, it
is not for examining the effectiveness of advertising or explaining how attitudes towards the
advertisement can play a mediator role between attitudes towards the brand and purchase
intentions.
From the 1980’s much attention was directed towards the relationship between
attitudes towards the advertisement and purchase intentions, following the pioneering work of
Shimp (1981) and Mitchell and Olsen (1981). Mitchell and Olsen (1981) looked at the gap
between consumers’ brand beliefs or brand knowledge and their attitudes towards the brand.
They were the first to present empirical evidence that support the hypothesis that attitudes
towards the advertisement played a significant role in this gap, since consumers might like an
ad so much that they transfer this positive attitude from the ad to the brand. Attitude towards
the ad phenomenon can therefore be defines as “a predisposition to respond in a favorable or
unfavorable manner to a particular advertising stimulus during a particular exposure occasion"
(Lutz, 1985). Haley and Baldinger`s (1991) research suggested that consumers’ attitudes
towards the ad might be the best indicator of advertising effectiveness, while Durvasula et al.
(1993) found evidence supporting that attitudes towards the ad is a globally phenomenon.
32
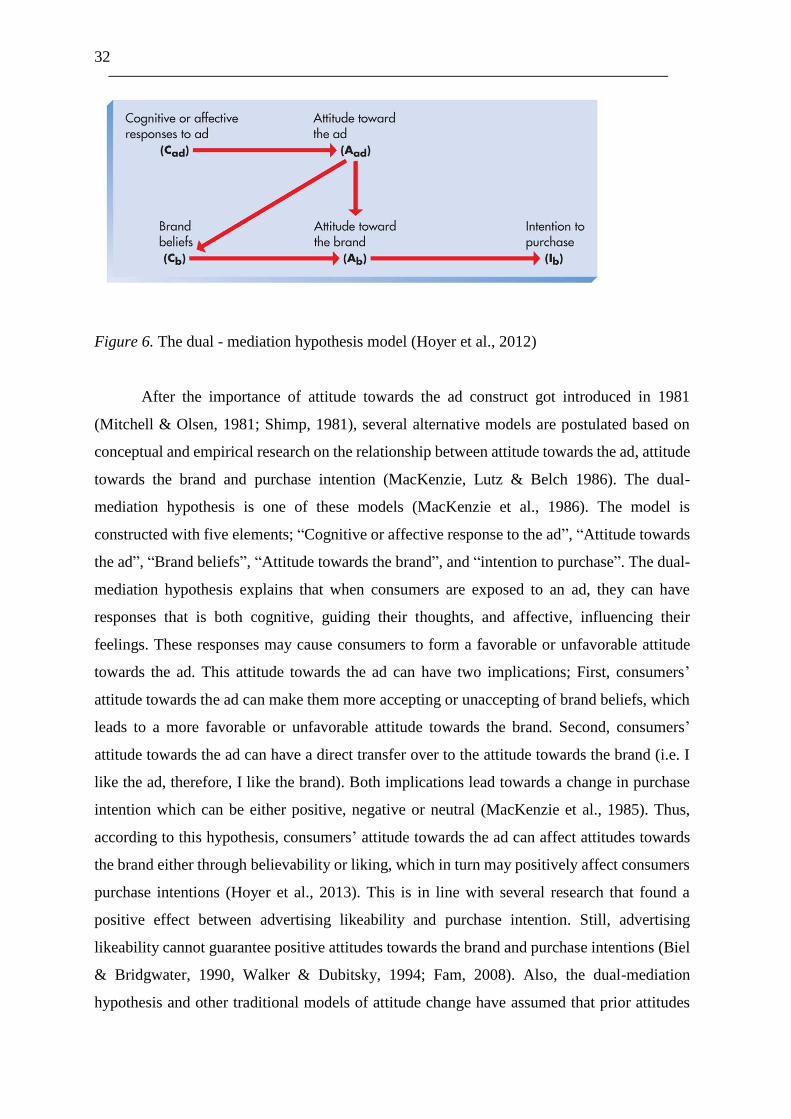
Figure 6. The dual - mediation hypothesis model (Hoyer et al., 2012)
After the importance of attitude towards the ad construct got introduced in 1981
(Mitchell & Olsen, 1981; Shimp, 1981), several alternative models are postulated based on
conceptual and empirical research on the relationship between attitude towards the ad, attitude
towards the brand and purchase intention (MacKenzie, Lutz & Belch 1986). The dual-
mediation hypothesis is one of these models (MacKenzie et al., 1986). The model is
constructed with five elements; “Cognitive or affective response to the ad”, “Attitude towards
the ad”, “Brand beliefs”, “Attitude towards the brand”, and “intention to purchase”. The dual-
mediation hypothesis explains that when consumers are exposed to an ad, they can have
responses that is both cognitive, guiding their thoughts, and affective, influencing their
feelings. These responses may cause consumers to form a favorable or unfavorable attitude
towards the ad. This attitude towards the ad can have two implications; First, consumers’
attitude towards the ad can make them more accepting or unaccepting of brand beliefs, which
leads to a more favorable or unfavorable attitude towards the brand. Second, consumers’
attitude towards the ad can have a direct transfer over to the attitude towards the brand (i.e. I
like the ad, therefore, I like the brand). Both implications lead towards a change in purchase
intention which can be either positive, negative or neutral (MacKenzie et al., 1985). Thus,
according to this hypothesis, consumers’ attitude towards the ad can affect attitudes towards
the brand either through believability or liking, which in turn may positively affect consumers
purchase intentions (Hoyer et al., 2013). This is in line with several research that found a
positive effect between advertising likeability and purchase intention. Still, advertising
likeability cannot guarantee positive attitudes towards the brand and purchase intentions (Biel
& Bridgwater, 1990, Walker & Dubitsky, 1994; Fam, 2008). Also, the dual-mediation
hypothesis and other traditional models of attitude change have assumed that prior attitudes
33
no longer have an impact after attitude change. However, Petty et al. 2006 found evidence that
old attitudes can remain in memory and influence purchase behavior, even if attitude change.
This means that old and new attitudes can interact to produce evaluative responses.
Another study that is of great importance in relation to advertising effectiveness is the
research of Sethuraman, Tellis and Briesch (2011), they looked at advertising effectiveness in
terms of measuring advertising elasticity. This measurement calculates the advertisements
effectiveness in terms of generating more sales, by dividing the percentage change in quantity
demand with the percentage change in advertising expenditures. Sethuraman et al. (2011)
found that there has been a decline in short-term advertising elasticity from 0.22 in 1984
(Assmus, Farley & Lehmann, 1984) to 0.12 in 2011. Also, the long-term advertising drop from
0.41 in 1984 (Assmus et al., 1984) to 0.24 in 2011 (Sethuraman et al., 2011). Sethuraman et
al. (2011) point out that greater competition, globalization, the event of internet and
consumers’ ability to purchase devices that opt out television commercials as some possible
explanations for this change in advertising elasticity. Further, Sethuraman et al. (2011) found
that advertising elasticity is higher for durable goods than nondurable goods, and that
advertising elasticity is higher in the early stage of the products life cycle than the mature
stage.
In conclusion, the advertisement and consumers’ attitude towards the ad might play a
role in their formation of attitudes towards the brand and thus, purchase intentions (Hoyer et
al., 2013).
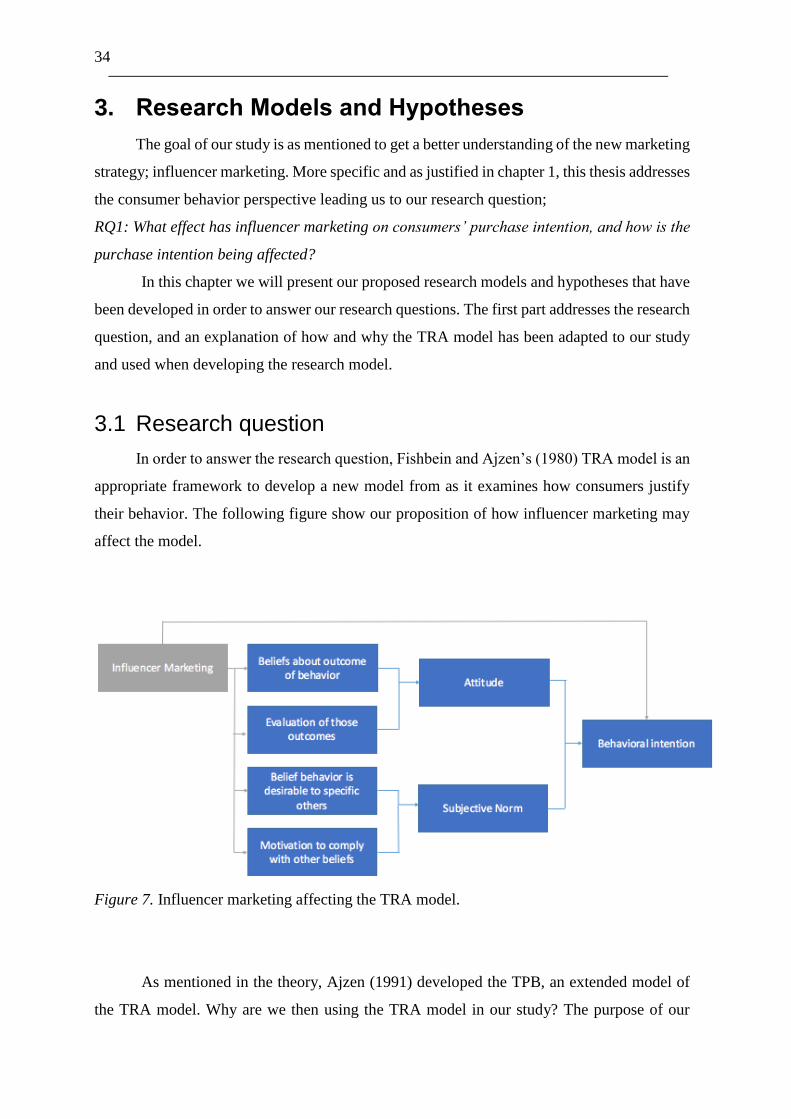
34
3. Research Models and Hypotheses
The goal of our study is as mentioned to get a better understanding of the new marketing
strategy; influencer marketing. More specific and as justified in chapter 1, this thesis addresses
the consumer behavior perspective leading us to our research question;
RQ1: What effect has influencer marketing on consumers’ purchase intention, and how is the
purchase intention being affected?
In this chapter we will present our proposed research models and hypotheses that have
been developed in order to answer our research questions. The first part addresses the research
question, and an explanation of how and why the TRA model has been adapted to our study
and used when developing the research model.
3.1 Research question
In order to answer the research question, Fishbein and Ajzen’s (1980) TRA model is an
appropriate framework to develop a new model from as it examines how consumers justify
their behavior. The following figure show our proposition of how influencer marketing may
affect the model.
Figure 7. Influencer marketing affecting the TRA model.
As mentioned in the theory, Ajzen (1991) developed the TPB, an extended model of
the TRA model. Why are we then using the TRA model in our study? The purpose of our
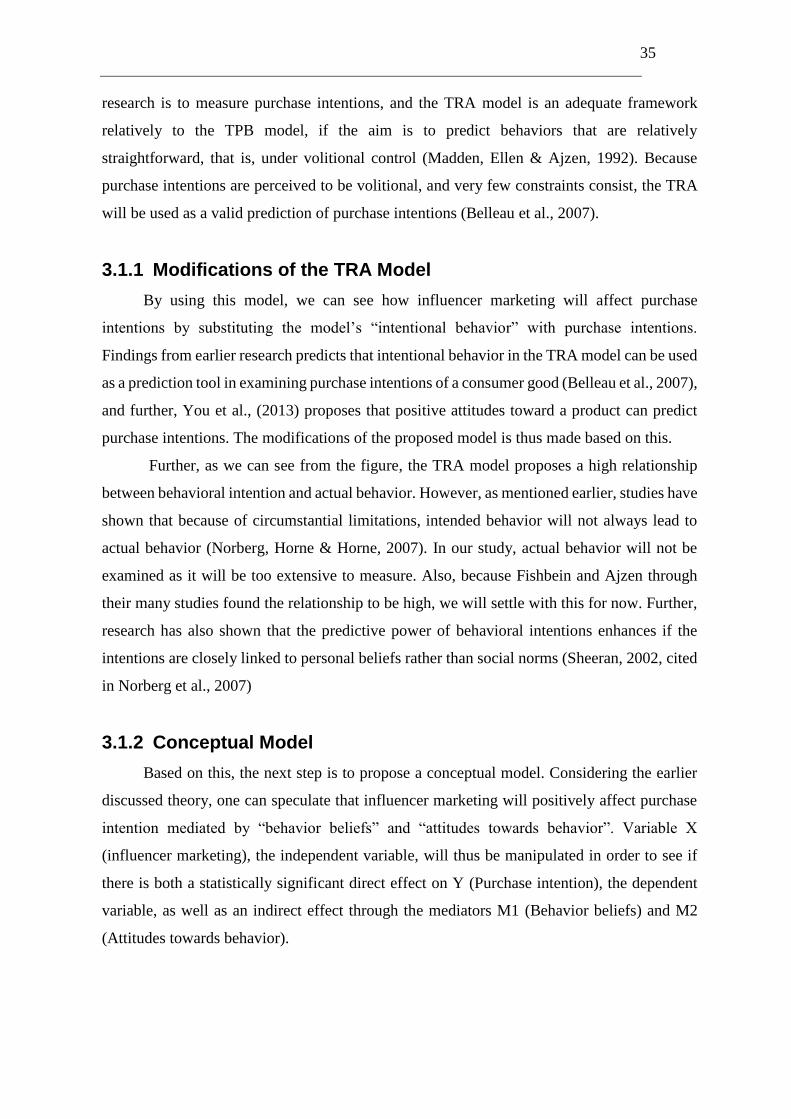
35
research is to measure purchase intentions, and the TRA model is an adequate framework
relatively to the TPB model, if the aim is to predict behaviors that are relatively
straightforward, that is, under volitional control (Madden, Ellen & Ajzen, 1992). Because
purchase intentions are perceived to be volitional, and very few constraints consist, the TRA
will be used as a valid prediction of purchase intentions (Belleau et al., 2007).
3.1.1 Modifications of the TRA Model
By using this model, we can see how influencer marketing will affect purchase
intentions by substituting the model’s “intentional behavior” with purchase intentions.
Findings from earlier research predicts that intentional behavior in the TRA model can be used
as a prediction tool in examining purchase intentions of a consumer good (Belleau et al., 2007),
and further, You et al., (2013) proposes that positive attitudes toward a product can predict
purchase intentions. The modifications of the proposed model is thus made based on this.
Further, as we can see from the figure, the TRA model proposes a high relationship
between behavioral intention and actual behavior. However, as mentioned earlier, studies have
shown that because of circumstantial limitations, intended behavior will not always lead to
actual behavior (Norberg, Horne & Horne, 2007). In our study, actual behavior will not be
examined as it will be too extensive to measure. Also, because Fishbein and Ajzen through
their many studies found the relationship to be high, we will settle with this for now. Further,
research has also shown that the predictive power of behavioral intentions enhances if the
intentions are closely linked to personal beliefs rather than social norms (Sheeran, 2002, cited
in Norberg et al., 2007)
3.1.2 Conceptual Model
Based on this, the next step is to propose a conceptual model. Considering the earlier
discussed theory, one can speculate that influencer marketing will positively affect purchase
intention mediated by “behavior beliefs” and “attitudes towards behavior”. Variable X
(influencer marketing), the independent variable, will thus be manipulated in order to see if
there is both a statistically significant direct effect on Y (Purchase intention), the dependent
variable, as well as an indirect effect through the mediators M1 (Behavior beliefs) and M2
(Attitudes towards behavior).
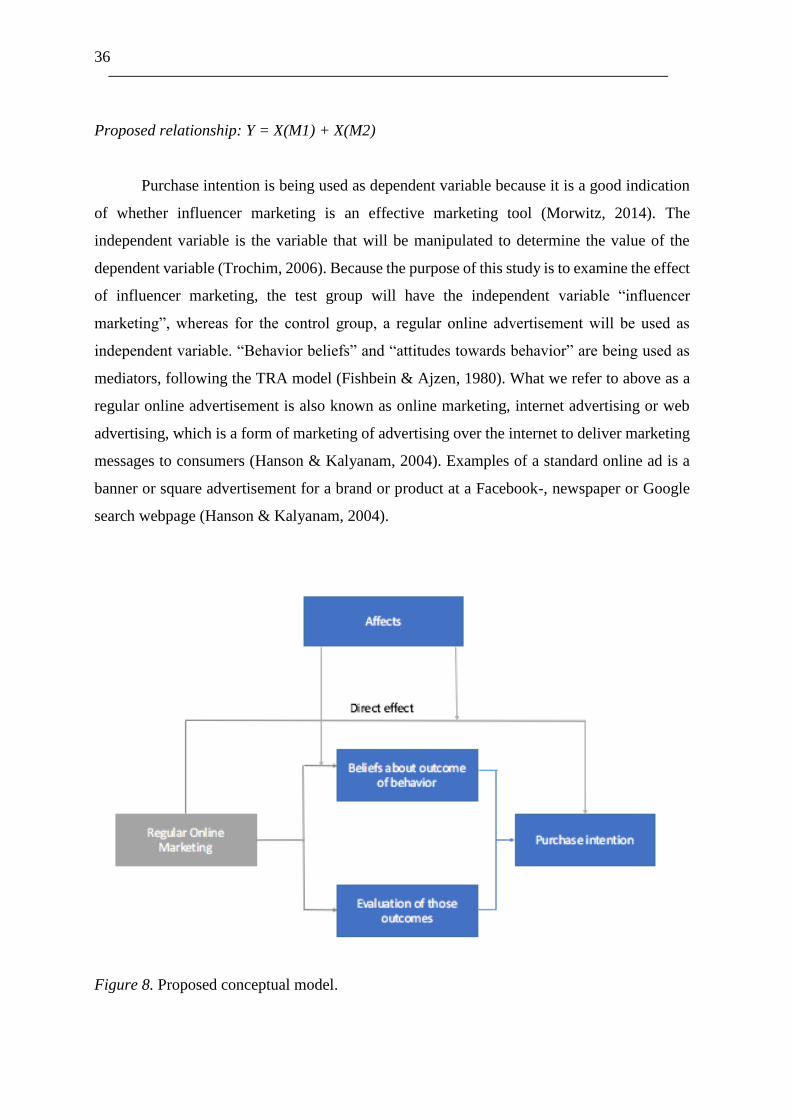
36
Proposed relationship: Y = X(M1) + X(M2)
Purchase intention is being used as dependent variable because it is a good indication
of whether influencer marketing is an effective marketing tool (Morwitz, 2014). The
independent variable is the variable that will be manipulated to determine the value of the
dependent variable (Trochim, 2006). Because the purpose of this study is to examine the effect
of influencer marketing, the test group will have the independent variable “influencer
marketing”, whereas for the control group, a regular online advertisement will be used as
independent variable. “Behavior beliefs” and “attitudes towards behavior” are being used as
mediators, following the TRA model (Fishbein & Ajzen, 1980). What we refer to above as a
regular online advertisement is also known as online marketing, internet advertising or web
advertising, which is a form of marketing of advertising over the internet to deliver marketing
messages to consumers (Hanson & Kalyanam, 2004). Examples of a standard online ad is a
banner or square advertisement for a brand or product at a Facebook-, newspaper or Google
search webpage (Hanson & Kalyanam, 2004).
Figure 8. Proposed conceptual model.
37
3.1.3 Hypotheses
In our model we propose a direct effect on purchase behavior due to Kit and P’ngs’
(2014) study stating that there is a direct relationship between product placement and
consumer behavior. Also, consumers apply previous experience and external information in
purchasing situations (Hoyer et al., 2013). Thus, our prediction is that influencer marketing
will have the same effect as product placement, as we perceive both as similar marketing
strategies. This is in line with previous findings, where consumers who had been exposed to
influencer marketing purchased significantly more after exposure (Tapinfluence & Nielsen,
2013). Also we predict that consumers will perceive a feeling of experience and external
information through the influencers, as one expect influencers to have more impact on
consumers than “regular people”. Thereby, following hypothesis is proposed:
H1: Influencer marketing has a positive direct effect on consumer's purchase intentions.
Our suggestion is that influencer marketing will also have an indirect effect on
purchase intention since theory with regards to how marketers can influence purchase
intentions mainly has focused on its path via attitude change (Fishbein & Ajzen, 1975; Spears
& Singh, 2004; Lutz, 1991). Several researchers have proposed a relationship of dependence
between purchase intentions and attitudes (Spears & Singh, 20114). Lutz (1991) even argues
that this relationship is necessary, as without attitude measurements are counterproductive and
ambiguous. In the TRA model, Fishbein and Ajzen (1980) find that two different attitudinal
variables; “beliefs about the outcomes of behavior” and “evaluations of those outcomes”,
influences a consumer’s attitudes which then again influence the behavioral intention. Our
proposal is that influencer marketing will affect the behavioral intention, purchase intentions,
the same way as the TRA model’s structure. Thus influencer marketing also can affect
purchase intentions indirectly, and following hypothesis is proposed:
H2a: Influencer marketing has a positive effect on consumer's “beliefs about the outcome of
behavior” and “evaluations of those outcomes”, which further positively influences
consumers purchase intentions.
Ajzen (1991) found that “social norm” yield no direct effect on behavioral intention
after controlling for the effects of attitudes and perceived behavior control. Lutz (1991) also
38
theorizes that attitudes have more control on behavior than the social norm. In addition to the
studies that has been conducted, our assumption is that an influencer will not have the power
to affect our thoughts about what others think of us. This leads us to the second hypothesis:
H2b: Influencer marketing has no effect on consumer's “subjective norm”, which further
positively influences consumers purchase intentions.
As mentioned earlier, several studies have revealed the effectiveness of influencer
marketing. Amongst others, Nielsen and Tapinfluence’s (2016) study discovered that
consumers who were exposed to influencer marketing purchased significantly more products
in each purchase occasion than the control group that had been exposed to traditional online
marketing. In addition, influencers are being perceived as a more credible source relatively to
other types of advertising (Berger & the Keller Fay Group, 2016). Moreover, normal
advertising is meeting a lot of challenges as the competition is high, and consumers are being
exposed to them more than ever (Klaassen, 2006) The development of new technology,
directly created for consumers to escape advertising, is also a big challenge marketers meet
today (Biagi, 2013). Our proposed hypothesis is thus:
H3: Influencer marketing has a stronger positive effect on consumer's purchase intention than
regular online advertising.
Advertising in general is the most important part of the advertising mix (Tellis,
Sathuraman & Briesch, 2011). However, if companies are getting an adequate return on their
advertising expenditures has been a controversy discussion. Advertising elasticity can measure
the advertising effectiveness, that is the one percentage increase in market share/sales for a
1% increase in advertising.
39
4. Research Metodology
This chapter will outline the selection of methodological choices in the thesis. The
choices that have been made were done in order to answer the research questions in a best
possible way. All choices will be elaborated upon. This part start by introducing the research
strategy, followed by research design. An experiment has been used, and specifics to that are
being explained. Finally, the measurements and data collection is presented.
4.1 Research Strategy
The research question creates some limits, and guides decisions for the research strategy
and design. First of all, this thesis has been conducted with a positivistic approach; “the view
that only “factual” knowledge gained through observation, including measurement, is
trustworthy” (Dudovskiy, 2016a). Which means that this thesis is concentrated on facts and
with an external and objective view. Furthermore, the purpose of the study is to explain and
predict as of in a positivistic approach. As observers we are independent, and human interests
are irrelevant.
As we enroll a positivistic approach, Crowther and Lancaster (2008) propose that as a
general rule, a deductive approach, a theoretical position to test through data collection
(Saunders et al., 2012), should be adopted. Moreover, in our thesis we have chosen this “top-
down” approach because we wanted to discover more of influencer marketing and how it
affects behavior through the TRA model, as well as demonstrate causality in our explanations.
Causality refers to the relationship between cause and effect, where the cause is understood to
be partly responsible for the effect, and the effect is dependent on the cause (Saunders et al.,
2012). As a rule with a deductive approach, hypotheses were then formed, and observations
were collected to address the hypotheses (Trochim, 2006). The analysis has been reduced to
the simples terms and generalizations are made through statistical probability with a large
sampling, selected randomly (Dudovskiy, 2016a).
4.2 Research Design
In this section a presentation of this thesis’ research design, the general plan describing
how to answer the research question will be presented. The research question will decide
which methods that are applicable, and how the analysis of data should be conducted
(Saunders et al., 2012). Further, when choosing a design, methodological challenges are being
40
addressed before gathering the data (Breivik, 2015a). According to Saunders et al. (2012,
p.139), the most common classification method of research purpose is; exploratory-,
descriptive- and explanatory research.
Exploratory research is defined as “the initial research into a hypothetical or theoretical
idea” (Saunders et al., 2012), and does not aim to provide conclusive evidence but to give a
better understanding (Saunders et al,. 2012). Descriptive research is defined as “attempts to
explore and explain while providing additional information about a topic”. As much
information as possible is collected instead of making elaborate models to predict the future.
Last, explanatory research is defined as “an attempt to connect ideas to understand cause and
effect”, and there needs to be a sufficient understanding in order to predict what will come
next with some accuracy (Saunders et al,. 2012). Since this thesis has a positivist and deductive
approach, either a descriptive or explanatory research design needs to be conducted (Saunders
et al., 2012).
The purpose of this study is to examine if there is a cause-effect and causality inference
between the independent variable, influencer marketing, and the dependent variable, purchase
intention. Thus an explanatory research design will be conducted as it aims to explain causality
and explain relations in the research question (Saunders et al., 2012). Also, the explanatory
design can be used to assess impacts of specific changes on existing norms, various processes
etc, which is the purpose of our thesis when we are studying the TRA model (Dudovskiy,
2016b).
4.2.1 Experiment
As just explained, an explanatory research design was chosen due to the characteristics
of the research. When an explanatory research design is chosen, a qualitative approach will be
the natural choice. Therefore, we chose to conduct an experiment which is the most used
primary data collection method within explanatory research designs (Dudovskiy, 2016b).
Further, the experiment will be done using a questionnaire. Experimental designs have been
referred to as “the golden standard”, and with respect to internal validity, it is the strongest
design (Trochim, 2006). Experiments aim to reduce the number of explanations for some
difference between the experimental conditions, as treatment and control, to only two
possibilities; 1) the effect of the experimental factor, and 2) chance (Haslam & McGarty,
2006). One can never confirm with certainty which of the two explanations that will hold.
However, to a certain degree one can estimate the chance (random variation) as a plausible
41
explanation. By ruling out chance as a plausible explanation, more confidence is being
attached to the interpretation that our experimental treatment was responsible for the observed
effect (Breivik, 2015b). Because the goal of this thesis is to explain a relationship between Y
and X, a cause-effect inference, with causality and with strong internal validity is important.
To conduct an experiment and establish causality, three criteria have to be meet; (1) X and Y
must correlate in either positive or negative direction, (2) Change in X, must happen before
changes in Y, (3) and all other alternative explanations for the correlation between X and Y
must be ruled out (Cook & Campell, 1979).
4.2.2 The Classical Experiment
Not only are we conducting an experiment, but because of the characteristics of the
experiment, we can refer to it as a modified classical experiment. The classical experiment
requires a design with; pre- and posttests, control group(s), manipulation of treatment,
random assignment and controlled situation. Moreover, the modified classical experiment
will be used as we do not have a controlled situation (Breivik, 2015a).
A test- and control group will be used to discover what might (or might not) produce
an effect (Breivik, 2015a). It is important to keep all factors identical, and let the treatment in
the treatment group be the only thing that distinguishes the two groups. By separating these
two different groups we are able to, in an easier way, rule out alternative explanations and
threats of inference. Thus, a control group can rule out causal relationships (Breivik, 2015a).
In a classical experiment, manipulation of treatment is required. However, it can
sometimes be difficult to establish whether the manipulation has taken place before we
measure the effect. To prevent this, a pre-test will be presented where we control that the
consumers have perceived the treatment correctly. For example, have the consumers
perceived that there is some product in the “ad” that the influencers are advertising for. We
therefore chose influencer marketing campaigns that were clear in what they were trying to
signalize, without being too obvious. In order to make it as similar as possible we also used
identical products in the ads for both the treatment and control group. The treatment group
got an influencer Jordan toothbrush advertisement, and the control group got a regular
Jordan toothbrush online advertisement.
To ensure improvement from the initial point, a pre-test post-test design was
conducted. A pre-test is a baseline measurement for the dependent variable, while the post-
test is an outline measurement for the dependent variable in an experiment (Saunders et al.,
42
2012). Both the treatment group and the control group were tested with the same
questionnaire before the treatment group were exposed to the treatment, and then again after
to compare before and after treatment. This way pre-test post-test comparison can be made,
and any difference between the experimental and control group can be found.
The key to a successful experiment is random assignment to the groups because one
assumes that the two groups then will be equivalent within known probabilistic ranges if the
size is big enough. One needs to make sure that there is no systematic differences between
those assigned to the treatment- and control condition, hence avoid selection bias (Breivik,
2015a). With a randomized assignment and a large enough sample to provide probabilistic
equivalence, the experiment can be considered to have strong internal validity and the
probability of assessing whether the independent variable; influencer marketing, will cause
the outcome; increased purchase intentions (Trochim, 2006). The random assignment was
done by using the survey software Qualitrics, an online software tool for creating surveys
accessible for master thesis students at NHH.
The classical experiment requires that there is control in the test situation. However,
in our study, that is not possible as the respondents answer the study on their private device
(computer, iPad, phone) and in their own random situation. We have no control of the test
situation, and we can refer to this as a field experiment (Breivik, 2015a). The weakness of
this design is that we risk having a lack of knowledge about the contribution of the observed
effects. Further there is also a risk of contamination, control and test group communicate
with each other, and confounding,” an unobserved exposure associated with the exposure of
interest” (University of Michigan, 2010). On the other hand, in a realistic situation,
consumers are looking at influencer marketing in many different situations, for instance, in
their home on their computer surrounded by friends. By letting the respondents conduct the
survey in the natural environment, we might observe a more realistic response.
The research design can be summarized in its simplest form in the following figure:
Figure 9. Research design.
EG:(R) O1 X1 O2
CG: (R) O1 O2
Research design: R=randomized, X= treatment, O1 = pre-test, O2=post-test
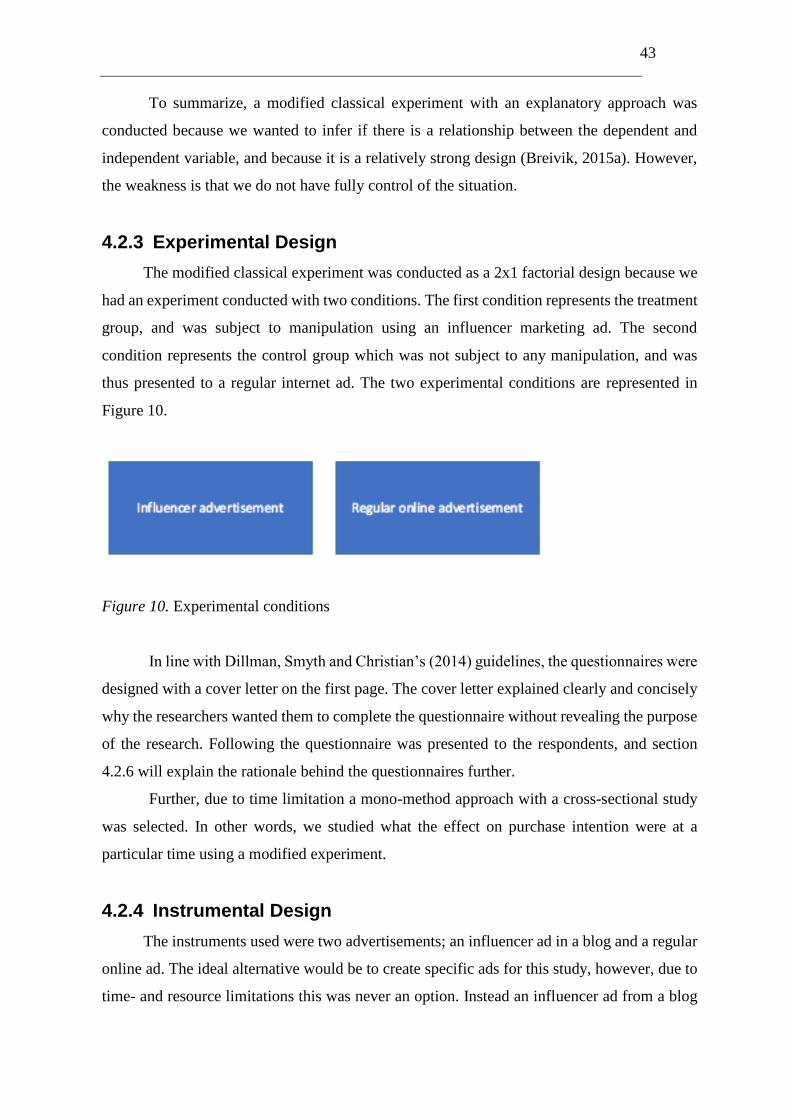
43
To summarize, a modified classical experiment with an explanatory approach was
conducted because we wanted to infer if there is a relationship between the dependent and
independent variable, and because it is a relatively strong design (Breivik, 2015a). However,
the weakness is that we do not have fully control of the situation.
4.2.3 Experimental Design
The modified classical experiment was conducted as a 2x1 factorial design because we
had an experiment conducted with two conditions. The first condition represents the treatment
group, and was subject to manipulation using an influencer marketing ad. The second
condition represents the control group which was not subject to any manipulation, and was
thus presented to a regular internet ad. The two experimental conditions are represented in
Figure 10.
Figure 10. Experimental conditions
In line with Dillman, Smyth and Christian’s (2014) guidelines, the questionnaires were
designed with a cover letter on the first page. The cover letter explained clearly and concisely
why the researchers wanted them to complete the questionnaire without revealing the purpose
of the research. Following the questionnaire was presented to the respondents, and section
4.2.6 will explain the rationale behind the questionnaires further.
Further, due to time limitation a mono-method approach with a cross-sectional study
was selected. In other words, we studied what the effect on purchase intention were at a
particular time using a modified experiment.
4.2.4 Instrumental Design
The instruments used were two advertisements; an influencer ad in a blog and a regular
online ad. The ideal alternative would be to create specific ads for this study, however, due to
time- and resource limitations this was never an option. Instead an influencer ad from a blog
44
and a regular online ad was used to achieve an authentic study. In order to secure validity, both
ads had to be similar. In order to achieve that we had to adjust the regular ad based on the
influencer ad so that the message in both of them were similar. An influencer ad from a blog
was chosen over other social media platforms, since influencers make most impact when using
this platform (Markethub, 2016). Further, to ensure external validity the use of prototypical
influencer and commercial internet ads were used. However, to be noticed, this is purely
subjective as there are no definitions of prototypical ads.
The brand selected to represent the two dimensions elaborated in the experimental
design section was the toothbrush producer Jordan. In order to make it as similar as possible
for the treatment and control groups, we also used an identical Jordan product in the ad for
both the treatment and control group. The Jordan brand was chosen as it conveys a clear
message in the ads, and the product displayed is normally often purchased by consumers. Also,
we tried to pick a brand that does not have too many strong blog associations with it, as some
brands have been highly visible in social media. It might be that the respondents have certain
attitudes and associations towards those brands, positive or negative, and we therefore tried to
avoid these possible confounding variables to ensure external validity. More general, a
toothbrush was chosen as a product because it is a commodity product that everyone has
familiarity with. It is also a product that our age group uses, and we believe that there is no big
difference between men and women regarding this product.
Kristine Ullebø with her blog krisssy.blogg.no was chosen to represent an influencer
ad. This influencer was chosen based on famousness and gender. First of all, the influencer
could not be too famous and visible in media, as our assumption is that they then might have
too many strong associations in consumers’ minds that might influence perceptions of the ad.
Further, we chose a woman, since most bloggers in Norway are women (Moen, 2017).
4.2.5 Pilot Test
Before the main study can be conducted it is important to implement a pilot study in
order to test the quality of the questionnaire. A pilot test is a small-scale study with the purpose
of minimizing the likelihood of respondents misinterpreting questions, and thus secure validity
and reliability (Saunders et al., 2012). Further, the use of a pilot test is crucial in order to ensure
that respondents have no problems understanding or answering the questions and instructions
(Fink, 2013). Also, pilot testing can be used to find out if the questionnaire is too time
consuming, if the layout is attractive, and if the respondents have any other comments after
45
completing the questionnaire (Bell & Waters, 2014).
Our pilot test was distributed to 10 respondents from our sample population, which is
in line with the requirements for sample sizing in pilot testing for student questionnaires (Fink,
2013). The respondents were presented to the questionnaire, and afterwards there were held
individual interviews over phone with standardized questions to get feedback regarding the
understanding of the questionnaire.
The pilot test revealed that the respondents found it a bit too time consuming and
boring, leading to a lack of motivation to answer properly. Also, the similarity between the
questions in the pre- and post-test were mentioned by two people, asking if it was something
wrong with the questionnaire. Therefore, in order to make the questionnaire a bit less time
consuming, the 7-point Likert scale questions were reduced from five to three measurement
items. This is still in line with Raubenheimer (2004), that argues the need of minimum three
items to fully measure attitudes. Additionally, the formulation of some of the questions were
changed in the post-test to reduce the risk of boredom. The formulation was only tweaked to
synonyms, so the items used in the 7-point Likert scales could still be comparable between
pre- and post-test.
Secondly, some respondents also reported that the topic toothbrushes was perceived as
boring and little enjoyable. However, as argued in previous section, we chose to stick to this
product as it was very challenging to find other products that qualified for our needs. This will
be elaborated more upon in chapter six and Further Research. Also, we put in some questions
where we tested whether the respondents had really looked at the advertisement or read the
blog post properly. The respondents were being informed that in the next page they will be
presented to a commercial, and they have to look at it carefully as they will be given some
questions regarding it afterwards. The questions given after were simple and designed with
the purpose of discovering whether they actually had looked at the advertisement or not.
Beyond the feedback given from our respondents, we found no other sign that the
respondents did not understand the questionnaire properly. A second questionnaire was then
created based on the feedback from the pilot test and sent out to five new people. This is not
in regard to Fink (2013), but because of limited time and busy friends we chose to reduce to
five after seeing that similar has been done in other master theses. The feedback from the
second pilot study confirmed positively the changes made from the first, as no one mentioned
similarity between pre- and post-test, nor boredom.
46
4.2.6 Questionnaire
In order to collect data, we conducted a two group pretest-posttest modified
experimental design with a questionnaire. The questionnaire can be found in appendix 1.0,
whereas an overview of the questions is in appendix 1.4. Saunders et al. (2012) defines
questionnaires as a “general term that includes all data collection techniques in which each
person is asked to respond to the same set of questions in a predetermined order”.
Questionnaires are often used in exploratory research because the method enables researchers
to examine and explain relationships between variables (Gilbert, 2001). Furthermore, if
designed properly, questionnaires can be an excellent method to obtain quantitative data about
consumers’ attitudes, values, experiences, and past behavior (Bell, 1999). For these reasons, a
questionnaire was used to examine the cause-effect interference between the dependent
variable and the independent variable in this thesis. Also, questionnaires enable us to collect a
significant amount of data at relatively low costs (Bryman & Bell, 2007). The questionnaire
was conducted through the means of an online survey, using Qualtrics. As mentioned earlier,
the online survey was distributed through our own Facebook pages, as we want to reach the
respondents in a natural setting relative to our research. Also, the questionnaire was written in
Norwegian, because of limited resources as elaborated in the introduction of this thesis
Additionally, a questionnaire in a respondent’s main language is preferred in order to ensure
measurement validity (Brancato, 2006).
To conduct a proper questionnaire there are several requirements that needs to be
fulfilled (MRS, 2011). First, the questionnaire was fit for the purpose, and the respondents got
a cover letter that informed them properly about the research nature and ethics. Second, the
design and content of the questionnaire was appropriate for the target audience. All questions
are within their frame of reference, and they are not led towards a particular point of view.
Third, the respondents were able to provide information in a way that reflects their view with
a balanced 7-point Likert scale and category questions. Fourth, the questionnaire was designed
without open-ended questions, to ensure that responses are capable of being interpreted in an
unambiguous way. Fifth, the questionnaire was designed in a way that ensured that personal
data collection was relevant and not excessive. Furthermore, we implemented Saunders et al.
(2012)’s point of view that questionnaires should not be too extensive either in length or in
grade of difficulty.
47
4.2.7 Manipulation Checks
Further, it is important to control if one have manipulated what one thinks one have
manipulated. Manipulation checks were therefore introduced. With a manipulation check we
measure the manipulations to see if we have been able to obtain the intended different levels
of the independent variable. Manipulation typically gets more difficult, the more abstract the
focal variable (Breivik, 2015b). In our study we are measuring influencer marketing, and thus
need to make sure that the respondents have perceived the influencer marketing ad different
from a normal ad, and that they perceive the character in the influencer ad as an influencer. In
our research it does not require a complicated manipulation check, but it is still important (see
appendix 1.2.6). Questions trying to uncover what the respondents had perceived was therefore
added in the survey. The manipulation check was included in the post-test, as the respondents
then already had been exposed to the treatment. A challenge with manipulation checks is that
it may reveal the purpose of the test (Breivik, 2015b), thus our manipulation check questions
were placed after the dependent variable questions. They were asked 10 questions that
addressed the type of advertisement, to control if they perceived it as intended. This will be
elaborated later in the section about measurement of control variables, and will be further
elaborated in section below 4.3, about measurements of control variables.
4.3 Measurement
To gather data and measure the effects on the proposed relationship, different questions
and scales were used. Both the treatment group and the control group were tested with identical
questions before the treatment group was exposed to the treatment, and then again after to
compare before and after treatment.
The questionnaire was designed with only close-ended choices, and these close-ended
questions were graded with the use of a 7-point Likert scale (Likert, 1932). Using a consistent
scale throughout the questionnaire will avoid creating confusion among the respondents
(Saunder et al., 2012). Therefore, with some exceptions a 7-point Likert scale were used
throughout. In line with Dillmann et al. (2014)’s requirements, the 7-point Likert scale used
had possible responses presented in a straight line. When using a series of statements, the same
order of response categories was kept. All items measured using the 7-point Likert scale were
formulated positively, therefore we chose to range the scale from strongly disagree to strongly
agree. In this way the respondents would not be biased to choose a positive answer (Survey
Monkey, 2017). The choice to use this scale was based on its usefulness to measure attitudes
48
and behavior (Survey Monkey, 2017). Also, Weijters, Cabooter and Schillewaert (2010)
recommend this 7-point scale based on two reasons. First, respondents tend to respond slightly
positively to please the researchers. Therefore, with a neutral middle value, we were able to
take this bias into account. Second, research shows that respondents can handle up to seven
pieces of information at once. The respondents should thus be able to discriminate between
the seven options. The 7-point Likert scale used in this questionnaire was anchored with the
end values strongly disagree (1) and strongly agree (7). The other numbers were not named
except from the middle value (4) as neutral. Although Saunders et al. (2012) recommend a
consistent scale throughout the questionnaire, the use of some category questions were
included. Category questions are designed in a way that enables each respondent to answer
predefined response categories. Such questions are useful for collecting data about behavior
and background information (Saunders et al., 2012). We believe that the use of some category
questions would not confuse the respondents, but instead awakened them. In this way they
would not go into a repetitive mind-set.
Furthermore, all questions were mandatory, meaning that the respondents needed to
answer all questions on one page before being able to continue to the next page. The
respondents could not go backwards when a new page was showed. In this way we avoided
contamination of the results.
Measurements of the independent variable, the dependent variable, the mediator
variables and the control variable will be further elaborated below. For a full overview of the
items used in this questionnaire, see appendix 1.0.
4.3.1 Independent Variable
The independent variable, the condition that is being manipulated in our research, is
influencer marketing. The test group was thus subjected to influencer marketing ads, whereas
the control group was subjected to a regular online ad. Thus, two different experimental
treatment conditions were created, as explained in the instrumental design section 4.2.3.
Subsequently, randomization of the respondents to the two different treatment conditions was
done by using our chosen survey software. This is important in order to ensure even
distribution.
49
4.3.2 Dependent Variable
To measure the dependent variable, purchase intention, a total of four questions were
asked. Both the treatment group and the control group were asked two questions in the pre-
test, and the same two questions in the post-test. For the treatment group, Q5 and Q6 in the
pre-test and Q14 and Q15 in the post-test measures the dependent variable. While in the
control group Q4, Q5, Q14 and Q16 measures the dependent variable, purchase intention.
According to Rossiter (2002), purchase intention is a concrete attribute to measure,
therefore it is no use for more than one item to measure this attribute in scale. However, Ajzen
(2013) constructed a TPB behavior questionnaire that argues for the need of three items to
demonstrate adequate internal consistency reliability. In line with Ajzen (2013) there were
statements in these questions related to; I expect to perform X behavior, I want to perform X
behavior, and I intend to perform X behavior. Also, statements related to previous purchase
habits were included in line with Wind and Lerner (1979). A 7-point Likert scale was used to
measure these four items (Dillmann et al., 2014).
A second question was constructed in order to measured more concretely the
respondents’ intentions to purchase the product. In line with Fink (2013), the questions were
designed as a category question with five response categories arranged in a logical order.
4.3.3 Mediator Variable
The questionnaire design included four question to measure the mediator variables in
our proposed model; “behavior beliefs” and “attitudes towards the behavior”. In the
questionnaire Q8 and Q9 in the pre-test and Q16 and Q17 in the post-test measures the
variables for the treatment group, and Q6, Q7, Q14 and Q15 for the control group.
Additionally, in order to fully answer hypothesis H2, four questions related to “subjective
norm” were given. For the treatment group Q10 and Q11 in the pre-test, and Q18 and 19 in
the post-test measured the “subjective norm”. While, for the control group, Q8 and Q9 in the
pre-test, and Q16 and Q17 in the post-test. The goal with these questions was to uncover
whether influencer marketing would affect the mediating variables. All of these questions were
measured on a 7-point Likert scale (Dillmann et al., 2014). As with the dependent variable,
the questions were asked twice, first in the pre-test and again in the post-test. The only
difference between the questions is the format. The items’ wording was replaced with
synonyms in order to reduce the risk of boredom.
In order to measure attitudes, Raubenheimer (2004) argues for the need of three items
50
in order to create a proper scale. Further, Ajzen (2013) suggested that each component to
influence behavioral intention had to be measured on its own. Therefore, we chose to use one
question for each component in both pre- and posttest. Questions related to the components
“behavioral beliefs about the outcome of the behavior”, “evaluation of the outcomes” and
“normative beliefs” were measured using three items. Originally, we had five measurement
items, but cut down to three after looking at how time consuming the questionnaire would be
for the respondents. The last component, “motivation to comply”, was measured using only
two items as this question relates to motivation and not attitudes.
Additionally, attitude strength and attitude extremity were measured after the post-test
for both the experimental and control group with one item on a 7-point Likert scale. This
question asked the respondents; “How sure are you about the attitudes?”, which relates to their
answer already provided in the questionnaire. This question is numbered Q20 in the
questionnaire for the experimental group, and Q18 for the control group.
4.3.4 Manipulation Check
In line with Perdue and Summers (1986) the questionnaire included manipulation
checks. Two questions were included after the post-test as the respondents then already had
been exposed to the treatment. Revealing the intention would then not harm the results. The
first question addressed the type of advertisement in order to control if the respondents
perceived it as intended. This is Q21 for the experimental group, and Q19 for the control group.
Also, a second question was included in the questionnaire for the experimental group
to address whether the respondents perceive the bloggers as influencers. A total of five items
were used for this purpose, and the question is numbered Q22 in the questionnaire.
Furthermore, both manipulation check questions were measured on a 7-point Likert scale
(Dillmann, 2014).
4.3.5 Control Variables
Control variables are variations that might be due to exogenous factors. These variables
can potentially undermine the inference drawn about the relationship between the independent
variable and the dependent variable (Saunders et al., 2012). In line with Saunders et al. (2012)
the control variables will be measured and kept constant to avoid this undermining of
inference.
Seven control variables were therefore incorporated into the questionnaire for the
51
experimental group. Five of these were placed before the pre-test, and in this way the
respondents’ honest opinions would be measured before being exposed to any manipulation.
The first question, Q1, addressed the respondents’ previous experience with blogs, measured
by five response categories. The next two questions were measured with a 7-point Likert scale
and addressed the respondents’ attitudes towards ads in blogs, Q2, and the brand, Q3. Since
these questions measured attitudes, a total of three items were used for each question
(Raubenheimer, 2004). The next question asked the respondents whether they had heard about
the influencer used in the manipulation treatment, Q4, and the respondents had two response
categories for this question; “yes” or “no”. If the respondents answered yes, they would be
given a second question that measured their attitudes towards this influencer, Q5, using a 7-
point Likert scale with three items (Dillmann et al., 2014; Raubenheimer, 2004). The two last
questions were measured after the post-test, and relates to demographic variables; age, Q23,
and gender, Q24. These two questions asked about background information and were therefore
put last in the questionnaire, in line with Leon`s (2003) suggestion for internet surveys. Both
background information questions were measured using category questions with five response
categories for age and two response categories for gender.
For the control group, a total number of five control variables were incorporated into
the questionnaire. Three of these were placed before the pre-test. The first question addressed
the respondents’ previous experience with internet surfing, Q1, and the question was measured
with five response categories. The next two questions were measured with a 7-point Likert
scale, and addressed the respondents’ attitudes towards ads on internet, Q2, and the brand, Q3.
The two last were measured after the post-test questions; age, Q20, and gender, Q21.
4.4 Data Collection
This thesis has been studying online consumer behavior, and therefore the data has been
collected from social media. A voluntary survey was published in our social media networks
4.4.1 Sampling
A research design should be able to generalize its results to the population; therefore, a sample
has to be made. How a sampling procedure is conducted will determine how representative a
respondent is of the target population, which will have implications for external validity.
Churchill and Iacobucci (2005) outline a six-step procedure when drawing a population. First,
one defines the target population, and second one identifies the sampling frame. The third step
52
is to select a sample procedure, and the fourth step will be to determine the sample size. Fifth,
the researcher does the sampling, and finally the data needs to be collected. Following, an
interpretation of stage 1- 5 will be presented.
The first step is to define the target population, the group one wants to generalize to
(Trochim, 2006). After looking at the worldwide statistics for social media users (Statista,
2017), and assuming a rather similar distribution for Norwegian consumers, the proposed
target population is Norwegian consumers between 16 - 54. Further one will distinguish
between the theoretical population; the population one would like to generalize to, and the
accessible population; the population that will be accessible. The theoretical population would
be identical with the target population, as in theory, all social media users are accessible.
However, because of limitations in our resources, the accessible population is the social media
users in our own communities. Thus, it is reason to believe that the accessible population will
have an overweight in the age range of 23 - 32, because of our own age. After conducting the
study, we experienced that our assumptions of an overweight in that age range was confirmed.
Second, the sampling frame needs to be set, which is the listing of the accessible
population (Trochim, 2006). In our case that was our friends on Facebook, a total number of
1461 people.
Furthermore, the third step, sampling procedure, will be initiated by selecting a
sampling method. This depends on the sampling frame, and in our case because of the
simplicity and lack of resources, convenience sampling was used. By choosing this non-
probability sample, we are obtaining efficiency in the data gathering by saving time. In this
case, the sample will be identical with our sampling frame. However, it is not likely that
everyone will answer, and the subgroup was thus all the actual respondents in our experiment.
The fourth step is to choose a sampling size. By using a 95% confidence level, with a
margin of error of 4%, it is suggested that a sampling size of 600 people is necessary to obtain
interference (Surveymonkey, 2015). The 4% margin of error was chosen on the basis of
assumptions about the size of the target population, magnitude of known problems in the
sample, and the extremity of statistic. We assume that the population size is roughly 2.800.000
based on numbers from SSB (SSB, 2017).
Last, we will look at the fifth step; how to reach the sample. Because our thesis aims
to examine behavior on social media, to gain as correct results as possible, the sample will
also be reached through the natural environment. A link to our online survey was distributed
on our personal Facebook pages. In this way, ethical issues are being taken care of, as the
participants themselves chose whether to participate or not, resulting in self-selection. Our

53
assumption is that because of its topic, the survey was perceived as relevant for the
respondents, thus it increased the likelihood of participating and providing true answers
(Trochim, 2006).
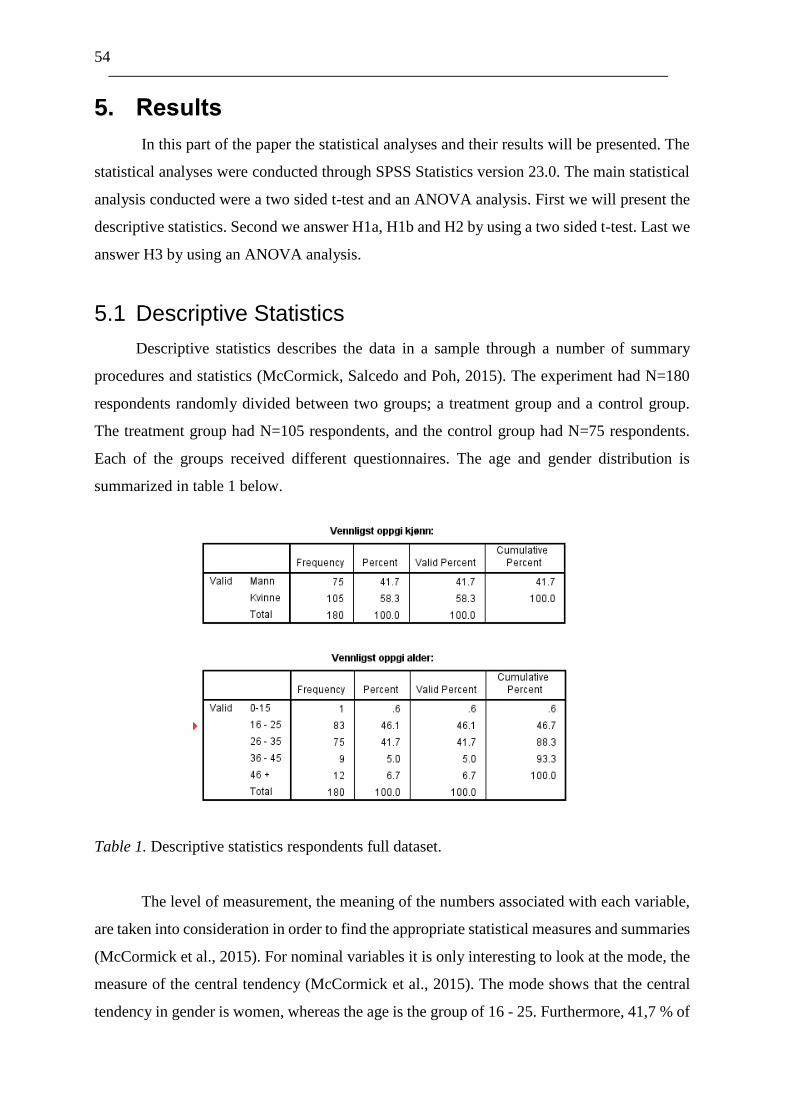
54
5. Results
In this part of the paper the statistical analyses and their results will be presented. The
statistical analyses were conducted through SPSS Statistics version 23.0. The main statistical
analysis conducted were a two sided t-test and an ANOVA analysis. First we will present the
descriptive statistics. Second we answer H1a, H1b and H2 by using a two sided t-test. Last we
answer H3 by using an ANOVA analysis.
5.1 Descriptive Statistics
Descriptive statistics describes the data in a sample through a number of summary
procedures and statistics (McCormick, Salcedo and Poh, 2015). The experiment had N=180
respondents randomly divided between two groups; a treatment group and a control group.
The treatment group had N=105 respondents, and the control group had N=75 respondents.
Each of the groups received different questionnaires. The age and gender distribution is
summarized in table 1 below.
Table 1. Descriptive statistics respondents full dataset.
The level of measurement, the meaning of the numbers associated with each variable,
are taken into consideration in order to find the appropriate statistical measures and summaries
(McCormick et al., 2015). For nominal variables it is only interesting to look at the mode, the
measure of the central tendency (McCormick et al., 2015). The mode shows that the central
tendency in gender is women, whereas the age is the group of 16 - 25. Furthermore, 41,7 % of
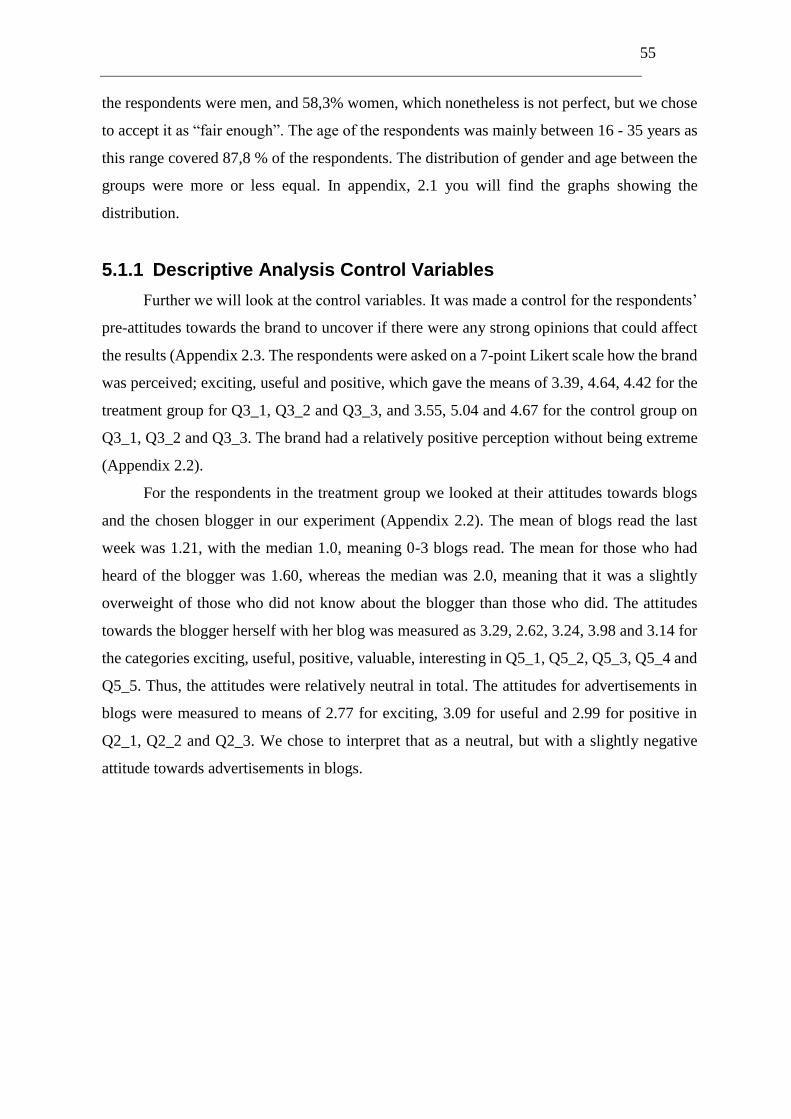
55
the respondents were men, and 58,3% women, which nonetheless is not perfect, but we chose
to accept it as “fair enough”. The age of the respondents was mainly between 16 - 35 years as
this range covered 87,8 % of the respondents. The distribution of gender and age between the
groups were more or less equal. In appendix, 2.1 you will find the graphs showing the
distribution.
5.1.1 Descriptive Analysis Control Variables
Further we will look at the control variables. It was made a control for the respondents’
pre-attitudes towards the brand to uncover if there were any strong opinions that could affect
the results (Appendix 2.3. The respondents were asked on a 7-point Likert scale how the brand
was perceived; exciting, useful and positive, which gave the means of 3.39, 4.64, 4.42 for the
treatment group for Q3_1, Q3_2 and Q3_3, and 3.55, 5.04 and 4.67 for the control group on
Q3_1, Q3_2 and Q3_3. The brand had a relatively positive perception without being extreme
(Appendix 2.2).
For the respondents in the treatment group we looked at their attitudes towards blogs
and the chosen blogger in our experiment (Appendix 2.2). The mean of blogs read the last
week was 1.21, with the median 1.0, meaning 0-3 blogs read. The mean for those who had
heard of the blogger was 1.60, whereas the median was 2.0, meaning that it was a slightly
overweight of those who did not know about the blogger than those who did. The attitudes
towards the blogger herself with her blog was measured as 3.29, 2.62, 3.24, 3.98 and 3.14 for
the categories exciting, useful, positive, valuable, interesting in Q5_1, Q5_2, Q5_3, Q5_4 and
Q5_5. Thus, the attitudes were relatively neutral in total. The attitudes for advertisements in
blogs were measured to means of 2.77 for exciting, 3.09 for useful and 2.99 for positive in
Q2_1, Q2_2 and Q2_3. We chose to interpret that as a neutral, but with a slightly negative
attitude towards advertisements in blogs.
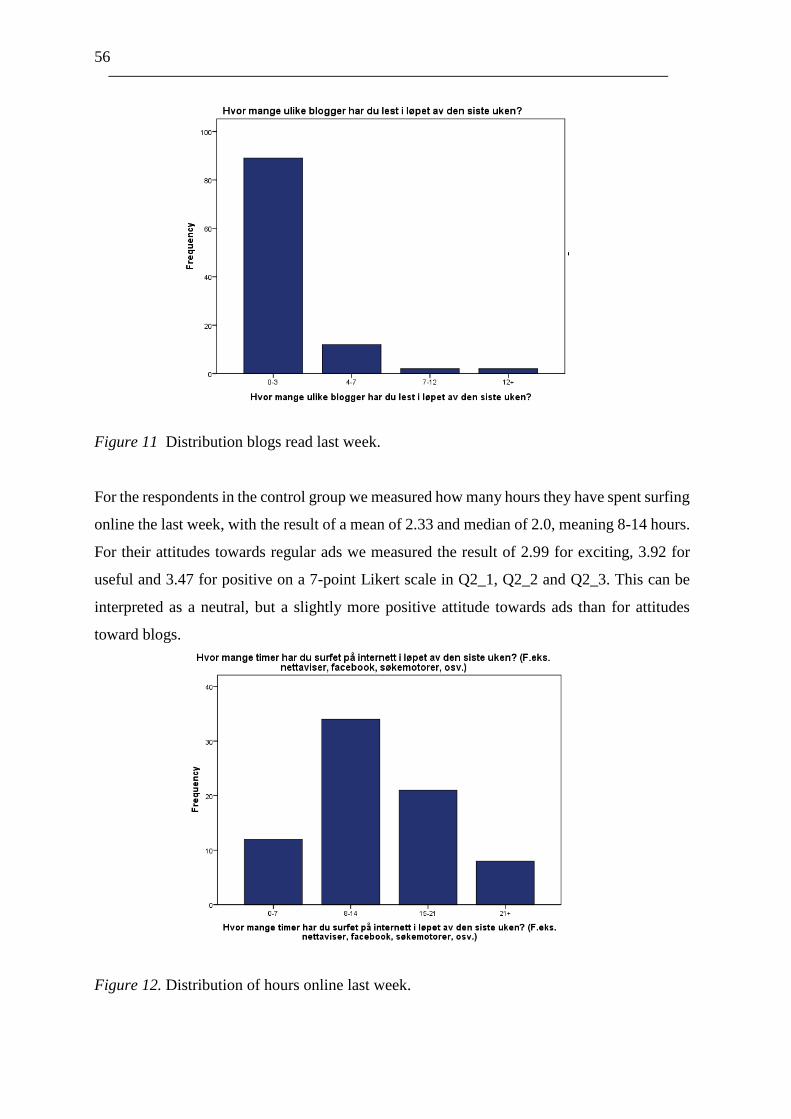
56
Figure 11 Distribution blogs read last week.
For the respondents in the control group we measured how many hours they have spent surfing
online the last week, with the result of a mean of 2.33 and median of 2.0, meaning 8-14 hours.
For their attitudes towards regular ads we measured the result of 2.99 for exciting, 3.92 for
useful and 3.47 for positive on a 7-point Likert scale in Q2_1, Q2_2 and Q2_3. This can be
interpreted as a neutral, but a slightly more positive attitude towards ads than for attitudes
toward blogs.
Figure 12. Distribution of hours online last week.
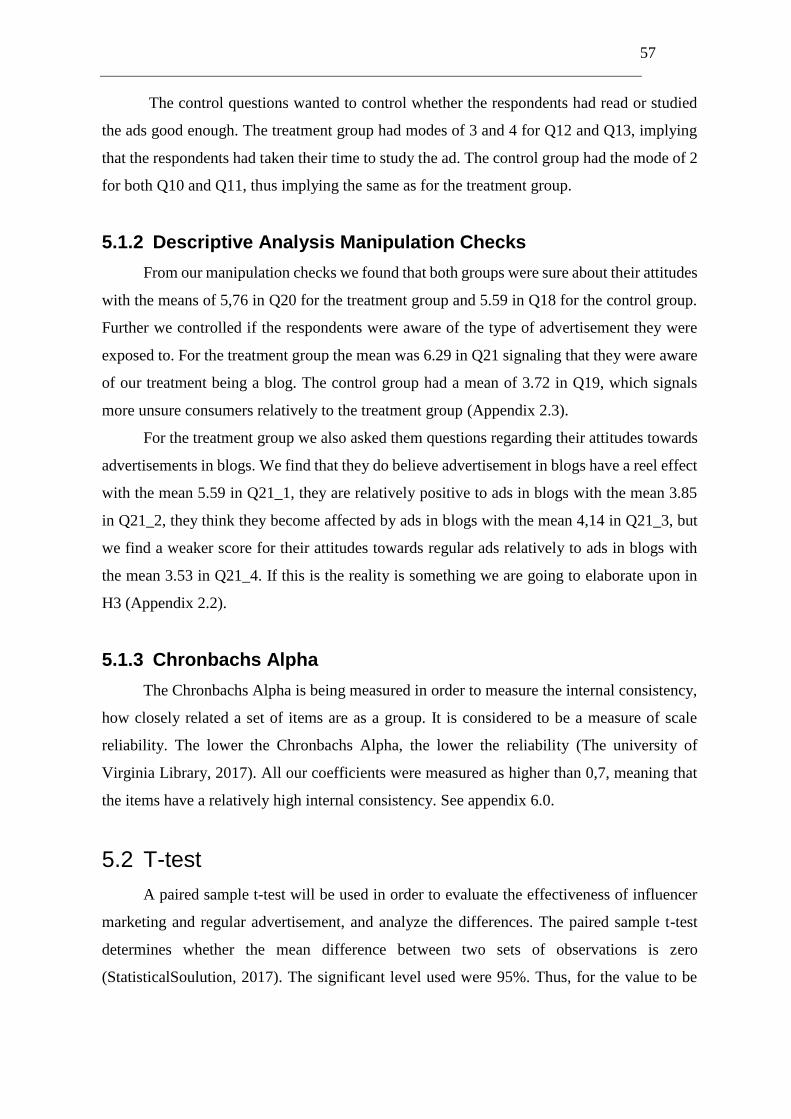
57
The control questions wanted to control whether the respondents had read or studied
the ads good enough. The treatment group had modes of 3 and 4 for Q12 and Q13, implying
that the respondents had taken their time to study the ad. The control group had the mode of 2
for both Q10 and Q11, thus implying the same as for the treatment group.
5.1.2 Descriptive Analysis Manipulation Checks
From our manipulation checks we found that both groups were sure about their attitudes
with the means of 5,76 in Q20 for the treatment group and 5.59 in Q18 for the control group.
Further we controlled if the respondents were aware of the type of advertisement they were
exposed to. For the treatment group the mean was 6.29 in Q21 signaling that they were aware
of our treatment being a blog. The control group had a mean of 3.72 in Q19, which signals
more unsure consumers relatively to the treatment group (Appendix 2.3).
For the treatment group we also asked them questions regarding their attitudes towards
advertisements in blogs. We find that they do believe advertisement in blogs have a reel effect
with the mean 5.59 in Q21_1, they are relatively positive to ads in blogs with the mean 3.85
in Q21_2, they think they become affected by ads in blogs with the mean 4,14 in Q21_3, but
we find a weaker score for their attitudes towards regular ads relatively to ads in blogs with
the mean 3.53 in Q21_4. If this is the reality is something we are going to elaborate upon in
H3 (Appendix 2.2).
5.1.3 Chronbachs Alpha
The Chronbachs Alpha is being measured in order to measure the internal consistency,
how closely related a set of items are as a group. It is considered to be a measure of scale
reliability. The lower the Chronbachs Alpha, the lower the reliability (The university of
Virginia Library, 2017). All our coefficients were measured as higher than 0,7, meaning that
the items have a relatively high internal consistency. See appendix 6.0.
5.2 T-test
A paired sample t-test will be used in order to evaluate the effectiveness of influencer
marketing and regular advertisement, and analyze the differences. The paired sample t-test
determines whether the mean difference between two sets of observations is zero
(StatisticalSoulution, 2017). The significant level used were 95%. Thus, for the value to be
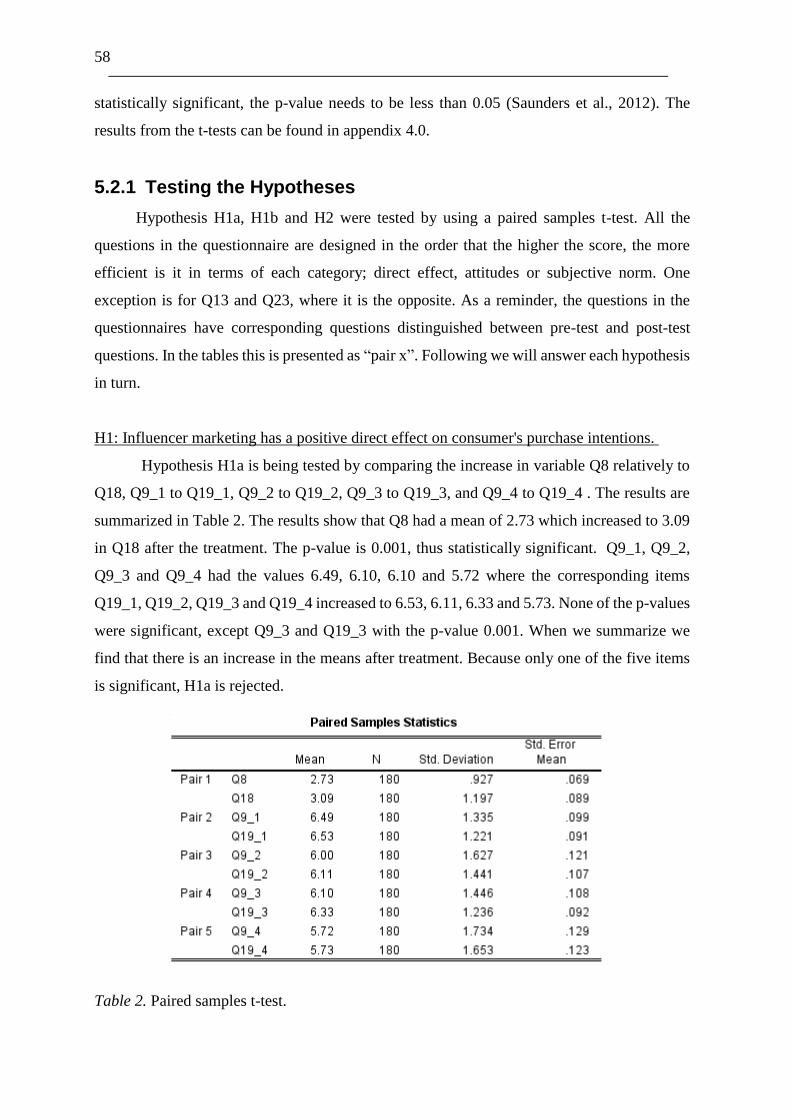
58
statistically significant, the p-value needs to be less than 0.05 (Saunders et al., 2012). The
results from the t-tests can be found in appendix 4.0.
5.2.1 Testing the Hypotheses
Hypothesis H1a, H1b and H2 were tested by using a paired samples t-test. All the
questions in the questionnaire are designed in the order that the higher the score, the more
efficient is it in terms of each category; direct effect, attitudes or subjective norm. One
exception is for Q13 and Q23, where it is the opposite. As a reminder, the questions in the
questionnaires have corresponding questions distinguished between pre-test and post-test
questions. In the tables this is presented as “pair x”. Following we will answer each hypothesis
in turn.
H1: Influencer marketing has a positive direct effect on consumer's purchase intentions.
Hypothesis H1a is being tested by comparing the increase in variable Q8 relatively to
Q18, Q9_1 to Q19_1, Q9_2 to Q19_2, Q9_3 to Q19_3, and Q9_4 to Q19_4 . The results are
summarized in Table 2. The results show that Q8 had a mean of 2.73 which increased to 3.09
in Q18 after the treatment. The p-value is 0.001, thus statistically significant. Q9_1, Q9_2,
Q9_3 and Q9_4 had the values 6.49, 6.10, 6.10 and 5.72 where the corresponding items
Q19_1, Q19_2, Q19_3 and Q19_4 increased to 6.53, 6.11, 6.33 and 5.73. None of the p-values
were significant, except Q9_3 and Q19_3 with the p-value 0.001. When we summarize we
find that there is an increase in the means after treatment. Because only one of the five items
is significant, H1a is rejected.
Table 2. Paired samples t-test.
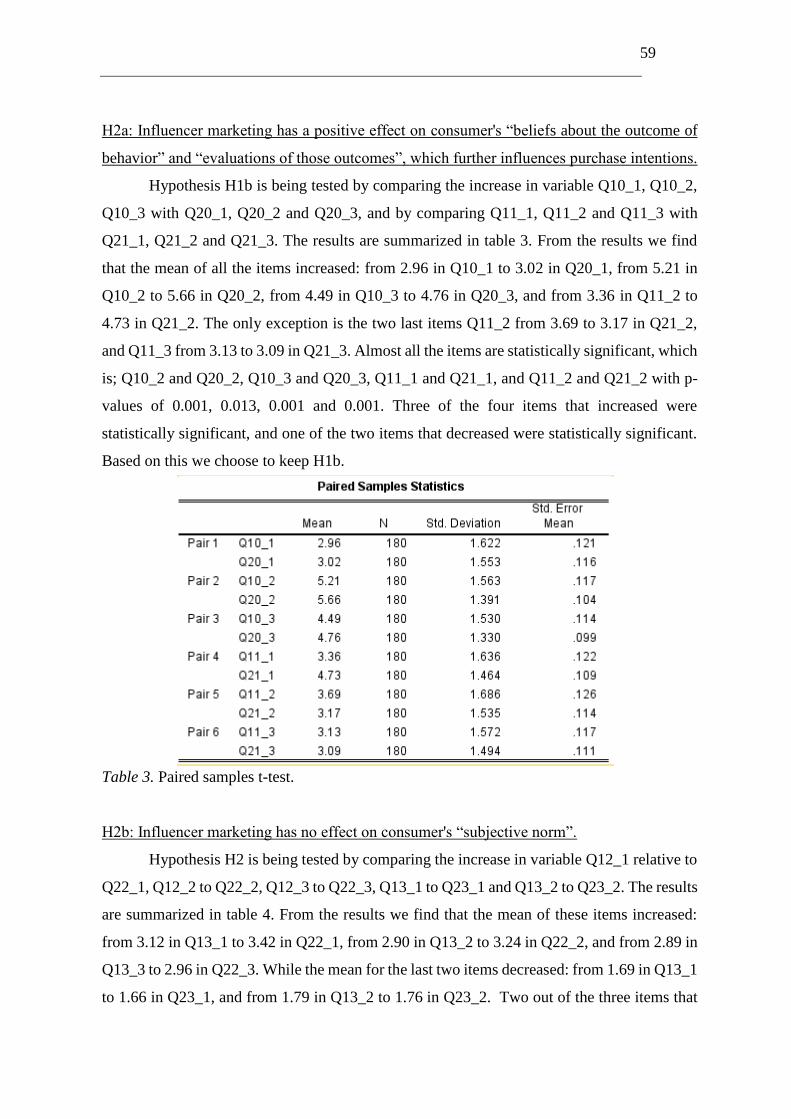
59
H2a: Influencer marketing has a positive effect on consumer's “beliefs about the outcome of
behavior” and “evaluations of those outcomes”, which further influences purchase intentions.
Hypothesis H1b is being tested by comparing the increase in variable Q10_1, Q10_2,
Q10_3 with Q20_1, Q20_2 and Q20_3, and by comparing Q11_1, Q11_2 and Q11_3 with
Q21_1, Q21_2 and Q21_3. The results are summarized in table 3. From the results we find
that the mean of all the items increased: from 2.96 in Q10_1 to 3.02 in Q20_1, from 5.21 in
Q10_2 to 5.66 in Q20_2, from 4.49 in Q10_3 to 4.76 in Q20_3, and from 3.36 in Q11_2 to
4.73 in Q21_2. The only exception is the two last items Q11_2 from 3.69 to 3.17 in Q21_2,
and Q11_3 from 3.13 to 3.09 in Q21_3. Almost all the items are statistically significant, which
is; Q10_2 and Q20_2, Q10_3 and Q20_3, Q11_1 and Q21_1, and Q11_2 and Q21_2 with p-
values of 0.001, 0.013, 0.001 and 0.001. Three of the four items that increased were
statistically significant, and one of the two items that decreased were statistically significant.
Based on this we choose to keep H1b.
Table 3. Paired samples t-test.
H2b: Influencer marketing has no effect on consumer's “subjective norm”.
Hypothesis H2 is being tested by comparing the increase in variable Q12_1 relative to
Q22_1, Q12_2 to Q22_2, Q12_3 to Q22_3, Q13_1 to Q23_1 and Q13_2 to Q23_2. The results
are summarized in table 4. From the results we find that the mean of these items increased:
from 3.12 in Q13_1 to 3.42 in Q22_1, from 2.90 in Q13_2 to 3.24 in Q22_2, and from 2.89 in
Q13_3 to 2.96 in Q22_3. While the mean for the last two items decreased: from 1.69 in Q13_1
to 1.66 in Q23_1, and from 1.79 in Q13_2 to 1.76 in Q23_2. Two out of the three items that
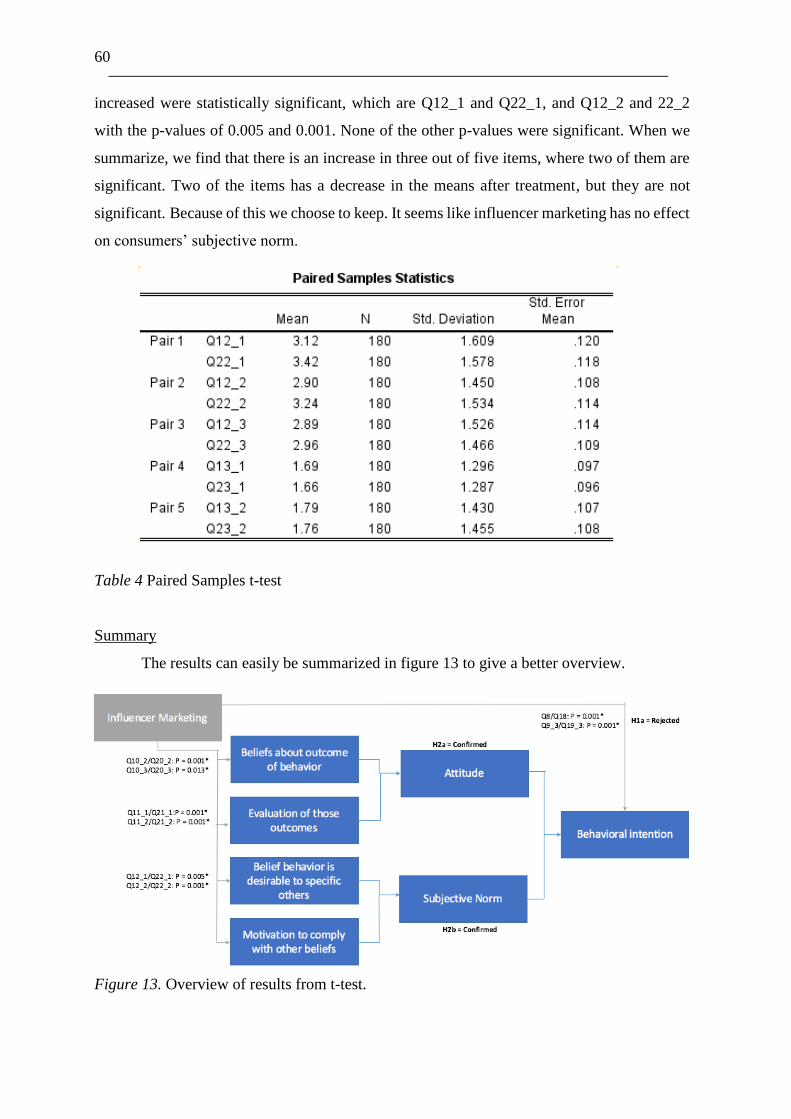
60
increased were statistically significant, which are Q12_1 and Q22_1, and Q12_2 and 22_2
with the p-values of 0.005 and 0.001. None of the other p-values were significant. When we
summarize, we find that there is an increase in three out of five items, where two of them are
significant. Two of the items has a decrease in the means after treatment, but they are not
significant. Because of this we choose to keep. It seems like influencer marketing has no effect
on consumers’ subjective norm.
Table 4 Paired Samples t-test
Summary
The results can easily be summarized in figure 13 to give a better overview.
Figure 13. Overview of results from t-test.
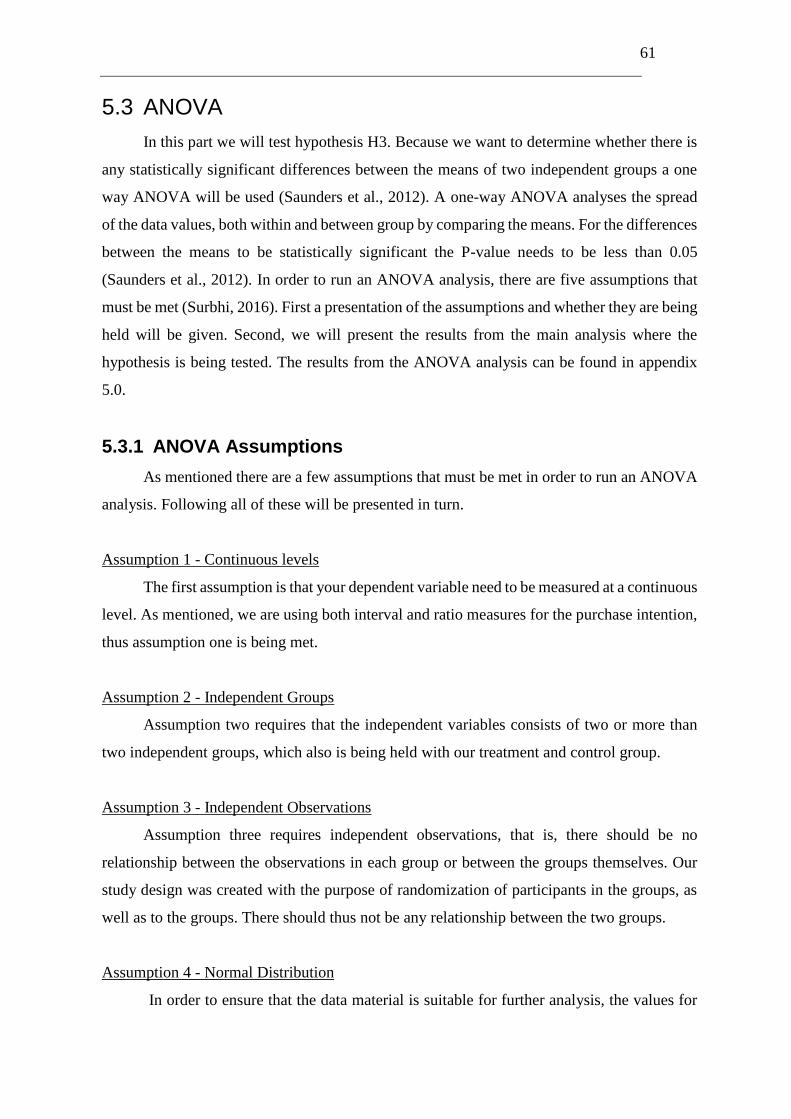
61
5.3 ANOVA
In this part we will test hypothesis H3. Because we want to determine whether there is
any statistically significant differences between the means of two independent groups a one
way ANOVA will be used (Saunders et al., 2012). A one-way ANOVA analyses the spread
of the data values, both within and between group by comparing the means. For the differences
between the means to be statistically significant the P-value needs to be less than 0.05
(Saunders et al., 2012). In order to run an ANOVA analysis, there are five assumptions that
must be met (Surbhi, 2016). First a presentation of the assumptions and whether they are being
held will be given. Second, we will present the results from the main analysis where the
hypothesis is being tested. The results from the ANOVA analysis can be found in appendix
5.0.
5.3.1 ANOVA Assumptions
As mentioned there are a few assumptions that must be met in order to run an ANOVA
analysis. Following all of these will be presented in turn.
Assumption 1 - Continuous levels
The first assumption is that your dependent variable need to be measured at a continuous
level. As mentioned, we are using both interval and ratio measures for the purchase intention,
thus assumption one is being met.
Assumption 2 - Independent Groups
Assumption two requires that the independent variables consists of two or more than
two independent groups, which also is being held with our treatment and control group.
Assumption 3 - Independent Observations
Assumption three requires independent observations, that is, there should be no
relationship between the observations in each group or between the groups themselves. Our
study design was created with the purpose of randomization of participants in the groups, as
well as to the groups. There should thus not be any relationship between the two groups.
Assumption 4 - Normal Distribution
In order to ensure that the data material is suitable for further analysis, the values for
62
each quantitative variable needs to have a normal distribution (Saunders et al., 2016). To
secure this, a test for skewness and kurtosis for each of the variables were conducted.
Parametric tests assume datasets to be normally distributed, thus it is important to control for
non-normality (Field, 2009). Skewness in a dataset indicates the symmetry of the distribution,
where a symmetrical dataset looks the same to the left and right of the center point. The
kurtosis measures whether the data are heavy- or light-tailed relative to a normal distribution.
Datasets with high kurtosis tends to have heavy tails, or outliers (NIST, 2017). Applying for
both terms, a value of zero indicates a perfectly normal distribution. Hence, the further away
the values are from zero, the probability of the variables being normally distributed diminishes.
Negative values of skewness indicate a heavy distribution of the right side, whereas positive
values indicate a heavy distribution on the left side. Positive values for kurtosis indicate a
pointed and heavy-tailed distribution, and negative values indicate flat and light-tailed
distributions (Field, 2009). Determining the suitability of the skewness and kurtosis however,
have some different views. Field (2009) suggests -1 and +1 as determining values, whereas
Davis and Pecar (2010) propose to be a bit more flexible. Kline (2011) limits the level of
skewness on -3/3 and for kurtosis -10/10. Because of this we accept limits higher than what
Field (2009) and Davis & Pecar (2010) suggest. Additionally, a zero value is a relatively
uncommon case in social sciences research (Pallant, 2005). In our dataset we find some
variables exceeding -1 and 1, but only two that barely exceed 3 in skewness (Appendix 2.2.2
and 2.3.2). However, there is one variable that exceeds 10 in kurtosis, which is Q6_1. This
question requests if the respondents ever have bought a Jordan toothbrush which is a highly
common product, and it is not controversial to assume that this result is correct. While there
is some tendencies to skewness and kurtosis, we choose to accept the data and use it for further
analysis. Additionally, when looking at the descriptive statistics for the scale variables
(appendix 2.2.2, and 2.3.2), we find that the mean, mode and median are fairly close, which
might indicate normal distribution (McCormick et al., 2015).
Assumption 5 - Homogeneity of Variance
The last assumption require that there is a homogeneity of variance, meaning that the
samples are obtained from populations of equal variances (Pallant, 2005). To test this, a
Levene’s test was conducted. Two out of 33 variables; Q9 and Q24_1, had a p value less than
.05 which indicates a violation of the assumption. Two out of the 33 variances are not
homogenous. Results from the full analysis can be found in appendix 2.2.2 and 2.2.2. Almost
all of the values are fulfilling the assumption. However, as long as the group sizes are
63
approximately equal and large, the F statistic is robust against heterogeneous variances
(Stevens, 2009; Weinberg & Abramowitz, 2008). Our groups sizes are relatively equal and
large, and the violation is only for two of the 33 variables. Because of this we accept that the
assumption of homogeneity of variance is violated.
Conclusion
To summarize, we chose to accept all the assumptions. This means that we are able to
run an ANOVA analysis for our dataset.
5.3.2 Testing the Hypotheses
When analyzing whether influencer marketing has a stronger positive effect on
consumers purchase intention relatively to regular online advertising we look at the difference
in mean for each variable. In order to create a better overview we will present the results in
accordance to the three distinctions in our model: direct effect, attitudes and subjective norm.
H3: Influencer marketing has a stronger positive effect on consumer's purchase intention than
regular online advertising.
Direct effect
For the direct effect, only four out of 10 variables have a higher mean for influencer
marketing than regular ad. However, none of the results were statistically significant. For the
six variables were regular ad had a higher score than influencer marketing, only variable Q8
was statistically significant with the p-value of 0.028.
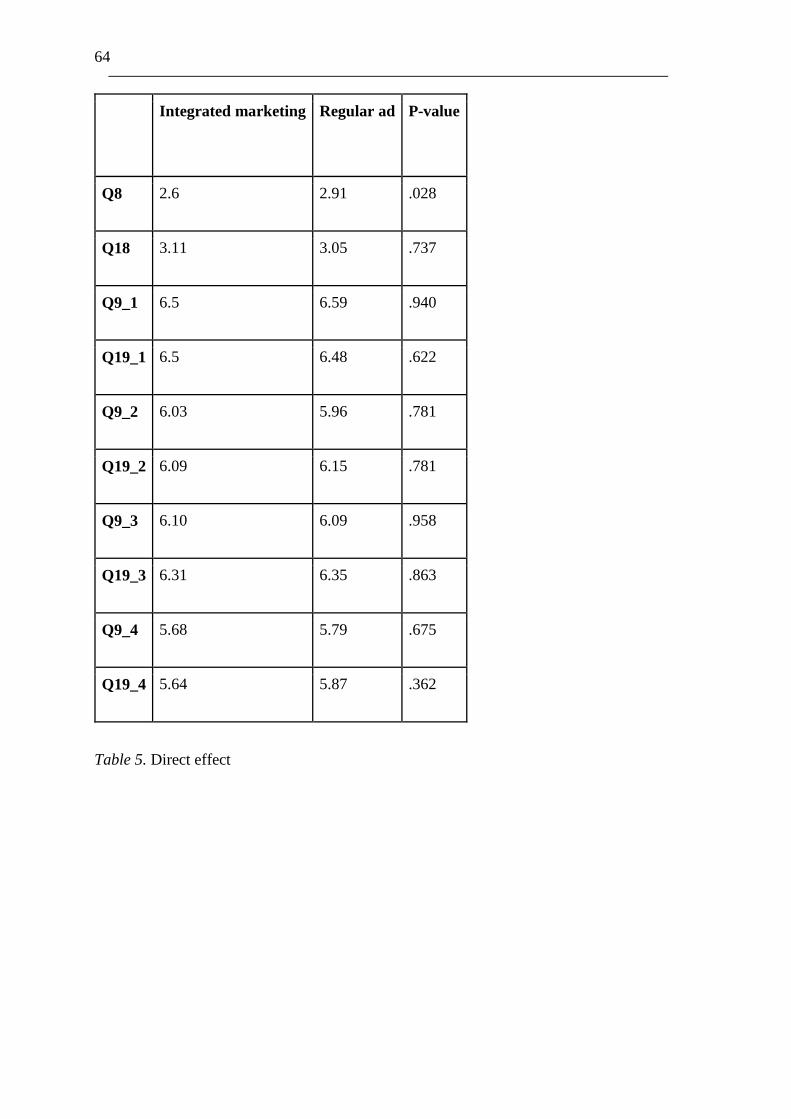
64
Integrated marketing Regular ad P-value
Q8 2.6 2.91 .028
Q18 3.11 3.05 .737
Q9_1 6.5 6.59 .940
Q19_1 6.5 6.48 .622
Q9_2 6.03 5.96 .781
Q19_2 6.09 6.15 .781
Q9_3 6.10 6.09 .958
Q19_3 6.31 6.35 .863
Q9_4 5.68 5.79 .675
Q19_4 5.64 5.87 .362
Table 5. Direct effect
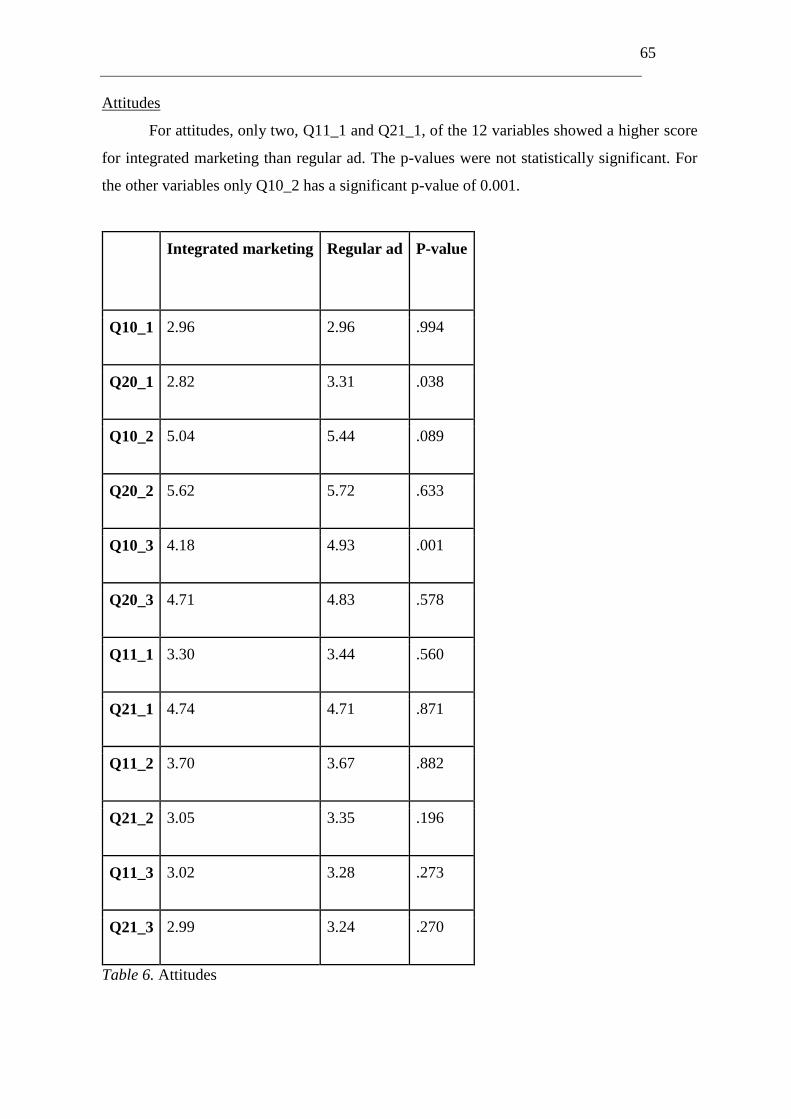
65
Attitudes
For attitudes, only two, Q11_1 and Q21_1, of the 12 variables showed a higher score
for integrated marketing than regular ad. The p-values were not statistically significant. For
the other variables only Q10_2 has a significant p-value of 0.001.
Integrated marketing Regular ad P-value
Q10_1 2.96 2.96 .994
Q20_1 2.82 3.31 .038
Q10_2 5.04 5.44 .089
Q20_2 5.62 5.72 .633
Q10_3 4.18 4.93 .001
Q20_3 4.71 4.83 .578
Q11_1 3.30 3.44 .560
Q21_1 4.74 4.71 .871
Q11_2 3.70 3.67 .882
Q21_2 3.05 3.35 .196
Q11_3 3.02 3.28 .273
Q21_3 2.99 3.24 .270
Table 6. Attitudes
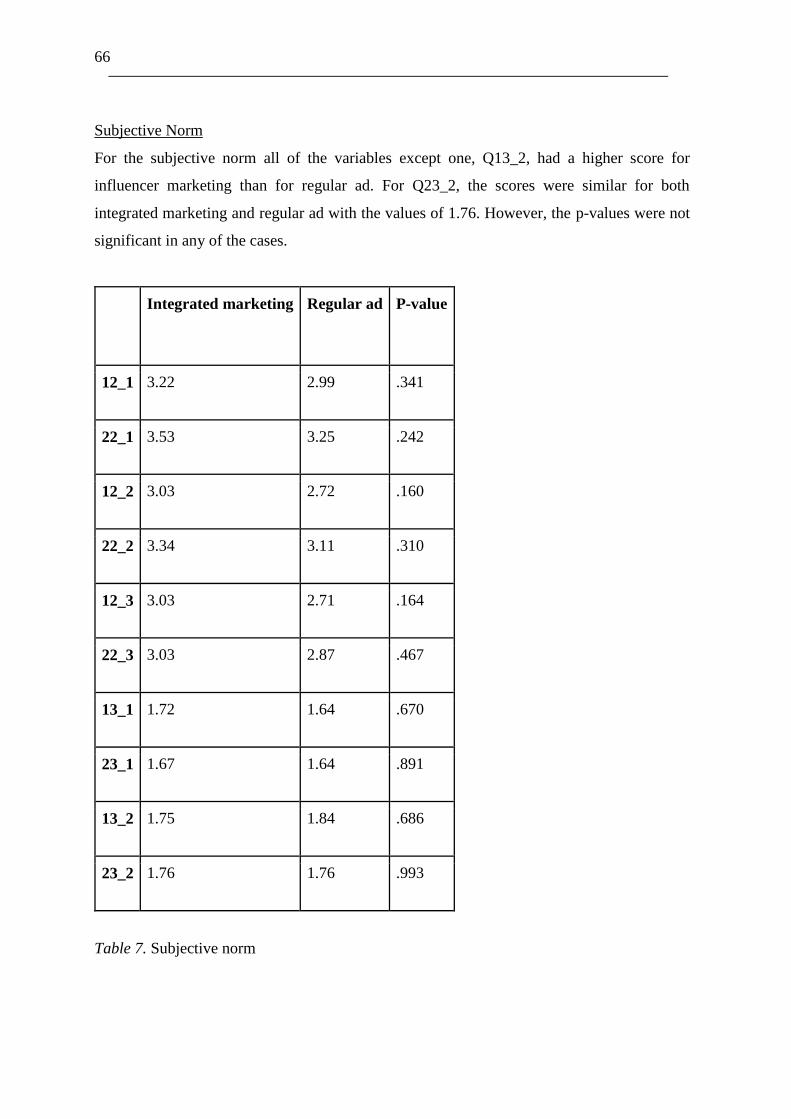
66
Subjective Norm
For the subjective norm all of the variables except one, Q13_2, had a higher score for
influencer marketing than for regular ad. For Q23_2, the scores were similar for both
integrated marketing and regular ad with the values of 1.76. However, the p-values were not
significant in any of the cases.
Integrated marketing Regular ad P-value
12_1 3.22 2.99 .341
22_1 3.53 3.25 .242
12_2 3.03 2.72 .160
22_2 3.34 3.11 .310
12_3 3.03 2.71 .164
22_3 3.03 2.87 .467
13_1 1.72 1.64 .670
23_1 1.67 1.64 .891
13_2 1.75 1.84 .686
23_2 1.76 1.76 .993
Table 7. Subjective norm
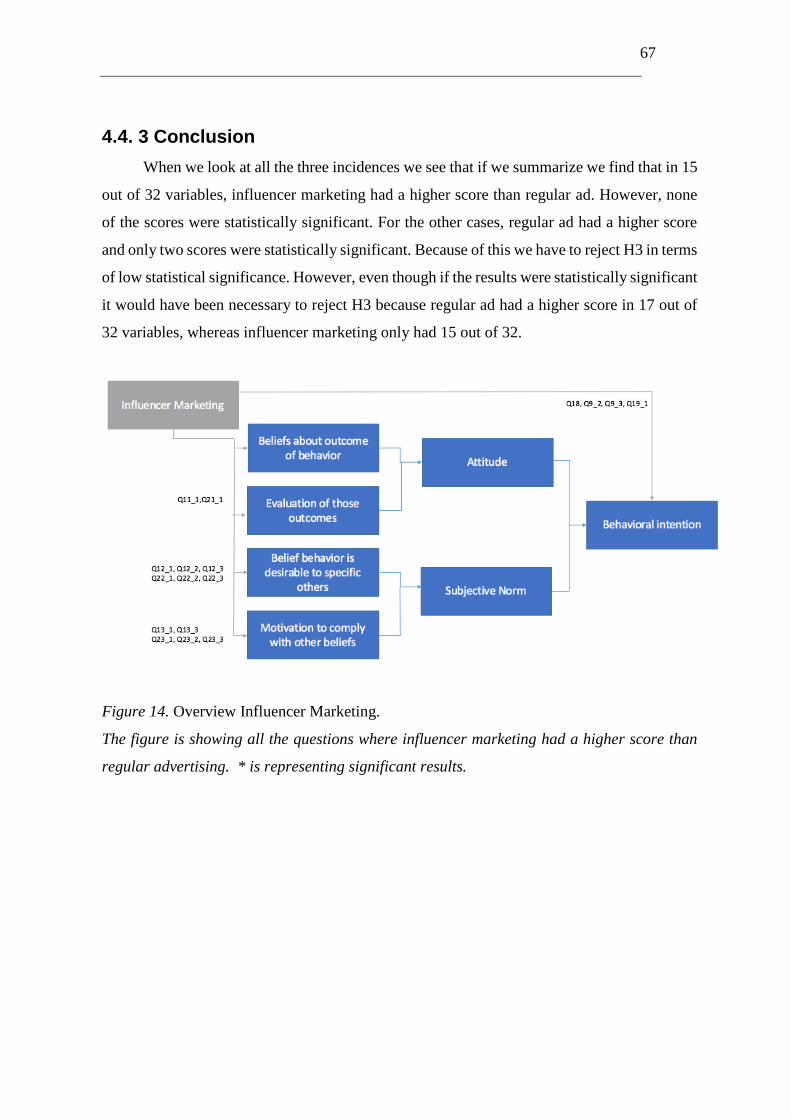
67
4.4. 3 Conclusion
When we look at all the three incidences we see that if we summarize we find that in 15
out of 32 variables, influencer marketing had a higher score than regular ad. However, none
of the scores were statistically significant. For the other cases, regular ad had a higher score
and only two scores were statistically significant. Because of this we have to reject H3 in terms
of low statistical significance. However, even though if the results were statistically significant
it would have been necessary to reject H3 because regular ad had a higher score in 17 out of
32 variables, whereas influencer marketing only had 15 out of 32.
Figure 14. Overview Influencer Marketing.
The figure is showing all the questions where influencer marketing had a higher score than
regular advertising. * is representing significant results.
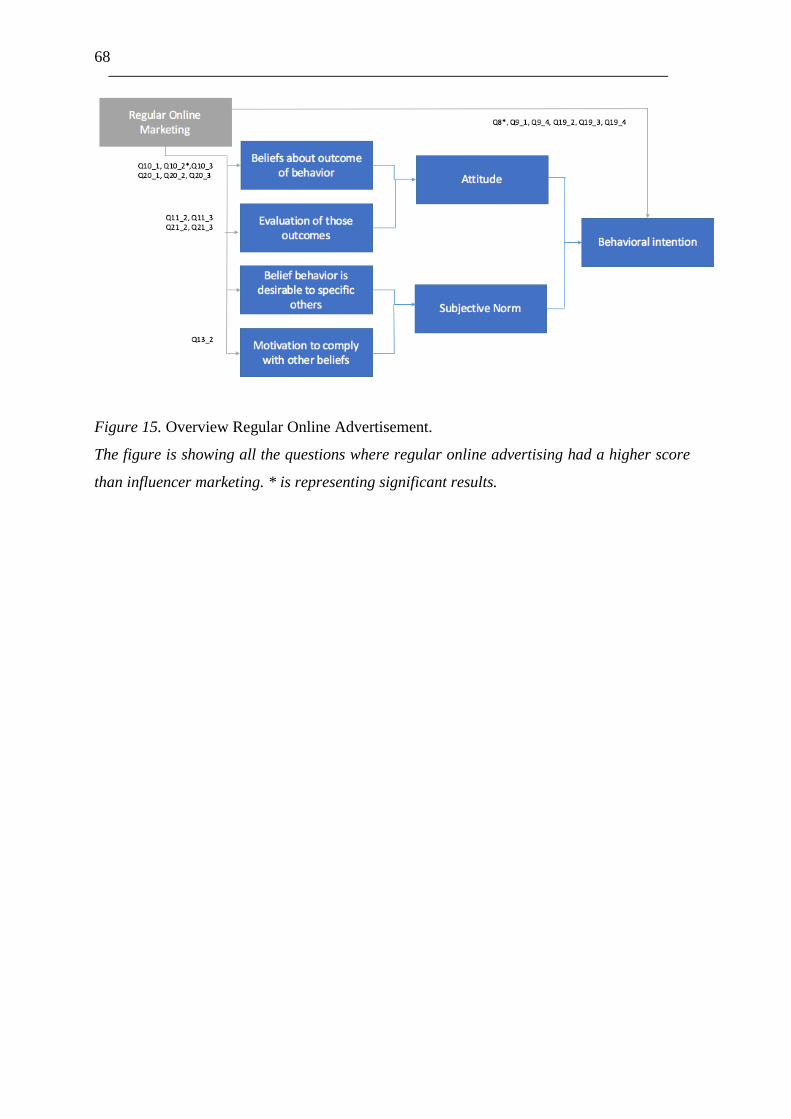
68
Figure 15. Overview Regular Online Advertisement.
The figure is showing all the questions where regular online advertising had a higher score
than influencer marketing. * is representing significant results.
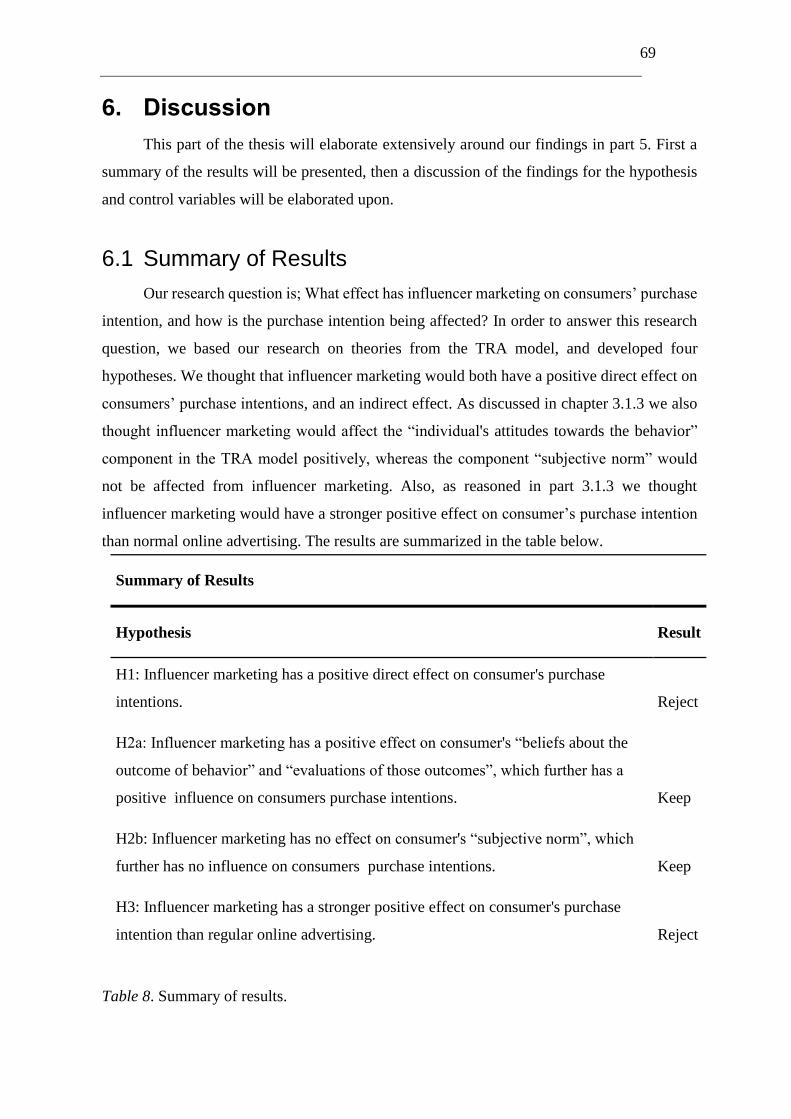
69
6. Discussion
This part of the thesis will elaborate extensively around our findings in part 5. First a
summary of the results will be presented, then a discussion of the findings for the hypothesis
and control variables will be elaborated upon.
6.1 Summary of Results
Our research question is; What effect has influencer marketing on consumers’ purchase
intention, and how is the purchase intention being affected? In order to answer this research
question, we based our research on theories from the TRA model, and developed four
hypotheses. We thought that influencer marketing would both have a positive direct effect on
consumers’ purchase intentions, and an indirect effect. As discussed in chapter 3.1.3 we also
thought influencer marketing would affect the “individual's attitudes towards the behavior”
component in the TRA model positively, whereas the component “subjective norm” would
not be affected from influencer marketing. Also, as reasoned in part 3.1.3 we thought
influencer marketing would have a stronger positive effect on consumer’s purchase intention
than normal online advertising. The results are summarized in the table below.
Table 8. Summary of results.
Summary of Results
Hypothesis Result
H1: Influencer marketing has a positive direct effect on consumer's purchase
intentions. Reject
H2a: Influencer marketing has a positive effect on consumer's “beliefs about the
outcome of behavior” and “evaluations of those outcomes”, which further has a
positive influence on consumers purchase intentions. Keep
H2b: Influencer marketing has no effect on consumer's “subjective norm”, which
further has no influence on consumers purchase intentions. Keep
H3: Influencer marketing has a stronger positive effect on consumer's purchase
intention than regular online advertising. Reject
70
We find that influencer marketing does not have a positive direct effect on
consumers’ purchase intentions, and that it has no effect on consumers’ “subjective norms”.
Also we find that it does not have a stronger positive effect on consumers’ purchase intentions
than regular online advertising. However, we find that influencer marketing has a positive
effect on consumers’ “beliefs about the outcome of behavior” and “evaluation of those
outcomes”.
6.2 Theoretical Implications
In this part we will discuss the theoretical implications of the results for the hypotheses
and control variables in light of the literature review presented in chapter 2.
6.2.1 H1 In H1 we expected to find that influencer marketing has a positive effect on consumers’
purchase intentions. Even though the results showed that consumers’ purchase intention
increased after being exposed to the influencer marketing ad, the results were not significant.
Surprisingly, H1 was therefore rejected.
Traditionally, theory in regards to how marketers can influence purchase intentions has
mainly focused on its path via attitude change (Fishbein & Ajzen, 1975; Spears & Singh, 2004;
Lutz, 1991). However, in this hypothesis we suggest a more direct approach to see what effect
influencer marketing has outside of the proposed theoretical relationship. As mentioned in
chapter 2.5.2, Kotler and Armstrong (2010) laid out a five stage model for the consumer
decision making process; need recognition, information search, evaluation of alternatives,
purchase decision, and post purchase behavior. In our modified experiment, the respondents
might have stopped the process after the first stage if they did not recognize a need after being
exposed to the influencer marketing ad. If the respondents did recognize a need, they most
likely got influenced by both the ad and past experience in the second stage. The influencer
marketing ad used consisted of persuasion arguments. This means that the respondents formed
explicit attitudes which required a more deliberate thought process (Madhavaram & Appan,
2010). In contrast to an unconscious process, a deliberate thought process might have
generated attitudes from past experiences that could have influenced the third stage; evaluation
of alternatives. Also, the product used in our experiment is used by the respondents on a regular
basis, meaning that they most likely have a personal experience. The results might thus have
been different if the influencer marketing ad had more unconsciously exposed the brand in the
71
ad, thereby triggered an implicit attitude formation. Also, the weak results might be because
the influencer marketing ad did not provide enough formation that persuaded the respondents
enough to create a need.
The results found in relation to H1 are also in contrast to Tapinfluence and Nielsen`s
(2016) study, saying that consumers who had been exposed to influencer marketing purchased
significantly more in each purchase occasion after the exposure. Still there can be several
reasons why this study found a direct effect on purchase intention and not ours. First, in reality
consumers themselves actively seeks the social media platform which generates true
engagement (Tapinfluence & Nielsen, 2016). However, in this experiment, the respondents
were exposed to the influencer marketing ad, without seeking it out themselves. Second,
research shows that influencers have more impact than an average person, since influencers
are being perceived as more credible, believable and knowledgeable (Berger & The Keller Fay
Group, 2016). The weak result from the experiment, may suggest that the respondents did not
see the influencer as more credible, believable or knowledgeable than an average person, since
they did not actively seek out the influencer themselves. Third, influencer marketing is
effective because it creates a halo effect that the influencer carries over to the brand it creates
content for (Tapinfluence & Nielsen, 2016). Again, since the respondents did not actively seek
out the influencer used in this experiment, the respondents might not have these positive
associations and attitudes towards the influencer, and therefore a halo effect from the
influencer to the brand has not occurred. In conclusion, the respondents were not engaged in
the behavior, which partly can explain why H1 was rejected.
Attitudes towards the ad might also shed light on the result. As explained in chapter
2.5.5, the AIDA model describes a common hierarchy of events that occur when consumers
view an advertisement. The model explains that the ad needs to create and raise attention,
interest, desire and action for the ad to be effective (Smith & Taylor, 2004). Further, the
attitude towards the ad model might also explain how the ad might play a mediator role
between influencer marketing and purchase intention (MacKenzie et al., 1986). According to
the model, consumers may respond both cognitive or affective. Then these responses may
cause consumers to form a favorable or unfavorable attitude towards the ad. If the consumers
form an attitude towards the ad it can have two implications; alter brand beliefs or directly
transfer the attitude towards the brand. In both cases the implication might lead towards a
change in purchase intentions. Since the results for H1 showed a weak insignificant positive
change in purchase intention, it might be that the respondents did not react either cognitive or
affective enough to create a positive attitude towards the ad. Hence, the AIDA model and
72
attitude towards the ad model might indicate that respondents did not react in a favorable way
towards the ad.
When looking at the manipulation variables, it can also be that one of these variables
could have affected the results. An interesting finding that might imply that there are
weaknesses in our experiment regarding H1, is the last question in the questionnaire for the
treatment group. The respondents here received four questions regarding their beliefs about
blogs as an advertisement tool. We find that they do believe ads in blogs have a reel effect,
and that they think themselves become affected by ads in blogs. Our results in H1 shows the
opposite. However, as we know, people do not always behave the way they think they would
all the time (Hoyer et al., 2013).
6.2.2 H2a
In H2a we expected to find that influencer marketing had a positive effect on the
respondents “beliefs about the outcome of behavior” and “evaluations of those outcomes”,
which further would positively influence their purchase intention. As presented in chapter
5.2.1, the results showed what we expected, and hypothesis 2a got accepted.
“Beliefs about the outcome of behavior” and “evaluations of those outcomes” are two
components in Fishbein and Ajzen's (1980) TRA model, these two components affect
consumers “attitude towards the behavior”, which mediates the relationship between
influencer marketing and purchase intention. First a discussion for each of the two components
will be further elaborated, then a discussion for how “attitude towards the behavior” influence
purchase intention in relation to the findings for hypothesis 2a.
First, we found that “beliefs about the outcome of behavior” increased after the
respondents got exposed to the influencer marketing ad, meaning that the respondents believe
that using the product exposed to them will result in a positive behavior (Ajzen, 1991). As
mentioned under 6.2.1 H1, the influencer marketing ad used in our experiment consisted of
several strong arguments for why the product should be purchased, playing on both positive
and negative motivation arguments. This argumentation implies that the respondents had a
deliberate thought process and formed explicit attitudes (Dempsey & Mitchell, 2010). In the
case of changing the respondents’ beliefs about the outcome of the behavior, this deliberate
thought process can be a part of the reason for the positive results.
Second, we found that “evaluation of the outcomes” both increased and decreased after
the respondents got exposed to the influencer marketing ad in our experiment. This implies
73
that the respondents evaluated the outcomes from the first components to be both positive and
negative. More specifically, as presented in chapter 5.2.1, the respondents thought the
outcomes would make them feel satisfied, but not like a better person or happy. Since the
product displayed in our experiment is a toothbrush, it is expected that the outcomes would be
evaluated this way. As described in chapter 2.5.1, Hoyer et al. (2013) states that attitudes can
affect our thoughts and feelings in four different ways. The first way is through a direct or
imagined experience, like test driving a car to get a good feeling. Our respondents were not
exposed to a direct experience, nor did we create situations with the attempt of persuade the
respondents to imagine an experience. This might be an explanation of why the respondents’
evaluation of being happy when buying a product was reduced. The second way is through
reasoning by analogy or category, meaning that the product gets compared to other products
or a particular product category. In our experiment, the influencer marketing ad would fall into
this category, as it talked about toothbrushes in general and compared the toothbrush to other
products in the same product category. Since the respondents did not feel happier about the
outcome, they most likely did not get influenced enough by the motivation argument to feel
happier when purchasing this particular toothbrush over other toothbrush brands. However,
the negative motivation argument for the product in general, that buying the product would
improve their health, may have influenced the respondents enough to feel more satisfied about
the outcome. The third way is through value driven attitudes, meaning that values might affect
attitudes towards a product. It would be more likely that an influencer marketing ad for helping
others, like donation to Red Cross for example would influence value driven attitudes than a
toothbrush ad. This might explain why the respondents had a decrease in making them feel
like a better person in evaluation of the outcome. The fourth way is through social identity-
based attitude generation, by playing on social identity to affect attitudes towards the product.
The influencer marketing ad used did not play on any specific social identity. It took a more
general approach by arguing for the product in general to the whole population. Maybe if the
influencer marketing ad had a stronger social identity profile, it could have influenced the
respondents feeling of being happy about the outcome. They would then feel like the product
would increase their social identity.
Even though we found both increases and decreases in the components mentioned
above, the results showed that influencer marketing positively influenced the respondent's
overall “attitude towards the behavior”. This means that the respondents believe the
consequences of performing the behavior outweigh the negative ones. Moreover, this imply
that we found that attitudes have a cognitive function, since the attitude guided the
74
respondents’ thoughts about the behavior (Hoyer et al., 2013). An affection function is less
likely to be found, since the respondents’ attitudes most likely did not get affected by feelings
in our experiment (Hoyer et al., 2013). Most importantly, we confirmed that influencer
marketing has a conative function, meaning that attitudes affect behavior (Hoyer et al., 2013).
This signify that our results imply that an increase in “attitude towards the behavior” positively
affects purchase intention, as described in Fishbein and Ajzen's (1980) theory of planned
behavior.
6.2.3 H2b
In hypothesis 2b we expected to find that influencer marketing had no effect on the
respondents’ “subjective norm”, which means that this mediator variable would not affect the
relationship between influencer marketing and purchase intention. As presented in chapter
5.2.1, the results showed what we expected and hypothesis 2b got accepted.
As described in chapter 2.5.3 about the TRA model, the “subjective norm” mediator consist
of two components, “normative beliefs” and “motivation to comply” (Fishbein & Ajzen,
1980). For these components we found both increase and decrease in the means after
treatment. However, these changes were not statistically significantly signifying that in
general the subjective norm did not get affected by influencer marketing.
As mentioned we expected that influencer marketing would not affect “normative
beliefs”, what significant others feel about the behavior (Fishbein & Ajzen, 1980). First, these
significant others are referred to as family, friends, co-workers and so forth, and in our
experiment only the respondents got exposed to the influencer marketing ad, not their
significant others. Therefore, our experiment would as expected, not have the power to affect
the respondents’ normative beliefs. Second, the influencer marketing ad used did not contain
any arguments with regards to normative beliefs nor social pressure. This leads the discussion
to the second component, “motivation to comply with those significant others”. Since the
influencer marketing ad did not contain any arguments for social pressure to use the product,
it would imply that this component would not be affected, as were the case in our experiment.
Furthermore, the product used in our experiment would probably not be subject to social
pressure, as everyone in industrialized countries purchase and use toothbrushes on a regular
basis.
Since neither “normative beliefs” nor “motivation to comply” changed in our
experiment, the “subjective norm” was not affected. We could therefore not register any
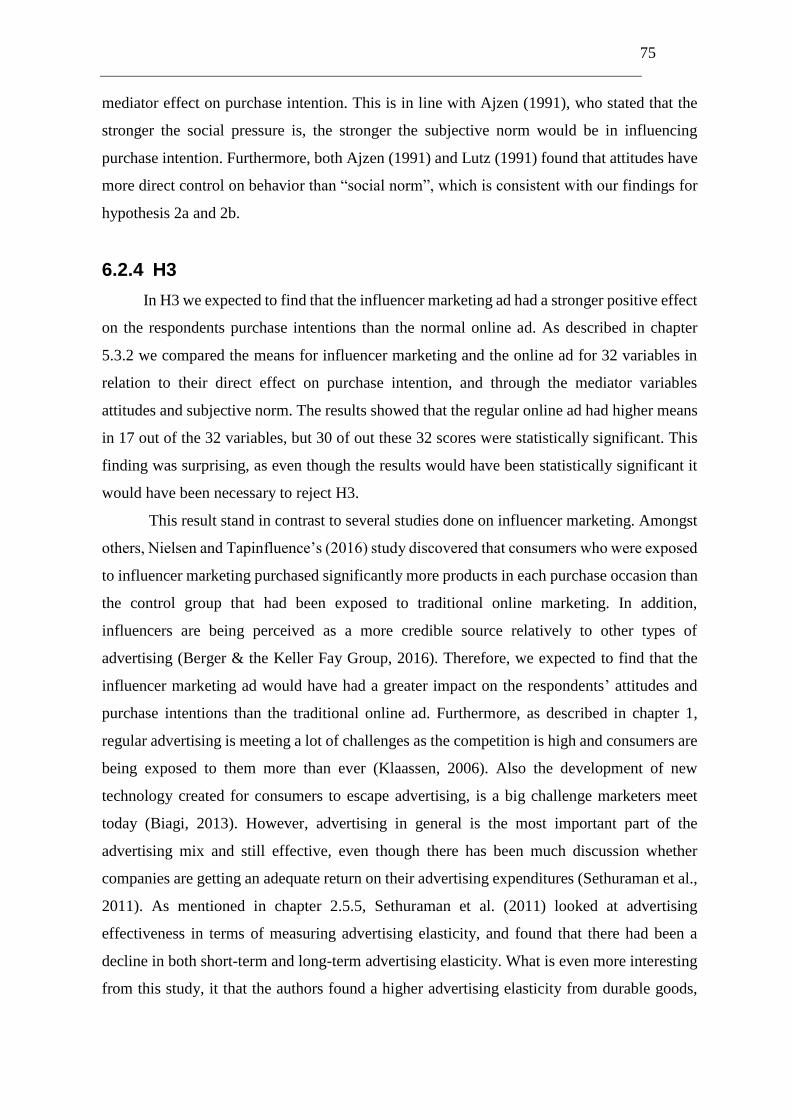
75
mediator effect on purchase intention. This is in line with Ajzen (1991), who stated that the
stronger the social pressure is, the stronger the subjective norm would be in influencing
purchase intention. Furthermore, both Ajzen (1991) and Lutz (1991) found that attitudes have
more direct control on behavior than “social norm”, which is consistent with our findings for
hypothesis 2a and 2b.
6.2.4 H3
In H3 we expected to find that the influencer marketing ad had a stronger positive effect
on the respondents purchase intentions than the normal online ad. As described in chapter
5.3.2 we compared the means for influencer marketing and the online ad for 32 variables in
relation to their direct effect on purchase intention, and through the mediator variables
attitudes and subjective norm. The results showed that the regular online ad had higher means
in 17 out of the 32 variables, but 30 of out these 32 scores were statistically significant. This
finding was surprising, as even though the results would have been statistically significant it
would have been necessary to reject H3.
This result stand in contrast to several studies done on influencer marketing. Amongst
others, Nielsen and Tapinfluence’s (2016) study discovered that consumers who were exposed
to influencer marketing purchased significantly more products in each purchase occasion than
the control group that had been exposed to traditional online marketing. In addition,
influencers are being perceived as a more credible source relatively to other types of
advertising (Berger & the Keller Fay Group, 2016). Therefore, we expected to find that the
influencer marketing ad would have had a greater impact on the respondents’ attitudes and
purchase intentions than the traditional online ad. Furthermore, as described in chapter 1,
regular advertising is meeting a lot of challenges as the competition is high and consumers are
being exposed to them more than ever (Klaassen, 2006). Also the development of new
technology created for consumers to escape advertising, is a big challenge marketers meet
today (Biagi, 2013). However, advertising in general is the most important part of the
advertising mix and still effective, even though there has been much discussion whether
companies are getting an adequate return on their advertising expenditures (Sethuraman et al.,
2011). As mentioned in chapter 2.5.5, Sethuraman et al. (2011) looked at advertising
effectiveness in terms of measuring advertising elasticity, and found that there had been a
decline in both short-term and long-term advertising elasticity. What is even more interesting
from this study, it that the authors found a higher advertising elasticity from durable goods,
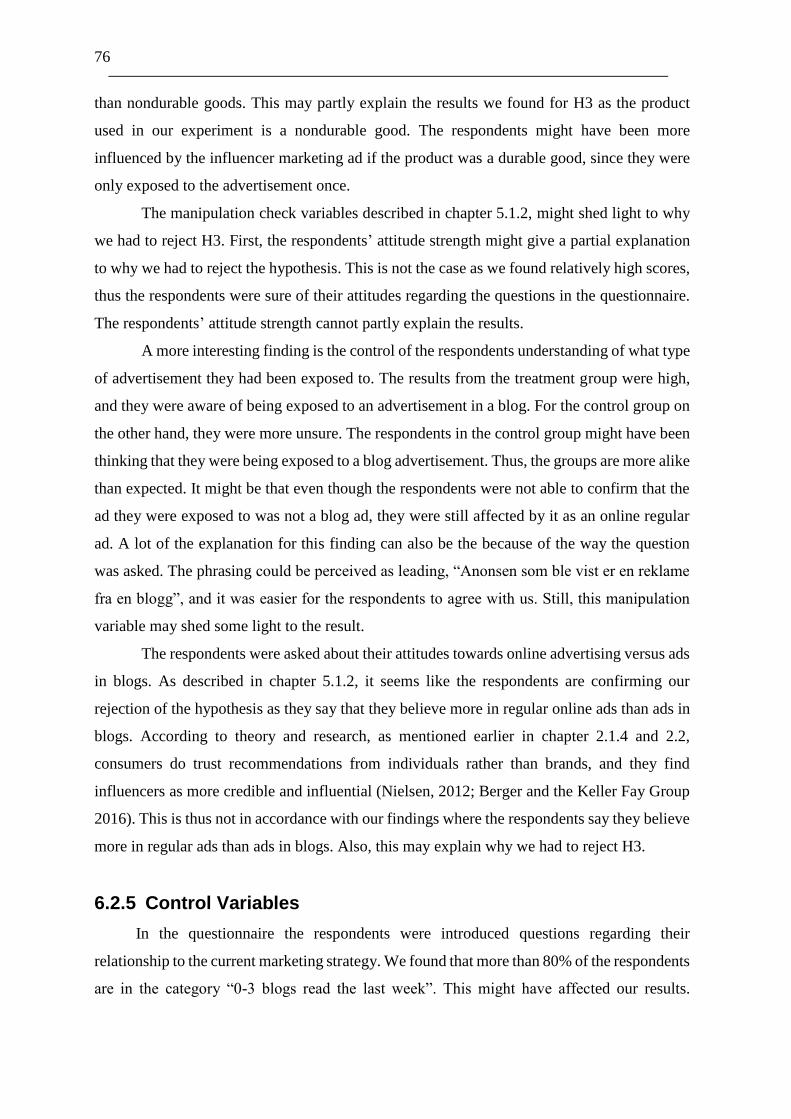
76
than nondurable goods. This may partly explain the results we found for H3 as the product
used in our experiment is a nondurable good. The respondents might have been more
influenced by the influencer marketing ad if the product was a durable good, since they were
only exposed to the advertisement once.
The manipulation check variables described in chapter 5.1.2, might shed light to why
we had to reject H3. First, the respondents’ attitude strength might give a partial explanation
to why we had to reject the hypothesis. This is not the case as we found relatively high scores,
thus the respondents were sure of their attitudes regarding the questions in the questionnaire.
The respondents’ attitude strength cannot partly explain the results.
A more interesting finding is the control of the respondents understanding of what type
of advertisement they had been exposed to. The results from the treatment group were high,
and they were aware of being exposed to an advertisement in a blog. For the control group on
the other hand, they were more unsure. The respondents in the control group might have been
thinking that they were being exposed to a blog advertisement. Thus, the groups are more alike
than expected. It might be that even though the respondents were not able to confirm that the
ad they were exposed to was not a blog ad, they were still affected by it as an online regular
ad. A lot of the explanation for this finding can also be the because of the way the question
was asked. The phrasing could be perceived as leading, “Anonsen som ble vist er en reklame
fra en blogg”, and it was easier for the respondents to agree with us. Still, this manipulation
variable may shed some light to the result.
The respondents were asked about their attitudes towards online advertising versus ads
in blogs. As described in chapter 5.1.2, it seems like the respondents are confirming our
rejection of the hypothesis as they say that they believe more in regular online ads than ads in
blogs. According to theory and research, as mentioned earlier in chapter 2.1.4 and 2.2,
consumers do trust recommendations from individuals rather than brands, and they find
influencers as more credible and influential (Nielsen, 2012; Berger and the Keller Fay Group
2016). This is thus not in accordance with our findings where the respondents say they believe
more in regular ads than ads in blogs. Also, this may explain why we had to reject H3.
6.2.5 Control Variables
In the questionnaire the respondents were introduced questions regarding their
relationship to the current marketing strategy. We found that more than 80% of the respondents
are in the category “0-3 blogs read the last week”. This might have affected our results.
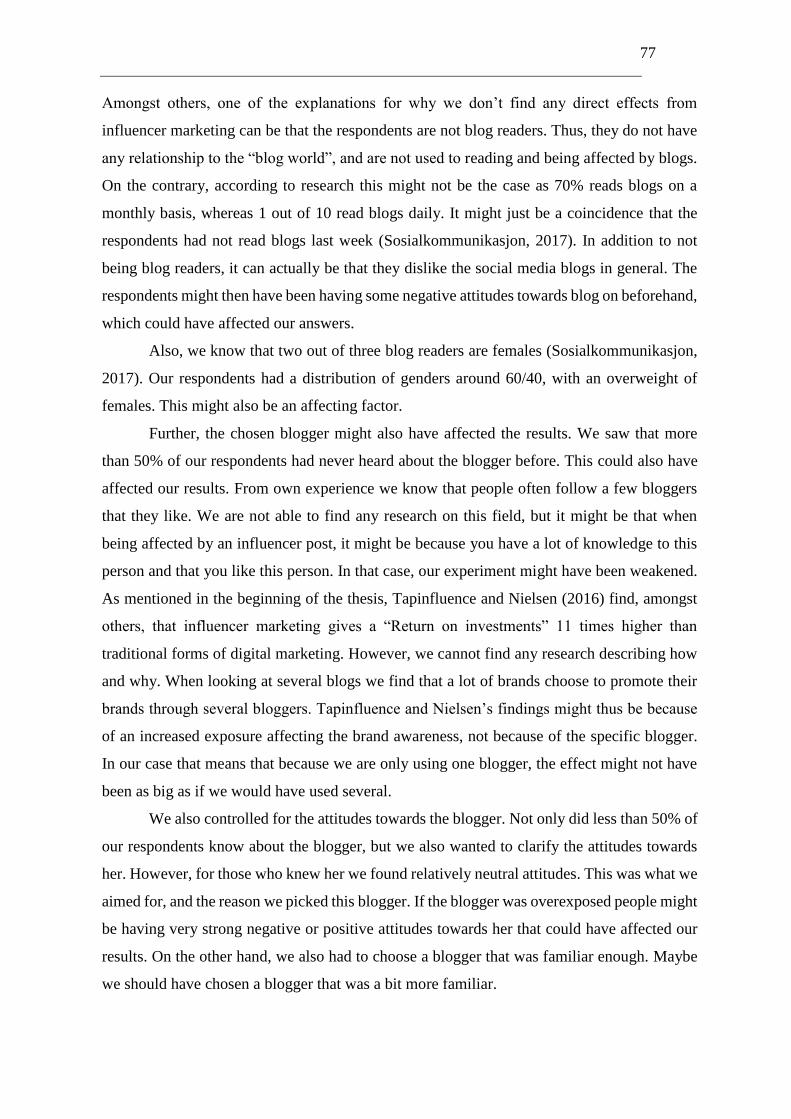
77
Amongst others, one of the explanations for why we don’t find any direct effects from
influencer marketing can be that the respondents are not blog readers. Thus, they do not have
any relationship to the “blog world”, and are not used to reading and being affected by blogs.
On the contrary, according to research this might not be the case as 70% reads blogs on a
monthly basis, whereas 1 out of 10 read blogs daily. It might just be a coincidence that the
respondents had not read blogs last week (Sosialkommunikasjon, 2017). In addition to not
being blog readers, it can actually be that they dislike the social media blogs in general. The
respondents might then have been having some negative attitudes towards blog on beforehand,
which could have affected our answers.
Also, we know that two out of three blog readers are females (Sosialkommunikasjon,
2017). Our respondents had a distribution of genders around 60/40, with an overweight of
females. This might also be an affecting factor.
Further, the chosen blogger might also have affected the results. We saw that more
than 50% of our respondents had never heard about the blogger before. This could also have
affected our results. From own experience we know that people often follow a few bloggers
that they like. We are not able to find any research on this field, but it might be that when
being affected by an influencer post, it might be because you have a lot of knowledge to this
person and that you like this person. In that case, our experiment might have been weakened.
As mentioned in the beginning of the thesis, Tapinfluence and Nielsen (2016) find, amongst
others, that influencer marketing gives a “Return on investments” 11 times higher than
traditional forms of digital marketing. However, we cannot find any research describing how
and why. When looking at several blogs we find that a lot of brands choose to promote their
brands through several bloggers. Tapinfluence and Nielsen’s findings might thus be because
of an increased exposure affecting the brand awareness, not because of the specific blogger.
In our case that means that because we are only using one blogger, the effect might not have
been as big as if we would have used several.
We also controlled for the attitudes towards the blogger. Not only did less than 50% of
our respondents know about the blogger, but we also wanted to clarify the attitudes towards
her. However, for those who knew her we found relatively neutral attitudes. This was what we
aimed for, and the reason we picked this blogger. If the blogger was overexposed people might
be having very strong negative or positive attitudes towards her that could have affected our
results. On the other hand, we also had to choose a blogger that was familiar enough. Maybe
we should have chosen a blogger that was a bit more familiar.
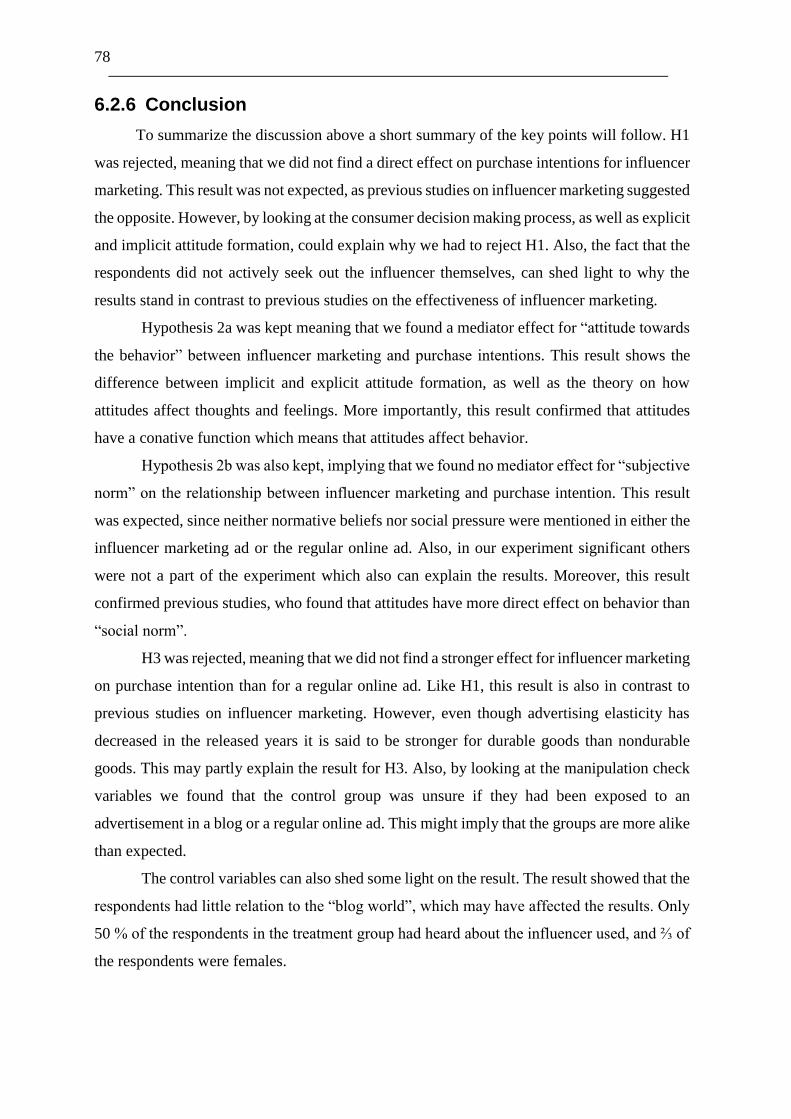
78
6.2.6 Conclusion
To summarize the discussion above a short summary of the key points will follow. H1
was rejected, meaning that we did not find a direct effect on purchase intentions for influencer
marketing. This result was not expected, as previous studies on influencer marketing suggested
the opposite. However, by looking at the consumer decision making process, as well as explicit
and implicit attitude formation, could explain why we had to reject H1. Also, the fact that the
respondents did not actively seek out the influencer themselves, can shed light to why the
results stand in contrast to previous studies on the effectiveness of influencer marketing.
Hypothesis 2a was kept meaning that we found a mediator effect for “attitude towards
the behavior” between influencer marketing and purchase intentions. This result shows the
difference between implicit and explicit attitude formation, as well as the theory on how
attitudes affect thoughts and feelings. More importantly, this result confirmed that attitudes
have a conative function which means that attitudes affect behavior.
Hypothesis 2b was also kept, implying that we found no mediator effect for “subjective
norm” on the relationship between influencer marketing and purchase intention. This result
was expected, since neither normative beliefs nor social pressure were mentioned in either the
influencer marketing ad or the regular online ad. Also, in our experiment significant others
were not a part of the experiment which also can explain the results. Moreover, this result
confirmed previous studies, who found that attitudes have more direct effect on behavior than
“social norm”.
H3 was rejected, meaning that we did not find a stronger effect for influencer marketing
on purchase intention than for a regular online ad. Like H1, this result is also in contrast to
previous studies on influencer marketing. However, even though advertising elasticity has
decreased in the released years it is said to be stronger for durable goods than nondurable
goods. This may partly explain the result for H3. Also, by looking at the manipulation check
variables we found that the control group was unsure if they had been exposed to an
advertisement in a blog or a regular online ad. This might imply that the groups are more alike
than expected.
The control variables can also shed some light on the result. The result showed that the
respondents had little relation to the “blog world”, which may have affected the results. Only
50 % of the respondents in the treatment group had heard about the influencer used, and ⅔ of
the respondents were females.
79
7. Limitations and Further Research
In this chapter the quality of the research design will be elaborated upon, as well as
suggestions for future research. First, the strengths and limitations of the research design will
be discussed. Second, reliability and validity will be assessed. When evaluating the quality of
qualitative research, reliability and validity are central concepts. To reduce the probability of
drawing wrong conclusions when designing a research design, it is crucial to address the
validity and reliability of the research design (Saunders et al., 2012). Thus, the concept of
reliability and validity in relation to the chosen research design will be further elaborated and
addressed. Finally, suggestions for future research will be presented
7.1 Strenghts and Limitations
In this section an outline of what we think is this study’s strengths and weaknesses will
be presented. What is both a strength and weakness in our study are the ads used as treatments.
For the treatment group we chose an authentic influencer ad that was copied from the chosen
blogger’s platform. Because we chose to use something that was well known and authentic as
a treatment, we perceive this as a strength as it creates a more realistic advertising exposure,
compared to using a fictitious brand and influencer ad. On the other hand, using a real life
brand and influencer ad have some limitations. The results might have been affected by
respondents’ attitudes and prior experiences with the brand and influencer (Saunders et al.
2012). This could have been prevented by creating a fictitious brand and influencer ad.
However, because of scarce resources, it was difficult to implement.
The execution of the regular online ad also represents a weakness with our study. The
advertisement was edited by ourselves as we were not able to find a Jordan ad to serve our
purpose to a full extent. To achieve a higher level of authenticity, a real life advertisement
should ideally have been used. The results from the questionnaire also suggest this as a
weakness as the respondents clearly were a bit unsure whether it was a blog ad or not.
However, as discussed in 6.2.4 it could be several explanations for this such as leading
questions.
The product chosen also had its strengths and limitations. First, the brand and the
product is well-known for Norwegian consumers. A toothbrush is a daily product that all
people can relate to, and was one of the main reasons of the choice. However, it was other
aspects to take into account. It was important to choose a product that had not been over
exposed on social media and thus might have had strong negative associations because of that.
80
The choice of product might have been a good in order to reduce associations to other bloggers
or products, but it might not have been the most interesting product. Feedback from some of
the respondents indicates that the topic toothbrushes was perceived as a bit boring, thus the
motivation to the respondents might have been reduced and affected their responses. Also,
toothbrushes in general might be a product that does not encourage a lot of engagement. A
toothbrush is a product everyone needs to buy anyways, and most people necessarily does not
have a lot of premises when buying them. The effect an ad has on a consumer’s purchase
intentions of toothbrushes might not be strong no matter what type of ad it is and how effective
it is. One might argue that this should have been discovered under the pretest. We did see that
there were no major effects, but as a research is as much about rejecting a hypothesis as
approving one, we chose to stick to the ethics of research and continue with the same
questionnaire.
Next, the sample also had its strengths and limitations. The number of respondents (N
= 190) could be considered relatively low compared to general research usage (Saunders et
al., 2012), but on the other hand, relatively high compared to master thesis conventions. Still,
a sample of this size may reduce the probability of finding statistically significant results and
enhance the chance of rejecting a null hypothesis when it is true (Cohen, 1992). Therefore,
with more time and resources to increase the sample size, we might have been able to obtain
more statistical significant results. Another aspect to consider is that the respondents were
recruited through our own Facebook profiles, thus we might have gotten respondents that are
somewhat similar to ourselves when it comes to age, education and geographical locations.
Social media users in Norway are between 16 - 54 years old, but from our sample there is a
clear overweight in the age range 16 - 35. The strength with recruiting on Facebook was that
we were able to reach the respondents in a natural environment regarding the questions in the
questionnaire.
Our experiment was conducted as a cross-sectional study, implying that the data
collected only involved a one-shot exposure to the instrument (Johannessen et al., 2016). This
could be considered as a limit. With only a single exposure to the ad it is not viable to examine
if attitudes would change with multiple exposures to the ad. This was also discussed in 6.2.4,
and further arguments can be found there.
Some limitations were also found in our design. The post-test was conducted right after
the treatment is presented instrument is shown, meaning that we only measured the effect
directly afterwards. The respondents then only had a limited time to process and elaborate over
what they just been exposed to. Another weakness was that we asked the respondents directly
81
about purchase intentions. According to Hosein (2012) this may influence the answers.
However, because of limitations a longitudinal study was not possible.
Moreover, this study has some strengths and limitations that could serve as help for
similar studies. In a longer perspective we would have been able to redo the experiment with
several improvements. Moreover, in order to make somewhat legit conclusions from a study
like this, it is especially important to be aware of the limitations.
7.2 Reliability
Reliability refers to replication and consistency, that is if other researchers will be able
to get consistent results by replicating the study, or if the study was performed on another
point in time (Saunders et al., 2012). As presented in chapter 3.2, the analysis utilizes survey
data. When using survey data, a distinction between internal reliability and external reliability
is made (Bryman & Cramer, 2009).
7.2.1 Internal Reliability
Internal reliability refers to the degree of internal consistency of the measured items,
meaning the degree to which the items of the measurement instrument are measuring a single
construct (Bryman & Cramer, 2009). Bryman and Cramer (2009) argues that this is especially
important when using a measurement scale with multiple items, like a 7-point Likert scale.
For the items to be internally consistent, respondents need to correctly understand that the
items in the multiple-item scale belong to the same construct. A number of procedures for
estimating whether the items are internally reliable exists and one of them is to measure the
Cronbach's alpha values (Cronbach, 1951). The Cronbach`s alpha is widely used for
calculating the average of all possible split-half reliability coefficients and can readily be
computed in SPSS (Bryman & Cramer, 2009). The findings for Cronbach's alpha values are
further explained in chapter 5.2, and fully presented in appendix 6.0. All the values calculated
are within the rule of thumb that the results should be 0.7 or above, suggesting that the items
are internally reliable (Bryman & Cramer, 2009).
7.2.2 External Reliability
External reliability refers to the degree of consistency of a measure over time, meaning
that the respondents will respond identically and that the analytic procedure will provide
consistent findings if it were repeated at a later point in time (Bryman & Cramer, 2009).
82
According to Trochim (2006) the fundamental threat to external reliability is systematic errors
and biases. These systematic errors and biases can according to Saunders et al. (2012) be
divided into four categories; participant error, participant bias, observer error and observer
bias.
The first category, participant error, refers to any factors that adversely alters the way
in which a participant performs (Saunders et al., 2012). A factor can be that respondents
misunderstand the questions, or that they respond at a stressful time. Since we distributed the
questionnaire through social media we have no control in the test situation. Perhaps the
respondents responded to the questionnaire in a particular mood or at a stressful point of time.
This factor lies outside our control, however, when distributing the questionnaire
through Facebook, respondents have the freedom to answer at an appropriate time. Also, we
took several measures to reduce the factor of respondents misunderstanding the questions. The
questions were carefully formulated regarding both format and wording. Also, the questions
were in the respondents’ main language, Norwegian, and the questionnaire was pilot tested.
In conclusion, even though steps were taken in order to reduce the participant error there will
still be some risk.
The second category, participant bias, refers to any factors that induces a false response
(Saunders et al., 2012). This bias may occur if respondents adapt their answer according to
what they believe is the “correct” answer or what they think the researches wants them to
answer. To reduce the probability of social desirability bias (Phillips & Clancy, 1972), which
refers to respondents answering questions in a manner that will be viewed favorably by others,
we ensure total anonymity in the cover letter (Saunders et al., 2012). To reduce the bias of
respondents adapting their answers according to what they believe the researchers are looking
for, the motive for the questionnaire was hidden. There was no mentioning of the objective of
the study in either the cover letter or the message on Facebook. Also, through the questionnaire
we tried to hide the purpose by carefully formulating the questions. However, there is still
some risk that participant bias might have occurred.
The third category, observer error, refers to any factors that alters the researchers’
interpretation (Saunders et al., 2012). First of all, the use of a questionnaire reduces observer
error as this qualitative method does not include researchers wording, mood or body language
at the time of response unlike interviews. Also, the data was directly imported into SPSS,
avoiding manually errors. Observer error was therefore highly reduced.
The fourth category, observer bias, refers to any factors that induces bias in the
researchers recording of the responses (Saunders et al., 2012). To reduce the probability of
83
observer bias, the questionnaire was designed with no open-ended questions, avoiding
researchers’ subjective views when interpreting respondents’ answers.
In conclusion, there are some weaknesses related to both internal and external
reliability. However, by being aware of the possible weak reliabilities we were able to facilitate
and design an experiment to keep the reliability as strong as possible. Additionally, the
arguments above demonstrate a sufficient level of reliability. Based on this we find it
reasonable to conclude that measures used in this thesis will provide equal results at another
point in time or if replicated by other researchers.
7.3 Validity
Validity refers to how well we manage to measure what is intended to measure or
examined in the research (Saunders et al., 2012) There are several types of validity, and
according to Trochim (2006) these types of validity can be divided into three main categories;
statistical conclusion validity, internal validity and external validity.
7.3.1 Statistical Conclusion Validity
The first category, statistical conclusion validity, addresses the extent and statistical
significance of the covariation in the data (Churchill, 1991). In other words, whether the
conclusions drawn about effects or causal relations in the study reflects a truth or if it is simply
due to random events (Austin, Boyle & Lualhati, 1998). Further, Saunders et al. (2012) divides
statistical conclusion validity into two types of errors; Type I and Type II.
Type I error is making wrong decisions that something is true, when in reality it is not,
thus, wrongly rejecting a false null hypothesis (Saunders et al., 2012). Preventing type I error
can according to Saunders et al. (2012) be accomplished, the use of ANOVA, t-test and the
Cronbach's alpha value will ensure that Type I error was unlikely to occur. The ANOVA test
and t-test is considered appropriate for significance testing, which gives confidence in the
results (Saunders et al., 2012).
Type II error is the inverse of Type I error. A type II error is made when wrongly
coming to the decision that something is not true, when in reality it is. Thus, rejecting the null
hypothesis when it is true (Saunders et al., 2012). For type II errors there is no possibility of
confirming that this error has occurred, since limited resources and time make the sample size
relatively small. A larger sample size may reveal a null hypothesis that were unattainable to
84
find within our sample frame.
7.3.2 Internal Validity
The second category, internal validity, addresses whether one may infer that the
relationship between X and Y is responsible for the effects we do detect (Breivik, 2015a). In
other words, alternative explanations for the observed effect has to be excluded. In order to
accomplish internal validity, the study needs measure what it is intended to measure
(Johannessen, Tufte & Christoffersen, 2016). To assess internal validity, Saunders et al. (2012)
highlights three important aspects when using a questionnaire in the research design; content
validity, criterion-related validity, and construct validity.
Content validity refers to the extent to which the content of the questionnaire items
provides accurate coverage of the research questions (Saunders et al., 2012). The research has
carefully been defined through extensive literature review on the concepts of study
Additionally, in order to ensure understanding the instruments used are authentic and
prototypical ads typically used in both regular ads and blog ads. Also, the items used in the
questionnaire are designed based on previous findings from research about attitudes and
purchase intention. Thus, we consider the content validity to be relatively high.
Criterion-related validity refers to whether the items in the questionnaire have the
ability to make accurate predictions (Trochim, 2006). Criterion-related validity can be divided
into two types; predictive validity and concurrent validity. Predictive validity refers to a
measurements’ “ability to predict something it should theoretically be able to”, while
concurrent validity refers to the measurements “ability to distinguish between groups that it
should theoretically be able to distinguish between” (Trochim, 2006). As described in chapter
5.3.1, the results showed a significant mediator effect of “attitudes towards the behavior” on
the relationship between influencer marketing and purchase intention. This indicates that the
operalization of attitudes were able to predict purchase intention and thus, indicates that
predictive validity is achieved. When it comes to the concurrent validity, the results in chapter
5.4.3 shows that the mean scores between the treatment and control group were not
significantly different for either “attitudes towards the behavior”, “subjective norm” or
“purchase intention”, which indicates that the concurrent validity is not adequate.
Construct validity refers to the extent in which there is coherence between
measurement items and what the study is supposed to measure (Johannessen et al. 2016). The
composition of different measurement items and scales used for measuring “attitudes towards
85
the behavior”, “subjective norm” and “purchase intention” in this questionnaire has never been
used together before, which can reduce the construct validity. However, as mentioned above,
the use of existing measurement items from findings in previous research was carefully
selected (Spears & Singh, 2004; Raubenheimer ,2004; Ajzen, 2013; Rossiter 2002; Dillmann
et al. 2014; Fink, 2013) Also, Cronbach`s alpha values show that these scales were internally
consistent and thus, reliable according to common research norms (Bryman & Cramer, 2009).
Based on this, the construct validity should be reasonable.
Further, Cook and Campbell (1979, cited in Saunders et al., 2012) propose six potential
threats to internal validity; history - if previous experience will influence the answers, testing
- if the researcher in any way influence responses, instrumentation - if the instrument in any
way mislead answers, mortality - if unfulfilled responses influence the results, maturation - if
respondents gets outworn and answer unintentionally, and ambiguity about causal direction -
if there is lack of clarity about cause and effect. The history threat was eliminated with the use
of a control group, as we only compared relative change in attitudes and purchase intentions
between the control and manipulation group. Thus, positive or negative history regarding
Jordan toothbrush would not be an issue. With regards to the testing threat, this was not an
issue due to the researchers’ distance from respondents. Therefore, the respondents’ answers
were not in any way affected by the researchers’ thoughts or wishes. Further, the instrumental
threat was also eliminated, as the aim of this thesis is to examine the cause-effect interference.
Therefore, the questionnaire was intentionally designed with an instrument between the pre-
and post-test. The morality threat was eliminated as the questionnaire software, Qualtrics, only
presents fully completed responses in the reports. Thus, only completed responses were
imported into SPSS. The maturation threat was also limited to a minimum, as the
questionnaire last for approximately 10 minutes. However, as discussed in 6.1, the choice of
product might have been perceived as tedious. Last, the ambiguity threat was limited to a
minimum as the questionnaire contained a pre- and post-test and thus, there should be a clear
cause-effect interference. In conclusion, we believe the research has a high degree of internal
validity.
In conclusion, the statistical conclusion validity is believed to be adequate based on the
arguments for type I error not to occur, while type II error was not possible to measure. Also,
the internal validity is believed to be adequate based on content, criterion-related, and
construct validity.
86
7.3.3 External Validity
The third category, external validity, refers to whether the findings may be equally
applicable to other research settings (Saunders et al., 2012). Hence, if the results from this
study will be generalizable to other contexts (Johannessen et al., 2016). First of all, there may
be a threat to the external validity if the sample size used differ significantly from the general
population (Saunders et al., 2012). Also, Saunders et al. (2012) claims that convenience
sampling will reduce the generalization. In this thesis convenience sampling was used, since
the questionnaire was distributed through our Facebook pages. Thus, there is a risk that the
sample size differs from the general population. For instance, the sample size has an
overweight in the age range of 22-32, while the proposed target population for social media
users in Norway is between 16-54. On the other hand, the sample size did not decriminalize
with regards to gender, age or geography. After taking all the considerations regarding our
resources and a weakened external validity, convenience sampling was used. In addition,
convenience sampling is widely used by researchers in general (Conveniencesampling, 2017)
Further, a change in the setting or context, such as changes in the level of consciousness
around influencer marketing may affect the external validity (Trochim, 2006). Influencer
marketing is a relatively new phenomenon in Norway, and thus, the consciousness level
around influencer marketing as an “camouflage” ad might be relatively low. The higher the
level of consciousness around influencer marketing, the more consumers may perceive the ads
to be noise and the less likely influencer can seduce the target audience. Thus, the results
reflect the level of consciousness at the time of study.
Another threat to consider in external validity is ecological validity, which refers to the
extent the results can be generalized from one group to another (Saunders et al., 2012). In this
thesis a modified classic experiment is conducted, which according to Saunders et al. (2012)
have a higher ecological validity than laboratory experiments, since the experiment takes place
in the participant's natural context. Ideally, to have high ecological validity, there should have
been a natural experiment, conducted in a natural environment, where the researchers do not
manipulate the variables. Based on this the ecological validity should be moderate, however,
the use of a real life brand, influencers and ads, might enhance the ecological validity.
To summarize, the results will have a reduced external validation based on
convenience sampling and possible change in context. Still, this thesis will provide interesting
results for marketers in Norway at present time.
87
7.4 Ethics
All research might lead to potential ethical concerns, also in our experiment. In research,
ethics refers to the standards of behavior in relation to the subject of the study or those affected
by the study (Saunders et al., 2012). Throughout the research we made sure to act according
to the codes of ethics for academic research (De Nasjonale Forskningsetiske Komiteene,
2017). We feel confident that our research did not harm the subjects of the study, nor anyone
affected by the study. The respondents were anonymous and their participation was voluntary.
In the cover letter showed on the first page of the questionnaire, we guaranteed the respondents
their anonymity. Hopefully this anonymity allowed the respondents to feel privacy and thus
answer more honestly. In addition, as researchers we will present the findings to a full extent
and carefully provide sources for all information.
Since the ads we presented to our respondents are actual ads from the Norwegian brand
Jordan and a blog post from Kristine Ullebø, we made sure to follow Norwegian copyright
laws. Norwegian Lovdata (2017) §16 states that “The King may issue rules regarding the right
of archives, libraries, museums and educational and research institutions to make copies of
works for conservation and safety purposes and other special purposes…”. Further, there is an
exception for research and private study from copyright protected material if these criteria are
meet; (1) the purpose of the use is non-commercial research and/or private study, (2) the use
of the materials is fair, (3) the use is made by researchers or students for their own use only,
(4) researchers give credit to the copyright holder (Copyrightuser, 2017). The research in this
thesis has non-commercial incentives, with pure academic purposes. The Jordan ad were
portrayed in its original content and it was highly visible that the ad was from Jordan. Thus,
the exception from the copyright law is applicable from the use of a Jordan ad. Also, we made
sure that respondents would not be able to share or copy the ads from the questionnaire. When
it comes to the influencer ad, we contacted Kristine Ullebø and got acceptance to use her blog
post in this thesis.
In conclusion, the codes of ethics for academic research has after best effort been
withheld, both in general and in relation to the subject of the study or those affected.
7.5 Suggestion for Further Research
Influencer marketing is a highly relevant topic in the changing marketing world. The
development of new technologies, platforms, and how individuals are applying them creates
new opportunities for marketers. It is still a relatively new term, but several marketing and PR
88
companies have done research with strong results of the benefits of influencer marketing
(Keller Fay Group, 2016; Tapinfluence & Nielsen, 2016; Nielsen, 2012; Tapinfluence 2017;
Talaverna, 2015; Harrison, 2017; Patel, 2016). In our experiment we had to reject H1 saying
that influencer marketing has a positive direct effect on consumers’ purchase intentions. Also
we had to reject H3 saying that influencer marketing has a stronger positive effect on consumer
purchase intention than regular online advertising. However, these findings are based on a
relatively small sample with scarce resources. As discussed in 6.1 a replication of the
experiment with more resources might give even more valid results. Ideally we should have
cooperated with bloggers and companies in order to create a more real situation. Still, this
research was carried out to the best of its ability in terms of resources. This thus leaves room
for further research on the same field.
Influencer marketing is, even though it is relatively new, a big field with many
approaches. As mentioned, this thesis only focuses on the consumer behavior side. Thus, our
suggestions for future research will only cover this aspect. There were several choices that had
to be made when developing our research. Our research looks at how influencer marketing
affect purchase intention, but as argued for earlier, the influencer marketing platform blogs
was used. There are several other platforms that are widely used for the purpose of influencer
marketing. Their different designs and usages might therefore affect purchase intentions
differently and should be taken into consideration for further research. Amongst others, from
own experiences we perceive an increase and focus on influencer marketing on Instagram.
Another aspect that had to be taken into consideration was which product and brand to
use as a treatment. Based on earlier discussions, an idea for further research would be to use
other brands and products that might be perceived as more relevant. Also, it might be
interesting to distinguish between products and services. Replicating a similar experiment with
certain improvements and different products might give different results in which influencer
marketing will affect purchase intentions.
In section 6.2.4 we discuss that the fact that the respondents only were exposed to one
blog post. Blogs are normally build on regular readers, and readers that have chosen to follow
that specific blogger themselves. In our experiment that was not taken into consideration.
When Nielsen and Tapinfluence (2016) find the positive effects of influencer marketing, it is
not built on experimental studies as this one. A suggestion for further research is therefore to
conduct a field experiment. Depth interviews might also be a good alternative as one then are
able to uncover the respondents attitudes more thoroughly.
To conclude, a replication of the experiment with a stronger foundation and more
89
resources might give more valid results. We have lined out the weaknesses of our experiment,
which can be used to develop a new and improved one. In addition, other aspects as type of
product, brand, service or influencer platform can be perspectives to consider.
7.6 Conclusion
After looking the latest marketing trends, there was one word that especially stood out;
Influencer marketing. There has been done a relatively limited research on this field, but from
what already has been we find interesting results. Amongst others, influencer marketing seems
to create a ROI 11 times higher than traditional forms of digital marketing (Tapinfluence &
Nielsen, 2016). Our aim, however, was to look at the consumer behavior perspective and how
influencer marketing is affecting the dynamics behind purchase intentions. This was being
done by using the TRA framework, and to see how influencer marketing would affect it.
A classical experiment with a questionnaire was conducted where we compared a
treatment group exposed to influencer marketing with a control group exposed to a regular
online ad. The purpose was to see if the influencer marketing ad would affect the respondents’
attitudes. The questionnaire was designed in order to uncover the different factors in the TRA
model, as we had several hypotheses of how influencer marketing would affect the model. The
respondents were recruited through Facebook in order to reach them in a natural environment
for the topic of the experiment.
From our results we find as expected that there is an existing mediator effects for ”
attitudes towards the behavior”, and a non-existing mediator effect for ”subjective norm”
between influencer marketing and purchase intentions. More surprisingly we find that find
that influencer marketing did not have a direct effect on purchase intentions. Also, in contrast
to previous research on influencer marketing we did not find a stronger effect for influencer
marketing on purchase intentions than regular online ads.
Several explanations for the results can be given and some are related to the chosen
blogger and product. We chose to use a nondurable goods that has weak advertising elasticity
relatively to durable goods. Also, we found that most of the respondents had little relation to
the ”blog world”. From the manipulation checks we found that the control group were unsure
if they had been exposed to an advertisement in a blog, thus it might imply that the groups
were more alike than expected.
In addition to answer our research question this thesis had the purpose of shading light
onto influencer marketing and to encourage more research on the aspiring marketing strategy.
90
8. References
Ajzen, I. (1991). The theory of planned behavior. Organizational Behavior and Human
Decision Processes, 50(2), 179-211. doi:10.1016/0749-5978(91)90020-t
Ajzen, I. (2013). Theory of Planned Behaviour Questionnaire. Measurement Instrument
Database for the Social Science. doi:10.13072/midss.649
Ajzen, I., & Klobas, J. (2013). Fertility intentions. Demographic Research,
29, 203-232. doi:10.4054/demres.2013.29.8
Assmus, G., Farley, J. U., & Lehmann, D. R. (1984). How Advertising Affects Sales: Meta-
Analysis of Econometric Results. Journal of Marketing Research, 21, 65-74.
Austin, J. T., Boyle, K. A., & Lualhati, J. C. (1998). Statistical conclusion validity for
organizational science researchers: A review. Organizational Research Methods,
1(2), 164- 208.
Bagozzi, R. P., Tybout, A. M., Craig, C. S., & Sternthal, B. (1979). The Construct Validity
of the Tripartite Classification of Attitudes. Journal of Marketing Research, 16(1),
88. doi:10.2307/3150879
Bell, J. (1999) Doing Your Research Project. 3rd ed. Buckingham: Open University
Press.
Bell, J., & Waters, S. (2014). Doing your research project: A guide for first-time
researchers. Berkshire England: McGraw-Hill Education.
Belleau, B. D., Summers, T. A., Yingjiao Xu, & Pinel, R. (2007). Theory of Reasoned
Action: Purchase Intention of Young Consumers. Clothing and Textiles Research
Journal, 25(3), 244-257. doi:10.1177/0887302x07302768
Benoit, W. L. (2017). Theory of Reasoned Action. Retrieved from
http://www.cios.org/encyclopedia/persuasion/Gtheory_1reasoned.htm
Berger, J., & Keller Fay Group (2016). Research shows micro-influencers have more impact
than average consumers. Retrieved from Experticity website:
http://go2.experticity.com/rs/288-azs-731/images/experticity-
kellerfaysurveysummary_.pdf
Biagi, S. (2013). Media/impact: An introduction to mass media. Boston, MA: Wadsworth
Cengage Learning.
Biel, A.L., & Bridgwater, C.A. (1990). Attributes of likeable television commercials, Journal
of Advertising Research, 30 (3), 38-44.
91
Business Dictionary. (2017). What is word-of-mouth marketing? definition and meaning -
BusinessDictionary.com. Retrieved from
http://www.businessdictionary.com/definition/word-of-mouth.html
Brancato, G., Murgia, M., Macchia, S., Signore, M., & Simeoni, G. (2006). Handbook of
Recommended Practices for Questionnaire Development and Testing in the
European Statistical System (2004103000002). Retrieved from Italian National
Institute of Statistics, ISTAT website:
https://www.istat.it/it/files/2013/12/Handbook_questionnaire_development_2006.pdf
Breivik, E. (2015a). Research Design [Word document].
Breivik, E. (2015b). Experiments [Word document].
Brown, D., & Hayes, N. (2015). Influencer marketing: Who really influences your
customers? Amsterdam, Netherland: Elsevier/Butterworth-Heinemann.
Bryman, A., & Bell, E. (2007). Business research methods. Oxford: Oxford University
Press.
Bryman, A. & Cramer, D., 2009. Quantitative Data Analysis with SPSS 14,15 & 16: A
Guide for Social Scientists, London: Routledge.
Churchill, G., A. (1991). Marketing Research – Methodological Foundations (5th ed.).
United States of America: The Dryden Press
Churchill, G. A., & Iacobucci, D. (2005). Marketing research: Methodological foundations.
Thomson, CA: Thomson/South-Western, 2005.
Cohen, J. (1992). A power primer. Psychological Bulletin, 112(1), 155-159.
doi:10.1037//0033-2909.112.1.155
Copyrightuser. (2017). Research & private study. Retrieved from
http://copyrightuser.org/topics/research-and-private-studies/
Cronbach, L. J. (1951). Coefficient alpha and the internal structure of tests. Psychometrika,
16(3), 297-334. doi:10.1007/bf02310555
Conveniencesampling. (2017). Convenience-Sampling-vs-Random-Sampling.html.
Retrieved from http://www.conveniencesampling.net/Convenience-Sampling-vs-
Random-Sampling.html
Cook, T. D., & Cambell, D. T. (1979). Quasi-Experimentation: Design and Analysis for
Field Settings. Rand McNally, Chicago, Illinois.
Crowther, D. & Lancaster, G. (2008) “Research Methods: A Concise Introduction
to Research in Management and Business Consultancy”
Butterworth-Heinemann
92
Dahan, E. (2016, February 19). Marketing Strategy - Influencer Marketing May Be the
Antidote to Ad Blocking. Retrieved from
http://www.marketingprofs.com/opinions/2016/29369/influencer-marketing-may-be-
the-antidote-to-ad-blocking
Davis, G. & Pecar, B. (2010). Business Statistics Using Excel. New York: Oxford University
Press.
De Nasjonale Forskningsetiske Komiteene. (2016). Generelle forskningsetiske
retningslinjer. Retrieved from https://www.etikkom.no/forskningsetiske-
retningslinjer/Generelle-forskningsetiske-retningslinjer/
Dempsey, M. A. & Mitchell, A. A. (2010). The Influence of Implicit Attitudes on Choice
When Consumers Are Confronted with Conflicting Attribute Information. Journal of
Consumer Research. Vol. 37, pp. 614-625.
Dichter, E. (1966). How word-of-mouth advertising works. Harvard Business Review.
Dillman D. A., Smyth J. D., Christian L. M. (2014) Internet, phone, mail, and mixed-mode
surveys: The tailored design method. Hoboken, NJ: John Wiley & Sons, Inc.
Dogtiev, A. (2016, April 11). Ad blockers popularity boom - why is it happening? Retrieved
From http://www.mobyaffiliates.com/blog/ad-blockers-popularity-boom-why-is-it-
happening
Dudovskiy, J. (2016a). Positivism - Research methodology. Retrieved from
http://research-methodology.net/research-philosophy/positivism/
Dudovskiy, J. (2016). Causal Research (Explanatory research) - Research Methodology.
Retrieved from http://research-methodology.net/research-methodology/research-
design/conclusive-research/caual-research/
McCormick, K., Poh, A., & Salcedo, J. (2015). Spss statistics for dummies. Hoboken, NJ:
John Wiley & Sons.
Engel, J.F., Blackwell, R.D., & Miniard, P.W. (1993). Consumer Behavior (8th ed.). Fort
Worth: Dryden Press.
Fam, K. (2008). Attributes of likeable television commercials in Asia. 418-32.
Feick, Lawrence F., and Linda L. Price (1987), The market maven: A diffuser of marketplace
information, Journal of Marketing, 51, 83–97.
Field, A. (2009). Discovering Statistics Using SPSS (3rd ed.). London: SAGE Publications
Ltd
Fink, A. (2013). How to conduct surveys: A step-by-step guide (6th ed.). California: The
Langley Research Institute.
93
Fishbein, M. (1967) Attitude and the prediction of behavior. In M. Fishbein (Ed.), Readings
in attitude theory and measurement. New York: Wiley.
Fishbein, M., & Ajzen, I. (1980). Understanding attitudes and predicting social behavior.
Upper Saddle River, NJ: Prentice-Hall.
Fishbein, M., & Ajzen, I. (2005). The influence of attitudes on behaviour. The handbook of
attitudes, 173-222.
Flynn, L.R., Goldsmith, R.E. & Eastman, J.K. JAMS (1996) 24: 137.
doi:10.1177/0092070396242004
Ghosh, A. (1990). Ghosh Retail management. Chicago: The Dryden Press series in
marketing.
Gilbert, N. (2001). Researching Social Life. 2nd eds Sage Publications, London
Godey, B., Manthiou, A., Pederzoli, D., Rokka, J., Aiello, G., Donvito, R., & Singh, R.
(2016). Social media marketing efforts of luxury brands: Influence on brand equity
and consumer behavior. Journal of Business Research, 69(12), 5833-5841.
doi:10.1016/j.jbusres.2016.04.181
Hanson, W. A., & Kalyanam, K. (2004). Principles of Internet marketing. Mason, OH:
South-Western.
Harrison, K. (2017, January 9). Top 10 trends that will transform digital marketing in 2017.
Retrieved from https://www.forbes.com/sites/kateharrison/2017/01/09/top-10-trends-
that-will-transform-digital-marketing-in-2017/#7e6d507d3bf5
Haslam, S. Alexander and Craig McGarty (2004): Experimental Design and Causality in
Spcial Psychological Research, in Carol Sansome, Carolyn C. Morf and A.T. Palmer
(eds.), The SAGE Handbook of Methods in Social Psychology, Sage
Publications,inc. Thousand Oaks: California.
Hennig-Thurau, T., Gwinner, K. P., Walsh, G., & Gremler, D. D. (2004). Electronic word of
mouth via consumer-opinion platforms: What motivates consumers to articulate
themselves on the internet? Journal of Interactive Marketing, 18(1).
doi:10.1002/dir.10073
Hosein, N. Z. (2012). Measuring the Purchase Intention of Visitors to the Auto Show.
Journal of Management and Marketing Research, 9, 1-17.
Hoyer, W. D., & MacInnis, D. J. (2013). Consumer behavior (6th ed.). Australia:
South-Western Cengage Learning.
Jacquin, A. (2016, January 8). Functional brands, image brands, and experiential brand
types. Retrieved from http://www.hundredrubys.com/types-of-brands/
94
Johannessen, A., Christoffersen, L. and Tufte, P.A. (2016). Introduksjon til
samfunnsvitenskapelig metode 5rd ed., Oslo: Abstrakt forlag.
Keller, K. L. (2013). Strategic brand management: Building, measuring, and managing
brand equity. Boston: Pearson.
Kit, L., C. & P’ng, E., L., Q. (2014). The effectiveness of product placement: The influence
of product placement towards consumer behaviour of the millennial generation.
International Journal of Social Science and Humanity. Vol. 4 (2), pp. 138 – 142.
Klaassen, A. (2006, March 22). Marketers lose confidence in media advertising. Retrieved
from http://adage.com/article/media/marketers-lose-confidence-tv-
advertising/107965/
Kline, R. B. (2011). Principles and Practice of Structural Equation Modeling (3rd ed.).
London: The Guilford Press.
Kotler, P., & Armstrong, G. (2010). Principles of marketing. Upper Saddle River, NJ:
Prentice Hall.
Kozinets, R., De Valck, K., Wojnicki, A. C., & Wilner, S. J. (2010). Networked Narratives:
Understanding word-of-mouth marketing in online communities. Journal of
Marketing, 74, 71-89. doi:1547-7185
Kraft, P., Rise, J., Sutton, S., & Røysamb, E. (2005). Perceived difficulty in the theory of
planned behaviour: Perceived behavioural control or affective attitude? British
Journal of Social Psychology, 44(3), 479-496. doi:10.1348/014466604x17533
Krosnick, J. A., & Smith, W. A. (1994). Attitude strength. In V. S. Ramachandran (Ed.),
Encyclopedia of human behavior. San Diego, CA: Academic Press.
Laczniak, R. N., DeCarlo, T. E., & Ramaswami, S. N. (2001). Consumers’ Responses to
Negative Word-of-Mouth Communication: An Attribution Theory Perspective.
Journal of Consumer Psychology, 11(1), 57-73. doi:10.1207/s15327663jcp1101_5
Likert, R. (1932). "A Technique for the Measurement of Attitudes". Archives of Psychology.
140: 1–55.
Leon, J. J. (2003). Survey research: In-person, mail, telephone and web methods. Honolulu,
HI: Streamline Surveys, Inc.
Lovdata (2017). Eksemplar Fremstilling i arkiv, bibliotek og museer mv. [Internet] Available
from: https://lovdata.no/dokument/NL/lov/1961-05-12-2#KAPITTEL_1
(Downloaded 17.02.17)
95
Lutz, R., J. (1985). "Affective and Cognitive Antecedents of Attitude Toward the Ad: A
Conceptual Framework", in Psychological Processes and Advertising Effects, L.F.
Alvitt and A.A. Mitchell, (eds.), Hillsdale, NJ: Lawrence Erlbaum Associates, 45-64.
Lutz, R., J. (1991). The Role of Attitude theory in Marketing. Eds. Kassarjian, H., H. &
Robertson, T., S. In Percpectives in Consumer Behaviour. Engelewood Cliffs, NJ:
Prentice Hall, pp. 317 – 339.
MacKenzie, S.B., Lutz, R.J., & Belch, G.E. (1986). The Role of Attitude Toward the Ad as a
Mediator of Advertising Effectiveness: A Test of Competing Explanations. Journal
of Marketing Research, 23 (May) 130-143.
Madhavaram, S. & Appan, R. (2010). The Potential Implications of Web-Based Marketing
Communications for Consumers’ Implicit and Explicit Brand Attitudes: A Call for
Research. Psychology & Marketing. Vol. 27 (2), pp. 186 – 202.
Madden, M. J., Ellen, P. S., Ajzen, I. (1992). A comparison of the theory of Planned
Behavioral and the Theory of reasoned Action. Personality and Social Psychology
Bulletin, 18 (1), 3-9.
Markethub. (2016). Influencer marketing vs word-of-mouth marketing. Retrieved from
https://www.markethub.io/influencer-marketing-vs-word-of-mouth-marketing/
McCormick, K., Poh, A., & Salcedo, J. (2015). Spss statistics for dummies. Hoboken, NJ:
John Wiley & Sons.
McCracken, Grant. (1986), Culture and consumption: A theoretical account of the structure
and movement of the cultural meaning of consumer goods,” Journal of Consumer
Research, 13, 71–84.
McQuarrie, E. F., Miller, J., & Phillips, B. J. (2012). The megaphone effect: Taste and
audience in fashion blogging. Journal of consumer research, 40, 136-159.
doi:10.1086/669042
Mitchell, A.A., & Olson, J.C. (1981). Are Product a Beliefs the Only Mediator of
Advertising Effects on Brand Attitude. Journal of Marketing Research, 18 (August),
318-332.
Moen, T. (2017). Blogging i Norge beveger seg i feil retning. Retrieved from
http://thomasmoen.com/blogging-i-norge-beveger-seg-i-feil-retning/
Morwitz, V. (2014). Consumers' purchase intentions and their behavior. Foundations and
Trends® in Marketing, 7(3), 181-230. doi:10.1561/1700000036
MRS (2011). Guidelines for Questionnaire Design. [Internet] Available from:
https://www.mrs.org.uk/pdf/201127%20Questionnaire%20Design%20Guidelines.pdf
96
Myers, James H. and Thomas S. Robertson (1972), "Dimensions of Opinion Leadership,"
Journal of Marketing Research, 9 (February), 41-46.
Nielsen. (2012, October 4). Consumer trust in online, social and mobile advertising grows.
Retrieved from
http://www.nielsen.com/us/en/insights/news/2012/consumer-trust-in-online-social-
and-mobile-advertising-grows.html
Nielsen Catalina Solutions, & Tapinfluence. (2016). Sales effect study: Influencer marketing.
Retrieved from
http://pages.tapinfluence.com/hubfs/Nielsen_WhiteWave_Study/1009_-
_Nielsen_Study_Case_Study.pdf?submissionGuid=3835e616-2729-4f22-b6fe-
30e819e8c5bb
NIST. (2017). Measures of skewness and kurtosis. Retrieved from
http://www.itl.nist.gov/div898/handbook/eda/section3/eda35b.htm
Norberg, P. A., Horne, D. R., & Horne, D. A. (2007). The privacy paradox: Personal
information disclosure intentions versus behaviors. Journal of Consumer Affairs,
41(1), 100-126.
Ostrom, T. M. (1969). The relationship between the affective, behavioral, and cognitive
components of attitude. Journal of Experimental Social Psychology, 5(1), 12-30.
doi:10.1016/0022-1031(69)90003-1
Pallant, J. (2005). SPSS SURVIVAL MANUAL A step by step guide to data analysis using
SPSS for Windows (Version 12). Australia: Allen & Unwin.
Patel, D. (2016, December 6). Top 8 marketing trends that will define 2017. Retrieved from
https://www.entrepreneur.com/article/284525
Perdue, B. C., & Summers, J. O. (1986). Checking the Success of Manipulations in
Marketing Experiments. Journal of Marketing Research, 23(4), 317.
doi:10.2307/3151807
Petty, R.E., Unnava, H.R., & Strathman A.J. (1991) Theories of attitude change. in eds.
Thomas robertson and Harold Kassarjina, Handbook of consumer behviour.
Engelwood Cliffs, N.J,: Prentince-Hall, pp. 241-280
Petty, R. E., Tormala, Z. L., Briñol, P., & Jarvis, W. B. (2006). Implicit ambivalence from
attitude change: An exploration of the PAST model. Journal of Personality and
Social Psychology, 90(1), 21-41. doi:10.1037/0022-3514.90.1.21
Phillips, D. L., & Clancy, K. J. (1972). Some Effects of "Social Desirability" in Survey
Studies. American Journal of Sociology, 77(5), 921-940. doi:10.1086/225231
97
Priester, J., R., Nayakankuppam, D., Fleming, M., A., & Godek, J. (2004). The A2SC2
Model: The Influence of Attitudes and Attitude Strength on Consideration and
Choice. Journal of Consumer Research, Vol. 30 (4), pp. 574 – 587.
Raubenheimer, J. (2004). An Item Selection Procedure to Maximise Scale Reliability and
Validity. Journal of Industrial Psychology. Vol. 30 (4), pp. 59 – 64.
Richins, M. L., & Root-Shaffer, T. (1988). The Role of Involvement and Opinion
Leadership in Consumer Word-of-Mouth: An Implicit Model Made Explicit. In
Advances in Consumer Research, 15.
Rogers, Everett M. and David G. Cartano. 1962. “Methods of Measuring Opinion
Leadership. ”Public Opinion Quarterly 26 (Fall): 435–441.
Rossiter, J., R. (2002). The C-OAR-SE procedure for scale development in marketing.
International Journal of Research in Marketing. Vol. 19 (4), pp. 305 – 335.
Russell, H. I., & Baldinger, A. L. (1991). The ARF Copi Research Validity Project. Journal
of Adverstising Research: April - May, 11-32.
Pallant, J. (2005). SPSS SURVIVAL MANUAL A step by step guide to data analysis using
SPSS for Windows (Version 12). Australia: Allen & Unwin.
Prestwich, A., Perugini, M., & Hurling, R. (2008). Goal desires moderate intention -
behaviour relations. British Journal of Social Psychology, 47(1), 49-71.
doi:10.1348/014466607x218221
Saunders, M. N., Lewis, P., Thornhill, A., & Pearson Education. (2012). Research methods
for business students. Harlow [etc.: Pearson.
Schwartz, S. H. (2006). Value Orientations: Measurement, Antecedents and Consequences
Across Nations. Measuring Attitudes Cross-Nationally, 169-203.
doi:10.4135/9781849209458.n9
Sethuraman, R., Tellis, G. J., & Briesch, R. A. (2011). How Well Does Advertising Work?
Generalizations from Meta-Analysis of Brand Advertising Elasticities. Journal of
Marketing Research, 48(3), 457-471. doi:10.1509/jmkr.48.3.457
Shah, H., Aziz, A., Jaffari, A. R., Waris, S., Ejaz, W., Fatima, M. and Sherazi., K.(2012),
The Impact of Brands on Consumer Purchase Intentions, Asian Journal of Business
Management 4(2): 105-110
Sheeran, P. 2002. Intention—Behavior relations: A conceptual and empirical review.
European review of social psychology (12:1), pp. 1-36.
Shimp, T. A. (1981). Attitude toward the AD as a Mediator of Consumer Brand Choice.
Journal of Advertising, 10(2), 9-48. doi:10.1080/00913367.1981.10672756
98
Smith, P. R., & Taylor, J. (2004). Marketing communications: An integrated approach.
London: Kogan Page.
Sosialkommunikasjon. (2017). Brukertallene i sosiale medier. Retrieved from
http://sosialkommunikasjon.no/brukertallene-i-sosiale-medier/
Spears, N., & Singh, S. N. (2004). Measuring Attitude toward the Brand and Purchase
Intentions. Journal of Current Issues & Research in Advertising, 26(2), 53-66.
doi:10.1080/10641734.2004.10505164
SSB. (2017, June 1). Befolkning - SSB. Retrieved from
https://www.ssb.no/befolkning/nokkeltall/befolkning
Sundaram, D.S., Mitra, K., & Webster, C. (1998). Word- of-Mouth Communications: A
Motivational Analysis. Advances in Consumer Research, 25, 527–531.
Surbhi, S. (2016, May 23). Difference between one way and two way ANOVA.
Retrieved From http://keydifferences.com/difference-between-one-way-and-two-
way-anova.html
Surveymonkey. (2015). Sample Size Calculator. Retrieved from
https://www.surveymonkey.com/mp/sample-size-calculator/
Statista. (2014). Average age of social media users. Retrieved from
https://www.statista.com/statistics/274829/age-distribution-of-active-social-media-
users-worldwide-by-platform/
StatisticsSoulutions. (2017). Conduct and Interpret a One-Sample T-Test. Retrieved from
http://www.statisticssolutions.com/conduct-interpret-one-sample-t-test/
Stevens, J. P. (2009). Applied multivariate statistics for the social sciences (Vol. 5th Editon).
New York: Routledge, Taylor & Francis group.
Tapinfluence. (2017a). What is influencer marketing? Retrieved from
https://www.tapinfluence.com/blog-what-is-influencer-marketing/
Tapinfluence. (2017b, February 16). Do micro-influencers make better brand ambassadors
than celebrities? [Web log post]. Retrieved from
https://www.tapinfluence.com/micro-Influencers-make-better-brand-ambassadors-
celebrities
Talaverna, M. (2015). 10 Reasons Why Influencer Marketing is the Next Big Thing.
Retrieved from http://www.adweek.com/digital/10-reasons-why-influencer-
marketing- is-the-next-big-thing/
Trochim, W. M. (2006, October 20). Research methods knowledge base. Retrieved from
http://www.socialresearchmethods.net/kb/index.php
99
Tomoson. (2015). influencer marketing study. Retrieved from
http://blog.tomoson.com/influencer-marketing-study/
University of Michigan. (2010). Confounding. Retrieved from
https://practice.sph.umich.edu/micphp/epicentral/confounding.php
University of Virginia Library. (2017). Using and interpreting cronbach’s alpha. Retrieved
http://data.library.virginia.edu/using-and-interpreting-cronbachs-alpha/
Vakratsas, D., & Ambler, T. (1999). How Adverstising Works: What Do We Really Know?
Journal of Marketing, 63, 26-43.
Vargo, Stephen L. and Robert F. Lusch (2004), “Evolving to a New Dominant Logic for
Marketing,” Journal of Marketing, 68 (January), 1–17.
Walker, D., & Dubitsky, T.M. (1994). Why liking matters. Journal of Advertising Research,
No.May/June, 9-18.
Wang, M., Jones, V., Brown, R., & Wang, M. (2016). The new advertising: Branding
and consumer relationships in the data-driven social media era. Santa Barbara:
ABC-CLIO.
Weijters, B., Cabooter, E., & Schillewaert, N. (2010). The effect of rating scale format on
response styles: The number of response categories and response category labels.
International Journal of Research in Marketing, 27(3), 236–247.
Weinberg, S. L., & Abramowitz, S. K. (2008). Statistics using SPSS: An integrative
approach (Vol. Second edition). Cambridge, NY, USA: Cambridge University Press.
Wind, Y., & Learner, D. (1979). On Measurement of Purchase Data: Surveys vs Purchase
Diaries. Journal of Marketing Research, 16, 39-47.
Wilson, T. D., Lindsey, S., & Schooler, T. Y. (2000). A model of dual attitudes.
Psychological Review, 107(1), 101-126. doi:10.1037/0033-295x.107.1.101
WOMMA. (2016, April 28). Research Shows Micro-Influencers Are Marketing’s Biggest
Opportunity - WOMMA. Retrieved from https://womma.org/research-shows-micro-
influencers-marketings-biggest-opportunity/
You, Z., Zhang, X., & Koyama, S. (2013). Informational vs. Emotional Appeals of Logo
Design in Influencing Purchase Intentions for Plant-factory-produced Vegetables.
International Journal of Advances in Psychology, 2(4).
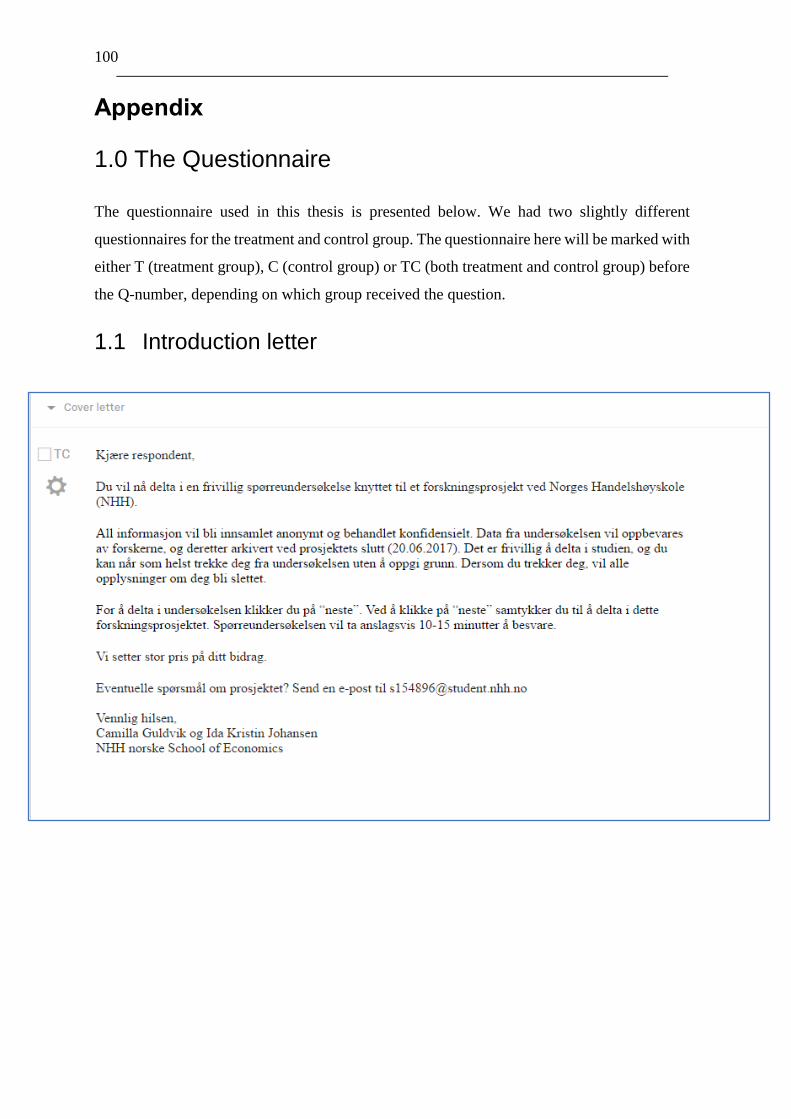
100
Appendix
1.0 The Questionnaire
The questionnaire used in this thesis is presented below. We had two slightly different
questionnaires for the treatment and control group. The questionnaire here will be marked with
either T (treatment group), C (control group) or TC (both treatment and control group) before
the Q-number, depending on which group received the question.
1.1 Introduction letter
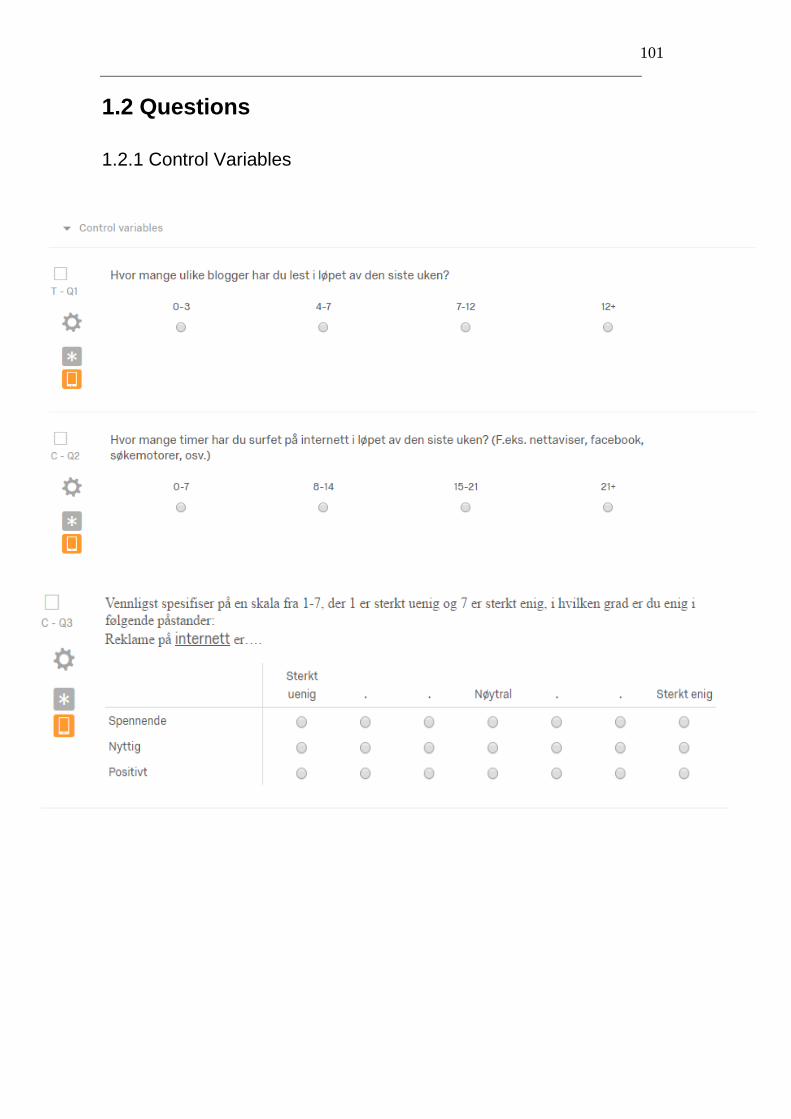
101
1.2 Questions
1.2.1 Control Variables
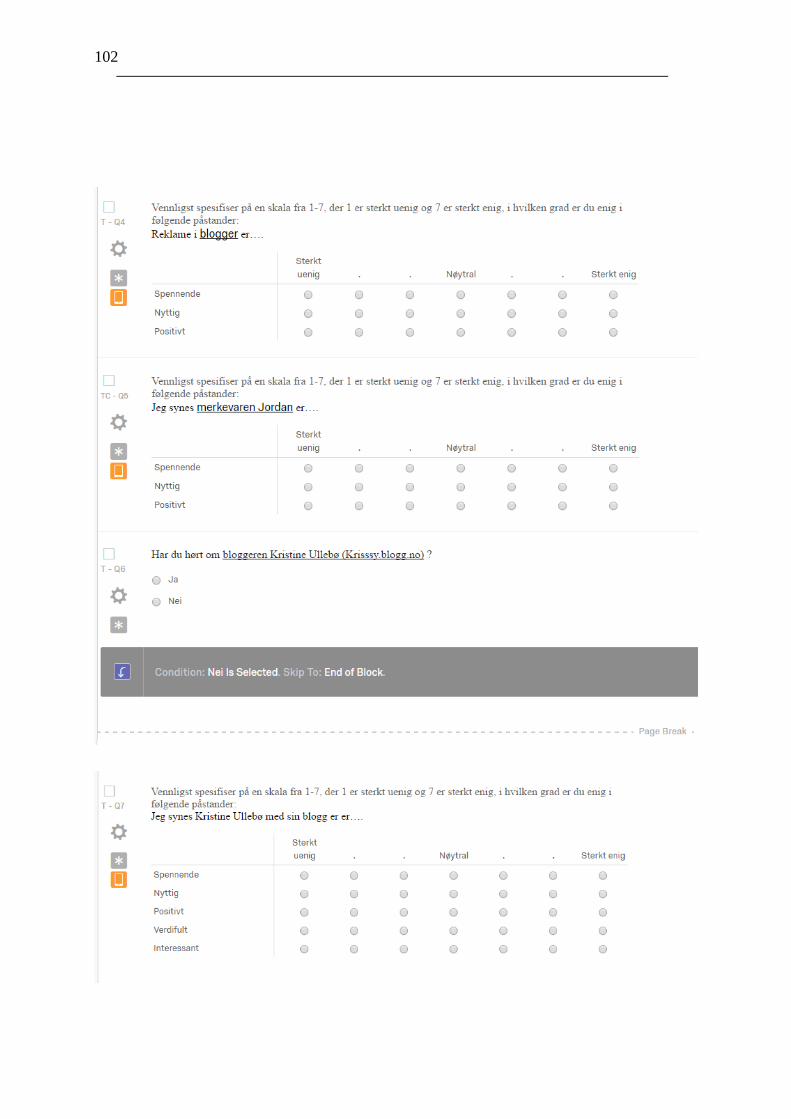
102
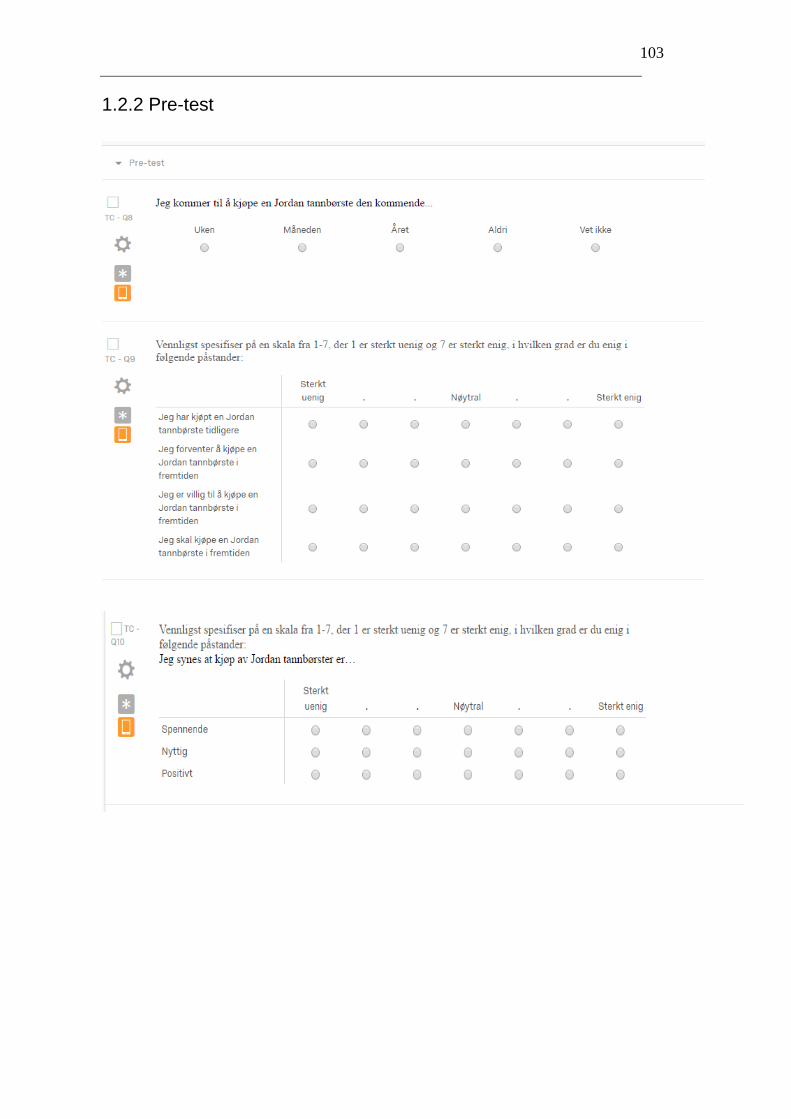
103
1.2.2 Pre-test
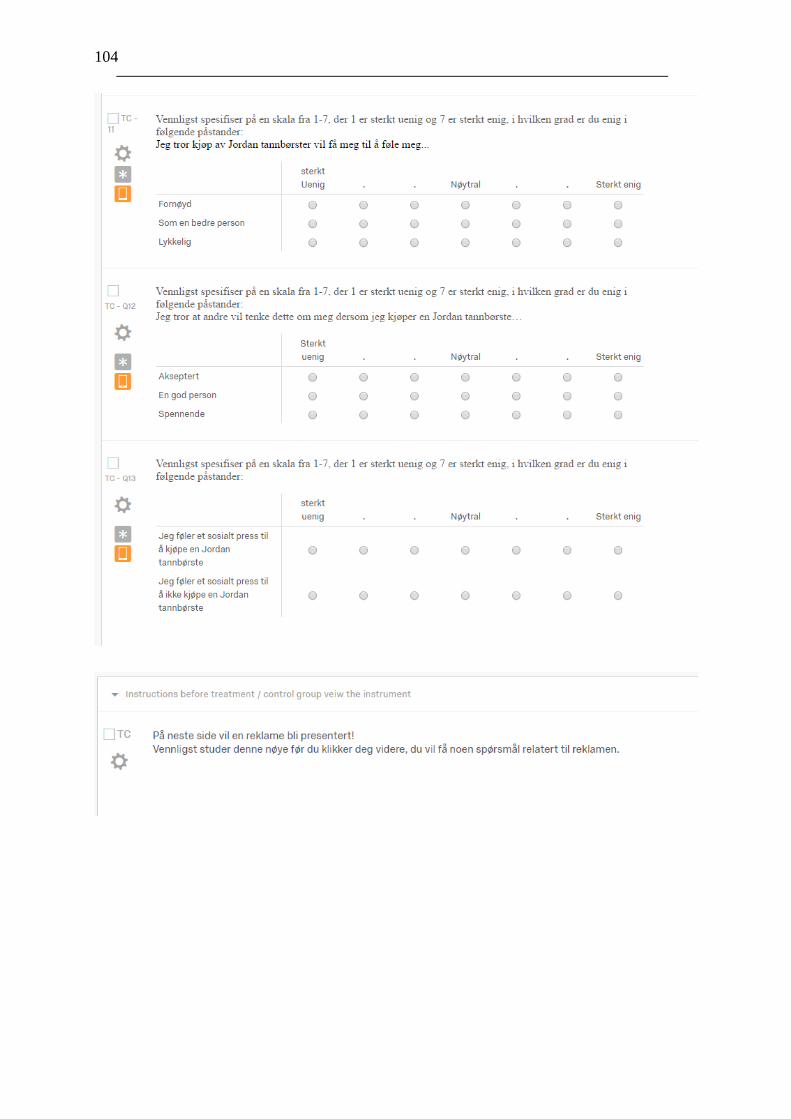
104
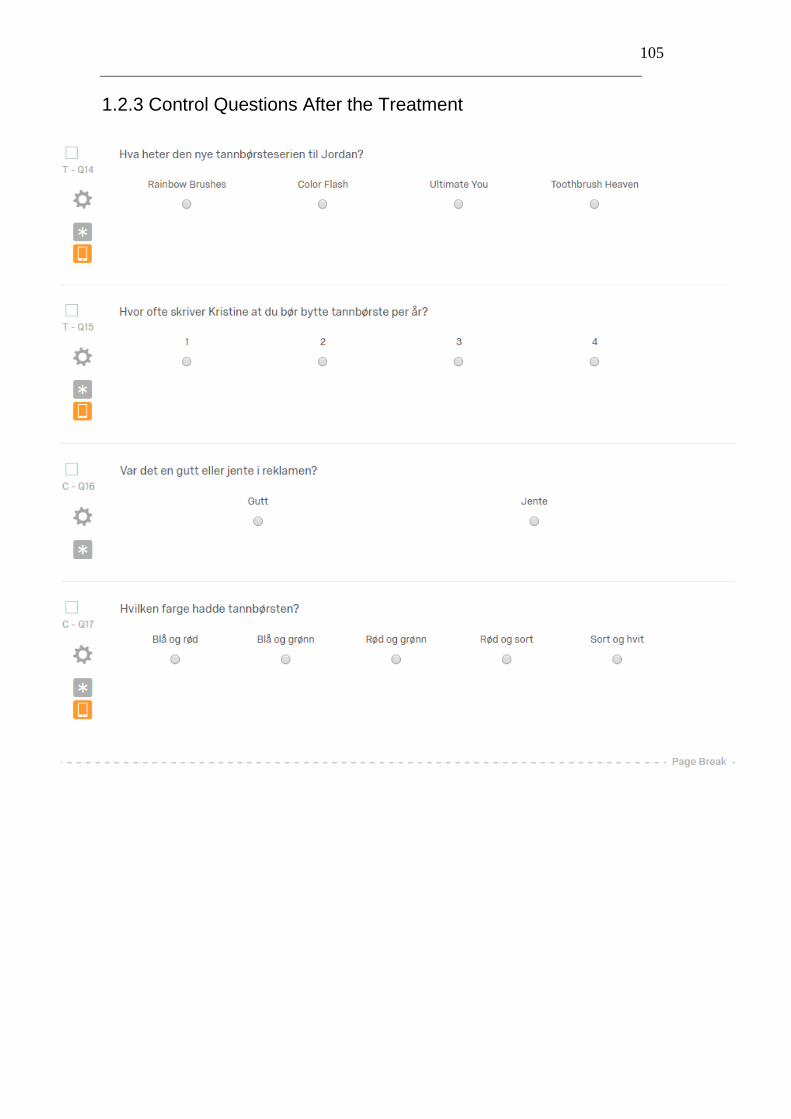
105
1.2.3 Control Questions After the Treatment
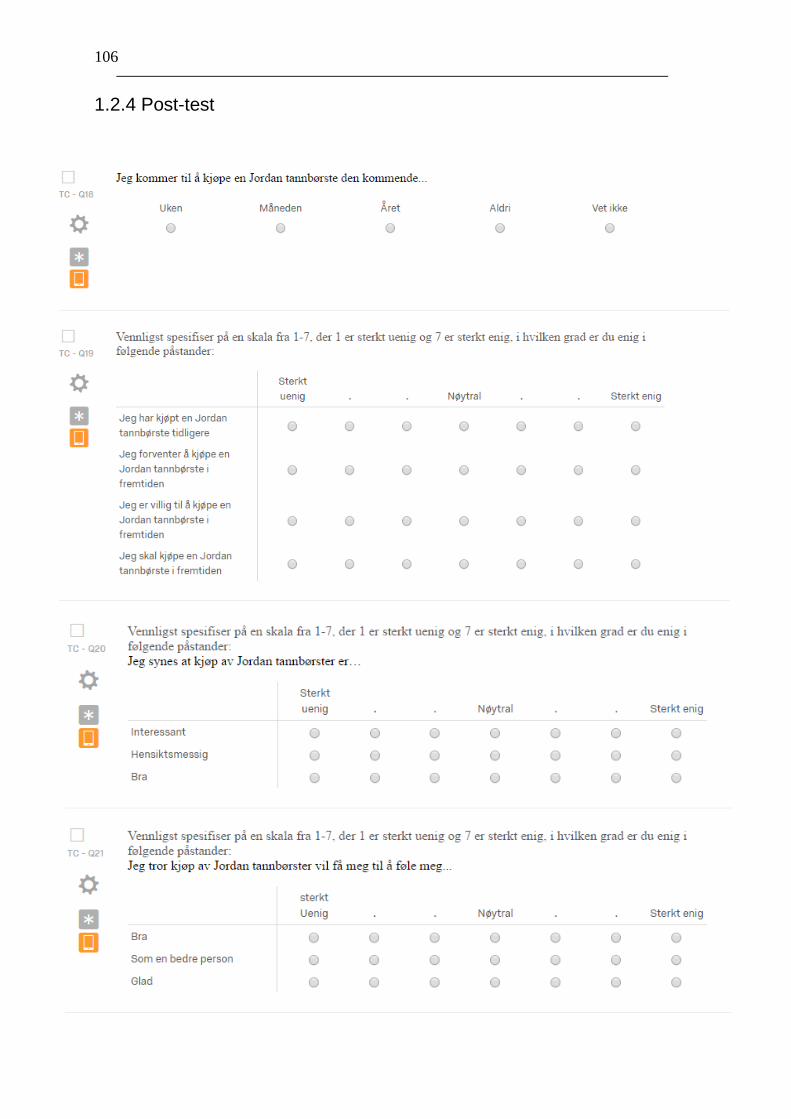
106
1.2.4 Post-test
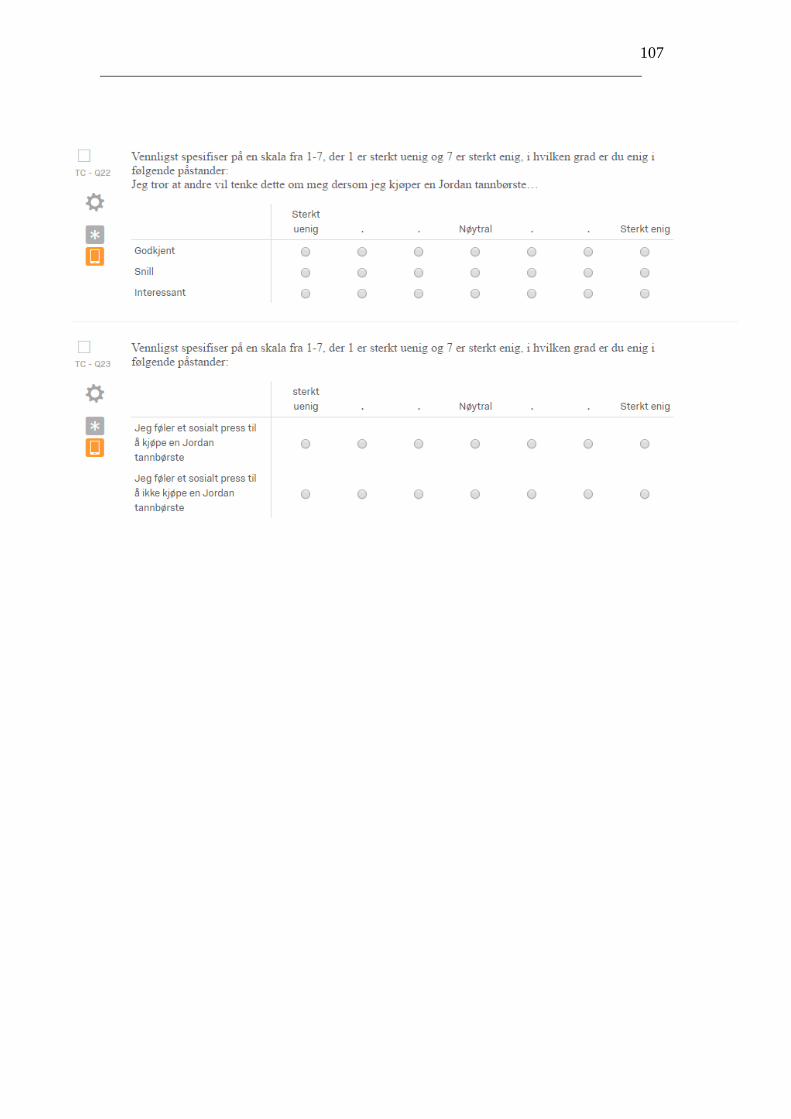
107

108
1.2.5 Attitude Strength
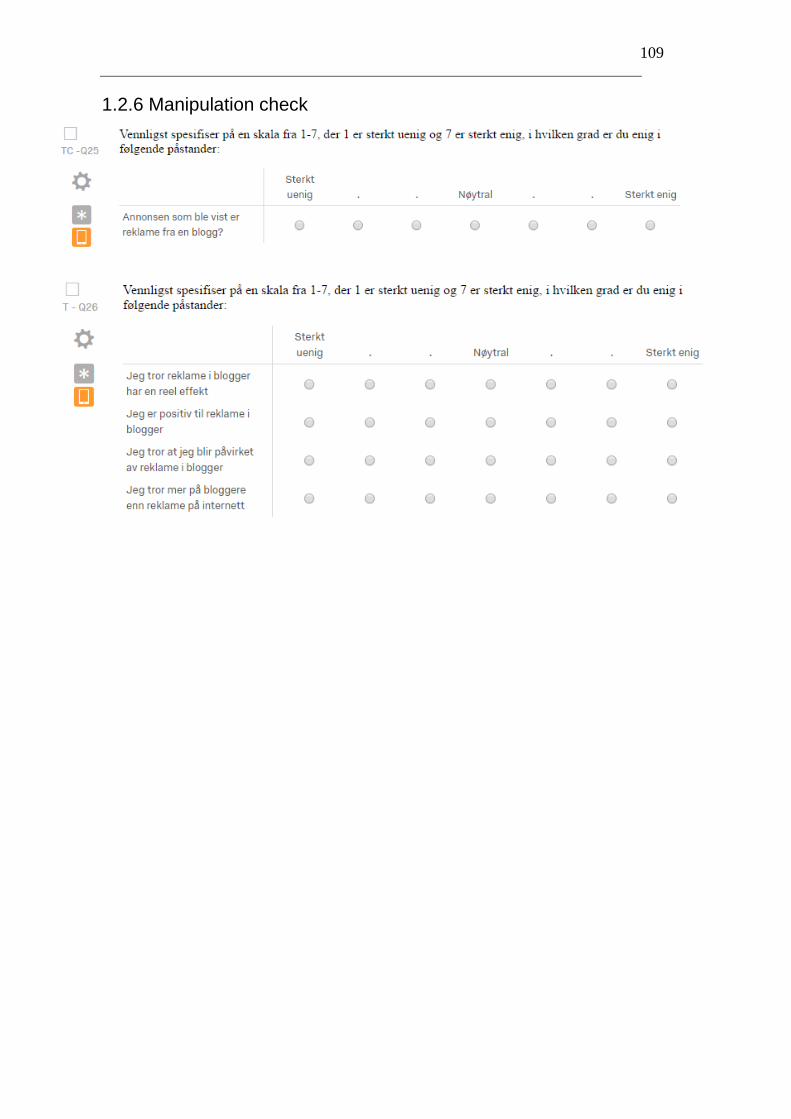
109
1.2.6 Manipulation check
110
1.2.7 Background Information

111
1.3 Treatment
1.3.1 Treatment Group

112

113
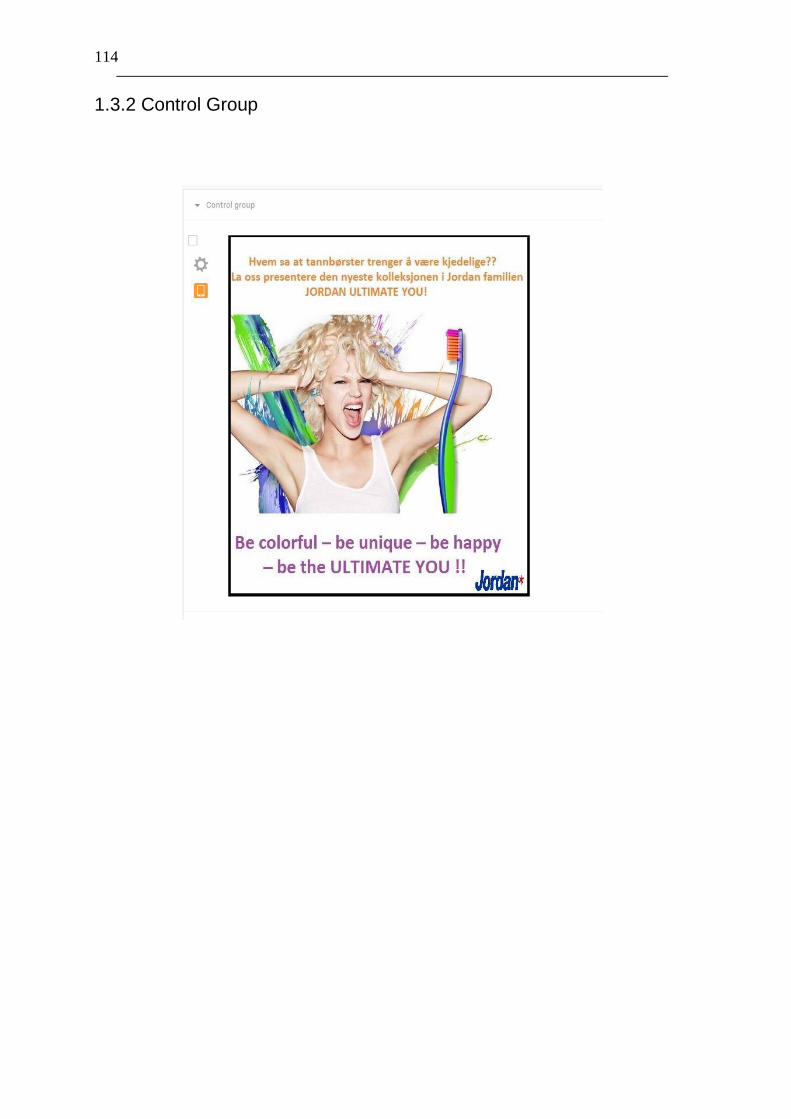
114
1.3.2 Control Group
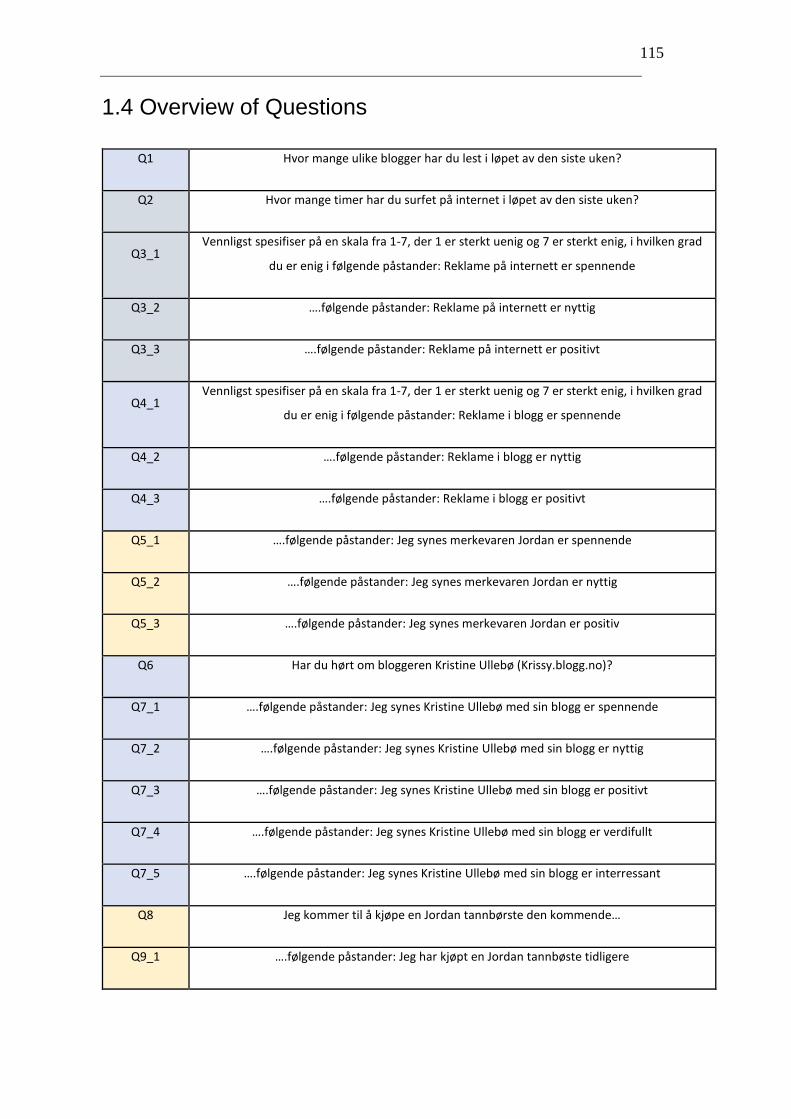
115
1.4 Overview of Questions
Q1 Hvor mange ulike blogger har du lest i løpet av den siste uken?
Q2 Hvor mange timer har du surfet på internet i løpet av den siste uken?
Q3_1 Vennligst spesifiser på en skala fra 1-7, der 1 er sterkt uenig og 7 er sterkt enig, i hvilken grad
du er enig i følgende påstander: Reklame på internett er spennende
Q3_2 ….følgende påstander: Reklame på internett er nyttig
Q3_3 ….følgende påstander: Reklame på internett er positivt
Q4_1 Vennligst spesifiser på en skala fra 1-7, der 1 er sterkt uenig og 7 er sterkt enig, i hvilken grad
du er enig i følgende påstander: Reklame i blogg er spennende
Q4_2 ….følgende påstander: Reklame i blogg er nyttig
Q4_3 ….følgende påstander: Reklame i blogg er positivt
Q5_1 ….følgende påstander: Jeg synes merkevaren Jordan er spennende
Q5_2 ….følgende påstander: Jeg synes merkevaren Jordan er nyttig
Q5_3 ….følgende påstander: Jeg synes merkevaren Jordan er positiv
Q6 Har du hørt om bloggeren Kristine Ullebø (Krissy.blogg.no)?
Q7_1 ….følgende påstander: Jeg synes Kristine Ullebø med sin blogg er spennende
Q7_2 ….følgende påstander: Jeg synes Kristine Ullebø med sin blogg er nyttig
Q7_3 ….følgende påstander: Jeg synes Kristine Ullebø med sin blogg er positivt
Q7_4 ….følgende påstander: Jeg synes Kristine Ullebø med sin blogg er verdifullt
Q7_5 ….følgende påstander: Jeg synes Kristine Ullebø med sin blogg er interressant
Q8 Jeg kommer til å kjøpe en Jordan tannbørste den kommende…
Q9_1 ….følgende påstander: Jeg har kjøpt en Jordan tannbøste tidligere
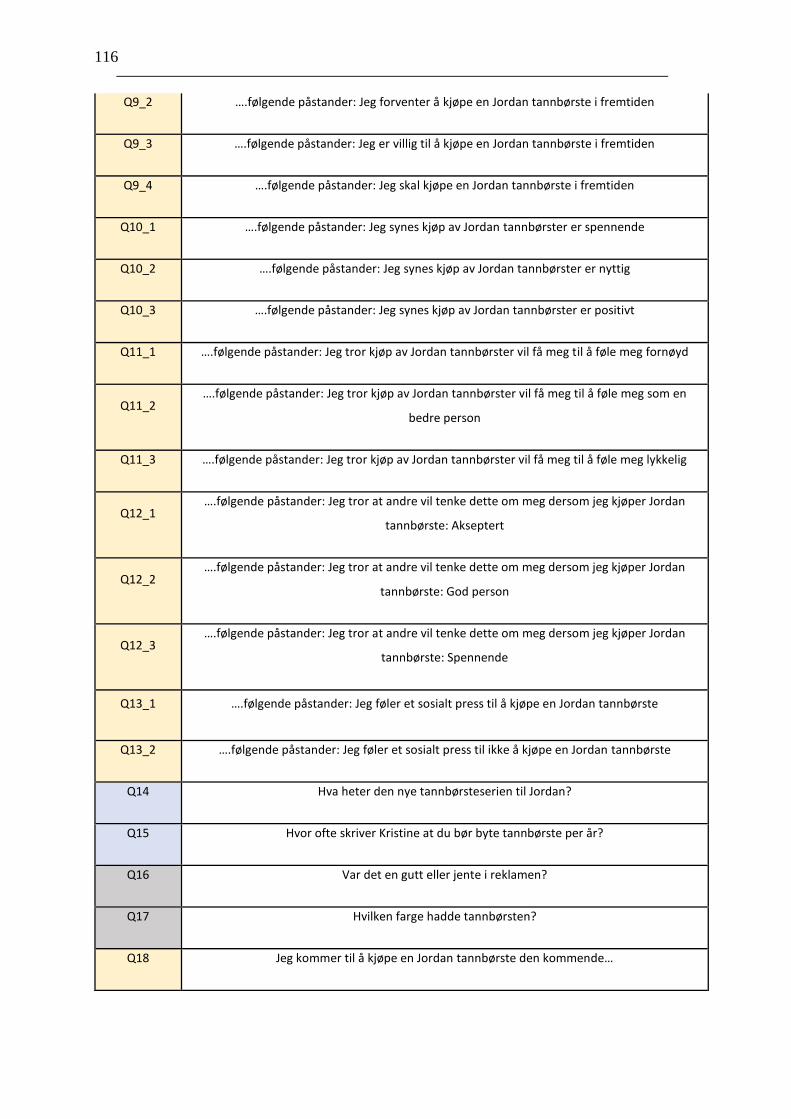
116
Q9_2 ….følgende påstander: Jeg forventer å kjøpe en Jordan tannbørste i fremtiden
Q9_3 ….følgende påstander: Jeg er villig til å kjøpe en Jordan tannbørste i fremtiden
Q9_4 ….følgende påstander: Jeg skal kjøpe en Jordan tannbørste i fremtiden
Q10_1 ….følgende påstander: Jeg synes kjøp av Jordan tannbørster er spennende
Q10_2 ….følgende påstander: Jeg synes kjøp av Jordan tannbørster er nyttig
Q10_3 ….følgende påstander: Jeg synes kjøp av Jordan tannbørster er positivt
Q11_1 ….følgende påstander: Jeg tror kjøp av Jordan tannbørster vil få meg til å føle meg fornøyd
Q11_2 ….følgende påstander: Jeg tror kjøp av Jordan tannbørster vil få meg til å føle meg som en
bedre person
Q11_3 ….følgende påstander: Jeg tror kjøp av Jordan tannbørster vil få meg til å føle meg lykkelig
Q12_1 ….følgende påstander: Jeg tror at andre vil tenke dette om meg dersom jeg kjøper Jordan
tannbørste: Akseptert
Q12_2 ….følgende påstander: Jeg tror at andre vil tenke dette om meg dersom jeg kjøper Jordan
tannbørste: God person
Q12_3 ….følgende påstander: Jeg tror at andre vil tenke dette om meg dersom jeg kjøper Jordan
tannbørste: Spennende
Q13_1 ….følgende påstander: Jeg føler et sosialt press til å kjøpe en Jordan tannbørste
Q13_2 ….følgende påstander: Jeg føler et sosialt press til ikke å kjøpe en Jordan tannbørste
Q14 Hva heter den nye tannbørsteserien til Jordan?
Q15 Hvor ofte skriver Kristine at du bør byte tannbørste per år?
Q16 Var det en gutt eller jente i reklamen?
Q17 Hvilken farge hadde tannbørsten?
Q18 Jeg kommer til å kjøpe en Jordan tannbørste den kommende…
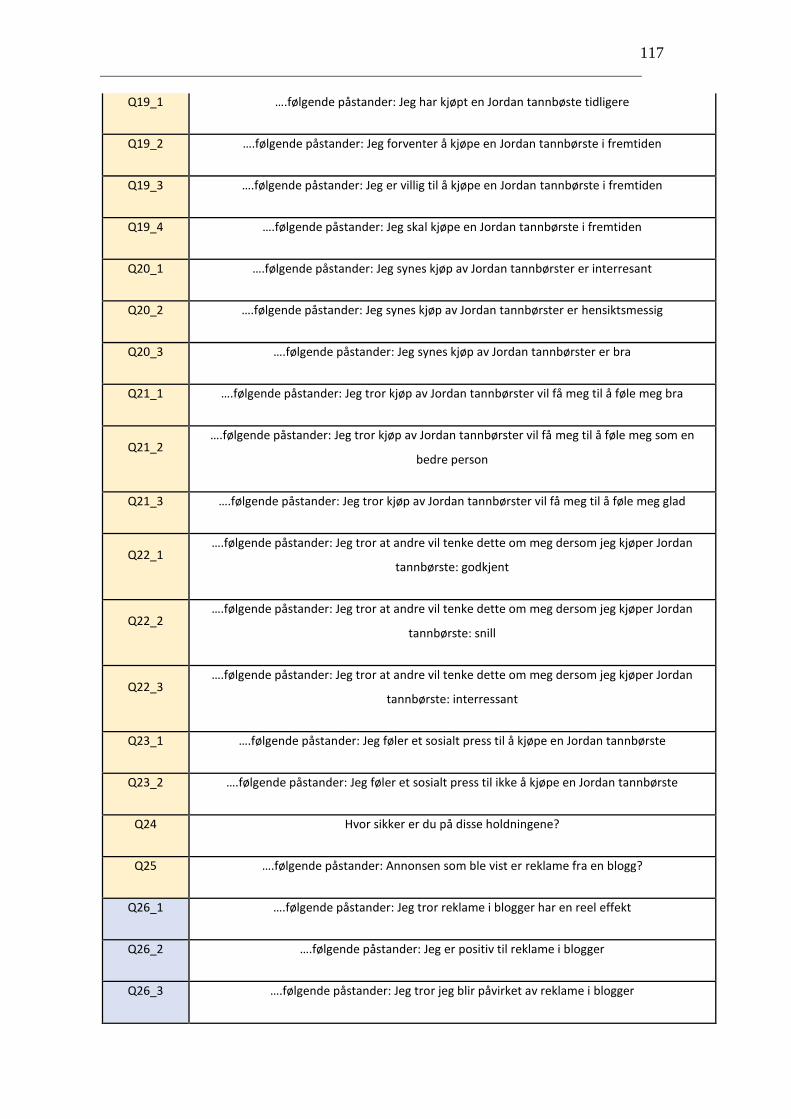
117
Q19_1 ….følgende påstander: Jeg har kjøpt en Jordan tannbøste tidligere
Q19_2 ….følgende påstander: Jeg forventer å kjøpe en Jordan tannbørste i fremtiden
Q19_3 ….følgende påstander: Jeg er villig til å kjøpe en Jordan tannbørste i fremtiden
Q19_4 ….følgende påstander: Jeg skal kjøpe en Jordan tannbørste i fremtiden
Q20_1 ….følgende påstander: Jeg synes kjøp av Jordan tannbørster er interresant
Q20_2 ….følgende påstander: Jeg synes kjøp av Jordan tannbørster er hensiktsmessig
Q20_3 ….følgende påstander: Jeg synes kjøp av Jordan tannbørster er bra
Q21_1 ….følgende påstander: Jeg tror kjøp av Jordan tannbørster vil få meg til å føle meg bra
Q21_2 ….følgende påstander: Jeg tror kjøp av Jordan tannbørster vil få meg til å føle meg som en
bedre person
Q21_3 ….følgende påstander: Jeg tror kjøp av Jordan tannbørster vil få meg til å føle meg glad
Q22_1 ….følgende påstander: Jeg tror at andre vil tenke dette om meg dersom jeg kjøper Jordan
tannbørste: godkjent
Q22_2 ….følgende påstander: Jeg tror at andre vil tenke dette om meg dersom jeg kjøper Jordan
tannbørste: snill
Q22_3 ….følgende påstander: Jeg tror at andre vil tenke dette om meg dersom jeg kjøper Jordan
tannbørste: interressant
Q23_1 ….følgende påstander: Jeg føler et sosialt press til å kjøpe en Jordan tannbørste
Q23_2 ….følgende påstander: Jeg føler et sosialt press til ikke å kjøpe en Jordan tannbørste
Q24 Hvor sikker er du på disse holdningene?
Q25 ….følgende påstander: Annonsen som ble vist er reklame fra en blogg?
Q26_1 ….følgende påstander: Jeg tror reklame i blogger har en reel effekt
Q26_2 ….følgende påstander: Jeg er positiv til reklame i blogger
Q26_3 ….følgende påstander: Jeg tror jeg blir påvirket av reklame i blogger

118
Q26_4 ….følgende påstander: Jeg tror mer på bloggere enn vanlig reklame
Q27 Vennligst oppgi kjønn
Q28 Vennligst oppgi alder
Blue = Treatment group, Gray = Control group, Yellow = similar for both groups
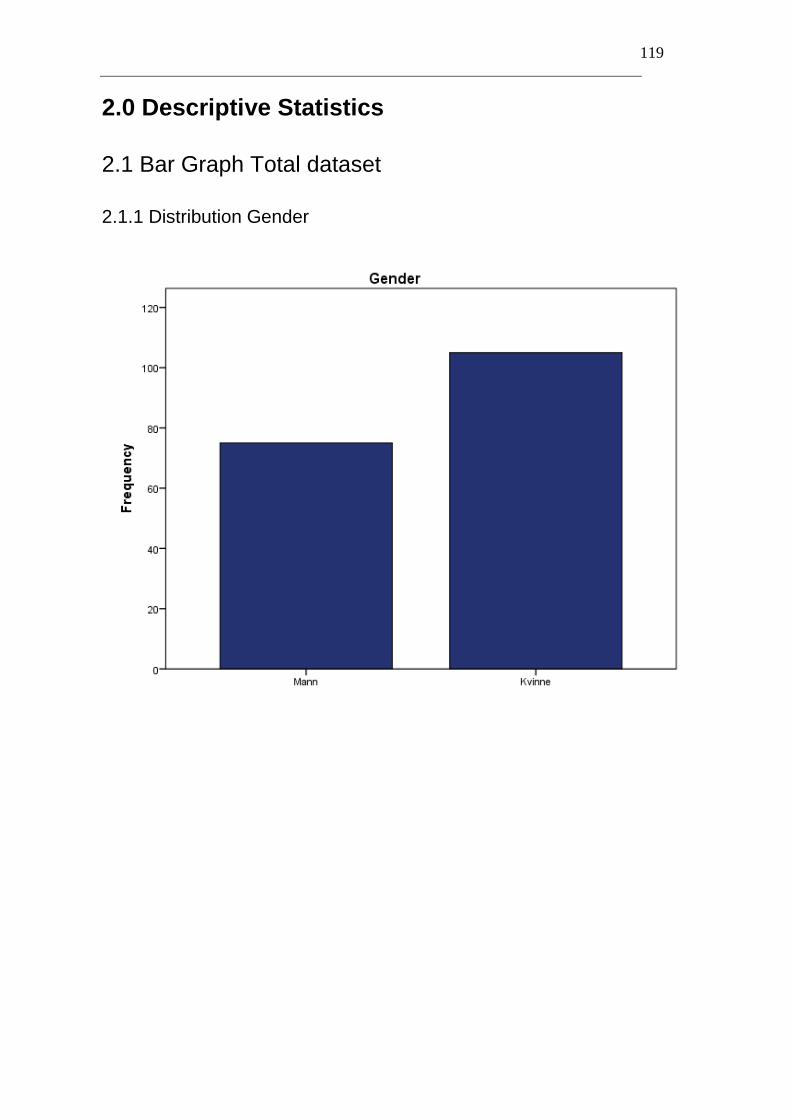
119
2.0 Descriptive Statistics
2.1 Bar Graph Total dataset
2.1.1 Distribution Gender
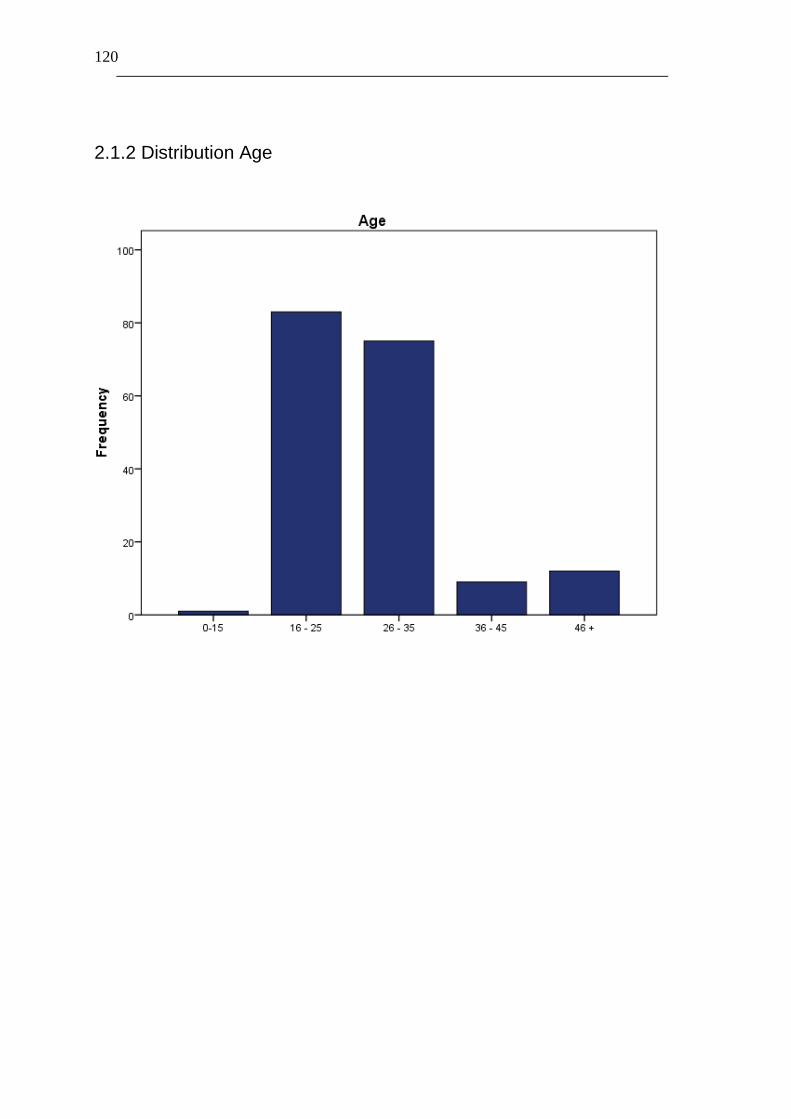
120
2.1.2 Distribution Age
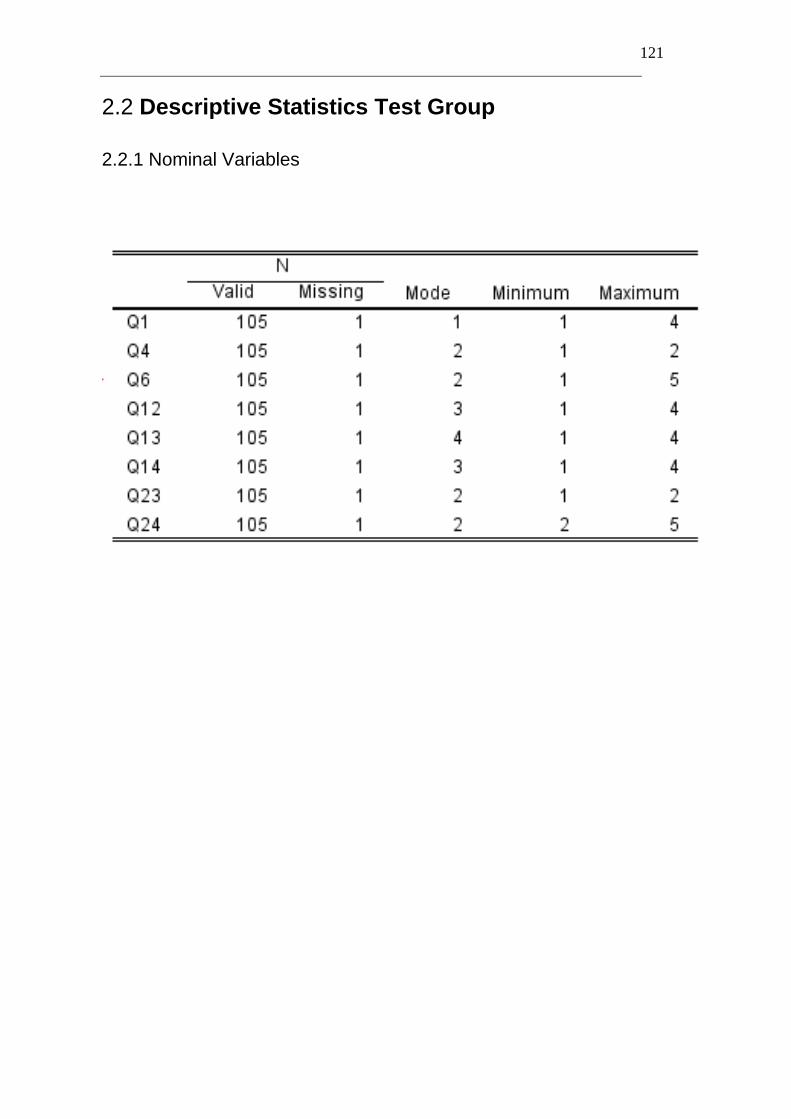
121
2.2 Descriptive Statistics Test Group
2.2.1 Nominal Variables
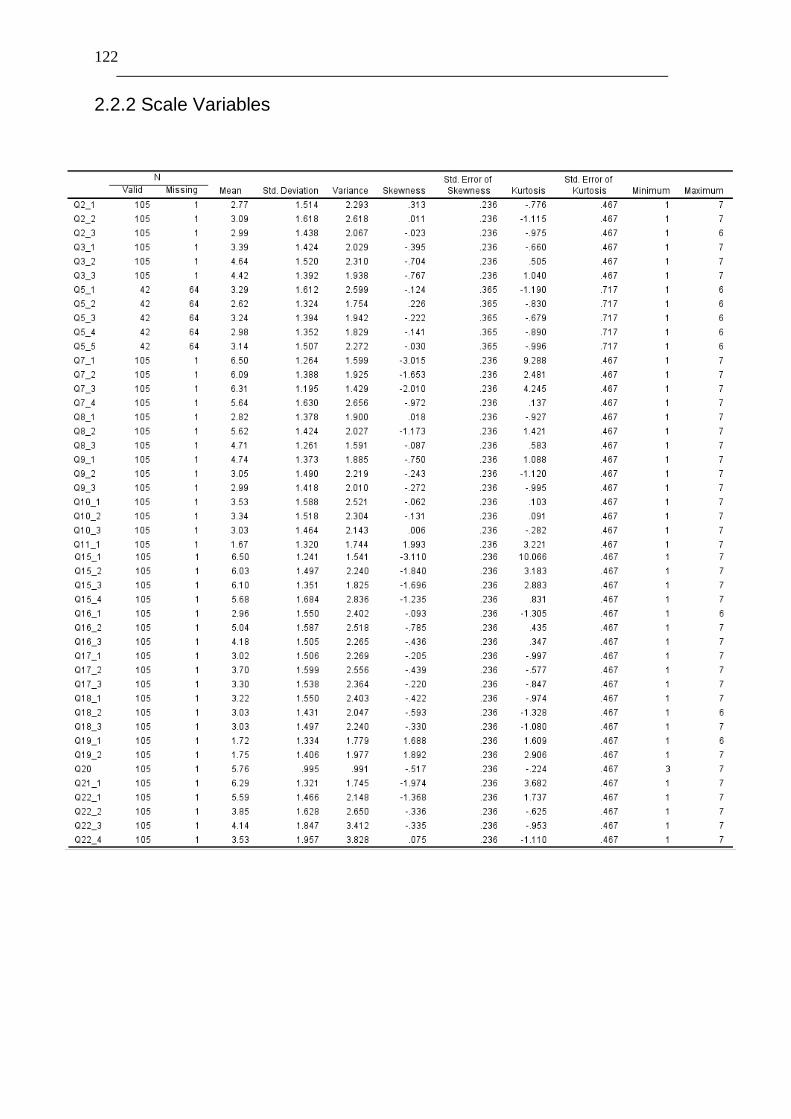
122
2.2.2 Scale Variables
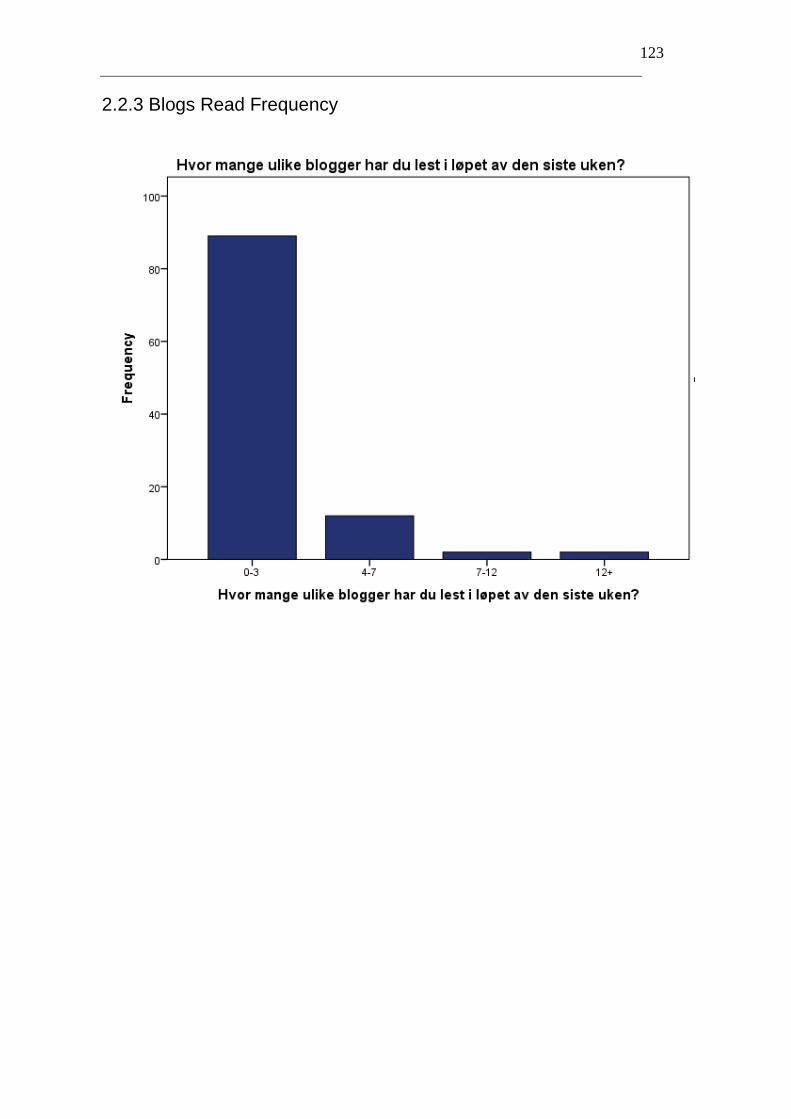
123
2.2.3 Blogs Read Frequency
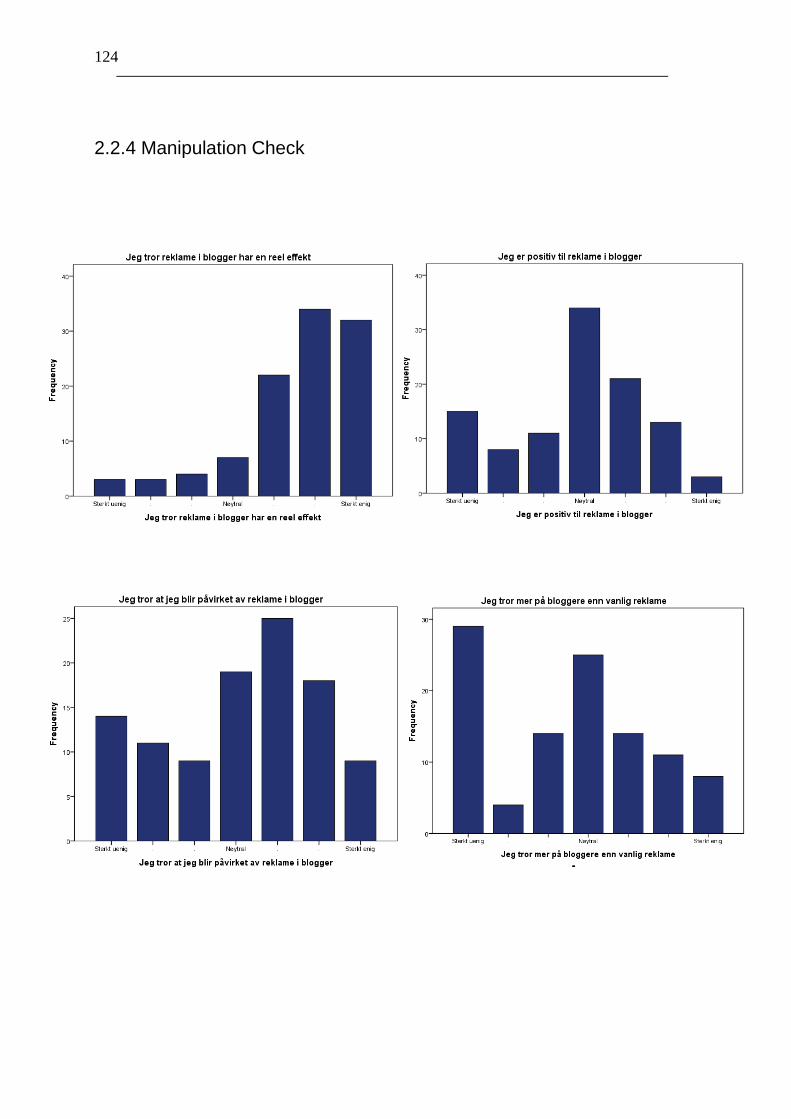
124
2.2.4 Manipulation Check
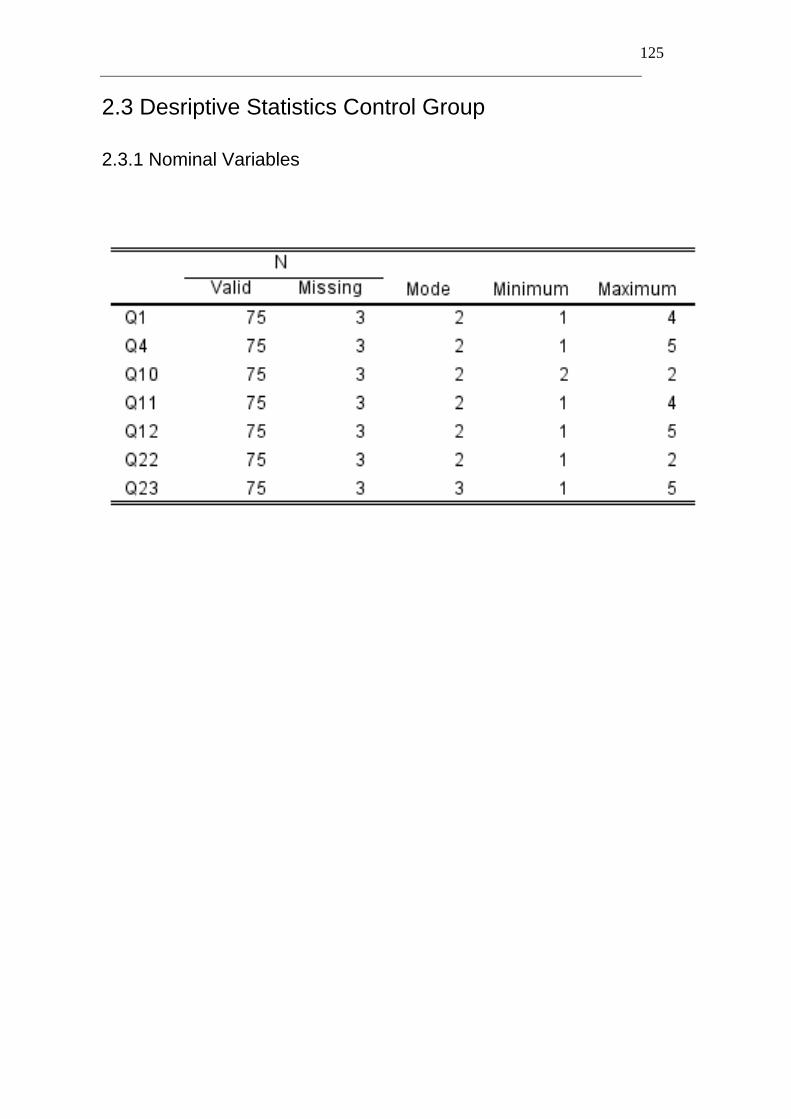
125
2.3 Desriptive Statistics Control Group
2.3.1 Nominal Variables
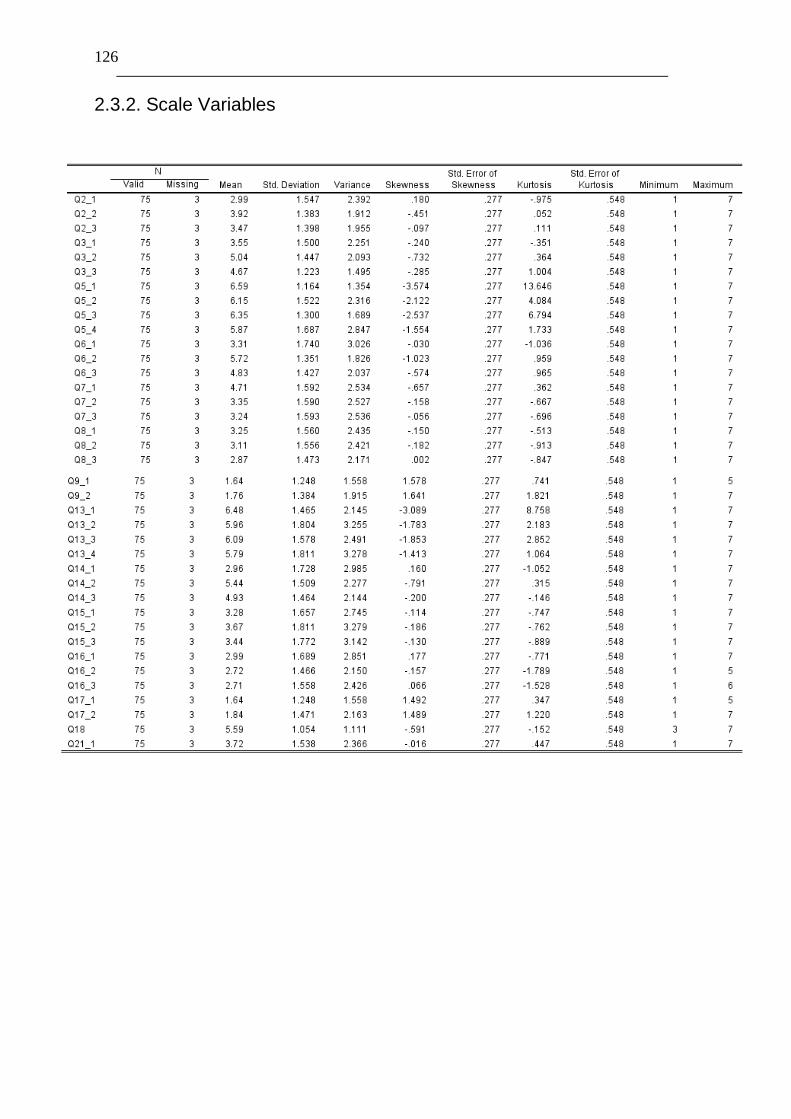
126
2.3.2. Scale Variables
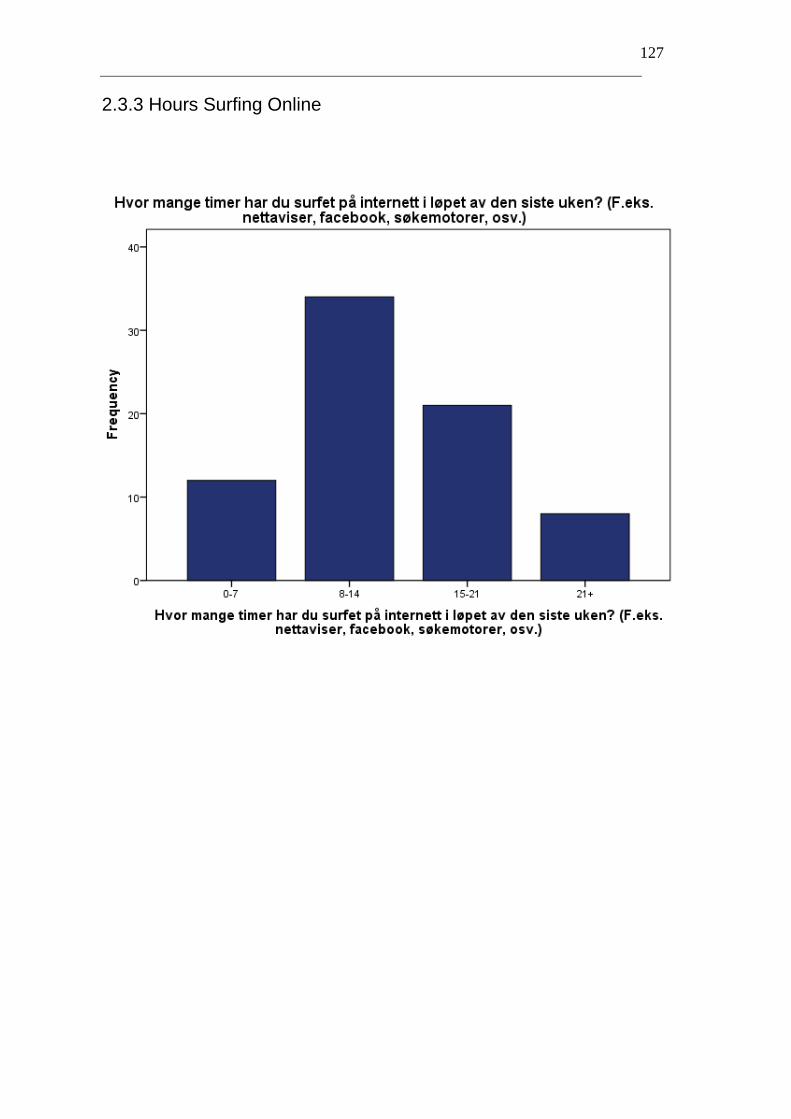
127
2.3.3 Hours Surfing Online
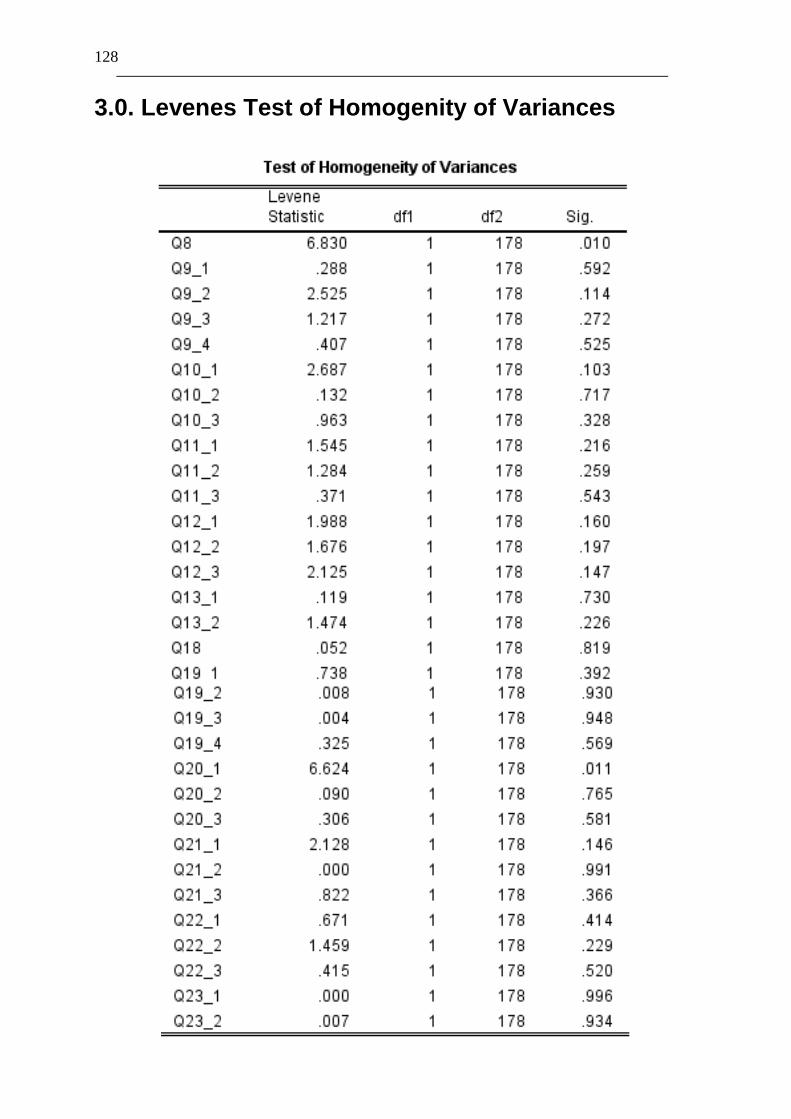
128
3.0. Levenes Test of Homogenity of Variances
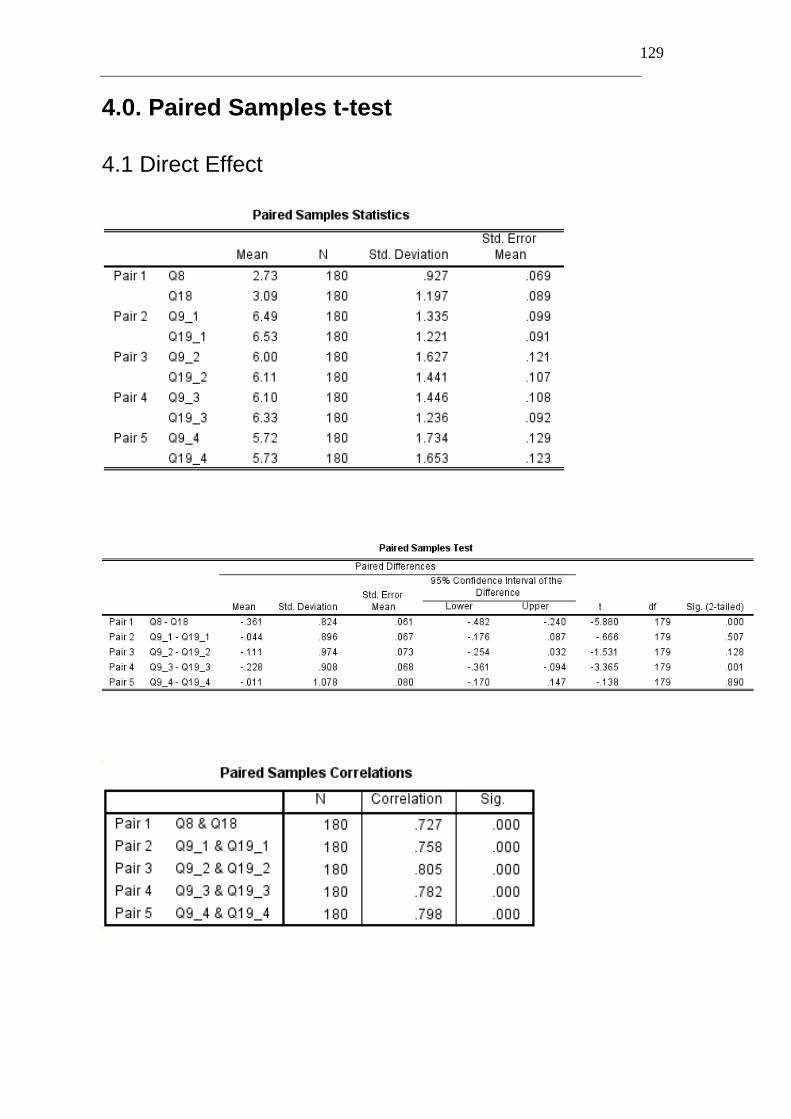
129
4.0. Paired Samples t-test
4.1 Direct Effect
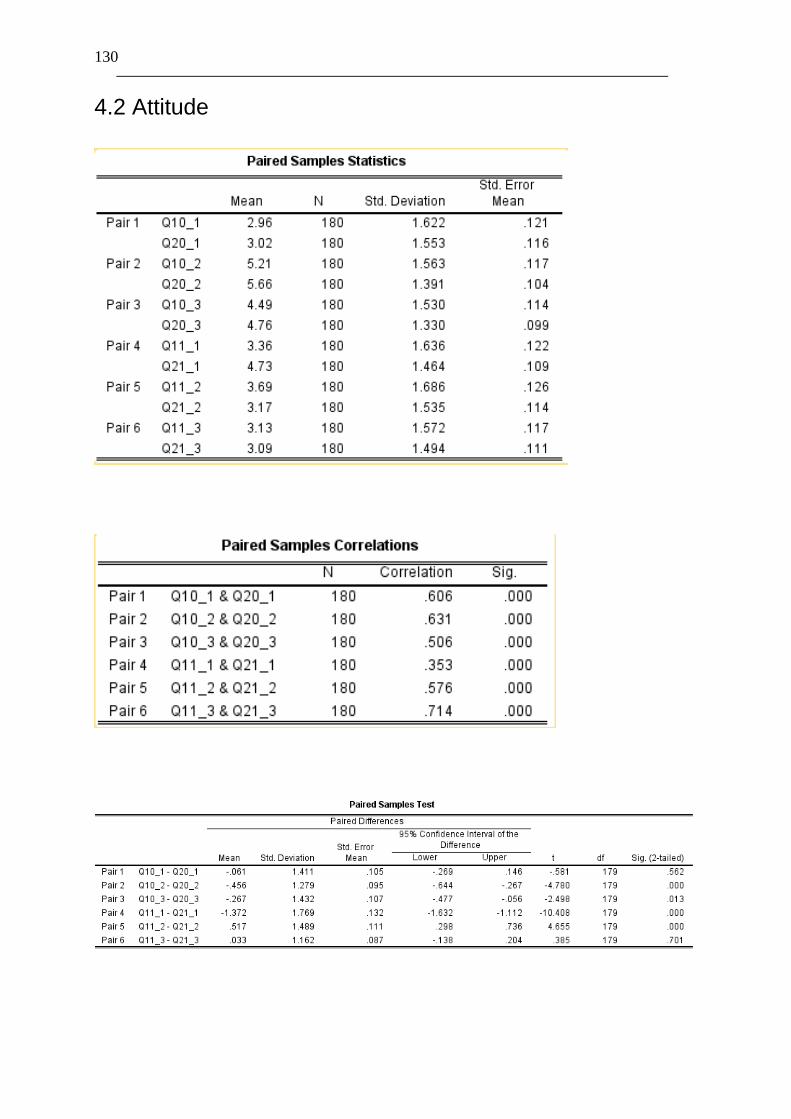
130
4.2 Attitude
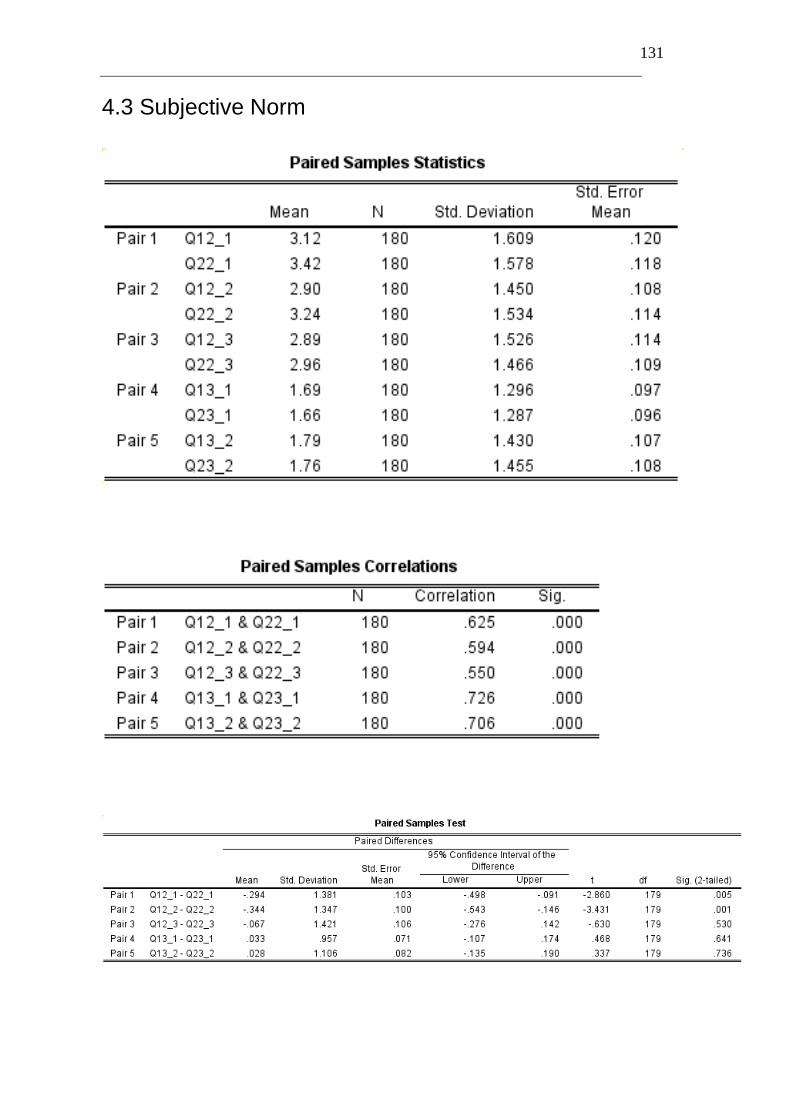
131
4.3 Subjective Norm
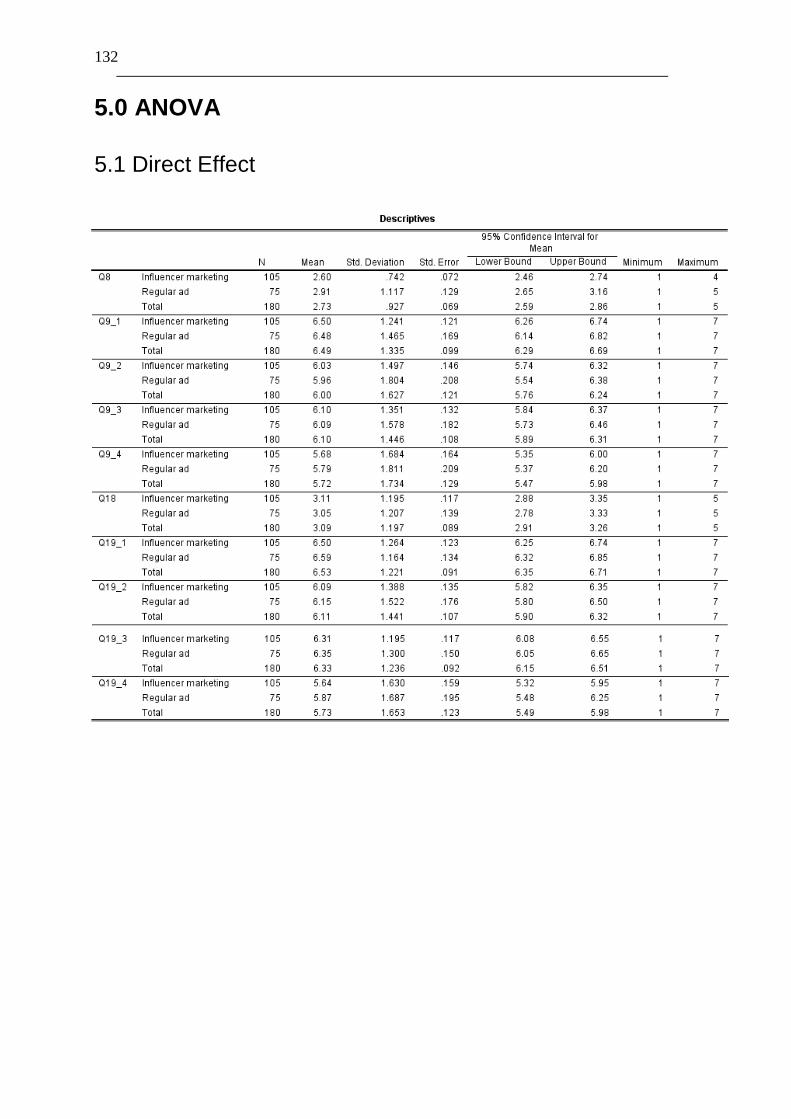
132
5.0 ANOVA
5.1 Direct Effect
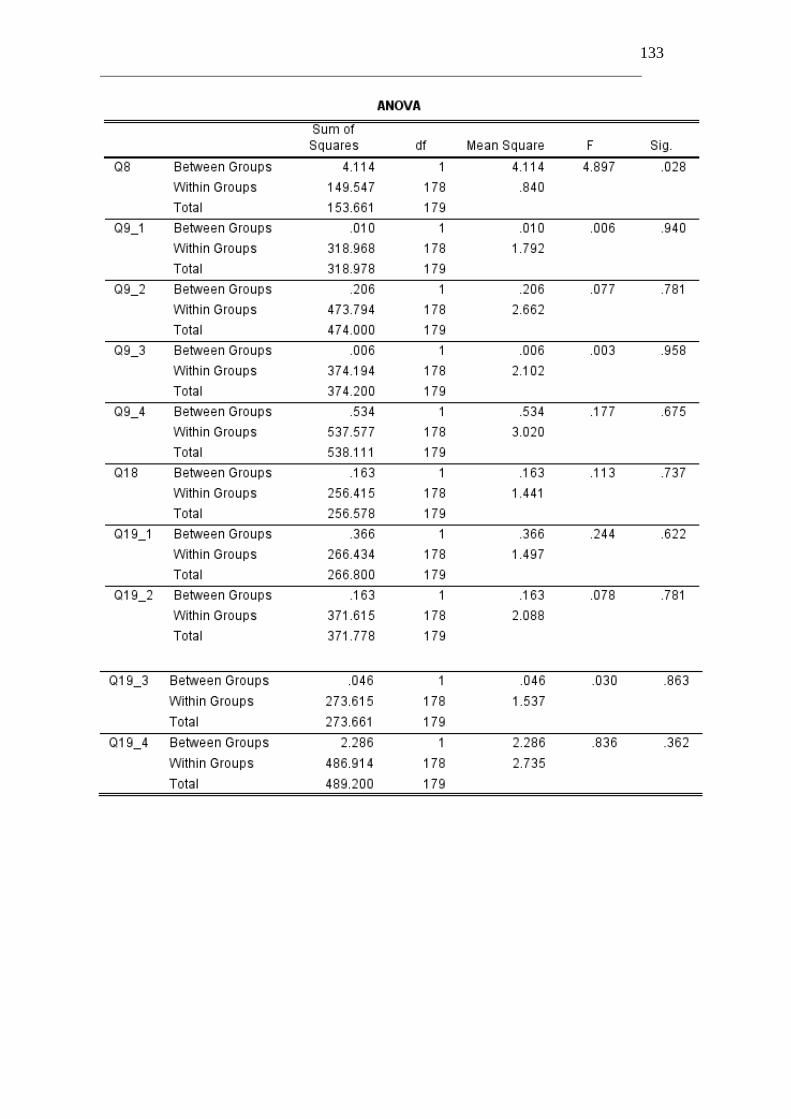
133
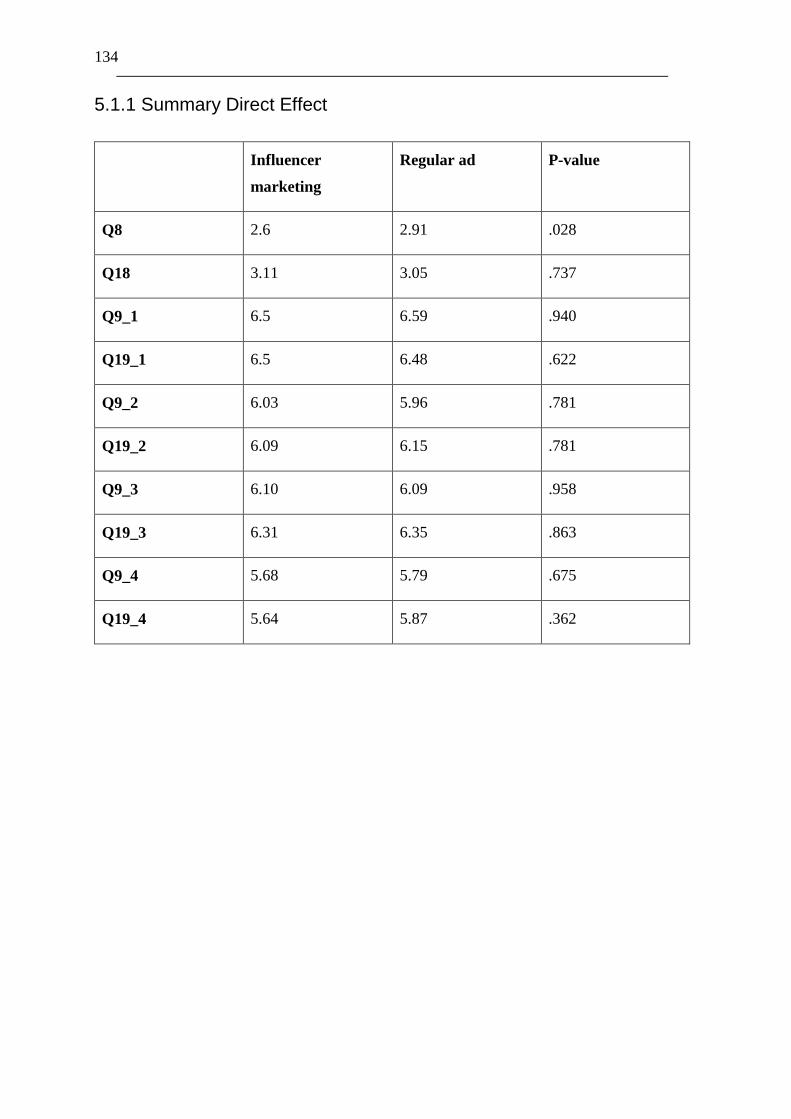
134
5.1.1 Summary Direct Effect
Influencer
marketing
Regular ad P-value
Q8 2.6 2.91 .028
Q18 3.11 3.05 .737
Q9_1 6.5 6.59 .940
Q19_1 6.5 6.48 .622
Q9_2 6.03 5.96 .781
Q19_2 6.09 6.15 .781
Q9_3 6.10 6.09 .958
Q19_3 6.31 6.35 .863
Q9_4 5.68 5.79 .675
Q19_4 5.64 5.87 .362
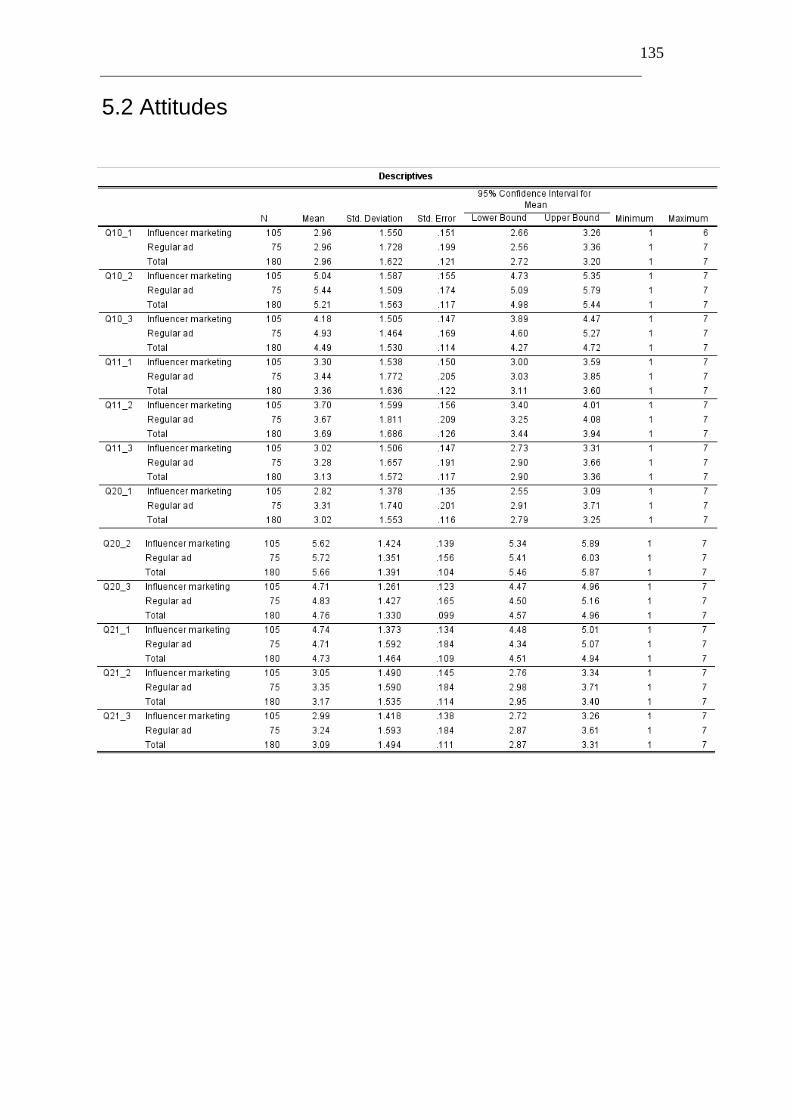
135
5.2 Attitudes
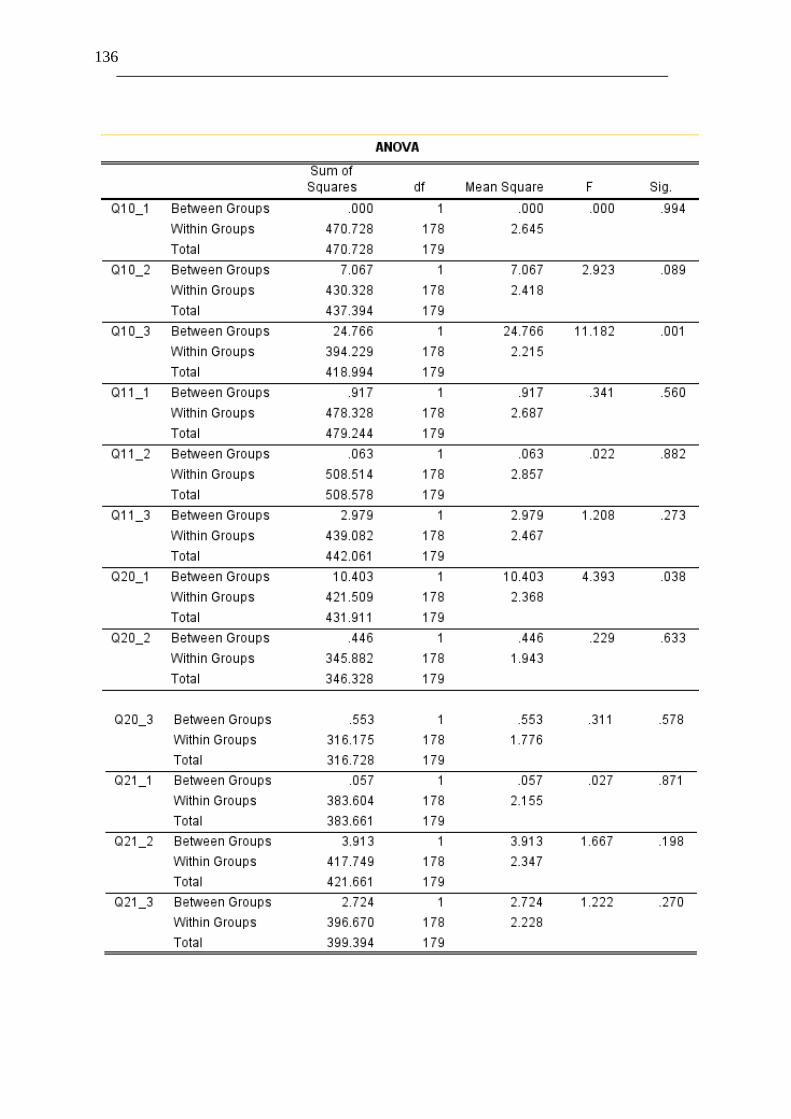
136
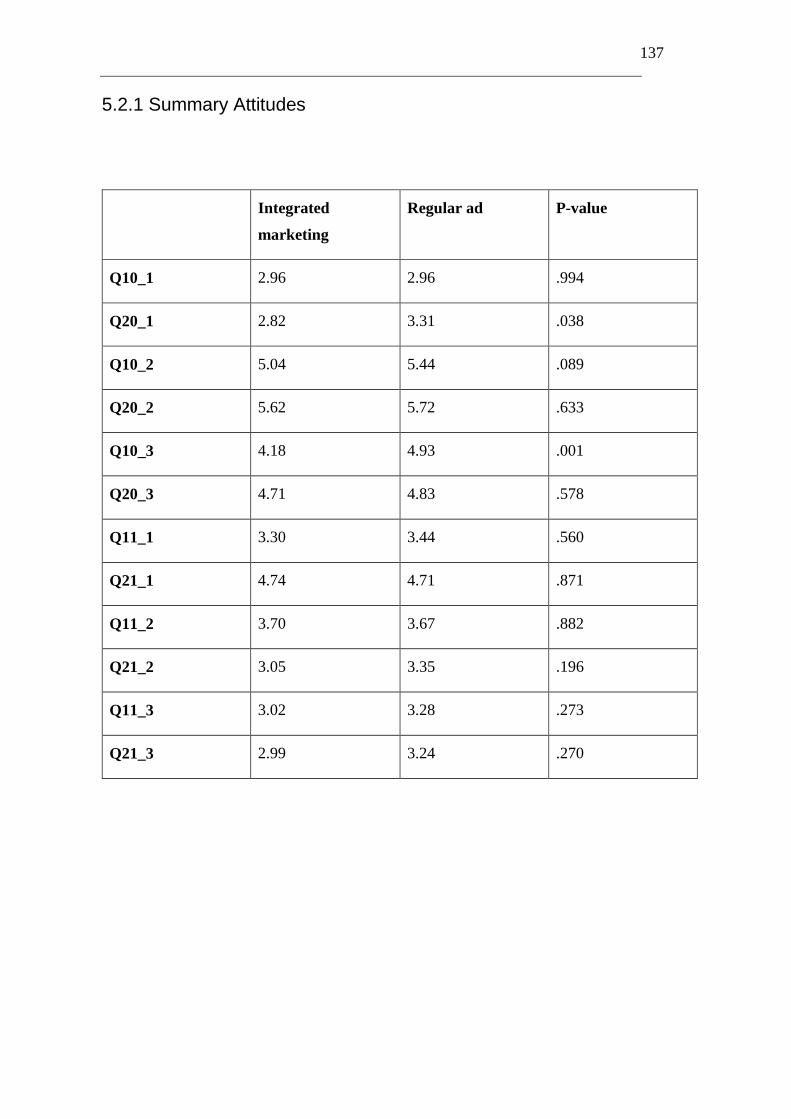
137
5.2.1 Summary Attitudes
Integrated
marketing
Regular ad P-value
Q10_1 2.96 2.96 .994
Q20_1 2.82 3.31 .038
Q10_2 5.04 5.44 .089
Q20_2 5.62 5.72 .633
Q10_3 4.18 4.93 .001
Q20_3 4.71 4.83 .578
Q11_1 3.30 3.44 .560
Q21_1 4.74 4.71 .871
Q11_2 3.70 3.67 .882
Q21_2 3.05 3.35 .196
Q11_3 3.02 3.28 .273
Q21_3 2.99 3.24 .270
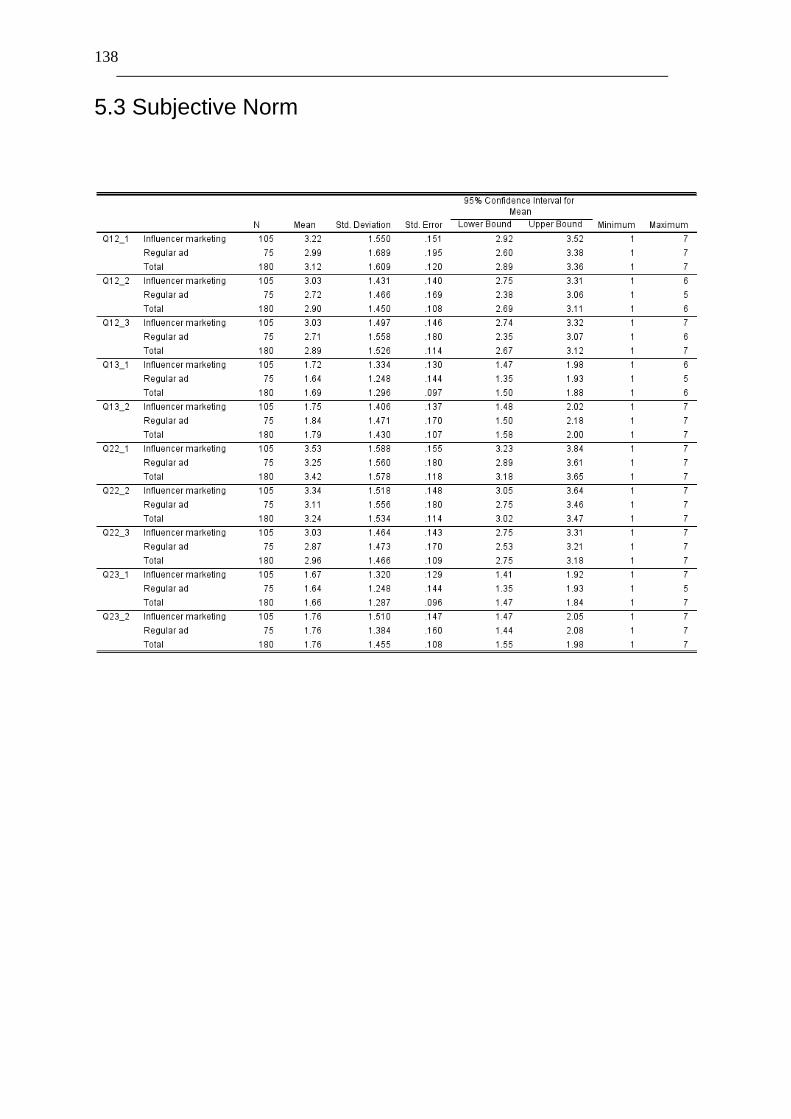
138
5.3 Subjective Norm
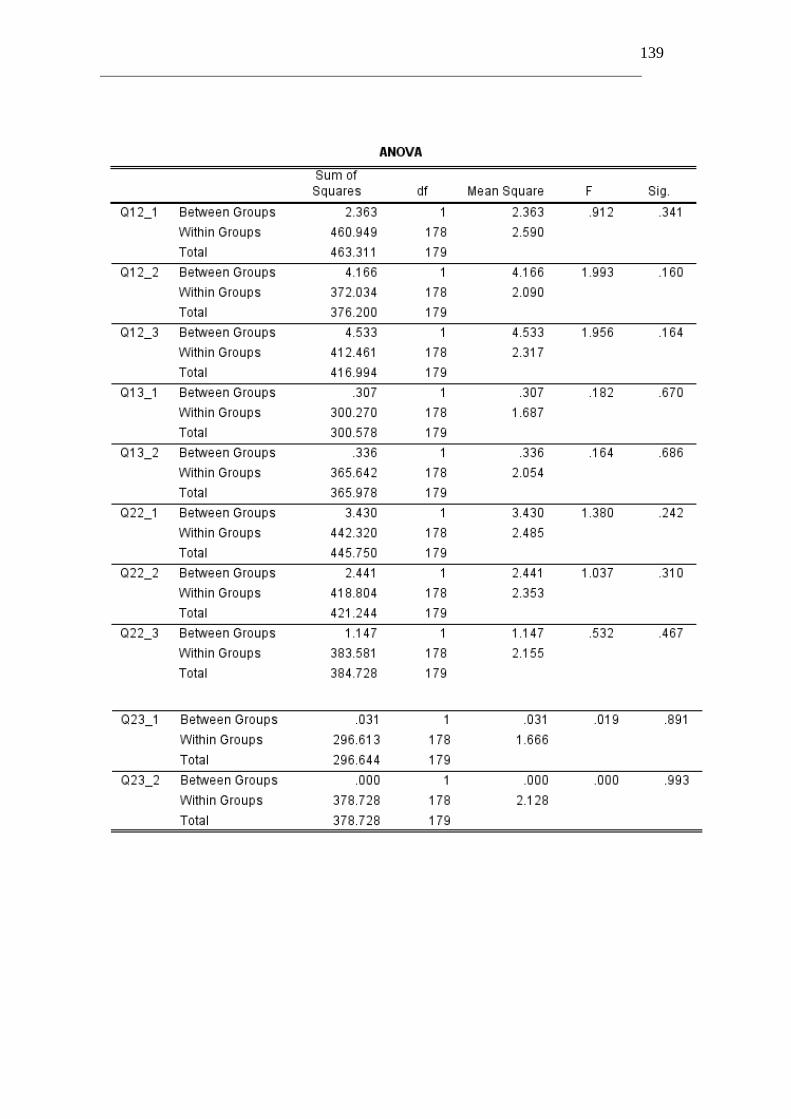
139
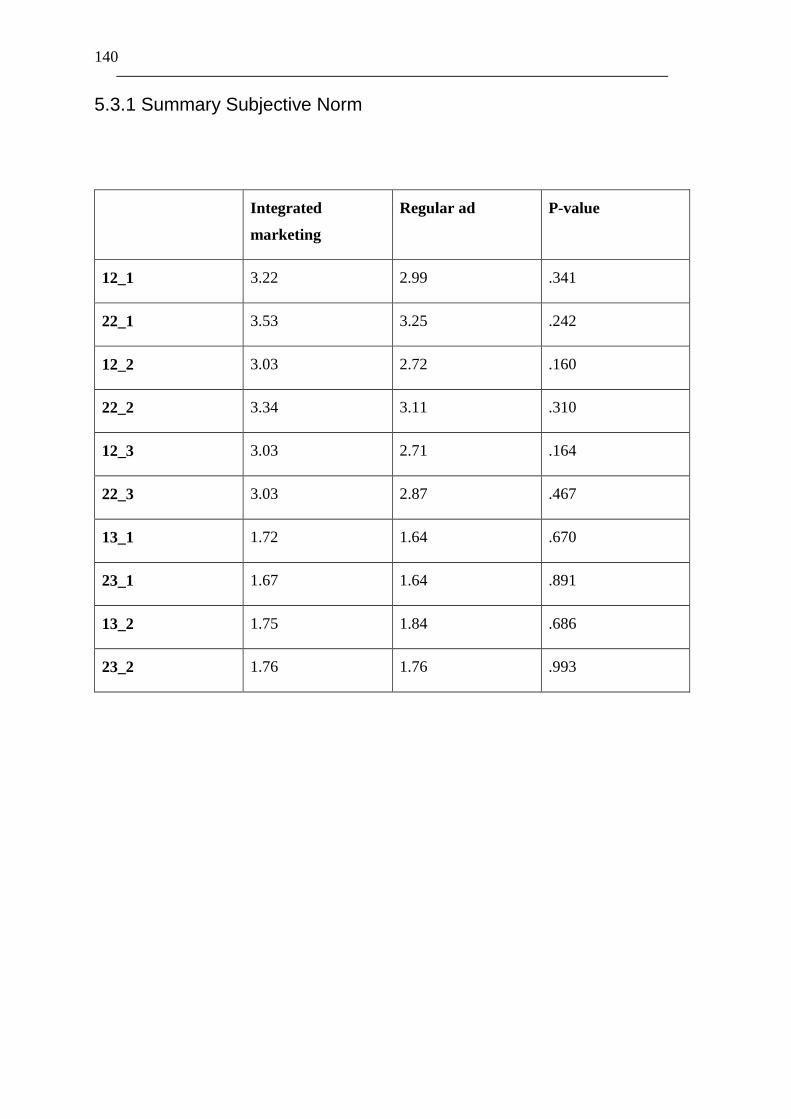
140
5.3.1 Summary Subjective Norm
Integrated
marketing
Regular ad P-value
12_1 3.22 2.99 .341
22_1 3.53 3.25 .242
12_2 3.03 2.72 .160
22_2 3.34 3.11 .310
12_3 3.03 2.71 .164
22_3 3.03 2.87 .467
13_1 1.72 1.64 .670
23_1 1.67 1.64 .891
13_2 1.75 1.84 .686
23_2 1.76 1.76 .993
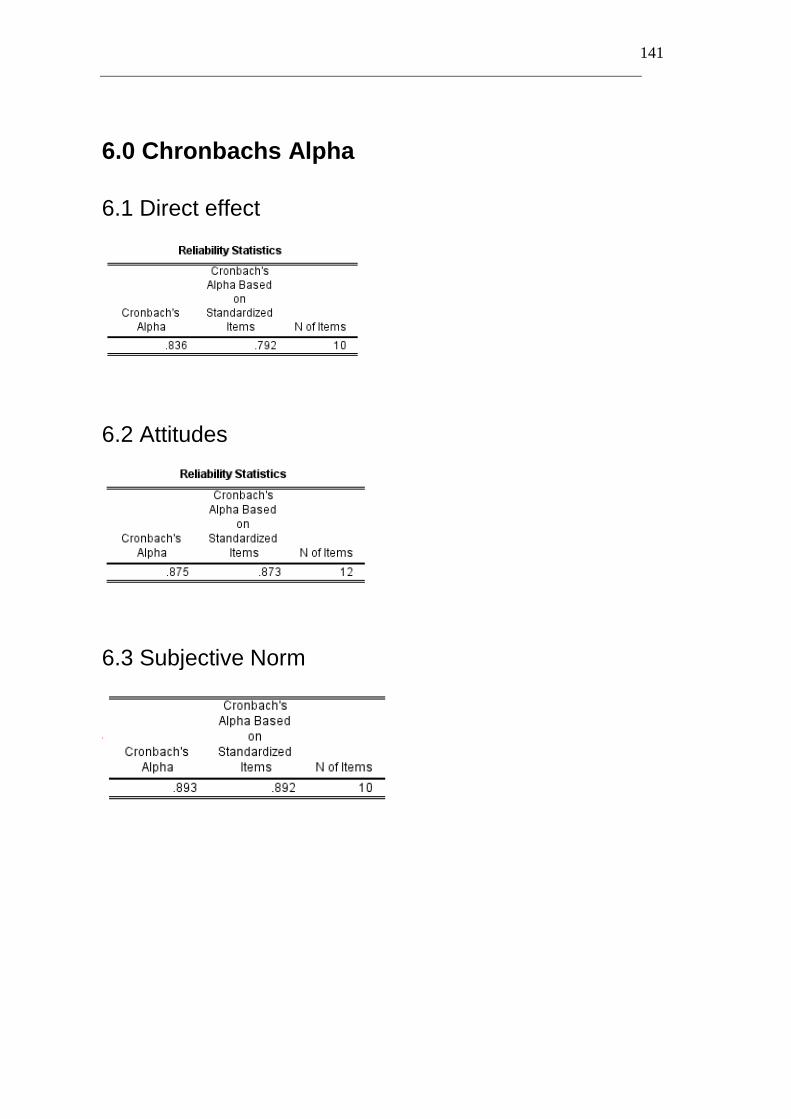
141
6.0 Chronbachs Alpha
6.1 Direct effect
6.2 Attitudes
6.3 Subjective Norm