Embed Size (px)
Citation preview
1
Influence of temperature and moisture on nitrogen cycling in soils from
experimentally heated and control plots at the Harvard Forest, MA
Fangyuan Hong
Mount Holyoke College
December 15, 2014
Primary investigators:
Dr. Jim Tang
Marine Biological Laboratory
2
Abstract
Global climate is predicted to become warmer and climate change can alter the function
and structure of terrestrial ecosystems. Studies have shown that soil warming has the potential to
change both soil and plant nutrient cycling, which may have a biogeochemical feedback to
climate change. Microbes in soils can regulate the availability of soil and plant organic carbon (C)
and nitrogen (N) by mediating substrate conversion processes such as microbial decomposition,
mineralization, nitrification and soil respiration. In this paper I argue that net mineralization,
nitrification and soil respiration rates increase as soil warms or wets at the Harvard Forest, MA,
and there exists a delicate balance point at which the effects of temperature and moisture are
numerically and ecologically equivalent. Methods included two-week laboratory incubation with
carefully manipulated temperature and moisture gradients, nutrient analysis and CO2 efflux
measurement using a LICOR at different time points. The study showed a strong influence of
temperature and moisture on net mineralization, nitrification, and respiration rates of soils from
the heated and unheated plots. With the prediction that NH4 dominated as a major form of N in
soil, the study complements the discoveries by both a mathematical model and previous studies
that in the long run more NO3 would leach out.
Keywords
Soil nitrogen cycling, soil respiration, temperature, moisture, heated, organic, mineral, Harvard
Forest
Introduction
Global climate is continuously predicted to become warmer (Durán et al. 2014), and its
change has altered the function and structure of terrestrial ecosystems (Butler et al. 2012). Many
studies (e.g. Peterjohn et al. 1994, Rustad et al. 2001, Butler et al. 2012) have shown that soil
3
warming has the potential to alter both soil and plant nutrients cycling, which may have a
biogeochemical feedback to climate change (Melillo et al. 2011, Butler et al. 2012, Auyeung et
al. 2013). Microbial processes such as N ammonification, nitrification and immobilization
regulate the availability of soil organic N and plant nutrients (Butler et al. 2012, Auyeung et al.
2013). Ecosystem N losses through emission of nitrous oxide (N2O), a powerful greenhouse gas,
and hydrologic leaching of nitrate (NO3-) create N-limited environments, where plants N
availability may constrain C sequestration by terrestrial ecosystems and produce a feedback to
elevated carbon dioxide (CO2) concentration in the atmosphere (Auyeung et al. 2013).
In many boreal and temperate forests, microbial activities in the cold-season contribute to
a significant portion of annual C (21-50 %) and net N mineralization (30->50 %) (Zimov et al.
1996, Vestgarden et al. 2003, Kielland et al. 2006, Monson et al. 2006, Schütt et al. 2014).
Changes in temperature and precipitation in winter are comparable to variations in the growing
season (Durán et al. 2014). Climate change is likely to have a greater influence on the winter N
cycle and C stocks as less plant N uptake leads to a higher rate of N losses out of the ecosystem
(Auyeung et al. 2013). Therefore, investigating C and N cycling of soils at low ambient
temperature in response to sustained soil warming and changing precipitation patterns can foster
the understanding of processes that lead to long-term changes in N cycling under climate change.
To explore the consequence of soil warming and wetting, as well as elicit the question
worth investigating, I model C, N and water cycles using the experimental soil warming and
control plots at the Harvard Forest, MA, an even-aged, mixed-stand temperate forest. The heated
plot has installed buried heating cables that continue to warm the soil 5°C above ambient (Butler
et al. 2012). The SNC Model, a biogeochemical mass-balance model, simulates winter soil N, C
and water cycles at the Harvard Forest over 14 years in light of elevated soil temperature and
4
moisture. It predicts a long-term decrease of NH4 and an increase of NO3 in response to soil
warming and wetting, which may result in a net loss of labile N in soils of the New England
temperate forest in the long run. The sensitivity and changes of nitrification and denitrification
rates to elevated temperature declines as the soil continues to warm. Unexpectedly, the effect of
a 20°C increase in soil temperature and that of a 2-mm increase in daily precipitation on
nitrification, denitrification and ammonification processes are congruent numerically. Therefore,
exploring the synergic effect of temperature and moisture is likely to be both mathematically and
ecologically meaningful. The model also suggests a decrease in microbial biomass over the
simulation period, which may potentially cause a decline in soil respiration and CO2 efflux.
The model predictions are in line with the previous observation. Butler et al. (2012) have
quantified and explained the effect of in situ 5°C soil temperature increase on net N
mineralization (a 45 % annual increase) and net nitrification (a 20 % annual increase in years 5
through 7) at the Harvard Forest. The previous NH4-dominant soils of the New England
temperate forests was transforming into a NO3-domiant reservoir due to disturbance (Melillo,
personal communication). In addition, soil warming has shown a strong carbon-nitrogen
interaction as carbon lost from the soil stimulated carbon gains in the woody tissue of trees
(Melillo et al. 2011). On the other hand, soil respiration rates of soils in the heated plot displayed
an acclimation to warming due to a decrease in microbial biomass and the thermal adaptation of
microbial respiration (Bradford et al. 2008).
In contrast to the abovementioned conclusions, Auyeung et al. (2013) have indicated that
warming had little or no effect on N cycling in some terrestrial ecosystems. They further used a
multi-factor mechanism to explain responses of N cycling to climate change. In addition to
warming, drought or limited soil moisture may also decrease net N mineralization, while
5
precipitation may have a variable effect on nitrification (Auyeung et al. 2013). These
observations, according to Auyeung et al. (2013) can be explained by the slack response of soil
respiration to warming at lower temperature and drier conditions. Another rationale is that
changes in soil temperature and precipitation may influence snow pack depth and freeze-thaw
events, creating a cascading effect on winter N cycling (Auyeung et al. 2013). Despite the
different goals and sampling methods, both studies (Butler et al. 2012, Auyeung et al. 2013)
mentioned the necessity to explore a combination of multiple interacting soil responses.
To explain the opposite conclusions from the two studies, here I investigate how
variations in soil temperature and moisture content affect net mineralization and nitrification
rates. Specifically, I hypothesize that 1) a rise in soil moisture and temperature within
biologically active ranges of microbes can increase net mineralization and nitrification in soils
from both heated and control plots; and that 2) the difference of net mineralization and
nitrification rates between soils from the heated and control plots decreases as microorganisms
adapt to a specific temperature and moisture level. I also explore response of soil respiration to
temperature and moisture gradients and its correlation to soil N cycle. I use a factorial design to
explore the individual and synergic effects of three temperature and three moisture levels on soil
net mineralization, nitrification and CO2 efflux response under laboratory soil incubation. The
temperature gradient (10, 20 and 30 °C) spans the range of soil temperature measured in previous
years. The moisture gradient ranges from the wilting point to the highest possible gravimetric
water content of soil samples. Each temperature or moisture treatment is spaced apart so as to
produce a clear differentiation in thermal or moisture responses. The study can complement
previous studies at the Harvard Forest and identify key soil temperature and moisture conditions
in light of climate change under which N losses initialize or reach the peak.
6
Methods
Field sampling
The study comprised of field sampling, laboratory incubation, nutrient analysis and gas
flux experiments. The in situ soil sampling took place at the Barre Woods (42°48’N, 72°18’W)
in the Harvard Forest in Petersham, Massachusetts, a long-term soil warming experiment site
since 2001. The climate in the Harvard Forest is temperate and humid year round (Butler et al.
2012). The study site included a 30 × 30 m experimentally heated and an equal-sized control
plots. Soils were mainly Canton series (coarse-loamy over sandy) with pH from 5.2 at the
surface to 5.5 at the subsurface (Butler et al. 2012). The average bulk density in the organic and
mineral layer was 0.37 g cm-3
and 0.78 g cm-3
respectively (Butler et al. 2012). The heated plot
has been warmed 5 °C above ambient since 2003 using buried resistance cables at 10 cm depth
and 20 cm apart (Butler et al. 2012).
12 cores from the heated and 14 cores from the control plot were taken from randomly
assigned subplots (Figure 1). Each soil core was approximately a cylinder of about 10 cm deep
and approximately 2.8 cm wide in cross-sectional radius. Each soil core taken inside treatment
plots was carefully replaced by a core taken outside. Two cores were taken from the same 5 × 5
m subplot to reduce spatial heterogeneity (Figure 1). Due to random assignment of sampling
locations, two cores might be close enough to be treated as one sample even if they were
originally from different subplots. Based on the hierarchical agglomerative clustering analysis, a
statistical approach that define spatial similarity among points in a coordinate system, I grouped
soil cores from each of the heated and control plots into 3 sample replicates (Table 1). The
grouping did not take into account any previous measurements and was thus exempt from
introducing confounding factors (e.g. N mineralization rate the month before). The study also
7
considered different sources and layers of soil. Each soil sample could be separated and
categorized as one of the following four types: heated organic (HO), heated mineral (HM),
control organic (CO), and control mineral (CM). The average depth of organic layer was less
than that of mineral layer in a soil core. However, at plot h15a and c17b (Figure 1) where
hemlock was present, organic layer usually contained a great amount of woodchips and could be
as thick as 9 cm. Soil samples were placed in clearly-labeled ziplock bags and stored in a cooler
before transporting back to the lab.
Laboratory incubation
Soils were sieved through a 2-mm screen to remove rocks and roots (the process was not
stringent) (Robertson et al. 1999). A subsample of heated organic, heated mineral, control
organic and control mineral soil was weighed in aluminum cans right away and dried in an oven
at 50 °C for 48 h to determine gravimetric soil moisture (Robertson et al. 1999). When the soils
were dried to constant weight, I allowed them to cool down, and quickly weighed the entire can
to get the gravimetric water content (GWC) (Elliot et al. 1995) using the equation
% 100%wet dry
dry
wt wtGWC
wt
(Robertson et al. 1999). GWC of four soil types were determined
by partitioning real-time soil moisture data in the heated and control plots from a TDR (Time
Domain Reflectometry) datalogger into organic and mineral layers based on previous GWC
metadata. The metadata had first to be converted from volumetric to gravimetric water content
by multiplying the corresponding bulk density of that soil type. Approximately 5 grams of the
initial soil samples was placed in 50 mL of 1 N KCl, shaked thoroughly, extracted for 24 h, and
filtered. The initial extracts were analyzed for NH4-N using a mass spectrometer and NO3-N
using a Lachat QuikChem FIA+ 8000 Series Flow Injection Analyzer. NH4 and NO3 standards
8
were made with samples to allow for an accurate conversion from absorbance to concentration.
Net mineralization (g N m-2
day-1
) and nitrification (mg N m-2
day-1
) rates were calculated using
the difference between initial and final concentrations as performed in the SES Soil Nutrient
Analysis Lab.
To simulate short-term in situ environmental conditions and minimize field disturbance,
each of the 12 subsamples received 9 temperature and moisture treatments under laboratory
incubations (Table 2). The treatment effect included temperature at 10, 20 and 30 °C, as well as
soil water content at 5-10%, 25% and 45% of the dry mass. With the assumption that all
replicates of a soil type had the same GWC, moisture levels were adjusted using the equation
(1 )1
dry wet
GWCwt wt
GWC
. Each soil sample was air dried for at least 48 h to the lowest water
content possible under room temperature and moisture before adjusting moisture. The air-dried
sample was then homogenized, divided into 9 subsamples placed in plastic cups, and adjusted
moisture to the corresponding water content. I used a mister to dispense small amount of
deionized water evenly to the soil sample. Subsamples 1, 2 & 3 received 5 – 10% water of the
dry soil mass. The exact water content depended on the deviation in water holding capacity of
the soil sample from that of the average level set when calculating the expected dry mass.
Subsamples 4, 5 & 6 and 7, 8 & 9 received 25% and 45% water of the dry soil mass, respectively.
Soils were capped in the plastic cups during the period of weighing and adjusting moisture. The
absolute deviation of soil weight and water mass across subsamples was less than 0.01 g. The
total weight of cup and soil was labeled on the tape before going into the incubator.
Soils with three moisture levels were incubated in three Thermo Scientific Incubators set
at 10, 20 and 30 °C. Each incubator included three batches of soil cups organized from the driest
9
to the wettest. Subsamples 1, 4 & 7 were in the 10 °C incubator, 2, 5 & 8 the 20 °C incubator,
and 3, 6 & 9 the 30 °C one. To best maintain moisture, soils from the wettest to the driest were
placed with four, two and one cups of deionized water respectively, and covered with cling
wraps with gaps in between allowing for gas exchange. All samples were checked daily for water
losses by weighing the entire cup and replenishing the evaporated water. After the first and
second weeks of incubation, 5 - 10 grams of soils were taken out of the original plastic cups for
NH4-N and NO3-N analyses. 50 - 100 mL of 1 N KCl was used for extraction, shaking and
filtering. KCl extracts for NH4-N analysis had to be diluted ten-fold before running mass
spectrometry.
CO2 efflux from the soil was measured using a LI-COR 6200 connected to a chamber
whose bottom part fitted the plastic cup seamlessly. In order to accounting for the headspace,
both the remaining space in the cup and the volume of the chamber head were calculated. The
chamber head, a partially filled sphere, had the volume 0.072 L. The cup headspace was
calculated by subtracting soil volume from the total cup volume. Soil respiration measurements
were taken at the beginning of incubation, at day 6 and finally at day 14 of the incubation. Soil
respiration of each cup was recorded 15 sec apart during a period of 3 – 4 min. The instantaneous
CO2 efflux from soil (umol g-1
sec-1
) was calculated using the regression slope of CO2 readings,
headspace in the cup and chamber head, mass of dry soil and air temperature and barometric
pressure using the modified equation 1 1( ) vdC P VF umol g s
dt RT M
(M refers to mass of dry
soil in grams; R = 0.08206 L atm mol-1
K-1
). I did take into account the CO2 evolution in the
pore space inside the soil by assuming that it was negligible compared to the head space in the
cup and chamber.
10
Statistical analyses
I used a two-way ANOVA (Type III marginal sum of squares) to explore the individual
and interactive effects of temperature and moisture on soil net mineralization, nitrification and
respiration rates. The analysis was repeated for both one-week and two-week incubation periods
to create a temporal sequence. I further used both linear and non-linear regression to explore the
correlation between week 1 and week 2 incubation periods of three dependent variables (net
mineralization, nitrification and CO2 efflux rates). The linear regression was used to indirectly
explore whether soil microbes displayed a quasi-linear acclimation to temperature and moisture
treatments with time. The closer the R2 value was to 1, the more consistent the acclimation
pattern was among all points. I also fitted a local linear regression to points in the scatterplot
between rates after week 1 and week 2. If the R2 value was relatively smaller, the smoothing
curve from connecting local regression lines might be more useful in determining microbial
thermal and moisture adaptation. For statistical significance I assumed an α-level of 0.05. All
statistical analyses were performed in R 3.1.1 (The R Foundation for Statistical Computing).
Data were tested for assumptions on normality and homogeneity of variance.
Results
Twelve line graphs with two levels of categorical were made to illustrate the individual
and interactive effect of temperature and moisture on three dependent variables (net
mineralization, nitrification and soil respiration) (Figure 2-7). Organic soil had a higher
mineralization rate than mineral soil. There was no significant difference between control and
heated soils. N Mineralization rates showed an overall increase with higher moisture (Figure 2 &
3). At 45% water content, 10°C corresponded to the highest mineralization rate, while 30°C had
11
the lowest (Figure 2 & 3). At the lowest temperature, however, 20°C usually rendered higher
mineralization rate (Figure 2 & 3). Error bars of some triplicates, such as heated mineral soils at
10°C and 25% water content (of soil dry mass) (Figure 2 & 3), were huge compared to others.
The greater the error bar, the less we can trust the mean value due to a possibly high spatial
variation of soil characteristics. Temperature effect was statistically significant except for control
organic soil (p=0.15>0.05). Moisture effect was only significant for heated organic soil (p<0.05).
There was no interactive effect from two independent variables on N mineralization rate.
The effect of temperature and moisture on net nitrification rate was quite different from
that of mineralization (Figure 4 & 5). Low temperature still accounted for the highest
nitrification rate in high moisture mineral soil, but this did not hold for organic soil (Figure 4 &
5). Heated soils have a higher nitrification rate than unheated soils (Figure 4 & 5). Except for
samples treated with lowest temperature and highest moisture, which was obviously an outlier,
others showed an overall decreasing trend with higher moisture levels, or an increase in NO3
immobilization (Figure 4 & 5). There was not a consistent pattern of temperature effect across
four soil types, and statistical analysis indicated its significance only on heated mineral soil
(p<0.05). An interactive influence of temperature and moisture on heated mineral soil was also
significant (p<0.005).
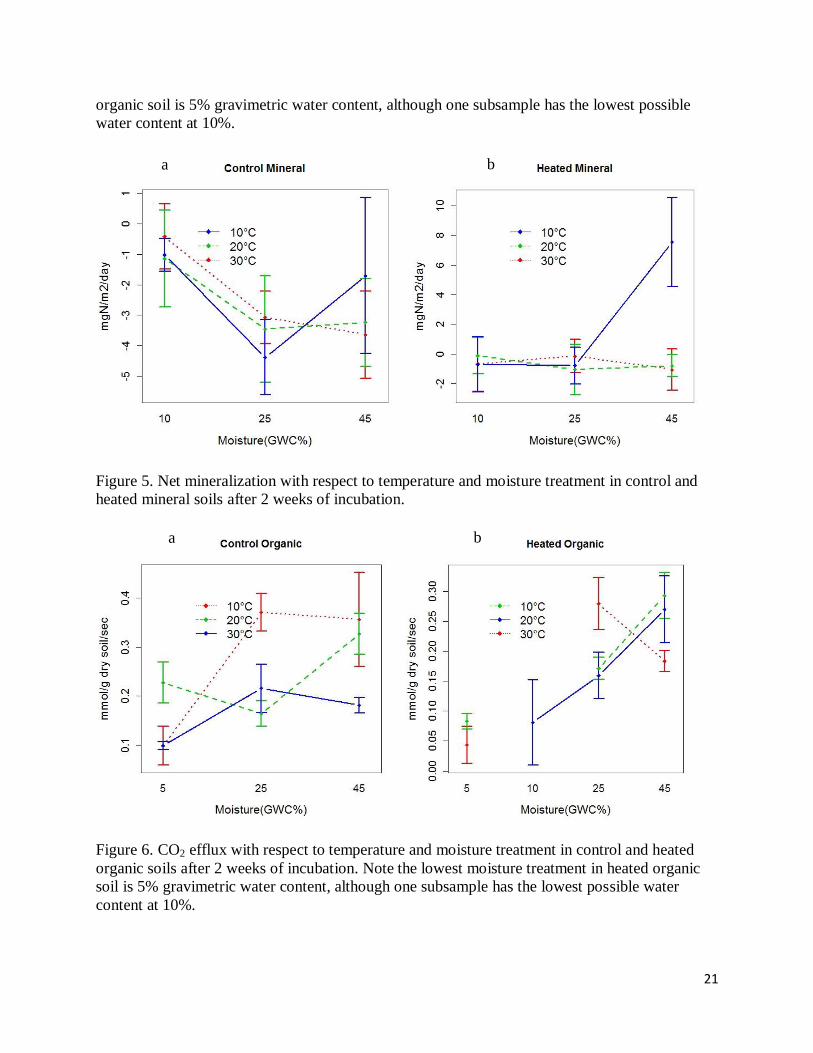
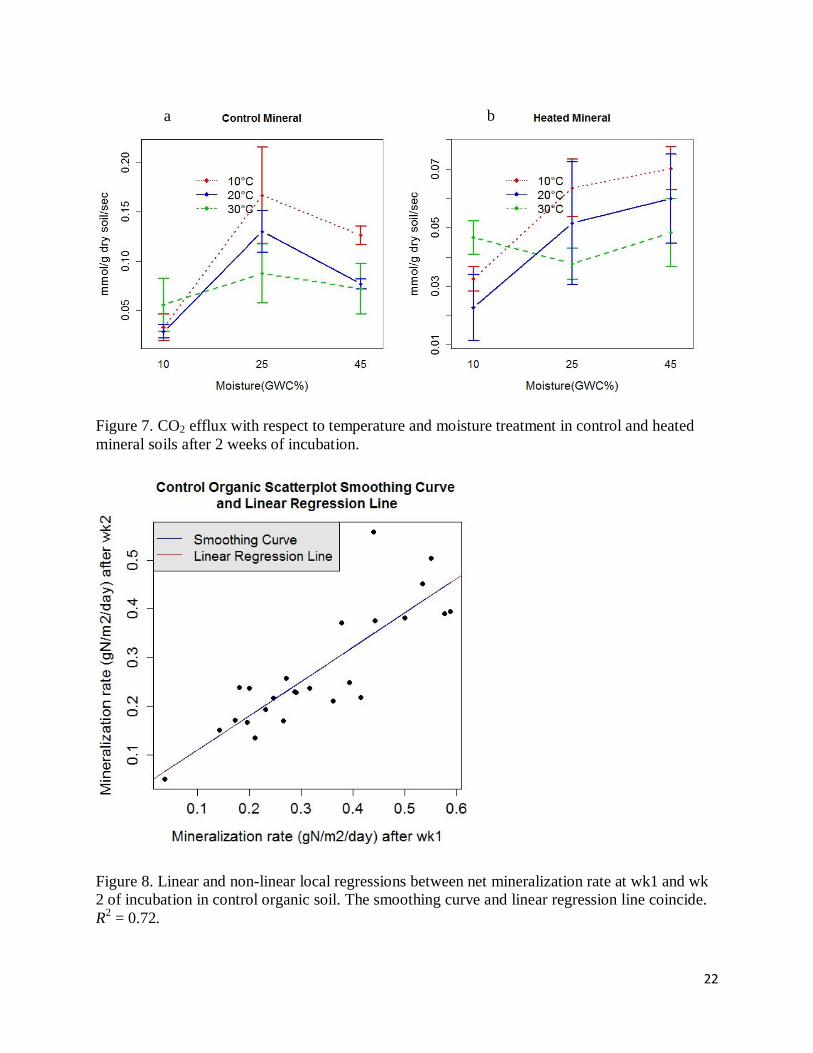
Soil respiration had a clearer and more pronounced trend in response to temperature and
moisture treatments (Figure 6 & 7). It generally increased with higher moisture and temperature,
although bigger error bars meant greater variations among replicates (Figure 6 & 7). Soil
respiration was higher in organic soils (Figure 6). At the lowest moisture, 30°C accounted for the
highest soil respiration rate (Figure 6 & 7). At higher moisture level, however, 10°C and
occasionally 20°C rendered higher respiration rates (Figure 6 & 7). These patterns were in line
12
with those of the net mineralization. Statistically only moisture effect was significant for the
control mineral, heated organic, and control organic soils (p<0.005). A significant interactive
effect was also present for the control organic soil (p<0.05).
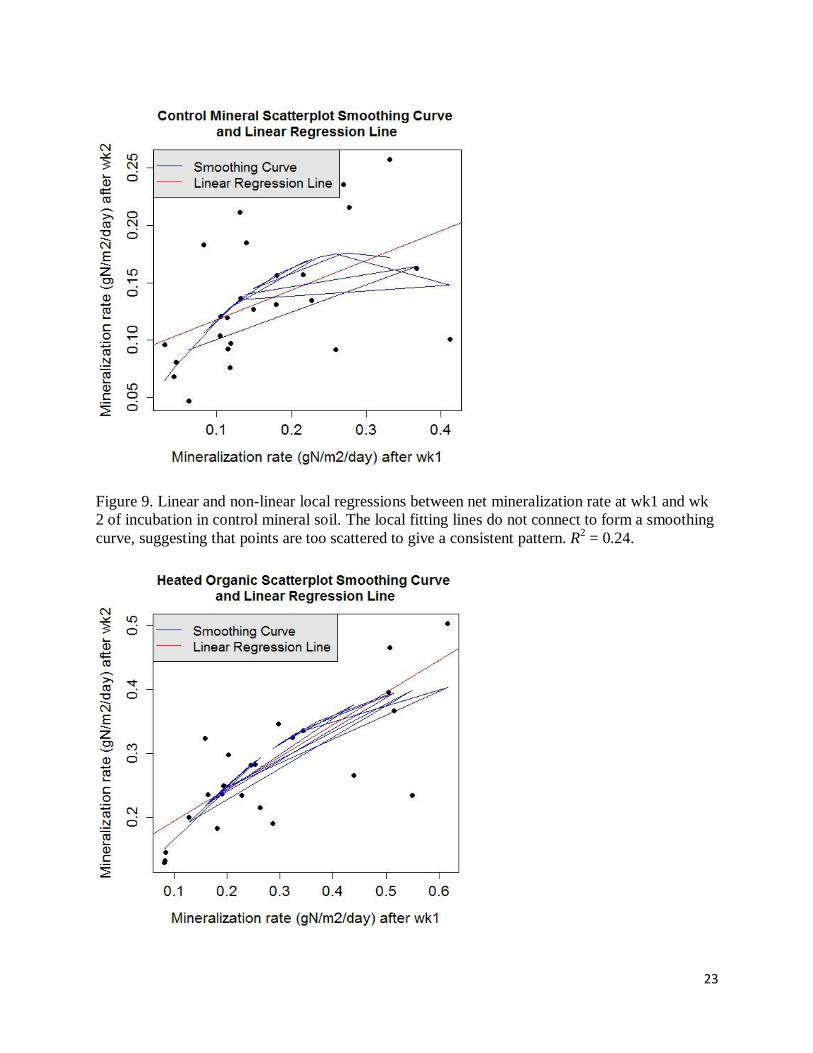
Results of linear and non-linear regression analyses showed different acclimation patterns
among three response variables with time. The more scattered points were on the plot, the less
the R2
value and more discontinuous the smoothing curve was. For the net mineralization rate,
heated organic, control organic and control mineral soils had R2 values of 0.52, 0.72 and 0.24
respectively (Figure 8 - 10). The linear regression line for the heated mineral soil had a R2 of
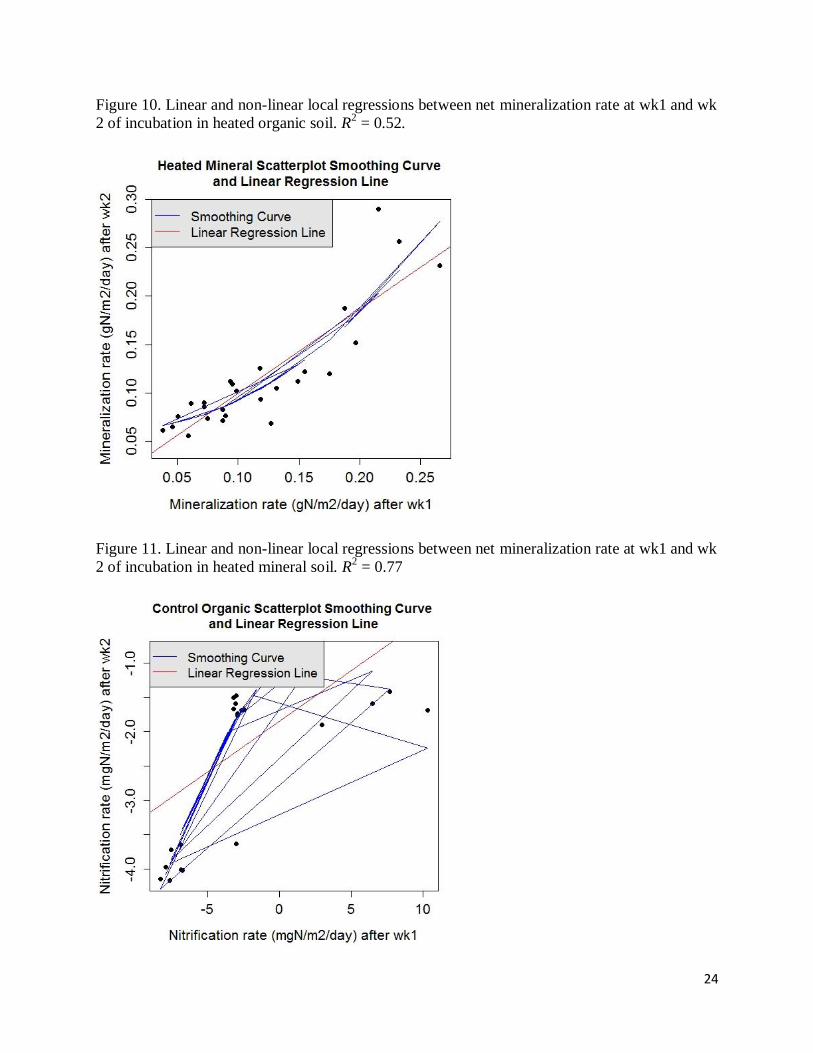
0.77 (Figure 11). The smoothing curve derived from local linear regression fitting showed an
enhancing acclimation with higher mineralization rate during week 1 of incubation (Figure 11).
For net nitrification, only heated organic soil had a relatively big R2 value (Figure 14). Other soil
types either had small R2 values or discontinuous locally fitted regression patterns that make the
acclimation less pronounced (Figure 12, 13 & 15). Soil respiration did not show a strong
correlation between measurements after week 1 and week 2 for any soil type (Figure 16 - 19).
Discussion
Results of the treatment effect suggest that there is likely to be a compensation point
between temperature and moisture treatments at which the effect of two factors are numerically
equivalent. Lower temperature may win over higher temperature at higher moisture for all four
soil types. The opposite also holds. This observation is in line with the prediction of the SNC
Model but opposite of the widely believed idea that decomposition, or mineralization, tends to
slow down at cooler temperature. However, since I took the soil samples in early winter, when
the average soil temperature (even for heated soils) is below 10°C, soil microbes might have
13
adapted to the lowest temperature level (10°C), creating a time lag of the acclimation and
ultimately the adaptation to a new temperature. The consistent pattern across all four soil types
may suggest that the incubation time is not long enough to stimulate microbial thermal or
moisture adaptation.
The decrease in nitrification rate or increase in nitrate immobilization (if in negative
signs) indicates a short-term reduction or even depletion of NO3 stocks in soil. Since there is
minimal amount of NO3 leaching out under laboratory incubation, NH4 accumulates and
dominates the soil when soil is saturated. This observation however is different from the
discovery by Butler et al. (2012), who predict an increase in NO3 and a gradual reduction of NH4
over longer period of time. There are slight variations between treatments, suggesting that the
results would be even more pronounced if given a longer period of incubation. Heated soils have
a higher nitrification rate than unheated soils, suggesting that nitrification process adapts to
changes in temperature even more slowly. Therefore, under global climate change and sustained
soil warming, temperate forest soil may be dominated by NO3 much faster than with current
temperature level.
The two types of regression can eliminate bias and maintain objectivity while making ad
hoc interpolations on microbial thermal acclimation, a pattern that may not be easily studied
directly, although sometimes doubling information does not give a clearer picture. Notice that
when the linear regression has a small R2
value, oftentimes the local linear fitting (LOESS) is
also discontinuous, making the information less credible and clear. Among all linear and non-
linear regression results, heated organic and control mineral soils clearly fail to show an
acclimation or adaptation of net mineralization or nitrification rates to treatments within two
weeks of incubation. This interpretation contradicts the results from Bradford et al. (2008),
14
whose 15-year soil warming experiment shows a thermal adaptation of microbial respiration.
The validity of using the pure statistical regression and data extrapolation to study ecological
questions needs to be reconsidered due to confounding factors that confuse the influence of the
factor of interest like time points.
In conclusion, the study suggests a strong influence of temperature and moisture on net
mineralization, nitrification, and respiration rates of soils from the heated and unheated plots at
the Barre Woods, Harvard Forest, MA. It replicates and predicts a gradual dominance of NH4
over short-term, which complements the opposite long-term increase of NH4 predicted by the
SNC Model and previous study. The study also proves the existence of a compensation point
between the effects of temperature and moisture. However, the interactive effect of two
treatments is not evident in some type of soils. Similarly, correlations of net nitrification and soil
respiration rates between week 1 and week 2 of incubation are insignificant. A longer incubation
time and a spatial analysis that considers spatial variability and multivariate origins of soil need
to be conducted in the future to identify other implicit factors.
Acknowledgements
I would like to thank my mentor Dr. Jim Tang for his help designing my project,
resolving my questions, interpreting my data, and guiding me to the next step of my academic
career. I would also like to thank Dr. Jerry Mellilo for designing my project and providing the
field site. I would also like to acknowledge the support of William Werner and Michael Bernard
lent during and after field sampling. Last but not least, I would like to thank Rich McHorney,
Fiona Jevon, Tyler Messerschmidt and Nick Barrett for helping me with my soil lab incubation. I

15
could not have successfully finished my project without their dedication to lab work and
excellent capability of trouble shooting.
16
Bibliography
Auyeung, D. S. N., Suseela, V. and J. S. Dukes. 2013. Warming and drought reduce temperature
sensitivity of nitrogen transformations. Global Change Biology 19:662-676.
Bradford, M. A., Davies, C. A., Frey, S. D., Maddox, T. R., Mellilo, J. M., Mohan, J. E.,
Reynolds, J. F., Treseder, K. K., and M. D. Wallenstein. 2008. Thermal adaptation of soil
microbial respiration to elevated temperature. Ecology Letters 11:1316-1327.
Butler, S.M., Melillo, J.M., Johnson, J.E., Mohan, J., Steudler, P.A., Lux, H., Burrows, E.,
Smith, R.M., Vario, C.L., Scott, L., Hill, T.D., Aponte, N. and Bowles, F. 2012. Soil
warming alters nitrogen cycling in a New England forest: implications for ecosystem
function and structure. Oecologia 168: 819-828.
Durán, J., J.L. Morse, P.M. Groffman, J.L. Campbell, L.M. Christenson, C.T. Driscoll, T.J.
Fahey, M.C. Fisk, M.J. Mitchell, and P.H. Templer. 2014. Winter climate change affects
growing-season soil microbial biomass and activity in northern hardwood forests. Global
Change Biology. Doi: 10.1111/gcb.12624. Accessed October 18, 2014.
Jarrel, W.M., D.E. Armstrong, D.F. Grigal, E.F. Kelly, H.C. Monger, and D.A. Wedin. 1999.
Soil water and temperature status. Pages 55-85 in G.P. Robertson, D.C. Coleman, C.S.
Bledsoe and P. Sollins, editors. Standard soil methods for long-term ecological research.
Oxford University Press, New York, New York, USA.
Kielland, K., Olson, K., Ruess, R.W., and R.D Boone. 2006. Contribution of winter processes to
soil nitrogen flux in taiga forest ecosystems. Biogeochemistry 81:349-360.
Melillo, J.M., S. Butler, J. Johnson, J. Mohan, P. Steudler, H. Lux, E. Burrows, F. Bowlers, R.
Smith, L. Scott, C. Vario, T. Hill, A. Burton, Y.M. Zhou, and J. Tang. 2011. Soil
warming, carbon-nitrogen interactions, and forest carbon budgets. PNAS 108:9508-9512.
Monson, R.K., Lipson, D.L., Burns, S.P., Turnipseed, A.A., Delany, A.C., Williams, M.W.,
Schmidt, S.K., 2006. Winter forest soil respiration controlled by climate and microbial
community composition. Nature 439:711-714.
Peterjohn, W.T., Melillo, J.M., Steudler, P.A., Newkirk, K.M., Bowles, F.P., and J.D. Aber.
1994. The response of trace gas fluxes and N availability to elevated soil temperatures.
Ecol Appl 4:617–625.
Robertson, G.P., D. Wedin, P.M. Groffman, J.M. Blair, E.A. Holland, K.J. Nadelhoffer, and D.
Harris. 1999. Soil carbon and nitrogen availability-nitrogen mineralization, nitrification
and soil respiration potentials. Pages 258-271 in G.P. Robertson, D.C. Coleman, C.S.
Bledsoe and P. Sollins, editors. Standard soil methods for long-term ecological research.
Oxford University Press, New York, New York, USA.
Rustad, L.E., Campbell, J.L., and G.M. Marion. 2001. A meta-analysis of the response of soil
respiration, net nitrogen mineralization, and aboveground plant growth response to
experimental ecosystem warming. Oecologia 126:543–562.
17
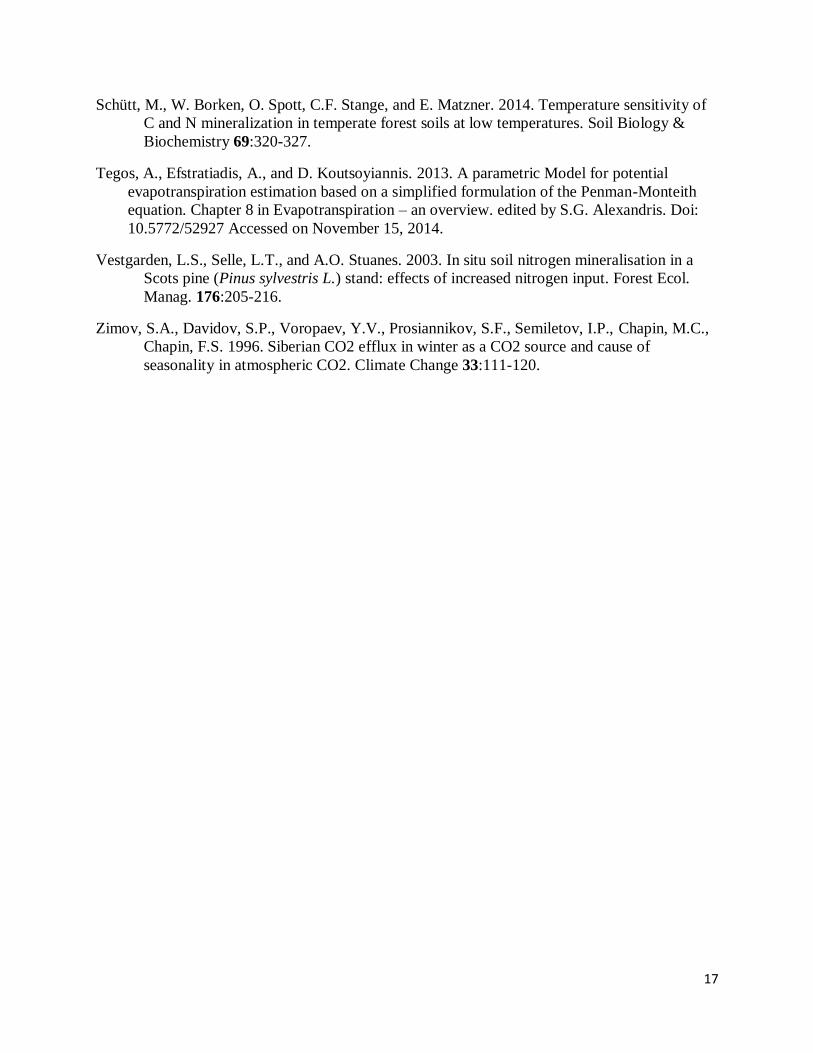
Schütt, M., W. Borken, O. Spott, C.F. Stange, and E. Matzner. 2014. Temperature sensitivity of
C and N mineralization in temperate forest soils at low temperatures. Soil Biology &
Biochemistry 69:320-327.
Tegos, A., Efstratiadis, A., and D. Koutsoyiannis. 2013. A parametric Model for potential
evapotranspiration estimation based on a simplified formulation of the Penman-Monteith
equation. Chapter 8 in Evapotranspiration – an overview. edited by S.G. Alexandris. Doi:
10.5772/52927 Accessed on November 15, 2014.
Vestgarden, L.S., Selle, L.T., and A.O. Stuanes. 2003. In situ soil nitrogen mineralisation in a
Scots pine (Pinus sylvestris L.) stand: effects of increased nitrogen input. Forest Ecol.
Manag. 176:205-216.
Zimov, S.A., Davidov, S.P., Voropaev, Y.V., Prosiannikov, S.F., Semiletov, I.P., Chapin, M.C.,
Chapin, F.S. 1996. Siberian CO2 efflux in winter as a CO2 source and cause of
seasonality in atmospheric CO2. Climate Change 33:111-120.
18
Tables and Figures
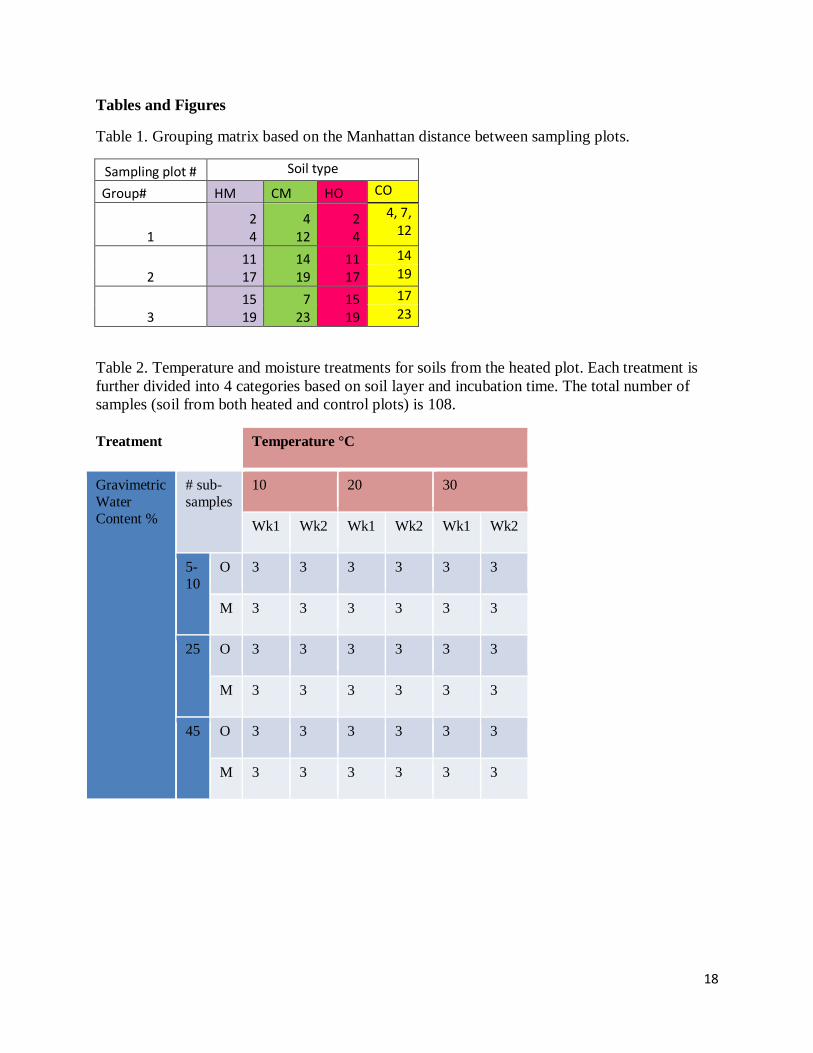
Table 1. Grouping matrix based on the Manhattan distance between sampling plots.
Sampling plot # Soil type
Group# HM CM HO CO
1 2 4
4 12
2 4
4, 7, 12
2 11 17
14 19
11 17
14
19
3 15 19
7 23
15 19
17
23
Table 2. Temperature and moisture treatments for soils from the heated plot. Each treatment is
further divided into 4 categories based on soil layer and incubation time. The total number of
samples (soil from both heated and control plots) is 108.
Treatment Temperature °C
Gravimetric
Water
Content %
# sub-
samples
10 20 30
Wk1 Wk2 Wk1 Wk2 Wk1 Wk2
5-
10
O 3 3 3 3 3 3
M 3 3 3 3 3 3
25 O 3 3 3 3 3 3
M 3 3 3 3 3 3
45 O 3 3 3 3 3 3
M 3 3 3 3 3 3
19
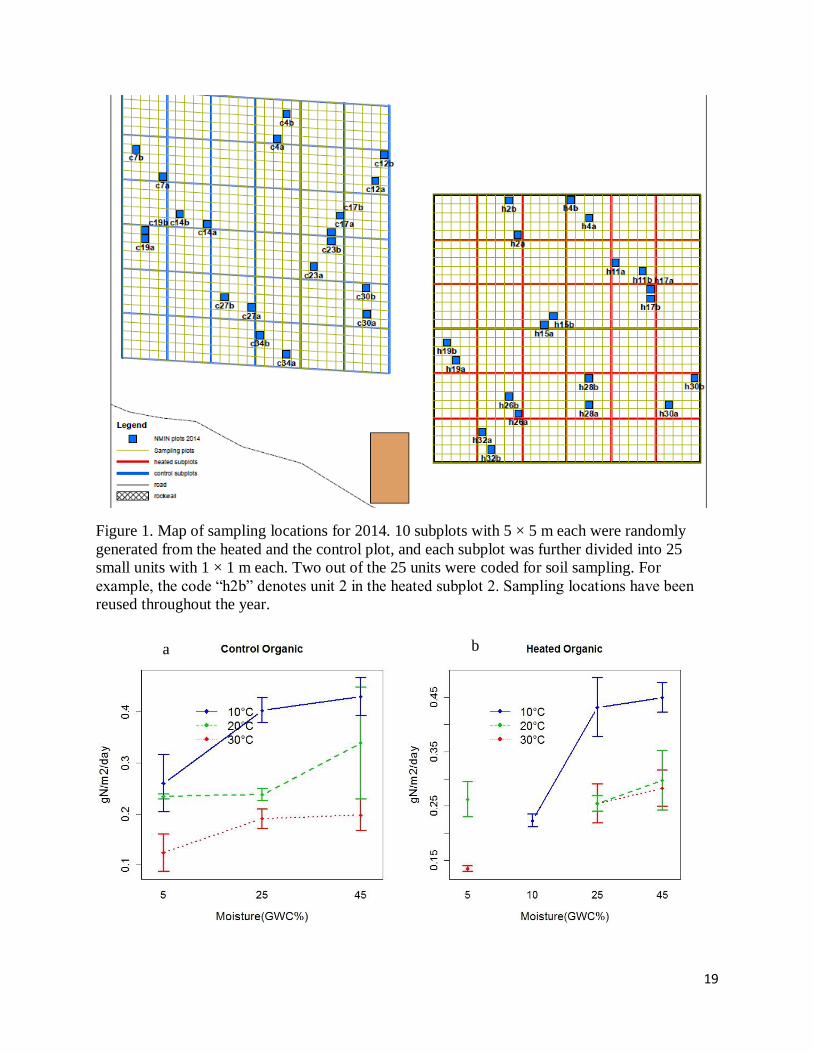
Figure 1. Map of sampling locations for 2014. 10 subplots with 5 × 5 m each were randomly
generated from the heated and the control plot, and each subplot was further divided into 25
small units with 1 × 1 m each. Two out of the 25 units were coded for soil sampling. For
example, the code “h2b” denotes unit 2 in the heated subplot 2. Sampling locations have been
reused throughout the year.
a b
o
te
t
h
e
l
o
w
e
st
m
o
is
t
u
r
e
tr
e
20
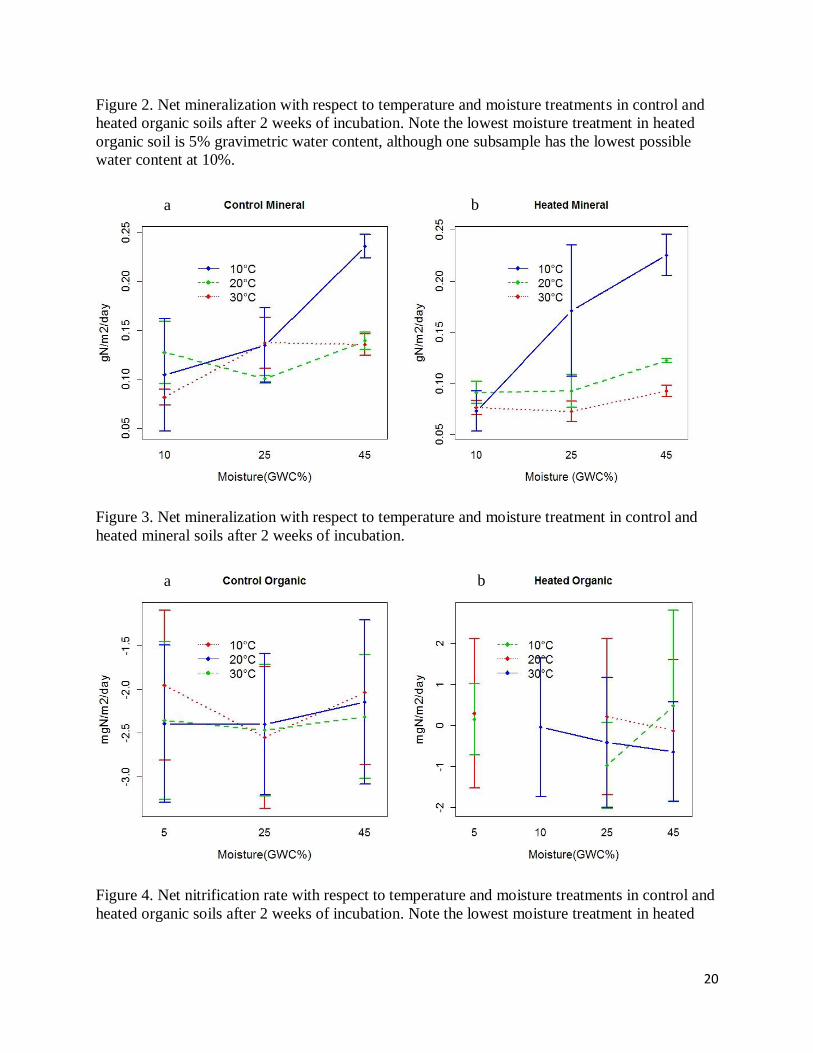
Figure 2. Net mineralization with respect to temperature and moisture treatments in control and
heated organic soils after 2 weeks of incubation. Note the lowest moisture treatment in heated
organic soil is 5% gravimetric water content, although one subsample has the lowest possible
water content at 10%.
Figure 3. Net mineralization with respect to temperature and moisture treatment in control and
heated mineral soils after 2 weeks of incubation.
Figure 4. Net nitrification rate with respect to temperature and moisture treatments in control and
heated organic soils after 2 weeks of incubation. Note the lowest moisture treatment in heated
a
o
te
t
h
e
l
o
w
e
st
m
o
is
t
u
r
e
tr
e
at
m
e
n
t
i
n
h
e
at
e
d
o
r
g
a
n
ic
s
o
il
a
a
a
b
a
o
te
t
h
e
l
o
w
e
st
m
o
is
t
u
r
e
tr
e
at
m
e
a
a
a
b
21
organic soil is 5% gravimetric water content, although one subsample has the lowest possible
water content at 10%.
Figure 5. Net mineralization with respect to temperature and moisture treatment in control and
heated mineral soils after 2 weeks of incubation.
Figure 6. CO2 efflux with respect to temperature and moisture treatment in control and heated
organic soils after 2 weeks of incubation. Note the lowest moisture treatment in heated organic
soil is 5% gravimetric water content, although one subsample has the lowest possible water
content at 10%.
a
o
te
t
h
e
l
o
w
e
st
m
o
is
t
u
r
e
tr
e
at
m
e
n
t
i
n
h
e
at
e
d
o
r
g
a
n
ic
s
o
il
is
5
a
a
a
a
o
te
t
h
e
l
o
w
e
st
m
o
is
t
u
r
e
tr
e
at
m
e
n
t
a
a
a
b
b
22
Figure 7. CO2 efflux with respect to temperature and moisture treatment in control and heated
mineral soils after 2 weeks of incubation.
Figure 8. Linear and non-linear local regressions between net mineralization rate at wk1 and wk
2 of incubation in control organic soil. The smoothing curve and linear regression line coincide.
R2 = 0.72.
a
o
te
t
h
e
l
o
w
e
st
m
o
is
t
u
r
e
tr
e
at
m
e
n
t
i
n
h
e
at
e
d
o
r
g
a
n
ic
s
o
il
is
5
%
a
a
a
b
23
Figure 9. Linear and non-linear local regressions between net mineralization rate at wk1 and wk
2 of incubation in control mineral soil. The local fitting lines do not connect to form a smoothing
curve, suggesting that points are too scattered to give a consistent pattern. R2 = 0.24.
24
Figure 10. Linear and non-linear local regressions between net mineralization rate at wk1 and wk
2 of incubation in heated organic soil. R2 = 0.52.
Figure 11. Linear and non-linear local regressions between net mineralization rate at wk1 and wk
2 of incubation in heated mineral soil. R2 = 0.77
25
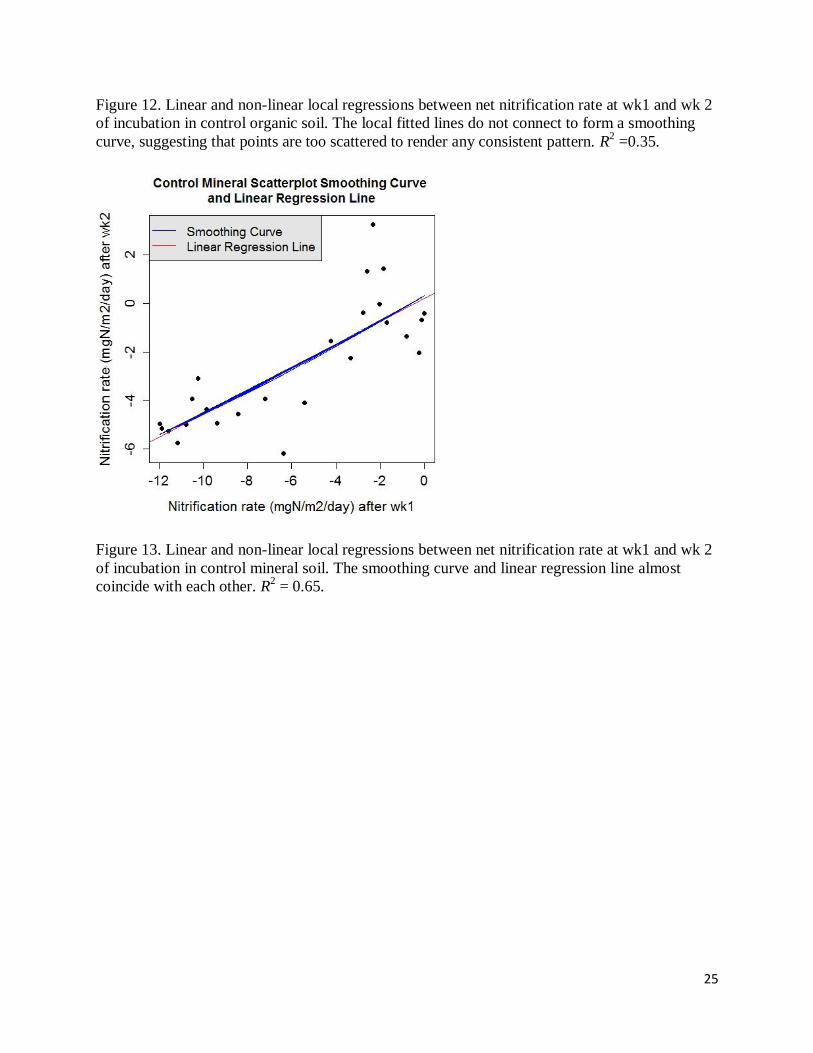
Figure 12. Linear and non-linear local regressions between net nitrification rate at wk1 and wk 2
of incubation in control organic soil. The local fitted lines do not connect to form a smoothing
curve, suggesting that points are too scattered to render any consistent pattern. R2 =0.35.
Figure 13. Linear and non-linear local regressions between net nitrification rate at wk1 and wk 2
of incubation in control mineral soil. The smoothing curve and linear regression line almost
coincide with each other. R2 = 0.65.
26
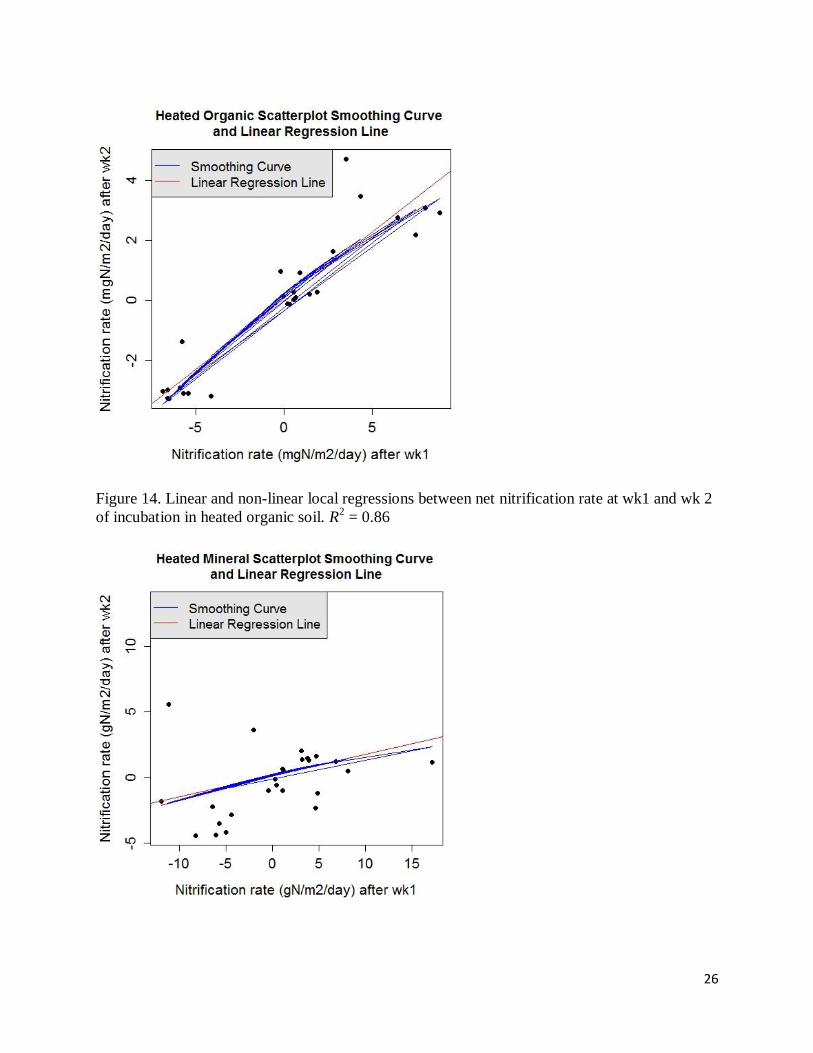
Figure 14. Linear and non-linear local regressions between net nitrification rate at wk1 and wk 2
of incubation in heated organic soil. R2 = 0.86
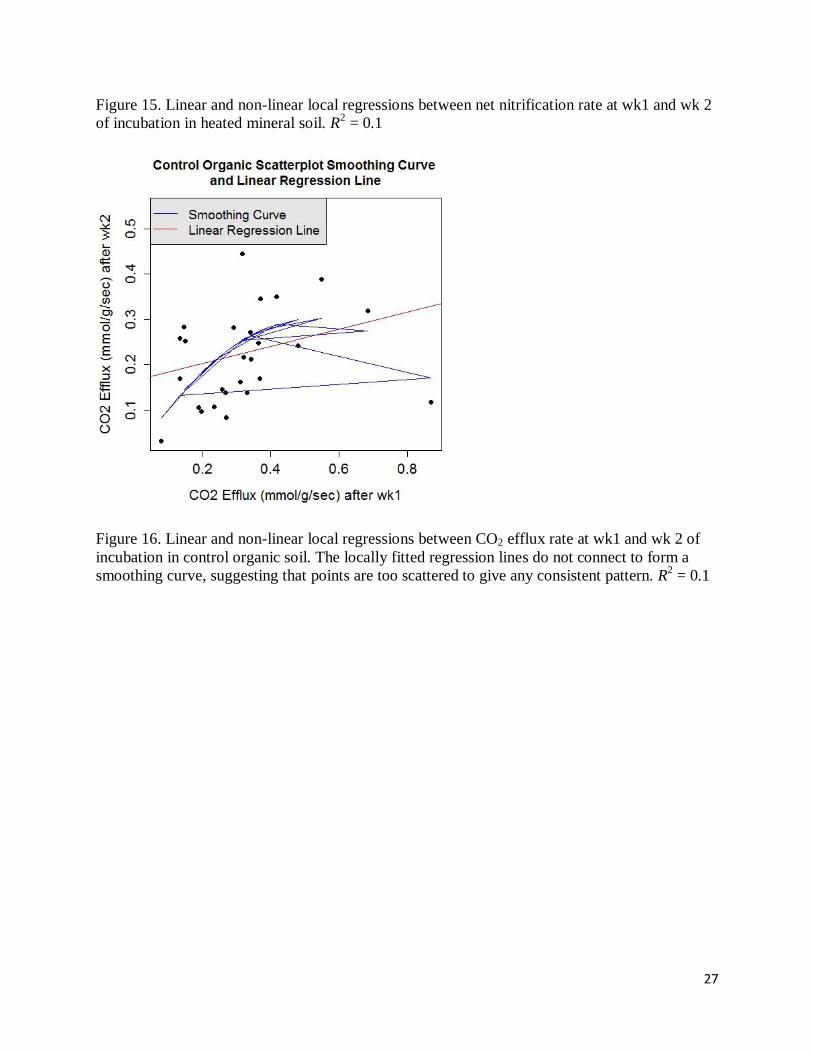
27
Figure 15. Linear and non-linear local regressions between net nitrification rate at wk1 and wk 2
of incubation in heated mineral soil. R2 = 0.1
Figure 16. Linear and non-linear local regressions between CO2 efflux rate at wk1 and wk 2 of
incubation in control organic soil. The locally fitted regression lines do not connect to form a
smoothing curve, suggesting that points are too scattered to give any consistent pattern. R2 = 0.1
28
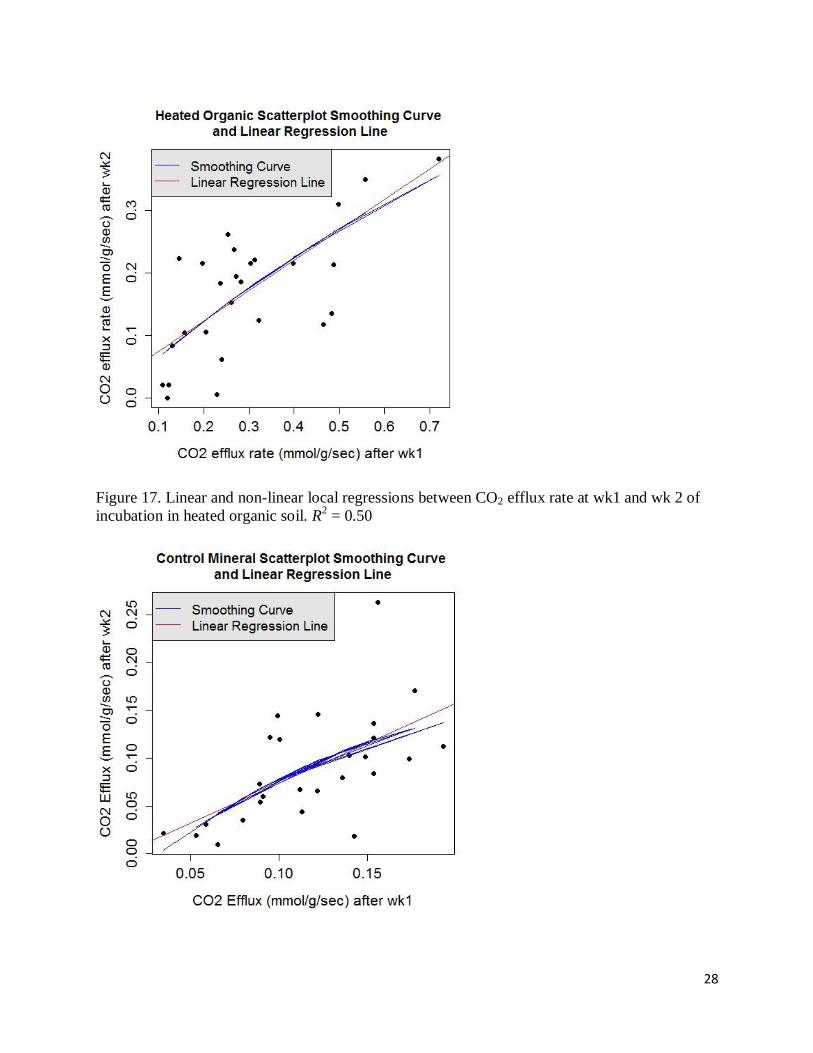
Figure 17. Linear and non-linear local regressions between CO2 efflux rate at wk1 and wk 2 of
incubation in heated organic soil. R2 = 0.50
29
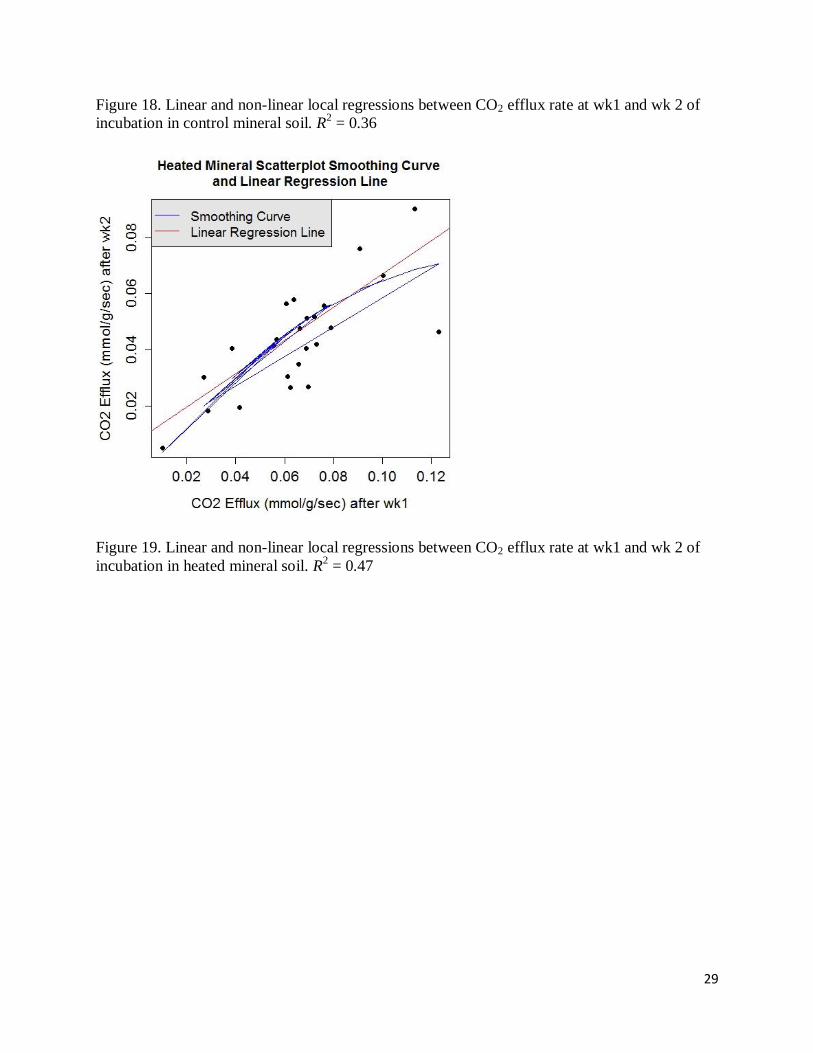
Figure 18. Linear and non-linear local regressions between CO2 efflux rate at wk1 and wk 2 of
incubation in control mineral soil. R2 = 0.36
Figure 19. Linear and non-linear local regressions between CO2 efflux rate at wk1 and wk 2 of
incubation in heated mineral soil. R2 = 0.47