Embed Size (px)
Citation preview

Ammonia and its influence on nitrogen deposition and fine particle formation
Jeffrey L. Collett, Jr. Atmospheric Science Department, Colorado State University

Acknowledgments • People
– CSU: Katie Benedict, Yi, Li, Tony Prenni, Ashley Evanoski-Cole, Derek Day, Florian Schwandner, Suresh Raja, Taehyoung Lee, Amy Sullivan, Kip Carrico, Sonia Kreidenweis
– NPS: Bret Schichtel, William Malm – ARS: Mark Tigges, John Molenar, Stephen Holcomb, Cassie Archuleta,
Lincoln Sherman – Shell: Angela Zivkovich – UC Davis: Chuck McDade, Jose Mojica, Mark van de Water – RTI: Eva Hardison, David Hardison
• Funding – U.S. National Park Service – U.S. Department of Agriculture – Shell Exploration and Production Company

Reactive nitrogen emissions
• Nitrogen oxides – NOx = NO + NO2 – Formed by high temperature
reaction of N2 and O2
– NOx reacts in the atmosphere to form nitric acid (HNO3) and other species
• Ammonia (NH3) • Livestock and fertilizer are
largest sources
NH3 emission sources
USEPA (2004)
USEPA
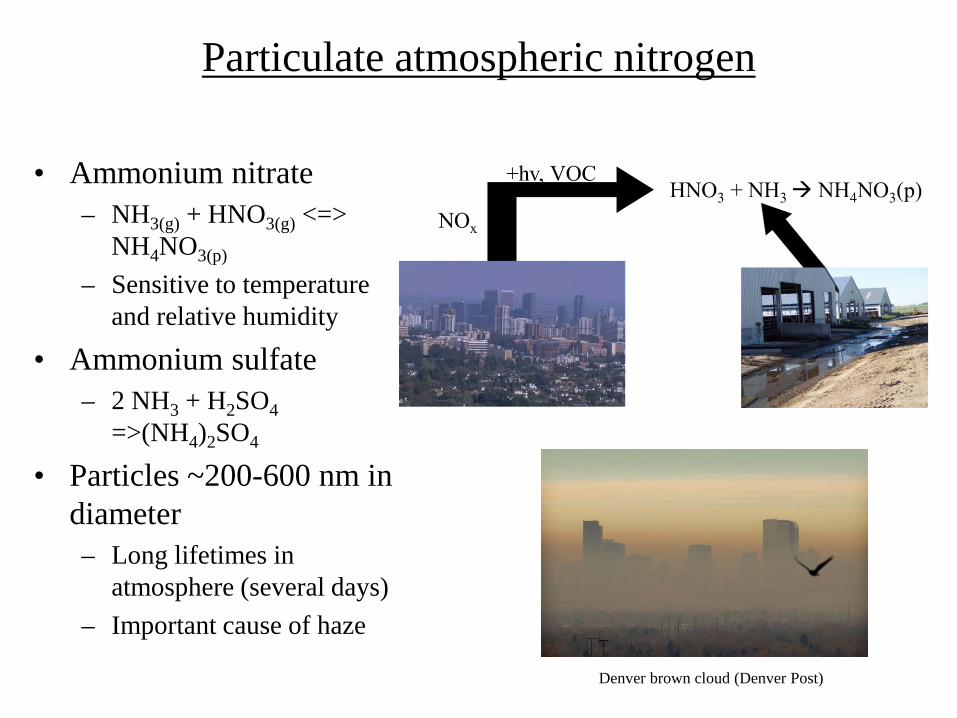
Particulate atmospheric nitrogen
• Ammonium nitrate – NH3(g) + HNO3(g) <=>
NH4NO3(p) – Sensitive to temperature
and relative humidity
• Ammonium sulfate – 2 NH3 + H2SO4
=>(NH4)2SO4
• Particles ~200-600 nm in diameter – Long lifetimes in
atmosphere (several days) – Important cause of haze
Denver brown cloud (Denver Post)

Reactive nitrogen deposition
• Wet deposition – Precipitation scavenges gases
and particles and deposits them on surface
– Easier to measure
• Dry deposition – Difficult/expensive to measure – Estimate as product of
measured concentration and modeled deposition velocity
– Gas/particle partitioning is key • Vd,NH3 >> Vd,NH4+
• Vd,HNO3 >> Vd,NO3-
Hand et al. (2011) IMPROVE report
HISTORICAL CHANGES IN REACTIVE N WET DEPOSITION

Nitrate Ion Wet Deposition
http://nadp.sws.uiuc.edu/data/
1995-97 1984-86
2003-05 2007-09

Ammonium Ion Wet Deposition
http://nadp.sws.uiuc.edu/data/
1995-97 1984-86
2003-05 2007-09

Changes in NH4+ wet deposition
NH4+
Lehmann et al., 2005

Changes in NO3- wet deposition and
NOx emissions
Lehmann and Gay, 2011
NO3- NOx
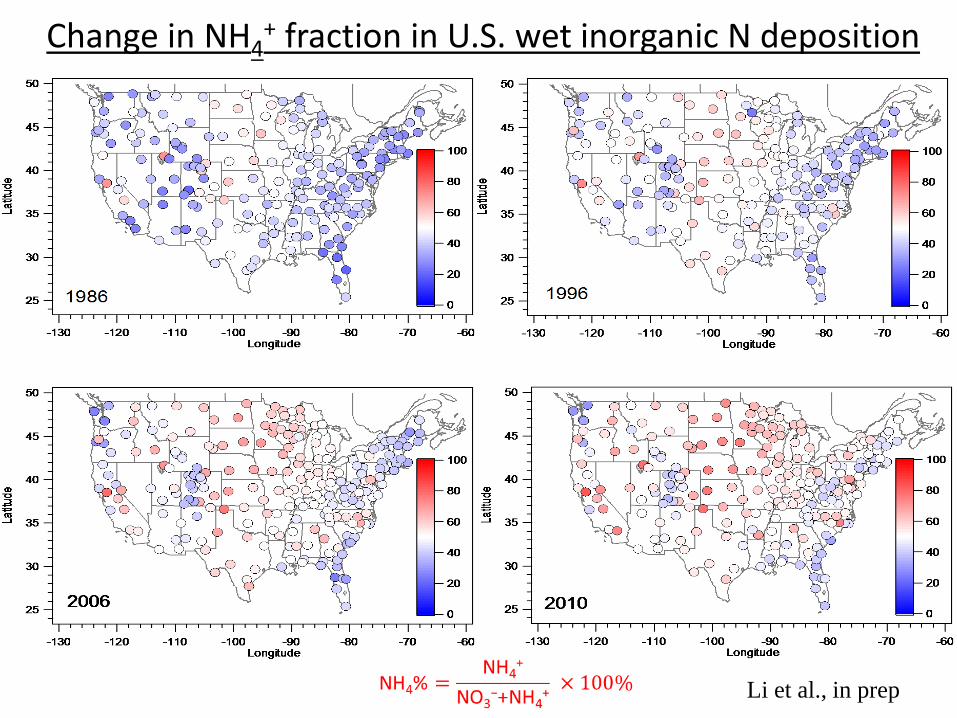
Change in NH4+ fraction in U.S. wet inorganic N deposition
Li et al., in prep
THE IMPORTANCE OF NH3 FOR N DEPOSITION AND PARTICLE FORMATION: A FEW EXAMPLES

Concerns about nitrogen deposition

RoMANS (Rocky Mountain Airborne Nitrogen and Sulfur) Study
• Major field studies – Spring
and Summer 2006
– 2008-09

RoMANS 2006 core site wet deposition
•Spring flux dominated by single event -- summer flux contributed by several events •Substantial oxidized, reduced, and organic N

Spring overview
• Strong concentration gradient
• Low concentrations west of RMNP
• High concentrations east of RMNP
• Ammonia peaks in NE Colorado

0
20
40
60
80
100
120
140
3/29 3/30 3/31 4/1 4/2 4/3 4/4 4/5 4/6 4/7 4/8 4/9 4/10 4/11 4/12 4/13 4/14 4/15 4/16 4/17 4/18 4/19 4/20 4/21 4/22 4/23 4/24 4/25 4/26 4/27 4/28 4/29 4/30 5/1
Date
Con
c.(n
eq/m
3)
SO4= NO3- NH4+
RMNP particle timelines
• Highly variable concentrations • Pollutant mix (sulfate, nitrate, and ammonium) varies
between episodes
Sulfate dominated
Mix of sulfate and
nitrate
Nitrate dominated

A closer look… • Ammonium nitrate episodes associated with upslope flow
from east of RMNP
0
20
40
60
80
100
120
140
4/20 4/21 4/22 4/23 4/24 4/25 4/26 4/27
Date
neq
/m3
0
90
180
270
360
WD
(D
eg
ree)
SO4= NO3- NH4+ WD 30 per. Mov. Avg. (WD)
precip
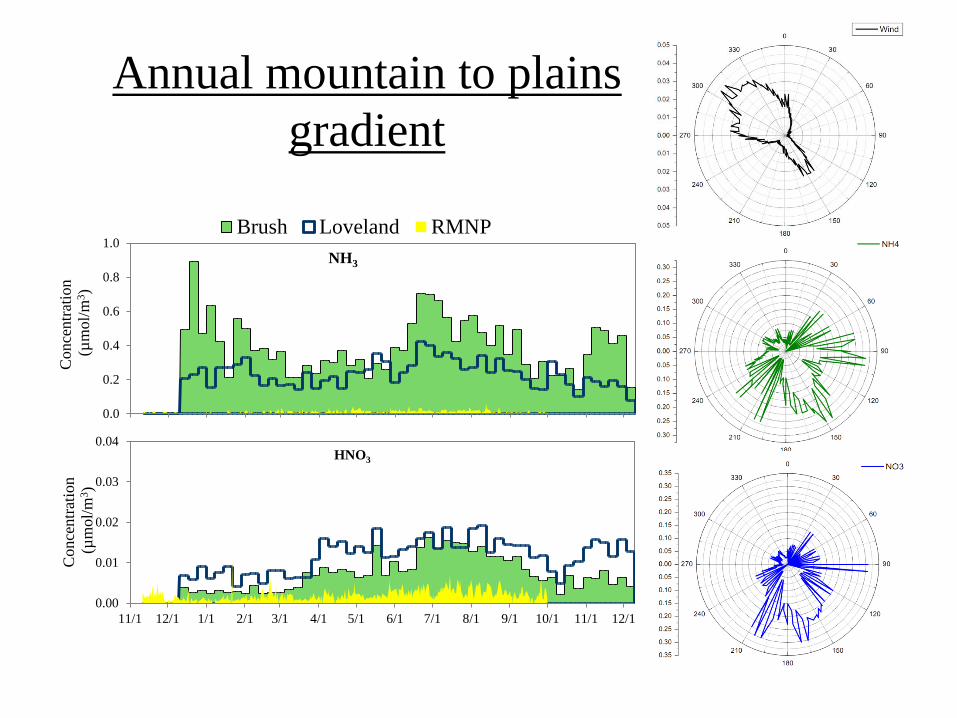
Annual mountain to plains gradient
0.0
0.2
0.4
0.6
0.8
1.0
Con
cent
ratio
n (µ
mol
/m3 )
NH3
Brush Loveland RMNP
0.00
0.01
0.02
0.03
0.04
11/1 12/1 1/1 2/1 3/1 4/1 5/1 6/1 7/1 8/1 9/1 10/1 11/1 12/1
Con
cent
ratio
n (µ
mol
/m3 )
HNO3

RMNP reactive N concentrations
0.00.20.40.60.81.01.21.41.61.82.0
11/1
1/08
11/2
5/08
12/9
/08
12/2
3/08
1/6/
09
1/20
/09
2/3/
09
2/17
/09
3/3/
09
3/17
/09
3/31
/09
4/14
/09
4/28
/09
5/12
/09
5/26
/09
6/9/
09
6/23
/09
7/7/
09
7/21
/09
8/4/
09
8/18
/09
9/1/
09
9/15
/09
9/29
/09
10/1
3/09
10/2
7/09
11/1
0/09
Con
cent
ratio
n (µ
g/m
3) NH4
NH3
Benedict et al., 2013a
0.0
0.5
1.0
1.5
2.0
2.5
3.0
11/1
1/08
11/2
5/08
12/9
/08
12/2
3/08
1/6/
09
1/20
/09
2/3/
09
2/17
/09
3/3/
09
3/17
/09
3/31
/09
4/14
/09
4/28
/09
5/12
/09
5/26
/09
6/9/
09
6/23
/09
7/7/
09
7/21
/09
8/4/
09
8/18
/09
9/1/
09
9/15
/09
9/29
/09
10/1
3/09
10/2
7/09
11/1
0/09
Con
cent
ratio
n (µ
g/m
3) NO3
HNO3

RMNP seasonal dry deposition budget
0.00
0.02
0.04
0.06
0.08
0.10
0.12
0.14
Jan.
Feb.
Mar
.
Apr
.
May
June
July
Aug
.
Sept
.
Oct
.
Nov
.
Dec
.
Dep
ositi
on (k
g N
/ha)
Dry HNO3 Dry NH3 Dry NO3 Dry NH4
• Ammonia deposition most important; spring and summer peaks
Benedict et al., 2013a

RMNP N deposition – annual budget
• Wet deposition biggest contributor to N deposition
• Dry deposition
strongly dominated by NH3
0.0 0.2 0.4 0.6 0.8 1.0 1.2 1.4
Dry NO3
Dry ON
Dry NH4
Dry HNO3
Wet ON
Dry NH3
Wet NO3
Wet NH4
Total Deposition 11/08-11/09 (kg N/ha)
Particle ON only
Benedict et al., 2013a

The 2011 Grand Teton Reactive Nitrogen Deposition Study
(GrandTReNDS)
Craters of the Moon AMoN
Driggs (DR)
Clarisse et al. (2009) IASI satellite NH3
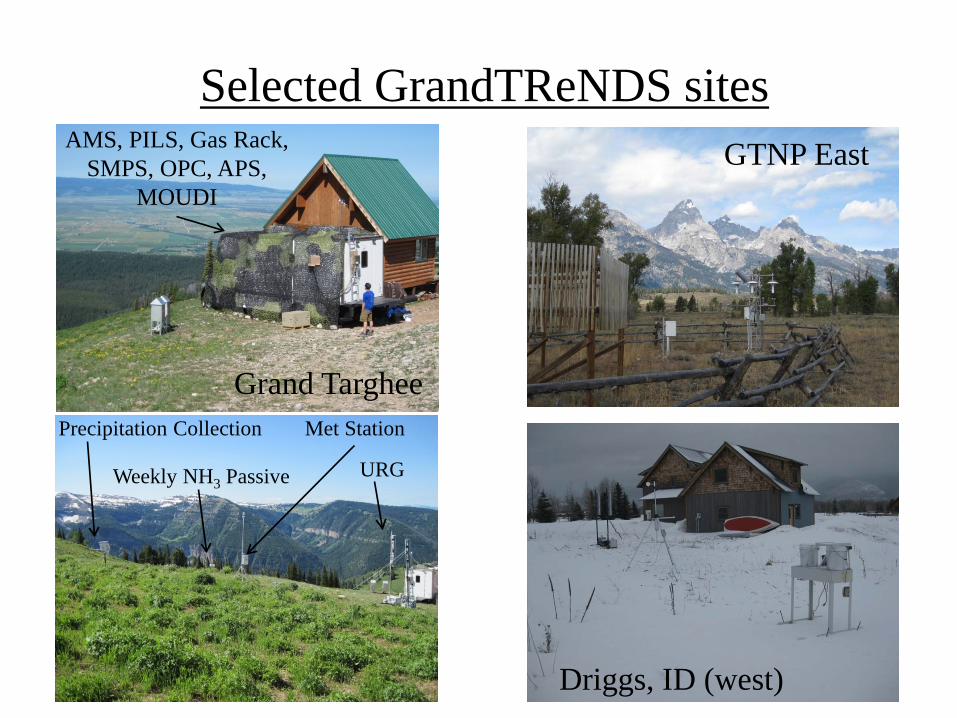
Selected GrandTReNDS sites
Precipitation Collection Met Station
URG
AMS, PILS, Gas Rack, SMPS, OPC, APS,
MOUDI
Weekly NH3 Passive
Grand Targhee
Driggs, ID (west)
GTNP East
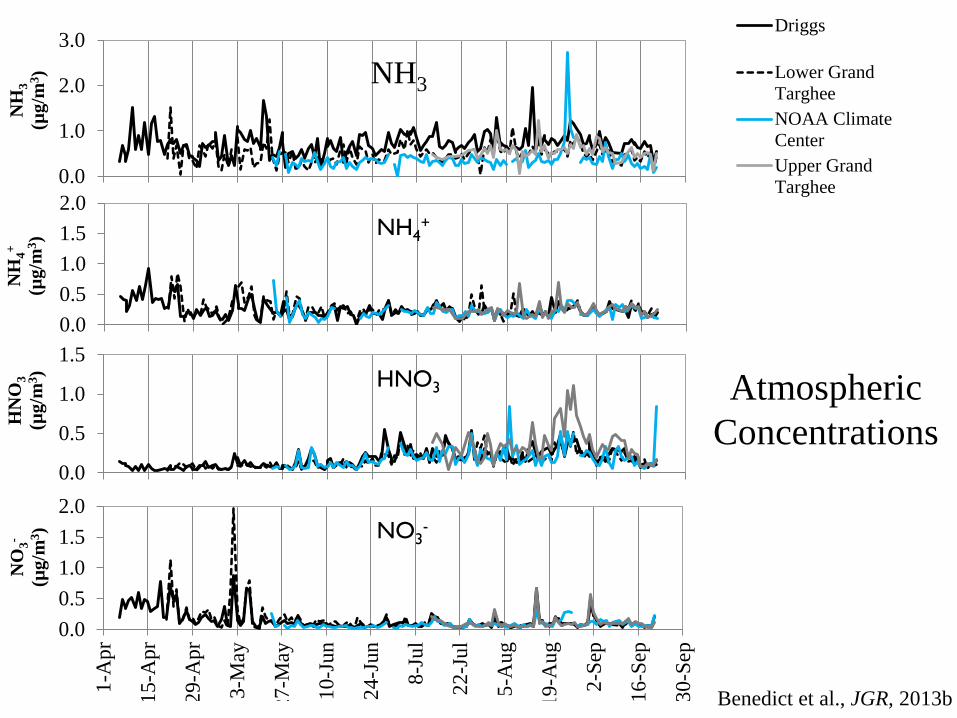
Atmospheric Concentrations
0.0
1.0
2.0
3.0N
H3
(µg/
m3 )
Driggs
Lower GrandTargheeNOAA ClimateCenterUpper GrandTarghee
0.0
0.5
1.0
1.5
HN
O3
(µg/
m3 )
HNO3
0.00.51.01.52.0
NH
4+ (µ
g/m
3 ) NH4
+
0.00.51.01.52.0
1-A
pr
15-A
pr
29-A
pr
3-M
ay
27-M
ay
10-J
un
24-J
un
8-Ju
l
22-J
ul
5-A
ug
19-A
ug
2-Se
p
16-S
ep
30-S
ep
NO
3-
(µg/
m3 )
NO3-
NH3
Benedict et al., JGR, 2013b

GrandTReNDS deposition budgets
• Reduced nitrogen comprises 50-80% of the N deposition budget – even more important here
than in Rocky Mountain National Park
Benedict et al., JGR, 2013b

Long-term measurements of the NHx-NOx-SOx system in Boulder, WY – one of the largest
U.S. natural gas producing regions
CSU, Air Resource Specialists, Shell

Reduced nitrogen shows typical summer max
Oxidized nitrogen shows unusual winter max tied to
winter photochemical smog
How much NH3 is available to react with NOx oxidation products to generate fine particles and lead to haze
formation?
Li et al., Atmos. Env., 2013
NH3(g) + NH4+(p) HNO3(g) + NO3
-(p)

Li et al., Atmos. Env., 2013
• Active winter photochemistry produces high ozone and nitric acid • Winter fine particle nitrate formation limited by ammonia availability

https://www.dmr.nd.gov/oilgas/
Oil Production in North Dakota
Bakken Shale Oil and Gas Development

Air quality in the Bakken shale region
Winter fine particle nitrate increasing in parts of western U.S.
Winter 2013 study conducted across region of
extensive oil well drilling to examine air quality impacts
From J. Hand

05
101520 Knife River (KNRI)
05
101520 Medicine Lake (MELA)
Bakken Particle Composition Co
ncen
trat
ion
(µg
m-3
)
Sampling Date
Episode 1 Episode 2
05
101520 Theodore Roosevelt North Unit (THRO-N)
Nitrite Chloride Sodium Potassium Magnesium Calcium Ammonium Nitrate Sulfate
05
101520 Fort Union (FOUN)

Does ammonia limit NH4NO3 formation in Bakken?
0
0.2
0.4
0.6
0.8
1
NH
3 / (N
H4+ +
NH
3) FOUS THRO-N
• Ammonia nearly depleted in Theodore Roosevelt National Park during episode 1, but not episode 2.
• Excess ammonia always available at Fort Union.
• HNO3 currently limits NH4NO3 formation
1 2

HOW CAN WE ROUTINELY MEASURE NH3 AND NH4
+ ?

U.S. network measurements of inorganic N species concentrations
• NO3-
– CASTNet quantifies PM2.5 deposition – PM2.5 concentrations also measured by IMPROVE and CSN
• HNO3 – CASTNet quantifies weekly concentration/deposition
• NH4+
– CASTNet quantifies weekly concentration/deposition • NH3
– AMoN (bi-weekly) – Regional networks (e.g., SEARCH) – Short-term/special studies

Radiello passive NH3 samplers
• Inexpensive • Greater spatial
coverage • ~1-2 week time
resolution • Excellent precision
and good accuracy • NH3 only
Replicate passives
Passive vs. denuder

NE Colorado spatial NH3 gradients
Li et al., in prep
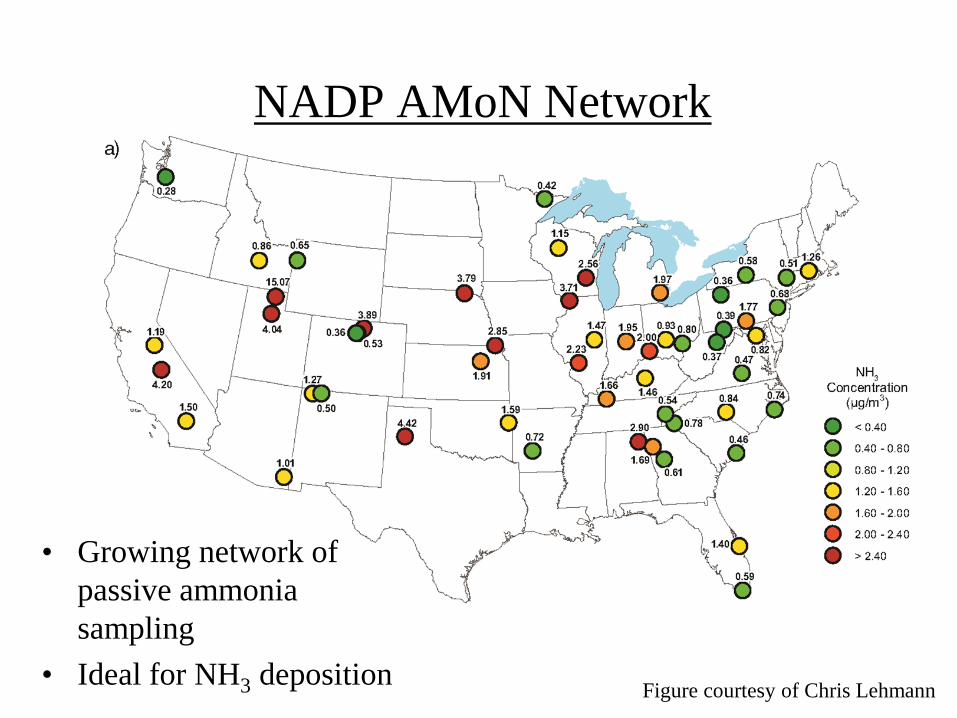
NADP AMoN Network
• Growing network of passive ammonia sampling
• Ideal for NH3 deposition Figure courtesy of Chris Lehmann

Limitations to AMoN passive sampling approach
• Low time resolution (1-2 weeks is typical) makes source attribution difficult
• Does not measure NH4
+
– Leaves total NHx burden unconstrained – Limits ability to understand PM formation – Limits ability to validate model simulations

Pilot IMPROVE NHx network
• Rocky Mountain focus • 9 sites, 1-in-3
day sampling • 4/2011 - 8/2012
• Single phosphorous acid-coated filter to capture NH4
+ + NH3

• Good accuracy vs. reference URG denuder/filter-pack (denuder + filter + backup denuder)
• Excellent field precision demonstrated by co-located samplers
NHx measurement quality

• Highest concentrations at eastern and southern sites
• Seasonal cycle apparent at all sites
• Fall/winter secondary max in ag regions
• Fire influence at Chiricahua in 2011
Chen et al., 2014
IMPROVE NHx data overview

Total N deposition budgets: wet + dry
Li et al., in prep

Anticipated future emissions changes will make NHx increasingly even more important
Ellis et al., 2012
NOx expected to decrease while NH3 increases

Summary • Ammonia is an important contributor to dry & wet deposition of reactive N
• As NOx emissions decrease, NHx is an increasingly important component of N deposition
• Ammonia also a key factor affecting PM acidity and NH4NO3 formation – Abundant ammonia supports greater
NH4NO3 PM formation and haze
• Network measurements needed to routinely characterize NH3 and NH4
+ at higher time resolution to – Understand PM formation – Validate air quality models – Attribute source contributions

Increase in NH4+ fraction
• A sizable increase in the NH4+ fraction (absolute % change) of wet inorganic
nitrogen deposition is seen across most of the country (2010 – 1989)