Embed Size (px)
Citation preview

Helsinki University of Technology Building Materials Technology Report 19
Teknillinen korkeakoulu Rakennusmateriaalitekniikka Julkaisu 19
Espoo 2005
INFLUENCE OF MOISTURE AND SUBSTRATE
ON THE EMISSION OF VOLATILE ORGANIC
COMPOUNDS FROM WALL STRUCTURES
Leif Wirtanen

Helsinki University of Technology Building Materials Technology Report 19
Teknillinen korkeakoulu Rakennusmateriaalitekniikka Julkaisu 19
Espoo 2005
INFLUENCE OF MOISTURE AND SUBSTRATE
ON THE EMISSION OF VOLATILE ORGANIC
COMPOUNDS FROM WALL STRUCTURES
Leif Wirtanen Dissertation for the degree of Doctor of Technology to be presented with due permission for public
examination and debate in Auditorium R3 at Helsinki University of Technology (Espoo, Finland)
on the 27th of January 2006, at 12 o’clock noon.
Helsinki University of Technology
Department of Civil and Environmental Engineering
Laboratory of Building Materials Technology
Teknillinen korkeakoulu
Rakennus- ja ympäristötekniikan osasto
Rakennusmateriaalitekniikan laboratorio

Jakelu: Teknillinen korkeakoulu
Rakennusmateriaalitekniikan laboratorio
PL 2100
02015 TKK
Puh. 09-451 3711
Fax. 09-451 3826
E-mail: [email protected]
ISBN 951-22-8011-6
ISBN 951-22-8052-3 (PDF)
ISSN 1455-5948
Edita Prima Oy
Helsinki 2005
Cover picture: Wolkoff & Nielsen (2001) Atmospheric Environment, 35, 26, p. 4411
3
Wirtanen, L. 2005. Influence of moisture and substrate on the emission of volatile organic compounds from wall structures. Helsinki University of Technology, Laboratory of Building Materials Technology, Report 19, 194 p. + app. 127 p. UDC 691.5:628.86:504.064.2:547 Keywords: Volatile Organic Compounds, VOC, emission, moisture, substrate, primer, paint, adhesive, gypsum board, filler, plaster ABSTRACT Volatile organic compounds, VOCs, are released from a multitude of different polymer-based building materials. They can cause adverse health effects such as irritation of eyes, nose and throat, headache, fatigue, dizziness, sinus congestion, allergic reactions, and respiratory infections. This study concentrates on the influence of moisture and substrate on the emissions of VOCs from common wall structures. The structures are made up of primers and paints or adhesives applied onto either gypsum board or a combination of filler and plaster (or a single layer of plaster) which is applied onto calcium silicate bricks. An inert substrate, glass, is used as a reference substrate for single layers of paints, adhesives or plasters, and combinations of primer and paint and filler and plaster.
The experimental section of this study is preceded by a literature review where the different factors affecting the emission process is dealt with. The literature review also includes the elaboration of a mathematical model describing the emission process.
Small environmental chambers were developed for the experiments. The relative humidity of the air introduced into the chambers, the air exchange rate, and the air flow velocity over the sample surfaces could be easily controlled. Samples were exposed to different moisture conditions by adjusting the relative humidity of the air introduced into the chambers and by the use of different substrates. The emitted compounds were collected both from the chamber air and from the surface of the samples by using a Field and Laboratory Emission Cell into stainless steel tubes containing Tenax TA adsorbent.
Other tests performed in this study included infrared spectroscopy, mercury intrusion porosimetry, microscopy, and the determination of pH. These tests were mainly performed to derive additional information on the chemical and physical characteristics of the materials studied.
The experimental results demonstrated that the emission of VOCs from a surface layer is affected especially by the substrate, primer included, and by the drying process of both the substrate and the surface layer. The use of gypsum board as a substrate for either combinations of primer and paint or adhesives resulted in the lowest emission rates, while the use of a combination of filler and plaster or a single layer of plaster applied onto calcium silicate brick as a substrate resulted either in higher or lower emission rates compared with the glass (reference substrate) depending on the emission characteristics of the combination of filler and plaster. The experimental results indicated also that a high relative humidity prolongs the drying process, thus affecting the emissions because of interactions of water molecules with other emitting compounds. The consequence of this is that different compounds are emitted at different points of time.
There was a statistically significant difference after the samples had reached moisture equilibrium only in the emission rate of aldehydes at RH 20 % and RH 80 % target relative humidities for samples collected from the test chambers. The emission rate was higher for the higher humidity environment. This result applied only when different combinations of primer and paint were spread onto glass plates.
The experimental results additionally confirmed that TVOC, the total amount of VOCs being released, is not a good estimate of the behaviour of the emission of single compounds, since their behaviour, as regards relative humidity, can not always be determined based on TVOC-values. Nevertheless, it has been proven that it is possible to reach low emission rates, i.e. TVOC-values < 30 μg/m²·h, in less than two weeks with an appropriate choice of materials and by ensuring good drying conditions.

4

5
ACKNOWLEDGMENTS The present study was carried out at the Laboratory of Building Materials Technology at Helsinki University of Technology during January 2002 and December 2004. The study has been financially supported by the Academy of Finland, the Ministry of Social Affairs and Health, the Jenny and Antti Wihuri Foundation, and the Finnish Work Environment Fund. The financial supporters are gratefully acknowledged. I would like to thank my supervisor, Professor Vesa Penttala, for his support during the work, which covers a rather new discipline of the laboratory's expertise. The official referees of my thesis, Professor, Head of Department Anna-Liisa Pasanen at the Kuopio Regional Institute of Occupational Health and Docent, Head of Laboratory, Tapani Tuomi at the Uusimaa Regional Institute of Occupational Health are gratefully acknowledged for their constructive criticism and helpful comments. I would also like to express my gratitude to Dr. Derrick Crump at the Building Research Establishment, Centre for Safety, Health and Environment for agreeing to act as opponent during the defense of the thesis. I would like to thank Mr. Markku Sivukari, Mr. Pertti Alho and Mr. Jarmo Vihervuori for their help with the design of the environmental chambers. Mr. Pertti Alho also helped me by running the MIP-tests, for which he is warmly acknowledged. Thank you to Mr. Fahim Al-Neshawy who helped me with software issues and made the nice pictures presenting the experimental setup. D.Sc. Andrzej Cwirzen is warmly acknowledged for helping me with ESEM imaging and EDX-analysis. D.Sc. Minna Nieminen and Ms. Mia Löija are warmly thanked for guiding me with the analysis of the FTIR-spectra. Mr. Jari Pukkila and the staff at the National Bureau of Investigation are acknowledged for carrying out the FTIR-analysis of the primer, paint and adhesive samples. Mrs. Beatrice Bäck, Mr. Juha Svinhufvud, Ms. Hanna Hovi and the rest of the staff at the Uusimaa Regional Institute of Occupational Health are warmly acknowledged for analysing hundreds of VOC-samples and for the fruitful discussions we had during this project. Finally, I would like to express my warmest gratitude to Mr. Karri Mäkinen, Ms. Kristina Saarela, Mr. Mika Tulimaa and all my colleagues and friends who have supported me during this work.
Thank you, my parents, Pertti and Brita who made this possible in the first place!
...to Heidi and Ebba, the loves of my life
Leif Wirtanen, Espoo, November 2005
6
ABSTRACT 3 ACKNOWLEDGMENTS 5 CONTENTS 6 ABBREVIATIONS AND NOTATIONS 11 1 INTRODUCTION 14 2 MATERIALS 15
2.1 PAINTS 15 2.1.1 Pigments and fillers 15 2.1.2 Film formers 16 2.1.2.1 Alkyd resins 16 2.1.2.2 Polymer dispersions 17 2.1.3 Solvents and dispersants 17 2.1.4 Paint additives 18
2.2 ADHESIVES 19 2.2.1 Bulk polymers 20 2.2.2 Polyvinyl acetate 20 2.2.3 Adhesive additives 21
2.3 FILLERS, PLASTERS AND PLASTERBOARD 22 2.3.1 Fillers and plasters 22 2.3.2 Plasterboard 22
3 EMISSIONS FROM MATERIALS AND STRUCTURES 23
3.1 EVAPORATION AND DIFFUSION 24 3.1.1 Molecular migration 24 3.1.2 Rate of emission 25 3.1.3 Factors affecting the emission process 26 3.1.4 Substrate effects 29 3.2 COMPUTATIONAL MODELLING 29 3.2.1 Surface emission 30 3.2.2 Internal diffusion 32 3.2.3 Model development 33 3.2.3.1 Surface evaporation 33 3.2.3.2 Internal diffusion 35 3.2.3.3 Sinks 36 3.2.3.4 Relative humidity 37 3.2.3.5 Model parameters 38

7
4 INFLUENCE OF MOISTURE ON EMISSIONS 42 4.1 POLARITY, HYDROPHILICITY AND LIPOPHILICITY 42 4.2 THE INFLUENCE OF MOISTURE ON THE SORPTION OF 43 ORGANIC COMPOUNDS 4.3 THE INFLUENCE OF MOISTURE ON EMISSIONS 46 5 OBJECTIVES OF THE EXPERIMENTAL STUDY 52 6 MATERIALS AND EXPERIMENTAL SETUP 53 6.1 FOURIER TRANSFORMED INFRARED SPECTROMETRY (FTIR) 55 6.1.1 Primers, paints and adhesives 55 6.1.2 Fine mortar, plasters and gypsum board 55 6.1.3 FTIR-sample analysis 56 6.2 MICROSCOPY 57 6.2.1 Light microscopy 57 6.2.2 Environmental Scanning Electron Microscopy (ESEM) 57 6.3 MERCURY INTRUSION POROSIMETRY (MIP) 57 6.4 pH-MEASUREMENTS 59 6.5 EMISSION TESTING 59 6.5.1 Sample preparation 59 6.5.1.1 Primers and paints 59 6.5.1.2 Adhesives 60 6.5.1.3 Fillers and plasters 60 6.5.2 Emission testing methods 60 6.5.2.1 Emission test chamber 60 6.5.2.2 Testing conditions 63 6.5.2.3 Field and Laboratory Emission Cell (FLEC) 64 6.5.3 VOC-sample collection 65 6.5.4 VOC-sample analysis 65 6.5.5 Data handling 66 6.5.6 Olfactory evaluation 66 7 EXPERIMENTAL RESULTS 68 7.1 FOURIER TRANSFORMED INFRARED SPECTROSCOPY (FTIR) 68 7.1.1 Primers and paints 68 7.1.2 Adhesives 71 7.1.3 Fillers, plasters and gypsum board 72 7.2 MICROSCOPY 75 7.2.1 Light microscopy 75 7.2.2 Environmental Scanning Electron Microscopy (ESEM) 75 7.3 MERCURY INTRUSION POROSIMETRY (MIP) 79 7.4 pH-MEASUREMENTS 83
8
7.5 RELATIVE HUMIDITY 84 7.5.1 Part I. Single material layers on a glass substrate 84 7.5.2 Part II. Material combinations on a glass substrate 86 7.5.3 Part III. Material combinations on gypsum board and CSB 88 7.6 WEIGHT CHANGES 91 7.6.1 Part I. Single material layers on a glass substrate 91 7.6.2 Part II. Material combinations on a glass substrate 93 7.6.3 Part III. Material combinations on gypsum board and CSB 94 7.7 VOC EMISSIONS 97 7.7.1 Background VOC concentrations 97 7.7.2 Part I. VOC emissions from single material layers on a glass 98 substrate 7.7.2.1 Paint A 98 7.7.2.2 Paint C 99 7.7.2.3 Adhesive A 101 7.7.2.4 Adhesive C 103 7.7.2.5 Plaster A 104 7.7.2.6 Plaster C 106 7.7.2.7 Gypsum board 107 7.7.3 Part II. VOC emissions from material combinations on a glass 109 substrate 7.7.3.1 Primer A and paint A 109 7.7.3.2 Primer B and paint B 110 7.7.3.3 Primer A and paint C 112 7.7.3.4 Primer C and paint C 114 7.7.3.5 Filler A and plaster A 116 7.7.3.6 Filler B and plaster B 118 7.7.3.7 A 6 mm layer of plaster C 119 7.7.3.8 Adhesive B 121 7.7.4 Part III. VOC emissions from material combinations on gypsum board and CSB 122 7.7.4.1 The combination of primer A and paint A spread onto 123 gypsum board 7.7.4.2 The combination of primer B and paint B spread onto 124 gypsum board 7.7.4.3 Adhesive A applied onto gypsum board 126 7.7.4.4 Adhesive B applied onto gypsum board 127 7.7.4.5 The combination of primer A and paint A spread onto 128 the combination of filler B and plaster B applied onto CSB 7.7.4.6 The combination of primer A and paint A spread onto 129 plaster C applied onto CSB 7.7.4.7 The combination of primer B and paint B spread onto 130

9
the combination of filler B and plaster B applied onto CSB 7.7.4.8 The combination of primer B and paint B spread onto 132 plaster C applied onto CSB 7.7.4.9 Adhesive A applied onto the combination of filler B and 133 plaster B applied onto CSB 7.7.4.10 Adhesive A applied onto plaster C applied onto CSB 134 77.4.11 Adhesive B applied onto the combination of filler B and 135 plaster B applied onto CSB 7.7.4.12 Adhesive B applied onto plaster C applied onto CSB 136 7.7.5 The influence of substrate on VOC-emissions from selected 137 materials and material combinations 7.7.5.1 Paint A and the combination of primer A and paint A 138 spread onto a glass plate 7.7.5.2 Paint C, the combination of primer A and paint C and the 139 combination of primer C and paint C spread onto a glass plate 7.7.5.3 Adhesives A and B applied onto a glass plate 141 7.7.5.4 Filler and plaster B, plaster C, and gypsum board applied 142 onto a glass plate 7.7.5.5 Primer and paint A and primer and paint B spread onto 144 glass and gypsum board 7.7.5.6 Adhesives A and B applied onto glass and gypsum board 146 7.7.5.7 The combination of primer and paint A spread onto 148 different substrates 7.7.5.8 The combination of primer and paint B spread onto 150 different substrates 7.7.5.9 Adhesive A applied onto different substrates 152 7.7.5.10 Adhesive B applied onto different substrates 155 7.7.6 Statistical analysis 157 7.7.6.1 Statistical analysis of Part I. VOC emissions from single 157 material layers on a glass substrate 7.7.6.2 Statistical analysis of Part II. VOC emissions from 158 material combinations on a glass substrate 7.7.6.3 Statistical analysis of Part III. VOC emissions from 158 material combinations on gypsum board and CSB 7.7.6.4 A comparison of glass and gypsum board as substrates 163 7.8 OLFACTORY EVALUATION 164 8 DISCUSSION 167 8.1 PROPERTIES OF THE TESTED MATERIALS AND THEIR 167 BEHAVIOUR AT DIFFERENT MOISTURE CONDITIONS 8.2 VOC EMISSIONS 170
10
8.3 MATHEMATICAL MODELLING 176 9 SUMMARY 178 10 CONCLUSIONS 181 REFERENCES 183 APPENDICES APPENDIX A RESULTS OF THE EDS-ANALYSES 195 APPENDIX B SAMPLE WEIGHTS 200 APPENDIX C AREA SPECIFIC EMISSION RATES 202
11
ABBREVIATIONS AND NOTATIONS ASAFR Area Specific Airflow Rate (m³/m²·h) DRIFT Diffuse Reflectance Unit ESEM Environmental Scanning Electron Microscope FLEC Field and Laboratory Emission Cell FTIR Fourier Transformed Infrared Spectroscopy GC Gas Chromatograph MIP Mercury Intrusion Porosimetre MS Mass Spectrometre PLS Partial Least Squares SERa Area specific air flow rate of a specific compound (μg/m²·h) SVOC Semi-Volatile Organic Compound, boiling point range 240-260...380-400 °C TVOC Total Volatile Organic Compound, determined as toluene-equivalent TVOCSERa Area specific airflow rate of the total amount of VOCs (μg/m²·h) VOC Volatile Organic Compound, boiling point range 50-100...240-260 °C A coefficient of relative humidity (-) A, As sample area (m²) ACH air exchange rate (h-1) B constant (-) c, C concentration (kg/m³) ca gas-phase concentration (kg/m³) ca0 initial gas-phase concentration (kg/m³) ci gas-phase concentration of a single compound (kg/m³) cpi partial vapour pressure of a single compound expressed as concentration (kg/m³) cs solid-phase concentration (kg/m³) cv equilibrium vapour pressure expressed as concentration (kg/m³) cvi equilibrium vapour pressure of a pure compound (kg/m³) cw concentration at a surface (kg/m³) c∞ concentration in the bulk air (kg/m³) Cm measured concentration D molecular diffusion coefficient (m²/s) Da average gas-phase diffusivity (m²/s) E coefficient of temperature (-) Ev mass emission rate in diffusion (kg/m²s) Ew emission rate in convection (kg/m²s) Ewi emission rate of a single compound in convection (kg/m²s) H test relative humidity (%) H0 relative humidity under standardised conditions (%) ∆vH enthalpy of vaporisation (J)

12
∆vHm molar enthalpy of vaporisation (J/mol) J species flux (kg/m²s) kc convective mass transfer coefficient (m/s) kci convective mass transfer coefficient of a single compound (m/s) kl linear partition coefficient (-) ks surface/air partition coefficient (kg/s) L, θ thickness of a sample (m) Lc characteristic length (m) ln natural logarithm m mass (kg/m²) mi mass of compound remaining (kg/m²) m0 initial mass (kg/m²) Ma molecular weight of air (g/mol) Mi, MVOC molecular weight of a compound (g/mol) n air change rate (h-1) p pressure (atm/bar) pA partial vapour pressure of a component (atm) pL vapour pressure of a liquid (atm) P amount of wet product applied (g) q adsorbed surface concentration Q volumetric flow of air (m³/s) r pore radius (m) ReL Reynolds number (-) RH relative humidity (%) R gas constant (J/K mol) S recommended amount of paint usage (m²/l wet product) Sc Schmidt number (-) Sh Sherwood number (-) t time (s) T, T temperature (K/°C) T0 temperature at standardised conditions (K) Ts dry film thickness recommended by a paint producer (μm) Tt dry film thickness for testing (μm) Tv boiling temperature of a solvent (K/°C) u air velocity (m/s) V volume of chamber air (m³) Va molar volume of air (cm³/mol) Vs solid content of a product (Vol.-%) VVOC molar volume of a compound (cm³/mol) xA mole fraction of a component y co-ordinate (m) δ density of a wet product (g/cm³)

13
δD thickness of the diffusion boundary layer (m) γ surface tension (N/m²) μ viscosity (g/h m) ρ density (g/m³) ν kinematic viscosity (m²/s) ω contact angle (°) ∏i molar amount of a compound (mol) ∏ molar amount of TVOC (mol)
14
1 INTRODUCTION Polymeric materials such as vinyl floorings, adhesives, wall-covering materials, plasters, sealants, thermal insulating materials, paints, and varnishes are important sources of volatile organic compound (VOC) emissions in buildings and they can emit a wide range of VOCs. VOCs have been defined by WHO as organic compounds having boiling points from 50-100 °C to 240-260 °C (WHO 1989). Some are solvent residues from the various polymerisation processes of polymer manufacturing; some are the excess unreacted monomers and co-monomers left trapped in the polymer structures; some are secondary products from the reactions of some monomers, solvents or plasticisers and some are the plasticisers used in the production of a material. (YU & CRUMP 1998) VOCs can cause adverse health effects and initiate symptoms of the so-called sick building syndrome (WHO 1983). Common symptoms of sick building syndrome include irritation of the nose, eye and throat, headache, fatigue, dizziness, sinus congestion, allergic reactions, and respiratory infection. Most symptoms are short-term in nature and are relieved upon vacating the premises. Current research effort has, however, not been able to fully characterise the human health risk of a large number of VOCs found in the indoor environment, including the effects of synergism and secondary reactions. Therefore it must be assumed that not all compounds are in concentrations low enough to be considered harmless, particularly in the long term. (ELLACOTT & REED 1999) However, the health issues related to VOCs will not be dealt with in this work. This work concentrates on the joint effect of relative humidity and different material combinations on the VOC-emissions despite the fact that the “traditional” VOC-window, as defined by the WHO, comprises largely non-reactive species and has, thus, lost interest lately. Instead radicals, ozone, semi-volatile organic compounds, and NOxs have gained increasing attention during the last few years as the primary targets reducing the indoor air quality. However, VOCs are the group of organic compounds that have gained most interest during the last decades, and for which there exists a relatively good international consensus as far as sample collection, analysis, and interpretation of test results are concerned. Furthermore, they are one parameter which national building material labelling schemes are based upon at least in Europe (WOLKOFF 2003). A small environmental test chamber has been developed that meets the requirements set by the European standards (ENV 13491-1 1999) and by the author, i.e. that the operation and maintenance of the chamber should not be too cumbersome and that the relative humidity of the chamber air should be easily adjusted. The emissions of VOCs from common building materials and material combinations under controlled conditions are examined in order to clarify the joint influence of moisture conditions and substrate on the emission process. This information can undividedly be used by material manufacturers, building designers, contractors, officials and researchers dealing with issues related to indoor air quality, and the general public.

15
2 MATERIALS The materials to be tested in this study are commercial products purchased from local hardware stores. Their main characteristics are presented in the following chapters very generally. Due to production secrets the author does not have detailed information on their composition, but rather has to rely on what is noted on the product information sheets provided by the producers for more specific information. 2.1 PAINTS A pigmented coating material, in liquid, paste or powder form which, when applied to a substrate, forms an opaque film having protective, decorative or specific technical properties is a paint (EN 971-1 1996). All paints are based on the structure shown in Table 1. Major differences between paints occur between the polymers or resins that are formulated for different purposes. This is because of differences between the methods of application and cure, the nature of the substrate, and the conditions of use. The deterioration of paints that occurs in many situations is largely due to changes in the chemical nature of the film former with consequent changes in its mechanical properties. Table 1. The structure of paints (BROCK ET AL. 2000). Non-volatile matter Volatile matter pigments solvents or dispersants fillers volatile additives film formers (any elimination products from stoving) non-volatile additives 2.1.1 Pigments and fillers Pigments are generally finely dispersed particles that are practically insoluble in the application medium and which are used because of their optical, protective or decorative properties (EN 971-1 1996). Examples of pigments include titanium dioxide, carbon black, pearlescent pigments, and zinc phosphate (BROCK ET AL. 2000). Aiming at improving the quality of paints, a great number of studies have been carried out to understand the role of pigments in paint formulation, fabrication, application, and durability. All the studies indicate that pigment characteristics, such as chemical nature, particle size, state of dispersion, morphology and level of pigmentation, determine the paint properties in its liquid and solid state. (PERERA 2004)
16
Fillers are granules or powders that are, like pigments, practically insoluble in the application medium. They are used as a constituent of paints to modify or influence certain physical properties. (EN 971-1 1996) Examples of fillers include chalk, talcum, and cellulose fibres (BROCK ET AL. 2000). Fillers differ from white pigments primarily in their lower refractive index and also in their particle size, which is generally larger than that of pigments. The objective with fillers is to ensure that they build a compact skeleton structure with pigments in the coating material. They are used among others for: reinforcing, improving flexural, adhesive and tensile strength, controlling the degree of gloss of coatings and, since they are generally less expensive than pigments, reducing the price of a coating material. (BROCK ET AL. 2000). 2.1.2 Film formers A film former forms a cohesive coating or paint film on a given substrate and, where relevant, holds together or embeds the other non-volatile components of the coating, particularly the pigments and fillers. Depending on their origin, film formers can be categorised into natural substances, modified natural substances, and synthetic substances. (BROCK ET AL. 2000) The following review is concentrated on alkyd resins and polymer dispersions, since these are the film formers used exclusively in this study. 2.1.2.1 Alkyd resins Alkyd resins can be defined as polymers modified with fatty acids or fatty oils or with higher synthetic carboxylic acids. The molecules consist of a polyester backbone from which fatty acid groups project as side chains. Excess (free) hydroxyl and residual carboxyl groups are also present. The polyester component is responsible for physical drying and weather resistance, the oil component for the suppleness of the films and above all for the capacity of oxidative cross-linking. (BROCK ET AL. 2000). With regard to the oil type or the fatty acid incorporated, alkyd resins can be categorised as drying or non-drying. Long oil alkyds, with an oil content of > 60 to 70 %, are principally used as sole film former for decorator’s paints and house paints. Thus, alkyd paints used in this study are most probably long oil alkyds. They are soluble in aliphatic hydrocarbons and they always dry by oxidation. The high oil content promotes good flow, high flexibility and easy manual processing, but also leads to relatively slow drying. If conjugate oil(s) or acid(s) are used in the resin synthesis, faster drying resins are produced. (BROCK ET AL. 2000).

17
2.1.2.2 Polymer dispersions A polymer dispersion is formed by emulsion polymerisation. It is usually a relatively low-viscosity liquid. In microscopic terms it is a micro-heterogeneous system essentially consisting of roughly spherical polymer particles (“latex particles”) which are evenly distributed in a usually aqueous phase. Non-aqueous dispersions contain highly volatile, aliphatic hydrocarbons as dispersant. The latex particles used in paints are always copolymers. The main types are styrene-butadiene copolymers, vinyl acetate copolymers, pure acrylate copolymers, and styrene-acrylate copolymers. (BROCK ET AL. 2000). As a minimum, the aqueous phase contains stabilisers such as surfactants and/or protective colloids together with decomposition products of the polymerisation initiator (BROCK ET AL. 2000). Surfactants are low-molecular substances with hydrophilic and hydrophobic molecule sections. They are used to prevent sedimentation and phase separation during polymerisation, film formation, and end-use conditions. (BUTLER ET AL. 2005). The aqueous phase may also contain plasticisers, buffer substances to regulate the pH, de-foaming agents, and preservatives (BROCK ET AL. 2000). Taken together, a water-borne paint formulation is extremely complex with a plethora of low and high molecular weight compounds (HELLGREN
ET AL. 1999). 2.1.3 Solvents and dispersants A solvent is defined as a single liquid or blend of liquids, volatile under specified drying conditions, in which the film former is completely soluble (EN 971-1 1996). Examples of solvents include butyl acetate, butyl glycol, white spirit, and water. Solvents serve primarily to adjust the viscosity of the coating material to the optimum level for a given application, and to control this level during application and film forming. However, solvents affect also e.g. the adhesion to the substrate (BROCK ET AL. 2000). Dispersants are liquids that do not dissolve the film former(s), but instead hold them in a fine micro-heterogeneous dispersion or emulsion. Examples include water, and in non-aqueous dispersions, hydrocarbons (BROCK ET AL. 2000). Dispersions were dealt with in the preceding chapter. A number of factors must be taken into account in choosing a solvent, including volatility, rheological behaviour, surface tension, combustibility, toxicity, odour, environmental compatibility, and cost. A solvent is, thus, generally required to be light and colourless, volatile with no residue, neutral, non-reactive or only slightly reactive, to have a slight or at least not unpleasant odour, and generally to be anhydrous, scarcely toxic, biodegradable, and moderately priced. (BROCK ET AL. 2000). Table 2 provides a summary of typical solvent contents in some coating materials.

18
Table 2. Typical solvent contents of paints and coating materials (BROCK ET AL. 2000). Coating material Solvent content (%) Emulsion paints for interior use 0 – 2 Latex coatings (environment-friendly) 7 – 9 Alkyd resin coatings, polyester resin coatings, epoxy resin coatings, polyurethane coatings, polyester resin coatings, phenolic/urea/melamine resin coatings
40 - 50
During application and film forming, the volatile components of a paint are intended to evaporate. The speed at which this occurs influences not only the drying time but also the appearance of the final paint film. The rate of evaporation of a solvent is dependent on vapour pressure, surface tension, specific heat, molecular weight, enthalpy of vaporisation, and humidity. Both vapour pressure and boiling point of a solvent are dependent on the enthalpy of vaporisation, but there is no general correlation between these two quantities. For example, solvents forming hydrogen bridge bonds - like water, alcohols or amines - are less volatile than other solvents with the same boiling point. Since most of the factors that determine the rate of evaporation are in turn dependent on one another, it is almost impossible to make theoretical predictions about the precise extent of solvent release from a coating film. (BROCK ET AL. 2000) For the optimum drying of a coating film, a blend of different solvents is generally required. In blends, deviations from an ideal behaviour occur which can be attributed to the interactions between the molecules of the blended components and are different for different solvents. Particularly in the case of blends containing water as one of the components, the strong interactions with this component can often lead to marked deviations from the ideal behaviour, which is expressed by Raoult’s law, Equation 1. pA = xA · pL , (1) where pA is the partial vapour pressure of a component, xA is its mole fraction, and pL is its vapour pressure as a pure liquid. The rate of evaporation of water is at the same time strongly influenced by the relative humidity. For example, if a blend of butyl glycol and water is evaporated, butyl glycol accumulates in the remaining mixture at low RH, whereas water accumulates in the mixture at high RH. At a given RH (the critical relative humidity, which is around 80 % in this case), both components evaporate approximately at the same rate and the composition of the liquid remains constant. (BROCK ET AL. 2000) 2.1.4 Paint additives Additives are substances that are generally added in small quantities to a coating material to improve or modify one or more specific properties (EN 971-1 1996). Additives are generally
19
subdivided into various groups, the most important of these being: de-foaming agents, surface-active additives, rheological additives, light stabilisers, dryers and catalysts or accelerators, and biocides. As some additives can influence several properties at the same time, the classification presented before is rather arbitrary. Moreover, the boundary between additives and other coating components is not always very clear, since some film formers, pigments, solvents, or even fillers are occasionally used like additives in terms of both function and of quantity added. (BROCK ET AL. 2000). The different additive groups and the main raw materials used in paints are presented in Table 3. Table 3. Typical additives used in paints and their main raw materials (BROCK ET AL. 2000). Coating material Solvent content (%) De-foaming and de-aerating agents Mineral oil and silicone de-foaming agents
Organic polymers, dimethyl polysiloxanes, organically modified polysiloxanes and fluorosilicone de-aerating agents
Surface-active additives (wetting and dispersion) Surfactans which include countless substances such as ethoxylates and siloxanes
Rheological additives - thickeners - thixotropic agents
Cellulose and polyurethane derivatives. Phyllosilicates, polyolefins, polyamides etc.
Light stabilisers 2-hydroxyphenyltriazoles, HALS1) Catalysts and driers Salts Biocides Formaldehyde and its reaction products, sulphur
and nitrogen containing organic compounds 1) Hindered Amine Light Stabiliser 2.2 ADHESIVES An adhesive is defined as a non-metallic substance capable of joining materials by surface bonding (adhesion), and the bond possessing adequate internal strength (cohesion) (EN 923 1998). Thus, there are three requirements that must be met for successful adhesive application. These are: wetting of the substrate surface, solidification of the adhesive, and formation of a joint structure that is resistant to the operating stress and environment. (PETRIE 2000) Adhesives are usually comprised of a bulk polymer or polymer blend acting as a binder, a solvent, and a variety of additional components. In the following chapters is presented different bulk polymers and a short description of solvents and other material components generally used in adhesive formulations. However, the main emphasis is still on the type of adhesives used in this study.
20
2.2.1 Bulk polymers Adhesives may be classified according to chemical composition, as presented in Table 4. This is not the only way to classify adhesives, but appropriate in this context. Other classifications are by function, mode of application or reaction, physical form, cost, or end-use (PETRIE 2000). Table 4. Classification of adhesives according to origin (PETRIE 2000). Classification Bulk polymers Most used forms Thermoplastic Cellulose derivatives, (poly)vinyl
derivatives, acrylics Liquid
Thermosetting Urea and melamine formaldehyde, epoxies, acrylics
Liquid, but all forms common
Elastomeric Natural and synthetic rubber, nitrile, styrene-butadiene, polyurethane
Liquid, some film
Alloys (hybrids) Epoxy and phenolic alloys Liquid, paste, film Thermoplastic adhesives do not cure or set under heat like thermosetting adhesives, but they can rather be melted with application of heat and then applied to the substrate or they can be dissolved in solution and rehardened on evaporation of the solvent. Thermoplastics dissolved in water as latexes or emulsions harden on water evaporation or by water diffusion into a porous substrate (PETRIE 2000). This last group of thermoplastics belong to the common household adhesives and are also used in this study. 2.2.2 Polyvinyl acetate Polyvinyl acetate, PVAc, is the binder of at least two of the adhesives used in this study. Polyvinyl acetate adhesives are dispersions of small droplets of PVAc in water. They set by loss of moisture, leaving the droplets to coalesce to form a continuous solid film. (TOUT 2000) PVAc dispersions have a reactive solid content of 40 - 70 %. The dispersions must be stabilised with protective colloids or emulsifying agents to prevent separation. When they are used with porous materials the majority of the water is absorbed by the substrates and the remainder, along with the small quantities of solvent which are used to keep the polymer dispersed, evaporate. (PARIS 2000) Thus, the setting times of PVAc adhesives depend on the moisture levels of the components being bonded, and the thickness of the adhesive film, but with optimum bonding conditions, i.e. low moisture content and thin gluelines, a modern PVAc adhesive will develop reasonable bond strength in about 15 minutes at normal ambient temperatures. Damp conditions and thick adhesive film will extend setting times. (TOUT 2000) Even though PVAc- based adhesives are convenient to use, have low toxicity and a clear glueline, they have some detracting features which limit their application to non-structural uses only. The main detracting features are susceptibility to both moisture and heat, and also

21
a tendency to creep under load. These deficiencies are primarily due to the inherent mechanical properties of the PVAc polymer and plasticisation of PVAc gluelines by moisture. (GRIGSBY ET AL. 2005) Cross-linking PVAc adhesives or the incorporation of copolymers has improved their moisture and temperature resistances compared with conventional PVAc adhesives (TOUT 2000 and GRIGSBY ET AL. 2005). 2.2.3 Adhesive additives The properties of an adhesive resin emulsion are derived both from the polymer employed as well as the system used to emulsify the polymer in water. There are several additives necessary to stabilise and protect the emulsion and still other additives are used to adjust tack, drying time, viscosity, storage time etc. (PETRIE 2000). Adhesive additives and their main characteristics are presented in Table 5. Table 5. Adhesive additives and their main characteristics (PETRIE 2000). Components Characteristics Hardeners and curing agents Combines chemically with the base resin Catalysts Causes the base resin to cross-link and solidify. Typically acids,
bases, salts, sulphur compounds and peroxides Accelerators, inhibitors, retarders Controls curing rate, storage life, and working life Solvents and water Affects the consistency during adhesive manufacture and
application. They must be completely evaporated prior to cure Diluents Diluents lowers the viscosity of an adhesive, but becomes part
of the final product contrary to solvents Thickeners and thixotropic agents Maintains a reasonable thickness of the glueline through
viscosity adjustment Surfactants and wetting agents Stabilises the adhesive emulsion Extenders and fillers Affects one or several adhesive properties and also reduces the
concentration of other adhesive components. Common properties that can be modified e.g. by fillers are viscosity, shrinkage, strength, and electrical and thermal properties
Plasticisers and film formers Plasticisers provide flexibility and/or elongation and may also reduce viscosity. They are, similar to diluents, non-volatile solvents for the base resin. Film formers lowers the glass transition temperature of an adhesive emulsion
Tackifiers Besides increasing tack they also increase peel strength and decreases shear strength. Common tackifiers include aliphatic and aromatic hydrocarbons, terpenes, and esters
Antioxidants, antihydrolysis agents, stabilisers, biocides
Prolongs the service life of an adhesive
However, what was noted in the preceding chapter on paint additives applies also to adhesive additives, i.e. there are thousands of different additives that can be used in adhesive systems and many of them can influence several properties at the same time. Moreover, the boundary between additives and other adhesive components is not always very clear, which makes a classification rather arbitrary.
22
2.3 FILLERS, PLASTERS AND PLASTERBOARD What is presented in the following two chapters on fillers, plasters and plasterboard is based on what is said on product information sheets and what the author knows from his own experience. 2.3.1 Fillers and plasters Fillers and plasters are used e.g. to level interior surfaces of structures. They typically consist of 2-5 % binder that is either an organic substance, an inorganic substance, or a mixture of these, 60- 80 % inorganic filler, and 20-35 % water. The composition of fillers and plasters varies to a great extent according to their properties and purposes. Fillers and plasters should have a strong adhesion to the substrate, small drying and curing shrinkage, no visible cracks or dents, durability against static and dynamic loading, and resistance against chemicals and water. They should also be grindable after curing. Adhesion is very important to the performance of a plaster. Factors influencing its adhesion are filler and plaster composition and pre-treatment, smoothness, cleanliness, and strength of the substrate. The adhesion can be improved by using a primer. A primer contains usually a mixture of organic substances, which have good wetting and adhering properties. A filler and plaster shrinks during curing. This causes two kinds of damage: cracking and denting. The tendency of a filler or plaster to shrink is dependent on temperature and humidity conditions during curing and of the water amount that is added to the powdery product. A surplus of water improves workability, but increases shrinkage leading to cracking. Cracks may damage the coating of a plastered surface. 2.3.2 Plasterboard Plasterboard consists of a gypsum core (~93 % by weight) covered on both sides by a gypsum board liner (~6 % by weight). The additional one weight-percentage consists of moisture, starch, and other additives. The gypsum normally used originates from natural gypsum stone, recycled gypsum, and/or industrial gypsum gained from the purification of combustion gases. The gypsum that is gained from the purification of combustion gases is even purer than the one gained from the gypsum stone. Plasterboard is fabricated by mixing water, additives and calcined gypsum (flower of gypsum) and then pressing the mixture between two gypsum board liners. The liners overlap each other in a joint, which is glued together.

23
3 EMISSIONS FROM MATERIALS AND STRUCTURES Research conducted for more than twenty years indicates that indoor air pollution in non-industrial buildings is affecting human comfort, health and productivity. (WHO 1983, NORBÄCK ET AL. 1990, SAMET 1990, BERGLUND ET AL. 1992, WARGOCKI ET AL. 1999, WARGOCKI ET AL. 2002) Of the different physical, chemical, and biological factors that occur in indoor air, volatile organic compounds, VOCs, have been shown to cause general discomfort, strong odour, irritation of eyes and throat, increased headache, and drowsiness. (MØLHAVE ET AL. 1986, OTTO ET AL. 1990, MØLHAVE 1991, KJÆRGAARD ET AL. 1991, JOHNSEN ET AL. 1991, HUDNELL ET AL. 1992, NIELSEN ET AL. 1997, WIESLANDER ET AL. 1997, KNUDSEN ET AL. 1999, VILLBERG ET AL. 2004) There are a number of factors influencing the room air concentration of contaminants, which in turn are affected by long-term emission characteristics of materials. These factors include (ELLACOTT & REED 1999 taken from SPARKS 1992, SOWA 1994, WOLKOFF 1995):
A) Changes that occur during the course of the emission process due possibly to secondary chemical reactions between VOCs and other air pollutants (e.g. ozone) and adsorption/desorption effects.
B) Multiple emissions from the same material. C) Delay in reaching equilibrium concentration gradients within the material. D) Incomplete hardening/curing of a material applied to a surface. E) Dilution and flushing of indoor air. F) Pre-conditioning of a substrate or material. This may prove to be critical and is
often overlooked. G) Material inhomogeneity caused by varying thicknesses of a material. H) Ambient temperature and humidity. I) Possible vapour pressure effects during initial burst of VOC from wet and un-
conditioned materials. J) Human activity patterns, i.e. use of consumer products and location of occupants
– occupants produce bio-effluents including aldehydes, ketones, and esters. There are several factors that may have a significant impact on the emission rate of an organic vapour. These include the characteristic source strength of the product, product exposure to various temperatures and humidities, concentration of the organic vapour in the indoor environment, and product age. One aspect of organic sources that has a major impact on emission rates is the generation process of the organic vapour. Possible generation mechanisms influencing emission rates include chemical decomposition of the building material to produce the pollutant, off-gassing of a contaminant in the building material, and evaporation of the organic vapour due to less than equilibrium vapour pressure over the solid or liquid material. Examples of rate-limiting steps in the emission process include: (1) organic vapour production, (2) transport through the bulk phase, (3) transport through a physical barrier, or (4) diffusional transport from the building material into the room air.
24
Readily measured factors that might affect these steps include temperature, humidity, barrier thickness and permeation rates, face velocities, and room concentration of the organic pollutant. (HAWTHORNE & MATTHEWS 1987) Thus, material emissions are the result of several processes, which are governed by material specific characteristics and ambient conditions. The interaction of the different processes commonly occurs, but the effects of these interactions on material emissions are somewhat complex. The emission processes and factors governing them will be dealt with in the following. 3.1 EVAPORATION AND DIFFUSION Evidence from a variety of building investigations and systematic studies suggests that many of the materials used in buildings, either as structural components like floors and walls or as furnishings, are the main source of indoor air pollution. This is due to their large surface area and their permanent exposure to indoor air. The emission rates of indoor contaminants are effected not only by the vaporisable constituents and their concentration and distribution, but also by humidity, surface velocity, air exchange rate, temperature, substrate, and material loading factors. (BERGE ET AL. 1980, TICHENOR & MASON 1988, TICHENOR & GUO 1991, TUCKER 1991, ZHANG & HAGHIGHAT 1997) 3.1.1 Molecular migration The lower the boiling point the greater is the vapour pressure of an agent and, thus, the higher is its volatility (emission rate). Since the vapour pressure difference between the evaporating molecule and the surrounding air is the driving force for evaporation, the emission rate of a compound increases with decreasing concentration (increased vapour pressure difference) due to dilution and flushing. A decrease in the concentration is caused e.g. by a rise in the air exchange rate. Thus, higher air exchange rates cause higher emission rates. (SOLLINGER ET
AL. 1993, GUNNARSEN 1997) Material loading has the opposite effect. As the loading (area of material/volume of room, m²/m³) is increased the concentration increases, and the vapour pressure difference decreases decreasing the emission rate. (TICHENOR & GUO 1991, SOLLINGER ET AL. 1993, JAYJOCK 1994) The effect of sinks in the indoor environment can also affect the emission rate. As compounds are emitted, they may adsorb to other materials, i.e. sinks. Such adsorption causes a decrease in concentration analogous to an increase in the air exchange rate and occurs as long as the concentration of a specific compound in the air is higher than the gas phase concentration within a material. Re-emission from the sink can also occur when the concentration in the air decreases reversing the concentration difference between the initially

25
adsorbing material and the surrounding air. (TICHENOR & GUO 1991, NERETNIEKS ET AL. 1993) For similar compounds, the less volatile the compound, the more severe the sink effect (CHANG & GUO 1992, COLOMBO ET AL. 1993, CHANG & GUO 1994, POPA & HAGHIGHAT 2003). For instance, semi-volatile organic compounds, SVOCs, which are defined as compounds with vapour pressures from approximately 10-2 to 10-8 kPa and a boiling-point range of 240-260 to 380-400 °C at normal ambient temperatures (WHO 1989), have strong sink effects because of their ability to adsorb to surfaces. They exist to a high degree in the condensed phase. The sink strength of materials also increases with increasing polar forces of the sink or the adsorbed species (COLOMBO ET AL. 1993, CHANG ET AL. 1998). COX ET AL. (2001) further noted that sorbed water molecules, water being a strongly polar compound, increase the total uptake of VOC. This may be attributed to at least two causes according to the authors. Firstly, water can exist in substrates in bound or bulk form causing VOCs to dissolve into it. Secondly, water could, in case of a polymer substrate such as vinyl flooring, disrupt the dipole-dipole interactions between relatively polar polymer chains further plasticising the polymer. Additional plastification would increase the void volume within the polymer matrix possibly increasing its sorptive capacity. Thirdly, from a thermodynamic viewpoint, the system free energy of the substrate/solute system could lower the chemical potential of each sorbed species, since the free energy of a mixture of solutes is lower than for a single solute. The overall system equilibrium would then shift to minimise the total substrate/gas-system free energy. The equilibrium shift due to solute interactions would result in more molecules sorbing to the substrate. The comments presented above regarding adsorption apply also to the desorption process from a sink. TICHENOR ET AL. (1991) noted that different sinks desorb adsorbed compounds at a different rate depending on the characteristics of the sink. There was no significant difference in the desorption rates between the two compounds studied, ethylbenzene and tetrachloroethylene, even though their adsorption rates differed depending on the sink material. JØRGENSEN & BJØRSETH (1999) also studied the sorption of organic compounds using two different VOCs, α-pinene and toluene, and two different sinks, wool and nylon carpet. The authors concentrated on the desorption phase only, because according to earlier experiments (JØRGENSEN ET AL. 1999) the uncertainty of desorption phase experiments is lower than the uncertainty of adsorption phase experiments. This is due to the dosing system used. They noted that the presence of two emitting compounds at the same time gives higher sorption compared to one compound at a time. This indicates that the desorbed masses of individual compounds are additive. Also the combination of two materials at the same time leads to higher sorption than one single material. 3.1.2 Rate of emission The rate of emission from liquid materials is usually rapid in the beginning and reaches a peak after a short period of time (typically 0.5 – 3 h), which indicates that the emission is

26
mainly evaporative. The emission rate also declines rapidly and some organic solvent-borne materials decline to a very low emission rate within hours of testing, whereas others, e.g. some water-borne types of paint, decline to a “steady” but still significant level in 1 – 5 days. (TICHENOR & GUO 1991, CHANG & GUO 1992, YU & CRUMP 1998, HUANG & HAGHIGHAT 2002, LEE ET AL. 2003) In cases where the emission of a compound is not purely evaporative, diffusion of the compound within the source becomes important and starts to control the emission rate. This is the case for e.g. dry solid materials. When the diffusion of a compound to the surface of the source is slower than the evaporation rate, the rate of emission will be reduced. (TICHENOR & GUO 1991, GUNNARSEN 1997) The physical properties, i.e. size and structure (e.g. polar charges) of the migrating molecule, the structure of the material, and temperature and relative humidity, influence molecular migration within a material. The rate of diffusion of a specific compound can be expressed as a function of the diffusion coefficient, or diffusivity. The diffusivity of an individual compound in a mixture is also affected by the composition of the mixture and by any inhomogeneity in the material itself (YU & CRUMP 1998). 3.1.3 Factors affecting the emission process CLAUSEN (1993) studied the influence of film thickness on the emission of volatile and semi-volatile organic compounds from a waterborne paint in a climate chamber. He used three different film thicknesses and the paint he used was applied to tin-plated steel sheets. The results showed that the emission rates decay slower with increasing film thickness. The emission of semi-volatile and volatile organic compounds from a waterborne paint film prior to film formation may be regarded as being controlled by evaporation, i.e. limited by diffusion through a boundary layer above the paint film. The emission after dry film formation might be controlled by either evaporation or by internal diffusion within the paint film. This depends on the emitted compounds and the interactions that occur between them. A thick film of a given paint has a larger VOC and semi-VOC mass than a thin film, but they have the same surface concentration and, thus, also the same characteristic equilibrium vapour pressure (TICHENOR ET AL. 1993). Assuming no influence of the chamber VOC and semi-VOC concentration they will have identical initial emission rates, but the thick film emission decays slower because of the larger VOC and semi-VOC mass. An uneven paint film surface can have very different film thicknesses locally, but the evaporation controlled emission rate decay is the same all over the surface because of the homogenous concentration at the surface of the paint film. This is not the case for the diffusion-controlled emission where the areas with thin film have a faster decrease of VOCs and SVOCs content than areas with thick film. The emission can not be considered as the sum of several independent sources because compounds may diffuse from the thick film to the thin film areas.

27
LEE ET AL. (2003) studied the influence of film thickness on the VOC emissions from a finishing varnish in a test chamber. Three different film thicknesses were examined. The results showed that the maximum concentration of VOCs in the chamber air increased with increasing film thickness. An increase in the film thickness also caused a decrease in the emission decay; a finding similar to that of Clausen presented above. The authors also noted that different compounds have different peak concentrations and are depleted at different, compound specific, emission rates. WOLKOFF (1995) also stated that the emission process is generally controlled by either evaporation from the building material surface or by internal diffusion within the material itself or a combination thereof. The distinction between the two mechanisms should be reflected to some extent in their dependence on the air velocity and possibly the concentration in the surroundings. Individual VOCs are released, usually, in quite different amounts and with different time dependencies, i.e. different emission rates and different emission mechanisms, the latter may even change during the decay period. STROMBERG & WIND (1968) reached the same conclusion in their study on the evaporation patterns of mixed solvents in water thinnable resins. Thus, the concentration/time profiles may change drastically in particular during the early stage of the emission process (WOLKOFF 1998). GUO & MURRAY (2000) compared the time dependence of TVOC concentration of a solvent-soluble paint and a water-soluble paint and concluded that the concentration of the solvent-soluble paint decreased with an increase in the air exchange rate. The TVOC concentration of the water-soluble paint was initially higher for the high air exchange rate (4.42 h-1), but after about six hours, the TVOC concentration was higher for the low air exchange rate (0.885 h-1). This result is similar to the results of the study by TICHENOR & MASON (1988), in which VOC emissions from wet materials under different air exchange rates were evaluated. Tichenor and Mason also noted that within the mixture of organic compounds emitted from a given source, the difference in emission factors for different compounds might be quite large. HANSEN (1974) further stated that different compounds evaporate largely independently from each other. ZHANG & HAGHIGHAT (1997) studied the impact of surface air movement (air velocity and turbulent fluctuations) on the emissions from a polyurethane plastic finish varnish and a common water-based acrylic paint using a small velocity-controlled test chamber. The emission rates for the varnish decreased rapidly with time during the first few hours. The emission rates were initially higher for a high surface air velocity (v = 0.113 m/s); after 10-15 hours, the rates were higher for the low surface air velocity (v = 0.054 m/s). Thus, the higher surface air velocity caused the material emission to deplete faster. This result is consistent with the findings by KORNUM (1980) who studied the drying of coating films. The result is also consistent with both the flow boundary layer theory and the mass conservation theory. The effects of turbulent fluctuation levels on emission rates from the varnish were smaller compared to that of the surface air velocity; and unlike surface air velocity, the turbulent
28
fluctuation levels and material emission rates have an inversely proportional relationship. The emission rates and their decay rates of the paint during the initial stage were much smaller than that of varnish; and the emission rates remained higher for the high surface air velocity during the 50-hour experimental period. The effects of turbulent fluctuation on the paint emissions were not obvious due to its weaker effect on boundary layer shear stress. The different behaviour of the VOC emissions from the paint and varnish may be due to the high water content and the relatively low content of VOCs in the paint according to the authors. The release of water vapour from the paint sample impedes the early release of VOCs because water prevents the VOCs in the paint sample from being released due to hydrogen bonding. VAN NETTEN ET AL. (1989) came to a similar conclusion as Zhang and Haghighat in their studies on temperature and humidity dependence of formaldehyde release from building materials. They stated that the rate of release of formaldehyde from a material is a combination of various actions. These include physical and chemical actions on formaldehyde sources including the formaldehyde that is physically absorbed onto the surface of the material, absorbed by the moisture held by the material, and chemically bound either in a free form or in a polymerised form. The release from different sources is further influenced by, among others, concentration gradient, porosity, humidity, differential geometric configurations, and the bulk of the material under investigation. In order to obtain an index that compares the relative emissions from a material an average release rate can be calculated. Release rate coefficients based on surface area were noted to be a better measure of potential release than release rate coefficients based on weight (PICKRELL ET AL. 1983). KIRCHNER ET AL. (1995) measured the specific surface of some of the materials they used in a chamber study on the adsorption/desorption of 2-butoxyethanol on indoor surface materials. The measured specific surface (surface readily available for adsorption) of the acoustic tile studied was about 10 times higher than that of a carpet backing (2.3 and 0.28 m²g-1). This was also confirmed by the visual inspection of these two materials by electronic microscopy where the compacted rock-wool fibre structure of the acoustic tile appeared much more favourable for adsorption than the alveolar structure of the carpet latex backing. Therefore, the microstructural characterisation of the acoustic tile and of the carpet was in good agreement with the adsorption experiments. JØRGENSEN ET AL. (1999) discussed the influence of specific surface area on the adsorption capacity of different materials, and speculated that the adsorption capacity of a material increases with increasing surface area. TOPP ET AL. (2001) studied the emission from building materials in ventilated rooms. They used numerical calculations by computational fluid dynamics (CFD) and full-scale laboratory experiments and found that material emissions are a strong function of air-change rate, local air velocity, and local turbulence, since the mass transfer coefficient increases in proportion to these parameters. They also stated that the mass transfer coefficient increases in proportion to the velocity when the emission is controlled by evaporation and is unaffected by the
29
velocity when the emission is controlled by diffusion. On the other hand, the emission always involves mass transfer across the boundary layer along the surface, which is affected by the surface air velocity and turbulence. This was noted also by Lundgren and colleagues who stated that for the majority of solid materials the rate of diffusion within the material determines the rate of emission when a reasonable air circulation above the material surface is maintained (LUNDGREN ET AL. 1999). 3.1.4 Substrate effects GUO & MURRAY (2000) analysed and characterised emissions from both organic solvent-soluble and water-soluble paints. They noted that when comparing emissions rates obtained in chamber studies to real indoor environments the possibility of changed emission characteristics from typical substrates has to be considered. CHANG ET AL. (1997) studied the effect of two different substrates, a stainless steel plate and a gypsum board, on VOC emissions from a latex paint in a test chamber. The test results showed significant differences in emission rates between the VOCs released from the two substrates. After the first two weeks, over 90 % of the VOCs were emitted from the stainless steel plate, but less than 20 % had left the gypsum board. Similar results were obtained by SPARKS ET AL. (1999) who used the same substrate materials as Chang and his colleagues had used. The dominant species also changed when stainless steel was replaced with gypsum board (CHANG ET AL. 1997). WOLKOFF (1998) reached a similar conclusion in his study on the influence of air velocity, temperature, relative humidity and type of gas (air vs. nitrogen) on the chemical emission from different building products. ROSÉN & ANDERSSON (1990), on the other hand, noticed only a minor influence of the substrate on solvent emission from a newly applied paint. The substrates they studied included glass and untreated and previously treated beech-veneer plywood. FORTMANN ET AL. (1998) reached a similar conclusion as Rosén and Andersson. Both studies, however, concentrated on the emissions from alkyd paints. The development of low emitting products relies on a better understanding of the pollutant transfer at the air/material interface. This transfer will be highly dependent on the type of pollutants and materials (gas/material affinity), but also on other parameters such as the microphysical shape of the materials (porosity, roughness) and the environmental conditions (temperature, humidity) (KIRCHNER ET AL. 1995). 3.2 COMPUTATIONAL MODELLING The emission of VOCs from building materials can be generally considered to stem from two major processes: evaporation (surface emission) and diffusion, as was described in the
30
preceding chapters. The emission process involves diffusion through the bulk material followed by surface evaporation. Depending on which of the two is the limiting process emission is often considered as either evaporative or diffusion-controlled. Emission of VOCs from freshly applied liquid films is typically evaporative although, after an initial period of evaporation, it becomes diffusion-controlled while the emission from carpets and other dry materials is mainly controlled by internal diffusion. These two transport processes will be dealt with mathematically in the following chapters. The emission model to be presented is based on physical phenomena, because a model that has a physical basis also provides insight into the controlling mechanisms. The applicability of a model to the results achieved in this study will be discussed in Chapter 8. 3.2.1 Surface emission For freshly applied liquid films, e.g. paint and lacquer, the emission is generally controlled by evaporation from the surface as the drying process progresses. Resistance in the gas phase limits the mass transfer. Thus, the emission process can be described in terms of a convective mass transfer coefficient and the difference between the concentration at the surface of the material and the bulk air Ew = kc (cw - c∞) , (2) where Ew is the emission rate (kg/m²s), kc is the convective mass transfer coefficient (m/s), cw is the concentration at the surface (kg/m³) and c∞ is the concentration in the bulk air (kg/m³). (TOPP ET AL. 2001) In liquids the evaporation of a compound is the dominating drying process. Analogously, the vapour pressure of the compounds in a liquid film, such as a freshly applied paint, and of the overlying air, is proportional to their concentrations. The mass transfer coefficient is, on the other hand, dependent upon the environment in which the process is taking place, including the surface air velocity and turbulence, surface characteristics, and the properties of the overlying air, i.e. its temperature and relative humidity. (HAGHIGHAT & DE BELLIS 1998) Turbulence decreases towards a surface, which has led to the concept of a laminar (or diffusion) boundary layer, Figure 1. No definite thickness can be assigned to such a layer because turbulence changes gradually. Nevertheless, in a very thin layer close to the surface, the air is moving slowly and can be considered stagnant. Throughout this layer, flow normal to the surface corresponds to mass transfer by molecular diffusion, and the velocity gradient is constant. Further away from the surface where the flow becomes turbulent, the velocity gradient is practically zeroed, and the emission is a combined process of both molecular and turbulent diffusion. The thickness of the diffusion boundary layer, δD, is defined so that the
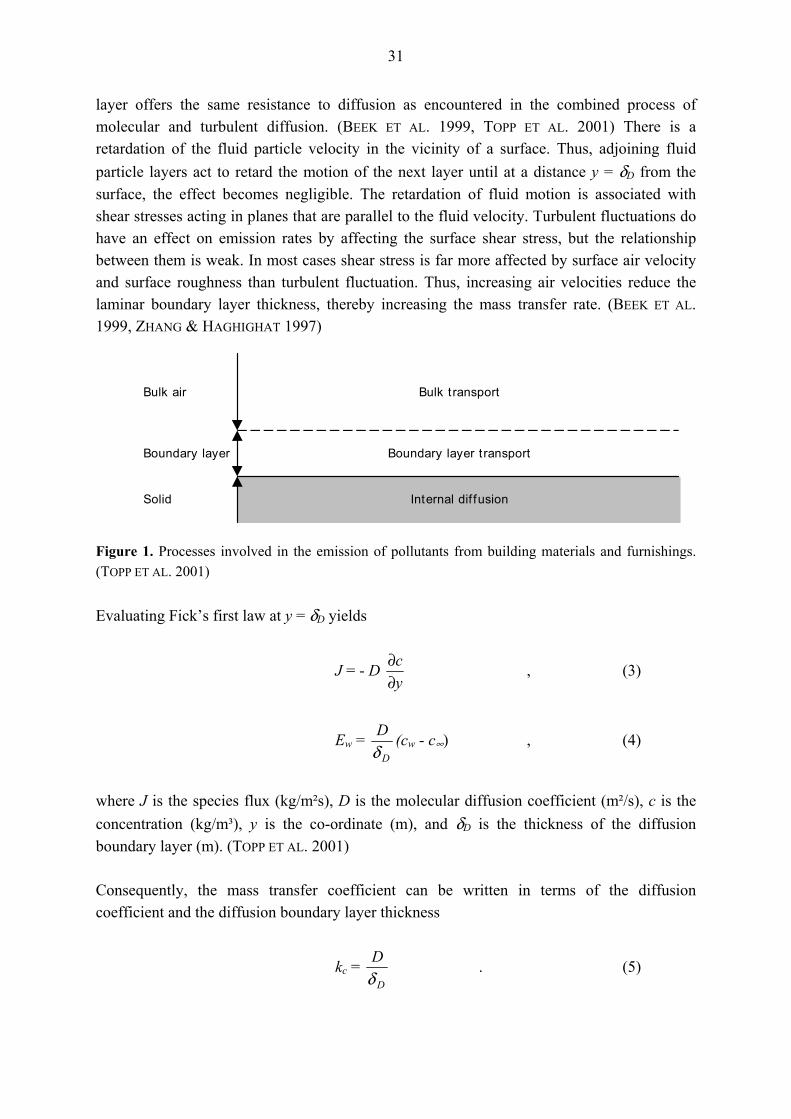
31
layer offers the same resistance to diffusion as encountered in the combined process of molecular and turbulent diffusion. (BEEK ET AL. 1999, TOPP ET AL. 2001) There is a retardation of the fluid particle velocity in the vicinity of a surface. Thus, adjoining fluid particle layers act to retard the motion of the next layer until at a distance y = δD from the surface, the effect becomes negligible. The retardation of fluid motion is associated with shear stresses acting in planes that are parallel to the fluid velocity. Turbulent fluctuations do have an effect on emission rates by affecting the surface shear stress, but the relationship between them is weak. In most cases shear stress is far more affected by surface air velocity and surface roughness than turbulent fluctuation. Thus, increasing air velocities reduce the laminar boundary layer thickness, thereby increasing the mass transfer rate. (BEEK ET AL. 1999, ZHANG & HAGHIGHAT 1997)
Bulk air Bulk transport
Boundary layer Boundary layer transport
Solid Internal dif fusion
Figure 1. Processes involved in the emission of pollutants from building materials and furnishings. (TOPP ET AL. 2001) Evaluating Fick’s first law at y = δD yields
J = - D yc
∂∂ , (3)
Ew = D
Dδ
(cw - c∞) , (4)
where J is the species flux (kg/m²s), D is the molecular diffusion coefficient (m²/s), c is the concentration (kg/m³), y is the co-ordinate (m), and δD is the thickness of the diffusion boundary layer (m). (TOPP ET AL. 2001) Consequently, the mass transfer coefficient can be written in terms of the diffusion coefficient and the diffusion boundary layer thickness
kc = D
Dδ
. (5)

32
Thus, the mass transfer coefficient is dependent on both the local airflow parameters and the source. (TOPP ET AL. 2001) 3.2.2 Internal diffusion Most emission processes become diffusion controlled after an initial period of evaporative emission. Different compound phases have to be taken into account, as a compound undergoes a change in phase after crossing the physical barrier at the surface-air interface by adsorption or desorption. In the solid material, a compound assumes a solid or adsorbed phase and, in the air, a compound assumes a vapour or gas phase. (TOPP ET AL. 2001) The fundamental equations in mass transfer within a material are Fick’s laws of diffusion. Assuming diffusion in only one direction, Fick’s first law, expressing direct proportionality between the concentration gradient and the species flux, is given by Equation 3. Fick’s second law expresses conservation of species
tc
∂∂
= D 2
2
yc
∂∂ , (6)
where t is the time (s). Since the VOC concentration in dry materials is usually low, the diffusion coefficient can be assumed to be independent of concentration. Nevertheless, it is a function of pressure and temperature. Each compound has its own diffusion coefficient, which is dependent upon its molecular weight, molecular volume, the characteristics of the material within which the diffusion is occurring, and ambient conditions. (BIRD ET AL. 2002) At steady state, the rate of internal diffusion balances the emission from the surface and there is, thus, a relation between the compound concentration in the solid phase and the gas-phase. Under isothermal conditions this relation is referred to as an adsorption isotherm. The simplest relation is the linear model cs = klca , (7) where cs is the solid-phase concentration (kg/m³), kl is the linear partition coefficient (-) and ca is the gas-phase concentration (kg/m³). (TOPP ET AL. 2001)

33
3.2.3 Model development What has been discussed in the foregoing will be converted into mathematical expressions in the following. Since most of the tests in this study consist of an initial rapid, evaporation controlled emission followed by a slower diffusion controlled emission, this sequence will be maintained also in the discussion and model development presented in the following. 3.2.3.1 Surface evaporation TICHENOR ET AL. (1993) developed a mass transfer model for surface coatings, i.e. so called wet materials, whose emissions are controlled by evaporation from the surface. This model, called the VB-model, is based on Equation 4. The model can be applied to both individual compounds or mixed solvents with the following characteristics:
1) All freshly applied liquid surfaces have the same equilibrium vapour pressure (expressed as concentration), cv which is characteristic of that product. cv is independent of the amount of coating applied.
2) As the coated surface ages, the vapour pressures of the remaining VOC
gradually decrease. The vapour pressure during the ageing period, cw is assumed to be proportional to the mass of VOC left, m. cw = cv(m/m0), where m0 is the initial mass of VOC applied (mg/m²).
3) The average gas-phase diffusivity, Da, of solvent molecules can be represented
by the diffusivity of the most abundant component in the solvent mixture and can be obtained e.g. through theoretical calculations.
The emission rate Ew in the VB-model is thus expressed as:
Ew = kc (cv (m/m0) - c∞) . (8) GUO ET AL. (1999) estimated the rate of emissions from solvent-based indoor coating materials based on the knowledge of product formulation. They noted that the decay rate of individual VOC-compounds is related to their vapour pressure. This result was consistent with earlier findings by STROMBERG & WIND (1968), SULLIVAN (1975), and CHANG & GUO (1994). GUO ET AL. (1998) developed a new model based on the VB-model. They estimated the emission of individual compounds. The result from their work is called the VBX-model, and it is presented in the following paragraphs.

34
The basic mass transfer process for an individual compound is the same as that for TVOC presented in the VB-model. Thus the mass transfer equation for a single component is:
Ewi = kci (cpi – ci) , (9) where subscript i represents component i and cpi the partial pressure for i. According to Raoult’s law, the partial pressure for an individual component in a solvent mixture is determined by: cpi = cvi xi , (10) where cvi is the vapour pressure for the pure compound i (kg/m³) and xi is the dimensionless molar fraction of i in the solvent mixture. By definition,
xi = ⎟⎠
⎞⎜⎝
⎛∏∏ i , (11)
where ∏i and ∏ are the molar amounts in the source for component i and TVOC, respectively, i.e. ∏i = mi/Mi , (12) ∏ = Σ∏i , (13) where mi is the amount of i remaining in the (kg/m²) and Mi is the molecular weight of i (g/mol). As the source emits, both ∏i and ∏ change. Substituting Equations (10) and (11) into (9) gives:
Ewi = kci (cvi ⎟⎠
⎞⎜⎝
⎛∏∏ i – ci) . (14)
Determining ∏ by summing ∏i for all the individual components is a challenge in analytical chemistry and makes the model very complicated. The authors propose to use the molecular weight of the most dominant species in the solvent mixture to approximate the average molecular weight of the total mixture as was also proposed for the VB-model. (GUO ET AL. 1998)
35
3.2.3.2 Internal diffusion The mathematical expression for internal diffusion presented in the following has been elaborated by LITTLE ET AL. (1994) and COX ET AL. (2002). Fick’s second law, Equation 6, is the governing equation describing one-dimensional transient diffusion. The initial assumption is that the VOCs are evenly distributed throughout the sample. An additional assumption is that the flux out of the sample occurs only through one plane, i.e. the bottom and the edges of the sample are sealed. A second flux condition is imposed through a mass balance of VOCs in the chamber air. This can be expressed by three terms: the accumulation of VOC in the chamber air, the mass flux diffusing out of the sample, and the VOC leaving the chamber in the out-flowing air steam. This can be expressed as
t
ca
∂∂
V = - D A Ly
s
yc
=∂∂
- Q ca , (15)
where ca is the concentration of VOC in the chamber air, Q is the volymetric flow rate of air through the chamber, V is the volume of air in the chamber, and A is the sample area. Equilibrium is assumed to exist between the bulk and surface concentration of the sample and also between the surface concentration of the sample and the chamber air. This results in Equation 16, the assumption of a linear relation between the surface and the gas phase concentration of a specific VOC. Combining Equations 15 and 16 yields the appropriate boundary condition, Equation 17. cw = klca (16)
Lyc t
ckA
V
=∂∂⎟⎟⎠
⎞⎜⎜⎝
⎛⋅
+ DLyt
c
=∂∂ + Ly
cc
kAQ
=⎟⎟⎠
⎞⎜⎜⎝
⎛⋅
= 0 . (17)
A solution to Equation 17 considering the initial and boundary conditions given is
c(y,t) = 2 c0 [ ]∑∞
= ⎪⎭
⎪⎬⎫
⎪⎩
⎪⎨⎧
+++−−−
1222
22
)cos()()()cos())(exp(
n nnn
nnn
LqhkLqkqhLyqkqhtDq
, (18)
where
h = cADk
Q , (19)
k = cAk
V , (20)
36
and the qn values are the roots of qntan(qnL) = h – kqn
2 . (21) Equation 18 gives the VOC concentration in a sample as a function of distance from the base of the sample and time. An expression for the mass emission rate, Ev, may be derived from that equation according to (COX ET AL. 2002)
Ev = AJ ( ) Lyty =, = -ADLyy
tyc
=∂∂ ),( . (22)
The VOC concentration in the air is obtained from the experimental results and the partition coefficient achieved according to Equation 34, which will be presented in chapter 3.2.3.5 on model parameters. Thus, the VOC concentration at the sample surface may be estimated using Equation 16. 3.2.3.3 Sinks The models presented above do not take into account the sink effect of the test chamber walls. DUNN & TICHENOR (1988) were among the first to include a sink term in their VOC emission model. Later, TICHENOR ET AL. (1991) modelled indoor sink behaviour assuming mono-molecular adsorption for which the Langmuir isotherm can be applied. Assuming that the occupied adsorption sites are a small fraction of the total available sites, linear adsorption behaviour can be presumed. Their test results (TICHENOR ET AL. 1991) showed that the Langmuir equilibrium was applicable for adsorption at low concentrations while the desorption process showed different behaviour. Nevertheless, COX ET AL. (2002) evaluated the chamber sink effect assuming a linear and instantaneously reversible equilibrium relationship to exist between a stainless steel surface and the chamber air. This can be expressed as
ks = acq , (23)
where q is the adsorbed surface concentration and ks is the surface/air partition coefficient. ks has units of mass per surface area (As)/gram per volume (V). As is the exposed area of stainless steel within the chamber. The mass balance for VOC in the empty chamber yields
sAdtdq + V
dtdca = - Qca . (24)
37
If the gas-phase concentration in the chamber air at time zero is ca0, then combining Equations 23 and 24, and integrating, results in (COX ET AL. 2002)
ln ⎟⎟⎠
⎞⎜⎜⎝
⎛
0acc
= - ⎟⎟⎠
⎞⎜⎜⎝
⎛+ ss AkV
Q t . (25)
Equation 25 can be used to determine the value of ks from experimental data. A similar analysis may also be applied when a sample is present in the chamber. The incorporation of the adsorbed phase may be expressed simply as an increase in the chamber volume equal in magnitude to ksAs. This solution may be applied with Equation 20 as follows (COX ET AL. 2002):
k = c
ss
AkAkV +
. (26)
3.2.3.4 Relative humidity A model that takes into account the relative humidity of the surrounding air was developed by BERGE ET AL. (1980). It was developed for modelling formaldehyde emissions in a closed system, i.e. a space without ventilation or concentration gradients in the surrounding air. The influence of temperature and relative humidity on the steady state formaldehyde concentration, C, is described as:
C =
[ ] ⎟⎟⎠
⎞⎜⎜⎝
⎛−−
−+ 0T1
T1E
0
m
e )HA(H1
C , (27)
where, Cm is the measured formaldehyde concentration, A is a coefficient of relative humidity whose optimum value is 0.0175, H is the test relative humidity (%), H0 is the relative humidity under standardised conditions (%), E is a coefficient of temperature whose optimum value is 9799, T is the test temperature (K) and T0 is the temperature at standardised conditions (K). (BERGE ET AL. 1980) The standardised relative humidity is 50 % and the standardised temperature is 23° C according to ENV 13419. The temperature used in this study was 21° C during sample collection for all samples, which gives a temperature correction factor of 0.798. GODISH & ROUCH (1985) found good agreement between experimentally measured formaldehyde concentrations and the level determined using the Berge equation.

38
Another, empirical, function was presented by DUNN & TICHENOR (1988) to apply for VOCs. It has the following expression: E = - 12.28 + 0.6155 T + 32.28 ACH/RH , (28) where E is the emission rate factor (mg/h g), T is the temperature (° C), ACH is the air change rate (h-1), and RH is the relative humidity (%). 3.2.3.5 Model parameters The variables that are most difficult to specify in the models presented in the foregoing sections are the initial mass of the VOC applied, the thickness of the diffusion boundary layer or alternatively the material/air partition coefficient, and the diffusion coefficient. However, the initial mass of VOC can be approximated from product formulation. Values for the partition and diffusion coefficients can be found in the literature, but the information is rather scarce. They can also be approximated according to the following equations. In all viscous flows, the controlling parameter is the Reynolds number, which links the inertial force to the viscous force:
ReL = νuL , (29)
where ReL is the Reynolds number (-), u is velocity (m/s), L is a characteristic length (m) and ν is the kinematic viscosity (m²/s). SPARKS ET AL. (1996) derived the correlation between the Sherwood number (Sh) and the Reynolds number (Re) from experimental data: Sh = 0.33 Re2/3 (30) This result is very close to the expression for mass transfer during laminar flow with a stationary interface and an air-velocity, νx = ν∞ sufficiently far from the interface for which the following applies: Sh = 0.332 Re1/2Sc1/3 , (31) where Sc is the Schmidt number, which is the measure for the ratio between the thicknesses of the hydrodynamic and concentration boundary layers, i.e. the ratio of viscous diffusion to the diffusion of mass. (BEEK ET AL. 1999) The Schmidt number is expressed as
39
Sc = Dν , (32)
where ν is the kinematic viscosity (m²/s) and D is the mass diffusivity. The boundary layer theory for mass transfer defines the Sherwood number as
Sh =D
Lkc (33)
where L is the characteristic length of the source, i.e. the square-root of the source area (m) and D is the diffusivity of the pollutant. Combining Equation 33 with the expression for the Reynolds number, Equation 29, and the relation between the Reynolds number and the Sherwood number, Equation 30, gives an expression for the partition coefficient:
kc = 0.33 DaLc-(1/3)
3/2
⎟⎟⎠
⎞⎜⎜⎝
⎛μρu , (34)
where Da is the diffusivity of VOC in the air (m²/h), Lc is the characteristic length of the source, i.e. the square-root of the source area (m), u is the air-velocity over the source (m/h), ρ is the air density (g/m³), and μ is the viscosity of the air (g/h m). Lc and u can be obtained from the experimental set-up, ρ and μ can be found in the literature, and Da can be calculated according to the FSG method (FULLER ET AL. 1966):
Da = [ ]23/13/1
75.1310
VOCa
r
VVp
MT
+
−
, (35)
where T is the temperature (K), Mr = (Ma + MVOC)/MaMVOC, i.e. the molecular weight of air and the specific VOC (g/mol) respectively, p is the pressure (atm), Va is the molar volume of air (cm³/mol) and VVOC is the molar volume of the specific VOC (cm³/mol). MEININGHAUS ET AL. (2000b) estimated the partition coefficient for combinations of m-xylene and n-octane with several indoor materials using both a micro-balance set-up and a CLIMPAQ-method. The micro-balance set-up gave a linear or almost linear relationship between gas phase concentration and adsorbed mass at steady state. This relationship gave the partition coefficient, Kp, which is dimensionless. There were some discrepancies between the results from the two test set-ups, but these were related to limitations in the micro-balance method and different experimental conditions. The limitations comprised limited sensitivity of the micro-balance, fluctuations in water levels present in the samples that may hide or vary VOC adsorption effects, and errors caused by the analytical process.
40
In another study, MEININGHAUS ET AL. (2000a) used two CLIMPAQs to determine the effective diffusion coefficient, sorption capacities, partition coefficients, and t0.25-values for several different building materials using ethyl acetate and n-octane. The t0.25-value indicates the time until the concentration of a compound had dropped to one-fourth of its initial value. The partition coefficients determined from the two studies presented above are shown in Table 6. Table 6. Partition coefficients for different VOCs and building materials according to MEININGHAUS
ET AL. (2000a) and MEININGHAUS ET AL. (2000b). Material Partition coefficient, kc m-xylene n-octane ethyl acetate wallpaper 1.21 0.211 - acrylic paint on wallpaper 0.720 0.140 - carpet (not specified) 1.028 0.226 - carpet with SBR backing - 0.381 0.170 PVC 0.360 0.010 - aerated concrete 0.144 0.043/0.120 >2.614 solid concrete - 0.031 >0.590 brick wall - 0.016 0.129 gypsum board 0.010 0.010/0.105 0.133
COX ET AL. (2001) also measured the partition and diffusion coefficients for VOCs ranging from n-butanol to n-pentadecane and water vapour in vinyl flooring using a micro-balance. Their studies showed that both the material/air partition coefficients and diffusion coefficients are independent of concentration. For the four alkanes (n-decane, n-dodecane, n-tetradecane, and n-pentadecane) studied, the partition coefficient increased with increasing vapour pressure while the diffusion coefficient decreased with increasing molecular weight. This result was similar to the findings by LITTLE ET AL. (1994) and BODALAL ET AL. (2000). The simultaneous sorption of a binary mixture showed to be non-competitive, which is consistent with the linear partitioning mechanism emphasised also by Meininghaus and his colleagues mentioned before. On the other hand, HE AT AL. (2004) concluded that the diffusion coefficient decreases with increasing molecular weight, but that the partition coefficient decreases with the increase of vapour pressure. They obtained their values for the diffusion and partition coefficients by fitting existing emission data from small-scale chamber measurements through regression. LITTLE ET AL. (1994) and BODALAL ET AL. (2000) also measured the partition and diffusion coefficients for different materials and VOCs tested based on emission results. Even though the experimental set-ups for these three studies differed, their results were similar and are presented in Table 7. The partition coefficients achieved by Meininghaus and his colleagues differ from that of the three other studies because of the different mathematical expressions used. This also makes it impossible to compare the values in Tables 6 and 7 with each other.
41
Table 7. Partition and diffusion coefficients for different building materials according to LITTLE ET AL. (1994), BODALAL ET AL. (2000), COX ET AL. (2001), and HE ET AL. (2004).
Experimenter / material Partition coefficient (-)
Diffusion coefficient (m²/s)
Little et al. / carpets 1 – 450,000 6.0×10⁻¹⁴ – 10.2×10⁻¹² Cox et al. / vinyl flooring 78 – 420,000 6.7×10⁻¹⁴ – 3.6×10⁻¹² Bodalal et al. / carpet, vinyl floor tile, and plywood
348 – 27,000 8.6×10⁻¹³ – 1.6×10⁻¹⁰
He et al. / acoustic ceiling tile, carpet, gypsum board, orient stranded board, particle board, plywood, sub floor tile, and under pad
86 - 276,000 1.5×10⁻¹³ – 10.5×10⁻¹⁰
CLAUSEN ET AL. (1993) found that, for a given product, the partition coefficient is related to the film thickness according to: kc = kce/θ , (36) kc = kcd/θ² , (37) where kce denotes evaporation-controlled emission, kcd denotes diffusion-controlled emission, and θ is the film thickness (m). Equations 36 and 37 provide a way to adjust kc when the film thickness changes. CHANG & GUO (1994) noted that, for an individual VOC in a given product, the partition coefficient can be related to its vapour pressure.
2
1
c
c
kk
= 2
1
pp (38)
Based on what has been presented in the preceding chapters, the applicability of a deterministic model based on the mass balance in the climate chamber will be evaluated in this work.

42
4 INFLUENCE OF MOISTURE ON EMISSIONS 4.1 POLARITY, HYDROPHILICITY AND LIPOPHILICITY GEHRIG ET AL. (1993) and CHANG ET AL. (1997) noted that compounds with more polar oxygen containing functional groups show lower emissions from a liner-covered gypsum plate and from a wood chip wallpaper than from a glass or stainless steel plate. WOLKOFF ET AL. (1993) modelled the emission process from different building products using a Field and Laboratory Emission Cell (FLEC) in their tests. They observed that maximum chamber concentrations were generally reached within two hours at an air exchange rate of 342 h-1 for non-polar volatile organic compounds or volatile organic compounds having a low boiling point. Polar and high boiling volatile organic compounds required 25-75 hours at the lowest air exchange rate, 171 h-1 to reach maximum chamber concentration. According to the authors, one rationale for this result could be that the non-polar, low boiling compound establishes a concentration gradient within the material relatively faster than the more polar, high boiling volatile organic compounds. COLOMBO ET AL. (1993) studied the adsorption of vapours of different polarity on a carpet made of nylon fibre with a SBR backing, a gypsum board, and a blown vinyl wall coating. Their experiments showed that adsorption seems to occur to at least two different sinks, i.e. adsorption sites with different rate constants in the same material. They also concluded that generally adsorption increases with the boiling point of the compounds, but that it also depends on other physicochemical properties, such as the chemical functionality of the compounds, as well as on the sorbent material. One of the main criteria for the selection of a compound for adsorption testing was the lipophilic or hydrophilic character of the compound, a feature that is more important than polarity according to their experience. In their study on the retention capacities (RC values), i.e. how strongly a VOC is held back by a building material, for different materials MEININGHAUS ET AL. (1999) showed two evident features of the RC values, which were partly overlapping. These were: an increase of RC values, i.e. the compound is held back by the material more strongly, with increasing boiling point of the compounds, and higher RC values for hydrophilic compared to lipophilic compounds. The highest RC values were found for the carpet and gypsum board studied, for which the differences between lipophilic and hydrophilic compounds were more pronounced. In this case, presumably the capacity of the compounds to form hydrogen bonds was the discriminating factor. An interesting difference could be noticed between the RC values of linalool and menthol. Although menthol has a higher boiling point, linalool has significantly higher RC values with the exception of gypsum board and a carpet with polyamide tuft and
43
polypropylene backing where the values were similar. This points to an influence of the molecular structure (linear vs. ring) or the degree of unsaturation as influencing factors according to the authors. (MEININGHAUS ET AL. 1999) In another study MEININGHAUS ET AL. (2000b) observed different adsorption behaviours of m-xylene and n-octane on typical indoor materials under controlled relative humidity (45 %) and temperature at ambient pressure. The materials included wallpaper, carpet, acrylic paint on wallpaper, PVC, aerated concrete, gypsum board, marble, and wooden parquet. They stated that since m-xylene, in contrast to n-octane, has a weak permanent dipole, and due to the π-electrons of the aromatic structure, it can be easily polarised. Interactions between m-xylene and a material surface will therefore be based on combinations of dispersion, dipole-dipole and dipole-induced dipole interactions, whereas for n-octane only (weak) dispersion interactions will contribute. KIRCHNER ET AL. (1995) studied the adsorption and desorption behaviour of 2-butoxyethanol on six different building materials in a chamber. They noticed that since 2-butoxyethanol is miscible in water, increasing the liquid water content in the chamber would tend to lower its gas-phase concentration and/or its retention efficiency on the Tenax tubes. Therefore they would rather privilege a kind of “liquid water content effect” (in the chamber and/or the adsorbent sampling tubes) than an “adsorption on the walls effect” to explain their observed chamber sink, i.e. adsorption of volatile compounds on the chamber walls. 4.2 THE INFLUENCE OF MOISTURE ON THE SORPTION OF ORGANIC
COMPOUNDS DUNN & TICHENOR (1988) observed in their study where they modelled chamber sink-effects mathematically that the air change rate of the chamber must be adjusted to compensate for the increasing relative humidity in order to maintain a constant emission rate factor. Increasing the air change rate will increase the emission rate factor more rapidly at a low relative humidity than at a high relative humidity. Increasing relative humidity will, on the other hand, offset the effect of increasing the air change rate, particularly at high air change values. The authors speculated that the reason for the noted effect was that the increasing humidity might have conditioned the adsorptive sites in their test chamber. GOSS & EISENREICH (1996) studied the influence of relative humidity on the adsorption equilibrium of VOCs from the gas phase onto different minerals and a mineral mixture. They found an exponential decrease of the adsorption coefficients (weaker adsorption) of all tested compounds which included alkanes, aromatic and chloroaromatic compounds, alcohols, ketones, and ethers, between 30 % and 90 % RH. Below 30 %, the influence of the relative humidity was even stronger. They hypothesised, based on this and also their earlier studies (GOSS 1992 and 1993), that this result is valid for all minerals in general. They also stated
44
that the extrapolated adsorption coefficients at 100% RH agrees with those reported for a bulk water surface. At close to 100% RH, the adsorbed water film apparently was thick enough to prevent influence of the mineral surface on adsorption. They also noticed that the adsorption of organic vapours to a mixture of minerals was equal to the sum of the contributions of the single minerals. The sorption of organic vapours to mineral surfaces may generally occur by three different mechanisms according to PENNELL ET AL. (1992). These are: adsorption from the vapour phase to the pure mineral surface, adsorption on the surface of a water film that is adsorbed on the mineral, or dissolution into an adsorbed water film. The relative importance of these different sorption mechanisms varies with varying humidity. Adsorption at the interface between the mineral and an adsorbed water film as another sorption mechanism can be ruled out since non-polar and most polar organic compounds cannot effectively compete with water for adsorption sites on a pure mineral surface. However, organic matter usually dominates the sorption of organic compounds from the aqueous phase. The sorbent can affect the adsorption equilibrium in two ways: by the number of available adsorption sites, which is proportional to the specific surface area and linearly related to the adsorption coefficient, and by the affinity that an adsorption site has for the adsorbate. (GOSS & EISENREICH 1996, RUIZ ET AL. 1998) Thus, the actual surface area available for adsorption of any given compound depends on whether the adsorbate molecule can reach the adsorbing sites. The larger the adsorbate molecule relative to the pore size of the adsorbate, the less adsorption is expected to occur at any given relative vapour pressure. (AMALI ET AL. 1994) GOSS & EISENREICH (1996) also concluded that the adsorption of alkanes is dominated by dispersion interactions (induced dipole interactions with the surface are neglected) and can thus be used to characterise the dispersive component of the surface free energy of the adsorbents. The adsorption interactions of the aromatic compounds are also dominated by dispersion forces, with hydrogen bonds and dipole interactions (where it applies) being of less importance. The oxygen-containing carbohydrates show a stronger deviation from this order. Their adsorption is dominated by the formation of hydrogen bonds with the hydrated surface. RUIZ ET AL. (1998) reached a similar conclusion and stated further that whilst organic compounds compete with water molecules for adsorption sites, due to the strong dipole interactions of the polar water molecules, they displace the non-polar organic molecules such as aliphatic and aromatic hydrocarbons. In the case of polar compounds, the interactions with the adsorption sites are of the same intensity as of water, and the reduction in adsorption is significant only at low VOC concentrations. MEININGHAUS ET AL. (2000a) studied the sorption and diffusion of volatile organic compounds in different building materials. They observed large differences in the sorption capacities for n-octane and ethyl acetate especially for different concrete samples. They hypothesised that this was attributed to the ability to form hydrogen bonds, because ethyl

45
acetate, in contrast to octane, can act as a hydrogen bond base via the oxygen of its ester group. Additionally, the presence of pores and capillaries could be an important parameter according to the authors. At 45% RH, water condensation may take place in the pores. Henry’s law constants are a measure for the solubility of a species in water. For n-octane and ethyl acetate they differ over several orders of magnitude being 3×10⁻⁴ M/atm and 5.9-7.4 M/atm, respectively. The solubility of a compound in capillary-condensed water in materials could therefore explain different sorption behaviours. (They also studied whether hydrolysis would explain the differences in the sorption behaviour of n-octane and ethyl acetate, and concluded that the hydrolysis reaction does not contribute to the sink effect.) COX ET AL. (2001) found in their study on the partition and diffusion coefficients for a selection of VOCs and water vapour in a vinyl flooring that water vapour is rapidly absorbed in the flooring compared with the other compounds. It reached equilibrium after about one hour while n-dodecane required about 25 hours and phenol required about 60 hours to reach equilibrium. When the authors compared the individual uptake curves for water vapour and phenol to the curve for their binary system, there was no observable difference in the overall uptake until about three hours. After this, the vinyl flooring specimen exposed to the two-component gas stream took up more mass than would be expected if the sorption processes were completely independent. Similar results were obtained for the n-dodecane and water vapour system. The test results for both systems suggested that sorbed water molecules increase the total uptake of VOCs. The apparent increase in sorption capacity of VOCs in vinyl flooring in the presence of water may be attributed to several causes according to the authors. Firstly, water can exist in polymers in bound or bulk form (SAMMON ET AL. 1998). Consequently, VOCs could dissolve into bulk water that may be present in the pores of the vinyl flooring. However, the relatively small vinyl flooring/water vapour partition coefficient suggests that little bulk water is present in the vinyl flooring. Even if all the water in the vinyl flooring at equilibrium was in bulk form, calculations using Henry’s law constants for phenol and n-dodecane show that the VOC mass absorbed into the bulk water would be small compared to the apparent increase in sorption capacity of the vinyl flooring in the presence of water vapour. Therefore, dissolution in water alone can not account for the observed increase in sorption capacity. Another possible mechanism is that bound water molecules could disrupt the dipole-dipole interactions between the relatively polar PVC chains effectively further plasticising the PVC in the vinyl flooring (TSUKRUK ET AL. 2000). Additional plastification would increase the void volume within the PVC matrix, possibly increasing its sorptive capacity. From a thermodynamic viewpoint, the free energy of the vinyl flooring/solute system is lower for the mixture of solutes than for a single solute. System free energy is the sum of the chemical potential of each species present in the system. Molecular interactions between solute species sorbed to the vinyl flooring could lower the chemical potential of each sorbed

46
species. Overall system equilibrium would then shift to total gas/solid system free energy. The equilibrium shift due to solute interactions would result in more molecules sorbed to the vinyl flooring. The higher apparent sorptive capacity of the vinyl flooring/phenol/water system compared to the vinyl flooring/n-dodecane/water system could result from greater affinity between phenol and water. Phenol and water have similar polarities, which may create a lower free energy state compared to the vinyl flooring/water/dodecane system. (TSUKRUK ET AL. 2000) 4.3 THE INFLUENCE OF MOISTURE ON EMISSIONS Moisture can enable, promote, or change chemical reactions in building materials. Moisture also enables the growth of moulds and other micro-organisms in building materials, and the formation of volatile compounds generated by them. The adverse effects caused by moisture usually require a high and long-standing moisture load. Problems caused by a long-standing and severe moisture load together with an estimate of moisture contents that may cause damage of building materials are presented in Table 8. Table 8. Examples of structures exposed to moisture or alkaline moisture, estimated threshold values leading to damage, and generated emissions (SAARELA 1992 and 1999). Material RH of the material (%) Damage and emission PVC mats and covers in damp structures
>95 Staining, decomposition reactions, 2-ethyl-1-hexanol
Water-soluble paints >95 Saponification, material specific products of hydrolysis
Water-based glues in damp structures
>85-95 Saponification, material specific products of hydrolysis
Urea-formaldehyde based resins in lacquers and binding agents in insulations
>60-70
Degradation, formaldehyde
Two component paints, injection resins, plastic fillers
Material specific Inhibition of curing reactions, monomer emissions
Micro-organisms
>85
Bio-aerosols, volatile organic compounds generated by micro-organisms (MVOC)
The influence of moisture on materials may consist of hydrolytic degradation reactions and thereby induced emissions. For instance resins used as binding agents may degrade in unfavourable conditions, i.e. when the moisture load is high. This may result in emissions of formaldehyde and higher aliphatic and aromatic aldehydes, such as benzaldehydes and its derivatives, and ketones. (SAARELA 1992)

47
Moisture that evaporates from wet cement based-materials is alkaline and causes alkalihydrolytic reactions in many polymeric materials. Some phtalic plasticisers included in PVC carpets and also other materials may degrade in damp, alkaline conditions. This kind of degradation results in e.g. 2-ethyl-1-hexanol that gives damaged PVC materials their characteristic, strong smell. Alkaline moisture, especially when it includes ammonia caused by a degradation reaction, also causes staining of materials such as the discoloration of oak, and it may also generate stains observed on PVC carpets. (SAARELA 1992) Besides the hydrolytic degradation reactions of polymers presented above, moisture also hinders the curing reactions of in situ cured resins. This results in a change in the proportions of the components taking part in the curing reactions and thus leads to incomplete curing and, as a consequence, emission of non-reacted monomers from the resin. (SAARELA 1992) Water and moisture are often factors of decisive importance in connection with many substances’ release from or binding to the surface of a material. The properties of the individual material are often of course important, but under practical circumstances water of some sort is always present, which often is of greater importance to the release of the substances to the surroundings than the material components themselves. Through interaction between the potential decontamination product and water, micro-atmospheres are created where contamination can take place. (NIELSEN 1987) Acidity of the water, its pH-value, is of importance to the potential pollutants, which can be ionised. If the potential pollutant is an amine, it is bound in a water phase whereas it can be released on an alkaline surface, e.g. concrete. Conversely, the acids will be bound on alkaline surfaces and be released if these are, or become, acid. In addition to the fact that water is of importance to substances, which can be ionised, it might influence other non-ionisable matters too, i.e. those forming azeotropic (a mixture of liquids that has a constant boiling point) mixtures together or with water. These could be water-soluble as well as insoluble. (NIELSEN 1987) In connection with indoor climate many different substances are often present and it can be difficult to calculate the mechanisms behind the decomposition of a material. The presence of water consequently may have the effect that adsorbent substances from a surface of a material can be “lifted” into a ventilating gas phase. (NIELSEN 1987) There are two distinct features characterising the studies about the influence of water on the emission of organic compounds from different building materials. One concerns studies conducted mainly in the 1980s, which concentrate on the emission of formaldehyde. The other concerns the correlation between emissions and relative humidity. These are conducted during the 1990s and onwards.

48
ANDERSEN ET AL. (1975) studied the influence of different climatic parameters on the emission of formaldehyde from a chipboard fabricated using a urea-formaldehyde glue in a climate chamber. They noticed that an increase in the relative humidity from 30 % RH to 70 % RH doubled the formaldehyde concentration in the chamber. In his study on the importance of potential pollutants to the sick building syndrome, NIELSEN (1987) also observed the release mechanisms of the pollutants. He emphasised the importance of water on the emission of formaldehyde, which has a great affinity to water. The reaction between water and formaldehyde is an equilibrium reaction and is presented in Equation 39:
CH2O + H2O ⇌ CH2(OH)2 , (39) This balance will be strongly shifted in favour of glycol, i.e. formaldehyde will be bound when water is present, for instant on moist walls. (MEYER 1979) As the moisture content of many materials varies according to the moisture content of the air, different materials will form an effective buffer for moisture as well as for formaldehyde and probably for many other substances. HAWTHORNE & MATTHEWS (1987) also stated that one mechanism that might affect the emission process is water vapour that can decompose a building material and release pollutants. They modelled formaldehyde emission and included product age, the influence of temperature and relative humidity on the generation of emissions, and the influence of temperature and relative humidity on the transport coefficient. The characteristic product concentration was derived from experimental data. According to their model thus developed, the likely seasonal variation in temperature and relative humidity results in a substantial change in the emission rate. VAN NETTEN ET AL. (1989) found in their studies on the release of formaldehyde from different building materials that based on the response of the various materials to high and low humidity, over the time span used in their study, there appear to be two general categories. One increases formaldehyde release with increasing humidity, i.e. the wood-based products including ceiling tile, shiplap, plywood, and particleboard. The other class includes gypsum board, lath and plaster, terra cotta brick, and cement block. The materials belonging to the latter category decrease formaldehyde release with increasing humidity for the first hours, but this trend reverses after approximately 4 hours. The materials belonging to the latter group had been in contact with urea formaldehyde insulation before testing. TUCKER (1991) reviewed studies on emissions from indoor surface materials conducted by that time. He concluded that early studies of formaldehyde emissions from pressed-wood products showed that relative humidity was an important factor influencing the emission rate.

49
He further stated that research studies of other pollutants have, however, shown that their emission rates from various materials are not particularly sensitive to relative humidity, at least for the normal range found indoors. Therefore, only materials that are known to emit highly polar compounds need to be tested at different relative humidities. Studies on the emissions of compounds other than formaldehyde have concentrated either on the relative humidity of the indoor air or on the moisture content of the material. It seems that the moisture content of the material is affecting the emissions more pronouncedly than the relative humidity of the indoor air. SOLLINGER ET AL. (1993) studied the organic emissions from textile floor coverings in a climate chamber under static conditions, i.e. with no air exchange. They determined the dependence of concentration of 15 compounds emitted from the same textile floor covering at 0 and 45 % relative humidity. Their results demonstrated that the equilibrium concentrations did not depend on humidity with the possible exception of aniline, the emission of which increased slightly with increasing humidity. WOLKOFF (1998) studied the influence of two different relative humidities, 0% and 50% RH, on the emission of two volatile organic compounds of concern from five building products: PVC flooring, tufted carpet, water-borne acrylic floor varnish on pre-treated beech-wood parquet, water-borne acrylic wall paint applied onto gypsum board, and an acrylic sealant. He noticed that some of the volatile organic compound emissions were markedly influenced by the relative humidity, and that the dependency was related to building product and the type of volatile organic compound emitted. For example, the results for the wall paint studied showed that while the Texanol time/concentration profile was unchanged by the different relative humidities, the concentration/time profile of propandiol approached zero concentration at 0% RH in less than one day. The low humidity may have resulted in a different film structure due to a faster dry-out process or otherwise, the water vapour itself carries polar substances from the surface. 2-ethylhexanol and dimethyloctanols emitted from the studied carpet and the sealant, respectively showed increased concentration/time profiles at 50% RH. This infers that the plasticisers present may decompose to their corresponding free alcohols already at 50% RH. Thus, he recommended including the relative humidity as an element in the emission testing of building products. FANG ET AL. (1999) studied the chemical and sensory emissions from the same building materials as used by Wolkoff (see the preceding paragraph). They noticed that the effect of the humidity of the ambient air was significant for the primary emission of total volatile organic compounds (TVOC) emitted from waterborne materials – floor varnish and wall paint. The increased emissions from the materials with increasing relative humidity were also clearly perceivable. The authors proposed that increasing moisture in the air leads to extraction of more hydrophilic VOCs out of the material surface and therefore increases the emission rate of those compounds. This would imply that the moisture level of the material
50
might influence the rate of emissions. LUNDGREN ET AL. (1999) also stated that high concentrations of volatile organic compounds in indoor air studies may indicate moisture damage of building materials. HAGHIGHAT & DE BELLIS (1998) studied the impact of temperature and relative humidity on material emission rates. Their experimental set-up was analogous to the one used in this study, which is presented in chapter 6. Haghighat’s and de Bellis’ emission test chamber design was somewhat different from the one used in this study, but they also mixed humidified and dry air to reach a desired level of relative humidity. The relative humidities used were 3 %, 32 %, and 62 %. A water-based gloss acrylic paint and a polyurethane plastic finish varnish were used in their experiments. It was noted that as the humidity increased, the TVOC emission rates increased for both the paint and varnish, but that it is truly impossible to generalise the behaviour of individual compounds based on the TVOC time-emission rate curve. They further noticed that though the concentration of the varnish was near depletion at the end of the test period, when the test chamber door was opened, a strong odour was still detected. Though feeding very dry air, 3 % relative humidity, into the test chamber with the paint sample, it was noticed that the release of water vapour from the sample must impede the release of VOCs. As the recorded exit humidity dropped to levels below 30 % relative humidity, which occurred after 12-24 hours, the time-emission rate curve began to behave exponentially as expected. As far as the water-based paint and the relative humidity in the test chamber were concerned, the time-emission rate curves could not be described as exponential decays. The curves reached steady state after approximately 160 hours, but the emission rates were not yet depleted. The emission rates were higher at 32 % relative humidity than at 62 % relative humidity. The relationship between emission rate and relative humidity could not be generalised as either directly or inversely proportional. At 32 % relative humidity the humidity may be such that the vapour pressure of the overlying air encourages, rather than inhibits, the release of VOCs. This is not as evident at the other two levels tested. The emission rates recorded for the 3 % relative humidity test yielded the lowest emission rates and depletion values. The impact of the relative humidity on the different compounds studied was quite extraordinary. Toluene and m,p-xylene were greatly affected by the humidity but at different levels, for instance. As they also have very abundant emission rates, their reaction to the relative humidity must impact the TVOC emission rate profile. The behaviour of the TVOC emission rate was also noticed to be different for the two materials tested. The higher water content of VOCs in the paint may cause this difference. The explanation may be due to the release of water vapour from the paint sample impeding the release of VOCs due to hydrogen bonding. The effects of relative humidity thus can not be summarised into a general trend for the emissions from different materials. (HAGHIGHAT & DE BELLIS 1998) The varnish had the highest emission rates recorded for the highest humidity level. Though following smoother trends than the paint, the varnish still showed varied effects under the
51
influence of different relative humidities. Its TVOC increased with increasing humidity, but some of its individual compounds showed higher emission rates at RH 32 % than at RH 62 %. (HAGHIGHAT & DE BELLIS 1998) KORNUM (1980) reached similar conclusions to the ones by Haghighat and de Bellis in his studies on the influence of relative humidity on the evaporation of water and solvents from different water/organic solvent mixtures. THØGERSEN ET AL. (1993) studied the effect of water-damaged chipboards on the indoor air quality. They stated that during the material decay phase caused by water damage, chemical substances are diffused to the material surface and evaporate. After emissions have stabilised, subsequent decomposition will determine the emission rate. Thus, during water damage the high emission rate is caused by the high water content, which increases the diffusion speed inside the material. The emission rate is also increased by organic compounds being transported into the air along with water during evaporation. A high water content also promotes the dissolution of the glue used in the fabrication of the chipboard. Water damage to chipboards resulted in increased emission of organic compounds even when the chipboards had dried. WOLKOFF ET AL. (1993) showed in their study that wetting linoleum had a marked influence on the qualitative emission of fatty acids, glycol ethers, and 2-decenal. WIRTANEN ET AL. (2002) studied the influence of moisture damage on the emissions from common floor structures. The results showed that an external moisture load increases the emission of α-pinene from a wood-based parquet composite. An external moisture load increased also the emission of 1,2-propanediol and 2-butoxyethanol originating from a water-borne lacquer applied onto a wooden mosaic parquet (WIRTANEN 2001)

52
5 OBJECTIVES OF THE EXPERIMENTAL STUDY The main objective of the experimental part of this study is to clarify the influence of moisture and substrate on the emission of volatile organic compounds (VOC) from paints and adhesives as a part of a wall structure using environmental test chambers and the Field and Laboratory Emission Cell (FLEC). Earlier studies have, as been shown, concentrated either on a substrate effect, the emissions from a coating spread onto an inert substrate has been compared with the emissions from a coating spread onto gypsum board, or a humidity effect using only a single material layer applied onto an inert substrate. In this study the combined effect of relative humidity and different substrates, i.e. an inert substrate (glass), gypsum board, and plasters applied onto calcium silicate brick, on the emissions from combinations of primer and paint and adhesives will be clarified. This is done by introducing the materials to be tested into environmental chambers into which humidified air having specified relative humidities will be introduced. The emitted compounds, which are analysed using gas chromatography and mass spectrometry, are collected into Tenax TA-tubes both directly from the chamber air and from the surface of the samples by using FLEC, and the results are compared with each other to verify whether the test chambers' inner surfaces have acted as sinks. FLEC samples will be collected only at the end of each testing period. The relative humidity of the chamber air, the olfaction, and the weight change of the samples are also recorded. The information of the composition of different materials provided by their manufacturers is usually rather scarce, thus the physical and chemical characteristics of the different materials will be studied using mercury intrusion porosimetry, infrared spectroscopy, pH-indicator liquid, light microscopy, and environmental scanning electron microscopy (ESEM) equipped with an energy-dispersive spectrometer. The ESEM is, thus, used both for studying the surface of the materials and for performing element analysis. Another, more practical, objective of the study is to verify if it is possible to achieve a low emission rate using different material combinations. A target value of 30 μg/m²·h was set based on the study by MØLHAVE ET AL. (1996). This area specific emission rate would result in a target concentration of 200 μg/m³ attained in a small bedroom 1 year after construction. This value is also the target value for the best indoor climate category according to the Finnish classification of indoor climate (CIC 2000). Matters that are not dealt with in this study include deterioration of the samples, i.e. hydrolysis and other failure mechanisms, and aging phenomena. Aging is defined in this context as sample ages over 28 days, which is the highest testing age according to the standard ENV 13419 (1999). These exclusions are made since one of the main objectives of this study is to achieve a low emission rate in a short period of time. Another relevant issue, as far as the indoor environment is concerned that is left untreated is the health implications of the VOCs emitted.

53
6 MATERIALS AND EXPERIMENTAL SETUP Three products of each material group: primers and paints, adhesives, and fillers and plasters, were chosen according to their popularity among domestic consumers (according to ironmongers’ sales personnel’s estimate), classification (CIC 2001), and chemical composition as given by the product manufacturer. The substrates were glass (used as reference), gypsum board, and calcium silicate brick together with a combination of filler and plaster B or a single layer of plaster C. The materials used and their main characteristics are presented in Table 9. Table 9. The materials used in this study and their main characteristics. Material Main characteristics Classification1) Primer A Water-borne acrylic emulsion primer M1 Paint A Water-borne acrylic emulsion paint M1 Primer B Water-borne acrylic emulsion primer M1 Paint B Water-borne acrylic emulsion paint M1 Primer C Alkyd resin primer - Paint C Alkyd resin paint - Adhesive A Water-borne PVAc-dispersion glue - Adhesive B Water-borne PVAc-dispersion glue - Adhesive C Water-borne PVC-dispersion glue - Filler A Polymer binder, water mixable M1 Plaster A Polymer binder, water mixable M1 Filler B Polymer binder, ready-mixed M1 Plaster B Polymer binder, ready-mixed M1 Plaster C2) Gypsum binder, water mixable M1 Gypsum board - M1 Calcium-silicate brick (CSB) - M1
1) The limit for the emission rate of total volatile organic compounds (TVOC) for M1 products is 200 μg/m²·h at 28 days. The products should also be odourless. (CIC 2001) 2) Plaster C is not used together with a filler. A primer is a coating product generally used as a substrate for a paint. One of the main differences between primers and paints is a lower gloss and higher filler content of the former. A filler is a plastering product used for filling holes and levelling a rough substrate such as a brick wall. It forms the substrate for a plaster, which itself forms the substrate for e.g. a paint or wallpaper. Primers and paints as well as adhesives A and B have different manufacturers. The study was divided into three successive parts and the results from a previous part were used in the following ones. The main objective of Part I was to study the influence of ambient relative humidity on the emission of VOCs from single material layers on an inert substrate (glass). The objective of Part II was to study the VOC-emissions from combinations of

54
primer and paint or filler and plaster prepared according to the manufacturer’s recommendations, on an inert substrate. The least and most emitting materials (adhesives) and material combinations (primer and paint and filler and plaster) according to the results in Part I and Part II were used in Part III, where they were spread onto real substrates, i.e. on gypsum board or CSB. Thus, the objective of Part III of this study was to examine the emissions from real structural components at different ambient relative humidities. Factorial experimental design was used in the set-up regarding the CSB as a substrate in Part III of this study. The materials studied in the different Parts are presented in Figure 2. The relative humidity of the air introduced into the test chambers (measurement of empty chamber) and the time of testing are presented in Table 10.
Figure 2. Materials and material combinations studied in the different Parts of this study.
Part I Substrate: glass plate
Paints A and C Adhesives A and C Gypsum board A 3 mm layer of plasters A and C
Part II Substrate: glass plate
Primer A and paint A Primer B and paint B Primer A and paint C Primer C and paint C
Adhesive B Filler A and plaster A (3+3 mm) Filler B and plaster B (3+3 mm)
Plaster C (6 mm)
Part III Least and most emitting adhesive and primer+paint combination applied onto real substrates, i.e. gypsum board or plastered CSB
Adhesive applied onto gypsum board or onto (filler+)plaster combination applied onto CSB
Primer+paint combination applied onto gypsum board or onto
(filler+)plaster combination applied onto CSB
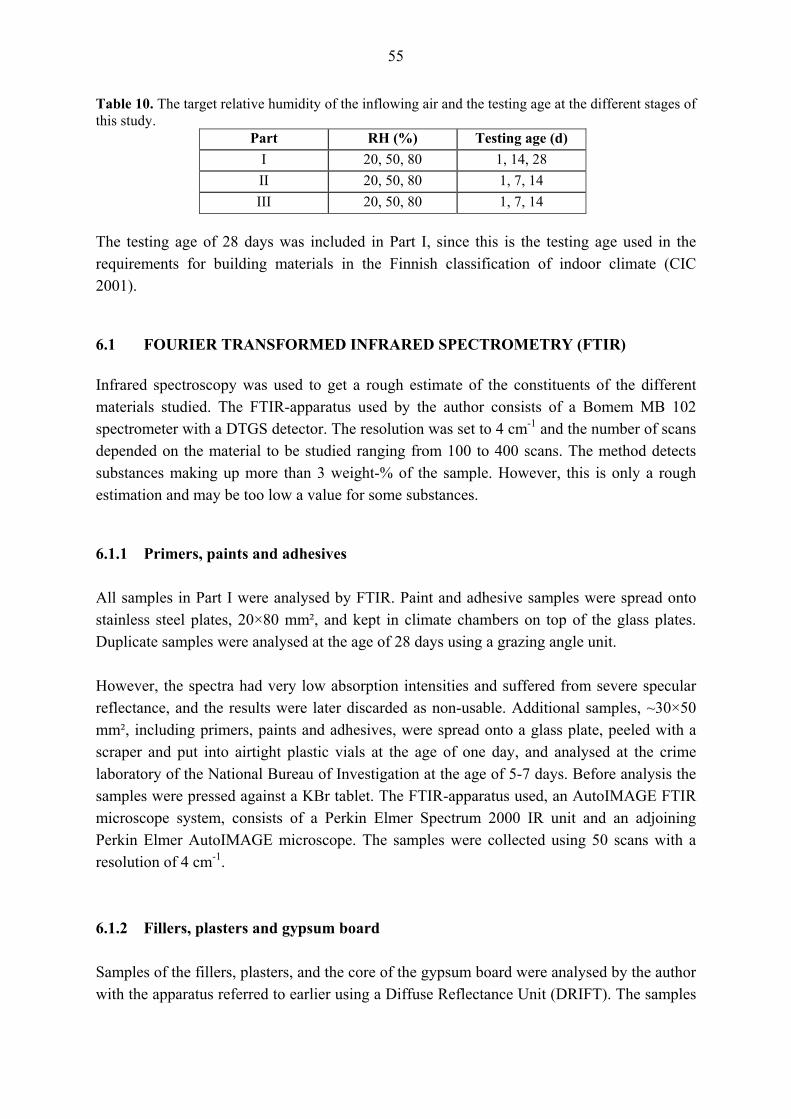
55
Table 10. The target relative humidity of the inflowing air and the testing age at the different stages of this study.
Part RH (%) Testing age (d) I 20, 50, 80 1, 14, 28 II 20, 50, 80 1, 7, 14 III 20, 50, 80 1, 7, 14
The testing age of 28 days was included in Part I, since this is the testing age used in the requirements for building materials in the Finnish classification of indoor climate (CIC 2001). 6.1 FOURIER TRANSFORMED INFRARED SPECTROMETRY (FTIR) Infrared spectroscopy was used to get a rough estimate of the constituents of the different materials studied. The FTIR-apparatus used by the author consists of a Bomem MB 102 spectrometer with a DTGS detector. The resolution was set to 4 cm-1 and the number of scans depended on the material to be studied ranging from 100 to 400 scans. The method detects substances making up more than 3 weight-% of the sample. However, this is only a rough estimation and may be too low a value for some substances. 6.1.1 Primers, paints and adhesives All samples in Part I were analysed by FTIR. Paint and adhesive samples were spread onto stainless steel plates, 20×80 mm², and kept in climate chambers on top of the glass plates. Duplicate samples were analysed at the age of 28 days using a grazing angle unit. However, the spectra had very low absorption intensities and suffered from severe specular reflectance, and the results were later discarded as non-usable. Additional samples, ~30×50 mm², including primers, paints and adhesives, were spread onto a glass plate, peeled with a scraper and put into airtight plastic vials at the age of one day, and analysed at the crime laboratory of the National Bureau of Investigation at the age of 5-7 days. Before analysis the samples were pressed against a KBr tablet. The FTIR-apparatus used, an AutoIMAGE FTIR microscope system, consists of a Perkin Elmer Spectrum 2000 IR unit and an adjoining Perkin Elmer AutoIMAGE microscope. The samples were collected using 50 scans with a resolution of 4 cm-1. 6.1.2 Fillers, plasters and gypsum board Samples of the fillers, plasters, and the core of the gypsum board were analysed by the author with the apparatus referred to earlier using a Diffuse Reflectance Unit (DRIFT). The samples

56
were prepared by crushing them in a mortar and mixing them with KBr. The weight of the material studied was 10 % of the total weight of the sample. Duplicate samples were analysed at the age of 14 or 28±1 days. 6.1.3 FTIR-sample analysis FTIR-samples are analysed based on data in the following references: AHOLA (1993), WILLIAMS ET AL. (1989), SOCRATES (1980), and NYQUIST ET AL. (1971). The regions in which functional groups absorb are presented in Table 11 to aid in the interpretation of the bands in the different infrared spectra. Furthermore, by examining a spectrum for the absence of bands in a given region, it is possible to exclude particular functional groups and, hence, compounds containing these groups. Table 12 can be used for this purpose. Table 11. Regions for different functional groups. (WILLIAMS ET AL. 1989 and SOCRATES, 1980)
Wavenumber (cm-1) Functional groups ~3700 - 2250 O–H, N–H, C–H stretching ~2250 - 1900 C≡C, C≡N, X=Y=Z stretching ~1900 - 1400 C=C, C=O, C=N, N=O stretching and N–H bending ~1400 - 650 Other stretching, bending and combination bands. The fingerprint region.
650> Skeletal vibrations, difficult to interpret and left out in this review Table 12. Negative spectral interpretation table. (SOCRATES 1980)
Absorption band absent in region (cm-1)
Type of vibration responsible for bands in this region
Type of group or compound absent
4000-3200
O–H and N–H stretch
Primary and secondary alcohols, amides, organic acids and phenols
3310-3100 C–H stretch (unsaturated) Alkynes 3100-3000 C–H stretch (unsaturated) Aromatic and olefinic compounds 3000-2800 C–H stretch (aliphatic) Methyl, methylene, methyne groups 2500-2000 X≡Y, X≡Y≡Z stretch1) Alkynes2), allenes, cyanate, isocyanate etc. 1879-1550 C=O stretch Esters, ketones, carboxylic acids etc. 1690-1620 C=C stretch Olefinic compounds 1680-1610 N=O stretch Organic nitrite compounds 1655-1610 –O–NO2 asymmetric stretch Organic nitrate compounds 1600-1510 –NO2 asymmetric stretch Organic nitro- compounds 1600-1450 C=C stretch Aromatic ring system 1490-1150 H–C–H bend Methyl, methylene 1420-990 S=O stretch Sulphoxides, sulphates, sulphites etc.
1310-1020 C–O–C stretch Ethers (aromatic, olefinic, or aliphatic) 1225-1045 C=S stretch Thiosters, thioureas, thioamides etc. 1000-780 C=C–H deformation Aliphatic unsaturation 900-670 C–H deformation Substituted aromatics 850-500 C–X stretch3) Organohalogenes 730-720 (CH2)n>3 Four or more consecutive methylene groups
1) X,Y, and Z may represent any of the atoms C, N, O, and S. 2) Band may be absent due to symmetry of functional groups. 3) X may be Cl, Br, or I.

57
6.2 MICROSCOPY 6.2.1 Light microscopy The paint and adhesive samples that were spread onto 20×80 mm² stainless steel plates were also studied by light microscopy at the end of each testing period in Part I in order to check if the different storing conditions caused any visual changes in the samples. The microscope used was a stereo microscope manufactured by Wild Heerbrugg with a 50× magnification power. 6.2.2 Environmental Scanning Electron Microscopy (ESEM) The ESEM used was a Model E-3 microscope manufactured by Electroscan equipped with an EDX X-ray analyser. The images were made using a secondary electron detector, which is very suitable for imaging the topography and elements of a sample. The accelerating voltage was 15 keV and the chamber pressure was 5 Torr. The element analysis by EDX was done at a working distance of 13.3 mm, a count rate of approximately 1500 counts per second (cps), and 60-second count time. The ESEM was not calibrated separately for the samples used in this study, since the purpose of the element analysis was not for quantification, only for identification. The samples, primers, paints and adhesives, analysed by ESEM were one day old. They were spread onto sample stubs, ~10 mm diameter, by using a paintbrush. 6.3 MERCURY INTRUSION POROSIMETRY (MIP) Mercury intrusion porosimetry was used to determine the porosity characteristics of the plasters and the core of the gypsum board. The mercury porosimeter manufactured by Carlo Erba Strumentazione used in this study consists of two units. The low-pressure unit, Macropores Unit 120, has a pressure range from 0.15 to 1 bar and it measures pores with a radius from 2,500 to 30,000 nm. The high-pressure unit, Porosimeter 2000 WS, has a pressure range from 1 to 1,990 bar and it measures pores with a radius between 3.7 and 7,500 nm. The relationship between pressure and pore radius is described by the Washburn equation as pr = 2γcosω , (40)

58
where p is pressure (bar), r is pore radius (nm), γ is surface tension of mercury (mN/m²), and ω is the contact angle (°) between mercury and the material studied. The value of surface tension is 480 mN/m² and the contact angle is 141.3°. Mercury has to be forced into the sample studied by using pressure since its contact is > 90°. The pore size distribution is determined from the volume of mercury intruded at each pressure increment and the total porosity from the total volume intruded. The pores are assumed to be of cylindrical shape and fully accessible for mercury penetration. This is only a rough approximation and may, thus, give rise to erroneous results as regards the true pore size distribution, since instead of the true pore diameter the method detects only the diameters of the entrance throats of the pores. The pore size distribution and the total porosity of the plasters and the core of the gypsum board were analysed. The MIP-samples were chiselled so that they represented the whole cross-section of the original sample. Chiselling resulted in arbitrary, generally flaky, sample shapes. The samples were put into a desiccator at the end of each test series, i.e. at the age of 28±1 days. Drying the samples in a desiccator can alter their microstructure, but is a necessary modus operandi as regards sample preparation. Duplicate samples were vacuum-stored at room temperature for four weeks before testing. Nitrogen adsorption was also initially considered as a test means, but it was rejected during the course of the study. The idea of including nitrogen adsorption stemmed from the test results by Pennell and his colleagues (PENNELL ET AL. 1992) who observed that nitrogen adsorbs much in the same way as organic vapours on mineral surfaces. Nitrogen can, moreover, not replace adsorbed water molecules, i.e. the surface area determination with nitrogen is expected to yield the same surface area that is available for adsorption of organic vapours (GOSS & EISENREICH 1996). Nevertheless, the use of nitrogen adsorption for the determination of the pore size distribution and specific surface area of the samples was rejected for several reasons. The main reason was that the moisture content of the samples would alter during sample preparation. Thus, it would not be possible to clarify the influence of the different storing conditions on the pore structure characteristics of the samples. Moisture absorbed in the pores of the samples might also alter the test result if the samples would not be dried before testing, since the samples come into contact with very low temperatures, -67° C or lower, during analysis. Furthermore, the main interest in the analysis of the samples used in this study would be on composite materials such as painted gypsum board. Separating the contribution of a single material on the surface area of a multi-layered sample would require a study of its own. Finally, the analysis of the pore structure was aimed at separating the porosity characteristics of the different substrates and this was achieved quite satisfactory by mercury intrusion porosimetry.
59
6.4 pH-MEASUREMENTS The pH of the samples used for emission testing was tested at the end of each testing period in Part III of the study by using a full range pH-indicator solution. A few droplets of the solution were spread onto a sample after the finish of the VOC-sample collection by using the Field and Laboratory Emission Cell (FLEC). The pH of the samples and its change with time was recorded by visual inspection. 6.5 EMISSION TESTING 6.5.1 Sample preparation The surface area of the samples was 220×280 mm² in all measurements. The thickness of the samples and the amount of product applied to a substrate varied according to the specifications presented in SAARELA ET AL. (2002) and what was judged to be convenient. 6.5.1.1 Primers and paints The recommended usage amount of paint is given by the manufacturer in square metres per litre wet product. The resulting dry film thickness is then calculated according to:
×= )/( SVT ss 10 , (41) where Ts is the dry film thickness recommended by the manufacturer, (μm), Vs is the solid content of the paint given by the manufacturer, and S is the recommended amount of paint usage (m²/l wet product). The classes for the different dry film thicknesses are presented in Table 13. Table 13. Classes for dry film thickness (EN 927-1 1996).
Class Supplier’s mean thickness, Ts Dry film thickness for testing, Tt Minimal < 5 μm 5 μm Low 5 – 20 μm 15 μm Medium 20 – 60 μm 40 μm High > 60 μm > 60 μm
The amount of wet product applied to a certain area to receive a specified dry film thickness is calculated according to: P = (Tt × A × δ) / (Vs × 100) , (42)

60
where P is the amount of wet product applied, (g), Tt is the dry film thickness for testing (μm), according to Table 11, A is the painted area (cm²), δ is the density of the wet product (g/cm³) given by the manufacturer, and Vs is the solid content of the product (Vol.-%) given by the manufacturer. The paint film thickness has been shown to influence the emission rate of single (S)VOCs from water-borne paints (CLAUSEN 1993). The dry film thickness in this study was medium, i.e. Tt was 40 µm, for all paints tested and it was kept as constant as possible irrespective of the substrate. CLAUSEN (1993) used a short haired (synthetic) paint roller and noticed that its use resulted in very uneven surfaces. In this study the paint was therefore applied with a foamed plastic paint roller. The roller method gave reproducible results in experiments performed by SPARKS ET AL. (1999) and represents a common method for applying paints on wall and ceiling materials. The test specimens were weighed before and after application. 6.5.1.2 Adhesives The recommended adhesive weight is 300±15 g/m² according to SAARELA ET AL. (2002). The adhesive to be tested was transferred in an excess of minimum 20 % by weight onto the substrate and spread with a notched spatula completely and uniformly. The adhesive weight was adjusted by adding more or by removing parts of it. All this handling took less than three minutes to perform. The test specimens were weighed before and after the application. 6.5.1.3 Fillers and plasters The water mixable plasters were prepared by using a mixer attached to a power drill according to the manufacturer’s recommendations. A uniform layer of the sample was placed on the substrate with a spatula. A stainless steel border was used to adjust the sample thickness of 3 or 6 mm. The test specimens were weighed before and after the application. 6.5.2 Emission testing methods 6.5.2.1 Emission test chamber The author developed the test chamber used in this study. The chambers were kept in an air-conditioned room having a constant temperature of +21±1 °C. The chamber was designed so that it would meet the requirements set in the European Standard for emission test chambers (ENV 13419-1 1999) and that a Field and Laboratory Emission Cell (FLEC) could also be used for collecting VOC-samples. The chamber consists of a 27-litre stainless steel container

61
made for institutional kitchens. On the bottom of the container is a stainless steel wire net. The size of the net is 220×280 mm² and its mesh size is 1.0×1.0 mm². The thickness of the steel threads is 0.46 mm. It was noticed during the design stage, that both the mesh size and the thickness of the steel thread influence the air velocity over the test sample. A fan was placed on the steel net at the middle of the chamber 15 mm above the net to regulate the air velocity over the test sample and to ensure proper mixing of the chamber air. The air velocity could be adjusted by regulating the voltage of the fan. The samples were placed on four adjustable stainless steel mounts. The height of the surface of the samples was 95 mm measured from the surface of the steel net in all measurements regardless of the thickness of the sample to ensure that the air velocity over the sample was the same irrespective of the height of the sample. The lid of the chamber was made of 8-mm thick glass and there were three holes in it. One hole was for a humidity and temperature measuring probe, one for VOC-sample collection, and one was originally intended for olfactory analysis, but was not taken into use since it would have required an extra fan to achieve proper results. The holes were covered with glass plates when not in use. The lid was made tight by a Viton-tube and the joint of the tube was made tight using laboratory film. Six chambers were in use simultaneously. Each chamber was cleaned according to the regulations presented in ENV 13419-1 (1999), prior to testing with de-ionised water and methanol. All loose metal parts were cleaned with de-ionised water and methanol before heating them to 400 °C and additionally rinsed with methanol before introducing them into the chamber. The air used was normal compressed air that is used by the whole Department of Civil and Environmental Engineering at Helsinki University of Technology. It was cleaned of impurities by a water-separator, an oil filter, an active-charcoal filter, and a Zero Air generator connected in series. The air was introduced into the chambers by Teflon-tubes. The length of the tubes was the same for all chambers to ensure pressure balance. The relative humidity of the chamber air could be adjusted by mixing dry and humidified air. Leading it through a water-filled gas washing bottle humidified the air. The ventilation rate was 1 h-1, i.e. an air flow rate of 450±5 ml/min was used. A Field-Cal 650 Flow Calibrator manufactured by Humonics Inc. was used to measure the airflow rate. Its accuracy is ±2 ml/min according to the manufacturer. The measurements were carried out regularly. Pictures of a test chamber and of the experimental setup are shown in Figures 3-5.

62
Figure 3. An environmental test chamber.
Figure 4. A sketch of an environmental test chamber.
Wire
Glass plate (3 mm)
Fan Adjustable mount
Viton- tube
Steel net (1mm)
Inflowing air Exhaust
air
Humidity and temperature
measuring probe
Glass lid (8 mm)
Sample collection

63
Figure 5. A sketch of the experimental setup. 6.5.2.2 Testing conditions The air-velocity 1 cm above the surface of the samples is shown in Figure 6. It was measured from nine points, i.e. from each corner, from the centre of each side and from the centre of the sample area, respectively.
Air valve
Oil separator
Moisture extractor
Activated carbon filter
Particle filter
Zero-air generator
Pressure regulator Flow velocity
regulator
Particle filter Air distributor
Air flow controller
Gas washing bottle
Teflon-tube
(6mm)
Climate chamber
RH 20% RH 20%
RH 50%
RH 80%
RH 50%
RH 80%

64
Figure 6. Air-velocity profiles measured 1 cm above the sample surface. A darker shade indicates a higher air-velocity. The air velocity was measured using an air velocity transducer model 8475, manufactured by TSI Incorporated. The air velocity was 0.15±0.03 m/s at the centre of the sample increasing somewhat (0.01-0.02 m/s) closer to the edges. In Part I of the tests, 20×80×3 mm³ stainless steel plates used for FTIR-measurements were placed at the narrow ends on top of the paint and glue samples. This caused a minor distortion of the velocity field. The velocity of the narrow ends was 0.03-0.05 m/s and at the right-hand side 0.02-0.04 m/s higher than at the centre of the sample. The distortion of the air-velocity profile was caused by the fact that the fans used did not create an independently-oriented flow of air. The relative humidity of the chambers was measured using one temperature and humidity measuring probe, HMP 233 manufactured by Vaisala, per chamber. The accuracy of the probes is ±2 RH-% at RH 0-90 % and ±3 RH-% at RH 90-98 % according to the manufacturer. The probes were calibrated periodically by using saturated salt solutions in a HMK 13 B Humidity Calibrator manufactured by Vaisala. The accuracy of the measured relative humidity compared with the target values were ±5 % RH for empty chambers. 6.5.2.3 Field and Laboratory Emission Cell (FLEC) The FLEC was supplied with 5.0-synthetic air with a mixture of 80 % nitrogen and 20 % oxygen. The air was led into the chamber via a FLEC Air Control unit in which it was humidified to RH 50±5 %. The chamber was cleaned according to (ENV 13419-2 1999) with de-ionised water and methanol before heating it up to 105 °C for one hour and additionally rinsing it with methanol prior to testing. The FLEC was used for trying to neglect the sink effect of the climate chamber.
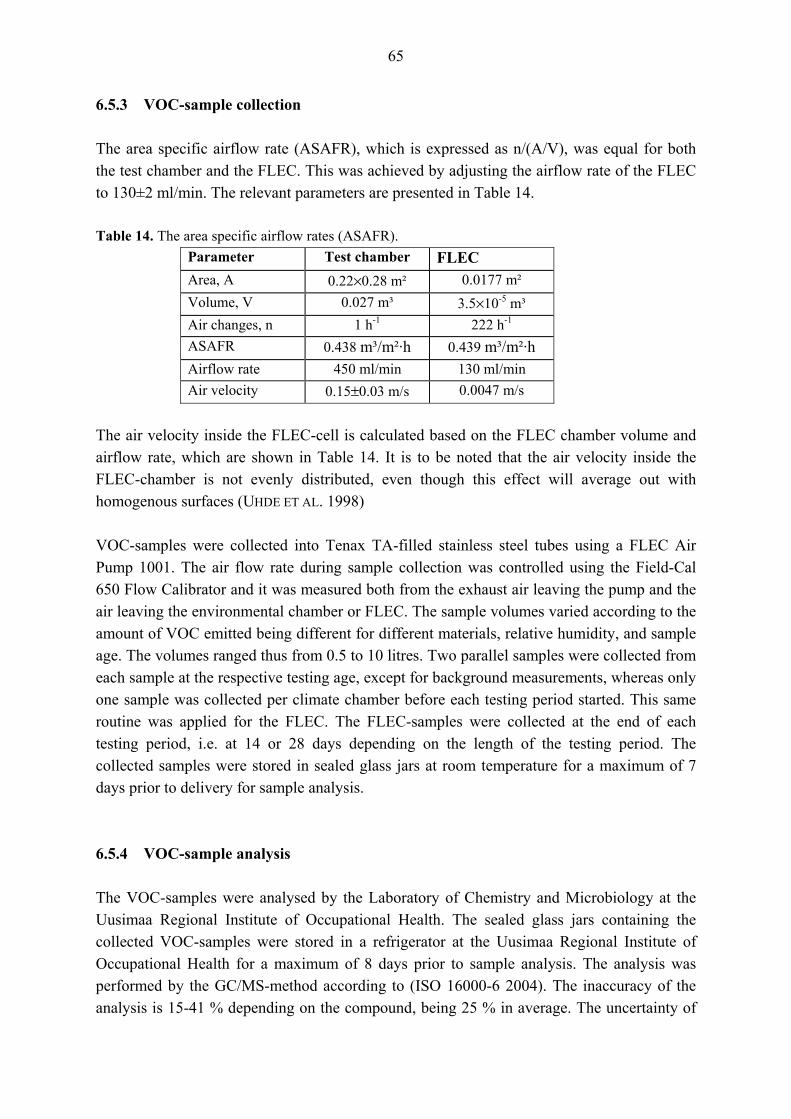
65
6.5.3 VOC-sample collection The area specific airflow rate (ASAFR), which is expressed as n/(A/V), was equal for both the test chamber and the FLEC. This was achieved by adjusting the airflow rate of the FLEC to 130±2 ml/min. The relevant parameters are presented in Table 14. Table 14. The area specific airflow rates (ASAFR).
Parameter Test chamber FLEC Area, A 0.22×0.28 m² 0.0177 m² Volume, V 0.027 m³ 3.5×10⁻⁵ m³ Air changes, n 1 h-1 222 h-1 ASAFR 0.438 m³/m²·h 0.439 m³/m²·h Airflow rate 450 ml/min 130 ml/min Air velocity 0.15±0.03 m/s 0.0047 m/s
The air velocity inside the FLEC-cell is calculated based on the FLEC chamber volume and airflow rate, which are shown in Table 14. It is to be noted that the air velocity inside the FLEC-chamber is not evenly distributed, even though this effect will average out with homogenous surfaces (UHDE ET AL. 1998) VOC-samples were collected into Tenax TA-filled stainless steel tubes using a FLEC Air Pump 1001. The air flow rate during sample collection was controlled using the Field-Cal 650 Flow Calibrator and it was measured both from the exhaust air leaving the pump and the air leaving the environmental chamber or FLEC. The sample volumes varied according to the amount of VOC emitted being different for different materials, relative humidity, and sample age. The volumes ranged thus from 0.5 to 10 litres. Two parallel samples were collected from each sample at the respective testing age, except for background measurements, whereas only one sample was collected per climate chamber before each testing period started. This same routine was applied for the FLEC. The FLEC-samples were collected at the end of each testing period, i.e. at 14 or 28 days depending on the length of the testing period. The collected samples were stored in sealed glass jars at room temperature for a maximum of 7 days prior to delivery for sample analysis. 6.5.4 VOC-sample analysis The VOC-samples were analysed by the Laboratory of Chemistry and Microbiology at the Uusimaa Regional Institute of Occupational Health. The sealed glass jars containing the collected VOC-samples were stored in a refrigerator at the Uusimaa Regional Institute of Occupational Health for a maximum of 8 days prior to sample analysis. The analysis was performed by the GC/MS-method according to (ISO 16000-6 2004). The inaccuracy of the analysis is 15-41 % depending on the compound, being 25 % in average. The uncertainty of
66
measurement of compounds identified as toluene-equivalents is even higher and the quantification is semi-quantitative. The limit of detection is also compound dependent. An average value is 10 ng/sample, i.e. 1 μg/m³ for a 10 l sample. The analysis results were given as concentration of VOCs in sampled air expressed as μg/m³. The background concentrations, i.e. the VOC-concentrations of the empty environmental chambers or the FLEC applied onto a stainless steel plate, were first subtracted from the actual concentrations, i.e the emissions generated by the material samples. Then the results were converted to area specific emission rates, SERa, expressed as μg/m²·h according to the equations presented in (ENV 13419-1 and 13419-2 1999), respectively. 6.5.5 Data handling The VOC-emission data is presented as area specific emission rates for each single material and material combination tested separately. The emission data is also analysed statistically using STATGRAPHICS and MODDE software programs. A Kruskal-Wallis test using the STATGRAPHICS program is applied to clarify the influence of the relative humidity of the surrounding air on the emission rates of single compounds. The compounds are separated according to which chemical group they belong to, i.e. all aromatic hydrocarbons emitted from the samples stored at the three target relative humidities in Part I are compared with each other, and so forth. The same procedure is done when the area specific emission rates of the total volatile organic compound emissions, TVOCSERa, from the two different sample collection methods are compared with each other. The Kruskal-Wallis test was chosen since the test data is not, at least in most cases in this study, normally distributed as a consequence of the fact that the emission rates are very material dependent. Factorial design was used in order to optimise the number of tests in Part III of this study where primer and paint combinations or adhesives were applied onto filler and plaster combinations which were applied onto calcium silicate brick. The factorial design was performed using a D-optimal design tool in MODDE. The TVOCSERa-values were analysed with the same program using PLS (Partial Least Squares) regression, interaction models, and response prediction plots. 6.5.6 Olfactory evaluation The olfaction of the samples stored in the environmental chambers was recorded according to SAARELA ET AL. (2002) with three exceptions. First, the olfaction was evaluated by the author only and no evaluation panel was used. Second, no diffuser was used, thus, the airflow rate was 0.0075 l/s instead of the recommended 0.9 l/s. Third, the evaluation was started the day following the introduction of a sample into a climate chamber and it was recorded once a day throughout a testing period. SAARELA ET AL. (2002) recommend that a test specimen should

67
be conditioned for two days prior to testing. And last, no acceptability scale was used, rather the perception was ranked on a scale from 0 to 5, where 0 denoted no perceptible smell and 5 denoted a strong perception. The evaluation was performed by placing a glass funnel over the nose, waiting approximately 10 seconds, and then breathing in air through the nose three times in sequence. The funnel was attached to the outlet of the chamber by a teflon-tube. The last recording was made when the lid to the climate chamber was opened. This proved to be a beneficial modus operandi, since you could then quite often sense a rather strong smell even though earlier evaluations had proved a sample to be odourless.
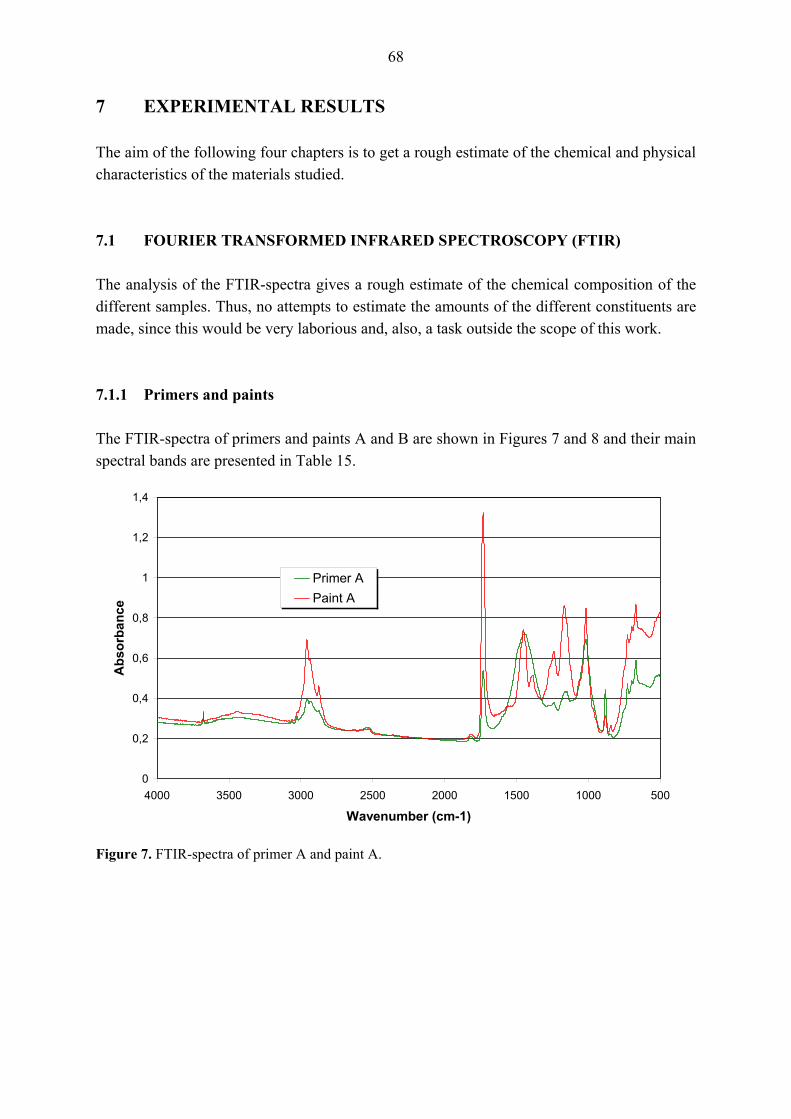
68
7 EXPERIMENTAL RESULTS The aim of the following four chapters is to get a rough estimate of the chemical and physical characteristics of the materials studied. 7.1 FOURIER TRANSFORMED INFRARED SPECTROSCOPY (FTIR) The analysis of the FTIR-spectra gives a rough estimate of the chemical composition of the different samples. Thus, no attempts to estimate the amounts of the different constituents are made, since this would be very laborious and, also, a task outside the scope of this work. 7.1.1 Primers and paints The FTIR-spectra of primers and paints A and B are shown in Figures 7 and 8 and their main spectral bands are presented in Table 15.
0
0,2
0,4
0,6
0,8
1
1,2
1,4
5001000150020002500300035004000
Wavenumber (cm-1)
Abs
orba
nce
Primer APaint A
Figure 7. FTIR-spectra of primer A and paint A.

69
0
0,2
0,4
0,6
0,8
1
1,2
1,4
5001000150020002500300035004000
Wavenumber (cm-1)
Abs
orba
nce
Primer B
Paint B
Figure 8. FTIR-spectra of primer B and paint B. Table 15. The spectral bands of primers and paints A and B and the compounds they assign.
Wavenumber (cm-1) Compound 3677, 2524, 1805, 879 CaCO3 ~3600 - 3100 O–H stretching in water or alcohol 3050 - 3020 could assign aromatics
2950 - 2850 asymmetric C–H stretching in –CH2 and –CH3, symmetric stretching in –CH3
1731 C=O stretching in ester 1545 could assign aromatics 1450 asymmetric bending in –CH3 and/or scissoring in –CH2 1385 symmetric bending in –CH3
1240, 1160, 1110, 1015 asymmetric and symmetric C–O–C stretching characteristic of ethers and carboxylic esters. The band at 1015 cm-1 could also assign C–O stretching vibration of alcohol
1050 shoulder assign skeletal vibration of acrylate 963 shoulder assign skeletal wagging of acrylate 940 =CH2 wagging of methacrylate 900 - 800 could assign aromatics
The primers' absorption spectrum differs from that of the paints most distinctly at 1600 cm-1 - 1300 cm-1. This assigns CaCO3, a common filler in paint products. The amount of solids in a primer is usually higher than that in a paint. The absorption spectra of paints A and B are very similar. There are, however, some differences, which will be dealt with in the following. Paint B lacks the medium intensity band at 3677 cm-1. Moreover it has a rather strong band at 940 cm-1 assigning =CH2 wagging of methacrylate. The third main difference is that paint B lacks a band at 1160 cm-1 and has,

70
instead, a medium intensity band at 1110 cm-1. The differences that were observed between the two different paints apply also to the two different primers. The structure of an acrylate monomer is shown in Figure 9.
Figure 9. The structure of an acrylate monomer. R stands for any atom or molecule.
0
0,2
0,4
0,6
0,8
1
1,2
1,4
1,6
1,8
5001000150020002500300035004000
Wavenumber (cm-1)
Abs
orba
nce
Primer CPaint C
Figure 10. FTIR-spectra of primer C and paint C. The primer and paint C, which are alkyd-based products, have very similar spectra, as can be seen in Figure 10. The main spectral bands are presented in Table 16.

71
Table 16. The spectral bands of primer C and paint C and the compounds they assign. Wavenumber (cm-1) Compound
~3600 - 3100 O–H stretching in alcohol 2950 - 2850 asymmetric and symmetric C–H stretching in –CH2 2650 - 2500 could assign O–H stretching in carboxylic acid 1731 C=O stretching in ester 1440 C–H bending in –CH3 and/or scissoring in –CH2 or CaCO3
1270, 1160 asymmetric and symmetric C–O–C stretching characteristic of ethers and carboxylic esters
1120, 1070 could assign C–O asymmetric stretching in phthalate. The band at 1070 cm-1 could also assign CaCO3
1040, 1010 C–O stretching vibration (in alcohol, ether, carboxylic acid, or ester)
880 CaCO3 963 shoulder assign skeletal wagging of acrylate 940 =CH2 wagging of methacrylate 900 - 800 could assign aromatics
CaCO3 has a strong band at 1500 to 1400 cm-1. Thus, the band at 1440 cm-1 that assigns C–H bending can also assign CaCO3, and most probably these bands overlap each other at that wavenumber region. 7.1.2 Adhesives The FTIR-spectra of the adhesives studied are shown in Figure 11 and their main spectral bands are presented in Table 17. Adhesives A and B are water-borne PVAc-dispersion adhesives, while adhesive C is a water-borne PVC-dispersion adhesive, according to the manufacturers' information.
0
0,2
0,4
0,6
0,8
1
1,2
1,4
1,6
1,8
5001000150020002500300035004000
Wavenumber (cm-1)
Abs
orba
nce
Adhesive AAdhesive BAdhesive C
Figure 11. FTIR-spectra of the different adhesives studied.

72
Table 17. The spectral bands of adhesives A, B, and C and the compounds they assign. Wavenumber (cm-1) Compound
~3700 - 3100 O–H stretching in water or alcohol 2920 asymmetric C–H stretching in –CH2 1730 C=O stretching in ester 1640 C=C stretching in vinyl ether 1600 C=C stretching in C=C conjugated with C=C 1430 symmetric bending in –CH3 1370 asymmetric bending in –CH3
1240, 1160, 1110 asymmetric and symmetric C–O–C stretching characteristic of ethers and carboxylic esters
1080, 1020 C–O stretching in alcohol or ester 940 C–H out-of-plane deformation of =CH2 in vinyl hydrocarbon 880 - 700 could assign aromatics
There are some differences between the spectral bands of the different adhesives, which will be treated in the following. First, adhesives A and C have a medium strong band at 1640 cm-1, while adhesive B has a medium strong band at 1600 cm-1. These assign C=C stretching in vinyl ether and C=C stretching in C=C conjugated with C=C, respectively. Second, adhesives A and B have a medium strong band at 1430 cm-1, while adhesive C has a shoulder at the same wavelength. Third, adhesives A and C have bands at 1160 cm-1 and 1080 cm-1, while adhesive B has a band at 1110 cm-1. The structure of vinyl monomer and vinyl chloride are shown in Figure 12.
Figure 12. Vinyl monomer (to the left) and vinyl chloride (to the right). 7.1.3 Fillers, plasters and gypsum board The FTIR-spectra of the two plasters with polymer binder and their respective fillers are shown in Figures 13 and 14 and their main spectral bands are presented in Table 18.
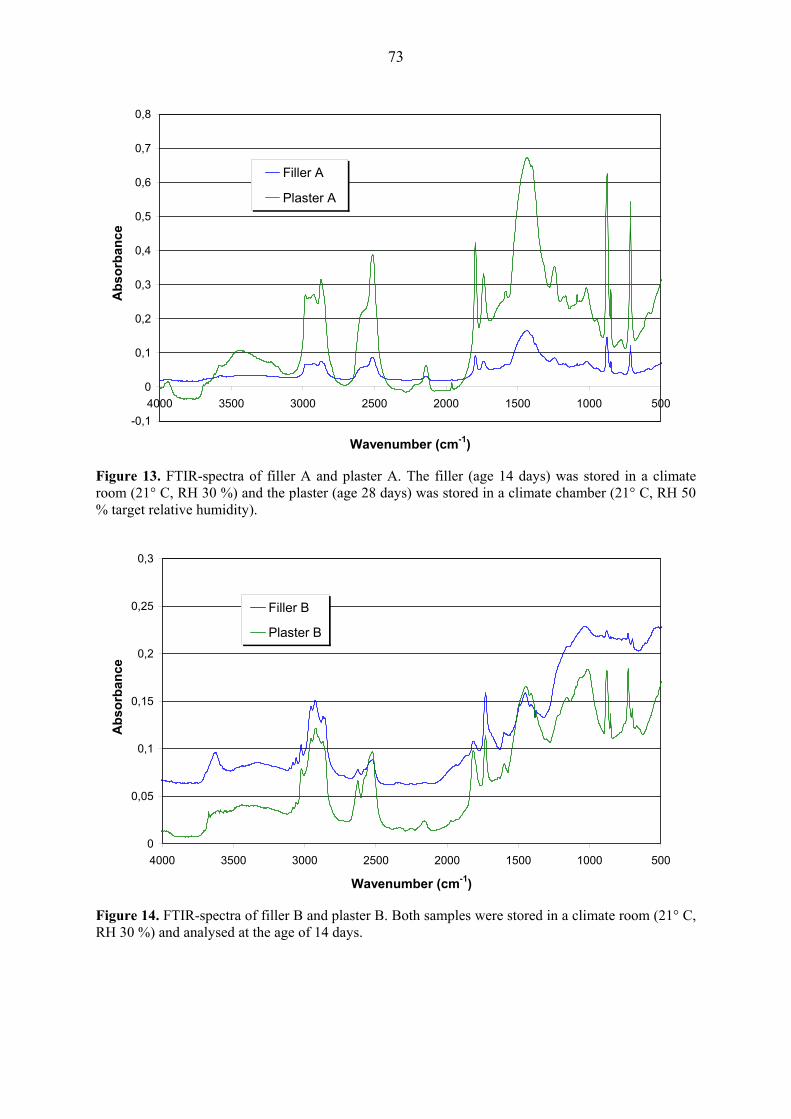
73
-0,1
0
0,1
0,2
0,3
0,4
0,5
0,6
0,7
0,8
5001000150020002500300035004000
Wavenumber (cm-1)
Abs
orba
nce
Filler A
Plaster A
Figure 13. FTIR-spectra of filler A and plaster A. The filler (age 14 days) was stored in a climate room (21° C, RH 30 %) and the plaster (age 28 days) was stored in a climate chamber (21° C, RH 50 % target relative humidity).
0
0,05
0,1
0,15
0,2
0,25
0,3
5001000150020002500300035004000
Wavenumber (cm-1)
Abs
orba
nce
Filler B
Plaster B
Figure 14. FTIR-spectra of filler B and plaster B. Both samples were stored in a climate room (21° C, RH 30 %) and analysed at the age of 14 days.

74
Table 18. The spectral bands of fillers and plasters A and B. Wavenumber (cm-1) Compound
~3600 - 3100 O–H stretching in water or alcohol 3100 - 3020 aromatic C–H stretching vibration
3000 - 2850 asymmetric C–H stretching in –CH2 and –CH3 and symmetric C–H stretching in –CH3. Could also include CaCO3 absorption bands
2510, 1450, 880, 710 CaCO3 1820, 1790, 1740 could assign C=O stretching in ester 1600 water
1250, 1190, 1170, 1030 asymmetric and symmetric C–O–C stretching characteristic of ethers and carboxylic esters
950 C–H out-of-plane deformation characteristic of a vinyl group800 C–H out-of-plane deformation characteristic of aromatics 1080, 1020 C–O stretching in alcohol or ester 940 C–H out-of-plane deformation of =CH2 in vinyl hydrocarbon 880 - 700 could assign aromatics
There are some differences between the spectral bands of the different products, which will be treated in the following. The aromatic C–H stretching vibration is observed only for filler and plaster B. Of the bands assigning C=O stretching in ester the band at 1820 cm-1 is only observed for filler and plaster B, while the band at 1790 cm-1 is only observed for filler and plaster A. Furthermore, the bands assigning C–O–C stretching at 1250 cm-1 and 1190 cm-1 is only observed for filler and plaster A, while the band at 1170 cm-1 is only observed for filler and plaster B. Thus, even though the FTIR-spectra of the two products are quite similar their binders have most probably somewhat different compositions.
0
0,5
1
1,5
2
2,5
3
3,5
4
4,5
50010001500200025003000350040004500
Wavenumber (cm-1)
Abs
orba
nce
CaSO4·2H2OPlaster CGypsum board
Figure 15. FTIR-spectra of plaster C, the core of the gypsum board and gypsum (pro analysi).

75
Plaster C consists mainly of gypsum, as is shown in Figure 15. It has a weak band at 2520 cm-1, which assigns CaCO3. Other differences between plaster C and gypsum occur at 1805 cm-1, 1750 cm-1, 1450 cm-1, and 890 cm-1. The first two bands assign C=O stretching vibration in ester, while the two latter bands assign CaCO3. The FTIR-spectrum of the core of the gypsum board also presented in Figure 15, indicates that the gypsum of the gypsum board is a rather pure product. 7.2 MICROSCOPY 7.2.1 Light microscopy All paint and glue samples in Part I were examined by light microscopy. The only difference that could be observed was that the sample of adhesive A, which was stored at the RH 80 % target relative humidity, had air bubbles on the surface. A visual inspection, on the other hand, showed that a sample that had been stored in the RH 80 % target relative humidity looked wet, i.e. there was a thin water layer on top of its surface and the sample also felt soft when touched while a sample that had been stored at RH 20 % target relative humidity looked (and felt) dry. The samples that had been stored at RH 50 % target relative humidity were intermediate. 7.2.2 Environmental Scanning Electron Microscopy (ESEM) The ESEM was used both for looking at the sample topography and for element analysis. The latter will be dealt with first in the following, since this gives additional information to the preceding chapter on FTIR-spectra. Figures 16-19 show the element analysis of some of the one day old paint and adhesive samples. The other results, including primers, paints, and adhesives not shown here, are presented in Appendix A. The element analysis is applicable only for elements having the molecular weight of oxygen and higher.
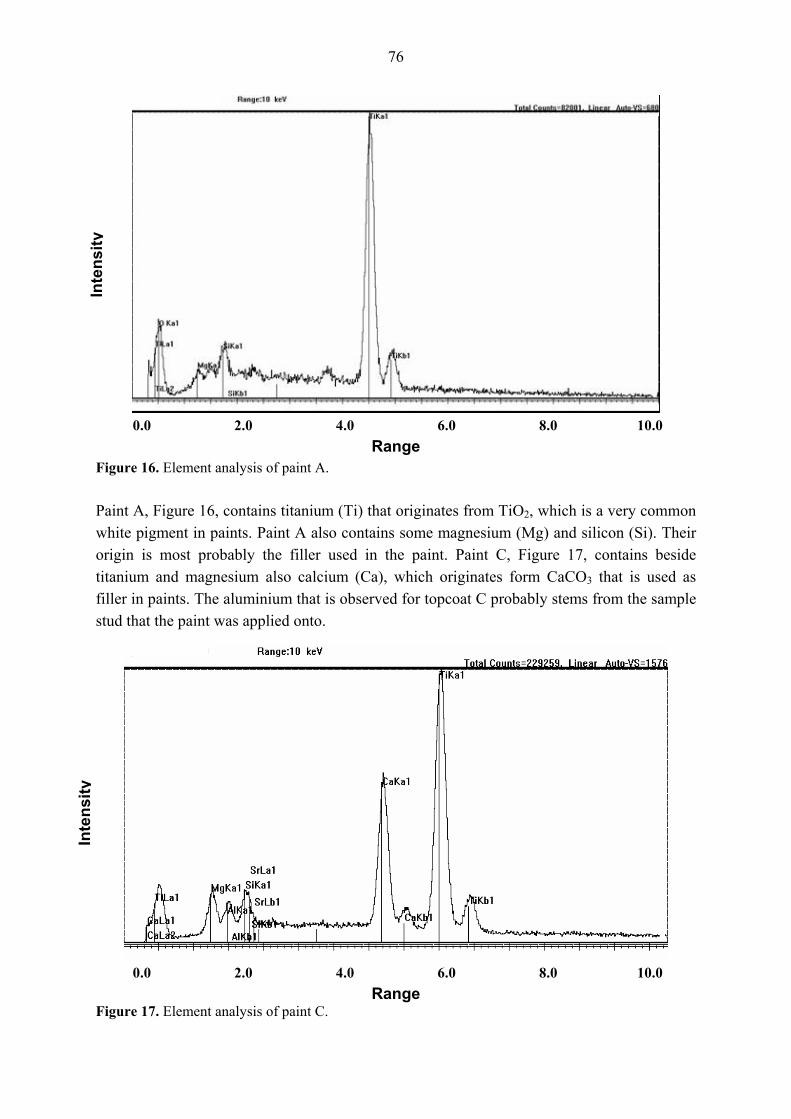
76
0.0 2.0 4.0 6.0 8.0 10.0
Range Figure 16. Element analysis of paint A. Paint A, Figure 16, contains titanium (Ti) that originates from TiO2, which is a very common white pigment in paints. Paint A also contains some magnesium (Mg) and silicon (Si). Their origin is most probably the filler used in the paint. Paint C, Figure 17, contains beside titanium and magnesium also calcium (Ca), which originates form CaCO3 that is used as filler in paints. The aluminium that is observed for topcoat C probably stems from the sample stud that the paint was applied onto.
0.0 2.0 4.0 6.0 8.0 10.0
Range Figure 17. Element analysis of paint C.
Inte
nsity
In
tens
ity

77
0.0 2.0 4.0 6.0 8.0 10.0
Range Figure 18. Element analysis of adhesive A. Adhesive A, Figure 18, contains sodium (Na) and chloride (Cl). Chloride probably derives from the copolymer, which could be a vinyl acetate/vinyl chloride copolymer. Sodium may derive from e.g. a plasticiser. The element analysis of adhesive C, Figure 19, does not show any specific elements except oxygen.
0.0 2.0 4.0 6.0 8.0 10.0
Range Figure 19. Element analysis of adhesive C.
Inte
nsity
In
tens
ity
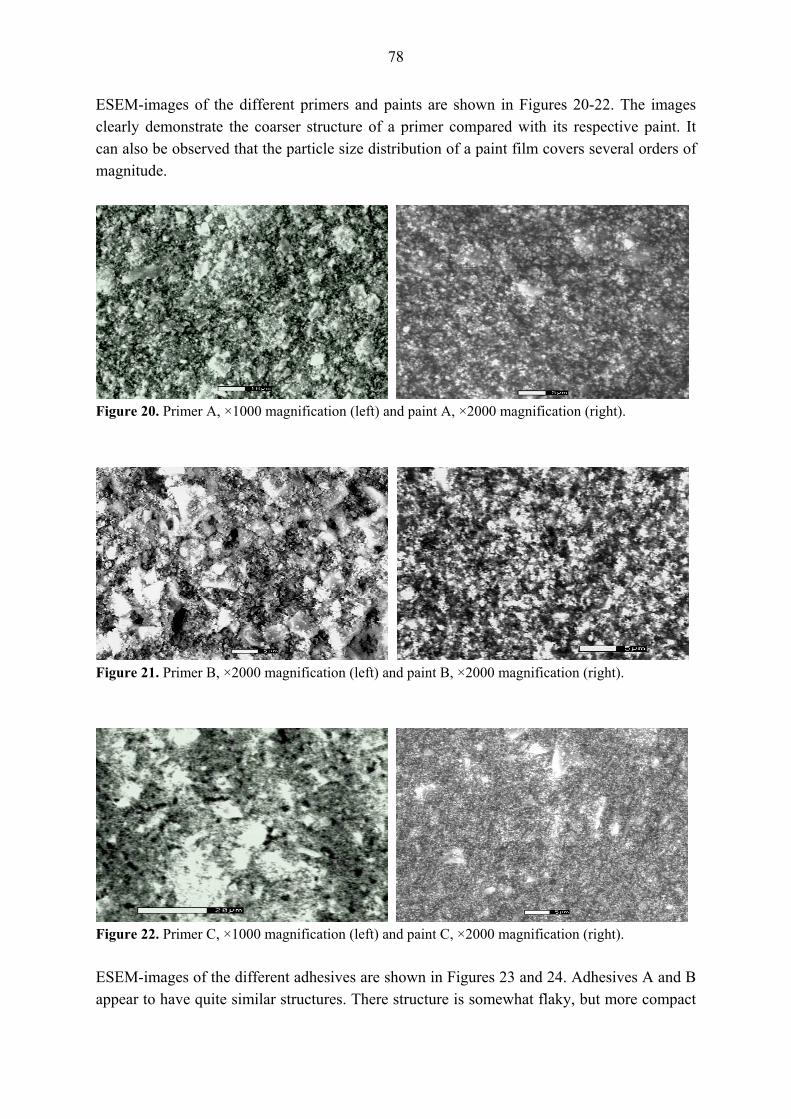
78
ESEM-images of the different primers and paints are shown in Figures 20-22. The images clearly demonstrate the coarser structure of a primer compared with its respective paint. It can also be observed that the particle size distribution of a paint film covers several orders of magnitude.
Figure 20. Primer A, ×1000 magnification (left) and paint A, ×2000 magnification (right).
Figure 21. Primer B, ×2000 magnification (left) and paint B, ×2000 magnification (right).
Figure 22. Primer C, ×1000 magnification (left) and paint C, ×2000 magnification (right). ESEM-images of the different adhesives are shown in Figures 23 and 24. Adhesives A and B appear to have quite similar structures. There structure is somewhat flaky, but more compact

79
than that of adhesive C. The surface of adhesive C is "bumpy" and appears to contain abundant air voids.
Figure 23. Adhesive A, ×1000 magnification (left) and adhesive B, ×975 magnification (right).
Figure 24. Adhesive C, ×950 magnification. 7.3 MERCURY INTRUSION POROSIMETRY (MIP) The pore size distribution of the different plasters and the core of the gypsum board are presented in Figures 25-28. The relative humidity, whose measured values are presented in Chapter 7.5, seems to have the greatest impact on plaster A. Its pore size distribution is shifted towards bigger pores with increasing relative humidity of the storing conditions. It is also observed that samples stored at the target relative humidity of RH 80 % have a higher peak, i.e. a bigger pore volume in relation to a specific pore radius, compared with the other two humidities as far as plasters B and C are concerned. The pore radius values corresponding to the strongest peaks are 2950 nm and 3500 nm (plaster B), and 1000 nm (plaster C), respectively. The core of the gypsum board appears to be least affected by the storing conditions.
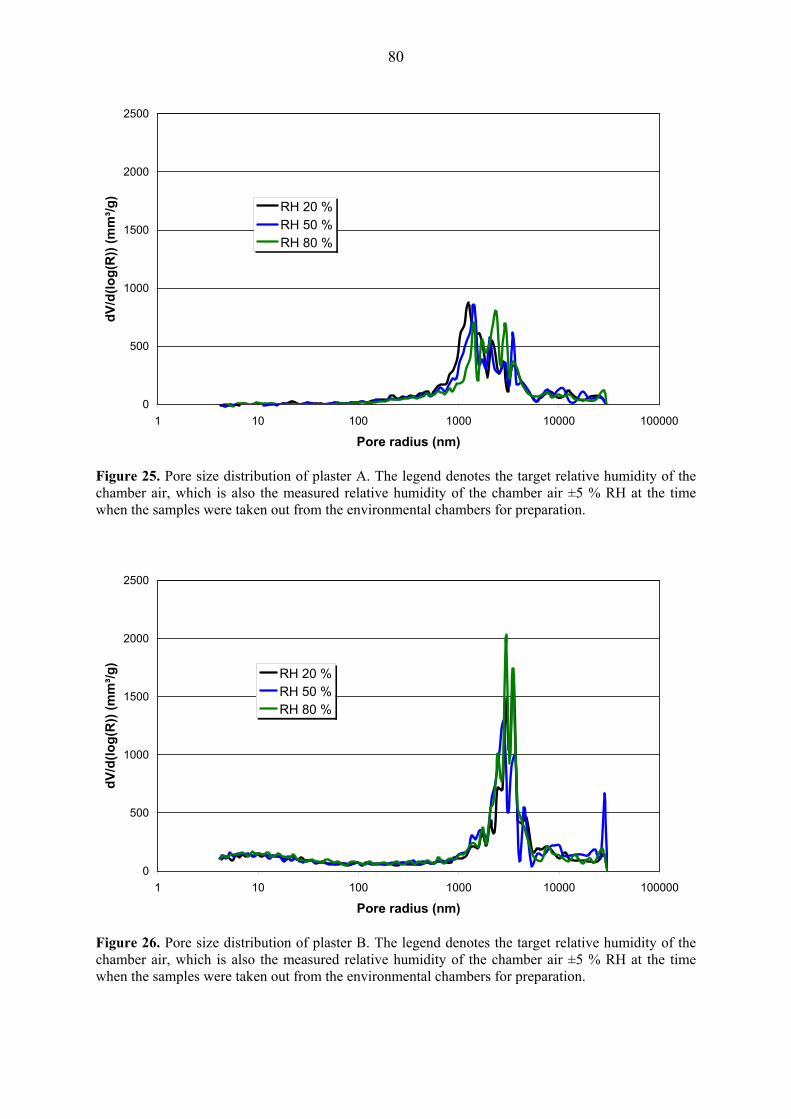
80
0
500
1000
1500
2000
2500
1 10 100 1000 10000 100000
Pore radius (nm)
dV/d
(log(
R))
(mm
³/g)
RH 20 %RH 50 %RH 80 %
Figure 25. Pore size distribution of plaster A. The legend denotes the target relative humidity of the chamber air, which is also the measured relative humidity of the chamber air ±5 % RH at the time when the samples were taken out from the environmental chambers for preparation.
0
500
1000
1500
2000
2500
1 10 100 1000 10000 100000
Pore radius (nm)
dV/d
(log(
R))
(mm
³/g)
RH 20 %RH 50 %RH 80 %
Figure 26. Pore size distribution of plaster B. The legend denotes the target relative humidity of the chamber air, which is also the measured relative humidity of the chamber air ±5 % RH at the time when the samples were taken out from the environmental chambers for preparation.

81
0
500
1000
1500
2000
2500
1 10 100 1000 10000 100000
Pore radius (nm)
dV/d
(log(
R))
(mm
³/g)
RH 20 %RH 50 %RH 80 %
Figure 27. Pore size distribution of plaster C. The legend denotes the target relative humidity of the chamber air, which is also the measured relative humidity of the chamber air ±5 % RH at the time when the samples were taken out from the environmental chambers for preparation, except for the RH 80 %, whose measured relative humidity was 100 %.
0
500
1000
1500
2000
2500
1 10 100 1000 10000 100000
Pore radius (nm)
dV/d
(log(
R))
(mm
³/g)
RH 20 %RH 50 %RH 80 %
Figure 28. Pore size distribution of the core of the gypsum board. The legend denotes the target relative humidity of the chamber air, which is also the measured relative humidity of the chamber air ±5 % RH at the time when the samples were taken out from the environmental chambers for preparation.

82
The total porosity and the specific surface area of the different samples are presented in Table 19. Even though an increase in the relative humidity caused a shift in the pore size distribution curve of plaster A towards larger pores, this did not cause an increase in its total porosity. On the contrary, its total porosity decreased with increasing relative humidity of the storing conditions. The shift in the pore size distribution could be caused by an increase in the internal moisture content caused by the higher relative humidity of the ambient air. The increase in the total porosity with decreasing relative humidity, on the other hand, could be a consequence of the increased water evaporation. There was, however, no distinct difference in the relative weight changes at the different relative humidities. The total porosity of plaster B, on the other hand, increased with increasing relative humidity. This could be a consequence of an increase in the internal moisture content. There was, however, no observable shift in the pore size distribution. Plaster C and the core of the gypsum board did not show any definite trends as far as their total porosity at different relative humidities is concerned. The specific surface area of plaster B increased with increasing relative humidity of the surrounding air. This is the only observable trend, all samples considered, regarding the influence of relative humidity on the specific surface area. The total porosity and, especially, the specific surface area differ quite much between different plasters. Plaster A has the smallest total porosity and specific surface area, while the total porosities of plasters B and C are fairly equal. The specific surface area is largest for plaster B. Thus, plaster B has considerably more pores and they also encompass a larger pore size distribution than is the case for the other plasters. This can also be observed in Figures 6-8. The total porosity of the core of the gypsum board is higher than that of the plasters, but its specific surface area is intermediate. Table 19. Total porosity and specific surface area of the plasters and the core of the gypsum board. The relative humidity indicates the target relative humidity value of the environmental chambers at the time when the samples were taken out from the chambers for sample preparation ±5 % RH. Sample Relative humidity (%) Total porosity (%) Specific surface area (m²/g)
Plaster A 20 54.7 1.2 50 48.0 0.8 80 47.7 1.0
Plaster B 20 56.5 24.8 50 57.0 25.3 80 59.4 26.1
Plaster C 20 52.9 6.4 50 55.0 6.5 100 54.5 6.8
Core of 20 67.2 10.3 gypsum 50 67.1 9.9 board 80 69.2 9.8

83
7.4 pH-MEASUREMENTS The pH of the products according to their operational safety sheets and the measured values of the top layers one hour and one day after the finish of a test series are presented in Table 20. The structures studied consisted of (from the top to the bottom layer) paint or adhesive, primer (no primer for adhesives), plaster, filler, and CSB. The pH of plaster B applied onto filler B, the pH of plaster C, and the pH of gypsum board are also presented in Table 20. Table 20. The pH-values of the different samples.
Material Declared pH Measured pH at 1 hour Measured pH at 1 day Paint A - 6 - 8 5 Paint B 7.8 - 8.4 6 - 8 6 - 7 Adhesive A ~6 5 - 7 5 Adhesive B 6.5 - 7.5 5 - 7 5 Plaster B 9 91) 7 Plaster C 7 - 8 4 - 71) 5 Gypsum board 7 - 8 5 5
1) The pH-value was determined immediately after the samples had been removed from the test chambers The pH-value of paints A and B was higher the higher the relative humidity of the storing conditions after one hour exposure to room air. The pH-values were somewhat higher on plaster C than on plaster B and higher for paint B than for paint A. The pH of the paints decreased more slowly than that of the adhesives. Also both adhesives A and B had a higher pH-value the higher the relative humidity of the storing conditions after one hour exposure to room air. The pH-value was again somewhat higher for adhesives spread onto plaster C than was the case for plaster B. The toothing of the spatula that was used for spreading the adhesives caused shifts in the pH-values. The pH-value was usually higher between brows and lower on their top. The phenomenon was more pronounced for samples stored at lower relative humidities. The pH of plaster B was about 9 immediately after it had been removed from a climate chamber irrespective of the relative humidity it had been stored at. After one hour exposure to room air, its pH-value had dropped to about 8. The corresponding values for plaster C were 4-5, 5, and 7 when stored at RH 20 %, RH 50 %, and RH 80 % target relative humidities (note: the measured value of the RH 80 % chamber was 100 % throughout the testing period), respectively, immediately after it had been removed from a climate chamber. One hour later the pH was about 5 for all three samples. The pH of the adhesives and paints applied onto gypsum board was not measured, since it was not considered to be as much affected by the substrate. The relative humidity of the room air was between 25 % and 50 % during the measurements presented in the preceding paragraphs.
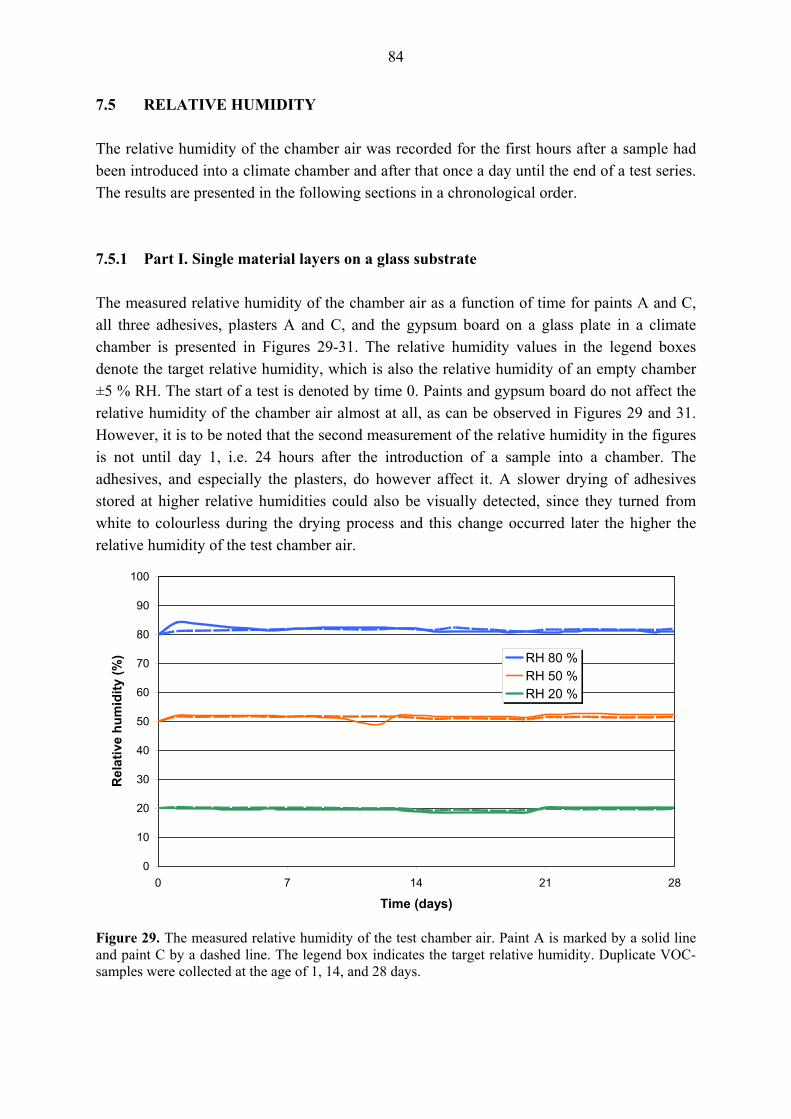
84
7.5 RELATIVE HUMIDITY The relative humidity of the chamber air was recorded for the first hours after a sample had been introduced into a climate chamber and after that once a day until the end of a test series. The results are presented in the following sections in a chronological order. 7.5.1 Part I. Single material layers on a glass substrate The measured relative humidity of the chamber air as a function of time for paints A and C, all three adhesives, plasters A and C, and the gypsum board on a glass plate in a climate chamber is presented in Figures 29-31. The relative humidity values in the legend boxes denote the target relative humidity, which is also the relative humidity of an empty chamber ±5 % RH. The start of a test is denoted by time 0. Paints and gypsum board do not affect the relative humidity of the chamber air almost at all, as can be observed in Figures 29 and 31. However, it is to be noted that the second measurement of the relative humidity in the figures is not until day 1, i.e. 24 hours after the introduction of a sample into a chamber. The adhesives, and especially the plasters, do however affect it. A slower drying of adhesives stored at higher relative humidities could also be visually detected, since they turned from white to colourless during the drying process and this change occurred later the higher the relative humidity of the test chamber air.
0
10
20
30
40
50
60
70
80
90
100
0 7 14 21 28
Time (days)
Rel
ativ
e hu
mid
ity (%
) RH 80 %RH 50 %RH 20 %
Figure 29. The measured relative humidity of the test chamber air. Paint A is marked by a solid line and paint C by a dashed line. The legend box indicates the target relative humidity. Duplicate VOC-samples were collected at the age of 1, 14, and 28 days.

85
0
10
20
30
40
50
60
70
80
90
100
0 7 14 21 28
Time (days)
Rel
ativ
e hu
mid
ity (%
) RH 80 %RH 50 %RH 20 %
Figure 30. The measured relative humidity of the test chamber air. Adhesive A is marked by a solid line and adhesive C by a dashed line. The measurement period for adhesive B (boxed line) was 14 days. The legend box indicates the target relative humidity. Duplicate VOC-samples were collected at the age of 1, 14, and 28 days (adhesives A and C) and at 1, 7, and 14 days (adhesive B).
0
10
20
30
40
50
60
70
80
90
100
0 7 14 21 28
Time (days)
Rel
ativ
e hu
mid
ity (%
) RH 80 %RH 50 %RH 20 %
Figure 31. The measured relative humidity of the chamber air. Plaster A is marked by a solid line and plaster C by a dashed line. The sample thickness of the plasters was 3 mm. The gypsum board is marked by a boxed line. The legend box indicates the target relative humidity. Duplicate VOC-samples were collected at the age of 1, 14, and 29 days (plaster A), at 1, 14, and 27 days (plaster C) and at 1, 14, and 28 days (gypsum board).

86
Both plasters had condensed moisture on the chamber walls and lid in the RH 50 % and RH 80 % chambers. This condensation was non-observable after 1 day (plaster A) and after 9 days (plaster C) in the RH 50 % chamber. Regarding the RH 80 % chamber, plaster A had no observable condensation after 22 days, while plaster C had condensation throughout the whole testing period of 27 days. The high relative humidity of the storing conditions made the plasters feel soft at the time when they were removed from the test chambers. This could also be noted as reduced cohesion and adhesion during FTIR-sample preparation. 7.5.2 Part II. Material combinations on a glass substrate The measured relative humidity as a function of time of primers and their respective paints and plasters with their respective fillers (note: plaster C has no filler) spread onto a glass plate and introduced into a climate chamber (time 0) is presented in Figures 32 and 33. Paint C requires a different primer depending on the substrate, which is why its humidity history is presented with both primer A and primer C. Primer A is a water-borne product that is recommended as a primer for both paints A and C and primer C is an alkyd primer recommended for paint C. The water-borne products affected the relative humidity in the RH 80 % chamber by raising it to 90-95 % during the first day. Otherwise the relative humidity level is unaffected by the paints. (This applies also to the combination of a water-borne primer and alkyd paint). The combinations of filler and plaster A or B and a single, 6 mm layer, of plaster C, on the other hand, kept the relative humidity level high throughout the whole testing period. Only the combinations of filler and plaster A and B in the RH 20 % chamber and filler and plaster A in the RH 50 % chamber had relative humidity values below 95 % before the end of the testing period of 14 days. All samples caused condensation of water on the chamber walls and lid in the RH 50 % and RH 80 % chambers. This condensation was non-observable after 6 days for the combinations of filler and plaster A and B and after 12 days for plaster C in the RH 50 % chamber only. Regarding the RH 20 % chamber, there was no observable condensation for plaster C after 1 day, while the other two product composites caused no observable condensation at all.

87
0
10
20
30
40
50
60
70
80
90
100
0 2 4 6 8 10 12 14
Time (days)
Rel
ativ
e hu
mid
ity (%
) RH 80 %RH 50 %RH 20 %
Figure 32. The measured relative humidity of the chamber air. The combination of primer A and paint A is marked by a solid line, primer B and paint B by a dashed line, primer A and paint C by a boxed line, and primer C and paint C by a circled line. The legend box indicates the target relative humidity. Duplicate VOC-samples were collected at the age of 1, 7, and 14 days.
0
10
20
30
40
50
60
70
80
90
100
0 2 4 6 8 10 12 14
Time (days)
Rel
ativ
e hu
mid
ity (%
)
RH 80 %RH 50 %RH 20 %
Figure 33. The measured relative humidity of the chamber air. The combination of filler A and plaster A is marked by a solid line, filler B and plaster B by a dashed line, and a 6 mm layer of plaster C by a boxed line. The legend box indicates the target relative humidity. Duplicate VOC-samples were collected at the age of 1, 7, and 14 days.
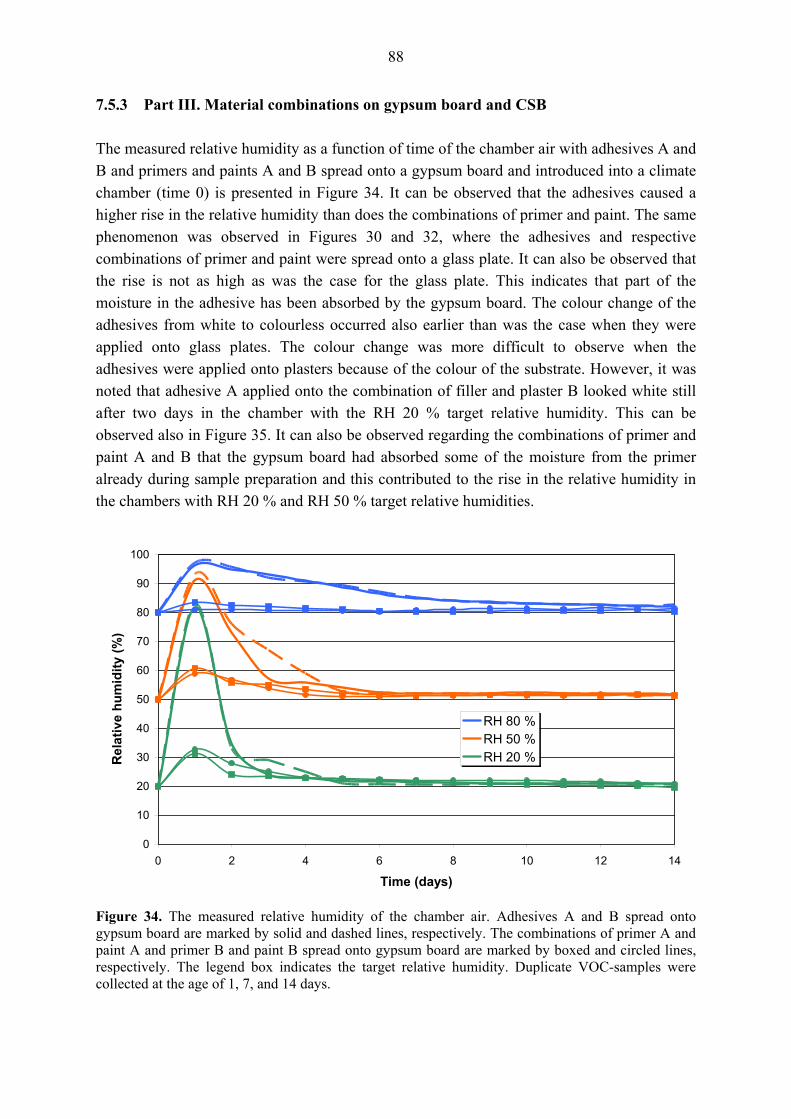
88
7.5.3 Part III. Material combinations on gypsum board and CSB The measured relative humidity as a function of time of the chamber air with adhesives A and B and primers and paints A and B spread onto a gypsum board and introduced into a climate chamber (time 0) is presented in Figure 34. It can be observed that the adhesives caused a higher rise in the relative humidity than does the combinations of primer and paint. The same phenomenon was observed in Figures 30 and 32, where the adhesives and respective combinations of primer and paint were spread onto a glass plate. It can also be observed that the rise is not as high as was the case for the glass plate. This indicates that part of the moisture in the adhesive has been absorbed by the gypsum board. The colour change of the adhesives from white to colourless occurred also earlier than was the case when they were applied onto glass plates. The colour change was more difficult to observe when the adhesives were applied onto plasters because of the colour of the substrate. However, it was noted that adhesive A applied onto the combination of filler and plaster B looked white still after two days in the chamber with the RH 20 % target relative humidity. This can be observed also in Figure 35. It can also be observed regarding the combinations of primer and paint A and B that the gypsum board had absorbed some of the moisture from the primer already during sample preparation and this contributed to the rise in the relative humidity in the chambers with RH 20 % and RH 50 % target relative humidities.
0
10
20
30
40
50
60
70
80
90
100
0 2 4 6 8 10 12 14
Time (days)
Rel
ativ
e hu
mid
ity (%
)
RH 80 %RH 50 %RH 20 %
Figure 34. The measured relative humidity of the chamber air. Adhesives A and B spread onto gypsum board are marked by solid and dashed lines, respectively. The combinations of primer A and paint A and primer B and paint B spread onto gypsum board are marked by boxed and circled lines, respectively. The legend box indicates the target relative humidity. Duplicate VOC-samples were collected at the age of 1, 7, and 14 days.

89
The measured relative humidity as a function of time of the chamber air with adhesives A and B spread onto the combination of filler and plaster B and a 6 mm layer of plaster C and introduced into a climate chamber (time 0) is presented in Figure 35. It can be observed that the humidity level stays higher for a longer period of time than was the case for the gypsum board. This is caused by the moisture evaporating from the plaster (+filler) through the adhesive layer. The humidity level is, however, not as high as it is for plasters without a coating. There are two factors that affect this result. One is that the plasters dried for one day before the application of the adhesive according to the manufacturer's recommendations and the other factor is that some of the moisture in the plaster was most probably absorbed by the calcium silicate brick that the plaster or filler was applied onto. Thus, the measured humidity results indicate that material combinations should be considered as separate entities and no general conclusions should be made based on single structural components. This will be dealt with further in the following chapters.
0
10
20
30
40
50
60
70
80
90
100
0 2 4 6 8 10 12 14
Time (days)
Rel
ativ
e hu
mid
ity (%
)
RH 80 %RH 50 %RH 20 %
Figure 35. The measured relative humidity of the chamber air. Adhesive A spread onto the combination of filler and plaster B and a 6 mm layer of plaster C is marked by solid and dashed lines, respectively. Adhesive B spread onto the combination of filler and plaster B and a 6 mm layer of plaster C is marked by boxed and circled lines, respectively. The legend box indicates the target relative humidity. Duplicate VOC-samples were collected at the age of 1, 7, or 14 days depending on the criteria set by the factorial design. The measured relative humidity as a function of time of the chamber air with the combinations of primer A and paint A and primer B and paint B spread onto the combination of filler B and plaster B and a 6 mm layer of plaster C and introduced into a climate chamber (time 0) is presented in Figure 36.

90
0
10
20
30
40
50
60
70
80
90
100
0 2 4 6 8 10 12 14
Time (days)
Rel
ativ
e hu
mid
ity (%
)
RH 80 %RH 50 %RH 20 %
Figure 36. The measured relative humidity of the chamber air. The combination of primer A and paint A spread onto the combination of filler B and plaster B and a 6 mm layer of plaster C is marked by solid and dashed lines, respectively. The combination of primer B and paint B spread onto the combination of filler B and plaster B and a 6 mm layer of plaster C is marked by boxed and circled lines, respectively. The legend box indicates the target relative humidity. Duplicate VOC-samples were collected at the age of 1, 7, or 14 days depending on the criteria set by the factorial design. It is to be observed that the second measurement of the relative humidity of the chamber air in Figures 29-36 is at 1 day. Water-borne materials caused a rapid rise of the relative humidity of the chamber air only hours after their introduction into the chamber. This is demonstrated in Figure 37. The relative humidity rises to 90 - 100 % already 1 hour after the introduction of adhesive C spread onto a glass plate irrespective of the initial relative humidity of the chamber air. The relative humidity of the laboratory room at the start of the test was approximately 20 %. The gypsum board causes an initial rise in the humidity level for the first hours at RH 20 % and a small decrease at the other two relative humidities. The relative humidity of the laboratory room at the start of the test was approximately 30 %. The relative humidity reaches equilibrium, however, in 24 hours. Paint C also causes an initial decrease of the relative humidity in the RH 50 % and RH 80 % chambers. The relative humidity of the laboratory room at the start of the test was also approximately 30 %. Equilibrium is again reached in about 24 hours.

91
0
10
20
30
40
50
60
70
80
90
100
0 1 2 24 48
Time (hours)
Rel
ativ
e hu
mid
ity (%
)
RH 80 %RH 50 %RH 20 %
Figure 37. The measured relative humidity of the chamber air during the first 48 hours of a test. All samples are applied onto a glass plate. Adhesive C is marked by a solid line, gypsum board is marked by a dashed line, and paint C is marked by a boxed line. 7.6 WEIGHT CHANGES The weight of the samples was recorded during sample preparation and after the chamber measurements were finished for each material/material combination. The results are presented in the following chapters in a chronological order. The numerical values are presented in Appendix B. 7.6.1 Part I. Single material layers on a glass substrate The relative weight change of paints A and C and adhesives A and C before and after the chamber measurements are shown in Figure 38. The weight change of the water-borne materials (paint A and both adhesives) was smaller the higher the target relative humidity of the chamber air. The weight change of the alkyd resin paint (paint C) was not affected by the relative humidity of the storing conditions. The measured relative humidity values were presented in Figure 30. The weight change of plasters A and C and the gypsum board are shown in Figure 39. The weight change of plaster A was not affected by the relative humidity of the storing conditions. The weight change of the gypsum board followed that of the water borne materials. This was, on the other hand, an expected result, since the relative humidity of the
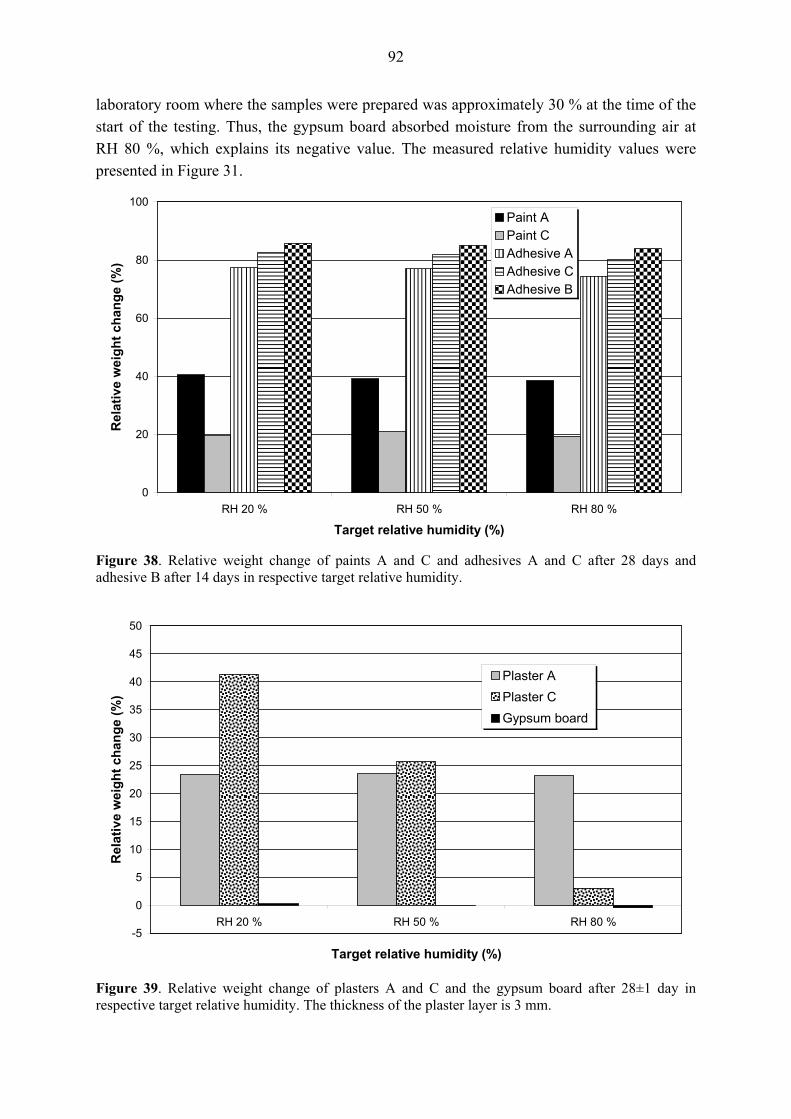
92
laboratory room where the samples were prepared was approximately 30 % at the time of the start of the testing. Thus, the gypsum board absorbed moisture from the surrounding air at RH 80 %, which explains its negative value. The measured relative humidity values were presented in Figure 31.
0
20
40
60
80
100
RH 20 % RH 50 % RH 80 %
Target relative humidity (%)
Rel
ativ
e w
eigh
t cha
nge
(%)
Paint APaint CAdhesive AAdhesive CAdhesive B
Figure 38. Relative weight change of paints A and C and adhesives A and C after 28 days and adhesive B after 14 days in respective target relative humidity.
-5
0
5
10
15
20
25
30
35
40
45
50
RH 20 % RH 50 % RH 80 %
Target relative humidity (%)
Rel
ativ
e w
eigh
t cha
nge
(%)
Plaster APlaster CGypsum board
Figure 39. Relative weight change of plasters A and C and the gypsum board after 28±1 day in respective target relative humidity. The thickness of the plaster layer is 3 mm.

93
7.6.2 Part II. Material combinations on a glass substrate The relative weight change of the combinations of primer and paint are presented in Figure 40. The relative weight change of the water-borne paints decreased with increasing relative humidity of the storing conditions, as could be expected. The same phenomenon is also observed for the combination of primer A and paint C. This indicates that the paint does not form an impervious layer, but rather an integral product together with its primer. It can also be noted that the relative weight change of the water-borne paints is about 3-times higher than that of the alkyd paint. The measured relative humidity values were presented in Figure 32. The relative weight change of plasters A and B with their respective fillers and a 6 mm layer of plaster C are presented in Figure 41. The weight change of plaster A was, when used in combination with its filler, affected by the high relative humidity contrary to what was observed for the single layer of the plaster. This indicates that the evaporation from plaster A when applied onto a filler is affected both by the high relative humidity of the surrounding air and by its substrate resulting in a decreased relative weight change. The measured relative humidity values were presented in Figure 33.
0
10
20
30
40
RH 20 % RH 50 % RH 80 %
Target relative humidity (%)
Rel
ativ
e w
eigh
t cha
nge
(%)
Primer A and paint APrimer B and paint BPrimer A and paint CPrimer C and paint C
Figure 40. Relative weight change of the different paints after 14 days in respective target relative humidity.

94
0
10
20
30
40
RH 20 % RH 50 % RH 80 %
Target relative humidity (%)
Rel
ativ
e w
eigh
t cha
nge
(%)
Filler A and plaster AFiller B and plaster BPlaster C (6 mm)
Figure 41. Relative weight change of the different filler and plaster combinations and a 6 mm layer of plaster C after 14 days in respective target relative humidity. 7.6.3 Part III. Material combinations on gypsum board and CSB The relative weight change of the material combinations applied onto gypsum board (GB) and calcium silicate brick (CSB) are presented in Figures 42-44. The relative weight change of adhesive B applied onto gypsum board is higher than that of adhesive A. The weight change of adhesive B applied onto gypsum board and stored at the different relative humidities is lower and decreases more pronouncedly with increasing relative humidity compared with the glass substrate. This is caused by the fact that the moisture in the adhesive is partly absorbed by the gypsum board. The same observation can be made for the combinations of primer and paint The weight change of the combination of primer A and paint A is higher than that of the combination of primer B and paint B when spread onto gypsum board, as was observed for the glass plate, and the weight change at the different relative humidities is lower and decreases more pronouncedly with increasing relative humidity compared with the glass substrate. The exception to the foregoing is the fact that the relative weight change at the RH 20 % target relative humidity is somewhat higher when primer s and paints are spread onto gypsum board than was the case when they were spread onto glass. This is probably caused by the fact that the gypsum board had absorbed some of the moisture from the primer already during sample preparation and this contributes to the weight change. The measured relative humidity values of material combinations on gypsum board and CSB were presented in Figures 34-36.

95
0
20
40
60
80
100
RH 20 % RH 50 % RH 80 %
Target relative humidity (%)
Rel
ativ
e w
eigh
t cha
nge
(%)
GB + adhesive AGB + adhesive BGB + primer A and paint AGB + primer B and paint B
Figure 42 Relative weight change of adhesives A and B and the combinations of primer and paint A and B spread onto gypsum board after 14 days in respective target relative humidity. The combination of filler and plaster B and a 6 mm layer of plaster C cause approximately a 3-4 -times higher relative weight change at the target relative humidities of RH 20 % and RH 50 % when the two adhesives A and B were applied onto them, compared with gypsum board. The difference becomes smaller at the target relative humidity of RH 80 %. The difference in the relative weight change is approximately 8-12 times higher on the combination of filler and plaster B and a 6 mm layer of plaster C applied onto CSB than on the gypsum board as far as the combinations of primer and paint at all three different target relative humidities are concerned. The reason for the difference between paints and adhesives is probably that the paints are more permeable than the adhesives and the contribution from the substrate to the weight change is, thus, bigger.
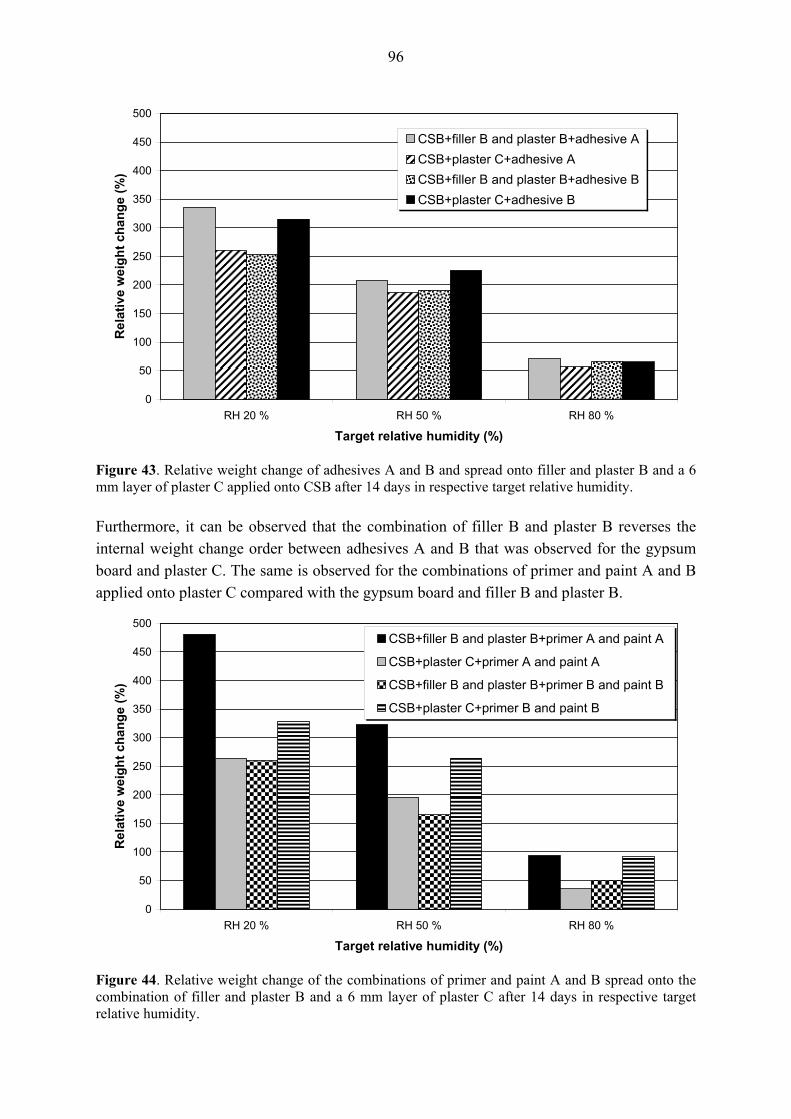
96
0
50
100
150
200
250
300
350
400
450
500
RH 20 % RH 50 % RH 80 %
Target relative humidity (%)
Rel
ativ
e w
eigh
t cha
nge
(%)
CSB+filler B and plaster B+adhesive ACSB+plaster C+adhesive ACSB+filler B and plaster B+adhesive BCSB+plaster C+adhesive B
Figure 43. Relative weight change of adhesives A and B and spread onto filler and plaster B and a 6 mm layer of plaster C applied onto CSB after 14 days in respective target relative humidity. Furthermore, it can be observed that the combination of filler B and plaster B reverses the internal weight change order between adhesives A and B that was observed for the gypsum board and plaster C. The same is observed for the combinations of primer and paint A and B applied onto plaster C compared with the gypsum board and filler B and plaster B.
0
50
100
150
200
250
300
350
400
450
500
RH 20 % RH 50 % RH 80 %
Target relative humidity (%)
Rel
ativ
e w
eigh
t cha
nge
(%)
CSB+filler B and plaster B+primer A and paint A
CSB+plaster C+primer A and paint A
CSB+filler B and plaster B+primer B and paint B
CSB+plaster C+primer B and paint B
Figure 44. Relative weight change of the combinations of primer and paint A and B spread onto the combination of filler and plaster B and a 6 mm layer of plaster C after 14 days in respective target relative humidity.
97
When comparing the measured relative humidity values, presented in the preceding chapter, with the relative weight changes it can be observed that a higher measured relative humidity corresponds to a bigger relative weight change especially regarding painting products and adhesives independent of the substrate. This is a consequence of water evaporation. Furthermore, there was no observable correlation between relative humidity and the weight change of especially the alkyd paint, but this held, surprisingly, true also for plaster A. Finally, the gypsum board obviously maintained moisture equilibrium with its surroundings. 7.7 VOC EMISSIONS 7.7.1 Background VOC concentrations The background VOC concentrations were measured always before the start of a test series. The results are presented in Appendix C in connection with respective material emission results. The average background concentration of VOCs of the test chamber air was 21.4 μg/m³ (81 measurements) and its standard deviation was 14.7 μg/m³. The average background concentrations were 14.3 μg/m³, 22.3 μg/m³, and 27.6 μg/m³ at RH 20±5 %, RH 50±5 %, and RH 80±5 % target relative humidities, respectively. This could indicate that either the chamber with a higher relative humidity was more difficult to clean due to adsorption of VOCs on the chamber walls or that the deionised water used to adjust the relative humidity of the chamber air was not free of VOCs. The average background concentration of VOCs measured with the FLEC-cell was 24.9 μg/m³ (27 measurements) and its standard deviation was 12.9 μg/m³. However, the result is influenced by the fact that, nevertheless, for some measurements the TVOC concentration was below the detection limit that was the value used in the calculations. The background concentration was always subtracted from the measured sample concentrations before converting the values into area specific emission rates (SERa). This might give rise to a small error in the sample concentrations measured at 7, 14, or 28 days from the test chamber air, since the background concentration might decrease with time. However, this was not confirmed. The area specific emission rates calculated as TVOC (TVOCSERa) and a more detailed study on the behaviour of certain single compounds is presented in the following chapters. All results are calculated as a mean of two consecutively collected (test chamber) or simultaneously collected (FLEC-cell) samples.

98
7.7.2 Part I. VOC emissions from single material layers on a glass substrate 7.7.2.1 Paint A The TVOCSERa of paint A spread onto a glass plate are presented in Figure 45 and the SERa of the most abundant compounds are presented in Table 21. The TVOCSERa of paint A is higher the higher the relative humidity of the storing conditions irrespective of the point of sample collection when samples are collected from the test chamber. The same trend is observed for the most abundant compounds at 1 day except for 1,2-propanediol. At 14 days the SERa of all single compounds is <5 μg/m²·h except for 1,2-propanediol at the RH 20 % target relative humidity. At 28 days the SERa of all single compounds is typically <1 μg/m²·h with a few exceptions. The most conspicuous exception is dichloromethane that is present at the RH 50 % target relative humidity having a SERa of 29 μg/m²·h. The compound lies, however, outside the TVOC-region and is of unknown origin. What is also noteworthy is that compounds within a chemical group and the number of chemical groups are different at different relative humidities and points of time. The detailed results of samples collected from the test chambers are presented in Appendix C, Tables C2 to C4. The SERa of single compounds collected using the FLEC-cell at 28 days is in general so low, < 2 μg/m²·h, that a detailed analysis is superfluous. The only compound with an elevated SERa is 2-butanone, 6 μg/m²·h emitted from the sample stored at RH 80 % target relative humidity. The samples collected from the environmental chambers also had very low SERa-values at 28 days, so the results confirm each other. The detailed results of samples collected using the FLEC-cell are presented in Appendix C, Table C110.

99
0
20
40
60
80
100
120
140
160
180
200
RH 20 % RH 50 % RH 80 %Target relative humidity
TVO
CSE
Ra (μg
/m²·h
) 1 day14 days28 daysFLEC 28 days600 860 940
Figure 45. TVOCSERa of paint A spread onto a glass plate. The measured relative humidities were 20±5 %, 50±5 %, and 85±2 % at 1 day. At the other sample collection points the measured relative humidities were the same as the target relative humidities ±5% RH. Table 21. The most abundant compounds emitted from paint A spread onto a glass plate (μg/m²·h). The relative humidity values indicate the target values of the test chambers.
Test chamber FLEC-cell Compound
20 % 50 % 80 % 20 % 50 % 80 % 1 day 1,2-propanediol 570 800 560 hydrocarbon mixture 260 300 390 2-(2-ethoxyethoxy)ethanol 130 200 200 1-dodecene 80 110 210 texanol 10 15 20 14 days 1,2-propanediol 15 2 2 1-dodecene 4 5 5 28 days 1-dodecene 2 2 1 2 2 1 2-butanone 0 4 0 0 3 6
7.7.2.2 Paint C The TVOCSERa of paint C spread onto a glass plate are presented in Figure 46 and the SERa of the most abundant compounds are presented in Table 22. The TVOCSERa of paint C is highest at RH 50 % target relative humidity irrespective of the point of sample collection.

100
One factor that contributes to the result is the fact that the weight difference between the samples at the start of the test period was quite large. Expressed as factors, the weights of the samples were 1.024, 1.092, and 1.00 at the target relative humidities of RH 20 %, RH 50 %, and RH 80 %, respectively. Taking this into consideration it can be deduced that the TVOCSERa of paint C is rather unaffected by the relative humidity of the storing conditions. The main chemical group emitted from paint C at 1 and 14 days is a mixture of hydrocarbons quantified as toluene-equivalents, which contains mainly aliphatic and alicyclic compounds in the boiling point range 130 °C to 250 °C. Their SERa has the same trend than that of TVOCSERa as regards relative humidity at 1 day, but not anymore at 14 days. Other abundant compounds are different aldehydes and acids. The SERa of aldehydes is higher the higher the relative humidity of the storing conditions at 1 day, but this trend is not observable later. Acids do not show any trend regarding relative humidity. The most abundant aldehyde is hexanal while the most abundant acid at 1 day is 2-ethylhexanoic acid and later on hexanoic acid. It is also noteworthy that acids with equal or higher boiling points than that of 2-ethylhexanoic acid are not present at 1 day but are present later on and that the SERa of some acids is higher at 28 days than at 14 days. The detailed results of the samples collected from the test chambers are presented in Appendix C, Tables C6 to C8.
0
400
800
1200
1600
2000
2400
2800
3200
3600
4000
RH 20 % RH 50 % RH 80 %Target relative humidity
TVO
CSE
Ra (μg
/m²·h
)
1 day14 days28 daysFLEC 28 days
20500 26500 17400
Figure 46. TVOCSERa of paint C spread onto a glass plate. The measured relative humidities were the same as the target relative humidities ±5% RH.
101
Table 22. The most abundant compounds emitted from paint C spread onto a glass plate (μg/m²·h). The relative humidity values indicate the target values of the test chambers.
Test chamber FLEC-cell Compound
20 % 50 % 80 % 20 % 50 % 80 % 1 day hydrocarbon mixture 16800 21700 12100 hexanal 1300 1500 1500 2-ethylhexanoic acid 800 900 750 pentanal 450 550 600 hexanoic acid 350 350 450 14 days hydrocarbon mixture 350 300 250 hexanoic acid 170 280 240 2-ethylhexanoic acid 160 170 120 hexanal 80 100 80 2 2 1 28 days hexanoic acid 320 360 220 280 620 130 2-ethylhexanoic acid 30 30 30 20 40 10 hexanal 30 30 30 70 220 25 pentanoic acid 30 30 15 40 110 10 acetic acid 15 10 5 75 160 30
The TVOCSERa of the two different sample collection methods was about equal in size at the target relative humidity of RH 20 %, but FLEC sample collection resulted in a higher TVOCSERa at RH 50 % and a lower TVOCSERa at RH 80 % than what was obtained for test chambers. Hexanoic acid and hexanal were also the most abundant single compounds irrespective of sample collection method at 28 days, but there is quite a big difference in the SERa-values between the two sample collection methods especially for samples stored at RH 50 % target relative humidity. The high SERa of hexanal and hexanoic acid at RH 50 % is also the main reason for the differences in TVOCSERa-values between the two sample collection methods. Pentanoic acid and acetic acid was also quite abundant in the samples collected using the FLEC-cell compared with the test chamber. The detailed results of the samples collected using the FLEC-cell are presented in Appendix C, Table C112. 7.7.2.3 Adhesive A The TVOCSERa of adhesive A applied onto a glass plate are presented in Figure 47 and the SERa of the most abundant compounds are presented in Table 23. There is no clear trend of the TVOCSERa of the adhesive regarding the relative humidity of the storing conditions except for 28 days, when it is higher the higher the relative humidity of the test chamber air irrespective of the sample collection method.

102
At 1 day the most abundant compounds are acetic acid and propyl benzoate. The SERa of acetic acid is 1.5-times higher at RH 20 % than at the other two relative humidities. At 14 and 28 days acetic acid is still the most abundant single compound and its SERa is higher the higher the relative humidity of the storing conditions also for samples collected using the FLEC-cell. Propyl benzoate is no longer observable at 14 days. The number of aliphatic, alicyclic and aromatic compounds increases with time and their SERa is highest at 14 days. As far as other compounds are concerned, the number of chemical groups is higher at 28 days than at 14 days, but the SERa of individual compounds is low, < 4 μg/m²·h. The detailed results of the samples collected from the test chambers are presented in Appendix C, Tables C10 to C12.
0
20
40
60
80
100
120
140
160
180
200
RH 20 % RH 50 % RH 80 %Target relative humidity
TVO
CSE
Ra (μg
/m²·h
)
1 day14 days28 daysFLEC 28 days
Figure 47. TVOCSERa of adhesive A sapplied onto a glass plate. The measured relative humidities were 95±5 %, 97±5 %, and 99±2 % at the target relative humidities of RH 20 %, RH 50 %, and RH 80 %, respectively, at 1 day. At the other sample collection points the measured relative humidities were the same as the target relative humidities ±5% RH. The by far most abundant compound in samples collected using the FLEC-cell is acetic acid, as was the case for the samples collected from the test chambers. Its SERa is also higher the higher the relative humidity of the storing conditions. 2-butanone and butyl phthalate have also somewhat abundant SERa-values for samples stored at the RH 80 % target relative humidity when collected using the FLEC-cell, i.e. 11 μg/m²·h and 9 μg/m²·h, respectively. These compounds were, however, not observed in any of the samples collected from the test chambers. The detailed results of the samples collected using the FLEC-cell are presented in Appendix C, Table C114.
103
Table 23. The most abundant compounds emitted from adhesive A applied onto a glass plate (μg/m²·h). The relative humidity values indicate the target values of the test chambers.
Test chamber FLEC-cell Compound
20 % 50 % 80 % 20 % 50 % 80 % 1 day acetic acid 120 70 75 propyl benzoate 25 25 30 14 days acetic acid 10 20 70 p,m-xylene 10 10 10 28 days acetic acid 7 10 25 4 30 55
7.7.2.4 Adhesive C The TVOCSERa of adhesive C applied onto a glass plate are presented in Figure 48 and the SERa of the most abundant compounds are presented in Table 24. The TVOCSERa is higher the lower the relative humidity of the storing conditions at 1 day, while the trend is the opposite at 14 and 28 days for samples collected from the test chambers. However, the TVOCSERa is lower the higher the relative humidity of the storing conditions when the samples are collected using the FLEC-cell.
0
50
100
150
200
250
300
RH 20 % RH 50 % RH 80 %Target relative humidity
TVO
CSE
Ra (μg
/m²·h
)
1 day14 days28 daysFLEC 28 days
Figure 48. TVOCSERa of adhesive C applied onto a glass plate. The measured relative humidities were 94±5 %, 97±5 %, and 98±2 % at the target relative humidities of RH 20 %, RH 50 %, and RH 80 %, respectively, at 1 day. At the other sample collection points the measured relative humidities were the same as the target relative humidities ±5% RH.
104
Table 24. The most abundant compounds emitted from adhesive C applied onto a glass plate (μg/m²·h). The relative humidity values indicate the target values of the test chambers.
Test chamber FLEC-cell Compound
20 % 50 % 80 % 20 % 50 % 80 % 1 day acetic acid 340 230 180 1,2-propanediol 85 40 15 14 days acetic acid 15 60 110 1,2-propanediol 3 85 230 28 days acetic acid 5 20 30 360 360 50 1,2-propanediol 1 40 50 450 150 55
As far as the two most abundant compounds, 1,2-propanediol and acetic acid, are concerned their SERa follows the same trend as that of TVOCSERa irrespective of time and sample collection method. The SERa of aldehydes and ketones which were somewhat abundant compounds at 1 day is almost zero at 14 and 28 days. Furthermore it can be noted that the number of aromatic compounds is quite high at 14 and 28 days and that their SERa is highest at 14 days. The number of chemical groups is higher at 28 days than at 14 days, but the SERa of the individual compounds is low, < 3 μg/m²·h for samples collected from the test chambers. The detailed results of the samples collected from the test chambers are presented in Appendix C, Tables C14 to C16. Other significant differences between the two sample collection methods, except the trends of TVOCSERa and the two most abundant species as regards the relative humidity of the storing conditions, are that ketones and esters were observed only using the FLEC-cell. Other chemical groups that are observed only using the FLEC-cell are nitrogen and especially sulphur containing compounds. The detailed results of the samples collected using the FLEC-cell are presented in Appendix C, Table C116. 7.7.2.5 Plaster A The TVOCSERa of a 3 mm layer plaster A applied onto a glass plate are presented in Figure 49 and the SERa of the most abundant compounds are presented in Table 25. There is no clear trend of the TVOCSERa of the plaster regarding the relative humidity of the chamber air for samples collected from the test chambers except at 29 days, when it is higher the higher the relative humidity of the storing conditions. However, this trend is not observed for samples collected using the FLEC-cell.
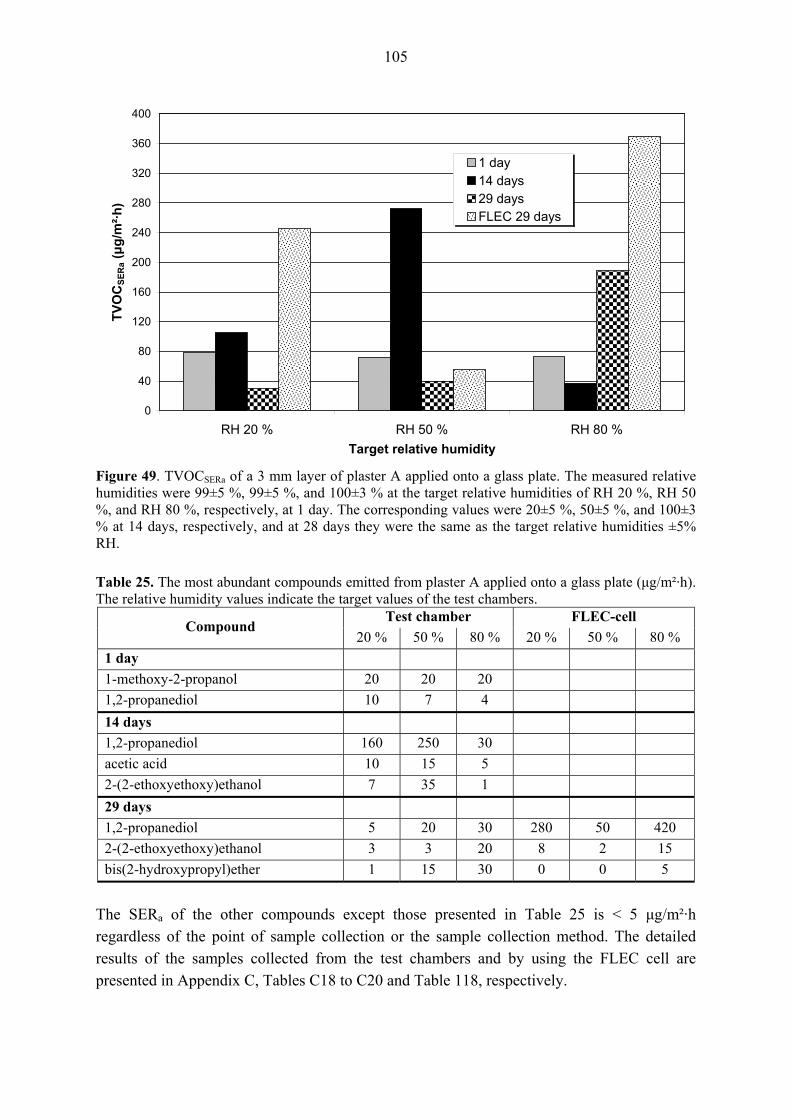
105
0
40
80
120
160
200
240
280
320
360
400
RH 20 % RH 50 % RH 80 %Target relative humidity
TVO
CSE
Ra (μg
/m²·h
)
1 day14 days29 daysFLEC 29 days
Figure 49. TVOCSERa of a 3 mm layer of plaster A applied onto a glass plate. The measured relative humidities were 99±5 %, 99±5 %, and 100±3 % at the target relative humidities of RH 20 %, RH 50 %, and RH 80 %, respectively, at 1 day. The corresponding values were 20±5 %, 50±5 %, and 100±3 % at 14 days, respectively, and at 28 days they were the same as the target relative humidities ±5% RH. Table 25. The most abundant compounds emitted from plaster A applied onto a glass plate (μg/m²·h). The relative humidity values indicate the target values of the test chambers.
Test chamber FLEC-cell Compound
20 % 50 % 80 % 20 % 50 % 80 % 1 day 1-methoxy-2-propanol 20 20 20 1,2-propanediol 10 7 4 14 days 1,2-propanediol 160 250 30 acetic acid 10 15 5 2-(2-ethoxyethoxy)ethanol 7 35 1 29 days 1,2-propanediol 5 20 30 280 50 420 2-(2-ethoxyethoxy)ethanol 3 3 20 8 2 15 bis(2-hydroxypropyl)ether 1 15 30 0 0 5
The SERa of the other compounds except those presented in Table 25 is < 5 μg/m²·h regardless of the point of sample collection or the sample collection method. The detailed results of the samples collected from the test chambers and by using the FLEC cell are presented in Appendix C, Tables C18 to C20 and Table 118, respectively.
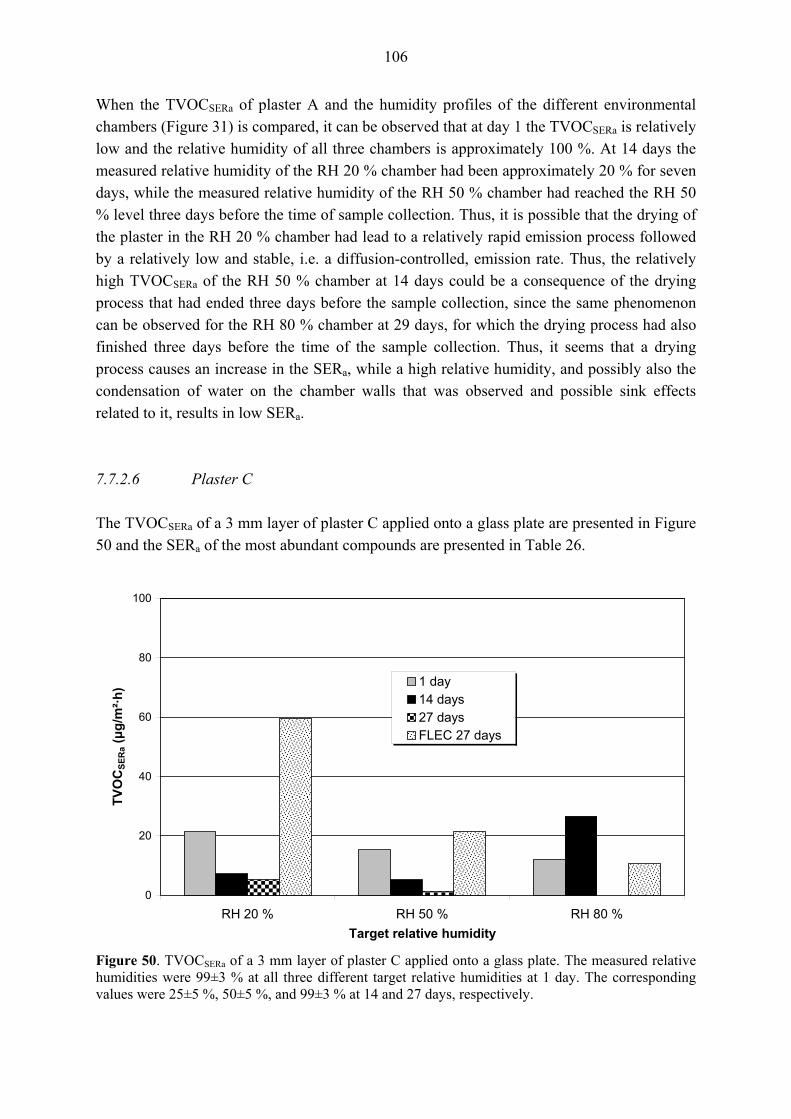
106
When the TVOCSERa of plaster A and the humidity profiles of the different environmental chambers (Figure 31) is compared, it can be observed that at day 1 the TVOCSERa is relatively low and the relative humidity of all three chambers is approximately 100 %. At 14 days the measured relative humidity of the RH 20 % chamber had been approximately 20 % for seven days, while the measured relative humidity of the RH 50 % chamber had reached the RH 50 % level three days before the time of sample collection. Thus, it is possible that the drying of the plaster in the RH 20 % chamber had lead to a relatively rapid emission process followed by a relatively low and stable, i.e. a diffusion-controlled, emission rate. Thus, the relatively high TVOCSERa of the RH 50 % chamber at 14 days could be a consequence of the drying process that had ended three days before the sample collection, since the same phenomenon can be observed for the RH 80 % chamber at 29 days, for which the drying process had also finished three days before the time of the sample collection. Thus, it seems that a drying process causes an increase in the SERa, while a high relative humidity, and possibly also the condensation of water on the chamber walls that was observed and possible sink effects related to it, results in low SERa. 7.7.2.6 Plaster C The TVOCSERa of a 3 mm layer of plaster C applied onto a glass plate are presented in Figure 50 and the SERa of the most abundant compounds are presented in Table 26.
0
20
40
60
80
100
RH 20 % RH 50 % RH 80 %Target relative humidity
TVO
CSE
Ra (μg
/m²·h
) 1 day14 days27 daysFLEC 27 days
Figure 50. TVOCSERa of a 3 mm layer of plaster C applied onto a glass plate. The measured relative humidities were 99±3 % at all three different target relative humidities at 1 day. The corresponding values were 25±5 %, 50±5 %, and 99±3 % at 14 and 27 days, respectively.

107
Table 26. The most abundant compounds emitted from plaster C applied onto a glass plate (μg/m²·h). The relative humidity values indicate the target values of the test chambers.
Test chamber FLEC-cell Compound
20 % 50 % 80 % 20 % 50 % 80 % 1 day all compounds ≤ 3 ≤ 3 ≤ 2 14 days hydrocarbon mixture 0 0 20 27 days p,m-xylene < 1 < 1 < 1 10 4 1 toluene - - - 15 4 1
The TVOCSERa of plaster C is lower the higher the relative humidity of the storing conditions at 1 and 27 days. The same trend is observed for samples collected using the FLEC-cell at 27 days. At 14 days the TVOCSERa is highest at RH 80 %. This is influenced by a mixture of mainly aliphatic and alicyclic compounds with boiling points between 230 °C and 280 °C, which were quantified as toluene-equivalents. The origin of this hydrocarbon mixture is unknown, but what is interesting is that it is observed also at 14 days at RH 20 % and RH 50 % target relative humidities for the 6 mm layer of the plaster. This will be dealt with in Chapter 7.7.3.6. In general it can be stated that the SERa of single compounds collected from the test chambers is so low, < 1 μg/m²·h, that a more detailed analysis is superfluous. The detailed results of the samples collected from the test chambers are presented in Appendix C, Tables C22 to C24. The TVOCSERa is about one order of magnitude higher when samples are collected using the FLEC-cell compared with the test chambers. The SERa of the other compounds except those presented in Table 26 is generally < 3 μg/m²·h irrespective of the storing conditions. The detailed results of the samples collected using the FLEC-cell are presented in Appendix C, Table C120. As far as plaster C is concerned, it consists of gypsum and probably also of some organic component(s), which was also dealt with in Chapter 7.1.3. However, the amount of organics seems to be small, or at least their effect on the VOC-emissions is negligible in practice, which is also the reason why the connection between relative humidity and emissions referred to in the preceding about plaster A can not be observed. 7.7.2.7 Gypsum board The TVOCSERa of the gypsum board applied on a sheet of glass are presented in Figure 51 and the SERa of the most abundant compounds are presented in Table 27.

108
0
20
40
60
80
100
RH 20 % RH 50 % RH 80 %Target relative humidity
TVO
CSE
Ra (μg
/m²·h
) 1 day14 days28 daysFLEC 28 days
Figure 51. TVOCSERa of the gypsum board applied onto a glass plate. The measured relative humidities were the same as the target relative humidities ±5% RH. Table 27. The most abundant compounds emitted from the gypsum board applied onto a glass plate (μg/m²·h). The relative humidity values indicate the target values of the test chambers.
Test chamber FLEC-cell Compound
20 % 50 % 80 % 20 % 50 % 80 % 1 day hexanal 2 5 10 halogen containing compounds 5 5 2 14 days all compounds ≤ 1 ≤ 1 ≤ 1 28 days all compounds < 1 < 1 < 1 < 1 ≤ 1 ≤ 2
The TVOCSERa of the gypsum board is higher the higher the relative humidity of the storing conditions at 1 day. At 14 and 28 days it is > 0 μg/m²·h only at RH 20 % at 14 days. The SERa of the single compounds at 14 and 28 days is so low, ≤ 2 μg/m²·h, that further analysis is superfluous. The detailed results of the samples collected from the test chambers are presented in Appendix C, Tables C26 to C28 and the detailed results of the samples collected using the FLEC-cell are presented in Table C122. A comparison of the TVOCSERa-values at 28 days of the materials studied in Part I with the requirements of the Finnish classification of building materials (CIC 2001) reveal that paint C is the only product not fulfilling the requirement of a TVOCSERa-value < 200 μg/m²·h for

109
samples collected from the test chamber. All other products, also the adhesives studied although not classified, fulfil the requirement irrespective of the relative humidity of the storing conditions. It is in this context noteworthy that the TVOCSERa of plaster A stored in the RH 80 % chamber is quite close to the reference value. The sample was collected at the age of 29 days. When examining the TVOCSERa-values of the samples collected by using the FLEC-cell, it can be noted that paint C stored in the RH 80 % would fulfil the requirement, while adhesive C stored in the RH 20 % chamber and plaster A stored in the RH 20 % and RH 80 % chambers would not fulfil the requirement. 7.7.3 Part II. VOC emissions from material combinations on a glass substrate 7.7.3.1 Primer A and paint A The TVOCSERa of the combination of primer A and paint A spread onto a glass plate are presented in Figure 52 and the SERa of the most abundant compounds are presented in Table 28. The TVOCSERa of the combination of primer A and paint A is higher the higher the relative humidity of the storing conditions for samples collected from the test chamber at 7 and 14 days. At 1 day the TVOCSERa at RH 20 % and RH 80 % target relative humidities is almost equal, while it is approximately 4 mg/m²·h higher at RH 50 %. The differences in the sample weights were less than 2 % at the start of the test, so the reason for the differences in the TVOCSERa-values at 1 day is difficult to explain. The SERa of 1,2-propanediol follows that of TVOCSERa regarding the relative humidity of the storing conditions at 1 and 7 days, while the SERa texanol is higher the higher the relative humidity of the storing conditions. The detailed results of the samples collected from the test chambers are presented in Appendix C, Tables C34 to C36. The TVOCSERa of the samples collected by using the FLEC-cell are quite similar to the values obtained from the test chambers. The SERa of 1,2-propanediol is about twice as high when collected using the FLEC-cell than when collected from the test chamber for samples stored at RH 20 % and RH 80 % target relative humidities. However, the SERa of texanol and all the other compounds collected are also quite similar irrespective of the sample collection method. The detailed results of the samples collected using the FLEC-cell are presented in Appendix C, Table C126.

110
0
500
1000
1500
2000
2500
3000
3500
4000
RH 20 % RH 50 % RH 80 %Target relative humidity
TVO
CSE
Ra (μg
/m²·h
)
1 day7 days14 daysFLEC 14 days
6300 10400 6700
Figure 52. TVOCSERa of the combination of primer A and paint A spread onto a glass plate. The measured relative humidities were 20±5 %, 55±5 %, and 90±5 % at 1 day. At the other sample collection points the measured relative humidities were the same as the target relative humidities ±5% RH. Table 28. The most abundant compounds emitted from the combination of primer A and paint A spread onto a glass plate (μg/m²·h). The relative humidity values indicate the target values of the test chambers.
Test chamber FLEC-cell Compound
20 % 50 % 80 % 20 % 50 % 80 % 1 day 1,2-propanediol 3650 5500 2750 texanol 1700 1800 2000 2-(2-butoxy-isopropoxy)-2-propanol 110 170 200 1-dodecene 80 110 190 7 days 1,2-propanediol 750 850 1450 texanol 1100 1150 1350 14 days 1,2-propanediol 300 250 650 650 250 1250 texanol 950 1000 1050 1000 1100 1350
7.7.3.2 Primer B and paint B The TVOCSERa of the combination of primer B and paint B spread onto a glass plate are presented in Figure 53 and the SERa of the most abundant compounds are presented in Table

111
29. The TVOCSERa does not show any clear trend as far as the relative humidity of the storing conditions is concerned for samples collected from the test chamber air. At 1 and 14 days it is highest at RH 50 % and lowest at RH 20 %. At 7 days the TVOCSERa is higher the higher the relative humidity. This holds true also when the samples are collected using the FLEC-cell at 14 days, thus there is a discrepancy in the test results between the two sample collection methods. The SERa of the two most abundant compounds, 1,2-propanediol and 2-(2-butoxyethoxy)ethanol, follow the trend of TVOCSERa at 1 and 7 days for samples collected from the test chambers. Acetic acid occurs only at 7 and 14 days. It has a high SERa-value especially at RH 50 % and RH 80 % target relative humidities. The detailed results of the samples collected from the test chambers are presented in Appendix C, Tables C38 to C42. The most abundant compounds are the same irrespective of the sample collection method. However, there is no observable trend regarding the SERa-values as far as the two methods or the relative humidity of the storing conditions are concerned. The detailed results of the samples collected using the FLEC-cell are presented in Appendix C, Table C128.
0
50
100
150
200
250
300
350
400
RH 20 % RH 50 % RH 80 %Target relative humidity
TVO
CSE
Ra (μg
/m²·h
)
1 day7 days14 daysFLEC 14 days
Figure 53. TVOCSERa of the combination of primer B and paint B spread onto a glass plate. The measured relative humidities were 20±5 %, 50±5 %, and 95±5 % at 1 day. At the other sample collection points the measured relative humidities were the same as the target relative humidities ±5% RH.

112
Table 29. The most abundant compounds emitted from the combination of primer B and paint B spread onto a glass plate (μg/m²·h). The relative humidity values indicate the target values of the test chambers.
Test chamber FLEC-cell Compound
20 % 50 % 80 % 20 % 50 % 80 % 1 day 1,2-propanediol 150 600 110 2-(2-butoxyethoxy)ethanol 20 150 130 2-(2-ethoxyethoxy)ethanol 15 70 20 7 days 1,2-propanediol 60 100 140 2-(2-butoxyethoxy)ethanol 25 70 90 2-(2-ethoxyethoxy)ethanol 10 15 20 acetic acid 0 170 60 14 days 1,2-propanediol 25 30 35 70 20 75 2-(2-butoxyethoxy)ethanol 10 35 35 10 10 25 2-(2-ethoxyethoxy)ethanol 15 4 3 5 2 5 acetic acid 30 55 50 40 40 45
7.7.3.3 Primer A and paint C The TVOCSERa of the combination of primer A and paint C spread onto a glass plate are presented in Figure 54 and the SERa of the most abundant compounds are presented in Table 30. The TVOCSERa is higher the higher the relative humidity of the storing conditions irrespective of the point of sample collection for samples collected from the test chambers, while it is of approximately equal size for samples collected using the FLEC-cell.

113
0
500
1000
1500
2000
2500
3000
RH 20 % RH 50 % RH 80 %Target relative humidity
TVO
CSE
Ra (μg
/m²·h
)1 day7 days14 daysFLEC 14 days
1930020300 20800
Figure 54. TVOCSERa of the combination of primer A and paint C spread onto a glass plate. The measured relative humidities were the same as the target relative humidities ±5% RH at every sample collection point. Only aldehydes and ketones follow the trend of TVOCSERa as regards the relative humidity of the chamber air irrespective of the point of sample collection. Also texanol follows the same trend, but only at 7 and 14 days. The trend of texanol applies also to samples collected using the FLEC-cell. When examining the other results of the samples collected using the FLEC-cell, it can be observed that the hydrocarbon mixture, aldehydes, ketones, and some acids have a lower SERa the higher the relative humidity of the storing conditions. A comparison of the results from the two sample collection methods shows that the SERa of single compounds are approximately of equal size, except that the SERa of aldehydes are higher and that of acids are lower when collected using the FLEC-cell compared with samples collected from the chamber air. It can also be observed in Table 30 that the SERa of 1,2-propanediol is distinctly higher for the sample stored at RH 20 % target relative humidity when collected using the FLEC-cell than when collected from the test chamber air. The detailed results of the samples collected from the test chambers are presented in Appendix C, Tables C42 to C44, and the detailed results of the samples collected using the FLEC-cell are presented in Table C130.

114
Table 30. The most abundant compounds emitted from the combination of primer A and paint C spread onto a glass plate (μg/m²·h). The relative humidity values indicate the target values of the test chambers.
Test chamber FLEC-cell Compound
20 % 50 % 80 % 20 % 50 % 80 % 1 day hydrocarbon mixture 8100 8700 8500 1,2-propanediol 7300 7600 7200 texanol 2500 2600 2550 hexanal 1750 2000 2500 undecane 2050 1900 1950 hexanoic acid 800 1000 900 7 days hydrocarbon mixture 400 450 400 1,2-propanediol 1200 1200 1850 texanol 500 650 1000 hexanal 200 200 250 undecane 40 40 35 hexanoic acid 300 400 350 14 days hydrocarbon mixture 130 130 140 200 110 50 1,2-propanediol 470 450 560 700 460 550 texanol 210 320 530 210 290 500 hexanal 70 75 80 150 95 55 undecane 15 10 10 10 5 2 hexanoic acid 180 250 230 190 170 150
7.7.3.4 Primer C and paint C The TVOCSERa of the combination of primer C and paint C spread onto a glass plate are presented in Figure 55 and the SERa of the most abundant compounds are presented in Table 31. The TVOCSERa is higher the higher the relative humidity irrespective of storing conditions or the point of sample collection for samples collected from the test chambers, while the trend is the opposite for samples collected using the FLEC-cell. The hydrocarbon mixture and aldehydes follow the trend of TVOCSERa as regards the relative humidity of the chamber air for samples collected from the test chamber air. When examining the results of the samples collected using the FLEC-cell, it can be observed that aliphatic hydrocarbons, 1-pentanol, some aldehydes and ketones, and most acids have a lower SERa the higher the relative humidity of the storing conditions, which is the opposite to what can be observed from the test chamber results as far as the hydrocarbon mixture and aldehydes are concerned. This is also the major reason for the difference in the TVOCSERa-values

115
between the two sample collection methods for samples stored in the RH 20 % and RH 80 % target relative humidity chambers.
0
500
1000
1500
2000
2500
3000
RH 20 % RH 50 % RH 80 %Target relative humidity
TVO
CSE
Ra (μg
/m²·h
)
1 day7 days14 daysFLEC 14 days
13700 15400 18400
Figure 55. TVOCSERa of the combination of primer C and paint C spread onto a glass plate. The measured relative humidities were the same as the target relative humidities ±5% RH at every sample collection point. Table 31. The most abundant compounds emitted from the combination of primer C and paint C spread onto a glass plate (μg/m²·h). The relative humidity values indicate the target values of the test chambers.
Test chamber FLEC-cell Compound
20 % 50 % 80 % 20 % 50 % 80 % 1 day hydrocarbon mixture 7500 8500 10500 undecane 2000 2100 2400 hexanal 1300 1600 2400 hexanoic acid 1000 1000 800 2-ethylhexanoic acid 1000 1000 800 7 days hydrocarbon mixture 400 500 750 undecane 70 80 20 hexanal 100 160 280 hexanoic acid 420 560 590 2-ethylhexanoic acid 150 210 260 14 days hydrocarbon mixture 180 250 330 410 310 180 undecane 25 30 15 55 25 5 hexanal 50 90 150 120 110 110 hexanoic acid 310 430 410 480 420 340 2-ethylhexanoic acid 70 120 150 70 85 90

116
The detailed results of the samples collected from the test chambers are presented in Appendix C, Tables C46 to C48, and the detailed results of the samples collected using the FLEC-cell are presented in Table C132. 7.7.3.5 Filler A and plaster A The TVOCSERa of the combination of filler A and plaster A applied onto a glass plate are presented in Figure 56 and the SERa of the most abundant compounds are presented in Table 32. The TVOCSERa of the combination of filler A and plaster A has no clear trend regarding the relative humidity of the storing conditions irrespective of the point of sample collection or the sample collection method. However, what was noted about the influence of relative humidity and the condensation of moisture on the chamber's inner surfaces on the emission process concerning plaster A (Chapter 7.7.2.5) most probably applies also here. Thus, a moisture content close to 100 % hinders the emission of VOCs and the emission process starts only when the relative humidity of the surrounding air is below a critical value. The most abundant single compound emitted at 7 and 14 days is 1,2-propanediol and its SERa is also probably related to the relative humidity of the storing conditions, since its value is quite high already in the RH 20 % chamber at 7 days when the measured relative humidity of the chamber air was approximately 95 %. Since the relative humidity of the RH 50 % chamber has started to decline only three days before the 14 days sample collection point the evaporation of moisture from the sample is probably still quite rapid resulting in a strong emission of 1,2-propanediol. The TVOCSERa-value is also highest at that point for the RH 50 % chamber irrespective of the sample collection method.
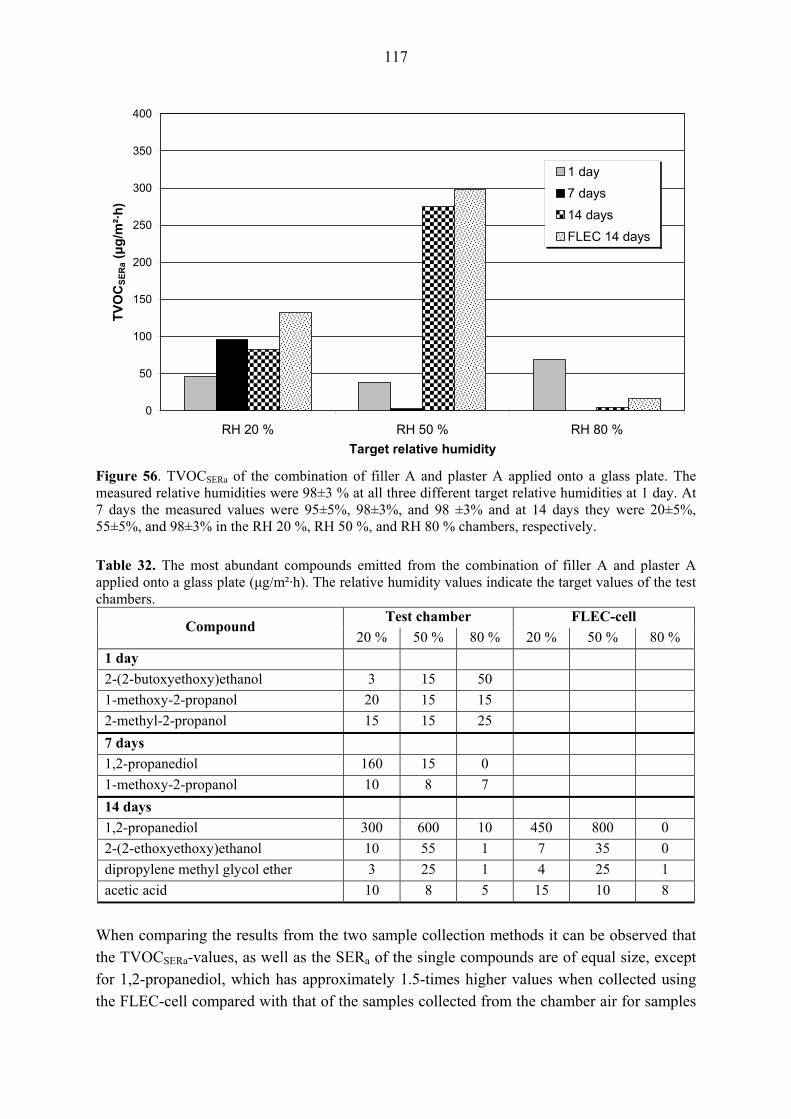
117
0
50
100
150
200
250
300
350
400
RH 20 % RH 50 % RH 80 %Target relative humidity
TVO
CSE
Ra (μg
/m²·h
)
1 day7 days14 daysFLEC 14 days
Figure 56. TVOCSERa of the combination of filler A and plaster A applied onto a glass plate. The measured relative humidities were 98±3 % at all three different target relative humidities at 1 day. At 7 days the measured values were 95±5%, 98±3%, and 98 ±3% and at 14 days they were 20±5%, 55±5%, and 98±3% in the RH 20 %, RH 50 %, and RH 80 % chambers, respectively. Table 32. The most abundant compounds emitted from the combination of filler A and plaster A applied onto a glass plate (μg/m²·h). The relative humidity values indicate the target values of the test chambers.
Test chamber FLEC-cell Compound
20 % 50 % 80 % 20 % 50 % 80 % 1 day 2-(2-butoxyethoxy)ethanol 3 15 50 1-methoxy-2-propanol 20 15 15 2-methyl-2-propanol 15 15 25 7 days 1,2-propanediol 160 15 0 1-methoxy-2-propanol 10 8 7 14 days 1,2-propanediol 300 600 10 450 800 0 2-(2-ethoxyethoxy)ethanol 10 55 1 7 35 0 dipropylene methyl glycol ether 3 25 1 4 25 1 acetic acid 10 8 5 15 10 8
When comparing the results from the two sample collection methods it can be observed that the TVOCSERa-values, as well as the SERa of the single compounds are of equal size, except for 1,2-propanediol, which has approximately 1.5-times higher values when collected using the FLEC-cell compared with that of the samples collected from the chamber air for samples
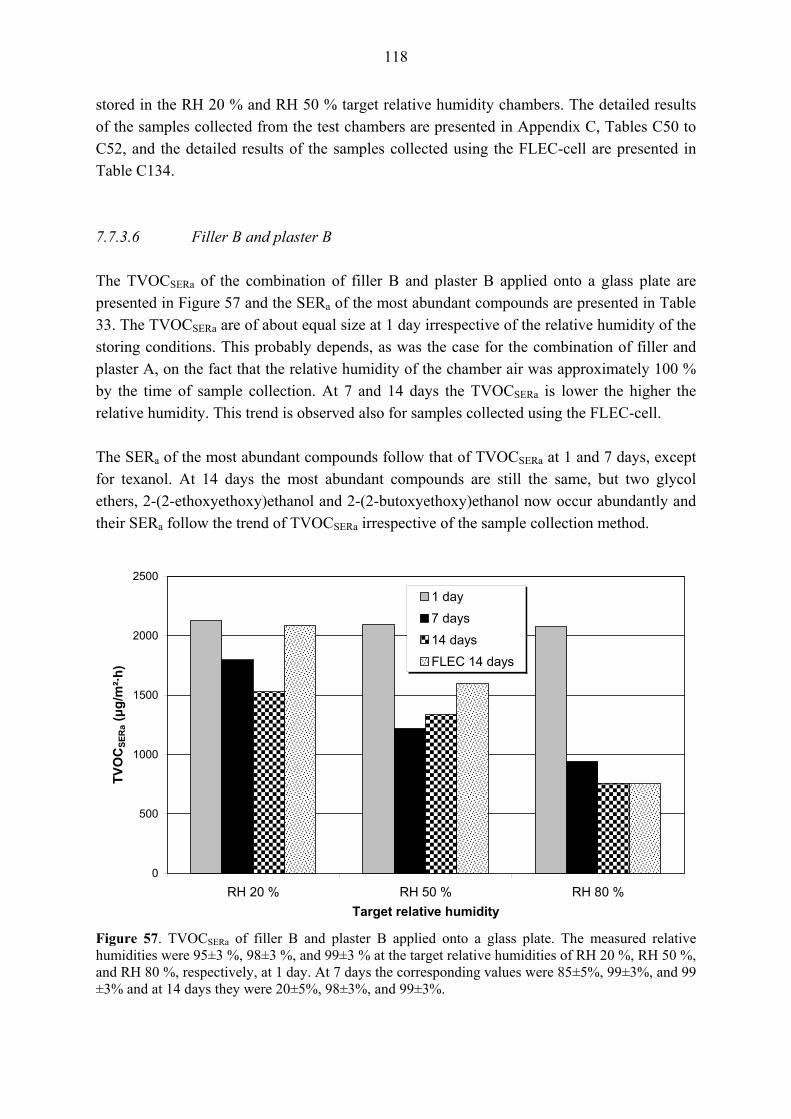
118
stored in the RH 20 % and RH 50 % target relative humidity chambers. The detailed results of the samples collected from the test chambers are presented in Appendix C, Tables C50 to C52, and the detailed results of the samples collected using the FLEC-cell are presented in Table C134. 7.7.3.6 Filler B and plaster B The TVOCSERa of the combination of filler B and plaster B applied onto a glass plate are presented in Figure 57 and the SERa of the most abundant compounds are presented in Table 33. The TVOCSERa are of about equal size at 1 day irrespective of the relative humidity of the storing conditions. This probably depends, as was the case for the combination of filler and plaster A, on the fact that the relative humidity of the chamber air was approximately 100 % by the time of sample collection. At 7 and 14 days the TVOCSERa is lower the higher the relative humidity. This trend is observed also for samples collected using the FLEC-cell. The SERa of the most abundant compounds follow that of TVOCSERa at 1 and 7 days, except for texanol. At 14 days the most abundant compounds are still the same, but two glycol ethers, 2-(2-ethoxyethoxy)ethanol and 2-(2-butoxyethoxy)ethanol now occur abundantly and their SERa follow the trend of TVOCSERa irrespective of the sample collection method.
0
500
1000
1500
2000
2500
RH 20 % RH 50 % RH 80 %Target relative humidity
TVO
CSE
Ra (μg
/m²·h
)
1 day7 days14 daysFLEC 14 days
Figure 57. TVOCSERa of filler B and plaster B applied onto a glass plate. The measured relative humidities were 95±3 %, 98±3 %, and 99±3 % at the target relative humidities of RH 20 %, RH 50 %, and RH 80 %, respectively, at 1 day. At 7 days the corresponding values were 85±5%, 99±3%, and 99 ±3% and at 14 days they were 20±5%, 98±3%, and 99±3%.
119
A comparison of the SERa of the single compounds as well as the TVOCSERa of the two different sample collection methods shows that the values are somewhat higher when using the FLEC-cell compared with the results from the test chambers. The detailed results of the samples collected from the test chambers are presented in Appendix C, Tables C54 to C56, and the detailed results of the samples collected using the FLEC-cell are presented in Table C136. Table 33. The most abundant compounds emitted from the combination of filler B and plaster B applied onto a glass plate (μg/m²·h). The relative humidity values indicate the target values of the test chambers.
Test chamber FLEC-cell Compound
20 % 50 % 80 % 20 % 50 % 80 % 1 day 2-ethyl-1-hexanol 1300 1200 1200 4,4-dimethyl-1,3-oxazolidine 530 520 520 2-methyl-2-propanol 250 210 200 2-ethylhexyl acetate 150 140 140 dimethyl perhydro-1,3-oxazine 90 95 90 7 days 2-ethyl-1-hexanol 450 400 350 4,4-dimethyl-1,3-oxazolidine 740 370 270 texanol 160 150 170 dimethyl perhydro-1,3-oxazine 130 80 60 2-ethylhexyl acetate 120 70 50 14 days 2-ethyl-1-hexanol 100 140 150 150 170 170 4,4-dimethyl-1,3-oxazolidine 580 580 300 800 690 220 texanol 60 150 170 75 150 160 dimethyl perhydro-1,3-oxazine 100 100 50 130 110 50 2-ethylhexyl acetate 15 90 40 210 120 50 2-(2-ethoxyethoxy)ethanol 230 40 10 380 40 6 2-(2-butoxyethoxy)ethanol 210 140 7 310 170 40
7.7.3.6 A 6 mm layer of plaster C The TVOCSERa of the 6 mm layer of plaster C applied onto a glass plate are presented in Figure 58 and the SERa of the most abundant compounds are presented in Table 34. The TVOCSERa is generally very low. The number of chemical groups increases with time, but the SERa-values of the single compounds are still very low. A comparison of the results obtained with the two sample collection methods shows that the results are quite similar. The only exceptions are that the hydrocarbon mixture is only observed in the sample stored at the RH
120
50 % target relative humidity and that acetic acid is present only when samples are collected using the FLEC -cell.
0
50
100
150
200
RH 20 % RH 50 % RH 80 %Target relative humidity
TVO
CSE
Ra (μg
/m²·h
)
1 day7 days14 daysFLEC 14 days
Figure 58. TVOCSERa of a 6 mm layer of plaster C applied onto a glass plate. The measured relative humidities were 99±3 % at all three different target relative humidities at 1 and 7 days. At 14 days they were 95±3 %, 99±3 %, and 99±3 % at the target relative humidities of RH 20 %, RH 50 %, and RH 80 %, respectively. Table 34. The most abundant compounds emitted from the 6 mm layer of plaster C applied onto a glass plate (μg/m²·h). The relative humidity values indicate the target values of the test chambers.
Test chamber FLEC-cell Compound
20 % 50 % 80 % 20 % 50 % 80 % 1 day acetic acid 40 40 45 acetone 15 10 15 7 days all compounds ≤ 4 ≤ 3 ≤ 3 14 days hydrocarbon mixture 50 55 0 0 65 0 acetic acid - - - 25 15 25
A comparison with the emission results from the 3 mm layer of plaster C presented in Chapter 7.7.2.6 shows that the 3 mm layer had no acetic acid-emission at 1 day. The SERa of acetone was also lower. Neither of these two compounds is included, however, in the TVOC-range. The TVOCSERa-values were about the same irrespective of the layer thickness. The hydrocarbon mixture that was observed at 14 days of the 3 mm layer at RH 80 % is now occurring at 14 days at RH 20 % and RH 50 % target relative humidities. Its origin is unknown, but it could be related to changes in the relative humidity, since the relative
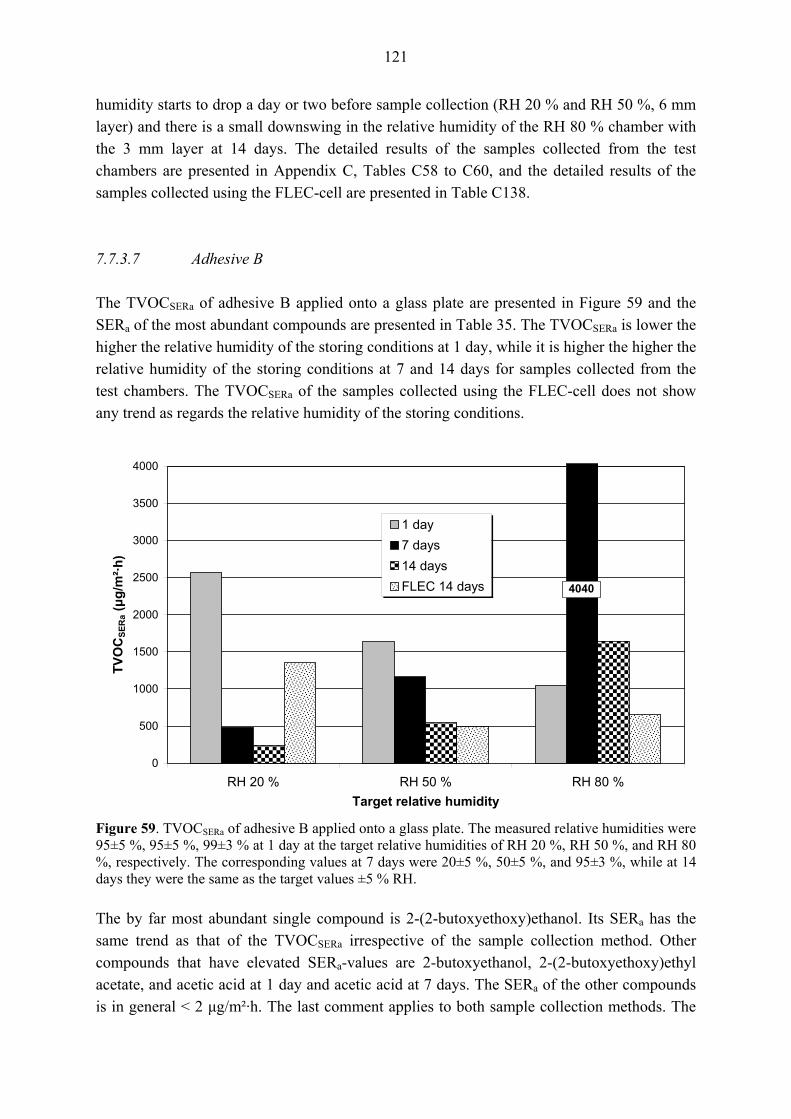
121
humidity starts to drop a day or two before sample collection (RH 20 % and RH 50 %, 6 mm layer) and there is a small downswing in the relative humidity of the RH 80 % chamber with the 3 mm layer at 14 days. The detailed results of the samples collected from the test chambers are presented in Appendix C, Tables C58 to C60, and the detailed results of the samples collected using the FLEC-cell are presented in Table C138. 7.7.3.7 Adhesive B The TVOCSERa of adhesive B applied onto a glass plate are presented in Figure 59 and the SERa of the most abundant compounds are presented in Table 35. The TVOCSERa is lower the higher the relative humidity of the storing conditions at 1 day, while it is higher the higher the relative humidity of the storing conditions at 7 and 14 days for samples collected from the test chambers. The TVOCSERa of the samples collected using the FLEC-cell does not show any trend as regards the relative humidity of the storing conditions.
0
500
1000
1500
2000
2500
3000
3500
4000
RH 20 % RH 50 % RH 80 %Target relative humidity
TVO
CSE
Ra (μg
/m²·h
)
1 day7 days14 daysFLEC 14 days 4040
Figure 59. TVOCSERa of adhesive B applied onto a glass plate. The measured relative humidities were 95±5 %, 95±5 %, 99±3 % at 1 day at the target relative humidities of RH 20 %, RH 50 %, and RH 80 %, respectively. The corresponding values at 7 days were 20±5 %, 50±5 %, and 95±3 %, while at 14 days they were the same as the target values ±5 % RH. The by far most abundant single compound is 2-(2-butoxyethoxy)ethanol. Its SERa has the same trend as that of the TVOCSERa irrespective of the sample collection method. Other compounds that have elevated SERa-values are 2-butoxyethanol, 2-(2-butoxyethoxy)ethyl acetate, and acetic acid at 1 day and acetic acid at 7 days. The SERa of the other compounds is in general < 2 μg/m²·h. The last comment applies to both sample collection methods. The
122
detailed results of the samples collected from the test chambers are presented in Appendix C, Tables C30 to C32, and the detailed results of the samples collected using the FLEC-cell are presented in Table C124. Table 35. The most abundant compound emitted from adhesive B applied onto a glass plate (μg/m²·h). The relative humidity values indicate the target values of the test chambers.
Test chamber FLEC-cell Compound
20 % 50 % 80 % 20 % 50 % 80 % 1 day 2-(2-butoxyethoxy)ethanol 2850 2000 1350 7 days 2-(2-butoxyethoxy)ethanol 790 2140 5890 14 days 2-(2-butoxyethoxy)ethanol 380 940 2450 2440 780 1090
7.7.4 Part III. VOC emissions from material combinations on gypsum board and CSB The materials tested in part III of this study were chosen based on the TVOCSERa-values of the material combinations tested in part II and the TVOCSERa-values of the three adhesives at 14 days. The least and most emitting ones were chosen. The respective TVOCSERa-values are presented in Table 36. Table 36. TVOCSERa-values of materials and material combinations spread onto a glass plate at 14 days. RH indicates the target relative humidities of the test chambers.
Test chamber FLEC-cell Material or material combination
20 % 50 % 80 % 20 % 50 % 80 % Primer A and paint A 1040 1180 1600 1122 1095 2005 Primer B and paint B 20 25 15 16 21 35 Primer A and paint C 410 930 1180 994 818 909 Primer C and paint C 540 840 880 1067 844 538 Adhesive A 45 50 50 - - - Adhesive B 240 540 1640 1350 489 659 Adhesive C 25 50 170 - - - Filler A and plaster A 80 280 5 132 298 16 Filler B and plaster B 1530 1340 760 2086 1598 756 6 mm layer of plaster C 70 70 20 71 60 18
The selected materials and material combinations were, thus, the combination of primer A and paint A, the combination of primer B and paint B, adhesive A, adhesive B, the combination of filler B and plaster B, and plaster C. Even though the TVOCSERa of adhesive A was higher than that of adhesive C at the target relative humidity of 20 % (the measured values were the same as the target values ±5 % RH) the TVOCSERa-values of adhesive A were

123
more even at the different relative humidities of the storing conditions, which is the reason for its selection. 7.7.4.1 The combination of primer A and paint A spread onto gypsum board The TVOCSERa of primer A and paint A spread onto gypsum board are presented in Figure 60 and the SERa of the most abundant compounds are presented in Table 37. The TVOCSERa shows no clear trend regarding the relative humidity of the storing conditions irrespective of the point of sample collection or the sample collection method. However, the SERa of texanol is higher the higher the relative humidity of the storing conditions at 1 day and the same applies to 1,2-propanediol at 14 days when the samples are collected from the test chamber air. Other compounds having SERa > 10 μg/m²·h at 1 day are 1-dodecene, benzaldehyde, acetone, n-butyl acetate, butyl propanoate, and styrene. The SERa of butyl ether is higher the higher the relative humidity, while the trend is the opposite for 2-(2-ethoxyethoxy)ethanol and texanol.
0
200
400
600
800
1000
RH 20 % RH 50 % RH 80 %
Target relative humidity
TVO
CSE
Ra (μg
/m²·h
)
1 day
7 days
14 days
FLEC 14 days
Figure 60. TVOCSERa of the combination of primer A and paint A spread onto gypsum board. The measured relative humidities were 30±5 %, 60±5 %, and 85±5 % at 1 day at the target relative humidities of RH 20 %, RH 50 %, and RH 80 %, respectively. The corresponding values at 7 and 14 days were the same as the target values ±5 % RH.
124
Table 37. The most abundant compounds emitted from the combination of primer A and paint A spread onto gypsum board (μg/m²·h). The relative humidity values indicate the target values of the test chambers.
Test chamber FLEC-cell Compound
20 % 50 % 80 % 20 % 50 % 80 % 1 day 1,2-propanediol 1550 1680 1150 texanol 560 670 870 2-(2-ethoxyethoxy)ethanol 150 140 60 acetic acid 75 230 40 7 days 1,2-propanediol 300 310 450 texanol 400 380 420 14 days 1,2-propanediol 75 160 320 260 170 770 texanol 350 310 350 290 300 390
When comparing the SERa of the single compounds collected with the two sample collection methods it can be observed that the TVOCSERa, as well as the SERa of 1,2-propanediol and texanol is of equal size irrespective of the sample collection method especially for samples stored at the RH 50 % target relative humidity. The SERa of the other compounds observed are in general < 4 μg/m²·h irrespective of the sample collection method or the relative humidity of the storing conditions, except for acetic acid. Its SERa is 86 μg/m²·h for the sample stored at RH 20 % target relative humidity and 24 μg/m²·h for the sample stored at RH 80 % target relative humidity when collected using the FLEC-cell. This is 10 and 40 -times higher than what was observed for the samples collected from the chamber air, respectively. The detailed results of the samples collected from the test chambers are presented in Appendix C, Tables C62 to C64, and the detailed results of the samples collected using the FLEC-cell are presented in Table C140. 7.7.4.2 The combination of primer B and paint B spread onto gypsum board The TVOCSERa of primer B and paint B spread onto gypsum board are presented in Figure 61 and the SERa of the most abundant compounds are presented in Table 38. The TVOCSERa is higher the higher the relative humidity of the storing conditions at 1 day. At 7 and 14 days there is no clear trend regarding the relative humidity, but the TVOCSERa is very low, < 10 μg/m²·h at 7 days. The values at 14 days in Figure 61 are a bit misleading, since they were, except for one measurement, below the detection limit of 30 μg/m³, which corresponds to 14 μg/m²·h irrespective of the sample collection method. The SERa of 1,2-propanediol is higher the higher the relative humidity of the storing conditions, while 2-propanol does not have any clear trend regarding relative humidity at 1

125
day for samples collected from the test chamber air. 2-(2-butoxyethoxy)ethanol is observed only at the target relative humidity of RH 80 %. 2-(2-butoxyethoxy)ethanol and 1,2-propanediol have a SERa > 5 μg/m²·h at the target relative humidity of RH 80 % at 7 days while it is ≤ 2 μg/m²·h for the other compounds. At 14 days the SERa of all compounds, except for acetic acid at RH 50 % and RH 80 %, is ≤ 1 μg/m²·h.
0
20
40
60
80
100
RH 20 % RH 50 % RH 80 %Target relative humidity
TVO
CSE
Ra (μg
/m²·h
)
1 day
7 days
14 days
FLEC 14 days
Figure 61. TVOCSERa of the combination of primer B and paint B spread onto gypsum board. The measured relative humidities were 35±5 %, 60±5 %, and 80±5 % at 1 day at the target relative humidities of RH 20 %, RH 50 %, and RH 80 %, respectively. The corresponding values at 7 and 14 days were the same as the target values ±5 % RH. Table 38. The most abundant compounds emitted from the combination of primer B and paint B spread onto gypsum board (μg/m²·h). The relative humidity values indicate the target values of the test chambers.
Test chamber FLEC-cell Compound
20 % 50 % 80 % 20 % 50 % 80 % 1 day 2-(2-butoxyethoxy)ethanol 0 0 100 1,2-propanediol 0 50 70 2-propanol 20 30 30 7 days 2-(2-butoxyethoxy)ethanol 0 0 18 1,2-propanediol 0 0 9 14 days 1,2-propanediol 0 0 5 1 0 2 acetic acid 1 8 5 0 8 4

126
When comparing the results from the two sample collection methods it can be observed that they are very consistent. However, the concentrations of the different compounds are very low. The detailed results of the samples collected from the test chambers are presented in Appendix C, Tables C66 to C68, and the detailed results of the samples collected using the FLEC-cell are presented in Table C142. 7.7.4.3 Adhesive A applied onto gypsum board The TVOCSERa of adhesive A applied onto gypsum board are presented in Figure 62 and the SERa of the most abundant compounds are presented in Table 39.
0
20
40
60
80
100
RH 20 % RH 50 % RH 80 %Target relative humidity
TVO
CSE
Ra (μg
/m²·h
)
1 day
7 days
14 days
FLEC 14 days
Figure 62. TVOCSERa of adhesive A applied onto gypsum board. The measured relative humidities were 80±5 %, 90±5 %, and 95±3 % at 1 day at the target relative humidities of RH 20 %, RH 50 %, and RH 80 %, respectively. The corresponding values at 7 days were 20±5 %, 50±5 %, and 85±5 %. At 14 days the measured values were the same as the target values ±5 % RH. The TVOCSERa does not show any clear trend regarding the relative humidity of the storing conditions irrespective of the point of sample collection or the sample collection method, and the level is overall very low. Acetic acid is the most abundant single compound, but its SERa-values are also low, being highest for the sample stored at the target relative humidity of 80 %. The detailed results of the samples collected from the test chambers are presented in Appendix C, Tables C70 to C72, and the detailed results of the samples collected using the FLEC-cell are presented in Table C144.
127
Table 39. The most abundant compounds emitted from adhesive A applied onto gypsum board (μg/m²·h). The relative humidity values indicate the target values of the test chambers.
Test chamber FLEC-cell Compound
20 % 50 % 80 % 20 % 50 % 80 % 1 day acetic acid 15 8 15 2-methyl-2-propanol 6 7 10 hexanal 6 6 8 7 days acetic acid 0 3 10 2-methyl-2-propanol - - - hexanal 1 1 1 14 days acetic acid 4 9 15 0 7 15 nonanal 1 1 2 2 2 4 decanal 1 0 1 2 3 6
7.7.4.4 Adhesive B applied onto gypsum board The TVOCSERa of adhesive B applied onto gypsum board are presented in Figure 63 and the SERa of the most abundant compounds are presented in Table 40.
0
50
100
150
200
250
RH 20 % RH 50 % RH 80 %Target relative humidity
TVO
CSE
Ra (μg
/m²·h
)
1 day7 days14 daysFLEC 14 days
Figure 63. TVOCSERa of adhesive B applied onto gypsum board. The measured relative humidities were 85±5 %, 95±5 %, and 98±3 % at 1 day at the target relative humidities of RH 20 %, RH 50 %, and RH 80 %, respectively. The corresponding values at 7 days were 20±5 %, 50±5 %, and 85±5 %. At 14 days the measured values were the same as the target values ±5 % RH.

128
Table 40. The most abundant compounds emitted from adhesive B applied onto gypsum board (μg/m²·h). The relative humidity values indicate the target values of the test chambers.
Test chamber FLEC-cell Compound
20 % 50 % 80 % 20 % 50 % 80 % 1 day 2-(2-butoxyethoxy)ethanol 350 340 290 acetic acid 15 45 15 7 days 2-(2-butoxyethoxy)ethanol 0 4 70 acetic acid 0 6 15 14 days 2-(2-butoxyethoxy)ethanol 0 5 64 0 0 18 acetic acid 5 5 10 0 6 13
The TVOCSERa does not show any clear trend regarding the relative humidity of the storing conditions for samples collected from the test chambers. Moreover, it is elevated at 7 and 14 days only for samples stored in the RH 80 % target relative humidity. The same observation can be made also for samples collected using the FLEC-cell, since the value for the RH 50 % chamber is actually below the detection limit, even though the detection limit value has been used in the calculations. The by far most abundant single compound is 2-(2-butoxyethoxy)ethanol for samples collected from the test chambers. Acetic acid is also quite abundant at all three points of sample collection. These two compounds are also the most abundant ones in the samples collected using the FLEC-cell. The SERa-values for the other compounds not presented in Table 40 are in general very low irrespective of the point of sample collection or the sample collection method. The detailed results of the samples collected from the test chambers are presented in Appendix C, Tables C74 to C76, and the detailed results of the samples collected using the FLEC-cell are presented in Table C146. 7.7.4.5 The combination of primer A and paint A spread onto the combination of filler B and plaster B applied onto CSB The TVOCSERa and the SERa of the most abundant compounds are presented in Table 41. The TVOCSERa-values are of very equal size irrespective of the sample collection method for each respective storing condition. Of the most abundant compounds 1,2-propanediol, 2-(2-butoxyethoxy)ethanol, and texanol stem mainly from the primer and paint, while 4,4-dimethyl-1,3-oxazolidine and 2-ethyl-1-hexanol stem from the filler and plaster. The SERa of 1,2-propanediol and 2-(2-butoxyethoxy)ethanol is lower the higher the relative humidity of the storing conditions, opposite to that of TVOCSERa, while the SERa of texanol, 2-ethyl-1-hexanol and the nitrogen containing compound is higher the higher the relative humidity at 1 day. At 14 days the TVOCSERa and the SERa of all six compounds is higher the higher the
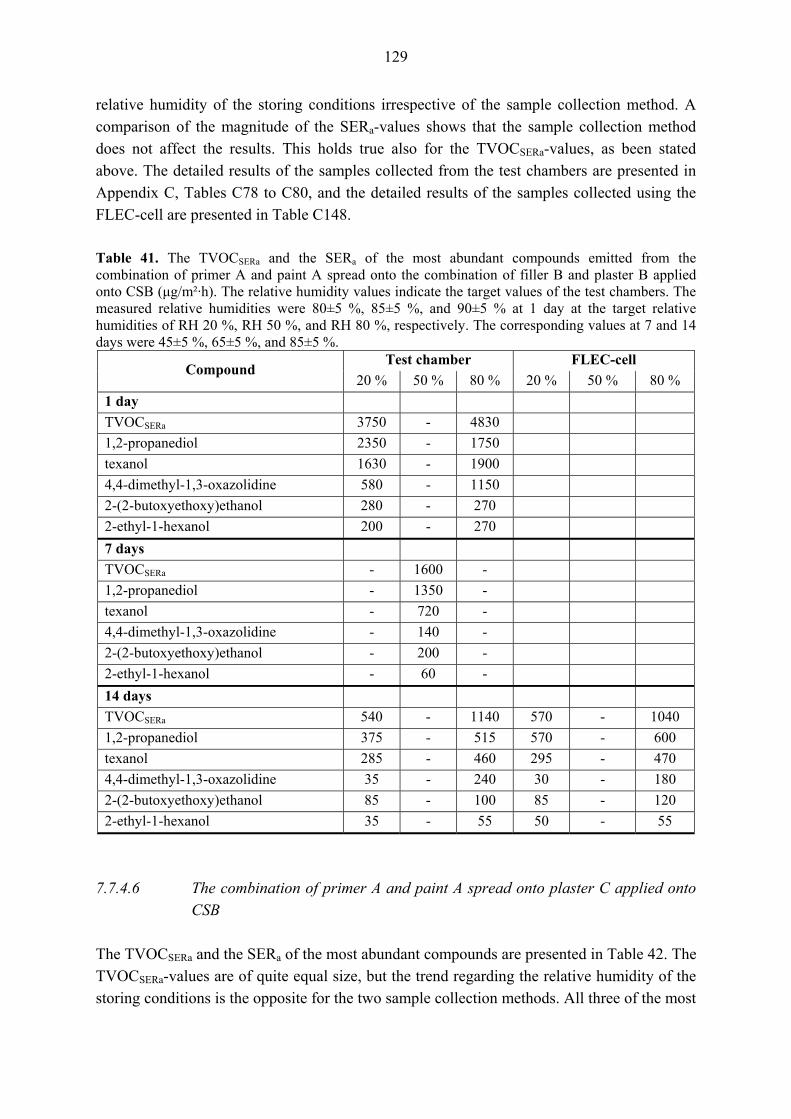
129
relative humidity of the storing conditions irrespective of the sample collection method. A comparison of the magnitude of the SERa-values shows that the sample collection method does not affect the results. This holds true also for the TVOCSERa-values, as been stated above. The detailed results of the samples collected from the test chambers are presented in Appendix C, Tables C78 to C80, and the detailed results of the samples collected using the FLEC-cell are presented in Table C148. Table 41. The TVOCSERa and the SERa of the most abundant compounds emitted from the combination of primer A and paint A spread onto the combination of filler B and plaster B applied onto CSB (μg/m²·h). The relative humidity values indicate the target values of the test chambers. The measured relative humidities were 80±5 %, 85±5 %, and 90±5 % at 1 day at the target relative humidities of RH 20 %, RH 50 %, and RH 80 %, respectively. The corresponding values at 7 and 14 days were 45±5 %, 65±5 %, and 85±5 %.
Test chamber FLEC-cell Compound
20 % 50 % 80 % 20 % 50 % 80 % 1 day TVOCSERa 3750 - 4830 1,2-propanediol 2350 - 1750 texanol 1630 - 1900 4,4-dimethyl-1,3-oxazolidine 580 - 1150 2-(2-butoxyethoxy)ethanol 280 - 270 2-ethyl-1-hexanol 200 - 270 7 days TVOCSERa - 1600 - 1,2-propanediol - 1350 - texanol - 720 - 4,4-dimethyl-1,3-oxazolidine - 140 - 2-(2-butoxyethoxy)ethanol - 200 - 2-ethyl-1-hexanol - 60 - 14 days TVOCSERa 540 - 1140 570 - 1040 1,2-propanediol 375 - 515 570 - 600 texanol 285 - 460 295 - 470 4,4-dimethyl-1,3-oxazolidine 35 - 240 30 - 180 2-(2-butoxyethoxy)ethanol 85 - 100 85 - 120 2-ethyl-1-hexanol 35 - 55 50 - 55
7.7.4.6 The combination of primer A and paint A spread onto plaster C applied onto CSB The TVOCSERa and the SERa of the most abundant compounds are presented in Table 42. The TVOCSERa-values are of quite equal size, but the trend regarding the relative humidity of the storing conditions is the opposite for the two sample collection methods. All three of the most

130
abundant single compounds emitted from primer A and paint A spread onto plaster C applied onto CSB stem from the primer and paint. The SERa of texanol and 1-dodecene is higher the higher the relative humidity of the storing conditions, similar to that of TVOCSERa, while the SERa of 1,2-propanediol is lower the higher the relative humidity at 1 day. At 14 days the TVOCSERa and the SERa of texanol is lower the higher the relative humidity of the storing conditions while the SERa of 1,2-propanediol has the opposite trend. A comparison of the magnitude of the SERa-values shows that the samples collected by using the FLEC-cell have higher SERa-values than those collected from the test chamber air, which contradicts the TVOCSERa-results for samples stored at RH 20 % target relative humidity. The detailed results of the samples collected from the test chambers are presented in Appendix C, Tables C82 to C84, and the detailed results of the samples collected using the FLEC-cell are presented in Table C150. Table 42. The TVOCSERa and the SERa of the most abundant compounds emitted from the combination of primer A and paint A spread onto plaster C applied onto CSB (μg/m²·h). The relative humidity values indicate the target values of the test chambers. The measured relative humidities were 50±5 %, 75±5 %, and 85±5 % at 1 day at the target relative humidities of RH 20 %, RH 50 %, and RH 80 %, respectively. The corresponding values at 7 days were 35±5 %, 65±5 %, and 85±5 % and at 14 days they were 30±5 %, 60±5 %, and 80±5 %.
Test chamber FLEC-cell Compound
20 % 50 % 80 % 20 % 50 % 80 % 1 day TVOCSERa 2620 3120 - 1,2-propanediol 2760 2450 - texanol 1070 1360 - 1-dodecene 90 140 - butyl ether 50 50 - 7 days TVOCSERa - - 940 1,2-propanediol - - 760 texanol - - 570 1-dodecene - - 20 14 days TVOCSERa 450 - 380 390 - 510 1,2-propanediol 140 - 260 220 - 600 texanol 300 - 240 330 - 280 1-dodecene 7 - 10 10 - 10
7.7.4.7 The combination of primer B and paint B spread onto the combination of filler B and plaster B applied onto CSB The TVOCSERa and the SERa of the most abundant compounds are presented in Table 43. The SERa of 2-ethyl-1-hexanol, 2-(2-butoxyethoxy)ethanol, and 4,4-dimethyl-1,3-oxazolidine is
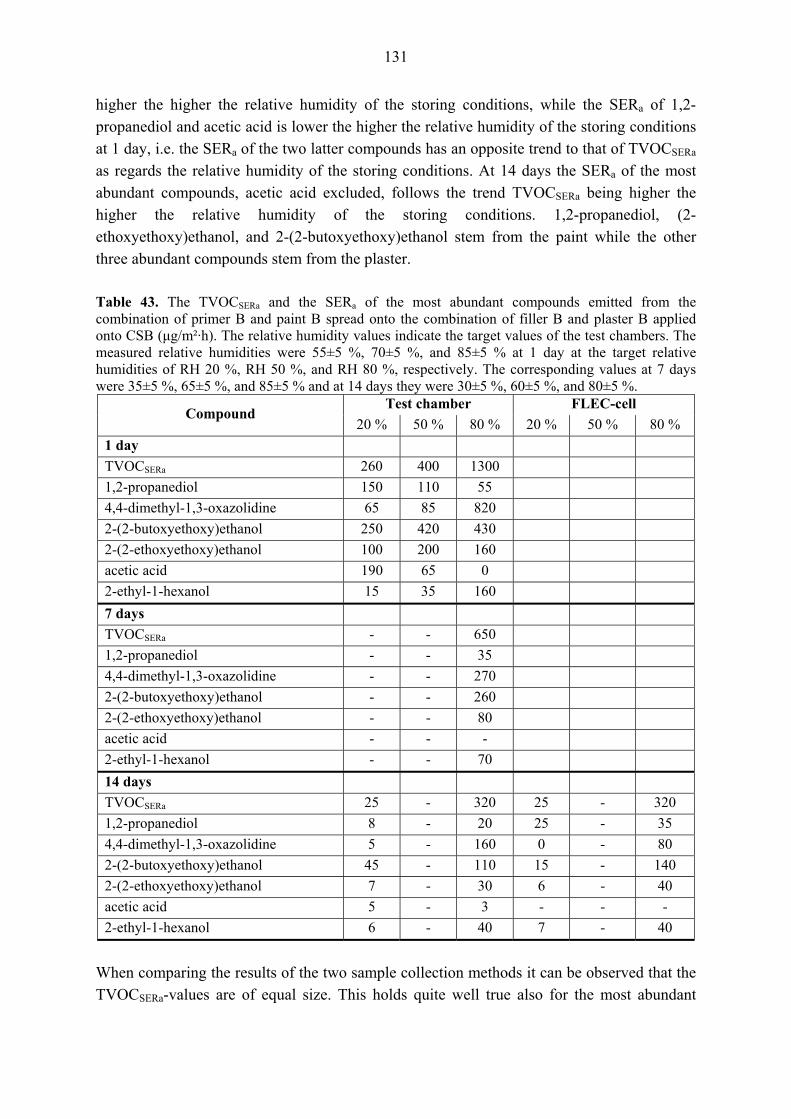
131
higher the higher the relative humidity of the storing conditions, while the SERa of 1,2-propanediol and acetic acid is lower the higher the relative humidity of the storing conditions at 1 day, i.e. the SERa of the two latter compounds has an opposite trend to that of TVOCSERa as regards the relative humidity of the storing conditions. At 14 days the SERa of the most abundant compounds, acetic acid excluded, follows the trend TVOCSERa being higher the higher the relative humidity of the storing conditions. 1,2-propanediol, (2-ethoxyethoxy)ethanol, and 2-(2-butoxyethoxy)ethanol stem from the paint while the other three abundant compounds stem from the plaster. Table 43. The TVOCSERa and the SERa of the most abundant compounds emitted from the combination of primer B and paint B spread onto the combination of filler B and plaster B applied onto CSB (μg/m²·h). The relative humidity values indicate the target values of the test chambers. The measured relative humidities were 55±5 %, 70±5 %, and 85±5 % at 1 day at the target relative humidities of RH 20 %, RH 50 %, and RH 80 %, respectively. The corresponding values at 7 days were 35±5 %, 65±5 %, and 85±5 % and at 14 days they were 30±5 %, 60±5 %, and 80±5 %.
Test chamber FLEC-cell Compound
20 % 50 % 80 % 20 % 50 % 80 % 1 day TVOCSERa 260 400 1300 1,2-propanediol 150 110 55 4,4-dimethyl-1,3-oxazolidine 65 85 820 2-(2-butoxyethoxy)ethanol 250 420 430 2-(2-ethoxyethoxy)ethanol 100 200 160 acetic acid 190 65 0 2-ethyl-1-hexanol 15 35 160 7 days TVOCSERa - - 650 1,2-propanediol - - 35 4,4-dimethyl-1,3-oxazolidine - - 270 2-(2-butoxyethoxy)ethanol - - 260 2-(2-ethoxyethoxy)ethanol - - 80 acetic acid - - - 2-ethyl-1-hexanol - - 70 14 days TVOCSERa 25 - 320 25 - 320 1,2-propanediol 8 - 20 25 - 35 4,4-dimethyl-1,3-oxazolidine 5 - 160 0 - 80 2-(2-butoxyethoxy)ethanol 45 - 110 15 - 140 2-(2-ethoxyethoxy)ethanol 7 - 30 6 - 40 acetic acid 5 - 3 - - - 2-ethyl-1-hexanol 6 - 40 7 - 40
When comparing the results of the two sample collection methods it can be observed that the TVOCSERa-values are of equal size. This holds quite well true also for the most abundant

132
single compounds. The major exception is 4,4-dimethyl-1,3-oxazolidine stored at RH 80 % target relative humidity for which the SERa is twice as high when collected from the chamber air compared with the FLEC-cell. The detailed results of the samples collected from the test chambers are presented in Appendix C, Tables C86 to C88, and the detailed results of the samples collected using the FLEC-cell are presented in Table C152. 7.7.4.8 The combination of primer B and paint B spread onto plaster C applied onto CSB The TVOCSERa and the SERa of the most abundant compounds are presented in Table 44. At 1 day the TVOCSERa and the SERa of 2-(2-butoxyethoxy)ethanol and 2-propanol is higher the higher the relative humidity of the storing conditions, while the trend is the opposite for 1,2-propanediol. At 14 days the TVOCSERa and the SERa of the most abundant compounds is higher the higher the relative humidity of the storing conditions irrespective of the sample collection method. The TVOCSERa and the SERa-values are also of approximately equal size for the two sample collection methods. 2-(2-butoxyethoxy)ethanol and 1,2-propanediol stem from the paint while the origin of 2-propanol, which is quite abundant at 1 day, is unknown. What is also to be noted is that acetic acid is observed in two out of three samples collected using the FLEC-cell while it is not present in the test chamber samples. Table 44. The TVOCSERa and the SERa of the most abundant compounds emitted from the combination of primer B and paint B spread onto plaster C applied onto CSB (μg/m²·h). The relative humidity values indicate the target values of the test chambers. The measured relative humidities were 65±5 %, 80±5 %, and 90±5 % at 1 day at the target relative humidities of RH 20 %, RH 50 %, and RH 80 %, respectively. The corresponding values at 7 days were 50±5 %, 70±5 %, and 85±5 % and at 14 days they were 40±5 %, 65±5 %, and 85±5 %.
Test chamber FLEC-cell Compound
20 % 50 % 80 % 20 % 50 % 80 % 1 day TVOCSERa 55 - 105 1,2-propanediol 120 - 60 2-(2-butoxyethoxy)ethanol 100 - 140 2-propanol 15 - 25 7 days TVOCSERa 10 - - 1,2-propanediol 7 - - 2-(2-butoxyethoxy)ethanol 15 - - 14 days TVOCSERa 5 15 20 10 8 40 1,2-propanediol 2 2 10 1 2 15 2-(2-butoxyethoxy)ethanol 3 7 20 2 5 30 acetic acid - - - 0 25 30
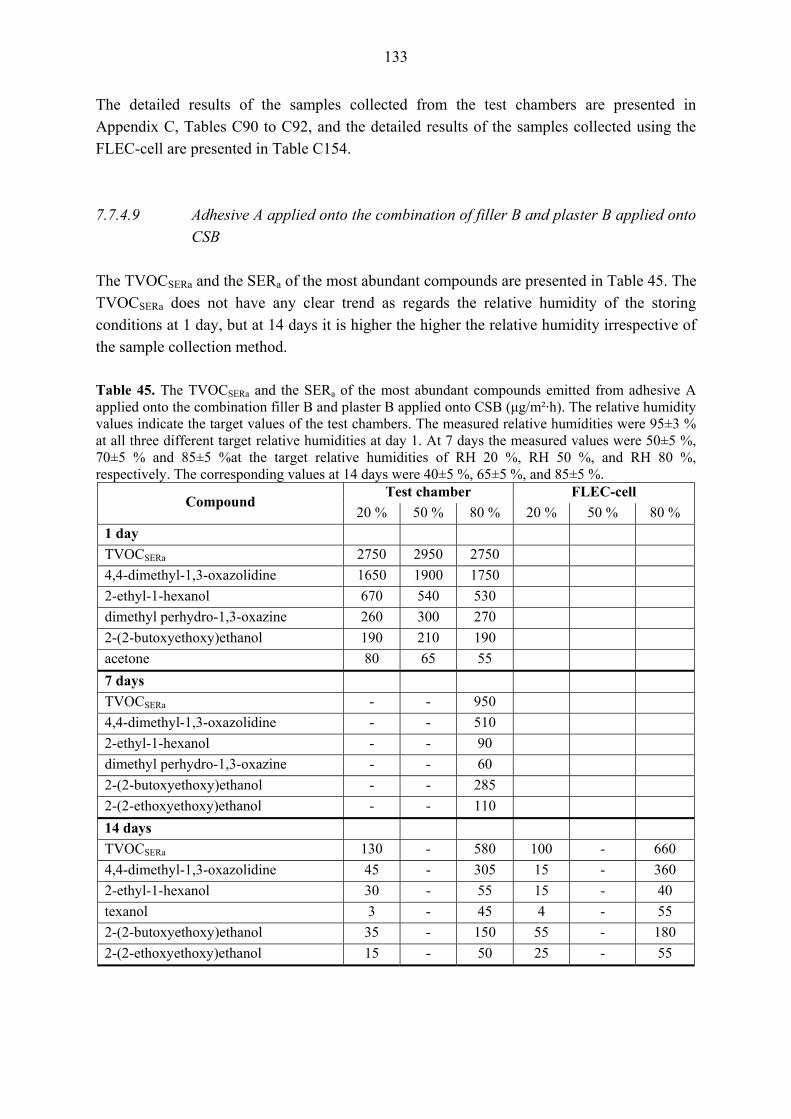
133
The detailed results of the samples collected from the test chambers are presented in Appendix C, Tables C90 to C92, and the detailed results of the samples collected using the FLEC-cell are presented in Table C154. 7.7.4.9 Adhesive A applied onto the combination of filler B and plaster B applied onto CSB The TVOCSERa and the SERa of the most abundant compounds are presented in Table 45. The TVOCSERa does not have any clear trend as regards the relative humidity of the storing conditions at 1 day, but at 14 days it is higher the higher the relative humidity irrespective of the sample collection method. Table 45. The TVOCSERa and the SERa of the most abundant compounds emitted from adhesive A applied onto the combination filler B and plaster B applied onto CSB (μg/m²·h). The relative humidity values indicate the target values of the test chambers. The measured relative humidities were 95±3 % at all three different target relative humidities at day 1. At 7 days the measured values were 50±5 %, 70±5 % and 85±5 %at the target relative humidities of RH 20 %, RH 50 %, and RH 80 %, respectively. The corresponding values at 14 days were 40±5 %, 65±5 %, and 85±5 %.
Test chamber FLEC-cell Compound
20 % 50 % 80 % 20 % 50 % 80 % 1 day TVOCSERa 2750 2950 2750 4,4-dimethyl-1,3-oxazolidine 1650 1900 1750 2-ethyl-1-hexanol 670 540 530 dimethyl perhydro-1,3-oxazine 260 300 270 2-(2-butoxyethoxy)ethanol 190 210 190 acetone 80 65 55 7 days TVOCSERa - - 950 4,4-dimethyl-1,3-oxazolidine - - 510 2-ethyl-1-hexanol - - 90 dimethyl perhydro-1,3-oxazine - - 60 2-(2-butoxyethoxy)ethanol - - 285 2-(2-ethoxyethoxy)ethanol - - 110 14 days TVOCSERa 130 - 580 100 - 660 4,4-dimethyl-1,3-oxazolidine 45 - 305 15 - 360 2-ethyl-1-hexanol 30 - 55 15 - 40 texanol 3 - 45 4 - 55 2-(2-butoxyethoxy)ethanol 35 - 150 55 - 180 2-(2-ethoxyethoxy)ethanol 15 - 50 25 - 55
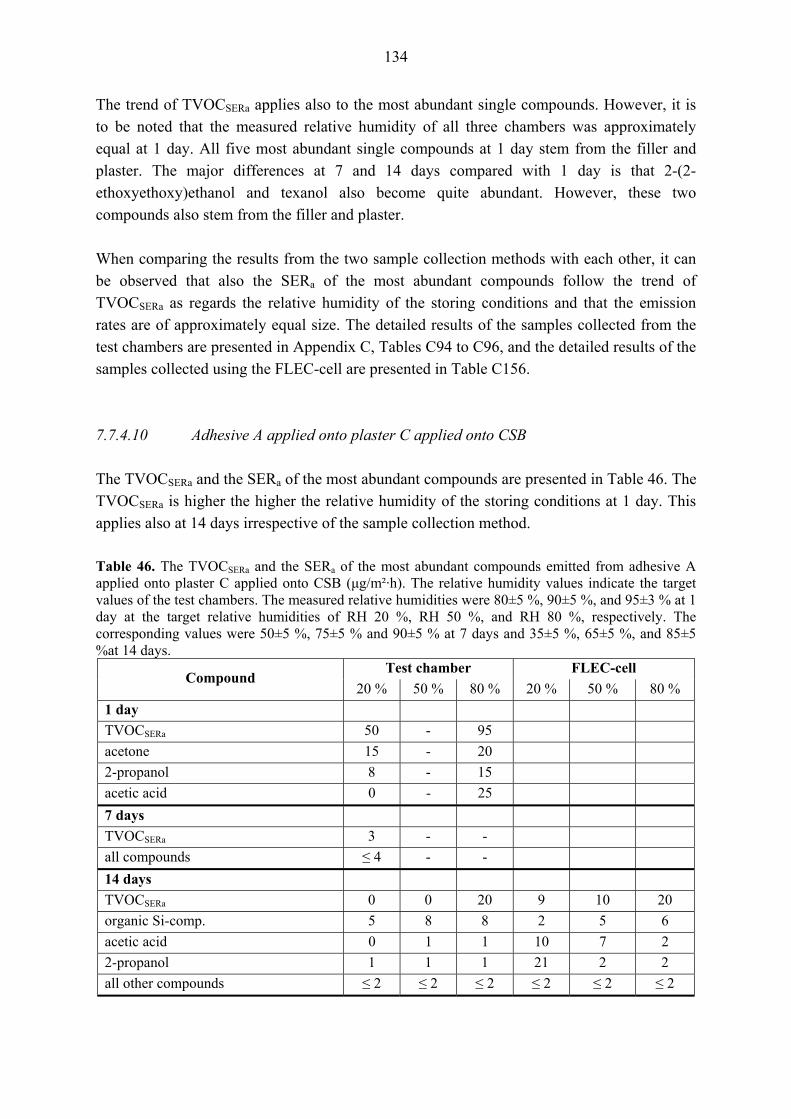
134
The trend of TVOCSERa applies also to the most abundant single compounds. However, it is to be noted that the measured relative humidity of all three chambers was approximately equal at 1 day. All five most abundant single compounds at 1 day stem from the filler and plaster. The major differences at 7 and 14 days compared with 1 day is that 2-(2-ethoxyethoxy)ethanol and texanol also become quite abundant. However, these two compounds also stem from the filler and plaster. When comparing the results from the two sample collection methods with each other, it can be observed that also the SERa of the most abundant compounds follow the trend of TVOCSERa as regards the relative humidity of the storing conditions and that the emission rates are of approximately equal size. The detailed results of the samples collected from the test chambers are presented in Appendix C, Tables C94 to C96, and the detailed results of the samples collected using the FLEC-cell are presented in Table C156. 7.7.4.10 Adhesive A applied onto plaster C applied onto CSB The TVOCSERa and the SERa of the most abundant compounds are presented in Table 46. The TVOCSERa is higher the higher the relative humidity of the storing conditions at 1 day. This applies also at 14 days irrespective of the sample collection method. Table 46. The TVOCSERa and the SERa of the most abundant compounds emitted from adhesive A applied onto plaster C applied onto CSB (μg/m²·h). The relative humidity values indicate the target values of the test chambers. The measured relative humidities were 80±5 %, 90±5 %, and 95±3 % at 1 day at the target relative humidities of RH 20 %, RH 50 %, and RH 80 %, respectively. The corresponding values were 50±5 %, 75±5 % and 90±5 % at 7 days and 35±5 %, 65±5 %, and 85±5 %at 14 days.
Test chamber FLEC-cell Compound
20 % 50 % 80 % 20 % 50 % 80 % 1 day TVOCSERa 50 - 95 acetone 15 - 20 2-propanol 8 - 15 acetic acid 0 - 25 7 days TVOCSERa 3 - - all compounds ≤ 4 - - 14 days TVOCSERa 0 0 20 9 10 20 organic Si-comp. 5 8 8 2 5 6 acetic acid 0 1 1 10 7 2 2-propanol 1 1 1 21 2 2 all other compounds ≤ 2 ≤ 2 ≤ 2 ≤ 2 ≤ 2 ≤ 2

135
Besides the three single compounds emitted at 1 day presented in Table 46, also different aldehydes (especially benzaldehyde, nonanal, and decanal) were quite abundant at that point of time. The origin of 2-propanol is unknown to the author while the other compounds stem from both the adhesive and the plaster. When comparing the results of the two sample collection methods with each other, it can be observed that acetic acid and 2-propanol are quite abundant in the samples collected using the FLEC-cell, while their SERa-values are ≤ 1 when samples are collected from the test chambers. The origin of the organic Si-compound is unknown to the author. The detailed results of the samples collected from the test chambers are presented in Appendix C, Tables C98 to C100, and the detailed results of the samples collected using the FLEC-cell are presented in Table C158. 7.7.4.11 Adhesive B applied onto the combination of filler B and plaster B applied onto CSB The TVOCSERa and the SERa of the most abundant compounds are presented in Table 47. The TVOCSERa is higher at RH 20 % than at RH 80 % target relative humidities at 1 day, while the result is the opposite at 14 days for samples collected from the test chambers. The SERa of 2-(2-butoxyethoxy)ethanol and the nitrogen containing compounds is higher for the samples stored in the RH 20 % target relative humidity chamber than for samples stored in the RH 80 % target relative humidity chamber, as was the case for TVOCSERa. The order of magnitude is the opposite for e.g. 2-ethyl-1-hexanol, acetic acid, ketones and esters. Of the five most abundant single compounds emitted at 1 day 2-(2-butoxyethoxy)ethanol stems mainly from the adhesive, acetic acid from both the adhesive and the combination of filler and plaster, and the other three compounds from the combination of filler and plaster. 2-(2ethoxyethoxy)ethanol that is quite abundant especially at 7 and 14 days stems also from the combination of filler and plaster. When comparing the results from the two sample collection methods with each other, it can be observed that the results are quite similar. The main difference is that the SERa of 2-(2-butoxyethoxy)ethanol is almost three times higher when collected using the FLEC-cell compared with the sample collected from the test chamber for samples stored at the RH 20 % target relative humidity. The detailed results of the samples collected from the test chambers are presented in Appendix C, Tables C102 to C104, and the detailed results of the samples collected using the FLEC-cell are presented in Table C160.
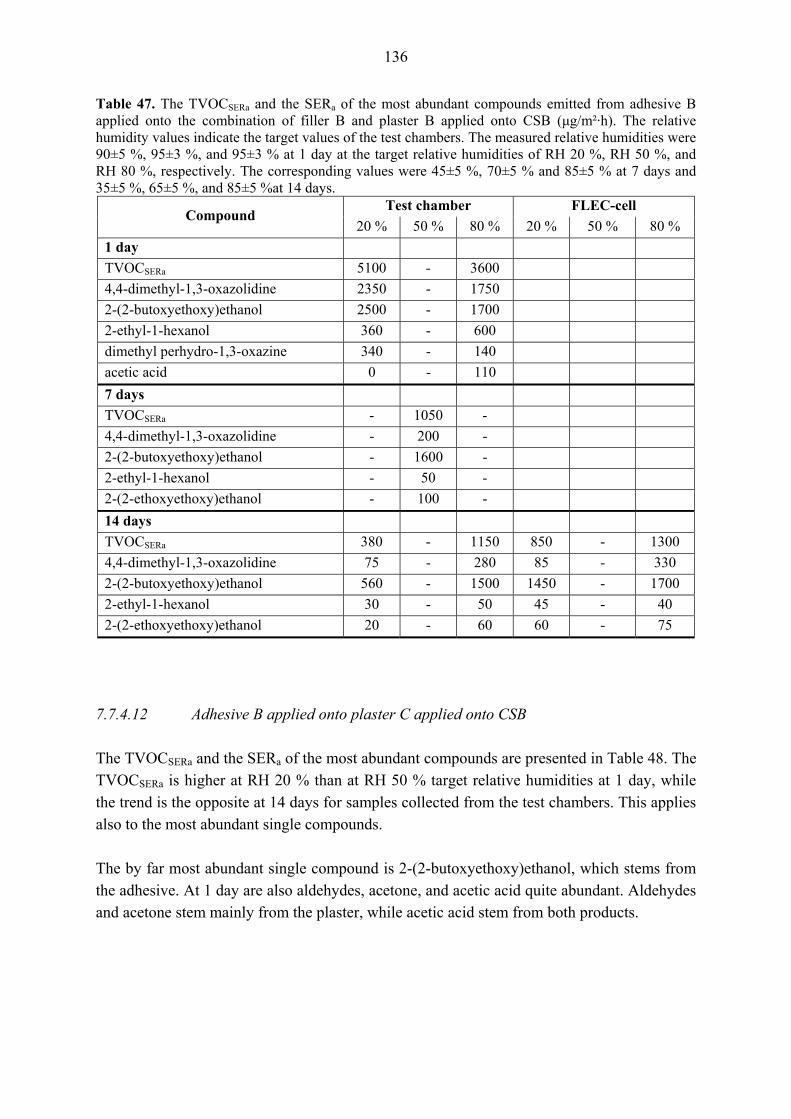
136
Table 47. The TVOCSERa and the SERa of the most abundant compounds emitted from adhesive B applied onto the combination of filler B and plaster B applied onto CSB (μg/m²·h). The relative humidity values indicate the target values of the test chambers. The measured relative humidities were 90±5 %, 95±3 %, and 95±3 % at 1 day at the target relative humidities of RH 20 %, RH 50 %, and RH 80 %, respectively. The corresponding values were 45±5 %, 70±5 % and 85±5 % at 7 days and 35±5 %, 65±5 %, and 85±5 %at 14 days.
Test chamber FLEC-cell Compound
20 % 50 % 80 % 20 % 50 % 80 % 1 day TVOCSERa 5100 - 3600 4,4-dimethyl-1,3-oxazolidine 2350 - 1750 2-(2-butoxyethoxy)ethanol 2500 - 1700 2-ethyl-1-hexanol 360 - 600 dimethyl perhydro-1,3-oxazine 340 - 140 acetic acid 0 - 110 7 days TVOCSERa - 1050 - 4,4-dimethyl-1,3-oxazolidine - 200 - 2-(2-butoxyethoxy)ethanol - 1600 - 2-ethyl-1-hexanol - 50 - 2-(2-ethoxyethoxy)ethanol - 100 - 14 days TVOCSERa 380 - 1150 850 - 1300 4,4-dimethyl-1,3-oxazolidine 75 - 280 85 - 330 2-(2-butoxyethoxy)ethanol 560 - 1500 1450 - 1700 2-ethyl-1-hexanol 30 - 50 45 - 40 2-(2-ethoxyethoxy)ethanol 20 - 60 60 - 75
7.7.4.12 Adhesive B applied onto plaster C applied onto CSB The TVOCSERa and the SERa of the most abundant compounds are presented in Table 48. The TVOCSERa is higher at RH 20 % than at RH 50 % target relative humidities at 1 day, while the trend is the opposite at 14 days for samples collected from the test chambers. This applies also to the most abundant single compounds. The by far most abundant single compound is 2-(2-butoxyethoxy)ethanol, which stems from the adhesive. At 1 day are also aldehydes, acetone, and acetic acid quite abundant. Aldehydes and acetone stem mainly from the plaster, while acetic acid stem from both products.
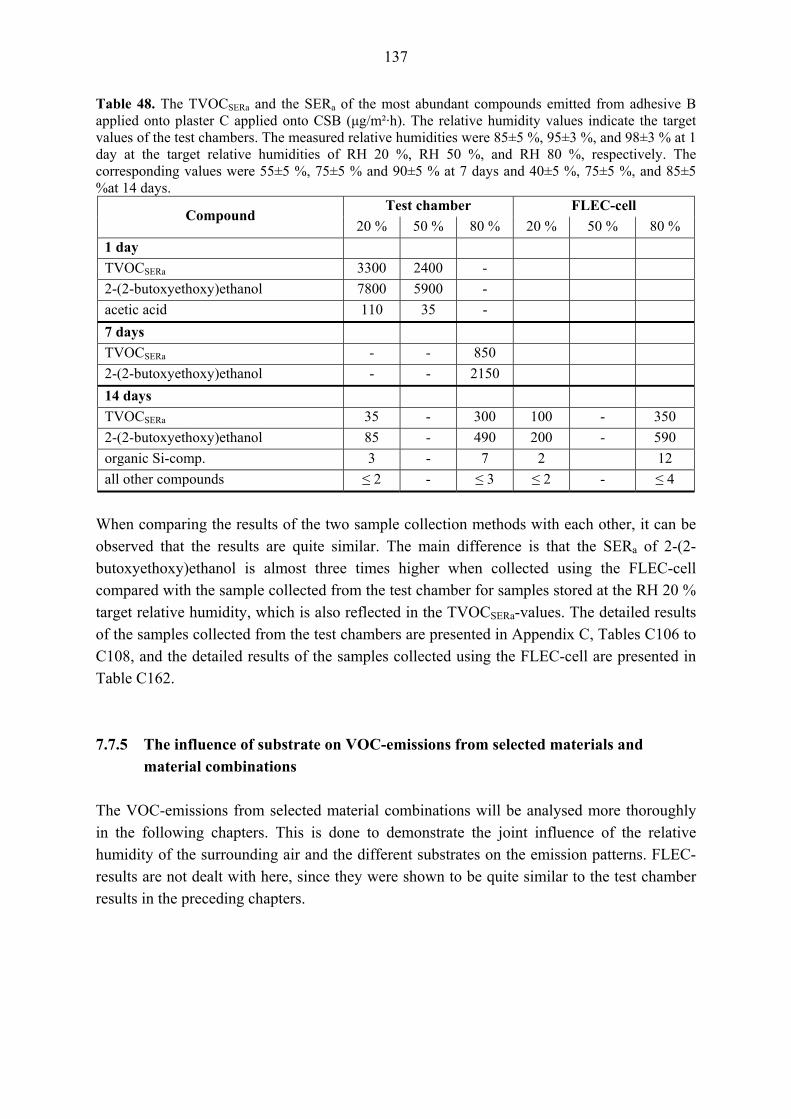
137
Table 48. The TVOCSERa and the SERa of the most abundant compounds emitted from adhesive B applied onto plaster C applied onto CSB (μg/m²·h). The relative humidity values indicate the target values of the test chambers. The measured relative humidities were 85±5 %, 95±3 %, and 98±3 % at 1 day at the target relative humidities of RH 20 %, RH 50 %, and RH 80 %, respectively. The corresponding values were 55±5 %, 75±5 % and 90±5 % at 7 days and 40±5 %, 75±5 %, and 85±5 %at 14 days.
Test chamber FLEC-cell Compound
20 % 50 % 80 % 20 % 50 % 80 % 1 day TVOCSERa 3300 2400 - 2-(2-butoxyethoxy)ethanol 7800 5900 - acetic acid 110 35 - 7 days TVOCSERa - - 850 2-(2-butoxyethoxy)ethanol - - 2150 14 days TVOCSERa 35 - 300 100 - 350 2-(2-butoxyethoxy)ethanol 85 - 490 200 - 590 organic Si-comp. 3 - 7 2 12 all other compounds ≤ 2 - ≤ 3 ≤ 2 - ≤ 4
When comparing the results of the two sample collection methods with each other, it can be observed that the results are quite similar. The main difference is that the SERa of 2-(2-butoxyethoxy)ethanol is almost three times higher when collected using the FLEC-cell compared with the sample collected from the test chamber for samples stored at the RH 20 % target relative humidity, which is also reflected in the TVOCSERa-values. The detailed results of the samples collected from the test chambers are presented in Appendix C, Tables C106 to C108, and the detailed results of the samples collected using the FLEC-cell are presented in Table C162. 7.7.5 The influence of substrate on VOC-emissions from selected materials and material combinations The VOC-emissions from selected material combinations will be analysed more thoroughly in the following chapters. This is done to demonstrate the joint influence of the relative humidity of the surrounding air and the different substrates on the emission patterns. FLEC-results are not dealt with here, since they were shown to be quite similar to the test chamber results in the preceding chapters.

138
7.7.5.1 Paint A and the combination of primer A and paint A spread onto a glass plate The TVOCSERa-values and the SERa of the most abundant compounds emitted from paint A and the combination of primer A and paint A spread onto glass plates at 1 and 14 days are presented in Table 49. When comparing the results of paint A with those of the combination of primer A and paint A, it is observed that the trend of a higher TVOCSERa-value at a higher relative humidity applies for all other cases except for the combination of primer and paint at day one. The most abundant species are also roughly the same as regards emitted single compounds and chemical groups at 1 day, but the scatter is bigger at 14 days. The main difference is in the SERa-values, which are one to two orders of magnitude higher for the combination of primer and paint compared to the single paint layer even though both the primer and paint have been classified as low-emitting according to the Finnish classification of indoor climate (CIC 2001). Table 49. The major emissions from paint A and the combination of primer A and paint A spread onto glass plates, (μg/m²·h). The relative humidity indicates the target relative humidity of the test chambers. The measured values for paint A were 20±5 %, 50±5 %, and 85±2 % at 1 day and at 14 days they were the same as the target relative humidities ±5% RH. The corresponding values for the combination of primer A and paint A were 20±5 %, 55±5 %, and 90±5 % at 1 day and the same as the target relative humidities ±5% RH at 14 days.
Relative humidity (%) Material Compound 20 50 80
Paint A TVOC 600 850 940 1 day 1-dodecene 80 110 210 hydrocarbarbon mixture 260 300 390 1,2-propanediol 570 800 560 2-(2-ethoxyethoxy)ethanol 130 200 200 texanol 13 14 19 Paint A TVOC 15 20 30 14 days 1,2-propanediol 14 2 2 1-dodecene 4 5 5 texanol 3 4 4 Primer and paint A TVOC 6470 10400 6730 1 day 1-dodecene 75 110 190 hydrocarbarbon mixture - - - 1,2-propanediol 3650 5500 2770 2-(2-ethoxyethoxy)ethanol 65 115 60 2-(2-butoxyethoxy)ethanol 11 165 200 texanol 1680 1800 2020 Primer and paint A TVOC 1040 1180 1600 14 days 1,2-propanediol 295 230 630 1-dodecene 5 5 4 texanol 930 1020 1030
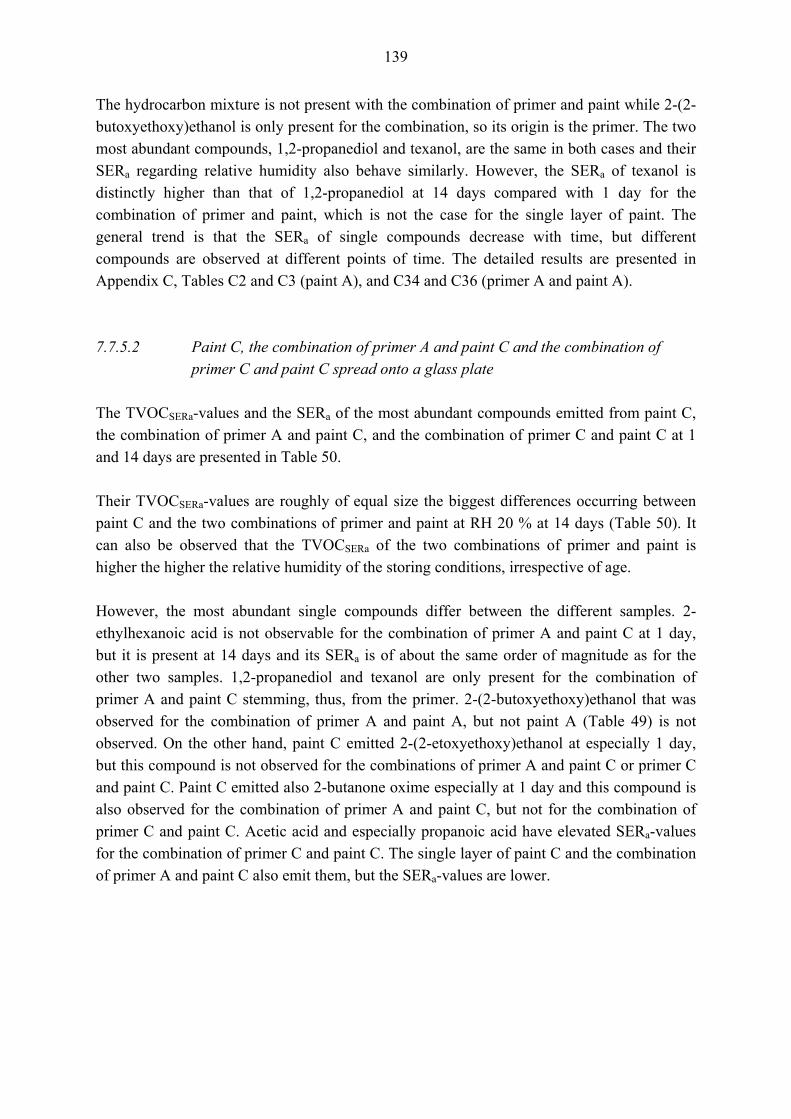
139
The hydrocarbon mixture is not present with the combination of primer and paint while 2-(2-butoxyethoxy)ethanol is only present for the combination, so its origin is the primer. The two most abundant compounds, 1,2-propanediol and texanol, are the same in both cases and their SERa regarding relative humidity also behave similarly. However, the SERa of texanol is distinctly higher than that of 1,2-propanediol at 14 days compared with 1 day for the combination of primer and paint, which is not the case for the single layer of paint. The general trend is that the SERa of single compounds decrease with time, but different compounds are observed at different points of time. The detailed results are presented in Appendix C, Tables C2 and C3 (paint A), and C34 and C36 (primer A and paint A). 7.7.5.2 Paint C, the combination of primer A and paint C and the combination of primer C and paint C spread onto a glass plate The TVOCSERa-values and the SERa of the most abundant compounds emitted from paint C, the combination of primer A and paint C, and the combination of primer C and paint C at 1 and 14 days are presented in Table 50. Their TVOCSERa-values are roughly of equal size the biggest differences occurring between paint C and the two combinations of primer and paint at RH 20 % at 14 days (Table 50). It can also be observed that the TVOCSERa of the two combinations of primer and paint is higher the higher the relative humidity of the storing conditions, irrespective of age. However, the most abundant single compounds differ between the different samples. 2-ethylhexanoic acid is not observable for the combination of primer A and paint C at 1 day, but it is present at 14 days and its SERa is of about the same order of magnitude as for the other two samples. 1,2-propanediol and texanol are only present for the combination of primer A and paint C stemming, thus, from the primer. 2-(2-butoxyethoxy)ethanol that was observed for the combination of primer A and paint A, but not paint A (Table 49) is not observed. On the other hand, paint C emitted 2-(2-etoxyethoxy)ethanol at especially 1 day, but this compound is not observed for the combinations of primer A and paint C or primer C and paint C. Paint C emitted also 2-butanone oxime especially at 1 day and this compound is also observed for the combination of primer A and paint C, but not for the combination of primer C and paint C. Acetic acid and especially propanoic acid have elevated SERa-values for the combination of primer C and paint C. The single layer of paint C and the combination of primer A and paint C also emit them, but the SERa-values are lower.
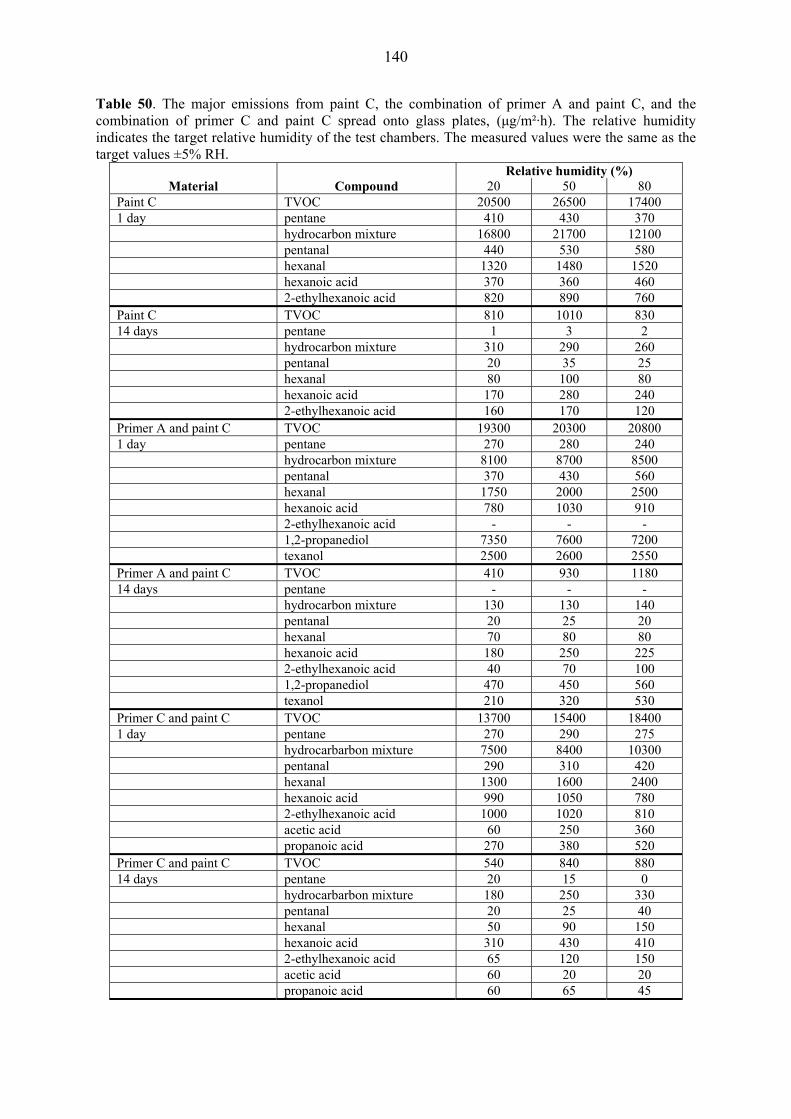
140
Table 50. The major emissions from paint C, the combination of primer A and paint C, and the combination of primer C and paint C spread onto glass plates, (μg/m²·h). The relative humidity indicates the target relative humidity of the test chambers. The measured values were the same as the target values ±5% RH.
Relative humidity (%) Material Compound 20 50 80
Paint C TVOC 20500 26500 17400 1 day pentane 410 430 370 hydrocarbon mixture 16800 21700 12100 pentanal 440 530 580 hexanal 1320 1480 1520 hexanoic acid 370 360 460 2-ethylhexanoic acid 820 890 760 Paint C TVOC 810 1010 830 14 days pentane 1 3 2 hydrocarbon mixture 310 290 260 pentanal 20 35 25 hexanal 80 100 80 hexanoic acid 170 280 240 2-ethylhexanoic acid 160 170 120 Primer A and paint C TVOC 19300 20300 20800 1 day pentane 270 280 240 hydrocarbon mixture 8100 8700 8500 pentanal 370 430 560 hexanal 1750 2000 2500 hexanoic acid 780 1030 910 2-ethylhexanoic acid - - - 1,2-propanediol 7350 7600 7200 texanol 2500 2600 2550 Primer A and paint C TVOC 410 930 1180 14 days pentane - - - hydrocarbon mixture 130 130 140 pentanal 20 25 20 hexanal 70 80 80 hexanoic acid 180 250 225 2-ethylhexanoic acid 40 70 100 1,2-propanediol 470 450 560 texanol 210 320 530 Primer C and paint C TVOC 13700 15400 18400 1 day pentane 270 290 275 hydrocarbarbon mixture 7500 8400 10300 pentanal 290 310 420 hexanal 1300 1600 2400 hexanoic acid 990 1050 780 2-ethylhexanoic acid 1000 1020 810 acetic acid 60 250 360 propanoic acid 270 380 520 Primer C and paint C TVOC 540 840 880 14 days pentane 20 15 0 hydrocarbarbon mixture 180 250 330 pentanal 20 25 40 hexanal 50 90 150 hexanoic acid 310 430 410 2-ethylhexanoic acid 65 120 150 acetic acid 60 20 20 propanoic acid 60 65 45
141
Pentanal and hexanal are the only compounds occurring in all samples having higher SERa-values the higher the relative humidity of the storing conditions, except for paint C at 14 days. The same trend is observed also for texanol at 14 days as regards relative humidity. Other phenomena that can be observed are that even though the SERa of the hydrocarbon mixture of the material combinations are lower than that of paint C, they still contain many higher boiling (≥ decane) aliphatic hydrocarbons with high SERa-values. It can also be observed that the amount of higher boiling aldehydes increases with age especially for the combined products. The highest boiling aldehyde at 1 day is octanal and 2-octenal, while nonanal and higher boiling aldehydes occur at 7 and 14 days. The general trend is that the SERa-values of the single compounds decrease with age and the same compounds are observed at different ages, contrary to what was observed for the combination of primer A and paint A. The detailed results are presented in Appendix C, Tables C6 and C7 (paint A), C42 and C44 (primer A and paint C), and C46 and C48 (primer C and paint C). 7.7.5.3 Adhesives A and B applied onto a glass plate The TVOCSERa-values and the SERa of the most abundant compounds emitted from adhesives A and B applied onto glass plates at 1 and 14 days are presented in Table 51. The TVOCSERa of adhesive A is of equal size irrespective of the relative humidity of the storing conditions or the point of sample collection. The most abundant single compound is acetic acid. Its SERa is higher the higher the relative humidity of the storing conditions at 14 days, but does not show any distinct trend at 1 day. Another abundant compound at 1 day is propyl benzoate. The TVOCSERa of adhesive B spread onto glass plates is higher the lower the relative humidity of the storing conditions at 1 day and higher the higher the relative humidity at 14 days. This same trend can also be observed for, by far, the most abundant single compound, 2-(2-butoxyethoxy)ethanol. The SERa of acetic acid is higher at 7 days than at 1 day, but is depleted by 14 days. Even though both adhesives are water-borne PVAc-dispersion products, their emission patterns are quite different. The general trend is that the SERa-values of the single compounds decrease with age, except for acetic acid (see above), and different compounds are being emitted at different ages and relative humidities. This applies to both adhesives, but what is noteworthy is that the SERa-values of the other occurring compounds, are generally ≤ 3 μg/m²·h. The detailed results are presented in Appendix C, Tables C10 and C11 (adhesive A), and C30 and C32 (adhesive B).
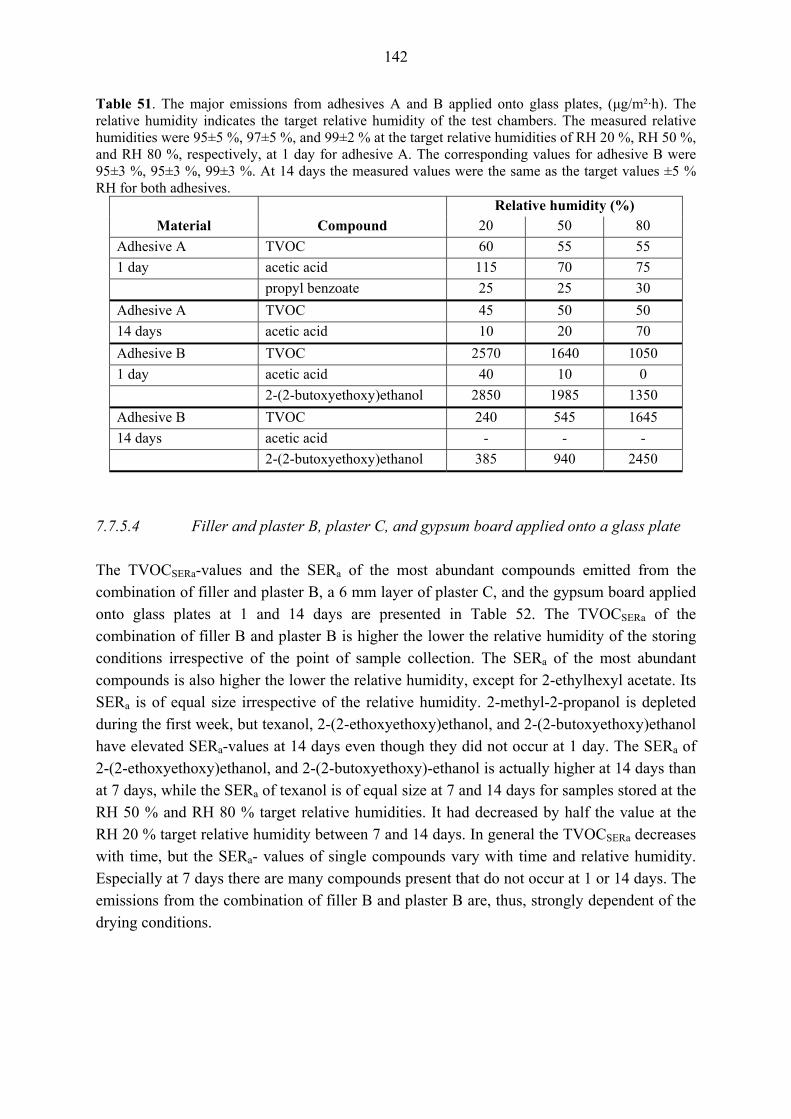
142
Table 51. The major emissions from adhesives A and B applied onto glass plates, (μg/m²·h). The relative humidity indicates the target relative humidity of the test chambers. The measured relative humidities were 95±5 %, 97±5 %, and 99±2 % at the target relative humidities of RH 20 %, RH 50 %, and RH 80 %, respectively, at 1 day for adhesive A. The corresponding values for adhesive B were 95±3 %, 95±3 %, 99±3 %. At 14 days the measured values were the same as the target values ±5 % RH for both adhesives.
Relative humidity (%) Material Compound 20 50 80
Adhesive A TVOC 60 55 55 1 day acetic acid 115 70 75 propyl benzoate 25 25 30 Adhesive A TVOC 45 50 50 14 days acetic acid 10 20 70 Adhesive B TVOC 2570 1640 1050 1 day acetic acid 40 10 0 2-(2-butoxyethoxy)ethanol 2850 1985 1350 Adhesive B TVOC 240 545 1645 14 days acetic acid - - - 2-(2-butoxyethoxy)ethanol 385 940 2450
7.7.5.4 Filler and plaster B, plaster C, and gypsum board applied onto a glass plate The TVOCSERa-values and the SERa of the most abundant compounds emitted from the combination of filler and plaster B, a 6 mm layer of plaster C, and the gypsum board applied onto glass plates at 1 and 14 days are presented in Table 52. The TVOCSERa of the combination of filler B and plaster B is higher the lower the relative humidity of the storing conditions irrespective of the point of sample collection. The SERa of the most abundant compounds is also higher the lower the relative humidity, except for 2-ethylhexyl acetate. Its SERa is of equal size irrespective of the relative humidity. 2-methyl-2-propanol is depleted during the first week, but texanol, 2-(2-ethoxyethoxy)ethanol, and 2-(2-butoxyethoxy)ethanol have elevated SERa-values at 14 days even though they did not occur at 1 day. The SERa of 2-(2-ethoxyethoxy)ethanol, and 2-(2-butoxyethoxy)-ethanol is actually higher at 14 days than at 7 days, while the SERa of texanol is of equal size at 7 and 14 days for samples stored at the RH 50 % and RH 80 % target relative humidities. It had decreased by half the value at the RH 20 % target relative humidity between 7 and 14 days. In general the TVOCSERa decreases with time, but the SERa- values of single compounds vary with time and relative humidity. Especially at 7 days there are many compounds present that do not occur at 1 or 14 days. The emissions from the combination of filler B and plaster B are, thus, strongly dependent of the drying conditions.
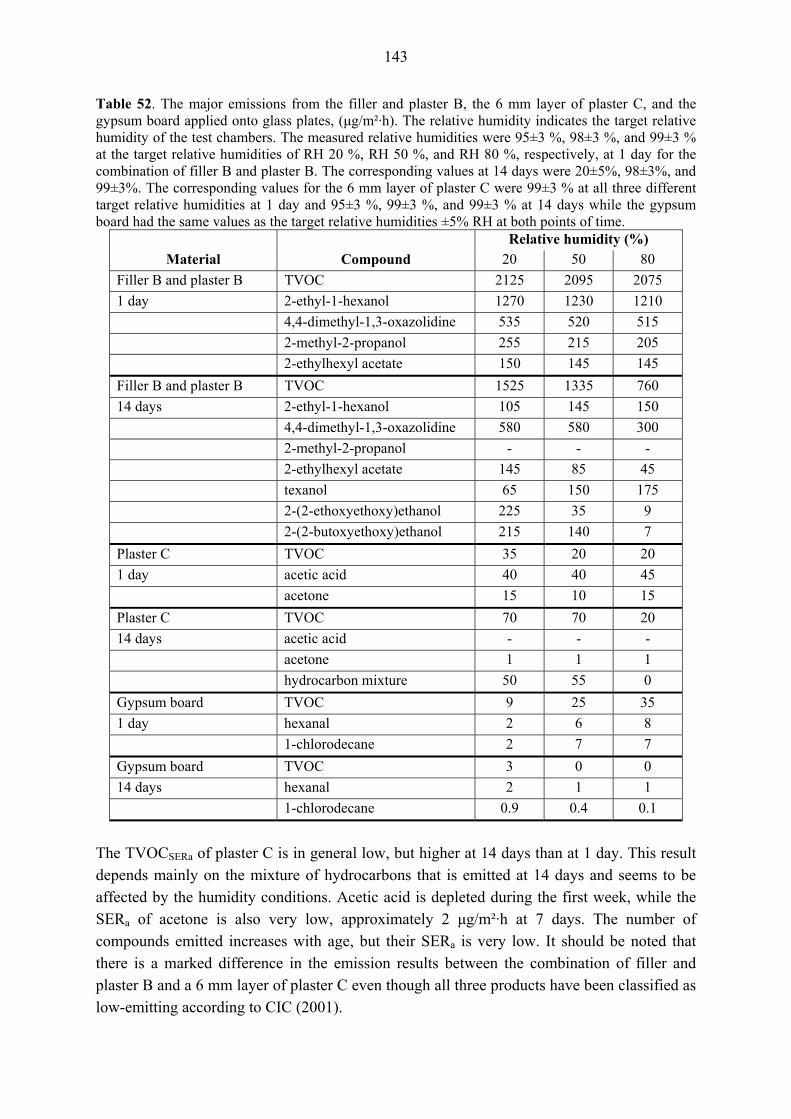
143
Table 52. The major emissions from the filler and plaster B, the 6 mm layer of plaster C, and the gypsum board applied onto glass plates, (μg/m²·h). The relative humidity indicates the target relative humidity of the test chambers. The measured relative humidities were 95±3 %, 98±3 %, and 99±3 % at the target relative humidities of RH 20 %, RH 50 %, and RH 80 %, respectively, at 1 day for the combination of filler B and plaster B. The corresponding values at 14 days were 20±5%, 98±3%, and 99±3%. The corresponding values for the 6 mm layer of plaster C were 99±3 % at all three different target relative humidities at 1 day and 95±3 %, 99±3 %, and 99±3 % at 14 days while the gypsum board had the same values as the target relative humidities ±5% RH at both points of time.
Relative humidity (%) Material Compound 20 50 80
Filler B and plaster B TVOC 2125 2095 2075 1 day 2-ethyl-1-hexanol 1270 1230 1210 4,4-dimethyl-1,3-oxazolidine 535 520 515 2-methyl-2-propanol 255 215 205 2-ethylhexyl acetate 150 145 145 Filler B and plaster B TVOC 1525 1335 760 14 days 2-ethyl-1-hexanol 105 145 150 4,4-dimethyl-1,3-oxazolidine 580 580 300 2-methyl-2-propanol - - - 2-ethylhexyl acetate 145 85 45 texanol 65 150 175 2-(2-ethoxyethoxy)ethanol 225 35 9 2-(2-butoxyethoxy)ethanol 215 140 7 Plaster C TVOC 35 20 20 1 day acetic acid 40 40 45 acetone 15 10 15 Plaster C TVOC 70 70 20 14 days acetic acid - - - acetone 1 1 1 hydrocarbon mixture 50 55 0 Gypsum board TVOC 9 25 35 1 day hexanal 2 6 8 1-chlorodecane 2 7 7 Gypsum board TVOC 3 0 0 14 days hexanal 2 1 1 1-chlorodecane 0.9 0.4 0.1
The TVOCSERa of plaster C is in general low, but higher at 14 days than at 1 day. This result depends mainly on the mixture of hydrocarbons that is emitted at 14 days and seems to be affected by the humidity conditions. Acetic acid is depleted during the first week, while the SERa of acetone is also very low, approximately 2 μg/m²·h at 7 days. The number of compounds emitted increases with age, but their SERa is very low. It should be noted that there is a marked difference in the emission results between the combination of filler and plaster B and a 6 mm layer of plaster C even though all three products have been classified as low-emitting according to CIC (2001).

144
The TVOCSERa of the gypsum board is also very low. It is higher the higher the relative humidity of the storing conditions at 1 day, but on the whole it is of equal size compared with plaster C. The gypsum board adsorbed moisture from the surroundings at RH 80 %, but this did not seem to affect its emissions. The compounds emitted at different points of time and at different relative humidities vary slightly, but their SERa-values are very low. The detailed results are presented in Appendix C, Tables C54 and C56 (filler B and plaster B), C58 and C60 (plaster C), and C26 and C27 (gypsum board). 7.7.5.5 Primer and paint A and primer and paint B spread onto glass and gypsum board The measured relative humidity values of the combinations of primer and paint A and primer and paint B spread onto glass plate and gypsum board are presented in Table 53. The measured relative humidities when the gypsum board was stored at the different target relative humidities were the same as target relative humidities ±5 % RH. The TVOCSERa-values and the SERa of the most abundant compounds emitted from the combinations of primer A and paint A and primer B and paint B applied onto glass and gypsum board at 1 and 14 days are presented in Table 54. The TVOCSERa of the combination of primer and paint A is lower when spread onto gypsum board than it is when it was spread onto a glass plate, irrespective of age or the relative humidity of the storing conditions. The difference is approximately 5-10 -fold. The most abundant compounds, 1,2-propanediol and texanol, are the same irrespective of substrate. There are, however, more chemical groups present when the substrate is gypsum board even though their SERa are in general quite low. Table 53. The measured relative humidities when the combinations of primer and paint A and primer and paint B were spread onto glass and gypsum board.
Target relative humidity (%) Material Time 20 50 80
Primer and paint A 1 day 20±5 % 55±5 % 90±5 % on glass 14 days 20±5 % 50±5 % 80±5 % Primer and paint A 1 day 30±5 % 60±5 % 85±3 % on gypsum board 14 days 20±5 % 50±5 % 80±5 % Primer and paint B 1 day 20±5 % 50±5 % 95±5 % on glass 14 days 20±5 % 50±5 % 80±5 % Primer and paint B 1 day 35±5 % 60±5 % 80±5 % on gypsum board 14 days 20±5 % 50±5 % 80±5 %
The TVOCSERa of the combination of primer and paint B is also lower when spread onto gypsum board than it is when it was spread onto a glass plate, irrespective of age or relative humidity. The difference is approximately 10-30 -fold. The most abundant compounds, 1,2-propanediol and 2-(2-butoxyethoxy)ethanol, are the same irrespective of substrate. 2-
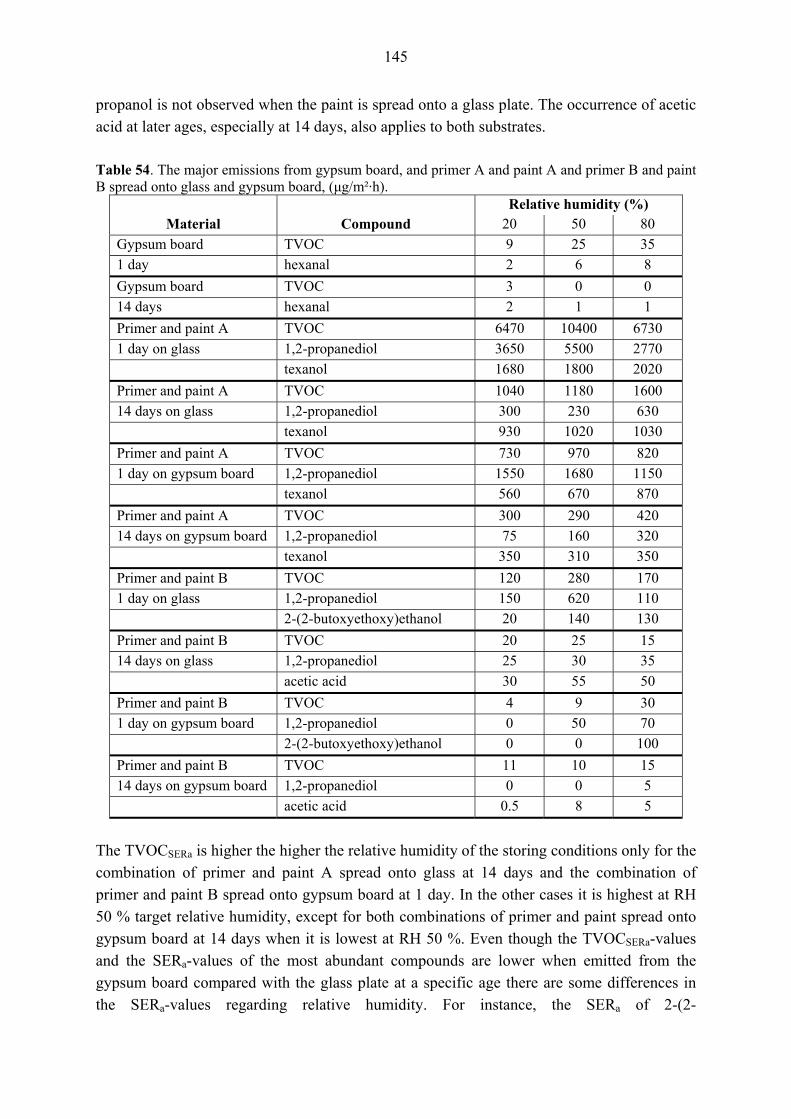
145
propanol is not observed when the paint is spread onto a glass plate. The occurrence of acetic acid at later ages, especially at 14 days, also applies to both substrates. Table 54. The major emissions from gypsum board, and primer A and paint A and primer B and paint B spread onto glass and gypsum board, (μg/m²·h).
Relative humidity (%) Material Compound 20 50 80
Gypsum board TVOC 9 25 35 1 day hexanal 2 6 8 Gypsum board TVOC 3 0 0 14 days hexanal 2 1 1 Primer and paint A TVOC 6470 10400 6730 1 day on glass 1,2-propanediol 3650 5500 2770 texanol 1680 1800 2020 Primer and paint A TVOC 1040 1180 1600 14 days on glass 1,2-propanediol 300 230 630 texanol 930 1020 1030 Primer and paint A TVOC 730 970 820 1 day on gypsum board 1,2-propanediol 1550 1680 1150 texanol 560 670 870 Primer and paint A TVOC 300 290 420 14 days on gypsum board 1,2-propanediol 75 160 320 texanol 350 310 350 Primer and paint B TVOC 120 280 170 1 day on glass 1,2-propanediol 150 620 110 2-(2-butoxyethoxy)ethanol 20 140 130 Primer and paint B TVOC 20 25 15 14 days on glass 1,2-propanediol 25 30 35 acetic acid 30 55 50 Primer and paint B TVOC 4 9 30 1 day on gypsum board 1,2-propanediol 0 50 70 2-(2-butoxyethoxy)ethanol 0 0 100 Primer and paint B TVOC 11 10 15 14 days on gypsum board 1,2-propanediol 0 0 5 acetic acid 0.5 8 5
The TVOCSERa is higher the higher the relative humidity of the storing conditions only for the combination of primer and paint A spread onto glass at 14 days and the combination of primer and paint B spread onto gypsum board at 1 day. In the other cases it is highest at RH 50 % target relative humidity, except for both combinations of primer and paint spread onto gypsum board at 14 days when it is lowest at RH 50 %. Even though the TVOCSERa-values and the SERa-values of the most abundant compounds are lower when emitted from the gypsum board compared with the glass plate at a specific age there are some differences in the SERa-values regarding relative humidity. For instance, the SERa of 2-(2-

146
butoxyethoxy)ethanol emitted from paint B is at 1 day highest at RH 80 % when emitted from the gypsum board, but highest at RH 50 % when emitted from the glass plate. Thus, relative humidity does not have a clear effect on the VOC-emissions from the combinations of primer and paint as far as TVOC and the emission of the most abundant compounds is concerned, but a substrate effect is obvious. The detailed results are presented in Appendix C, Tables C26 and C27 (gypsum board), C34 and C36 (primer and paint A on glass), C62 and C64 (primer and paint A on gypsum board), C38 and C40 (primer and paint B on glass), and C66 and C68 (primer and paint B on gypsum board). 7.7.5.6 Adhesives A and B applied onto glass and gypsum board The measured relative humidity values of adhesives A and B applied onto glass plate and gypsum board are presented in Table 55. The measured relative humidities when the gypsum board was stored at the different target relative humidities were the same as target relative humidities ±5 % RH. The TVOCSERa-values and the SERa of the most abundant compounds emitted from adhesives A and B applied onto glass and gypsum board at 1 and 14 days are presented in Table 56. Table 55. The measured relative humidities when adhesives A and B were applied onto glass and gypsum board.
Target relative humidity (%) Material Time 20 50 80
Adhesive A 1 day 95±5 % 97±3 % 99±2 % on glass 14 days 20±5 % 50±5 % 80±5 % Adhesive A 1 day 80±5 % 90±5 % 95±3 % on gypsum board 14 days 20±5 % 50±5 % 80±5 % Adhesive B 1 day 95±5 % 95±5 % 99±2 % on glass 14 days 20±5 % 50±5 % 80±5 % Adhesive B 1 day 85±5 % 95±5 % 98±3 % on gypsum board 14 days 20±5 % 50±5 % 80±5 %
The TVOCSERa is of very equal size, irrespective of the relative humidity of the storing conditions at the respective point of sample collection when adhesive A was applied onto a glass plate and the same trend is roughly maintained when the adhesive is applied onto gypsum board. In general, the TVOCSERa is distinctly lower when the substrate is gypsum board compared with the glass plate. The most abundant single compound is acetic acid in both cases irrespective of the point of sample collection. Its SERa-value, especially at 7 and 14 days, is higher the higher the relative humidity of the storing conditions when the adhesive is applied onto a glass plate while the trend is the opposite with the gypsum board as substrate. Other abundant compounds emitted when adhesive A is applied onto glass or
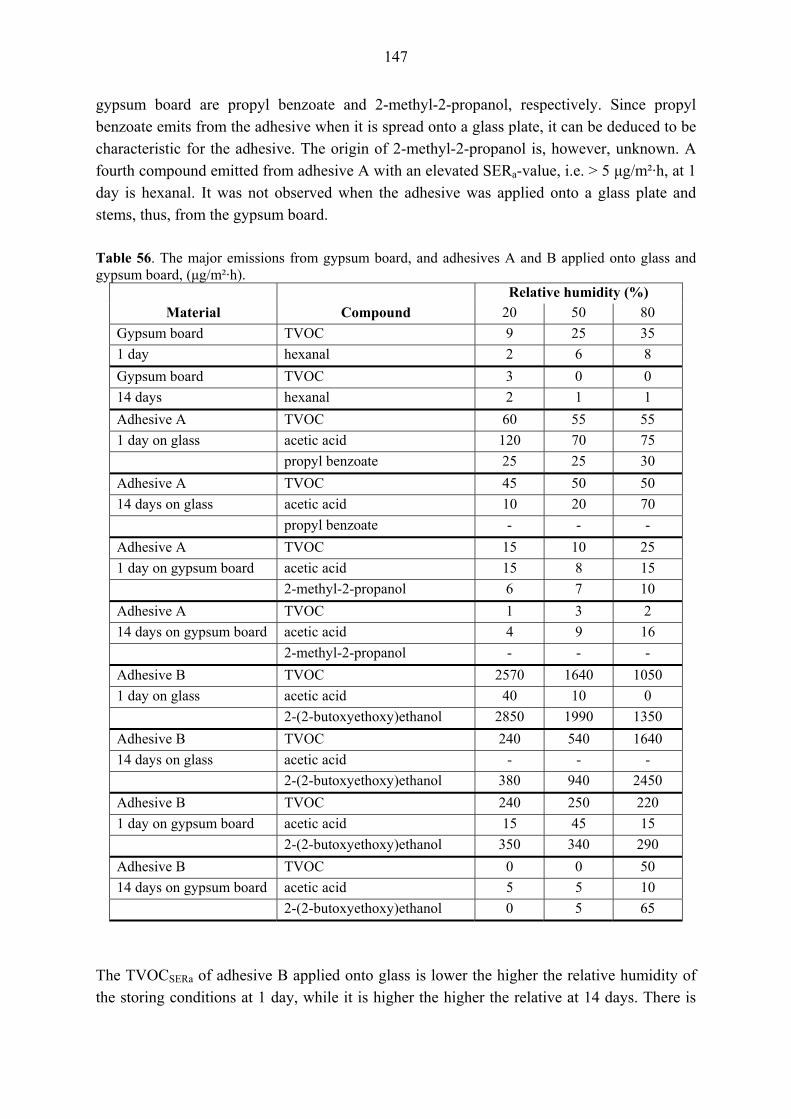
147
gypsum board are propyl benzoate and 2-methyl-2-propanol, respectively. Since propyl benzoate emits from the adhesive when it is spread onto a glass plate, it can be deduced to be characteristic for the adhesive. The origin of 2-methyl-2-propanol is, however, unknown. A fourth compound emitted from adhesive A with an elevated SERa-value, i.e. > 5 μg/m²·h, at 1 day is hexanal. It was not observed when the adhesive was applied onto a glass plate and stems, thus, from the gypsum board. Table 56. The major emissions from gypsum board, and adhesives A and B applied onto glass and gypsum board, (μg/m²·h).
Relative humidity (%) Material Compound 20 50 80
Gypsum board TVOC 9 25 35 1 day hexanal 2 6 8 Gypsum board TVOC 3 0 0 14 days hexanal 2 1 1 Adhesive A TVOC 60 55 55 1 day on glass acetic acid 120 70 75 propyl benzoate 25 25 30 Adhesive A TVOC 45 50 50 14 days on glass acetic acid 10 20 70 propyl benzoate - - - Adhesive A TVOC 15 10 25 1 day on gypsum board acetic acid 15 8 15 2-methyl-2-propanol 6 7 10 Adhesive A TVOC 1 3 2 14 days on gypsum board acetic acid 4 9 16 2-methyl-2-propanol - - - Adhesive B TVOC 2570 1640 1050 1 day on glass acetic acid 40 10 0 2-(2-butoxyethoxy)ethanol 2850 1990 1350 Adhesive B TVOC 240 540 1640 14 days on glass acetic acid - - - 2-(2-butoxyethoxy)ethanol 380 940 2450 Adhesive B TVOC 240 250 220 1 day on gypsum board acetic acid 15 45 15 2-(2-butoxyethoxy)ethanol 350 340 290 Adhesive B TVOC 0 0 50 14 days on gypsum board acetic acid 5 5 10 2-(2-butoxyethoxy)ethanol 0 5 65
The TVOCSERa of adhesive B applied onto glass is lower the higher the relative humidity of the storing conditions at 1 day, while it is higher the higher the relative at 14 days. There is

148
only one result > 0 μg/m²·h when the adhesive is applied onto gypsum board at 14 days, i.e. at the RH 80 % target relative humidity. The TVOCSERa-values are lower on the gypsum board compared with the glass plate at a specific point of time, but there are some differences in the SERa-values and the most abundant compounds. The SERa of 2-(2-butoxyethoxy)ethanol emitted from adhesive B is higher the lower the relative humidity of the storing conditions at 1 day and higher the higher the relative humidity at 14 days, irrespective of substrate. It can be concluded that the relative humidity does not have a clear effect on the VOC-emissions from adhesives applied onto glass or gypsum board as far as TVOC is concerned, but it seems to affect the emissions of the most abundant single compounds and a substrate effect is also obvious. The detailed results are presented in Appendix C, Tables C26 and C27 (gypsum board), C10 and C11 (adhesive A on glass), C70 and C72 (adhesive A on gypsum board), C30 and C32 (adhesive B on glass), and C74 and C76 (primer and paint B on gypsum board). 7.7.5.7 The combination of primer and paint A spread onto different substrates The measured relative humidity values of the combination of primer and paint A spread onto glass plate, gypsum board, the combination of filler and plaster B, and plaster C are presented in Table 57. The TVOCSERa-values and the SERa of the most abundant compounds emitted from primer and paint A spread onto different substrates and the emissions from the combination of filler and plaster B and plaster C at 1 and 14 days are presented in Table 58. The dependence of TVOCSERa on the relative humidity of the storing conditions is difficult to deduce from Table 56 partly because of the factorial design that was applied, but there seems to be no clear trend of the TVOCSERa of primer and paint A regarding relative humidity. Table 57. The measured relative humidities when the combination of primer and paint A was spread onto different substrates.
Target relative humidity (%) Material Time 20 50 80
Primer and paint A 1 day 20±5 % 55±5 % 90±5 % on glass 14 days 20±5 % 50±5 % 80±5 % Primer and paint A 1 day 30±5 % 60±5 % 85±3 % on gypsum board 14 days 20±5 % 50±5 % 80±5 % Primer and paint A 1 day 80±5 % 85±5 % 90±5 % on filler and plaster B 14 days 45±5 % 65±5 % 85±5 %
Primer and paint A 1 day 50±5 % 75±5 % 85±5 % on plaster C 14 days 30±5 % 60±5 % 80±5 %
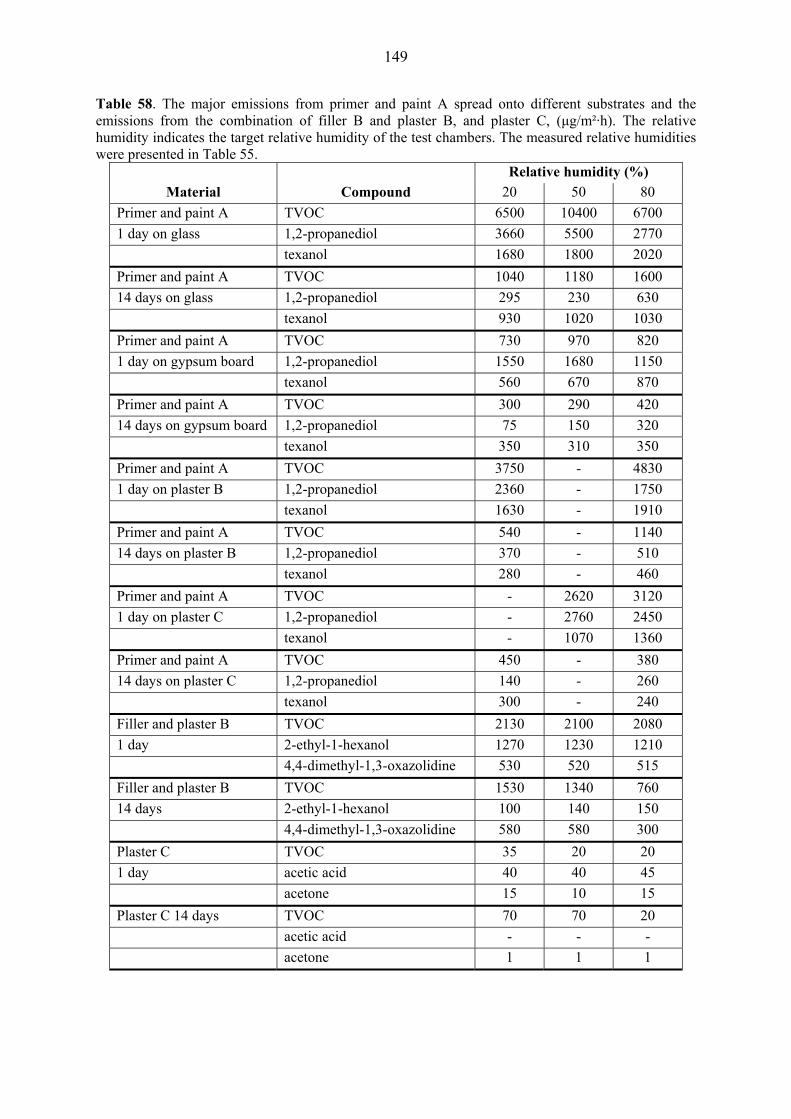
149
Table 58. The major emissions from primer and paint A spread onto different substrates and the emissions from the combination of filler B and plaster B, and plaster C, (μg/m²·h). The relative humidity indicates the target relative humidity of the test chambers. The measured relative humidities were presented in Table 55.
Relative humidity (%) Material Compound 20 50 80
Primer and paint A TVOC 6500 10400 6700 1 day on glass 1,2-propanediol 3660 5500 2770 texanol 1680 1800 2020 Primer and paint A TVOC 1040 1180 1600 14 days on glass 1,2-propanediol 295 230 630 texanol 930 1020 1030 Primer and paint A TVOC 730 970 820 1 day on gypsum board 1,2-propanediol 1550 1680 1150 texanol 560 670 870 Primer and paint A TVOC 300 290 420 14 days on gypsum board 1,2-propanediol 75 150 320 texanol 350 310 350 Primer and paint A TVOC 3750 - 4830 1 day on plaster B 1,2-propanediol 2360 - 1750 texanol 1630 - 1910 Primer and paint A TVOC 540 - 1140 14 days on plaster B 1,2-propanediol 370 - 510 texanol 280 - 460 Primer and paint A TVOC - 2620 3120 1 day on plaster C 1,2-propanediol - 2760 2450 texanol - 1070 1360 Primer and paint A TVOC 450 - 380 14 days on plaster C 1,2-propanediol 140 - 260 texanol 300 - 240 Filler and plaster B TVOC 2130 2100 2080 1 day 2-ethyl-1-hexanol 1270 1230 1210 4,4-dimethyl-1,3-oxazolidine 530 520 515 Filler and plaster B TVOC 1530 1340 760 14 days 2-ethyl-1-hexanol 100 140 150 4,4-dimethyl-1,3-oxazolidine 580 580 300 Plaster C TVOC 35 20 20 1 day acetic acid 40 40 45 acetone 15 10 15 Plaster C 14 days TVOC 70 70 20 acetic acid - - - acetone 1 1 1

150
However, what can be deduced is that the TVOCSERa depends on the substrate and increases in the following order: gypsum board < plaster C < filler and plaster B < glass plate, irrespective of time. The only exception is that the TVOCSERa is of approximately equal size when the combination of primer and paint is spread onto gypsum board or plaster C at 14 days. Another noteworthy observation is that 1,2-propanediol and texanol are the two most abundant compounds emitted from the combination of primer and paint, irrespective of the substrate. Thus, the substrate contributes mainly to the TVOCSERa-value. It can additionally be noticed that the SERa of 1,2-propanediol is higher the higher the relative humidity of the storing conditions at 14 days irrespective of the substrate while the SERa of texanol is higher the higher the relative humidity of the storing conditions at 1 day irrespective of the substrate. The detailed results are presented in Appendix C, Tables C34 and C36 (primer and paint A on glass), C62 and C64 (primer and paint A on gypsum board), C78 and C80 (primer and paint A on filler and plaster B), and C82 and C84 (primer and paint A on plaster C). The detailed results of the emissions from gypsum board are presented in Appendix C, Tables 26 and 27, filler and plaster B in Tables C54 and C56 and of plaster C in Tables C58 and C60. 7.7.5.8 The combination of primer and paint B spread onto different substrates The measured relative humidity values of the combination of primer and paint B spread onto glass plate, gypsum board, the combination of filler and plaster B, and plaster C are presented in Table 59. The TVOCSERa-values and the SERa of the most abundant compounds emitted from primer and paint B spread onto different substrates and the emissions from the combination of filler and plaster B and plaster C at 1 and 14 days are presented in Table 60. Table 59. The measured relative humidities when the combination of primer and paint B was spread onto different substrates.
Target relative humidity (%) Material Time 20 50 80
Primer and paint B 1 day 20±5 % 50±5 % 95±5 % on glass 14 days 20±5 % 50±5 % 80±5 % Primer and paint B 1 day 35±5 % 60±5 % 80±3 % on gypsum board 14 days 20±5 % 50±5 % 80±5 % Primer and paint B 1 day 55±5 % 70±5 % 85±5 % on filler and plaster B 14 days 30±5 % 60±5 % 80±5 %
Primer and paint B 1 day 65±5 % 80±5 % 90±5 % on plaster C 14 days 40±5 % 65±5 % 85±5 %
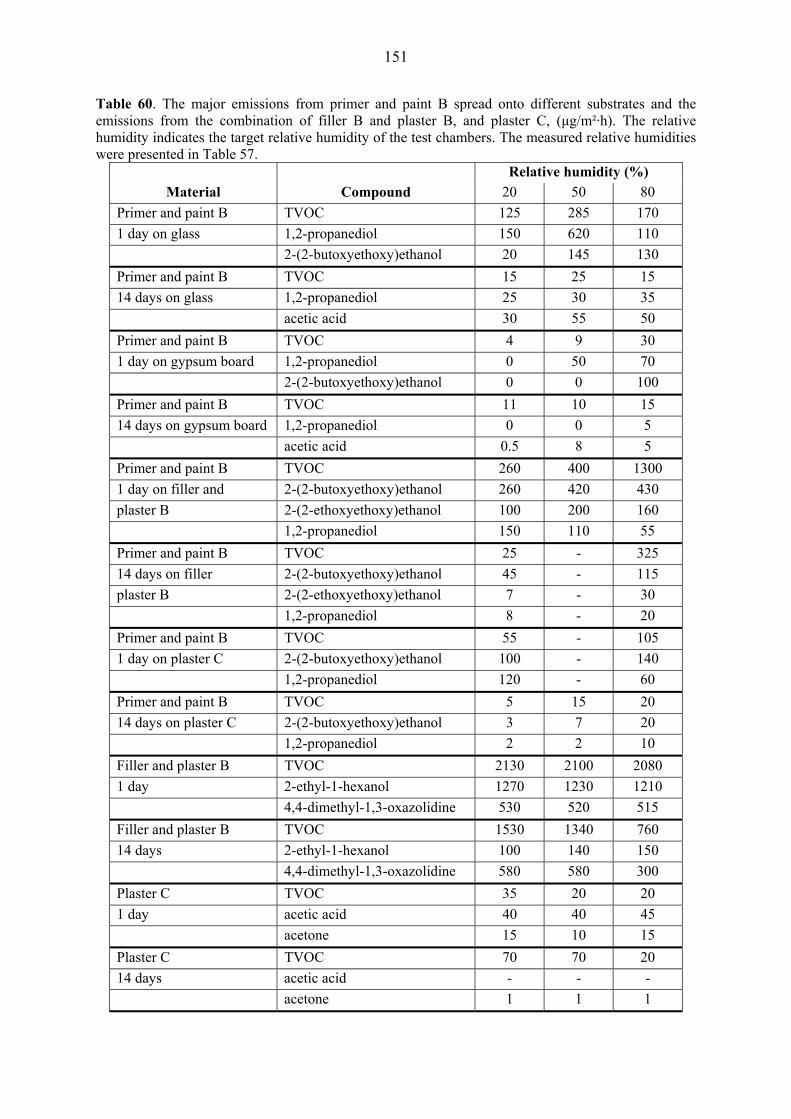
151
Table 60. The major emissions from primer and paint B spread onto different substrates and the emissions from the combination of filler B and plaster B, and plaster C, (μg/m²·h). The relative humidity indicates the target relative humidity of the test chambers. The measured relative humidities were presented in Table 57.
Relative humidity (%) Material Compound 20 50 80
Primer and paint B TVOC 125 285 170 1 day on glass 1,2-propanediol 150 620 110 2-(2-butoxyethoxy)ethanol 20 145 130 Primer and paint B TVOC 15 25 15 14 days on glass 1,2-propanediol 25 30 35 acetic acid 30 55 50 Primer and paint B TVOC 4 9 30 1 day on gypsum board 1,2-propanediol 0 50 70 2-(2-butoxyethoxy)ethanol 0 0 100 Primer and paint B TVOC 11 10 15 14 days on gypsum board 1,2-propanediol 0 0 5 acetic acid 0.5 8 5 Primer and paint B TVOC 260 400 1300 1 day on filler and 2-(2-butoxyethoxy)ethanol 260 420 430 plaster B 2-(2-ethoxyethoxy)ethanol 100 200 160 1,2-propanediol 150 110 55 Primer and paint B TVOC 25 - 325 14 days on filler 2-(2-butoxyethoxy)ethanol 45 - 115 plaster B 2-(2-ethoxyethoxy)ethanol 7 - 30 1,2-propanediol 8 - 20 Primer and paint B TVOC 55 - 105 1 day on plaster C 2-(2-butoxyethoxy)ethanol 100 - 140 1,2-propanediol 120 - 60 Primer and paint B TVOC 5 15 20 14 days on plaster C 2-(2-butoxyethoxy)ethanol 3 7 20 1,2-propanediol 2 2 10 Filler and plaster B TVOC 2130 2100 2080 1 day 2-ethyl-1-hexanol 1270 1230 1210 4,4-dimethyl-1,3-oxazolidine 530 520 515 Filler and plaster B TVOC 1530 1340 760 14 days 2-ethyl-1-hexanol 100 140 150 4,4-dimethyl-1,3-oxazolidine 580 580 300 Plaster C TVOC 35 20 20 1 day acetic acid 40 40 45 acetone 15 10 15 Plaster C TVOC 70 70 20 14 days acetic acid - - - acetone 1 1 1
152
The dependence of TVOCSERa on relative humidity is again difficult to deduce from the table partly because of the factorial design that was applied, but some observations can still be made. The TVOCSERa-values are highest at the RH 50 % target relative humidity when the combination of primer and paint is spread onto a glass plate, higher the higher the relative humidity of the storing conditions when spread onto gypsum board and the combination of filler and plaster B at 1 day and plaster C at 14 days. It can also be deduced that the TVOCSERa of primer and paint B depends on the substrate and increases in the following order: gypsum board < plaster C < glass plate < filler and plaster B irrespective of time. Another observation that can be made is that the most abundant compounds change with substrate and age. 2-(2-butoxethoxy)ethanol and 1,2-propanediol are the two most abundant compounds emitted when the primer and paint is spread onto glass and gypsum board at 1 day and when it is spread onto the combination of filler and plaster B or plaster C irrespective of the point of time. Acetic acid replaces 2-(2-butoxethoxy)ethanol when the combination of primer and paint is spread onto glass and gypsum board at 14 days. 2-(2-ethoxyethoxy)ethanol is also very abundant when the combination of primer and paint is spread onto the combination of filler and plaster B irrespective of the point of time. 4,4-dimethyl-1,3-oxazolidine is also very abundant at the RH 80 % target relative humidity when the combination of primer and paint is spread onto the combination of filler and plaster B. Thus, it can be concluded that the substrate contributes mainly to the TVOCSERa-value and that the occurrence of single compounds depends on the relative humidity. It is also noteworthy that the TVOCSERa of the combination of primer and paint B is one to two orders of magnitude lower than that of the combination of primer and paint A irrespective of the substrate, even though all four products have been classified as low-emitting in CIC (2001). The detailed results are presented in Appendix C, Tables C38 and C40 (primer and paint B on glass), C66 and C68 (primer and paint B on gypsum board), C86 and C88 (primer and paint B on filler and plaster B), and C90 and C92 (primer and paint B on plaster C). The detailed results of the emissions from gypsum board are presented in Appendix C, Tables 26 and 27, filler and plaster B in Tables C54 and C56 and of plaster C in Tables C58 and C60. 7.7.5.9 Adhesive A applied onto different substrates The measured relative humidity values of adhesive A applied onto glass plate, gypsum board, the combination of filler and plaster B, and plaster C are presented in Table 61. The TVOCSERa-values and the SERa of the most abundant compounds emitted from the adhesive applied onto different substrates and the emissions from the combination of filler and plaster B and plaster C at 1 and 14 days are presented in Table 62.
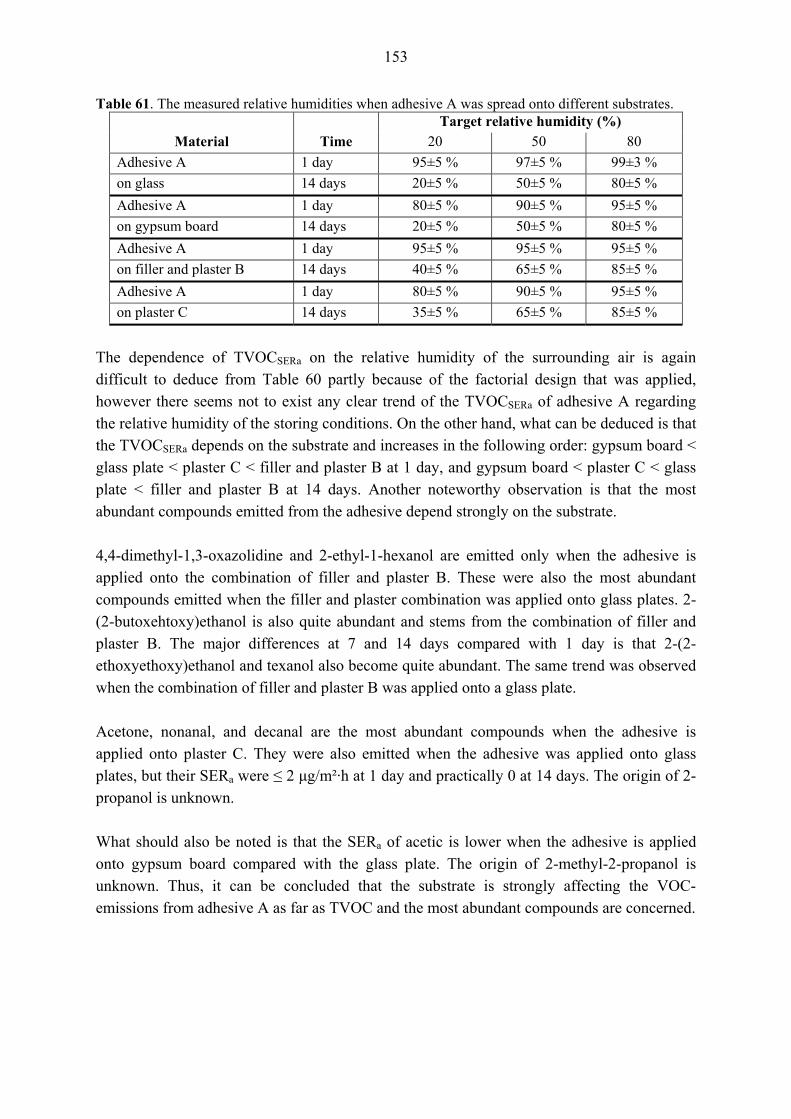
153
Table 61. The measured relative humidities when adhesive A was spread onto different substrates. Target relative humidity (%)
Material Time 20 50 80 Adhesive A 1 day 95±5 % 97±5 % 99±3 % on glass 14 days 20±5 % 50±5 % 80±5 % Adhesive A 1 day 80±5 % 90±5 % 95±5 % on gypsum board 14 days 20±5 % 50±5 % 80±5 % Adhesive A 1 day 95±5 % 95±5 % 95±5 % on filler and plaster B 14 days 40±5 % 65±5 % 85±5 %
Adhesive A 1 day 80±5 % 90±5 % 95±5 % on plaster C 14 days 35±5 % 65±5 % 85±5 %
The dependence of TVOCSERa on the relative humidity of the surrounding air is again difficult to deduce from Table 60 partly because of the factorial design that was applied, however there seems not to exist any clear trend of the TVOCSERa of adhesive A regarding the relative humidity of the storing conditions. On the other hand, what can be deduced is that the TVOCSERa depends on the substrate and increases in the following order: gypsum board < glass plate < plaster C < filler and plaster B at 1 day, and gypsum board < plaster C < glass plate < filler and plaster B at 14 days. Another noteworthy observation is that the most abundant compounds emitted from the adhesive depend strongly on the substrate. 4,4-dimethyl-1,3-oxazolidine and 2-ethyl-1-hexanol are emitted only when the adhesive is applied onto the combination of filler and plaster B. These were also the most abundant compounds emitted when the filler and plaster combination was applied onto glass plates. 2-(2-butoxehtoxy)ethanol is also quite abundant and stems from the combination of filler and plaster B. The major differences at 7 and 14 days compared with 1 day is that 2-(2-ethoxyethoxy)ethanol and texanol also become quite abundant. The same trend was observed when the combination of filler and plaster B was applied onto a glass plate. Acetone, nonanal, and decanal are the most abundant compounds when the adhesive is applied onto plaster C. They were also emitted when the adhesive was applied onto glass plates, but their SERa were ≤ 2 μg/m²·h at 1 day and practically 0 at 14 days. The origin of 2-propanol is unknown. What should also be noted is that the SERa of acetic is lower when the adhesive is applied onto gypsum board compared with the glass plate. The origin of 2-methyl-2-propanol is unknown. Thus, it can be concluded that the substrate is strongly affecting the VOC-emissions from adhesive A as far as TVOC and the most abundant compounds are concerned.
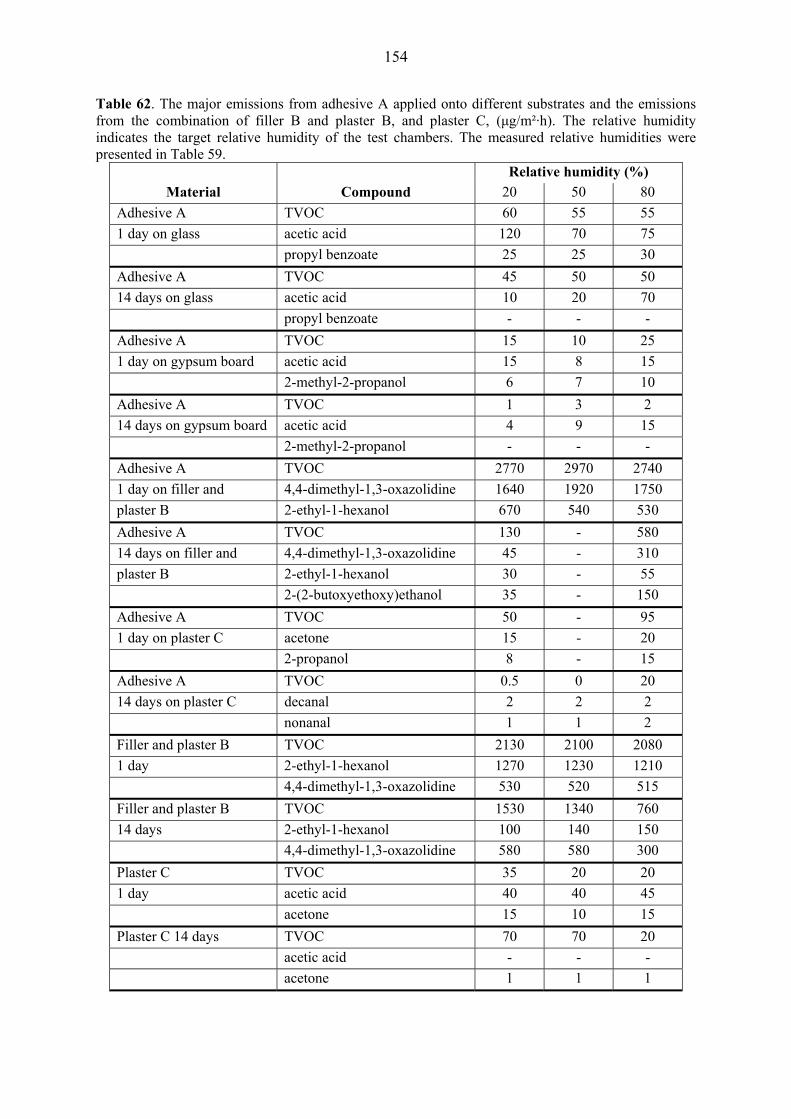
154
Table 62. The major emissions from adhesive A applied onto different substrates and the emissions from the combination of filler B and plaster B, and plaster C, (μg/m²·h). The relative humidity indicates the target relative humidity of the test chambers. The measured relative humidities were presented in Table 59.
Relative humidity (%) Material Compound 20 50 80
Adhesive A TVOC 60 55 55 1 day on glass acetic acid 120 70 75 propyl benzoate 25 25 30 Adhesive A TVOC 45 50 50 14 days on glass acetic acid 10 20 70 propyl benzoate - - - Adhesive A TVOC 15 10 25 1 day on gypsum board acetic acid 15 8 15 2-methyl-2-propanol 6 7 10 Adhesive A TVOC 1 3 2 14 days on gypsum board acetic acid 4 9 15 2-methyl-2-propanol - - - Adhesive A TVOC 2770 2970 2740 1 day on filler and 4,4-dimethyl-1,3-oxazolidine 1640 1920 1750 plaster B 2-ethyl-1-hexanol 670 540 530 Adhesive A TVOC 130 - 580 14 days on filler and 4,4-dimethyl-1,3-oxazolidine 45 - 310 plaster B 2-ethyl-1-hexanol 30 - 55 2-(2-butoxyethoxy)ethanol 35 - 150 Adhesive A TVOC 50 - 95 1 day on plaster C acetone 15 - 20 2-propanol 8 - 15 Adhesive A TVOC 0.5 0 20 14 days on plaster C decanal 2 2 2 nonanal 1 1 2 Filler and plaster B TVOC 2130 2100 2080 1 day 2-ethyl-1-hexanol 1270 1230 1210 4,4-dimethyl-1,3-oxazolidine 530 520 515 Filler and plaster B TVOC 1530 1340 760 14 days 2-ethyl-1-hexanol 100 140 150 4,4-dimethyl-1,3-oxazolidine 580 580 300 Plaster C TVOC 35 20 20 1 day acetic acid 40 40 45 acetone 15 10 15 Plaster C 14 days TVOC 70 70 20 acetic acid - - - acetone 1 1 1
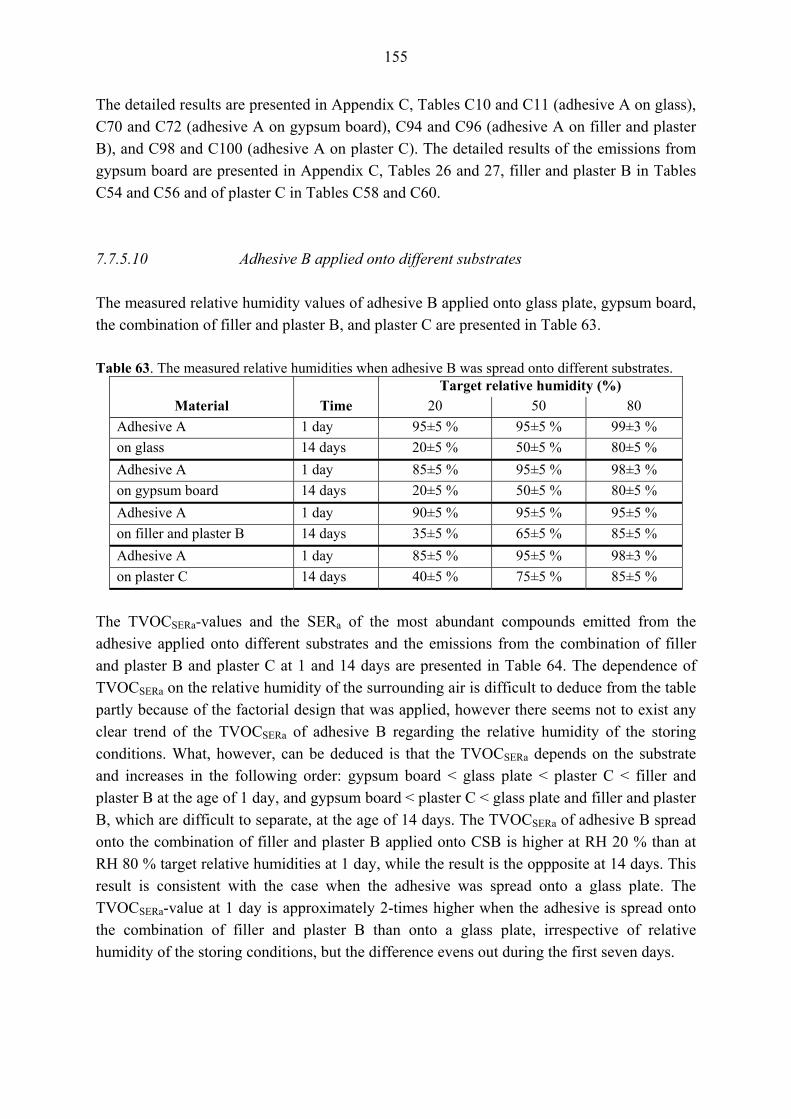
155
The detailed results are presented in Appendix C, Tables C10 and C11 (adhesive A on glass), C70 and C72 (adhesive A on gypsum board), C94 and C96 (adhesive A on filler and plaster B), and C98 and C100 (adhesive A on plaster C). The detailed results of the emissions from gypsum board are presented in Appendix C, Tables 26 and 27, filler and plaster B in Tables C54 and C56 and of plaster C in Tables C58 and C60. 7.7.5.10 Adhesive B applied onto different substrates The measured relative humidity values of adhesive B applied onto glass plate, gypsum board, the combination of filler and plaster B, and plaster C are presented in Table 63. Table 63. The measured relative humidities when adhesive B was spread onto different substrates.
Target relative humidity (%) Material Time 20 50 80
Adhesive A 1 day 95±5 % 95±5 % 99±3 % on glass 14 days 20±5 % 50±5 % 80±5 % Adhesive A 1 day 85±5 % 95±5 % 98±3 % on gypsum board 14 days 20±5 % 50±5 % 80±5 % Adhesive A 1 day 90±5 % 95±5 % 95±5 % on filler and plaster B 14 days 35±5 % 65±5 % 85±5 %
Adhesive A 1 day 85±5 % 95±5 % 98±3 % on plaster C 14 days 40±5 % 75±5 % 85±5 %
The TVOCSERa-values and the SERa of the most abundant compounds emitted from the adhesive applied onto different substrates and the emissions from the combination of filler and plaster B and plaster C at 1 and 14 days are presented in Table 64. The dependence of TVOCSERa on the relative humidity of the surrounding air is difficult to deduce from the table partly because of the factorial design that was applied, however there seems not to exist any clear trend of the TVOCSERa of adhesive B regarding the relative humidity of the storing conditions. What, however, can be deduced is that the TVOCSERa depends on the substrate and increases in the following order: gypsum board < glass plate < plaster C < filler and plaster B at the age of 1 day, and gypsum board < plaster C < glass plate and filler and plaster B, which are difficult to separate, at the age of 14 days. The TVOCSERa of adhesive B spread onto the combination of filler and plaster B applied onto CSB is higher at RH 20 % than at RH 80 % target relative humidities at 1 day, while the result is the oppposite at 14 days. This result is consistent with the case when the adhesive was spread onto a glass plate. The TVOCSERa-value at 1 day is approximately 2-times higher when the adhesive is spread onto the combination of filler and plaster B than onto a glass plate, irrespective of relative humidity of the storing conditions, but the difference evens out during the first seven days.
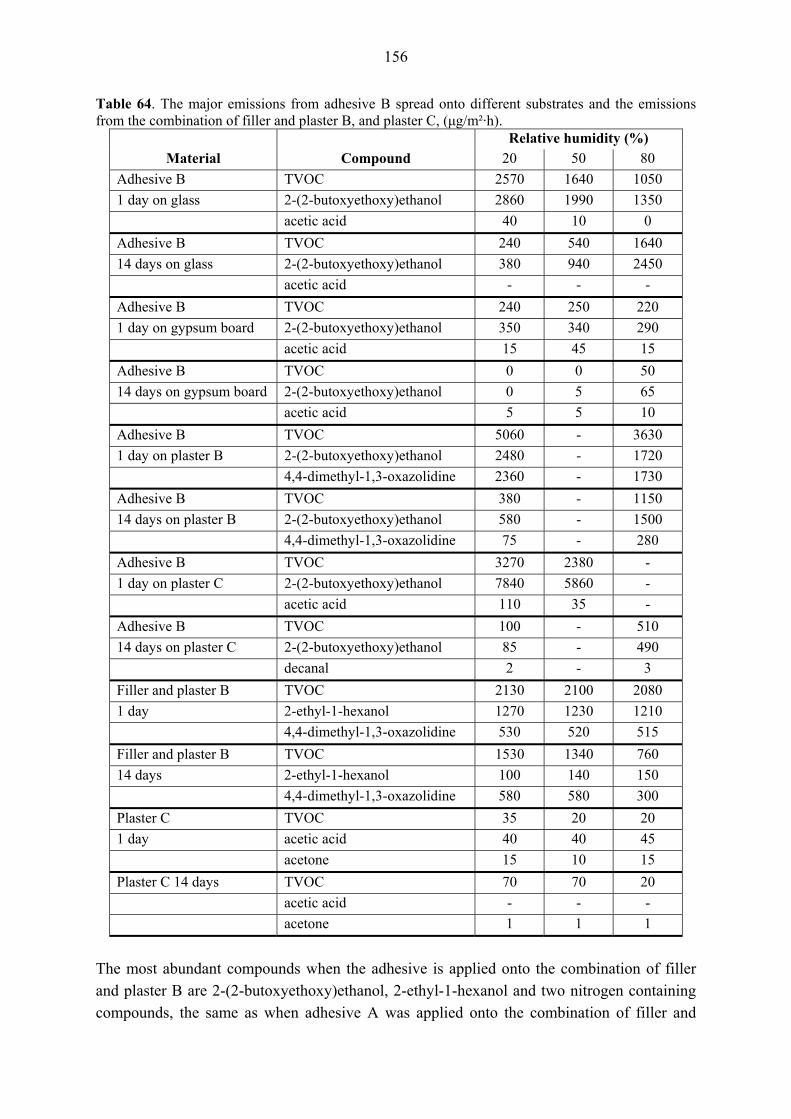
156
Table 64. The major emissions from adhesive B spread onto different substrates and the emissions from the combination of filler and plaster B, and plaster C, (μg/m²·h).
Relative humidity (%) Material Compound 20 50 80
Adhesive B TVOC 2570 1640 1050 1 day on glass 2-(2-butoxyethoxy)ethanol 2860 1990 1350 acetic acid 40 10 0 Adhesive B TVOC 240 540 1640 14 days on glass 2-(2-butoxyethoxy)ethanol 380 940 2450 acetic acid - - - Adhesive B TVOC 240 250 220 1 day on gypsum board 2-(2-butoxyethoxy)ethanol 350 340 290 acetic acid 15 45 15 Adhesive B TVOC 0 0 50 14 days on gypsum board 2-(2-butoxyethoxy)ethanol 0 5 65 acetic acid 5 5 10 Adhesive B TVOC 5060 - 3630 1 day on plaster B 2-(2-butoxyethoxy)ethanol 2480 - 1720 4,4-dimethyl-1,3-oxazolidine 2360 - 1730 Adhesive B TVOC 380 - 1150 14 days on plaster B 2-(2-butoxyethoxy)ethanol 580 - 1500 4,4-dimethyl-1,3-oxazolidine 75 - 280 Adhesive B TVOC 3270 2380 - 1 day on plaster C 2-(2-butoxyethoxy)ethanol 7840 5860 - acetic acid 110 35 - Adhesive B TVOC 100 - 510 14 days on plaster C 2-(2-butoxyethoxy)ethanol 85 - 490 decanal 2 - 3 Filler and plaster B TVOC 2130 2100 2080 1 day 2-ethyl-1-hexanol 1270 1230 1210 4,4-dimethyl-1,3-oxazolidine 530 520 515 Filler and plaster B TVOC 1530 1340 760 14 days 2-ethyl-1-hexanol 100 140 150 4,4-dimethyl-1,3-oxazolidine 580 580 300 Plaster C TVOC 35 20 20 1 day acetic acid 40 40 45 acetone 15 10 15 Plaster C 14 days TVOC 70 70 20 acetic acid - - - acetone 1 1 1
The most abundant compounds when the adhesive is applied onto the combination of filler and plaster B are 2-(2-butoxyethoxy)ethanol, 2-ethyl-1-hexanol and two nitrogen containing compounds, the same as when adhesive A was applied onto the combination of filler and
157
plaster B. The aforementioned compounds stem from the combination of filler and plaster. The SERa of 2-(2-butoxyethoxy)ethanol is, however, much higher in the case for adhesive B than for adhesive A. The difference is caused by adhesive B, which emits mainly 2-(2-butoxyethoxy)ethanol based on the emission results when it was spread onto glass. When adhesive B is spread onto plaster C the TVOCSERa-level is distinctly lower than was the case with the combination of filler and plaster B as substrate. It is still higher than with the glass as substrate at 1 day at RH 20 % and RH 50 % target relative humidities, but after that it is intermediate compared with glass and gypsum board as substrates. Of the three most abundant compounds are acetic acid, and especially decanal, also emitted from the plaster. What should also be noted is that the SERa of acetic acid is higher especially at 14 days when the adhesive is applied onto gypsum board compared with the glass plate. This result is opposite to what was observed for adhesive A applied onto gypsum board. The detailed results are presented in Appendix C, Tables C30 and C32 (adhesive B on glass), C74 and C76 (adhesive B on gypsum board), C102 and C104 (adhesive B on filler and plaster B), and C106 and C108 (adhesive B on plaster C). The detailed results of the emissions from gypsum board are presented in Appendix C, Tables 26 and 27, filler and plaster B in Tables C54 and C56 and of plaster C in Tables C58 and C60. 7.7.6 Statistical analysis The influence of the relative humidity of the surrounding air on the emission of single compounds separated according to the chemical group they belong to and the conformity of the two sample collection methods were studied using a STATGRAPHICS software program. For the study on the influence of relative humidity a condition that the measured relative humidity of the test chamber air should have reached the target level at least five days prior to sample collection for a result to be included was introduced. This was done in an attempt to minimise the influence of the drying process on the analysis results. 7.7.6.1 Statistical analysis of Part I. VOC emissions from single material layers on a glass substrate A Kruskal-Wallis test at a 95 % confidence interval indicated that the relative humidity of the surrounding air did not influence the emission rate of single compounds separated according to chemical groups or the TVOCSERa-values for samples collected from the test chambers. This applies also to acetic acid, which was tested separately. Adhesive B was included in the analysis, since it was also applied onto a glass plate as a single material layer.

158
Furthermore, the same test indicated that there was no statistical difference in the two different sample collection methods when the emission rates of single compounds separated according to chemical groups or the TVOCSERa-values were compared. 7.7.6.2 Statistical analysis of Part II. VOC emissions from material combinations on a glass substrate A Kruskal-Wallis test at a 95 % confidence interval indicated that the relative humidity of the surrounding air did not influence influenced the TVOCSERa-values for samples collected from the test chambers. However, it did influence the emission rate of aldehydes when their SERa was < 200 μg/m²·h. A Mann-Whitney u Test indicates that the difference was significant between samples stored at RH 20 % and RH 80 % target relative humidities. A Box-and-Whisker plot, Figure 64, shows that the SERa were higher for the latter storing conditions. The plot also asserts the result from the Mann-Whitney u Test, since the notches in the boxes do not overlap each other.
SERa (µg/m²·h)
RH 20 %
RH 50 %
RH 80 %
0 40 80 120 160
Figure 64. A Box-and-Whisker of the SERa of aldehydes. The relative humidity values indicate the measured relative humidity of the different test chambers ±5 % RH. Furthermore, the Kruskal-Wallis test indicated that there was no statistical difference in the two different sample collection methods when the emission rates of single compounds separated according to chemical groups or the TVOCSERa-values were compared. 7.7.6.3 Statistical analysis of Part III. VOC emissions from material combinations on gypsum board and CSB Factorial design was applied in order to optimise the amount of samples collected when primer A and paint A or primer B and paint B was spread onto filler B and plaster B or a 6

159
mm layer of plaster C which was applied onto calcium silicate brick (CSB). A statistical analysis of the test results, which has been done by using a software program, MODDE, which was also used to design the experiments by D-Optimal design, is presented in the following paragraphs. The TVOCSERa-values used in the calculations were presented in Tables 41-44. A multiple linear regression (MLR) analysis performed using MODDE gave the following results presented in Table 65 regarding the combinations of primer and paint applied onto the combination of filler and plaster B or a single layer of plaster C. Partial Least Squares (PLS) -coefficients with confidence intervals and an interaction plot for the influence of the point of sample collection and the relative humidity of the storing conditions on TVOCSERa-values are presented in Figures 65 and 66. Table 65. ANOVA-table (MLR) of the tests with the combination of primers and paints A or B spread onto the combination of filler and plaster B or a single layer of plaster C applied onto CSB.
TVOC DF SS MS F p SD Total 22 6.2×10⁷ 2.8×10⁶ Constant 1 2.3×10⁷ 2.3×10⁷ Total corrected 21 3.9×10⁷ 1.8×10⁶ 1357 Regression 10 3.7×10⁷ 3.7×10⁶ 21.8 0.00 1919 Residual 11 1.8×10⁶ 168600 410 R2 = 0.952 and Q2 = 0.591. Condition number = 1.360 By default the PLS-coefficient plot is centred and scaled. The scaling of the data makes the coefficients comparable. The size of the coefficient represents the change in the response when a factor varies from 0 to 1, in coded units, while the other factors are kept at their averages. A PLS-coefficient is significant, i.e. different from the noise, when the confidence interval does not cross zero. It can be observed that the combination of primer and paint, point of time of sample collection, and the combination of filler and plaster, respectively, are three significant factors affecting the TVOCSERa-values. The relative humidity of the surrounding air by itself is insignificant regarding TVOCSERa, but there is a strong interaction of relative humidity and the combination of filler plaster affecting the TVOCSERa.
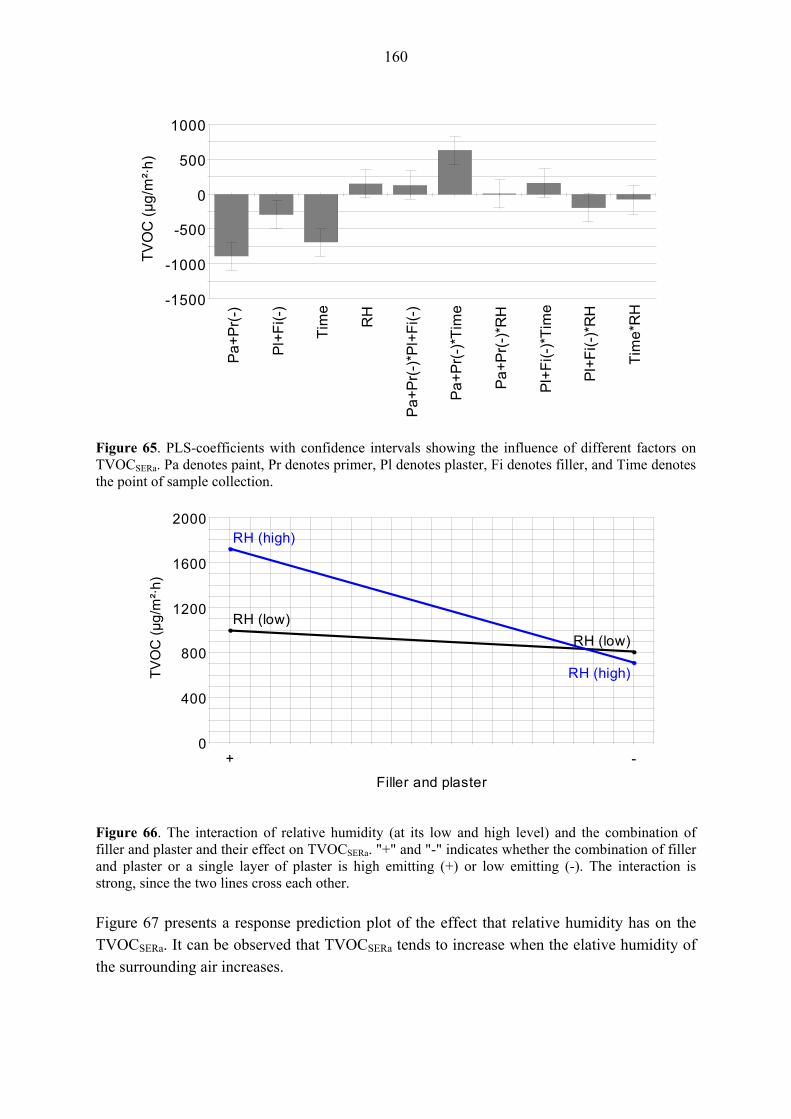
160
-1500
-1000
-500
0
500
1000
Pa+
Pr(
-)
Pl+
Fi(-)
Tim
e
RH
Pa+P
r(-)
*Pl+
Fi(-
)
Pa+
Pr(
-)*T
ime
Pa+
Pr(
-)*R
H
Pl+
Fi(-
)*Ti
me
Pl+
Fi(-
)*R
H
Tim
e*R
H
TVO
C (µ
g/m
²·h)
Figure 65. PLS-coefficients with confidence intervals showing the influence of different factors on TVOCSERa. Pa denotes paint, Pr denotes primer, Pl denotes plaster, Fi denotes filler, and Time denotes the point of sample collection.
0
400
800
1200
1600
2000
+ -
TVO
C (µ
g/m
²·h)
Filler and plaster
RH (low)RH (low)
RH (high)
RH (high)
Figure 66. The interaction of relative humidity (at its low and high level) and the combination of filler and plaster and their effect on TVOCSERa. "+" and "-" indicates whether the combination of filler and plaster or a single layer of plaster is high emitting (+) or low emitting (-). The interaction is strong, since the two lines cross each other. Figure 67 presents a response prediction plot of the effect that relative humidity has on the TVOCSERa. It can be observed that TVOCSERa tends to increase when the elative humidity of the surrounding air increases.
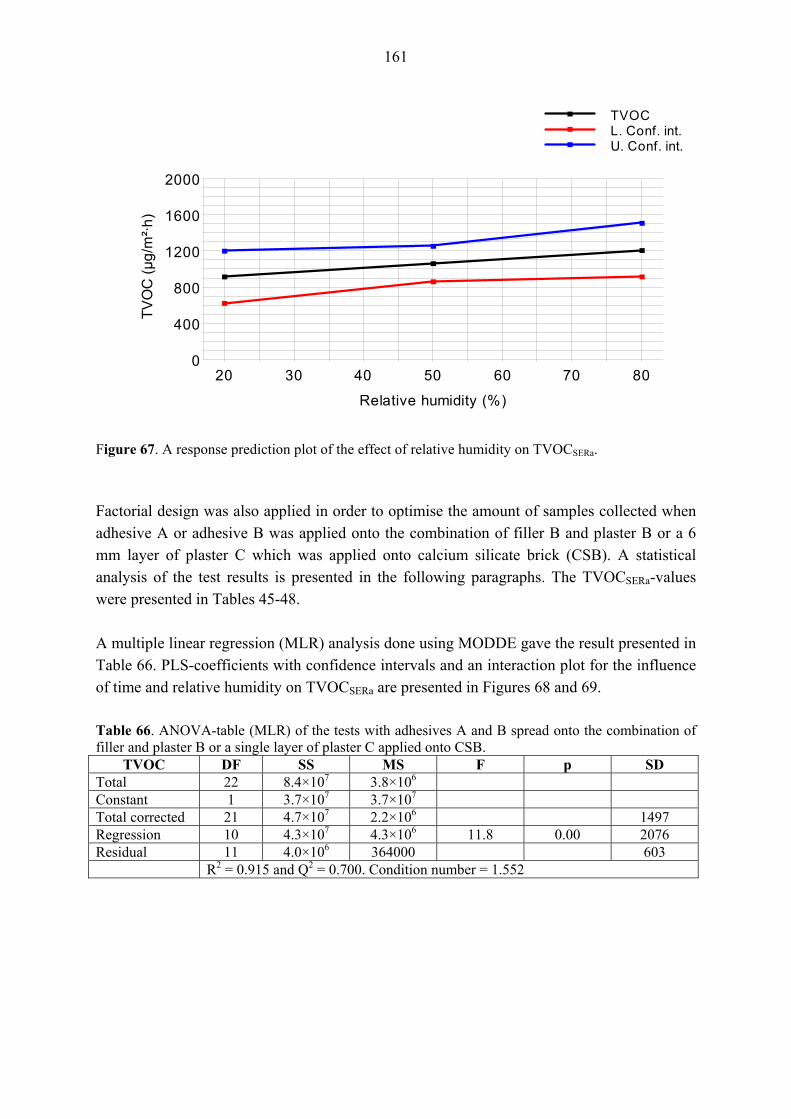
161
0
400
800
1200
1600
2000
20 30 40 50 60 70 80
TVO
C (µ
g/m
²·h)
Relative humidity (%)
TVOCL. Conf. int.U. Conf. int.
Figure 67. A response prediction plot of the effect of relative humidity on TVOCSERa. Factorial design was also applied in order to optimise the amount of samples collected when adhesive A or adhesive B was applied onto the combination of filler B and plaster B or a 6 mm layer of plaster C which was applied onto calcium silicate brick (CSB). A statistical analysis of the test results is presented in the following paragraphs. The TVOCSERa-values were presented in Tables 45-48. A multiple linear regression (MLR) analysis done using MODDE gave the result presented in Table 66. PLS-coefficients with confidence intervals and an interaction plot for the influence of time and relative humidity on TVOCSERa are presented in Figures 68 and 69. Table 66. ANOVA-table (MLR) of the tests with adhesives A and B spread onto the combination of filler and plaster B or a single layer of plaster C applied onto CSB.
TVOC DF SS MS F p SD Total 22 8.4×10⁷ 3.8×10⁶ Constant 1 3.7×10⁷ 3.7×10⁷ Total corrected 21 4.7×10⁷ 2.2×10⁶ 1497 Regression 10 4.3×10⁷ 4.3×10⁶ 11.8 0.00 2076 Residual 11 4.0×10⁶ 364000 603 R2 = 0.915 and Q2 = 0.700. Condition number = 1.552
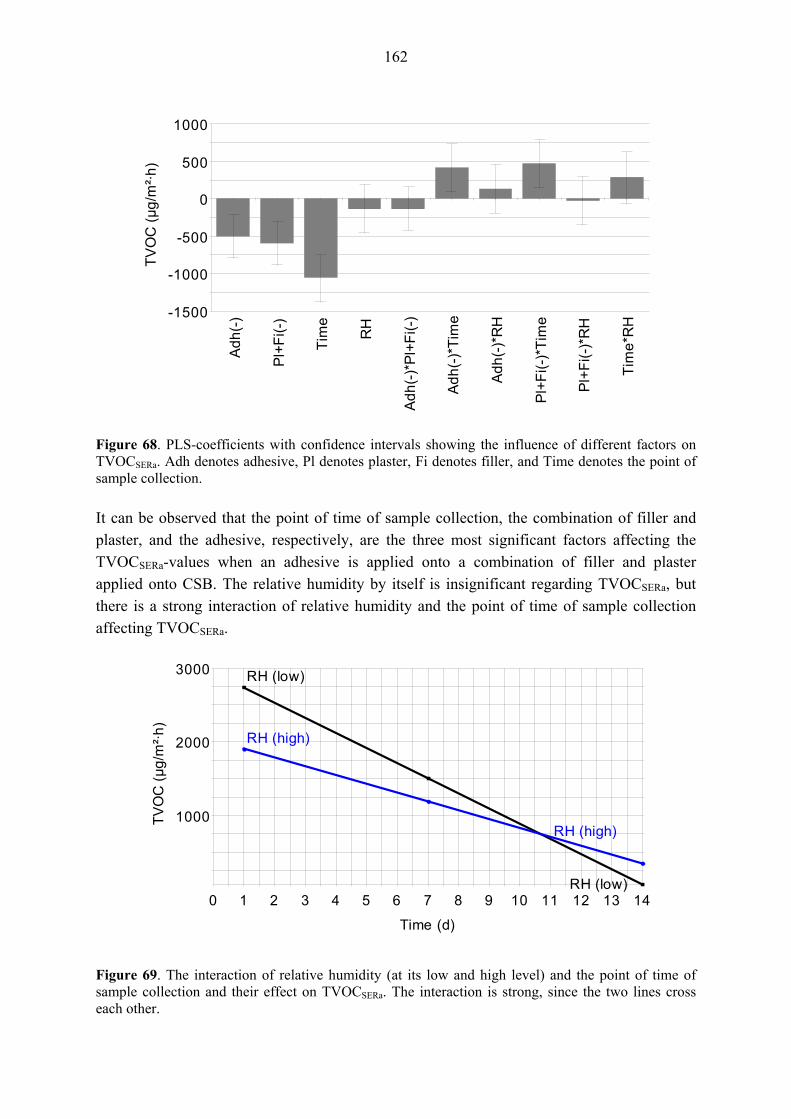
162
-1500
-1000
-500
0
500
1000
Adh
(-)
Pl+
Fi(-
)
Tim
e
RH
Adh(
-)*Pl
+Fi(-
)
Adh
(-)*
Tim
e
Adh(
-)*R
H
Pl+
Fi(-
)*Ti
me
Pl+F
i(-)*
RH
Tim
e*R
H
TVO
C (µ
g/m
²·h)
Figure 68. PLS-coefficients with confidence intervals showing the influence of different factors on TVOCSERa. Adh denotes adhesive, Pl denotes plaster, Fi denotes filler, and Time denotes the point of sample collection. It can be observed that the point of time of sample collection, the combination of filler and plaster, and the adhesive, respectively, are the three most significant factors affecting the TVOCSERa-values when an adhesive is applied onto a combination of filler and plaster applied onto CSB. The relative humidity by itself is insignificant regarding TVOCSERa, but there is a strong interaction of relative humidity and the point of time of sample collection affecting TVOCSERa.
1000
2000
3000
0 1 2 3 4 5 6 7 8 9 10 11 12 13 14
TVO
C (µ
g/m
²·h)
Time (d)
RH (low)
RH (low)
RH (high)
RH (high)
Figure 69. The interaction of relative humidity (at its low and high level) and the point of time of sample collection and their effect on TVOCSERa. The interaction is strong, since the two lines cross each other.
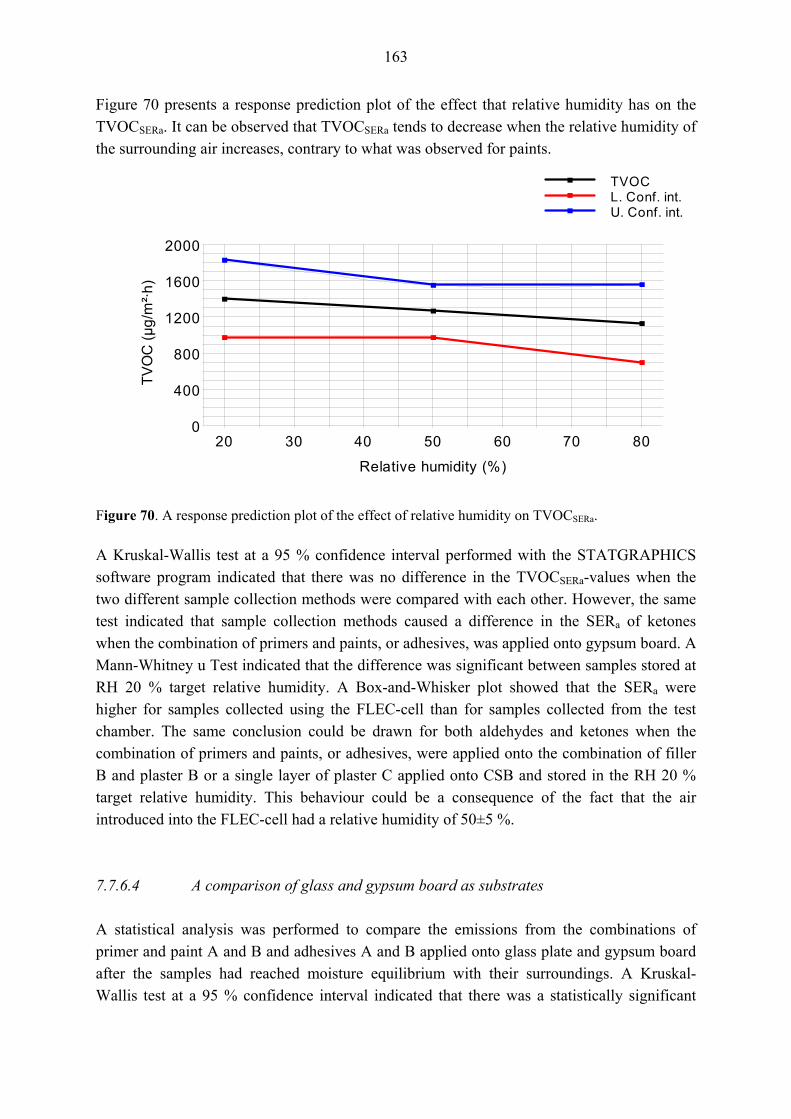
163
Figure 70 presents a response prediction plot of the effect that relative humidity has on the TVOCSERa. It can be observed that TVOCSERa tends to decrease when the relative humidity of the surrounding air increases, contrary to what was observed for paints.
0
400
800
1200
1600
2000
20 30 40 50 60 70 80
TVO
C (µ
g/m
²·h)
Relative humidity (%)
TVOCL. Conf. int.U. Conf. int.
Figure 70. A response prediction plot of the effect of relative humidity on TVOCSERa. A Kruskal-Wallis test at a 95 % confidence interval performed with the STATGRAPHICS software program indicated that there was no difference in the TVOCSERa-values when the two different sample collection methods were compared with each other. However, the same test indicated that sample collection methods caused a difference in the SERa of ketones when the combination of primers and paints, or adhesives, was applied onto gypsum board. A Mann-Whitney u Test indicated that the difference was significant between samples stored at RH 20 % target relative humidity. A Box-and-Whisker plot showed that the SERa were higher for samples collected using the FLEC-cell than for samples collected from the test chamber. The same conclusion could be drawn for both aldehydes and ketones when the combination of primers and paints, or adhesives, were applied onto the combination of filler B and plaster B or a single layer of plaster C applied onto CSB and stored in the RH 20 % target relative humidity. This behaviour could be a consequence of the fact that the air introduced into the FLEC-cell had a relative humidity of 50±5 %. 7.7.6.4 A comparison of glass and gypsum board as substrates A statistical analysis was performed to compare the emissions from the combinations of primer and paint A and B and adhesives A and B applied onto glass plate and gypsum board after the samples had reached moisture equilibrium with their surroundings. A Kruskal-Wallis test at a 95 % confidence interval indicated that there was a statistically significant

164
difference in the emission rates of alcohol and phenol ethers emitted from the paint combinations for samples collected from the test chambers. A Mann-Whitney u Test indicated that the difference was significant between samples stored at the RH 20 % target relative humidity and a Box-and-Whisker plot showed that the SERa were higher for samples spread onto glass plates than gypsum board. The same analysis procedure also indicated that the emission rate of aromatic hydrocarbons emitted from the adhesives was higher when they were applied onto glass plates than onto gypsum board both at the RH 20 % and RH 50 % target relative humidities when samples were collected from the test chambers. Furthermore, there was a statistically significant difference between the emission rates of aliphatic and alicyclic compounds emitted from the combinations of primer and paint A and B spread onto glass plate and gypsum board for samples stored at the RH 80 % target relative humidity when samples were collected using the FLEC-cell. The emission rates were again higher from the glass plate. Adhesives could not be analysed, since there was not enough data. 7.8 OLFACTORY EVALUATION The average strength of olfaction of the materials studied in Parts I-III of this study is presented in Tables 67-69, respectively. It was rather difficult to observe any differences between samples stored at different relative humidities. At least during the first 2-3 days the odour seemed to be stronger at higher relative humidity, but this shifted later on, and no definite pattern could be observed. Regarding the end of a testing period when the chamber lid was opened, a more distinct pattern could be observed. Then the olfactory evaluation showed increasing sensation with an increase in the relative humidity of the storing conditions. The difference between the relative humidities was approximately one step on the olfactory scale irrespective of the sample evaluated. This finding is consistent with the results reported by FANG ET AL. (1998), who concluded that the air was perceived as less acceptable with increasing humidity. They used five different building materials, i.e. a PVC flooring, a loomed polyamide carpet, a water-borne floor varnish, a water-borne wall paint, and an acrylic sealant, and a humidity range of 30 % to 70 % RH in their study. The odours observed were characteristic to the samples in Parts I and II, i.e. paints had a characteristic smell of wet paint with regard to the solvent and adhesives had a characteristic adhesive-like smell. Fillers and plasters A and B had a hint of the characteristic smell of adhesives while plaster C was mainly odourless. When paints and adhesives were spread onto gypsum board the smell could be characterised by a mix of paint or adhesive and the rather tangy smell of the gypsum board. Filler and plaster B as a substrate gave a mix of the adhesive-like smell of the substrate and the surface material, while plaster C did not contribute to the odour sensation of the surface material.
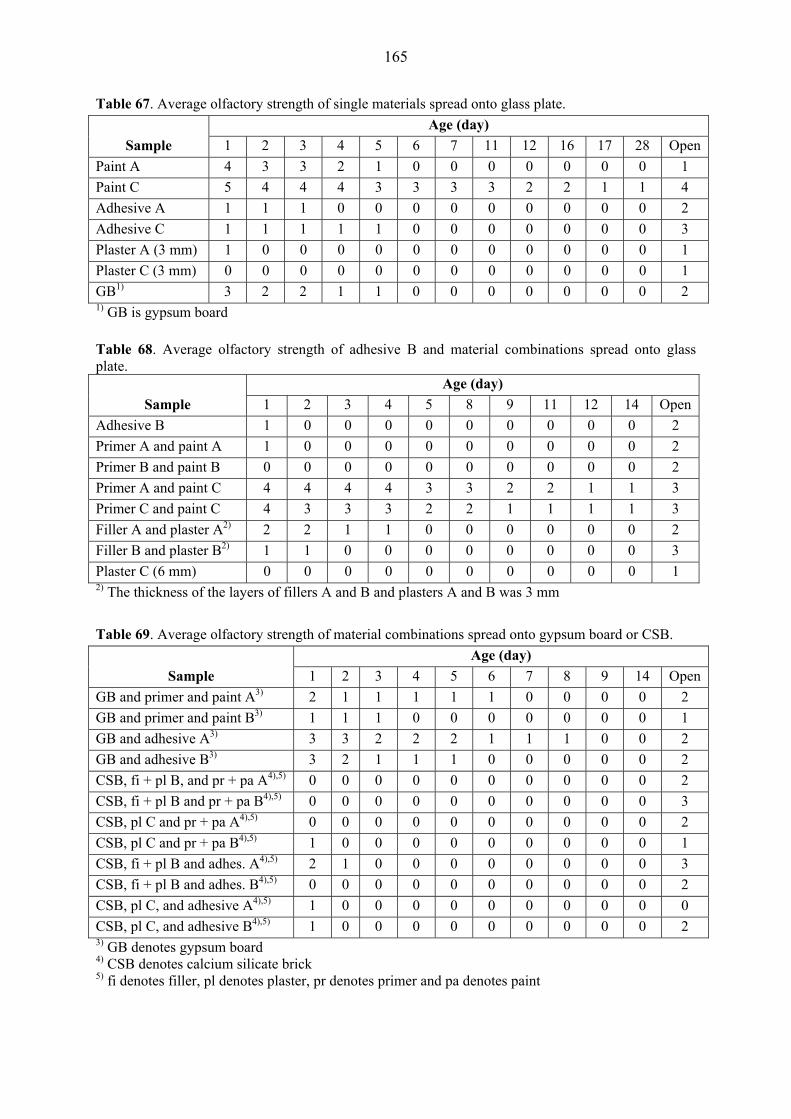
165
Table 67. Average olfactory strength of single materials spread onto glass plate. Age (day)
Sample 1 2 3 4 5 6 7 11 12 16 17 28 Open Paint A 4 3 3 2 1 0 0 0 0 0 0 0 1 Paint C 5 4 4 4 3 3 3 3 2 2 1 1 4 Adhesive A 1 1 1 0 0 0 0 0 0 0 0 0 2 Adhesive C 1 1 1 1 1 0 0 0 0 0 0 0 3 Plaster A (3 mm) 1 0 0 0 0 0 0 0 0 0 0 0 1 Plaster C (3 mm) 0 0 0 0 0 0 0 0 0 0 0 0 1 GB1) 3 2 2 1 1 0 0 0 0 0 0 0 2 1) GB is gypsum board Table 68. Average olfactory strength of adhesive B and material combinations spread onto glass plate.
Age (day) Sample 1 2 3 4 5 8 9 11 12 14 Open
Adhesive B 1 0 0 0 0 0 0 0 0 0 2 Primer A and paint A 1 0 0 0 0 0 0 0 0 0 2 Primer B and paint B 0 0 0 0 0 0 0 0 0 0 2 Primer A and paint C 4 4 4 4 3 3 2 2 1 1 3 Primer C and paint C 4 3 3 3 2 2 1 1 1 1 3 Filler A and plaster A2) 2 2 1 1 0 0 0 0 0 0 2 Filler B and plaster B2) 1 1 0 0 0 0 0 0 0 0 3 Plaster C (6 mm) 0 0 0 0 0 0 0 0 0 0 1 2) The thickness of the layers of fillers A and B and plasters A and B was 3 mm Table 69. Average olfactory strength of material combinations spread onto gypsum board or CSB.
Age (day) Sample 1 2 3 4 5 6 7 8 9 14 Open
GB and primer and paint A3) 2 1 1 1 1 1 0 0 0 0 2 GB and primer and paint B3) 1 1 1 0 0 0 0 0 0 0 1 GB and adhesive A3) 3 3 2 2 2 1 1 1 0 0 2 GB and adhesive B3) 3 2 1 1 1 0 0 0 0 0 2 CSB, fi + pl B, and pr + pa A4),5) 0 0 0 0 0 0 0 0 0 0 2 CSB, fi + pl B and pr + pa B4),5) 0 0 0 0 0 0 0 0 0 0 3 CSB, pl C and pr + pa A4),5) 0 0 0 0 0 0 0 0 0 0 2 CSB, pl C and pr + pa B4),5) 1 0 0 0 0 0 0 0 0 0 1 CSB, fi + pl B and adhes. A4),5) 2 1 0 0 0 0 0 0 0 0 3 CSB, fi + pl B and adhes. B4),5) 0 0 0 0 0 0 0 0 0 0 2 CSB, pl C, and adhesive A4),5) 1 0 0 0 0 0 0 0 0 0 0 CSB, pl C, and adhesive B4),5) 1 0 0 0 0 0 0 0 0 0 2 3) GB denotes gypsum board 4) CSB denotes calcium silicate brick 5) fi denotes filler, pl denotes plaster, pr denotes primer and pa denotes paint

166
The emissions from materials and material combinations were obviously related to the sensation of smell, even though there were some major exceptions. The combination of primer and paint A had higher TVOC-values than paint C spread onto primer A or primer C even though it did not smell as strongly. The gypsum board also smelled quite strongly, but its emissions were, on the other hand, very low. The fact that the chambers had a stronger smell at higher relative humidities at the end of a testing period when the chamber lids were opened is possibly related to sink effects caused by the high relative humidity in the chambers and consequently of adsorption of water molecules and, hence, VOCs on the inner surfaces of the chambers.

167
8 DISCUSSION 8.1 PROPERTIES OF THE TESTED MATERIALS AND THEIR BEHAVIOUR AT DIFFERENT MOISTURE CONDITIONS The FTIR-analyses of all three primers and paints demonstrated that they contain CaCO3, which is used as filler. They also have strong bands assigning C=O stretching in ester and C–O–C stretching in ether or carboxylic ester. One major difference in the absorption bands of the water-borne primers and paints A and B was that primer and paint A had a strong band at 1160 cm-1, while primer and paint B had a strong band at 1110 cm-1 instead. Even though both bands assign asymmetric and symmetric C–O–C stretching in ether and carboxylic ester the products have probably some differences in their film formers. This could be one reason for their different VOC-emissions. They emit partly different compounds when spread onto glass, e.g. ethers and nitrogen containing compounds are emitted only from primer and paint A while 2-ethyl-1-hexanol and acids are emitted only from primer and paint B. Furthermore, their common compounds, e.g. 1,2-propanediol and texanol, have quite different emission rates being higher for primer and paint A. The water-borne primers and paints differ from the alkyd primer and paint especially in the wavenumber region 1500 cm-1 to 1000 cm-1. The main absorption bands assign the same chemical compounds in that region, but the bands occur at somewhat different wavenumbers indicating that the film formers differ somewhat from each other. There is also a marked difference in the VOC-emissions from water-borne and alkyd paints, since, besides differences in the film formers the products have also different solvents and means of film formation. The FTIR-spectra of the different adhesives differ mainly in the wavenumber region 1640 cm-1 to 1600 cm-1 and 1160 cm-1 to 1110 cm-1. The first absorption band region assigns C=C stretching vibration and the latter assigns C–O–C stretching characteristic of ethers and carboxylic esters. Adhesives A and C have bands at 1640 cm-1 and 1160 cm-1, while adhesive B have bands at 1600 cm-1 and 1110 cm-1. Adhesives A and C also emit roughly the same compounds when applied onto glass and the emission rates are also similar, 1,2-propanediol emitted from adhesive C being the major exception. Adhesive B emits mainly 2-(2-butoxyethoxyethanol), which adhesives A and C emit only at 28 days and the emission rate is low, <0.5 μg/m²·h. The FTIR-spectra of fillers and plasters with polymer binder were also quite similar. They had absorption bands assigning water (or alcohol), CaCO3, C=O stretching in ester, and C–O–C stretching characteristic of ether and carboxylic ester. However, the spectral band positions were somewhat different as was the emission rates of their common compounds.
168
Furthermore, only the combination of filler and plaster A emitted 1,2-propanediol whereas only the combination of filler and plaster B emitted nitrogen containing compounds. The absorption bands of plaster C, a gypsum-based product, assigned gypsum along with CaCO3 and C=O stretching vibration in ester. It was noted in its operational safety sheet that the product contains a copolymer acetate of vinyl acetate. The core of the gypsum board is rather pure gypsum according to its FTIR-spectra. The element analysis of primers and paints indicated that they contain TiO2 that is used as pigment in the products. TiO2 was also observed in the ESEM-images as small particles evenly distributed in the samples. The element analysis further indicated the presence of CaCO3, a filler used in paints that was observed in the images as coarser particles. The presence of CaCO3 is also in concordance with the FTIR-spectra. The ESEM-images revealed also the coarser structure of primers compared with paints. Furthermore, the element analysis indicated the presence of oxygen in the water-borne primers and paints, but not in the alkyd primer and paint, as expected. The element analysis of adhesive A indicated the presence of Cl- and Na+. Cl- could derive from the adhesive binder, which according to the manufacturer is a PVAc -copolymer and, thus, probably a vinyl acetate - vinyl chloride copolymer, while Na+ may derive, for instance, from a plasticiser. Storing the different plasters at different relative humidities caused only minor changes in their porosity characteristics, as either a shift in the pore size distribution curve or as higher peak values. However, the major differences between the different plasters studied were in their specific surface areas. This could be a key factor affecting adsorption and absorption phenomena of VOCs, but was not further investigated in this study. The pH-measurements indicated that the surface of the samples stored at RH 80 % was covered with a layer of water molecules, since their pH was approximately 7 and it decreased when the samples were allowed to dry. Thus, the moisture content of the surrounding air rather than the pH of the plasters affected the pH of the top layers. The reason for the low pH of the gypsum board compared with that reported in its operational safety sheet could be caused by the fact that the colour of the surface of the gypsum board made the determination of the pH difficult. The weight change of the water-borne primers and paints, the adhesives and the gypsum-based plaster spread onto a glass plate was smaller the higher the relative humidity of the storing conditions. This result is consistent with the finding reported by KORNUM (1980), who concluded that the influence of relative humidity on the evaporation of water can be considered to be linear at isothermal conditions, since the products emitted, based on their emission and weight change results, mainly water.
169
The weight change of adhesives was higher than that of the water-borne paint A and they also caused a more pronounced change in the relative humidity of the chamber air when applied onto glass plates. Thus, the water to solid -ratio of adhesives is higher than that of the paint, and probably also of other water-borne paints, but their area specific emission rates were lower especially at one day compared with paint A. The weight change of the alkyd paint spread onto a glass plate was rather unaffected by the relative humidity. This also holds true for the water-mixable plaster with a polymer binder. The gypsum board, which had been stored at approximately RH 30 % before the start of the testing adsorbed moisture from the surroundings when stored at RH 80 %. The weight change of the combinations of water-borne primer and paint or adhesives applied onto gypsum board was smaller than when the products were applied onto a glass plate. This holds true also for the VOC-emissions. The differences in the relative weight changes were also bigger between the different relative humidities. The cause of this is that the gypsum board had adsorbed some of the water in the primer, paint and adhesive during application, which was released by a rather slow process. When a water-borne primer and paint or an adhesive were spread onto the combination of filler and plaster or a single layer of plaster which were applied onto calcium silicate bricks, the effect of the moisture content of the plaster on the weight change was considerable indicating that the plaster may also influence the VOC-emissions. The weight change of the different materials and material combinations is, at least as far as water-based products are concerned, related mainly to their drying, i.e. water evaporation from the samples. The evaporation process seems, on the other hand, to be interrelated with the emission of VOCs especially from the plasters, but this seems also to hold true for the other materials. The emissions from e.g. adhesive B was high at RH 80 % target relative humidity at 7 days, when the drying process in the climate chamber was still going on. Otherwise it is difficult to relate the weight change to the emission of VOCs. For instance, the combination of primer and paint A had a bigger relative weight change than the combination of primer and paint B, which indicates that there could be less volatile constituents left at the end of the testing period in the combination of primer and paint A, but the TVOCSERa at 14 days of the combination of primer and paint A was much higher than that of the combination of primer and paint B. This same trend holds true for e.g. the combination of filler and plaster B compared with the single layer of plaster C. Adhesives applied onto glass plates and gypsum board caused a higher increase in the relative humidity than did the combination of water-borne primers and paints, which was also reflected in the relative weight changes. The water-borne primers and paints spread onto glass plates affected markedly only the relative humidity of the RH 80 % target relative humidity chamber, in contrast to the case when the combinations of primer and paint were spread onto gypsum board. This indicates that the increase in the relative humidity generated by the primer and paint spread onto a glass plate lasts longer in the high relative humidity compared
170
with the RH 50 % and RH 20 % target relative humidity chambers and also that the gypsum board adsorbs some of the water in the primer, paint and adhesive which is later released. The measured relative humidities were, thus, in concordance with the weight change results. The relative humidity of primer and paint A was unfortunately recorded only for the first two hours after the introduction of the sample into the test chamber. However, it was > 95 % in all three target relative humidities during that time. Adhesives, and especially plaster C and the combinations of filler and plaster A and B, raised the relative humidity of especially the RH 80 %, but also the RH 50 % target relative humidity chambers, to 100 % for several days. This is consistent with the observed relative weight changes as far as the adhesives are concerned. The chambers of RH 50 % and RH 80 % target relative humidities also had observable condensation on their walls and lid. The high relative humidity caused by the plasters was not reflected as distinctly in their relative weight changes because the mass of the water in relation to the mass of the solids is much smaller in plasters compared with the adhesives. The water to solids ratio for plasters A and C were 0.32 and 0.52, respectively. The average amount of constituents evaporated from adhesives A and C in relation to their initial weight were 0.76 and 0.81, respectively. The water to solids ratio of the adhesives is probably even higher, since they were not completely dry at the end of the testing period. The relative humidity profiles of the water-borne products were also similar to what has been presented in the literature on the emission profile during evaporation (TICHENOR & GUO 1991, CHANG & GUO 1992, YU & CRUMP 1998, HUANG & HAGHIGHAT 2002, LEE ET AL. 2003), i.e. a rapid increase followed by a rapid decrease and that the peak value is achieved during the first hours of the emission process. This was valid especially for materials spread onto dry surfaces, i.e. glass or gypsum board. The humidity profiles also revealed that the higher the relative humidity of the surrounding air the longer was the drying process of water-based materials, as expected. However, this affects also the emission profiles, since the TVOCSERa, of adhesive C was higher at 14 and even 28 days when stored at RH 50 % and RH 80 % target relative humidities than at RH 20 %. This also holds true for plaster A and adhesive B at 7 and 14 days. 8.2 VOC EMISSIONS The behaviour of single material layers on substrates including glass, aluminium, stainless steel, wood products, and gypsum board has been studied extensively during the last years (JØRGENSEN ET AL. 1995, ROACHE ET AL. 1996, CHANG ET AL. 1997, SPARKS ET AL. 1999, KWOK ET AL. 2003) There have also been also quite many studies on the emissions from actual buildings, e.g. (BLUYSSEN ET AL. 1996, PEJTERSEN ET AL. 2001, TUOMAINEN ET AL. 2001, SAARELA ET AL. 2003, PARK & IKEDA 2004, RAW ET AL. 2004), but no attempts to study the behaviour of several material layers on different substrates, as is the case in actual

171
structural components, in controlled laboratory conditions has been done so far, floors excluded. Furthermore, only two reports where the influence of the relative humidity of the surrounding air on the emissions from structures in actual buildings have been found. FELLIN & OTSON (1994) conducted a nationwide study of indoor air in Canadian residences. They found only a weak correlation between indoor relative humidity and VOC concentration levels. The result was valid for individual VOCs also. However, the authors did not give any detailed information of the age of the residences or the materials used. The study of JÄRNSTRÖM &
SAARELA (2005) on the emissions from structures in eight buildings built according to today's good practice, including humidity control of the structures and selection of low-emitting materials (CIC 2001), showed that higher emissions were measured from building structures than from individual materials tested at laboratory conditions. This was explained by the fact that a material in a real structure is affected by its surroundings, i.e. the humidity and temperature of the structure and its surrounding air. When single material layers were applied onto glass plates in this present study, the emission pattern of TVOC and single compounds generally fluctuated quite much both with the relative humidity of the storing conditions and the point of time of sample collection and no clear trend between the TVOCSERa and the SERa of single compounds could be established. This result is consistent with the findings by HAGHIGHAT & DE BELLIS (1998) and applies to all materials studied. There are, however, three trends that could be observed. First, the TVOCSERa of the water-borne paint, paint A, was higher the higher the relative humidity of the surrounding air irrespective of the point of time of sample collection when samples were collected from the test chamber air. Second, the TVOCSERa of the alkyd paint, paint C, was rather unaffected by the relative humidity of the surrounding air, even though there were fluctuations in the emission patterns of single compounds. Third, the emissions from plasters A and C were markedly affected by the condensation of water on the test chambers' inner surfaces that they generated. CHANG & GUO (1998) found in their study on aldehyde emissions from three different alkyd paints that their main target compound hexanal, as well as other odorous aldehydes, is formed after painting during the air-drying period. The existence of this phenomenon was confirmed based on the results from the bulk analysis of the paints where no hexanal was detected. The emitted amount of hexanal was more than 2 mg/g. They also noticed that each paint studied had a different set of values for the first order reaction rate constants modelling the hexanal formation. Hexanal was not the only aldehyde emitted, as was mentioned. Other aldehyde emissions such as pentanal and propanal were also detected. These compounds have very low odour threshold values. The combination of those aldehydes and indoor sink effects can result in strong and irritating odour that lasts for weeks. This is consistent with the findings in this present study and hexanal was, indeed, the most abundant aldehyde emitted from the alkyd paint.
172
A statistical analysis confirmed that the emission results of the two sample collection methods, samples collected from the test chamber air and samples collected using the FLEC-cell, did not differ from each other. This applies both to TVOCSERa-values and to single compounds, which were separated according to chemical groups in the analysis. The result implies that the test chambers did not act as significant sinks. When material combinations were applied onto glass plates, the emission pattern of TVOC and single compounds still fluctuated quite much both with the relative humidity of the storing conditions and the point of time of sample collection, and no clear trend between the TVOCSERa and the SERa of single compounds could be established. There are, however, two results that need special attention. The TVOCSERa of the combination of primer and paint A and the combination of filler and plaster B was markedly elevated still at 14 days, even though the materials have been classified as low-emitting. It can, however, only be speculated what their emission level would be at 28 days, which is the classification time. Nevertheless, the TVOCSERa of paint A spread onto glass plate was 20 μg/m²·h and 15 μg/m²·h at 14 and 28 days for the sample stored at the RH 50 % target relative humidity, while the corresponding value at 14 days for the combination of primer and paint A was 1200 μg/m²·h for samples collected from the test chamber. The TVOCSERa of the combination of primer and paint B was 26 μg/m²·h at 14 days at the RH 50 % target relative humidity, which is approximately equal to the value of paint A. For comparison, the TVOCSERa of the combination of filler and plaster B at the RH 50 % target relative humidity at 14 days was 1335 μg/m²·h, when the corresponding values for the combination of filler and plaster A and a single layer of plaster C were 275 and 72 μg/m²·h , respectively. It is, however, to be noted that the measured relative humidities were 98±3 %, 55±5 %, and 99±3 %, respectively, i.e. in two cases quite different from the target relative humidity of 50±5 %. Another interesting result is that the emissions from the combination of primer A and paint C include compounds that are typical for both the water-borne primer and the alkyd paint. It can also be noted that the TVOCSERa-value is higher the higher the relative humidity of the storing conditions irrespective of the point of time of sample collection for samples collected from the test chambers. A statistical analysis indicated that the emission rate of aldehydes was higher for samples stored at the RH 80 % target relative humidity than for samples stored at the RH 20 % target relative humidity. This result was valid only for samples collected from the test chambers. There was no statistical difference in the TVOCSERa-values or the SERa of single compounds separated according to chemical groups of the two sample collection methods. The result implies that the test chambers did not act as significant sinks. When the combinations of primer and paint A or B or adhesives A or B were applied onto gypsum board, the emissions were lower than when they were spread onto glass plates. What is, however, noteworthy is that the emissions from the paints spread onto gypsum board were higher at 14 days than at 7 days. This was not the case for the adhesives. The emission pattern concerning the emissions from paints have been studied by CHANG ET AL. (1997), JØRGENSEN
173
ET AL. (1995), and SPARKS ET AL. (1999) among others. Their results also showed that the emissions from an inert substrate, stainless steel and aluminium, were initially higher, but at later ages, i.e. over 30 days, the emissions from the gypsum board could still be significant, or at least higher, than from the inert substrate. Furthermore, CHANG ET AL. (1997) reported that the composition of VOCs emitted were dramatically different on the two substrates studied, i.e. stainless steel and gypsum board. Ethylene glycol dominated the VOC emissions for the first 100 h and Texanol was the dominant VOC thereafter when stainless steel was the substrate. The trend was reversed when gypsum board was the substrate. This trend is, however, not observed in this present study. A statistical analysis indicated that there was no significant difference in the TVOCSERa-values of the samples collected with the two different sample collection methods. However, the same test indicated there was a difference in the SERa of ketones being higher for samples collected using the FLEC-cell than for samples collected from the test chambers, when they were stored at the RH 20 % target relative humidity. When the combinations of primer and paint A or B or adhesives A or B were applied onto the combination of filler and plaster B or a single layer of plaster C, which were applied onto calcium silicate bricks, the emissions were higher when applied onto the combination of filler and plaster B than when applied onto plaster C. Furthermore, the emissions were higher when the combinations of primer and paint or adhesives were applied onto plaster C then when applied onto gypsum board. How much the results are affected by the different retention capacities of the substrates, their porosity characteristics, specific emissions, and moisture conditions is difficult to deduce. WESCHLER & SHIELDS (1997) reported that the relative humidity determines both the gas phase concentration of water and the absence, presence, and thickness of aqueous surface films. The former influences homogenous (gas phase) hydrolysis reactions while the latter influences the surface removal rates of numerous hydrophilic chemicals in the air. They reported further that homogenous processes are influenced by the nature of the surface, i.e. polar surfaces attract polar VOCs and water while non-polar surfaces attract non-polar VOCs and repel water. The emission results from this present study show that the high relative humidity of the surrounding air affects the emission rates, the emission profile of a sample quite often change with time in relation to the measured relative humidity of the test chamber air. However, the polarity of the material surfaces studied and hydrolysis reactions have not been clarified in this project. On the other hand, WON ET AL. (2001) reported that virgin gypsum board was observed to be a significant sink for highly polar VOCs and would, thus, be highly polar itself. This finding is consistent with the results obtained by GEHRIG ET AL. (1993) and CHANG ET AL. (1997) who noticed that compounds with more polar oxygen containing functional groups show lower emissions from gypsum board and wood chip wall paper than from glass or stainless steel. A statistical analysis of the emission results from this present study indicated that the emission rate of alcohol and phenol ethers emitted from the combinations of primer and paint A and B was higher from the glass plate than from the gypsum board for samples stored at RH 20 % target

174
relative humidity. On the other hand, the emission rate of aromatic hydrocarbons emitted from adhesives A and B was higher when they were applied onto glass plate than onto gypsum board both at the RH 20 % and RH 50 % target relative humidities for samples collected from the test chambers. The emissions were, especially regarding adhesives, also influenced by the emissions from the substrate, all three substrates, i.e. the combination of filler and plaster B, plaster C, and gypsum board, included. A statistical analysis indicated that there was a strong interaction of filler and plaster and the relative humidity of the surrounding air influencing the TVOCSERa of the structures when the combinations of primer and paint A or B were spread onto the combination of filler and plaster B or a single layer of plaster C that was applied onto calcium silicate brick. A response prediction plot indicated further that the TVOCSERa increases with increasing relative humidity of the surrounding air. The analysis indicated further that there was a strong interaction of relative humidity and the point of time of sample collection on the TVOCSERa of the structures when adhesives A or B were applied onto the combination of filler and plaster B or a single layer of plaster C that was applied onto calcium silicate brick. Contrary to what was observed for the combinations of primer and paint, a response prediction plot indicated that the TVOCSERa decreases with increasing relative humidity of the surrounding air. It could also be deduced that there was no statistically significant difference between the two sample collection methods regarding TVOCSERa. However, there was a difference in that sample collection methods for aldehydes and ketones being higher for samples collected using the FLEC-cell than for samples collected from the test chambers when the structures were stored at the RH 20 % target relative humidity. The difference in the emission rates of aldehydes and ketones between the two sample collection methods could be a consequence of the higher humidity of the air introduced into the FLEC-cell compared with that of the test chambers. The measured relative humidity of the chamber was the same as the target relative humidity ±5 % RH when gypsum board was the substrate and it was between 30 % and 45 % when the combination of filler and plaster was the substrate, while the relative humidity of the air introduced into the FLEC-cell was 50±5 %. On the other hand, this does not explain why there was no statistically significant difference in the results in Parts I and II of this study, when single material layers or material combinations were applied onto glass plate. One possible explanation could be different retention capacities of the different materials. It can be concluded about the two different sample collection methods that the emission results achieved using the FLEC-cell were in general comparable with samples collected from the environmental chamber air. This finding is consistent with the results obtained by AFSHARI ET AL. (2003) who compared the VOC emission rate of an alkyd paint from three small test chambers, i.e. a 1-m³ chamber, a CLIMPAQ, and the FLEC-cell. Also KNUDSEN ET
175
AL. (1999) who compared the VOC emissions from five building materials (nylon carpet, PVC flooring, floor varnish, sealant, and a water-borne wall paint) using a CLIMPAQ with the results from a study by WOLKOFF ET AL. (1998) who collected the VOCs from the same materials using a FLEC-cell reached a similar result. However, ROACHE ET AL. (1996) studied the emissions from a floor wax and a latex paint using a 53-litre test chamber and the FLEC-cell. They reached consistent results for the floor wax applied onto glass with the two different chambers, but the emission rates from the latex paint applied onto gypsum board were not comparable. The emission rate of TVOC for the FLEC was generally higher than that from the test chamber. The discrepancy could be attributed to the freshness of the painted surface and the substrate according to the authors. The tests lasted for two weeks. Nevertheless, the comparability of the test results from the two different sample collection methods in this present study indicates that the test chambers did not act as significant sinks. The only discrepancies occurred, besides to what was referred to in the preceding paragraphs about aldehydes and ketones, also at high SERa-values of a specific compound, typically 1,2-propanediol, aldehydes, and acids. Then the SERa were generally higher for samples collected using the FLEC-cell. This could be a result of the differences in the relative humidities being introduced into the chambers, i.e. the relative humidity during sample collection from the test chambers was the same as the measured relative humidity of the chamber air ±5 % RH, while the relative humidity introduced into the FLEC-cell was 50±5 % RH. Thus, the finding by JÄRNSTRÖM & SAARELA (2005) who concluded that higher emissions were measured from building structures than from individual materials tested at laboratory conditions is probably a result indicated by this present study, i.e. material combinations act as entities, not as the sum of single material layers. A material in a real structure is affected by its surroundings, i.e. the humidity and temperature of the structure and its surrounding air, but also of the physical and chemical characteristics, i.e. porosity, emissions, moisture content, etc. of the materials included. One of the objectives of the experimental part of this study was to verify if it is possible to achieve a low emission rate with different material combinations. A target value of 30 μg/m²·h was set. The material combinations that fulfil the target value for samples collected from the test chambers at 14 days were: - primer and paint B spread onto gypsum board or plaster C applied onto calcium silicate brick irrespective of the storing conditions, - primer and paint B spread onto the combination of filler and plaster B stored at RH 20 % target relative humidity, - adhesive A applied onto gypsum board or plaster C which was applied onto calcium silicate brick irrespective of the storing conditions, - adhesive B spread onto gypsum board and stored at RH 20 % or RH 50 % target relative humidities.
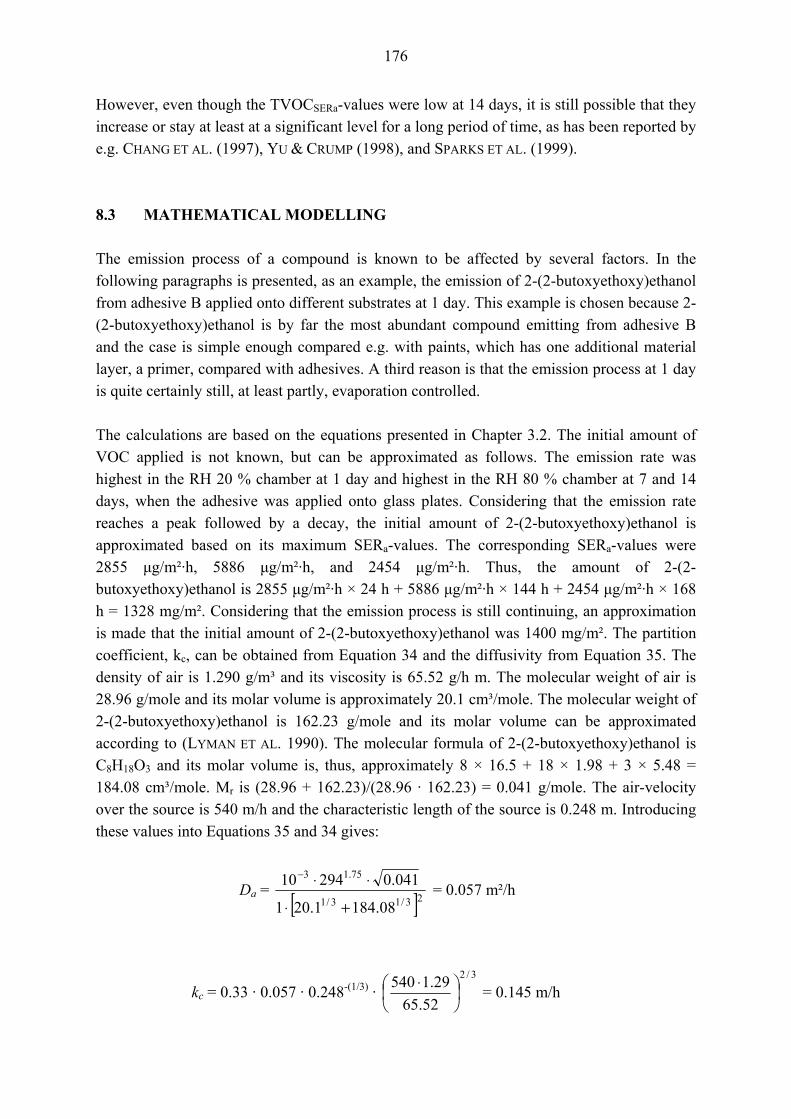
176
However, even though the TVOCSERa-values were low at 14 days, it is still possible that they increase or stay at least at a significant level for a long period of time, as has been reported by e.g. CHANG ET AL. (1997), YU & CRUMP (1998), and SPARKS ET AL. (1999). 8.3 MATHEMATICAL MODELLING The emission process of a compound is known to be affected by several factors. In the following paragraphs is presented, as an example, the emission of 2-(2-butoxyethoxy)ethanol from adhesive B applied onto different substrates at 1 day. This example is chosen because 2-(2-butoxyethoxy)ethanol is by far the most abundant compound emitting from adhesive B and the case is simple enough compared e.g. with paints, which has one additional material layer, a primer, compared with adhesives. A third reason is that the emission process at 1 day is quite certainly still, at least partly, evaporation controlled. The calculations are based on the equations presented in Chapter 3.2. The initial amount of VOC applied is not known, but can be approximated as follows. The emission rate was highest in the RH 20 % chamber at 1 day and highest in the RH 80 % chamber at 7 and 14 days, when the adhesive was applied onto glass plates. Considering that the emission rate reaches a peak followed by a decay, the initial amount of 2-(2-butoxyethoxy)ethanol is approximated based on its maximum SERa-values. The corresponding SERa-values were 2855 μg/m²·h, 5886 μg/m²·h, and 2454 μg/m²·h. Thus, the amount of 2-(2-butoxyethoxy)ethanol is 2855 μg/m²·h × 24 h + 5886 μg/m²·h × 144 h + 2454 μg/m²·h × 168 h = 1328 mg/m². Considering that the emission process is still continuing, an approximation is made that the initial amount of 2-(2-butoxyethoxy)ethanol was 1400 mg/m². The partition coefficient, kc, can be obtained from Equation 34 and the diffusivity from Equation 35. The density of air is 1.290 g/m³ and its viscosity is 65.52 g/h m. The molecular weight of air is 28.96 g/mole and its molar volume is approximately 20.1 cm³/mole. The molecular weight of 2-(2-butoxyethoxy)ethanol is 162.23 g/mole and its molar volume can be approximated according to (LYMAN ET AL. 1990). The molecular formula of 2-(2-butoxyethoxy)ethanol is C8H18O3 and its molar volume is, thus, approximately 8 × 16.5 + 18 × 1.98 + 3 × 5.48 = 184.08 cm³/mole. Mr is (28.96 + 162.23)/(28.96 · 162.23) = 0.041 g/mole. The air-velocity over the source is 540 m/h and the characteristic length of the source is 0.248 m. Introducing these values into Equations 35 and 34 gives:
Da = [ ]23/13/1
75.13
08.1841.201
041.029410
+⋅
⋅⋅− = 0.057 m²/h
kc = 0.33 · 0.057 · 0.248-(1/3) · 3/2
52.6529.1540
⎟⎠⎞
⎜⎝⎛ ⋅ = 0.145 m/h

177
Assuming that the concentration at the surface of the sample is the same as its bulk concentration and assuming further, based on the conclusion by HANSEN (1974) that the loss of volatile material from, in his case water-based latex coatings, is a surface phenomenon controlled by surface resistance and not by internal diffusion at least at early age (SULLIVAN 1975), the calculations according to Equation 9 give the following results presented in Table 70. When examining the results presented in Table 70 it can be observed that the calculated values are higher than the measured ones. At least two factors affect the result: the approximation of the initial amount of 2-(2-butoxyethoxy)ethanol in the product could be too high or the emission process is no longer evaporation controlled. At least one thing supports the latter argument, since the results are closest in size for the case when the adhesive was spread onto plaster C, which caused a higher moisture content in the environmental chamber than when the adhesive was spread onto the combination of filler and plaster B. Two other factors that might affect the result, but which have not been taken into consideration in the calculations, are the retention capacities of the substrates and the sink effects on the chamber walls. The latter one is more troublesome to evaluate, since the influence of adsorbed moisture on the adsorption of 2-(2-butoxyethoxy)ethanol should be clarified first, and is, as such, outside the scope of this study. Partition coefficients based on the studies by Meininghaus for some VOCs were presented in Table 6. The partition coefficients for m-xylene, n-octane, and ethyl acetate emitted from gypsum board varied from 0.010 to 0.133, respectively. Applying for instance the value of ethyl acetate would give the following results: 995 μg/m²·h, 989 μg/m²·h and 826 μg/m²·h at RH 20 %, RH 50 %, and RH 80 % target relative humidities, respectively. No further efforts to model the emissions are made, since there are so many different factors affecting the emission process and a full model that would take all these factors into consideration simultaneously would require a separate study. Table 70. The calculated and measured SERa of 2-(2-butoxyethoxy)ethanol (μg/m²·h) emitted from adhesive B spread onto different substrates. cw is the concentration at the surface (kg/m³), c∞ is the concentration in the bulk air, and Ew is the emission rate (μg/m²·h).
Ew calculated Ew measured Substrate RH 20 % RH 50 % RH 80 % RH 20 % RH 50 % RH 80 %
Glass 8537 6043 4158 2855 1986 1350 Gypsum board 1085 1078 900 346 343 286 Filller and plaster B on CSB1)
7471 - 5260 2480 1720
Plaster C on CSB1) 21117 16484 - 17250 12900 1) CSB denotes calcium silicate brick

178
9 SUMMARY This study has concentrated on the VOC-emissions from paints and adhesives applied onto different substrates and kept at specific relative humidities. The substrates used were glass, gypsum board, and a combination of a filler and plaster or a single layer of plaster applied onto calcium silicate brick. The target relative humidities at the start of a test, i.e. when a sample was introduced into an environmental test chamber, were 20 %, 50 %, and 80 %. These cover the relative humidities normally encountered in the Nordic countries. When houses are heated during the winter season, the relative humidity tends to decrease to approximately 20 %, or even lower. The high relative humidity is encountered, except during the summer time, also during a construction period when water-based materials such as concrete, mortars, and plasters are used. The first part of this study consists of a theoretical review, which covers the following topics: a general description of the materials studied, VOC emissions from materials and structures, and the influence of moisture on VOC emissions. Mathematical expressions for the emission process were also presented. The literature study indicated that the emission rate of indoor contaminants is affected by the emitted compounds and their concentration and distribution, humidity, surface velocity, air exchange rate, temperature, substrate, material loading factors, and sinks. The emission process can be roughly divided into two rate limiting steps: evaporation and diffusion. Evaporation occurs from liquid materials and is usually rapid in the beginning reaching a peak after typically 0.5-3 hours. It is expressed as a function of the convective mass transfer coefficient. The peak is followed by a rapid decline and the emissions reach a steady level within hours or some days depending on the material in question. Major factors controlling evaporation are vapour pressure differences, surface velocity, temperature and humidity. Evaporation is followed by a diffusion controlled process, which is also the major rate limiting process for initially dry materials. Diffusion is expressed as a function of the diffusion coefficient. It is a slow process compared with evaporation and major factors controlling it are concentration differences, the size and structure of the migrating molecule, the structure of the material, temperature, and relative humidity. The interaction of functional groups of the emitting compounds with water molecules on the surface of a substrate also affects the emission process. As a consequence the quantity and composition of compounds emitted to the surrounding air may differ from one case to another depending on moisture content of a material and the substrate it is applied onto and the relative humidity of the surrounding air. These factors are important to include when analysing emission data, since moisture can enable, promote, or change chemical and physical processes in building materials.

179
Initial experiments were conducted to characterise some physical and chemical properties of the materials studied and to clarify the influence of moisture conditions and substrate on the VOC-emissions. The physical and chemical characterisation included FTIR-analysis, light and electron microscopy, the latter together with element analysis, mercury intrusion porosimetry, and the determination of the pH of selected samples using a pH-indicator liquid. The FTIR-results showed that, even though the spectral bands of similar products, e.g. the two water-borne paints, assigned the same components, the peak values occurred at somewhat different wavenumbers indicating differences in the compositions. Similar products emitted also somewhat different compounds and were, thus, not as similar as could be deduced from their product declarations. Mercury intrusion porosimetry showed that the plasters studied have quite different specific surface areas. It influences at least the amount of available adsorption sites for VOCs and water molecules. However, a relationship between specific surface area and i.e. adsorption of VOCs was not established. Another material specific factor affecting VOC emissions is its retention capacity, but the retention capacities of the different substrates were not clarified. Environmental test chambers were designed by the author to meet the requirements in the European standards for VOC emission testing. Other requirements were: the chambers should be easy to assemble and clean, the relative humidity of the chamber air should be easy to adjust, the flow conditions should be easily controlled, and the surface area of the samples should be big enough for the FLEC-cell. The experiments for the clarification of the effect of moisture and substrate on the VOC-emissions included, besides VOC sample collection from test chambers and by using the FLEC-cell, also weighing of the samples studied, recording of the relative humidity of the chamber air during sample storage, and olfactory evaluation. The emission tests showed that the combination of primer and paint spread onto a glass plate gives rise to elevated emissions compared with only a single paint layer, i.e. that two or more materials in close contact act more like one material rather than two separate materials. This was also indicated by the weight change and the relative humidity measurements. The difference in the emission rates can be up to two orders of magnitude. The emission testing of material combinations also showed that the emissions are made up of the characteristic emissions of both the paint and the primer. When the combinations of primer and paint or adhesives were applied onto gypsum board, the emissions were lower than when they were spread onto glass plates. What is, however, noteworthy is that the emissions from the combinations of primer and paint spread onto gypsum board were higher at 14 days than at 7 days. This was, however, not the case for the adhesives.
180
When the combinations of primer and paint or adhesives were applied onto a combination of filler and plaster or a single plaster layer which was applied onto calcium silicate brick, the emission results were strongly affected by the substrate still being higher than when the combinations of primer and paint or adhesives were applied onto gypsum board. The emissions were, especially for adhesives, also influenced by the emissions from the substrate. This holds true for all three substrates. A statistical analysis indicated that the three most influential factors affecting the TVOC-value were the emission characteristics of the combination of primer and paint or adhesive applied (did it have low or high emission rates), the emission characteristics of the combination of filler and plaster used, and the sample collection point of time. Furthermore, there was a strong interaction of filler and plaster and the relative humidity of the surrounding air influencing the TVOCSERa of the structures for the different combinations of primer and paint. A response prediction plot indicated that the TVOCSERa increases with increasing relative humidity of the surrounding air. The analysis indicated further that there was a strong interaction of relative humidity and the point of time of sample collection on the TVOCSERa of the structures for the different adhesives. Contrary to what was observed for the combinations of primer and paint, a response prediction plot indicated that the TVOCSERa of the structure decreases with increasing relative humidity of the surrounding air. It can be concluded about the two different sample collection methods that the emission results achieved using the FLEC-cell were in general comparable with samples collected from the environmental chamber air. This indicates that the test chambers did not act as significant sinks. The most abundant chemicals or chemical groups emitted from the different products applied onto glass plates are presented in Table 71. Table 71. The materials used in this study and their main emissions.
Material Emitted compounds Primer and paint A, water-borne acrylic latex products
1,2-propanediol, texanol, glycol ethers
Primer and paint B, a water-borne acrylic latex products
1,2-propanediol, glycol ethers, acetic acid
Primer A and paint C, a water-borne acrylic latex primer and an alkyd resin paint
Aliphatic and alicyclic hydrocarbons, 1,2-propanediol, aldehydes, ketones, acids, texanol
Primer and paint C, alkyd resin products Aliphatic and alicyclic hydrocarbons, aldehydes, acids
Adhesive A, water-borne PVAc-dispersion product Acetic acid Adhesive B, water-borne PVAc-dispersion product Glycol ethers, acetic acid Adhesive C, water-borne PVC-dispersion product1) 1,2-propanediol, acetic acid Filler and plaster A, polymer binder, water mixable Alcohols, 1,2-propanediol, glycol ethers Filler and plaster B, polymer binder, ready-mixed Alcohols, glycol ethers, esters, nitrogen
containing compounds Plaster C, gypsum binder, water mixable Acetone, acetic acid Gypsum board Aldehydes, halogen containing compounds
1) According to the manufacturer's information

181
10 CONCLUSIONS The experimental part of this study concentrated on clarifying the influence of the relative humidity of the surrounding air and different substrates on the VOC emissions from paints and adhesives. The main results can be concluded as follows:
• It was confirmed that VOC emissions differ depending on the material included, the emitting compound, time, the relative humidity of the surrounding air, and the substrate. Thus, the TVOC-value should be treated with reservations when the emissions of single compounds are estimated.
• The emissions of VOCs from material combinations are affected strongly by the substrate, i.e. its physical and chemical characteristics have an effect on both the total emissions and the emission of single compounds from material combinations. The substrate effect has been shown to hold true for gypsum board in earlier studies, but in this study it has been shown to hold true for other substrates as well, including primers.
• The emissions from material combinations may not necessarily meet the TVOC-level set for a low emitting material even though the materials included have separately been classified as low-emitting. The last measuring point for material combinations was 14 days in this study, while the testing age for the classification tests is 28 days. The TVOC-value of, for instance, the combination of primer and paint A spread onto a glass plate was approximately 500 to 1000-times higher compared with a single layer of paint A at 14 days and it can only be speculated what the TVOC-value of the combination would be at 28 days.
• The three main factors influencing the emissions from the combination of primer and paint or adhesive applied onto a combination of filler and plaster applied onto calcium silicate bricks were: the emission characteristics from the combination of primer and paint or adhesive, the combination of filler and plaster, and the point of time of sample collection. When primers and paints were used, the emissions tended to increase with increasing relative humidity while adhesives indicated an opposite tendency. There was a strong interaction of the relative humidity and the combination of filler and plaster on the emissions when primers and paints were applied onto them and of relative humidity and time when adhesives were applied onto them.
• As a continuation to the preceding paragraph: when the combinations of primer and paint were applied onto different substrates the most abundant compounds emitted stemmed from the combination of primer and paint, irrespective of the substrate. When adhesives were applied onto different substrates, at least part of the most abundant compounds emitted stemmed from the substrate. However, when adhesives were applied onto gypsum board, the most abundant compounds differed from that when they were spread onto glass, but none of the most abundant compounds stemmed from the gypsum board.

182
• The influence of moisture on the emissions has been shown to be directed especially on the drying process rather than the relative humidity of the surrounding air. Only aldehydes emitting from different combinations of primer and paint applied onto glass were statistically significantly affected by the relative humidity of the surrounding air. On the other hand, a high relative humidity of the surrounding air prolongs the duration of the drying process, thus affecting the emission process.
• The FLEC-cell gave comparable results to what was obtained when samples were collected from the test chambers. The only statistically significant discrepancies occurred when aldehydes or ketones were emitted from combinations of primer and paint or adhesives were applied onto the combination of filler and plaster and when ketones were emitted from combinations of primer and paint or adhesives applied onto gypsum board for samples stored at the RH 20 % target relative humidity. This could be a consequence of the higher relative humidity of the air introduced into the FLEC-cell compared with that of the test chamber.
• It is possible to achieve very low emission rates in two weeks even when many different materials are combined in a structure by a proper choice of low emitting materials. The emissions from even a high emitting substrate can be reduced by a dense and low emitting top-layer, but a proper drying of the substrate has to be assured. However, even though the TVOCSERa-values were low at 14 days, it is still possible that they increase or stay at least at a significant level for a long period of time.
Based on the results of this study some suggestions for the future are:
• The relation between the drying process and emissions should be clarified more precisely by continuous monitoring of relative humidity and emissions and the results should be related to material and compound specific data, such as specific surface area and polarity.
• The influence of wetting a substrate should be clarified, i.e. it should be clarified how the emissions change in case of a water-damage. This would include the clarification of the emissions generated by hydrolytic degradation reactions.
• The influence of moisture on the emissions from other, e.g. wood-based, materials should be clarified.
• Material emission testing should encompass the testing of materials and material combinations on real substrates used in buildings instead of single material layers on inert substrates, which is common practice today. Then a concept of low-emitting structural components could be introduced. The emission testing in this case should include different relative humidities of the surrounding air.
• Test results from test chambers with actual structural components should be compared with field measurements.

183
REFERENCES AFSHARI, A., LUNDGREN, B. and EKBERG, L.E. (2003) Comparison of three small chamber test methods for the measurement of VOC emission rates from paint. Indoor Air, 13, 2, 156-165. AHOLA, P. (1993) Chemical and physical changes in paints or painted wood due to ageing. VTT Publications 155. Technical Research Centre of Finland. Espoo. Finland. 90 p. ANDERSEN, I., LUNDQVIST, G.R. and MØLHAVE, L. (1975) Indoor air pollution due to chipboard used as a construction material. Atmospheric Environment, 9, 12, 1121-1127. AMALI, S., PETERSEN, L.W. and ROLSTON, D.E. (1994) Modeling multicomponent volatile organic and water vapor adsorption on soils. Journal of Hazardous Materials, 36, 1, 89-108. BEEK, W. J., MUTTZALL, K.M.K. and VAN HEUVEN, J.W. (1999) Transport Phenomena, 2nd ed., John Wiley & Sons Ltd., England. 329 p. BERGE, A., MELLEGAARD, B., HANETHO, P. and ORMSTAD, E.B. (1980) Formaldehyde release from particleboard – evaluation of a mathematical model. Holz als Roh- und Werkstoff, 38, 7, 251-255. BERGLUND, B., BRUNEKREEF, B., KNÖPPEL, H., LINDVALL, T., MARONI, M., MØLHAVE, L. and SKOV, P. 1992. Effects of indoor air pollution on human health. Indoor Air, 2, 1, 2-25 BIRD, R.B., STEWART, W.E. and LIGHTFOOT, E.N. (2002) Transport Phenomena, 2nd ed., John Wiley & Sons Ltd., New York, U.S.A. 895 p. BLUYSSEN, P.M., DE OLIVEIRA FERNANDES, E., GROES, L., CLAUSEN, G., FANGER, P.O:, VALBJØRN, O., BERNHARD, C.A. and ROULET, C.A. (1996) European indoor air quality audit project in 56 office buildings. Indoor Air, 6, 4, 221-238. BODALAL, A., ZHANG, J.S. and PLETT, E.G. (2000) A method for measuring internal diffusion and equilibrium partition coefficients of volatile organic compounds for building materials. Building and Environment, 35, 2, 101-110. BROCK, T., GROTEKLAES, M. and MISCHKE, P. (2000) European Coatings Handbook. Vincentz Verlag, Hannover, Germany. 412 p. BUTLER, L.N., FELLOWS, C.M. and GILBERT, R.G. (2005) Effect of surfactants used for binder synthesis on the properties of latex paints. Progress in Organic Coatings. 53, 2, 112-118.
184
CALL, F. (1957) The mechanism of sorption of ethylene dibromide on moist soils. Journal of the Science of Food and Agriculture, 8, 630-639. CHANG, J.S.C. and GUO, Z. (1992) Characterisation of organic emissions from a wood finishing product – wood stain. Indoor Air, 2, 3, 146-153. CHANG, J.S.C. and GUO, Z. (1994) Modelling of alkane emissions from a wood stain. Indoor Air, 4, 1, 35-39. CHANG, J.S.C. and GUO, Z. (1998) Emissions of odorous aldehydes from alkyd paint. Atmospheric Environment, 32, 20, 3581-3586. CHANG, J.S.C., SPARKS, L.E., GUO, Z. and FORTMANN, R. (1998) Evaluation of sink effects on VOCs from a latex paint. Journal of the Air & Waste Management Association, 48, October, 953-958. CHANG, J.S.C., TICHENOR, B.A., GUO, Z. and KREBS, K.A. (1997) Substrate effects on VOC emissions from a latex paint. Indoor Air, 7, 4, 241-247. CIC. (2001) Classification of Indoor Climate 2000. Target values, design guidance and product requirements. Finnish Society of Indoor Air Quality and Climate (FiSIAQ). FiSIAQ Publication 5 E, Espoo, Finland. 40 p. CLAUSEN, P.A. (1993) Emission of volatile and semivolatile organic compounds from waterborne paints – the effect of the film thickness. Indoor Air, 3, 4, 269-275. COLOMBO, A., DE BETOLI, M., KNÖPPEL, H., PECCHIO, E. and VISSERS, H. (1993) Adsorption of selected volatile organic compounds on a carpet, a wall coating, and a gypsum board in a test chamber. Indoor Air, 3, 4, 276-282. COX, S., ZHAO, D. and LITTLE, J.C. (2001) Measuring partition and diffusion coefficients for volatile organic compounds in vinyl flooring. Atmospheric Environment, 35, 22, 3823-3830. COX, S., LITTLE, J.C. and HODGSON, A.T. (2002) Predicting the emission rate of volatile organic compounds from vinyl flooring. Environmental Science& Technology, 36, 4, 709-714. DUNN, J.E. and TICHENOR, B.A. (1988) Compensating for sink effects in emission test chambers by mathematical modeling. Atmospheric Environment, 22, 5, 885-894. ELLACOTT, M.V. & REED, S. (1999) Development of robust indoor air quality models for the estimation of volatile organic compound concentrations in buildings. Indoor and Built Environment, 8, 6, 345-360.
185
EN 923. (1998) Adhesives - terms and definitions. Brussels, 48 p. EN 927-1. (1996) Paints and varnishes. Coating materials and coating systems for exterior wood. Part 1: Classification and selection. Brussels, 10 p. EN 971-1. (1996) Paints and varnishes - Terms and definitions for coating materials - Part I: General terms. Brussels, 28 p. ENV 13419-1. (1999) Building products – determination of the emission of volatile organic compounds – Part 1: Emission test chamber method. European Committee for Standardisation. CEN/TC 264. Brussels. 17 p. ENV 13419-2. (1999) Building products – determination of the emission of volatile organic compounds – Part 2: Emission test cell method. European Committee for Standardisation. CEN/TC 264. Brussels. 19 p. FANG, L., CLAUSEN, G. and FANGER, P.O. (1998) Impact of temperature and humidity on the perception of indoor air quality. Indoor Air, 8, 2, 80-90. FANG, L., CLAUSEN, G. and FANGER, P.O. (1999) Impact of temperature and humidity on chemical and sensory emissions from building materials. Indoor Air, 9, 3, 193-201. FELLIN, P. and OTSON, R. (1994) Assessment of the influence of climatic factors on concentration levels of volatile organic compounds (VOCs) in Canadian homes. Atmospheric Environment, 28, 22, 3581-3586. FORTMANN, R., ROACHE, N., CHANG, J.S.C. and GUO, Z. (1998) Characterisation of emissions of volatile organic compounds from interior alkyd paint. Journal of the Air & Waste Management Association, 48, October, 931-940. FULLER, E.N., SCHETTLER, P.D. and GIDDINGS, J.C. (1966) A new method for prediction of binary gas-phase diffusion coefficients. Industrial and Engineering Chemistry, 58, 5, 19-27. GEHRIG, R., HILL, M., ZELLWEGER and C., HOFER, P. (1993) VOC-emissions from wall paints - a test chamber study. In: Indoor Air '93. Proceedings of the 6th International Conference on Indoor Air Quality and Climate, July 4-8, 1993, Helsinki, Finland. Vol. 2. 431-436. GIRMAN, J.R., HODGSON, A.T. and NEWTON, A.S. (1986) Emissions of volatile organic compounds from adhesives with indoor application. Environment International, 12, 317-321. GODISH, T. and ROUCH, J. (1987) An assessment of the Berge equation applied to formaldehyde measurements under controlled conditions of temperature and humidity in a mobile home. Journal of the Air Pollution Control Association, 35, 11, 1186-1187.

186
GOSS, K-U. (1992) Effects of temperature and relative humidity on the sorption of organic vapors on quartz sand. Environmental Science & Technology, 26, 11, 2287-2294. GOSS, K-U. (1993) Effects of temperature and relative humidity on the sorption of organic vapors on clay minerals. Environmental Science & Technology, 27, 10, 2127-2132. GOSS, K-U. and EISENREICH, S.J. (1996) Adsorption of volatile organic compounds from the gas phase to different minerals and a mineral mixture. Environmental Science & Technology, 30, 7, 2135-2142. GRIGSBY, W.J., FERGUSON, C.J., FRANICH, R.A. and RUSSELL, G.T. (2005) Evaluation of latex adhesives containing hydrophobic cores and poly(vinyl acetate) shells: potential to improve poly(vinyl acetate) performance. International Journal of Adhesion & Adhesives, 25, 2, 127-137. GUNNARSEN, L. (1997) The influence of area-specific ventilation rate on the emissions from construction products. Indoor Air, 7, 2, 116-120. GUO, H. and MURRAY, F. (2000) Characterisation of total volatile organic compound emissions from paints. Clean Products and Processes, 2, 1, 28-36. GUO, Z., SPARKS, L.E., TICHENOR, B.A.and CHANG, J.C.S. (1998) Predicting the emissions of individual VOCs from petroleum-based indoor coatings. Atmospheric Environment, 32, 2, 231-237. GUO, Z., SPARKS, L.E., CHANG, J.C.S., SPARKS, L.E. and FORTMANN, R.C. (1999) Estimation of the rate of VOC emissions from solvent-based indoor coating materials based on product formulation. Atmospheric Environment, 33, 2, 1205-1215. HAGHIGHAT, F. and DE BELLIS, L. (1998) Material emission rates: literature review, and the impact of indoor air temperature and relative humidity. Building and Environment, 33, 5, 261-277. HANSEN, C.M. (1974) The air drying of latex coatings. Industrial & Engineering Chemistry Product Research and Development, 13, 2, 150-152. HAWTHORNE, A.R. and MATTHEWS, T.G. (1987) Models for estimating organic emissions from building materials: formaldehyde example. Atmospheric Environment, 21, 2, 419-424. HE, G., YANG, X. and SHAW, C.Y. (2004) Material emission parameters obtained through regression. Indoor and Built Environment, 14, 1, 59-68.

187
HELLGREN, A-C., WEISSENBORN, P. and HOLMBERG, K. (1999) Surfactants in water-borne paints. Progress in Organic Coatings. 35, 1-4, 79-87. HUANG, H. and HAGHIGHAT, F. (2002) Modelling of volatile organic compounds emission from dry building materials. Building and Environment, 37, 12, 1349-1360. HUDNELL, H.K., OTTO, D.A., HOUSE, D.E. and MØLHAVE, L. (1992) Exposure of humans to a volatile organic mixture. II. Sensory. Archives of Environmental Health, 47, 1, 31-38. ISO 16000-6. (2004) Indoor air -- Part 6: Determination of volatile organic compounds in indoor and test chamber air by active sampling on Tenax TA sorbent, thermal desorption and gas chromatography using MS/FID, 25 p. JAYJOCK, M.A. (1994) Back pressure modeling of indoor air concentrations from volatilizing sources. American Industrial Hygiene Association Journal, 55, 3, 230-235. JOHNSEN, C.R., HEINIG, J.H., SCHMIDT, K., ALBRECHTSEN, O., NIELSEN, P.A., WOLKOFF, P., NIELSEN, G.D., HANSEN, L.F. and FRANCK, C. (1991) A study of human reactions to emissions from building materials in climate chambers. Part I: clinical data, performance and comfort. Indoor Air, 1, 4, 377-388. JÄRNSTRÖM, H. and SAARELA, K. (2005) Indoor air quality and material emissions in new buildings. VTT Research Notes 2281, Espoo, Finland. 100 p. (In Finnish) JØRGENSEN, R.B., BJØRSETH, O. and MALVIK, B. (1995) Emissions from wall paints - the influence of the wall material. In: Healthy Buildings '95. Proceedings of the 5th International Conference on Healthy Buildings, September 10-14, 1995, Milano, Italy. 977-982. JØRGENSEN, R.B., BJØRSETH, O. and MALVIK, B. (1999) Chamber testing of adsorption of volatile organic compounds (VOCs) on material surfaces. Indoor Air, 9, 1, 2-9. JØRGENSEN, R.B. and BJØRSETH, O. (1999) Sorption behaviour of volatile organic compounds on material surfaces – the influence of combinations of compounds and materials compared to single compounds and single materials. Environment International, 25, 1, 17-27. KIRCHNER, S., MAUPETIT, F., QUENARD, D., ROUXEL, P. and GIRAUD, D. (1995) Characterisation of adsorption/desorption of volatile organic compounds of indoor surface materials. In: Proceedings of Healthy Buildings, Milano 10-14 September 1995. Vol. 2. 953-958. KJÆRGAARD, S.K., MØLHAVE, L. and PEDERSEN, O.F. (1991) Human reactions to a mixture of indoor air volatile organic compounds. Atmospheric Environment, 25A, 8, 1417-1426.

188
KNUDSEN, H.N., KJÆR, U.D., NIELSEN, P.A. and WOLKOFF, P. (1999) Sensory and chemical characterization of VOC emissions from building products: impact of concentration and air velocity. Atmospheric Environment, 33, 8, 1217-1230. KORNUM, L.O. (1980) Evaporation and water-dilutable coatings. Journal of the Oil and Colour Chemists' Association (JOCCA), 63, 3, 103-123. KWOK, N-H, LEE, S-C, GUO, H. and HUNG, W-T. (2003) Substrate effects on VOC emissions from an interior finishing varnish. Building and Environment, 38, 8, 1019-1026. LEE, S-C., KWOK, N-H., GUO, H.and HUNG, W-T. (2003) The effect of wet film thickness on VOC emissions from a finishing varnish. The Science of the Total Environment, 302, 1-3, 75-84. LITTLE, J.C., HODGSON, A.T. and GADGIL, A.J. (1994) Modeling emissions of volatile organic compounds from new carpets. Atmospheric Environment, 28, 2, 227-234. LUNDGREN, B., JONSSON, B. and EK-OLAUSSON, B. (1999) Materials emission of chemicals-PVC flooring materials. Indoor Air, 9, 3, 202-208. LYMAN, W.J., REEHL, W.F. and ROSENBLATT, D. H. (1990) Handbook of chemical property estimation methods. Environmental behavior of organic compounds. American Chemical Society, Washington D.C., U.S.A. 960 p. (appr.) MEININGHAUS, R., SALTHAMMER and T., KNÖPPEL, H. (1999) Interaction of volatile organic compounds with indoor materials – a small-scale screening method. Atmospheric Environment, 33, 15, 2395-2401. MEININGHAUS, R., GUNNARSEN, L. and KNUDSEN, H.N. (2000a) Diffusion and sorption of volatile organic compounds in building materials. Environmental Science & Technology, 34, 15, 3101-3108. MEININGHAUS, R., KIRCHNER, S., MAUPETIT, F., SALLÉE, H. and QUENARD, D. (2000b) Gravimetric studies on VOC adsorption by indoor materials under near-ambient conditions. Indoor and Built Environment, 9, 5, 277-283. MEYER, B. (1979) Urea-formaldehyde resins. Addison-Wesley Publishing Company. Reading, Massachusetts. U.S.A. 423 p. MØLHAVE, L. (1991) Volatile organic compounds, indoor air quality and health. Indoor Air, 1, 4, 357-376.

189
MØLHAVE, L., BACH, B. and PEDERSEN,O.F. (1986) Human reactions to low levels of volatile organic compounds. Environment International, 12, 1-4, 167-175. MØLHAVE, L., SPARKS, L.E., WOLKOFF, P., CLAUSEN, P.A., NIELSEN, P.A. and BERSØ, N.C. (1996) The Danish twin apartment study - part II: Mathematical modeling of the relative strength of sources of indoor pollution. Indoor Air, 6, 1, 18-30. NERETNIEKS, I., CHRISTIANSSON, J., ROMERO, L., DEGERHOLT, L. and YU, J-W. (1993)
Modelling of emission and re-emission from building materials with indoor air applications. Indoor Air, 3, 1, 2-11. VAN NETTEN, C., SHIRTLIFFE, C. and SVEC, J. (1989) Temperature and humidity dependence of formaldehyde release from selected building materials. Bulletin of Environmental Contamination and Toxicology, 42, 4, 558-565. NIELSEN, G.D., HANSEN, L.F., HAMMER, M., VEJRUP, K.V. and WOLKOFF, P. (1997) Chemical and biological evaluation of building material emissions. I. A screening procedure based on a closed emission system. Indoor Air, 7, 1, 8-16. NIELSEN, P.A. (1987) Potential pollutants – their importance to the sick building syndrome – and their release mechanisms. In: Proceedings of the 4th International Conference on Indoor Air Quality and Climate, Berlin (West) 17-21 August 1987. Vol. 2, 598-602. NORBÄCK, D., TORGÉN, M. and EDLING, C. (1990) Volatile organic compounds, respirable dust, and personal factors related to prevalence and incidence of sick building syndrome in primary schools. British Journal of Industrial Medicine, 47, 11, 737-741. NYQUIST, R.A. and NAGEL, R.O. (1971) Infrared spectra of inorganic compounds. Academic Press. New York. 495 p. OKAMURA, J.P. and SAWYER, D.T. (1973) Gas chromatographic studies of sorptive interactions of normal and halogenated hydrocarbons with water-modified soil, silica, and Chromosorb W. Analytical Chemistry, 45, 1, 80-84. ONG, S.K. and LION, L.W. (1991) Mechanisms for trichloroethylene vapor sorption onto soil minerals. Journal of Environmental Quality, 20, 180-188. OTTO, D., MØLHAVE, L., ROSE, G., HUDNELL, H. K. and HOUSE, D. (1990) Neurobehavioral and sensory irritant effects of controlled exposure to a complex mixture of volatile organic compounds. Neurotoxicology and Teratology, 12, 6, 649-652. PARIS, J. (2000) Adhesives for paper, board and foils. International Journal of Adhesion & Adhesives, 20, 2, 89-90.

190
PARK, J.S. and IKEDA, K. (2004) Exposure to the mixtures of organic compounds in homes in Japan. Indoor Air, 14, 6, 413-420. PEJTERSEN, J., BROHUS, H., HYLDGAARD, C.E., NIELSEN, J.B., VALBJØRN, O., HAUSCHILDT, P., KJÆRGAARD, S.K. and WOLKOFF, P. (2001) Effect of renovating an office building on occupants' comfort and health. Indoor Air, 11, 1, 10-25. PENNELL, K.D., DEAN RHUE, R., SURESH, P., RAO, C. and JOHNSTON, C.T. (1992) Vapour-phase sorption of p-xylene and water on soils and clay minerals. Environmental Science & Technology, 26, 4, 756-763. PERERA, D.Y. (2004) Effect of pigmentation on organic coating characteristics. Progress in Organic Coatings, 50, 4, 247-262. PETERSEN, L.W., MOLDRUP, P., EL-FARHAN, Y.H., JACOBSEN, O.H., YAMAGUCHI, T. and
ROLSTON, D.E. (1995) The effect of moisture and soil texture on the adsorption of organic vapors. Journal of Environmental Quality, 24, 752-759. PETRIE, E.M. (2000) Handbook of Adhesives and Sealants. McGraw-Hill. U.S.A. 880 p. PICKRELL, J.A., MOKLER, B.V., GRIFFIS, L.C. and HOBBS, H. (1983) Formaldehyde release rate coefficients from selected consumer products. Environmental Science & Technology, 17, 12, 753-757. POPA, J. and HAGHIGHAT, F. (2003) The impact of VOC mixture, film thickness and substrate on adsorption/desorption characteristics of some building materials. Building and Environment, 38, 7, 959-964. RAW, G.J., COWARD, S.K.D., BROWN, V.M. and CRUMP, D.R. (2004) Exposure to air pollutants in English homes. Journal of Exposure Analysis and Environmental Epidemiology, 14, suppl. 1, S85-S94. ROACHE, N.F., GUO, F., FORTMANN, R. and TICHENOR, B.A. (1996) Comparing the Field and Laboratory Emission Cell (FLEC) with traditional emission testing chambers. In: Characterizing Sources of Indoor Air Pollution and Related Sink Effects. Edited by B.A. Tichenor. ASTM, STP 1287, U.S.A. 98-111. ROSÉN, G. and ANDERSSON, I.M. (1990) Solvent emission from newly painted surfaces. Journal of the Oil and Colour Chemists’ Association (JOCCA), 73, 5, 202-211. RUIZ, J., BILBAO, R. and MURILLO, M.B. (1998) Adsorption of different VOC onto soil minerals from gas phase: influence of mineral, type of VOC, and air humidity. Environmental Science & Technology, 32, 8, 1079-1084.

191
SAARELA, K. (1992) Organic emissions from building materials and their reduction. Report 3. Ministry of the Environment. Helsinki. 68 p. (In Finnish) SAARELA, K. (1999) Emission from floor coverings. In: Organic Indoor Air Pollutants. Occurrence-Measurement-Evaluation. Edited by T. Salthammer. Wiley-VCH. 185-202. SAARELA, K., BJÖRKROTH, M., KUKKONEN, E., SEPPÄNEN, O. and TUOMAINEN, M. (2002) Emission Classification of Building Materials: Protocol for Chemical and Sensory Testing of Building Materials. The Building Information Foundation RTS, Finland. 44 p. SAARELA, K., TIRKKONEN, T., LAINE-YLIJOKI, J., JURVELIN, J., NIEUWENHUISJEN, M.J. and JANTUNEN, M. (2003) Exposure of population and microenvironmental distributions of volatile organic compound concentrations in the EXPOLIS study. Atmospheric Environment, 37, 39-40, 5563-5575. SAMET, J.M. (1993) Indoor air pollution: a public health perspective. Indoor Air, 3, 4, 219-226. SAMMON, C., MURA, C., YARWOOD, J., EVERALL, N., SWART, R. and HODGE, D. (1998) FTIR-ATR studies of the structure and dynamics of water molecules in polymeric matrixes. A comparison of PET and PVC. The Journal of Physical Chemistry B, 102, 18, 3402-3411. SOCRATES, G. (1980) Infrared characteristic group frequencies. John Wiley & Sons, Chichester, 1-89. SOLLINGER, S., LEVSEN, K. and WÜNSCH, G. (1993) Indoor pollution by organic emissions from textile floor coverings: climate test chamber studies under static conditions. Atmospheric Environment, 28, 14, 2369-2378. SOLLINGER, S., LEVSEN, K. and WÜNSCH, G. (1994) Indoor pollution by organic emissions from textile floor coverings. Climate chamber studies under dynamic conditions. Atmospheric Environment, 27 B, 2, 183-192. SOWA, J. (1994) Man as a stochastic factor in indoor air quality predictions. Indoor Environment, 3, 3, 119-122. SPARKS, L.E. (1992) Modeling indoor concentrations and exposures. Annals of the New York Academy of Sciences, 641, 102-111. SPARKS, L.E., TICHENOR, B.A., CHANG, J.S.C. and GUO, Z. (1996) Gas-phase mass transfer model for predicting volatile organic compound (VOC) emission rates from indoor pollutant sources. Indoor Air, 6, 1, 31-40.

192
SPARKS, L.E., GUO, Z., CHANG, J.C. and TICHENOR, B.A. (1999) Volatile organic compound emissions from latex paint – part 1. Chamber experiments and source model development. Indoor Air, 9, 1, 10-17. STROMBERG, S.E. and WIND, G.J. (1968) Investigation of the evaporation patterns of mixed solvents in water thinnable resins. Recent Advances in Water Soluble Coatings, 40, 525, 459-467. SULLIVAN, D.A. (1975) Water and solvent evaporation from latex and latex paint films. Journal of Paint Technology, 47, 610, 60-67. THØGERSEN, K., GUNNARSEN, L. and NIELSEN, P.A. (1993) The effect on indoor air quality by water-damaged chipboards. In: Proceedings of the 6th International Conference on Indoor Air Quality and Climate, Helsinki 4-8 July 1993. Vol. 2, 537-542. TICHENOR, B.A. and MASON, M. (1988) Organic emissions from consumer products and building materials to the indoor environment. The International Journal of Air Pollution Control and Waste Management (JAPCA), 38, 3, 264-268. TICHENOR, B.A. and GUO, Z. (1991) The effect of ventilation rate on emission rates of wood finishing materials. Environment International, 17, 4, 317-323 TICHENOR, B.A., GUO, Z., DUNN, J.E., SPARKS, L.E. and MASON, M.A. (1991) The interaction of vapor phase organic compounds with indoor sinks. Indoor Air, 1, 1, 23-35. TICHENOR, B.A., GUO, Z. and SPARKS, L.E. (1993) Fundamental mass transfer model for indoor air emissions from surface coatings. Indoor Air, 3, 4, 263-268. TOPP, C., NIELSEN, P.V. and HEISELBERG, P. (2001) Influence of local airflow on the pollutant emission from indoor building surfaces. Indoor Air, 11, 3, 162-170. TOUT, R. (2000) A review of adhesives for furniture. International Journal of Adhesion & Adhesives, 20, 4, 269-272. TSUKRUK, V.V., GORBUNOV, V.V., HUANG, Z. and CHIZHIK, S.A. (2000) Dynamic microprobing of viscoelastic polymer properties. Polymer International, 49, 5, 441-444. TUCKER, W.G. (1991) Emission of organic substances from indoor surface materials. Environment International, 17, 357-363. TUOMAINEN, M., PASANEN, A-L., TUOMAINEN, A., LIESIVUORI, J and JUVONEN, P. (2001) Usefulness of the Finnish classification of indoor climate, construction and finishing:

193
comparison of indoor climate between two new blocks of flats in Finland. Atmospheric Environment, 35, 2, 305-313. UHDE, E., BORGSCHULTE, A. and SALTHAMMER, T. (1998) Characterization of the Field and Laboratory Emission Cell – FLEC: flow field and air velocities. Atmospheric Environment, 32, 4, 773-781. VILLBERG, K., SAARELA, K., TIRKKONEN, T., PASANEN, A-L., KASANEN, J-P., PASANEN, P., KALLIOKOSKI, P., MUSSALO-RAUHAMAA, H., MALMBERG, M., and HAAHTELA, T. (2004) Indoor air quality control. VTT Publications 540. Espoo, Finland. 192 p. (In Finnish) WARGOCKI, P., LAGERCRANTZ, L., WITTERSEH, T., SUNDELL, J., WYON, D.P. and FANGER, P.O. (2002) Subjective perceptions, symptom intensity and performance: a comparison of two independent studies, both changing similarly the pollution load in an office. Indoor Air, 12, 2, 74-80. WARGOCKI, P., WYON, D.P., BAIK, Y.K., CLAUSEN, G.and FANGER, P.O. (1999) Perceived air quality, sick building syndrome (SBS) symptoms and productivity in an office with two different pollution loads. Indoor Air, 9, 3, 176-179. WESCHLER, C.J. and SHIELDS, H.C. (1997) Potential reactions among indoor pollutants. Atmospheric Environment, 31, 21, 3487-3495. WHO. (1983) Indoor air pollutants: exposure and health effects. EURO Reports and Studies 78. Report on a WHO meeting, Nördlingen 8-11 June 1982. Published by World Health Organization Regional Office for Europe, Copenhagen. 42 p. WHO. (1989) Indoor air quality: organic pollutants. EURO Reports and Studies 111. Report on a WHO meeting, Berlin (West) 23-27 August 1987. Published by World Health Organization Regional Office for Europe, Copenhagen. 53 p. WIESLANDER, G., NORBÄCK, D. and EDLING, C. (1997) Airway symptoms among house painters in relation to exposure to volatile organic compounds (VOCs) – a longitudinal study. Annals of Occupational Hygiene, 41, 2, 155-166. WILLIAMS, D.A. and FLEMING, I. (1989) Spectroscopic methods in organic chemistry. McGraw-Hill Book Company, London, 29-62. WIRTANEN, L. (2001) The moisture content and emissions of ground slabs and floors between storeys subjected to a moisture load (in Finnish). Licentiate's thesis. Helsinki University of Technology, Building Materials Technology. 136 p. + appendices 25 p.
194
WIRTANEN, L., ERONEN, J. and PENTTALA, V. (2002) The moisture content and emissions from floors subjected to a moisture load. In: Proceedings of the 9th International Conference on Indoor Air Quality and Climate, Monterey, California, 30 June - 4 July 2002. Vol. 3. 244-249. WOLKOFF, P. (1995) Volatile organic compounds – sources, measurements, emissions, and the impact on indoor air quality. Indoor Air, Supplement no. 3. 73 p. WOLKOFF, P. (1998) Impact of air-velocity, temperature, humidity, and air on long-term VOC emissions from building products. Atmospheric Environment, 32, 14/15, 2659-2668. WOLKOFF, P. (2003) Trends in Europe to reduce the indoor air pollution of VOCs. Indoor Air, 13, Supplement no. 6, 5-11. WOLKOFF, P., CLAUSEN, P.A., NIELSEN, P.A. and GUNNARSEN, L. (1993) Documentation of Field and Laboratory Emission Cell “FLEC”: identification of emission processes from carpet, linoleum, paint, and sealant by modelling. Indoor Air, 3, 4, 291-297. WOLKOFF, P., CLAUSEN, P.A., NIELSEN and P.A. (1993) Application of Field and Laboratory Emission Cell “FLEC”-recovery study, case study of damaged linoleum, and liquid wax. In: Proceedings of the 6th International Conference on Indoor Air Quality and Climate, Helsinki 4-8 July 1993. Vol. 2. 543-548. WON, D., CORSI, R.L. and RYNES, M. (2001) Sorptive interactions between VOCs and indoor materials. Indoor Air, 11, 4, 246-256. YU, C. and CRUMP, D. (1998) A review of the emission of VOCs from polymeric materials used in buildings. Building and Environment, 33, 6, 357-374. ZHANG, Y. and HAGHIGHAT, F. (1997) The impact of surface air movement on material emissions. Building and Environment, 32, 6, 551-556.

APPENDIX A 195
RESULTS OF THE EDS-ANALYSES
0.0 2.0 4.0 6.0 8.0 10.0
Range Figure A1. Paint A.
0.0 2.0 4.0 6.0 8.0 10.0
Range Figure A2. Primer A.
Inte
nsity
In
tens
ity

APPENDIX A 196
0.0 2.0 4.0 6.0 8.0 10.0
Range Figure A3. Paint B.
0.0 2.0 4.0 6.0 8.0 10.0
Range Figure A4. Primer B.
Inte
nsity
In
tens
ity
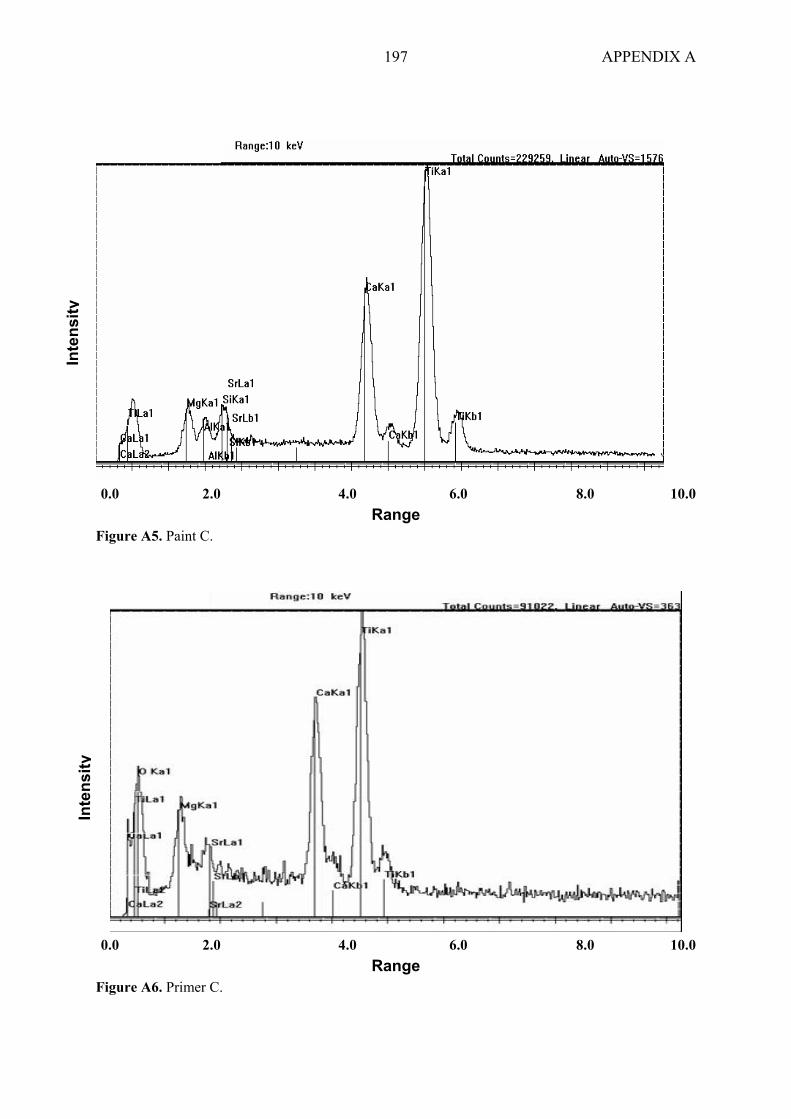
APPENDIX A 197
0.0 2.0 4.0 6.0 8.0 10.0
Range Figure A5. Paint C.
0.0 2.0 4.0 6.0 8.0 10.0
Range Figure A6. Primer C.
Inte
nsity
In
tens
ity

APPENDIX A 198
0.0 2.0 4.0 6.0 8.0 10.0
Range Figure A7. Adhesive A.
0.0 2.0 4.0 6.0 8.0 10.0
Range Figure A8. Adhesive B.
Inte
nsity
In
tens
ity
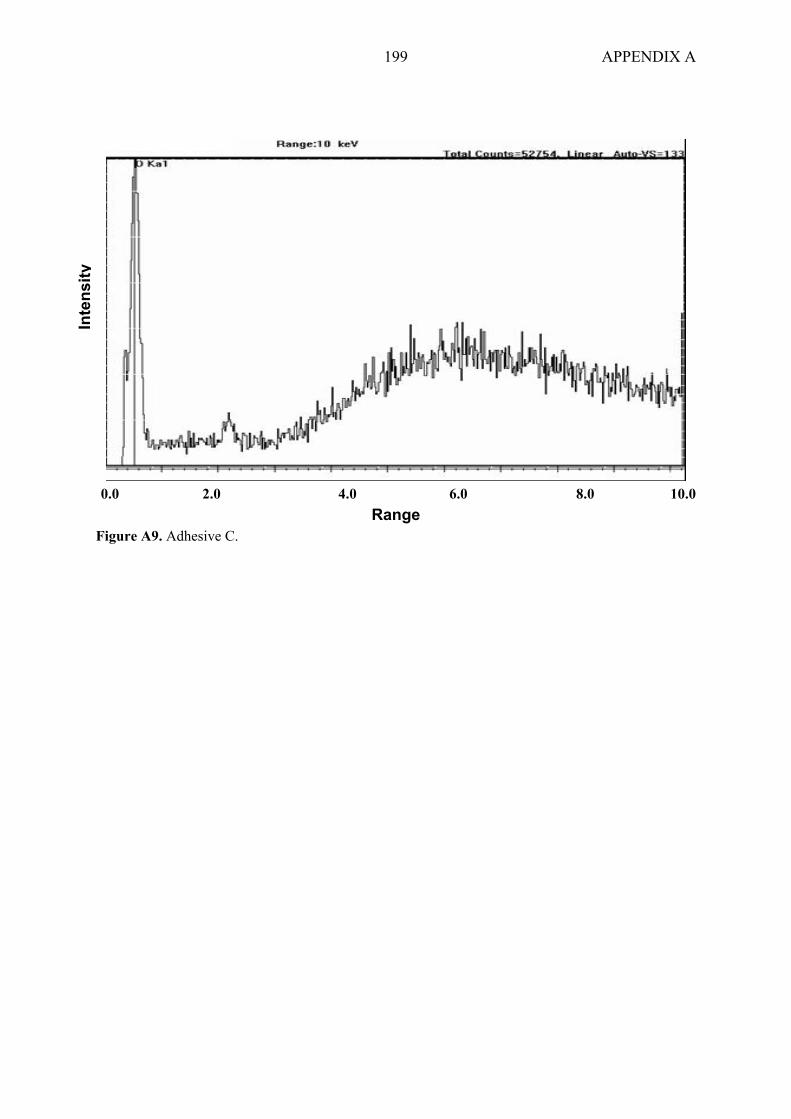
APPENDIX A 199
0.0 2.0 4.0 6.0 8.0 10.0
Range Figure A9. Adhesive C.
Inte
nsity
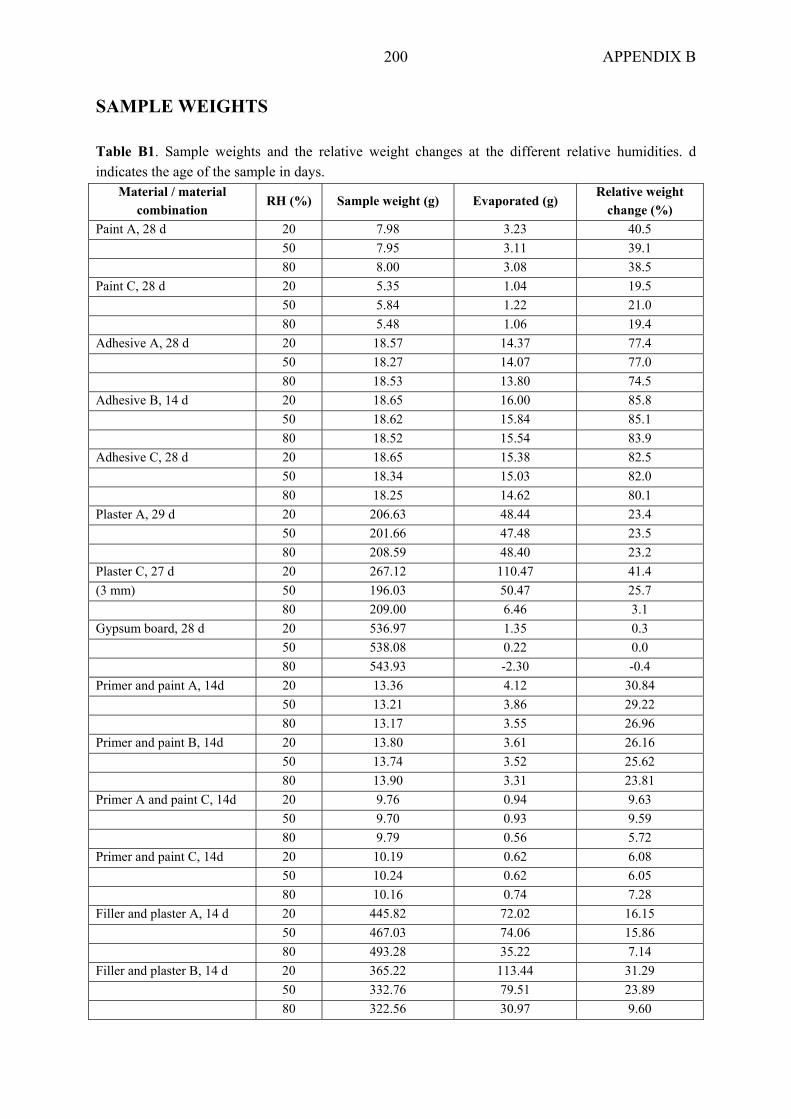
APPENDIX B 200
SAMPLE WEIGHTS Table B1. Sample weights and the relative weight changes at the different relative humidities. d indicates the age of the sample in days.
Material / material combination
RH (%) Sample weight (g) Evaporated (g) Relative weight
change (%) Paint A, 28 d 20 7.98 3.23 40.5 50 7.95 3.11 39.1 80 8.00 3.08 38.5 Paint C, 28 d 20 5.35 1.04 19.5 50 5.84 1.22 21.0 80 5.48 1.06 19.4 Adhesive A, 28 d 20 18.57 14.37 77.4 50 18.27 14.07 77.0 80 18.53 13.80 74.5 Adhesive B, 14 d 20 18.65 16.00 85.8 50 18.62 15.84 85.1 80 18.52 15.54 83.9 Adhesive C, 28 d 20 18.65 15.38 82.5 50 18.34 15.03 82.0 80 18.25 14.62 80.1 Plaster A, 29 d 20 206.63 48.44 23.4 50 201.66 47.48 23.5 80 208.59 48.40 23.2 Plaster C, 27 d 20 267.12 110.47 41.4 (3 mm) 50 196.03 50.47 25.7 80 209.00 6.46 3.1 Gypsum board, 28 d 20 536.97 1.35 0.3 50 538.08 0.22 0.0 80 543.93 -2.30 -0.4 Primer and paint A, 14d 20 13.36 4.12 30.84 50 13.21 3.86 29.22 80 13.17 3.55 26.96 Primer and paint B, 14d 20 13.80 3.61 26.16 50 13.74 3.52 25.62 80 13.90 3.31 23.81 Primer A and paint C, 14d 20 9.76 0.94 9.63 50 9.70 0.93 9.59 80 9.79 0.56 5.72 Primer and paint C, 14d 20 10.19 0.62 6.08 50 10.24 0.62 6.05 80 10.16 0.74 7.28 Filler and plaster A, 14 d 20 445.82 72.02 16.15 50 467.03 74.06 15.86 80 493.28 35.22 7.14 Filler and plaster B, 14 d 20 365.22 113.44 31.29 50 332.76 79.51 23.89 80 322.56 30.97 9.60
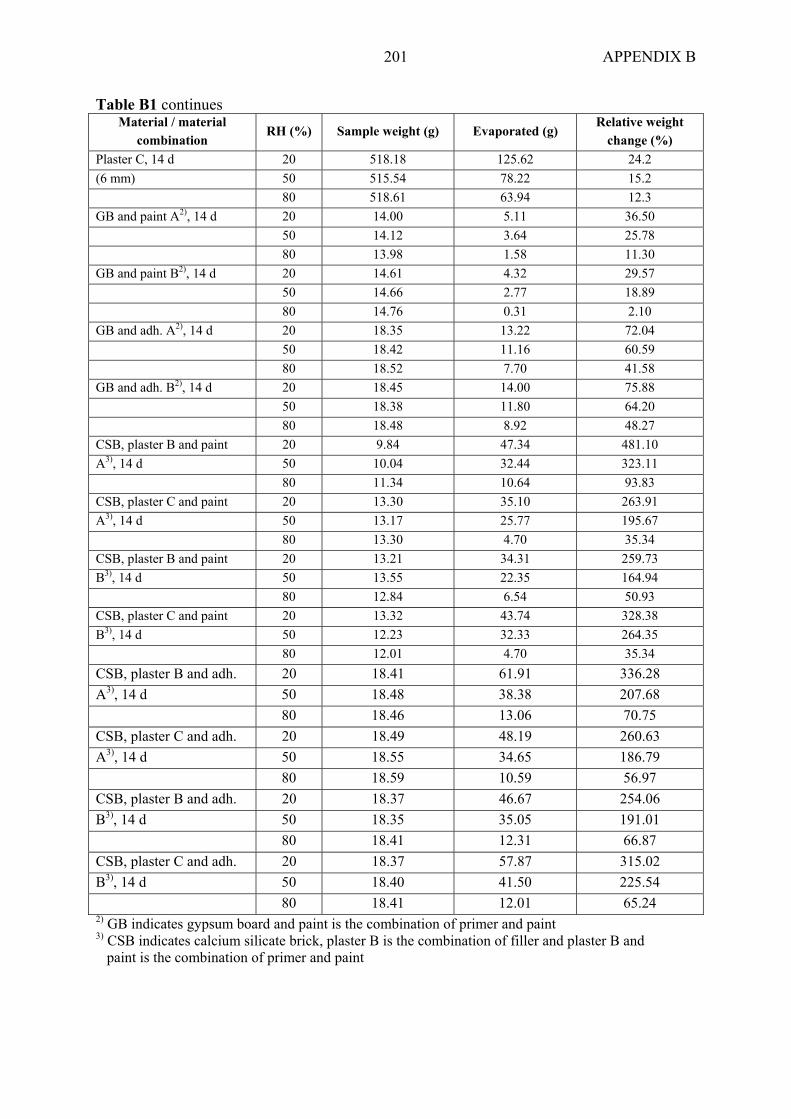
APPENDIX B 201
Table B1 continues Material / material
combination RH (%) Sample weight (g) Evaporated (g)
Relative weight change (%)
Plaster C, 14 d 20 518.18 125.62 24.2 (6 mm) 50 515.54 78.22 15.2 80 518.61 63.94 12.3 GB and paint A2), 14 d 20 14.00 5.11 36.50 50 14.12 3.64 25.78 80 13.98 1.58 11.30 GB and paint B2), 14 d 20 14.61 4.32 29.57 50 14.66 2.77 18.89 80 14.76 0.31 2.10 GB and adh. A2), 14 d 20 18.35 13.22 72.04 50 18.42 11.16 60.59 80 18.52 7.70 41.58 GB and adh. B2), 14 d 20 18.45 14.00 75.88 50 18.38 11.80 64.20 80 18.48 8.92 48.27 CSB, plaster B and paint 20 9.84 47.34 481.10 A3), 14 d 50 10.04 32.44 323.11 80 11.34 10.64 93.83 CSB, plaster C and paint 20 13.30 35.10 263.91 A3), 14 d 50 13.17 25.77 195.67 80 13.30 4.70 35.34 CSB, plaster B and paint 20 13.21 34.31 259.73 B3), 14 d 50 13.55 22.35 164.94 80 12.84 6.54 50.93 CSB, plaster C and paint 20 13.32 43.74 328.38 B3), 14 d 50 12.23 32.33 264.35 80 12.01 4.70 35.34 CSB, plaster B and adh. 20 18.41 61.91 336.28 A3), 14 d 50 18.48 38.38 207.68 80 18.46 13.06 70.75 CSB, plaster C and adh. 20 18.49 48.19 260.63 A3), 14 d 50 18.55 34.65 186.79 80 18.59 10.59 56.97 CSB, plaster B and adh. 20 18.37 46.67 254.06 B3), 14 d 50 18.35 35.05 191.01 80 18.41 12.31 66.87 CSB, plaster C and adh. 20 18.37 57.87 315.02 B3), 14 d 50 18.40 41.50 225.54 80 18.41 12.01 65.24 2) GB indicates gypsum board and paint is the combination of primer and paint 3) CSB indicates calcium silicate brick, plaster B is the combination of filler and plaster B and paint is the combination of primer and paint

APPENDIX C 202
AREA SPECIFIC EMISSION RATES Bold values in respective columns are the averages. Table C1. Background emission values of paint A in the environmental chamber test.
(µg/m³) RH 20 % RH 50 % RH 80 % ALIPHATIC AND ALICYCLIC COMPOUNDS decane 0.3 0.4 0.4 undecane 0.3 0.3 0.3 dodecane 0 0.3 0 AROMATIC HYDROCARBONS aromatic hydrocarcarbons 0.2 0.2 0.3 ethylbenzene 0.3 0.3 0.4 p,m-xylene 1 1 1 o-xylene 0.4 0.4 0.4 styrene 0.5 0.4 0.4 toluene 1 1 2 1,2,4-trimethylbenzene 0.5 0.5 0.6
TERPENES AND THEIR DERIVATIVES limonene 0.5 0.6 0.6 α-pinene 0 0.3 0
ALDEHYDES hexanal 0 0 0.4 octanal 0.3 0.2 0.4 nonanal 0 0 1 decanal 0 0 2
ESTERS AND LACTONES 2-(2-butoxy)ethylacetate 0.3 0 0
NITROGEN CONTAINING COMPOUNDS 1-methyl-2-pyrrolidinone 3 1 0.5
SILICON CONTAINING COMPOUNDS organic Si-compounds 2 1 2 Total 10.6 7.9 12.7 TVOC 18 16 22 non-TVOC 3 21) 2
1) Italic font indicates that the value is below the detection limit.
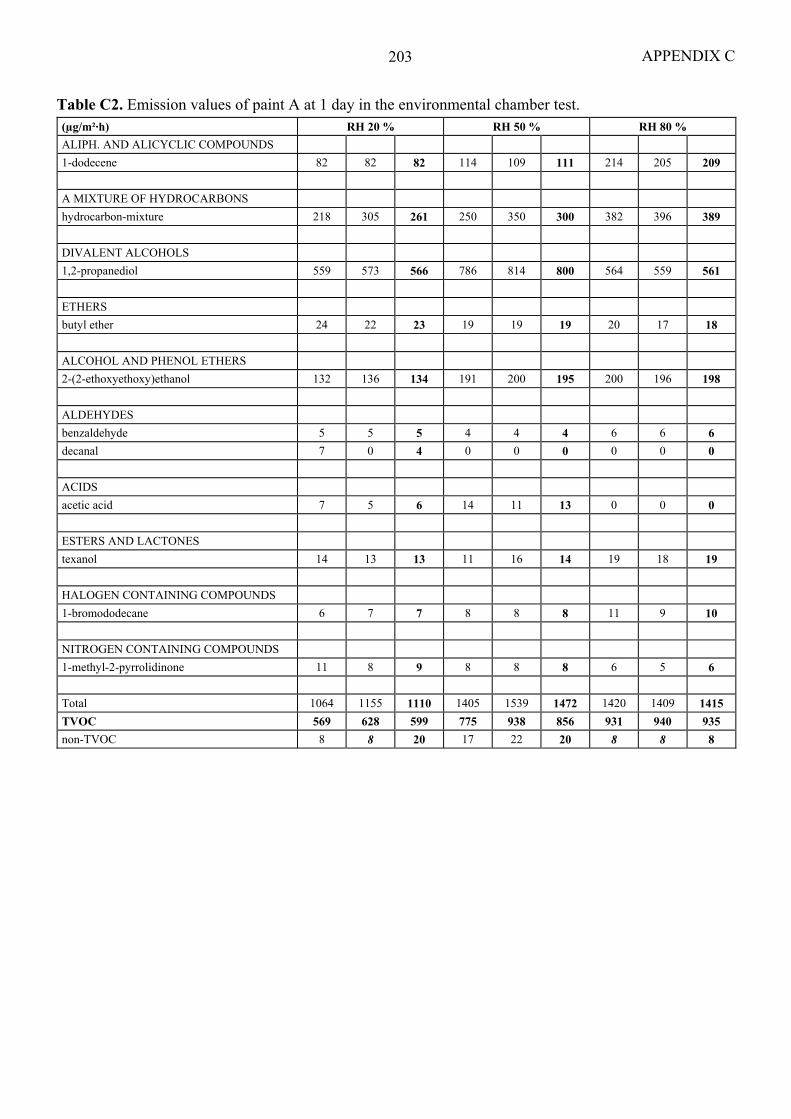
APPENDIX C 203
Table C2. Emission values of paint A at 1 day in the environmental chamber test. (µg/m²·h) RH 20 % RH 50 % RH 80 % ALIPH. AND ALICYCLIC COMPOUNDS 1-dodecene 82 82 82 114 109 111 214 205 209 A MIXTURE OF HYDROCARBONS hydrocarbon-mixture 218 305 261 250 350 300 382 396 389 DIVALENT ALCOHOLS 1,2-propanediol 559 573 566 786 814 800 564 559 561 ETHERS butyl ether 24 22 23 19 19 19 20 17 18 ALCOHOL AND PHENOL ETHERS 2-(2-ethoxyethoxy)ethanol 132 136 134 191 200 195 200 196 198 ALDEHYDES benzaldehyde 5 5 5 4 4 4 6 6 6 decanal 7 0 4 0 0 0 0 0 0 ACIDS acetic acid 7 5 6 14 11 13 0 0 0 ESTERS AND LACTONES texanol 14 13 13 11 16 14 19 18 19 HALOGEN CONTAINING COMPOUNDS 1-bromododecane 6 7 7 8 8 8 11 9 10 NITROGEN CONTAINING COMPOUNDS 1-methyl-2-pyrrolidinone 11 8 9 8 8 8 6 5 6 Total 1064 1155 1110 1405 1539 1472 1420 1409 1415 TVOC 569 628 599 775 938 856 931 940 935 non-TVOC 8 8 20 17 22 20 8 8 8
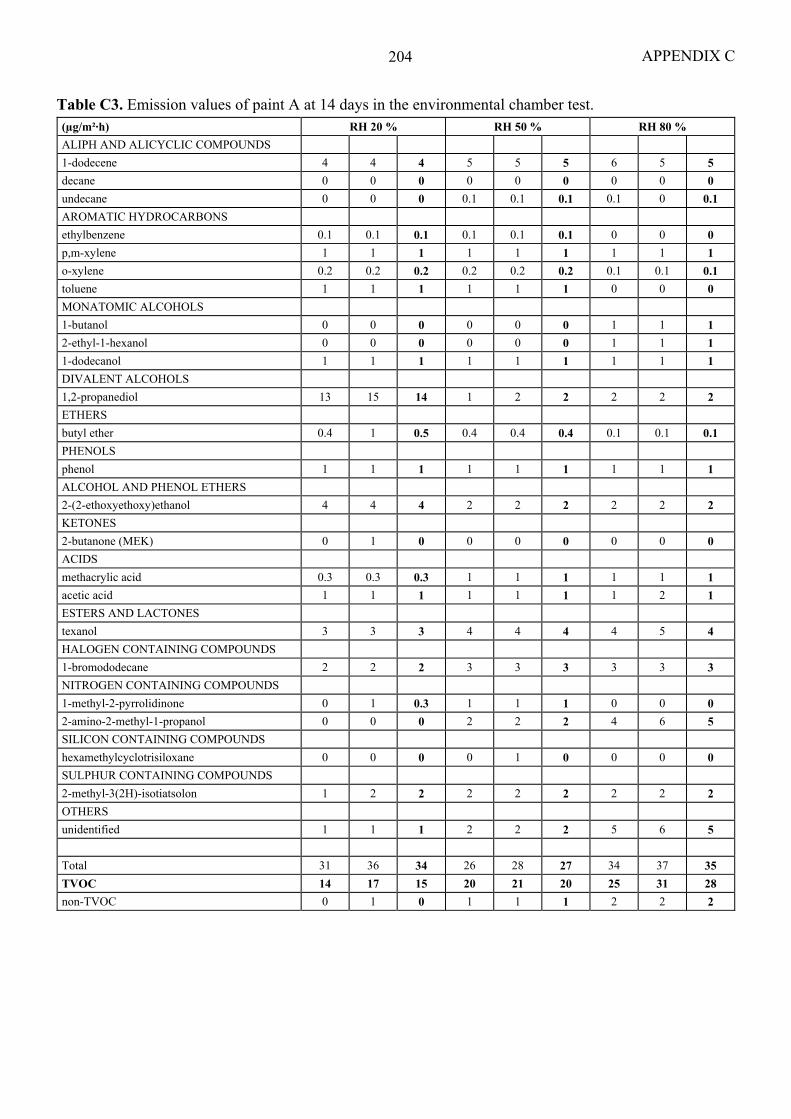
APPENDIX C 204
Table C3. Emission values of paint A at 14 days in the environmental chamber test. (µg/m²·h) RH 20 % RH 50 % RH 80 % ALIPH AND ALICYCLIC COMPOUNDS 1-dodecene 4 4 4 5 5 5 6 5 5 decane 0 0 0 0 0 0 0 0 0 undecane 0 0 0 0.1 0.1 0.1 0.1 0 0.1 AROMATIC HYDROCARBONS ethylbenzene 0.1 0.1 0.1 0.1 0.1 0.1 0 0 0 p,m-xylene 1 1 1 1 1 1 1 1 1 o-xylene 0.2 0.2 0.2 0.2 0.2 0.2 0.1 0.1 0.1 toluene 1 1 1 1 1 1 0 0 0 MONATOMIC ALCOHOLS 1-butanol 0 0 0 0 0 0 1 1 1 2-ethyl-1-hexanol 0 0 0 0 0 0 1 1 1 1-dodecanol 1 1 1 1 1 1 1 1 1 DIVALENT ALCOHOLS 1,2-propanediol 13 15 14 1 2 2 2 2 2 ETHERS butyl ether 0.4 1 0.5 0.4 0.4 0.4 0.1 0.1 0.1 PHENOLS phenol 1 1 1 1 1 1 1 1 1 ALCOHOL AND PHENOL ETHERS 2-(2-ethoxyethoxy)ethanol 4 4 4 2 2 2 2 2 2 KETONES 2-butanone (MEK) 0 1 0 0 0 0 0 0 0 ACIDS methacrylic acid 0.3 0.3 0.3 1 1 1 1 1 1 acetic acid 1 1 1 1 1 1 1 2 1 ESTERS AND LACTONES texanol 3 3 3 4 4 4 4 5 4 HALOGEN CONTAINING COMPOUNDS 1-bromododecane 2 2 2 3 3 3 3 3 3 NITROGEN CONTAINING COMPOUNDS 1-methyl-2-pyrrolidinone 0 1 0.3 1 1 1 0 0 0 2-amino-2-methyl-1-propanol 0 0 0 2 2 2 4 6 5 SILICON CONTAINING COMPOUNDS hexamethylcyclotrisiloxane 0 0 0 0 1 0 0 0 0 SULPHUR CONTAINING COMPOUNDS 2-methyl-3(2H)-isotiatsolon 1 2 2 2 2 2 2 2 2 OTHERS unidentified 1 1 1 2 2 2 5 6 5 Total 31 36 34 26 28 27 34 37 35 TVOC 14 17 15 20 21 20 25 31 28 non-TVOC 0 1 0 1 1 1 2 2 2

APPENDIX C 205
Table C4. Emission values of paint A at 28 days in the environmental chamber test. (µg/m²·h) RH 20 % RH 50 % RH 80 %
ALIPH. AND ALICYCLIC COMPOUNDS 1-dodecene 2 2 2 2 2 2 0 2 1 hexane 0 0 0 0 0 0 0 0 0 decane 0 0 0 0 0 0 0 0 0 cyclohexane 0 0 0 0 0 0 1 0 0 AROMATIC HYDROCARBONS benzene 0 0 0 0 0.1 0.1 0 0 0 ethylbenzene 0 0 0 0 0 0 0 0 0 propylbenzene 0 0 0 0 0 0 0 0 0 p,m-xylene 0 0 0 0 0 0 0 0 0 o-xylene 0 0 0 0 0 0 0 0 0 styrene 0 0 0 0 0 0 0 0 0 toluene 1 1 1 1 1 1 0 0 0 1,2,3-trimethylbenzene 0 0 0 0 0.1 0.1 0 0 0 1,2,4-trimethylbenzene 0 0 0 0 0 0 0 0 0 1,3,5-trimethylbenzene 0 0.1 0.1 0.1 0 0.1 0 0 0 1-ethyl-2-methylbenzene 0.1 0.1 0.1 0 0 0 0 0 0 MONATOMIC ALCOHOLS 1-butanol 0.2 0 0.1 0.3 0.4 0.4 1 1 1 2-ethyl-1-hexanol 0.3 0.3 0.3 1 1 1 1 1 1 DIVALENT ALCOHOLS 1,2-propanediol 1 1 1 0 0 0 0 0 0 ALCOHOL AND PHENOL ETHERS 2-(2-ethoxyethoxy)ethanol 0.3 1 0.4 0 0.2 0.1 0 0 0 ALDEHYDES hexanal 1 1 1 2 2 2 4 4 4 KETONES 2-butanone (MEK) 0 0 0 0 9 4 0 0 0 4-methyl-2-pentanone 0 0.1 0.1 0 0 0 0 0 0 TERPENES AND THEIR DERIVATIVES limonene 0 0 0 0 0 0 0 0 0 3-carene 0.1 0 0.1 0.1 0 0.1 0 0 0 ESTERS AND LACTONES texanol 1 2 2 2 2 2 1 2 2 methylester of 2-propionic acid 0 0 0 0 3 1 0 0 0 HALOGEN CONTAINING COMPOUNDS 1-bromododecane 1 1 1 1 1 1 0 1 1 dichloromethane 0 0 0 3 55 29 0 0 0 NITROGEN CONTAINING COMPOUNDS 1-methyl-2-pyrrolidinone 0 0 0 0 0 0 0.1 0 0.1 2-amino-2-methyl-1-propanol 0 0 0 0 0 0 3 1 2 4,4-dimethyl-1,3-oxazolidine 0 1 0 1 2 2 4 4 4 Total 7 9 8 13 77 45 14 15 15 TVOC 6 10 8 11 20 15 22 17 20 non-TVOC 0 0 0 2 62 32 0 0 0
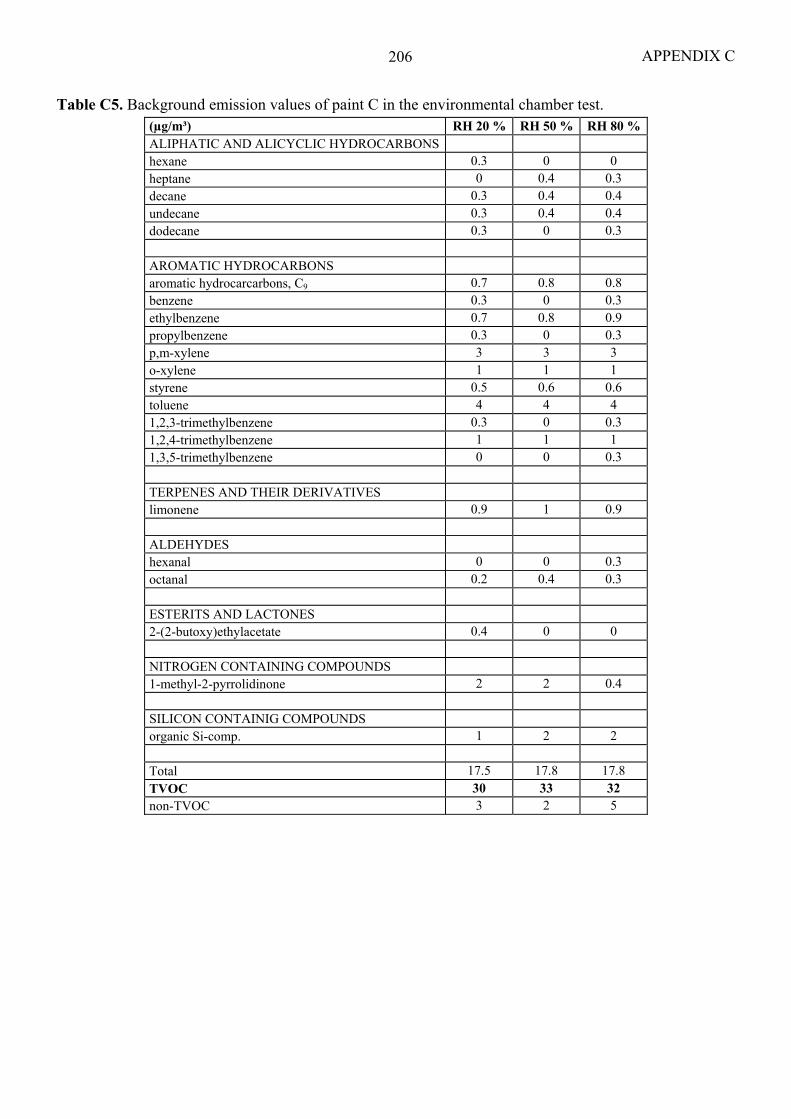
APPENDIX C 206
Table C5. Background emission values of paint C in the environmental chamber test. (µg/m³) RH 20 % RH 50 % RH 80 % ALIPHATIC AND ALICYCLIC HYDROCARBONS hexane 0.3 0 0 heptane 0 0.4 0.3 decane 0.3 0.4 0.4 undecane 0.3 0.4 0.4 dodecane 0.3 0 0.3 AROMATIC HYDROCARBONS aromatic hydrocarcarbons, C9 0.7 0.8 0.8 benzene 0.3 0 0.3 ethylbenzene 0.7 0.8 0.9 propylbenzene 0.3 0 0.3 p,m-xylene 3 3 3 o-xylene 1 1 1 styrene 0.5 0.6 0.6 toluene 4 4 4 1,2,3-trimethylbenzene 0.3 0 0.3 1,2,4-trimethylbenzene 1 1 1 1,3,5-trimethylbenzene 0 0 0.3 TERPENES AND THEIR DERIVATIVES limonene 0.9 1 0.9 ALDEHYDES hexanal 0 0 0.3 octanal 0.2 0.4 0.3 ESTERITS AND LACTONES 2-(2-butoxy)ethylacetate 0.4 0 0 NITROGEN CONTAINING COMPOUNDS 1-methyl-2-pyrrolidinone 2 2 0.4 SILICON CONTAINIG COMPOUNDS organic Si-comp. 1 2 2 Total 17.5 17.8 17.8 TVOC 30 33 32 non-TVOC 3 2 5

APPENDIX C 207
Table C6. Emission values of paint C at 1 day in the environmental chamber test. (µg/m²·h) RH 20 % RH 50 % RH 80 % ALIPH. AND ALICYCLIC HYDROCARBONS pentane 409 418 414 441 423 432 341 391 366 heptane 64 59 61 73 73 73 64 64 64 octane 68 68 68 77 77 77 68 73 70 A MIXTURE OF HYDROCARBONS hydrocarbon-mixture 17500 16046 16773 21773 21591 21682 12182 11955 12068 MONATOMIC ALCOHOLS 1-pentanol 91 96 93 105 105 105 86 100 93 ALCOHOL AND PHENOL ETHERS 2-(2-ethoxyethoxy)ethanol 227 255 241 273 300 286 291 300 295 ALDEHYDES propanal 41 46 43 55 55 55 50 59 55 n-butanal 50 46 48 55 59 57 68 64 66 pentanal 446 432 439 541 518 530 605 550 577 hexanal 1346 1291 1318 1477 1491 1484 1536 1514 1525 heptanal 36 32 34 46 45 45 55 55 55 octanal 0 0 0 0 0 0 43 45 44 2-octenal 105 114 109 109 114 111 146 150 148 nonanal 0 0 0 0 0 0 28 35 31 KETONES 2-butanone (MEK) 27 28 28 40 42 41 28 28 28 ACIDS acetic acid 24 40 32 50 40 45 33 44 38 propanoic acid 55 64 59 82 86 84 82 100 91 butanoic acid 6 8 7 8 10 9 10 12 11 pentanoic acid 32 44 38 42 46 44 50 68 59 hexanoic acid 327 418 373 355 373 364 405 514 459 2-ethylhexanoic acid 755 896 825 846 927 886 741 786 764 NITROGEN CONTAINING COMPOUNDS 2-butanone oxime 77 73 75 114 118 116 73 68 70 OTHERS 1,2-epoxy alkane 73 64 68 82 73 77 68 68 68 Total 21756 20534 21145 26640 26563 26601 17049 17041 17045 TVOC 20532 20486 20509 26349 26576 26462 17349 17486 17417 non-TVOC 521 540 530 586 563 574 484 548 516
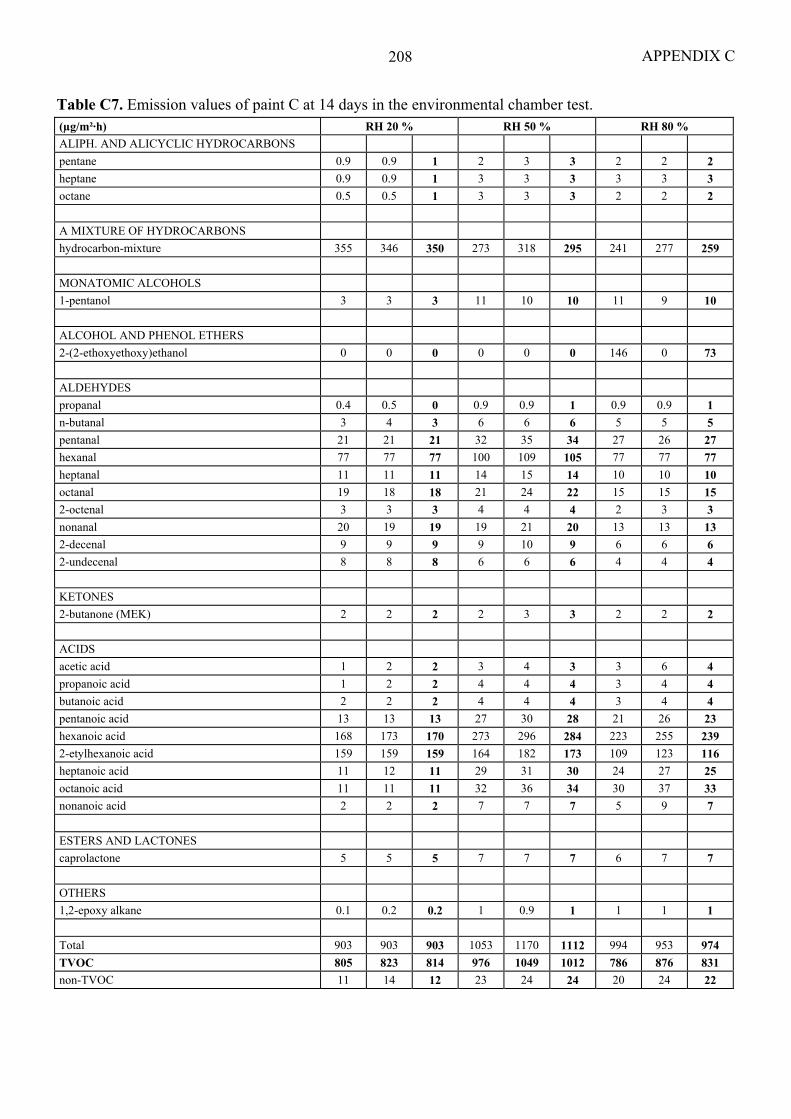
APPENDIX C 208
Table C7. Emission values of paint C at 14 days in the environmental chamber test. (µg/m²·h) RH 20 % RH 50 % RH 80 % ALIPH. AND ALICYCLIC HYDROCARBONS pentane 0.9 0.9 1 2 3 3 2 2 2 heptane 0.9 0.9 1 3 3 3 3 3 3 octane 0.5 0.5 1 3 3 3 2 2 2 A MIXTURE OF HYDROCARBONS hydrocarbon-mixture 355 346 350 273 318 295 241 277 259 MONATOMIC ALCOHOLS 1-pentanol 3 3 3 11 10 10 11 9 10 ALCOHOL AND PHENOL ETHERS 2-(2-ethoxyethoxy)ethanol 0 0 0 0 0 0 146 0 73 ALDEHYDES propanal 0.4 0.5 0 0.9 0.9 1 0.9 0.9 1 n-butanal 3 4 3 6 6 6 5 5 5 pentanal 21 21 21 32 35 34 27 26 27 hexanal 77 77 77 100 109 105 77 77 77 heptanal 11 11 11 14 15 14 10 10 10 octanal 19 18 18 21 24 22 15 15 15 2-octenal 3 3 3 4 4 4 2 3 3 nonanal 20 19 19 19 21 20 13 13 13 2-decenal 9 9 9 9 10 9 6 6 6 2-undecenal 8 8 8 6 6 6 4 4 4 KETONES 2-butanone (MEK) 2 2 2 2 3 3 2 2 2 ACIDS acetic acid 1 2 2 3 4 3 3 6 4 propanoic acid 1 2 2 4 4 4 3 4 4 butanoic acid 2 2 2 4 4 4 3 4 4 pentanoic acid 13 13 13 27 30 28 21 26 23 hexanoic acid 168 173 170 273 296 284 223 255 239 2-etylhexanoic acid 159 159 159 164 182 173 109 123 116 heptanoic acid 11 12 11 29 31 30 24 27 25 octanoic acid 11 11 11 32 36 34 30 37 33 nonanoic acid 2 2 2 7 7 7 5 9 7 ESTERS AND LACTONES caprolactone 5 5 5 7 7 7 6 7 7 OTHERS 1,2-epoxy alkane 0.1 0.2 0.2 1 0.9 1 1 1 1 Total 903 903 903 1053 1170 1112 994 953 974 TVOC 805 823 814 976 1049 1012 786 876 831 non-TVOC 11 14 12 23 24 24 20 24 22

APPENDIX C 209
Table C8. Emission values of paint C at 28 days in the environmental chamber test. (µg/m²·h) RH 20 % RH 50 % RH 80 % ALIPH. AND ALICYCLIC HYDROCARBONS nonane 0 0 0 0 0 0 0 2 1 decane 5 5 5 4 4 4 10 11 11 undecane 5 6 6 6 6 6 10 12 11 dodecane 0.8 1 1 1 1 1 2 2 2 AROMATIC HYDROCARBONS ethylbenzene 0 0 0 0 0 0 0 0 0 p,m-xylene 0 0 0 0 0 0 0 0 0 o-xylene 0 0 0 0 0 0 0 0 0 styrene 0 0 0 0 0 0 0 0 0 toluene 0 0 0 0 0 0 0 0 0 MONATOMIC ALCOHOLS 2-ethyl-1-hexanol 0 0 0 0 0 0 0 4 2 ALDEHYDES pentanal 10 10 10 7 11 9 8 8 8 hexanal 31 33 32 23 33 28 28 29 28 heptanal 5 5 5 5 6 5 4 4 4 octanal 7 0 4 8 10 9 6 7 6 nonanal 7 8 7 9 9 9 6 8 7 decanal 0.9 0.9 1 0.9 0.9 1 0.9 0.9 1 ACIDS acetic acid 15 13 14 10 11 11 4 6 5 propanoic acid 11 11 11 9 11 10 3 7 5 butanoic acid 1 2 2 5 5 5 2 3 3 pentanoic acid 27 35 31 33 34 33 13 15 14 hexanoic acid 286 359 323 350 368 359 205 227 216 2-etylhexanoic acid 24 31 28 26 29 28 26 28 27 heptanoic acid 16 20 18 16 18 17 4 4 4 octanoic acid 25 27 26 30 32 31 7 8 8 nonanoic acid 9 12 11 8 11 9 9 12 11 TERPENES AND THEIR DERIVATIVES limonene 0 0 0 0 0 0 0 0 0 NITROGEN CONTAINING COMPOUNDS 2-butanone oxime 0 0 0 0 0 0 0 0.5 0 Total 486 578 532 549 602 575 347 398 372 TVOC 282 336 309 303 349 326 272 336 304 non-TVOC 14 11 13 9 11 10 2 4 3
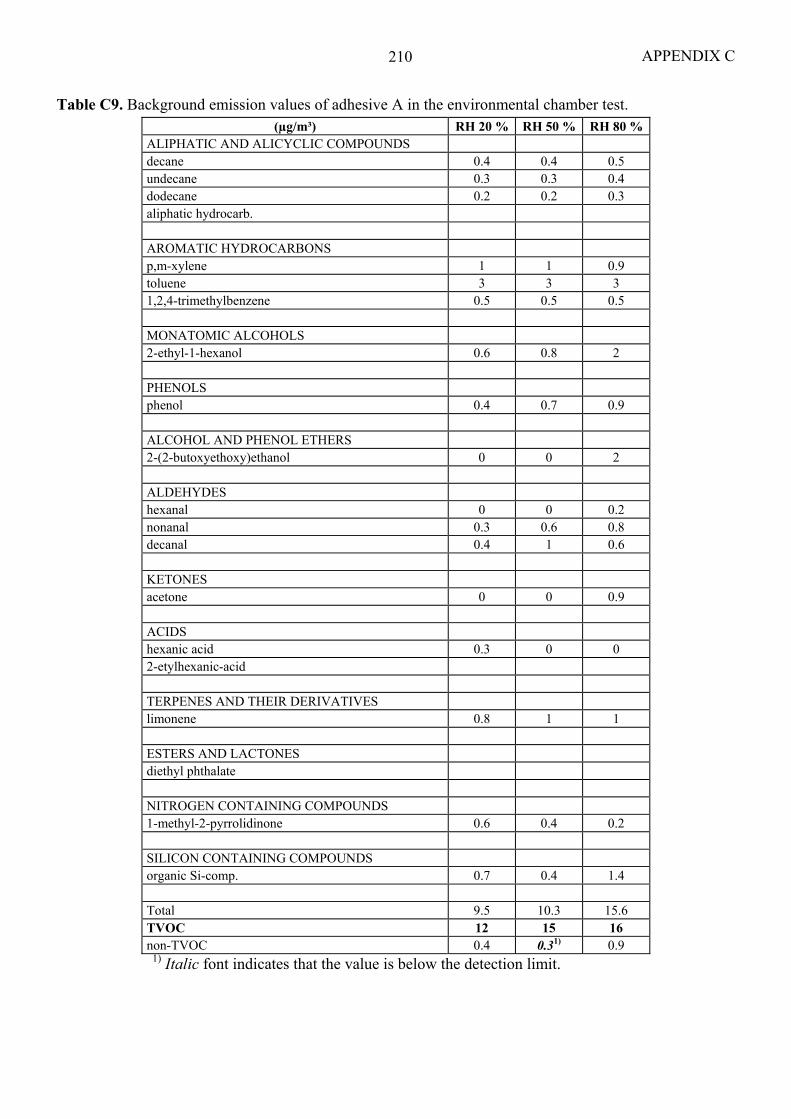
APPENDIX C 210
Table C9. Background emission values of adhesive A in the environmental chamber test. (µg/m³) RH 20 % RH 50 % RH 80 %
ALIPHATIC AND ALICYCLIC COMPOUNDS decane 0.4 0.4 0.5 undecane 0.3 0.3 0.4 dodecane 0.2 0.2 0.3 aliphatic hydrocarb. AROMATIC HYDROCARBONS p,m-xylene 1 1 0.9 toluene 3 3 3 1,2,4-trimethylbenzene 0.5 0.5 0.5 MONATOMIC ALCOHOLS 2-ethyl-1-hexanol 0.6 0.8 2 PHENOLS phenol 0.4 0.7 0.9 ALCOHOL AND PHENOL ETHERS 2-(2-butoxyethoxy)ethanol 0 0 2 ALDEHYDES hexanal 0 0 0.2 nonanal 0.3 0.6 0.8 decanal 0.4 1 0.6 KETONES acetone 0 0 0.9 ACIDS hexanic acid 0.3 0 0 2-etylhexanic-acid TERPENES AND THEIR DERIVATIVES limonene 0.8 1 1 ESTERS AND LACTONES diethyl phthalate NITROGEN CONTAINING COMPOUNDS 1-methyl-2-pyrrolidinone 0.6 0.4 0.2 SILICON CONTAINING COMPOUNDS organic Si-comp. 0.7 0.4 1.4 Total 9.5 10.3 15.6 TVOC 12 15 16 non-TVOC 0.4 0.31) 0.9
1) Italic font indicates that the value is below the detection limit.

APPENDIX C 211
Table C10. Emission values of adhesive A at 1 day in the environmental chamber test. (µg/m²·h) RH 20 % RH 50 % RH 80 % ALIPH. AND ALICYCLIC COMPOUNDS nonane 0 0 0 0 0 0 0.9 0.5 0.7 decane 0 0 0 0.3 0 0.2 0 0 0
AROMATIC HYDROCARBONS p,m-xylene 0 0 0 0.5 0 0.3 0 0 0 toluene 0 0 0 0 0 0 0 0 0 1,1'-biphenyl 2 2 2 2 2 2 3 2 3
MONATOMIC ALCOHOLS 2-ethyl-1-hexanol 0.2 0.2 0.2 0.5 0.1 0.3 0 0 0
PHENOLS phenol 0.3 0.3 0.3 0 0 0 0 0 0
ALCOHOL AND PHENOL ETHERS 1-allyloxy-2-propanol 2 2 2 2 2 2 1 1 1
ALDEHYDES benzaldehyde 0 0 0 0 0 0 0.9 0 0.5 octanal 0.5 0 0.3 0 0.9 0.5 0.9 0 0.5 nonanal 1 0 1 0.6 2 1 2 0 1 decanal 2 0 1 0 1 1 0 0 0
KETONES acetophenone 0.9 0.9 0.9 0.5 0.5 0.5 1 0.9 1 acetone 2 2 2 2 2 2 1 1 1
ACIDS acetic acid 91 141 116 73 64 68 68 77 73
ESTERS AND LACTONES 2-(2-butoxyethoxy)ethylacetate 0.9 0.9 0.9 0.5 0.9 0.7 0.9 0.5 0.7 propyl benzoate 28 26 27 26 26 26 29 29 29 methyl benzoate 0.9 0.9 0.9 0.9 1 1 0.9 0.9 0.9 ethyl benzoate 3 3 3 3 3 3 3 3 3 isopropyl benzoate 2 1 2 1 1 1 1 1 1 allyl benzoate 1 0.9 1 1 0.9 1 1 1 1
SILICON CONTAINING COMPOUNDS hexamethylcyclotrisiloxane 2 0 1 0 0 0 0 0 0
OTHERS unidentified 11 11 11 12 11 11 13 12 13
Total 151 193 172 127 118 122 128 132 130 TVOC 63 54 58 57 52 55 56 52 54 non-TVOC 101 162 132 82 75 79 78 89 83
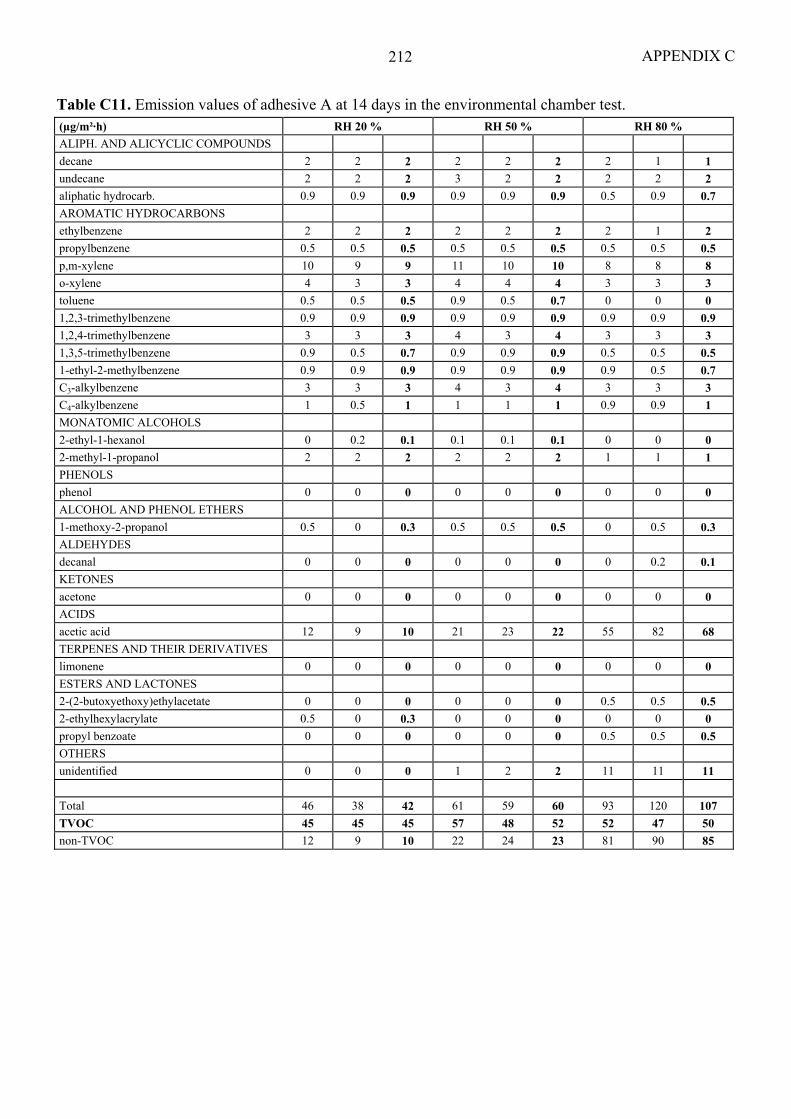
APPENDIX C 212
Table C11. Emission values of adhesive A at 14 days in the environmental chamber test. (µg/m²·h) RH 20 % RH 50 % RH 80 % ALIPH. AND ALICYCLIC COMPOUNDS decane 2 2 2 2 2 2 2 1 1 undecane 2 2 2 3 2 2 2 2 2 aliphatic hydrocarb. 0.9 0.9 0.9 0.9 0.9 0.9 0.5 0.9 0.7 AROMATIC HYDROCARBONS ethylbenzene 2 2 2 2 2 2 2 1 2 propylbenzene 0.5 0.5 0.5 0.5 0.5 0.5 0.5 0.5 0.5 p,m-xylene 10 9 9 11 10 10 8 8 8 o-xylene 4 3 3 4 4 4 3 3 3 toluene 0.5 0.5 0.5 0.9 0.5 0.7 0 0 0 1,2,3-trimethylbenzene 0.9 0.9 0.9 0.9 0.9 0.9 0.9 0.9 0.9 1,2,4-trimethylbenzene 3 3 3 4 3 4 3 3 3 1,3,5-trimethylbenzene 0.9 0.5 0.7 0.9 0.9 0.9 0.5 0.5 0.5 1-ethyl-2-methylbenzene 0.9 0.9 0.9 0.9 0.9 0.9 0.9 0.5 0.7 C3-alkylbenzene 3 3 3 4 3 4 3 3 3 C4-alkylbenzene 1 0.5 1 1 1 1 0.9 0.9 1 MONATOMIC ALCOHOLS 2-ethyl-1-hexanol 0 0.2 0.1 0.1 0.1 0.1 0 0 0 2-methyl-1-propanol 2 2 2 2 2 2 1 1 1 PHENOLS phenol 0 0 0 0 0 0 0 0 0 ALCOHOL AND PHENOL ETHERS 1-methoxy-2-propanol 0.5 0 0.3 0.5 0.5 0.5 0 0.5 0.3 ALDEHYDES decanal 0 0 0 0 0 0 0 0.2 0.1 KETONES acetone 0 0 0 0 0 0 0 0 0 ACIDS acetic acid 12 9 10 21 23 22 55 82 68 TERPENES AND THEIR DERIVATIVES limonene 0 0 0 0 0 0 0 0 0 ESTERS AND LACTONES 2-(2-butoxyethoxy)ethylacetate 0 0 0 0 0 0 0.5 0.5 0.5 2-ethylhexylacrylate 0.5 0 0.3 0 0 0 0 0 0 propyl benzoate 0 0 0 0 0 0 0.5 0.5 0.5 OTHERS unidentified 0 0 0 1 2 2 11 11 11 Total 46 38 42 61 59 60 93 120 107 TVOC 45 45 45 57 48 52 52 47 50 non-TVOC 12 9 10 22 24 23 81 90 85

APPENDIX C 213
Table C12. Emission values of adhesive A at 28 days in the environmental chamber test. (µg/m²·h) RH 20 % RH 50 % RH 80 % ALIPH. AND ALICYCLIC COMPOUNDS heptane 0.2 0.2 0.2 0.3 0.2 0.3 0.4 0.2 0.3 nonane 0.2 0.2 0.2 0.2 0 0.1 0 0 0 decane 0.3 0.3 0.3 0.3 0.3 0.3 0.2 0.2 0.2 undecane 0.3 0.2 0.3 0.3 0.3 0.3 0.2 0.2 0.2 dodecane 0 0 0 0 0.1 0.1 0 0 0 AROMATIC HYDROCARBONS ethylbenzene 0.9 0.9 1 0.9 0.9 0.9 0.5 0.5 0.5 propylbenzene 0.2 0.2 0.2 0.2 0.2 0.2 0.2 0.2 0.2 p,m-xylene 3 3 3 3 3 3 2 2 2 o-xylene 1 1 1 1 1 1 0.9 0.9 0.9 styrene 0 0 0 0.2 0 0.1 0 0 0 toluene 0 0 0 0.5 0 0 0 0 0 1,2,3-trimethylbenzene 0.3 0.3 0.3 0.4 0.3 0.4 0.3 0.2 0.3 1,2,4-trimethylbenzene 1 0.7 1 1 1 1 0.7 0.7 0.7 1,3,5-trimethylbenzene 0.3 0.3 0.3 0.3 0.3 0.3 0.2 0.2 0.2 1-ethyl-2-methylbenzene 0.3 0.2 0.3 0.3 0.3 0.3 0.2 0.2 0.2 C3-alkylbenzene 1 1 1 1 1 1 0.8 0.7 0.8 C4-alkylbenzene 0.2 0.2 0.2 0.2 0.2 0.2 0.2 0.2 0.2 MONATOMIC ALCOHOLS 2-ethyl-1-hexanol 0.2 0.1 0.2 0.1 0.1 0.1 0 0 0 2-methyl-1-propanol 0.2 0.4 0.3 0.3 0.3 0.3 0.4 0.2 0.3 DIVALENT ALCOHOLS 1,2-propanediol 0.9 0 0.5 0 0 0 0 0 0 PHENOLS phenol 0 0 0 0 0 0 0 0 0 ALCOHOL AND PHENOL ETHERS 2-(2-butoxyethoxy)ethanol 0 0 0 0.2 0 0.1 0 0 0 1-methoxy-2-propanol 0 0 0 0.2 0.2 0.2 0.2 0.2 0.2 ALDEHYDES octanal 0 0 0 0 0 0 0 0.2 0.1 nonanal 0.1 0.1 0.1 0 0 0 0 0.1 0.1 decanal 0 0 0 0 0 0 0 0.6 0.3 KETONES acetone 0 0 0 0 0 0 0 0 0 ACIDS acetic acid 9 6 7 12 11 11 20 25.5 23 TERPENES AND THEIR DERIVATIVES limonene 0 0 0 0 0 0 0 0 0 ESTERS AND LACTONES 2-(2-butoxyethoxy)ethylacetate 0 0 0 0 0 0 0.3 0.3 0.3 SILICON CONTAINING COMPOUNDS organic Si-comp. 0 0 0 0 0 0 0 0 0 hexamethylcyclotrisiloxane 0 0 0 0 0 0 0.2 0.2 0.2 OTHERS unidentified 0 0 0 0.8 0.8 0.8 8 8 8 Total 20 16 18 25 22 23 36 42 39 TVOC 17 15 16 18 16 17 20 20 20 non-TVOC 9 6.2 8 13 11 12 21 27 24
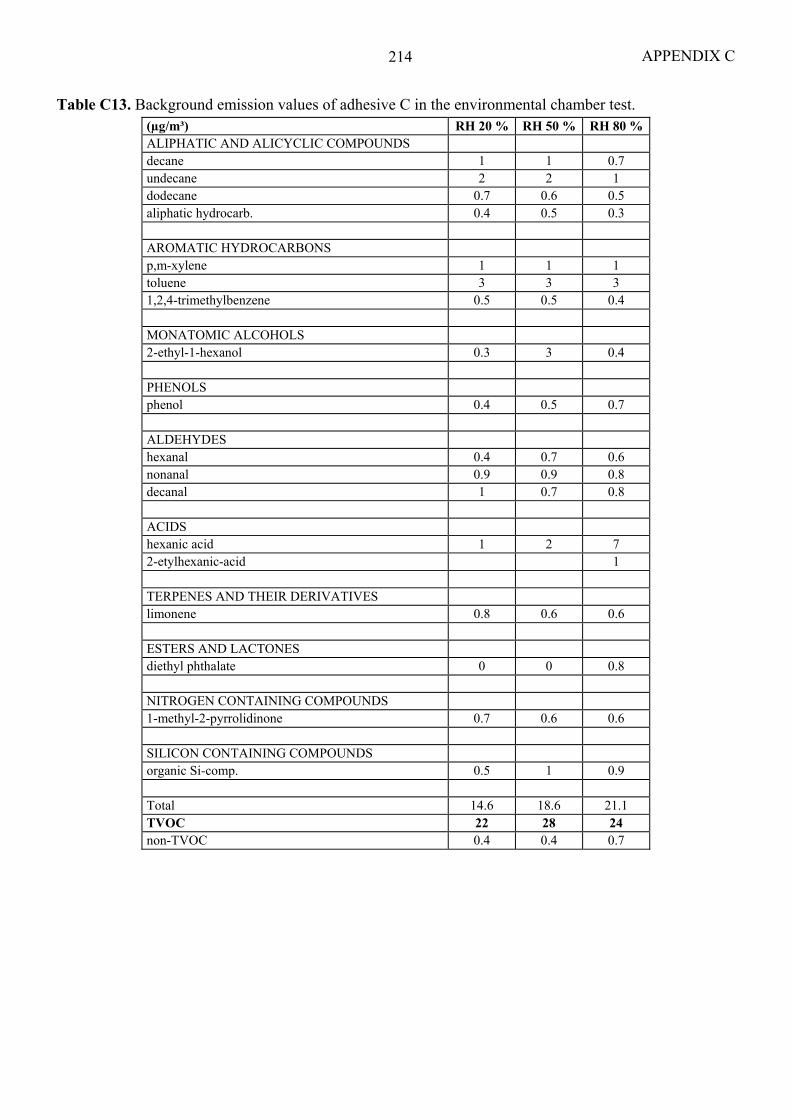
APPENDIX C 214
Table C13. Background emission values of adhesive C in the environmental chamber test. (µg/m³) RH 20 % RH 50 % RH 80 % ALIPHATIC AND ALICYCLIC COMPOUNDS decane 1 1 0.7 undecane 2 2 1 dodecane 0.7 0.6 0.5 aliphatic hydrocarb. 0.4 0.5 0.3
AROMATIC HYDROCARBONS p,m-xylene 1 1 1 toluene 3 3 3 1,2,4-trimethylbenzene 0.5 0.5 0.4 MONATOMIC ALCOHOLS 2-ethyl-1-hexanol 0.3 3 0.4 PHENOLS phenol 0.4 0.5 0.7 ALDEHYDES hexanal 0.4 0.7 0.6 nonanal 0.9 0.9 0.8 decanal 1 0.7 0.8 ACIDS hexanic acid 1 2 7 2-etylhexanic-acid 1
TERPENES AND THEIR DERIVATIVES limonene 0.8 0.6 0.6
ESTERS AND LACTONES diethyl phthalate 0 0 0.8
NITROGEN CONTAINING COMPOUNDS 1-methyl-2-pyrrolidinone 0.7 0.6 0.6
SILICON CONTAINING COMPOUNDS organic Si-comp. 0.5 1 0.9 Total 14.6 18.6 21.1 TVOC 22 28 24 non-TVOC 0.4 0.4 0.7
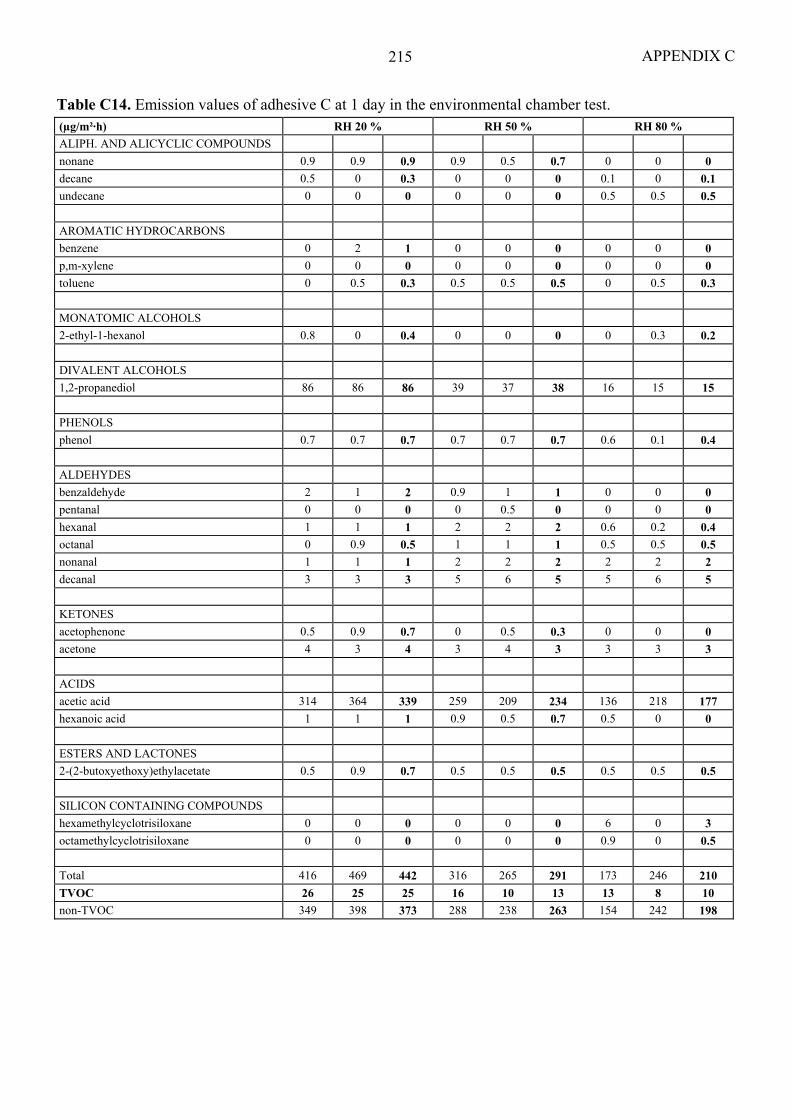
APPENDIX C 215
Table C14. Emission values of adhesive C at 1 day in the environmental chamber test. (µg/m²·h) RH 20 % RH 50 % RH 80 % ALIPH. AND ALICYCLIC COMPOUNDS nonane 0.9 0.9 0.9 0.9 0.5 0.7 0 0 0 decane 0.5 0 0.3 0 0 0 0.1 0 0.1 undecane 0 0 0 0 0 0 0.5 0.5 0.5 AROMATIC HYDROCARBONS benzene 0 2 1 0 0 0 0 0 0 p,m-xylene 0 0 0 0 0 0 0 0 0 toluene 0 0.5 0.3 0.5 0.5 0.5 0 0.5 0.3 MONATOMIC ALCOHOLS 2-ethyl-1-hexanol 0.8 0 0.4 0 0 0 0 0.3 0.2 DIVALENT ALCOHOLS 1,2-propanediol 86 86 86 39 37 38 16 15 15 PHENOLS phenol 0.7 0.7 0.7 0.7 0.7 0.7 0.6 0.1 0.4 ALDEHYDES benzaldehyde 2 1 2 0.9 1 1 0 0 0 pentanal 0 0 0 0 0.5 0 0 0 0 hexanal 1 1 1 2 2 2 0.6 0.2 0.4 octanal 0 0.9 0.5 1 1 1 0.5 0.5 0.5 nonanal 1 1 1 2 2 2 2 2 2 decanal 3 3 3 5 6 5 5 6 5 KETONES acetophenone 0.5 0.9 0.7 0 0.5 0.3 0 0 0 acetone 4 3 4 3 4 3 3 3 3 ACIDS acetic acid 314 364 339 259 209 234 136 218 177 hexanoic acid 1 1 1 0.9 0.5 0.7 0.5 0 0 ESTERS AND LACTONES 2-(2-butoxyethoxy)ethylacetate 0.5 0.9 0.7 0.5 0.5 0.5 0.5 0.5 0.5 SILICON CONTAINING COMPOUNDS hexamethylcyclotrisiloxane 0 0 0 0 0 0 6 0 3 octamethylcyclotrisiloxane 0 0 0 0 0 0 0.9 0 0.5 Total 416 469 442 316 265 291 173 246 210 TVOC 26 25 25 16 10 13 13 8 10 non-TVOC 349 398 373 288 238 263 154 242 198

APPENDIX C 216
Table C15. Emission values of adhesive C at 14 days in the environmental chamber test. (µg/m²·h) RH 20 % RH 50 % RH 80 % ALIPH. AND ALICYCLIC COMPOUNDS decane 0 0 0 0 0 0 0 0 0 undecane 0 0 0 0 0 0 0 0 0 AROMATIC HYDROCARBONS ethylbenzene 2 2 2 2 2 2 2 2 2 propylbenzene 0.5 0.5 0.5 0 0 0 0 0 0 p,m-xylene 11 10 10 9 11 10 9 11 10 o-xylene 4 3 3 3 4 3 3 4 3 toluene 0 0 0 0.9 0.5 0.7 0.9 0.5 0.7 1,2,3-trimethylbenzene 0.5 0.5 0.5 0.5 0.5 0.5 0.5 0.5 0.5 1,2,4-trimethylbenzene 3 3 3 2 3 2 2 3 2 1,3,5-trimethylbenzene 0.5 0.5 0.5 0.5 0.5 0.5 0.5 0.5 0.5 1-ethyl-2-methylbenzene 0.5 0.5 0.5 0.5 0.5 0.5 0.5 0.5 0.5 C3-alkylbenzene 2 2 2 1 2 2 1 1 1 MONATOMIC ALCOHOLS 2-ethyl-1-hexanol 0 0 0 0 0 0 0 0 0 2-methyl-1-propanol 1 1 1 1 1 1 1 2 2 DIVALENT ALCOHOLS 1,2-propanediol 4 2 3 86 86 86 227 241 234 ALCOHOL AND PHENOL ETHERS 1-methoxy-2-propanol 0 0 0 0.5 0.5 0.5 0.5 0.9 0.7 ALDEHYDES nonanal 0 0 0 0 0.5 0.3 0.1 0 0.1 decanal 0 0 0 0 0.1 0.1 0.1 0 0.1 KETONES acetone 0 0 0 0.5 0 0.3 0.5 0.9 0.7 ACIDS acetic acid 20 13 16 59 64 61 118 100 109 hexanoic acid 0 0 0 0 0 0 0.5 0.9 0.7 2-etylhexanic-acid 0 0 0 0 0 0 0.5 0.9 0.7 HALOGEN CONTAINING COMPOUNDS bromnitromethane 0 0 0 0 0 0 1 2 2 SULPHUR CONTAINING COMPOUNDS 5-chloro-2-methyl-3(2H)-isotiatsolon 0 0 0 0 0 0 0.9 0.9 0.9 Total 48 38 43 168 175 172 371 371 371 TVOC 26 23 25 51 56 53 162 180 171 non-TVOC 20 14 17 64 69 66 129 111 120

APPENDIX C 217
Table C16. Emission values of adhesive C at 28 days in the environmental chamber test. (µg/m²·h) RH 20 % RH 50 % RH 80 % ALIPH. AND ALICYCLIC COMPOUNDS heptane 0 0 0 0.2 0.2 0.2 0.2 0.2 0.2 decane 0 0 0 0 0 0 0 0 0 undecane 0 0 0 0 0 0 0 0 0 dodecane 0 0 0 0 0 0 0 0 0 AROMATIC HYDROCARBONS ethylbenzene 0.5 0.5 0.5 0.5 0.5 0.5 0.5 0.5 0.5 p,m-xylene 2 1 2 2 3 3 2 2 2 o-xylene 0.9 0.9 0.9 0.9 0.9 0.9 0.9 0.9 0.9 toluene 0 0 0 0.5 0 0.3 0.5 0 0.3 1,2,3-trimethylbenzene 0.2 0.2 0.2 0.3 0.3 0.3 0.3 0.2 0.3 1,2,4-trimethylbenzene 0.7 0.7 0.7 0.7 0.7 0.7 0.7 0.7 0.7 1,3,5-trimethylbenzene 0 0 0 0 0.2 0.1 0.2 0 0.1 C3-alkylbenzene 0.7 0.6 0.7 0.7 0.8 0.8 0.7 0.7 0.7 MONATOMIC ALCOHOLS 2-ethyl-1-hexanol 0 0 0 0 0 0 0 0 0 2-methyl-1-propanol 0.2 0.3 0.3 0 0.3 0.2 0.2 0.3 0.3 DIVALENT ALCOHOLS 1,2-propanediol 1 0.9 1 39 43 41 50 55 52 PHENOLS phenol 0 0 0 0 0 0 0 0 0 ALCOHOL AND PHENOL ETHERS 2-(2-butoxyethoxy)ethanol 0.3 0 0.2 0 0.4 0.2 0.3 0.3 0.3 1-methoxy-2-propanol 0 0 0 0 0.2 0.1 0.3 0.4 0.4 ALDEHYDES nonanal 0 0 0 0 0 0 0 0.1 0.1 decanal 0 0 0 0 0 0 0.1 0.1 0 ACIDS acetic acid 5 5 5 11 26 18 34 29 31 hexanoic acid 0 0 0 0 0 0 0 0 0 TERPENES AND THEIR DERIVATIVES limonene 0 0 0 0 0 0 0 0 0 HALOGEN CONTAINING COMPOUNDS bromnitromethane 0 0 0 0 0 0 1 2 2 SILICON CONTAINING COMPOUNDS hexamethylcyclotrisiloxane 0 0 0 0 0 0 0.3 0 0.2 OTHERS unidentified 0 0 0 0 0 0 1 2 2 Total 11 10 11 55 76 66 94 93 94 TVOC 9 5 7 21 21 21 30 31 30 non-TVOC 5 5 5 11 28 20 37 31 34
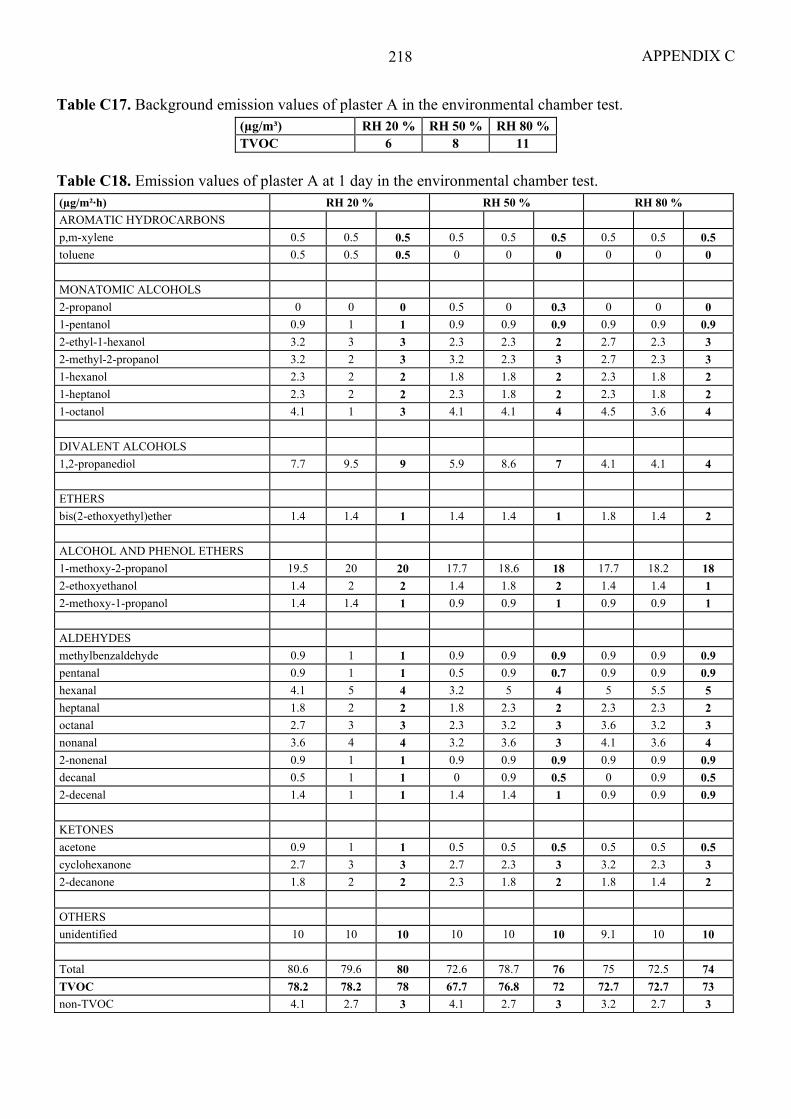
APPENDIX C 218
Table C17. Background emission values of plaster A in the environmental chamber test. (µg/m³) RH 20 % RH 50 % RH 80 %TVOC 6 8 11
Table C18. Emission values of plaster A at 1 day in the environmental chamber test. (µg/m²·h) RH 20 % RH 50 % RH 80 % AROMATIC HYDROCARBONS p,m-xylene 0.5 0.5 0.5 0.5 0.5 0.5 0.5 0.5 0.5 toluene 0.5 0.5 0.5 0 0 0 0 0 0 MONATOMIC ALCOHOLS 2-propanol 0 0 0 0.5 0 0.3 0 0 0 1-pentanol 0.9 1 1 0.9 0.9 0.9 0.9 0.9 0.9 2-ethyl-1-hexanol 3.2 3 3 2.3 2.3 2 2.7 2.3 3 2-methyl-2-propanol 3.2 2 3 3.2 2.3 3 2.7 2.3 3 1-hexanol 2.3 2 2 1.8 1.8 2 2.3 1.8 2 1-heptanol 2.3 2 2 2.3 1.8 2 2.3 1.8 2 1-octanol 4.1 1 3 4.1 4.1 4 4.5 3.6 4 DIVALENT ALCOHOLS 1,2-propanediol 7.7 9.5 9 5.9 8.6 7 4.1 4.1 4 ETHERS bis(2-ethoxyethyl)ether 1.4 1.4 1 1.4 1.4 1 1.8 1.4 2 ALCOHOL AND PHENOL ETHERS 1-methoxy-2-propanol 19.5 20 20 17.7 18.6 18 17.7 18.2 18 2-ethoxyethanol 1.4 2 2 1.4 1.8 2 1.4 1.4 1 2-methoxy-1-propanol 1.4 1.4 1 0.9 0.9 1 0.9 0.9 1 ALDEHYDES methylbenzaldehyde 0.9 1 1 0.9 0.9 0.9 0.9 0.9 0.9 pentanal 0.9 1 1 0.5 0.9 0.7 0.9 0.9 0.9 hexanal 4.1 5 4 3.2 5 4 5 5.5 5 heptanal 1.8 2 2 1.8 2.3 2 2.3 2.3 2 octanal 2.7 3 3 2.3 3.2 3 3.6 3.2 3 nonanal 3.6 4 4 3.2 3.6 3 4.1 3.6 4 2-nonenal 0.9 1 1 0.9 0.9 0.9 0.9 0.9 0.9 decanal 0.5 1 1 0 0.9 0.5 0 0.9 0.5 2-decenal 1.4 1 1 1.4 1.4 1 0.9 0.9 0.9 KETONES acetone 0.9 1 1 0.5 0.5 0.5 0.5 0.5 0.5 cyclohexanone 2.7 3 3 2.7 2.3 3 3.2 2.3 3 2-decanone 1.8 2 2 2.3 1.8 2 1.8 1.4 2 OTHERS unidentified 10 10 10 10 10 10 9.1 10 10 Total 80.6 79.6 80 72.6 78.7 76 75 72.5 74 TVOC 78.2 78.2 78 67.7 76.8 72 72.7 72.7 73 non-TVOC 4.1 2.7 3 4.1 2.7 3 3.2 2.7 3

APPENDIX C 219
Table C19. Emission values of plaster A at 14 days in the environmental chamber test. (µg/m²·h) RH 20 % RH 50 % RH 80 % ALIPH. AND ALICYCLIC COMPOUNDS dodecane 0 0 0 0 0 0 0.3 0.3 0.3 tetradecane 0 0 0 0 0 0 0.4 0.4 0.4 AROMATIC HYDROCARBONS p,m-xylene 1 1 1 1 1 1 1 1 1 toluene 1 1 1 1 1 1 1 1 1 1,2,4-trimethylbenzene 0 0 0 0 1 0 0.4 0.3 0.4 MONATOMIC ALCOHOLS 2-ethyl-1-hexanol 1 1 1 0 0 0 0.4 0.4 0.4 DIVALENT ALCOHOLS 1,2-propanediol 159 159 159 255 250 252 30 29 29 ETHERS bis(2-ethoxyethyl)ether 0 0 0 0 0 0 1 2 2 bis[2-(2-ethoxyethoxy)ethyl]ether 0 0 0 3 2.3 3 0.4 0.4 0.4 PHENOLS phenol 0 0 0 0 1 0 1 1 1 ALCOHOL AND PHENOL ETHERS 2-(2-ethoxyethoxy)ethanol 7 8 7 34 39 36 1 1 1 2-(2-butoxyethoxy)ethanol 0 0 0 1 1 1 0 0 0 1-methoxy-2-propanol 0 0 0 0 0 0 0.4 0.4 0.4 dipropylene glycol methyl ether 3 3 3 6 6 6 3 3 3 bis(2-hydroxypropyl) ether 1 1 1 20 21 21 0 0 0 ALDEHYDES hexanal 1 1 1 1 1 1 1 1 1 heptanal 0 0 0 0 0 0 1 1 1 octanal 1 1 1 0 1 0 1 1 1 nonanal 1 1 1 1 1 1 1 1 1 decanal 0 0 0 1 0 0 1 1 1 2-decenal 0 0 0 0 0 0 0.3 0.3 0.3 KETONES 2-butanone (MEK) 0 0 0 1 0 0 0 0.2 0.1 acetone 1 0 0 0 0 0 1 1 1 1-hydroxy-2-propanone 0 0 0 0 0 0 1 1 1 ACIDS acetic acid 8 12 10 14 17 15 6 4 5 SILICON CONTAINING COMPOUNDS organic Si-comp. 0 0 0 0 0 0 0.7 0.8 0.8 hexamethylcyclotrisiloxane 0 0 0 1 0 0 0 0 0 octamethylcyclotrisiloxane 0 0 0 0 0 0 1 1 1 decamethylcyclopentasiloxane 0 0 0 0 0 0 0.4 0.4 0.4 triethoxypentylsilane 0 0 0 0 0 0 0.3 0.3 0.3 Total 181 187 184 336 340 338 51 50 50 TVOC 106 106 106 272 272 272 38 36 37 non-TVOC 8 12 10 14 17 15 6 4.8 5
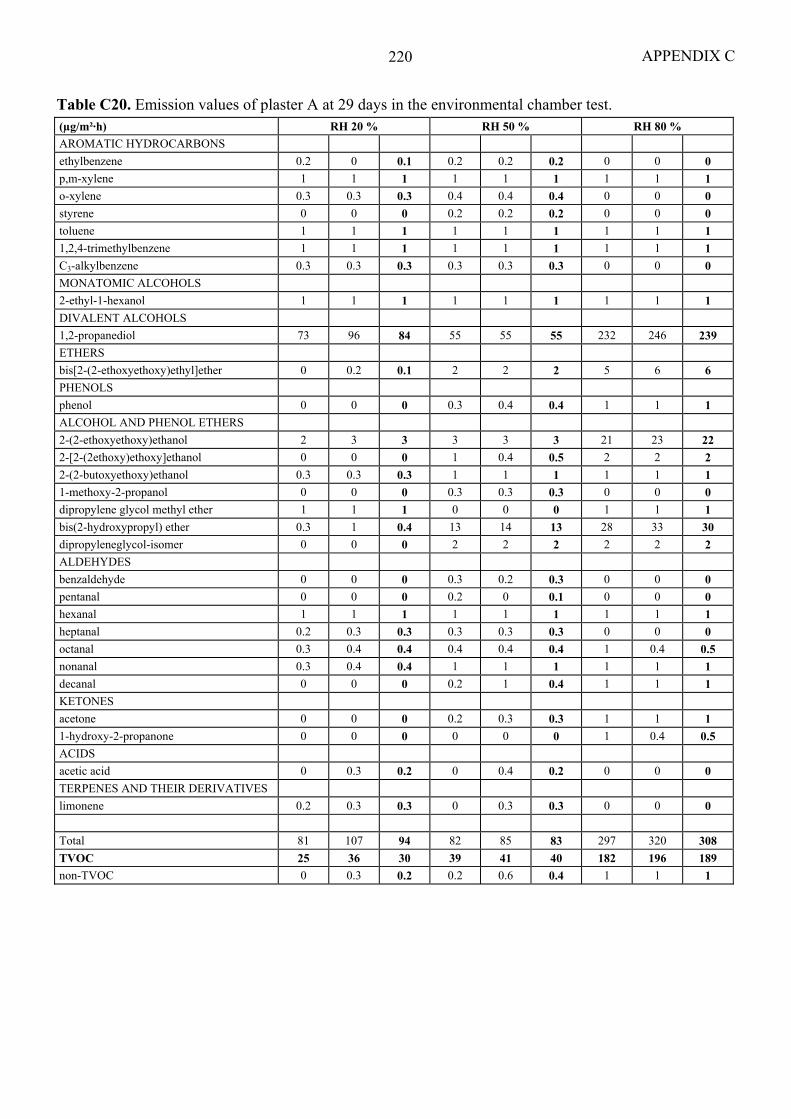
APPENDIX C 220
Table C20. Emission values of plaster A at 29 days in the environmental chamber test. (µg/m²·h) RH 20 % RH 50 % RH 80 % AROMATIC HYDROCARBONS ethylbenzene 0.2 0 0.1 0.2 0.2 0.2 0 0 0 p,m-xylene 1 1 1 1 1 1 1 1 1 o-xylene 0.3 0.3 0.3 0.4 0.4 0.4 0 0 0 styrene 0 0 0 0.2 0.2 0.2 0 0 0 toluene 1 1 1 1 1 1 1 1 1 1,2,4-trimethylbenzene 1 1 1 1 1 1 1 1 1 C3-alkylbenzene 0.3 0.3 0.3 0.3 0.3 0.3 0 0 0 MONATOMIC ALCOHOLS 2-ethyl-1-hexanol 1 1 1 1 1 1 1 1 1 DIVALENT ALCOHOLS 1,2-propanediol 73 96 84 55 55 55 232 246 239 ETHERS bis[2-(2-ethoxyethoxy)ethyl]ether 0 0.2 0.1 2 2 2 5 6 6 PHENOLS phenol 0 0 0 0.3 0.4 0.4 1 1 1 ALCOHOL AND PHENOL ETHERS 2-(2-ethoxyethoxy)ethanol 2 3 3 3 3 3 21 23 22 2-[2-(2ethoxy)ethoxy]ethanol 0 0 0 1 0.4 0.5 2 2 2 2-(2-butoxyethoxy)ethanol 0.3 0.3 0.3 1 1 1 1 1 1 1-methoxy-2-propanol 0 0 0 0.3 0.3 0.3 0 0 0 dipropylene glycol methyl ether 1 1 1 0 0 0 1 1 1 bis(2-hydroxypropyl) ether 0.3 1 0.4 13 14 13 28 33 30 dipropyleneglycol-isomer 0 0 0 2 2 2 2 2 2 ALDEHYDES benzaldehyde 0 0 0 0.3 0.2 0.3 0 0 0 pentanal 0 0 0 0.2 0 0.1 0 0 0 hexanal 1 1 1 1 1 1 1 1 1 heptanal 0.2 0.3 0.3 0.3 0.3 0.3 0 0 0 octanal 0.3 0.4 0.4 0.4 0.4 0.4 1 0.4 0.5 nonanal 0.3 0.4 0.4 1 1 1 1 1 1 decanal 0 0 0 0.2 1 0.4 1 1 1 KETONES acetone 0 0 0 0.2 0.3 0.3 1 1 1 1-hydroxy-2-propanone 0 0 0 0 0 0 1 0.4 0.5 ACIDS acetic acid 0 0.3 0.2 0 0.4 0.2 0 0 0 TERPENES AND THEIR DERIVATIVES limonene 0.2 0.3 0.3 0 0.3 0.3 0 0 0 Total 81 107 94 82 85 83 297 320 308 TVOC 25 36 30 39 41 40 182 196 189 non-TVOC 0 0.3 0.2 0.2 0.6 0.4 1 1 1

APPENDIX C 221
Table C21. Background emission values of plaster C in the environmental chamber test. (µg/m³) RH 20 % RH 50 % RH 80 % TVOC 14 20 19
Table C22. Emission values of plaster C at 1 day in the environmental chamber test. (µg/m²·h) RH 20 % RH 50 % RH 80 % ALIPH. AND ALICYCLIC COMPOUNDS 1-nonene 0 0 0 0 0.3 0.2 0 0 0 decane 0.2 0.2 0.2 0.3 0.3 0.3 0 0 0 undecane 0.2 0.2 0.2 0.4 0.4 0.4 0.3 0.2 0.3 tetradecane 0 0 0 0.2 0.2 0.2 0 0 0 AROMATIC HYDROCARBONS ethylbenzene 0 0 0 0 0 0 0.2 0.2 0.2 p,m-xylene 0.5 0.5 0.5 0.5 0.5 0.5 0.9 0.9 0.9 o-xylene 0.2 0.2 0.2 0 0.2 0.1 0.3 0.3 0.3 toluene 0.5 0.5 0.5 0.4 0.5 0.5 0.4 0.5 0.5 1,2,4-trimethylbenzene 0.5 0.5 0.5 0.5 0.5 0.5 0.5 0.5 0.5 MONATOMIC ALCOHOLS 1-butanol 0 0 0 0 0.2 0.1 0.3 0.2 0.3 2-ethyl-1-hexanol 0.5 0.5 0.5 0.5 0.5 0.5 0.5 0.4 0.5 benzylalcohol 0.4 0.5 0.5 0.4 0.4 0.4 0.4 0.3 0.4 2-methyl-1-propanol 0.3 0.4 0.4 0 0.4 0.2 0.5 0.4 0.5 2-methyl-2-propanol 0.2 0 0.1 0.2 0.3 0.3 0.5 0.5 0.5 ETHERS bis(2-methoxyethyl)ether 0.4 0.4 0.4 0.5 0.3 0.4 0.4 0.3 0.4 1,2-dimethoxybenzene 0.3 0.3 0.3 0.3 0.4 0.4 0.4 0.4 0.4 ALCOHOL AND PHENOL ETHERS 1-methoxy-2-propanol 0.4 0.4 0.4 0 0.3 0.2 0.3 0.3 0.3 2-methoxyethanol 0.5 0.5 0.5 0.5 0.5 0.5 0.4 0.4 0.4 ALDEHYDES benzaldehyde 0.3 0.4 0.4 0.2 0.4 0.3 0.3 0.4 0.4 pentanal 0.2 0 0.1 0 0.3 0.2 0.2 0.2 0.2 hexanal 0.9 0.5 0.7 0.9 0.9 1 0.9 0.9 0.9 heptanal 0 0 0 0.2 0.5 0.4 0.2 0 0.1 octanal 0.2 0.3 0.3 0 0.9 0.5 0.3 0.2 0.3 nonanal 0.9 0.9 0.9 0.9 2 1 0.9 1 1.2 decanal 0 0.9 0 0 0.9 0.5 0 0.5 0.3 KETONES 2-butanone (MEK) 0 0 0 0 2 1 0 0 0 acetone 0 0.3 0.2 0 0.4 0.2 0.3 0.4 0.4 cyclohexanone 0.4 0.4 0.4 0.4 0.3 0.4 0.9 0.5 0.7 6-methyl-5-hepten-2-one 0 0 0 0 0.2 0.1 0 0 0 ESTERS AND LACTONES 1-methoxy-2-propylacetate 0.9 0.9 0.9 0.9 0.9 0.9 1 0.9 1.2 n-butylacetate 0.2 0 0.1 0 0 0 0 0.2 0.1 methylmetacrylate 0 0 0 0 0.9 0.5 0 0 0 diethyl phthalate 0 0 0 0.5 0 0.3 0.9 0 0.5 2-butoxyethylacetate 0 0 0 0 0 0 0.2 0.2 0.2 NITROGEN CONTAINING COMPOUNDS unidentified nitrile 0.9 0.9 0.9 0.9 0.9 0.9 0.9 0.9 0.9 SILICON CONTAINING COMPOUNDS organic Si-comp. 0.9 0.9 0.9 0.5 0.5 0.5 0.5 0.5 0.5 triethoxypentylsilane 3 3 3 3 2 3 2 2 2 Total 14 14 14 13 21 17 17 15 16 TVOC 22 21 21 14 16 15 13 11 12 non-TVOC 0.2 0.3 0 0.2 3 2 0.8 0.8 1

APPENDIX C 222
Table C23. Emission values of plaster C at 14 days in the environmental chamber test. (µg/m²·h) RH 20 % RH 50 % RH 80 % ALIPH. AND ALICYCLIC COMPOUNDS decane 0.2 0.2 0.2 0.3 0.3 0.3 0.3 0.3 0.3 undecane 0.1 0.1 0.1 0.4 0.3 0.4 0.3 0.3 0.3 dodecane 0 0 0 0.2 0.1 0.2 0.2 0.2 0.2 tridecane 0 0 0 0 0 0 0.5 0.9 0.7 tetradecane 0 0 0 0.1 0.1 0.1 2 1 2 pentadecane 0 0 0 0 0 0 0.4 0.4 0.4 hexadecane 0 0 0 0 0 0 0.2 0.2 0.2 A MIXTURE OF HYDROCARBONS hydrocarbon-mixture 0 0 0 0 0 0 18 19 19 AROMATIC HYDROCARBONS ethylbenzene 0.2 0.2 0.2 0.2 0.2 0.2 0.2 0.2 0.2 p,m-xylene 0.9 0.9 0.9 0.9 0.9 0.9 0.9 0.9 0.9 o-xylene 0.3 0.3 0.3 0.3 0.3 0.3 0.3 0.3 0.3 styrene 0.1 0.1 0.1 0.1 0.1 0.1 0.1 0.1 0.1 toluene 0.9 0.9 0.9 0.9 0.9 0.9 0.9 0.9 0.9 1,2,3-trimethylbenzene 0 0 0 0.1 0.1 0.1 0.1 0 0.1 1,2,4-trimethylbenzene 0.5 0.4 0.5 0.5 0.5 0.5 0.5 0.5 0.5 C3-alkylbenzene 0.2 0.3 0.3 0.3 0.3 0.3 0.3 0.3 0.3 MONATOMIC ALCOHOLS 1-butanol 0 0 0 0 0 0 0 0.1 0.1 2-ethyl-1-hexanol 0 0 0 0.3 0.3 0.3 0.3 0.5 0.4 benzylalcohol 0 0 0 0.1 0 0.1 0 0 0 2-methyl-1-propanol 0 0 0 0 0.1 0.1 0 0 0 ETHERS bis(2-methoxyethyl)ether 0 0 0 0 0.2 0.1 0.5 0.5 0.5 PHENOLS phenol 0 0 0 0.1 0.2 0.2 0.3 0.3 0.3 ALCOHOL AND PHENOL ETHERS 1-methoxy-2-propanol 0 0 0 0.1 0.1 0.1 0.2 0.1 0.2 2-phenoxyethanol 0 0 0 0 0 0 0.1 0.2 0.2 2-methoxyethanol 0 0 0 0 0 0 0.4 0.2 0.3 ALDEHYDES benzaldehyde 0 0 0 0 0 0 0.3 0 0.2 hexanal 0 0 0 0.2 0.1 0.2 0 0 0 octanal 0 0 0 0 0 0 0 0.1 0.1 nonanal 0.2 0.1 0.2 0.2 0.2 0.2 0.2 0.3 0.3 decanal 0.4 0 0.2 0 0 0 0 0 0 KETONES 2-butanone (MEK) 0 0 0 0.2 0.2 0.2 0 0 0 acetone 0 0 0 0.1 0.1 0.1 0.3 0 0.2 ACIDS acetic acid 0 2 1 3 2 2 2 2 2 TERPENES AND THEIR DERIVATIVES limonene 0.2 0.2 0.2 0.2 0.3 0.3 0.2 0.3 0.3 α-pinene 0 0 0 0 0.1 0.1 0 0 0 ESTERS AND LACTONES n-butylacetate 0.1 0.1 0.1 0.2 0.2 0.2 0.1 0 0.1 SILICON CONTAINING COMPOUNDS organic Si-comp. 0 0 0 0 0.1 0.1 0.5 0.6 0.6 decamethylcyclopentasiloxane 0 0 0 0 0 0 0.2 0.2 0.2 triethoxypentylsilane 0 0 0 0 0 0 2 2 2 Total 4 6 5 9 8 8 32 34 33 TVOC 8 7 7 6 5 5 27 26 27 non-TVOC 0 2 1 3 2 3 2 2 2

APPENDIX C 223
Table C24. Emission values of plaster C at 27 days in the environmental chamber test. (µg/m²·h) RH 20 % RH 50 % RH 80 % ALIPH. AND ALICYCLIC COMPOUNDS decane 0 0 0 0.2 0.2 0.2 0.1 0.1 0.1 undecane 0 0 0 0.2 0.2 0.2 0.1 0.2 0.2 dodecane 0 0 0 0.1 0 0.1 0 0.1 0.1 hexadecane 0 0 0 0 0 0 0.1 0 0.1 AROMATIC HYDROCARBONS ethylbenzene 0.2 0.2 0.2 0.2 0.2 0.2 0.2 0.2 0.2 p,m-xylene 0.9 0.9 0.9 0.9 0.5 0.7 0.9 0.9 0.9 o-xylene 0.3 0.3 0.3 0.4 0.3 0.4 0.3 0.3 0.3 styrene 0.2 0.2 0.2 0.2 0.2 0.2 0.2 0.2 0.2 toluene 0.9 0.9 0.9 0.9 0.9 0.9 0.9 0.9 0.9 1,2,4-trimethylbenzene 0.3 0.4 0.4 0.5 0.5 0.5 0.5 0.5 0.5 C3-alkylbenzene 0.2 0.2 0.2 0.3 0.3 0.3 0.3 0.3 0.3 MONATOMIC ALCOHOLS 1-butanol 0 0 0 0 0 0 0.3 0.5 0.4 2-ethyl-1-hexanol 0 0 0 0.5 0.4 0.5 0.2 0.4 0.3 ETHERS bis(2-methoxyethyl)ether 0 0 0 0 0 0 0.4 0.5 0.5 ALCOHOL AND PHENOL ETHERS 1-methoxy-2-propanol 0 0 0 0.1 0 0.1 0.1 0.1 0.1 2-butoxyethanol 0 0 0 0 0 0 0.2 0.3 0.3 ALDEHYDES benzaldehyde 0 0 0 0.2 0.2 0.2 0 0.1 0.1 n-butanal 0 0 0 0 0 0 0.4 0.5 0.5 hexanal 0 0 0 0 0.1 0.1 0 0 0 decanal 0 0 0 0.2 0 0.1 0 0 0 KETONES acetone 0 0 0 0.1 0 0.1 0.3 0.3 0.3 TERPENES AND THEIR DERIVATIVES limonene 0.2 0.2 0.2 0.3 0.3 0.3 0.3 0.3 0.3 Total 3 3 3 5 4 5 6 7 6 TVOC 5 5.5 5 1.8 0.9 1 0 0 0 non-TVOC 0 0 0 0.1 0 0.1 0.6 0.8 0.7
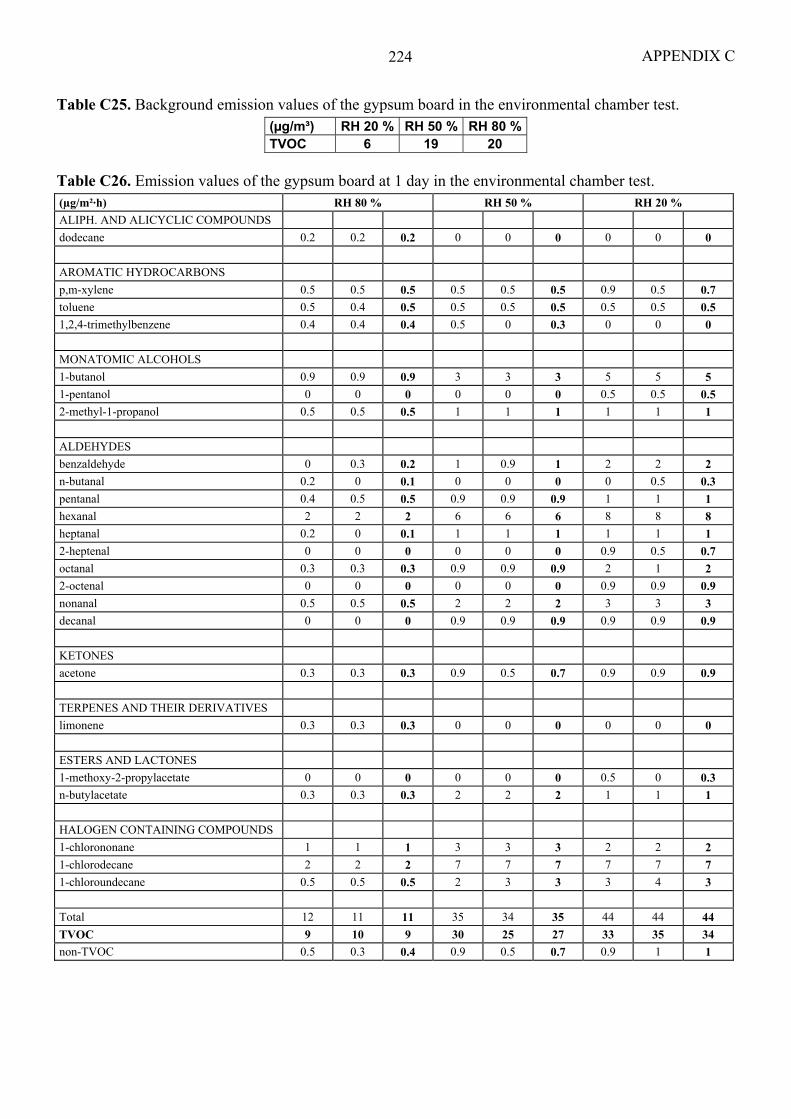
APPENDIX C 224
Table C25. Background emission values of the gypsum board in the environmental chamber test. (µg/m³) RH 20 % RH 50 % RH 80 %TVOC 6 19 20
Table C26. Emission values of the gypsum board at 1 day in the environmental chamber test. (µg/m²·h) RH 80 % RH 50 % RH 20 % ALIPH. AND ALICYCLIC COMPOUNDS dodecane 0.2 0.2 0.2 0 0 0 0 0 0 AROMATIC HYDROCARBONS p,m-xylene 0.5 0.5 0.5 0.5 0.5 0.5 0.9 0.5 0.7 toluene 0.5 0.4 0.5 0.5 0.5 0.5 0.5 0.5 0.5 1,2,4-trimethylbenzene 0.4 0.4 0.4 0.5 0 0.3 0 0 0 MONATOMIC ALCOHOLS 1-butanol 0.9 0.9 0.9 3 3 3 5 5 5 1-pentanol 0 0 0 0 0 0 0.5 0.5 0.5 2-methyl-1-propanol 0.5 0.5 0.5 1 1 1 1 1 1 ALDEHYDES benzaldehyde 0 0.3 0.2 1 0.9 1 2 2 2 n-butanal 0.2 0 0.1 0 0 0 0 0.5 0.3 pentanal 0.4 0.5 0.5 0.9 0.9 0.9 1 1 1 hexanal 2 2 2 6 6 6 8 8 8 heptanal 0.2 0 0.1 1 1 1 1 1 1 2-heptenal 0 0 0 0 0 0 0.9 0.5 0.7 octanal 0.3 0.3 0.3 0.9 0.9 0.9 2 1 2 2-octenal 0 0 0 0 0 0 0.9 0.9 0.9 nonanal 0.5 0.5 0.5 2 2 2 3 3 3 decanal 0 0 0 0.9 0.9 0.9 0.9 0.9 0.9 KETONES acetone 0.3 0.3 0.3 0.9 0.5 0.7 0.9 0.9 0.9 TERPENES AND THEIR DERIVATIVES limonene 0.3 0.3 0.3 0 0 0 0 0 0 ESTERS AND LACTONES 1-methoxy-2-propylacetate 0 0 0 0 0 0 0.5 0 0.3 n-butylacetate 0.3 0.3 0.3 2 2 2 1 1 1 HALOGEN CONTAINING COMPOUNDS 1-chlorononane 1 1 1 3 3 3 2 2 2 1-chlorodecane 2 2 2 7 7 7 7 7 7 1-chloroundecane 0.5 0.5 0.5 2 3 3 3 4 3 Total 12 11 11 35 34 35 44 44 44 TVOC 9 10 9 30 25 27 33 35 34 non-TVOC 0.5 0.3 0.4 0.9 0.5 0.7 0.9 1 1
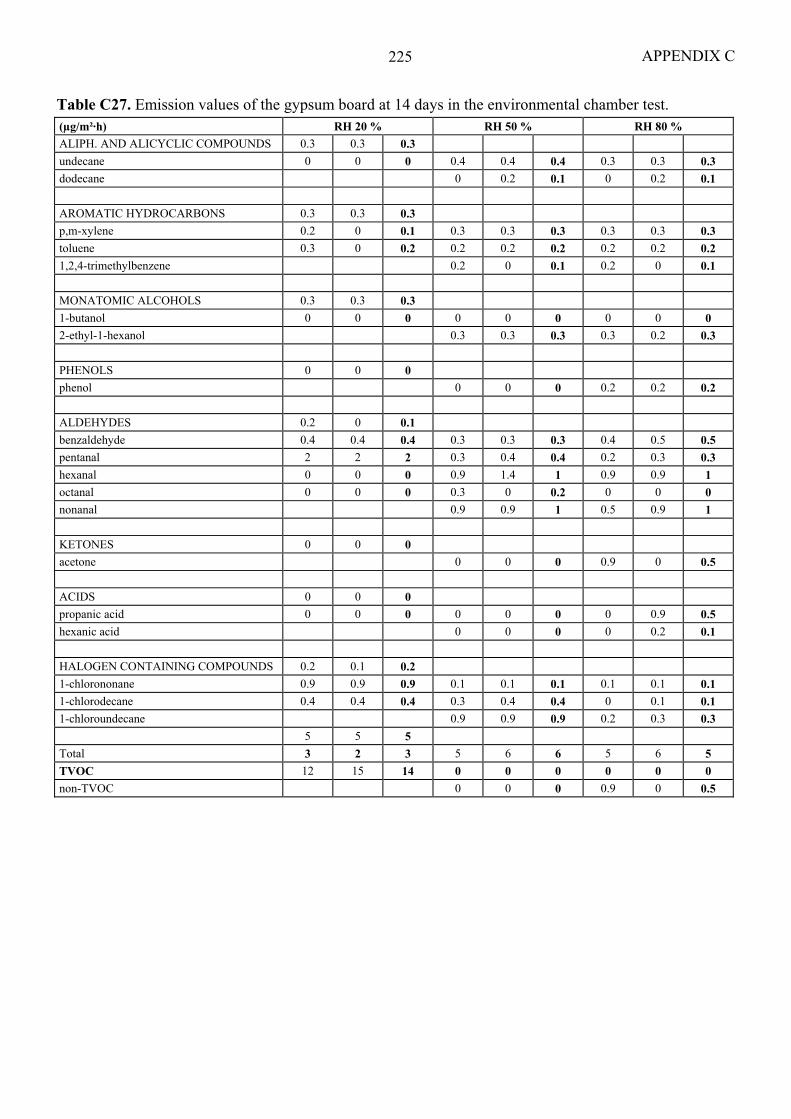
APPENDIX C 225
Table C27. Emission values of the gypsum board at 14 days in the environmental chamber test. (µg/m²·h) RH 20 % RH 50 % RH 80 % ALIPH. AND ALICYCLIC COMPOUNDS 0.3 0.3 0.3 undecane 0 0 0 0.4 0.4 0.4 0.3 0.3 0.3 dodecane 0 0.2 0.1 0 0.2 0.1 AROMATIC HYDROCARBONS 0.3 0.3 0.3 p,m-xylene 0.2 0 0.1 0.3 0.3 0.3 0.3 0.3 0.3 toluene 0.3 0 0.2 0.2 0.2 0.2 0.2 0.2 0.2 1,2,4-trimethylbenzene 0.2 0 0.1 0.2 0 0.1 MONATOMIC ALCOHOLS 0.3 0.3 0.3 1-butanol 0 0 0 0 0 0 0 0 0 2-ethyl-1-hexanol 0.3 0.3 0.3 0.3 0.2 0.3 PHENOLS 0 0 0 phenol 0 0 0 0.2 0.2 0.2 ALDEHYDES 0.2 0 0.1 benzaldehyde 0.4 0.4 0.4 0.3 0.3 0.3 0.4 0.5 0.5 pentanal 2 2 2 0.3 0.4 0.4 0.2 0.3 0.3 hexanal 0 0 0 0.9 1.4 1 0.9 0.9 1 octanal 0 0 0 0.3 0 0.2 0 0 0 nonanal 0.9 0.9 1 0.5 0.9 1 KETONES 0 0 0 acetone 0 0 0 0.9 0 0.5 ACIDS 0 0 0 propanic acid 0 0 0 0 0 0 0 0.9 0.5 hexanic acid 0 0 0 0 0.2 0.1 HALOGEN CONTAINING COMPOUNDS 0.2 0.1 0.2 1-chlorononane 0.9 0.9 0.9 0.1 0.1 0.1 0.1 0.1 0.1 1-chlorodecane 0.4 0.4 0.4 0.3 0.4 0.4 0 0.1 0.1 1-chloroundecane 0.9 0.9 0.9 0.2 0.3 0.3 5 5 5 Total 3 2 3 5 6 6 5 6 5 TVOC 12 15 14 0 0 0 0 0 0 non-TVOC 0 0 0 0.9 0 0.5
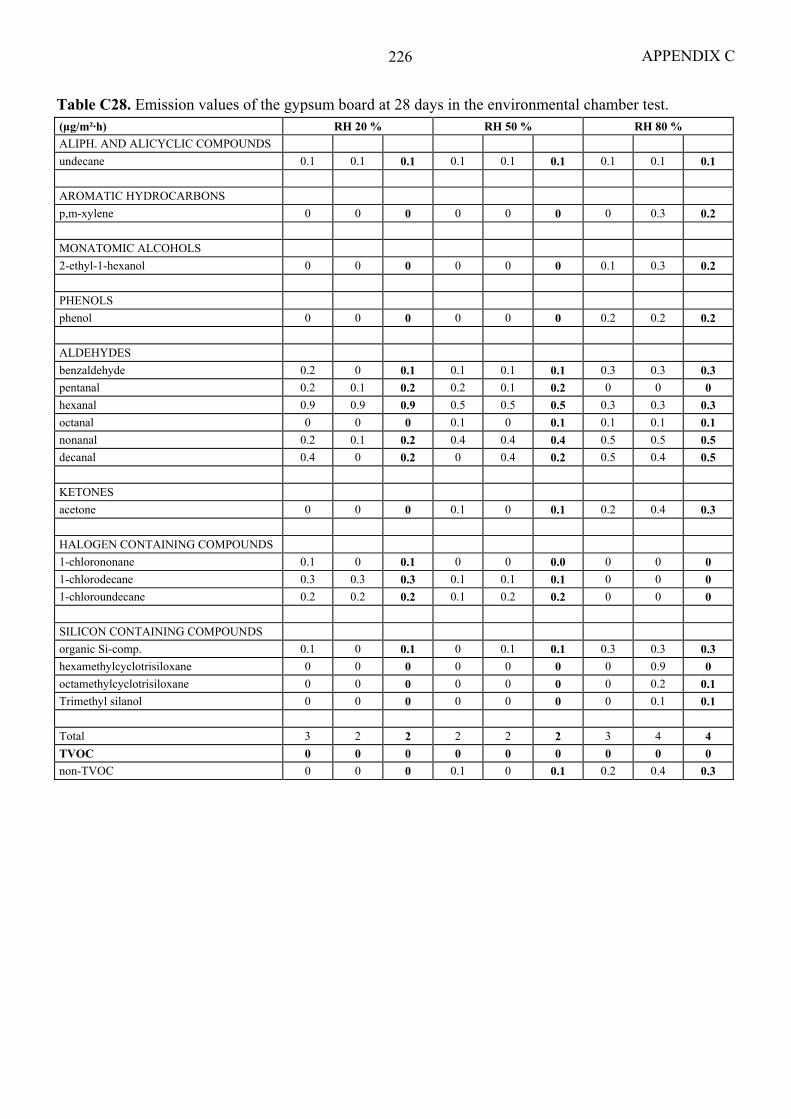
APPENDIX C 226
Table C28. Emission values of the gypsum board at 28 days in the environmental chamber test. (µg/m²·h) RH 20 % RH 50 % RH 80 % ALIPH. AND ALICYCLIC COMPOUNDS undecane 0.1 0.1 0.1 0.1 0.1 0.1 0.1 0.1 0.1 AROMATIC HYDROCARBONS p,m-xylene 0 0 0 0 0 0 0 0.3 0.2 MONATOMIC ALCOHOLS 2-ethyl-1-hexanol 0 0 0 0 0 0 0.1 0.3 0.2 PHENOLS phenol 0 0 0 0 0 0 0.2 0.2 0.2 ALDEHYDES benzaldehyde 0.2 0 0.1 0.1 0.1 0.1 0.3 0.3 0.3 pentanal 0.2 0.1 0.2 0.2 0.1 0.2 0 0 0 hexanal 0.9 0.9 0.9 0.5 0.5 0.5 0.3 0.3 0.3 octanal 0 0 0 0.1 0 0.1 0.1 0.1 0.1 nonanal 0.2 0.1 0.2 0.4 0.4 0.4 0.5 0.5 0.5 decanal 0.4 0 0.2 0 0.4 0.2 0.5 0.4 0.5 KETONES acetone 0 0 0 0.1 0 0.1 0.2 0.4 0.3 HALOGEN CONTAINING COMPOUNDS 1-chlorononane 0.1 0 0.1 0 0 0.0 0 0 0 1-chlorodecane 0.3 0.3 0.3 0.1 0.1 0.1 0 0 0 1-chloroundecane 0.2 0.2 0.2 0.1 0.2 0.2 0 0 0 SILICON CONTAINING COMPOUNDS organic Si-comp. 0.1 0 0.1 0 0.1 0.1 0.3 0.3 0.3 hexamethylcyclotrisiloxane 0 0 0 0 0 0 0 0.9 0 octamethylcyclotrisiloxane 0 0 0 0 0 0 0 0.2 0.1 Trimethyl silanol 0 0 0 0 0 0 0 0.1 0.1 Total 3 2 2 2 2 2 3 4 4 TVOC 0 0 0 0 0 0 0 0 0 non-TVOC 0 0 0 0.1 0 0.1 0.2 0.4 0.3

APPENDIX C 227
Table C29. Background emission values of adhesive B in the environmental chamber test. (µg/m³) RH 20 % RH 50 % RH 80 % ALIPHATIC AND ALICYCLIC COMPOUNDS decane 1 0.5 0.7 undecane 2 0.4 1 dodecane 0.5 1 0.4 AROMATIC HYDROCARBONS benzene 0 0.2 0.2 ethylbenzene 0.2 0.2 0.2 p,m-xylene 0.6 0.7 0.7 o-xylene 0.2 0.2 0.2 toluene 1 1 1 1,2,4-trimethylbenzene 0.3 0.3 0.3 MONATOMIC ALCOHOLS 2-ethyl-1-hexanol 0 3 0.8 PHENOLS phenol 0 0.2 0.8 ALCOHOL AND PHENOL ETHERS 2-(2-butoxyethoxy)ethanol 0 0 0.4 2-butoxyethanol 0 0.3 0.5 ALDEHYDES benzaldehyde 0.5 0.3 0.3 pentanal 0 0 1 nonanal 0 1 1 ACIDS acetic acid 0 3 4 hexanic acid 0 0.3 0 ESTERS AND LACTONES texanol 0 0 2 NITROGEN CONTAINING COMPOUNDS 1-methyl-2-pyrrolidinone 0 0 0.4 Total 6.3 12.6 15.9 TVOC 8 8 13 non-TVOC 0 3 4
Table C30. Emission values of adhesive B at 1 day in the environmental chamber test. (µg/m²·h) RH 20 % RH 50 % RH 80 % ALCOHOL AND PHENOL ETHERS 2-(2-butoxyethoxy)ethanol 2850 2859 2855 2009 1964 1986 1368 1332 1350 2-butoxyethanol 28 28 28 22 22 22 17 18 17 ALDEHYDES nonanal 0 0 0 0 0 0 7 0 4 ACIDS acetic acid 33 43 38 20 0 10 0 0 0 ESTERS AND LACTONES 2-(2-butoxyethoxy)ethyl acetate 26 26 26 20 19 19 15 15 15 Total 2937 2956 2947 2070 2005 2038 1407 1364 1385 TVOC 2560 2578 2569 1656 1619 1637 1071 1026 1049 non-TVOC 33 43 38 20 0 10 0 0 0

APPENDIX C 228
Table C31. Emission values of adhesive B at 7 days in the environmental chamber test. (µg/m²·h) RH 20 % RH 50 % RH 80 % ALIPH. AND ALICYCLIC COMPOUNDS undecane 0 0 0 0 0 0 1 1 1 AROMATIC HYDROCARBONS p,m-xylene 0 0 0 0 0 0 0 0 0 toluene 0 0 0 0 0 0 0 1 0 MONATOMIC ALCOHOLS 1-butanol 0 0 0 0 0 0 0 1 1 2-ethyl-1-hexanol 1 1 1 1 1 1 1 1 1 DIVALENT ALCOHOLS 1,2-propanediol 0 0 0 0 0 0 7 3 5 ALCOHOL AND PHENOL ETHERS 2-(2-ethoxyethoxy)ethanol 0 0 0 0 0 0 1 1 1 2-(2-butoxyethoxy)ethanol 777 796 786 2141 2132 2136 5818 5954 5886 2-butoxyethanol 1 1 1 1 1 1 2 2 2 ALDEHYDES benzaldehyde 1 1 1 1 0 1 1 0 1 n-butanal 0 1 0 1 0 0 2 2 2 nonanal 0 0 0 0 1 0 1 1 1 decanal 2 2 2 2 2 2 0 0 0 KETONES acetophenone 1 1 1 1 0 0 1 1 1 ACIDS acetic acid 28 28 28 36 40 38 36 27 32 ESTERS AND LACTONES 2-(2-butoxyethoxy)ethylacetate 2 2 2 4 5 4 16 16 16 texanol 0 0 0 2 2 2 3 3 3 Total 812 832 822 2189 2182 2186 5889 6013 5951 TVOC 483 483 483 1160 1165 1162 3958 4121 4040 non-TVOC 28 28 28 37 40 38 38 29 34 Table C32. Emission values of adhesive B at 14 days in the environmental chamber test. (µg/m²·h) RH 20 % RH 50 % RH 80 % AROMATIC HYDROCARBONS p,m-xylene 0 0 0 0 0 0 0 0 0 toluene 0 0 0 0 0 0 0 1 0 MONATOMIC ALCOHOLS 2-ethyl-1-hexanol 1 0 0 1 1 1 0 0 0 DIVALENT ALCOHOLS 1,2-propanediol 0 0 0 0 0 0 6 6 6 PHENOLS phenol 0 0 0 0 0 0 1 1 1 ALCOHOL AND PHENOL ETHERS 2-(2-ethoxyethoxy)ethanol 0 0 0 0 0 0 1 1 1 2-(2-butoxyethoxy)ethanol 382 386 384 946 932 939 2473 2436 2454 2-butoxyethanol 1 1 1 1 1 1 2 2 2 ALDEHYDES benzaldehyde 0 0 0 0 0 0 0 0 0 n-butanal 0 0 0 0 0 0 0 1 0 nonanal 0 0 0 0 0 0 1 0 0 ESTERS AND LACTONES 2-(2-butoxyethoxy)ethylacetate 1 1 1 2 2 2 4 4 4 texanol 1 1 1 1 1 1 1 1 1 Total 385 389 387 950 937 943 2487 2451 2469 TVOC 237 242 240 546 542 544 1658 1631 1644 non-TVOC 0 0 0 0 0 0 0 0 0
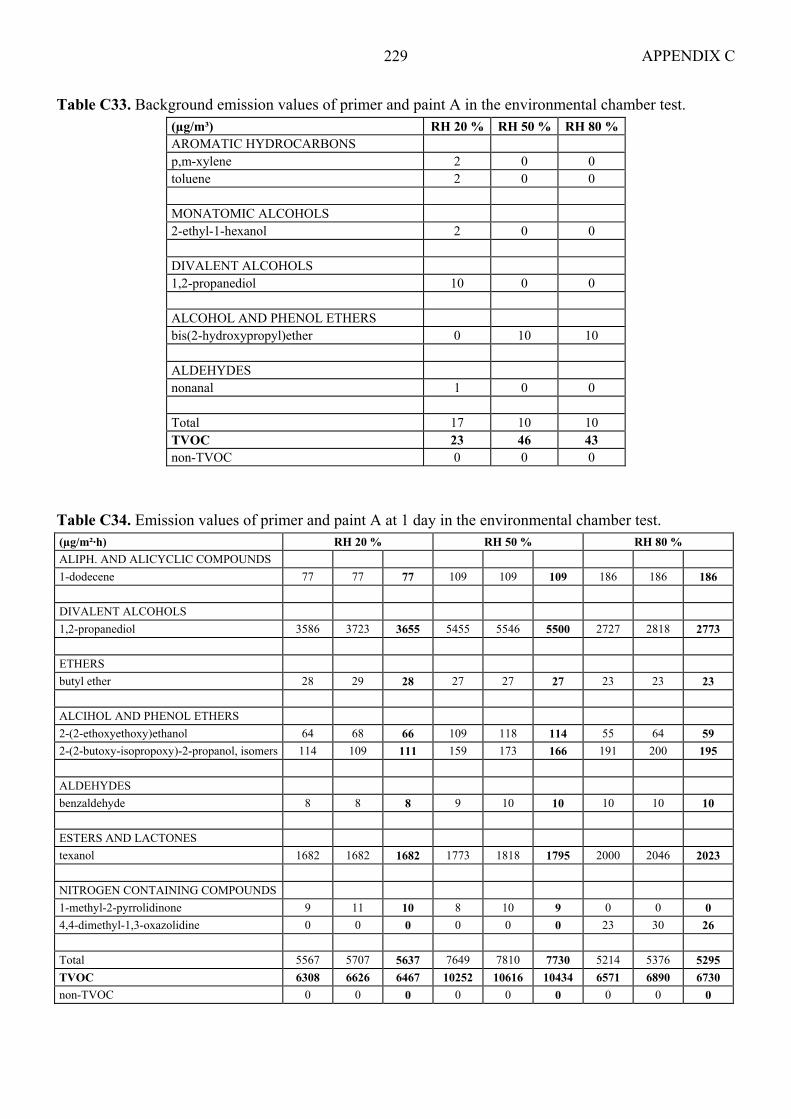
APPENDIX C 229
Table C33. Background emission values of primer and paint A in the environmental chamber test. (µg/m³) RH 20 % RH 50 % RH 80 % AROMATIC HYDROCARBONS p,m-xylene 2 0 0 toluene 2 0 0 MONATOMIC ALCOHOLS 2-ethyl-1-hexanol 2 0 0 DIVALENT ALCOHOLS 1,2-propanediol 10 0 0 ALCOHOL AND PHENOL ETHERS bis(2-hydroxypropyl)ether 0 10 10 ALDEHYDES nonanal 1 0 0 Total 17 10 10 TVOC 23 46 43 non-TVOC 0 0 0
Table C34. Emission values of primer and paint A at 1 day in the environmental chamber test. (µg/m²·h) RH 20 % RH 50 % RH 80 % ALIPH. AND ALICYCLIC COMPOUNDS 1-dodecene 77 77 77 109 109 109 186 186 186 DIVALENT ALCOHOLS 1,2-propanediol 3586 3723 3655 5455 5546 5500 2727 2818 2773 ETHERS butyl ether 28 29 28 27 27 27 23 23 23 ALCIHOL AND PHENOL ETHERS 2-(2-ethoxyethoxy)ethanol 64 68 66 109 118 114 55 64 59 2-(2-butoxy-isopropoxy)-2-propanol, isomers 114 109 111 159 173 166 191 200 195 ALDEHYDES benzaldehyde 8 8 8 9 10 10 10 10 10 ESTERS AND LACTONES texanol 1682 1682 1682 1773 1818 1795 2000 2046 2023 NITROGEN CONTAINING COMPOUNDS 1-methyl-2-pyrrolidinone 9 11 10 8 10 9 0 0 0 4,4-dimethyl-1,3-oxazolidine 0 0 0 0 0 0 23 30 26 Total 5567 5707 5637 7649 7810 7730 5214 5376 5295 TVOC 6308 6626 6467 10252 10616 10434 6571 6890 6730 non-TVOC 0 0 0 0 0 0 0 0 0
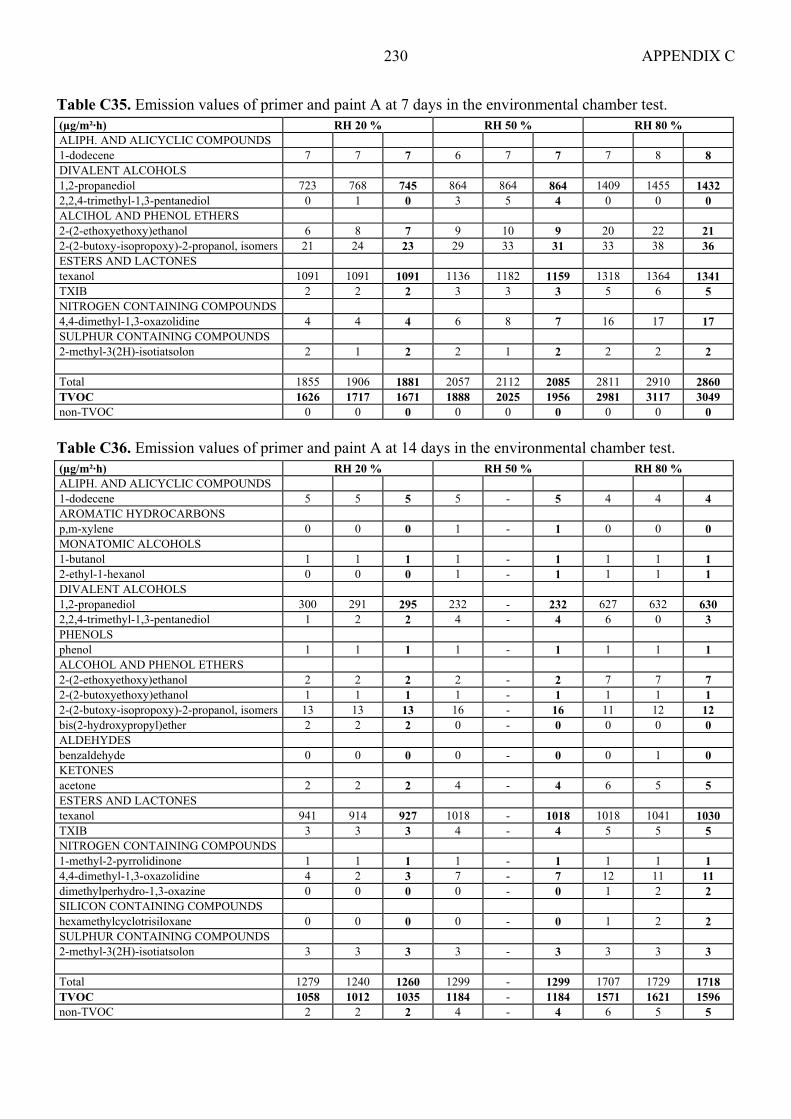
APPENDIX C 230
Table C35. Emission values of primer and paint A at 7 days in the environmental chamber test. (µg/m²·h) RH 20 % RH 50 % RH 80 % ALIPH. AND ALICYCLIC COMPOUNDS 1-dodecene 7 7 7 6 7 7 7 8 8 DIVALENT ALCOHOLS 1,2-propanediol 723 768 745 864 864 864 1409 1455 1432 2,2,4-trimethyl-1,3-pentanediol 0 1 0 3 5 4 0 0 0 ALCIHOL AND PHENOL ETHERS 2-(2-ethoxyethoxy)ethanol 6 8 7 9 10 9 20 22 21 2-(2-butoxy-isopropoxy)-2-propanol, isomers 21 24 23 29 33 31 33 38 36 ESTERS AND LACTONES texanol 1091 1091 1091 1136 1182 1159 1318 1364 1341 TXIB 2 2 2 3 3 3 5 6 5 NITROGEN CONTAINING COMPOUNDS 4,4-dimethyl-1,3-oxazolidine 4 4 4 6 8 7 16 17 17 SULPHUR CONTAINING COMPOUNDS 2-methyl-3(2H)-isotiatsolon 2 1 2 2 1 2 2 2 2 Total 1855 1906 1881 2057 2112 2085 2811 2910 2860 TVOC 1626 1717 1671 1888 2025 1956 2981 3117 3049 non-TVOC 0 0 0 0 0 0 0 0 0 Table C36. Emission values of primer and paint A at 14 days in the environmental chamber test. (µg/m²·h) RH 20 % RH 50 % RH 80 % ALIPH. AND ALICYCLIC COMPOUNDS 1-dodecene 5 5 5 5 - 5 4 4 4 AROMATIC HYDROCARBONS p,m-xylene 0 0 0 1 - 1 0 0 0 MONATOMIC ALCOHOLS 1-butanol 1 1 1 1 - 1 1 1 1 2-ethyl-1-hexanol 0 0 0 1 - 1 1 1 1 DIVALENT ALCOHOLS 1,2-propanediol 300 291 295 232 - 232 627 632 630 2,2,4-trimethyl-1,3-pentanediol 1 2 2 4 - 4 6 0 3 PHENOLS phenol 1 1 1 1 - 1 1 1 1 ALCOHOL AND PHENOL ETHERS 2-(2-ethoxyethoxy)ethanol 2 2 2 2 - 2 7 7 7 2-(2-butoxyethoxy)ethanol 1 1 1 1 - 1 1 1 1 2-(2-butoxy-isopropoxy)-2-propanol, isomers 13 13 13 16 - 16 11 12 12 bis(2-hydroxypropyl)ether 2 2 2 0 - 0 0 0 0 ALDEHYDES benzaldehyde 0 0 0 0 - 0 0 1 0 KETONES acetone 2 2 2 4 - 4 6 5 5 ESTERS AND LACTONES texanol 941 914 927 1018 - 1018 1018 1041 1030 TXIB 3 3 3 4 - 4 5 5 5 NITROGEN CONTAINING COMPOUNDS 1-methyl-2-pyrrolidinone 1 1 1 1 - 1 1 1 1 4,4-dimethyl-1,3-oxazolidine 4 2 3 7 - 7 12 11 11 dimethylperhydro-1,3-oxazine 0 0 0 0 - 0 1 2 2 SILICON CONTAINING COMPOUNDS hexamethylcyclotrisiloxane 0 0 0 0 - 0 1 2 2 SULPHUR CONTAINING COMPOUNDS 2-methyl-3(2H)-isotiatsolon 3 3 3 3 - 3 3 3 3 Total 1279 1240 1260 1299 - 1299 1707 1729 1718 TVOC 1058 1012 1035 1184 - 1184 1571 1621 1596 non-TVOC 2 2 2 4 - 4 6 5 5
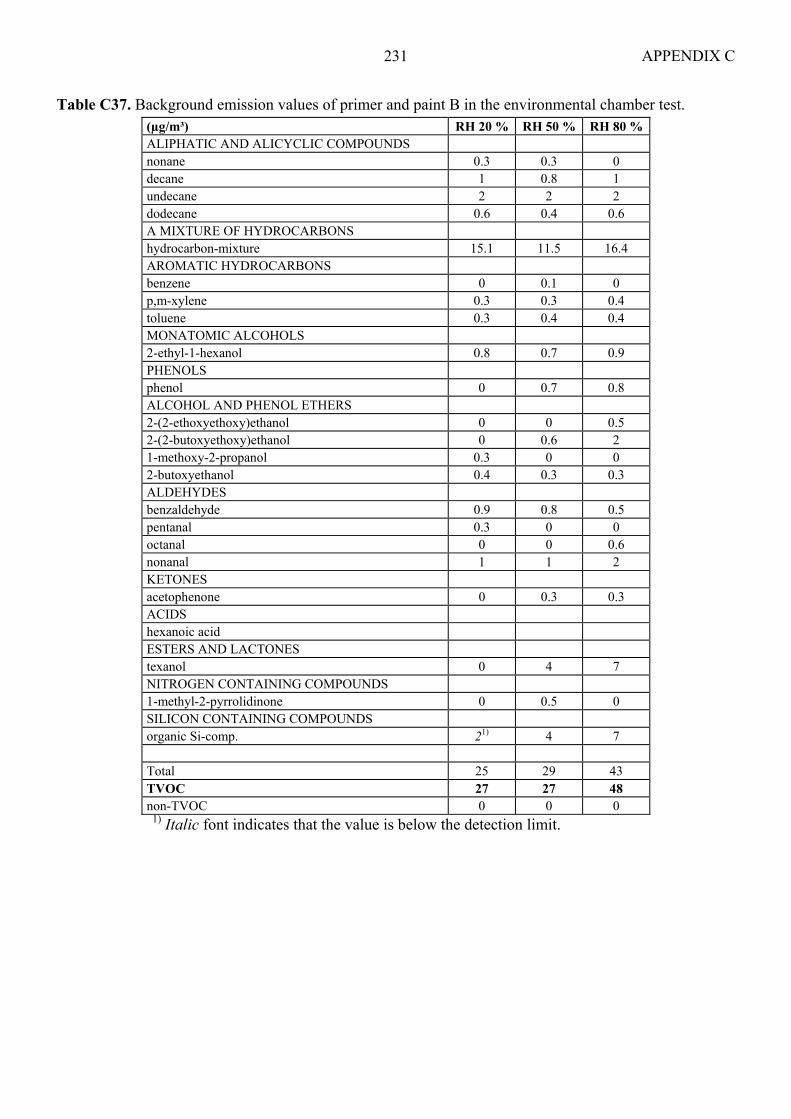
APPENDIX C 231
Table C37. Background emission values of primer and paint B in the environmental chamber test. (µg/m³) RH 20 % RH 50 % RH 80 % ALIPHATIC AND ALICYCLIC COMPOUNDS nonane 0.3 0.3 0 decane 1 0.8 1 undecane 2 2 2 dodecane 0.6 0.4 0.6 A MIXTURE OF HYDROCARBONS hydrocarbon-mixture 15.1 11.5 16.4 AROMATIC HYDROCARBONS benzene 0 0.1 0 p,m-xylene 0.3 0.3 0.4 toluene 0.3 0.4 0.4 MONATOMIC ALCOHOLS 2-ethyl-1-hexanol 0.8 0.7 0.9 PHENOLS phenol 0 0.7 0.8 ALCOHOL AND PHENOL ETHERS 2-(2-ethoxyethoxy)ethanol 0 0 0.5 2-(2-butoxyethoxy)ethanol 0 0.6 2 1-methoxy-2-propanol 0.3 0 0 2-butoxyethanol 0.4 0.3 0.3 ALDEHYDES benzaldehyde 0.9 0.8 0.5 pentanal 0.3 0 0 octanal 0 0 0.6 nonanal 1 1 2 KETONES acetophenone 0 0.3 0.3 ACIDS hexanoic acid ESTERS AND LACTONES texanol 0 4 7 NITROGEN CONTAINING COMPOUNDS 1-methyl-2-pyrrolidinone 0 0.5 0 SILICON CONTAINING COMPOUNDS organic Si-comp. 21) 4 7 Total 25 29 43 TVOC 27 27 48 non-TVOC 0 0 0
1) Italic font indicates that the value is below the detection limit.

APPENDIX C 232
Table C38. Emission values of primer and paint B at 1 day in the environmental chamber test. (µg/m²·h) RH 20 % RH 50 % RH 80 % ALIPH. AND ALICYCLIC COMPOUNDS nonane 0 0 0 0 0 0 2 1 2 decane 0 0 0 0 0 0 0.5 0.5 0.5 dodecane 0.6 0 0.3 0 0 0 0 0 0 AROMATIC HYDROCARBONS benzene 0 0 0 0 0 0 0.3 0 0.2 isopropylbenzene 0 0 0 0 0 0 1 1 1 p,m-xylene 0 0 0 0 0 0 0.7 1 1 toluene 4 6 5 6 7 6 5 7 6 MONATOMIC ALCOHOLS 2-ethyl-1-hexanol 2 1 1 2 1 1 3 1 2 DIVALENT ALCOHOLS 1,2-propanediol 150 155 152 609 623 616 105 118 111 ALCOHOL AND PHENOL ETHERS 2-(2-ethoxyethoxy)ethanol 16 13 14 77 68 73 22 18 20 2-(2-butoxyethoxy)ethanol 17 19 18 145 145 145 126 140 133 2-butoxyethanol 0 0 0 0 0 0 6 4 5 ALDEHYDES benzaldehyde 4 3 3 2 1 1 7 8 7 n-butanal 0 0 0 0 0 0 5 3 4 KETONES acetophenone 0 2 1 0.8 0 0.4 0 0 0 ESTERS AND LACTONES texanol 0 0 0 2 2 2 0 0 0 SILICON CONTAINING COMPOUNDS organic Si-comp. 0 0 0 0 0 0 26 201) 23 Total 193 198 195 843 847 845 310 322 316 TVOC 1241) 1241) 124 261 306 283 178 160 169 non-TVOC 0 0 0 0 0 0 5 3 4 1) Italic font indicates that the value is below the detection limit.

APPENDIX C 233
Table C39. Emission values of primer and paint B at 7 days in the environmental chamber test. (µg/m²·h) RH 20 % RH 50 % RH 80 % ALIPH. AND ALICYCLIC COMPOUNDS nonane 1 1 1 1 1 1 2 1 1 decane 5 6 5 7 7 7 6 6 6 undecane 6 6 6 6 6 6 6 6 6 dodecane 1 1 1 1 1 1 1 1 1 AROMATIC HYDROCARBONS p,m-xylene 0 0 0 1 1 1 0 0 0 toluene 4 5 5 5 6 6 5 5 5 MONATOMIC ALCOHOLS 2-ethyl-1-hexanol 1 1 1 1 1 1 1 1 1 DIVALENT ALCOHOLS 1,2-propanediol 59 55 57 109 91 100 109 164 136 PHENOLS phenol 0 0 0 0 0 0 1 1 1 ALCOHOL AND PHENOL ETHERS 2-(2-ethoxyethoxy)ethanol 8 8 8 16 13 15 17 19 18 2-(2-butoxyethoxy)ethanol 28 26 27 68 68 68 90 95 92 2-butoxyethanol 0 0 0 0 0 0 1 1 1 ACIDS acetic acid 0 0 0 209 123 166 0 118 59 ESTERS AND LACTONES texanol 0 0 0 1 1 1 0 0 0 SILICON CONTAINING COMPOUNDS decamethylcyclopentasiloxane 0 0 0 0 0 0 1 1 1 Total 113 108 111 426 317 371 239 419 329 TVOC 111 79 95 129 97 113 115 133 124 non-TVOC 0 0 0 209 123 166 0 118 59 Table C40. Emission values of primer and paint B at 14 days in the environmental chamber test. (µg/m²·h) RH 20 % RH 50 % RH 80 % ALIPH. AND ALICYCLIC COMPOUNDS nonane 1 2 1 0 0 0 0 0 0 decane 1 1 1 0 0 0 0 0 0 dodecane 0 0.1 0.1 0 0 0 0 0 0 MONATOMIC ALCOHOLS 2-ethyl-1-hexanol 1 2 1 0 0 0 1 1 1 DIVALENT ALCOHOLS 1,2-propanediol 27 24 25 27 28 28 32 40 36 PHENOLS phenol 2 2 2 3 2 3 2 2 2 ALCOHOL AND PHENOL ETHERS 2-(2-ethoxyethoxy)ethanol 25 4 15 4 4 4 3 3 3 2-(2-butoxyethoxy)ethanol 5 20 12 38 34 36 36 37 36 ALDEHYDES benzaldehyde 1 3 2 1 0 0 2 1 1 nonanal 2 1 2 1 2 2 1 1 1 ACIDS acetic acid 39 20 30 40 73 56 41 55 48 hexanic acid 2 0 1 2 3 3 0 0 0 ESTERS AND LACTONES texanol 2 2 2 1 1 1 0 0 0 Total 108 80 94 118 146 132 118 140 129 TVOC 21 12 17 32 20 26 13 17 15 non-TVOC 39 20 30 40 73 56 41 55 48

APPENDIX C 234
Table C41. Background emission values of primer A and paint C in the environmental chamber test. (µg/m³) RH 20 % RH 50 % RH 80 %TVOC 121) 121) 121)
1) Italic font indicates that the value is below the detection limit. Table C42. Emission values of primer A and paint C at 1 day in the environmental chamber test. (µg/m²·h) RH 20 % RH 50 % RH 80 % ALIPHATIC AND ALICYCLIC COMPOUNDS pentane 268 264 266 282 286 284 246 236 241 hexane 43 42 42 45 43 44 39 37 38 heptane 68 68 68 73 77 75 64 59 61 octane 68 68 68 73 77 75 64 59 61 nonane 29 29 29 30 31 30 17 18 17 decane 459 455 457 477 477 477 441 414 427 undecane 2077 2005 2041 1936 1868 1902 1982 1886 1934 dodecane 800 796 798 764 759 761 796 768 782 tridecane 105 105 105 105 105 105 118 109 114 tetradecane 11 10 10 10 11 10 15 13 14 pentadecane 3 3 3 3 3 3 5 5 5 hexadecane 0 0 0 0 0 0 0 2 1 A MIXTURE OF HYDROCARBONS hydrocarbon-mixture 8196 8005 8100 8673 7768 8673 9027 8005 8516 AROMATIC HYDROCARBONS benzene 2 2 2 0 0 0 0 2 1 p,m-xylene 7 7 7 7 8 7 4 3 3 1,2,3-trimethylbenzene 12 12 12 12 12 12 12 12 12 1,2,4-trimethylbenzene 28 28 28 29 28 29 26 25 25 1,3,5-trimethylbenzene 6 6 6 6 6 6 5 5 5 MONATOMIC ALCOHOLS 2-propanol 0 0 0 0 2 1 0 0 0 1-butanol 16 15 15 19 18 19 21 21 21 DIVALENT ALCOHOLS 1,2-propanediol 7227 7455 7341 7591 7636 7614 7500 6909 7205 PHENOLS phenol 4 4 4 5 4 4 6 5 5 ALCOHOL AND PHENOL ETHERS 1-methoxy-2-propanol 0 0 0 0 0 0 0 3 2 ALDEHYDES benzaldehyde 7 11 9 8 8 8 11 14 12 n-butanal 40 43 42 50 50 50 64 68 66 pentanal 364 373 368 414 446 430 555 568 561 hexanal 1727 1741 1734 1909 2059 1984 2482 2532 2507 heptanal 64 68 66 77 82 80 105 105 105 2-heptenal 91 91 91 105 109 107 123 118 120 octanal 38 41 39 50 50 50 64 64 64 2-octenal 177 200 189 214 218 216 236 227 232 KETONES 2-butanone (MEK) 86 82 84 96 96 96 100 96 98 acetone 141 118 130 168 155 161 205 214 209 ACIDS acetic acid 200 227 214 418 246 332 232 214 223 propanoic acid 24 46 35 82 41 61 43 26 35 butanoic acid 30 31 31 41 37 39 36 27 32 pentanoic acid 123 127 125 182 155 168 182 127 155 hexanoic acid 759 796 777 1118 941 1030 1105 718 911 ESTERS AND LACTONES texanol 2496 2523 2509 2600 2600 2600 2618 2486 2552 TXIB 7 7 7 7 8 8 7 6 7 NITROGEN CONTAINING COMPOUNDS 2-butanone oxime 59 68 64 59 68 64 44 50 47 SILICON CONTAINING COMPOUNDS decamethylcyclopentasiloxane 0 0 0 2 0 1 3 2 2 Total 25859 25966 25913 27736 26586 27161 28595 26256 27425 TVOC 19682 19000 19341 20222 20404 20313 21449 20222 20835 non-TVOC 536 507 521 596 589 592 614 614 614
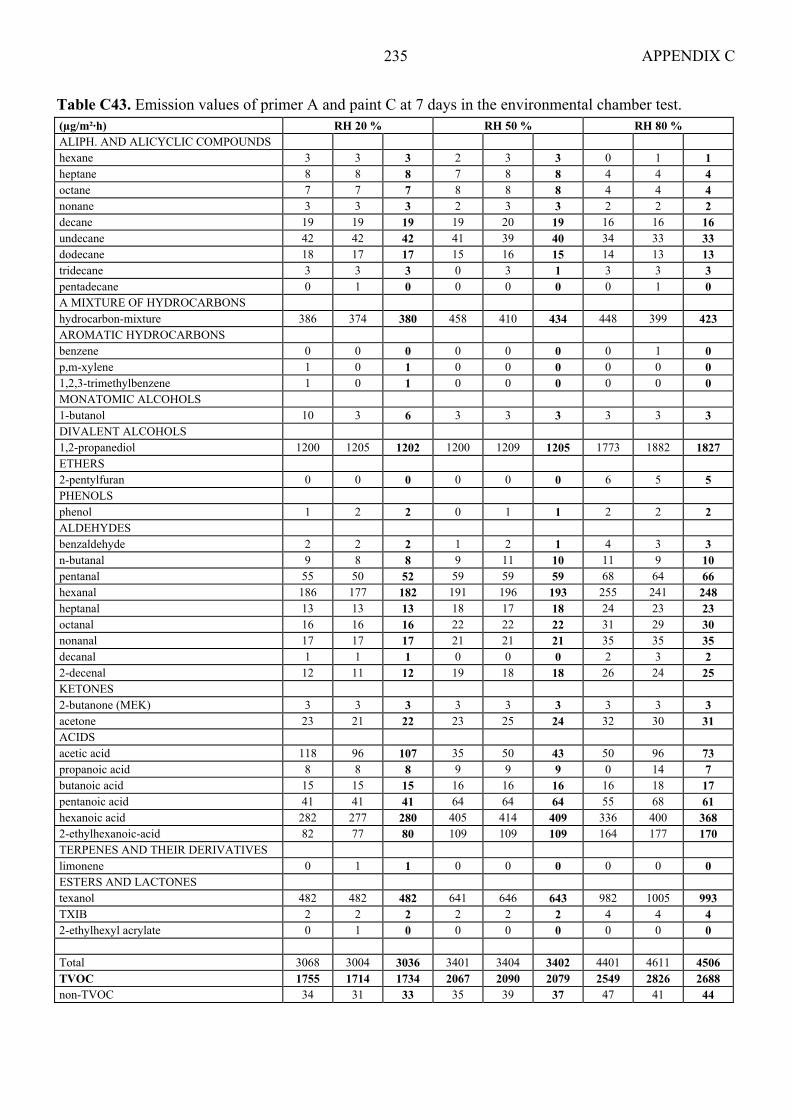
APPENDIX C 235
Table C43. Emission values of primer A and paint C at 7 days in the environmental chamber test. (µg/m²·h) RH 20 % RH 50 % RH 80 % ALIPH. AND ALICYCLIC COMPOUNDS hexane 3 3 3 2 3 3 0 1 1 heptane 8 8 8 7 8 8 4 4 4 octane 7 7 7 8 8 8 4 4 4 nonane 3 3 3 2 3 3 2 2 2 decane 19 19 19 19 20 19 16 16 16 undecane 42 42 42 41 39 40 34 33 33 dodecane 18 17 17 15 16 15 14 13 13 tridecane 3 3 3 0 3 1 3 3 3 pentadecane 0 1 0 0 0 0 0 1 0 A MIXTURE OF HYDROCARBONS hydrocarbon-mixture 386 374 380 458 410 434 448 399 423 AROMATIC HYDROCARBONS benzene 0 0 0 0 0 0 0 1 0 p,m-xylene 1 0 1 0 0 0 0 0 0 1,2,3-trimethylbenzene 1 0 1 0 0 0 0 0 0 MONATOMIC ALCOHOLS 1-butanol 10 3 6 3 3 3 3 3 3 DIVALENT ALCOHOLS 1,2-propanediol 1200 1205 1202 1200 1209 1205 1773 1882 1827 ETHERS 2-pentylfuran 0 0 0 0 0 0 6 5 5 PHENOLS phenol 1 2 2 0 1 1 2 2 2 ALDEHYDES benzaldehyde 2 2 2 1 2 1 4 3 3 n-butanal 9 8 8 9 11 10 11 9 10 pentanal 55 50 52 59 59 59 68 64 66 hexanal 186 177 182 191 196 193 255 241 248 heptanal 13 13 13 18 17 18 24 23 23 octanal 16 16 16 22 22 22 31 29 30 nonanal 17 17 17 21 21 21 35 35 35 decanal 1 1 1 0 0 0 2 3 2 2-decenal 12 11 12 19 18 18 26 24 25 KETONES 2-butanone (MEK) 3 3 3 3 3 3 3 3 3 acetone 23 21 22 23 25 24 32 30 31 ACIDS acetic acid 118 96 107 35 50 43 50 96 73 propanoic acid 8 8 8 9 9 9 0 14 7 butanoic acid 15 15 15 16 16 16 16 18 17 pentanoic acid 41 41 41 64 64 64 55 68 61 hexanoic acid 282 277 280 405 414 409 336 400 368 2-ethylhexanoic-acid 82 77 80 109 109 109 164 177 170 TERPENES AND THEIR DERIVATIVES limonene 0 1 1 0 0 0 0 0 0 ESTERS AND LACTONES texanol 482 482 482 641 646 643 982 1005 993 TXIB 2 2 2 2 2 2 4 4 4 2-ethylhexyl acrylate 0 1 0 0 0 0 0 0 0 Total 3068 3004 3036 3401 3404 3402 4401 4611 4506 TVOC 1755 1714 1734 2067 2090 2079 2549 2826 2688 non-TVOC 34 31 33 35 39 37 47 41 44
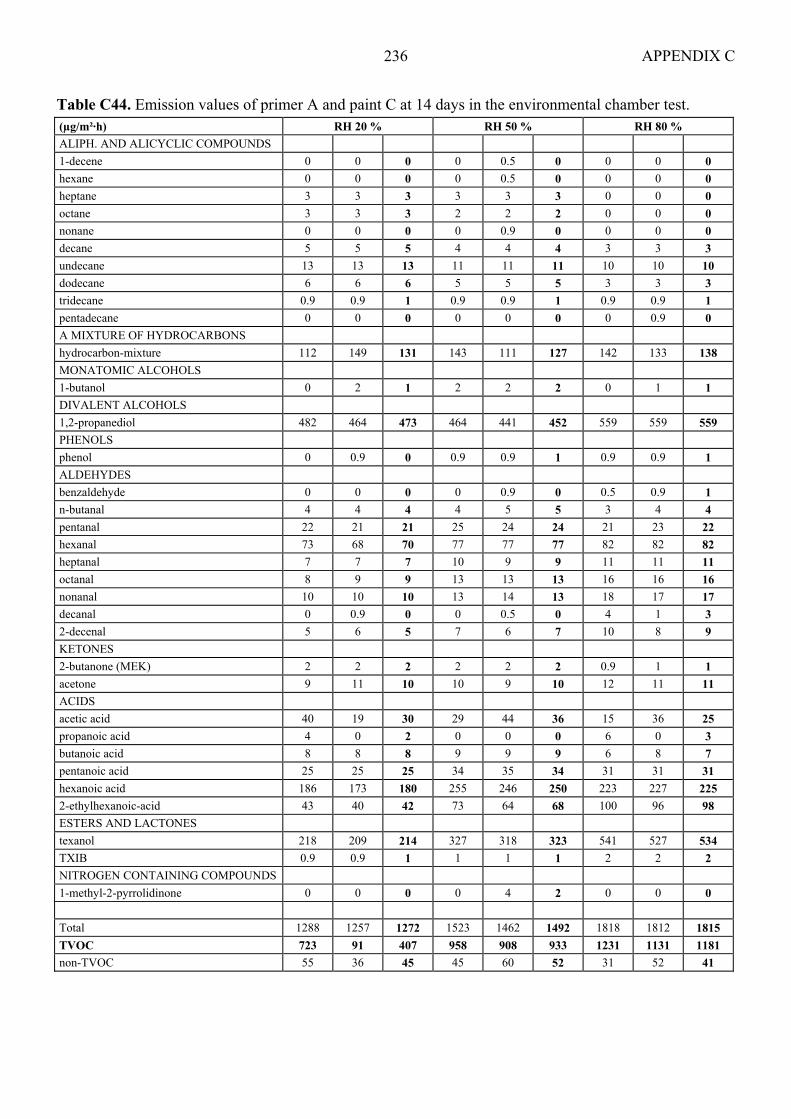
APPENDIX C 236
Table C44. Emission values of primer A and paint C at 14 days in the environmental chamber test. (µg/m²·h) RH 20 % RH 50 % RH 80 % ALIPH. AND ALICYCLIC COMPOUNDS 1-decene 0 0 0 0 0.5 0 0 0 0 hexane 0 0 0 0 0.5 0 0 0 0 heptane 3 3 3 3 3 3 0 0 0 octane 3 3 3 2 2 2 0 0 0 nonane 0 0 0 0 0.9 0 0 0 0 decane 5 5 5 4 4 4 3 3 3 undecane 13 13 13 11 11 11 10 10 10 dodecane 6 6 6 5 5 5 3 3 3 tridecane 0.9 0.9 1 0.9 0.9 1 0.9 0.9 1 pentadecane 0 0 0 0 0 0 0 0.9 0 A MIXTURE OF HYDROCARBONS hydrocarbon-mixture 112 149 131 143 111 127 142 133 138 MONATOMIC ALCOHOLS 1-butanol 0 2 1 2 2 2 0 1 1 DIVALENT ALCOHOLS 1,2-propanediol 482 464 473 464 441 452 559 559 559 PHENOLS phenol 0 0.9 0 0.9 0.9 1 0.9 0.9 1 ALDEHYDES benzaldehyde 0 0 0 0 0.9 0 0.5 0.9 1 n-butanal 4 4 4 4 5 5 3 4 4 pentanal 22 21 21 25 24 24 21 23 22 hexanal 73 68 70 77 77 77 82 82 82 heptanal 7 7 7 10 9 9 11 11 11 octanal 8 9 9 13 13 13 16 16 16 nonanal 10 10 10 13 14 13 18 17 17 decanal 0 0.9 0 0 0.5 0 4 1 3 2-decenal 5 6 5 7 6 7 10 8 9 KETONES 2-butanone (MEK) 2 2 2 2 2 2 0.9 1 1 acetone 9 11 10 10 9 10 12 11 11 ACIDS acetic acid 40 19 30 29 44 36 15 36 25 propanoic acid 4 0 2 0 0 0 6 0 3 butanoic acid 8 8 8 9 9 9 6 8 7 pentanoic acid 25 25 25 34 35 34 31 31 31 hexanoic acid 186 173 180 255 246 250 223 227 225 2-ethylhexanoic-acid 43 40 42 73 64 68 100 96 98 ESTERS AND LACTONES texanol 218 209 214 327 318 323 541 527 534 TXIB 0.9 0.9 1 1 1 1 2 2 2 NITROGEN CONTAINING COMPOUNDS 1-methyl-2-pyrrolidinone 0 0 0 0 4 2 0 0 0 Total 1288 1257 1272 1523 1462 1492 1818 1812 1815 TVOC 723 91 407 958 908 933 1231 1131 1181 non-TVOC 55 36 45 45 60 52 31 52 41
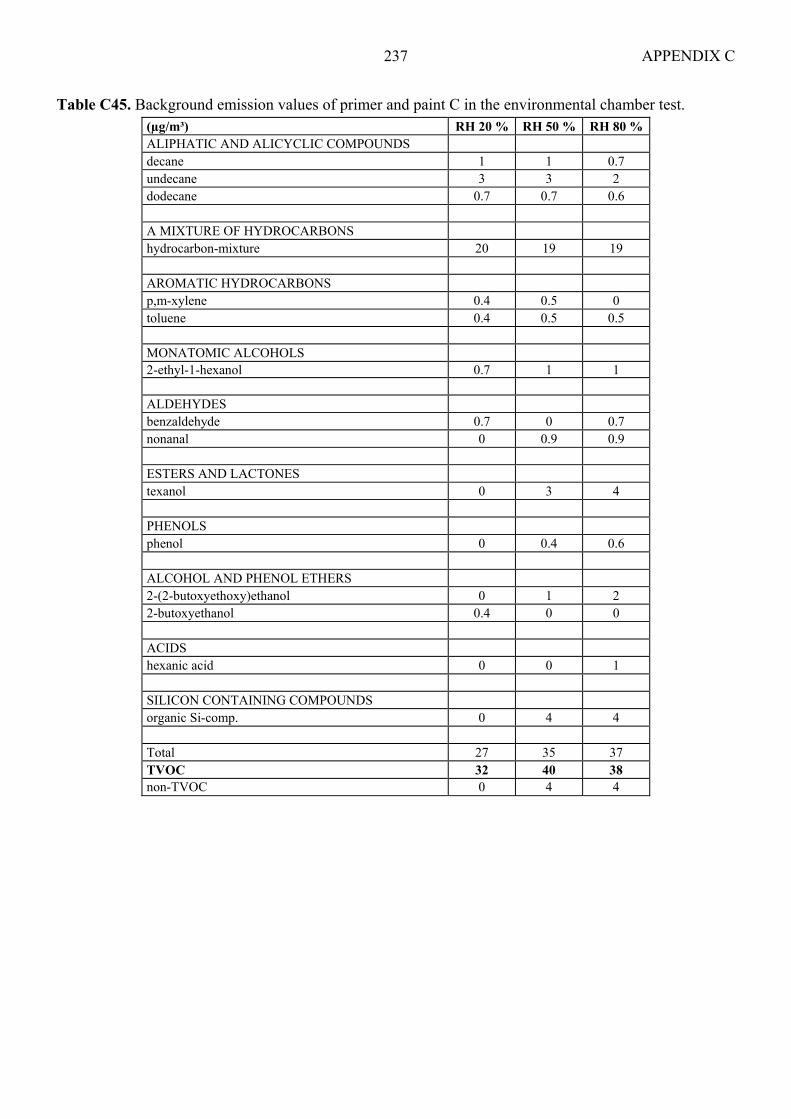
APPENDIX C 237
Table C45. Background emission values of primer and paint C in the environmental chamber test. (µg/m³) RH 20 % RH 50 % RH 80 % ALIPHATIC AND ALICYCLIC COMPOUNDS decane 1 1 0.7 undecane 3 3 2 dodecane 0.7 0.7 0.6 A MIXTURE OF HYDROCARBONS hydrocarbon-mixture 20 19 19 AROMATIC HYDROCARBONS p,m-xylene 0.4 0.5 0 toluene 0.4 0.5 0.5 MONATOMIC ALCOHOLS 2-ethyl-1-hexanol 0.7 1 1 ALDEHYDES benzaldehyde 0.7 0 0.7 nonanal 0 0.9 0.9 ESTERS AND LACTONES texanol 0 3 4 PHENOLS phenol 0 0.4 0.6 ALCOHOL AND PHENOL ETHERS 2-(2-butoxyethoxy)ethanol 0 1 2 2-butoxyethanol 0.4 0 0 ACIDS hexanic acid 0 0 1 SILICON CONTAINING COMPOUNDS organic Si-comp. 0 4 4 Total 27 35 37 TVOC 32 40 38 non-TVOC 0 4 4

APPENDIX C 238
Table C46. Emission values of primer and paint C at 1 day in the environmental chamber test. (µg/m²·h) RH 20 % RH 50 % RH 80 % ALIPH. AND ALICYCLIC COMPOUNDS pentane 273 264 268 291 282 286 273 277 275 hexane 42 42 42 45 46 45 46 44 45 heptane 77 77 77 86 86 86 91 91 91 octane 73 73 73 82 82 82 91 86 89 decane 813 777 795 850 818 834 863 836 850 undecane 2008 1926 1967 2121 2062 2092 2386 2317 2351 dodecane 477 463 470 518 504 511 627 609 618 tridecane 68 68 68 73 73 73 91 91 91 A MIXTURE OF HYDROCARBONS hydrocarbon-mixture 7714 7255 7484 8382 8351 8382 10114 10455 10285 MONATOMIC ALCOHOLS 1-pentanol 96 91 93 114 114 114 168 159 164 ALDEHYDES n-butanal 41 41 41 45 45 45 59 59 59 pentanal 286 286 286 305 314 309 427 418 423 hexanal 1305 1296 1300 1568 1632 1600 2414 2400 2407 heptanal 55 55 55 59 64 61 86 86 86 2-octenal 164 173 168 209 177 193 427 250 339 KETONES 2-butanone (MEK) 42 43 43 46 46 46 59 59 59 ACIDS acetic acid 291 223 257 305 200 252 332 382 357 propanoic acid 259 282 270 396 364 380 546 491 518 butanoic acid 37 36 36 43 38 41 40 44 42 pentanoic acid 168 159 164 196 173 184 168 155 161 hexanoic acid 1009 964 986 1105 1000 1052 818 750 784 2-ethylhexanoic-acid 996 1000 998 1055 986 1020 827 796 811 Total 16293 15591 15942 17891 17454 17672 20952 20854 20903 TVOC 13986 13486 13736 15573 15255 15414 18665 18210 18437 non-TVOC 647 571 609 684 571 627 721 776 748
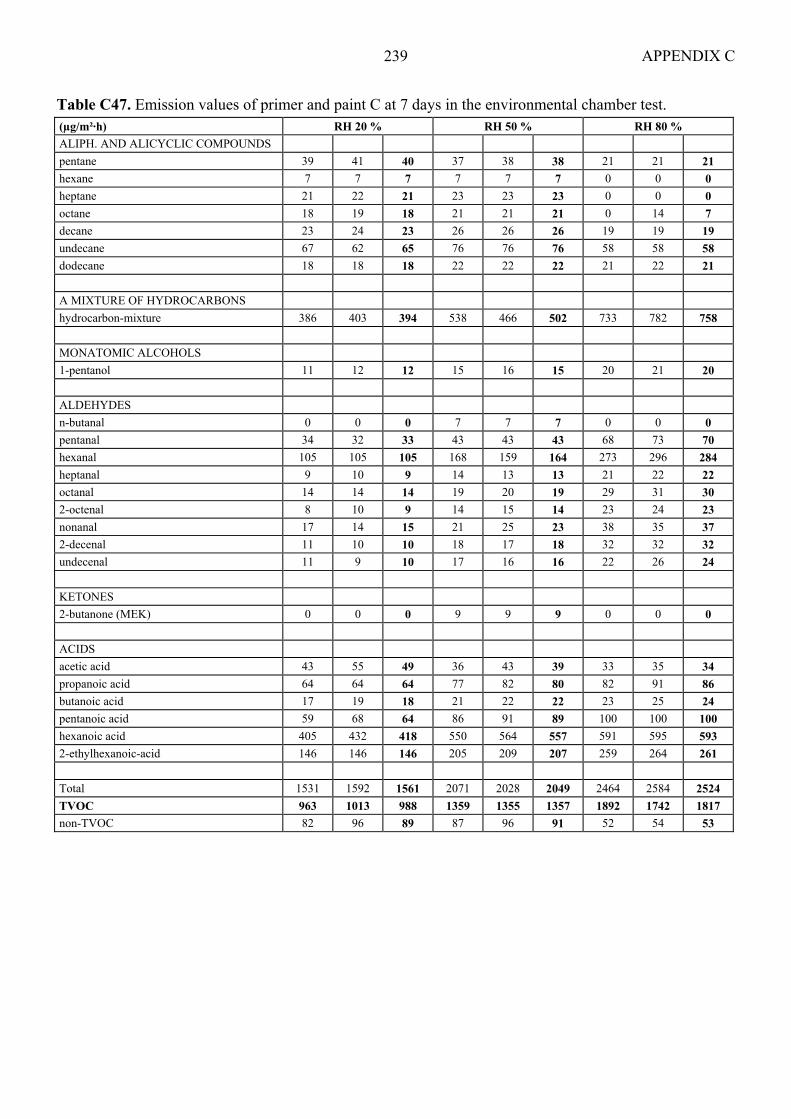
APPENDIX C 239
Table C47. Emission values of primer and paint C at 7 days in the environmental chamber test. (µg/m²·h) RH 20 % RH 50 % RH 80 % ALIPH. AND ALICYCLIC COMPOUNDS pentane 39 41 40 37 38 38 21 21 21 hexane 7 7 7 7 7 7 0 0 0 heptane 21 22 21 23 23 23 0 0 0 octane 18 19 18 21 21 21 0 14 7 decane 23 24 23 26 26 26 19 19 19 undecane 67 62 65 76 76 76 58 58 58 dodecane 18 18 18 22 22 22 21 22 21 A MIXTURE OF HYDROCARBONS hydrocarbon-mixture 386 403 394 538 466 502 733 782 758 MONATOMIC ALCOHOLS 1-pentanol 11 12 12 15 16 15 20 21 20 ALDEHYDES n-butanal 0 0 0 7 7 7 0 0 0 pentanal 34 32 33 43 43 43 68 73 70 hexanal 105 105 105 168 159 164 273 296 284 heptanal 9 10 9 14 13 13 21 22 22 octanal 14 14 14 19 20 19 29 31 30 2-octenal 8 10 9 14 15 14 23 24 23 nonanal 17 14 15 21 25 23 38 35 37 2-decenal 11 10 10 18 17 18 32 32 32 undecenal 11 9 10 17 16 16 22 26 24 KETONES 2-butanone (MEK) 0 0 0 9 9 9 0 0 0 ACIDS acetic acid 43 55 49 36 43 39 33 35 34 propanoic acid 64 64 64 77 82 80 82 91 86 butanoic acid 17 19 18 21 22 22 23 25 24 pentanoic acid 59 68 64 86 91 89 100 100 100 hexanoic acid 405 432 418 550 564 557 591 595 593 2-ethylhexanoic-acid 146 146 146 205 209 207 259 264 261 Total 1531 1592 1561 2071 2028 2049 2464 2584 2524 TVOC 963 1013 988 1359 1355 1357 1892 1742 1817 non-TVOC 82 96 89 87 96 91 52 54 53
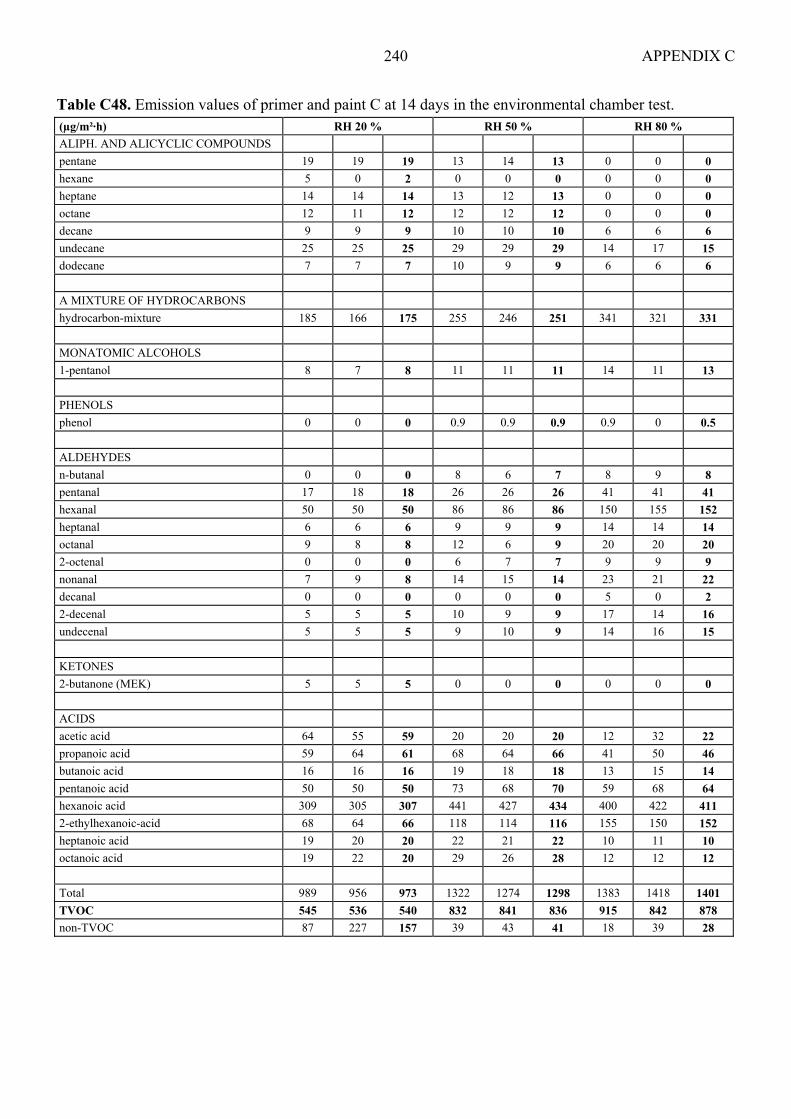
APPENDIX C 240
Table C48. Emission values of primer and paint C at 14 days in the environmental chamber test. (µg/m²·h) RH 20 % RH 50 % RH 80 % ALIPH. AND ALICYCLIC COMPOUNDS pentane 19 19 19 13 14 13 0 0 0 hexane 5 0 2 0 0 0 0 0 0 heptane 14 14 14 13 12 13 0 0 0 octane 12 11 12 12 12 12 0 0 0 decane 9 9 9 10 10 10 6 6 6 undecane 25 25 25 29 29 29 14 17 15 dodecane 7 7 7 10 9 9 6 6 6 A MIXTURE OF HYDROCARBONS hydrocarbon-mixture 185 166 175 255 246 251 341 321 331 MONATOMIC ALCOHOLS 1-pentanol 8 7 8 11 11 11 14 11 13 PHENOLS phenol 0 0 0 0.9 0.9 0.9 0.9 0 0.5 ALDEHYDES n-butanal 0 0 0 8 6 7 8 9 8 pentanal 17 18 18 26 26 26 41 41 41 hexanal 50 50 50 86 86 86 150 155 152 heptanal 6 6 6 9 9 9 14 14 14 octanal 9 8 8 12 6 9 20 20 20 2-octenal 0 0 0 6 7 7 9 9 9 nonanal 7 9 8 14 15 14 23 21 22 decanal 0 0 0 0 0 0 5 0 2 2-decenal 5 5 5 10 9 9 17 14 16 undecenal 5 5 5 9 10 9 14 16 15 KETONES 2-butanone (MEK) 5 5 5 0 0 0 0 0 0 ACIDS acetic acid 64 55 59 20 20 20 12 32 22 propanoic acid 59 64 61 68 64 66 41 50 46 butanoic acid 16 16 16 19 18 18 13 15 14 pentanoic acid 50 50 50 73 68 70 59 68 64 hexanoic acid 309 305 307 441 427 434 400 422 411 2-ethylhexanoic-acid 68 64 66 118 114 116 155 150 152 heptanoic acid 19 20 20 22 21 22 10 11 10 octanoic acid 19 22 20 29 26 28 12 12 12 Total 989 956 973 1322 1274 1298 1383 1418 1401 TVOC 545 536 540 832 841 836 915 842 878 non-TVOC 87 227 157 39 43 41 18 39 28

APPENDIX C 241
Table C49. Background emission values of filler and plaster A in the environmental chamber test. (µg/m³) RH 20 % RH 50 % RH 80 % ALIPHATIC AND ALICYCLIC COMPOUNDS nonane 0 0.4 0.6 decane 2 5 4 undecane 3 0.3 7 dodecane 0.8 2 2 tridecane 0 0.3 0 hexadecane 0 0 0.2 A MIXTURE OF HYDROCARBONS hydrocarbon-mixture 18 56 41 AROMATIC HYDROCARBONS benzene ethylbenzene 0 0.2 0.2 p,m-xylene 0.6 0.7 0.7 o-xylene 0.2 0.2 0.2 styrene 0 0 0.2 toluene 0.8 0.8 0.8 MONATOMIC ALCOHOLS 2-ethyl-1-hexanol 0 1 1 PHENOLS phenol 0 0 0.6 ALCOHOL AND PHENOL ETHERS 2-(2-butoxyethoxy)ethanol 0.4 1 0 2-butoxyethanol 0 0.3 0 ALDEHYDES benzaldehyde 0.6 0.5 0.8 pentanal 0.2 0 0.9 nonanal 0.7 1 2 decanal 1 1 2 KETONES acetophenone 0 0 0.4 ESTERS AND LACTONES texanol 0 0 1 NITROGEN CONTAINING COMPOUNDS 1-methyl-2-pyrrolidinone 0 0.7 0.6 SILICON CONTAINING COMPOUNDS organic Si-comp. 2 0 1 Total 30 71 67 TVOC 19 65 54 non-TVOC 0 0 0

APPENDIX C 242
Table C50. Emission values of filler and plaster A at 1 day in the environmental chamber test. (µg/m²·h) RH 20 % RH 50 % RH 80 % ALIPH. AND ALICYCLIC COMPOUNDS decane 0 0 0 0 0 0 0 0 0 undecane 0 0 0 4 3 3 0 0 0 dodecane 0 0 0 0 0 0 0 0 0 AROMATIC HYDROCARBONS toluene 0 0 0 1 0.5 1 1 0 1 MONATOMIC ALCOHOLS ethanol 0 0 0 6 0 3 0 7 3 2-propanol 4 4 4 3 4 3 5 5 5 2-ethyl-1-hexanol 3 6 4 2 2 2 3 3 3 2-methyl-2-propanol 16 16 16 12 15 14 23 25 24 ALCOHOL AND PHENOL ETHERS 2-(2-butoxyethoxy)ethanol 4 2 3 27 3 15 82 14 48 1-methoxy-2-propanol 17 18 18 11 17 14 17 16 17 ALDEHYDES benzaldehyde 3 3 3 3 3 3 3 4 4 pentanal 0 0 0 0 0 0 2 0 1 hexanal 9 8 8 9 10 9 11 8 10 heptanal 5 5 5 5 6 5 6 0 3 octanal 6 5 5 5 6 6 6 6 6 nonanal 8 7 8 6 10 8 10 7 8 decanal 5 3 4 2 8 5 7 4 6 KETONES acetophenone 2 2 2 2 1 2 2 3 2 acetone 7 6 7 9 6 8 7 6 7 cyclohexanone 0 0 0 4 0 2 6 0 3 ACIDS acetic acid 0 0 0 0 0 0 25 0 12 ESTERS AND LACTONES 1-methoxy-2-propylacetate 0 0 0 0.9 0 0 0 0 0 SILICON CONTAINING COMPOUNDS organic Si-comp. 0 11 5 0 10 5 0 13 6 Total 90 95 93 112 104 108 216 120 168 TVOC 51 41 46 39 39 39 76 62 69 non-TVOC 27 26 26 30 25 28 60 42 51
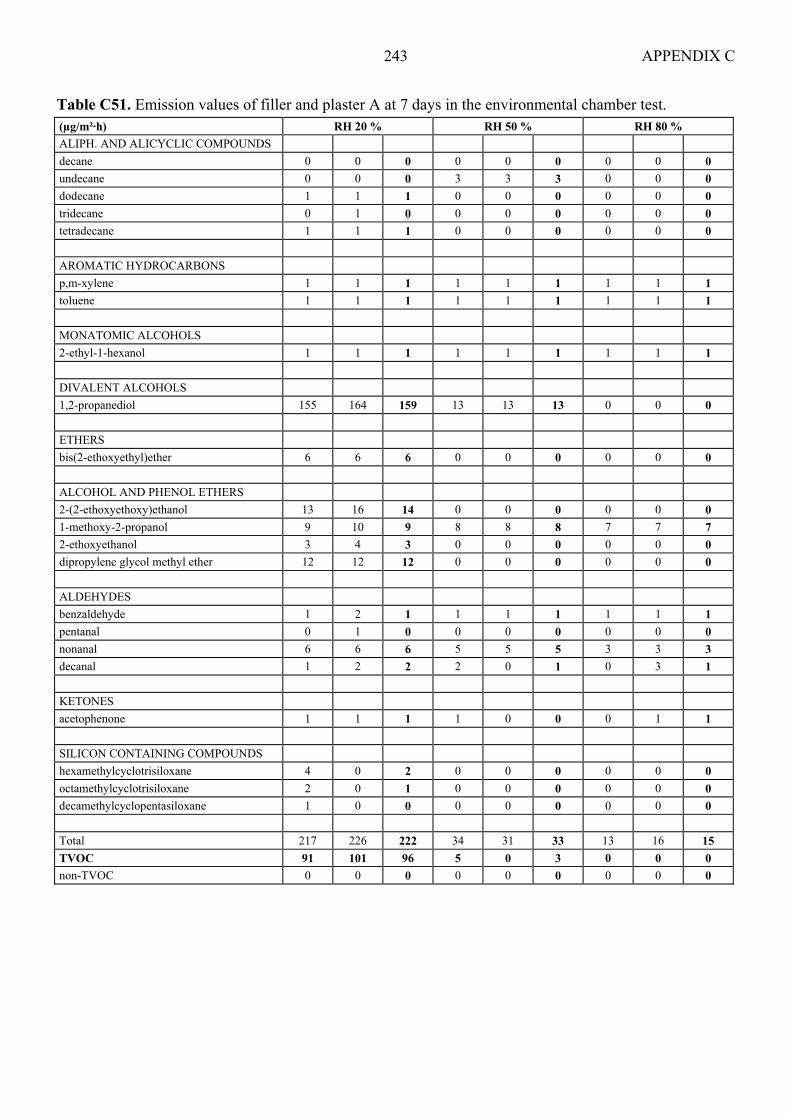
APPENDIX C 243
Table C51. Emission values of filler and plaster A at 7 days in the environmental chamber test. (µg/m²·h) RH 20 % RH 50 % RH 80 % ALIPH. AND ALICYCLIC COMPOUNDS decane 0 0 0 0 0 0 0 0 0 undecane 0 0 0 3 3 3 0 0 0 dodecane 1 1 1 0 0 0 0 0 0 tridecane 0 1 0 0 0 0 0 0 0 tetradecane 1 1 1 0 0 0 0 0 0 AROMATIC HYDROCARBONS p,m-xylene 1 1 1 1 1 1 1 1 1 toluene 1 1 1 1 1 1 1 1 1 MONATOMIC ALCOHOLS 2-ethyl-1-hexanol 1 1 1 1 1 1 1 1 1 DIVALENT ALCOHOLS 1,2-propanediol 155 164 159 13 13 13 0 0 0 ETHERS bis(2-ethoxyethyl)ether 6 6 6 0 0 0 0 0 0 ALCOHOL AND PHENOL ETHERS 2-(2-ethoxyethoxy)ethanol 13 16 14 0 0 0 0 0 0 1-methoxy-2-propanol 9 10 9 8 8 8 7 7 7 2-ethoxyethanol 3 4 3 0 0 0 0 0 0 dipropylene glycol methyl ether 12 12 12 0 0 0 0 0 0 ALDEHYDES benzaldehyde 1 2 1 1 1 1 1 1 1 pentanal 0 1 0 0 0 0 0 0 0 nonanal 6 6 6 5 5 5 3 3 3 decanal 1 2 2 2 0 1 0 3 1 KETONES acetophenone 1 1 1 1 0 0 0 1 1 SILICON CONTAINING COMPOUNDS hexamethylcyclotrisiloxane 4 0 2 0 0 0 0 0 0 octamethylcyclotrisiloxane 2 0 1 0 0 0 0 0 0 decamethylcyclopentasiloxane 1 0 0 0 0 0 0 0 0 Total 217 226 222 34 31 33 13 16 15 TVOC 91 101 96 5 0 3 0 0 0 non-TVOC 0 0 0 0 0 0 0 0 0

APPENDIX C 244
Table C52. Emission values of filler and plaster A at 14 days in the environmental chamber test. (µg/m²·h) RH 20 % RH 50 % RH 80 % ALIPH. AND ALICYCLIC COMPOUNDS decane 0 0 0 0 0 0 0 0 0 undecane 0 0 0 2 2 2 0 0 0 dodecane 0 0 0 0 0 0 0 0 0 AROMATIC HYDROCARBONS p,m-xylene 0.6 0.6 1 0 0 0 0.6 0.6 1 o-xylene 0 0 0 0 0 0 0.2 0.2 0 toluene 0 0 0 0 0 0 0.5 0.5 1 1,2,4-trimethylbenzene 0 0 0 0 0 0 0.4 0.4 0 MONATOMIC ALCOHOLS 2-ethyl-1-hexanol 0 0 0 0 0 0 0 0 0 DIVALENT ALCOHOLS 1,2-propanediol 296 300 298 582 600 591 10 13 11 ETHERS bis(2-ethoxyethyl)ether 0 0 0 3 3 3 0.9 0.9 1 ALCOHOL AND PHENOL ETHERS 2-(2-ethoxyethoxy)ethanol 11 10 10 55 55 55 0.9 1 1 1-methoxy-2-propanol 0 0 0 0 0 0 2 2 2 dipropylene glycol methyl ether 2 3 3 23 24 24 2 0 1 ALDEHYDES benzaldehyde 0 0 0 0 0 0 0.1 0.5 0 pentanal 0 0 0 0 0 0 0 0 0 hexanal 1 2 2 0 0 0 0.9 1 1 heptanal 0.9 0.9 1 0 0 0 0 0 0 octanal 0.9 0.9 1 0 0 0 0.9 0.9 1 nonanal 2 2 2 2 2 2 0.9 1 1 decanal 0.9 0.5 1 0 0 0 0 0 0 KETONES acetophenone 0 0 0 0 0 0 0.2 0 0 acetone 1 1 1 3 4 3 1 0 1 ACIDS acetic acid 9 11 10 9 7 8 6 5 5 OTHERS unidentified 0 0 0 9 10 9 0 0 0 Total 325 331 328 688 706 697 28 29 28 TVOC 82 82 82 266 284 275 4 6 5 non-TVOC 10 12 11 12 11 12 7 5 6

APPENDIX C 245
Table C53. Background emission values of filler and plaster B in the environmental chamber test. (µg/m³) RH 20 % RH 50 % RH 80 % ALIPHATIC AND ALICYCLIC COMPOUNDS nonane 0 0.5 0.6 decane 0.6 0.5 0.6 undecane 1 0.7 1 dodecane 0.4 0.3 0.4 AROMATIC HYDROCARBONS benzene 0 0.2 0.2 ethylbenzene 0.4 0.4 0.4 propylbenzene 0.1 0.2 0 p,m-xylene 1 2 2 o-xylene 0.5 0.6 0.5 styrene 0.2 0.3 0.3 toluene 1 1 1 1,2,3-trimethylbenzene 0 0.2 0 1,2,4-trimethylbenzene 0.7 0.8 0.8 1,3,5-trimethylbenzene 0.1 0.2 0.2 1-ethyl-2-methylbenzene 0.1 0.2 0 MONATOMIC ALCOHOLS 1-butanol 0 0 1 2-ethyl-1-hexanol 0.4 5 0.7 PHENOLS phenol 0 0.3 1 ALCOHOL AND PHENOL ETHERS 2-(2-ethoxyethoxy)ethanol 0 0 0.7 2-(2-butoxyethoxy)ethanol 0 0 94 1-methoxy-2-propanol 0 0.1 0 2-butoxyethanol 0 0.6 0.7 ALDEHYDES benzaldehyde 0.8 1 0.9 pentanal 0 0 0.3 nonanal 1 0.8 1 KETONES acetophenone 0 0.5 0.4 ACIDS acetic acid 0 4 2 TERPENES AND THEIR DERIVATIVES limonene 0.8 1 0.8 ESTERS AND LACTONES 2-(2-butoxyethoxy)ethylacetate 0 0 0.4 texanol 0 0 2 Total 9 21 114 TVOC 11 19 87 non-TVOC 0 4 2
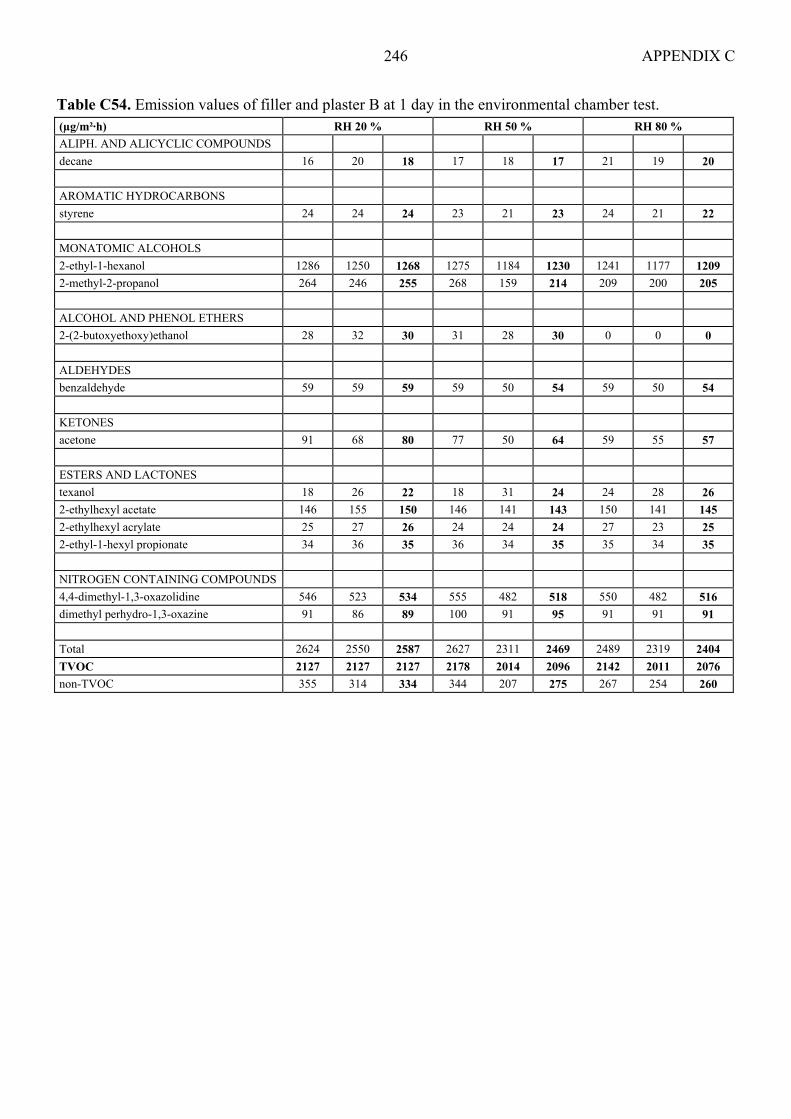
APPENDIX C 246
Table C54. Emission values of filler and plaster B at 1 day in the environmental chamber test. (µg/m²·h) RH 20 % RH 50 % RH 80 % ALIPH. AND ALICYCLIC COMPOUNDS decane 16 20 18 17 18 17 21 19 20 AROMATIC HYDROCARBONS styrene 24 24 24 23 21 23 24 21 22 MONATOMIC ALCOHOLS 2-ethyl-1-hexanol 1286 1250 1268 1275 1184 1230 1241 1177 1209 2-methyl-2-propanol 264 246 255 268 159 214 209 200 205 ALCOHOL AND PHENOL ETHERS 2-(2-butoxyethoxy)ethanol 28 32 30 31 28 30 0 0 0 ALDEHYDES benzaldehyde 59 59 59 59 50 54 59 50 54 KETONES acetone 91 68 80 77 50 64 59 55 57 ESTERS AND LACTONES texanol 18 26 22 18 31 24 24 28 26 2-ethylhexyl acetate 146 155 150 146 141 143 150 141 145 2-ethylhexyl acrylate 25 27 26 24 24 24 27 23 25 2-ethyl-1-hexyl propionate 34 36 35 36 34 35 35 34 35 NITROGEN CONTAINING COMPOUNDS 4,4-dimethyl-1,3-oxazolidine 546 523 534 555 482 518 550 482 516 dimethyl perhydro-1,3-oxazine 91 86 89 100 91 95 91 91 91 Total 2624 2550 2587 2627 2311 2469 2489 2319 2404 TVOC 2127 2127 2127 2178 2014 2096 2142 2011 2076 non-TVOC 355 314 334 344 207 275 267 254 260
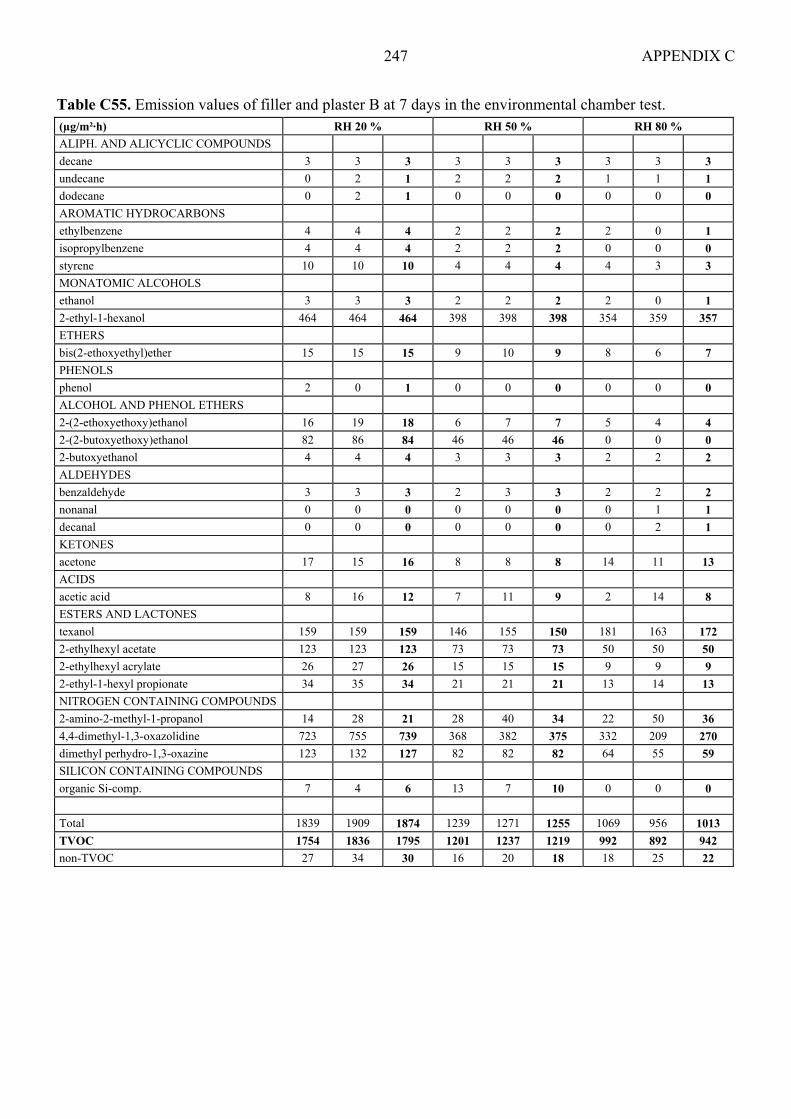
APPENDIX C 247
Table C55. Emission values of filler and plaster B at 7 days in the environmental chamber test. (µg/m²·h) RH 20 % RH 50 % RH 80 % ALIPH. AND ALICYCLIC COMPOUNDS decane 3 3 3 3 3 3 3 3 3 undecane 0 2 1 2 2 2 1 1 1 dodecane 0 2 1 0 0 0 0 0 0 AROMATIC HYDROCARBONS ethylbenzene 4 4 4 2 2 2 2 0 1 isopropylbenzene 4 4 4 2 2 2 0 0 0 styrene 10 10 10 4 4 4 4 3 3 MONATOMIC ALCOHOLS ethanol 3 3 3 2 2 2 2 0 1 2-ethyl-1-hexanol 464 464 464 398 398 398 354 359 357 ETHERS bis(2-ethoxyethyl)ether 15 15 15 9 10 9 8 6 7 PHENOLS phenol 2 0 1 0 0 0 0 0 0 ALCOHOL AND PHENOL ETHERS 2-(2-ethoxyethoxy)ethanol 16 19 18 6 7 7 5 4 4 2-(2-butoxyethoxy)ethanol 82 86 84 46 46 46 0 0 0 2-butoxyethanol 4 4 4 3 3 3 2 2 2 ALDEHYDES benzaldehyde 3 3 3 2 3 3 2 2 2 nonanal 0 0 0 0 0 0 0 1 1 decanal 0 0 0 0 0 0 0 2 1 KETONES acetone 17 15 16 8 8 8 14 11 13 ACIDS acetic acid 8 16 12 7 11 9 2 14 8 ESTERS AND LACTONES texanol 159 159 159 146 155 150 181 163 172 2-ethylhexyl acetate 123 123 123 73 73 73 50 50 50 2-ethylhexyl acrylate 26 27 26 15 15 15 9 9 9 2-ethyl-1-hexyl propionate 34 35 34 21 21 21 13 14 13 NITROGEN CONTAINING COMPOUNDS 2-amino-2-methyl-1-propanol 14 28 21 28 40 34 22 50 36 4,4-dimethyl-1,3-oxazolidine 723 755 739 368 382 375 332 209 270 dimethyl perhydro-1,3-oxazine 123 132 127 82 82 82 64 55 59 SILICON CONTAINING COMPOUNDS organic Si-comp. 7 4 6 13 7 10 0 0 0 Total 1839 1909 1874 1239 1271 1255 1069 956 1013 TVOC 1754 1836 1795 1201 1237 1219 992 892 942 non-TVOC 27 34 30 16 20 18 18 25 22

APPENDIX C 248
Table C56. Emission values of filler and plaster B at 14 days in the environmental chamber test. (µg/m²·h) RH 20 % RH 50 % RH 80 % AROMATIC HYDROCARBONS styrene 0 0 0 6 6 6 0 0 0 MONATOMIC ALCOHOLS 2-ethyl-1-hexanol 104 104 104 143 143 143 145 154 150 ETHERS bis(2-ethoxyethyl)ether 15 15 15 14 15 14 7 7 7 ALCOHOL AND PHENOL ETHERS 2-(2-ethoxyethoxy)ethanol 227 227 227 37 38 37 9 8 9 2-(2-butoxyethoxy)ethanol 214 214 214 141 141 141 7 7 7 KETONES acetone 5 7 6 6 8 7 16 6 11 ACIDS acetic acid 7 7 7 0 0 0 0 0 0 ESTERS AND LACTONES texanol 64 64 64 150 155 152 167 181 174 2-ethylhexyl acetate 146 146 146 86 86 86 41 44 43 2-ethylhexyl acrylate 59 59 59 29 29 29 10 10 10 2-ethyl-1-hexyl propionate 50 55 52 31 31 31 12 12 12 NITROGEN CONTAINING COMPOUNDS 2-amino-2-methyl-1-propanol 13 19 16 16 40 28 9 7 8 4,4-dimethyl-1,3-oxazolidine 591 573 582 600 559 580 291 305 298 dimethyl perhydro-1,3-oxazine 100 96 98 96 96 96 50 46 48 SILICON CONTAINING COMPOUNDS organic Si-comp. 64 59 61 9 8 9 0 0 0 Total 1657 1643 1650 1364 1354 1359 765 786 776 TVOC 1536 1518 1527 1332 1337 1335 747 770 758 non-TVOC 12 15 13 5 6 5 16 5 10

APPENDIX C 249
Table C57. Background emission values of a 6 mm layer of plaster C in the environmental chamber test. (µg/m³) RH 20 % RH 50 % RH 80 %TVOC 11 8 20
Table C58. Emission values of a 6 mm layer of plaster C at 1 day in the environmental chamber test. (µg/m²·h) RH 20 % RH 50 % RH 80 % AROMATIC HYDROCARBONS p,m-xylene 2 2 2 2 2 2 2 2 2 toluene 2 2 2 2 2 2 2 1 2 MONATOMIC ALCOHOLS 2-ethyl-1-hexanol 2 5 3 3 5 4 4 5 4 2-methyl-2-propanol 7 7 7 6 6 6 6 6 6 ALDEHYDES hexanal 6 6 6 0 4 2 0 0 0 octanal 3 3 3 2 2 2 3 1 2 nonanal 8 11 9 7 6 6 9 5 7 decanal 7 11 9 8 51) 6 9 51) 7 KETONES acetone 13 13 13 12 11 11 14 11 13 ACIDS acetic acid 55 271) 41 46 36 41 64 271) 45 TERPENES AND THEIR DERIVATIVES limonene 0 0 0 0 0 0 0 4 2 SILICON CONTAINING COMPOUNDS organic Si-comp. 31) 31) 3 4 31) 3 4 31) 4 Total 108 90 99 90 81 85 115 71 93 TVOC 36 32 34 18 25 21 29 13 21 non-TVOC 75 47 61 63 53 58 83 44 64 1) Italic font indicates that the value is below the detection limit.

APPENDIX C 250
Table C59. Emission values of a 6 mm layer of plaster C at 7 days in the environmental chamber test. (µg/m²·h) RH 20 % RH 50 % RH 80 % ALIPH. AND ALICYCLIC COMPOUNDS nonane 0.9 0.5 0.7 0 0 0 0.9 0 0.5 decane 0.5 0.5 0.5 0 0.3 0.2 0 0 0 undecane 1 1 1 0 0 0 0 0 0 dodecane 0.9 0.9 0.9 0.4 0.4 0.4 0.4 0.4 0.4 tridecane 0.9 0.9 0.9 0.3 0.4 0.4 0 0 0 tetradecane 0.9 1 1 0.5 0 0.3 0 0.3 0.2 pentadecane 0 0.5 0.3 0 0 0 0 0 0 aliphatic hydrocarb. 10 10 10 0 0 0 0 0 0 AROMATIC HYDROCARBONS benzene 1 0 0 0.2 0 0.1 0.3 0.2 0.3 ethylbenzene 0 0 0 0 0.2 0.1 0 0 0 p,m-xylene 1 1 1 1 1 1 1 1 1 o-xylene 0 0 0 0.3 0.3 0.3 0.3 0.3 0.3 toluene 1 1 1 1 1 1 1 1 1 1,2,4-trimethylbenzene 0 0 0 1 1 1 1 1 1 MONATOMIC ALCOHOLS 2-ethyl-1-hexanol 1 1 1 2 2 2 3 3 3 benzylalcohol 1 1 1 0.9 1 1 1 0.9 1 ALCOHOL AND PHENOL ETHERS 1-methoxy-2-propanol 0.5 0.5 0.5 0.9 0.5 0.7 0 0.9 0.5 2-butoxyethanol 0.5 0 0.3 0.9 0 0.5 0 0 0 2-phenoxyethanol 0.9 0.9 0.9 0.5 0.9 0.7 0.9 0.5 0.7 2-methoxyethanol 0.9 0.9 0.9 0 0 0 0 0 0 ALDEHYDES benzaldehyde 1 0 1 0 0 0 2 0 1 n-butanal 0.9 0.4 0.7 0 0 0 0 0.9 0.5 hexanal 0.9 0 0.5 0 0 0 0 0 0 nonanal 3 6 4 2 2 2 3 1 2 decanal 3 4 3 3 3 3 4 0.9 3 KETONES acetophenone 0 0 0 0 0 0 0.9 0.9 0.9 acetone 1 3 2 1 2 2 3 3 3 TERPENES AND THEIR DERIVATIVES limonene 0 0 0 0 0.4 0.2 0 0 0 ESTERS AND LACTONES 1-methoxy-2-propylacetate 0 0 0 0.9 0.5 0.7 0.9 0.5 0.7 TXIB 0 0 0 0.1 0 0.1 0 0 0 SILICON CONTAINING COMPOUNDS triethoxypentylsilane 4 3 4 0 2 1 0 0 0 Total 38 39 38 16 18 17 24 16 20 TVOC 50 68 59 14 34 24 34 17 26 non-TVOC 2 3 3 1 2 2 3 4 3

APPENDIX C 251
Table C60. Emission values of a 6 mm layer of plaster C at 14 days in the environmental chamber test. (µg/m²·h) RH 20 % RH 50 % RH 80 % ALIPH. AND ALICYCLIC COMPOUNDS decane 0 0.2 0.1 0.3 0.3 0.3 0.2 0.2 0.2 undecane 0 0.2 0.1 3 3 3 0.5 0.9 0.7 dodecane 0 0 0 0 0 0 0.2 0.2 0.2 tridecane 0 0 0 0 0 0 0.2 0.2 0.2 tetradecane 0 0 0 0 0 0 0.2 0.2 0.2 hexadecane 0 0 0 0 0 0 0.1 0 0.1 A MIXTURE OF HYDROCARBONS hydrocarbon-mixture 50 46 48 50 64 57 0 0 0 AROMATIC HYDROCARBONS benzene 0.4 0.3 0.4 0.3 0.3 0.3 0.3 0.4 0.4 ethylbenzene 0.2 0.2 0.2 0.2 0.2 0.2 0.2 0.2 0.2 propylbenzene 0 0.1 0.1 0.1 0.1 0.1 0.1 0.1 0.1 p,m-xylene 0.9 0.9 0.9 0.9 0.9 0.9 0.9 0.9 0.9 o-xylene 0.3 0.3 0.3 0.3 0.3 0.3 0.3 0.3 0.3 toluene 0.9 1 1 0.9 0.9 0.9 0.9 0.9 0.9 1,2,4-trimethylbenzene 0.4 0.4 0.4 0.4 0.4 0.4 0.4 0.4 0.4 1,3,5-trimethylbenzene 0.2 0.2 0.2 0.2 0.2 0.2 0.2 0.2 0.2 1-ethyl-2-methylbenzene 0 0.1 0.1 0.1 0.1 0.1 0.1 0 0.1 MONATOMIC ALCOHOLS 2-ethyl-1-hexanol 0 0 0 0 0.5 0.3 2 0 1 benzylalcohol 0.5 0.5 0.5 0 0 0 0 0 0 DIVALENT ALCOHOLS 1,2-propanediol 0 0 0 0 0 0 0 0.5 0.3 PHENOLS phenol 0.9 0.1 0.5 1 0.9 1 1 1 1 ALCOHOL AND PHENOL ETHERS 2-(2-butoxyethoxy)ethanol 0.9 0 0.5 0 0 0 0 0 0 2-phenoxyethanol 0.9 0.9 0.9 0 0 0 0 0 0 2-methoxyethanol 2 1 2 0.5 0 0.3 0 0 0 ALDEHYDES benzaldehyde 0.9 0.3 0.6 0.9 0.5 0.7 0.9 0.9 0.9 nonanal 1 2 2 0.9 2 2 1 1 1 decanal 1 3 2 1 3 2 0.9 1 1 KETONES acetophenone 0 0 0 0 0.2 0.1 0 0 0 acetone 1 1 1 0 2 1 0 1 1 TERPENES AND THEIR DERIVATIVES limonene 0 0.3 0.2 0.3 0.3 0.3 0 0.3 0.2 ESTERS AND LACTONES 1-methoxy-2-propylacetate 0 0 0 0 0 0 0.1 0 0.1 SILICON CONTAINING COMPOUNDS organic Si-comp. 6 6 6 10 9 9 0.5 2 1 decamethylcyclopentasiloxane 0.5 0.3 0 0.9 0.9 1 0.5 0.5 1 Total 70 66 68 72 89 81 13 15 14 TVOC 73 64 68 72 72 72 19 21 20 non-TVOC 1 1 1 0 2 1 0 1 1

APPENDIX C 252
Table C61. Background emission values of primer and paint A spread onto gypsum board in the environmental chamber test.
(µg/m³) RH 20 % RH 50 % RH 80 %TVOC 7 11 11
Table C62. Emission values of primer and paint A spread onto gypsum board at 1 day in the environmental chamber test. (µg/m²·h) RH 20 % RH 50 % RH 80 % ALIPH. AND ALICYCLIC COMPOUNDS 1-dodecene 17 16 17 21 20 20 19.5 20 20 AROMATIC HYDROCARBONS ethylbenzene 6 6 6 7 8 8 7 7 7 isopropylbenzene 0 0 0 5 5 5 5 5 5 p,m-xylene 7 7 7 8 8 8 8 8 8 styrene 21 20 20 29 29 29 27 28 28 MONATOMIC ALCOHOLS ethanol 0 0 0 6 0 3 8 6 7 2-propanol 5 5 5 9 8 8 11 11 11 1-butanol 17 17 17 46 45 45 50 55 52 DIVALENT ALCOHOLS 1,2-propanediol 1523 1577 1550 1686 1677 1682 1050 1255 1152 ETHERS butyl ether 55 50 52 68 73 70 64 68 66 ALCOHOL AND PHENOL ETHERS 2-(2-ethoxyethoxy)ethanol 150 155 152 146 136 141 0 118 59 ALDEHYDES benzaldehyde 10 11 10 11 13 12 18 16 17 hexanal 0 0 0 0 5 2 5 5 5 decanal 7 7 7 34 5 20 6 5 5 KETONES acetone 14 7 10 17 11 14 17 11 14 ACIDS acetic acid 114 37 75 432 32 232 38 36 37 ESTERS AND LACTONES texanol 546 568 557 655 682 668 818 918 868 n-butylacetate 0 0 0 10 10 10 10 11 10 butyl propanoate 9 9 9 13 13 13 12 15 13 Total 2498 2493 2496 3200 2779 2989 2171 2595 2383 TVOC 732 732 732 992 951 972 731 913 822 non-TVOC 132 49 90 463 51 257 74 64 69

APPENDIX C 253
Table C63. Emission values of primer and paint A spread onto gypsum board at 7 days in the environmental chamber test. (µg/m²·h) RH 20 % RH 50 % RH 80 % ALIPH. AND ALICYCLIC COMPOUNDS 1-dodecene 1 1 1 1 1 1 1 2 2 decane 0 0 0 1 0 0 0 0 0 hexadecane 0 0 0 7 0 3 0 0 0 AROMATIC HYDROCARBONS ethylbenzene 1 0 0 1 1 1 0 0 0 isopropylbenzene 0 1 0 0 0 0 0 0 0 p,m-xylene 1 1 1 1 1 1 1 1 1 o-xylene 1 0 0 0 1 0 0 1 0 styrene 0 1 0 0 0 0 0 0 0 toluene 1 1 1 1 1 1 1 1 1 MONATOMIC ALCOHOLS ethanol 0 0 0 0 4 2 4 3 3 2-propanol 1 1 1 1 1 1 1 1 1 1-butanol 2 2 2 8 8 8 0 11 6 DIVALENT ALCOHOLS 1,2-propanediol 305 296 300 323 296 309 432 468 450 ETHERS butyl ether 3 3 3 3 3 3 2 3 3 ALDEHYDES benzaldehyde 2 1 2 2 2 2 3 3 3 n-butanal 0 0 0 0 1 1 0 0 0 pentanal 0 0 0 1 0 0 0 0 0 nonanal 0 0 0 0 0 0 0 3 2 decanal 0 0 0 0 2 1 0 6 3 KETONES 2-butanone (MEK) 0 0 0 1 0 1 0 0 0 acetone 4 2 3 8 3 5 4 6 5 ESTERS AND LACTONES texanol 396 396 396 382 368 375 418 423 420 TXIB 0 0 0 17 0 9 3 0 2 butyl propanoate 1 1 1 1 1 1 1 1 1 Total 717 705 711 759 694 726 871 931 901 TVOC 159 150 155 183 151 167 241 268 254 non-TVOC 5 3 4 10 9 10 9 9 9

APPENDIX C 254
Table C64. Emission values of primer and paint A spread onto gypsum board at 14 days in the environmental chamber test. (µg/m²·h) RH 20 % RH 50 % RH 80 % ALIPH. AND ALICYCLIC COMPOUNDS nonane 0 0 0 1 1 1 0.5 0.9 0.7 tetradecane 0 0 0 0 0 0 0.9 0 0.5 AROMATIC HYDROCARBONS p,m-xylene 0.9 0.9 0.9 0.9 0.9 0.9 0.9 0.9 0.9 toluene 0.5 0.9 0.7 0.9 0.9 0.9 0.9 0.9 0.9 MONATOMIC ALCOHOLS 2-propanol 0.5 0 0.3 0 0 0 0 0 0 1-butanol 1 1 1 5 5 5 5 5 5 DIVALENT ALCOHOLS 1,2-propanediol 68 77 73 150 159 155 318 323 320 ALCOHOL AND PHENOL ETHERS 2-butoxyethanol 0.5 0.5 0.5 2 1 2 0.9 0.9 0.9 ALDEHYDES benzaldehyde 1 0.9 1 1 1 1 2 2 2 n-butanal 0 0 0 0 0 0 0 1 1 pentanal 0 0.5 0.3 0 0.5 0.3 0.5 0 0.3 hexanal 0 0 0 0.9 0.9 0.9 0.9 0.9 0.9 nonanal 0 0.9 0.5 0.9 1 1 0.9 1 1 decanal 1 2 2 2 2 2 2 1 2 2-furfural 0 0 0 0 0 0 0.5 0 0.3 KETONES acetophenone 0 0 0 0 0 0 1 0.5 0.5 acetone 2 2 2 3 3 3 3 5 4 ACIDS acetic acid 0 4 2 2 9 5 4 0 2 ESTERS AND LACTONES texanol 346 359 352 314 309 311 346 359 352 TXIB 0.5 0.5 0.5 0.9 0.9 0.9 0.9 0.9 0.9 Total 423 451 437 485 497 491 687 703 695 TVOC 305 300 302 297 288 292 431 404 418 non-TVOC 2 6 4 5 12 8 7 5 6
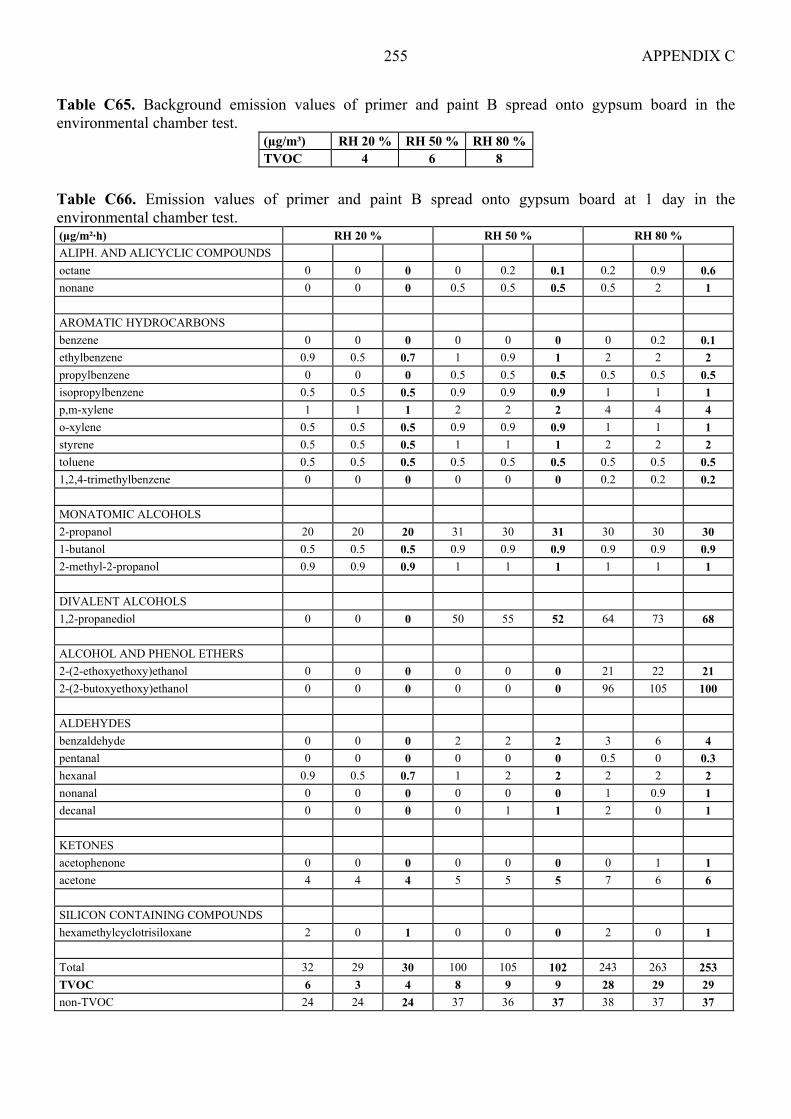
APPENDIX C 255
Table C65. Background emission values of primer and paint B spread onto gypsum board in the environmental chamber test.
(µg/m³) RH 20 % RH 50 % RH 80 %TVOC 4 6 8
Table C66. Emission values of primer and paint B spread onto gypsum board at 1 day in the environmental chamber test. (µg/m²·h) RH 20 % RH 50 % RH 80 % ALIPH. AND ALICYCLIC COMPOUNDS octane 0 0 0 0 0.2 0.1 0.2 0.9 0.6 nonane 0 0 0 0.5 0.5 0.5 0.5 2 1 AROMATIC HYDROCARBONS benzene 0 0 0 0 0 0 0 0.2 0.1 ethylbenzene 0.9 0.5 0.7 1 0.9 1 2 2 2 propylbenzene 0 0 0 0.5 0.5 0.5 0.5 0.5 0.5 isopropylbenzene 0.5 0.5 0.5 0.9 0.9 0.9 1 1 1 p,m-xylene 1 1 1 2 2 2 4 4 4 o-xylene 0.5 0.5 0.5 0.9 0.9 0.9 1 1 1 styrene 0.5 0.5 0.5 1 1 1 2 2 2 toluene 0.5 0.5 0.5 0.5 0.5 0.5 0.5 0.5 0.5 1,2,4-trimethylbenzene 0 0 0 0 0 0 0.2 0.2 0.2 MONATOMIC ALCOHOLS 2-propanol 20 20 20 31 30 31 30 30 30 1-butanol 0.5 0.5 0.5 0.9 0.9 0.9 0.9 0.9 0.9 2-methyl-2-propanol 0.9 0.9 0.9 1 1 1 1 1 1 DIVALENT ALCOHOLS 1,2-propanediol 0 0 0 50 55 52 64 73 68 ALCOHOL AND PHENOL ETHERS 2-(2-ethoxyethoxy)ethanol 0 0 0 0 0 0 21 22 21 2-(2-butoxyethoxy)ethanol 0 0 0 0 0 0 96 105 100 ALDEHYDES benzaldehyde 0 0 0 2 2 2 3 6 4 pentanal 0 0 0 0 0 0 0.5 0 0.3 hexanal 0.9 0.5 0.7 1 2 2 2 2 2 nonanal 0 0 0 0 0 0 1 0.9 1 decanal 0 0 0 0 1 1 2 0 1 KETONES acetophenone 0 0 0 0 0 0 0 1 1 acetone 4 4 4 5 5 5 7 6 6 SILICON CONTAINING COMPOUNDS hexamethylcyclotrisiloxane 2 0 1 0 0 0 2 0 1 Total 32 29 30 100 105 102 243 263 253 TVOC 6 3 4 8 9 9 28 29 29 non-TVOC 24 24 24 37 36 37 38 37 37
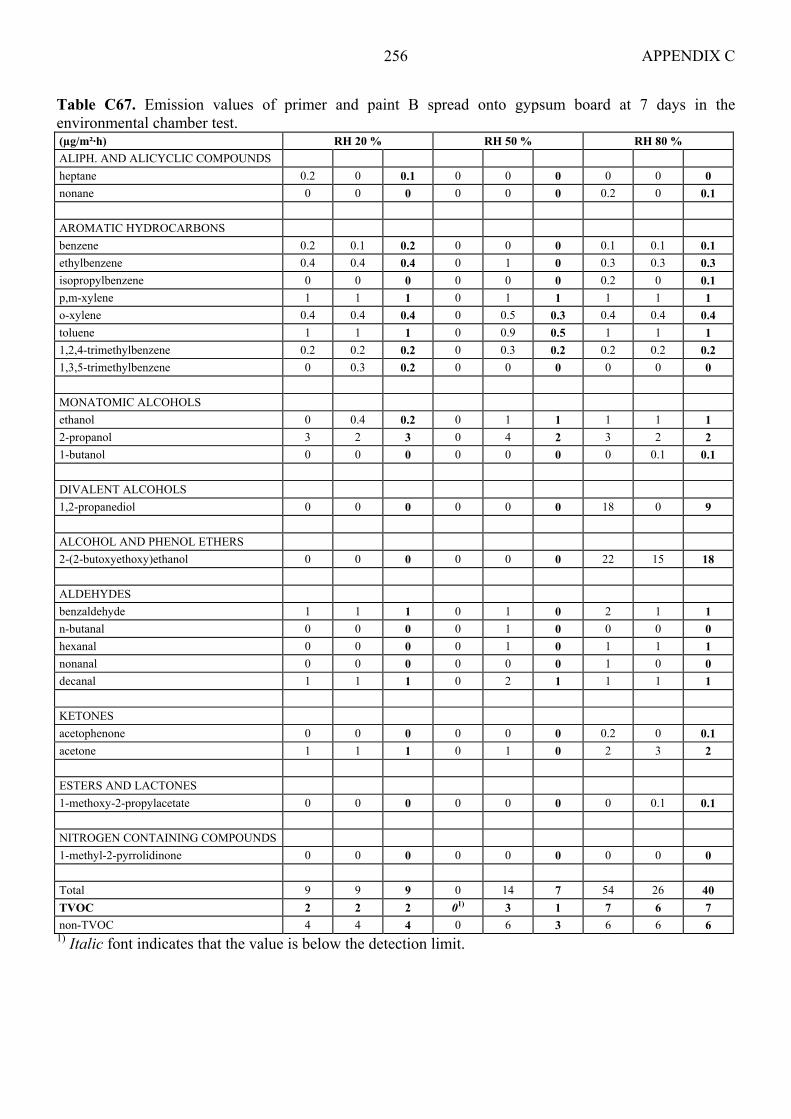
APPENDIX C 256
Table C67. Emission values of primer and paint B spread onto gypsum board at 7 days in the environmental chamber test. (µg/m²·h) RH 20 % RH 50 % RH 80 % ALIPH. AND ALICYCLIC COMPOUNDS heptane 0.2 0 0.1 0 0 0 0 0 0 nonane 0 0 0 0 0 0 0.2 0 0.1 AROMATIC HYDROCARBONS benzene 0.2 0.1 0.2 0 0 0 0.1 0.1 0.1 ethylbenzene 0.4 0.4 0.4 0 1 0 0.3 0.3 0.3 isopropylbenzene 0 0 0 0 0 0 0.2 0 0.1 p,m-xylene 1 1 1 0 1 1 1 1 1 o-xylene 0.4 0.4 0.4 0 0.5 0.3 0.4 0.4 0.4 toluene 1 1 1 0 0.9 0.5 1 1 1 1,2,4-trimethylbenzene 0.2 0.2 0.2 0 0.3 0.2 0.2 0.2 0.2 1,3,5-trimethylbenzene 0 0.3 0.2 0 0 0 0 0 0 MONATOMIC ALCOHOLS ethanol 0 0.4 0.2 0 1 1 1 1 1 2-propanol 3 2 3 0 4 2 3 2 2 1-butanol 0 0 0 0 0 0 0 0.1 0.1 DIVALENT ALCOHOLS 1,2-propanediol 0 0 0 0 0 0 18 0 9 ALCOHOL AND PHENOL ETHERS 2-(2-butoxyethoxy)ethanol 0 0 0 0 0 0 22 15 18 ALDEHYDES benzaldehyde 1 1 1 0 1 0 2 1 1 n-butanal 0 0 0 0 1 0 0 0 0 hexanal 0 0 0 0 1 0 1 1 1 nonanal 0 0 0 0 0 0 1 0 0 decanal 1 1 1 0 2 1 1 1 1 KETONES acetophenone 0 0 0 0 0 0 0.2 0 0.1 acetone 1 1 1 0 1 0 2 3 2 ESTERS AND LACTONES 1-methoxy-2-propylacetate 0 0 0 0 0 0 0 0.1 0.1 NITROGEN CONTAINING COMPOUNDS 1-methyl-2-pyrrolidinone 0 0 0 0 0 0 0 0 0 Total 9 9 9 0 14 7 54 26 40 TVOC 2 2 2 01) 3 1 7 6 7 non-TVOC 4 4 4 0 6 3 6 6 6 1) Italic font indicates that the value is below the detection limit.
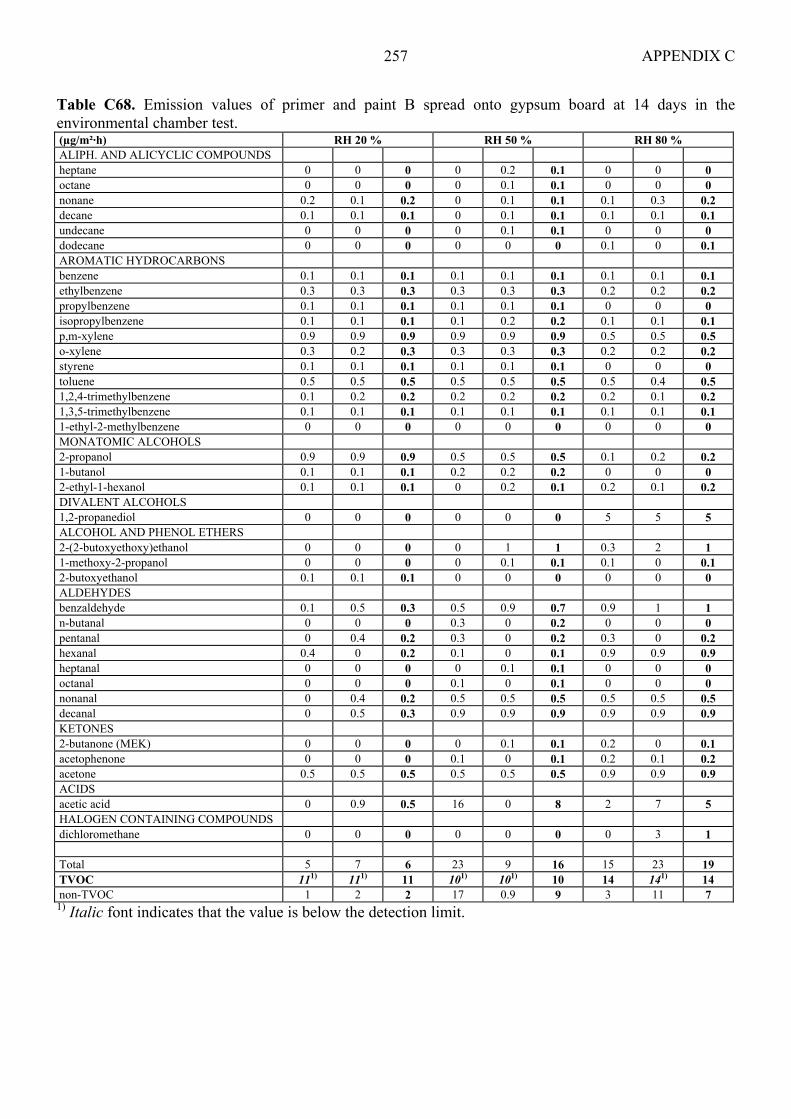
APPENDIX C 257
Table C68. Emission values of primer and paint B spread onto gypsum board at 14 days in the environmental chamber test. (µg/m²·h) RH 20 % RH 50 % RH 80 % ALIPH. AND ALICYCLIC COMPOUNDS heptane 0 0 0 0 0.2 0.1 0 0 0 octane 0 0 0 0 0.1 0.1 0 0 0 nonane 0.2 0.1 0.2 0 0.1 0.1 0.1 0.3 0.2 decane 0.1 0.1 0.1 0 0.1 0.1 0.1 0.1 0.1 undecane 0 0 0 0 0.1 0.1 0 0 0 dodecane 0 0 0 0 0 0 0.1 0 0.1 AROMATIC HYDROCARBONS benzene 0.1 0.1 0.1 0.1 0.1 0.1 0.1 0.1 0.1 ethylbenzene 0.3 0.3 0.3 0.3 0.3 0.3 0.2 0.2 0.2 propylbenzene 0.1 0.1 0.1 0.1 0.1 0.1 0 0 0 isopropylbenzene 0.1 0.1 0.1 0.1 0.2 0.2 0.1 0.1 0.1 p,m-xylene 0.9 0.9 0.9 0.9 0.9 0.9 0.5 0.5 0.5 o-xylene 0.3 0.2 0.3 0.3 0.3 0.3 0.2 0.2 0.2 styrene 0.1 0.1 0.1 0.1 0.1 0.1 0 0 0 toluene 0.5 0.5 0.5 0.5 0.5 0.5 0.5 0.4 0.5 1,2,4-trimethylbenzene 0.1 0.2 0.2 0.2 0.2 0.2 0.2 0.1 0.2 1,3,5-trimethylbenzene 0.1 0.1 0.1 0.1 0.1 0.1 0.1 0.1 0.1 1-ethyl-2-methylbenzene 0 0 0 0 0 0 0 0 0 MONATOMIC ALCOHOLS 2-propanol 0.9 0.9 0.9 0.5 0.5 0.5 0.1 0.2 0.2 1-butanol 0.1 0.1 0.1 0.2 0.2 0.2 0 0 0 2-ethyl-1-hexanol 0.1 0.1 0.1 0 0.2 0.1 0.2 0.1 0.2 DIVALENT ALCOHOLS 1,2-propanediol 0 0 0 0 0 0 5 5 5 ALCOHOL AND PHENOL ETHERS 2-(2-butoxyethoxy)ethanol 0 0 0 0 1 1 0.3 2 1 1-methoxy-2-propanol 0 0 0 0 0.1 0.1 0.1 0 0.1 2-butoxyethanol 0.1 0.1 0.1 0 0 0 0 0 0 ALDEHYDES benzaldehyde 0.1 0.5 0.3 0.5 0.9 0.7 0.9 1 1 n-butanal 0 0 0 0.3 0 0.2 0 0 0 pentanal 0 0.4 0.2 0.3 0 0.2 0.3 0 0.2 hexanal 0.4 0 0.2 0.1 0 0.1 0.9 0.9 0.9 heptanal 0 0 0 0 0.1 0.1 0 0 0 octanal 0 0 0 0.1 0 0.1 0 0 0 nonanal 0 0.4 0.2 0.5 0.5 0.5 0.5 0.5 0.5 decanal 0 0.5 0.3 0.9 0.9 0.9 0.9 0.9 0.9 KETONES 2-butanone (MEK) 0 0 0 0 0.1 0.1 0.2 0 0.1 acetophenone 0 0 0 0.1 0 0.1 0.2 0.1 0.2 acetone 0.5 0.5 0.5 0.5 0.5 0.5 0.9 0.9 0.9 ACIDS acetic acid 0 0.9 0.5 16 0 8 2 7 5 HALOGEN CONTAINING COMPOUNDS dichloromethane 0 0 0 0 0 0 0 3 1 Total 5 7 6 23 9 16 15 23 19 TVOC 111) 111) 11 101) 101) 10 14 141) 14 non-TVOC 1 2 2 17 0.9 9 3 11 7 1) Italic font indicates that the value is below the detection limit.

APPENDIX C 258
Table C69. Background emission values of adhesive A spread onto gypsum board in the environmental chamber test.
(µg/m³) RH 20 % RH 50 % RH 80 % ALDEHYDES decanal - 11 - TVOC 7 28 14
Table C70. Emission values of adhesive A spread onto gypsum board at 1 day in the environmental chamber test. (µg/m²·h) RH 20 % RH 50 % RH 80 % ALIPH. AND ALICYCLIC COMPOUNDS nonane 0 0 0 0 0.5 0 0.3 0.3 0.3 decane 0.2 0 0.1 0.2 0.3 0.3 0 0.3 0.2 undecane 0.3 0.2 0.3 0.3 0.3 0.3 0.3 0.3 0.3 dodecane 0 0 0 0.2 0.2 0.2 0 0.2 0.1 AROMATIC HYDROCARBONS p,m-xylene 0.5 0.4 0.5 0.5 0.5 0.5 0.5 0.5 0.5 o-xylene 0 0 0 0.2 0 0.1 0 0.3 0.2 toluene 0.5 0.4 0.5 0.5 0.5 0.5 0.5 0.5 0.5 1,2,4-trimethylbenzene 0.3 0.3 0.3 0.4 0.4 0.4 0.4 0.4 0.4 MONATOMIC ALCOHOLS 2-propanol 0.3 0 0.2 0.3 0.3 0.3 0.3 0.4 0.4 1-butanol 0.9 0.9 0.9 1 1 1 2 2 2 2-ethyl-1-hexanol 0.4 0.4 0.4 0.4 0.5 0.5 0.4 0.5 0.5 benzylalcohol 0.3 0 0.2 0.2 0 0.1 0 0 0 2-methyl-1-propanol 0 0 0 0.5 0.4 0.5 0.5 0.5 0.5 2-methyl-2-propanol 6 6 6 8 6 7 9 11 10 DIVALENT ALCOHOLS 1,2-propanediol 0.4 0 0.2 0 0.3 0.2 0 0 0 PHENOLS phenol 0.5 0.4 0.5 0.5 0.4 0 0.5 0.3 0.4 ALCOHOL AND PHENOL ETHERS 2-butoxyethanol 0.3 0 0.2 0 0 0 0 0 0 2-phenoxyethanol 0 0 0 0 0.2 0.1 0 0 0 ALDEHYDES benzaldehyde 0.9 0.9 0.9 2 1 2 2 2 2 pentanal 0 0 0 0.9 0.9 0.9 0 0.9 0.5 hexanal 6 6 6 6 6 6 8 8 8 heptanal 0.9 0.9 0.9 0.9 0.9 0.9 1 1 1 octanal 0.9 0.9 0.9 0.5 1 1.0 1 0.9 1 nonanal 3 3 3 2 6 4 5 4 5 decanal 1 2 2 0 0.5 0 3 3 3 2-furfural 0.4 0.3 0.4 0.5 0.5 0.5 0.9 0.9 0.9 KETONES acetophenone 0.3 0.4 0.4 0.4 0.4 0.4 0.5 0.5 0.5 acetone 0.9 0.9 0.9 1 2 2 2 2 2 ACIDS acetic acid 17 14 15 11 6 8 14 16 15 hexanoic acid 0 0 0 0 0 0 0 0.5 0 TERPENES AND THEIR DERIVATIVES limonene 0 0.2 0.1 0.4 0.3 0.4 0.3 0.3 0.3 3-carene 0.2 0.2 0.2 0.9 0.9 0.9 0.5 0.5 0.5 ESTERS AND LACTONES n-butyl acetate 1 0.9 1 0.9 0.9 0.9 0 1 1 SILICON CONTAINING COMPOUNDS decamethylcyclopentasiloxane 0.5 0.3 0.4 0 0.2 0.1 0 0.2 0.1 Total 45 39 42 41 40 41 54 60 57 TVOC 16 14 15 10 14.5 12 26 26 26 non-TVOC 24 20 22 20 14 17 25 30 27

APPENDIX C 259
Table C71. Emission values of adhesive A spread onto gypsum board at 7 days in the environmental chamber test. (µg/m²·h) RH 20 % RH 50 % RH 80 % ALIPH. AND ALICYCLIC COMPOUNDS nonane 0 0.1 0.2 0.1 0 0.1 0 0 0 decane 0.1 0.1 0.1 0.1 0.1 0.1 0.1 0.1 0.1 undecane 0 0 0 0 0.1 0.1 0.1 0.1 0.1 dodecane 0.1 0.1 0.1 0.1 0.1 0.1 0.1 0.1 0.1 tridecane 0 0 0 0 0.1 0.1 0.1 0.1 0.1 tetradecane 0 0.0 0.0 0 0.1 0.1 0.1 0.1 0.1 pentadecane 0 0.1 0.1 0 0.1 0.1 0.1 0.1 0.1 hexadecane 0.1 0.1 0.1 0.1 0.1 0.1 0.1 0.1 0.1 AROMATIC HYDROCARBONS benzene 0 0 0 0 0 0 0 0 0 ethylbenzene 0.1 0.1 0.1 0.1 0.1 0.1 0.1 0.1 0.1 propylbenzene 0 0 0 0 0 0 0 0 0 p,m-xylene 0.3 0.3 0.3 0.3 0.4 0.4 0.3 0.3 0.3 o-xylene 0.1 0.1 0.1 0.1 0.1 0.1 0.1 0.1 0.1 styrene 0 0 0 0 0 0 0 0 0 toluene 0.3 0.4 0.4 0.4 1 0.5 0.4 0.4 0.4 1,2,3-trimethylbenzene 0 0 0 0 0 0 0.1 0.1 0.1 1,2,4-trimethylbenzene 0.2 0.2 0.2 0.2 0.2 0.2 0.2 0.2 0.2 1,3,5-trimethylbenzene 0.0 0.1 0.1 0.1 0.1 0.1 0.1 0.1 0.1 1-ethyl-2-methylbenzene 0 0 0 0 0 0 0 0 0 MONATOMIC ALCOHOLS 1-butanol 0 0 0 0.2 0 0.1 0.2 0 0.1 2-ethyl-1-hexanol 0.1 0.1 0.1 0.3 0.2 0.3 0.3 0.3 0.3 benzylalcohol 0 0 0 0.1 0 0.1 0.1 0.1 0.1 DIVALENT ALCOHOLS 1,2-propanediol 0 0 0 1 0 0.5 0.4 0.4 0.4 PHENOLS phenol 0 0 0 0.2 0 0.1 0.4 0.4 0.4 ALCOHOL AND PHENOL ETHERS 2-butoxyethanol 0 0 0 0.2 0.2 0.2 0.2 0.2 0.2 2-phenoxyethanol 0 0 0 0 0 0 0.2 0.2 0.2 ALDEHYDES benzaldehyde 0.0 0.1 0.1 0 0 0 0.4 0.3 0.4 pentanal 0.4 0.4 0.4 0 0 0 0 0 0 hexanal 1 1 1 1 1 1 1 1 1 heptanal 0 0.2 0.1 0.3 0.3 0.3 0.4 0.4 0.4 octanal 0.3 0.4 0.4 1 0.3 0.4 0.4 0.4 0.4 nonanal 1 1 1 1 1 1 2 2 2 decanal 2 1 2 0 0 0 1 1 1 KETONES acetophenone 0 0.1 0.1 0 0.1 0.1 0.2 0.1 0.2 acetone 0.2 1 0.4 0.4 0.4 0.4 1 1 1 ACIDS acetic acid 0 0 0 1 4 3 13 7 10 propanoic acid 0 0 0 0 0 0 1 1 1 TERPENES AND THEIR DERIVATIVES limonene 0.2 0.2 0.2 0.3 0.2 0.3 0.3 0.2 0.3 α-pinene 0.4 0.3 0.4 1 0.3 0.4 1 0.4 0.5 3-carene 0.4 0.4 0.4 1 1 1 1 1 1 NITROGEN CONTAINING COMPOUNDS 1-methyl-2-pyrrolidinone 0 0 0 0 0.1 0.1 0 0 0 SILICON CONTAINING COMPOUNDS decamethylcyclopentasiloxane 0 0 0 0.1 0.1 0.1 0.1 0.1 0.1 Total 7 8 8 10 10 10 25 18 21 TVOC 2 2 2 0 0 0 5 13 9 non-TVOC 0 1 0 2 4 3 13 8 10

APPENDIX C 260
Table C72. Emission values of adhesive A spread onto gypsum board at 14 days in the environmental chamber test. (µg/m²·h) RH 20 % RH 50 % RH 80 % ALIPH. AND ALICYCLIC COMPOUNDS nonane 0.2 0.1 0.2 0 0.1 0.1 0.1 0.2 0.2 decane 0.1 0.1 0.1 0.1 0.1 0.1 0.1 0.1 0.1 undecane 0 0 0 0.1 0 0.1 0.1 0.1 0.1 dodecane 0 0 0 0.1 0.1 0.1 0.1 0.1 0.1 tridecane 0 0 0 0 0 0 0.1 0.1 0.1 tetradecane 0 0 0 0 0 0 0.1 0.1 0.1 pentadecane 0 0 0 0 0 0 0.1 0 0.1 AROMATIC HYDROCARBONS benzene 0.1 0 0.1 0 0 0 0 0 0 ethylbenzene 0.1 0.1 0.1 0.1 0.1 0.1 0.1 0.1 0.1 propylbenzene 0 0 0 0 0 0 0 0 0 p,m-xylene 0.5 0.4 0 0.5 0.5 1 0.5 0.5 1 o-xylene 0.1 0.1 0.1 0.1 0.1 0.1 0.1 0.1 0.1 toluene 0.4 0.3 0.4 0.5 0.4 0.5 0.5 0.4 0 1,2,4-trimethylbenzene 0.1 0.1 0.1 0.2 0.2 0.2 0.2 0.2 0.2 1,3,5-trimethylbenzene 0.1 0.1 0.1 0.1 0.1 0.1 0.1 0.1 0.1 1-ethyl-2-methylbenzene 0 0 0 0 0 0 0 0 0 MONATOMIC ALCOHOLS 2-ethyl-1-hexanol 0.1 0.1 0.1 0.2 0.2 0.2 0.2 0.3 0.3 benzylalcohol 0 0 0 0.1 0.1 0.1 0.1 0.1 0.1 DIVALENT ALCOHOLS 1,2-propanediol 0 0 0 0 0 0 0.4 0.3 0.4 PHENOLS phenol 0.2 0.1 0.2 0 0 0 0.1 0.4 0.3 ALCOHOL AND PHENOL ETHERS 2-(2-butoxyethoxy)ethanol 0 0 0 0.1 0.1 0.1 0 0.1 0.1 2-butoxyethanol 0 0 0 0.1 0.2 0.2 0.2 0.2 0.2 2-phenoxyethanol 0 0 0 0 0 0 0.2 0.2 0.2 ALDEHYDES benzaldehyde 0.1 0 0.1 0.1 0.1 0.1 0.2 0.3 0.3 pentanal 0.5 0.5 0.5 0 0 0 0 0 0 hexanal 0.9 0.9 0.9 0.9 0.9 0.9 0.5 0.5 0.5 heptanal 0 0 0 0.2 0.2 0.2 0.2 0.3 0.3 octanal 0 0.3 0.2 0 0.3 0.2 0.3 0.5 0.4 nonanal 0.5 0.9 0.7 0.9 0.9 0.9 1 2 2 decanal 0.9 1 1 0 0 0 0.9 2 1 KETONES acetophenone 0 0 0 0.1 0 0.1 0.2 0.1 0.2 acetone 0.2 0.2 0.2 0.2 0.3 0.3 0.5 0.5 0.5 ACIDS acetic acid 7 0 4 4 15 9 18 14 16 propanoic acid 0 0 0 0 0 0 0.9 0.9 1 TERPENES AND THEIR DERIVATIVES limonene 0 0 0 0.1 0.1 0.1 0.1 0.1 0.1 α-pinene 0.1 0.1 0.1 0.1 0.1 0.1 0.1 0.1 0.1 3-carene 0 0 0 0.1 0 0.1 0.1 0.1 0.1 SILICON CONTAINING COMPOUNDS decamethylcyclopentasiloxane 0.1 0 0.1 0 0.3 0.2 0 0.2 0.1 Total 13 6 9 9 20 14 27 25 26 TVOC 3 0 1 0 0 0 0 4 2 non-TVOC 8 0.2 4 4 15 9 19 15 17
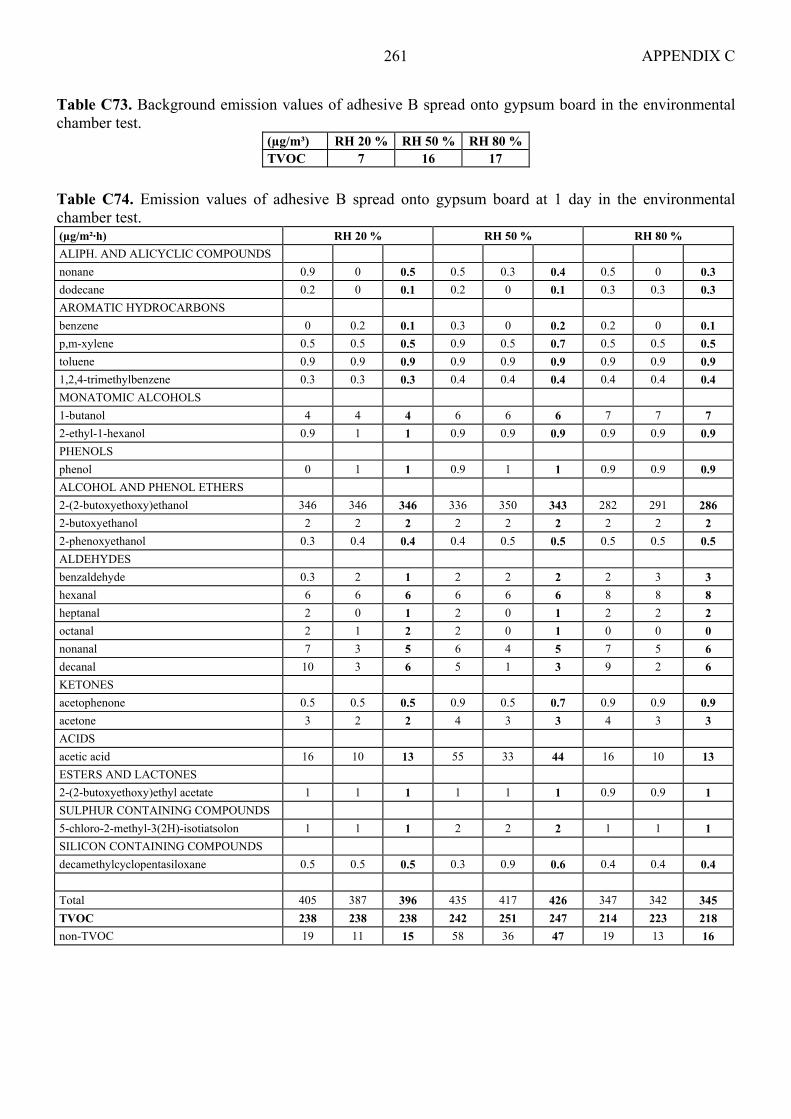
APPENDIX C 261
Table C73. Background emission values of adhesive B spread onto gypsum board in the environmental chamber test.
(µg/m³) RH 20 % RH 50 % RH 80 %TVOC 7 16 17
Table C74. Emission values of adhesive B spread onto gypsum board at 1 day in the environmental chamber test. (µg/m²·h) RH 20 % RH 50 % RH 80 % ALIPH. AND ALICYCLIC COMPOUNDS nonane 0.9 0 0.5 0.5 0.3 0.4 0.5 0 0.3 dodecane 0.2 0 0.1 0.2 0 0.1 0.3 0.3 0.3 AROMATIC HYDROCARBONS benzene 0 0.2 0.1 0.3 0 0.2 0.2 0 0.1 p,m-xylene 0.5 0.5 0.5 0.9 0.5 0.7 0.5 0.5 0.5 toluene 0.9 0.9 0.9 0.9 0.9 0.9 0.9 0.9 0.9 1,2,4-trimethylbenzene 0.3 0.3 0.3 0.4 0.4 0.4 0.4 0.4 0.4 MONATOMIC ALCOHOLS 1-butanol 4 4 4 6 6 6 7 7 7 2-ethyl-1-hexanol 0.9 1 1 0.9 0.9 0.9 0.9 0.9 0.9 PHENOLS phenol 0 1 1 0.9 1 1 0.9 0.9 0.9 ALCOHOL AND PHENOL ETHERS 2-(2-butoxyethoxy)ethanol 346 346 346 336 350 343 282 291 286 2-butoxyethanol 2 2 2 2 2 2 2 2 2 2-phenoxyethanol 0.3 0.4 0.4 0.4 0.5 0.5 0.5 0.5 0.5 ALDEHYDES benzaldehyde 0.3 2 1 2 2 2 2 3 3 hexanal 6 6 6 6 6 6 8 8 8 heptanal 2 0 1 2 0 1 2 2 2 octanal 2 1 2 2 0 1 0 0 0 nonanal 7 3 5 6 4 5 7 5 6 decanal 10 3 6 5 1 3 9 2 6 KETONES acetophenone 0.5 0.5 0.5 0.9 0.5 0.7 0.9 0.9 0.9 acetone 3 2 2 4 3 3 4 3 3 ACIDS acetic acid 16 10 13 55 33 44 16 10 13 ESTERS AND LACTONES 2-(2-butoxyethoxy)ethyl acetate 1 1 1 1 1 1 0.9 0.9 1 SULPHUR CONTAINING COMPOUNDS 5-chloro-2-methyl-3(2H)-isotiatsolon 1 1 1 2 2 2 1 1 1 SILICON CONTAINING COMPOUNDS decamethylcyclopentasiloxane 0.5 0.5 0.5 0.3 0.9 0.6 0.4 0.4 0.4 Total 405 387 396 435 417 426 347 342 345 TVOC 238 238 238 242 251 247 214 223 218 non-TVOC 19 11 15 58 36 47 19 13 16

APPENDIX C 262
Table C75. Emission values of adhesive B spread onto gypsum board at 7 days in the environmental chamber test. (µg/m²·h) RH 20 % RH 50 % RH 80 % ALIPH. AND ALICYCLIC COMPOUNDS nonane 0 0.1 0.1 0 0 0 0.1 0.2 0.2 decane 0 0.1 0.1 0.1 0 0.1 0 0.1 0.1 dodecane 0 0.1 0.1 0 0 0 0 0.1 0.1 tridecane 0 0 0 0 0 0 0.2 0.2 0.2 tetradecane 0 0 0 0 0 0 0.2 0.2 0.2 pentadecane 0 0 0 0 0 0 0.2 0.1 0.2 hexadecane 0.1 0.2 0.2 0 0 0 0 0 0 AROMATIC HYDROCARBONS benzene 0 0 0 0 0 0 0 0 0 ethylbenzene 0.1 0.1 0.1 0.1 0.1 0.1 0.1 0.1 0.1 p,m-xylene 1 1 1 1 1 1 1 1 1 o-xylene 0.1 0.1 0.1 0 0.1 0.1 0.1 0.1 0.1 toluene 0.4 0.4 0.4 0.4 0.4 0.4 0.4 0.4 0.4 1,2,4-trimethylbenzene 0.1 0.1 0.1 0.1 0.1 0.1 0.1 0.1 0.1 MONATOMIC ALCOHOLS 1-butanol 0 0 0 0 0.4 0.2 0.3 0 0.2 2-ethyl-1-hexanol 0.2 0.2 0.2 0.4 0.4 0.4 1 0.4 0 benzylalcohol 0 0 0 0 0 0 0.2 0 0.1 DIVALENT ALCOHOLS 1,2-propanediol 0 0 0 0 0 0 1 1 1 PHENOLS phenol 1 0.3 0.4 0 0 0 0.3 0.2 0.3 ALCOHOL AND PHENOL ETHERS 2-(2-butoxyethoxy)ethanol 0 0 0 3 5 4 68 73 70 1-methoxy-2-propanol 0 0 0 0 0.1 0.1 0 0 0 2-butoxyethanol 0 0 0 1 1 1 1 1 1 2-phenoxyethanol 0 0 0 0 0 0 0.2 0.3 0.3 ALDEHYDES benzaldehyde 0 0 0 0 0.3 0.2 0.4 0 0.2 pentanal 0 0 0 1 0.4 0 0 0 0 hexanal 1 1 1 1 1 1 1 1 1 heptanal 0 0 0 0 0 0 0.4 0 0.2 octanal 0 0 0 1 0 0 1 1 1 nonanal 1 1 1 2 1 2 3 3 3 decanal 1 1 1 2 1 1 2 3 2 KETONES acetophenone 0 0 0 0.1 0.1 0.1 0.1 0 0.1 acetone 1 1 1 1 1 1 1 1 1 ACIDS acetic acid 0 0 0 3 9 6 13 13 13 TERPENES AND THEIR DERIVATIVES limonene 0.2 0 0.1 0.2 0.2 0.2 0.2 0.2 0.2 α-pinene 0.3 0.3 0.3 0.3 0.2 0.3 0.2 0.2 0.2 3-carene 0.4 0.3 0.4 0.4 0.3 0.4 0.3 0.3 0.3 decamethylcyclopentasiloxane 0 0.1 0.1 0.0 0.1 0.1 0.1 0 0.1 Total 7 7 7 16 22 19 96 100 98 TVOC 01) 01) 0 01) 01) 0 55 55 55 non-TVOC 1 1 1 4 10 7 15 14 14 1) Italic font indicates that the value is below the detection limit.
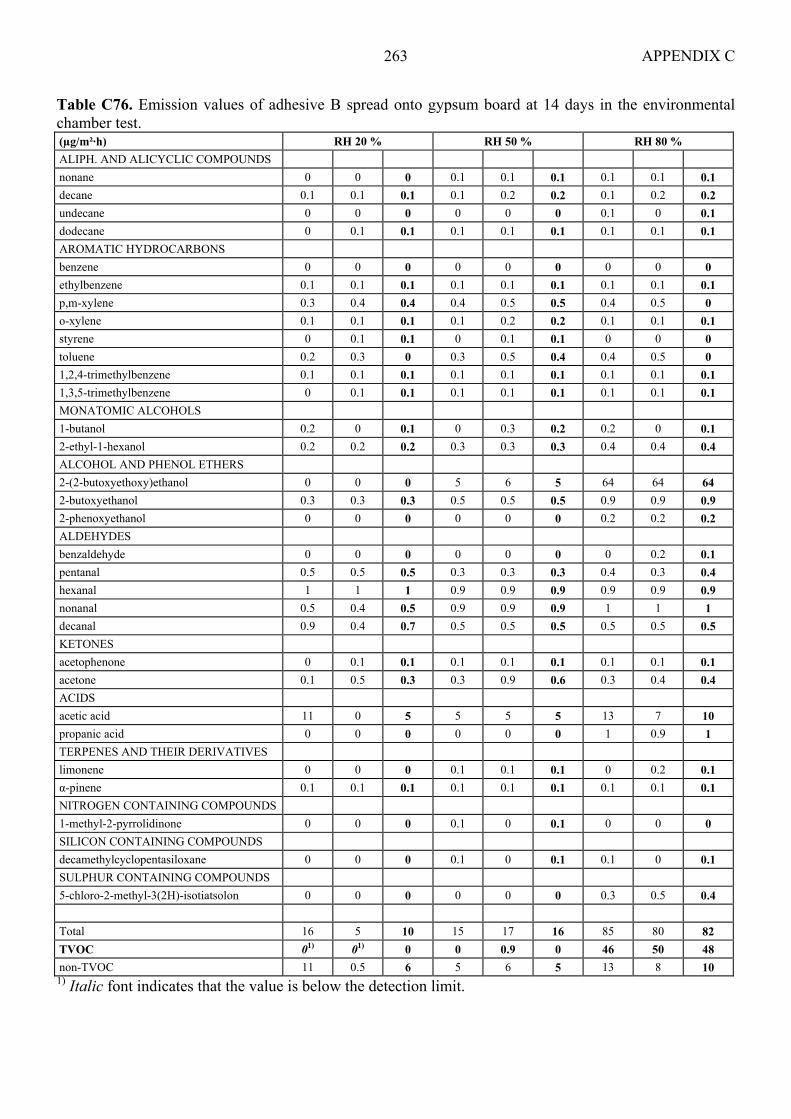
APPENDIX C 263
Table C76. Emission values of adhesive B spread onto gypsum board at 14 days in the environmental chamber test. (µg/m²·h) RH 20 % RH 50 % RH 80 % ALIPH. AND ALICYCLIC COMPOUNDS nonane 0 0 0 0.1 0.1 0.1 0.1 0.1 0.1 decane 0.1 0.1 0.1 0.1 0.2 0.2 0.1 0.2 0.2 undecane 0 0 0 0 0 0 0.1 0 0.1 dodecane 0 0.1 0.1 0.1 0.1 0.1 0.1 0.1 0.1 AROMATIC HYDROCARBONS benzene 0 0 0 0 0 0 0 0 0 ethylbenzene 0.1 0.1 0.1 0.1 0.1 0.1 0.1 0.1 0.1 p,m-xylene 0.3 0.4 0.4 0.4 0.5 0.5 0.4 0.5 0 o-xylene 0.1 0.1 0.1 0.1 0.2 0.2 0.1 0.1 0.1 styrene 0 0.1 0.1 0 0.1 0.1 0 0 0 toluene 0.2 0.3 0 0.3 0.5 0.4 0.4 0.5 0 1,2,4-trimethylbenzene 0.1 0.1 0.1 0.1 0.1 0.1 0.1 0.1 0.1 1,3,5-trimethylbenzene 0 0.1 0.1 0.1 0.1 0.1 0.1 0.1 0.1 MONATOMIC ALCOHOLS 1-butanol 0.2 0 0.1 0 0.3 0.2 0.2 0 0.1 2-ethyl-1-hexanol 0.2 0.2 0.2 0.3 0.3 0.3 0.4 0.4 0.4 ALCOHOL AND PHENOL ETHERS 2-(2-butoxyethoxy)ethanol 0 0 0 5 6 5 64 64 64 2-butoxyethanol 0.3 0.3 0.3 0.5 0.5 0.5 0.9 0.9 0.9 2-phenoxyethanol 0 0 0 0 0 0 0.2 0.2 0.2 ALDEHYDES benzaldehyde 0 0 0 0 0 0 0 0.2 0.1 pentanal 0.5 0.5 0.5 0.3 0.3 0.3 0.4 0.3 0.4 hexanal 1 1 1 0.9 0.9 0.9 0.9 0.9 0.9 nonanal 0.5 0.4 0.5 0.9 0.9 0.9 1 1 1 decanal 0.9 0.4 0.7 0.5 0.5 0.5 0.5 0.5 0.5 KETONES acetophenone 0 0.1 0.1 0.1 0.1 0.1 0.1 0.1 0.1 acetone 0.1 0.5 0.3 0.3 0.9 0.6 0.3 0.4 0.4 ACIDS acetic acid 11 0 5 5 5 5 13 7 10 propanic acid 0 0 0 0 0 0 1 0.9 1 TERPENES AND THEIR DERIVATIVES limonene 0 0 0 0.1 0.1 0.1 0 0.2 0.1 α-pinene 0.1 0.1 0.1 0.1 0.1 0.1 0.1 0.1 0.1 NITROGEN CONTAINING COMPOUNDS 1-methyl-2-pyrrolidinone 0 0 0 0.1 0 0.1 0 0 0 SILICON CONTAINING COMPOUNDS decamethylcyclopentasiloxane 0 0 0 0.1 0 0.1 0.1 0 0.1 SULPHUR CONTAINING COMPOUNDS 5-chloro-2-methyl-3(2H)-isotiatsolon 0 0 0 0 0 0 0.3 0.5 0.4 Total 16 5 10 15 17 16 85 80 82 TVOC 01) 01) 0 0 0.9 0 46 50 48 non-TVOC 11 0.5 6 5 6 5 13 8 10 1) Italic font indicates that the value is below the detection limit.

APPENDIX C 264
Table C77. Background emission values of primer and paint A spread onto filler and plaster B applied onto calcium silicate brick in the environmental chamber test.
(µg/m³) RH 20 % RH 50 % RH 80 % AROMATIC HYDROCARBONS p,m-xylene 0 2 0 toluene 0 2 0 MONATOMIC ALCOHOLS 2-ethyl-1-hexanol 0 2 0 ALCOHOL AND PHENOL ETHERS 2-(2-butoxyethoxy)ethanol 0 0 23 ALDEHYDES nonanal 0 2 0 decanal 0 2 0 ACIDS acetic acid 0 22 0 SILICON CONTAINING COMPOUNDS organic Si-comp. 0 3 0 TVOC 8 21 29

APPENDIX C 265
Table C78. Emission values of primer and paint A spread onto filler and plaster B applied onto calcium silicate brick at 1 day in the environmental chamber test. (µg/m²·h) RH 20 % RH 50 % RH 80 % ALIPH. AND ALICYCLIC COMPOUNDS 1-dodecene 91 100 95 - - - 105 105 105 nonane 0 0 0 - - - 8 9 8 decane 0 0 0 - - - 2 0 1 pentadecane 4 0 2 - - - 11 0 5 hexadecane 5 0 2 - - - 0 0 0 AROMATIC HYDROCARBONS ethylbenzene 10 10 10 - - - 8 8 8 propylbenzene 3 3 3 - - - 2 2 2 isopropylbenzene 8 8 8 - - - 7 7 7 p,m-xylene 7 7 7 - - - 7 7 7 o-xylene 4 4 4 - - - 4 4 4 styrene 23 24 23 - - - 21 20 20 toluene 2 2 2 - - - 2 0 1 MONATOMIC ALCOHOLS 2-propanol 11 11 11 - - - 11 11 11 1-butanol 36 36 36 - - - 31 29 30 2-ethyl-1-hexanol 196 200 198 - - - 264 268 266 benzyl alcohol 0 0 0 - - - 6 0 3 DIVALENT ALCOHOLS 1,2-propanediol 2309 2405 2357 - - - 1732 1768 1750 ETHERS butyl ether 50 50 50 - - - 55 55 55 PHENOLS phenol 0 0 0 - - - 16 7 12 ALCOHOL AND PHENOL ETHERS 2-(2-ethoxyethoxy)ethanol 155 159 157 - - - 114 118 116 2-(2-butoxyethoxy)ethanol 277 286 282 - - - 262 271 267 1-methoxy-2-propanol 0 5 2 - - - 0 0 0 2-butoxyethanol 2 2 2 - - - 1 2 2 ALDEHYDES benzaldehyde 18 21 20 - - - 36 22 29 nonanal 8 7 8 - - - 10 9 10 KETONES acetophenone 8 4 6 - - - 3 4 3 acetone 36 31 33 - - - 35 32 33 ESTERS AND LACTONES 2-(2-butoxyethoxy)ethyl acetate 3 4 3 - - - 5 5 5 texanol 1632 1632 1632 - - - 1909 1909 1909 TXIB 2 2 2 - - - 2 2 2 2-ethylhexyl acetate 23 21 22 - - - 22 23 23 2-ethylhexyl acrylate 6 6 6 - - - 5 5 5 butyl propanoate 8 6 7 - - - 11 10 10 NITROGEN CONTAINING COMPOUNDS 4,4-dimethyl-1,3-oxazolidine 573 582 577 - - - 1146 1159 1152 dimethyl perhydro-1,3-oxazine 68 73 70 - - - 164 168 166 SILICON CONTAINING COMPOUNDS organic Si-comp. 68 132 100 - - - 77 50 64 Total 5645 5832 5738 - - - 6091 6089 6090 TVOC 3678 3815 3746 - - - 4851 4805 4828 non-TVOC 46 42 44 - - - 46 43 45
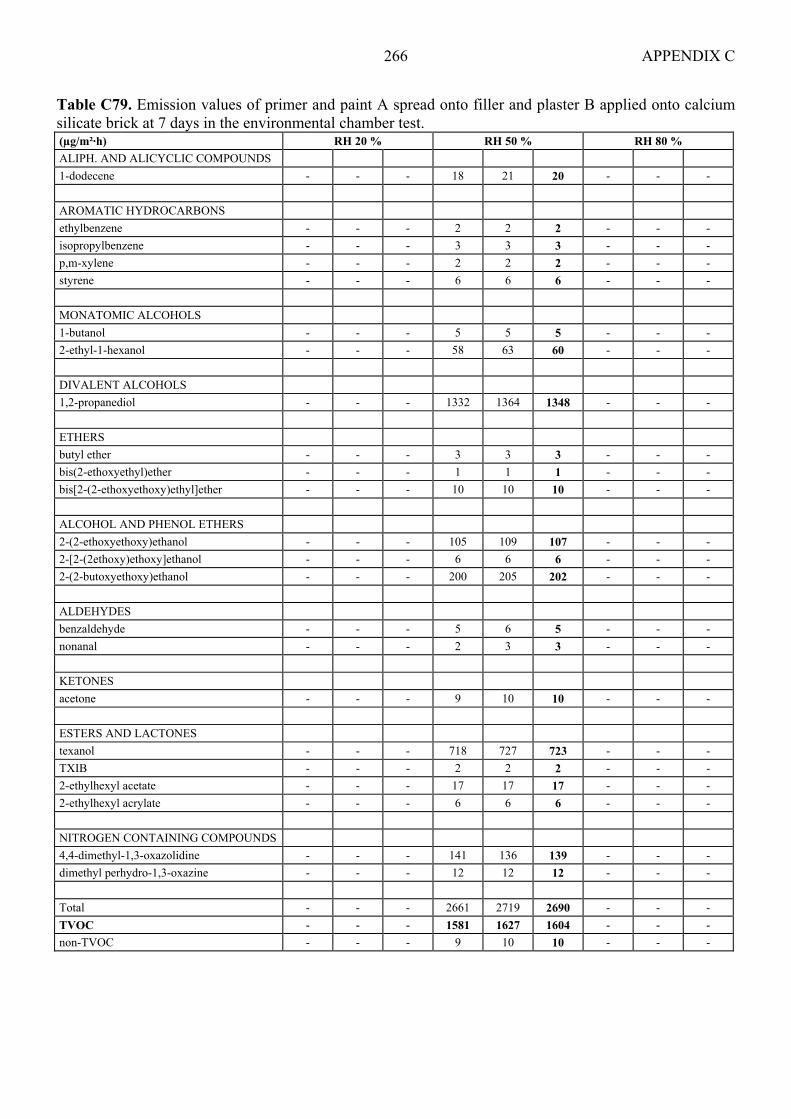
APPENDIX C 266
Table C79. Emission values of primer and paint A spread onto filler and plaster B applied onto calcium silicate brick at 7 days in the environmental chamber test. (µg/m²·h) RH 20 % RH 50 % RH 80 % ALIPH. AND ALICYCLIC COMPOUNDS 1-dodecene - - - 18 21 20 - - - AROMATIC HYDROCARBONS ethylbenzene - - - 2 2 2 - - - isopropylbenzene - - - 3 3 3 - - - p,m-xylene - - - 2 2 2 - - - styrene - - - 6 6 6 - - - MONATOMIC ALCOHOLS 1-butanol - - - 5 5 5 - - - 2-ethyl-1-hexanol - - - 58 63 60 - - - DIVALENT ALCOHOLS 1,2-propanediol - - - 1332 1364 1348 - - - ETHERS butyl ether - - - 3 3 3 - - - bis(2-ethoxyethyl)ether - - - 1 1 1 - - - bis[2-(2-ethoxyethoxy)ethyl]ether - - - 10 10 10 - - - ALCOHOL AND PHENOL ETHERS 2-(2-ethoxyethoxy)ethanol - - - 105 109 107 - - - 2-[2-(2ethoxy)ethoxy]ethanol - - - 6 6 6 - - - 2-(2-butoxyethoxy)ethanol - - - 200 205 202 - - - ALDEHYDES benzaldehyde - - - 5 6 5 - - - nonanal - - - 2 3 3 - - - KETONES acetone - - - 9 10 10 - - - ESTERS AND LACTONES texanol - - - 718 727 723 - - - TXIB - - - 2 2 2 - - - 2-ethylhexyl acetate - - - 17 17 17 - - - 2-ethylhexyl acrylate - - - 6 6 6 - - - NITROGEN CONTAINING COMPOUNDS 4,4-dimethyl-1,3-oxazolidine - - - 141 136 139 - - - dimethyl perhydro-1,3-oxazine - - - 12 12 12 - - - Total - - - 2661 2719 2690 - - - TVOC - - - 1581 1627 1604 - - - non-TVOC - - - 9 10 10 - - -

APPENDIX C 267
Table C80. Emission values of primer and paint A spread onto filler and plaster B applied onto calcium silicate brick at 14 days in the environmental chamber test. (µg/m²·h) RH 20 % RH 50 % RH 80 % ALIPH. AND ALICYCLIC COMPOUNDS 1-dodecene 7 8 8 - - - 9 10 9 AROMATIC HYDROCARBONS styrene 2 2 2 - - - 0 0 0 MONATOMIC ALCOHOLS 1-butanol 3 3 3 - - - 6 6 6 2-ethyl-1-hexanol 32 33 33 - - - 55 55 55 DIVALENT ALCOHOLS 1,2-propanediol 373 377 375 - - - 509 518 514 ETHERS butyl ether 1 1 1 - - - 2 2 2 bis(2-ethoxyethyl)ether 0.2 0.3 0.3 - - - 0.2 0.1 0.2 bis[2-(2-ethoxyethoxy)ethyl]ether 6 6 6 - - - 9 9 9 ALCOHOL AND PHENOL ETHERS 2-(2-ethoxyethoxy)ethanol 22 23 23 - - - 34 36 35 2-[2-(2ethoxy)ethoxy]ethanol 4 4 4 - - - 5 6 5 2-(2-butoxyethoxy)ethanol 82 86 84 - - - 103 103 103 ALDEHYDES benzaldehyde 0 0 0 - - - 3 3 3 KETONES acetone 0 0 0 - - - 5 4 4
ESTERS AND LACTONES texanol 282 286 284 - - - 459 459 459 TXIB 0 0 0 - - - 3 3 3 2-ethylhexyl acetate 8 9 8 - - - 12 13 13 2-ethylhexyl acrylate 4 4 4 - - - 6 6 6 2-ethyl-1-hexyl propionate 5 5 5 - - - 5 5 5
NITROGEN CONTAINING COMPOUNDS 4,4-dimethyl-1,3-oxazolidine 33 34 33 - - - 232 241 236 dimethyl perhydro-1,3-oxazine 3 3 3 - - - 24 25 24 SILICON CONTAINING COMPOUNDS organic Si-comp. 0 0 0 - - - 5 4 4
Total 868 885 876 - - - 1483 1504 1494 TVOC 528 546 537 - - - 1132 1155 1144 non-TVOC 0 0 0 - - - 5 4 4

APPENDIX C 268
Table C81. Background emission values of primer and paint A spread onto plaster C applied onto calcium silicate brick in the environmental chamber test.
(µg/m³) RH 20 % RH 50 % RH 80 % AROMATIC HYDROCARBONS p,m-xylene 0 4 0 ALCOHOL AND PHENOL ETHERS 2-(2-butoxyethoxy)ethanol 0 0 6 TVOC 20 27 38
Table C82. Emission values of primer and paint A spread onto plaster C applied onto calcium silicate brick at 1 day in the environmental chamber test. (µg/m²·h) RH 20 % RH 50 % RH 80 % ALIPH. AND ALICYCLIC COMPOUNDS 1-dodecene 91 96 93 96 182 139 - - - decane 0 1 1 1 2 2 - - - dodecane 0.9 0.9 0.9 0 0.9 0.5 - - - AROMATIC HYDROCARBONS ethylbenzene 5 5 5 6 6 6 - - - propylbenzene 1 1 1 1 1 1 - - - isopropylbenzene 4 4 4 4 4 4 - - - p,m-xylene 7 8 8 6 6 6 - - - o-xylene 4 4 4 4 4 4 - - - styrene 21 21 21 23 23 23 - - - toluene 0.9 0.5 0.7 0.9 0.9 0.9 - - - 1,2,4-trimethylbenzene 0.9 0.9 0.9 0.9 0.9 0.9 - - - MONATOMIC ALCOHOLS 2-propanol 2 2 2 3 3 3 - - - 1-butanol 8 8 8 16 16 16 - - - 2-ethyl-1-hexanol 1 0.9 1 3 6 4 - - - benzyl alcohol 0 0 0 2 0 1 - - - DIVALENT ALCOHOLS 1,2-propanediol 2741 2773 2757 2418 2486 2452 - - - ETHERS butyl ether 50 50 50 50 55 52 - - - ALCOHOL AND PHENOL ETHERS 2-(2-ethoxyethoxy)ethanol 4 4 4 3 3 3 - - - 2-(2-butoxyethoxy)ethanol 6 6 6 6 8 7 - - - 2-butoxyethanol 0 15 8 0 0 0 - - - 2-(2-butoxy-isopropoxy)-2-propanol, isomers 46 50 48 55 55 55 - - - ALDEHYDES benzaldehyde 2 8 5 11 6 8 - - - hexanal 0 0 0 3 0 1 - - - heptanal 0 0 0 0 2 1 - - - nonanal 0 0 0 2 2 2 - - - decanal 0 0 0 0 2 1 - - - KETONES acetophenone 2 2 2 1 1 1 - - - acetone 11 7 9 18 15 16 - - - ESTERS AND LACTONES texanol 1055 1082 1068 1350 1364 1357 - - - TXIB 0 0 0 2 2 2 - - - butyl propanoate 6 6 6 6 6 6 - - - NITROGEN CONTAINING COMPOUNDS 1-methyl-2-pyrrolidinone 13 12 12 14 13 13 - - - SILICON CONTAINING COMPOUNDS decamethylcyclopentasiloxane 0 0.5 0.3 0 0 0 - - - Total 4081 4166 4124 4103 4273 4188 - - - TVOC 2582 2659 2620 3051 3183 3117 - - - non-TVOC 13 9 11 21 17 19 - - -
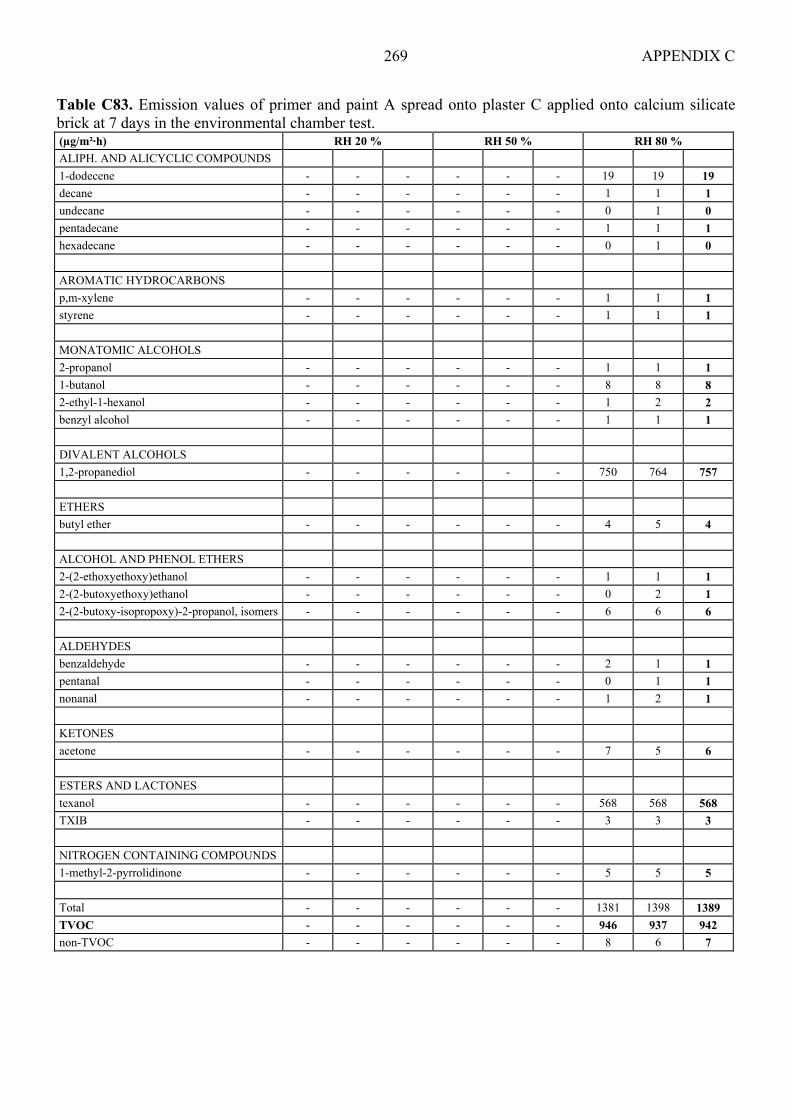
APPENDIX C 269
Table C83. Emission values of primer and paint A spread onto plaster C applied onto calcium silicate brick at 7 days in the environmental chamber test. (µg/m²·h) RH 20 % RH 50 % RH 80 % ALIPH. AND ALICYCLIC COMPOUNDS 1-dodecene - - - - - - 19 19 19 decane - - - - - - 1 1 1 undecane - - - - - - 0 1 0 pentadecane - - - - - - 1 1 1 hexadecane - - - - - - 0 1 0 AROMATIC HYDROCARBONS p,m-xylene - - - - - - 1 1 1 styrene - - - - - - 1 1 1 MONATOMIC ALCOHOLS 2-propanol - - - - - - 1 1 1 1-butanol - - - - - - 8 8 8 2-ethyl-1-hexanol - - - - - - 1 2 2 benzyl alcohol - - - - - - 1 1 1 DIVALENT ALCOHOLS 1,2-propanediol - - - - - - 750 764 757 ETHERS butyl ether - - - - - - 4 5 4 ALCOHOL AND PHENOL ETHERS 2-(2-ethoxyethoxy)ethanol - - - - - - 1 1 1 2-(2-butoxyethoxy)ethanol - - - - - - 0 2 1 2-(2-butoxy-isopropoxy)-2-propanol, isomers - - - - - - 6 6 6 ALDEHYDES benzaldehyde - - - - - - 2 1 1 pentanal - - - - - - 0 1 1 nonanal - - - - - - 1 2 1 KETONES acetone - - - - - - 7 5 6 ESTERS AND LACTONES texanol - - - - - - 568 568 568 TXIB - - - - - - 3 3 3 NITROGEN CONTAINING COMPOUNDS 1-methyl-2-pyrrolidinone - - - - - - 5 5 5 Total - - - - - - 1381 1398 1389 TVOC - - - - - - 946 937 942 non-TVOC - - - - - - 8 6 7

APPENDIX C 270
Table C84. Emission values of primer and paint A spread onto plaster C applied onto calcium silicate brick at 14 days in the environmental chamber test. (µg/m²·h) RH 20 % RH 50 % RH 80 % ALIPH. AND ALICYCLIC COMPOUNDS 1-dodecene 7 7 7 - - - 11 11 11 1-octene 0 0.5 0.3 - - - 0 0 0 hexadecane 0.5 0.5 0.5 - - - 0 0 0 AROMATIC HYDROCARBONS p,m-xylene 0.5 0.5 0.5 - - - 0.9 0.5 0.7 toluene 0.5 0.5 0.5 - - - 0.5 0.5 0.5 MONATOMIC ALCOHOLS 2-propanol 0 0 0 - - - 0.5 0 0.3 1-butanol 2 2 2 - - - 6 6 6 2-ethyl-1-hexanol 0 0.5 0.3 - - - 0.5 0.5 0.5 benzyl alcohol 0.5 0 0.3 - - - 1 1 1 DIVALENT ALCOHOLS 1,2-propanediol 146 141 143 - - - 259 259 259 2,2,4-trimethyl-1,3-pentanediol 2 3 3 - - - 0.9 0.9 0.9 ETHERS butyl ether 0.9 0.9 0.9 - - - 2 3 3 ALCOHOL AND PHENOL ETHERS 2-(2-butoxyethoxy)ethanol 3 3 3 - - - 0 0.5 0.3 2-(2-butoxy-isopropoxy)-2-propanol, isomers 4 4 4 - - - 0 0 0 ALDEHYDES benzaldehyde 0.5 0.5 0.5 - - - 1 2 2 hexanal 0 0 0 - - - 1 1 1 octanal 0 0 0 - - - 1 0 1 nonanal 0.5 0 0.3 - - - 3 0.5 2 decanal 0.9 0.5 0.7 - - - 2 0 1 KETONES acetophenone 0 0.5 0 - - - 0 0 0 acetone 0.9 1 1 - - - 2 2 2 ESTERS AND LACTONES texanol 300 305 302 - - - 236 241 239 TXIB 3 3 3 - - - 3 3 3 NITROGEN CONTAINING COMPOUNDS 1-methyl-2-pyrrolidinone 0.9 0.9 0.9 - - - 2 2 2 4,4-dimethyl-1,3-oxazolidine 0 0 0 - - - 3 3 3 Total 473 474 473 - - - 538 538 538 TVOC 446 459 452 - - - 378 387 383 non-TVOC 0.9 1 1 - - - 3 2 3
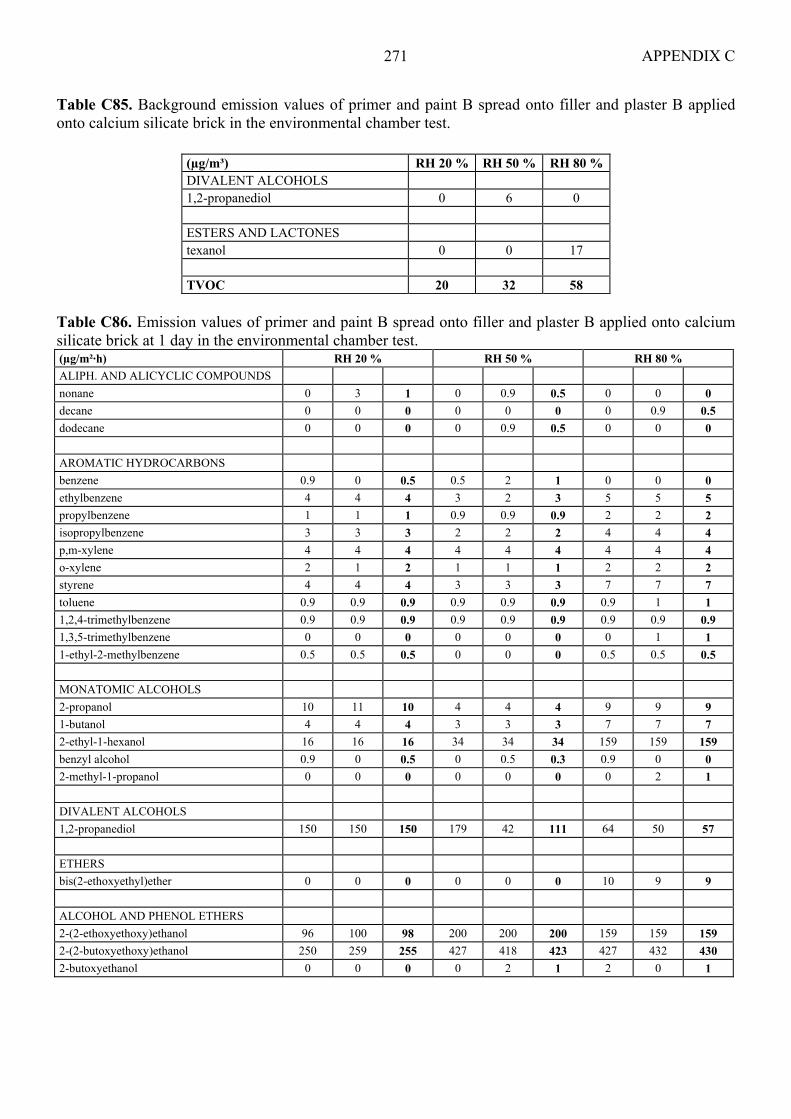
APPENDIX C 271
Table C85. Background emission values of primer and paint B spread onto filler and plaster B applied onto calcium silicate brick in the environmental chamber test.
(µg/m³) RH 20 % RH 50 % RH 80 % DIVALENT ALCOHOLS 1,2-propanediol 0 6 0 ESTERS AND LACTONES texanol 0 0 17 TVOC 20 32 58
Table C86. Emission values of primer and paint B spread onto filler and plaster B applied onto calcium silicate brick at 1 day in the environmental chamber test. (µg/m²·h) RH 20 % RH 50 % RH 80 % ALIPH. AND ALICYCLIC COMPOUNDS nonane 0 3 1 0 0.9 0.5 0 0 0 decane 0 0 0 0 0 0 0 0.9 0.5 dodecane 0 0 0 0 0.9 0.5 0 0 0 AROMATIC HYDROCARBONS benzene 0.9 0 0.5 0.5 2 1 0 0 0 ethylbenzene 4 4 4 3 2 3 5 5 5 propylbenzene 1 1 1 0.9 0.9 0.9 2 2 2 isopropylbenzene 3 3 3 2 2 2 4 4 4 p,m-xylene 4 4 4 4 4 4 4 4 4 o-xylene 2 1 2 1 1 1 2 2 2 styrene 4 4 4 3 3 3 7 7 7 toluene 0.9 0.9 0.9 0.9 0.9 0.9 0.9 1 1 1,2,4-trimethylbenzene 0.9 0.9 0.9 0.9 0.9 0.9 0.9 0.9 0.9 1,3,5-trimethylbenzene 0 0 0 0 0 0 0 1 1 1-ethyl-2-methylbenzene 0.5 0.5 0.5 0 0 0 0.5 0.5 0.5 MONATOMIC ALCOHOLS 2-propanol 10 11 10 4 4 4 9 9 9 1-butanol 4 4 4 3 3 3 7 7 7 2-ethyl-1-hexanol 16 16 16 34 34 34 159 159 159 benzyl alcohol 0.9 0 0.5 0 0.5 0.3 0.9 0 0 2-methyl-1-propanol 0 0 0 0 0 0 0 2 1 DIVALENT ALCOHOLS 1,2-propanediol 150 150 150 179 42 111 64 50 57 ETHERS bis(2-ethoxyethyl)ether 0 0 0 0 0 0 10 9 9 ALCOHOL AND PHENOL ETHERS 2-(2-ethoxyethoxy)ethanol 96 100 98 200 200 200 159 159 159 2-(2-butoxyethoxy)ethanol 250 259 255 427 418 423 427 432 430 2-butoxyethanol 0 0 0 0 2 1 2 0 1

APPENDIX C 272
Table C86. Emission values of primer and paint B spread onto filler and plaster B applied onto calcium silicate brick at 1 day in the environmental chamber test. Table continues (µg/m²·h) RH 20 % RH 50 % RH 80 % ALDEHYDES benzaldehyde 6 2 4 5 5 5 10 6 8 pentanal 0 2 1 0 0 0 0 0 0 octanal 0 2 1 0 0 0 0 0 0 nonanal 0 7 3 0 0 0 0 0 0 decanal 0 0.5 0.3 0 0 0 0 0 0 KETONES acetophenone 0.5 2 1 0.9 2 1 1 1 1 acetone 17 21 19 13 55 34 27 24 25 4-methyl-2-pentanone 0 0 0 0 0 0 0 15 8 ACIDS acetic acid 168 205 186 132 0 66 0 0 0 TERPENES AND THEIR DERIVATIVES limonene 0 0 0 0 0 0 4 4 4 ESTERS AND LACTONES texanol 23 8 15 20 16 18 0.9 0.9 0.9 2-ethylhexyl acetate 5 6 6 5 5 5 16 16 16 2-ethylhexyl acrylate 2 1 2 1 1 1 3 4 3 NITROGEN CONTAINING COMPOUNDS 1-methyl-2-pyrrolidinone 13 13 13 13 14 13 3 4 3 2-amino-2-methyl-1-propanol 0 0 0 0 0 0 9 9 9 4,4-dimethyl-1,3-oxazolidine 64 64 64 127 43 85 823 814 818 dimethyl perhydro-1,3-oxazine 7 7 7 13 6 9 96 91 93 SILICON CONTAINING COMPOUNDS decamethylcyclopentasiloxane 0.5 0.5 0.5 0.5 0.5 0.5 0.9 1 1 Total 853 904 878 1193 869 1031 1857 1844 1850 TVOC 250 273 261 445 358 401 1310 1287 1299 non-TVOC 195 236 215 149 58 104 36 33 35

APPENDIX C 273
Table C87. Emission values of primer and paint B spread onto filler and plaster B applied onto calcium silicate brick at 7 days in the environmental chamber test. (µg/m²·h) RH 20 % RH 50 % RH 80 % ALIPH. AND ALICYCLIC COMPOUNDS nonane - - - - - - 1 1 1 decane - - - - - - 1 1 1 dodecane - - - - - - 1 1 1 AROMATIC HYDROCARBONS ethylbenzene - - - - - - 1 1 1 propylbenzene - - - - - - 1 1 1 isopropylbenzene - - - - - - 1 1 1 p,m-xylene - - - - - - 1 1 1 o-xylene - - - - - - 1 1 1 styrene - - - - - - 2 2 2 1,2,4-trimethylbenzene - - - - - - 1 0 0 MONATOMIC ALCOHOLS 2-propanol - - - - - - 1 1 1 1-butanol - - - - - - 4 5 4 2-ethyl-1-hexanol - - - - - - 68 68 68 benzyl alcohol - - - - - - 1 1 1 2-methyl-1-propanol - - - - - - 1 1 1 DIVALENT ALCOHOLS 1,2-propanediol - - - - - - 33 34 33 ALCOHOL AND PHENOL ETHERS 2-(2-ethoxyethoxy)ethanol - - - - - - 82 82 82 2-(2-butoxyethoxy)ethanol - - - - - - 255 259 257 2-butoxyethanol - - - - - - 0 1 0 ALDEHYDES benzaldehyde - - - - - - 5 5 5 octanal - - - - - - 2 0 1 nonanal - - - - - - 5 2 3 decanal - - - - - - 4 0 2 KETONES acetophenone - - - - - - 1 0 0 acetone - - - - - - 10 9 9 TERPENES AND THEIR DERIVATIVES limonene - - - - - - 1 2 2 ESTERS AND LACTONES 1-methoxy-2-propylacetate - - - - - - 1 0 0 texanol - - - - - - 27 28 28 2-ethylhexyl acetate - - - - - - 11 11 11 2-ethylhexyl acrylate - - - - - - 5 5 5 NITROGEN CONTAINING COMPOUNDS 1-methyl-2-pyrrolidinone - - - - - - 1 1 1 2-amino-2-methyl-1-propanol - - - - - - 6 6 6 4,4-dimethyl-1,3-oxazolidine - - - - - - 264 282 273 dimethyl perhydro-1,3-oxazine - - - - - - 26 28 27 Total - - - - - - 821 840 830 TVOC - - - - - - 728 569 649 non-TVOC - - - - - - 11 11 11

APPENDIX C 274
Table C88. Emission values of primer and paint B spread onto filler and plaster B applied onto calcium silicate brick at 14 days in the environmental chamber test. (µg/m²·h) RH 20 % RH 50 % RH 80 % ALIPH. AND ALICYCLIC COMPOUNDS undecane 0.2 0.2 0.2 - - - 0 0 0 dodecane 0 0 0 - - - 0 0.9 0.5 tetradecane 0.4 0 0.2 - - - 0 0 0 pentadecane 0.2 0.3 0.3 - - - 0 0 0 hexadecane 1 0.9 1 - - - 0.9 0.9 0.9 AROMATIC HYDROCARBONS ethylbenzene 0.3 0.4 0.4 - - - 0 0.5 0.3 propylbenzene 0.2 0.2 0.2 - - - 0 0 0 isopropylbenzene 0.4 0.4 0.4 - - - 0.5 0.5 0.5 p,m-xylene 0.9 0.9 0.9 - - - 0.9 0.9 0.9 o-xylene 0.4 0.4 0.4 - - - 0 0.5 0 styrene 0.5 0.5 0.5 - - - 0.5 0.5 0.5 toluene 0.5 0.5 0.5 - - - 0.5 0.5 0.5 1,2,4-trimethylbenzene 0.3 0.3 0.3 - - - 0 0 0 MONATOMIC ALCOHOLS 2-propanol 0.4 0 0.2 - - - 0.5 0.5 0.5 1-butanol 0.9 1 1 - - - 3 3 3 2-ethyl-1-hexanol 6 6 6 - - - 40 40 40 benzyl alcohol 0.5 0.5 0.5 - - - 1 1 1 2-methyl-1-propanol 0 0 0 - - - 0.9 0.9 0.9 DIVALENT ALCOHOLS 1,2-propanediol 8 9 8 - - - 20 19 19 ETHERS bis[2-(2-ethoxyethoxy)ethyl]ether 1 1 1 - - - 8 9 8 ALCOHOL AND PHENOL ETHERS 2-(2-ethoxyethoxy)ethanol 7 7 7 - - - 27 28 28 2-(2-butoxyethoxy)ethanol 44 46 45 - - - 114 114 114 2-butoxyethanol 0.3 0.3 0.3 - - - 0 0 0 ALDEHYDES benzaldehyde 1 2 2 - - - 3 3 3 pentanal 0 0 0 - - - 0 0.5 0.3 octanal 0 0 0 - - - 0.9 0 0.5 nonanal 0 0.4 0.2 - - - 0.9 0 0.5 decanal 0.4 0 0.2 - - - 0 0 0 KETONES acetophenone 0 0.2 0.1 - - - 0 0 0 acetone 0.9 0.9 0.9 - - - 4 3 3 ACIDS acetic acid 0 9 5 - - - 6 0 3 ESTERS AND LACTONES 2-(2-butoxyethoxy)ethylacetate 0 0 0 - - - 0 1 1 texanol 6 3 4 - - - 25 25 25 2-ethylhexyl acetate 1 0.9 1 - - - 6 6 6 2-ethylhexyl acrylate 0.5 0.5 0.5 - - - 4 4 4 NITROGEN CONTAINING COMPOUNDS 1-methyl-2-pyrrolidinone 0.9 0.9 0.9 - - - 0.9 0.5 0.7 2-amino-2-methyl-1-propanol 0 0 0 - - - 5 6 5 4,4-dimethyl-1,3-oxazolidine 5 6 5 - - - 159 159 159 dimethyl perhydro-1,3-oxazine 0 0 0 - - - 15 16 15 SILICON CONTAINING COMPOUNDS organic Si-comp. 0 0 0 - - - 4 6 5 Total 89 98 94 - - - 449 447 448 TVOC 25 26 25 - - - 324 324 324 non-TVOC 1 10 6 - - - 10 3 7

APPENDIX C 275
Table C89. Background emission values of primer and paint B spread onto plaster C applied onto calcium silicate brick in the environmental chamber test.
(µg/m³) RH 20 % RH 50 % RH 80 % ALCOHOL AND PHENOL ETHERS 2-(2-butoxyethoxy)ethanol 13 TVOC 6 16 25
Table C90. Emission values of primer and paint B spread onto plaster C applied onto calcium silicate brick at 1 day in the environmental chamber test. (µg/m²·h) RH 20 % RH 50 % RH 80 % ALIPH. AND ALICYCLIC COMPOUNDS nonane 0 0 0 - - - 1 1 1 dodecane 0 0 0 - - - 0.5 0 0.3 pentadecane 0 0 0 - - - 0.9 0 0.5 hexadecane 0 0 0 - - - 1 0.9 1 AROMATIC HYDROCARBONS benzene 0 0 0 - - - 0 0 0 ethylbenzene 1 1 1 - - - 2 2 2 p,m-xylene 3 3 3 - - - 5 6 5 o-xylene 0.9 0.9 0.9 - - - 2 2 2 styrene 0.9 0.9 0.9 - - - 0.9 0.9 0.9 toluene 0.3 0 0.2 - - - 0.9 1 1 1,2,4-trimethylbenzene 0 0 0 - - - 0.9 0.9 0.9 MONATOMIC ALCOHOLS 2-propanol 14 14 14 - - - 24 28 26 2-ethyl-1-hexanol 1 0.9 1 - - - 4 2 3 benzylalcohol 2 2 2 - - - 2 2 2 DIVALENT ALCOHOLS 1,2-propanediol 123 118 120 - - - 59 64 61 ALCOHOL AND PHENOL ETHERS 2-(2-ethoxyethoxy)ethanol 9 9 9 - - - 10 12 11 2-(2-butoxyethoxy)ethanol 100 96 98 - - - 135 140 137 2-phenoxyethanol 0 0 0 - - - 0 0.5 0.3 ALDEHYDES benzaldehyde 5 6 5 - - - 4 5 4 octanal 0 0 0 - - - 4 3 3 nonanal 0 3 2 - - - 9 6 8 decanal 0 0.5 0.3 - - - 11 5 8 KETONES acetophenone 0.2 0.9 0.6 - - - 0 2 1 acetone 6 5 5 - - - 9 11 10 NITROGEN CONTAINING COMPOUNDS 1-methyl-2-pyrrolidinone 24 23 23 - - - 0 0 0 SILICON CONTAINING COMPOUNDS organic Si-comp. 0 0 0 - - - 9 32 20 decamethylcyclopentasiloxane 0.4 0.4 0.4 - - - 0 0 0 Total 291 285 288 - - - 295 327 311 TVOC 56 56 56 - - - 102 107 105 non-TVOC 20 19 19 - - - 33 39 36
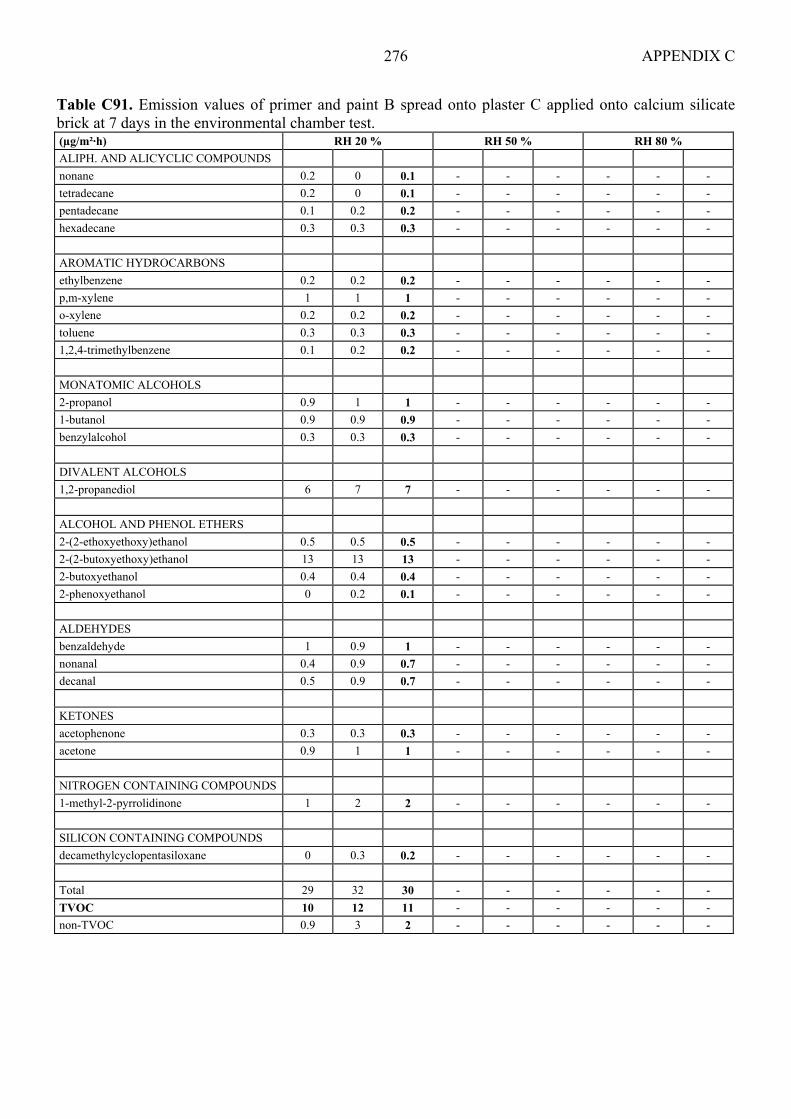
APPENDIX C 276
Table C91. Emission values of primer and paint B spread onto plaster C applied onto calcium silicate brick at 7 days in the environmental chamber test. (µg/m²·h) RH 20 % RH 50 % RH 80 % ALIPH. AND ALICYCLIC COMPOUNDS nonane 0.2 0 0.1 - - - - - - tetradecane 0.2 0 0.1 - - - - - - pentadecane 0.1 0.2 0.2 - - - - - - hexadecane 0.3 0.3 0.3 - - - - - - AROMATIC HYDROCARBONS ethylbenzene 0.2 0.2 0.2 - - - - - - p,m-xylene 1 1 1 - - - - - - o-xylene 0.2 0.2 0.2 - - - - - - toluene 0.3 0.3 0.3 - - - - - - 1,2,4-trimethylbenzene 0.1 0.2 0.2 - - - - - - MONATOMIC ALCOHOLS 2-propanol 0.9 1 1 - - - - - - 1-butanol 0.9 0.9 0.9 - - - - - - benzylalcohol 0.3 0.3 0.3 - - - - - - DIVALENT ALCOHOLS 1,2-propanediol 6 7 7 - - - - - - ALCOHOL AND PHENOL ETHERS 2-(2-ethoxyethoxy)ethanol 0.5 0.5 0.5 - - - - - - 2-(2-butoxyethoxy)ethanol 13 13 13 - - - - - - 2-butoxyethanol 0.4 0.4 0.4 - - - - - - 2-phenoxyethanol 0 0.2 0.1 - - - - - - ALDEHYDES benzaldehyde 1 0.9 1 - - - - - - nonanal 0.4 0.9 0.7 - - - - - - decanal 0.5 0.9 0.7 - - - - - - KETONES acetophenone 0.3 0.3 0.3 - - - - - - acetone 0.9 1 1 - - - - - - NITROGEN CONTAINING COMPOUNDS 1-methyl-2-pyrrolidinone 1 2 2 - - - - - - SILICON CONTAINING COMPOUNDS decamethylcyclopentasiloxane 0 0.3 0.2 - - - - - - Total 29 32 30 - - - - - - TVOC 10 12 11 - - - - - - non-TVOC 0.9 3 2 - - - - - -

APPENDIX C 277
Table C92. Emission values of primer and paint B spread onto plaster C applied onto calcium silicate brick at 14 days in the environmental chamber test. (µg/m²·h) RH 20 % RH 50 % RH 80 % ALIPH. AND ALICYCLIC COMPOUNDS nonane 0 0 0 0.5 0.5 0.5 0.9 0.9 0.9 decane 0.3 0.2 0.3 2 2 2 2 2 2 undecane 0.3 0.4 0.4 0.9 1 0.9 0.9 0.9 0.9 dodecane 0.1 0.1 0.1 0.4 0.5 0.5 0.4 0.4 0.4 tridecane 0 0 0 0.2 0 0.1 0 0 0 tetradecane 0 0.1 0.1 0.2 0 0.1 0.3 0.4 0.4 pentadecane 0 0.2 0.1 0 0 0 0 0 0 hexadecane 0 0.3 0.2 0 0 0 0 0 0 AROMATIC HYDROCARBONS benzene 0 0.1 0.1 0 0 0 0 0 0 ethylbenzene 0.1 0.1 0.1 0.3 0.3 0.3 0 0 0 p,m-xylene 0.4 0.4 0.4 0.9 0.9 0.9 0.9 0.9 0.9 o-xylene 0.1 0.1 0.1 0.4 0.4 0.4 0.4 0.4 0.4 toluene 0.3 0.4 0.4 0.9 0.9 0.9 0.9 0.9 0.9 1,2,4-trimethylbenzene 0.1 0.1 0.1 0.5 0.5 0.5 0.5 0.5 0.5 1,3,5-trimethylbenzene 0 0 0 0.4 0.4 0.4 0.4 0.4 0.4 MONATOMIC ALCOHOLS 2-propanol 0 0 0 0.9 0.9 0.9 1 1 1 1-butanol 0.4 0.4 0.4 0 0 0 0.9 0.9 0.9 2-ethyl-1-hexanol 0.4 0.2 0.3 0.5 0.5 0.5 1 0.5 0.5 benzylalcohol 0.3 0.2 0.3 0.5 0.5 0.5 1 1 1 DIVALENT ALCOHOLS 1,2-propanediol 1 2 2 3 0.9 2 10 10 10 ALCOHOL AND PHENOL ETHERS 2-(2-ethoxyethoxy)ethanol 0 0.2 0.1 0 0 0 0.9 0.9 1 2-(2-butoxyethoxy)ethanol 3 3 3 7 7 7 20 21 20 2-butoxyethanol 0.3 0.3 0.3 0 0 0 0 0 0 ALDEHYDES benzaldehyde 1 0.9 1 0.9 1 1 0.9 1 1 pentanal 0.3 0 0.2 0 0 0 0 0 0 octanal 0 0 0 1 0 1 0 0 0 nonanal 0.5 0.9 0.7 2 2 2 2 0.9 1 decanal 0.1 0.9 0.5 4 2 3 0.9 1 1 KETONES acetophenone 0 0.2 0.1 0 0 0 0 0 0 acetone 0.4 0.5 0.5 0.9 0.9 0.9 0.9 0.9 0.9 TERPENES AND THEIR DERIVATIVES limonene 0 0 0 0.9 0.9 0.9 0.9 0.9 0.9 NITROGEN CONTAINING COMPOUNDS 1-methyl-2-pyrrolidinone 0.5 0.5 0.5 0 0 0 0 0 0 SILICON CONTAINING COMPOUNDS decamethylcyclopentasiloxane 0 0 0 0 0 0 0.4 0.3 0.4 Total 11 13 12 29 25 27 47 49 48 TVOC 3 7 5 19 13 16 21 20 20 non-TVOC 0.4 0.5 0.5 2 2 2 2 2 2
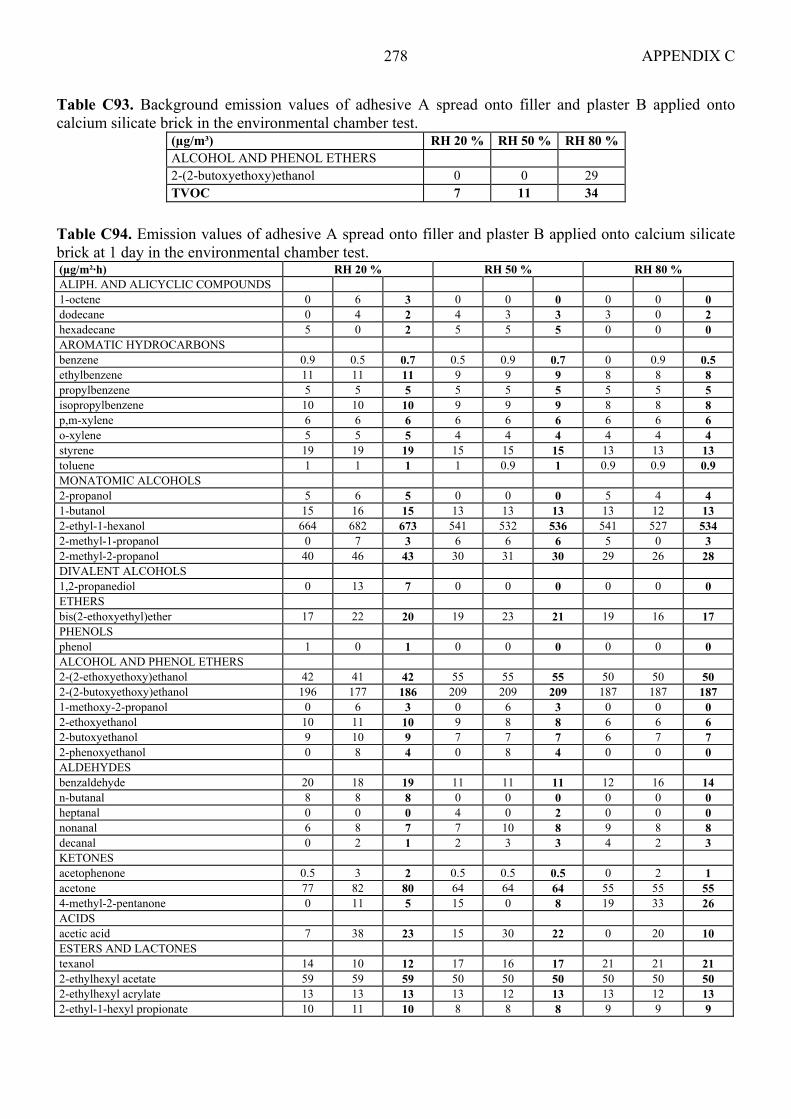
APPENDIX C 278
Table C93. Background emission values of adhesive A spread onto filler and plaster B applied onto calcium silicate brick in the environmental chamber test.
(µg/m³) RH 20 % RH 50 % RH 80 % ALCOHOL AND PHENOL ETHERS 2-(2-butoxyethoxy)ethanol 0 0 29 TVOC 7 11 34
Table C94. Emission values of adhesive A spread onto filler and plaster B applied onto calcium silicate brick at 1 day in the environmental chamber test. (µg/m²·h) RH 20 % RH 50 % RH 80 % ALIPH. AND ALICYCLIC COMPOUNDS 1-octene 0 6 3 0 0 0 0 0 0 dodecane 0 4 2 4 3 3 3 0 2 hexadecane 5 0 2 5 5 5 0 0 0 AROMATIC HYDROCARBONS benzene 0.9 0.5 0.7 0.5 0.9 0.7 0 0.9 0.5 ethylbenzene 11 11 11 9 9 9 8 8 8 propylbenzene 5 5 5 5 5 5 5 5 5 isopropylbenzene 10 10 10 9 9 9 8 8 8 p,m-xylene 6 6 6 6 6 6 6 6 6 o-xylene 5 5 5 4 4 4 4 4 4 styrene 19 19 19 15 15 15 13 13 13 toluene 1 1 1 1 0.9 1 0.9 0.9 0.9 MONATOMIC ALCOHOLS 2-propanol 5 6 5 0 0 0 5 4 4 1-butanol 15 16 15 13 13 13 13 12 13 2-ethyl-1-hexanol 664 682 673 541 532 536 541 527 534 2-methyl-1-propanol 0 7 3 6 6 6 5 0 3 2-methyl-2-propanol 40 46 43 30 31 30 29 26 28 DIVALENT ALCOHOLS 1,2-propanediol 0 13 7 0 0 0 0 0 0 ETHERS bis(2-ethoxyethyl)ether 17 22 20 19 23 21 19 16 17 PHENOLS phenol 1 0 1 0 0 0 0 0 0 ALCOHOL AND PHENOL ETHERS 2-(2-ethoxyethoxy)ethanol 42 41 42 55 55 55 50 50 50 2-(2-butoxyethoxy)ethanol 196 177 186 209 209 209 187 187 187 1-methoxy-2-propanol 0 6 3 0 6 3 0 0 0 2-ethoxyethanol 10 11 10 9 8 8 6 6 6 2-butoxyethanol 9 10 9 7 7 7 6 7 7 2-phenoxyethanol 0 8 4 0 8 4 0 0 0 ALDEHYDES benzaldehyde 20 18 19 11 11 11 12 16 14 n-butanal 8 8 8 0 0 0 0 0 0 heptanal 0 0 0 4 0 2 0 0 0 nonanal 6 8 7 7 10 8 9 8 8 decanal 0 2 1 2 3 3 4 2 3 KETONES acetophenone 0.5 3 2 0.5 0.5 0.5 0 2 1 acetone 77 82 80 64 64 64 55 55 55 4-methyl-2-pentanone 0 11 5 15 0 8 19 33 26 ACIDS acetic acid 7 38 23 15 30 22 0 20 10 ESTERS AND LACTONES texanol 14 10 12 17 16 17 21 21 21 2-ethylhexyl acetate 59 59 59 50 50 50 50 50 50 2-ethylhexyl acrylate 13 13 13 13 12 13 13 12 13 2-ethyl-1-hexyl propionate 10 11 10 8 8 8 9 9 9
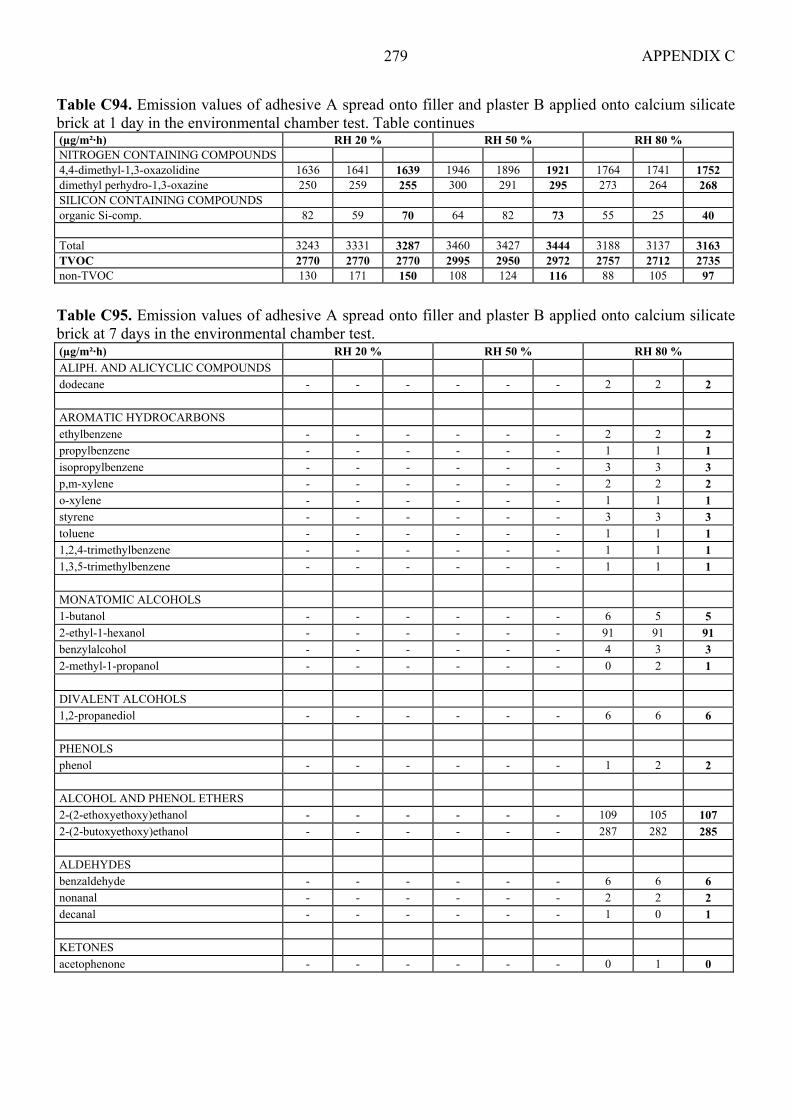
APPENDIX C 279
Table C94. Emission values of adhesive A spread onto filler and plaster B applied onto calcium silicate brick at 1 day in the environmental chamber test. Table continues (µg/m²·h) RH 20 % RH 50 % RH 80 % NITROGEN CONTAINING COMPOUNDS 4,4-dimethyl-1,3-oxazolidine 1636 1641 1639 1946 1896 1921 1764 1741 1752 dimethyl perhydro-1,3-oxazine 250 259 255 300 291 295 273 264 268 SILICON CONTAINING COMPOUNDS organic Si-comp. 82 59 70 64 82 73 55 25 40 Total 3243 3331 3287 3460 3427 3444 3188 3137 3163 TVOC 2770 2770 2770 2995 2950 2972 2757 2712 2735 non-TVOC 130 171 150 108 124 116 88 105 97 Table C95. Emission values of adhesive A spread onto filler and plaster B applied onto calcium silicate brick at 7 days in the environmental chamber test. (µg/m²·h) RH 20 % RH 50 % RH 80 % ALIPH. AND ALICYCLIC COMPOUNDS dodecane - - - - - - 2 2 2 AROMATIC HYDROCARBONS ethylbenzene - - - - - - 2 2 2 propylbenzene - - - - - - 1 1 1 isopropylbenzene - - - - - - 3 3 3 p,m-xylene - - - - - - 2 2 2 o-xylene - - - - - - 1 1 1 styrene - - - - - - 3 3 3 toluene - - - - - - 1 1 1 1,2,4-trimethylbenzene - - - - - - 1 1 1 1,3,5-trimethylbenzene - - - - - - 1 1 1 MONATOMIC ALCOHOLS 1-butanol - - - - - - 6 5 5 2-ethyl-1-hexanol - - - - - - 91 91 91 benzylalcohol - - - - - - 4 3 3 2-methyl-1-propanol - - - - - - 0 2 1 DIVALENT ALCOHOLS 1,2-propanediol - - - - - - 6 6 6 PHENOLS phenol - - - - - - 1 2 2 ALCOHOL AND PHENOL ETHERS 2-(2-ethoxyethoxy)ethanol - - - - - - 109 105 107 2-(2-butoxyethoxy)ethanol - - - - - - 287 282 285 ALDEHYDES benzaldehyde - - - - - - 6 6 6 nonanal - - - - - - 2 2 2 decanal - - - - - - 1 0 1 KETONES acetophenone - - - - - - 0 1 0
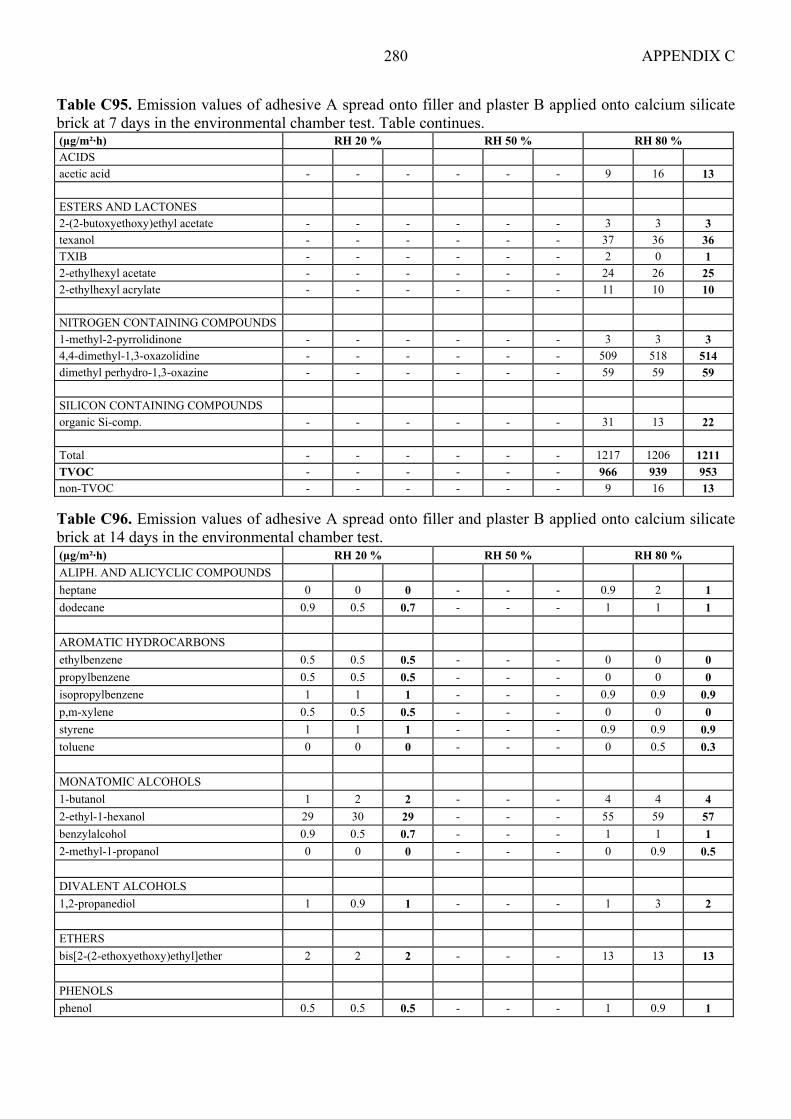
APPENDIX C 280
Table C95. Emission values of adhesive A spread onto filler and plaster B applied onto calcium silicate brick at 7 days in the environmental chamber test. Table continues. (µg/m²·h) RH 20 % RH 50 % RH 80 % ACIDS acetic acid - - - - - - 9 16 13 ESTERS AND LACTONES 2-(2-butoxyethoxy)ethyl acetate - - - - - - 3 3 3 texanol - - - - - - 37 36 36 TXIB - - - - - - 2 0 1 2-ethylhexyl acetate - - - - - - 24 26 25 2-ethylhexyl acrylate - - - - - - 11 10 10 NITROGEN CONTAINING COMPOUNDS 1-methyl-2-pyrrolidinone - - - - - - 3 3 3 4,4-dimethyl-1,3-oxazolidine - - - - - - 509 518 514 dimethyl perhydro-1,3-oxazine - - - - - - 59 59 59 SILICON CONTAINING COMPOUNDS organic Si-comp. - - - - - - 31 13 22 Total - - - - - - 1217 1206 1211 TVOC - - - - - - 966 939 953 non-TVOC - - - - - - 9 16 13 Table C96. Emission values of adhesive A spread onto filler and plaster B applied onto calcium silicate brick at 14 days in the environmental chamber test. (µg/m²·h) RH 20 % RH 50 % RH 80 % ALIPH. AND ALICYCLIC COMPOUNDS heptane 0 0 0 - - - 0.9 2 1 dodecane 0.9 0.5 0.7 - - - 1 1 1 AROMATIC HYDROCARBONS ethylbenzene 0.5 0.5 0.5 - - - 0 0 0 propylbenzene 0.5 0.5 0.5 - - - 0 0 0 isopropylbenzene 1 1 1 - - - 0.9 0.9 0.9 p,m-xylene 0.5 0.5 0.5 - - - 0 0 0 styrene 1 1 1 - - - 0.9 0.9 0.9 toluene 0 0 0 - - - 0 0.5 0.3 MONATOMIC ALCOHOLS 1-butanol 1 2 2 - - - 4 4 4 2-ethyl-1-hexanol 29 30 29 - - - 55 59 57 benzylalcohol 0.9 0.5 0.7 - - - 1 1 1 2-methyl-1-propanol 0 0 0 - - - 0 0.9 0.5 DIVALENT ALCOHOLS 1,2-propanediol 1 0.9 1 - - - 1 3 2 ETHERS bis[2-(2-ethoxyethoxy)ethyl]ether 2 2 2 - - - 13 13 13 PHENOLS phenol 0.5 0.5 0.5 - - - 1 0.9 1

APPENDIX C 281
Table C96. Emission values of adhesive A spread onto filler and plaster B applied onto calcium silicate brick at 14 days in the environmental chamber test. Table continues. (µg/m²·h) RH 20 % RH 50 % RH 80 % ALCOHOL AND PHENOL ETHERS 2-(2-ethoxyethoxy)ethanol 14 14 14 - - - 50 50 50 2-[2-(2ethoxy)ethoxy]ethanol 0.9 0.9 0.9 - - - 6 6 6 2-(2-butoxyethoxy)ethanol 35 34 34 - - - 146 151 148 ALDEHYDES benzaldehyde 1 2 2 - - - 3 3 3 pentanal 0 0 0 - - - 0 0.5 0.3 octanal 0.9 0.9 0.9 - - - 0.9 0.9 0.9 nonanal 1 2 2 - - - 1 0.9 1 decanal 1 3 2 - - - 1 0 1 KETONES acetophenone 0 0 0 - - - 1 0.5 1 acetone 1 1 1 - - - 4 3 4 ACIDS acetic acid 59 0 30 - - - 0 0 0 ESTERS AND LACTONES 2-(2-butoxyethoxy)ethyl acetate 0 0 0 - - - 1 1 1 texanol 3 3 3 - - - 44 45 45 2-ethylhexyl acetate 12 12 12 - - - 18 16 17 2-ethylhexyl acrylate 6 6 6 - - - 8 8 8 2-ethyl-1-hexyl propionate 5 5 5 - - - 6 6 6 NITROGEN CONTAINING COMPOUNDS 1-methyl-2-pyrrolidinone 0.5 0.5 0.5 - - - 0.9 0.9 0.9 4,4-dimethyl-1,3-oxazolidine 44 44 44 - - - 300 309 305 dimethyl perhydro-1,3-oxazine 6 6 6 - - - 30 31 30 SILICON CONTAINING COMPOUNDS organic Si-comp. 8 8 8 - - - 8 10 9 decamethylcyclopentasiloxane 0 0.9 0.5 - - - 0 0 0 Total 240 185 212 - - - 708 729 718 TVOC 129 133 131 - - - 576 589 582 non-TVOC 61 1 31 - - - 4 3 4
Table C97. Background emission values of adhesive A spread onto plaster C applied onto calcium silicate brick in the environmental chamber test.
(µg/m³) RH 20 % RH 50 % RH 80 % ALCOHOL AND PHENOL ETHERS 2-(2-butoxyethoxy)ethanol 0 7 0 SILICON CONTAINING COMPOUNDS hexamethylcyclotrisiloxane 20 0 0 TVOC 28 35 13

APPENDIX C 282
Table C98. Emission values of adhesive A spread onto plaster C applied onto calcium silicate brick at 1 day in the environmental chamber test. (µg/m²·h) RH 20 % RH 50 % RH 80 % ALIPH. AND ALICYCLIC COMPOUNDS 1-octene 0 0 0 - - - 3 0 2 nonane 0 0 0 - - - 0 2 1 decane 0 0 0 - - - 0 0.9 0.5 undecane 0 0 0 - - - 0.9 0 0.5 dodecane 0.9 0.9 0.9 - - - 0.9 0.9 0.9 tridecane 0.9 0.5 0.7 - - - 0.9 0.9 0.9 tetradecane 1 0.9 1 - - - 1 0.9 1 hexadecane 0.9 0.5 0.7 - - - 0 0 0 AROMATIC HYDROCARBONS benzene 0.5 0 0.3 - - - 0.9 1 1 ethylbenzene 0 0.5 0.3 - - - 0 0 0 p,m-xylene 1 1 1 - - - 1 1 1 o-xylene 0.5 0.5 0.5 - - - 0.5 0.5 0.5 toluene 0.9 1 1 - - - 0.9 0.9 0.9 1,2,4-trimethylbenzene 0.9 0.9 0.9 - - - 0.9 0.9 0.9 1,3,5-trimethylbenzene 0 0 0 - - - 0 0.5 0.3 MONATOMIC ALCOHOLS 2-propanol 8 8 8 - - - 15 15 15 1-butanol 2 2 2 - - - 3 3 3 2-ethyl-1-hexanol 0 0 0 - - - 3 0.9 2 benzyl alcohol 1 1 1 - - - 2 2 2 DIVALENT ALCOHOLS 1,2-propanediol 15 0 8 - - - 0 0 0 PHENOLS phenol 5 7 6 - - - 9 7 8 ALCOHOL AND PHENOL ETHERS 2-(2-ethoxyethoxy)ethanol 0 0 0 - - - 6 0 3 2-phenoxyethanol 0.9 0 0.5 - - - 1 1 1 ALDEHYDES benzaldehyde 5 5 5 - - - 8 7 8 n-butanal 0 0 0 - - - 0.9 5 3 pentanal 0 0 0 - - - 0 3 1 hexanal 0 0 0 - - - 3 0 2 heptanal 0 0 0 - - - 0 2 1 octanal 0 0 0 - - - 0 4 2 nonanal 3 2 3 - - - 3 10 7 decanal 5 4 4 - - - 4 14 9 KETONES acetophenone 0 0 0 - - - 0.9 0.9 0.9 acetone 13 14 13 - - - 19 20 19 4-methyl-2-pentanone 0 0 0 - - - 2 2 2

APPENDIX C 283
Table C98. Emission values of adhesive A spread onto plaster C applied onto calcium silicate brick at 1 day in the environmental chamber test. Table continues. (µg/m²·h) RH 20 % RH 50 % RH 80 % ACIDS acetic acid 0 0 0 - - - 0 50 25 ESTERS AND LACTONES propylbenzoate 2 2 2 - - - 6 6 6 SILICON CONTAINING COMPOUNDS organic Si-comp. 6 3 4 - - - 7 6 6 decamethylcyclopentasiloxane 0 0 0 - - - 2 0 1 Total 74 55 65 - - - 107 167 137 TVOC 51 46 49 - - - 71 117 94 non-TVOC 21 22 21 - - - 35 39 37
Table C99. Emission values of adhesive A spread onto plaster C applied onto calcium silicate brick at 7 days in the environmental chamber test. (µg/m²·h) RH 20 % RH 50 % RH 80 % ALIPH. AND ALICYCLIC COMPOUNDS heptane 4 4 4 - - - - - - methylcyclohexane 2 2 2 - - - - - - AROMATIC HYDROCARBONS benzene 0.1 0.3 0.2 - - - - - - p,m-xylene 1 1 1 - - - - - - toluene 2 2 2 - - - - - - MONATOMIC ALCOHOLS 2-propanol 0 2 1 - - - - - - 2-ethyl-1-hexanol 0 1 0 - - - - - - PHENOLS phenol 0 2 1 - - - - - - ALDEHYDES benzaldehyde 0 2 1 - - - - - - n-butanal 0 2 1 - - - - - - octanal 1 1 1 - - - - - - nonanal 2 2 2 - - - - - - decanal 4 4 4 - - - - - - KETONES acetophenone 0 1 0 - - - - - - acetone 4 5 4 - - - - - - ACIDS acetic acid 0 3 2 - - - - - - Total 20 34 27 TVOC 0 6 3 non-TVOC 6 10 8
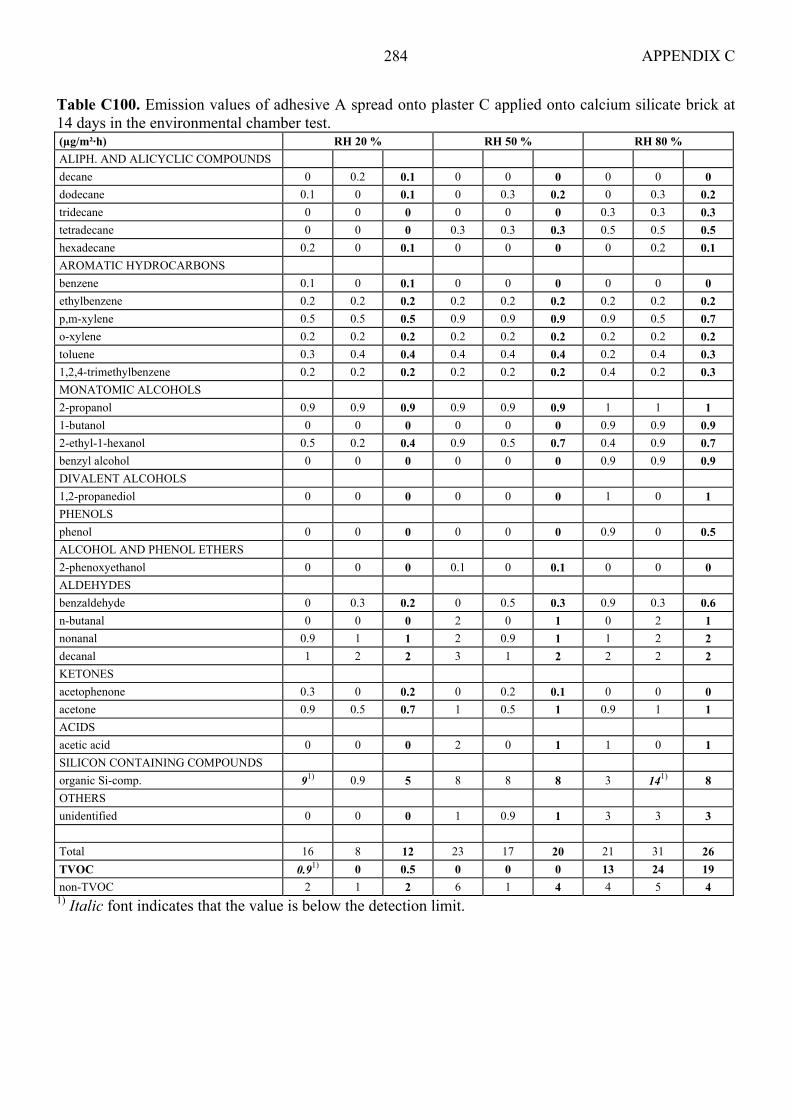
APPENDIX C 284
Table C100. Emission values of adhesive A spread onto plaster C applied onto calcium silicate brick at 14 days in the environmental chamber test. (µg/m²·h) RH 20 % RH 50 % RH 80 % ALIPH. AND ALICYCLIC COMPOUNDS decane 0 0.2 0.1 0 0 0 0 0 0 dodecane 0.1 0 0.1 0 0.3 0.2 0 0.3 0.2 tridecane 0 0 0 0 0 0 0.3 0.3 0.3 tetradecane 0 0 0 0.3 0.3 0.3 0.5 0.5 0.5 hexadecane 0.2 0 0.1 0 0 0 0 0.2 0.1 AROMATIC HYDROCARBONS benzene 0.1 0 0.1 0 0 0 0 0 0 ethylbenzene 0.2 0.2 0.2 0.2 0.2 0.2 0.2 0.2 0.2 p,m-xylene 0.5 0.5 0.5 0.9 0.9 0.9 0.9 0.5 0.7 o-xylene 0.2 0.2 0.2 0.2 0.2 0.2 0.2 0.2 0.2 toluene 0.3 0.4 0.4 0.4 0.4 0.4 0.2 0.4 0.3 1,2,4-trimethylbenzene 0.2 0.2 0.2 0.2 0.2 0.2 0.4 0.2 0.3 MONATOMIC ALCOHOLS 2-propanol 0.9 0.9 0.9 0.9 0.9 0.9 1 1 1 1-butanol 0 0 0 0 0 0 0.9 0.9 0.9 2-ethyl-1-hexanol 0.5 0.2 0.4 0.9 0.5 0.7 0.4 0.9 0.7 benzyl alcohol 0 0 0 0 0 0 0.9 0.9 0.9 DIVALENT ALCOHOLS 1,2-propanediol 0 0 0 0 0 0 1 0 1 PHENOLS phenol 0 0 0 0 0 0 0.9 0 0.5 ALCOHOL AND PHENOL ETHERS 2-phenoxyethanol 0 0 0 0.1 0 0.1 0 0 0 ALDEHYDES benzaldehyde 0 0.3 0.2 0 0.5 0.3 0.9 0.3 0.6 n-butanal 0 0 0 2 0 1 0 2 1 nonanal 0.9 1 1 2 0.9 1 1 2 2 decanal 1 2 2 3 1 2 2 2 2 KETONES acetophenone 0.3 0 0.2 0 0.2 0.1 0 0 0 acetone 0.9 0.5 0.7 1 0.5 1 0.9 1 1 ACIDS acetic acid 0 0 0 2 0 1 1 0 1 SILICON CONTAINING COMPOUNDS organic Si-comp. 91) 0.9 5 8 8 8 3 141) 8 OTHERS unidentified 0 0 0 1 0.9 1 3 3 3 Total 16 8 12 23 17 20 21 31 26 TVOC 0.91) 0 0.5 0 0 0 13 24 19 non-TVOC 2 1 2 6 1 4 4 5 4 1) Italic font indicates that the value is below the detection limit.

APPENDIX C 285
Table C101. Background emission values of adhesive B spread onto filler and plaster B applied onto calcium silicate brick in the environmental chamber test.
(µg/m³) RH 20 % RH 50 % RH 80 % ALCOHOL AND PHENOL ETHERS 2-(2-butoxyethoxy)ethanol 0 0 10 TERPENES AND THEIR DERIVATIVES Limonene 0 3 0 TVOC 12 25 24
Table C102. Emission values of adhesive B spread onto filler and plaster B applied onto calcium silicate brick at 1 day in the environmental chamber test. (µg/m²·h) RH 20 % RH 50 % RH 80 % ALIPH. AND ALICYCLIC COMPOUNDS 1-octene 0 5 2 - - - 2 0 1 dodecane 0 2 1 - - - 0 0 0 AROMATIC HYDROCARBONS benzene 0 0 0 - - - 3 2 3 ethylbenzene 5 5 5 - - - 1 8 5 propylbenzene 0 0 0 - - - 2 3 2 isopropylbenzene 5 5 5 - - - 5 7 6 p,m-xylene 2 2 2 - - - 2 4 3 o-xylene 0 0 0 - - - 2 3 2 styrene 9 9 9 - - - 10 16 13 toluene 0 0 0 - - - 0.9 3 2 1,2,4-trimethylbenzene 0 0 0 - - - 0 0.9 0.5 1,3,5-trimethylbenzene 0 0 0 - - - 0.9 2 1 1-ethyl-2-methylbenzene 0 0 0 - - - 0 0.9 0.5 MONATOMIC ALCOHOLS 2-propanol 11 12 11 - - - 11 19 15 1-butanol 10 10 10 - - - 10 19 14 2-ethyl-1-hexanol 346 373 359 - - - 477 727 602 benzyl alcohol 0 3 1 - - - 2 0 1 2-methyl-1-propanol 5 3 4 - - - 3 0 2 ETHERS bis(2-ethoxyethyl)ether 19 26 22 - - - 15 14 15 PHENOLS phenol 6 13 10 - - - 12 4 8 ALCOHOL AND PHENOL ETHERS 2-(2-ethoxyethoxy)ethanol 55 68 61 - - - 23 55 39 2-(2-butoxyethoxy)ethanol 2400 2559 2480 - - - 1705 1736 1720 1-methoxy-2-propanol 0 0 0 - - - 0 3 2 2-ethoxyethanol 7 8 8 - - - 5 6 5 2-butoxyethanol 9 10 10 - - - 8 20 14 2-phenoxyethanol 0 0 0 - - - 1 3 2 ALDEHYDES benzaldehyde 16 22 19 - - - 20 26 23 n-butanal 0 0 0 - - - 1 25 13 pentanal 0 0 0 - - - 0 6 3 hexanal 0 3 1 - - - 0 0 0 heptanal 0 2 1 - - - 0 0 0 octanal 0 4 2 - - - 0 0 0 nonanal 0 3 1 - - - 3 6 4 KETONES acetophenone 0 0 0 - - - 0.9 4 2 acetone 41 44 42 - - - 42 68 55

APPENDIX C 286
Table C102. Emission values of adhesive B spread onto filler and plaster B applied onto calcium silicate brick at 1 day in the environmental chamber test. Table continues. (µg/m²·h) RH 20 % RH 50 % RH 80 % ACIDS acetic acid 0 0 0 - - - 45 177 111 TERPENES AND THEIR DERIVATIVES limonene 8 10 9 - - - 12 21 16 ESTERS AND LACTONES 2-(2-butoxyethoxy)ethyl acetate 7 8 8 - - - 6 11 9 texanol 14 16 15 - - - 18 36 27 2-ethylhexyl acetate 50 50 50 - - - 59 59 59 2-ethylhexyl acrylate 10 11 10 - - - 10 18 14 2-ethyl-1-hexyl propionate 15 12 13 12 13 13 NITROGEN CONTAINING COMPOUNDS 1-methyl-2-pyrrolidinone 0 0 0 - - - 8 0 4 4,4-dimethyl-1,3-oxazolidine 2282 2436 2359 - - - 1718 1736 1727 4,4-dimethyl-2-oxazolidine 7 7 7 - - - 7 7 7 dimethyl perhydro-1,3-oxazine 332 350 341 - - - 26 255 140 SILICON CONTAINING COMPOUNDS hexamethylcyclotrisiloxane 0 0 0 - - - 55 0 27 decamethylcyclopentasiloxane 2 3 3 - - - 3 3 3 Total 5669 6091 5880 - - - 4346 5124 4735 TVOC 4904 5222 5063 - - - 3626 3626 3626 non-TVOC 52 56 54 - - - 100 112 106 Table C103. Emission values of adhesive B spread onto filler and plaster B applied onto calcium silicate brick at 7 days in the environmental chamber test. (µg/m²·h) RH 20 % RH 50 % RH 80 % ALIPH. AND ALICYCLIC COMPOUNDS heptane - - - 5 5 5 - - - dodecane - - - 2 2 2 - - - methylcyclohexane - - - 3 3 3 - - - AROMATIC HYDROCARBONS isopropylbenzene - - - 2 2 2 - - - styrene - - - 2 2 2 - - - toluene - - - 2 2 2 - - - MONATOMIC ALCOHOLS 2-propanol - - - 3 4 3 - - - 1-butanol - - - 3 4 3 - - - 2-ethyl-1-hexanol - - - 50 50 50 - - - DIVALENT ALCOHOLS 1,2-propanediol - - - 4 5 4 - - - ETHERS bis(2-ethoxyethyl)ether - - - 3 7 5 - - - PHENOLS phenol - - - 2 0 1 - - - ALCOHOL AND PHENOL ETHERS 2-(2-ethoxyethoxy)ethanol - - - 100 105 102 - - - 2-[2-(2ethoxy)ethoxy]ethanol - - - 8 9 8 - - - 2-(2-butoxyethoxy)ethanol - - - 1564 1646 1605 - - - ALDEHYDES benzaldehyde - - - 3 0 2 - - - n-butanal - - - 7 6 6 - - - nonanal - - - 2 0 1 - - - KETONES acetone - - - 9 11 10 - - - ACIDS acetic acid - - - 31 41 36 - - -
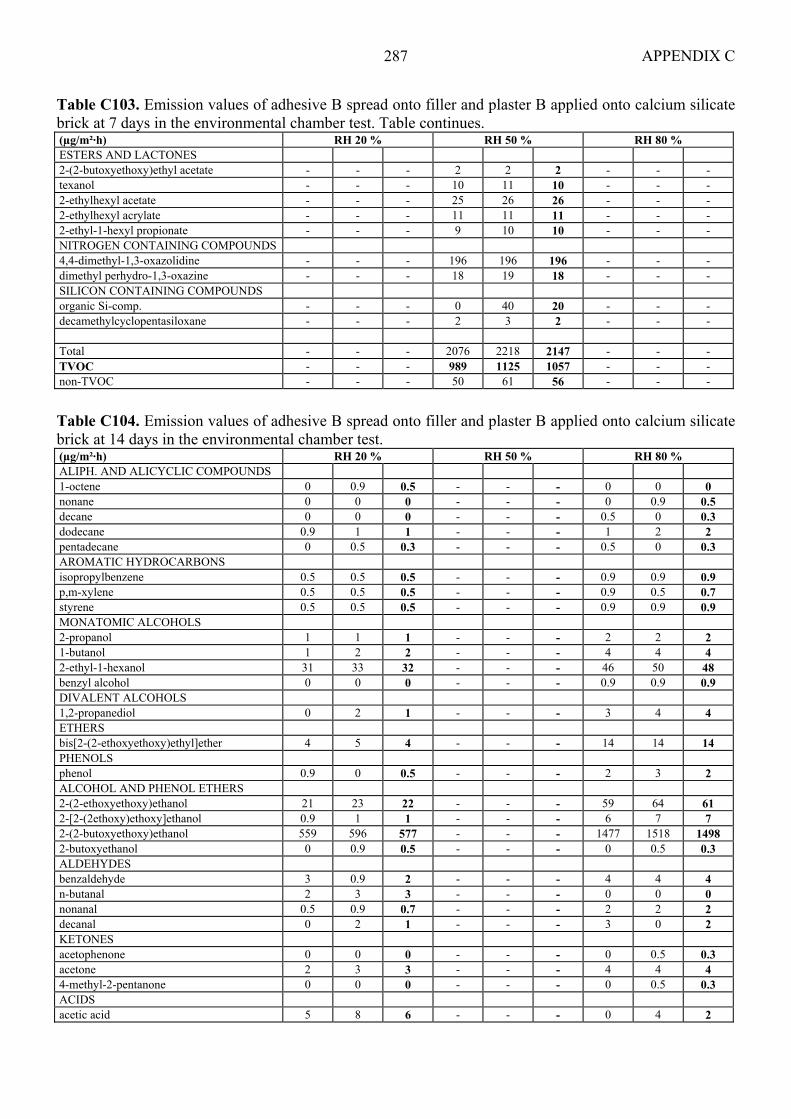
APPENDIX C 287
Table C103. Emission values of adhesive B spread onto filler and plaster B applied onto calcium silicate brick at 7 days in the environmental chamber test. Table continues. (µg/m²·h) RH 20 % RH 50 % RH 80 % ESTERS AND LACTONES 2-(2-butoxyethoxy)ethyl acetate - - - 2 2 2 - - - texanol - - - 10 11 10 - - - 2-ethylhexyl acetate - - - 25 26 26 - - - 2-ethylhexyl acrylate - - - 11 11 11 - - - 2-ethyl-1-hexyl propionate - - - 9 10 10 - - - NITROGEN CONTAINING COMPOUNDS 4,4-dimethyl-1,3-oxazolidine - - - 196 196 196 - - - dimethyl perhydro-1,3-oxazine - - - 18 19 18 - - - SILICON CONTAINING COMPOUNDS organic Si-comp. - - - 0 40 20 - - - decamethylcyclopentasiloxane - - - 2 3 2 - - - Total - - - 2076 2218 2147 - - - TVOC - - - 989 1125 1057 - - - non-TVOC - - - 50 61 56 - - - Table C104. Emission values of adhesive B spread onto filler and plaster B applied onto calcium silicate brick at 14 days in the environmental chamber test. (µg/m²·h) RH 20 % RH 50 % RH 80 % ALIPH. AND ALICYCLIC COMPOUNDS 1-octene 0 0.9 0.5 - - - 0 0 0 nonane 0 0 0 - - - 0 0.9 0.5 decane 0 0 0 - - - 0.5 0 0.3 dodecane 0.9 1 1 - - - 1 2 2 pentadecane 0 0.5 0.3 - - - 0.5 0 0.3 AROMATIC HYDROCARBONS isopropylbenzene 0.5 0.5 0.5 - - - 0.9 0.9 0.9 p,m-xylene 0.5 0.5 0.5 - - - 0.9 0.5 0.7 styrene 0.5 0.5 0.5 - - - 0.9 0.9 0.9 MONATOMIC ALCOHOLS 2-propanol 1 1 1 - - - 2 2 2 1-butanol 1 2 2 - - - 4 4 4 2-ethyl-1-hexanol 31 33 32 - - - 46 50 48 benzyl alcohol 0 0 0 - - - 0.9 0.9 0.9 DIVALENT ALCOHOLS 1,2-propanediol 0 2 1 - - - 3 4 4 ETHERS bis[2-(2-ethoxyethoxy)ethyl]ether 4 5 4 - - - 14 14 14 PHENOLS phenol 0.9 0 0.5 - - - 2 3 2 ALCOHOL AND PHENOL ETHERS 2-(2-ethoxyethoxy)ethanol 21 23 22 - - - 59 64 61 2-[2-(2ethoxy)ethoxy]ethanol 0.9 1 1 - - - 6 7 7 2-(2-butoxyethoxy)ethanol 559 596 577 - - - 1477 1518 1498 2-butoxyethanol 0 0.9 0.5 - - - 0 0.5 0.3 ALDEHYDES benzaldehyde 3 0.9 2 - - - 4 4 4 n-butanal 2 3 3 - - - 0 0 0 nonanal 0.5 0.9 0.7 - - - 2 2 2 decanal 0 2 1 - - - 3 0 2 KETONES acetophenone 0 0 0 - - - 0 0.5 0.3 acetone 2 3 3 - - - 4 4 4 4-methyl-2-pentanone 0 0 0 - - - 0 0.5 0.3 ACIDS acetic acid 5 8 6 - - - 0 4 2
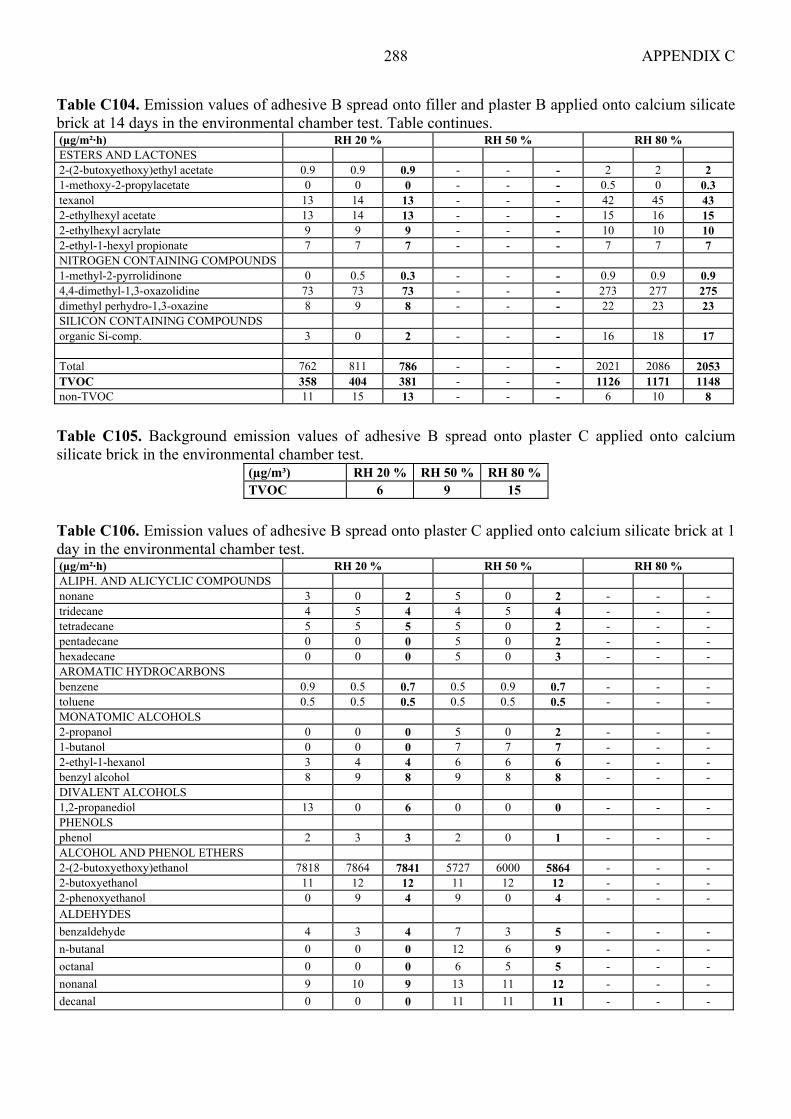
APPENDIX C 288
Table C104. Emission values of adhesive B spread onto filler and plaster B applied onto calcium silicate brick at 14 days in the environmental chamber test. Table continues. (µg/m²·h) RH 20 % RH 50 % RH 80 % ESTERS AND LACTONES 2-(2-butoxyethoxy)ethyl acetate 0.9 0.9 0.9 - - - 2 2 2 1-methoxy-2-propylacetate 0 0 0 - - - 0.5 0 0.3 texanol 13 14 13 - - - 42 45 43 2-ethylhexyl acetate 13 14 13 - - - 15 16 15 2-ethylhexyl acrylate 9 9 9 - - - 10 10 10 2-ethyl-1-hexyl propionate 7 7 7 - - - 7 7 7 NITROGEN CONTAINING COMPOUNDS 1-methyl-2-pyrrolidinone 0 0.5 0.3 - - - 0.9 0.9 0.9 4,4-dimethyl-1,3-oxazolidine 73 73 73 - - - 273 277 275 dimethyl perhydro-1,3-oxazine 8 9 8 - - - 22 23 23 SILICON CONTAINING COMPOUNDS organic Si-comp. 3 0 2 - - - 16 18 17 Total 762 811 786 - - - 2021 2086 2053 TVOC 358 404 381 - - - 1126 1171 1148 non-TVOC 11 15 13 - - - 6 10 8 Table C105. Background emission values of adhesive B spread onto plaster C applied onto calcium silicate brick in the environmental chamber test.
(µg/m³) RH 20 % RH 50 % RH 80 %TVOC 6 9 15
Table C106. Emission values of adhesive B spread onto plaster C applied onto calcium silicate brick at 1 day in the environmental chamber test. (µg/m²·h) RH 20 % RH 50 % RH 80 % ALIPH. AND ALICYCLIC COMPOUNDS nonane 3 0 2 5 0 2 - - - tridecane 4 5 4 4 5 4 - - - tetradecane 5 5 5 5 0 2 - - - pentadecane 0 0 0 5 0 2 - - - hexadecane 0 0 0 5 0 3 - - - AROMATIC HYDROCARBONS benzene 0.9 0.5 0.7 0.5 0.9 0.7 - - - toluene 0.5 0.5 0.5 0.5 0.5 0.5 - - - MONATOMIC ALCOHOLS 2-propanol 0 0 0 5 0 2 - - - 1-butanol 0 0 0 7 7 7 - - - 2-ethyl-1-hexanol 3 4 4 6 6 6 - - - benzyl alcohol 8 9 8 9 8 8 - - - DIVALENT ALCOHOLS 1,2-propanediol 13 0 6 0 0 0 - - - PHENOLS phenol 2 3 3 2 0 1 - - - ALCOHOL AND PHENOL ETHERS 2-(2-butoxyethoxy)ethanol 7818 7864 7841 5727 6000 5864 - - - 2-butoxyethanol 11 12 12 11 12 12 - - - 2-phenoxyethanol 0 9 4 9 0 4 - - - ALDEHYDES benzaldehyde 4 3 4 7 3 5 - - - n-butanal 0 0 0 12 6 9 - - - octanal 0 0 0 6 5 5 - - - nonanal 9 10 9 13 11 12 - - - decanal 0 0 0 11 11 11 - - -
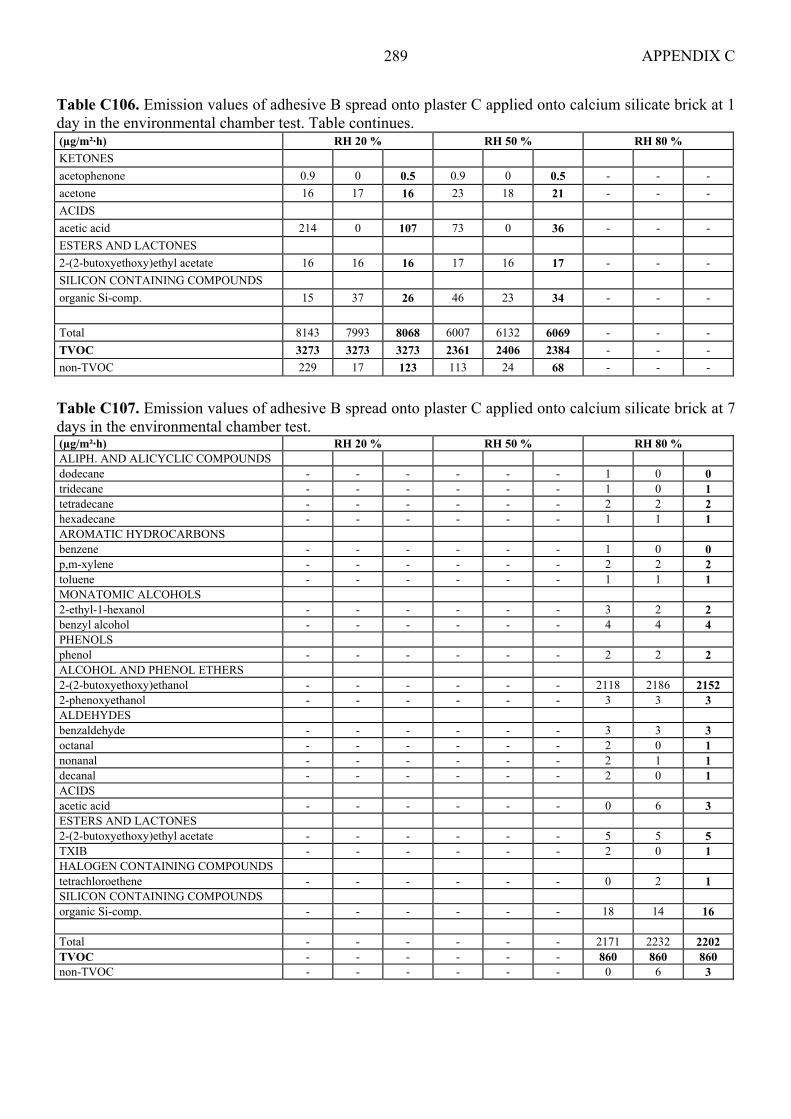
APPENDIX C 289
Table C106. Emission values of adhesive B spread onto plaster C applied onto calcium silicate brick at 1 day in the environmental chamber test. Table continues. (µg/m²·h) RH 20 % RH 50 % RH 80 % KETONES acetophenone 0.9 0 0.5 0.9 0 0.5 - - - acetone 16 17 16 23 18 21 - - - ACIDS acetic acid 214 0 107 73 0 36 - - - ESTERS AND LACTONES 2-(2-butoxyethoxy)ethyl acetate 16 16 16 17 16 17 - - - SILICON CONTAINING COMPOUNDS organic Si-comp. 15 37 26 46 23 34 - - - Total 8143 7993 8068 6007 6132 6069 - - - TVOC 3273 3273 3273 2361 2406 2384 - - - non-TVOC 229 17 123 113 24 68 - - -
Table C107. Emission values of adhesive B spread onto plaster C applied onto calcium silicate brick at 7 days in the environmental chamber test. (µg/m²·h) RH 20 % RH 50 % RH 80 % ALIPH. AND ALICYCLIC COMPOUNDS dodecane - - - - - - 1 0 0 tridecane - - - - - - 1 0 1 tetradecane - - - - - - 2 2 2 hexadecane - - - - - - 1 1 1 AROMATIC HYDROCARBONS benzene - - - - - - 1 0 0 p,m-xylene - - - - - - 2 2 2 toluene - - - - - - 1 1 1 MONATOMIC ALCOHOLS 2-ethyl-1-hexanol - - - - - - 3 2 2 benzyl alcohol - - - - - - 4 4 4 PHENOLS phenol - - - - - - 2 2 2 ALCOHOL AND PHENOL ETHERS 2-(2-butoxyethoxy)ethanol - - - - - - 2118 2186 2152 2-phenoxyethanol - - - - - - 3 3 3 ALDEHYDES benzaldehyde - - - - - - 3 3 3 octanal - - - - - - 2 0 1 nonanal - - - - - - 2 1 1 decanal - - - - - - 2 0 1 ACIDS acetic acid - - - - - - 0 6 3 ESTERS AND LACTONES 2-(2-butoxyethoxy)ethyl acetate - - - - - - 5 5 5 TXIB - - - - - - 2 0 1 HALOGEN CONTAINING COMPOUNDS tetrachloroethene - - - - - - 0 2 1 SILICON CONTAINING COMPOUNDS organic Si-comp. - - - - - - 18 14 16 Total - - - - - - 2171 2232 2202 TVOC - - - - - - 860 860 860 non-TVOC - - - - - - 0 6 3

APPENDIX C 290
Table C108. Emission values of adhesive B spread onto plaster C applied onto calcium silicate brick at 14 days in the environmental chamber test. (µg/m²·h) RH 20 % RH 50 % RH 80 % ALIPH. AND ALICYCLIC COMPOUNDS tetradecane 0 0 0 - - - 0.5 0.5 0.5 pentadecane 0.5 0.5 0.5 - - - 0 0.5 0.3 hexadecane 0 0.5 0.3 - - - 0 0 0 AROMATIC HYDROCARBONS p,m-xylene 0.3 0.3 0.3 - - - 0 0 0 toluene 0.4 0.4 0.4 - - - 0 0 0 MONATOMIC ALCOHOLS 1-butanol 0 0 0 - - - 1 1 1 2-ethyl-1-hexanol 0.9 0.4 0.7 - - - 0.9 0.9 0.9 benzyl alcohol 0 0 0 - - - 1 1 1 DIVALENT ALCOHOLS 1,2-propanediol 0 0 0 - - - 0.9 0 0.5 PHENOLS phenol 0.5 0 0.3 - - - 0 0.5 0.3 ALCOHOL AND PHENOL ETHERS 2-(2-ethoxyethoxy)ethanol 0 0 0 - - - 0.5 0 0.3 2-(2-butoxyethoxy)ethanol 86 86 86 - - - 477 496 486 1-methoxy-2-propanol 0 0 0 - - - 1 1 1 2-butoxyethanol 0.9 0.9 0.9 - - - 0 0.5 0.3 ALDEHYDES benzaldehyde 0.9 0 0.5 - - - 0.9 0.9 1 octanal 0.5 0.9 0.7 - - - 0.9 0.9 1 nonanal 0.9 1 1 - - - 2 2 2 decanal 2 3 2 - - - 3 3 3 KETONES acetone 0.3 0.9 1 - - - 1 0.9 1 ESTERS AND LACTONES 2-(2-butoxyethoxy)ethyl acetate 0 0 0 - - - 0.9 0.9 0.9 1-methoxy-2-propylacetate 0.2 0 0.1 - - - 0 0 0 SILICON CONTAINING COMPOUNDS organic Si-comp. 0 6 3 - - - 3 11 7 Total 95 101 98 - - - 496 523 509 TVOC 35 33 34 - - - 296 310 303 non-TVOC 0.3 0.9 0.6 - - - 1 0.9 1
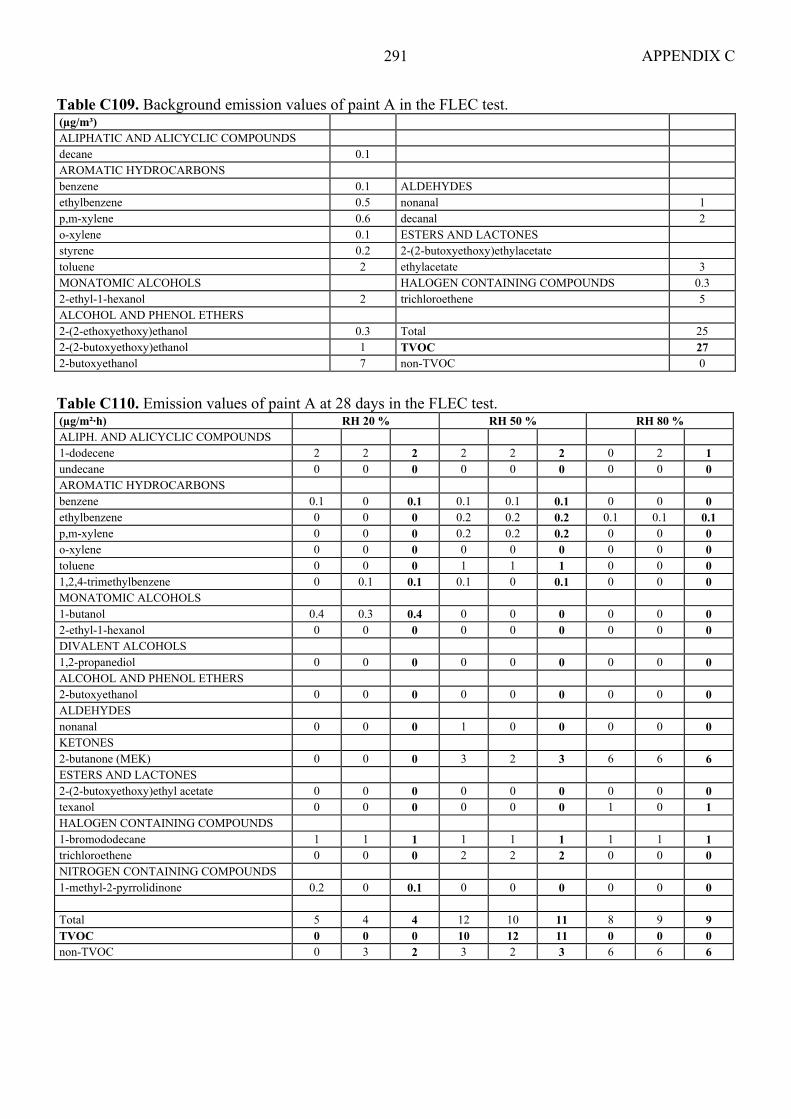
APPENDIX C 291
Table C109. Background emission values of paint A in the FLEC test. (µg/m³) ALIPHATIC AND ALICYCLIC COMPOUNDS decane 0.1 AROMATIC HYDROCARBONS benzene 0.1 ALDEHYDES ethylbenzene 0.5 nonanal 1 p,m-xylene 0.6 decanal 2 o-xylene 0.1 ESTERS AND LACTONES styrene 0.2 2-(2-butoxyethoxy)ethylacetate toluene 2 ethylacetate 3 MONATOMIC ALCOHOLS HALOGEN CONTAINING COMPOUNDS 0.3 2-ethyl-1-hexanol 2 trichloroethene 5 ALCOHOL AND PHENOL ETHERS 2-(2-ethoxyethoxy)ethanol 0.3 Total 25 2-(2-butoxyethoxy)ethanol 1 TVOC 27 2-butoxyethanol 7 non-TVOC 0 Table C110. Emission values of paint A at 28 days in the FLEC test. (µg/m²·h) RH 20 % RH 50 % RH 80 % ALIPH. AND ALICYCLIC COMPOUNDS 1-dodecene 2 2 2 2 2 2 0 2 1 undecane 0 0 0 0 0 0 0 0 0 AROMATIC HYDROCARBONS benzene 0.1 0 0.1 0.1 0.1 0.1 0 0 0 ethylbenzene 0 0 0 0.2 0.2 0.2 0.1 0.1 0.1 p,m-xylene 0 0 0 0.2 0.2 0.2 0 0 0 o-xylene 0 0 0 0 0 0 0 0 0 toluene 0 0 0 1 1 1 0 0 0 1,2,4-trimethylbenzene 0 0.1 0.1 0.1 0 0.1 0 0 0 MONATOMIC ALCOHOLS 1-butanol 0.4 0.3 0.4 0 0 0 0 0 0 2-ethyl-1-hexanol 0 0 0 0 0 0 0 0 0 DIVALENT ALCOHOLS 1,2-propanediol 0 0 0 0 0 0 0 0 0 ALCOHOL AND PHENOL ETHERS 2-butoxyethanol 0 0 0 0 0 0 0 0 0 ALDEHYDES nonanal 0 0 0 1 0 0 0 0 0 KETONES 2-butanone (MEK) 0 0 0 3 2 3 6 6 6 ESTERS AND LACTONES 2-(2-butoxyethoxy)ethyl acetate 0 0 0 0 0 0 0 0 0 texanol 0 0 0 0 0 0 1 0 1 HALOGEN CONTAINING COMPOUNDS 1-bromododecane 1 1 1 1 1 1 1 1 1 trichloroethene 0 0 0 2 2 2 0 0 0 NITROGEN CONTAINING COMPOUNDS 1-methyl-2-pyrrolidinone 0.2 0 0.1 0 0 0 0 0 0 Total 5 4 4 12 10 11 8 9 9 TVOC 0 0 0 10 12 11 0 0 0 non-TVOC 0 3 2 3 2 3 6 6 6
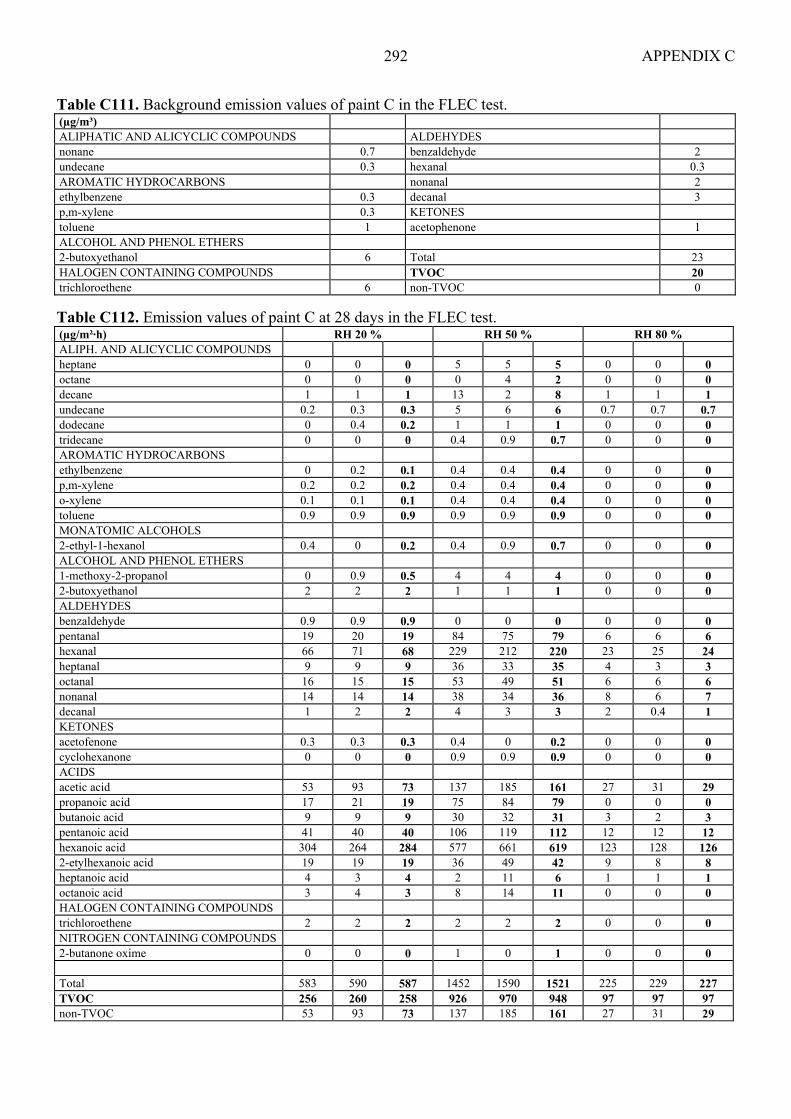
APPENDIX C 292
Table C111. Background emission values of paint C in the FLEC test. (µg/m³) ALIPHATIC AND ALICYCLIC COMPOUNDS ALDEHYDES nonane 0.7 benzaldehyde 2 undecane 0.3 hexanal 0.3 AROMATIC HYDROCARBONS nonanal 2 ethylbenzene 0.3 decanal 3 p,m-xylene 0.3 KETONES toluene 1 acetophenone 1 ALCOHOL AND PHENOL ETHERS 2-butoxyethanol 6 Total 23 HALOGEN CONTAINING COMPOUNDS TVOC 20 trichloroethene 6 non-TVOC 0 Table C112. Emission values of paint C at 28 days in the FLEC test. (µg/m²·h) RH 20 % RH 50 % RH 80 % ALIPH. AND ALICYCLIC COMPOUNDS heptane 0 0 0 5 5 5 0 0 0 octane 0 0 0 0 4 2 0 0 0 decane 1 1 1 13 2 8 1 1 1 undecane 0.2 0.3 0.3 5 6 6 0.7 0.7 0.7 dodecane 0 0.4 0.2 1 1 1 0 0 0 tridecane 0 0 0 0.4 0.9 0.7 0 0 0 AROMATIC HYDROCARBONS ethylbenzene 0 0.2 0.1 0.4 0.4 0.4 0 0 0 p,m-xylene 0.2 0.2 0.2 0.4 0.4 0.4 0 0 0 o-xylene 0.1 0.1 0.1 0.4 0.4 0.4 0 0 0 toluene 0.9 0.9 0.9 0.9 0.9 0.9 0 0 0 MONATOMIC ALCOHOLS 2-ethyl-1-hexanol 0.4 0 0.2 0.4 0.9 0.7 0 0 0 ALCOHOL AND PHENOL ETHERS 1-methoxy-2-propanol 0 0.9 0.5 4 4 4 0 0 0 2-butoxyethanol 2 2 2 1 1 1 0 0 0 ALDEHYDES benzaldehyde 0.9 0.9 0.9 0 0 0 0 0 0 pentanal 19 20 19 84 75 79 6 6 6 hexanal 66 71 68 229 212 220 23 25 24 heptanal 9 9 9 36 33 35 4 3 3 octanal 16 15 15 53 49 51 6 6 6 nonanal 14 14 14 38 34 36 8 6 7 decanal 1 2 2 4 3 3 2 0.4 1 KETONES acetofenone 0.3 0.3 0.3 0.4 0 0.2 0 0 0 cyclohexanone 0 0 0 0.9 0.9 0.9 0 0 0 ACIDS acetic acid 53 93 73 137 185 161 27 31 29 propanoic acid 17 21 19 75 84 79 0 0 0 butanoic acid 9 9 9 30 32 31 3 2 3 pentanoic acid 41 40 40 106 119 112 12 12 12 hexanoic acid 304 264 284 577 661 619 123 128 126 2-etylhexanoic acid 19 19 19 36 49 42 9 8 8 heptanoic acid 4 3 4 2 11 6 1 1 1 octanoic acid 3 4 3 8 14 11 0 0 0 HALOGEN CONTAINING COMPOUNDS trichloroethene 2 2 2 2 2 2 0 0 0 NITROGEN CONTAINING COMPOUNDS 2-butanone oxime 0 0 0 1 0 1 0 0 0 Total 583 590 587 1452 1590 1521 225 229 227 TVOC 256 260 258 926 970 948 97 97 97 non-TVOC 53 93 73 137 185 161 27 31 29
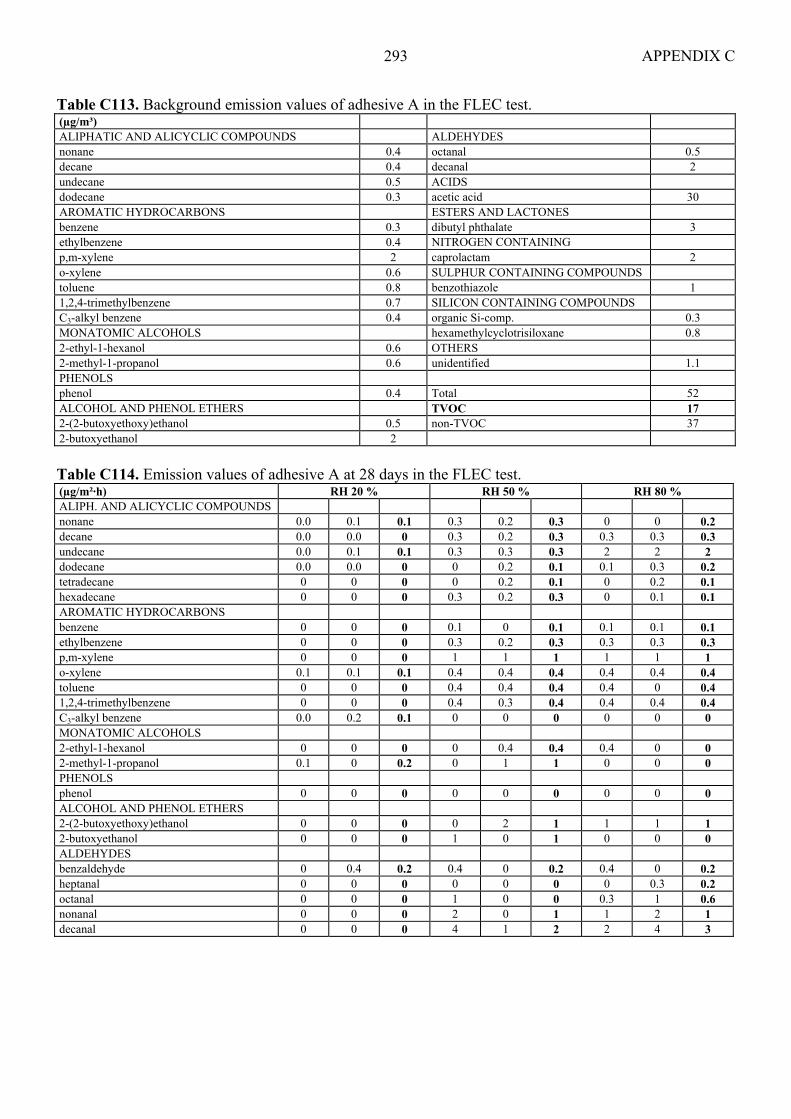
APPENDIX C 293
Table C113. Background emission values of adhesive A in the FLEC test. (µg/m³) ALIPHATIC AND ALICYCLIC COMPOUNDS ALDEHYDES nonane 0.4 octanal 0.5 decane 0.4 decanal 2 undecane 0.5 ACIDS dodecane 0.3 acetic acid 30 AROMATIC HYDROCARBONS ESTERS AND LACTONES benzene 0.3 dibutyl phthalate 3 ethylbenzene 0.4 NITROGEN CONTAINING p,m-xylene 2 caprolactam 2 o-xylene 0.6 SULPHUR CONTAINING COMPOUNDS toluene 0.8 benzothiazole 1 1,2,4-trimethylbenzene 0.7 SILICON CONTAINING COMPOUNDS C3-alkyl benzene 0.4 organic Si-comp. 0.3 MONATOMIC ALCOHOLS hexamethylcyclotrisiloxane 0.8 2-ethyl-1-hexanol 0.6 OTHERS 2-methyl-1-propanol 0.6 unidentified 1.1 PHENOLS phenol 0.4 Total 52 ALCOHOL AND PHENOL ETHERS TVOC 17 2-(2-butoxyethoxy)ethanol 0.5 non-TVOC 37 2-butoxyethanol 2 Table C114. Emission values of adhesive A at 28 days in the FLEC test. (µg/m²·h) RH 20 % RH 50 % RH 80 % ALIPH. AND ALICYCLIC COMPOUNDS nonane 0.0 0.1 0.1 0.3 0.2 0.3 0 0 0.2 decane 0.0 0.0 0 0.3 0.2 0.3 0.3 0.3 0.3 undecane 0.0 0.1 0.1 0.3 0.3 0.3 2 2 2 dodecane 0.0 0.0 0 0 0.2 0.1 0.1 0.3 0.2 tetradecane 0 0 0 0 0.2 0.1 0 0.2 0.1 hexadecane 0 0 0 0.3 0.2 0.3 0 0.1 0.1 AROMATIC HYDROCARBONS benzene 0 0 0 0.1 0 0.1 0.1 0.1 0.1 ethylbenzene 0 0 0 0.3 0.2 0.3 0.3 0.3 0.3 p,m-xylene 0 0 0 1 1 1 1 1 1 o-xylene 0.1 0.1 0.1 0.4 0.4 0.4 0.4 0.4 0.4 toluene 0 0 0 0.4 0.4 0.4 0.4 0 0.4 1,2,4-trimethylbenzene 0 0 0 0.4 0.3 0.4 0.4 0.4 0.4 C3-alkyl benzene 0.0 0.2 0.1 0 0 0 0 0 0 MONATOMIC ALCOHOLS 2-ethyl-1-hexanol 0 0 0 0 0.4 0.4 0.4 0 0 2-methyl-1-propanol 0.1 0 0.2 0 1 1 0 0 0 PHENOLS phenol 0 0 0 0 0 0 0 0 0 ALCOHOL AND PHENOL ETHERS 2-(2-butoxyethoxy)ethanol 0 0 0 0 2 1 1 1 1 2-butoxyethanol 0 0 0 1 0 1 0 0 0 ALDEHYDES benzaldehyde 0 0.4 0.2 0.4 0 0.2 0.4 0 0.2 heptanal 0 0 0 0 0 0 0 0.3 0.2 octanal 0 0 0 1 0 0 0.3 1 0.6 nonanal 0 0 0 2 0 1 1 2 1 decanal 0 0 0 4 1 2 2 4 3
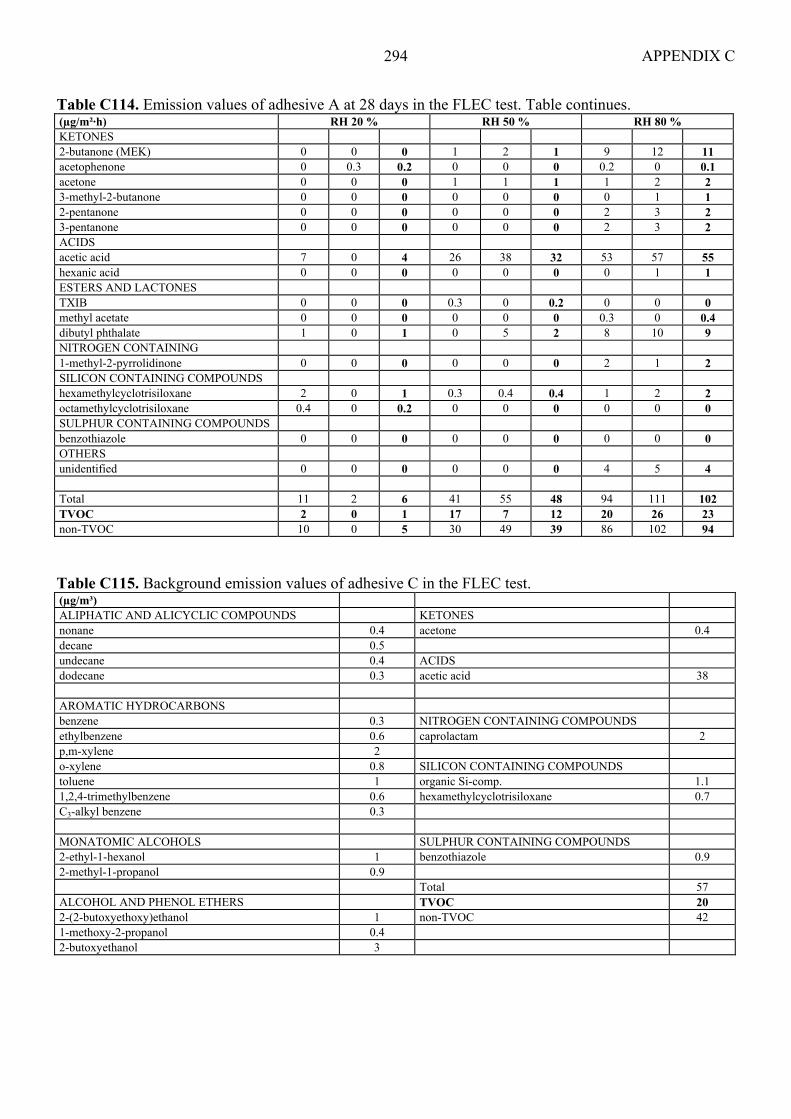
APPENDIX C 294
Table C114. Emission values of adhesive A at 28 days in the FLEC test. Table continues. (µg/m²·h) RH 20 % RH 50 % RH 80 % KETONES 2-butanone (MEK) 0 0 0 1 2 1 9 12 11 acetophenone 0 0.3 0.2 0 0 0 0.2 0 0.1 acetone 0 0 0 1 1 1 1 2 2 3-methyl-2-butanone 0 0 0 0 0 0 0 1 1 2-pentanone 0 0 0 0 0 0 2 3 2 3-pentanone 0 0 0 0 0 0 2 3 2 ACIDS acetic acid 7 0 4 26 38 32 53 57 55 hexanic acid 0 0 0 0 0 0 0 1 1 ESTERS AND LACTONES TXIB 0 0 0 0.3 0 0.2 0 0 0 methyl acetate 0 0 0 0 0 0 0.3 0 0.4 dibutyl phthalate 1 0 1 0 5 2 8 10 9 NITROGEN CONTAINING 1-methyl-2-pyrrolidinone 0 0 0 0 0 0 2 1 2 SILICON CONTAINING COMPOUNDS hexamethylcyclotrisiloxane 2 0 1 0.3 0.4 0.4 1 2 2 octamethylcyclotrisiloxane 0.4 0 0.2 0 0 0 0 0 0 SULPHUR CONTAINING COMPOUNDS benzothiazole 0 0 0 0 0 0 0 0 0 OTHERS unidentified 0 0 0 0 0 0 4 5 4 Total 11 2 6 41 55 48 94 111 102 TVOC 2 0 1 17 7 12 20 26 23 non-TVOC 10 0 5 30 49 39 86 102 94 Table C115. Background emission values of adhesive C in the FLEC test. (µg/m³) ALIPHATIC AND ALICYCLIC COMPOUNDS KETONES nonane 0.4 acetone 0.4 decane 0.5 undecane 0.4 ACIDS dodecane 0.3 acetic acid 38 AROMATIC HYDROCARBONS benzene 0.3 NITROGEN CONTAINING COMPOUNDS ethylbenzene 0.6 caprolactam 2 p,m-xylene 2 o-xylene 0.8 SILICON CONTAINING COMPOUNDS toluene 1 organic Si-comp. 1.1 1,2,4-trimethylbenzene 0.6 hexamethylcyclotrisiloxane 0.7 C3-alkyl benzene 0.3 MONATOMIC ALCOHOLS SULPHUR CONTAINING COMPOUNDS 2-ethyl-1-hexanol 1 benzothiazole 0.9 2-methyl-1-propanol 0.9 Total 57 ALCOHOL AND PHENOL ETHERS TVOC 20 2-(2-butoxyethoxy)ethanol 1 non-TVOC 42 1-methoxy-2-propanol 0.4 2-butoxyethanol 3

APPENDIX C 295
Table C116. Emission values of adhesive C at 28 days in the FLEC test. (µg/m²·h) RH 20 % RH 50 % RH 80 % ALIPH. AND ALICYCLIC COMPOUNDS nonane 0 0 0 0.9 0 0.5 0.3 0.3 0.3 decane 0 0 0 0.9 0.9 0.9 0.1 0.2 0.2 undecane 4 3 4 23 24 24 0.1 0 0.1 dodecane 0 0 0 0 0 0 0.1 0 0.1 tridecane 0 0 0 8 8 8 0 0 0 tetradecane 0 0 0 12 12 12 0 0 0 pentadecane 0 0 0 3 3 3 0 0 0 AROMATIC HYDROCARBONS benzene 0 0 0 0.9 0 0.5 0 0 0 ethylbenzene 0 0 0 0 0 0 0 0 0 p,m-xylene 1 1 1 2 2 2 0.4 0.4 0.4 o-xylene 0 0 0 0.9 0.4 0.7 0.1 0.1 0.1 toluene 0 0 0 0.9 0.9 0.9 0.4 0.4 0.4 1,2,4-trimethylbenzene 0 0 0 0 0.9 0.5 0.2 0.2 0.2 C3-alkyl benzene 0 0 0 0 0 0 0 0.1 0.1 MONATOMIC ALCOHOLS 1-butanol 0 0 0 0.9 1 1 0 0 0 2-ethyl-1-hexanol 0.9 0.9 0.9 0.9 1 1 0 0 0 2-methyl-1-propanol 2 2 2 2 2 2 0.5 0.5 0.5 DIVALENT ALCOHOLS 1,2-propanediol 450 450 450 154 154 154 53 62 57 PHENOLS phenol 0 0 0 0 0 0 0.3 0.2 0.3 ALCOHOL AND PHENOL ETHERS 2-(2-butoxyethoxy)ethanol 1 1 1 0.9 0.9 0.9 0.4 0 0.2 1-methoxy-2-propanol 3 3 3 2 2 2 0.1 0.2 0.2 2-butoxyethanol 2 2 2 0.9 0.9 0.9 0 0 0 ALDEHYDES benzaldehyde 0 0 0 0 0 0 0.4 0.2 0.3 n-butanal 0 0 0 2 3 2 0 0 0 pentanal 0 0 0 0.9 0.9 0.9 0 0 0 hexanal 0 0 0 3 3 3 0 0 0 octanal 0 0 0 0.9 0 0.5 0 0.4 0.2 nonanal 0.9 2 1 0.9 0 0.5 0 0 0 decanal 0.9 3 2 2 0.9 1 0 1 1 KETONES 2-butanone (MEK) 15 12 14 17 18 17 0 0 0 acetone 3 2 2 2 2 2 0.7 0 0.4 3-methyl-2-butanone 0 0 0 4 4 4 0 0 0 2-pentanone 5 4 4 28 30 29 0 0 0 3-pentanone 4 3 4 24 26 25 0 0 0 ACIDS acetic acid 309 419 364 353 357 355 63 41 52 butyric acid 0.9 0.9 0.9 0 0 0 0 0 0 pentanic acid 0 0.9 0.5 0 0 0 0 0 0 hexanic acid 2 2 2 0.9 2 1 0.4 0.4 0.4 ESTERS AND LACTONES n-butylacetate 0 0 0 0 0.9 0.5 0 0 0 methyl acetate 0 0 0 2 3 2 0 0 0 methyl butonate 0 0 0 4 5 5 0 0 0 HALOGEN CONTAINING COMPOUNDS bromnitromethane 0.9 0.9 0.9 8 9 8 0.9 1 1 NITROGEN CONTAINING COMPOUNDS 1-methyl-2-pyrrolidinone 3 3 3 0 2 1 0 0 0 caprolactam 0 0 0 1 1 1 0.9 1 1 SILICON CONTAINING COMPOUNDS organic Si-comp. 0 0 0 0 0 0 0 0 0 hexamethylcyclotrisiloxane 4 4 4 4 4 4 0 0 0 SULPHUR CONTAINING COMPOUNDS 5-chloro-2-methyl-3(2H)-isotiatsolon 2 2 2 0.9 0.9 0.9 0 0 0 benzothiazole 0 0 0 0 0 0 0 0 0 Total 813 919 866 671 687 679 122 110 116 TVOC 287 295 291 172 176 174 20 23 22 non-TVOC 371 486 428 428 435 432 68 43 55

APPENDIX C 296
Table C117. Background emission values of plaster A in the FLEC test. (µg/m³) ALIPHATIC AND ALICYCLIC COMPOUNDS ALDEHYDES nonane 0.4 benzaldehyde 1 undecane 0.3 n-butanal 1 AROMATIC HYDROCARBONS decanal 6 p,m-xylene 0.7 KETONES o-xylene 0.3 acetophenone 0.4 toluene 0.5 acetone 0.8 1,2,4-trimethylbenzene 0.3 ACIDS MONATOMIC ALCOHOLS acetic acid 0.5 1-butanol 0.7 ESTERS AND LACTONES 2-ethyl-1-hexanol 1 2-(2-butoxyethoxy)ethylacetate 0.5 PHENOLS NITROGEN CONTAINING COMPOUNDS phenol 0.3 1-methyl-2-pyrrolidinone 0.7 ALCOHOL AND PHENOL ETHERS caprolactam 10 2-(2-butoxyethoxy)ethanol 1 SULPHUR CONTAINING COMPOUNDS 2-butoxyethanol 2 benzothiazole 1 SILICON CONTAINING COMPOUNDS organic Si-comp. 0.9 Total 30 TVOC 26 non-TVOC 2.3 Table C118. Emission values of plaster A at 29 days in the FLEC test. (µg/m²·h) RH 20 % RH 50 % RH 80 % ALIPH. AND ALICYCLIC COMPOUNDS heptane 0.3 0.2 0.3 0 0 0 0 0 0 octane 0.2 0 0.1 0 0 0 0 0 0 nonane 0 0 0 0 0 0 0.4 0 0.2 decane 0.3 0.3 0.3 0 0.2 0.1 0.2 0 0.1 undecane 0.1 0.1 0.1 0 0 0 0.3 0.2 0.3 dodecane 0.4 0.4 0.4 0 0 0 0 0 0 tetradecane 0 0.3 0.2 0 0 0 0 0 0 AROMATIC HYDROCARBONS benzene 0 0 0 0.2 0 0.1 0 0 0 ethylbenzene 0 0 0 0.4 0.4 0.4 0.3 0.3 0.3 p,m-xylene 2 2 2 1 1 1 1 1 1 o-xylene 1 1 1 0 0 0 0.4 0 0 styrene 0 0 0 0.4 0.4 0.4 0.3 0.3 0.3 toluene 2 1 1 1 1 1 1 1 1 1,2,3-trimethylbenzene 0.2 0.3 0.3 0 0 0 0 0 0 1,2,4-trimethylbenzene 1 1 1 1 1 1 0 0 0 1,3,5-trimethylbenzene 0 0.2 0.1 0 0 0 0 0 0 C3-alkyl benzene 0.7 0.7 0.7 0.5 0.5 0.5 0.4 0.3 0.4 MONATOMIC ALCOHOLS 1-butanol 0.1 0.1 0.1 0.4 0 0.4 0 0.2 0.3 2-ethyl-1-hexanol 2 1 2 0 0 0 0.4 1 0.7 benzylalcohol 0.3 0.2 0.3 0 0 0 0 0 0 2-methyl-1-propanol 1 1 1 1 1 1 1 0 1 DIVALENT ALCOHOLS 1,2-propanediol 278 291 284 49 44 46 410 423 417 ETHERS bis[2-(2-ethoxyethoxy)ethyl]ether 0.4 0.1 0.3 0.3 0.3 0.3 2 2 2
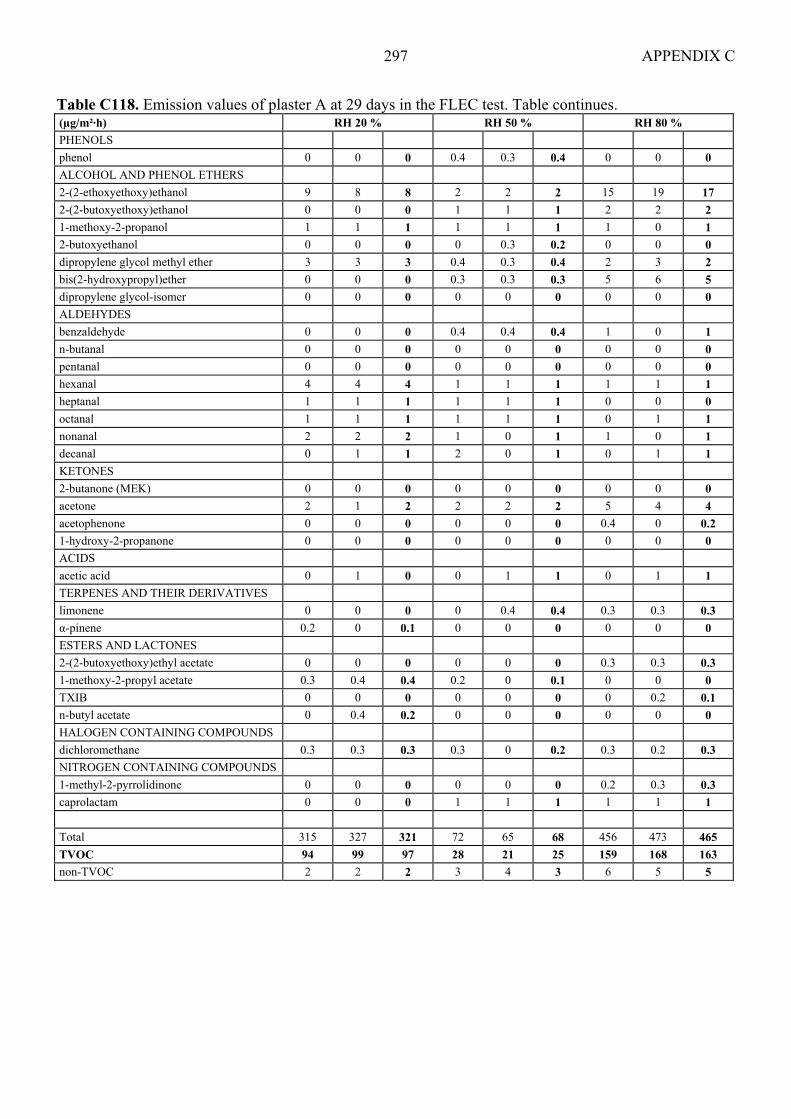
APPENDIX C 297
Table C118. Emission values of plaster A at 29 days in the FLEC test. Table continues. (µg/m²·h) RH 20 % RH 50 % RH 80 % PHENOLS phenol 0 0 0 0.4 0.3 0.4 0 0 0 ALCOHOL AND PHENOL ETHERS 2-(2-ethoxyethoxy)ethanol 9 8 8 2 2 2 15 19 17 2-(2-butoxyethoxy)ethanol 0 0 0 1 1 1 2 2 2 1-methoxy-2-propanol 1 1 1 1 1 1 1 0 1 2-butoxyethanol 0 0 0 0 0.3 0.2 0 0 0 dipropylene glycol methyl ether 3 3 3 0.4 0.3 0.4 2 3 2 bis(2-hydroxypropyl)ether 0 0 0 0.3 0.3 0.3 5 6 5 dipropylene glycol-isomer 0 0 0 0 0 0 0 0 0 ALDEHYDES benzaldehyde 0 0 0 0.4 0.4 0.4 1 0 1 n-butanal 0 0 0 0 0 0 0 0 0 pentanal 0 0 0 0 0 0 0 0 0 hexanal 4 4 4 1 1 1 1 1 1 heptanal 1 1 1 1 1 1 0 0 0 octanal 1 1 1 1 1 1 0 1 1 nonanal 2 2 2 1 0 1 1 0 1 decanal 0 1 1 2 0 1 0 1 1 KETONES 2-butanone (MEK) 0 0 0 0 0 0 0 0 0 acetone 2 1 2 2 2 2 5 4 4 acetophenone 0 0 0 0 0 0 0.4 0 0.2 1-hydroxy-2-propanone 0 0 0 0 0 0 0 0 0 ACIDS acetic acid 0 1 0 0 1 1 0 1 1 TERPENES AND THEIR DERIVATIVES limonene 0 0 0 0 0.4 0.4 0.3 0.3 0.3 α-pinene 0.2 0 0.1 0 0 0 0 0 0 ESTERS AND LACTONES 2-(2-butoxyethoxy)ethyl acetate 0 0 0 0 0 0 0.3 0.3 0.3 1-methoxy-2-propyl acetate 0.3 0.4 0.4 0.2 0 0.1 0 0 0 TXIB 0 0 0 0 0 0 0 0.2 0.1 n-butyl acetate 0 0.4 0.2 0 0 0 0 0 0 HALOGEN CONTAINING COMPOUNDS dichloromethane 0.3 0.3 0.3 0.3 0 0.2 0.3 0.2 0.3 NITROGEN CONTAINING COMPOUNDS 1-methyl-2-pyrrolidinone 0 0 0 0 0 0 0.2 0.3 0.3 caprolactam 0 0 0 1 1 1 1 1 1 Total 315 327 321 72 65 68 456 473 465 TVOC 94 99 97 28 21 25 159 168 163 non-TVOC 2 2 2 3 4 3 6 5 5

APPENDIX C 298
Table C119. Background emission values of plaster C in the FLEC test. (µg/m³) ALIPHATIC AND ALICYCLIC COMPOUNDS ALDEHYDES undecane 0.3 decanal 5 dodecane 0.3 KETONES AROMATIC HYDROCARBONS acetone 1 ethylbenzene 0.3 ESTERS AND LACTONES p,m-xylene 1 2-(2-butoxyethoxy)ethylacetate 0.7 o-xylene 0.4 TXIB 0.3 toluene 2 SILICON CONTAINING COMPOUNDS 1,2,4-trimethylbenzene 0.4 organic Si-comp. 1 MONATOMIC ALCOHOLS 2-ethyl-1-hexanol 1 Total 16 ALCOHOL AND PHENOL ETHERS TVOC 14 2-butoxyethanol 2 non-TVOC 1 Table C120. Emission values of plaster C at 27 days in the FLEC test. (µg/m²·h) RH 20 % RH 50 % RH 80 % ALIPH. AND ALICYCLIC COMPOUNDS heptane 0 0 0 0.3 0 0.2 0.2 0 0.1 nonane 0 0 0 0 0 0 0.3 0 0.2 decane 0.9 0.9 0.9 0 0.2 0.1 0 0 0 undecane 1 1 1 0.4 0.4 0.4 0.1 0 0.1 dodecane 0.9 0.9 0.9 0.2 0 0.1 0.1 0 0.1 methylcyclopentane 0 0 0 0.3 0.2 0.3 0 0 0 2-methylpentane 0.4 0.4 0.4 0.4 0.4 0.4 0 0.3 0.2 AROMATIC HYDROCARBONS benzene 0.4 0.4 0.4 0.3 0.3 0.3 0.2 0.2 0.2 ethylbenzene 3 3 3 0.9 1 1 0.3 0.3 0.3 propylbenzene 0.9 0.9 0.9 0.4 0.3 0.4 0 0 0 p,m-xylene 11 11 11 4 4 4 0.9 0.9 0.9 o-xylene 4 4 4 2 2 2 0.3 0.7 0.5 styrene 0.9 0.9 0.9 0.3 0.3 0.3 0 0 0 toluene 13 13 13 4 4 4 0.9 0.9 0.9 1,2,3-trimethylbenzene 0.4 0.4 0.4 0.3 0.3 0.3 0 0 0 1,2,4-trimethylbenzene 3 3 3 1 1 1 0.3 0.3 0.3 1,3,5-trimethylbenzene 0.9 0.9 0.9 0.4 0.3 0.4 0 0 0 1-ethyl-2-methylbenzene 0.4 0.4 0.4 0.3 0.3 0.3 0 0 0 C3-alkyl benzene 3 3 3 0.9 0.9 0.9 0.4 0.4 0.4 MONATOMIC ALCOHOLS 2-propanol 0 0 0 0.3 0.2 0.3 0.2 0.3 0.3 1-butanol 0.4 0.4 0.4 0.3 0.3 0.3 0 0.4 0.2 2-ethyl-1-hexanol 0.4 0.4 0.4 0.4 0.3 0.4 0.4 0 0.2 2-methyl-1-propanol 3 3 3 1 1 1 0.4 0.9 0.7 ETHERS bis(2-methoxyethyl)ether 0 0 0 0 0 0 0.4 0.3 0.4 ALCOHOL AND PHENOL ETHERS 2-(2-butoxyethoxy)ethanol 0 0 0 0 0 0 0.9 0.9 0.9 1-methoxy-2-propanol 0.9 0.9 0.9 0.4 0.4 0.4 0.3 0.2 0.3 2-butoxyethanol 0 0 0 0 0 0 0 0 0
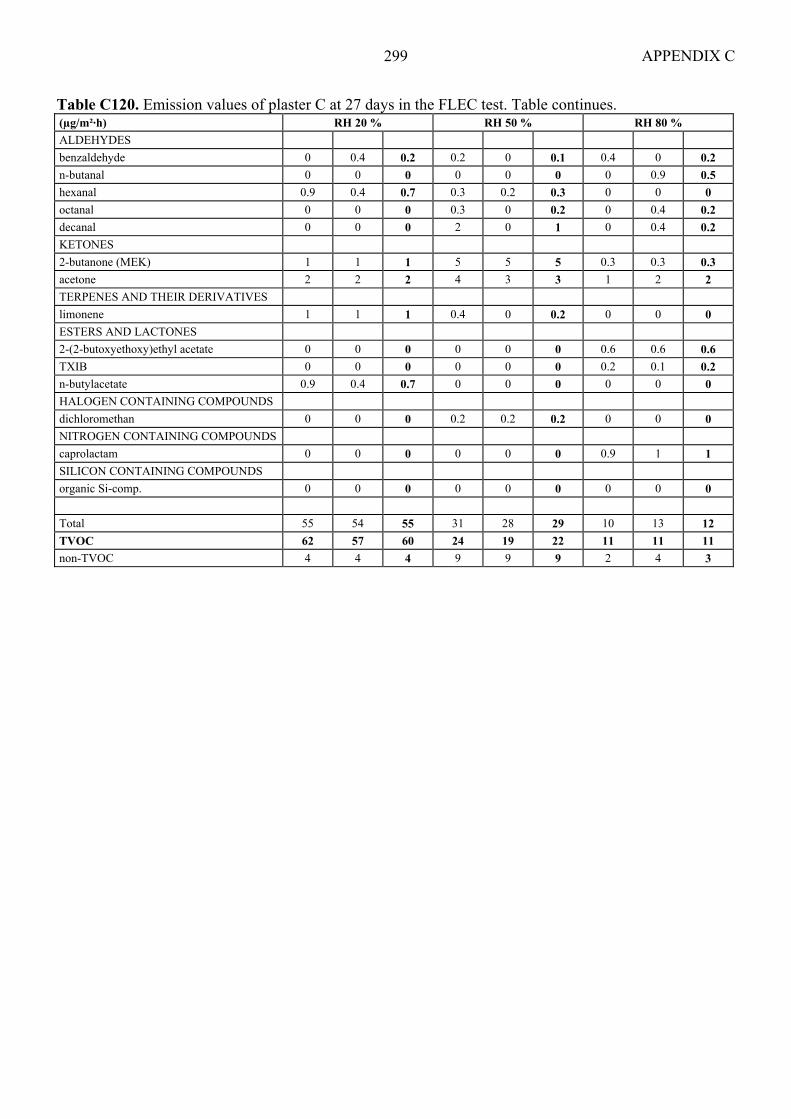
APPENDIX C 299
Table C120. Emission values of plaster C at 27 days in the FLEC test. Table continues. (µg/m²·h) RH 20 % RH 50 % RH 80 % ALDEHYDES benzaldehyde 0 0.4 0.2 0.2 0 0.1 0.4 0 0.2 n-butanal 0 0 0 0 0 0 0 0.9 0.5 hexanal 0.9 0.4 0.7 0.3 0.2 0.3 0 0 0 octanal 0 0 0 0.3 0 0.2 0 0.4 0.2 decanal 0 0 0 2 0 1 0 0.4 0.2 KETONES 2-butanone (MEK) 1 1 1 5 5 5 0.3 0.3 0.3 acetone 2 2 2 4 3 3 1 2 2 TERPENES AND THEIR DERIVATIVES limonene 1 1 1 0.4 0 0.2 0 0 0 ESTERS AND LACTONES 2-(2-butoxyethoxy)ethyl acetate 0 0 0 0 0 0 0.6 0.6 0.6 TXIB 0 0 0 0 0 0 0.2 0.1 0.2 n-butylacetate 0.9 0.4 0.7 0 0 0 0 0 0 HALOGEN CONTAINING COMPOUNDS dichloromethan 0 0 0 0.2 0.2 0.2 0 0 0 NITROGEN CONTAINING COMPOUNDS caprolactam 0 0 0 0 0 0 0.9 1 1 SILICON CONTAINING COMPOUNDS organic Si-comp. 0 0 0 0 0 0 0 0 0 Total 55 54 55 31 28 29 10 13 12 TVOC 62 57 60 24 19 22 11 11 11 non-TVOC 4 4 4 9 9 9 2 4 3
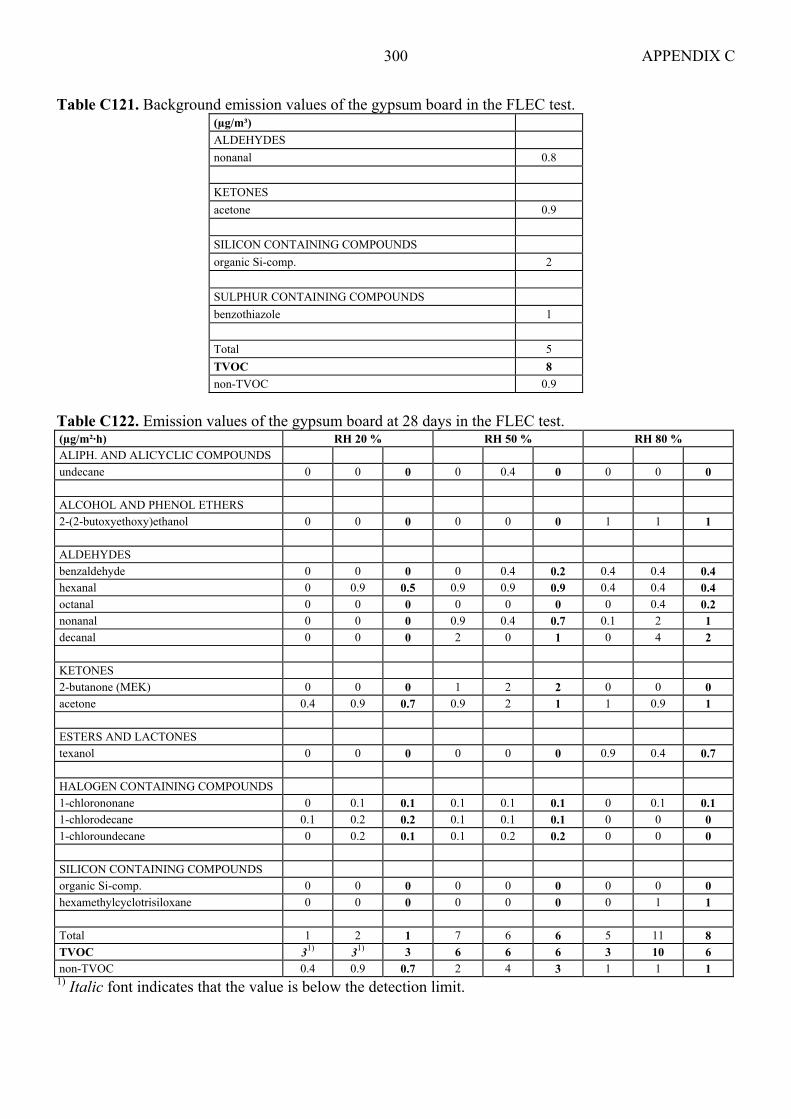
APPENDIX C 300
Table C121. Background emission values of the gypsum board in the FLEC test. (µg/m³) ALDEHYDES nonanal 0.8 KETONES acetone 0.9 SILICON CONTAINING COMPOUNDS organic Si-comp. 2 SULPHUR CONTAINING COMPOUNDS benzothiazole 1 Total 5 TVOC 8 non-TVOC 0.9
Table C122. Emission values of the gypsum board at 28 days in the FLEC test. (µg/m²·h) RH 20 % RH 50 % RH 80 % ALIPH. AND ALICYCLIC COMPOUNDS undecane 0 0 0 0 0.4 0 0 0 0 ALCOHOL AND PHENOL ETHERS 2-(2-butoxyethoxy)ethanol 0 0 0 0 0 0 1 1 1 ALDEHYDES benzaldehyde 0 0 0 0 0.4 0.2 0.4 0.4 0.4 hexanal 0 0.9 0.5 0.9 0.9 0.9 0.4 0.4 0.4 octanal 0 0 0 0 0 0 0 0.4 0.2 nonanal 0 0 0 0.9 0.4 0.7 0.1 2 1 decanal 0 0 0 2 0 1 0 4 2 KETONES 2-butanone (MEK) 0 0 0 1 2 2 0 0 0 acetone 0.4 0.9 0.7 0.9 2 1 1 0.9 1 ESTERS AND LACTONES texanol 0 0 0 0 0 0 0.9 0.4 0.7 HALOGEN CONTAINING COMPOUNDS 1-chlorononane 0 0.1 0.1 0.1 0.1 0.1 0 0.1 0.1 1-chlorodecane 0.1 0.2 0.2 0.1 0.1 0.1 0 0 0 1-chloroundecane 0 0.2 0.1 0.1 0.2 0.2 0 0 0 SILICON CONTAINING COMPOUNDS organic Si-comp. 0 0 0 0 0 0 0 0 0 hexamethylcyclotrisiloxane 0 0 0 0 0 0 0 1 1 Total 1 2 1 7 6 6 5 11 8 TVOC 31) 31) 3 6 6 6 3 10 6 non-TVOC 0.4 0.9 0.7 2 4 3 1 1 1 1) Italic font indicates that the value is below the detection limit.
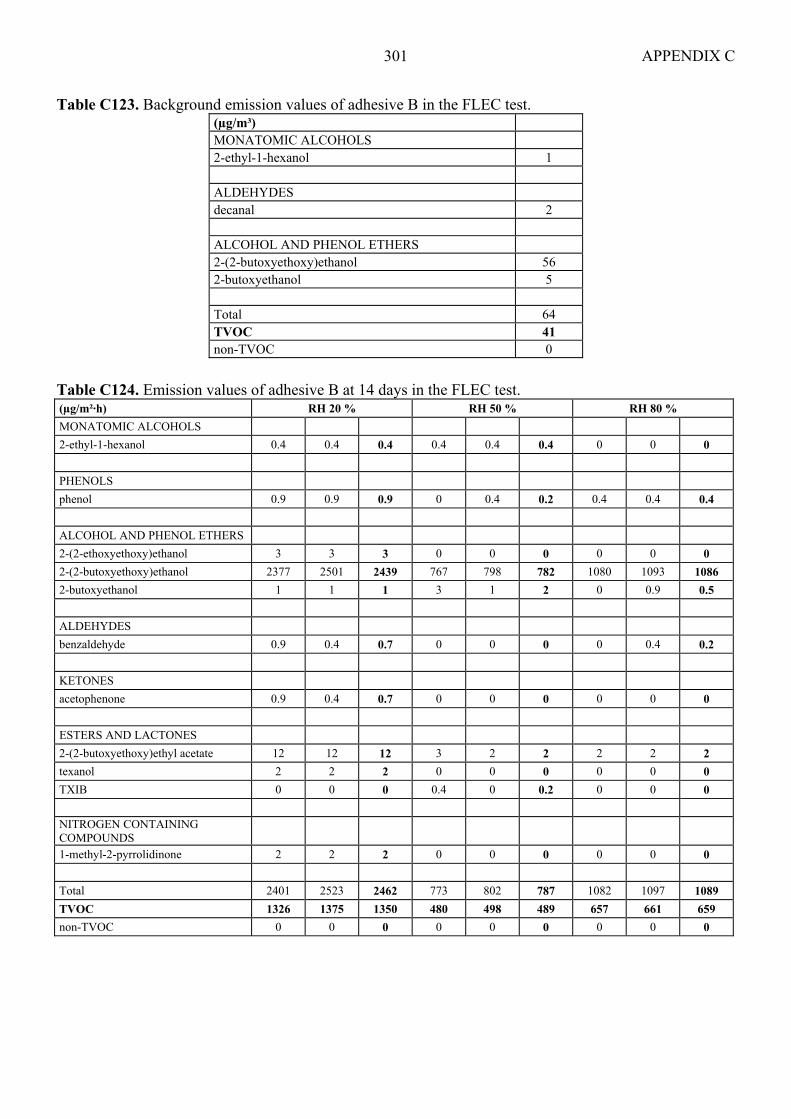
APPENDIX C 301
Table C123. Background emission values of adhesive B in the FLEC test. (µg/m³) MONATOMIC ALCOHOLS 2-ethyl-1-hexanol 1 ALDEHYDES decanal 2 ALCOHOL AND PHENOL ETHERS 2-(2-butoxyethoxy)ethanol 56 2-butoxyethanol 5 Total 64 TVOC 41 non-TVOC 0
Table C124. Emission values of adhesive B at 14 days in the FLEC test. (µg/m²·h) RH 20 % RH 50 % RH 80 % MONATOMIC ALCOHOLS 2-ethyl-1-hexanol 0.4 0.4 0.4 0.4 0.4 0.4 0 0 0 PHENOLS phenol 0.9 0.9 0.9 0 0.4 0.2 0.4 0.4 0.4 ALCOHOL AND PHENOL ETHERS 2-(2-ethoxyethoxy)ethanol 3 3 3 0 0 0 0 0 0 2-(2-butoxyethoxy)ethanol 2377 2501 2439 767 798 782 1080 1093 1086 2-butoxyethanol 1 1 1 3 1 2 0 0.9 0.5 ALDEHYDES benzaldehyde 0.9 0.4 0.7 0 0 0 0 0.4 0.2 KETONES acetophenone 0.9 0.4 0.7 0 0 0 0 0 0 ESTERS AND LACTONES 2-(2-butoxyethoxy)ethyl acetate 12 12 12 3 2 2 2 2 2 texanol 2 2 2 0 0 0 0 0 0 TXIB 0 0 0 0.4 0 0.2 0 0 0 NITROGEN CONTAINING COMPOUNDS
1-methyl-2-pyrrolidinone 2 2 2 0 0 0 0 0 0 Total 2401 2523 2462 773 802 787 1082 1097 1089 TVOC 1326 1375 1350 480 498 489 657 661 659 non-TVOC 0 0 0 0 0 0 0 0 0
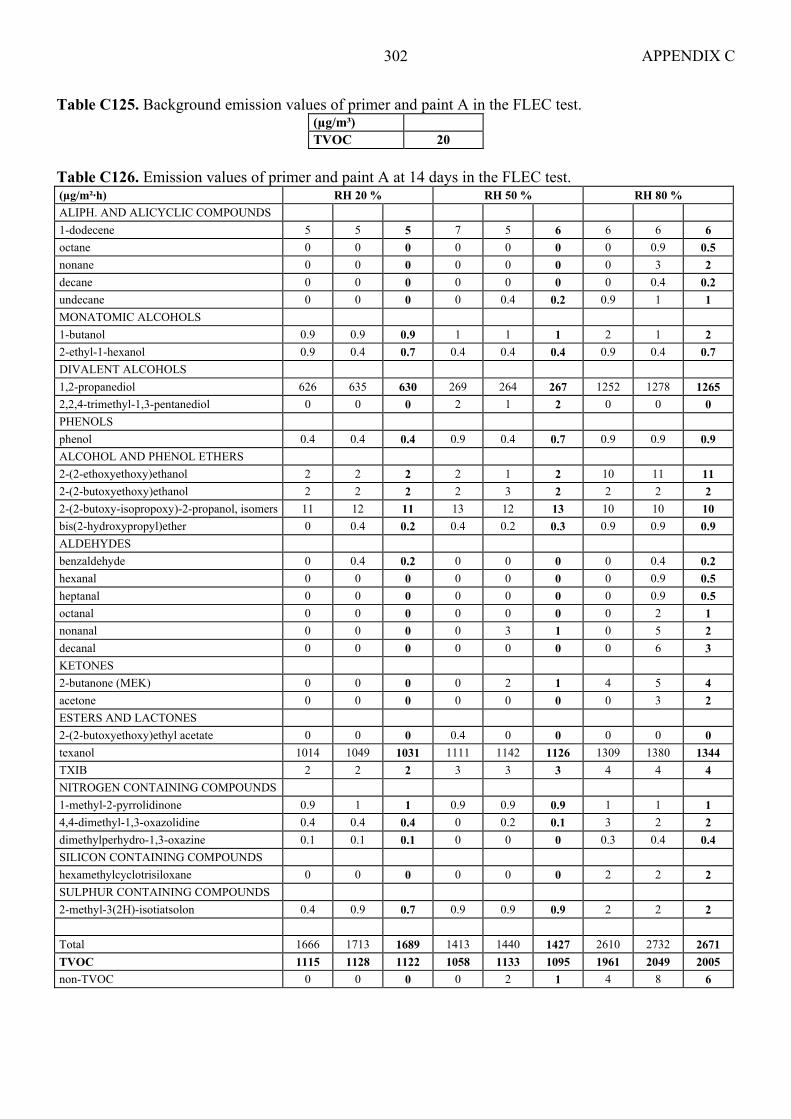
APPENDIX C 302
Table C125. Background emission values of primer and paint A in the FLEC test. (µg/m³) TVOC 20
Table C126. Emission values of primer and paint A at 14 days in the FLEC test. (µg/m²·h) RH 20 % RH 50 % RH 80 % ALIPH. AND ALICYCLIC COMPOUNDS 1-dodecene 5 5 5 7 5 6 6 6 6 octane 0 0 0 0 0 0 0 0.9 0.5 nonane 0 0 0 0 0 0 0 3 2 decane 0 0 0 0 0 0 0 0.4 0.2 undecane 0 0 0 0 0.4 0.2 0.9 1 1 MONATOMIC ALCOHOLS 1-butanol 0.9 0.9 0.9 1 1 1 2 1 2 2-ethyl-1-hexanol 0.9 0.4 0.7 0.4 0.4 0.4 0.9 0.4 0.7 DIVALENT ALCOHOLS 1,2-propanediol 626 635 630 269 264 267 1252 1278 1265 2,2,4-trimethyl-1,3-pentanediol 0 0 0 2 1 2 0 0 0 PHENOLS phenol 0.4 0.4 0.4 0.9 0.4 0.7 0.9 0.9 0.9 ALCOHOL AND PHENOL ETHERS 2-(2-ethoxyethoxy)ethanol 2 2 2 2 1 2 10 11 11 2-(2-butoxyethoxy)ethanol 2 2 2 2 3 2 2 2 2 2-(2-butoxy-isopropoxy)-2-propanol, isomers 11 12 11 13 12 13 10 10 10 bis(2-hydroxypropyl)ether 0 0.4 0.2 0.4 0.2 0.3 0.9 0.9 0.9 ALDEHYDES benzaldehyde 0 0.4 0.2 0 0 0 0 0.4 0.2 hexanal 0 0 0 0 0 0 0 0.9 0.5 heptanal 0 0 0 0 0 0 0 0.9 0.5 octanal 0 0 0 0 0 0 0 2 1 nonanal 0 0 0 0 3 1 0 5 2 decanal 0 0 0 0 0 0 0 6 3 KETONES 2-butanone (MEK) 0 0 0 0 2 1 4 5 4 acetone 0 0 0 0 0 0 0 3 2 ESTERS AND LACTONES 2-(2-butoxyethoxy)ethyl acetate 0 0 0 0.4 0 0 0 0 0 texanol 1014 1049 1031 1111 1142 1126 1309 1380 1344 TXIB 2 2 2 3 3 3 4 4 4 NITROGEN CONTAINING COMPOUNDS 1-methyl-2-pyrrolidinone 0.9 1 1 0.9 0.9 0.9 1 1 1 4,4-dimethyl-1,3-oxazolidine 0.4 0.4 0.4 0 0.2 0.1 3 2 2 dimethylperhydro-1,3-oxazine 0.1 0.1 0.1 0 0 0 0.3 0.4 0.4 SILICON CONTAINING COMPOUNDS hexamethylcyclotrisiloxane 0 0 0 0 0 0 2 2 2 SULPHUR CONTAINING COMPOUNDS 2-methyl-3(2H)-isotiatsolon 0.4 0.9 0.7 0.9 0.9 0.9 2 2 2 Total 1666 1713 1689 1413 1440 1427 2610 2732 2671 TVOC 1115 1128 1122 1058 1133 1095 1961 2049 2005 non-TVOC 0 0 0 0 2 1 4 8 6

APPENDIX C 303
Table C127. Background emission values of primer and paint B in the FLEC test. (µg/m³) ALIPHATIC AND ALICYCLIC COMPOUNDS nonane 2 MONATOMIC ALCOHOLS 2-ethyl-1-hexanol 2 ALDEHYDES benzaldehyde 2 nonanal 4 PHENOLS phenol 0.3 ALCOHOL AND PHENOL ETHERS 2-butoxyethanol 3 ACIDS acetic acid 7 Total 20 TVOC 20 non-TVOC 7
Table C128. Emission values of primer and paint B at 14 days in the FLEC test. (µg/m²·h) RH 20 % RH 50 % RH 80 % ALIPH. AND ALICYCLIC COMPOUNDS nonane 0 0 0 1 0 1 0.4 1.3 1 AROMATIC HYDROCARBONS toluene 0.3 0 0.2 0 0.3 0.2 0 0 0 MONATOMIC ALCOHOLS 2-ethyl-1-hexanol 0.4 0 0 2 0.9 1 0.9 0.9 0.9 DIVALENT ALCOHOLS 1,2-propanediol 66 71 68 22 21 22 71 79 75 PHENOLS phenol 0 0 0 0 0 0 0.9 0.9 0.9 ALCOHOL AND PHENOL ETHERS 2-(2-ethoxyethoxy)ethanol 5 5 5 2 2 2 5 5 5 2-(2-butoxyethoxy)ethanol 10 10 10 10 8 9 23 26 25 2-butoxyethanol 0 0 0 0 0 0 0 0 0 ALDEHYDES benzaldehyde 0.9 0.4 0.7 2 1 2 1 2 2 nonanal 2 0.9 1 3 3 3 3 2 2 ACIDS acetic acid 34 45 40 38 38 38 38 49 43 hexanoic acid 0 0 0 0 0 0 0.9 2 1 ESTERS AND LACTONES texanol 0 0 0 0 0 0 1 1 1 TXIB 0 0 0 0 0 0 0.4 0.9 0.7 Total 119 133 126 80 75 78 145 171 158 TVOC 15 17 16 27 15 21 32 37 35 non-TVOC 34 45 40 38 38 38 38 49 43

APPENDIX C 304
Table C129. Background emission values of primer A and paint C in the FLEC test. (µg/m³) ALDEHYDES decanal 17 Total 17 TVOC 57 non-TVOC 0
Table C130. Emission values of primer A and paint C at 14 days in the FLEC test. (µg/m²·h) RH 20 % RH 50 % RH 80 % ALIPH. AND ALICYCLIC COMPOUNDS hexane 2 2 2 0 0.9 0 0 0 0 heptane 7 8 7 3 3 3 0 0 0 octane 7 7 7 3 3 3 0 0 0 nonane 0 0.9 0.5 0 0 0 0 0 0 decane 2 2 2 1 1 1 0 0 0 undecane 12 12 12 5 5 5 2 2 2 dodecane 9 9 9 4 4 4 1 1 1 tridecane 2 2 2 0.9 0.9 0.9 0 0 0 A MIXTURE OF HYDROCARBONS hydrocarbon-mixture 186 211 199 112 112 112 54 41 48 MONATOMIC ALCOHOLS 1-butanol 4 4 4 0 0 0 0 0 0 2-ethyl-1-hexanol 0 0 0 0.9 0 0.5 1 0.9 1 DIVALENT ALCOHOLS 1,2-propanediol 705 688 696 432 480 456 542 560 551 PHENOLS phenol 0.9 0.9 0.9 0.9 0.9 0.9 0.9 0.9 0.9 ALCOHOL AND PHENOL ETHERS 2-(2-butoxyethoxy)ethanol 0 0 0 4 4 4 5 6 6 2-butoxyethanol 2 2 2 0 0 0 2 0 1 ALDEHYDES benzaldehyde 0.9 0.9 0.9 1 0 1 0 0 0 n-butanal 9 8 9 6 6 6 3 4 3 pentanal 43 44 44 28 29 28 16 18 17 hexanal 145 145 145 97 93 95 53 57 55 heptanal 13 13 13 11 12 11 8 9 9 octanal 17 18 17 17 17 17 12 12 12 nonanal 17 19 18 17 18 17 13 13 13 decanal 0.9 0 0.5 3 2 2 0 0 0 2-decenal 10 10 10 8 8 8 8 8 8 KETONES 2-butanone (MEK) 5 4 4 2 3 3 0 3 2 acetone 18 17 17 12 11 12 10 9 10 ACIDS acetic acid 53 88 71 30 57 44 32 30 31 propanoic acid 7 7 7 0 0 0 0 0 0 butanoic acid 8 8 8 10 11 10 6 6 6 pentanoic acid 44 44 44 34 37 35 26 29 28 hexanoic acid 190 190 190 159 181 170 137 154 145 2-etylhexanoic-acid 27 27 27 29 39 34 49 53 51 ESTERS AND LACTONES 2-(2-butoxyethoxy)ethyl acetate 0 0 0 0 0 0 0.9 0.9 0.9 texanol 216 207 212 287 287 287 498 502 500 TXIB 1 1 1 1 2 2 2 2 2 Total 1765 1797 1781 1318 1424 1371 1483 1521 1502 TVOC 1000 987 994 815 820 818 892 927 909 non-TVOC 84 117 101 51 77 64 45 45 45

APPENDIX C 305
Table C131. Background emission values of primer and paint C in the FLEC test. (µg/m³) ALIPHATIC AND ALICYCLIC COMPOUNDS ACIDS nonane 0.7 acetic acid 27 MONATOMIC ALCOHOLS 2-ethyl-1-hexanol 2 Total 35 ALDEHYDES TVOC 20 benzaldehyde 0.9 non-TVOC 27 ALCOHOL AND PHENOL ETHERS 2-butoxyethanol 4
Table C132. Emission values of primer and paint C at 14 days in the FLEC test. (µg/m²·h) RH 20 % RH 50 % RH 80 % ALIPH. AND ALICYCLIC COMPOUNDS pentane 34 39 36 14 17 15 0 0 0 hexane 10 9 10 5 5 5 0 0 0 heptane 34 33 34 17 17 17 0 0 0 octane 30 30 30 16 16 16 0 0 0 decane 16 15 15 6 6 6 0 0 0 undecane 57 53 55 27 26 26 5 5 5 dodecane 18 18 18 10 10 10 0 0 0 A MIXTURE OF HYDROCARBONS hydrocarbon-mixture 420 395 407 309 320 314 194 175 184 MONATOMIC ALCOHOLS 1-pentanol 23 23 23 14 15 14 8 8 8 ALCOHOL AND PHENOL ETHERS 2-(2-butoxyethoxy)ethanol 0 0 0 0 0 0 6 5 6 ALDEHYDES n-butanal 12 9 11 8 9 8 7 5 6 pentanal 42 42 42 33 34 34 30 30 30 hexanal 128 128 128 110 110 110 110 106 108 heptanal 13 13 13 11 11 11 11 11 11 octanal 18 17 17 16 16 16 17 16 16 2-octenal 7 6 7 8 7 7 6 6 6 nonanal 19 19 19 20 16 18 19 19 19 decanal 0 0 0 6 0 3 0 0 0 2-decenal 11 10 11 11 12 11 13 13 13 undecenal 6 6 6 9 9 9 13 13 13 KETONES 2-butanone (MEK) 11 10 11 8 8 8 0 0 0 2-heptanone 12 16 14 0 0 0 0 0 0 ACIDS acetic acid 57 88 73 29 38 33 17 14 15 propanoic acid 159 154 157 79 88 84 33 37 35 butanoric acid 43 40 41 25 26 26 12 12 12 pentanoic acid 119 115 117 84 88 86 57 62 60 hexanoic acid 489 467 478 410 436 423 326 344 335 2-etylhexanoic-acid 71 66 68 84 88 86 88 93 90 heptanoic acid 15 14 15 13 14 13 7 8 7 Total 1873 1835 1854 1382 1441 1411 977 980 978 TVOC 1075 1058 1067 851 837 844 533 542 538 non-TVOC 114 146 130 58 72 65 23 19 21
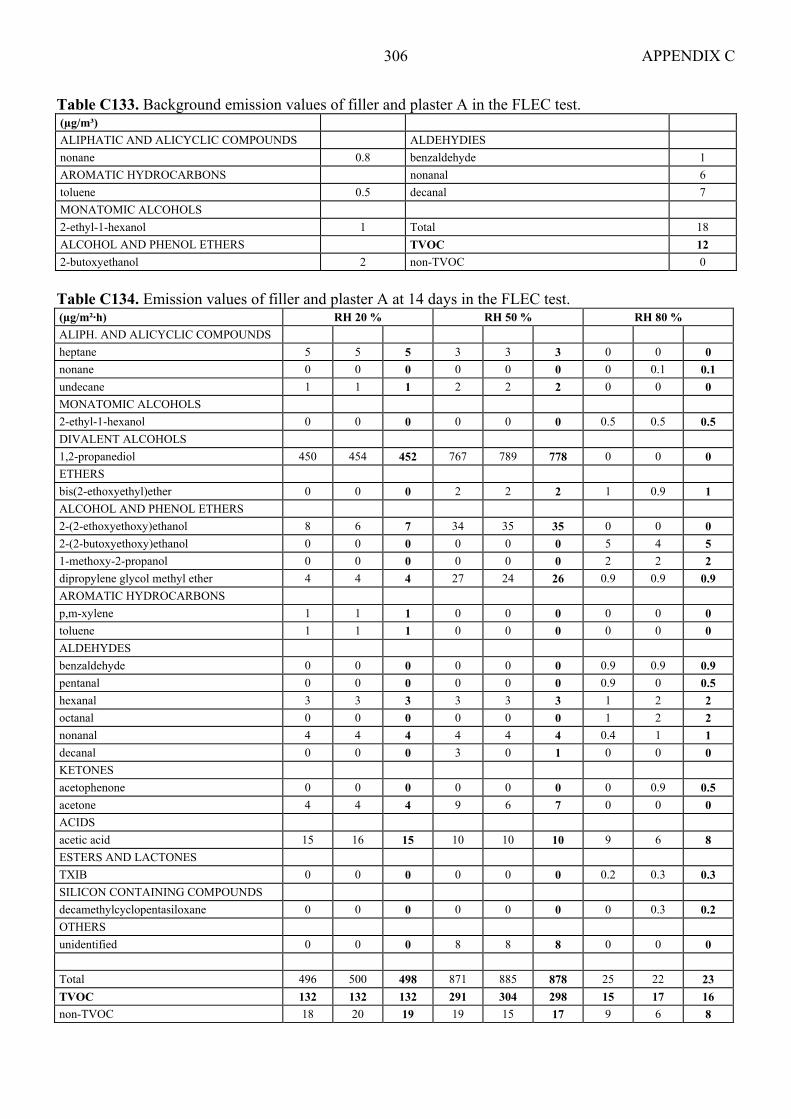
APPENDIX C 306
Table C133. Background emission values of filler and plaster A in the FLEC test. (µg/m³) ALIPHATIC AND ALICYCLIC COMPOUNDS ALDEHYDIES nonane 0.8 benzaldehyde 1 AROMATIC HYDROCARBONS nonanal 6 toluene 0.5 decanal 7 MONATOMIC ALCOHOLS 2-ethyl-1-hexanol 1 Total 18 ALCOHOL AND PHENOL ETHERS TVOC 12 2-butoxyethanol 2 non-TVOC 0
Table C134. Emission values of filler and plaster A at 14 days in the FLEC test. (µg/m²·h) RH 20 % RH 50 % RH 80 % ALIPH. AND ALICYCLIC COMPOUNDS heptane 5 5 5 3 3 3 0 0 0 nonane 0 0 0 0 0 0 0 0.1 0.1 undecane 1 1 1 2 2 2 0 0 0 MONATOMIC ALCOHOLS 2-ethyl-1-hexanol 0 0 0 0 0 0 0.5 0.5 0.5 DIVALENT ALCOHOLS 1,2-propanediol 450 454 452 767 789 778 0 0 0 ETHERS bis(2-ethoxyethyl)ether 0 0 0 2 2 2 1 0.9 1 ALCOHOL AND PHENOL ETHERS 2-(2-ethoxyethoxy)ethanol 8 6 7 34 35 35 0 0 0 2-(2-butoxyethoxy)ethanol 0 0 0 0 0 0 5 4 5 1-methoxy-2-propanol 0 0 0 0 0 0 2 2 2 dipropylene glycol methyl ether 4 4 4 27 24 26 0.9 0.9 0.9 AROMATIC HYDROCARBONS p,m-xylene 1 1 1 0 0 0 0 0 0 toluene 1 1 1 0 0 0 0 0 0 ALDEHYDES benzaldehyde 0 0 0 0 0 0 0.9 0.9 0.9 pentanal 0 0 0 0 0 0 0.9 0 0.5 hexanal 3 3 3 3 3 3 1 2 2 octanal 0 0 0 0 0 0 1 2 2 nonanal 4 4 4 4 4 4 0.4 1 1 decanal 0 0 0 3 0 1 0 0 0 KETONES acetophenone 0 0 0 0 0 0 0 0.9 0.5 acetone 4 4 4 9 6 7 0 0 0 ACIDS acetic acid 15 16 15 10 10 10 9 6 8 ESTERS AND LACTONES TXIB 0 0 0 0 0 0 0.2 0.3 0.3 SILICON CONTAINING COMPOUNDS decamethylcyclopentasiloxane 0 0 0 0 0 0 0 0.3 0.2 OTHERS unidentified 0 0 0 8 8 8 0 0 0 Total 496 500 498 871 885 878 25 22 23 TVOC 132 132 132 291 304 298 15 17 16 non-TVOC 18 20 19 19 15 17 9 6 8

APPENDIX C 307
Table C135. Background emission values of filler and plaster B in the FLEC test. (µg/m³) ALIPHATIC AND ALICYCLIC COMPOUNDS ALDEHYDES nonane 1 benzaldehyde 1 AROMATIC HYDROCARBONS SILICON CONTAINING COMPOUNDS toluene 1 organic Si-comp. 8 MONATOMIC ALCOHOLS Total 17 2-ethyl-1-hexanol 2 TVOC 16 ALCOHOL AND PHENOL ETHERS non-TVOC 0 2-butoxyethanol 4 Table C136. Emission values of filler and plaster B at 14 days in the FLEC test. (µg/m²·h) RH 20 % RH 50 % RH 80 % AROMATIC HYDROCARBONS styrene 0 0 0 9 9 9 0 0 0 MONATOMIC ALCOHOLS 2-ethyl-1-hexanol 153 153 153 172 172 172 172 176 174 ETHERS bis(2-ethoxyethyl)ether 20 20 20 17 16 16 6 6 6 ALCOHOL AND PHENOL ETHERS 2-(2-ethoxyethoxy)ethanol 379 379 379 40 39 39 6 5 6 2-(2-butoxyethoxy)ethanol 313 313 313 168 168 168 43 39 41 KETONES acetone 0 0 0 19 11 15 10 10 10 ACIDS acetic acid 14 12 13 19 9 14 6 12 9 ESTERS AND LACTONES texanol 75 75 75 150 150 150 168 159 163 2-ethylhexylacetate 207 207 207 123 119 121 53 49 51 2-ethylhexylacrylate 79 79 79 38 38 38 12 12 12 2-ethyl-1-hexylpropionate 71 71 71 42 41 42 15 15 15 NITROGEN CONTAINING COMPOUNDS 2-amino-2-methyl-1-propanol 12 15 13 20 25 22 19 26 22 4,4-dimethyl-1,3-oxazolidine 802 802 802 696 683 690 242 207 225 dimethylperhydro-1,3-oxazine 132 132 132 110 110 110 49 44 46 SILICON CONTAINING COMPOUNDS organic Si-comp. 85 85 85 23 23 23 9 2 6 Total 2342 2343 2342 1646 1611 1629 809 761 785 TVOC 2073 2100 2086 1626 1569 1598 780 732 756 non-TVOC 14 12 13 38 19 29 15 22 19

APPENDIX C 308
Table C137. Background emission values of a 6 mm layer of plaster C in the FLEC test. (µg/m³) ALCOHOL AND PHENOL ETHERS 2-butoxyethanol 12 TVOC 39
Table C138. Emission values of a 6 mm layer of plaster C at 14 days in the FLEC test. (µg/m²·h) RH 20 % RH 50 % RH 80 % ALIPH. AND ALICYCLIC COMPOUNDS decane 0 0 0 0.2 0.3 0.3 0 0 0 undecane 0 0.4 0.2 0 0 0 0 0 0 dodecane 0.3 0 0.2 0.9 0.9 1 0.3 0 0.2 tridecane 0.4 0.4 0.4 3 3 3 0.3 0.4 0.4 tetradecane 3 2 2 4 4 4 0.4 0.4 0 pentadecane 1 1 1 1 1.3 1 0 0 0 hexadecane 1 0.9 1 0.9 0.9 1 0 0 0 2,2,4,6,6-pentamethylheptane 0 0 0 0.9 0.9 1 0.9 0.9 1 aliphatic hydrocarb. 0 0 0 7 7 7 0 0 0 A MIXTURE OF HYDROCARBONS hydrocarbon-mixture 0 0 0 70 62 66 0 0 0 AROMATIC HYDROCARBONS benzene 0.4 0.2 0.3 0.3 0.2 0.3 0.4 0.2 0.3 ethylbenzene 0.2 0.2 0.2 0 0 0 0 0 0 p,m-xylene 0.9 0.9 1 0.4 0.4 0 0.3 0.3 0.3 o-xylene 0.3 0.3 0.3 0 0 0 0 0 0 toluene 1.8 1.8 2 0.9 0.9 1 0.9 0.9 1 1,2,4-trimethylbenzene 0.4 0.4 0.4 0.2 0 0.1 0 0 0 MONATOMIC ALCOHOLS 2-propanol 4 4 4 4 4 4 0 0 0 2-ethyl-1-hexanol 0 0 0 0 0 0 0.3 0 0.2 benzyl alcohol 0.9 0.9 1 0 0 0 0 0 0 ETHERS bis(2-methoxyethyl)ether 4 4 4 0 0 0 0 0 0 PHENOLS phenol 2 0 1 0 0 0 0 2.6 1 ALCOHOL AND PHENOL ETHERS 2-phenoxyethanol 1 1 1 0.4 0 0 0 0 0 2-methoxyethanol 2 2 2 0.4 0.4 0 0 0 0 ALDEHYDES benzaldehyde 2 1 2 1 0.3 0.8 1 2 2 nonanal 3 3 3 3 4 3 3 6 5 decanal 2 2 2 1 2 2 3 4 3 KETONES 2-butanone (MEK) 0 2 1 0 0 0 0 0 0 acetophenone 0.4 0.9 1 0.3 0 0.2 0.9 0.4 1 acetone 5 5 5 4 4.4 4 4 4 4 ACIDS acetic acid 18 35 26 13 13 13 31 18 24 ESTERS AND LACTONES 1-methoxy-2-propylacetate 0 0 0 0 0 0 0.4 0 0.2 NITROGEN CONTAINING COMPOUNDS 1-methyl-2-pyrrolidinone 0.4 0 0.2 0 0 0 0 0 0 SILICON CONTAINING COMPOUNDS organic Si-comp. 7 11 9 20 23 22 13 11 12 decamethylcyclopentasiloxane 0 0 0 0 0 0 0 0.9 0 Total 62 82 72 138 132 135 61 51 56 TVOC 70 71 71 137 115 126 15 20 18 non-TVOC 27 44 35 20 21 21 35 22 28

APPENDIX C 309
Table C139. Background emission values of primer and paint A spread onto gypsum board in the FLEC test.
(µg/m³) TVOC 501)
1) Italic font indicates that the value is below the detection limit. Table C140. Emission values of primer and paint A spread onto gypsum board at 14 days in the FLEC test. (µg/m²·h) RH 20 % RH 50 % RH 80 % ALIPH. AND ALICYCLIC COMPOUNDS nonane 0 0 0 0.4 0.4 0.4 0.4 0.4 0.4 AROMATIC HYDROCARBONS p,m-xylene 0.4 0 0.2 0 0.4 0.2 0 0.4 0.2 toluene 0 0 0 0 0 0 0 0.4 0.2 MONATOMIC ALCOHOLS 1-butanol 0.9 0.9 0.9 2 2 2 2 2 2 2-ethyl-1-hexanol 0 0 0 0 0 0 0 0.4 0.2 DIVALENT ALCOHOLS 1,2-propanediol 269 260 264 176 168 172 771 767 769 ALCOHOL AND PHENOL ETHERS 2-(2-ethoxyethoxy)ethanol 0 0 0 0 0 0 1 2 2 2-butoxyethanol 0 0 0 0.9 0.4 0.7 0.4 0.4 0.4 ALDEHYDES benzaldehyde 0.9 1 1 1 1 1 1 2 2 n-butanal 3 0 1 0.9 0.9 0.9 0.9 0.9 0.9 hexanal 0 0.9 0.5 0.9 0.9 0.9 0.9 0.9 0.9 nonanal 0.9 1 1 0.9 0 0.5 2 1 2 decanal 3 2 2 2 3 2 3 2 3 KETONES acetone 4 3 4 4 3 3 4 4 4 ACIDS acetic acid 168 5 86 10 4 7 26 21 24 propanoic acid 34 0 17 0 0 0 2 0 1 ESTERS AND LACTONES 1-methoxy-2-propyl acetate 0 0 0 0 0 0 0.4 0 0.2 texanol 287 295 291 304 291 298 392 397 394 TXIB 0.4 0.4 0.4 0.4 0.9 0.7 1 0.9 1 ethyl acetate 1 0 1 0 0 0 0 0 0 HALOGEN CONTAINING COMPOUNDS dichloromethane 0.9 1 1 1 0.9 1 0 0 0 Total 771 572 671 506 476 491 1210 1202 1206 TVOC 304 309 306 300 295 298 740 749 745 non-TVOC 172 10 91 15 8 11 30 24 27
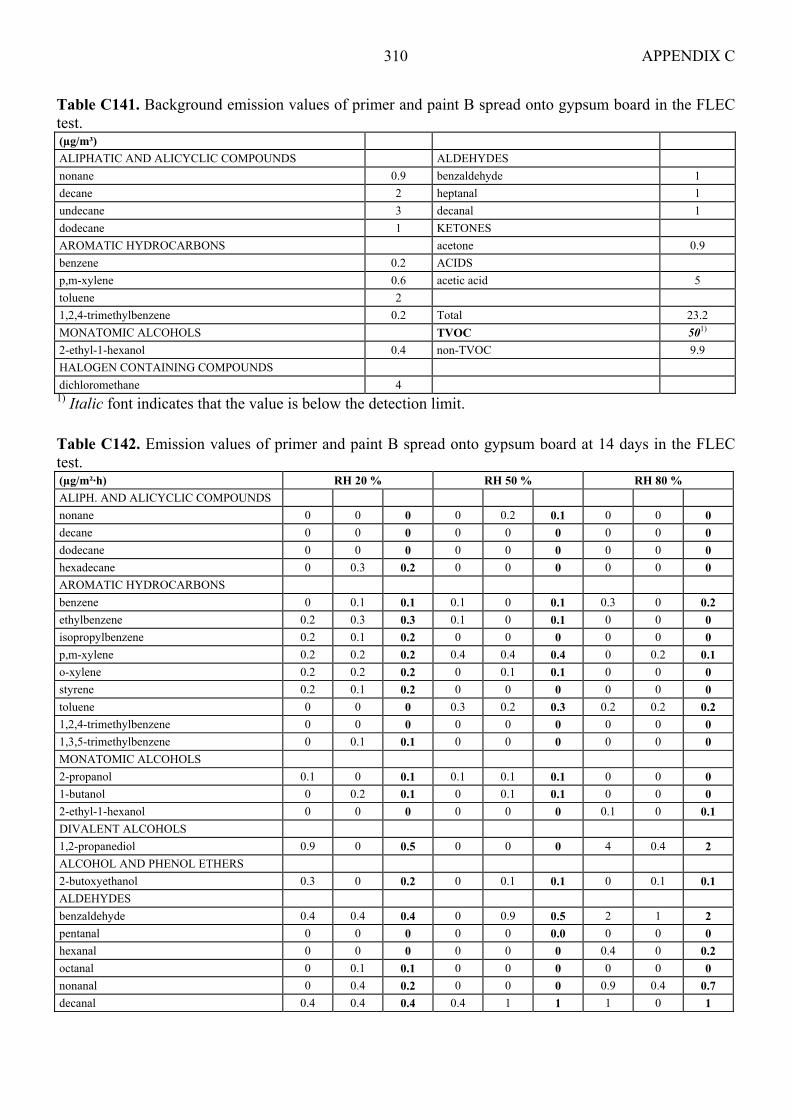
APPENDIX C 310
Table C141. Background emission values of primer and paint B spread onto gypsum board in the FLEC test. (µg/m³) ALIPHATIC AND ALICYCLIC COMPOUNDS ALDEHYDES nonane 0.9 benzaldehyde 1 decane 2 heptanal 1 undecane 3 decanal 1 dodecane 1 KETONES AROMATIC HYDROCARBONS acetone 0.9 benzene 0.2 ACIDS p,m-xylene 0.6 acetic acid 5 toluene 2 1,2,4-trimethylbenzene 0.2 Total 23.2 MONATOMIC ALCOHOLS TVOC 501) 2-ethyl-1-hexanol 0.4 non-TVOC 9.9 HALOGEN CONTAINING COMPOUNDS dichloromethane 4 1) Italic font indicates that the value is below the detection limit. Table C142. Emission values of primer and paint B spread onto gypsum board at 14 days in the FLEC test. (µg/m²·h) RH 20 % RH 50 % RH 80 % ALIPH. AND ALICYCLIC COMPOUNDS nonane 0 0 0 0 0.2 0.1 0 0 0 decane 0 0 0 0 0 0 0 0 0 dodecane 0 0 0 0 0 0 0 0 0 hexadecane 0 0.3 0.2 0 0 0 0 0 0 AROMATIC HYDROCARBONS benzene 0 0.1 0.1 0.1 0 0.1 0.3 0 0.2 ethylbenzene 0.2 0.3 0.3 0.1 0 0.1 0 0 0 isopropylbenzene 0.2 0.1 0.2 0 0 0 0 0 0 p,m-xylene 0.2 0.2 0.2 0.4 0.4 0.4 0 0.2 0.1 o-xylene 0.2 0.2 0.2 0 0.1 0.1 0 0 0 styrene 0.2 0.1 0.2 0 0 0 0 0 0 toluene 0 0 0 0.3 0.2 0.3 0.2 0.2 0.2 1,2,4-trimethylbenzene 0 0 0 0 0 0 0 0 0 1,3,5-trimethylbenzene 0 0.1 0.1 0 0 0 0 0 0 MONATOMIC ALCOHOLS 2-propanol 0.1 0 0.1 0.1 0.1 0.1 0 0 0 1-butanol 0 0.2 0.1 0 0.1 0.1 0 0 0 2-ethyl-1-hexanol 0 0 0 0 0 0 0.1 0 0.1 DIVALENT ALCOHOLS 1,2-propanediol 0.9 0 0.5 0 0 0 4 0.4 2 ALCOHOL AND PHENOL ETHERS 2-butoxyethanol 0.3 0 0.2 0 0.1 0.1 0 0.1 0.1 ALDEHYDES benzaldehyde 0.4 0.4 0.4 0 0.9 0.5 2 1 2 pentanal 0 0 0 0 0 0.0 0 0 0 hexanal 0 0 0 0 0 0 0.4 0 0.2 octanal 0 0.1 0.1 0 0 0 0 0 0 nonanal 0 0.4 0.2 0 0 0 0.9 0.4 0.7 decanal 0.4 0.4 0.4 0.4 1 1 1 0 1
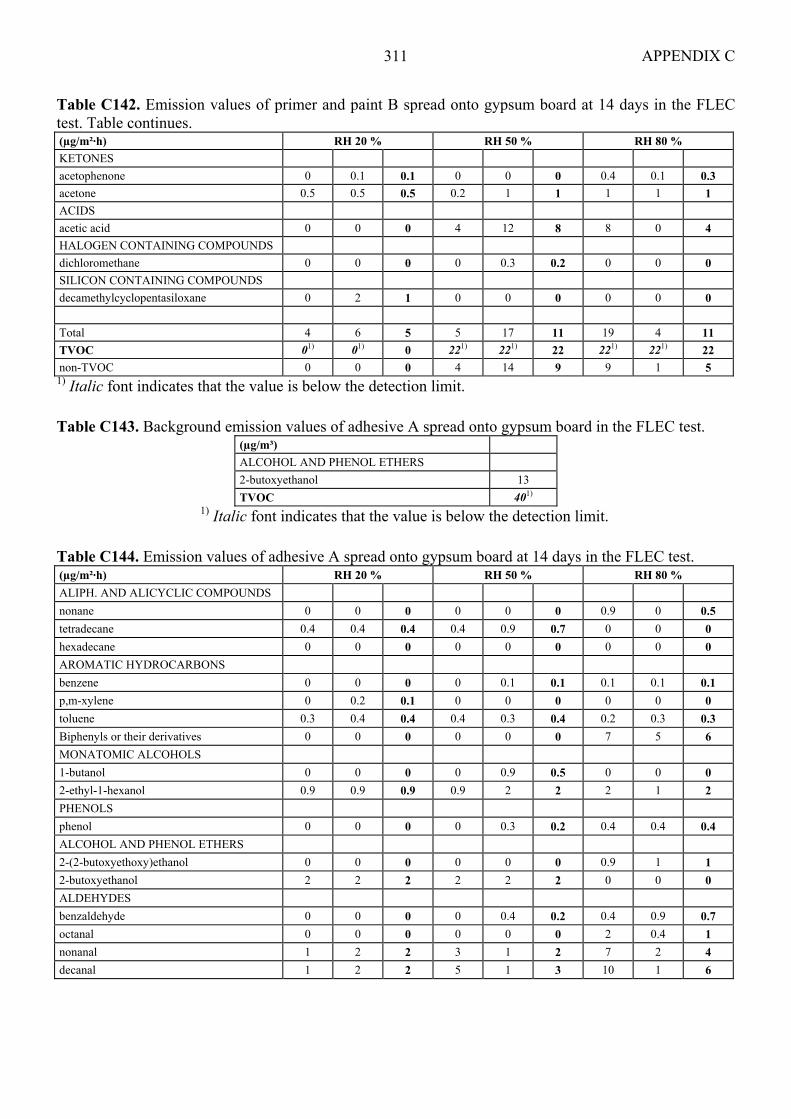
APPENDIX C 311
Table C142. Emission values of primer and paint B spread onto gypsum board at 14 days in the FLEC test. Table continues. (µg/m²·h) RH 20 % RH 50 % RH 80 % KETONES acetophenone 0 0.1 0.1 0 0 0 0.4 0.1 0.3 acetone 0.5 0.5 0.5 0.2 1 1 1 1 1 ACIDS acetic acid 0 0 0 4 12 8 8 0 4 HALOGEN CONTAINING COMPOUNDS dichloromethane 0 0 0 0 0.3 0.2 0 0 0 SILICON CONTAINING COMPOUNDS decamethylcyclopentasiloxane 0 2 1 0 0 0 0 0 0 Total 4 6 5 5 17 11 19 4 11 TVOC 01) 01) 0 221) 221) 22 221) 221) 22 non-TVOC 0 0 0 4 14 9 9 1 5 1) Italic font indicates that the value is below the detection limit. Table C143. Background emission values of adhesive A spread onto gypsum board in the FLEC test.
(µg/m³) ALCOHOL AND PHENOL ETHERS 2-butoxyethanol 13 TVOC 401)
1) Italic font indicates that the value is below the detection limit. Table C144. Emission values of adhesive A spread onto gypsum board at 14 days in the FLEC test. (µg/m²·h) RH 20 % RH 50 % RH 80 % ALIPH. AND ALICYCLIC COMPOUNDS nonane 0 0 0 0 0 0 0.9 0 0.5 tetradecane 0.4 0.4 0.4 0.4 0.9 0.7 0 0 0 hexadecane 0 0 0 0 0 0 0 0 0 AROMATIC HYDROCARBONS benzene 0 0 0 0 0.1 0.1 0.1 0.1 0.1 p,m-xylene 0 0.2 0.1 0 0 0 0 0 0 toluene 0.3 0.4 0.4 0.4 0.3 0.4 0.2 0.3 0.3 Biphenyls or their derivatives 0 0 0 0 0 0 7 5 6 MONATOMIC ALCOHOLS 1-butanol 0 0 0 0 0.9 0.5 0 0 0 2-ethyl-1-hexanol 0.9 0.9 0.9 0.9 2 2 2 1 2 PHENOLS phenol 0 0 0 0 0.3 0.2 0.4 0.4 0.4 ALCOHOL AND PHENOL ETHERS 2-(2-butoxyethoxy)ethanol 0 0 0 0 0 0 0.9 1 1 2-butoxyethanol 2 2 2 2 2 2 0 0 0 ALDEHYDES benzaldehyde 0 0 0 0 0.4 0.2 0.4 0.9 0.7 octanal 0 0 0 0 0 0 2 0.4 1 nonanal 1 2 2 3 1 2 7 2 4 decanal 1 2 2 5 1 3 10 1 6
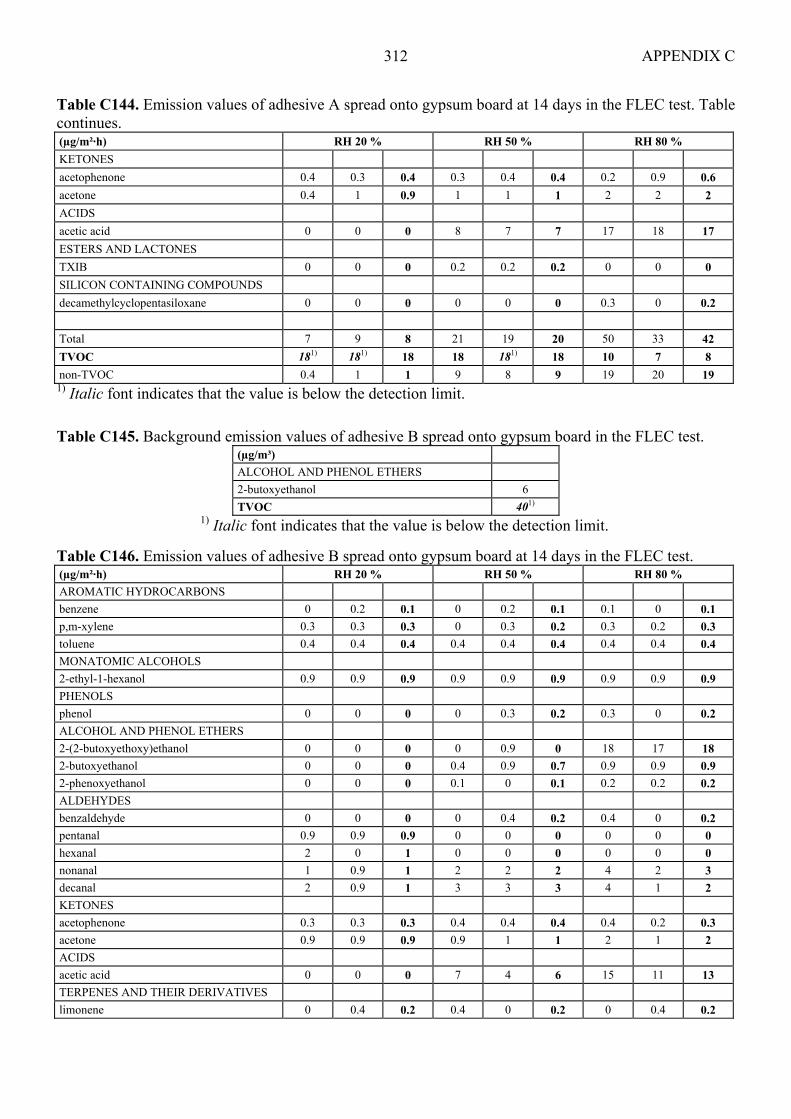
APPENDIX C 312
Table C144. Emission values of adhesive A spread onto gypsum board at 14 days in the FLEC test. Table continues. (µg/m²·h) RH 20 % RH 50 % RH 80 % KETONES acetophenone 0.4 0.3 0.4 0.3 0.4 0.4 0.2 0.9 0.6 acetone 0.4 1 0.9 1 1 1 2 2 2 ACIDS acetic acid 0 0 0 8 7 7 17 18 17 ESTERS AND LACTONES TXIB 0 0 0 0.2 0.2 0.2 0 0 0 SILICON CONTAINING COMPOUNDS decamethylcyclopentasiloxane 0 0 0 0 0 0 0.3 0 0.2 Total 7 9 8 21 19 20 50 33 42 TVOC 181) 181) 18 18 181) 18 10 7 8 non-TVOC 0.4 1 1 9 8 9 19 20 19 1) Italic font indicates that the value is below the detection limit. Table C145. Background emission values of adhesive B spread onto gypsum board in the FLEC test.
(µg/m³) ALCOHOL AND PHENOL ETHERS 2-butoxyethanol 6 TVOC 401)
1) Italic font indicates that the value is below the detection limit. Table C146. Emission values of adhesive B spread onto gypsum board at 14 days in the FLEC test. (µg/m²·h) RH 20 % RH 50 % RH 80 % AROMATIC HYDROCARBONS benzene 0 0.2 0.1 0 0.2 0.1 0.1 0 0.1 p,m-xylene 0.3 0.3 0.3 0 0.3 0.2 0.3 0.2 0.3 toluene 0.4 0.4 0.4 0.4 0.4 0.4 0.4 0.4 0.4 MONATOMIC ALCOHOLS 2-ethyl-1-hexanol 0.9 0.9 0.9 0.9 0.9 0.9 0.9 0.9 0.9 PHENOLS phenol 0 0 0 0 0.3 0.2 0.3 0 0.2 ALCOHOL AND PHENOL ETHERS 2-(2-butoxyethoxy)ethanol 0 0 0 0 0.9 0 18 17 18 2-butoxyethanol 0 0 0 0.4 0.9 0.7 0.9 0.9 0.9 2-phenoxyethanol 0 0 0 0.1 0 0.1 0.2 0.2 0.2 ALDEHYDES benzaldehyde 0 0 0 0 0.4 0.2 0.4 0 0.2 pentanal 0.9 0.9 0.9 0 0 0 0 0 0 hexanal 2 0 1 0 0 0 0 0 0 nonanal 1 0.9 1 2 2 2 4 2 3 decanal 2 0.9 1 3 3 3 4 1 2 KETONES acetophenone 0.3 0.3 0.3 0.4 0.4 0.4 0.4 0.2 0.3 acetone 0.9 0.9 0.9 0.9 1 1 2 1 2 ACIDS acetic acid 0 0 0 7 4 6 15 11 13 TERPENES AND THEIR DERIVATIVES limonene 0 0.4 0.2 0.4 0 0.2 0 0.4 0.2

APPENDIX C 313
Table C146. Emission values of adhesive B spread onto gypsum board at 14 days in the FLEC test. Table continues. (µg/m²·h) RH 20 % RH 50 % RH 80 % SILICON CONTAINING COMPOUNDS decamethylcyclopentasiloxane 0 0 0 0 0.1 0.1 0 0.1 0.1 SULPHUR CONTAINING COMPOUNDS 5-chloro-2-methyl-3(2H)-isotiatsolon 0 0 0 0 0 0 0.4 0.3 0.4 Total 9 6 7 15 15 15 47 36 41 TVOC 01) 01) 0 181) 181) 18 22 20 21 non-TVOC 0.9 0.9 1 8 5 7 17 12 15 1) Italic font indicates that the value is below the detection limit. Table C147. Background emission values of primer and paint A spread onto filler and plaster B applied onto calcium silicate brick in the FLEC test.
(µg/m³) TVOC 18
Table C148. Emission values of primer and paint A spread onto filler and plaster B applied onto calcium silicate brick at 14 days in the FLEC test. (µg/m²·h) RH 20 % RH 50 % RH 80 % ALIPH. AND ALICYCLIC COMPOUNDS 1-dodecene 8 11 10 - - - 10 9 10 AROMATIC HYDROCARBONS styrene 3 3 3 - - - 2 0 1 MONATOMIC ALCOHOLS 2-propanol 16 12 14 - - - 8 7 7 1-butanol 0 0 0 - - - 4 4 4 2-ethyl-1-hexanol 49 49 49 - - - 62 53 57 DIVALENT ALCOHOLS 1,2-propanediol 569 577 573 - - - 613 582 597 ETHERS butylether 0.4 0.4 0.4 - - - 0.4 0.4 0.4 bis[2-(2-ethoxyethoxy)ethyl]ether 3 4 3 - - - 8 7 7 ALCOHOL AND PHENOL ETHERS 2-(2-ethoxyethoxy)ethanol 28 29 28 - - - 39 37 38 2-[2-(2ethoxy)ethoxy]ethanol 0.4 0.4 0 - - - 0.9 1 1 2-(2-butoxyethoxy)ethanol 84 88 86 - - - 119 119 119 ALDEHYDES benzaldehyde 2 3 3 - - - 3 4 3 KETONES acetone 4 4 4 - - - 5 4 5 ESTERS AND LACTONES texanol 287 304 295 - - - 476 463 469 TXIB 0 0 0 - - - 2 2 2 2-ethylhexyl acetate 12 13 13 - - - 11 10 10 2-ethylhexyl acrylate 7 7 7 - - - 6 6 6 2-ethyl-1-hexyl propionate 7 9 8 - - - 5 5 5 NITROGEN CONTAINING COMPOUNDS 4,4-dimethyl-1,3-oxazolidine 31 28 29 - - - 185 172 179 dimethylperhydro-1,3-oxazine 3 3 3 - - - 16 15 15 SILICON CONTAINING COMPOUNDS organic Si-comp. 0 0 0 - - - 7 8 7 Total 1113 1143 1128 - - - 1581 1507 1544 TVOC 564 582 573 - - - 1049 1000 1025 non-TVOC 21 16 18 - - - 12 12 12

APPENDIX C 314
Table C149. Background emission values of primer and paint A spread onto plaster C applied onto calcium silicate brick in the FLEC test.
(µg/m³) TVOC 201)
1) Italic font indicates that the value is below the detection limit. Table C150. Emission values of primer and paint A spread onto plaster C applied onto calcium silicate brick at 14 days in the FLEC test. (µg/m²·h) RH 20 % RH 50 % RH 80 % ALIPH. AND ALICYCLIC COMPOUNDS 1-dodecene 8 11 10 - - - 10 11 10 pentadecane 0 0 0 - - - 0.9 0 0 hexadecane 1 1 1 - - - 1 1 1 AROMATIC HYDROCARBONS p,m-xylene 0 0.4 0.2 - - - 0 0 0 toluene 0 0.4 0.2 - - - 0 0 0 MONATOMIC ALCOHOLS 2-propanol 5 5 5 - - - 0 0 0 1-butanol 1 1 1 - - - 3 3 3 2-ethyl-1-hexanol 0 0 0 - - - 0.9 0.4 0.7 benzyl alcohol 0.4 0.4 0.4 - - - 1 3 2 DIVALENT ALCOHOLS 1,2-propanediol 238 207 223 - - - 599 599 599 ALCOHOL AND PHENOL ETHERS 2-(2-ethoxyethoxy)ethanol 0 0 0 - - - 0 0.4 0.2 2-(2-butoxyethoxy)ethanol 4 6 5 - - - 13 13 13 ALDEHYDES benzaldehyde 0.4 0.9 0.7 - - - 0.4 1 0.9 pentanal 1 0.9 1 - - - 0 1 1 hexanal 0 0 0 - - - 2 2 2 nonanal 0.9 0 0.5 - - - 2 0 1 decanal 2 0 1 - - - 3 6 4 KETONES acetone 3 9 6 - - - 4 4 4 ESTERS AND LACTONES 2-(2-butoxyethoxy)ethyl acetate 0 0 0 - - - 0 0.9 0.5 texanol 326 326 326 - - - 273 282 278 TXIB 2 2 2 - - - 4 4 4 NITROGEN CONTAINING COMPOUNDS 1-methyl-2-pyrrolidinone 0.9 0.9 0.9 - - - 4 4 4 SILICON CONTAINING COMPOUNDS decamethylcyclopentasiloxane 0.4 0.4 0.4 - - - 0.4 1 1 Total 595 573 584 - - - 921 937 929 TVOC 392 383 388 - - - 502 520 511 non-TVOC 8 14 11 - - - 4 4 4
APPENDIX C 315
Table C151. Background emission values of primer and paint B spread onto filler and plaster B applied onto calcium silicate brick in the FLEC test.
(µg/m³) TVOC 201)
1) Italic font indicates that the value is below the detection limit. Table C152. Emission values of primer and paint B spread onto filler and plaster B applied onto calcium silicate brick at 14 days in the FLEC test. (µg/m²·h) RH 20 % RH 50 % RH 80 % ALIPH. AND ALICYCLIC COMPOUNDS pentadecane 0 0.4 0.2 - - - 0 0 0 hexadecane 0.9 1 1 - - - 1 0.4 0.9 AROMATIC HYDROCARBONS benzene 0 0.3 0.2 - - - 0 0.4 0.2 p,m-xylene 0.4 0.4 0.4 - - - 0 0 0 styrene 0 0 0 - - - 0.4 0 0.2 toluene 0.4 0.4 0.4 - - - 0 0 0 MONATOMIC ALCOHOLS 2-propanol 3 3 3 - - - 3 3 3 1-butanol 0 0 0 - - - 2 2 2 2-ethyl-1-hexanol 7 7 7 - - - 38 37 38 benzyl alcohol 0.9 0 0 - - - 1 1 1 DIVALENT ALCOHOLS 1,2-propanediol 24 24 24 - - - 38 34 36 ETHERS bis[2-(2-ethoxyethoxy)ethyl]ether 0 0 0 - - - 5 5 5 ALCOHOL AND PHENOL ETHERS 2-(2-ethoxyethoxy)ethanol 5 6 6 - - - 40 39 39 2-(2-butoxyethoxy)ethanol 16 19 17 - - - 141 141 141 2-butoxyethanol 0.4 0.4 0.4 - - - 0.4 0.4 0.4 ALDEHYDES benzaldehyde 3 1 2 - - - 3 4 4 octanal 0 2 1 - - - 2 1 2 nonanal 2 6 4 - - - 3 0.9 2 decanal 3 1 2 - - - 2 0.4 1 KETONES acetophenone 0 0.3 0.2 - - - 0 0 0 acetone 4 4 4 - - - 5 7 6 ESTERS AND LACTONES 2-(2-butoxyethoxy)ethyl acetate 0 0 0 - - - 0.9 0.4 0.7 texanol 9 8 9 - - - 35 33 34 2-ethylhexyl acetate 1 1 1 - - - 5 5 5 2-ethylhexyl acrylate 0.9 0.9 0.9 - - - 4 4 4 NITROGEN CONTAINING COMPOUNDS 1-methyl-2-pyrrolidinone 0.9 0.9 0.9 - - - 1 1 1 4,4-dimethyl-1,3-oxazolidine 0 0 0 - - - 79 79 79 dimethylperhydro-1,3-oxazine 0 0 0 - - - 6 5 6 SILICON CONTAINING COMPOUNDS decamethylcyclopentasiloxane 0 0.4 0.2 - - - 0.4 0.4 0.4 Total 81 89 85 - - - 417 404 411 TVOC 26 28 27 - - - 247 383 315 non-TVOC 6 7 7 - - - 8 9 9
APPENDIX C 316
Table C153. Background emission values of primer and paint B spread onto plaster C applied onto calcium silicate brick in the FLEC test.
(µg/m³) TVOC 18
Table C154. Emission values of primer and paint B spread onto plaster C applied onto calcium silicate brick at 14 days in the FLEC test. (µg/m²·h) RH 20 % RH 50 % RH 80 % ALIPH. AND ALICYCLIC COMPOUNDS nonane 0 0 0 0 0 0 1 0 1 decane 0 0 0 0 0 0 0 0 0 tridecane 0 0 0 0 0 0 0.2 0 0.1 pentadecane 0.2 0.2 0.2 0 0 0 0 0 0 hexadecane 0.2 0.4 0.3 0 0.4 0.2 0.9 0.4 0.7 AROMATIC HYDROCARBONS benzene 0.3 0.2 0.3 0 0 0 0 0 0 p,m-xylene 0.2 0.2 0.2 0.4 0 0.2 0 0 0 toluene 0.1 0.1 0.1 0.4 0.4 0.4 0.4 0.4 0.4 MONATOMIC ALCOHOLS 2-propanol 0 0 0 0.9 0 0.5 1 0.9 1 2-ethyl-1-hexanol 0.4 0.4 0.4 0.9 0 0.5 1 2 2 benzyl alcohol 0 0 0 0.9 0.9 0.9 1 2 2 DIVALENT ALCOHOLS 1,2-propanediol 3 0 1 3 2 2 16 15 16 ALCOHOL AND PHENOL ETHERS 2-(2-ethoxyethoxy)ethanol 0 0 0 0 0 0 2 1 2 2-(2-butoxyethoxy)ethanol 2 2 2 6 4 5 29 30 30 2-phenoxyethanol 0 0 0 0 0 0 0.4 0 0.2 ALDEHYDES benzaldehyde 2 2 2 2 3 2 2 2 2 octanal 0 0 0 0 0 0 2 1 2 nonanal 1 2 2 1 0 1 3 0.9 2 decanal 0 0.4 0.2 3 0 1 5 2 4 KETONES acetophenone 0.2 0.4 0.3 0 0.4 0.2 0.4 0.9 0.7 acetone 1 0.9 1 2 1 2 3 2 3 ACIDS acetic acid 0 0 0 0 53 26 57 0 29 hexanoic acid 0 0 0 0 0 0 18 11 14 ESTERS AND LACTONES 2-(2-butoxyethoxy)ethyl acetate 0 0 0 0 0 0 0.9 0.9 0.9 texanol 0 0 0 0 0 0 0.4 0 0.2 TXIB 0.1 0.1 0.1 0.2 0 0.1 0.4 0.4 0.4 NITROGEN CONTAINING COMPOUNDS 1-methyl-2-pyrrolidinone 0.4 0.4 0.4 0 0 0 0 0 0 SILICON CONTAINING COMPOUNDS organic Si-comp. 0 0 0 0 0 0 0 5 2 decamethylcyclopentasiloxane 0.2 0.1 0.2 0 0 0 0.4 2 1 Total 11 10 10 20 66 43 146 80 113 TVOC 8 12 10 10 7 8 37 44 40 non-TVOC 14 12 13 3 54 28 62 3 32
APPENDIX C 317
Table C155. Background emission values of adhesive A spread onto filler and plaster B applied onto calcium silicate brick in the FLEC test.
(µg/m³) TVOC 15
Table C156. Emission values of adhesive A spread onto filler and plaster B applied onto calcium silicate brick at 14 days in the FLEC test. (µg/m²·h) RH 20 % RH 50 % RH 80 % ALIPH. AND ALICYCLIC COMPOUNDS dodecane 0.2 0.4 0.3 - - - 0 0.9 0.5 pentadecane 0.9 0 0.5 - - - 0.9 0.9 0.9 AROMATIC HYDROCARBONS ethylbenzene 0.3 0 0.2 - - - 0 0 0 propylbenzene 0.2 0.2 0.2 - - - 0 0 0 isopropylbenzene 0.4 0.4 0.4 - - - 0.4 0.4 0.4 styrene 0.9 0.9 0.9 - - - 0.4 0.4 0.4 toluene 0.4 0 0.2 - - - 0 0 0 MONATOMIC ALCOHOLS 2-propanol 0.9 0 0.5 - - - 1 0.9 1 1-butanol 0 0 0 - - - 3 3 3 2-ethyl-1-hexanol 17 16 17 - - - 44 40 42 benzyl alcohol 0.9 0 0.5 - - - 0 0 0 DIVALENT ALCOHOLS 1,2-propanediol 2 3 2 - - - 2 3 2 PHENOLS phenol 0.9 0.9 0.9 - - - 1 0.9 1 ALCOHOL AND PHENOL ETHERS 2-(2-ethoxyethoxy)ethanol 16 34 25 - - - 57 53 55 2-(2-butoxyethoxy)ethanol 36 71 53 - - - 181 181 181 1-methoxy-2-propanol 0 0 0 - - - 2 0 1 2-butoxyethanol 0.4 0 0.2 - - - 0 0.4 0.2 ALDEHYDES benzaldehyde 3 1 2 - - - 4 3 3 pentanal 0 2 1 - - - 0 0 0 heptanal 0 0 0 - - - 0 0.9 0.5 octanal 1 0.9 1 - - - 0.9 0 0.5 nonanal 2 1 2 - - - 0.9 2 1 decanal 3 1 2 - - - 0 2 1 KETONES acetophenone 2 0.4 1 - - - 1 0.4 1 acetone 2 2 2 - - - 6 6 6 ESTERS AND LACTONES 2-(2-butoxyethoxy)ethyl acetate 0 0 0 - - - 0.9 1 1 1-methoxy-2-propyl acetate 0.4 0 0.2 - - - 0 0 0 texanol 2 5 4 - - - 49 57 53 TXIB 0.3 0.2 0.3 - - - 0 0 0 2-ethylhexyl acetate 9 8 9 - - - 14 11 12 2-ethylhexyl acrylate 4 4 4 - - - 7 7 7 2-ethyl-1-hexyl propionate 4 4 4 - - - 5 5 5 NITROGEN CONTAINING COMPOUNDS 1-methyl-2-pyrrolidinone 0 0 0 - - - 0.9 0 0.5 4,4-dimethyl-1,3-oxazolidine 11 17 14 - - - 361 366 364 dimethylperhydro-1,3-oxazine 2 2 2 - - - 36 35 35 SILICON CONTAINING COMPOUNDS organic Si-comp. 4 8 6 - - - 14 53 34 OTHERS phenyl maleinic acid anhydride 2 0 1 - - - 0 0 0 Total 129 184 156 - - - 793 832 813 TVOC 93 106 99 - - - 657 661 659 non-TVOC 3 2 2 - - - 7 6 7
APPENDIX C 318
Table C157. Background emission values of adhesive A spread onto plaster C applied onto calcium silicate brick in the FLEC test.
(µg/m³) TVOC 18
Table C158. Emission values of adhesive A spread onto plaster C applied onto calcium silicate brick at 14 days in the FLEC test. (µg/m²·h) RH 20 % RH 50 % RH 80 % ALIPH. AND ALICYCLIC COMPOUNDS nonane 0.9 0 0.5 0 0 0 0 0 0 dodecane 0 0 0 0 0 0 0.4 0.4 0.4 tridecane 0 0 0 0 0 0 0.4 0.4 0.4 tetradecane 0 0 0 0 0 0 0.4 0.4 0.4 hexadecane 0 0.3 0.2 0 0 0 0.4 0 0.2 AROMATIC HYDROCARBONS benzene 0.2 0.1 0.2 0.1 0.1 0.1 0 0.4 0.2 toluene 0.3 0.3 0.3 0.1 0.2 0.2 0.2 0.1 0.2 MONATOMIC ALCOHOLS 2-propanol 20 23 21 2 2 2 2 2 2 2-ethyl-1-hexanol 0.3 0.4 0.4 0.4 1 0.9 1 2 2 benzyl alcohol 0 0 0 0 0 0 0.9 0.9 1 DIVALENT ALCOHOLS 1,2-propanediol 0 0 0 0 0 0 2 0 1 PHENOLS phenol 2 0.9 1 2 1 2 0.9 1 1 ALCOHOL AND PHENOL ETHERS 2-(2-butoxyethoxy)ethanol 0 0 0 0 0 0 4 0 2 ALDEHYDES benzaldehyde 2 0.9 2 0.9 0.9 0.9 1 2 2 n-butanal 0 0 0 2 0 1 0 2 1 octanal 0.9 0.4 0.7 0.4 0.9 0.7 0.9 0.9 0.9 nonanal 2 0.4 1 0.9 0.9 0.9 1 2 2 decanal 3 0.9 2 0.9 1 1 2 2 2 KETONES acetophenone 0.4 0 0 0.4 0 0.2 0.4 0.4 0.4 acetone 3 2 2 3 2 2 2 4 3 ACIDS acetic acid 13 8 11 10 4 7 5 0 2 ESTERS AND LACTONES TXIB 0 0 0 0.2 0 0.1 0.3 0.4 0.4 SILICON CONTAINING COMPOUNDS organic Si-comp. 1 2 2 6 4 5 8 3 6 decamethylcyclopentasiloxane 0 0 0 0 0 0 0.4 0 0.2 Total 49 39 44 29 20 24 35 24 29 TVOC 11 8 9 11 11 11 23 19 21 non-TVOC 36 32 34 17 8 13 8 8 8

APPENDIX C 319
Table C159. Background emission values of adhesive B spread onto filler and plaster B applied onto calcium silicate brick in the FLEC test.
(µg/m³) TVOC 18
Table C160. Emission values of adhesive B spread onto filler and plaster B applied onto calcium silicate brick at 14 days in the FLEC test. (µg/m²·h) RH 20 % RH 50 % RH 80 % ALIPH. AND ALICYCLIC COMPOUNDS nonane 0 0 0 - - - 0 0.9 0.5 dodecane 1 0.9 1 - - - 1 1 1 tridecane 0 0.4 0.2 - - - 0 0 0 pentadecane 0 0.4 0.2 - - - 0 0 0 hexadecane 0.4 0.4 0.4 - - - 0.4 0.4 0.4 AROMATIC HYDROCARBONS propylbenzene 0 0 0 - - - 0.4 0.4 0.4 isopropylbenzene 0.4 0.4 0.4 - - - 0.9 0.9 0.9 styrene 0.4 0.4 0.4 - - - 0.9 0.9 0.9 MONATOMIC ALCOHOLS 2-propanol 16 15 16 - - - 8 9 9 1-butanol 0 0 0 - - - 3 3 3 2-ethyl-1-hexanol 44 44 44 - - - 38 39 39 benzyl alcohol 0.9 0.9 0.9 - - - 1 0.9 1 DIVALENT ALCOHOLS 1,2-propanediol 5 4 5 - - - 4 6 5 ETHERS bis[2-(2-ethoxyethoxy)ethyl]ether 12 13 12 - - - 13 13 13 PHENOLS phenol 2 2 2 - - - 0 2 1 ALCOHOL AND PHENOL ETHERS 2-(2-ethoxyethoxy)ethanol 57 57 57 - - - 75 75 75 2-[2-(2ethoxy)ethoxy]ethanol 0.4 0.9 0.7 - - - 2 2 2 2-(2-butoxyethoxy)ethanol 1410 1459 1435 - - - 1692 1679 1686 2-butoxyethanol 0 0.9 0 - - - 0.9 0.9 0.9 ALDEHYDES benzaldehyde 3 3 3 - - - 3.5 4 4 n-butanal 3 0 1 - - - 5 4 5 nonanal 4 3 3 - - - 2 3 2 decanal 6 3 4 - - - 0 0 0 KETONES acetophenone 0 0 0 - - - 0.4 1 0.9 acetone 4 4 4 - - - 5 5 5 ACIDS acetic acid 8 4 6 - - - 25 19 22 TERPENES AND THEIR DERIVATIVES limonene 1 1 1 - - - 0.9 0.9 0.9 ESTERS AND LACTONES 2-(2-butoxyethoxy)ethyl acetate 4 4 4 - - - 3 3 3 texanol 28 29 28 - - - 53 53 53 2-ethylhexyl acetate 17 18 17 - - - 17 16 17 2-ethylhexyl acrylate 13 13 13 - - - 12 12 12 2-ethyl-1-hexyl propionate 9 9 9 - - - 9 8 9
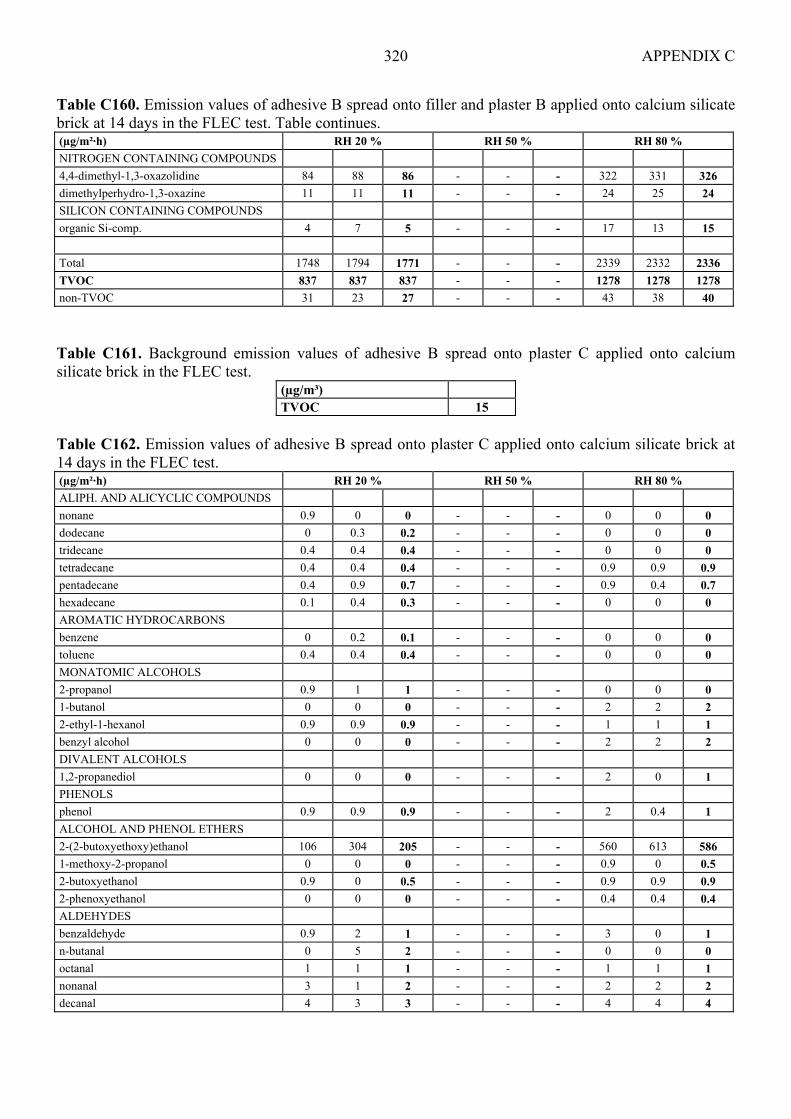
APPENDIX C 320
Table C160. Emission values of adhesive B spread onto filler and plaster B applied onto calcium silicate brick at 14 days in the FLEC test. Table continues. (µg/m²·h) RH 20 % RH 50 % RH 80 % NITROGEN CONTAINING COMPOUNDS 4,4-dimethyl-1,3-oxazolidine 84 88 86 - - - 322 331 326 dimethylperhydro-1,3-oxazine 11 11 11 - - - 24 25 24 SILICON CONTAINING COMPOUNDS organic Si-comp. 4 7 5 - - - 17 13 15 Total 1748 1794 1771 - - - 2339 2332 2336 TVOC 837 837 837 - - - 1278 1278 1278 non-TVOC 31 23 27 - - - 43 38 40
Table C161. Background emission values of adhesive B spread onto plaster C applied onto calcium silicate brick in the FLEC test.
(µg/m³) TVOC 15
Table C162. Emission values of adhesive B spread onto plaster C applied onto calcium silicate brick at 14 days in the FLEC test. (µg/m²·h) RH 20 % RH 50 % RH 80 % ALIPH. AND ALICYCLIC COMPOUNDS nonane 0.9 0 0 - - - 0 0 0 dodecane 0 0.3 0.2 - - - 0 0 0 tridecane 0.4 0.4 0.4 - - - 0 0 0 tetradecane 0.4 0.4 0.4 - - - 0.9 0.9 0.9 pentadecane 0.4 0.9 0.7 - - - 0.9 0.4 0.7 hexadecane 0.1 0.4 0.3 - - - 0 0 0 AROMATIC HYDROCARBONS benzene 0 0.2 0.1 - - - 0 0 0 toluene 0.4 0.4 0.4 - - - 0 0 0 MONATOMIC ALCOHOLS 2-propanol 0.9 1 1 - - - 0 0 0 1-butanol 0 0 0 - - - 2 2 2 2-ethyl-1-hexanol 0.9 0.9 0.9 - - - 1 1 1 benzyl alcohol 0 0 0 - - - 2 2 2 DIVALENT ALCOHOLS 1,2-propanediol 0 0 0 - - - 2 0 1 PHENOLS phenol 0.9 0.9 0.9 - - - 2 0.4 1 ALCOHOL AND PHENOL ETHERS 2-(2-butoxyethoxy)ethanol 106 304 205 - - - 560 613 586 1-methoxy-2-propanol 0 0 0 - - - 0.9 0 0.5 2-butoxyethanol 0.9 0 0.5 - - - 0.9 0.9 0.9 2-phenoxyethanol 0 0 0 - - - 0.4 0.4 0.4 ALDEHYDES benzaldehyde 0.9 2 1 - - - 3 0 1 n-butanal 0 5 2 - - - 0 0 0 octanal 1 1 1 - - - 1 1 1 nonanal 3 1 2 - - - 2 2 2 decanal 4 3 3 - - - 4 4 4
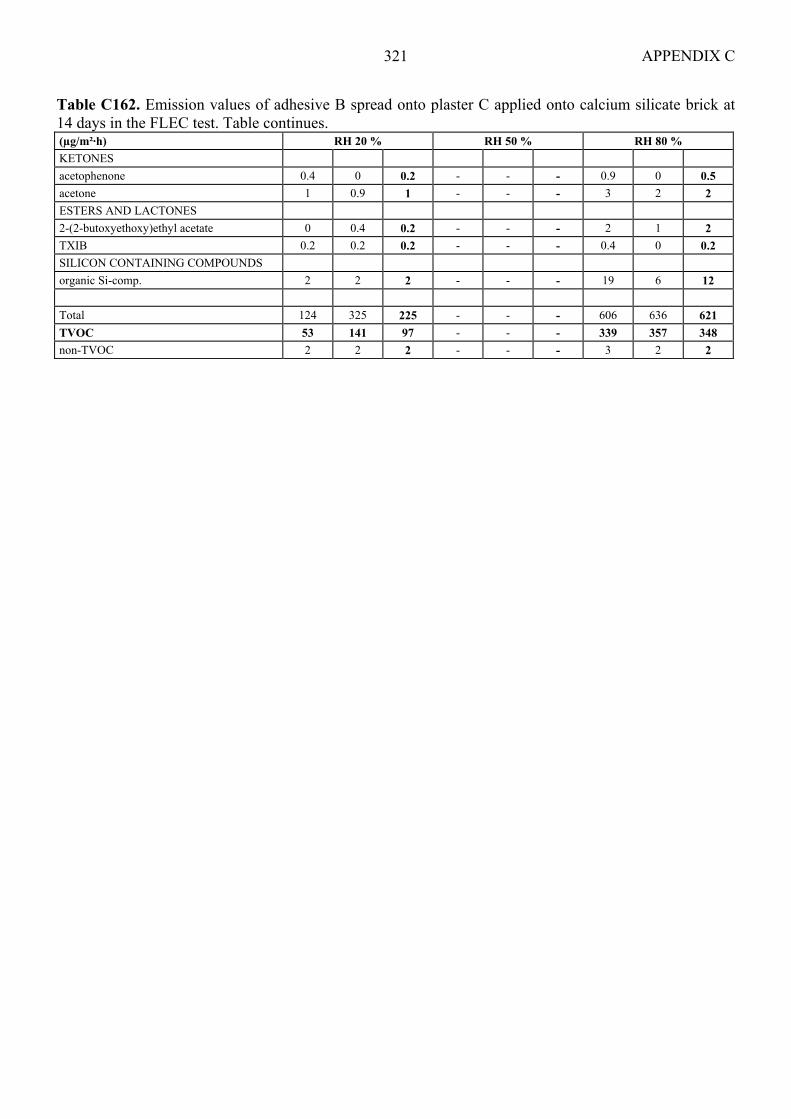
APPENDIX C 321
Table C162. Emission values of adhesive B spread onto plaster C applied onto calcium silicate brick at 14 days in the FLEC test. Table continues. (µg/m²·h) RH 20 % RH 50 % RH 80 % KETONES acetophenone 0.4 0 0.2 - - - 0.9 0 0.5 acetone 1 0.9 1 - - - 3 2 2 ESTERS AND LACTONES 2-(2-butoxyethoxy)ethyl acetate 0 0.4 0.2 - - - 2 1 2 TXIB 0.2 0.2 0.2 - - - 0.4 0 0.2 SILICON CONTAINING COMPOUNDS organic Si-comp. 2 2 2 - - - 19 6 12 Total 124 325 225 - - - 606 636 621 TVOC 53 141 97 - - - 339 357 348 non-TVOC 2 2 2 - - - 3 2 2

HELSINKI UNIVERSITY OF TECHNOLOGY LABORATORY OF BUILDING MATERIALS TECHNOLOGY PUBLICATIONS Report 6. Matala, S., Effects of carbonation on the pore structure of granulated blast furnace slag concrete, 1995. Report 7. Mannonen, R., Effects of addition time of sulphonated naphthalene-based superplasticizer on the properties of concrete, 1996. Report 8. Eronen, J., Räsänen, V., Wirtanen, L., Penttala, V., Päällystettyjen betonilattioiden emissiot, 1998. Report 9. Räsänen, V., Eronen, J., Wirtanen, L., Penttala, V., Tasoitteiden vaikutus betonilattioiden kosteustekniseen toimintaan, 1998. Report 10. Wirtanen, L., Eronen, J., Räsänen, V., Penttala, V., Lämpötilan ja suhteellisen kosteuden vaikutus betonin kuivumiseen, 1998. Report 11. Tulimaa, M., Eronen, J.,
Lämpötilan ja suhteellisen kosteuspitoisuuden vaihtelut talviaikana betonisten elementtien ulkokuoressa sekä eristysvillan ulkopinnassa, 1998.
Report 12. Komonen, J.,
Betonin pakkasenkestävyystestien kriittinen vertailu, 1999.
Report 13. Punkki, J., Effects of a high-speed crusher-mixer on the properties of concrete, 2000. Report 14. Wirtanen, L., Vasama, M., Itsetiivistyvät betonit, 2001. Report 15. Eronen, J., Wirtanen, L., Räsänen, V., Penttala, V., Lattiapäällysteiden vaikutus betonilattioiden kuivumiseen, 2001. Report 16. Mannonen, P., Penttala, V., Al-Neshawy, F., Räsänen, V., Itsetiivistyvien betonien suhteitus, valmistustekniikka ja perusominaisuudet, 2004. Report 17. Cwirzen, A., Effects of the transition zone and ageing on the frost damage of high strength concretes, 2004.
Report 18. Tulimaa, M., Wirtanen, L., Holt, E., Kukko, H., Penttala, V., Ympäristöystävälliset ja hyvin säilyvät betonit, 2005.

ISBN 951-22-8011-6
ISBN 951-22-8052-3 (PDF)
ISSN 1455-5948


![Forest litter crickets prefer higher substrate moisture for ......the tree canopy, being particularly abundant in forest litter [40]. Crickets are oviparous, hemimetabolous insects](https://img.pdfslide.us/doc/110x75/60e627b10ee34f2dea08b7e8/forest-litter-crickets-prefer-higher-substrate-moisture-for-the-tree-canopy.jpg)