Embed Size (px)
Citation preview

BiomaterialsScience
PAPER
Cite this: Biomater. Sci., 2021, 9,4099
Received 29th January 2021,Accepted 23rd April 2021
DOI: 10.1039/d1bm00166c
rsc.li/biomaterials-science
Influence of high-pressure torsion deformation onthe corrosion behaviour of a bioresorbableMg-based alloy studied by positron annihilation
Philipp Brunner, *a Florian Brumbauer, a Eva-Maria Steyskal, a
Oliver Renk, b Annelie-Martina Weinberg,c Hartmuth Schroettnerd andRoland Würschum e
The effect of high-pressure torsion (HPT) on the corrosion behavior of extruded ZX00 (Mg–0.45wt%Zn–
0.45wt%Ca) in phosphate buffered saline solution is investigated. MgCaZn alloys are promising candidates
for the use as bioresorbable implant materials and, therefore, are in the focus of current research. To
improve their strength, severe plastic deformation, e.g. via the technique of HPT, can be used. Positron
lifetime spectroscopy (PLS) is applied as sensitive tool for studying open-volume defects which evolve
during HPT processing and subsequent corrosion. The studies were complemented by electrochemical
impedance spectroscopy (EIS). In the uncorroded state, grain boundaries are the major type of positron
trap as quantitatively analysed by means of diffusion-reaction models for positron trapping and annihil-
ation in fine-grained alloys. Upon corrosion, positronium formation and annihilation indicate larger open-
volume structures, such as pores and cracks, in the emerging corrosion product and oxide layers. Both
PLS and EIS clearly show that HPT-deformation strongly reduces the resistance against corrosion.
Evidence is found for corrosion-induced open-volume defects, presumably related to hydrogen, in
deeper parts of the material below the corrosion layer.
I. Introduction
Magnesium (Mg) and its alloys are promising candidates forthe use as bioresorbable implant materials and therefore inthe focus of current biomaterials research. For non-permanentapplications, such as fracture fixation, they offer major advan-tages compared to the commonly used implants made of tita-nium or stainless steel. Mg-based implant materials supportfracture healing by continuously transferring load back to thebone as they are resorbed. Additionally, they do not need to beexplanted after the healing process has finished.1–3 Furtheradvantages are their bio-compatibility, nontoxicity, low specificdensity and an elastic modulus close to that of human bone.4,5
The Mg2+ release during the dissolution supports osteogenesisand therefore promotes the formation of healthy bone near
the implant tissue interface.6 Nevertheless, pure Mg suffersfrom a low strength for load-bearing implants and dissolvesquickly in physiological environments, accompanied by arapid evolution of hydrogen. The produced hydrogen causestroubles like a delayed healing process, necrosis of the sur-rounding tissue or can lead to encapsulated gas cavities.2,4,7
Using suitable Mg alloys allows to both increase the materialsstrength and slow down the degradation rate and thereforeimproves the performance as implant material.2
Here we investigate the alloy Mg–0.45wt%Zn–0.45wt%Ca(ZX00), which only contains elements, naturally present in thehuman body. This material has been shown to be biocompati-ble with adequate degradation rates, along with a yieldstrength of 285 MPa.1,7 One technique, suitable to furtherimprove the strength of Mg alloys, is grain refinement8 viasevere plastic deformation, such as high-pressure torsion(HPT).9 The effects of grain refinement on the corrosion behav-ior are under debate.10–16 Corrosion preferentially takes placealong crystalline defects, such as dislocations and grainboundaries, but also along second phase particles. Someauthors found that the higher grain boundary density and thefragmentation of potentially present second phase particlesafter severe plastic deformation provide more homogeneouslydistributed sites for corrosion attack. Therefore a change froma localized towards a more uniform degradation process is
aInstitute of Materials Physics, Graz University of Technology, Petersgasse 16, 8010
Graz, Austria. E-mail: [email protected] Schmid Institute of Materials Science, Austrian Academy of Sciences, 8700
Leoben, AustriacDepartment of Orthopaedics and Trauma, Medical University of Graz,
Auenbruggerplatz 5, 8036 Graz, AustriadInstitute of Electron Microscopy and Nanoanalytics, Graz University of Technology,
Steyrergasse 17, 8010 Graz, AustriaeInstitute of Materials Physics, Graz University of Technology, Petersgasse 16, 8010
Graz, Austria. E-mail: [email protected]
This journal is © The Royal Society of Chemistry 2021 Biomater. Sci., 2021, 9, 4099–4109 | 4099
Ope
n A
cces
s A
rtic
le. P
ublis
hed
on 3
0 A
pril
2021
. Dow
nloa
ded
on 3
/13/
2022
4:5
8:18
AM
. T
his
artic
le is
lice
nsed
und
er a
Cre
ativ
e C
omm
ons
Attr
ibut
ion-
Non
Com
mer
cial
3.0
Unp
orte
d L
icen
ce.
View Article OnlineView Journal | View Issue

observed. This leads to a compact corrosion product layer,which protects the underlying matrix from the corrosiveenvironment and slows down the degradation process.15,16 Onthe contrary, other authors claim that the formed corrosionproduct layer after severe plastic deformation has no improvedpassivation ability and delivers therefore no protection againstthe corrosive environment. The additionally introduced crystal-line defects then cause an enhanced corrosion rate.10
In the present study, positron lifetime spectroscopy (PLS) isapplied for studying open-volume defects which evolve duringHPT processing and subsequent corrosion. A comparison ofthe positron lifetime measurements performed on ZX00 withand without HPT-deformation in dependence of corrosiontime in phosphate buffered saline solution aims to assess theinfluence of HPT-deformation on the corrosion-induced open-volume defects. The high sensitivity of about 1 to 100 atomicppm towards defects in the sub-nanometer range make PLS toa powerful tool for detecting vacancies, dislocations or micro-voids and pores in all kinds of solids, especially in metals andsemiconductors.17–19 Since PLS with conventional positronsources probes the materials bulk, potentially arising corrosioninduced open-volume defects deeper inside the sample can beinvestigated. As an example, evidence for crack formationinside the material in the context with hydrogen embrittle-ment during corrosion comes so far from, e.g., electronmicroscopy or stress corrosion cracking tests.20,21 Due to itssensitivity to defects in the sub-nanometer range, PLS has thecapability of providing insights to very early states of this crackformation.
Positron annihilation studies of corrosion-related phenomenahave been performed so far primarily by means of monoener-getic beams (see, e.g. ref. 22–24), to a lesser extent only by meansof PALS using conventional positron sources (see, e.g., ref. 22and 25–28). The present e+ annihilation studies are the first onthe corrosion behavior of an HPT-deformed alloy and also thefirst on this type of Mg alloy (ZX00). The studies are complemen-ted by electrochemical impedance spectroscopy (EIS), a well-established technique for studying corrosion phenomena.29
II. Experimental
The used alloy Mg–0.45wt%Zn–0.45wt%Ca (ZX00) is the samethat has been studied recently by one of the coauthors.1,7 Aftersolution and ageing-treatments, the alloy was indirectlyextruded at 325 °C. From this material, denoted ZX00EXT hen-ceforth, disks with a diameter of 15 mm and a thickness ofabout 1 mm were cut, serving as reference samples as well asraw material for subsequent high-pressure torsion. For HPT atotal of 10 revolutions with a nominal pressure of approxi-mately 2.6 GPa was applied at room temperature, denotedZX00HPT henceforth. The ZX00EXT and ZX00HPT discs were cutin 4 pieces and kept in a vacuum-desiccator with silica gel asdesiccant.
The microstructure of the uncorroded material was charac-terized by scanning electron microscopy (SEM) along with
EDX-analysis using a ZEISS Ultra 55 FESEM with an EDAXSuper Octance detector. The used setup was described indetail previously.30,31 Micrographs were recorded in channel-ing contrast mode. For the SEM-studies, the samples weremechanically precut and then finally prepared by ion beamtechnique.
The e+ lifetime measurements were performed with a con-ventional positron lifetime spectrometer (in so-called fast-fastset-up) with a time resolution of 160 ps, a description of whichcan be found elsewhere.32 A 22Na radioactive isotope encapsu-lated between 5 µm thick Al foils was used as a e+ source. Therecorded spectra contained at least more than 106 counts andwere analyzed by means of the program PALSFIT33 after sourcecorrection. An annealed ultra high purity (XHP) Mg samplepair was used to determine the source contribution consistingof two components of 408 ps and 1500 ps with relative intensi-ties of 16% and 3%, respectively. The ZX00EXT,HPT-sampleplatelets with an initial thickness of 0.9 mm were stepwise cor-roded between 12 s and 48 h by immersing in phosphatebuffered saline (PBS) solution, the corrosive medium used inthis study. After removing the samples from the corrosiveenvironment, they were carefully rinsed with distilled water, sothat the overall well adherent corrosion product remained onthe sample surface. After drying the samples in a desiccator,they were weighted with a Sartorius™ Cubis™ microbalanceusing a 6.6S weighting module. The PBS was prepared via dis-solving a phosphate buffered saline tablet (ROTI FAIR PBS 7.4)in 200 ml highly pure water (ROTIPURAN p.a., ACS).
The onset of corrosion at the alloy surface was also charac-terized by electrochemical impedance spectroscopy (EIS).Spectra of ZX00EXT,HPT were recorded after 10 min of immer-sion, using an AUTOLAB potentiostat (AUT85934, METROHM)equipped with an EIS module (FRA32M). For this purpose, theZX00EXT,HPT-samples were contacted with a gold wire usingcommercial conduct silver. To ensure a stable contact and toavoid unintended exposure to PBS, the contact was sealed witha two-component epoxy glue. A three-electrode electrochemicalcell was used for the measurements at room temperature, withthe ZX00EXT,HPT-samples serving as working electrode, a curledplatinum wire as counter electrode, and an Ag/AgCl electrodein 3M-KCl as reference (RE), to which all given potentials arereferred to. To reduce artifacts due to the high impedanceresponse of the reference electrode,34 a platinum wire in serieswith a 1 µF capacitance was parallel connected to RE, as rec-ommended by the manufacturer. The EIS measurements wereperformed at open circuit potential (OCP) in a frequency rangebetween 100 kHz and a few mHz with six points per decadeand a 0.01 V single sine amplitude. The recorded spectra wereanalyzed via the NOVA 1.11 software.
III. ResultsA. Microstructurural characterization
The base alloy material ZX00EXT used in the present study hasrecently been characterized in detail by Holweg et al.1 To a
Paper Biomaterials Science
4100 | Biomater. Sci., 2021, 9, 4099–4109 This journal is © The Royal Society of Chemistry 2021
Ope
n A
cces
s A
rtic
le. P
ublis
hed
on 3
0 A
pril
2021
. Dow
nloa
ded
on 3
/13/
2022
4:5
8:18
AM
. T
his
artic
le is
lice
nsed
und
er a
Cre
ativ
e C
omm
ons
Attr
ibut
ion-
Non
Com
mer
cial
3.0
Unp
orte
d L
icen
ce.
View Article Online

great extent (ca. 80%) the material exhibits a recrystallizedstructure with an average size of 1.7 ± 0.8 µm. The Mg matrixcontains nanometric intermetallic particles composed of a Ca-rich phase, presumably of Laves-type Mg2Ca. An average inter-metallic particle size of 80 ± 35 nm was reported by Cihovaet al.35 for Mg–Zn–Ca alloys with a little higher concentrationof Zn.
Fig. 1(a) and (b) show scanning electronmicrographs ofZX00EXT and ZX00HPT, respectively, which were taken in theframework of the present study. For ZX00EXT, structural fea-tures were found similar to that denoted above.1 The averagegrain size is between 2 and 3 µm. The bright spots in themicrograph indicate the intermetallic particles (Fig. 1a), whichwith few exceptions are of nanometric size in the range ofabout 100 nm. They consist mainly of Mg (72.4 at%) and Ca(26.6 at%) and to a minor fraction of Zn according to EDXmeasurements (not shown), indicating the presence of aMg2Ca Laves phase, as expected from literature.1 These par-ticles are mostly formed discontinuously along grain bound-aries, but some are also found within the grains. The averageinterparticle spacing is estimated to 1–2 µm, which is in thesame range as found by Cihova et al.35 for Mg–Zn–Ca alloyswith a little higher concentration of Zn. After HPT processing,smaller grains, elongated along the deformation axis with anaverage width of 1 µm and length of 2 to 3 µm, are observed(see SEM-micrograph of ZX00HPT, Fig. 1b). No significantchange in the intermetallic particle size due to fragmentationof the precipitates is found after HPT deformation.
B. Electrochemical impedance spectroscopy
For studying the corrosion behavior, electrochemical impe-dance spectroscopy is applied complementary to positronannihilation. Fig. 2 shows electrochemical impedance spectrafor ZX00EXT and ZX00HPT in the Nyquist plot representationrecorded 10 min after immersion in PBS at their OCP values(for further details see Fig. 2). For ZX00EXT two capacitiveloops, one in the high and the other in the medium frequency
range, as well as an inductive loop for low frequencies can bediscerned. After HPT processing, the measured spectrum ofZX00HPT changes significantly in terms of its shape and size(Fig. 2). The high frequency loop is hardly pronounced as com-pared to ZX00EXT, whereas the capacitive loop in the medium
Fig. 1 SEM channeling contrast images of (a) ZX00EXT and (b) ZX00HPT microstructure. The ZX00EXT micrograph is recorded in extrusion direction,the ZX00HPT micrograph in the direction of the torsion axis.
Fig. 2 (a) Impedance spectra in the Nyquist plot representation ofZX00EXT (blue) and of ZX00HPT (red) after 10 min of immersion in PBS atthe OCP values of −1.705 V and −1.579 V, respectively. Frequencyranges of 100 kHz to 2.1 mHz and 100 kHz to 9.5 mHz are chosen forZX00EXT and ZX00HPT, respectively. The black lines represent the fits tothe equivalent electrical circuit of Fig. 3. (b) Zoomed spectrum ofZX00HPT. hf denotes the high frequency, mf the medium frequency, andlf the low frequency range.
Biomaterials Science Paper
This journal is © The Royal Society of Chemistry 2021 Biomater. Sci., 2021, 9, 4099–4109 | 4101
Ope
n A
cces
s A
rtic
le. P
ublis
hed
on 3
0 A
pril
2021
. Dow
nloa
ded
on 3
/13/
2022
4:5
8:18
AM
. T
his
artic
le is
lice
nsed
und
er a
Cre
ativ
e C
omm
ons
Attr
ibut
ion-
Non
Com
mer
cial
3.0
Unp
orte
d L
icen
ce.
View Article Online

frequency range and the inductive loop at low frequencies isclearly visible.
According to literature (e.g. Baril et al.36 or Gomes et al.37),the high frequency capacitive loop corresponds to the chargetransfer resistance parallel to the interface capacitance and thecapacitive loop in the medium frequency range to thediffusion of dissolved Mg2+ through the porous Mg(OH)2 layer.The low frequency inductive loop corresponds to the relaxationof the adsorbed intermediates Mg+, which are formed duringthe dissolution of Mg and which cover the film free surface.
The measured spectra are analyzed by means of an equi-valent electrical circuit (EEC) shown in Fig. 3, similar as usedby Baril et al.,36 King et al.,38 or Liu et al.39 The EEC takes intoaccount the electrolyte resistance Re and the charge transfer re-sistance Rct associated with the cathodic hydrogen evolution atcathodic sites. The double layer capacitance at the film freeareas is neglected36 since most of the surface is covered with athin MgO layer. The capacitance of the MgO layer is rep-resented by the constant phase element YCint
. The resistanceRdiff and the parallel constant phase element YCdiff
are used todescribe the diffusion of Mg2+ through the porous corrosionlayer. The inductive behavior at low frequencies is fitted by theinductance L in series with the resistance RL. As indicated inFig. 3, Rct, Rdiff and YCdiff
can be summed up to the cathodicimpedance ZC, L and RL to the anodic impedance ZA.
39
According to King et al.,38 the corrosion rate is inversely pro-
portional to the polarization resistance RP. RP corresponds tothe impedance at zero frequency and reads therefore:
1RP
¼ 1RC
þ 1RA
ð1Þ
with1RC
¼ 1Rct þ Rdiff
andRA ¼ RL;
where RA and RC denote the anodic and cathodic resistance,respectively.
Table 1 shows the various parameters which are deducedfrom fitting the measured spectra (Fig. 2) with the EEC ofFig. 3. The obtained fit parameters are in the following ana-lysed according to Baril et al.,36 or Liu et al.39 The smallercharge transfer resistance Rct fitted for ZX00HPT, as comparedto ZX00EXT, corresponds directly to the hardly pronouncedhigh frequency loop in Fig. 2. The smaller value of YCint
forZX00HPT indicates a smaller fraction of MgO formed on thesample surface. Together with the smaller Rct value, thispoints towards a lack of protection from the oxide layer afterHPT deformation. Since nCint
is smaller than 1 for bothsamples, deviations from an ideal capacitive behavior can beassumed and attributed to some inhomogeneities on thesurface.16 The smaller Rdiff value fitted for ZX00HPT indicates adecreased resistance of the corrosion product layer against thediffusion of Mg2+ and therefore points towards a less compactcorrosion layer formed after HPT deformation. As shown inTable 2, the significantly decreased RP value indicates, accord-ing to King et al.,38 an enhanced corrosion rate for ZX00HPT.Furthermore a more dominating anodic activity can beobserved due to the decreased RA value after HPT processingleading to a faster dissolution of ZX00HPT as compared toZX00EXT.
Fig. 3 Equivalent electrical circuit used for fitting the measuredelectrochemical impedance spectra in Fig. 2. Parameters (for results seeTable 1): anodic impedance ZA consisting of the inductance L and theresistance RL to fit the inductive behavior in the low frequency range.Cathodic impedance ZC consisting of the charge transfer resistance Rct
associated with hydrogen evolution and the resistance Rdiff with theconstant phase element YCdiff
with nCdiffascribed to the diffusion of Mg2+
through the Mg(OH)2 layer. Re denotes the electrolyte resistance andYCint
with nCintthe constant phase element used to fit the capacitance of
the MgO film.
Table 1 Characteristic values deduced from the measured impedancespectra (Fig. 2) by means of fitting the equivalent electrical circuit (EEC)shown in Fig. 3. The EEC elements are defined in the caption of Fig. 3
L (H cm2) RL (Ω cm2) YCdiff(μs cm−2) nCdiff
Rdiff(Ω cm2)
ZX00EXT 37 339 2833 3086 0.98 197ZX00HPT 273 21 32 0.98 47
Re (Ω cm2) Rct (Ω cm2) YCint(μs cm−2) nCint
ZX00EXT 19 585 41 0.86ZX00HPT 14 10 17 0.89
Table 2 Polarization resistance RP, cathodic resistance RC, and anodicresistance RA according to eqn (1) obtained from the fit values given inTable 1
RC (Ω cm2) RA (Ω cm2) RP (Ω cm2)
ZX00EXT 782 2833 613ZX00HPT 57 21 15
Paper Biomaterials Science
4102 | Biomater. Sci., 2021, 9, 4099–4109 This journal is © The Royal Society of Chemistry 2021
Ope
n A
cces
s A
rtic
le. P
ublis
hed
on 3
0 A
pril
2021
. Dow
nloa
ded
on 3
/13/
2022
4:5
8:18
AM
. T
his
artic
le is
lice
nsed
und
er a
Cre
ativ
e C
omm
ons
Attr
ibut
ion-
Non
Com
mer
cial
3.0
Unp
orte
d L
icen
ce.
View Article Online

C. Positron lifetime measurements
The results of the e+ lifetime measurements are summarizedin Table 3. For pure, annealed Mg a single e+ lifetime τ1 =226 ps is found which represents the e+ bulk lifetime in Mg(see Discussion and Table 4).
In the uncorroded states of ZX00EXT and ZX00HPT, mean e+
lifetimes τm of 232 ps and 241 ps are found, respectively. Atwo-component analysis reveals for ZX00EXT the trap com-ponent τ = 254 ps with an intensity of 58.9% which will beattributed to e+ trapping and annihilation in grain boundaries(GBs) of the extruded sample (see Discussion). The uncorrodedstate of ZX00HPT can be well described by a single e+ lifetimecomponent, presumably because the fraction of e+ annihilat-ing in the free bulk state cannot be resolved due to strong e+
trapping. In fact, a two-component analysis with the trap com-ponent τ = 254 ps, found for ZX00EXT, being fixed yields a hightrap intensity I2 = 75.2% for ZX00HPT.
The e+ lifetime measurements reveal substantial differences inthe corrosion behavior of ZX00EXT and ZX00HPT as demonstrated bytheir different variations of τm with corrosion time tcorr (seeFig. 4). For ZX00HPT, τm starts to increase after 60 s of corrosionalready, whereas for ZX00EXT faint changes can be discerned onlyafter 5 min. Particular pronounced differences occur with pro-longed corrosion of 2 h and longer, where τm of ZX00HPT stronglyincreases, by nearly 80 ps in total up to 48 h of corrosion, in con-trast to ZX00EXT which exhibits a total τm-increase of 7 ps only.
According to e+ lifetime spectroscopy, a trap componentwith long e+ lifetime exceeding 500 ps emerges for ZX00HPT
after 60 s and for ZX00EXT after 5 min of corrosion (Table 3).The components τ1 and τ2 can no longer be separated forZX00EXT when the long component emerges (see, e.g., the dataset for 25 min and 48 h). Therefore, the GB component τ2 =254 ps had to be fixed. To minimize the numerical uncertain-ties associated with the small intensity of the long componentτ3, also this component was fixed to the value of 903 ps foundin the unconstrained two-component analysis of the spectrumwith tcorr = 25 min. The intensity I3 of the long componentdeduced in this way exhibits a maximum value of 1.2%. ForZX00HPT, the intensity of the long component increases morestrongly and even a second long component exceeding 500 psis found for tcorr ≥ 10 h. For comparison of ZX00EXT andZX00HPT, the variation of the intensity I3 of the long com-
Table 4 Positron lifetimes in free state (τb) and defect-trapped state invacancy (τv) and dislocation (τd) in pure Mg according to literature.Experimental values unless stated
τb (ps) 225 Hautojärvi et al.56
225 Čížek et al.57
226 Dryzek et al.58
233 Čížek et al.,57 theoretical237 Puska and Nieminen,19 theoretical
τv (ps) 255 Hautojärvi et al.56
297 Čížek et al.,57 theoretical307 Nieminen and Manninen,59 theoretical
τd (ps) 256 Čížek et al.41
257 Čížek et al.41
Table 3 Results of positron lifetime spectroscopy of ZX00EXT and ZX00HPT along with the relative change Δm/m0 of the sample mass in depen-dence of corrosion time tcorr: mean e+ lifetime τm = ΣiIiτi and e+ lifetime components τi with relative intensities Ii (i = 1, 2, 3); value in bracket: numeri-cal uncertainty, fix: component fixed for analysis. The result obtained for pure annealed Mg is given for comparison
tcorr τ1 (ps) I1 (%) τ2 (ps) I2 (%) τ3 (ps) I3 (%) τm (ps) Δm/m0
ZX00EXT0 s 201(22) 41.1(35.8) 254(17) 58.9(35.8) 23212 s 198(4) 40.3(3.2) 254(fix) 59.7(3.2) 23160 s 190(4) 34.3(2.3) 254(fix) 65.7(2.2) 232 0.00005 min 210(4) 52.2(5.5) 254(fix) 47.4(5.6) 903(fix) 0.4(0.1) 233 0.000325 min 229(1) 98.8(0.2) 903(79) 1.2(0.2) 23725 min 212(5) 56.4(7.7) 254(fix) 42.6(7.7) 903(fix) 1.0(0.1) 236 0.00232 h 211(5) 56.1(7.6) 254(fix) 42.9(7.7) 903(fix) 1.0(0.1) 236 0.002910 h 206(5) 47.0(5.5) 254(fix) 52.6(5.6) 903(fix) 0.4(0.1) 234 0.003624 h 212(5) 55.4(6.6) 254(fix) 44.0(6.6) 903(fix) 0.6(0.1) 235 0.005748 h 229(1) 98.5(0.2) 886(65) 1.5(0.2) 23948 h 210(6) 52.9(7.2) 254(fix) 45.9(7.2) 903(fix) 1.2(0.1) 239 0.0047
ZX00HPT0 s 241(1) 100.0 2410 s 203(7) 24.8(3.4) 254(fix) 75.2(3.4) 24112 s 241(1) 100.0 24160 s 240(1) 99.6(0.1) 1500(206) 0.4(0.1) 245 0.00005 min 240(1) 99.7(0.1) 2180(429) 0.3(0.1) 247 0.000525 min 241(1) 99.1(0.1) 1663(129) 0.9(0.1) 254 0.00362 h 242(1) 99.0(0.1) 1408(89) 1.0(0.1) 254 0.007410 h 242(1) 94.8(0.6) 686(82) 4.4(0.5) 2514(688) 0.8(0.2) 279 −0.008924 h 242(1) 92.6(0.5) 687(47) 6.2(0.3) 2052(290) 1.2(0.3) 290 −0.072048 h 239(2) 85.0(1.5) 573(52) 12.0(1.1) 1590(157) 3.0(0.6) 319 −0.1490
Mg0 s 226(1) 100.0 226
Biomaterials Science Paper
This journal is © The Royal Society of Chemistry 2021 Biomater. Sci., 2021, 9, 4099–4109 | 4103
Ope
n A
cces
s A
rtic
le. P
ublis
hed
on 3
0 A
pril
2021
. Dow
nloa
ded
on 3
/13/
2022
4:5
8:18
AM
. T
his
artic
le is
lice
nsed
und
er a
Cre
ativ
e C
omm
ons
Attr
ibut
ion-
Non
Com
mer
cial
3.0
Unp
orte
d L
icen
ce.
View Article Online

ponent, respectively the sum I2 + I3 of the two long com-ponents in ZX00HPT for tcorr ≥ 10 h, is shown in Fig. 4.
Finally, we note that the component τ1 found for ZX00HPT
in the analysis of the spectra after corrosion has to be con-sidered as averaged value between the trap component τ =254 ps and the annihilation in the bulk which cannot beresolved as outlined above for the spectrum of the uncorrodedstate of ZX00HPT.
Supplementary to the e+ annihilation measurements, aftereach corrosion step the mass m of each sample pair was deter-mined in order to assess the fraction of corroded materialevolved on the sample surfaces. The relative mass variationΔm/m0 for the two sample sets ZX00EXT and ZX00HPT with cor-rosion time is shown in Table 3 and Fig. 4. Both samples showa pretty similar increase of Δm/m0 up to 2 h. Upon continuingcorrosion, Δm/m0 of ZX00EXT further increases up to 24 h,whereas that of ZX00HPT strongly decreases. This is due to apeeling off of the corrosion product.
From the increase of Δm/m0, an estimate can be given onthe fraction of positrons expected to be stopped in the cor-rosion layer. For simplicity, it is assumed that as single cor-rosion product a Mg(OH)2 layer is formed at the surface. Thesample mass is therefore given by:
m ¼ mMg þmMgðOHÞ2 ¼ ðm0 � xMMgÞ þ xðMMg þ 2MH þ 2MOÞ ¼m0 þ 2xðMH þMOÞ;
ð2Þ
where x denotes the number of moles of corroded Mg, m0
the initial mass, mMg and mMg(OH)2 the mass of Mg and the
Mg(OH)2-layer, respectively, and MH, MO and MMg the molemass of hydrogen, oxygen and magnesium, respectively. Fromeqn (2) the mass of the corrosion product layer:
mMgðOHÞ2 ¼ðm�m0ÞðMMg þ 2MH þ 2MOÞ
2ðMH þMOÞ ð3Þ
and its thickness:
dMgðOHÞ2 ¼mMgðOHÞ2ρMgðOHÞ2A
ð4Þ
follows with the density ρMg(OH)2 = 2.34 g cm−3 (ref. 40) andthe sample area A. From the area density mMg(OH)2A
−1 =ρMg(OH)2dMg(OH)2 of the Mg(OH)2 layer, the fraction of e+ beeingstopped in the layer can be calculated as follows:17
feþ; corr ¼ 1� exp � ρMgðOHÞ2dMgðOHÞ225mg cm�2
� �: ð5Þ
Assuming that the e+ diffusion length in the corrosion layeris small due to a high defect density, fe+,corr also corresponds tothe fraction of e+ beeing annihilated in this layer.
The increase of dMg(OH)2 and fe+,corr with corrosion timededuced from the measured mass increase Δm/m0 of ZX00EXTis shown in Fig. 5. For the initial mass m0, the sample massafter 60 s is used as no change in e+ annihilation data up to5 min of corrosion could be observed. A maximum corrosionlayer thickness of ca. 4 μm with a corresponding maximumfraction fe+,corr of ca. 3% is estimated.
IV. DiscussionA. Open-volume defects prior to corrosion
We start the discussion with a consideration of the character-istic e+ lifetime in the Mg alloy and the type of open-volumedefects in the extruded (ZX00EXT) and HPT-deformed(ZX00HPT) state prior to corrosion. The literature value τb =225/6 ps reported for the bulk e+ lifetime in the defect-freestate of Mg (Table 4) could be well reproduced in the presentstudy (Table 3). For e+ annihilation at dislocations values of
Fig. 4 Results of positron lifetime spectroscopy of ZX00EXT (blue) andZX00HPT (red) along with the relative change Δm/m0 of the sample massin dependence of corrosion time tcorr: Mean e+ lifetime τm; Intensity I3or I2 + I3 of long e+ lifetime components (τ2,3 > 500 ps, I2 + I3 refers tothe intensity sum for tcorr ≥ 10 h of ZX00HPT). Complete data set andnumerical uncertainties see Table 3.
Fig. 5 Thickness dMg(OH)2 of corrosion product layer (eqn (4)) and frac-tion fe+,corr of e
+ being stopped in the layer (eqn (5)) in dependence ofcorrosion time deduced from the measured mass increase Δmm0
−1 ofZX00EXT.
Paper Biomaterials Science
4104 | Biomater. Sci., 2021, 9, 4099–4109 This journal is © The Royal Society of Chemistry 2021
Ope
n A
cces
s A
rtic
le. P
ublis
hed
on 3
0 A
pril
2021
. Dow
nloa
ded
on 3
/13/
2022
4:5
8:18
AM
. T
his
artic
le is
lice
nsed
und
er a
Cre
ativ
e C
omm
ons
Attr
ibut
ion-
Non
Com
mer
cial
3.0
Unp
orte
d L
icen
ce.
View Article Online
256/7 ps are reported by Čížek et al.41 similar to the trap com-ponent τ2 = 254 ps found here for ZX00EXT. This trap com-ponent is considered to arise from e+ trapping and annihil-ation in grain boundaries of the recrystallized microstructure.Positron lifetimes similar to that of dislocations and smallerthan that of lattice vacancies (Table 4) are typical for GBs.
The assignment of τ2 to GBs is further supported by quanti-tatively considering the intensity of the e+ annihilation com-ponent which is expected for trapping at grain boundaries(GBs) and matrix–precipitate interfaces based on the micro-structural parameters quoted in section III A. For this purpose,our models of diffusion- and reaction-limited e+ trapping atthe aforementioned defect types42–45 were applied by makinguse of the solutions which are summarized in the appendix.The used e+ annihilation parameters are quoted in Table 5,among them are the bulk e+ lifetime τb = 226 ps measured onannealed Mg and the trap lifetime component τgb,if = 254 psobserved for ZX00EXT, which is considered as the e+ lifetimecomponent in grain boundaries or precipitate–matrix inter-faces. Using these parameters, the mean e+ lifetime τm and theintensities of the e+ annihilation component in grain bound-aries (Igb) and matrix–precipitate interfaces (Iif ) are calculatedfor spherical- or cylindrical-shaped grains with various radii ras well as for spherical-shaped precipitates using as radius rand half distance R between precipitates the typical valuesreported for the intermetallic particles in a similar Mg–Zn–Caalloy. The results are summarized in Table 5.
The model with e+ trapping at GBs of spherical-shapedgrains with diameter of 2 µm describes the measuring data forZX00EXT remarkably well; the intensity Igb = 63% of the e+
annihilation component in GBs and the mean e+ lifetime τm =233 ps are close to the experimental values (I2 = 59%, τm =232 ps; Table 4). Likewise the experimental results for ZX00HPT
can be well described by e+ trapping at GBs of cylindrical-shaped grains with diameter of 1 μm, as a comparison of thee+ annihilation component in GBs according to this model(76%, Table 5) with the result from spectra analysis (I2 = 75%,
Table 3) shows. The higher experimental τm-value compared tothe model may indicate that the experimental e+ lifetime com-ponent τ1 does not exclusively reflect e+ annihilation in thefree bulk state.
The interfaces between precipitates and matrix, on theother hand, contribute only to a minor extent to e+ trapping: asmall trap intensity Iif = 2.2% is predicted for an interparticledistance of 1.5 µm between precipitates with diameter of80 nm (Table 5). Fragmentation of the precipitates duringHPT-processing might increase this contribution for ZX00HPT,however, also e+ trapping at GBs is stronger in that case, com-pared to ZX00EXT, due to the smaller grain size.
B. Corrosion behaviour
In the following section the substantially different corrosionbehavior of ZX00EXT and ZX00HPT as revealed by the comp-lementary e+ annihilation and electrochemical impedancemeasurements will be discussed. EIS is highly surface sensitiveand therefore allows the investigation of the evolving corrosionproduct layer.29 In contrast, by using conventional positronsources, as done in this work, the materials bulk can be inves-tigated with a high sensitivity of about 1 to 100 atomic ppmtowards defects in the sub-nanometer range.17–19 As a result,also corrosion-related changes in the materials bulk can bemonitored. Therefore a more global picture of the corrosionprocesses can be given by combining EIS with bulk sensitivePLS measurements. To the authors knowledge, such a combi-nation of these two measurements techniques has not beenused so far for studying the corrosion process of Mg alloys.
At first the results of electrochemical impedance spec-troscopy will be discussed. For this purpose and the sake ofillustration, a scheme of the corrosion-induced prospectivemicrostructure is shown in Fig. 6. The corrosion productsform a loosely bonded filamentous layer consisting ofMg(OH)2, MgCO3 and Ca10(PO4)6(OH)2.
35,40,46 Between thiscorrosion product layer and the alloy, there is a thin and moredense oxide interlayer of MgO, where cracks can emerge in the
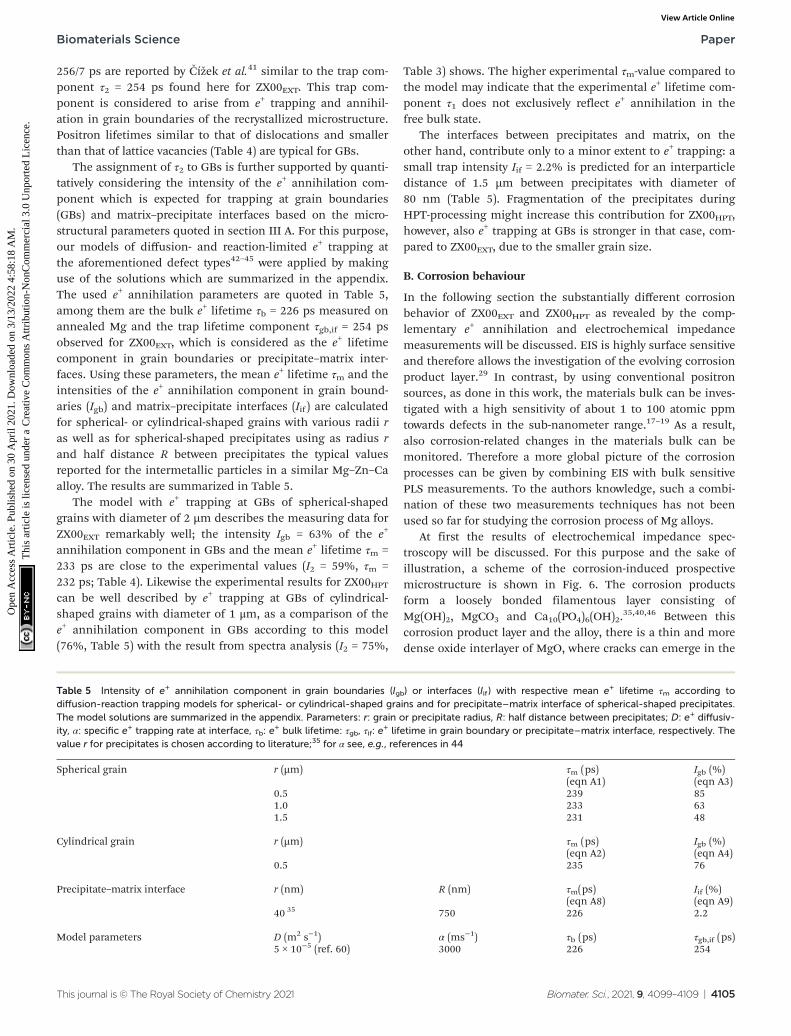
Table 5 Intensity of e+ annihilation component in grain boundaries (Igb) or interfaces (Iif ) with respective mean e+ lifetime τm according todiffusion-reaction trapping models for spherical- or cylindrical-shaped grains and for precipitate–matrix interface of spherical-shaped precipitates.The model solutions are summarized in the appendix. Parameters: r: grain or precipitate radius, R: half distance between precipitates; D: e+ diffusiv-ity, α: specific e+ trapping rate at interface, τb: e
+ bulk lifetime: τgb, τif: e+ lifetime in grain boundary or precipitate–matrix interface, respectively. The
value r for precipitates is chosen according to literature;35 for α see, e.g., references in 44
Spherical grain r (µm) τm (ps) Igb (%)(eqn A1) (eqn A3)
0.5 239 851.0 233 631.5 231 48
Cylindrical grain r (µm) τm (ps) Igb (%)(eqn A2) (eqn A4)
0.5 235 76
Precipitate–matrix interface r (nm) R (nm) τm(ps) Iif (%)(eqn A8) (eqn A9)
40 35 750 226 2.2
Model parameters D (m2 s−1) α (ms−1) τb (ps) τgb,if (ps)5 × 10⁻⁵ (ref. 60) 3000 226 254
Biomaterials Science Paper
This journal is © The Royal Society of Chemistry 2021 Biomater. Sci., 2021, 9, 4099–4109 | 4105
Ope
n A
cces
s A
rtic
le. P
ublis
hed
on 3
0 A
pril
2021
. Dow
nloa
ded
on 3
/13/
2022
4:5
8:18
AM
. T
his
artic
le is
lice
nsed
und
er a
Cre
ativ
e C
omm
ons
Attr
ibut
ion-
Non
Com
mer
cial
3.0
Unp
orte
d L
icen
ce.
View Article Online

course of corrosion.40 The nanometric intermetallic particles,composed of the Laves-type Mg2Ca phase (see section III A),dissolve with no observable remnants in the corrosion pro-ducts, as found by electron microscopy studies.35
The impedance spectrum of ZX00HPT strongly differs fromthat of ZX00EXT with respect to both size and shape (Fig. 2).For ZX00HPT, the generally smaller spectrum and in particularthe strongly reduced polarization resistance RP (Table 2),which is inversely proportional to the corrosion rate, indicatesa decreased corrosion resistance of this sample type. Thisfaster dissolution can be considered to arise from the higherdensity of structural defects, especially grain boundaries,present in the HPT-processed material, leading to a less pro-tective surface product film, as supported by the decreasedRdiff value (Table 1). As known from literature,10 a fast for-mation of the porous Mg(OH)2 layer will not effectively create abarrier between the alloy matrix and the corrosive electrolyte.The high dissolution activity at HPT-induced defects will causeextensive hydrogen formation, which leads to cracks, disrup-tions and delamination in the Mg(OH)2 layer. These imperfec-tions in the Mg(OH)2 layer provide channels for the electrolyteto reach the surface and thus increase the film-free surfacearea, leading to the high dissolution activity and the signifi-cant decrease in the anodic resistance RA.
This interpretation is also supported by the characteristicshapes of the different EIS spectra: the ZX00EXT spectrum con-sists of two clear capacitive loops (upper branch), with the highfrequency (left) loop stemming from charge transfer across theinterface in parallel to the MgO film capacitance and the low fre-quency (right) loop representing Mg2+ transport through theporous surface layer, and one inductive loop (lower branch)caused by Mg+ intermediates at the surface and thus indicatingdirect dissolution from alloy into the electrolyte.36 In contrast tothis, in the ZX00HPT spectrum, the high frequency loop is hardlyexistent, only visible as a small shoulder, while the inductiveloop is more pronounced, both indicating the lack of an effec-tively protective corrosion product layer.
The reduced corrosion resistance of HPT-processedsamples, as deduced from EIS, strongly affects the open-volume defects which evolve during corrosion as observed bye+ lifetime spectroscopy. The estimated fraction fe+,corr of posi-trons beeing stopped in the corrosion product layer (Fig. 5) upto a corrosion time of 2 h is rather similar to the measuredintensity I3 of the e+ lifetime component τ3 for both ZX00EXTand ZX00HPT. The component τ3 can therefore be attributed toe+ annihilation in this product layer and the oxide layer under-neath. The high value of τ3, exceeding 500 ps, is characteristicfor positronium formation and annihilation in larger open-volume structures such as pores and cracks. This direct prooffor larger open-volume elements supports the notion on thedefect structure obtained by other techniques, such as trans-mission electron microscopy, small angle neutron scattering,or gas adsorption.40 These studies reveal for the corrosionproduct layer a nanoporous filamentous structure with poresizes ranging from 20 to 40 nm. The MgO interlayer, on theother hand, is considered to affect e+ annihilation only to aminor extent if at all. According to studies of different Mgalloys in corrosive environments, the thickness of this layer isin the range of a few hundred nanometers or even less, i.e.,much thinner than the corrosion product layer.37,40
The earlier onset of the τ3-component and its higher value inZX00HPT (after 60 s, already) compared to ZX00EXT (after 5 min,only) indicate a more stronger onset of corrosion after HPT asalso clearly shown by the present results from EIS (Fig. 2). Thesubstantially reduced resistance of ZX00HPT against corrosionobserved by EIS becomes more dramatically effective in thedefect structure formed after longer corrosion times tcorr >2 h.The intensity sum I2 + I3 of the long e+ annihilation componentsstrongly exceeds the fraction fe+,corr of e
+ beeing stopped in thecorrosion product layer (compare Fig. 4 and Fig. 6). This is con-sidered as clear evidence for corrosion-induced defects withlarge open volume in deeper parts of the ZX00HPT-material.
The enhanced corrosion rate favors void formation withinthe matrix underneath the surface Mg-oxide forming a defect-rich layer.23 Of even more relevance here is the fact that themajor corrosion product, namely hydrogen, can be absorbedduring degradation by the Mg matrix20,21 and may inducedefects in far deeper parts. For instance, electron microscopyin combination with secondary ion mass spectroscopy yieldsevidence of cracks in the μm-range during corrosion as a resultof the brittle fracture of MgH2.
20 Also, stress corrosion crackingtests suggest hydrogen embrittlement caused, e.g., by crack for-mation.21 In coarse-grained metals upon hydrogen loading evi-dence for large open-volume defects is found in near surfaceregions by positron annihilation,47,48 but not for the bulkwhere vacancy-type defects and dislocations prevail as e+
traps.49,50 Fine-grained HPT-deformed Mg, on the other hand,is strongly absorbing hydrogen into the bulk, presumablyarising from enhanced diffusivity associated with the highnumber of GBs.51 Furthermore, a faster corrosion process isaccompanied by an enhanced production of hydrogen,29
leading to a larger amount of absorbable hydrogen. We there-fore conclude that the strong hydrogen uptake during cor-
Fig. 6 Corrosion creates a near-surface defect layer in the alloy, whichis covered by a thin MgO layer, followed by further corrosion products.Deeper inside the alloy bulk, hydrogen induced defects may form.
Paper Biomaterials Science
4106 | Biomater. Sci., 2021, 9, 4099–4109 This journal is © The Royal Society of Chemistry 2021
Ope
n A
cces
s A
rtic
le. P
ublis
hed
on 3
0 A
pril
2021
. Dow
nloa
ded
on 3
/13/
2022
4:5
8:18
AM
. T
his
artic
le is
lice
nsed
und
er a
Cre
ativ
e C
omm
ons
Attr
ibut
ion-
Non
Com
mer
cial
3.0
Unp
orte
d L
icen
ce.
View Article Online

rosion into the bulk of ZX00HPT combined with the reducedcorrosion resistance (monitored by EIS) and the larger amountof absorbable hydrogen gives rise to the formation of largeopen-volume defects in deeper parts which is detected in thepresent study by the strong intensity increase the long e+
annihilation components.In contrast, the intensity I3 of ZX00EXT does not exceed the
fraction fe+,corr of e+ beeing stopped in the corrosion productlayer for longer corrosion times tcorr >2 h and the τ3 com-ponent can still be related to annihilation events mainly in thecorrosion product layer. Corrosion-related defects deeper intothe material are not detected during the investigated corrosiontime, which is in good accordance with the slower corrosionrate, as found by EIS. Therefore it can be concluded, thatfurther grain refinement and the so additionally introduceddefects, as e.g. done in this work by HPT processing, has nega-tive effects on the corrosion behavior of the investigated ZX00alloy and makes it less suitable for potential biomedical appli-cation. Corrosion-dampening strategies, which were success-fully applied to Mg-alloys in the past,52 might be an additionof Mn, which can be tolerated by the human body and isknown to mitigate impurity-effects on corrosion, or also a pre-anodization treatment of the samples to delay the onset of cor-rosion. Beside the choice of a suitable material, also the phys-iological environment has an effect on the samples degra-dation behavior. Adding biological ions or proteins to the cor-rosive environment, e.g., causes changes in the degradationmorphology due to an enhanced pit formation on thematerials surface.53 Therefore adding some proteins to PBS,e.g., will provide further insights into the corrosion behavior ofZX00 alloys with respect to the use in the human body.
V. Conclusion
In this work positron lifetime and electrochemical impedancespectroscopy were successfully applied to investigate the corrosionprocess of a Mg-based alloy. In good agreement with electro-chemical impedance spectroscopy, PLS shows that HPT-proces-sing clearly reduces the corrosion resistance of the here-investi-gated Mg-based alloy ZX00. We see that severe plastic deformationintroduces significant amounts of open volume defects, especiallygrain boundaries, into the uncorroded material, which in the fol-lowing strongly influence the degradation behavior. For HPT-samples, structural defects such as cracks and voids formedwithin the corrosion product layer, making this layer ineffective inprotecting the surface from further corrosion and leading togetherwith the higher grain boundary density to enhanced corrosionrates. In addition, the HPT-deformed structure also favors hydro-gen-uptake into the material, causing large open-volume defectsin deeper parts of the material below the corrosion layer, asshown by positron annihilation, and leading to a further deterio-ration of the materials properties.
Further combination of positron lifetime measurementswith an appropriate electrochemical cell, as demonstratedrecently for battery electrodes,54 would allow to study dynami-
cally and in situ the corrosion process under cathodic oranodic polarization, e.g., and would give further insights inthe formation of corrosion-related defects.
Conflicts of interest
There are no conflicts of interest to declare.
A. Results of diffusion-reactionmodels of positron trapping atextended defects
Diffusion- and reaction limited e+ trapping at grain boundarieshas been treated by Würschum and Seeger42 and byOberdorfer and Würschum43 for spherical-shaped grains andby Würschum45 for cylindrical-shaped grains.
The mean e+ lifetime reads for spherical symmetry (ref. 43,eqn (30)):
τm ¼ τb 1þ 3αrðτgb � τbÞ γ0DLðγ0rÞ
αþ γ0DLðγ0rÞ� �
ðA1Þ
and for cylindrical symmetry (ref. 45: left part of eqn (10)without weighting factor (r/R)2):
τm ¼ τb 1þ 2αrðτgb � τbÞ γ0DΘðγ0rÞ
αþ γ0DΘðγ0rÞ� �
: ðA2Þ
The intensity of the e+ lifetime component τgb associatedwith trapping and annihilation at GBs reads for spherical sym-metry (ref. 43, eqn (31)):
Igb ¼ 3αr
γgbDLðγgbrÞ½αþ γgbDLðγgbrÞ�ðτ�1
b � τ�1gb Þ
ðA3Þ
and for cylindrical symmetry (ref. 45: eqn (16) without weight-ing factor (r/R)2):
Igb ¼ 2αr
γgbDΘðγgbrÞ½αþ γgbDΘðγgbrÞ� τ�1
b � τ�1gb
� � ; ðA4Þ
with
γ20 ¼τ�1b
D; γ2gb ¼ τ�1
b � τ�1gb
D; ðA5Þ
the Langevin function:
LðzÞ ¼ coth z � 1z
ðA6Þ
and
ΘðzÞ ¼ I1ðzÞI0ðzÞ ; ðA7Þ
where Ij ( j = 0, 1) denote the modified Bessel functions.55 Ddenotes the e+ diffusivity, α the specific e+ trapping rate, τgb thee+ lifetime in the grain boundary, and r the grain radius.
Biomaterials Science Paper
This journal is © The Royal Society of Chemistry 2021 Biomater. Sci., 2021, 9, 4099–4109 | 4107
Ope
n A
cces
s A
rtic
le. P
ublis
hed
on 3
0 A
pril
2021
. Dow
nloa
ded
on 3
/13/
2022
4:5
8:18
AM
. T
his
artic
le is
lice
nsed
und
er a
Cre
ativ
e C
omm
ons
Attr
ibut
ion-
Non
Com
mer
cial
3.0
Unp
orte
d L
icen
ce.
View Article Online
Solutions for diffusion- and reaction limited e+ trapping atprecipitate–matrix interfaces of spherical-shaped precipitateswere presented by Würschum et al.44 The mean e+ lifetimereads (ref. 44: eqn (30)):
and the intensity of the e+ lifetime component τif associatedwith trapping and annihilation at the precipitate–matrix inter-face (ref. 44: eqn (31)):
Iif ¼ Kτ�1b � τ�1
if
γif R̂� tanhðγif R̂Þ½1� γ2ifrR�γif R̂� tanhðγif R̂Þ½1� γ2ifrR� þ αr
D ½γifR� tanhðγif R̂Þ�ðA9Þ
with
γ2if ¼τ�1b � τ�1
if
D; K ¼ 3αr2
R3 � r3; R̂ ¼ R� r; ðA10Þ
where R denotes the half distance between the precipitatesand r the precipitate radius.
Acknowledgements
The authors are indebted to Wolfgang Sprengel (Institute ofMaterials Physics, TU Graz) for technical support and for valu-able comments.
References
1 P. Holweg, L. Berger, M. Cihova, N. Donohue, B. Clement,U. Schwarze, N. G. Sommer, G. Hohenberger, J. J. van denBeucken, F. Seibert, et al., Acta Biomater., 2020, 113, 646–659.
2 H. Ibrahim, A. D. Klarner, B. Poorganji, D. Dean, A. A. Luoand M. Elahinia, J. Mech. Behav. Biomed. Mater., 2017, 69,203–212.
3 B. J. Luthringer, F. Feyerabend and R. Willumeit-Römer,Magnesium Res., 2014, 27, 142–154.
4 G. Manivasagam and S. Suwas, Mater. Sci. Technol., 2014,30, 515–520.
5 N. Li and Y. Zheng, J. Mater. Sci. Technol., 2013, 29, 489–502.
6 H. Zreiqat, C. Howlett, A. Zannettino, P. Evans, G. Schulze-Tanzil, C. Knabe and M. Shakibaei, J. Biomed. Mater. Res.,2002, 62, 175–184.
7 N. G. Grün, P. Holweg, S. Tangl, J. Eichler, L. Berger,J. J. Van den Beucken, J. F. Löffler, T. Klestil andA. M. Weinberg, Acta Biomater., 2018, 78, 378–386.
8 N. Ikeo, M. Nishioka and T. Mukai, Mater. Lett., 2018, 223,65–68.
9 J. Horky, A. Ghaffar, K. Werbach, B. Mingler,S. Pogatscher, R. Schäublin, D. Setman, P. J. Uggowitzer,J. F. Löffler and M. J. Zehetbauer, Materials, 2019, 12,2460.
10 D. Song, A. Ma, J. Jiang, P. Lin, D. Yang and J. Fan, Corros.Sci., 2010, 52, 481–490.
11 C. op’t Hoog, N. Birbilis and Y. Estrin, Adv. Eng. Mater.,2008, 10, 579–582.
12 M. Gholami-Kermanshahi, V.-D. Neubert, M. Tavakoli,F. Pastorek, B. Smola and V. Neubert, Adv. Eng. Mater.,2018, 20, 1800121.
13 J. Gao, S. Guan, Z. Ren, Y. Sun, S. Zhu and B. Wang, Mater.Lett., 2011, 65, 691–693.
14 D. Ahmadkhaniha, Y. Huang, M. Jaskari, A. Järvenpää,M. H. Sohi, C. Zanella, L. P. Karjalainen andT. G. Langdon, J. Mater. Sci., 2018, 53, 16585–16597.
15 C. Zhang, S. Zhu, L. Wang, R. Guo, G. Yue and S. Guan,Mater. Des., 2016, 96, 54–62.
16 Y. Xu, J. Li, M. Qi, J. Gu and Y. Zhang, J. Mater. Sci., 2020,55, 1231–1245.
17 P. Hautojärvi, A. Dupasquier and M. Manninen, Positronsin solids, Springer, 1979, vol. 12.
18 R. Krause-Rehberg and H. S. Leipner, Positron annihilationin semiconductors: defect studies, Springer Science andBusiness Media, 1999, vol. 127.
19 M. J. Puska and R. M. Nieminen, Rev. Mod. Phys., 1994, 66,841.
20 J. Chen, J. Wang, E. Han, J. Dong and W. Ke, Corros. Sci.,2008, 50, 1292–1305.
21 M. Kappes, M. Iannuzzi and R. M. Carranza, J. Electrochem.Soc., 2013, 160, C168.
22 W. Yang, Z. Zhu, J. Wang, Y. Wu, T. Zhai and G.-L. Song,Corros. Sci., 2016, 106, 271–280.
23 Y. Wu, R. Zhang, H. Chen, Y. Li, J. Zhang, D.-M. Zhu andY. Jean, Radiat. Phys. Chem., 2003, 68, 599–603.
24 X. Wu, P. Asoka-Kumar, K. Lynn and K. R. Hebert,J. Electrochem. Soc., 1994, 141, 3361.
25 R. Pietrzak, R. Szatanik and M. Szuszkiewicz, Acta Phys.Pol., A, 1999, 95, 647–651.
26 R. Pietrzak and R. Szatanik, Phys. Status Solidi B, 2010, 247,1822–1828.
27 R. Pietrzak and R. Szatanik, Nukleonika, 2015, 60, 755–758.28 M. R. E. S. Aly, H. Shokry, T. Sharshar and M. A. Amin,
J. Mol. Liq., 2016, 214, 319–334.29 N. Kirkland, N. Birbilis and M. Staiger, Acta Biomater.,
2012, 8, 925–936.30 H. Schröttner, Gießerei-Praxis, 2010, 10, 307–320.31 T. Pabel, T. Petkov, H. Schröttner, M. Albu, A. Rossmann-
Perner and P. Schumacher, 57th International FoundryConference, 2017, p. 93.
τm ¼ τb 1þ Kðτif � τbÞ γ0R̂� tanhðγ0R̂Þ½1� γ20rR�γ0R̂� tanhðγ0R̂Þ½1� γ20rR� þ αr
D ½γ0R� tanhðγ0R̂Þ�
( )ðA8Þ
Paper Biomaterials Science
4108 | Biomater. Sci., 2021, 9, 4099–4109 This journal is © The Royal Society of Chemistry 2021
Ope
n A
cces
s A
rtic
le. P
ublis
hed
on 3
0 A
pril
2021
. Dow
nloa
ded
on 3
/13/
2022
4:5
8:18
AM
. T
his
artic
le is
lice
nsed
und
er a
Cre
ativ
e C
omm
ons
Attr
ibut
ion-
Non
Com
mer
cial
3.0
Unp
orte
d L
icen
ce.
View Article Online

32 D. J. Keeble, U. Brossmann, W. Puff and R. Würschum,Charact. Mater., 2002, 1–28.
33 J. V. Olsen, P. Kirkegaard, N. J. Pedersen and M. Eldrup,Phys. Status Solidi C, 2007, 4, 4004–4006.
34 O. Poupard, A. Aït-Mokhtar and P. Dumargue, J. Mater. Sci.,2003, 38, 2845–2850.
35 M. Cihova, E. Martinelli, P. Schmutz, A. Myrissa,R. Schäublin, A. M. Weinberg, P. Uggowitzer andJ. F. Löffler, Acta Biomater., 2019, 100, 398–414.
36 G. Baril, G. Galicia, C. Deslouis, N. Pébère, B. Tribollet andV. Vivier, J. Electrochem. Soc., 2006, 154, C108.
37 M. P. Gomes, I. Costa, N. Pébère, J. L. Rossi, B. Tribolletand V. Vivier, Electrochim. Acta, 2019, 306, 61–70.
38 A. D. King, N. Birbilis and J. R. Scully, Electrochim. Acta,2014, 121, 394–406.
39 Y. Liu, M. Curioni and Z. Liu, Electrochim. Acta, 2018, 264,101–108.
40 M. Brady, G. Rother, L. Anovitz, K. Littrell, K. Unocic,H. Elsentriecy, G.-L. Song, J. Thomson, N. Gallego andB. Davis, J. Electrochem. Soc., 2015, 162, C140.
41 J. Čížek, I. Procházka, B. Smola, I. Stulíková, R. Kužel,Z. Matěj, V. Cherkaska, R. Islamgaliev and O. Kulyasova,Mater. Sci. Eng., A, 2007, 462, 121–126.
42 R. Würschum and A. Seeger, Philos. Mag. A, 1993, 73,1489.
43 B. Oberdorfer and R. Würschum, Phys. Rev. B: Condens.Matter Mater. Phys., 2009, 79, 184103.
44 R. Würschum, L. Resch and G. Klinser, Phys. Rev. B, 2018,97, 224108.
45 R. Würschum, L. Resch and G. Klinser, AIP Conf. Proc.,2019, p. 050010.
46 J.-Y. Lee, G. Han, Y.-C. Kim, J.-Y. Byun, J.-i. Jang, H.-K. Seokand S.-J. Yang, Met. Mater. Int., 2009, 15, 955–961.
47 Y. Wu and Y. Jean, Phys. Status Solidi A, 2004, 201, 917–922.48 R. Checchetto, N. Bazzanella, A. Kale, A. Miotello,
S. Mariazzi, R. Brusa, P. Mengucci, C. Macchi, A. Somoza,W. Egger, et al., Phys. Rev. B: Condens. Matter Mater. Phys.,2011, 84, 054115.
49 J. Čížek, I. Procházka, F. Bečvář, R. Kužel, M. Cieslar,G. Brauer, W. Anwand, R. Kirchheim and A. Pundt, Phys.Rev. B: Condens. Matter Mater. Phys., 2004, 69, 224106.
50 K. Sakaki, M. Mizuno, H. Araki and Y. Shirai, J. AlloysCompd., 2006, 414, 204–206.
51 A. Grill, J. Horky, A. Panigrahi, G. Krexner and M. Zehetbauer,Int. J. Hydrogen Energy, 2015, 40, 17144–17152.
52 G. Song, Corros. Sci., 2007, 49, 1696–1701.53 H. Liu, J. Biomed. Mater. Res., Part A, 2011, 99, 249–260.54 G. Klinser, H. Kren, S. Koller and R. Würschum, Appl. Phys.
Lett., 2019, 114, 013905.55 F. W. Olver, NIST Handbook of Mathematical Functions,
Cambridge University Press, 2010.56 P. Hautojärvi, J. Johansson, A. Vehanen, J. Yli-Kauppila,
J. Hillairet and P. Tzanétakis, Appl. Phys. A, 1982, 27, 49–56.57 J. Čížek, I. Procházka, B. Smola, I. Stulíková, R. Kužel,
Z. Matěj, V. Cherkaska, R. K. Islamgaliev andO. B. Kulyasova, Mater. Sci. Forum, 2005, 183–186.
58 J. Dryzek, E. Dryzek, T. Suzuki and R. Yu, Tribol. Lett., 2005,20, 91–97.
59 R. Nieminen and M. Manninen, Positrons in solids,Springer, 1979, pp. 145–195.
60 B. Bergersen, E. Pajanne, P. Kubica, M. Stott andC. Hodges, Solid State Commun., 1974, 15, 1377–1380.
Biomaterials Science Paper
This journal is © The Royal Society of Chemistry 2021 Biomater. Sci., 2021, 9, 4099–4109 | 4109
Ope
n A
cces
s A
rtic
le. P
ublis
hed
on 3
0 A
pril
2021
. Dow
nloa
ded
on 3
/13/
2022
4:5
8:18
AM
. T
his
artic
le is
lice
nsed
und
er a
Cre
ativ
e C
omm
ons
Attr
ibut
ion-
Non
Com
mer
cial
3.0
Unp
orte
d L
icen
ce.
View Article Online