Embed Size (px)
Citation preview

Inflation Education
September 2014
150 Spear Street, Suite 950 San Francisco, CA 94105 Phone: 866-627-6984

DISCLAIMER
The charts in this presentation are for illustrative purposes only. Individual clients may achieve results materially different from the results portrayed herein. All investments involve risks and you may lose money. Parallel Advisors, LLC (“Parallel”) does not guarantee any particular investment outcome. The charts depict average expected risks and returns for the asset mixes shown herein, which are may or may not be asset mixes currently recommended by Parallel. Expected returns shown herein are based on a building block methodology which incorporates both current and historical returns, risk premiums, interest rates and inflation. This data was compiled and performance returns were calculated using this building block methodology and does not represent actual trading, or investment decisions made, by Parallel. The hypothetical performance was calculated after the fact and does not reflect the impact that material economic and market factors might have on the decision-making by Parallel if it had been managing the assets. Performance returns reflect the reinvestment of dividends and are calculated based on total returns, including gains or losses plus income, and do not include any deductions for transaction expenses or management fees charged by Parallel, which management fees are described in Parallel’s current Summary Disclosure Brochure, a copy of which is available upon request.***PAST PERFORMANCE IS NO GUARANTEE OF FUTURE RESULTS***

Overview on Inflation & The Federal Reserve
Inflation has been a hot topic lately as the Federal Reserve weighs its first interest rate hike. The Fed is focused on the employment picture and its inflation target of 2.5%.
No single employment measure will cause the Fed to act as they are looking hard at unemployment (underemployment), payroll growth, labor market slack and wage pressure.
The unemployment rate misrepresents the true environment because the labor participation rate is near historic lows and does not accurately reflect people who have grown frustrated and left the workforce. It also does not capture the “underemployed”. The Fed believes that labor markets are weaker than the headline unemployment rate and slack has kept wages low.
Job growth has averaged 214,000/month in 2014 and while this is up from the past few years, it is well short of the 300,000/month during past economic recoveries. Given the amount of damage from the financial crisis, the Fed is in no hurry to declare the job market healthy.
Wages have only grown 2% year-over-year and there are no signs of wage pressure/inflation.
No single data point will drive the Fed decision making and we believe that inflation and wage pressure continue to be key metrics to watch. Given the lack of wage pressure and core CPI/PCE inflation, the Fed can afford to wait before adjusting monetary policy. Despite better U.S. economic growth, we believe that the Fed is also concerned about slowing global growth.
3
Implement

What is Inflation?
Inflation is defined as a sustained increase in the general level of prices for goods and services.
It is measured as an annual percentage increase.
As inflation rises, every dollar you own buys a smaller percentage of a good or service, and purchasing power declines.
If the annual inflation rate is 2%, a $1 pack of gum will cost $1.02 in a year.
“Core” Inflation excludes the more volatile food and energy prices.
4
Implement
Source: U.S. Bureau of Labor Statistics, CPI Index-Avg Price Data 3/1982-3/2012
According to our calculation, $100 back in 1982 would be worth $238 in 2012 when accounting for CPI Inflation. This represents a cumulative inflation rate of 138%.

Other Types of Inflation
Deflation occurs when the general level of prices is falling (opposite of inflation).
The last major period of U.S. deflation occurred during the Great Depression. From 1930-1933, the rate of deflation approached 10%/year. In addition to numerous bank failures, unemployment topped 25%.
Hyper-inflation is a period of unusually rapid inflation that can lead the breakdown of a nation’s monetary system. This is often caused by an excessive growth in the money supply.
The U.S. has never faced a period of hyper-inflation and the most recent example globally is Zimbawein 2008 where inflation peaked at 98%.
Stagflation is the combination of high unemployment and economic stagnation with inflation.
Stagflation occurred in the 1970’s as oil prices spiked higher, GDP and corporate earnings fell, and unemployment moved higher.
Reflation is an attempt to raise the general level of prices to counteract deflationary pressures.
Disinflation is a decrease in the overall rate of inflation.
Japan experienced disinflation in the early 1990’s before entering a protracted period of deflation.5
Implement

Real World U.S. Examples of Inflation, Deflation, and Stagflation
6
Implement
Source: U.S. Bureau of Labor Statistics

Common Methods For Reporting Inflation
Consumer Price Index (CPI) - measures changes in the price level of a market basket of consumer goods and services purchased by households. Calculated and reported monthly by the Bureau of Labor Statistics.
Personal Consumption Expenditure (PCE) – measures the average increase/decrease in prices for all domestic personal consumption. Calculated and reported monthly by the Bureau of Economic Analysis.
Producer Price Index (PPI) - measures the average changes in prices received by domestic producers for their output. Calculated and reported monthly by the Bureau of Labor Statistics.
GDP Deflator – measures the level of prices of all new, domestically produced, final goods and services in an economy (GDP). Calculated and reported quarterly by the Bureau of Economic Analysis.
Employment Cost Index (ECI) – measures the changes in the costs of labor for businesses in the U.S. economy. Calculated and reported quarterly by the Bureau of Labor Statistics.
7
Implement
Consumer Price Index (CPI)
The CPI is a measure of the average change over time in the prices paid by urban consumers for a market basket of consumer goods and services. It is a statistical estimate constructed using the prices of a sample of representative items whose prices are collected periodically.
CPI = updated cost/base period cost x 100
The BLS collects data on expenditure items and classifies them into more than 200 categories across eight major groups. Major groups and examples of categories in each are as follows:
Food & Beverages, Housing, Apparel, Transportation, Medical Care, Recreation, Education & Communication, and Other Goods & Services.
Also included within these major groups are various government-charged user fees, such as water and sewerage charges, auto registration fees, and vehicle tolls. In addition, the CPI includes taxes (such as sales and excise taxes) that are directly associated with the prices of specific goods and services.
Prices for the goods and services used to calculate the CPI are collected in 87 urban areas throughout the country and from about 23,000 retail and service establishments. Data on rents are collected from about 50,000 landlords or tenants.
The CPI “Core” Index strips out volatile food and energy so users can focus on the core or underlying rate of inflation.
8
Implement

Personal Consumption Expenditure (PCE)
The PCE Price Index is an indicator of the average increase/decrease in prices for all domestic personal consumption (urban and rural). Personal consumption expenditures consist of the actual and imputed expenditures of households, and it includes data pertaining to durables, non-durables and services. PCE is essentially a measure of goods and services targeted toward individuals and consumed by individuals.
This is the preferred inflation method of the Federal Reserve, but they look at a variety of other metrics.
In comparison to CPI, which uses one set of expenditure weights for several years, PCE uses a Fisher Price Index, which uses expenditure data from both the current period and the preceding period. Unlike the CPI that cannot be revised, the PCE can be revised to account for new data/information.
Also, PCE uses a chained index which compares one quarter's price to the last quarter's instead of choosing a fixed base. This price index method assumes that the consumer has made allowances for changes in relative prices. That is to say, they have substituted from goods whose prices are rising to goods whose prices are stable or falling.
The PCE generally rises about 0.3%-0.5% less than the CPI, a trend that dates back to 1992. This may be due to the failure of CPI to take into account substitution.
9
Implement

CPI vs. PCE
The Fed prefers PCE over CPI and the official switch from CPI to PCE occurred in 2000 when the FOMC stopped publishing CPI forecasts and began to frame its inflation projections in terms of the PCE Index.
The conclusion was that the PCE has several advantages over the CPI:
1. The changing composition of spending is more consistent with actual consumer behavior
2. The weights are based on a more comprehensive measure of expenditures
3. PCE data can be revised to account for newly available information and improved measurement techniques
The spread between the two has been about 0.3%-0.5% over the long run and it is driven in part by the composition effect where the CPI basket is fixed and the PCE basket allows for substitutions which usually translates into cheaper goods and services.
The CPI reflects out-of-pocket expenditures of all urban households, but the PCE also includes goods and services purchased by non-profit organizations serving on behalf of households. The PCE captures both rural and urban households versus only urban households in the CPI.
The PCE includes the imputed cost of financial services furnished without payment which are not included in the CPI (examples are medical spending and insurance premiums paid by employers and federal government programs like Medicare).
10
Implement

Why The Fed Prefers PCE
The PCE Index is updated more frequently and takes into account things like employer expenditures on healthcare and substitution between goods.
The CPI is based on what people say they’re buying, and it’s adjusted less frequently. As a general rule, the CPI overemphasizes housing, while the PCE overemphasizes healthcare.
The PCE is more representative of changes in the actual cost of living for consumers.
The Fed has a dual mandate and their goal is to minimize inflation and promote price stability.
The PCE measures a much broader group of goods and services along with a much broader cross section of American households (rural households as an example).
11
Implement

CPI Core vs. PCE Core
12
Implement0.0
1.0
2.0
3.0
4.0
5.0
6.0
Jan
-90
Jun
-90
No
v-9
0A
pr-
91
Sep
-91
Feb
-92
Jul-
92
De
c-9
2M
ay-9
3O
ct-9
3M
ar-9
4A
ug-
94
Jan
-95
Jun
-95
No
v-9
5A
pr-
96
Sep
-96
Feb
-97
Jul-
97
De
c-9
7M
ay-9
8O
ct-9
8M
ar-9
9A
ug-
99
Jan
-00
Jun
-00
No
v-0
0A
pr-
01
Sep
-01
Feb
-02
Jul-
02
De
c-0
2M
ay-0
3O
ct-0
3M
ar-0
4A
ug-
04
Jan
-05
Jun
-05
No
v-0
5A
pr-
06
Sep
-06
Feb
-07
Jul-
07
De
c-0
7M
ay-0
8O
ct-0
8M
ar-0
9A
ug-
09
Jan
-10
Jun
-10
No
v-1
0A
pr-
11
Sep
-11
Feb
-12
Jul-
12
De
c-1
2M
ay-1
3O
ct-1
3M
ar-1
4
% Y/Y Change
PCE Core CPI Core
Source: Bureau of Labor Statistics, Bureau of Economic Analysis
PCE & CPI core inflation track pretty closely over time, but CPI has historically been 0.3-0.5% higher. The current spread is 0.4%.

Average Hourly Earnings
13
Implement
1.0
1.5
2.0
2.5
3.0
3.5
4.0
% Y/Y Change
Source: Bureau of Labor Statistics
Average hourly earnings have been hovering around the 2% level year-over-year since the end of the financial crisis. The Fed has indicated that they are not seeing widespread wage inflation.
Employment Cost Index (Total Comp)
14
Implement
1.0
1.5
2.0
2.5
3.0
3.5
4.0
4.5
Jan
-02
May
-02
Sep
-02
Jan
-03
May
-03
Sep
-03
Jan
-04
May
-04
Sep
-04
Jan
-05
May
-05
Sep
-05
Jan
-06
May
-06
Sep
-06
Jan
-07
May
-07
Sep
-07
Jan
-08
May
-08
Sep
-08
Jan
-09
May
-09
Sep
-09
Jan
-10
May
-10
Sep
-10
Jan
-11
May
-11
Sep
-11
Jan
-12
May
-12
Sep
-12
Jan
-13
May
-13
Sep
-13
Jan
-14
% Y/Y Change
Source: Bureau of Labor Statistics
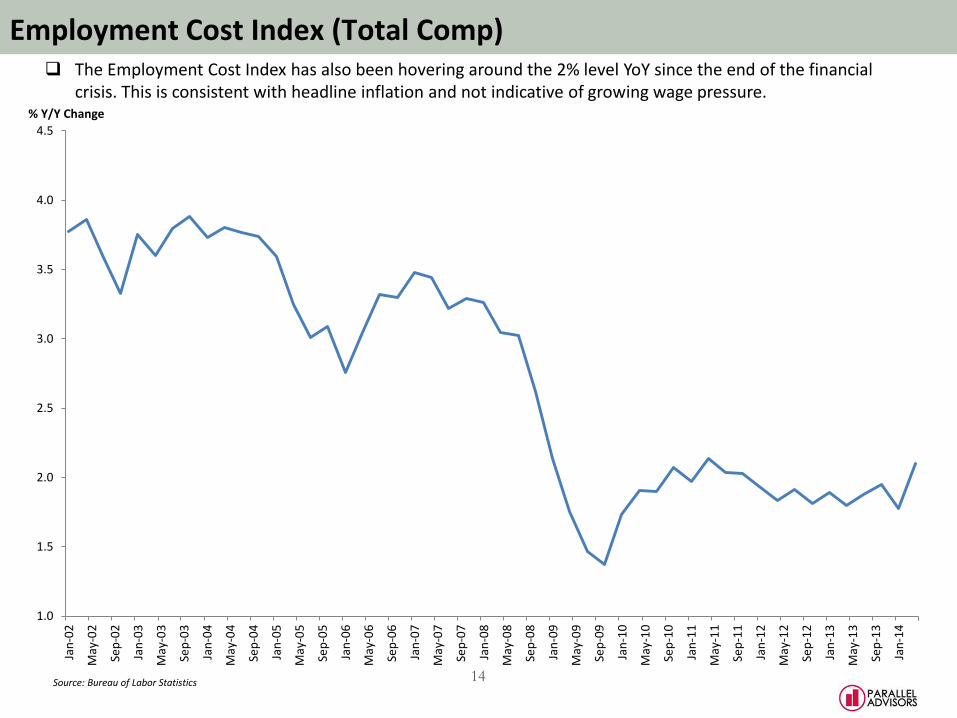
The Employment Cost Index has also been hovering around the 2% level YoY since the end of the financial crisis. This is consistent with headline inflation and not indicative of growing wage pressure.

What Will Cause The Fed To Raise Interest Rates
The Fed will act when core inflation and the job market heats up. The Fed focuses on the PCE Index, but considers several other data points like CPI, Employment Cost Index (ECI), etc.
The Fed’s stated inflation target is 2%, but they are focused on core inflation that excludes the more volatile food and energy sectors. The July Core CPI reading was 1.9% YoY, but the July Core PCE reading was only 1.5% YoY.
The Fed is very focused on wage pressure and average hourly earnings and the ECI have hovered around the 2% level YoY. Wage growth has been in line with general inflation and the Fed notes that there is significant slack in the labor market due to the number of underemployed and unemployed Americans.
They may be forced to raise rates when there is evidence of wage pressure in the labor market. If we move closer to full employment (less slack), wages will rise quicker and the Fed will have to take action sooner than expected. Janet Yellen argues that there is currently sufficient slack in labor markets and this should keep a lid on inflation and wage growth for the time being.
The Fed may also be forced to raise short term rates if core inflation (as measured by the PCE) surges higher past the 2% mark. Inflation has clearly ticked higher recently and the real question is WHEN the Fed will implement the first rate hike. Right now it appears to be targeted for 2015, but the Fed will continue to analyze a variety of data points in order to determine the most appropriate course of action.
15
Implement