Embed Size (px)
Citation preview
Saudi Arabian Monetary Authority Economic Research Department
First Quarter of 2017
Inflation Report
Saudi Arabian Monetary Authority Inflation Report — 1st Quarter, 2017 2
Inflation Report
Table of Contents
Cost of Living Index 3
Developments in Q1 2017 3
Influence of Major Sections on the General Cost of Living Index 3
Wholesale Price Indices 5
Cost of Living Index by Cities in Q1 2017 6
GDP Deflator 6
Foreign Trade with Major Trading Partners 10
Inflation Projections for Q2 2017 10
Conclusion 11
Saudi Arabian Monetary Authority Inflation Report — 1st Quarter, 2017 3
Inflation Report
Cost of Living Index
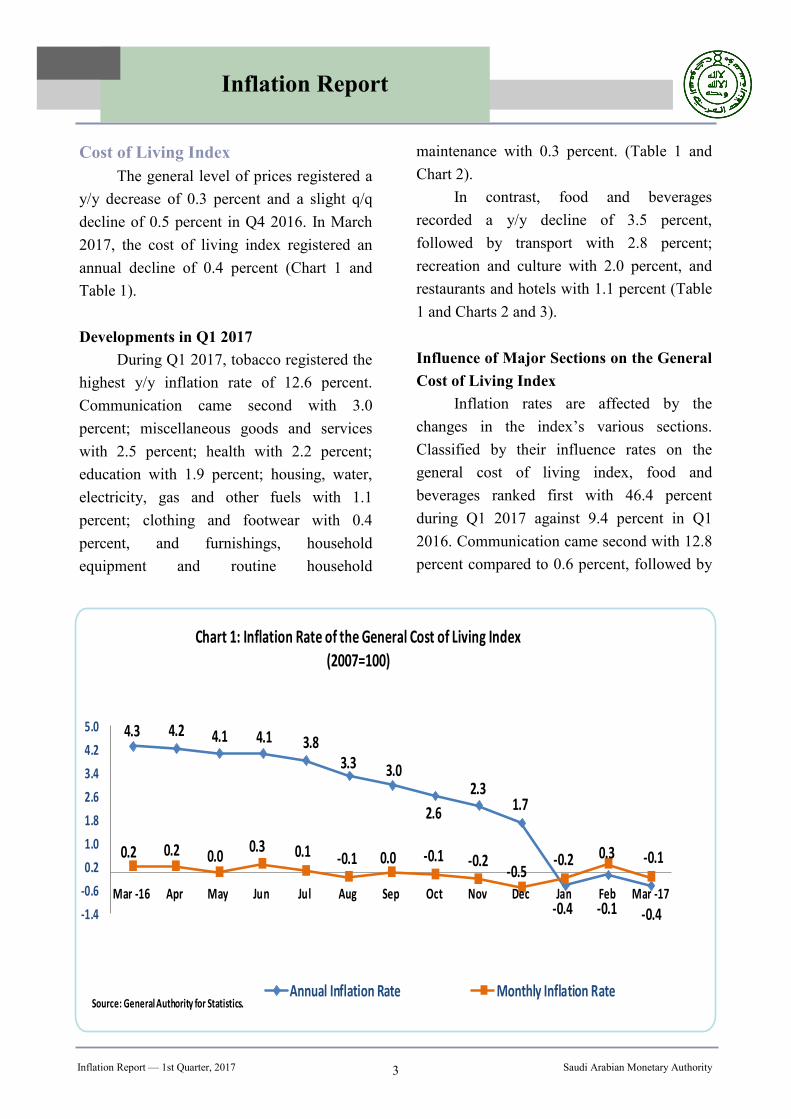
The general level of prices registered a
y/y decrease of 0.3 percent and a slight q/q
decline of 0.5 percent in Q4 2016. In March
2017, the cost of living index registered an
annual decline of 0.4 percent (Chart 1 and
Table 1).
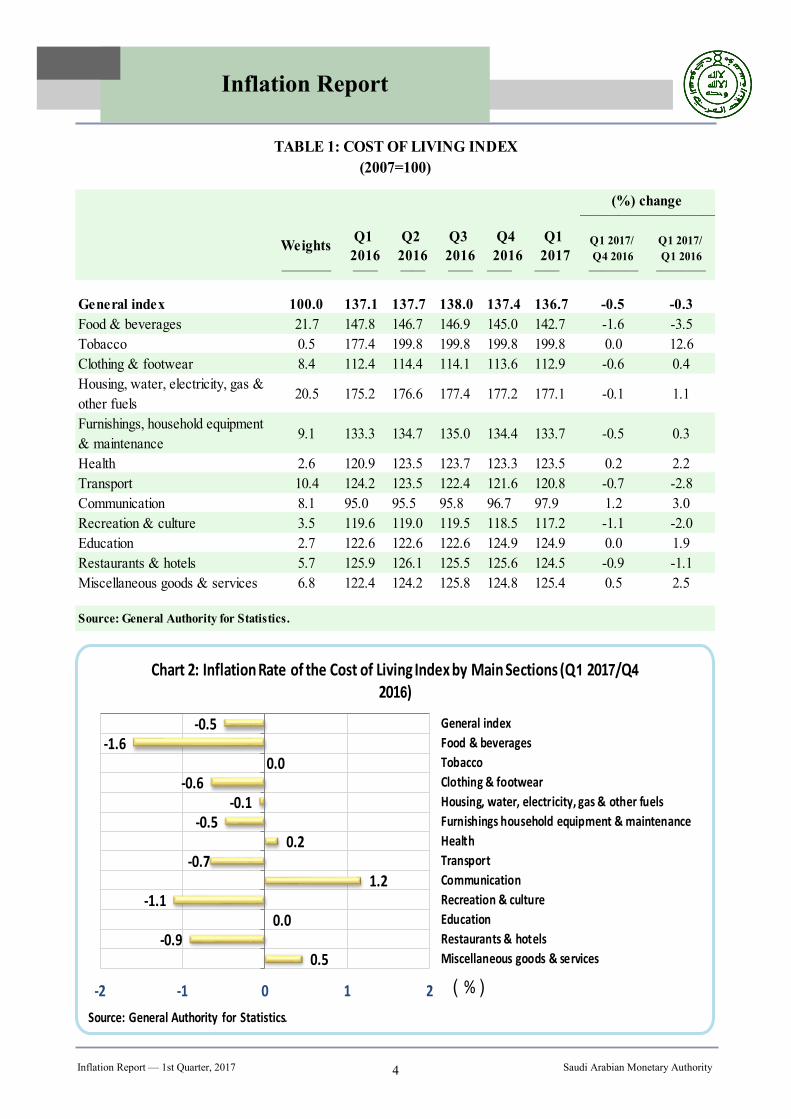
Developments in Q1 2017
During Q1 2017, tobacco registered the
highest y/y inflation rate of 12.6 percent.
Communication came second with 3.0
percent; miscellaneous goods and services
with 2.5 percent; health with 2.2 percent;
education with 1.9 percent; housing, water,
electricity, gas and other fuels with 1.1
percent; clothing and footwear with 0.4
percent, and furnishings, household
equipment and routine household
maintenance with 0.3 percent. (Table 1 and
Chart 2).
In contrast, food and beverages
recorded a y/y decline of 3.5 percent,
followed by transport with 2.8 percent;
recreation and culture with 2.0 percent, and
restaurants and hotels with 1.1 percent (Table
1 and Charts 2 and 3).
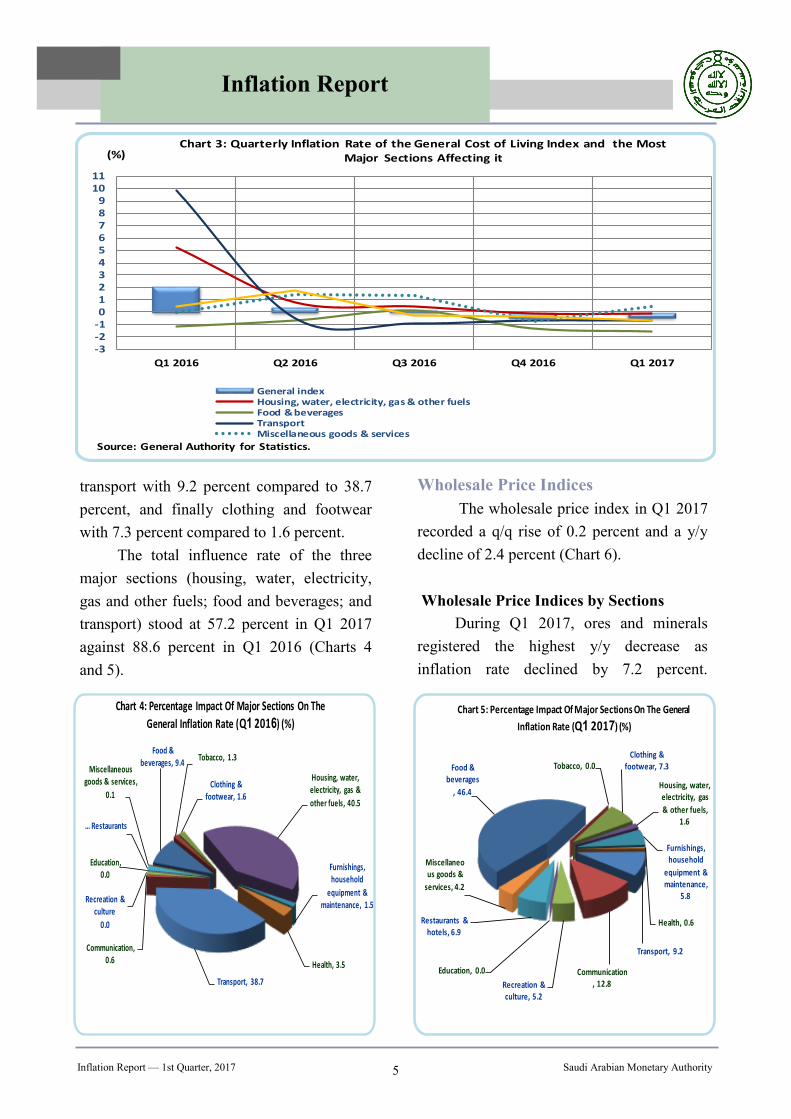
Influence of Major Sections on the General
Cost of Living Index
Inflation rates are affected by the
changes in the index’s various sections.
Classified by their influence rates on the
general cost of living index, food and
beverages ranked first with 46.4 percent
during Q1 2017 against 9.4 percent in Q1
2016. Communication came second with 12.8
percent compared to 0.6 percent, followed by
4.3 4.2 4.1 4.1 3.83.3 3.0
2.6
2.31.7
-0.4 -0.1 -0.4
0.2 0.2 0.00.3 0.1 -0.1 0.0 -0.1 -0.2
-0.5-0.2 0.3 -0.1
-1.4
-0.6
0.2
1.0
1.8
2.6
3.4
4.2
5.0
Mar -16 Apr May Jun Jul Aug Sep Oct Nov Dec Jan Feb Mar -17
Source: General Authority for Statistics
Chart 1: Inflation Rate of the General Cost of Living Index(2007=100)
Annual Inflation Rate Monthly Inflation Rate
Saudi Arabian Monetary Authority Inflation Report — 1st Quarter, 2017 4
Inflation Report
-0.5-1.6
0.0-0.6
-0.1-0.5
0.2-0.7
1.2-1.1
0.0-0.9
0.5
-2 -1 0 1 2
General index
Food & beverages
Tobacco
Clothing & footwear
Housing, water, electricity, gas & other fuels
Furnishings household equipment & maintenance
Health
Transport
Communication
Recreation & culture
Education
Restaurants & hotels
Miscellaneous goods & services
Source: General Authority for Statistics
%
Chart 2: Inflation Rate of the Cost of Living Index by Main Sections (Q 201 /Q
201 )
Q1 2017/
Q1 2016
Q1 2017/
Q4 2016
Q1
2017
Q4
2016
Q3
2016
Q2
2016
Q1
2016Weights
——————————————————————
-0.3-0.5136.7137.4138.0137.7137.1100.0General index
-3.5-1.6142.7145.0146.9146.7147.821.7Food & beverages
12.60.0199.8199.8199.8199.8177.40.5Tobacco
0.4-0.6112.9113.6114.1114.4112.48.4Clothing & footwear
1.1-0.1177.1177.2177.4176.6175.220.5Housing, water, electricity, gas &
other fuels
0.3-0.5133.7134.4135.0134.7133.39.1Furnishings, household equipment
& maintenance
2.20.2123.5123.3123.7123.5120.92.6Health
-2.8-0.7120.8121.6122.4123.5124.210.4Transport
3.01.297.996.795.895.595.08.1Communication
-2.0-1.1117.2118.5119.5119.0119.63.5Recreation & culture
1.90.0124.9124.9122.6122.6122.62.7Education
-1.1-0.9124.5125.6125.5126.1125.95.7Restaurants & hotels
2.50.5125.4124.8125.8124.2122.46.8Miscellaneous goods & services
TABLE 1: COST OF LIVING INDEX
(2007=100)
Source: General Authority for Statistics.
————————————(%) change
Saudi Arabian Monetary Authority Inflation Report — 1st Quarter, 2017 5
Inflation Report
transport with 9.2 percent compared to 38.7
percent, and finally clothing and footwear
with 7.3 percent compared to 1.6 percent.
The total influence rate of the three
major sections (housing, water, electricity,
gas and other fuels; food and beverages; and
transport) stood at 57.2 percent in Q1 2017
against 88.6 percent in Q1 2016 (Charts 4
and 5).
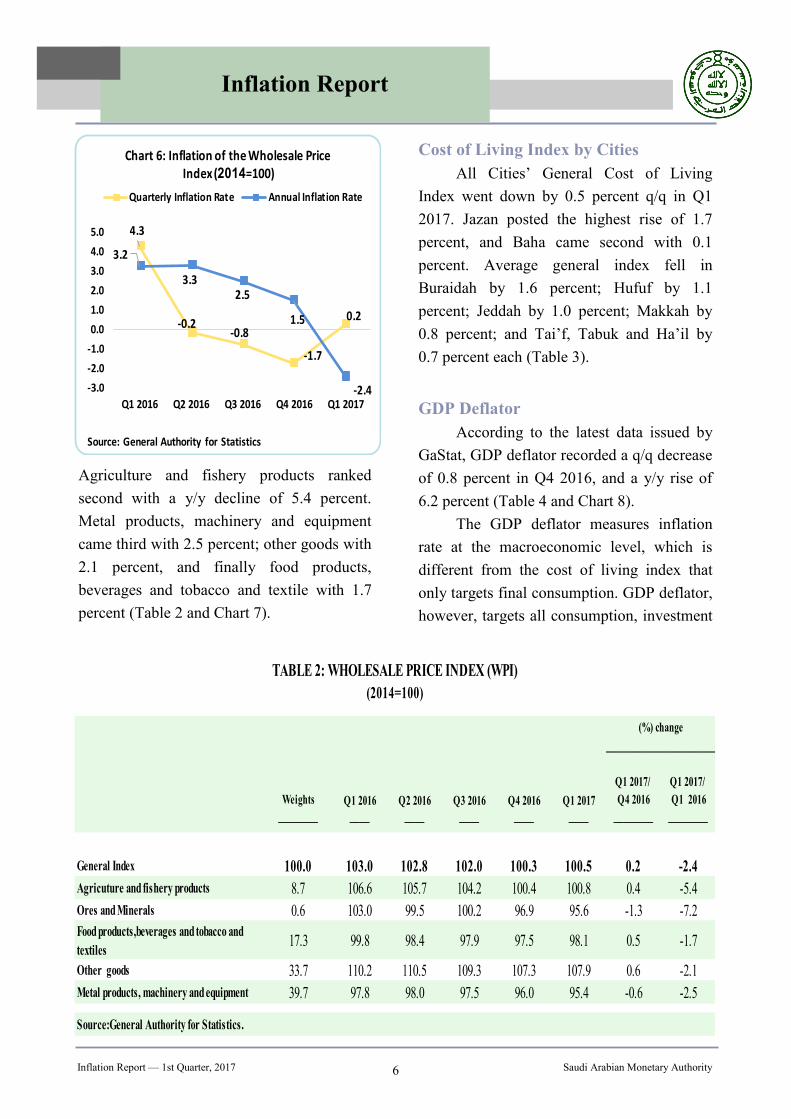
Wholesale Price Indices
The wholesale price index in Q1 2017
recorded a q/q rise of 0.2 percent and a y/y
decline of 2.4 percent (Chart 6).
Wholesale Price Indices by Sections
During Q1 2017, ores and minerals
registered the highest y/y decrease as
inflation rate declined by 7.2 percent.
-3-2-10123456789
1011
Q1 2016 Q2 2016 Q3 2016 Q4 2016 Q1 2017
(%)
Source: General Authority for Statistics
Chart 3: Quarterly Inflation Rate of the General Cost of Living Index and the Most Major Sections Affecting it
General indexHousing, water, electricity, gas & other fuelsFood & beveragesTransportMiscellaneous goods & services
Food & beverages, 9.4
Tobacco, 1.3
Clothing & footwear, 1.6
Housing, water, electricity, gas &
other fuels, 40.5
Furnishings, household
equipment & maintenance, 1.5
Health, 3.5
Transport, 38.7
Communication, 0.6
Recreation & culture
0.0
Education, 0.0
Restaurants …
Miscellaneous goods & services,
0.1
Chart 4: Percentage Impact Of Major Sections On The
General Inflation Rate (Q 201 ) (%)
Food & beverages
, 46.4
Tobacco, 0.0Clothing &
footwear, 7.3
Housing, water, electricity, gas
& other fuels, 1.6
Furnishings, household
equipment & maintenance,
5.8
Health, 0.6
Transport, 9.2
Communication, 12.8Recreation &
culture, 5.2
Education, 0.0
Restaurants & hotels, 6.9
Miscellaneous goods &
services, 4.2
Chart 5: Percentage Impact Of Major Sections On The General
Inflation Rate (Q 201 ) (%)
Saudi Arabian Monetary Authority Inflation Report — 1st Quarter, 2017 6
Inflation Report
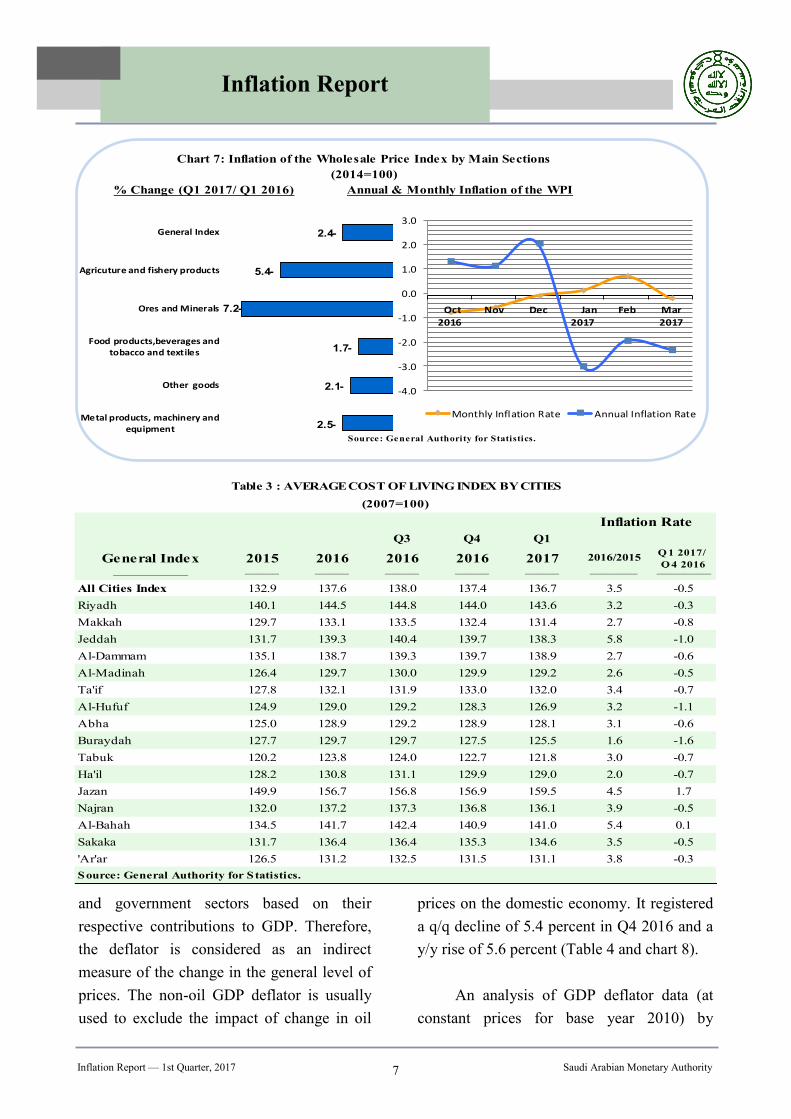
Agriculture and fishery products ranked
second with a y/y decline of 5.4 percent.
Metal products, machinery and equipment
came third with 2.5 percent; other goods with
2.1 percent, and finally food products,
beverages and tobacco and textile with 1.7
percent (Table 2 and Chart 7).
Cost of Living Index by Cities
All Cities’ General Cost of Living
Index went down by 0.5 percent q/q in Q1
2017. Jazan posted the highest rise of 1.7
percent, and Baha came second with 0.1
percent. Average general index fell in
Buraidah by 1.6 percent; Hufuf by 1.1
percent; Jeddah by 1.0 percent; Makkah by
0.8 percent; and Tai’f, Tabuk and Ha’il by
0.7 percent each (Table 3).
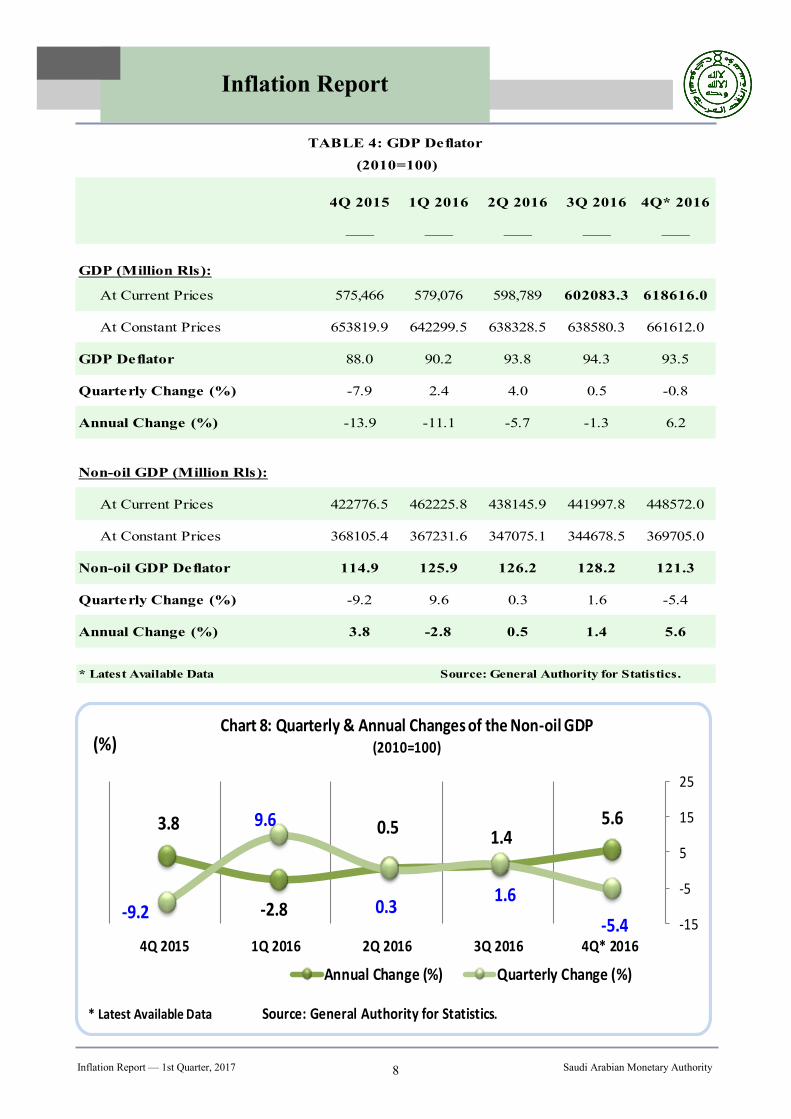
GDP Deflator
According to the latest data issued by
GaStat, GDP deflator recorded a q/q decrease
of 0.8 percent in Q4 2016, and a y/y rise of
6.2 percent (Table 4 and Chart 8).
The GDP deflator measures inflation
rate at the macroeconomic level, which is
different from the cost of living index that
only targets final consumption. GDP deflator,
however, targets all consumption, investment
4.3
-0.2-0.8
-1.7
0.2
3.2
3.32.5
1.5
-2.4-3.0
-2.0
-1.0
0.0
1.0
2.0
3.0
4.0
5.0
Q1 2016 Q2 2016 Q3 2016 Q4 2016 Q1 2017
Chart 6: Inflation of the Wholesale Price Index ( =100)
Quarterly Inflation Rate Annual Inflation Rate
Source: General Authority for Statistics
Q1 2017/
Q1 2016
Q1 2017/
Q4 2016Q1 2017Q4 2016Q3 2016Q2 2016Q1 2016Weights
——————————————————————
-2.40.2100.5100.3102.0102.8103.0100.0General Index
-5.40.4100.8100.4104.2105.7106.68.7Agricuture and fishery products
-7.2-1.395.696.9100.299.5103.00.6Ores and Minerals
-1.70.598.197.597.998.499.817.3Food products,beverages and tobacco and
textiles
-2.10.6107.9107.3109.3110.5110.233.7Other goods
-2.5-0.695.496.097.598.097.839.7Metal products, machinery and equipment
TABLE 2: WHOLESALE PRICE INDEX (WPI)
(2014=100)
(%) change
————————————
Source:General Authority for Statistics.
Saudi Arabian Monetary Authority Inflation Report — 1st Quarter, 2017 7
Inflation Report
and government sectors based on their
respective contributions to GDP. Therefore,
the deflator is considered as an indirect
measure of the change in the general level of
prices. The non-oil GDP deflator is usually
used to exclude the impact of change in oil
prices on the domestic economy. It registered
a q/q decline of 5.4 percent in Q4 2016 and a
y/y rise of 5.6 percent (Table 4 and chart 8).
An analysis of GDP deflator data (at
constant prices for base year 2010) by
Annual & Monthly Inflation of the WPI% Change (Q1 2017/ Q1 2016)
Source: General Authority for Statistics.
Chart 7: Inflation of the Wholesale Price Index by Main Sections
(2014=100)
General Index
Agricuture and fishery products
Ores and Minerals
Food products,beverages andtobacco and textiles
Other goods
Metal products, machinery andequipment
-4.0
-3.0
-2.0
-1.0
0.0
1.0
2.0
3.0
Oct
2016
Nov Dec Jan
2017
Feb Mar
2017
Monthly Inflation Rate Annual Inflation Rate
————
Q1Q4Q3
Q 1 2017/
Q 4 20162016/201520172016201620162015General Index
———————–——–——–——–——–——–—————–
-0.53.5136.7137.4138.0137.6132.9All Cities Index
-0.33.2143.6144.0144.8144.5140.1Riyadh
-0.82.7131.4132.4133.5133.1129.7Makkah
-1.05.8138.3139.7140.4139.3131.7Jeddah
-0.62.7138.9139.7139.3138.7135.1Al-Dammam
-0.52.6129.2129.9130.0129.7126.4Al-Madinah
-0.73.4132.0133.0131.9132.1127.8Ta'if
-1.13.2126.9128.3129.2129.0124.9Al-Hufuf
-0.63.1128.1128.9129.2128.9125.0Abha
-1.61.6125.5127.5129.7129.7127.7Buraydah
-0.73.0121.8122.7124.0123.8120.2Tabuk
-0.72.0129.0129.9131.1130.8128.2Ha'il
1.74.5159.5156.9156.8156.7149.9Jazan
-0.53.9136.1136.8137.3137.2132.0Najran
0.15.4141.0140.9142.4141.7134.5Al-Bahah
-0.53.5134.6135.3136.4136.4131.7Sakaka
-0.33.8131.1131.5132.5131.2126.5'Ar'ar
Table 3 : AVERAGE COST OF LIVING INDEX BY CITIES
(2007=100)
Inflation Rate
Source: General Authority for Statistics.
Saudi Arabian Monetary Authority Inflation Report — 1st Quarter, 2017 8
Inflation Report
4Q* 20163Q 20162Q 20161Q 20164Q 2015
——————————
GDP (Million Rls):
618616.0602083.3598,789579,076575,466 At Current Prices
661612.0638580.3638328.5642299.5653819.9 At Constant Prices
93.594.393.890.288.0GDP Deflator
-0.80.54.02.4-7.9Quarterly Change (%)
6.2-1.3-5.7-11.1-13.9Annual Change (%)
Non-oil GDP (Million Rls):
448572.0441997.8438145.9462225.8422776.5 At Current Prices
369705.0344678.5347075.1367231.6368105.4 At Constant Prices
121.3128.2126.2125.9114.9Non-oil GDP Deflator
-5.41.60.39.6-9.2Quarterly Change (%)
5.61.40.5-2.83.8Annual Change (%)
* Latest Available Data Source: General Authority for Statistics.
TABLE 4: GDP Deflator
(2010=100)
5.61.4
0.5
-2.8
3.8
-5.4
1.60.3
9.6
-9.2-15
-5
5
15
25
4Q* 20163Q 20162Q 20161Q 20164Q 2015
(%)
* Latest Available Data Source: General Authority for Statistics
Chart 8: Quarterly & Annual Changes of the Non-oil GDP(2010=100)
Annual Change (%) Quarterly Change (%)
Saudi Arabian Monetary Authority Inflation Report — 1st Quarter, 2017 9
Inflation Report
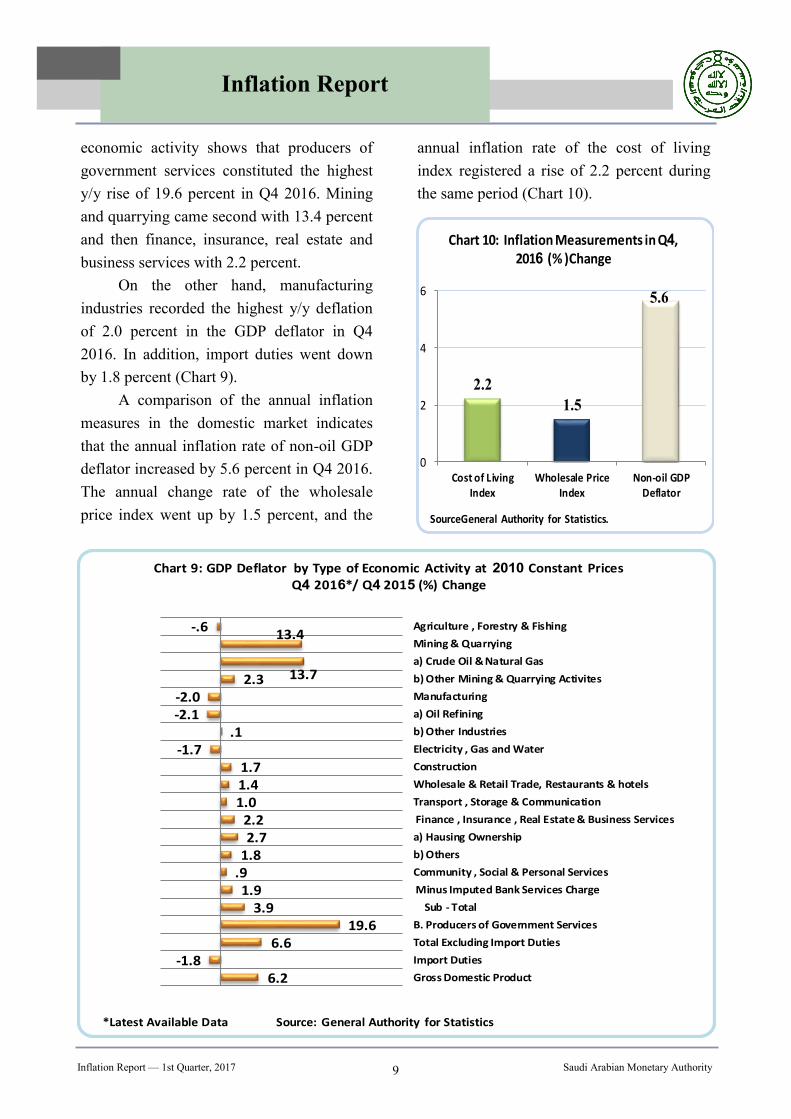
economic activity shows that producers of
government services constituted the highest
y/y rise of 19.6 percent in Q4 2016. Mining
and quarrying came second with 13.4 percent
and then finance, insurance, real estate and
business services with 2.2 percent.
On the other hand, manufacturing
industries recorded the highest y/y deflation
of 2.0 percent in the GDP deflator in Q4
2016. In addition, import duties went down
by 1.8 percent (Chart 9).
A comparison of the annual inflation
measures in the domestic market indicates
that the annual inflation rate of non-oil GDP
deflator increased by 5.6 percent in Q4 2016.
The annual change rate of the wholesale
price index went up by 1.5 percent, and the
-.613.4
13.72.3-2.0-2.1
.1-1.7
1.71.41.0
2.22.7
1.8.91.9
3.919.6
6.6-1.8
6.2
Agriculture , Forestry & Fishing
Mining & Quarrying
a) Crude Oil & Natural Gas
b) Other Mining & Quarrying Activites
Manufacturing
a) Oil Refining
b) Other Industries
Electricity , Gas and Water
Construction
Wholesale & Retail Trade, Restaurants & hotels
Transport , Storage & Communication
Finance , Insurance , Real Estate & Business Services
a) Hausing Ownership
b) Others
Community , Social & Personal Services
Minus Imputed Bank Services Charge
Sub - Total
B. Producers of Government Services
Total Excluding Import Duties
Import Duties
Gross Domestic Product
*Latest Available Data Source: General Authority for Statistics
Chart 9: GDP Deflator by Type of Economic Activity at Constant PricesQ 201 */ Q 201 (%) Change
2.2
1.5
5.6
0
2
4
6
Cost of LivingIndex
Wholesale PriceIndex
Non-oil GDPDeflator
SourceGeneral Authority for Statistics
Chart 10: Inflation Measurements in Q ,201 (% )Change
annual inflation rate of the cost of living
index registered a rise of 2.2 percent during
the same period (Chart 10).
Saudi Arabian Monetary Authority Inflation Report — 1st Quarter, 2017 10
Inflation Report
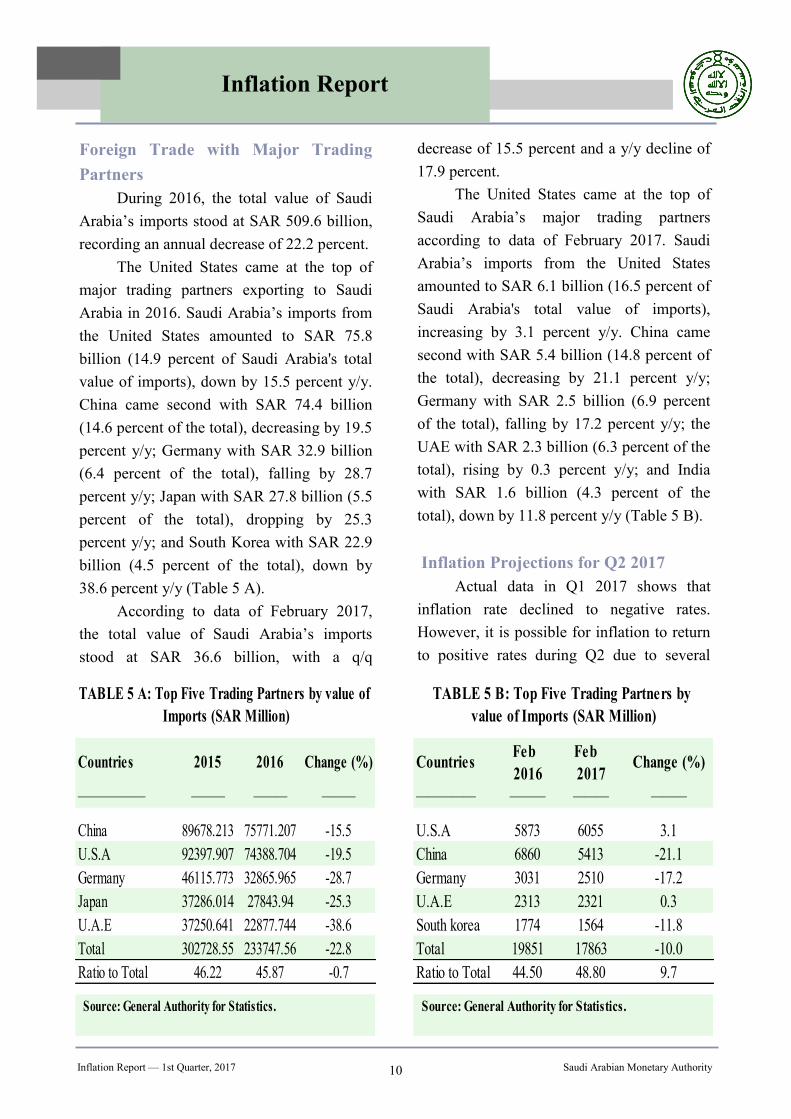
Foreign Trade with Major Trading
Partners
During 2016, the total value of Saudi
Arabia’s imports stood at SAR 509.6 billion,
recording an annual decrease of 22.2 percent.
The United States came at the top of
major trading partners exporting to Saudi
Arabia in 2016. Saudi Arabia’s imports from
the United States amounted to SAR 75.8
billion (14.9 percent of Saudi Arabia's total
value of imports), down by 15.5 percent y/y.
China came second with SAR 74.4 billion
(14.6 percent of the total), decreasing by 19.5
percent y/y; Germany with SAR 32.9 billion
(6.4 percent of the total), falling by 28.7
percent y/y; Japan with SAR 27.8 billion (5.5
percent of the total), dropping by 25.3
percent y/y; and South Korea with SAR 22.9
billion (4.5 percent of the total), down by
38.6 percent y/y (Table 5 A).
According to data of February 2017,
the total value of Saudi Arabia’s imports
stood at SAR 36.6 billion, with a q/q
decrease of 15.5 percent and a y/y decline of
17.9 percent.
The United States came at the top of
Saudi Arabia’s major trading partners
according to data of February 2017. Saudi
Arabia’s imports from the United States
amounted to SAR 6.1 billion (16.5 percent of
Saudi Arabia's total value of imports),
increasing by 3.1 percent y/y. China came
second with SAR 5.4 billion (14.8 percent of
the total), decreasing by 21.1 percent y/y;
Germany with SAR 2.5 billion (6.9 percent
of the total), falling by 17.2 percent y/y; the
UAE with SAR 2.3 billion (6.3 percent of the
total), rising by 0.3 percent y/y; and India
with SAR 1.6 billion (4.3 percent of the
total), down by 11.8 percent y/y (Table 5 B).
Inflation Projections for Q2 2017
Actual data in Q1 2017 shows that
inflation rate declined to negative rates.
However, it is possible for inflation to return
to positive rates during Q2 due to several
Change (%)20162015Countries
———————————————
-15.575771.20789678.213China
-19.574388.70492397.907U.S.A
-28.732865.96546115.773Germany
-25.327843.9437286.014Japan
-38.622877.74437250.641U.A.E
-22.8233747.56302728.55Total
-0.745.8746.22Ratio to Total
TABLE 5 A: Top Five Trading Partners by value of
Imports (SAR Million)
Source: General Authority for Statistics.
Change (%)Feb
2017
Feb
2016Countries
——————————————
3.160555873U.S.A
-21.154136860China
-17.225103031Germany
0.323212313U.A.E
-11.815641774South korea
-10.01786319851Total
9.748.8044.50Ratio to Total
Source: General Authority for Statistics.
TABLE 5 B: Top Five Trading Partners by
value of Imports (SAR Million)
Saudi Arabian Monetary Authority Inflation Report — 1st Quarter, 2017 11
Inflation Report
factors, the most important of which is
restoring allowances and other financial perks
for state employees, which will boost
confidence and support the purchasing power
of customers. In addition, Ramadan, summer
vacation and Eid al-Fitr are close.
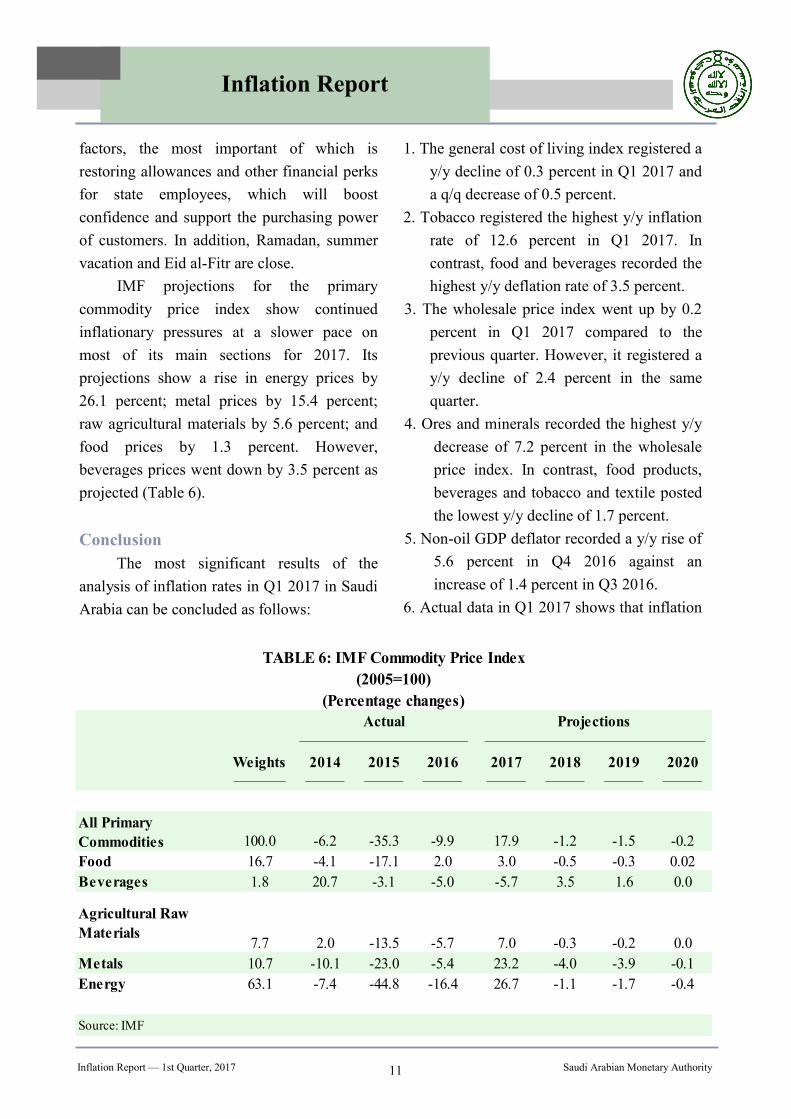
IMF projections for the primary
commodity price index show continued
inflationary pressures at a slower pace on
most of its main sections for 2017. Its
projections show a rise in energy prices by
26.1 percent; metal prices by 15.4 percent;
raw agricultural materials by 5.6 percent; and
food prices by 1.3 percent. However,
beverages prices went down by 3.5 percent as
projected (Table 6).
Conclusion
The most significant results of the
analysis of inflation rates in Q1 2017 in Saudi
Arabia can be concluded as follows:
1. The general cost of living index registered a
y/y decline of 0.3 percent in Q1 2017 and
a q/q decrease of 0.5 percent.
2. Tobacco registered the highest y/y inflation
rate of 12.6 percent in Q1 2017. In
contrast, food and beverages recorded the
highest y/y deflation rate of 3.5 percent.
3. The wholesale price index went up by 0.2
percent in Q1 2017 compared to the
previous quarter. However, it registered a
y/y decline of 2.4 percent in the same
quarter.
4. Ores and minerals recorded the highest y/y
decrease of 7.2 percent in the wholesale
price index. In contrast, food products,
beverages and tobacco and textile posted
the lowest y/y decline of 1.7 percent.
5. Non-oil GDP deflator recorded a y/y rise of
5.6 percent in Q4 2016 against an
increase of 1.4 percent in Q3 2016.
6. Actual data in Q1 2017 shows that inflation
2020201920182017201620152014Weights
—————————————————————————
-0.2-1.5-1.217.9-9.9-35.3-6.2100.0
All Primary
Commodities
0.02-0.3-0.53.02.0-17.1-4.116.7Food
0.01.63.5-5.7-5.0-3.120.71.8Beverages
0.0-0.2-0.37.0-5.7-13.52.07.7
Agricultural Raw
Materials
-0.1-3.9-4.023.2-5.4-23.0-10.110.7Metals
-0.4-1.7-1.126.7-16.4-44.8-7.463.1Energy
TABLE 6: IMF Commodity Price Index
Source: IMF
(2005=100)
(Percentage changes)
Projections
—————————————————
————————
Actual
—————————————
————————————
Saudi Arabian Monetary Authority Inflation Report — 1st Quarter, 2017 12
Inflation Report
rate declined to negative rates. However,
it is possible for inflation to return to
positive rates during Q2 due to several
factors, the most important of which is
restoring allowances and other financial
perks for state employees, which will
boost confidence and support the
purchasing power of customers. In
addition, Ramadan, summer vacation and
Eid al-Fitr are close.