Embed Size (px)
Citation preview
INDUSTRY STUDIES ASSOCATION WORKING PAPER SERIES
The Effect of Project Labor Agreements on the Cost of School Construction
By Dale Belman
Sloan Foundation Trucking Industry Program School of Labor and Industrial Relations
Michigan State University East Lansing, MI 48823
Russell Ormiston
Michigan State University East Lansing, MI 48823
William Schriver
University of Tennessee, Knoxville Knoxville, TN 37996
Richard Kelso
University of Tennessee, Knoxville Knoxville, TN 37996
2005 Industry Studies Association
Working Papers
WP-2005-01 http://isapapers.pitt.edu/
The Effect of Project Labor Agreements on
the Cost of School Construction
Dale Belman Michigan State University
Russell Ormiston,
Michigan State University
William Schriver, University of Tennessee Knoxville,
Richard Kelso
University of Tennessee, Knoxville
Correspondence may be sent to Professor Dale Belman, School of Labor and Industrial Relations, Michigan State University, East Lansing, MI, 48823 or to [email protected]
Abstract
This paper investigates the impact of project labor agreements on school construction cost in New England. In contrast
to prior research, which applied very leanly specified cost models to secondary data, this study explores more
sophisticated models using a rich data set on school characteristics collected by the authors to control for the increased
complexity inherent in PLA-built schools. The results indicate that while simple models exhibit large positive PLA
effects, such effects are lacking in more complete models. We suggest that the PLA coefficients in simple models are
capturing the increased complexity, and cost, of school projects built under PLAs.
Introduction
Construction-industry project labor agreements (PLAs) are collectively-bargained pre-hire labor contracts negotiated
between property owners and building trades unions. The essential features of PLAs are the requirement that
provisions for union referral or hiring halls, union security, and collectively-bargained compensation are adhered to by
successful bidders, even those who operate non-union. In exchange, unions typically agree to harmonize work
scheduling provisions among the trades, forego certain types of premium pay or pay increases, and give up the right to
strike for the duration of the project. Once negotiated, adherence to the PLA becomes a requirement of the bidding
process.
Over the last 20 years, building trades unions have increasingly made use of PLAs to protect and expand their
position in construction markets. This has engendered a vigorous response from open-shop contractors, particularly the
Associated Builders and Contractors (ABC), the trade organization of the open-shop. The ABC has initiated legal and
political challenges to many of the PLAs proposed for large, publicly-funded construction projects such as the Boston
Harbor project and work on the New York State Throughway. The debate over the effects of PLAs has been fought
over such issues as project timeliness, quality, safety, training, minority employment, employee benefits and labor
peace. The central dispute in this struggle has, however, been over the effect of PLAs on the cost of public
construction.
To help address this question, the current research investigates the effect of PLAs on the cost of new school
construction in New England between 1996 and 2002. Building on prior research, our work uses unique data on new
school construction collected by the authors to develop a comprehensive model of school construction costs and
estimate the impact of PLAs on school cost. Our results indicate that, although simple models suggest that PLAs
increase school construction costs, more fully-specified models that better account for project characteristics do not find
a meaningful relationship between the PLAs and construction costs. Our research also indicates that schools built under
PLAs are often more complex projects than those built without PLAs and that, absent appropriate controls for the nature
of the construction, the increased costs associated with complexity are erroneously attributed to PLAs.
Background and Research on PLAs
Although a nascent version of a PLA was negotiated between the War Department and the Building Trades Department
of the AFL in 1917, widespread use of PLAs began during World War II:
Modern project agreements have their roots in construction developments in World War II, and they emerged in the post-war era at atomic energy and space and missile sites. The defense program, begun in earnest following the fall of France in 1940, required a large increase in construction activity...
In this setting, the Office of Production Management, predecessor to the War Production Board, entered into a ‘stabilization agreement’ adopted on July 22, 1941 on behalf of such contracting agencies as the Army and Navy Departments, with the Building and Construction Trades Department, AFL. The agreement provided for uniform overtime rates of time-and-one-half for work beyond eight hours per day, on weekends and on holidays. It also provided for uniform shifts at regular rates. It declared, ‘that there shall be no stoppage of work on account of jurisdictional disputes, or for any other cause.’ (Dunlop, 2002, p. 1)
PLAs remained uncontroversial until the 1970s. Project owners and contractors operating in the densely
organized industrial and heavy construction sector viewed PLAs as a means of avoiding contract and jurisdictional
strikes and of obtaining better terms than may have been available through local collective agreements. This changed
with the increasing capacity of the open-shop sector in the 1970s and 1980s (Allen, 1988 & 1994; Linder, 1999), as
non-union contractors became capable of competing for all types of construction work and viewed PLA requirements
for hiring halls and union wages as an impediment to their competing for this work. Working through the ABC, the
open-shop sector has regularly mounted legal, political and media challenges to public sector PLAs. The 1993 Boston
Harbor decision of the U.S. Supreme Court (Building & Construction Trades Council of the Metropolitan District v.
Associated Builders & Contractors of Massachusetts/Rhode Island, Inc. (507 US 218, 142 LRRM 2649, US Supreme
Court, March 8, 1993)) - that public bodies could sign PLAs in their role as construction owners - encouraged use of
PLAs on public projects and led to further advocacy by building trades unions and challenges by the ABC and its
affiliates.
The controversy surrounding PLAs, at its core a disagreement over whether public PLAs are advantageous to
taxpayers, has motivated research on the effect of PLAs on project timeliness, quality, safety, training, minority
employment, employee benefits, and labor peace competitiveness. The majority of this research has, however, been
concerned with project costs (see Belman, Bodah and Philips, forthcoming). The Effects of Project Labor Agreements
on Publicly Funded Construction Projects in Massachusetts (Haughton, Chisholm and Bachman; March, 2003) and
Project Labor Agreements and the Cost of School Construction in Massachusetts (Bachman, Chisholm, Haughton, and
Tuerck; September, 2003), hereafter referred to as Haughton et. al. I and Haughton et. al. II., respectively, provide the
most sophisticated analyses to date of the cost impacts of PLAs. Using data on new school construction and
renovations of existing schools in the Greater Boston area, the authors estimate that PLAs increase the costs of school
construction between $18.83 to $31.74 per square foot or by 14.0 to 17.3 percent.
Data
The collection of detailed data on the characteristics of school construction was central to this study. The current
research extends prior work by measuring the cost impact of PLAs within a more complete model of school
construction costs and by enlarging the area under study from Greater Boston to all of Massachusetts and later including
Connecticut and Rhode Island. In developing a more complete model of school construction costs, we explore the
claim that little is to be gained from more extensive control for the characteristics of construction (Haughton et. al. II,
page 8). If correct, estimates of the effect of PLAs on school construction costs will not be sensitive to additional
controls for the characteristics of construction.
Prior to undertaking the survey, we engaged in discussions with architects and contractors experienced with
school construction to identify space-use types and features that they believed affected construction costs. The basic
unit of a school is the classroom, which occupies the majority of school space and accounts for the bulk of school costs.
Factors that affect the cost of classrooms have a large bearing on schools’ costs. The educational level of the school is
also an important determinant of cost; high schools cost more than elementary and middle schools because their
classrooms are more elaborate. High schools typically include more expensive amenities such as science and computer
laboratories as well as more elaborate library facilities and auditoriums.
Classrooms are not the only determinant of construction costs. The presence and characteristics of other types
of spaces, including offices, libraries, cooking and dining areas and athletic facilities, affect cost. Gymnasiums and
auditoriums are more costly than classrooms, and exterior appurtenances such as playing fields certainly add to a
project’s bottom line. Site preparation, such as demolition work and the abatement of asbestos and lead, also increases
project costs, as does extensive grading and foundation work. In addition, mechanical systems typically comprise about
15-20 percent of project costs, and some system types, such as boilers for heating and water-fed coolers for air
conditioning, are more expensive than others. The number of floors in a building has an impact on cost, as does the
quality of the construction materials selected. Cost may also be affected by contractual arrangements, such as whether
the contractor for the project won through a low bid, through a negotiated contract or through a design/build
arrangement.
Although these do not represent an exhaustive list of school cost determinants, building a realistic model of
school costs requires the accumulation of data on such characteristics. Historically, the F. W. Dodge Construction
Reports have been the primary source of data for research in the construction industry, including school construction, as
they provide a comprehensive list of construction projects of interest. Virtually every large building project is covered
by Dodge, with several reports issued during the course of a construction project; all provide the project name, location,
type, size, owner, architect and, after the contract award, the general contractor and owner. Depending on when a report
is issued, successive Dodge reports on a project will also provide an architect’s estimate of project costs, the low bid on
the project or the final offered cost. Some features, such as number of stories and construction materials may be
included, but these listings may be incomplete and inconsistent between reports.
Rather than rely on the detail provided in the Dodge reports, we used Dodge information solely to identify new
school construction projects and parties who would have detailed information on those projects. We then contacted
architects, contractors and school officials involved in each project and, using a consistent list of potential school
characteristics, surveyed these parties about project features including the final cost, type of school (elementary, middle,
high, other), type of contract, number of stories, roof pitch, particulars of each project (library, science labs, athletic
fields, etc.), site grading, type of mechanical system(s) installed, materials used, bidding process and whether there was
a liquidated damage clause in the school construction contract. The survey instrument closely followed the list of
characteristics found in Table 1.
The projects surveyed were completed projects from the Dodge list of 2001-2002 starts and earlier projects
included in Haughton et. al. I. The survey was limited to new construction and projects that involved both new
construction and renovation where the cost of renovations could be separated from the cost of new construction.
Renovation projects were excluded as they are inherently heterogeneous; renovation projects vary from repainting or re-
roofing to the installation of completely new interiors and systems. Key data, particularly the physical area of the
renovation, are difficult to define much less measure. Surveying respondents between March and October 2003, we
obtained information on 70 of the 75 new schools in Massachusetts for which construction was completed by fall 2003
as well as on the 22 new schools built in Rhode Island and Connecticut during the period under study.1 Information
regarding the presence of project labor agreements was obtained from state Building Trades Councils and construction
employer organizations.
Characteristics of PLA and non-PLA Schools
Our final data consisted of 92 schools, of which 70 were located in Massachusetts. We emphasize the Massachusetts
schools in this study as these schools were built under the same legal and administrative standards as those studied by
Haughton et. al. Of the 70 Massachusetts schools included in our data, nine, or 12.9 percent, were built under a PLA
(Table 1), with marked differences between schools built with PLAs and those built without PLAs. PLA schools tend
to be larger on average – 172,000 square feet against 118,000 square feet for non-PLA schools. PLA schools also tend
to be taller, with PLA schools averaging 3.3 stories against 2.6 stories for non-PLA schools, and are more likely to be
vocational schools than non-PLA schools, 33.3 percent against 14.8 percent. Every project completed under a PLA
involved demolition work compared to half of those built without a PLA; similarly, all nine schools built under a PLA
installed chillers compared against 45.9 percent of the balance of new schools. Only public schools were built under
PLAs, as the three private schools in our data were built without PLAs. PLA schools also had higher total final costs,
$26.8 million against $17.4 million, and cost per square foot, $164.91 against $147.86. Given the differences between
PLA and non-PLA projects, sorting out the effect of differences in school characteristics between PLA and non-PLA
projects from pure PLA cost effects is central to understanding the cost impact of PLAs.
Estimation Strategy and Results
As the purpose of this paper is not simply to provide new estimates of PLA effects but rather to investigate the impacts
of different measures of costs and controls for construction characteristics on those estimates, we present and discuss
several sets of estimates. We are particularly interested in comparing estimates of PLA effects obtained from leanly-
specified models, similar to those used in prior research, with more fully-specified models. We are also interested in
comparing models using final cost collected in our survey with the more available F.W. Dodge price data as well as
with estimates obtained by prior researchers. We begin with estimates for Massachusetts schools using final cost as this
is the central public policy concern. Here we start with a simple model similar to that used by Haughton et. al. and
progress to more complete models.
We next present Dodge price models and compare these to the final cost models. The third section returns to
the final cost models but includes the twenty-two new schools from Rhode Island and Connecticut in the sample. The
fourth section explores the sensitivity of the estimates of PLA effects to idiosyncratic projects and sample selection. We
conclude with a comparison between our estimates and those from prior research.
Final Cost Models
Our data include two measures of cost: the prices reported by F. W. Dodge and the final costs collected in our survey.
Although Dodge data have the advantage of being less burdensome to obtain than survey data, they are not always
accurate and may be inconsistent between reports. The audience for Dodge data are contractors and suppliers who use
the reports to locate construction projects and determine whether to obtain plan information needed to develop a bid.
Timeliness, rather than accuracy, is the overriding concern of these consumers. A million dollar error on the architect’s
cost estimate may be less important than delays in publishing the report. Further, the prices reported by Dodge change
between reports. Initial reports contain architects’ estimates of costs while later reports contain low bids and still later
reports contain the accepted price (which may be above or below the low bid). There is no assurance that the price in a
Dodge report is the low bid much less the actual cost paid for the project.
Dodge price is only a proxy of the public’s primary concern, namely the final cost paid for a project. Costs can
change considerably after a bid is accepted but before the project begins and can change again in the course of the
project. Although changes may result from unforseen alterations in the construction plans, contractors may
intentionally bid low when plans contain errors or are incomplete, as these provide opportunities to increase prices when
bidding is no longer possible. Final cost may then deviate substantially from the Dodge price. Although Dodge bid
prices are more readily available than final costs, it is the effect of PLAs on final costs, the cost the public pays, that is
our true concern.2
We estimate two types of final cost models: the first takes final cost per square foot as the dependent variable,
the second the log of final cost. Cost per square foot is a common rule of thumb measure in construction, prior research
has used this as the dependent variable for their cost models. However, cost per square foot models impose a structure
in which all construction costs are proportional to project size. Although appropriate for some characteristics, such as
roofing or painting, others such as athletic fields, swimming pools, and demolition are often not proportional to project
size. An alternative specification of the dependent variable that does not impose this type of proportionality is the log of
total cost. Here coefficients estimate the percent increase in total cost associated with a feature. Rather than choosing
between these two specifications, we present both, beginning with cost per square foot models. All estimates allow for
random error components by school district where there is more than one project in a district and for heterogeneity in
the error term with the Huber-White correction. School costs are deflated using the ENR construction cost index for
Boston.
Cost per square foot models Our initial specification is similar to that favored by Haughton et. al. II with cost per
square foot determined by area in square feet, area squared and an indicator variable which takes a value of one when a
school is built under a PLA (Table 2, Model 1).3 Project size has a negative convex relationship to cost per square foot
that is significant in better than a five-percent test. Larger projects cost less per square foot but the decline in cost per
square foot attenuates as project size increases. PLAs are estimated to have a large positive effect on school costs,
increasing costs by $28.57 per square foot; the null of no PLA effect is rejected in better than a five-percent, one-tailed
test. This leanly-specified model explains almost 20 percent of the variation in school costs.
Model 2 adds variables to control for the cost effects of elementary and private schools. Consistent with the
views of architects and contractors, elementary schools are estimated to reduce construction costs by $27.02 per square
foot, the coefficient is significant in any conventional test. Although private schools are also estimated to be less
expensive than public schools, the coefficient is far from statistically significant and the hypothesis that private schools
are no less expensive to build than public schools cannot be rejected. With these variables, the model accounts for 32.3
percent of the variation in school costs. The relationship of area to school costs remains negative, convex and
statistically significant. The estimate of the impact of PLAs on school costs is higher in Model 2 than Model 1, the
coefficient increases to $32.31 and almost achieves one-percent significance.
We use two F-tests, reported in the bottom two rows of Table 2, to test whether the our models are improved
by the additional variables. F-test 1 compares the current model with the immediately prior model by testing the null
hypotheses that the population coefficients on the variables added to the current model are zero. Consider F-statistic 1 in
Model 2. This statistic compares Model 2 with Model 1 by testing whether the elementary and private school
coefficients in Model 2 are zero. The null is rejected in better than a 1 percent test (F=7.09; p=.0019). In contrast, F-test
2 compares the current model’s specification with the Model 1 specification by testing whether the coefficients on the
variables other than PLA, area and area2 are zero. For Model 2 F-statistic 1 and F-statistic 2 are identical and the null of
zero coefficients on elementary and private school are easily rejected.
Model 3 adds three characteristics that our interviews suggested should affect school costs: the height of the
school, whether the school had a basement and whether construction involved demolition work. Although correctly
signed, none of these variables achieve conventional levels of statistical significance in t-tests. It is also not possible to
reject the null that the coefficient on story, basement and demolition are zero, the F statistic for test 1 is 0.87 with a
probability of 46.13 percent. However, F-statistic 2 indicates that the null that all coefficients but those on PLA, area
and area2 are zero can be rejected in almost a 1 percent test (F=3.11, p=.0156). R2 increases modestly, from 32.3
percent in Model 2 to 35.1 percent in model 3.4 With the addition of these variables, the effect of PLAs declines to
$24.10 per square foot and is only significant in a one-tailed, 10-percent test.
Models 4 and 5 further control for school characteristics. Model 4 adds a control for construction in the
Boston school district; three of the nine PLA schools in Massachusetts were in this district. Urban construction is
typically more expensive than suburban or rural areas because of the difficulties of working in urban areas and
differences in construction requirements. Discussions with Peabody Construction, a general contractor familiar with
school construction in the Boston area, indicates that Boston schools are built to considerably higher standards than
suburban schools, incorporate features such as concrete pilings, and require 24 hour police protection. These features
add substantially to school construction costs relative to districts outside of Boston. Model 4 estimates are consistent
with this view, as the coefficient on Boston is $34.11 and is significant in a one-tailed, five-percent test. The addition of
the Boston variable modestly improves the fit of the model, r2 increases to 38.8 percent. It is possible to reject the
hypothesis that the Boston variable is zero at better than a 5 percent level (F=4.40, p=.0407). Taking Model 1 as the
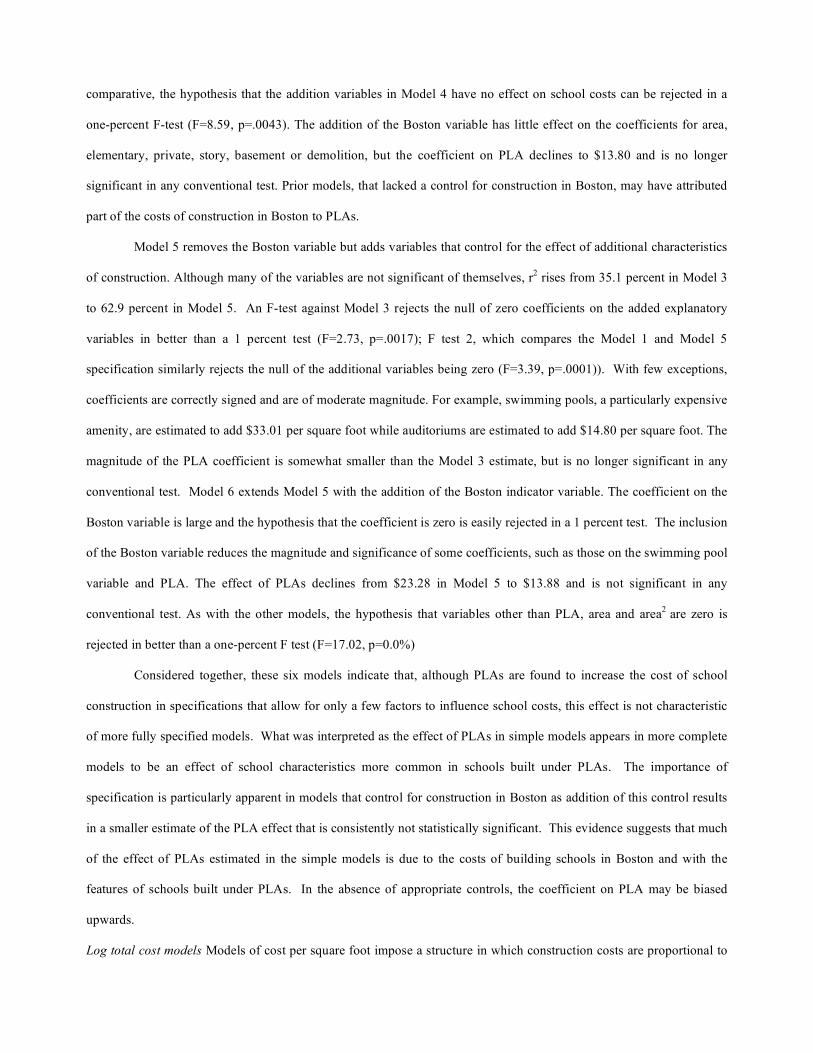
comparative, the hypothesis that the addition variables in Model 4 have no effect on school costs can be rejected in a
one-percent F-test (F=8.59, p=.0043). The addition of the Boston variable has little effect on the coefficients for area,
elementary, private, story, basement or demolition, but the coefficient on PLA declines to $13.80 and is no longer
significant in any conventional test. Prior models, that lacked a control for construction in Boston, may have attributed
part of the costs of construction in Boston to PLAs.
Model 5 removes the Boston variable but adds variables that control for the effect of additional characteristics
of construction. Although many of the variables are not significant of themselves, r2 rises from 35.1 percent in Model 3
to 62.9 percent in Model 5. An F-test against Model 3 rejects the null of zero coefficients on the added explanatory
variables in better than a 1 percent test (F=2.73, p=.0017); F test 2, which compares the Model 1 and Model 5
specification similarly rejects the null of the additional variables being zero (F=3.39, p=.0001)). With few exceptions,
coefficients are correctly signed and are of moderate magnitude. For example, swimming pools, a particularly expensive
amenity, are estimated to add $33.01 per square foot while auditoriums are estimated to add $14.80 per square foot. The
magnitude of the PLA coefficient is somewhat smaller than the Model 3 estimate, but is no longer significant in any
conventional test. Model 6 extends Model 5 with the addition of the Boston indicator variable. The coefficient on the
Boston variable is large and the hypothesis that the coefficient is zero is easily rejected in a 1 percent test. The inclusion
of the Boston variable reduces the magnitude and significance of some coefficients, such as those on the swimming pool
variable and PLA. The effect of PLAs declines from $23.28 in Model 5 to $13.88 and is not significant in any
conventional test. As with the other models, the hypothesis that variables other than PLA, area and area2 are zero is
rejected in better than a one-percent F test (F=17.02, p=0.0%)
Considered together, these six models indicate that, although PLAs are found to increase the cost of school
construction in specifications that allow for only a few factors to influence school costs, this effect is not characteristic
of more fully specified models. What was interpreted as the effect of PLAs in simple models appears in more complete
models to be an effect of school characteristics more common in schools built under PLAs. The importance of
specification is particularly apparent in models that control for construction in Boston as addition of this control results
in a smaller estimate of the PLA effect that is consistently not statistically significant. This evidence suggests that much
of the effect of PLAs estimated in the simple models is due to the costs of building schools in Boston and with the
features of schools built under PLAs. In the absence of appropriate controls, the coefficient on PLA may be biased
upwards.
Log total cost models Models of cost per square foot impose a structure in which construction costs are proportional to
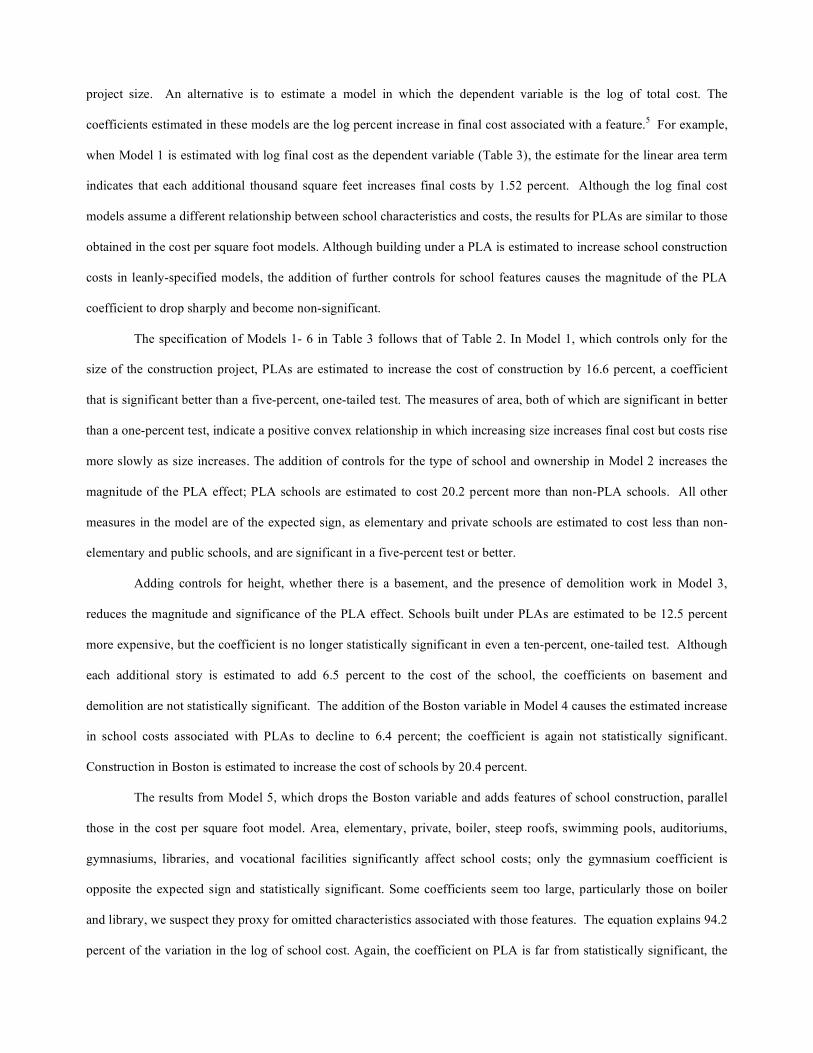
project size. An alternative is to estimate a model in which the dependent variable is the log of total cost. The
coefficients estimated in these models are the log percent increase in final cost associated with a feature.5 For example,
when Model 1 is estimated with log final cost as the dependent variable (Table 3), the estimate for the linear area term
indicates that each additional thousand square feet increases final costs by 1.52 percent. Although the log final cost
models assume a different relationship between school characteristics and costs, the results for PLAs are similar to those
obtained in the cost per square foot models. Although building under a PLA is estimated to increase school construction
costs in leanly-specified models, the addition of further controls for school features causes the magnitude of the PLA
coefficient to drop sharply and become non-significant.
The specification of Models 1- 6 in Table 3 follows that of Table 2. In Model 1, which controls only for the
size of the construction project, PLAs are estimated to increase the cost of construction by 16.6 percent, a coefficient
that is significant better than a five-percent, one-tailed test. The measures of area, both of which are significant in better
than a one-percent test, indicate a positive convex relationship in which increasing size increases final cost but costs rise
more slowly as size increases. The addition of controls for the type of school and ownership in Model 2 increases the
magnitude of the PLA effect; PLA schools are estimated to cost 20.2 percent more than non-PLA schools. All other
measures in the model are of the expected sign, as elementary and private schools are estimated to cost less than non-
elementary and public schools, and are significant in a five-percent test or better.
Adding controls for height, whether there is a basement, and the presence of demolition work in Model 3,
reduces the magnitude and significance of the PLA effect. Schools built under PLAs are estimated to be 12.5 percent
more expensive, but the coefficient is no longer statistically significant in even a ten-percent, one-tailed test. Although
each additional story is estimated to add 6.5 percent to the cost of the school, the coefficients on basement and
demolition are not statistically significant. The addition of the Boston variable in Model 4 causes the estimated increase
in school costs associated with PLAs to decline to 6.4 percent; the coefficient is again not statistically significant.
Construction in Boston is estimated to increase the cost of schools by 20.4 percent.
The results from Model 5, which drops the Boston variable and adds features of school construction, parallel
those in the cost per square foot model. Area, elementary, private, boiler, steep roofs, swimming pools, auditoriums,
gymnasiums, libraries, and vocational facilities significantly affect school costs; only the gymnasium coefficient is
opposite the expected sign and statistically significant. Some coefficients seem too large, particularly those on boiler
and library, we suspect they proxy for omitted characteristics associated with those features. The equation explains 94.2
percent of the variation in the log of school cost. Again, the coefficient on PLA is far from statistically significant, the
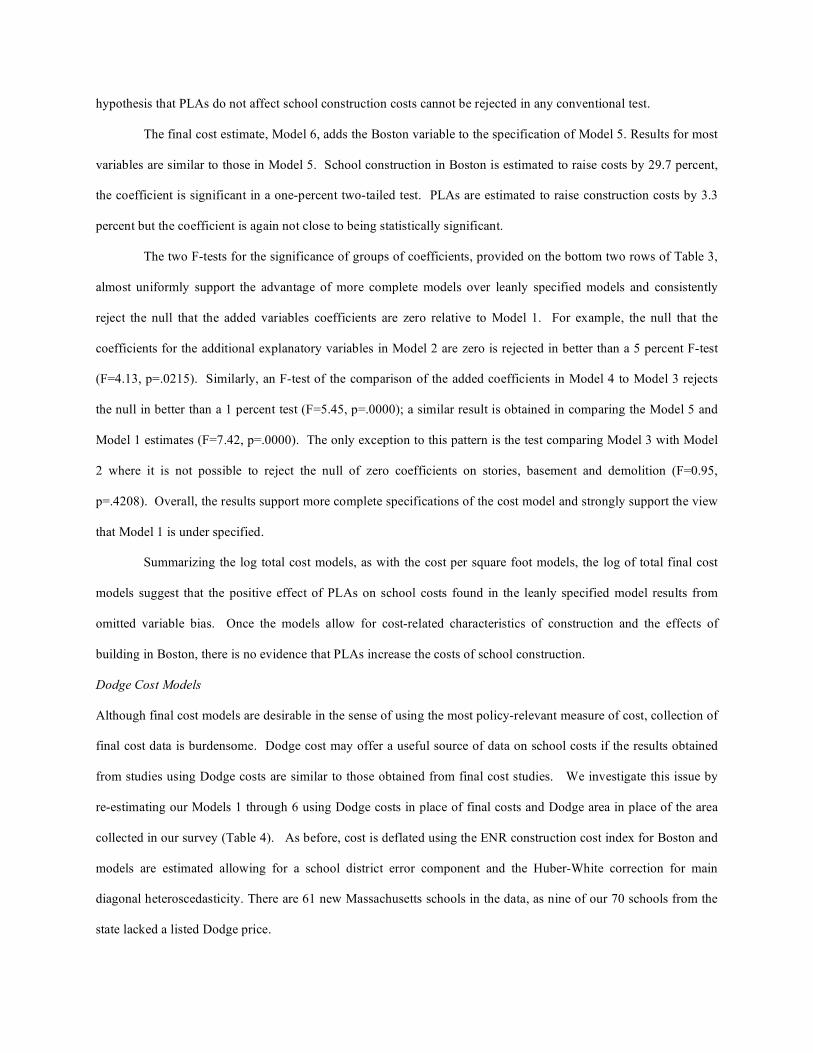
hypothesis that PLAs do not affect school construction costs cannot be rejected in any conventional test.
The final cost estimate, Model 6, adds the Boston variable to the specification of Model 5. Results for most
variables are similar to those in Model 5. School construction in Boston is estimated to raise costs by 29.7 percent,
the coefficient is significant in a one-percent two-tailed test. PLAs are estimated to raise construction costs by 3.3
percent but the coefficient is again not close to being statistically significant.
The two F-tests for the significance of groups of coefficients, provided on the bottom two rows of Table 3,
almost uniformly support the advantage of more complete models over leanly specified models and consistently
reject the null that the added variables coefficients are zero relative to Model 1. For example, the null that the
coefficients for the additional explanatory variables in Model 2 are zero is rejected in better than a 5 percent F-test
(F=4.13, p=.0215). Similarly, an F-test of the comparison of the added coefficients in Model 4 to Model 3 rejects
the null in better than a 1 percent test (F=5.45, p=.0000); a similar result is obtained in comparing the Model 5 and
Model 1 estimates (F=7.42, p=.0000). The only exception to this pattern is the test comparing Model 3 with Model
2 where it is not possible to reject the null of zero coefficients on stories, basement and demolition (F=0.95,
p=.4208). Overall, the results support more complete specifications of the cost model and strongly support the view
that Model 1 is under specified.
Summarizing the log total cost models, as with the cost per square foot models, the log of total final cost
models suggest that the positive effect of PLAs on school costs found in the leanly specified model results from
omitted variable bias. Once the models allow for cost-related characteristics of construction and the effects of
building in Boston, there is no evidence that PLAs increase the costs of school construction.
Dodge Cost Models
Although final cost models are desirable in the sense of using the most policy-relevant measure of cost, collection of
final cost data is burdensome. Dodge cost may offer a useful source of data on school costs if the results obtained
from studies using Dodge costs are similar to those obtained from final cost studies. We investigate this issue by
re-estimating our Models 1 through 6 using Dodge costs in place of final costs and Dodge area in place of the area
collected in our survey (Table 4). As before, cost is deflated using the ENR construction cost index for Boston and
models are estimated allowing for a school district error component and the Huber-White correction for main
diagonal heteroscedasticity. There are 61 new Massachusetts schools in the data, as nine of our 70 schools from the
state lacked a listed Dodge price.
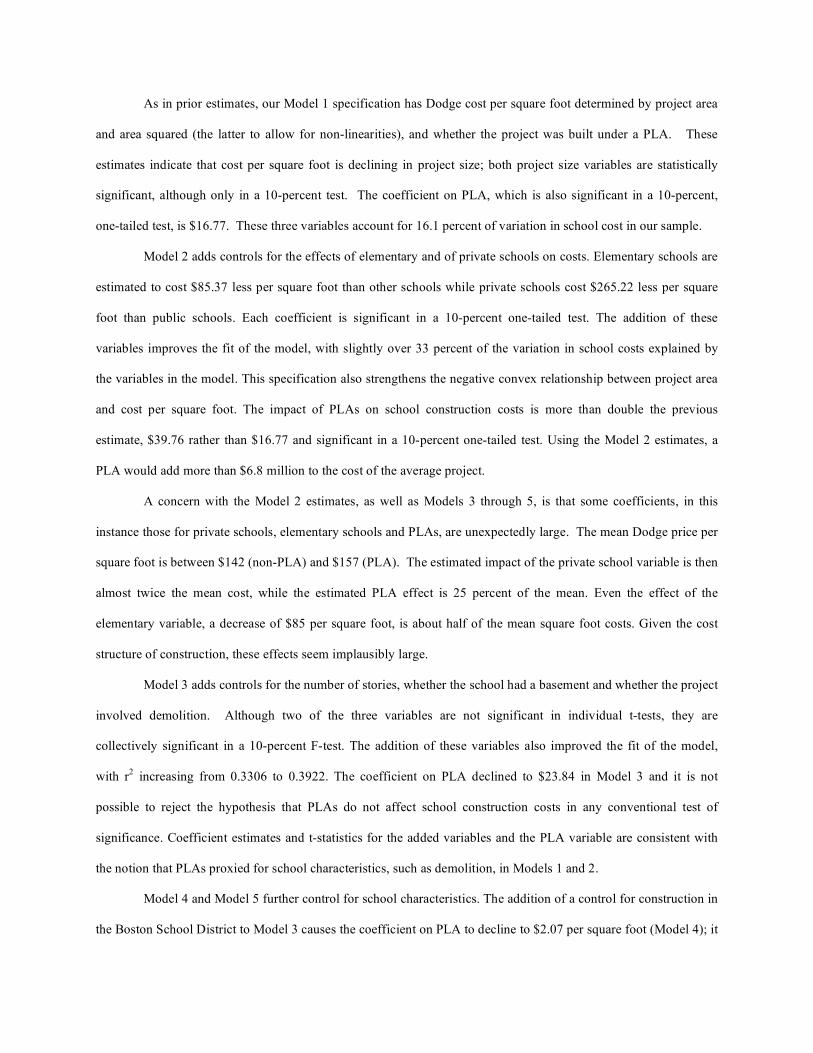
As in prior estimates, our Model 1 specification has Dodge cost per square foot determined by project area
and area squared (the latter to allow for non-linearities), and whether the project was built under a PLA. These
estimates indicate that cost per square foot is declining in project size; both project size variables are statistically
significant, although only in a 10-percent test. The coefficient on PLA, which is also significant in a 10-percent,
one-tailed test, is $16.77. These three variables account for 16.1 percent of variation in school cost in our sample.
Model 2 adds controls for the effects of elementary and of private schools on costs. Elementary schools are
estimated to cost $85.37 less per square foot than other schools while private schools cost $265.22 less per square
foot than public schools. Each coefficient is significant in a 10-percent one-tailed test. The addition of these
variables improves the fit of the model, with slightly over 33 percent of the variation in school costs explained by
the variables in the model. This specification also strengthens the negative convex relationship between project area
and cost per square foot. The impact of PLAs on school construction costs is more than double the previous
estimate, $39.76 rather than $16.77 and significant in a 10-percent one-tailed test. Using the Model 2 estimates, a
PLA would add more than $6.8 million to the cost of the average project.
A concern with the Model 2 estimates, as well as Models 3 through 5, is that some coefficients, in this
instance those for private schools, elementary schools and PLAs, are unexpectedly large. The mean Dodge price per
square foot is between $142 (non-PLA) and $157 (PLA). The estimated impact of the private school variable is then
almost twice the mean cost, while the estimated PLA effect is 25 percent of the mean. Even the effect of the
elementary variable, a decrease of $85 per square foot, is about half of the mean square foot costs. Given the cost
structure of construction, these effects seem implausibly large.
Model 3 adds controls for the number of stories, whether the school had a basement and whether the project
involved demolition. Although two of the three variables are not significant in individual t-tests, they are
collectively significant in a 10-percent F-test. The addition of these variables also improved the fit of the model,
with r2 increasing from 0.3306 to 0.3922. The coefficient on PLA declined to $23.84 in Model 3 and it is not
possible to reject the hypothesis that PLAs do not affect school construction costs in any conventional test of
significance. Coefficient estimates and t-statistics for the added variables and the PLA variable are consistent with
the notion that PLAs proxied for school characteristics, such as demolition, in Models 1 and 2.
Model 4 and Model 5 further control for school characteristics. The addition of a control for construction in
the Boston School District to Model 3 causes the coefficient on PLA to decline to $2.07 per square foot (Model 4); it
remains non-significant. In contrast, the coefficient on the Boston variable is correctly signed, and significant in a
five-percent, one-tailed test but is implausibly large. The demolition coefficient is also statistically significant in
this model, but along with the elementary and private school coefficient, is also very large.
Model 5 replaces the Boston variable with additional controls for school characteristics related to
construction costs. The model fits the data substantially better than prior models, with 72.2 percent of the variation
in cost accounted for. Although many of the coefficients on these additional controls are correctly signed and
statistically significant, some have the opposite of the expected sign and several are very large. Specifically,
estimates that suggest that schools with libraries cost an additional $602.68 per square foot and that schools with
boiler heating systems cost $490.51 more per square foot, are not reasonable. Further, the coefficient on private
school has reversed sign from Model 3 and now indicates that private schools are substantially more expensive to
build than public schools. The coefficient on PLA is $11.34 but is not significant in any conventional test.
Taken together, these five models confirm that, although PLAs are estimated to increase the cost of school
construction in simple models, this effect dissipates in more fully-specified models. What was interpreted as the
effect of PLAs in the simple model appears in the more complete models to be an effect of school characteristics
more common in schools built under PLAs. Dodge price estimates are however troubling because reasonable
specifications produce coefficients of unrealistic magnitudes and unexpected signs with some coefficients unstable
in sign and magnitude between specifications. The issues with these estimates are also evident in the coefficients for
PLA which range between $39.76 and $2.07 per square foot. These problems warn against placing too much
credence in the estimates from any of the specifications and particularly suggests that Dodge costs are not a good
substitute for final cost data for modeling school construction costs.6,7
Why do Dodge cost models produce less satisfactory estimates than final cost models? One possibility is
that the Dodge sample of 61 schools behaves differently than the final cost sample of 70 schools. We investigate
this by re-estimating the Model 3 actual cost per square foot model on the sample of 61 schools for which we have
Dodge data (Table 5). The table is arranged in three columns of results: the left-hand column shows the Dodge data
estimates from Table 4, the middle column lists the final cost estimates for the sample of 61 schools for which we
have Dodge data, and the right-hand column gives the final cost estimates with the sample of 70 schools from in
Table 2. Comparison of the coefficients across these three specifications indicates that, although moving from the
final cost sample of 70 schools to the “Dodge” sample of 61 schools results in moderate changes in estimated
coefficients, the implausibly large estimates of the effects of private schools, elementary schools, basements and
stories is mainly consequent to the use of Dodge cost and Dodge area. For example, the final cost coefficient for
elementary schools is -$25.85 per square foot in the 70 school final cost model and -$16.23 in the 61 school final
cost model, but -$85.64 in the Dodge data model. A more pronounced version of this pattern is found for the
coefficient for private schools; similar if less dramatic patterns are found for the story and basement variables. This
marked sensitivity to the sample and cost data is present in the other models in Tables 2 - 4.
The issues with Dodge data may be illustrated by comparing it to data on costs and area collected as part of
our survey (Table 6). In contrast with the Dodge data, which may mix low bid, architects’ estimates and accepted
prices, and for which timeliness may trump accuracy, our final cost data was uniformly collected after completion of
the project and verified by surveyors. As Table 6 demonstrates, just 41 percent of the Dodge price reports, or 26 of
64, were within $100,000 of the final cost collected in our survey. Twenty-six percent, 17 of the 64 schools, differed
from the final cost by one million dollars or more. The average difference between final cost and Dodge price was
$623,521. As evidenced both by the sizeable differential, and that Dodge prices are lower than final costs in 41 of
64 schools, Dodge figures appear to systematically underestimate final school costs.8 The results for size were
better, as 46 out of 66 school projects had total Dodge area within 5,000 square feet of the area collected by our
survey. Mean Dodge size was 4,680 square feet smaller than the mean size found in our survey; 21 Dodge schools
were smaller than reported to our surveyors, 7 were larger.
Although we cannot pinpoint the source of difficulties with Dodge data, it is clear that final cost models are
superior to Dodge price models for the sample sizes used in school PLA research. Although there would be a
considerable lessening of the burden of data collection if Dodge data could be substituted for final cost data, the
estimates obtained from Dodge data models are not reasonable proxies of the final cost estimates and are too often
implausible and too unstable to hold them in great faith.
Expanding the Estimates to Rhode Island and Connecticut
As a part of our survey, we also collected data on new school construction and PLAs in Rhode Island and
Connecticut, adding 22 schools, including one school built under a PLA, to our sample. We re-estimated the final
cost models adding two state variables indicating whether a school was built in Massachusetts, Rhode Island, or
Connecticut (Table 7). The Boston variable was redefined to indicate schools located in the city limits of Boston,
Hartford, or Providence. Table 7 provides only the estimates of the PLA coefficient; full estimates are available
from the authors.
The inclusion of schools from Connecticut and Rhode Island reduces the magnitude and statistical
significance of PLAs on school costs. Model 1 and 2 estimates of the effect of PLAs are positive and significant in a
five-percent one-tailed test for both cost per square foot and log cost models but the coefficients are three to five
dollars – or one to three percent in the log cost models – lower in these models than the Massachusetts-only
models. The attenuation of the PLA effect carries through into Models 3 through 6, as the estimated effects are
smaller than in the Massachusetts-only models and, in all cases, the PLA coefficients are not significant in a 10-
percent one-tailed test. Shifting to a sample that, although dominated by Massachusetts schools, includes a larger set
of schools results in a weaker PLA effect on school costs.
Sensitivity to Outliers
The approach taken in this research has been to develop a cost function for school construction, embed a measure of
whether a school was built under a PLA, and use estimates from this model to test the magnitude of the effect of
PLAs on school construction costs. Our work suggests that, although leanly-specified models find a positive
relationship between PLAs and school construction costs, models with more complete controls for characteristics of
schools and construction projects indicate that PLAs do not affect school construction costs.
Our experience with this research suggests some difficulties in using small samples to estimate school cost
functions. Construction projects are inherently unique and, although school construction is more homogeneous than
most construction, schools are still quite unique structures. The combination of unique projects and small samples
causes estimates to be sensitive to the composition of the sample as well as to unusual projects (i.e., outliers).
Several of the construction projects in our sample had unique characteristics that affected their costs. For
example, the PLA school in Lawrence, was a historic building; because of preservation requirements, the project had
to retain two walls and the roof at great expense. Another project was built under an accelerated schedule, taking just
two months from start to finish. Meeting this schedule required extraordinary efforts, with 120 workers employed
throughout the two months. This accelerated schedule would be expected to substantially increase the cost of the
project but this was mitigated because the foundation was in place, reducing construction costs. There were also
issues with the measurement of some characteristics. Demolition was more complex than we allowed for in the
survey; demolition projects varied in scale, complexity and expense. Some demolition involved small buildings, but
in other instances it involved removing multi-story buildings and/or lead and asbestos abatement. The control for
demolition was likely inadequate for the variety of work it encompassed. As previously discussed, Boston school
construction was also different and more expensive than the typical school in ways not fully captured in our survey.
The uniqueness of school construction presents two problems. First, as suggested above, collecting data on
the important characteristics that affect school construction costs is expensive and time-consuming, but necessary
since equivalent data is not available from secondary sources. Second, there appear to be more characteristics than
observations, at least in small data sets. Given the number of relevant characteristics, it may not be possible to build
an adequate model with fewer than several hundred observations.
The problems posed by the unique nature of construction might be ignored if we were working with large
data sets. In a sufficiently sizeable data set, there is a reasonable chance that the unique characteristics that affected
a PLA school would be balanced by unusual characteristics in a non-PLA school. The historic school built under a
PLA would hopefully be “balanced” by a non-PLA school that had particularly costly characteristics. Further, as
outliers would comprise a smaller portion of the sample, they would not exercise as great of an influence on the
estimates. This is not true for small samples, as a single extreme-valued observation can have a large effect on the
estimates, making the coefficients particularly sensitive to the sample used for the research.
Table 8 illustrates this issue by comparing estimates from two subsamples of our data to our full
Massachusetts sample of 70 schools. The left-hand side of the table provides results for final cost per square foot
models, the right hand side presents log final cost models. The first column contains estimates with 70
Massachusetts schools presented in Tables 2 and 3, the second contains estimates for a sample that omits Littleton
Massachusetts High School - an unusually low-cost, non-PLA high school, the third is the sample of 61 schools for
which we have Dodge data.
Turning first to the Littleton High School results, omission of this one observation has a modest effect on
estimates in Models 1-4. It generally results in an increase in the estimated impact of PLAs of one to two dollars
per square foot and by about one percentage point in the log cost models. Conclusions about the significance of the
PLA variable are sensitive to the treatment of Littleton: its exclusion from log cost Model 3 causes the PLA
measure to become significant with a similar pattern occuring in Model 4 of the cost per square foot model.
Omitting Littleton has a more dramatic effect in Models 5 and 6. In Model 5, the exclusion of Littleton causes the
point estimate of PLAs on cost per square foot to decline from $23.28 to $8.67; the effect on the log of final cost
falls from 9.7 percent to less than one percent. Model 6 estimates are similarly sensitive to the exclusion of the
Littleton High School data, with the PLA coefficient becoming negative albeit non-significant.
Substituting the Dodge sample of 61 schools for the full Massachusetts sample also affects point estimates
and statistical significance. For example, the Dodge sample estimate of Model 1 is $5.29 less per foot and 2 percent
less in the log total cost models than the full sample estimates. Dodge sample estimates of Model 3 PLA effects are
$5.10 and 2.79 percent lower than the full sample estimates. The most dramatic effects are, however, found in
Model 6 where the Dodge sample estimates have the opposite sign of the full sample estimates.
Another example of the issues with small samples is found in the implausibly large estimated effect of
libraries on construction cost. Libraries are necessary to the mission of schools, as it is unusual for a school to be
built without a library. Only two school buildings in our sample lack a library, both are private and one is unusually
inexpensive for new school construction.9 The large estimated effect for library thus appears to not so much a
measure of the cost of a library, but rather a measure of the difference in cost between a typical school and the
buildings that, because of their special purpose, lack a library. As such, the coefficient on library in our models may
be misleading.
What is the source of this sensitivity to sample and outliers? Data on school construction is micro-data.
Micro-data is inherently idiosyncratic; dependent variables have large variances and it is difficult to build models
that explain large proportions of the variance. Large micro-data samples are extensively used in economic and
social science research as large samples lessen issues with sampling variability and reduce the variance of estimates.
Small micro-data samples are, however, rarely used because of these same issues. These problems lead us to doubt
the efficacy of school cost functions estimated with small samples.
Comparison to Prior Research
Our work on the effect of PLAs on school construction costs has built upon two prior works by Haughton,
Chisholm, Haughton, and Tuerck. How do our results compare to these earlier studies? The first of these studies
considers the effect of PLAs on the price of school construction for 52 schools built in the Boston area between
1995 and 2001 allowing for the effects of project size, the number of stories, and whether the project was new
construction or a renovation. The study was limited to schools with a construction price of at least $1 million and
between 20,000 and 250,000 square feet. Twenty-nine percent of these schools were classified as being built under
PLAs. Project costs, square footage, height, and the type of the construction were obtained from F. W. Dodge. The
PLA projects in this sample were substantially larger than non-PLA projects (132,000 square feet versus 105,000
square feet), taller (3.1 versus 2.5 stories), and more expensive ($184 versus $145 per square foot).
Taking Dodge cost per square foot as the dependent variable in a leanly-specified regression model that
included measures of area, area squared, whether the project was new construction or a renovation, and whether the
school was built under a PLA, the authors found that PLAs increased the cost of school projects by $31.74 per
square foot (Table 9). This estimate suggests that the typical PLA project of 132,000 square feet would cost $4.2
million, or 17.3 percent, more than it would have had it been built without a PLA.
A follow-up study by Haughton, Chisholm, Haughton, and Tuerck (September 2003) increased the sample
size to 126 school construction projects in the Greater Boston area and better verified the Dodge and PLA data by
using additional sources of information. Problems with the data used in the initial study, such as misclassification of
three construction projects as having been built under as PLAs, were also corrected. The second study was limited
to larger and more expensive schools than the first, as projects were included if they were between 40,000 and
400,000 square feet and cost at least $5 million. Seventeen percent of the 126 construction projects were bid with
PLAs, while the square foot price of schools was $152 for PLA schools and $134 for non-PLA schools, a smaller
difference than in the first study. Differences in size were also less dramatic, as PLA projects averaged 151,000
square feet while non-PLA projects were 134,000 square feet. The average Dodge price was $22.92 million and
$16.95 million for PLA and non-PLA schools, respectively.
The estimated effect of PLAs on Dodge price was considerably smaller than in the first study. The authors’
preferred regression model indicates that PLAs increased expenses by $18.83 per square foot (Table 10), $12.91, or
41 percent, lower than the estimate in the first study. A small part of the disparity is attributable to differences in the
specification of the models, as estimates from specifications more comparable to Haughton et. al. I produced PLA
effects between $19.09 and $20.51.10 Models that use only new schools indicate that PLAs increase the cost of
construction by $14.90 per square foot.
How do our estimates compare to those of Haughton et. al.? Dodge cost Model 1 (Table 4) is the estimate
most similar to this prior work; it draws its data from the same source and the specification is, given our sample,
identical to their preferred model. Our estimate of the impact of PLAs, $16.77, is close to the $14.90 per square foot
reported in Haughton et. al. II for new school samples. This is reassuring as it indicates that differences between our
work and earlier research is caused by differences in measures of cost, in the variables used to control for the
features of construction, and in functional forms rather than differences in our base samples or techniques.
Given the similarities between the Haughton et. al. results and our comparable estimates, our concerns
about the effects of lean specifications and samples apply to this earlier research. Haughton et. al.’s view is that
additional controls are unlikely to influence the estimates of the effect of PLAs:
For the PLA effects here to be overstated, it would have to be the case that PLA projects systematically use more expensive materials or add more enhancements and “bells and whistles” than non-PLA projects. Our conversations with builders, town officials and architects suggests that PLA projects are not systematically more upscale. (Houghton, et. al. II, p. 8)
Contrary to this, our research indicates that PLA estimates are sensitive to specification and that, consistent with the
view and evidence that PLAs are used on more complex construction projects, positive PLA effects are not found in
more complete specifications. The superiority of the more fully specified model is also reflected in the second row
of F-statistics at the bottom of Tables 3 and 4. This statistic tests the hypothesis that all of the coefficients except
those on the PLA model, area and area2 - the Beacon Hill specification - are zero. In no case is the probability of
null greater than 2.15 percent and in three of the five cases, it is less than one percent. These tests indicate that the
additional variables belong in the model.
The use of Dodge data in Haughton et. al. is also troubling given the evidence of the instability of the
estimates with Dodge data and the implausibility of the results for some features of construction. Only the leanest of
specifications with Dodge data provide results that are, on their face, reasonable. Finally, we have shown that
estimates of PLA effects are sensitive to the sample used. Further evidence for this is found in the decline in the
estimate of the PLA effect from $31.74 in Haughton et. al. I to $18.83 in Haughton et. al. II consequent to the
change in the sample from 52 to 126 schools.
Conclusion
The effect of PLAs on the performance of school construction has become increasingly controversial. In pioneering
research, Haughton, Bachman, Chrisholm and Tuerck found that schools built under PLAs in the Greater Boston
Area are more expensive than those built without such agreements. The current research extends this earlier work by
examining the effect of more complete specifications, alternative measures of cost and the sensitivity of the results
to outlying observations. Our estimates suggest that, although simple specifications suggest that PLAs raise the cost
of school construction, this is not found in more complete specifications that better fit the data. Our results also

suggest that estimates using final costs rather than Dodge prices are more stable and more in keeping with
expectations about the sign and magnitude of the effect of construction characteristics on costs. Finally, we find
that, because of the uniqueness of construction projects, estimates obtained from small samples can be influenced by
unusual data. Although this does not invalidate the research, it suggests caution in accepting such estimates as the
last word on this subject.
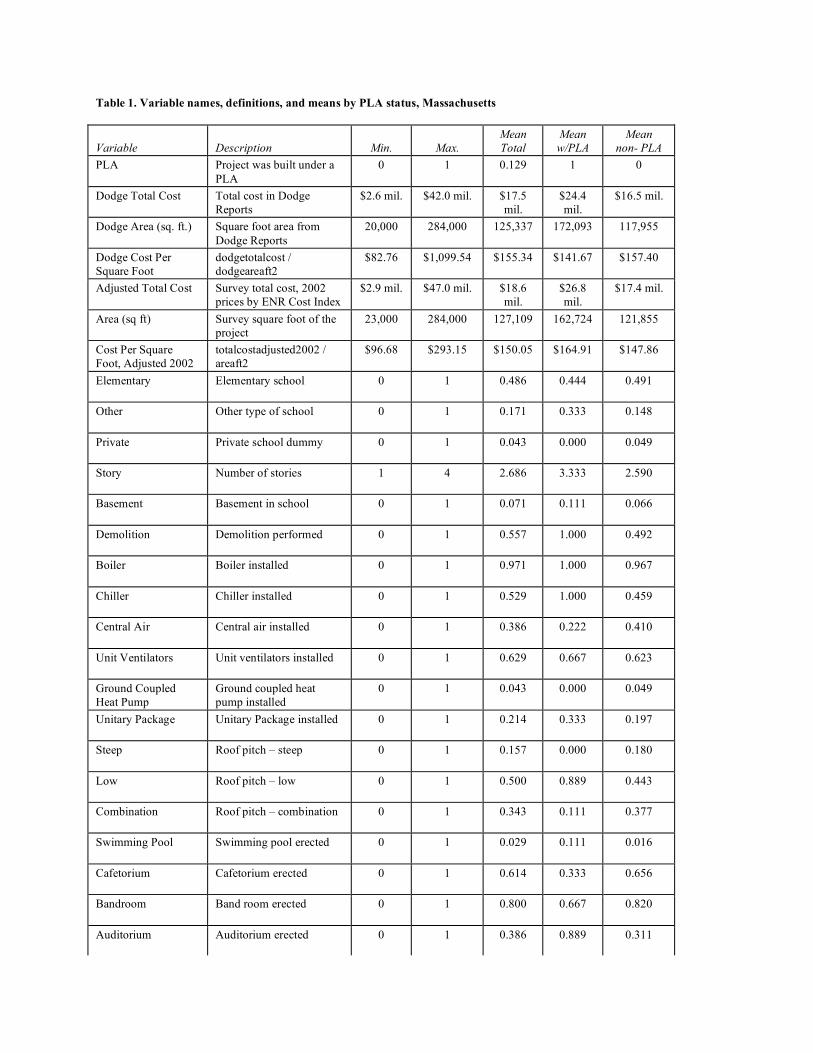
Table 1. Variable names, definitions, and means by PLA status, Massachusetts Variable
Description
Min.
Max.
Mean Total
Mean w/PLA
Mean non- PLA
PLA Project was built under a PLA
0
1
0.129
1
0
Dodge Total Cost Total cost in Dodge Reports
$2.6 mil.
$42.0 mil.
$17.5 mil.
$24.4 mil.
$16.5 mil.
Dodge Area (sq. ft.) Square foot area from Dodge Reports
20,000
284,000
125,337
172,093
117,955
Dodge Cost Per Square Foot
dodgetotalcost / dodgeareaft2
$82.76
$1,099.54
$155.34
$141.67
$157.40
Adjusted Total Cost Survey total cost, 2002 prices by ENR Cost Index
$2.9 mil. $47.0 mil. $18.6 mil.
$26.8 mil.
$17.4 mil.
Area (sq ft) Survey square foot of the project
23,000
284,000
127,109
162,724
121,855
Cost Per Square Foot, Adjusted 2002
totalcostadjusted2002 / areaft2
$96.68
$293.15
$150.05
$164.91
$147.86
Elementary Elementary school
0
1
0.486
0.444
0.491
Other
Other type of school
0
1
0.171
0.333
0.148
Private
Private school dummy
0
1
0.043
0.000
0.049
Story
Number of stories
1
4
2.686
3.333
2.590
Basement
Basement in school
0
1
0.071
0.111
0.066
Demolition
Demolition performed
0
1
0.557
1.000
0.492
Boiler
Boiler installed
0
1
0.971
1.000
0.967
Chiller
Chiller installed
0
1
0.529
1.000
0.459
Central Air
Central air installed
0
1
0.386
0.222
0.410
Unit Ventilators
Unit ventilators installed
0
1
0.629
0.667
0.623
Ground Coupled Heat Pump
Ground coupled heat pump installed
0
1
0.043
0.000
0.049
Unitary Package Unitary Package installed
0
1
0.214
0.333
0.197
Steep
Roof pitch – steep
0
1
0.157
0.000
0.180
Low
Roof pitch – low
0
1
0.500
0.889
0.443
Combination
Roof pitch – combination
0
1
0.343
0.111
0.377
Swimming Pool
Swimming pool erected
0
1
0.029
0.111
0.016
Cafetorium
Cafetorium erected
0
1
0.614
0.333
0.656
Bandroom
Band room erected
0
1
0.800
0.667
0.820
Auditorium
Auditorium erected
0
1
0.386
0.889
0.311
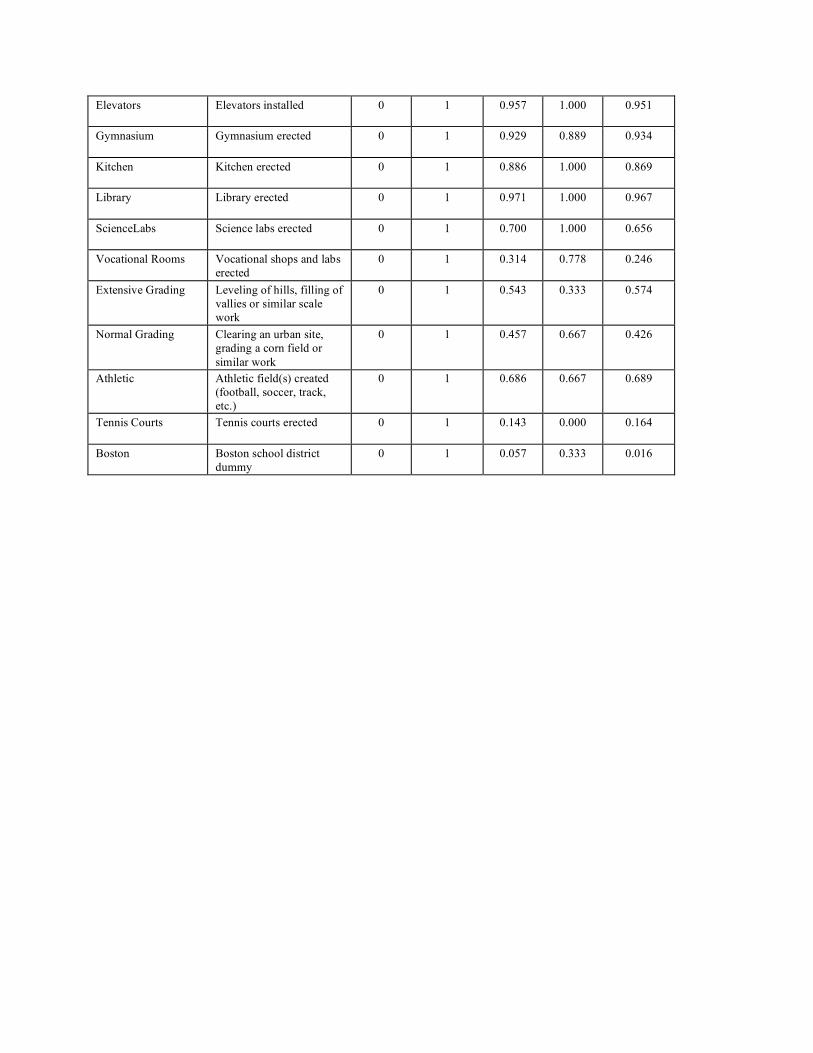
Elevators
Elevators installed
0
1
0.957
1.000
0.951
Gymnasium
Gymnasium erected
0
1
0.929
0.889
0.934
Kitchen
Kitchen erected
0
1
0.886
1.000
0.869
Library
Library erected
0
1
0.971
1.000
0.967
ScienceLabs
Science labs erected
0
1
0.700
1.000
0.656
Vocational Rooms Vocational shops and labs erected
0
1
0.314
0.778
0.246
Extensive Grading
Leveling of hills, filling of vallies or similar scale work
0
1
0.543
0.333
0.574
Normal Grading
Clearing an urban site, grading a corn field or similar work
0
1
0.457
0.667
0.426
Athletic
Athletic field(s) created (football, soccer, track, etc.)
0
1
0.686
0.667
0.689
Tennis Courts
Tennis courts erected
0
1
0.143
0.000
0.164
Boston
Boston school district dummy
0
1
0.057
0.333
0.016
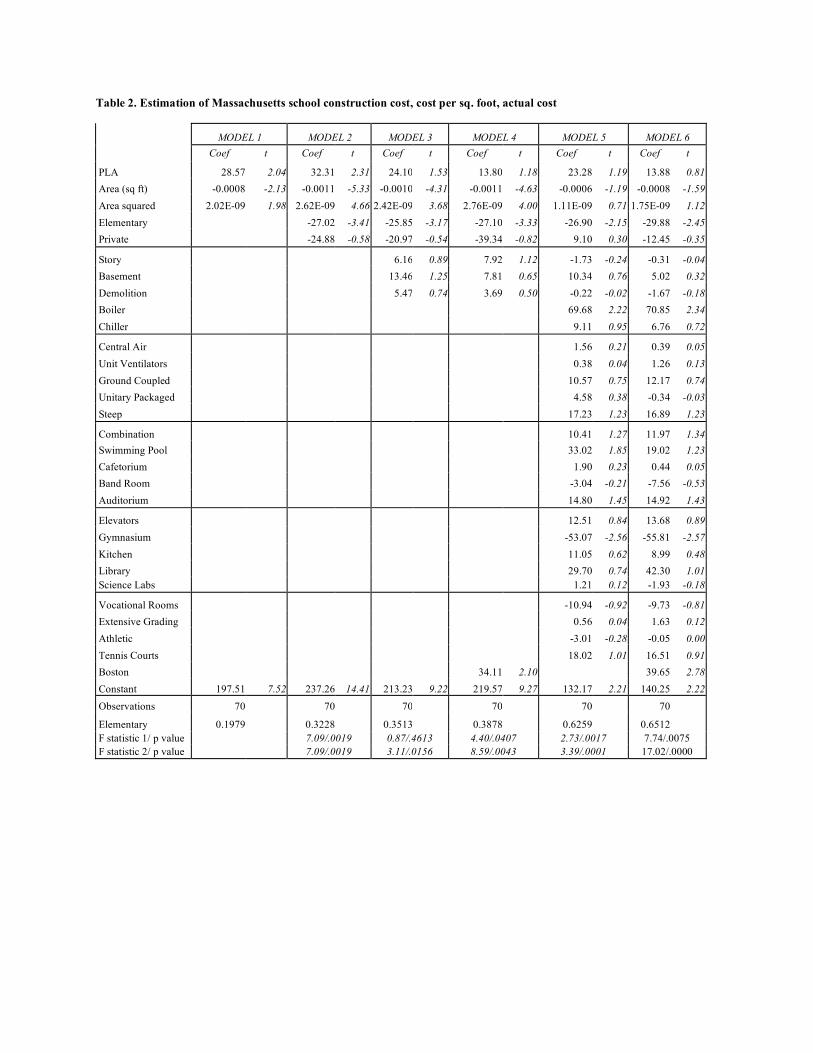
Table 2. Estimation of Massachusetts school construction cost, cost per sq. foot, actual cost
MODEL 1 MODEL 2 MODEL 3 MODEL 4 MODEL 5 MODEL 6 Coef t Coef t Coef t Coef t Coef t Coef t
PLA 28.57 2.04 32.31 2.31 24.10 1.53 13.80 1.18 23.28 1.19 13.88 0.81 Area (sq ft) -0.0008 -2.13 -0.0011 -5.33 -0.0010 -4.31 -0.0011 -4.63 -0.0006 -1.19 -0.0008 -1.59 Area squared 2.02E-09 1.98 2.62E-09 4.66 2.42E-09 3.68 2.76E-09 4.00 1.11E-09 0.71 1.75E-09 1.12 Elementary -27.02 -3.41 -25.85 -3.17 -27.10 -3.33 -26.90 -2.15 -29.88 -2.45 Private -24.88 -0.58 -20.97 -0.54 -39.34 -0.82 9.10 0.30 -12.45 -0.35
Story 6.16 0.89 7.92 1.12 -1.73 -0.24 -0.31 -0.04 Basement 13.46 1.25 7.81 0.65 10.34 0.76 5.02 0.32 Demolition 5.47 0.74 3.69 0.50 -0.22 -0.02 -1.67 -0.18 Boiler 69.68 2.22 70.85 2.34 Chiller 9.11 0.95 6.76 0.72
Central Air 1.56 0.21 0.39 0.05 Unit Ventilators 0.38 0.04 1.26 0.13 Ground Coupled 10.57 0.75 12.17 0.74 Unitary Packaged 4.58 0.38 -0.34 -0.03 Steep 17.23 1.23 16.89 1.23
Combination 10.41 1.27 11.97 1.34 Swimming Pool 33.02 1.85 19.02 1.23 Cafetorium 1.90 0.23 0.44 0.05 Band Room -3.04 -0.21 -7.56 -0.53 Auditorium 14.80 1.45 14.92 1.43
Elevators 12.51 0.84 13.68 0.89 Gymnasium -53.07 -2.56 -55.81 -2.57 Kitchen 11.05 0.62 8.99 0.48 Library 29.70 0.74 42.30 1.01 Science Labs 1.21 0.12 -1.93 -0.18
Vocational Rooms -10.94 -0.92 -9.73 -0.81 Extensive Grading 0.56 0.04 1.63 0.12 Athletic -3.01 -0.28 -0.05 0.00 Tennis Courts 18.02 1.01 16.51 0.91 Boston 34.11 2.10 39.65 2.78 Constant 197.51 7.52 237.26 14.41 213.23 9.22 219.57 9.27 132.17 2.21 140.25 2.22 Observations 70 70 70 70 70 70
Elementary 0.1979 0.3228 0.3513 0.3878 0.6259 0.6512 F statistic 1/ p value 7.09/.0019 0.87/.4613 4.40/.0407 2.73/.0017 7.74/.0075 F statistic 2/ p value 7.09/.0019 3.11/.0156 8.59/.0043 3.39/.0001 17.02/.0000
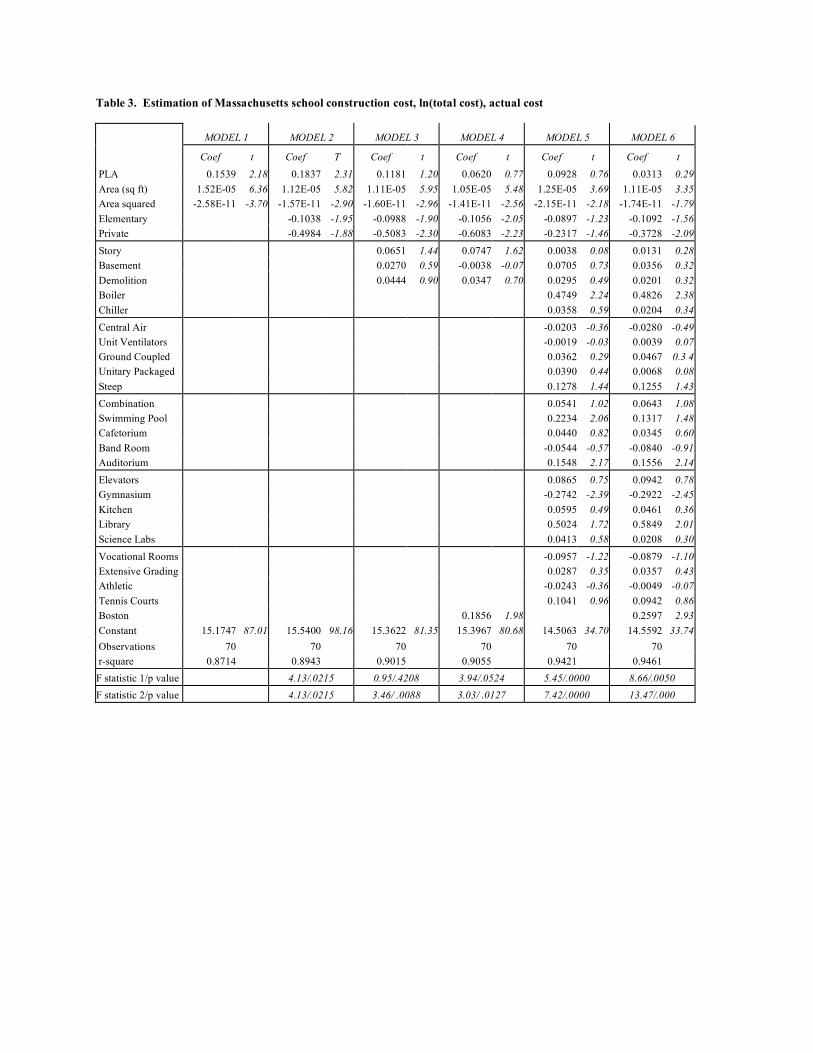
Table 3. Estimation of Massachusetts school construction cost, ln(total cost), actual cost
MODEL 1 MODEL 2 MODEL 3 MODEL 4 MODEL 5 MODEL 6
Coef t Coef T Coef t Coef t Coef t Coef t PLA 0.1539 2.18 0.1837 2.31 0.1181 1.20 0.0620 0.77 0.0928 0.76 0.0313 0.29 Area (sq ft) 1.52E-05 6.36 1.12E-05 5.82 1.11E-05 5.95 1.05E-05 5.48 1.25E-05 3.69 1.11E-05 3.35 Area squared -2.58E-11 -3.70 -1.57E-11 -2.90 -1.60E-11 -2.96 -1.41E-11 -2.56 -2.15E-11 -2.18 -1.74E-11 -1.79 Elementary -0.1038 -1.95 -0.0988 -1.90 -0.1056 -2.05 -0.0897 -1.23 -0.1092 -1.56 Private -0.4984 -1.88 -0.5083 -2.30 -0.6083 -2.23 -0.2317 -1.46 -0.3728 -2.09 Story 0.0651 1.44 0.0747 1.62 0.0038 0.08 0.0131 0.28 Basement 0.0270 0.59 -0.0038 -0.07 0.0705 0.73 0.0356 0.32 Demolition 0.0444 0.90 0.0347 0.70 0.0295 0.49 0.0201 0.32 Boiler 0.4749 2.24 0.4826 2.38 Chiller 0.0358 0.59 0.0204 0.34 Central Air -0.0203 -0.36 -0.0280 -0.49 Unit Ventilators -0.0019 -0.03 0.0039 0.07 Ground Coupled 0.0362 0.29 0.0467 0.3 4 Unitary Packaged 0.0390 0.44 0.0068 0.08 Steep 0.1278 1.44 0.1255 1.43 Combination 0.0541 1.02 0.0643 1.08 Swimming Pool 0.2234 2.06 0.1317 1.48 Cafetorium 0.0440 0.82 0.0345 0.60 Band Room -0.0544 -0.57 -0.0840 -0.91 Auditorium 0.1548 2.17 0.1556 2.14 Elevators 0.0865 0.75 0.0942 0.78 Gymnasium -0.2742 -2.39 -0.2922 -2.45 Kitchen 0.0595 0.49 0.0461 0.36 Library 0.5024 1.72 0.5849 2.01 Science Labs 0.0413 0.58 0.0208 0.30 Vocational Rooms -0.0957 -1.22 -0.0879 -1.10 Extensive Grading 0.0287 0.35 0.0357 0.43 Athletic -0.0243 -0.36 -0.0049 -0.07 Tennis Courts 0.1041 0.96 0.0942 0.86 Boston 0.1856 1.98 0.2597 2.93 Constant 15.1747 87.01 15.5400 98.16 15.3622 81.35 15.3967 80.68 14.5063 34.70 14.5592 33.74 Observations 70 70 70 70 70 70 r-square 0.8714 0.8943 0.9015 0.9055 0.9421 0.9461 F statistic 1/p value 4.13/.0215 0.95/.4208 3.94/.0524 5.45/.0000 8.66/.0050 F statistic 2/p value 4.13/.0215 3.46/ .0088 3.03/ .0127 7.42/.0000 13.47/.000
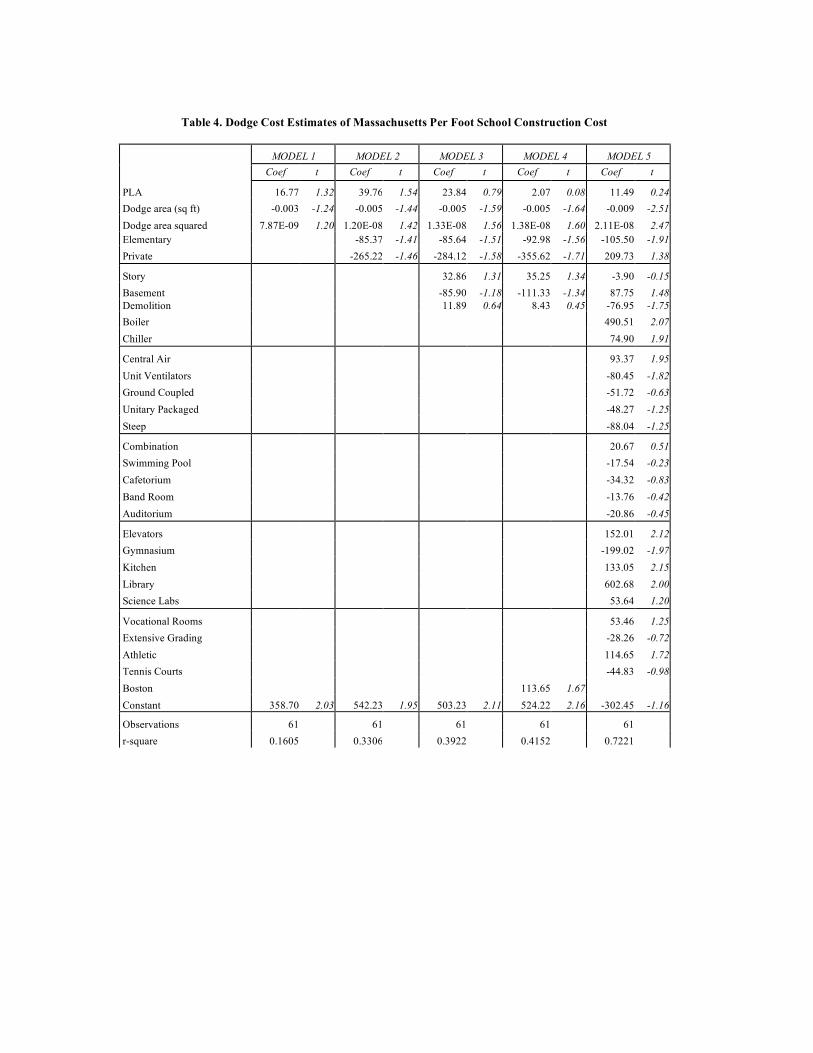
Table 4. Dodge Cost Estimates of Massachusetts Per Foot School Construction Cost
MODEL 1 MODEL 2 MODEL 3 MODEL 4 MODEL 5
Coef t Coef t Coef t Coef t Coef t
PLA 16.77 1.32 39.76 1.54 23.84 0.79 2.07 0.08 11.49 0.24 Dodge area (sq ft) -0.003 -1.24 -0.005 -1.44 -0.005 -1.59 -0.005 -1.64 -0.009 -2.51 Dodge area squared 7.87E-09 1.20 1.20E-08 1.42 1.33E-08 1.56 1.38E-08 1.60 2.11E-08 2.47 Elementary -85.37 -1.41 -85.64 -1.51 -92.98 -1.56 -105.50 -1.91 Private -265.22 -1.46 -284.12 -1.58 -355.62 -1.71 209.73 1.38
Story 32.86 1.31 35.25 1.34 -3.90 -0.15 Basement -85.90 -1.18 -111.33 -1.34 87.75 1.48 Demolition 11.89 0.64 8.43 0.45 -76.95 -1.75 Boiler 490.51 2.07 Chiller 74.90 1.91
Central Air 93.37 1.95 Unit Ventilators -80.45 -1.82 Ground Coupled -51.72 -0.63 Unitary Packaged -48.27 -1.25 Steep -88.04 -1.25
Combination 20.67 0.51 Swimming Pool -17.54 -0.23 Cafetorium -34.32 -0.83 Band Room -13.76 -0.42 Auditorium -20.86 -0.45
Elevators 152.01 2.12 Gymnasium -199.02 -1.97 Kitchen 133.05 2.15 Library 602.68 2.00 Science Labs 53.64 1.20
Vocational Rooms 53.46 1.25 Extensive Grading -28.26 -0.72 Athletic 114.65 1.72 Tennis Courts -44.83 -0.98 Boston 113.65 1.67 Constant 358.70 2.03 542.23 1.95 503.23 2.11 524.22 2.16 -302.45 -1.16
Observations 61 61 61 61 61 r-square 0.1605 0.3306 0.3922 0.4152 0.7221
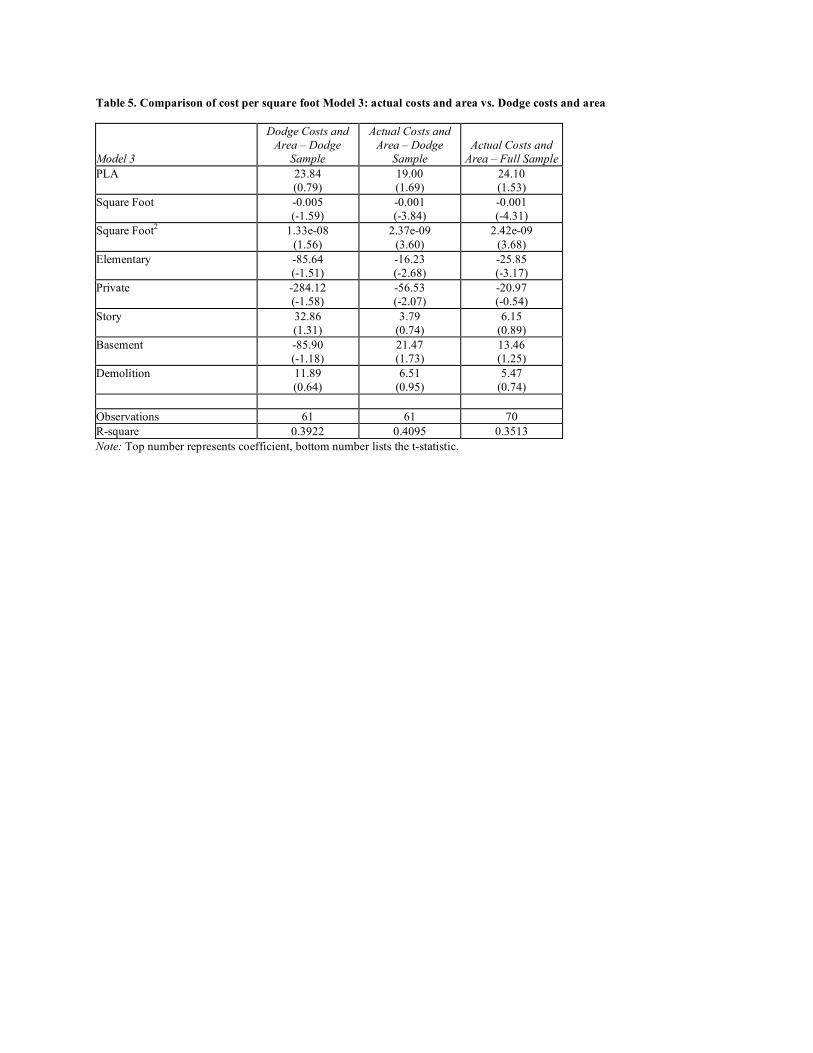
Table 5. Comparison of cost per square foot Model 3: actual costs and area vs. Dodge costs and area Model 3
Dodge Costs and Area – Dodge
Sample
Actual Costs and Area – Dodge
Sample
Actual Costs and
Area – Full Sample PLA 23.84
(0.79) 19.00 (1.69)
24.10 (1.53)
Square Foot -0.005 (-1.59)
-0.001 (-3.84)
-0.001 (-4.31)
Square Foot2 1.33e-08 (1.56)
2.37e-09 (3.60)
2.42e-09 (3.68)
Elementary -85.64 (-1.51)
-16.23 (-2.68)
-25.85 (-3.17)
Private -284.12 (-1.58)
-56.53 (-2.07)
-20.97 (-0.54)
Story 32.86 (1.31)
3.79 (0.74)
6.15 (0.89)
Basement -85.90 (-1.18)
21.47 (1.73)
13.46 (1.25)
Demolition 11.89 (0.64)
6.51 (0.95)
5.47 (0.74)
Observations 61 61 70 R-square 0.3922 0.4095 0.3513 Note: Top number represents coefficient, bottom number lists the t-statistic.
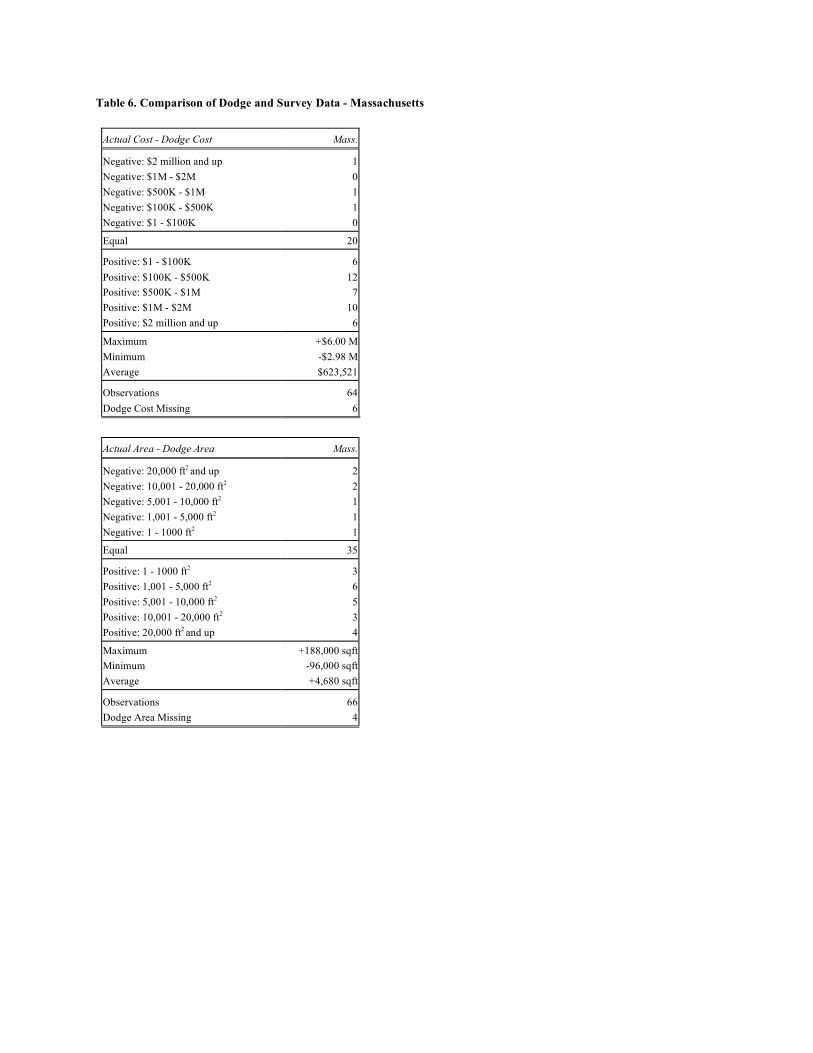
Table 6. Comparison of Dodge and Survey Data - Massachusetts
Actual Cost - Dodge Cost Mass.
Negative: $2 million and up 1 Negative: $1M - $2M 0 Negative: $500K - $1M 1 Negative: $100K - $500K 1 Negative: $1 - $100K 0
Equal 20
Positive: $1 - $100K 6 Positive: $100K - $500K 12 Positive: $500K - $1M 7 Positive: $1M - $2M 10 Positive: $2 million and up 6
Maximum +$6.00 M Minimum -$2.98 M Average $623,521
Observations 64 Dodge Cost Missing 6
Actual Area - Dodge Area Mass.
Negative: 20,000 ft2 and up 2 Negative: 10,001 - 20,000 ft2 2 Negative: 5,001 - 10,000 ft2 1 Negative: 1,001 - 5,000 ft2 1 Negative: 1 - 1000 ft2 1
Equal 35
Positive: 1 - 1000 ft2 3 Positive: 1,001 - 5,000 ft2 6 Positive: 5,001 - 10,000 ft2 5 Positive: 10,001 - 20,000 ft2 3 Positive: 20,000 ft2 and up 4
Maximum +188,000 sqft Minimum -96,000 sqft Average +4,680 sqft
Observations 66 Dodge Area Missing 4
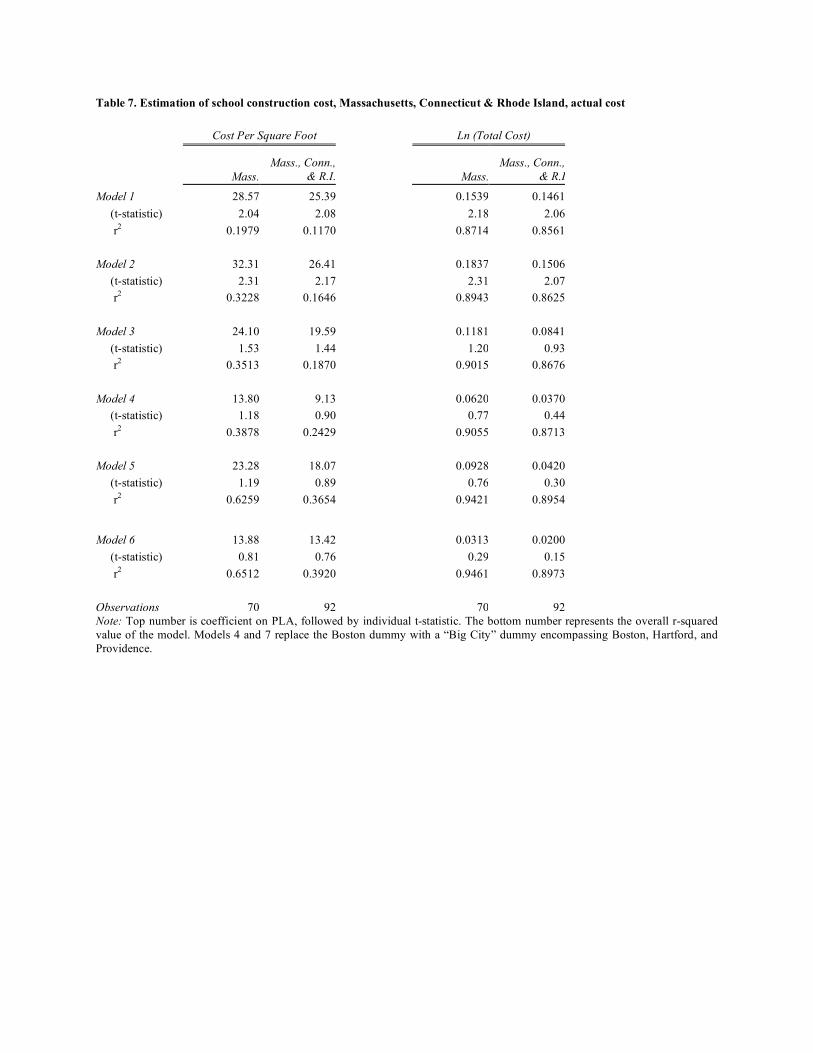
Table 7. Estimation of school construction cost, Massachusetts, Connecticut & Rhode Island, actual cost
Cost Per Square Foot Ln (Total Cost)
Mass. Mass., Conn.,
& R.I. Mass. Mass., Conn.,
& R.I
Model 1 28.57 25.39 0.1539 0.1461 (t-statistic) 2.04 2.08 2.18 2.06 r2 0.1979 0.1170 0.8714 0.8561 Model 2 32.31 26.41 0.1837 0.1506 (t-statistic) 2.31 2.17 2.31 2.07 r2 0.3228 0.1646 0.8943 0.8625 Model 3 24.10 19.59 0.1181 0.0841 (t-statistic) 1.53 1.44 1.20 0.93 r2 0.3513 0.1870 0.9015 0.8676 Model 4 13.80 9.13 0.0620 0.0370 (t-statistic) 1.18 0.90 0.77 0.44 r2 0.3878 0.2429 0.9055 0.8713 Model 5 23.28 18.07 0.0928 0.0420 (t-statistic) 1.19 0.89 0.76 0.30 r2 0.6259 0.3654 0.9421 0.8954
Model 6 13.88 13.42 0.0313 0.0200 (t-statistic) 0.81 0.76 0.29 0.15 r2 0.6512 0.3920 0.9461 0.8973 Observations 70 92 70 92 Note: Top number is coefficient on PLA, followed by individual t-statistic. The bottom number represents the overall r-squared value of the model. Models 4 and 7 replace the Boston dummy with a “Big City” dummy encompassing Boston, Hartford, and Providence.
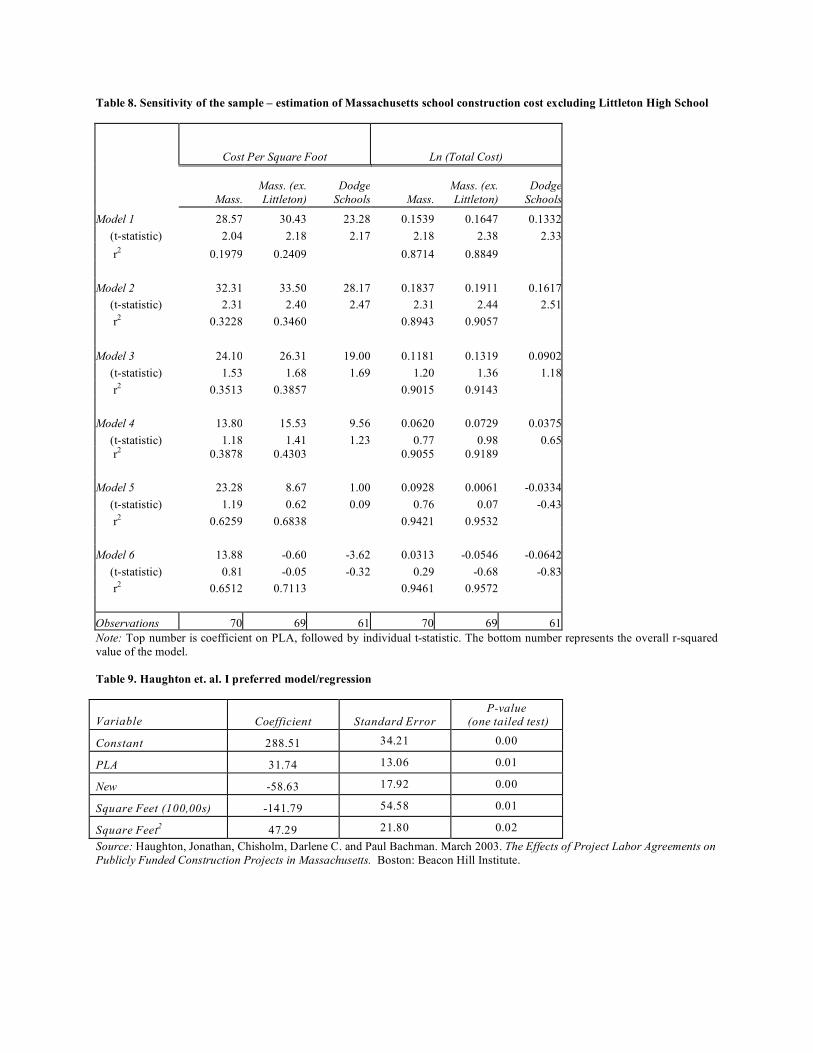
Table 8. Sensitivity of the sample – estimation of Massachusetts school construction cost excluding Littleton High School
Cost Per Square Foot Ln (Total Cost)
Mass. Mass. (ex. Littleton)
Dodge Schools Mass.
Mass. (ex. Littleton)
Dodge Schools
Model 1 28.57 30.43 23.28 0.1539 0.1647 0.1332 (t-statistic) 2.04 2.18 2.17 2.18 2.38 2.33 r2 0.1979 0.2409 0.8714 0.8849 Model 2 32.31 33.50 28.17 0.1837 0.1911 0.1617 (t-statistic) 2.31 2.40 2.47 2.31 2.44 2.51 r2 0.3228 0.3460 0.8943 0.9057 Model 3 24.10 26.31 19.00 0.1181 0.1319 0.0902 (t-statistic) 1.53 1.68 1.69 1.20 1.36 1.18 r2 0.3513 0.3857 0.9015 0.9143 Model 4 13.80 15.53 9.56 0.0620 0.0729 0.0375 (t-statistic) 1.18 1.41 1.23 0.77 0.98 0.65 r2 0.3878 0.4303 0.9055 0.9189 Model 5 23.28 8.67 1.00 0.0928 0.0061 -0.0334 (t-statistic) 1.19 0.62 0.09 0.76 0.07 -0.43 r2 0.6259 0.6838 0.9421 0.9532 Model 6 13.88 -0.60 -3.62 0.0313 -0.0546 -0.0642 (t-statistic) 0.81 -0.05 -0.32 0.29 -0.68 -0.83 r2 0.6512 0.7113 0.9461 0.9572 Observations 70 69 61 70 69 61 Note: Top number is coefficient on PLA, followed by individual t-statistic. The bottom number represents the overall r-squared value of the model. Table 9. Haughton et. al. I preferred model/regression
Variable
Coefficient
Standard Error P-value
(one tailed test)
Constant 288.51 34.21 0.00
PLA 31.74 13.06 0.01
New -58.63 17.92 0.00
Square Feet (100,00s) -141.79 54.58 0.01
Square Feet2 47.29 21.80 0.02 Source: Haughton, Jonathan, Chisholm, Darlene C. and Paul Bachman. March 2003. The Effects of Project Labor Agreements on Publicly Funded Construction Projects in Massachusetts. Boston: Beacon Hill Institute.
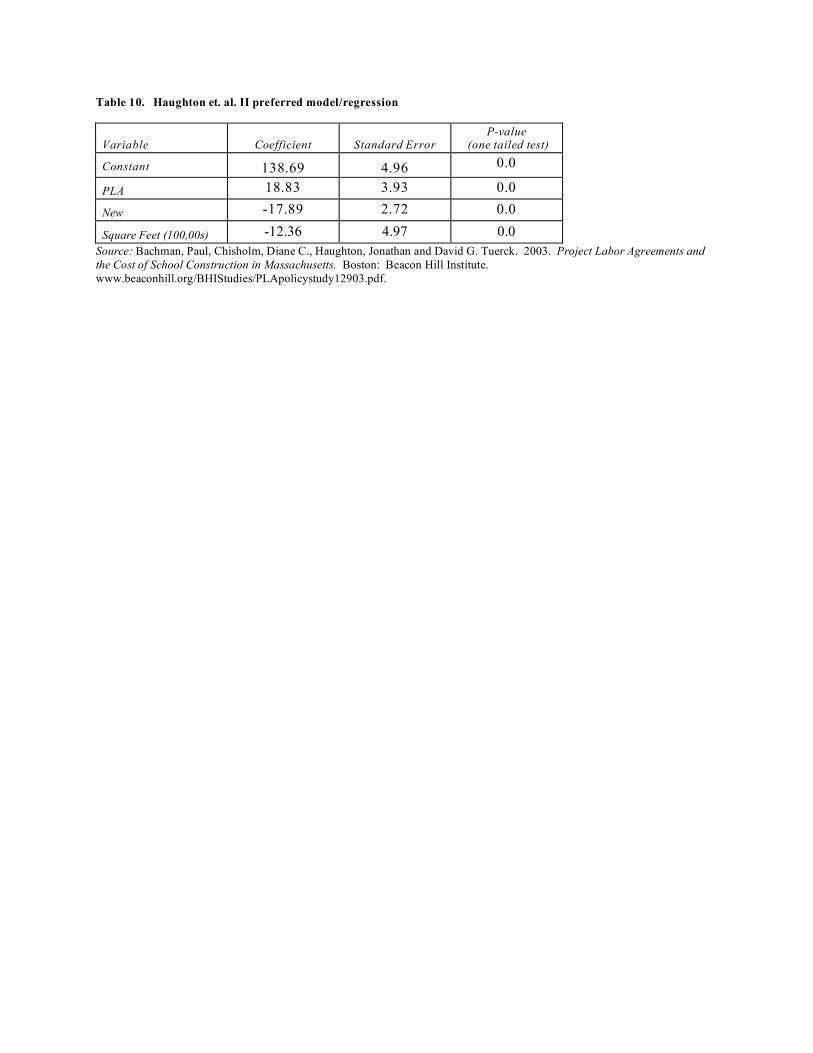
Table 10. Haughton et. al. II preferred model/regression
Variable Coefficient Standard Error P-value
(one tailed test)
Constant 138.69 4.96 0.0
PLA 18.83 3.93 0.0 New -17.89 2.72 0.0 Square Feet (100,00s) -12.36 4.97 0.0
Source: Bachman, Paul, Chisholm, Diane C., Haughton, Jonathan and David G. Tuerck. 2003. Project Labor Agreements and the Cost of School Construction in Massachusetts. Boston: Beacon Hill Institute. www.beaconhill.org/BHIStudies/PLApolicystudy12903.pdf.
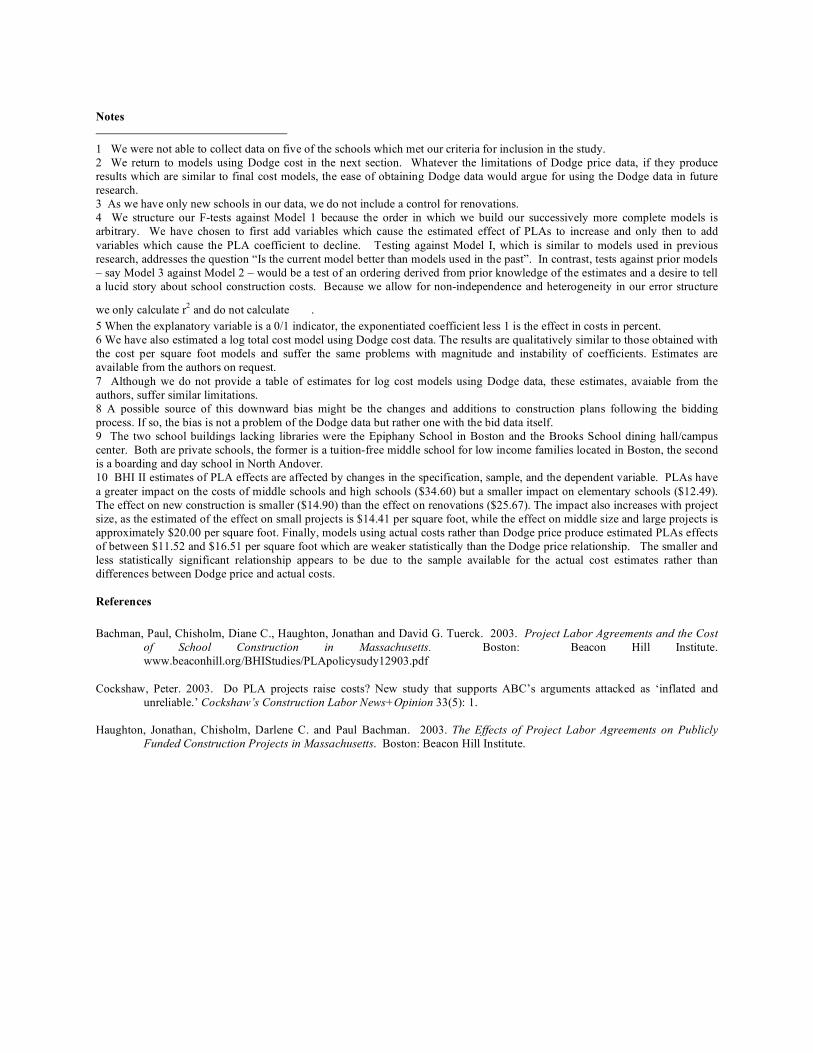
Notes 1 We were not able to collect data on five of the schools which met our criteria for inclusion in the study. 2 We return to models using Dodge cost in the next section. Whatever the limitations of Dodge price data, if they produce results which are similar to final cost models, the ease of obtaining Dodge data would argue for using the Dodge data in future research. 3 As we have only new schools in our data, we do not include a control for renovations. 4 We structure our F-tests against Model 1 because the order in which we build our successively more complete models is arbitrary. We have chosen to first add variables which cause the estimated effect of PLAs to increase and only then to add variables which cause the PLA coefficient to decline. Testing against Model I, which is similar to models used in previous research, addresses the question “Is the current model better than models used in the past”. In contrast, tests against prior models – say Model 3 against Model 2 – would be a test of an ordering derived from prior knowledge of the estimates and a desire to tell a lucid story about school construction costs. Because we allow for non-independence and heterogeneity in our error structure
we only calculate r2 and do not calculate . 5 When the explanatory variable is a 0/1 indicator, the exponentiated coefficient less 1 is the effect in costs in percent. 6 We have also estimated a log total cost model using Dodge cost data. The results are qualitatively similar to those obtained with the cost per square foot models and suffer the same problems with magnitude and instability of coefficients. Estimates are available from the authors on request. 7 Although we do not provide a table of estimates for log cost models using Dodge data, these estimates, avaiable from the authors, suffer similar limitations. 8 A possible source of this downward bias might be the changes and additions to construction plans following the bidding process. If so, the bias is not a problem of the Dodge data but rather one with the bid data itself. 9 The two school buildings lacking libraries were the Epiphany School in Boston and the Brooks School dining hall/campus center. Both are private schools, the former is a tuition-free middle school for low income families located in Boston, the second is a boarding and day school in North Andover. 10 BHI II estimates of PLA effects are affected by changes in the specification, sample, and the dependent variable. PLAs have a greater impact on the costs of middle schools and high schools ($34.60) but a smaller impact on elementary schools ($12.49). The effect on new construction is smaller ($14.90) than the effect on renovations ($25.67). The impact also increases with project size, as the estimated of the effect on small projects is $14.41 per square foot, while the effect on middle size and large projects is approximately $20.00 per square foot. Finally, models using actual costs rather than Dodge price produce estimated PLAs effects of between $11.52 and $16.51 per square foot which are weaker statistically than the Dodge price relationship. The smaller and less statistically significant relationship appears to be due to the sample available for the actual cost estimates rather than differences between Dodge price and actual costs. References Bachman, Paul, Chisholm, Diane C., Haughton, Jonathan and David G. Tuerck. 2003. Project Labor Agreements and the Cost
of School Construction in Massachusetts. Boston: Beacon Hill Institute. www.beaconhill.org/BHIStudies/PLApolicysudy12903.pdf
Cockshaw, Peter. 2003. Do PLA projects raise costs? New study that supports ABC’s arguments attacked as ‘inflated and
unreliable.’ Cockshaw’s Construction Labor News+Opinion 33(5): 1. Haughton, Jonathan, Chisholm, Darlene C. and Paul Bachman. 2003. The Effects of Project Labor Agreements on Publicly
Funded Construction Projects in Massachusetts. Boston: Beacon Hill Institute.