Embed Size (px)
Citation preview
INVENT2 Final Report (Public)
1
INdustriele en decentrale VErduurzaming door iNnovatieve biomassa Torrefactie 2 (INVENT 2) Public Final Report • Project number: TEBE214004 • Project title: INVENT2 • Project Coordinator: ECN • Project period : 01-01-2015 – 31-12-2017 • Publication date: 30-06-2018
Participant Type of organization
Role in project Contact person
Coordinator ECN (now TNO)
Research Institute
Coordination, washing and torrefaction of biomass residue streams on pilot scale
Michiel Carbo, Jaap Kiel, Pedro Abelha, Pavlina Nanou
P1. Torr-Coal SME Development of torrefaction and post-washing, contribution to techno-economic evaluation
Jo Sluijsmans
P2. Biolake SME Development of torrefaction and pre-washing, contribution to techno-economic evaluation
Tom de Wit
P3. Kees v/d Vecht rvs Apparatenbouw B.V.
SME Design, construction and development of washing and dewatering pilot installation
Michiel Ruis
P4. Hoogheemraadschap Hollands Noorderkwartier (HHNK)
(Semi-) governmental organization
Availability of agro-residues, estimation of quality and options for effluent treatment
George Zoutberg
P5. Essent Power B.V. (now RWE Generation NL B.V.)
Large Enterprise
Support in selection of biomass residue streams, estimation of product quality, contribution to techno-economic evaluation
Mark Bouwmeester
P6. Van Gansewinkel groep B.V.
Large Enterprise
Producer of SRF, contribution to knowledge on biomass residues and waste streams market
Arend Bolt, Martien van Eersel
This project was realized with financial support by the Ministry of Economic Affairs, Subsidy Scheme energy and Innovation (SEI), Topsector Energy carried out by the Netherlands Enterprise Agency (RVO) For questions you can contact Pavlina Nanou [email protected].

INVENT2 Final Report (Public)
2
Inhoud Summary ................................................................................................................................................. 3
1. Introduction ...................................................................................................................................... 4
2. Feedstock selection and screening ................................................................................................. 5
3. Lab scale screening tests: washing and torrefaction ...................................................................... 8
3.1. Washing tests ............................................................................................................................... 8
3.1.1. Procedure ............................................................................................................................. 8
3.1.2. Results .................................................................................................................................. 9
3.2. Lab-scale torrefaction tests ......................................................................................................... 11
3.3. Global Mass Balances ................................................................................................................ 14
3.4. Testing with SRF ......................................................................................................................... 17
3.4.1. Washing tests with raw and torrefied SRF (ECN) ........................................................... 17
3.4.2. Washing tests with torrefied SRF (Torr-Coal) ................................................................. 18
4. Pilot scale testing ........................................................................................................................... 20
4.1. Materials ..................................................................................................................................... 20
4.2. Pre-washing and drying .............................................................................................................. 20
4.3. Pelleting ...................................................................................................................................... 22
4.4. Torrefaction testing (ECN) .......................................................................................................... 22
4.5. Torrefaction testing (Biolake) ...................................................................................................... 25
4.6. Torrefaction flue gas cleaning (Torr-Coal) .................................................................................. 26
5. Fuel and system evaluation ........................................................................................................... 29
5.1. Fuel evaluation (ECN)................................................................................................................. 29
5.1.1. Evaluation of emissions, high temperature corrosion and ash melting tendency ....... 29
5.1.2. Grindability......................................................................................................................... 30
5.1.3. Fine particulates/aerosol formation ................................................................................ 32
5.2. Fuel combustion testing in a pellet stove (Biolake) .................................................................... 36
5.3. System evaluation on industrial scale (Torr-Coal) ...................................................................... 37
5.3.1. Washing of torrefied material ........................................................................................... 37
5.4. Treatment of the wastewater effluent from the washing installation (HHNK) ............................. 44
5.4.1. General rules about wastewater discharge ..................................................................... 44
5.4.2. Relevance for pre-wash or post-wash effluent ................................................................ 45
6. Conclusions ................................................................................................................................... 46
INVENT2 Final Report (Public)
3
Summary Six individual waste stream biomass materials – road-side grass, FVG waste, miscanthus, chicken
manure, SRF and waste from forest and landscaping – were selected for upgrading into good quality
solid energy carriers. This involves a pre-washing step to remove part of the undesirable mineral
elements like alkalis and chloride, followed by torrefaction. These six biomass waste streams were
screened using lab-scale equipment at ECN.
These washing tests showed that more than 80% of Cl and more than 60% of K could be removed
from the different tested materials, with the exception of miscanthus which revealed lower values (60%
and 40% for Cl and K respectively) and waste from forest and landscaping where only K is present in
substantial amounts and about 35% was removed. The washing was also effective in the removal of
Na and S achieving about 50% removal (again with the exception of miscanthus and waste from forest
and landscaping). Subsequent torrefaction of the washed feedstocks increased the energy content of
all biomass streams although it revealed a very limited effect on the ash composition with the
exception of Cl and S where it seems to favor the removal of these elements.
Three biomass waste streams were selected, namely road-side grass, miscanthus and straw, for
testing on pilot-scale washing and torrefaction at ECN and Biolake. The pilot-scale washing unit was
built by Kees v/d Vecht rvs Apparatenbouw B.V. and washing tests were successfully completed by
ECN. The washing treatment on pilot scale for road side grass led to results comparable to the lab
testing results for the removal of elements like Cl (80%), K (70%), S (50%) and the total amount of ash
(25%). The torrefaction treatment shows a further reduction in Cl and S, and an overall increase in
other mineral concentrations, as expected. For miscanthus the removal of Cl (58%), K (45%), P (32%)
and S (30%) is comparable for the lab and pilot scale washing treatments.
Fuel indexes were used to provide a first view on the expected improved behavior during combustion
as a result of the upgrading processes. Combustion testing of the pellets in a 15 kW pellet stove at
Biolake did not lead to solid conclusions as the CS Thermos pellet stove used is not suitable for
burning torrefied pellets. Extra combustion testing was realized in a controlled environment at ECN
facilities using the original and upgraded fuels. It can be concluded that the upgraded biomasses
showed improved fuel characteristics for combustion.
INVENT2 Final Report (Public)
4
1. Introduction The TKI project INVENT2 aims at the production of good quality secondary/bio fuels from low-value
(biomass) residue streams through washing of the materials followed by torrefaction. The pre-washing
step is introduced to remove part of the undesirable elements like alkali metals (potassium, sodium)
and chloride.
Torrefaction, followed by densification, is a process that can upgrade a biomass stream into a high
quality energy carrier. It is a thermal treatment performed at temperatures between 240°C and 320°C
in an inert atmosphere and at atmospheric conditions. During the process the biomass partly
devolatilizes. The final product is the remaining solid, which is often referred to as torrefied biomass.
Torrefaction improves the thermo-chemical properties of the biomass, making biomass easier to store,
handle and transport and making biomass easily grindable, comparable with hard coal. However,
torrefaction does not affect the alkali metals and chloride content in the biomass. These elements are
undesirable for the end user and as such to convert low value streams into high quality energy carriers
these elements have to be removed. Hereby a washing step prior to torrefaction is included in this
project.
This report summarizes the tests performed with different types of low-value biomass streams to
convert them into good quality energy carriers through washing and torrefaction. The first step in this
project was to select a range of biomass waste streams that could be used. Chapter 2 presents the
properties of the six biomass streams that were chosen after screening of their availability in The
Netherlands. Chapter 3 presents the lab scale washing and torrefaction testing of the six selected
biomass streams. Based on these results, three biomass streams were selected for pilot scale testing.
These are described in Chapter 4, where also some attention is dedicated to torrefaction of SRF.
Finally, Chapter 5 evaluates the properties of the final upgraded product and some techno economic
considerations of the system are discussed.

INVENT2 Final Report (Public)
5
2. Feedstock selection and screening The following biomass streams were selected for the TKI Invent 2 project. The criteria of this choice are based on variety and accessibility.
• Road-side grass
• FVG waste (Fruit, Vegetable and Garden)
• Miscanthus
• Chicken Manure
• Waste from forest and landscaping
• SRF (Solid Recovered Fuel)
All these streams have been received, analysed and tested at ECN facilities. Road-side grass was
provided by J. van Bodegom en Zn. B.V. (www.firmajvanbodegom.nl); FVG waste supplied by HVC
(www.hvcgroep.nl ) from Medemblik; miscanthus supplied by Cradle Crops (cradlecrops.nl); Chicken
manure was available within ECN facilities, courtesy of the University of Limerik (Ireland), waste from
forest and landscaping provided by Stadsverwarming Purmerend
(www.stadsverwarmingpurmerend.nl) and SRF was provided by partner Torr-Coal. Due to the high
moisture content of the road-side grass and the FVG waste these feedstocks had to be dried before
the washing tests.
Figure 1 shows the different biomass streams to be subjected to the washing tests. All these feedstocks were analyzed at ECN facilities. Table 1 shows the ultimate analysis while Table 2 presents details on ash composition.
A B
C D

INVENT2 Final Report (Public)
6
Figure 1 Samples of the biomass streams received: A) road-side grass; B) FVG waste, C) miscanthus, D) chicken manure, E) SRF, F) Waste from forest and landscaping.
Table 1 Ultimate analysis of the different biomass streams (dry basis).
C H N O Ash
wt% wt% wt% wt% wt%
Road-side grass 41,5 5,6 1,5 37,4 13,9
FVG waste 26,9 3,1 1,2 23,7 48,3
Miscanthus 45,8 6,1 0,3 41,9 2,3
Chicken manure 40,7 5,5 4,5 35,9 17,9
SRF 55,9 7,4 0,9 29,2 8,1
Waste from forest
and landscaping 47,7 6,1 0,4 45,7 1,7
Table 2 Details on ash composition from the different biomass streams (dry basis).
Cl Ca K Mg Na P S Si
mg/kg mg/kg mg/kg mg/kg mg/kg mg/kg mg/kg mg/kg
Road-side grass 9155 8993 19885 1722 1611 2590 2544 34646
FVG waste 2986 22468 11922 4777 3702 2371 1770 153296
Miscanthus 640 1272 3749 325 181 235 459 6583
Chicken manure 4579 30875 28437 7872 3750 13175 7069 5865
SRF 11989 16819 1035 989 364 498 1160 7949
Waste from forest
and landscaping
133 4440 2088 453 127 416 337 394
In general FVG waste has the highest content on mineral matter (about 50%) although the majority of
it is sand (Si). On the opposite side miscanthus and waste from forest and landscaping have the
lowest content on mineral matter with basically only potassium (K) present in substantial amounts.
Road-side grass and SRF contain the highest amount of chloride. Chicken manure, followed by road-
side grass, contains the highest amount of potassium (K). Compared with the other elements sodium
(Na) is present in lower quantities though still substantial in FVG waste and chicken manure.
Phosphorous (P) and sulphur (S), also problematic elements, are present in high amounts in chicken
E F

INVENT2 Final Report (Public)
7
manure. Figure 2 compares the amount of these elements in the different biomass streams. It is
clearly seen that K is the element present in larger content (Si is not shown).
Figure 2 Problematic ash elements present in the different biomass streams (mass fraction on dry basis).

INVENT2 Final Report (Public)
8
3. Lab scale screening tests: washing and torrefaction Six individual waste biomass streams – road-side grass, FVG waste, miscanthus, chicken manure, SRF and waste from forest and landscaping – were selected in the scope of the TKI Invent2 project with the goal of upgrading them into good quality solid energy carriers. This involves a pre-washing step, to remove part of the undesirable mineral elements like alkalis and chloride, followed by torrefaction. In the case of SRF, washing was investigated before (pre-washing) as well as after torrefaction (post-washing).
3.1. Washing tests A small-scale washing procedure has been developed to assess the conditions that should be applied during the washing of the different biomass streams. This study gives an indication of the extent of washing efficiency expected for a certain feedstock. Three parameters are studied: Liquid to Solid ratio (L/S) on dry basis, washing medium temperature and washing time.
3.1.1. Procedure Washing tests on a small-scale were performed to determine the feedstocks to be subjected for washing as well as to give an indication about the conditions that should be applied during the washing of the biomass. These tests were performed with 500 mL demi water (Figure 3A) and the corresponding amount of biomass (depending on the L/S to be studied). Besides pre-drying the biomass there was no further pre-treatment prior to these tests. To reach the desired temperature the samples were placed in a water bath with mild shacking (Figure 3B). After each test the effluent was filtered (Figure 3C) and the respective conductivity was measured at room temperature (Figure 3D). Conductivity is a fast, inexpensive and reliable way of measuring the ionic content in a solution. The washed biomass samples were sent for analyses.
Figure 3 Images from the small-scale set-up: A) 500 mL flasks; B) water bath for temperature control; C) effluent filtered; D) conductivity of the effluent.
A B
C D

INVENT2 Final Report (Public)
9
3.1.2. Results Table 3 shows the ultimate analysis and
Table 4 shows the ash composition of the washed biomass streams.
Table 3 Ultimate analysis of the washed biomass streams (dry basis).
C H N O Ash
wt% wt% wt% wt% wt%
Road-side grass 42,1 5,7 1,7 40,2 10,4
FVG waste 26,6 3,3 0,7 22,9 51,0
Miscanthus 45,6 6,1 0,2 44,0 2,1
Chicken manure 40,0 5,5 3,9 39,8 16,1
Waste from forest
and landscaping 47,6 6,0 0,3 45,7 1,4
Table 4 Details on ash composition from the washed biomass streams (dry basis).
Cl Ca K Mg Na P S Si
mg/kg mg/kg mg/kg mg/kg mg/kg mg/kg mg/kg mg/kg
Road-side grass 1280 8301 5362 1199 653 1878 1336 32413
FVG waste 434 19331 6177 2517 2241 1068 1051 186903
Miscanthus 275 1262 1976 281 222 146 303 6169
Chicken manure 1402 35060 11673 5562 1631 10535 4780 9358
Waste from forest
and landscaping
105 4901 1380 456 151 356 287 144
Based on these analysis results and on the mass yields obtained after washing a full material balance can be compiled for the different washed biomass streams. Figure 4 shows the yields of C, H and O as well as the total mass for the different materials.
It can be seen that the mass losses during washing of miscanthus and waste from forest and landscaping are very low. The total mass yield is around 99%. On the other hand, around 35 wt.% of the dry matter is washed away from FVG waste and chicken manure. This washed dry matter consists of organics as well as inorganics (mineral matter). All the elements are removed at similar proportions though it seems that O is removed to a lesser extent. This is especially evident for road-side grass and chicken manure.
Figure 5 shows the material balances in terms of inorganics for the different biomass streams. About 40% of the ash present in the road-side grass as well as chicken manure is washed away. This value drops to about 30% for the FVG waste. In the case of miscanthus only about 10% of the ash is removed. Waste from forest and landscaping shows a reduction of about 20% after the washing process.

INVENT2 Final Report (Public)
10
Figure 4 Yields of the washed biomass streams (WFL is waste from forest and landscaping).
Figure 5 Fraction of ash elements removed with washing (WFL as waste from forest and landscaping).
Note: Only the elements that are present in substantial amounts in the fresh material (> 400 mg/kg) are presented.
For all streams, Cl is the element removed in the largest extent followed by K (the exception is waste from forest and landscaping but this is due to the low value of Cl present in this stream, < 150 mg/kg). More than 80% of the Cl and more than 60% of the K present in the original biomass is removed. This occurs to all streams with the exception of miscanthus where the removed fractions are lower (60% and 45%, respectively). Na and S are also removed in substantial amounts with more than 50% removal for all biomass streams tested with the exception of miscanthus. Although Si is present in large amounts in all the tested feedstocks it is the least affected one, among those presented in Figure 5, by the washing. In the case of waste from forest and landscaping only the K is affected by the washing. The calorific values of both the original and washed biomass streams are assessed according to the Milne equation (Equation 1) which takes into account the mass fraction on dry basis of the different elements. The results are presented in Figure 6.
Equation 1 : 𝑯𝑯𝑽 = 𝟎. 𝟑𝟒𝟏𝑪 + 𝟏. 𝟑𝟐𝟐𝑯− 𝟎. 𝟏𝟐𝑶 − 𝟎. 𝟏𝟐𝑵 + 𝟎. 𝟎𝟔𝟖𝟔𝟖𝑺 − 𝟎. 𝟎𝟏𝟓𝟑𝒂𝒔𝒉
The washing step does not improve the calorific value of the biomass streams. Even though about 35% of the dry matter is washed away in the case of FVG and chicken manure, the calorific value does not decrease. This occurs because C, H and O are removed to a similar extent. This figure also shows that the FVG has a very low calorific value (around 9 MJ/kg) due to the high content of inorganics (around 50 wt.%).

INVENT2 Final Report (Public)
11
Figure 6 Calorific values for fresh and washed biomass streams (WFL as waste from forest and landscaping).
3.2. Lab-scale torrefaction tests The bench-scale torrefaction tests were performed in a fixed-bed batch reactor, displayed in Figure 7. The reactor consists of a vertical cylinder with an internal diameter of 16 cm and an effective length of 100 cm. The feedstock is positioned in three zones which are separated by perforated plates.
Figure 7 Batch torrefaction reactor.
There are three thermocouples per section, and the reactor is heated through two independent trace-heaters at the reactor outer surface to get the reactor at temperature and minimize heat losses during experiments, while direct heating takes place using preheated nitrogen fed through the bottom of the
reactor. The temperature program was as follows: increase of 15°C per minute from room temperature
to 200°C at which point starts the torrefaction time (45 min); increase temperature to the desired
torrefaction temperature. The final temperatures used varied between 240°C and 280°C, in order to
reach the desired mass yields, 70-80 wt.%. The final mass yields were measured and compared.
In order to produce sufficient amounts of the various washed biomass streams for the batch torrefaction tests, batches of biomass were washed in an industrial washing machine according to the final recipe explored in the small-scale washing tests described in section 3.1.2. All the materials used
were pre-dried at 60-65°C until the moisture content was below 5 wt.%. The batch torrefaction results
together with those from TGA tests are shown in the following figures. When possible, tests in the batch reactor were also performed with the original biomass (unwashed).

INVENT2 Final Report (Public)
12
Figure 8 Comparison between the mass yields obtained during the batch reactor and TGA test experiments (45
minutes after the sample reached 200°C) for road-side grass, on dry ash free (daf) basis.
Figure 9 Comparison between the mass yields obtained during the batch reactor and TGA test experiments (45
minutes after the sample reached 200°C) for FVG waste, on dry ash free (daf) basis.
Figure 10 Comparison between the mass yields obtained during the batch reactor and TGA test experiments (45
minutes after the sample reached 200°C) for miscanthus, on dry ash free (daf) basis.

INVENT2 Final Report (Public)
13
Figure 11 Comparison between the mass yields obtained during the batch reactor and TGA test experiments (45
minutes after the sample reached 200°C) for chicken manure, on dry ash free (daf) basis.
Figure 12 Comparison between the mass yields obtained during the batch reactor and TGA test experiments (45
minutes after the sample reached 200°C) for waste from forest and landscaping, on dry ash free (daf) basis.
During the batch tests higher mass yields (lower mass losses) were obtained at the same temperatures compared with TGA. This is seen for both original and washed samples. Two effects contributed to this phenomenon. Firstly, in the TGA the set point temperature is the real temperature in contact with the sample. In the batch reactor the sample reaches slightly lower temperatures than the set point temperature. Secondly, in the TGA smaller particle sizes were used (< 0.25 mm) therefore the process is kinetically controlled contrary to what occurs in the batch reactor, where diffusional limitations control the rate of the torrefaction process. Both phenomena lead to slightly lower degrees of torrefaction in the batch reactor and consequently to higher mass yields.
The largest differences in the mass yields between the TGA and batch results were obtained in the case of the chicken manure and FVG waste. This occurs due to the larger difference in particle size used in the TGA and batch reactor. The chicken manure had to be pelletized before the batch test experiments since it contained a significant fraction of fine particles that would have caused a large pressure drop in the reactor through the fixed bed. The FVG was composed of big lumps of agglomerated material, up to 5 cm of diameter.
In the batch reactor tests the same difference in the mass yields between the washed and the original samples were observed for both the FVG and road-side grass and again almost no difference was verified with the miscanthus and waste from forest and landscaping, which is in good agreement with the TGA results. This shows that the TGA can provide a good indication about torrefaction. The results obtained in the batch reactor tests can be used further for optimizing an industrial scale process.
The optimum mass yield (70-80 wt.%) was obtained at different temperatures depending on the materials tested. For the washed miscanthus, the optimum temperatures were found between 270-

INVENT2 Final Report (Public)
14
290°C, for washed chicken manure between 260-280°C, for washed road-side grass between 265-
280°C and for washed FVG waste above 280°C. For the original materials, the optimum temperatures
could be between 5-10°C lower, depending on the material. This temperature difference, as well as
the organics lost during washing must be considered and correctly evaluated when performing an economical evaluation of the process. The summary of the mass yield values can be observed in Table 5.
Table 5 Mass yields obtained in the TGA and batch torrefaction tests (wt.% on dry ash free basis, daf).
Mass Yields
wt.% (daf)
TGA (°C) Batch reactor (°C)
220 240 260 280 300 240 260 280
Road-side grass
Original 89.0 80.3 69.4 50.7 41.4 X 79.5 X
Washed 94.0 87.2 77.0 63.1 43.4 93.9 84.0 74.1
FVG waste
Original 91.6 85.8 74.7 63.9 53.8 X 86.5 X
Washed 92.6 87.0 79.1 68.5 56.5 X 89.7 82.5
Miscanthus
Original 89.8 X 75.6 X X X X X
Washed 94.0 87.3 77.6 64.8 47.1 94.2 86.0 76.9
Chicken manure
Original 95.7 90.2 80.8 67.6 47.1 93.6 87.4 78.2
Washed 81.2 73.1 63.7 51.9 45.9 X X X
Waste from forest and
landscaping
Original 89.2 81.5 71.6 60.6 47.6 X 82.4 72.8
Washed 64.6 X 50.3 X X X X X
3.3. Global Mass Balances The different torrefied washed biomass samples were analyzed at ECN facilities. Based on these analyses and on the mass yields obtained after the different treatments a full material balance could be compiled for the different biomass streams. The following figures show the results. Since the effect of the washing was discussed previously in section 3.1. only the torrefaction will be discussed in this section. It should also be pointed out that the torrefaction tests were performed with the pre-washed material.
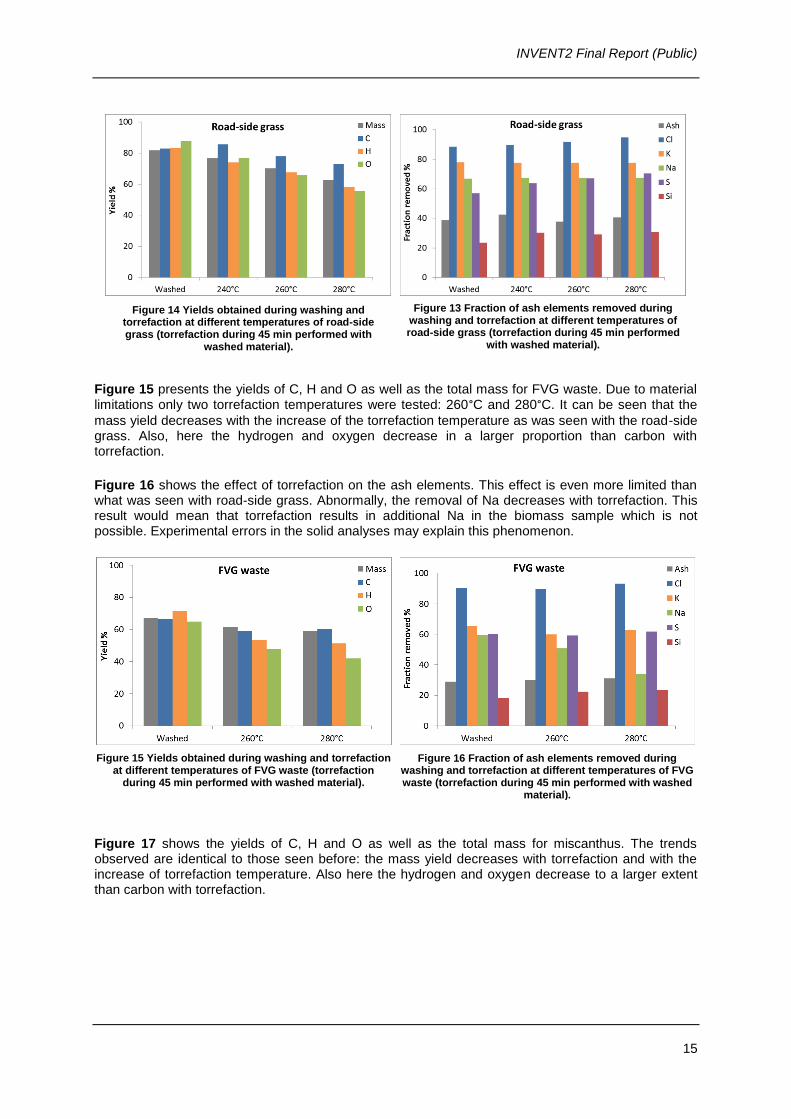
Figure 14 shows the yields of C, H and O as well as the total mass for road-side grass. It can be seen that the mass yield decreases with increasing torrefaction temperature. This is an expected result since the increase of torrefaction temperature leads to the release of more volatiles. It can also be
seen that hydrogen and oxygen decrease to a larger extent than carbon. This is evident at 240°C but
occurs throughout the temperature spectrum studied.
Figure 13 shows the effect of torrefaction on the ash elements. This effect is rather limited though a small increase of Cl and S removal can be noted with the increase of torrefaction temperature.
INVENT2 Final Report (Public)
15
Figure 15 presents the yields of C, H and O as well as the total mass for FVG waste. Due to material limitations only two torrefaction temperatures were tested: 260°C and 280°C. It can be seen that the
mass yield decreases with the increase of the torrefaction temperature as was seen with the road-side grass. Also, here the hydrogen and oxygen decrease in a larger proportion than carbon with torrefaction.
Figure 16 shows the effect of torrefaction on the ash elements. This effect is even more limited than what was seen with road-side grass. Abnormally, the removal of Na decreases with torrefaction. This result would mean that torrefaction results in additional Na in the biomass sample which is not possible. Experimental errors in the solid analyses may explain this phenomenon.
Figure 17 shows the yields of C, H and O as well as the total mass for miscanthus. The trends observed are identical to those seen before: the mass yield decreases with torrefaction and with the increase of torrefaction temperature. Also here the hydrogen and oxygen decrease to a larger extent than carbon with torrefaction.
Figure 15 Yields obtained during washing and torrefaction at different temperatures of FVG waste (torrefaction
during 45 min performed with washed material).
Figure 14 Yields obtained during washing and torrefaction at different temperatures of road-side grass (torrefaction during 45 min performed with
washed material).
Figure 16 Fraction of ash elements removed during washing and torrefaction at different temperatures of FVG waste (torrefaction during 45 min performed with washed
material).
Figure 13 Fraction of ash elements removed during washing and torrefaction at different temperatures of road-side grass (torrefaction during 45 min performed
with washed material).

INVENT2 Final Report (Public)
16
Figure 18 shows the effect of torrefaction on the ash elements. It can be seen that the removal of Cl and S increases with torrefaction and the increase of torrefaction temperature. This same tendency was observed with road-side grass though it was not that evident. For the other elements the effect is limited. Na does not show any significant value due to its very low value in the original miscanthus, around 190 mg/kg.
Figure 19 shows the yields of C, H and O as well as the total mass for chicken manure. Due to material limitations only two torrefaction temperatures were tested: 260°C and 280°C. The trends here observed are identical to those seen before: the mass yield decreases with torrefaction and with the increase of torrefaction temperature. Also here the hydrogen and oxygen decrease to a larger extent than carbon with torrefaction.
Figure 20 shows the effect of torrefaction on the ash elements. The effect is also very limited with the exception of S removal which increases with torrefaction. This same trend of S removal was noticed with miscanthus.
One of the benefits of torrefatcion as pre-treatment is the increase of the energy content of the biomass. Figure 21 shows the effect of torrefaction (as well as washing) on the calorific value which was calculated according to Equation 1 (Milne equation).
It can be seen that torrefaction increases the energy density of all materials with the exception of FVG waste which does not show any trend. This increase is evident with road-side grass and miscanthus
Figure 19 Yields obtained during washing and torrefaction at different temperatures of chicken manure (torrefaction
during 45 min performed with washed material).20
Figure 20 Fraction of ash elements removed during washing and torrefaction at different temperatures of
chicken manure (torrefaction during 45 min performed with washed material).
Figure 18 Fraction of ash elements removed during washing and torrefaction at different temperatures of
miscanthus (torrefaction during 45 min performed with washed material).
Figure 17 Yields obtained during washing and torrefaction at different temperatures of miscanthus (torrefaction during 45 min performed with washed
material).

INVENT2 Final Report (Public)
17
where already at 240°C there is an evident upgrading in terms of energy content. However, in this
analysis the mass yields after the treatments should be taken into account.
Figure 21 Calorific values of the biomass streams after washing and torrefaction (torrefaction during 45 min performed
with washed material; WFL is waste from forest and landscaping).
3.4. Testing with SRF
3.4.1. Washing tests with raw and torrefied SRF (ECN) SRF, delivered by Torr-coal, was also tested in this small-scale study. Figure 23 shows the results. Only the effect of washing time at 50°C was studied. The removal of K varies though it occurs at higher levels than Cl. Since no effect was seen on the removal of Cl it was concluded that washing of SRF prior to torrefaction does not make sense. This result is completely different from the other biomass streams where Cl was always removed at higher levels than K (with the exception of waste from forest and landscaping but this was due to the low value of Cl present in this stream, < 150 mg/kg). This indicates that the Cl present in SRF is not easily accessible to the washing medium. SRF
torrefied at 300°C was also studied to analyze the effect of torrefaction on the washing properties. The
results are presented in Figure 22.
Figure 22 clearly shows that the removal of Cl improves with torrefaction. The Cl, which is not easily accessible to the washing medium, after torrefaction it becomes available and washable. It should also be pointed out that the Cl present in the SRF partially devolatilizes during the torrefaction process as can be seen in the tables below. Both SRF samples were analyzed at the ECN facilities. Table 6 shows the ultimate composition and Table 7 shows the detailed ash composition. These are the original (unwashed) materials.
Figure 23 Cl and K removed from the washing of SRF as function of washing time at 50°C and L/S of 11.
Figure 22 Cl removed during washing of raw SRF and torrefied SRF (torrefaction at 300°C) at 50°C with L/S
of 11.

INVENT2 Final Report (Public)
18
Table 6 Ultimate analysis of raw SRF and torrefied at 300°C SRF (dry basis).
C H N O Ash
wt% wt% wt% wt% wt%
SRF “raw” 55,9 7,4 0,9 29,2 8,1
SRF 300°C 57,4 6,0 0,9 23,6 13,6
Table 7 Details on ash composition from the different unwashed biomass streams (dry basis).
Cl Ca K Mg Na P S Si
mg/kg mg/kg mg/kg mg/kg mg/kg mg/kg mg/kg mg/kg
SRF “raw” 11989 16819 1035 989 364 498 1160 7949
SRF 300°C 3098 26218 1907 1701 736 819 910 15695
3.4.2. Washing tests with torrefied SRF (Torr-Coal) As was shown in Table 7, chlorine and sulphur, which are present in the feedstock, stay partly in the solid product after torrefaction. End-users of torrefied material request a product low in chlorine and sulphur content. Experiments done in the past, showed that about 85% of the chlorine that is present in the torrefied product is bound inorganically (anion: Cl-). This would mean that this chlorine can be removed from the product by washing with water. In terms of sulphur, it is not known which part of the sulphur present in the torrefied product is bound inorganically (anion sulphate: SO42-) and by that how much of the sulphur present can be removed from the product by washing with water. Also, CaSO4 and BaSO4 show low solubility in water. Before removing chlorine and sulphur from the torrefied material, this material must be pulverized to a particle size of < 3 mm. Experiments have shown that a crushing roller mill is the most suitable equipment for this. Parts which are larger than 3 mm must be removed by sieving (vibrating, shaker sieve) after passing the crushing roller mill. Processing 4,000 kg/h of torrefied material would need about 75 kW installed electrical power for the crushing roller mill and sieve. Total investment for this crushing roller mill (second-hand obtained), sieve, necessary platforms and installation amounts to about 180 k€. The fraction larger than 3 mm which is removed by sieving consists mainly of material, that has not been torrefied in a proper way and does not have the right product properties. For this reason this fraction should not belong to the final torrefied product. The fraction which passes the sieve (particle size < 3 mm) has been torrefied in a proper way and can be used for the next washing process steps. In 2015-2016 laboratory scale tests showed how the product cleaning can be done in the most effective way. The washing/cleaning process with hot water (about 70°C) on laboratory scale
consisted of two process steps:
• soaking process (solid dry material : soaking water = 1 : 2 ; soaking time 30 min)
• counterflow washing process (3 times rinse; solid dry material : clean rinsing water = 1 : 1).
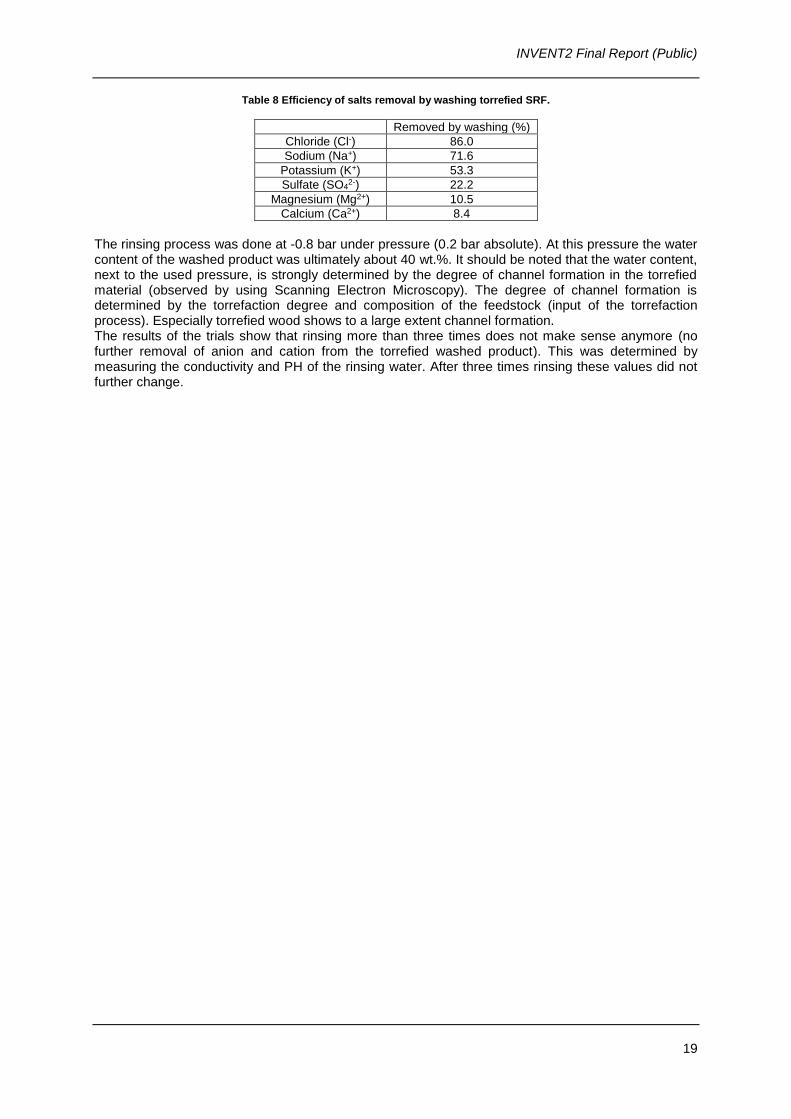
The results obtained after a series of washing experiments are presented in Table 8.
INVENT2 Final Report (Public)
19
Table 8 Efficiency of salts removal by washing torrefied SRF.
Removed by washing (%)
Chloride (Cl-) 86.0
Sodium (Na+) 71.6
Potassium (K+) 53.3
Sulfate (SO42-) 22.2
Magnesium (Mg2+) 10.5
Calcium (Ca2+) 8.4
The rinsing process was done at -0.8 bar under pressure (0.2 bar absolute). At this pressure the water content of the washed product was ultimately about 40 wt.%. It should be noted that the water content, next to the used pressure, is strongly determined by the degree of channel formation in the torrefied material (observed by using Scanning Electron Microscopy). The degree of channel formation is determined by the torrefaction degree and composition of the feedstock (input of the torrefaction process). Especially torrefied wood shows to a large extent channel formation. The results of the trials show that rinsing more than three times does not make sense anymore (no further removal of anion and cation from the torrefied washed product). This was determined by measuring the conductivity and PH of the rinsing water. After three times rinsing these values did not further change.

INVENT2 Final Report (Public)
20
4. Pilot scale testing Three feedstocks were chosen to be pre-washed and torrefied on pilot scale based on their availability, type of feedstock and lab-scale results. These feedstocks were miscanthus, wheat straw and road-side grass. In this chapter, the processing steps of the feedstocks are described to convert them from low-value waste streams to clean solid biofuels. The processing steps include pre-washing, drying, chopping, pelleting and torrefaction.
4.1. Materials Miscanthus was obtained from project partner Biolake, wheat straw was purchased from J.P. Bruntink (Sint Pancras) and road-side grass was obtained from Jan van Bodegom B.V. (Wieringermeer). The different feedstocks are shown in Figure 24 as received.
Figure 24 Biomass feedstocks tested on pilot scale. (A) wheat straw, (B) road-side grass, (C) miscanthus.
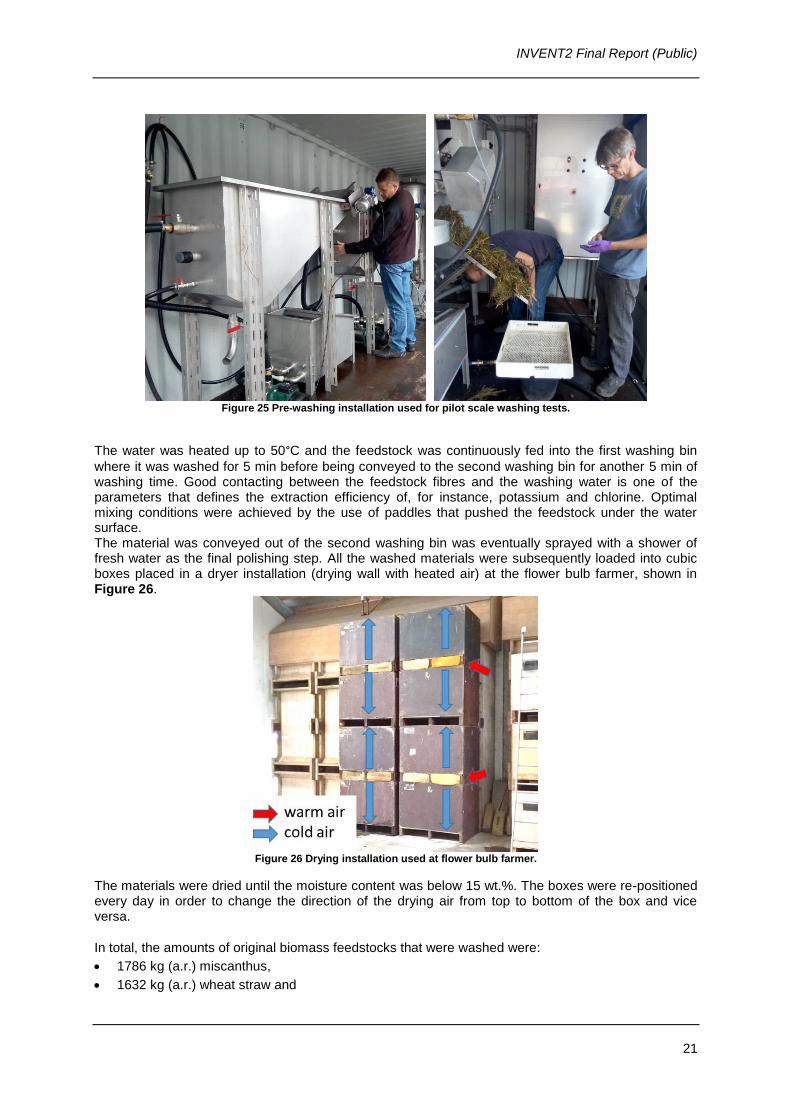
4.2. Pre-washing and drying Preliminary pre-washing tests were performed on location at a flower bulb farmer in Burgerbrug, The Netherlands (Rotteveel B.V.) who owns a flower bulb processing installation. These tests provided the optimal parameters which were applied on washing tests performed with a mobile pilot washing unit located at ECN (Figure 25). This installation was built by Kees v/d Vecht rvs Apparatenbouw B.V. and is situated inside a container. It consists of two washing bins in sequence.
A B
C
INVENT2 Final Report (Public)
21
Figure 25 Pre-washing installation used for pilot scale washing tests.
The water was heated up to 50°C and the feedstock was continuously fed into the first washing bin
where it was washed for 5 min before being conveyed to the second washing bin for another 5 min of washing time. Good contacting between the feedstock fibres and the washing water is one of the parameters that defines the extraction efficiency of, for instance, potassium and chlorine. Optimal mixing conditions were achieved by the use of paddles that pushed the feedstock under the water surface. The material was conveyed out of the second washing bin was eventually sprayed with a shower of fresh water as the final polishing step. All the washed materials were subsequently loaded into cubic boxes placed in a dryer installation (drying wall with heated air) at the flower bulb farmer, shown in Figure 26.
Figure 26 Drying installation used at flower bulb farmer.
The materials were dried until the moisture content was below 15 wt.%. The boxes were re-positioned every day in order to change the direction of the drying air from top to bottom of the box and vice versa.
In total, the amounts of original biomass feedstocks that were washed were:
• 1786 kg (a.r.) miscanthus,
• 1632 kg (a.r.) wheat straw and

INVENT2 Final Report (Public)
22
• 4015 kg (a.r.) road-side grass
The washed and dried materials are shown in Figure 27.
Figure 27 Pictures of the washed materials: wheat straw, miscanthus and road side grass.
4.3. Pelleting The feedstocks were pelleted in order to increase their bulk density and therewith to overcome possible feeding and handling issues in the torrefaction pilot plant which operates in a moving bed mode. Straw and road-side grass were first chopped to be able to be handled at the pelleting company. Feed Design Lab in Wanssum (https://www.feeddesignlab.nl/) first ground the straw using a hammer mill and a 1.5 mm screen and pelleted the ground straw using a 5x60 mm pellet die. In total about 720 kg of straw pellets was produced. Because pellets were already a challenge for the pilot torrefaction plant, designed for wood chips, small pellets with 5 mm diameter, like the straw pellets were even more difficult to handle. Therefore the other materials were pelleted at a different company. Yilkins in Ruurlo (http://yilkins.com/) pelleted the miscanthus and road-side grass using a 6x30 mm pellet die. In total about 400 kg of miscanthus pellets and 340 kg of grass pellets was produced. The pellets produced at Feed Design Lab and at Yilkins are shown in Figure 28.
Figure 28 Pictures of the pelleted materials: wheat straw, miscanthus and road side grass.
The pellets were characterized in terms of bulk density and durability (PDI). The results are shown in Table 9.
Table 9 Properties of the as received pellets for the torrefaction treatment.
Pellet properties Wheat straw Miscanthus Road side grass
Bulk density (kg/m3) 642 626 657
PDI (%) 99.4 95.0 90.8
Moisture content (%) 11.1 2.5 8.7
4.4. Torrefaction testing (ECN) The received pellets have been dried before the torrefaction treatment, by blowing hot air through the cubic boxes containing the pellets. This way the moisture content has been reduced from 11 to 6% for straw pellets and 8.7 to 6.3% for the grass pellets. The moisture content of the miscanthus pellets was between 2 and 3% all the time. This pre-drying step was to prevent any clogging caused by steam

INVENT2 Final Report (Public)
23
condensation on the cold pellets entering the reactor, which was the case in previous torrefaction tests using triticale pellets. After pre-drying, the three pelleted feedstocks were torrefied in the 50 kg/h pilot plant at the ECN testing facilities. The torrefaction pilot plant consists of three main sections each occupying one floor in a three-story building. These sections are: (1) the feeding and drying section, (2) the torrefaction section and (3) the torrefied product collection section, which can all be seen in Figure 29.
Figure 29 Torrefaction pilot plant at ECN. Top: Feeding and drying section, Middle: Torrefaction reactor, Bottom: Product collection.
The feedstock to be tested is loaded in cubic boxes which are hoisted by a crane to the top floor of the pilot facility where they are tipped onto a belt conveyor. The top part of the drying section has a sluicing system which allows batches of ingoing feedstock to be flushed with nitrogen before being released into the drying unit. All operating conditions are selected based on the moisture content and
the desired torrefaction recipe for the selected feedstock. The biomass is heated up to 150-200°C in
the drying section.
Subsequently, the dried biomass enters the torrefaction section of the pilot plant reactor. The
feedstock is heated directly by a recycled torrefaction gas stream at a temperature of 250-340°C so
that the torrefied biomass can reach a temperature of 240-320°C at the bottom of the reactor. The
produced torrefaction gas is burnt in a combustor and the flue gas is vented to the stack. The torrefied material is extracted from the bottom of the reactor with a shredder and via screw conveyors it is transported and stored in metal storage vessels situated on the ground floor, where it is allowed to cool down under a nitrogen purge. The solids residence time during torrefaction is regulated by the frequency controller of the shredder at the bottom of the reactor.
The torrefaction temperature has been determined to be 230°C, based on small scale test results and
the relatively long residence time in the reactor, due to the much higher density of these feedstocks compared to regular woodchips the reactor is designed for. The 679 kg of straw pellets with an average moisture content of 6 wt.% were fed with an average speed of 47 kg/h. Because of some disturbances during the production run, the longer residence time

INVENT2 Final Report (Public)
24
and the relatively large mass loss only 330 kg of torrefied pellets has been collected, with a mass yield of 65%. The 399 kg of miscanthus pellets with an average moisture content of 2.7% have been fed at a speed of 45 kg/h and 325 kg of torrefied pellets has been collected with a mass yield of 86%. The 334 kg of grass pellets with an average moisture content of 6.3% have been fed at a speed of 48.5 kg/h and 215 kg of torrefied pellets has been collected with a mass yield of 68%. The torrefied pellets are shown in Figure 30.
Figure 30 Pictures of the torrefied pellets. From left to right: straw, miscanthus, road-side grass.
All materials: original, pre-washed and torrefied were analyzed on ultimate composition and ash composition. The results are shown in Table 10 for wheat straw, road-side grass and miscanthus.
Table 10 Proximate, ultimate and ash composition of the original, pre-washed and prewashed/torrefied biomasses
tested on pilot scale – wheat straw, road-side grass and miscanthus.
After the pretreatments, it is possible to observe that the ash content tends to decrease for the biomasses with high ash content (straw and grass) and to increase slightly for the low ash content biomass (miscanthus). The volatile content decreased and the heating value increased after torrefaction as expected, due to the increased content in C and decreased content in O, while washing
(Dry basis)Original Washed Torrefied Original Washed Torrefied
Ash (550) (% 10.3 10.2 9.3 3.4 4.8 4Volatiles (%) 71.8 74 70.9 74.5 74.7 69.2HHV (MJ/kg) 17.5 17.7 19.2 19.9 20.0 21.5
Cl (mg/kg) 2800 790 540 100 130 88C (%) 42.9 42.9 47.7 49.4 49.9 54.3H (%) 5.6 5.6 5.5 5.8 5.9 5.6N (%) 0.4 0.4 0.4 0.4 0.4 0.4O (%) 38.6 40.2 35.9 40.2 41.3 36.2
Al (mg/kg) 45 120 180 470 560 580As (mg/kg) < 1 < 1 < 1 < 1 < 1 < 1
B (mg/kg) 1.8 1.3 2 12 11 11Ba (mg/kg) 7.3 2.5 6.8 220 220 250Ca (mg/kg) 2800 3600 3800 11000 12000 14000Cd (mg/kg) 0.14 0.13 0.14 0.36 0.37 0.41Co (mg/kg) < 0.3 < 0.3 < 0.3 0.65 0.49 0.43Cr (mg/kg) 1.8 1.6 4.8 3.4 2.1 1.7Cu (mg/kg) < 2 2.7 3.1 3.7 4.3 14Fe (mg/kg) 140 150 250 280 340 370
K (mg/kg) 8400 3100 3400 2000 1000 1000Li (mg/kg) < 0.3 < 0.3 < 0.3 < 0.3 < 0.3 < 0.3
Mg (mg/kg) 560 540 560 810 790 850Mn (mg/kg) 17 15 42 650 620 680Mo (mg/kg) 1.3 < 0.8 < 0.8 < 0.8 < 0.8 < 0.8Na (mg/kg) 140 410 440 160 430 500Ni (mg/kg) 1.3 0.79 1 2.6 1.8 1.9P (mg/kg) 830 640 610 510 440 430
Pb (mg/kg) < 0.6 0.62 < 0.6 < 0.6 0.7 1.6S (mg/kg) 820 600 520 330 340 310
Sb (mg/kg) < 3 < 3 < 3 < 3 < 3 < 3Se (mg/kg) < 1 < 1 < 1 < 1 < 1 < 1Si (mg/kg) 36000 38000 34000 1900 3800 2300
Sn (mg/kg) < 0.9 < 0.9 < 0.9 < 0.9 < 0.9 < 0.9Sr (mg/kg) 11 20 23 44 46 55Ti (mg/kg) 50 60 41 90 94 87V (mg/kg) < 0.2 < 0.2 0.3 0.39 0.78 0.45
W (mg/kg) < 1 < 1 < 1 1.3 1.6 1.7Zn (mg/kg) 6.4 25 29 140 160 170Hg (mg/kg) 0.0067 0.0074 <0.002 0.033 0.034 0.0075
Wheat straw Spruce bark(Dry basis)Original Washed Torrefied Original Washed Torrefied
Ash (550) (% 18.1 14.2 14.8 2.1 2.4 3.1Volatiles (%) 66.1 72.1 61.5 81.7 82.5 75.7HHV (MJ/kg) 16.5 17.3 20 19.3 19.2 20.4
Cl (mg/kg) 9500 2000 1300 1300 550 420C (%) 41.4 43.1 49.9 47.7 47.3 50.1H (%) 5.3 5.6 5.3 5.9 5.9 5.6N (%) 1.8 1.4 1.7 0.3 0.25 0.25O (%) 35.4 37.4 30.7 43.3 43.4 38.9
Al (mg/kg) 1700 2000 1400 79 71 160As (mg/kg) 1.5 < 1 < 1 < 1 < 1 < 1
B (mg/kg) 40 15 15 1.9 < 0.7 < 0.7Ba (mg/kg) 25 29 33 8.2 1.5 4.4Ca (mg/kg) 18000 11000 13000 1000 1100 1700Cd (mg/kg) 0.12 0.13 0.15 < 0.1 < 0.1 0.11Co (mg/kg) 0.44 0.46 < 0.3 < 0.3 < 0.3 < 0.3Cr (mg/kg) 3.9 6.3 11 1.4 1.4 2.4Cu (mg/kg) 4.7 7 9.1 < 2 2.4 3.9Fe (mg/kg) 1800 1500 1400 160 230 330
K (mg/kg) 17000 4600 4400 2300 1200 1800Li (mg/kg) 1.1 1.1 0.87 < 0.3 < 0.3 < 0.3
Mg (mg/kg) 2000 1100 1600 360 320 420Mn (mg/kg) 130 160 140 22 11 15Mo (mg/kg) 1.8 2.1 2.6 < 0.8 < 0.8 < 0.8Na (mg/kg) 1600 1000 1000 260 390 470Ni (mg/kg) 2 2.9 3.7 0.66 0.74 < 0.6P (mg/kg) 4000 1600 2200 220 150 250
Pb (mg/kg) 3.3 2.7 1.9 < 0.6 < 0.6 < 0.6S (mg/kg) 3400 1700 1400 480 310 360
Sb (mg/kg) < 3 < 3 < 3 < 3 < 3 < 3Se (mg/kg) < 1 < 1 < 1 < 1 < 1 < 1Si (mg/kg) 45000 54000 46000 6500 9400 14000
Sn (mg/kg) 1.5 < 0.9 < 0.9 < 0.9 < 0.9 < 0.9Sr (mg/kg) 91 51 55 5.3 6.6 10Ti (mg/kg) 230 250 220 50 40 18V (mg/kg) 3 2.4 1.9 < 0.2 < 0.2 0.35
W (mg/kg) < 1 < 1 < 1 < 1 < 1 < 1Zn (mg/kg) 39 70 78 9.1 24 50Hg (mg/kg) 0.011 0.015 <0.002 0.0023 <0.002 0.0024
Road-side grass Miscanthus
INVENT2 Final Report (Public)
25
didn’t affect these values significantly. The Cl and the S contents decreased significantly after washing and slightly after torrefaction. The P and K decreased after washing but were not significantly affected by torrefaction. The Na content of these biomasses was low (< 300 mg/kg) and after washing it increased slightly, most probably due to a higher Na content in the tap water. The exception was the grass, which originally had a higher Na content (1600 mg/kg) and after washing it decreased to 1000 mg/kg at which level it remained after torrefaction. The pretreatments didn’t affect the trace elements (heavy metals) contents. The exception was for Hg, for which a decreasing tendency was observed with torrefaction without any major change after the prewash step (see Table 10).
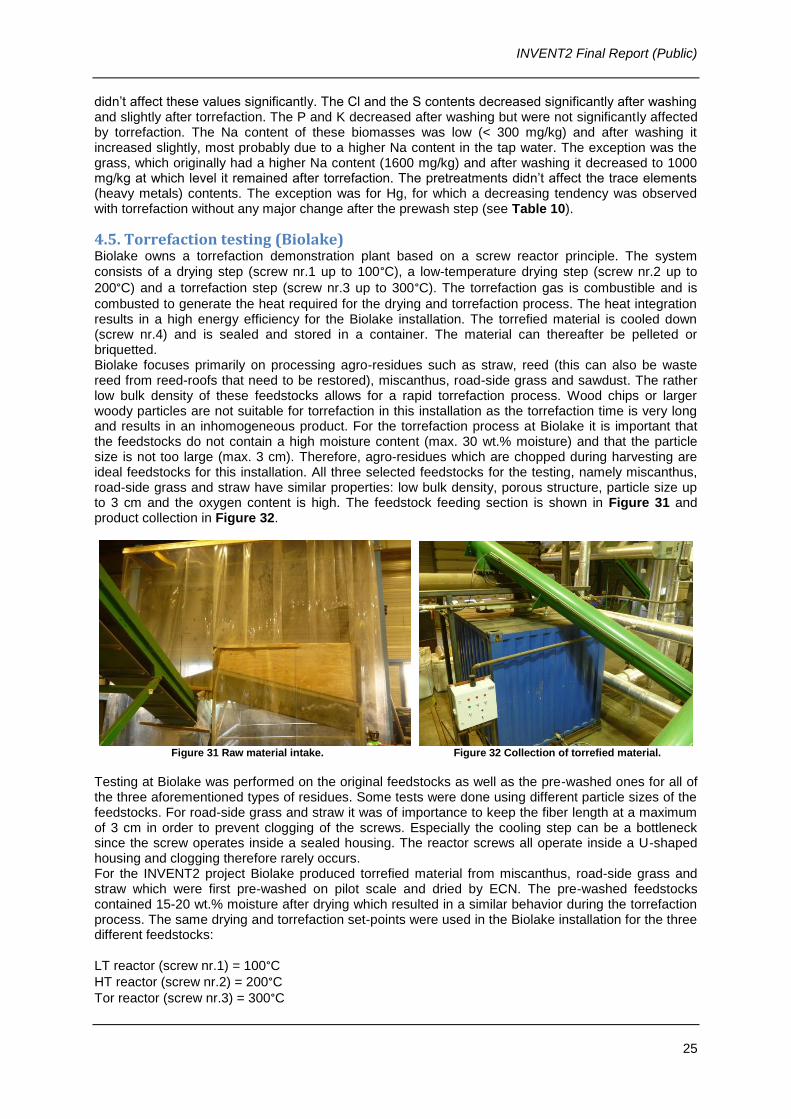
4.5. Torrefaction testing (Biolake) Biolake owns a torrefaction demonstration plant based on a screw reactor principle. The system
consists of a drying step (screw nr.1 up to 100°C), a low-temperature drying step (screw nr.2 up to
200°C) and a torrefaction step (screw nr.3 up to 300°C). The torrefaction gas is combustible and is
combusted to generate the heat required for the drying and torrefaction process. The heat integration results in a high energy efficiency for the Biolake installation. The torrefied material is cooled down (screw nr.4) and is sealed and stored in a container. The material can thereafter be pelleted or briquetted. Biolake focuses primarily on processing agro-residues such as straw, reed (this can also be waste reed from reed-roofs that need to be restored), miscanthus, road-side grass and sawdust. The rather low bulk density of these feedstocks allows for a rapid torrefaction process. Wood chips or larger woody particles are not suitable for torrefaction in this installation as the torrefaction time is very long and results in an inhomogeneous product. For the torrefaction process at Biolake it is important that the feedstocks do not contain a high moisture content (max. 30 wt.% moisture) and that the particle size is not too large (max. 3 cm). Therefore, agro-residues which are chopped during harvesting are ideal feedstocks for this installation. All three selected feedstocks for the testing, namely miscanthus, road-side grass and straw have similar properties: low bulk density, porous structure, particle size up to 3 cm and the oxygen content is high. The feedstock feeding section is shown in Figure 31 and product collection in Figure 32.
Figure 31 Raw material intake. Figure 32 Collection of torrefied material.
Testing at Biolake was performed on the original feedstocks as well as the pre-washed ones for all of the three aforementioned types of residues. Some tests were done using different particle sizes of the feedstocks. For road-side grass and straw it was of importance to keep the fiber length at a maximum of 3 cm in order to prevent clogging of the screws. Especially the cooling step can be a bottleneck since the screw operates inside a sealed housing. The reactor screws all operate inside a U-shaped housing and clogging therefore rarely occurs. For the INVENT2 project Biolake produced torrefied material from miscanthus, road-side grass and straw which were first pre-washed on pilot scale and dried by ECN. The pre-washed feedstocks contained 15-20 wt.% moisture after drying which resulted in a similar behavior during the torrefaction process. The same drying and torrefaction set-points were used in the Biolake installation for the three different feedstocks:
LT reactor (screw nr.1) = 100°C
HT reactor (screw nr.2) = 200°C
Tor reactor (screw nr.3) = 300°C

INVENT2 Final Report (Public)
26
The torrefaction pilot plant has a capacity of 200-250 kg/h of biomass input (140-175 kg/h torrefied biomass output). This is limited by the capacity of the afterburner of the torrefaction off-gases. The flue gas is fed to a fan which distributes the heat back to the torrefaction installation. Because of the afterburner being the limitation for the throughput of the installation, several options were examined in order to increase the capacity of the installation:
• Increase the height of the stack. Nevertheless, this was not a viable option because of the limited height of the building where the installation is situated.
• Additional chimney. Several chimney diameters were tested, but the extra capacity could not be realized.
• Increase the ash output. This resulted in fluctuations during the combustion process because of an unsteady flame.
Therefore, in order to increase the capacity of the installation a new, larger afterburner needs to be installed. Since the height of the building at the current location is limiting, the larger afterburner will have to be installed at a new location. Engineering documents and blueprints for the new afterburner have been completed. Additionally, the piping infrastructure connected to the torrefaction reactor was adjusted at several locations; the direct gas feeding into the HT reactor screw and accompanying valves and piping was removed, which led a much simpler construction and ease of operation.
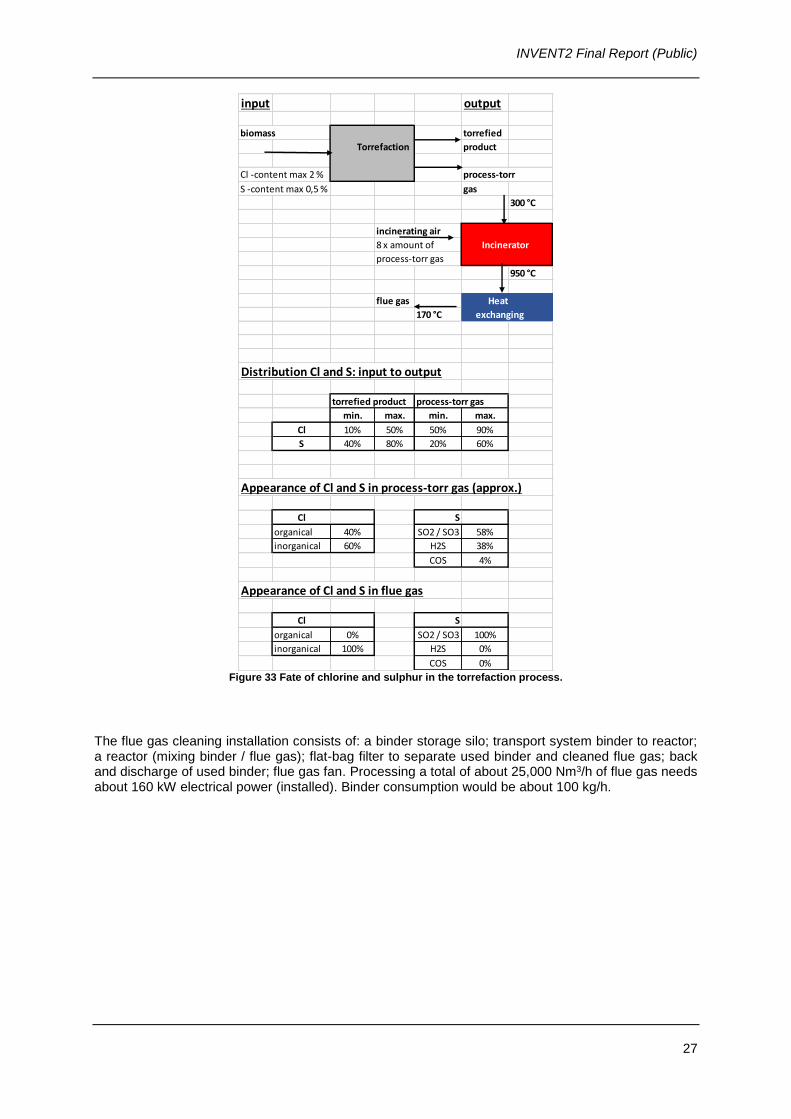
4.6. Torrefaction flue gas cleaning (Torr-Coal) Torrefaction causes part of the chlorine and sulphur contained in the original biomass feedstock to devolatilize. 50-90% of the chlorine and 20-60% of the sulphur in the biomass ends up in the torrefaction gas. Investigations done by ECN (commissioned by Torr-Coal Technology) have shown, that about 40% of the chlorine present in the torrefaction gas is organically bound. The remaining 60% is present as inorganic HCl. Only the inorganic HCl can be removed by utilizing common additives, such as Ca(OH)2 or NaHCO3. However, using this method cannot remove chlorine from the torrefaction gases to a sufficient extent. After burning the torrefaction gas, essentially all chlorine is present in the flue gas as inorganic HCl and can be removed almost completely by using Ca(OH)2 or NaHCO3. The same study also showed that about 58% of the sulphur in the torrefaction gas is present as SO2, 38% as H2S and 4% as COS (carbonyl sulphide). It is possible to remove the first two components from the torrefaction gas by utilizing common additives at temperatures of about 300°C.
The fate of chlorine and sulphur during the torrefaction process is summarized in Figure 33. If the case is considered where chlorine and sulphur are both removed directly from the torrefaction gas, besides the fact that chlorine cannot be removed to a sufficient extent from the torrefaction gas there is another disadvantage. Due to the torrefaction process, this gas contains tars, which may interfere the process for removal of chlorine and sulphur from the gas. The influence of this has not been investigated in detail. Due to these aforementioned considerations and disadvantages, Torr-Coal Technology decided to clean the flue gas (this means gas cleaning after incinerating the torrefaction gas) by adding dry Ca(OH)2 or NaHCO3 to the flue gas at a flue gas temperature of about 170°C. This is proven
technology and has already been applied in many cases. The disadvantage of this choice is the size of the installation (large mass gas flow: 8 x larger than mass flow torrefaction gas) and the risk of corrosion in the installation (heat exchangers) by the presence of HCl and SO2/SO3 (acid dewpoint is
about 145°C).
In other words, this flue gas cleaning installation is, because of its large size, not the cheapest choice, (total investment ca. 850 k€), but technically and in terms of process the most robust one in order to realize the set goals. Figure 34 shows the principle sketch of the flue gas cleaning installation.
INVENT2 Final Report (Public)
27
Figure 33 Fate of chlorine and sulphur in the torrefaction process.
The flue gas cleaning installation consists of: a binder storage silo; transport system binder to reactor; a reactor (mixing binder / flue gas); flat-bag filter to separate used binder and cleaned flue gas; back and discharge of used binder; flue gas fan. Processing a total of about 25,000 Nm3/h of flue gas needs about 160 kW electrical power (installed). Binder consumption would be about 100 kg/h.
input output
biomass torrefied
Torrefaction product
Cl -content max 2 % process-torr
S -content max 0,5 % gas
300 °C
incinerating air
8 x amount of Incinerator
process-torr gas
950 °C
flue gas Heat
170 °C exchanging
Distribution Cl and S: input to output
torrefied product process-torr gas
min. max. min. max.
Cl 10% 50% 50% 90%
S 40% 80% 20% 60%
Appearance of Cl and S in process-torr gas (approx.)
Cl S
organical 40% SO2 / SO3 58%
inorganical 60% H2S 38%
COS 4%
Appearance of Cl and S in flue gas
Cl S
organical 0% SO2 / SO3 100%
inorganical 100% H2S 0%
COS 0%

INVENT2 Final Report (Public)
28
Figure 34 Sketch of flue gas cleaning installation.

INVENT2 Final Report (Public)
29
5. Fuel and system evaluation
5.1. Fuel evaluation (ECN) 5.1.1. Evaluation of emissions, high temperature corrosion and ash melting tendency In this section the results obtained for road-side grass and miscanthus are presented and discussed as examples. The results for the wheat straw lied in between that of the grass and the miscanthus. The potential reduction in the pollutant gaseous emissions through pretreatment can be evaluated by the achieved reduction in the contents of N, S and Cl for the emissions of NOX, SO2 and HCl respectively. The change in the sum of the contents of K, Na, Pb and Zn can also provide an indication related to the aerosol emission impact [1].
In Figure 34 it is possible to observe that with the pretreatment a significant reduction in four gaseous pollutants is expected and especially in the Cl and aerosol emissions from road-side grass. It is also possible to see that the miscanthus is a cleaner fuel, even prior to the pre-treatments. The expected potential reduction in the NOX is about 20% for both fuels after upgrading and about 90 and 70% reduction in the HCl emissions for the grass and miscanthus respectively. For SO2, a reduction of 65 and 30% it is expected for the grass and miscanthus, respectively, while for aerosols a respective decrease of 76 and 15% is expected.
The molar ratio S/Cl is often used to evaluate the risk for Cl-containing deposits on superheaters. Usually with a S/Cl ratio higher than 2 minor corrosion risk is expected. By upgrading the road-side grass and the miscanthus, the risk of corrosion is significantly reduced by a factor of 3 and 2, respectively, as shown in Table 11. This means a reduction from a severe corrosion potential to an acceptable risk. The values presented in Table 11 still indicate that even if the grass and the miscanthus are both pre-washed and torrefied there is a risk for alkali chloride formation, although the amounts will be significantly smaller when compared to untreated materials. For the slagging and fouling evaluation, there are still no widely accepted indexes that could cover the behavior of all the biomass types with a good correlation to actual observations, in the combustion systems. However, as a first indication the indexes proposed in [2] will be used here. In Table 11 it can be seen that with the grass and especially with miscanthus, the slagging index (SI) presents a relatively low value due to the high Si content of the original materials. A SI value < 0.6 already points to a low slagging inclination. The pretreatment improves this value further for both fuels. The fouling index (FI) of both original grass and miscanthus is relatively high (23.3 and 19.2 respectively). Values between 0.6 and 40 means high tendency for sintering. With the pretreatment the FI was significantly reduced to 4 and 6 for the grass and the miscanthus respectively. However, these reduced values are still indicative of significant fouling issues.
[1] P. Sommersacher. T. Brunner and I. Obernberger, Fuel Indexes: A Novel Method for the Evaluation of Relevant
Combustion Properties of New Biomass Fuels, Energy Fuels 26 (1) (2012), 380–390.
[2] M. Pronobis, Evaluation of the influence of biomass co-combustion on boiler furnace slagging by means of fusibility
correlations, Biomass and Bioenergy 28 (2005) 375-383.

INVENT2 Final Report (Public)
30
0
200
400
600
800
1000
1200
Original Washed Torrefied
Road-side grassEmis
sio
ns
ind
ex v
alu
e (m
g/M
J)
N Cl S (K+Na+Zn+Pb)
0
20
40
60
80
100
120
140
160
Original Washed Torrefied
MiscanthusEmis
sio
ns
ind
ex v
alu
e (m
g/M
J)
N Cl S (K+Na+Zn+Pb)
Figure 35 The changes in the emissions fuel indexes obtained during upgrading of road-side grass and miscanthus at pilot scale.
Table 11 The changes in high temperature corrosion (S/Cl, molar) fuel index and slagging (SI) and fouling (FI) fuel
indexes, obtained after upgrading of road-side grass and miscanthus at pilot scale.
Although fuel indexes could present a first view on the expected improved behavior during combustion as a result of the upgrading processes, performing actual combustion testing will be essential to definitely confirm the improved properties of the upgraded fuels.
5.1.2. Grindability For the pilot testing at ECN’s facilities, the feedstock had to be pelleted in order to be handled and processed in the fixed bed pilot reactor. The torrefied product from these tests were not considered to be a representative sample of how the overall process would be in practice. Therefore, the feedstocks were torrefied in the batch reactor at process conditions simulating the pilot tests. The materials were torrefied as received after washing. Thereafter, the materials were pelleted so that representative pellet samples would be obtained for the grindability testing.

INVENT2 Final Report (Public)
31
The three materials that were in pellet form – grass, miscanthus and straw – were subjected to grindability studies and the results on the required specific energy consumption (Em) and the characteristic particle correspondent to 80 wt.% undersize (d80) of the milled material are presented in Table 12. An example of how the parameter d80 was determined is presented in Figure 36. There it is possible to see that the d80 is obtained by intercepting the 0.8 fraction line (black dashed horizontal line) with the respective particle size distribution (PSD) curve lines and reading the corresponding value from the particle size axis. The milling tests showed that among the original materials, the grass was the easiest material to grind exhibiting the lowest specific energy consumption for the same reference size (d80). The miscanthus followed closely and straw was undoubtedly the material that required more energy to be milled.
Table 12 The milling specific energy consumption and the characteristic particle undersize d80 for the three biomasses tested.
Figure 36 The PSD curves obtained for the milled products from the straw pellets, using different bottom sieves (0.25,
0.50, 0.75, 1.0 and 1.5 mm).
In Table 12 it is possible to observe that the upgraded materials required significant less energy to be comminuted to a particular particle size, when compared to the respective original material. However, the specific energy demands follows the same order of materials as the original, being the straw the more demanding and the grass the lower. Moreover, a significant decrease was observed in attrition of the moving parts of the mill as well as a decrease in the final temperature of the mill, while milling the upgraded materials. The data points in Table 12 were used to derive trendline curves representing the specific energy required to achieve any desired undersize particle diameter, characteristic of each fuel pellet. These curves are presented in Figure 37 and Figure 38. The energy demand follows an exponential increase as de comminution diameter is decreased and the differences in the required specific energy

INVENT2 Final Report (Public)
32
for milling the different materials can be well visualized. For instance, if a particle undersize diameter (d80) of 500 μm is desirable to be obtained, the energy requirements are about 299, 107 and 51 MJ/ton (or 83.2, 29.7, 14.3 kWh/ton) for the straw, miscanthus and grass pellets, respectively.
Figure 37 The specific energy consumption (Em) obtained for the three original biomasses tested.
If we consider the upgraded materials and the same required particle undersize (d80 = 500 μm), the energy requirements are significantly lowered to about 106, 45 and 23 MJ/ton (or 29.4, 12.4, 6.5 kWh/ton) for the straw, miscanthus and grass pellets, respectively.
Figure 38 The specific energy consumption (Em) obtained for the three upgraded biomasses tested.
5.1.3. Fine particulates/aerosol formation Fly ash samples that were taken in the LCS with a Pilat Mark V cascade impactor under combustion
conditions with residence time of approximately 2 s were analysed for the particle size distribution, as
shown in Figure 39 through Figure 44. The purpose of these measurements was to investigate the
impact of pre-washing and torrefaction on the formation of sub-micron particles (aerosols) that can
cause fouling and corrosion problems in thermal power plants. The latter is particularly true when the
aerosols are formed by homogenous nucleation of alkali salt vapours in the flue gas. Since large
amounts of alkalis and chlorine are removed during upgrading, it is expected that a significant
reduction in fine particulate matter formation can be observed.

INVENT2 Final Report (Public)
33
Table 13 gives an overview of the achieved fine particulate emission reduction. Sub-micron particles
of wheat straw and road side grass can be reduced by approximately 65% by mass, while the
emissions of miscanthus can even be reduced by approximately 80%. These values are very
promising given that fine particulate fouling problems are a big concern when firing fast growing
biomass. Further analysis of the chemical composition of the individual cascade impactor stage
samples could shed light into the nature of the particulate matter.
Table 13 Reduction of sub-micron particles expressed as mass percentage of initial emissions
Reduction in sub-micron particles, by mass
Wheat straw 66.8%
Miscanthus 78.3%
Road side grass 64.6%
Wheat straw
Figure 39 Particle size distribution of untreated wheat straw fly ash.

INVENT2 Final Report (Public)
34
Figure 40 Particle size distribution of upgraded wheat straw fly ash.
Miscanthus
Figure 41 Particle size distribution of untreated miscanthus fly ash.

INVENT2 Final Report (Public)
35
Figure 42 Particle size distribution of upgraded miscanthus fly ash
Road side grass
Figure 43 Particle size distribution of untreated road side grass fly ash.

INVENT2 Final Report (Public)
36
Figure 44 Particle size distribution of upgraded road side grass fly ash
5.2. Fuel combustion testing in a pellet stove (Biolake) Biolake performed combustion tests with the washed and torrefied miscanthus, straw and road-side grass pellets. The materials were fed to a CS Thermos pellet stove (15 kW) shown in Figure 45 which is normally operating on wood pellets for domestic heating.
Figure 45 CS Thermos pellet stove.
The stove has a rotating combustion chamber which causes the fuel pellets to move vigorously and the produced ash to fall through a grate as shown in Figure 46. From the trials it appeared that the torrefied pellets are too dense to be combusted completely by the electrical arc and a large fraction of unburned material remains in the ashes (Figure 47). When the torrefied pellets are mixed with regular wood pellets then the combustion process runs more smoothly. The high ash content and unburned material in the ash discharge caused the combustion chamber to clog quickly and combustion reactions to proceed in the ash discharge chamber, which created an unsafe situation.

INVENT2 Final Report (Public)
37
Figure 46 Rotating combustion chamber. Figure 47 Ash discharge screw.
The CS Thermos pellet stove is not suitable for burning torrefied pellets. Therefore, the combustion testing ran inefficiently and the stove quickly showed signs of fouling. Additionally, a mixture of torrefied material and wood pellets was combusted in a semi-industrial boiler of 40 kW. This trial gave better results because of the larger combustion chamber and the higher heat requirements. However, the high ash content still affects maintenance. The grate had to be cleaned daily to remove the formed ash layer. The combustion ran more smoothly when non-pelleted torrefied material is used.
Because of system contamination by the use of torrefied pellets only short trials have been conducted and no emission measurements have been performed.
5.3. System evaluation on industrial scale (Torr-Coal)
5.3.1. Washing of torrefied material With the outcome of the laboratory tests an installation has been devised, which would be suitable to clean the torrefied product (removal of anion and cation) on industrial scale (see Figure 48 and Figure 49).

INVENT2 Final Report (Public)
38
Figure 48 Simple block scheme of product cleaning process.
torrefied product
pulverized and sieved hot water (70 ⁰C)
4000 kg/h saltwater
8000 kg/h
mixing
12000 kg/h
overflow saltwater
soaking unit residence time 30 min.
twin screw transport
hot water (70 ⁰C)
12000 kg/h 4000 kg/h
vacuum beltdryer
fresh water
2440 kg/h Condensor
9360 kg/h
saltwater 6640 kg/h
2440 kg/h water vapour
twin screw transport heat medium: steam or thermo-oil
double-walled
4200 kg/h
twin screw transport cooling medium: cold water
double-walled
4200 kg/h torrefied product
desalted

INVENT2 Final Report (Public)
39
Figure 49 Sketch of vacuum belt dryer, as mentioned in Figure 48.
In the first step of the product cleaning process (removal of soluble salts) the torrefied material is mixed with hot water at 70°C at a mass ratio of 1:1 during ca.30 min. During this intensive mixing the present soluble salts dissolve in the water. This process is called soaking. After the soaking process the solid material / hot water mixture is transported to the vacuum belt dryer. At the beginning of this vacuum belt dryer the excess of water is removed from the solid product by using vacuum pressure. Subsequently, a three times counterflow rinsing with hot water takes place. For this part of the process clean hot water is added at the end of the vacuum belt dryer (last rinsing step: one mass part of clean hot water for one mass part of solid dry material). This water is used in counterflow in the two previous rinsing steps and will be polluted more and more by the soluble salts, organic compounds and very small particles of torrefied material. After passing the vacuum belt dryer the water content of the solid desalted product is about 40 wt.%. Next to that, a waste water flow is produced, contaminated with soluble salts, organic compounds and very small particles of torrefied material. The amount of this polluted water flow equals 2.34 times one mass part of dry torrefied solid product (mass mixing ratio of cleaning process: soaking 1:2; rinsing 1:1; moisture content solid product after rinsing equals 40 wt.%; see Figure 48: 9360/4000 = 2.34). The wet product (moisture content about 40 wt.%) must be dried to a water content < 5 wt.%. A conventional technology is used to realize this, namely an indirectly heated twin screw conveyor. The resulting water vapor is discharged, condensed and used again as clean rinsing water. Finally, the torrefied, cleaned and dried product is cooled to about 20°C. As indicated before, the washing water used is contaminated with soluble salts, organic compounds and very small particles of torrefied material. In Table 14 a probable composition of the washing water used is indicated. The values used are based on analysis results of washing torrefied Solid Recovered Fuel (SRF) and 50% of the polluted washing water is being used again for the soaking process without cleaning (see Figure 50).

INVENT2 Final Report (Public)
40
Table 14 composition of the effluent after washing torrefied SRF.
The TOC-value is strongly dependent on the degree of torrefaction of the torrefied particles that are present in the washing water. Additionally, it can be seen, that the inorganic composition of the washing water used looks comparable to the composition of seawater. This indicates that the washing water used will show an extremely corrosive behavior. This will have large consequences concerning the choice of the equipment components for desalting the product and cleaning the polluted washing water. Whether the organic compounds and the very small particles of torrefied material in the washing effluent can have any effect on the downstream process and the installed equipment of the water treatment has not been investigated.
Organic Inorganic:
Methyl–ethyl keton: 0,5 mg/l Ca (2+): 5 g/l
Tetra hydro furane: 0,26 mg/l Mg (2+): 1 g/l
Propoxy substances: 56 mg/l K (1+): 5 g/l
fatty acids: 4 mg/l Na (1+): 9 g/l
Caprolactam: 4 mg/l Cl (1-): 15 g/l
Caffeïne: 0,3 mg/l SO4 (2-): 6 g/l
Other organic divers: 1 mg/l
TOC value about 5000 mg/l
for comparison: composition of seawater:
24 g/l NaCl Ca (2+): 0,3 g/l
5g/l MgCl2 Mg (2+): 1,3 g/l
4 g/l Na2SO4 K (1+): 0 g/l
0,7 g/l CaCl2 Na (1+): 10,3 g/l
0,8 g/l MgBr2 Cl (1-): 18,7 g/l
SO4 (2-): 2,7 g/l

INVENT2 Final Report (Public)
41
Figure 50 Flow diagram of the effluent treatment.
In order to recover clean washing water which can be re-used again for the washing process, it is important to remove the dissolved salts and the small particles of torrefied material. A membrane distillation unit can be the first step to consider in the effluent treatment process. Using this technology, it will be possible to increase the salt concentration up to max. 12 wt.%. Membrane distillation functions with the help of micro-porous hydrophobic membranes. These membranes contain very narrow pores and because the membrane material has hydrophobic properties it means that liquid water cannot pass through. The pores of the membrane do not contain liquid but only pure air/gas. By creating a temperature difference between the feeding side (saltwater) and distillate side (fresh water) of the membrane a difference in vapor pressure will arise. Due to this difference in vapor pressure, water (and other volatile components) will evaporate and pass the membrane and condensate at the other cold distillate side (see Figure 51). Membrane distillation (supplier AquaStill) shows some additional advantages:
• A small amount of low-grade heat is needed to operate the process.
• The equipment components of this membrane distillation are not susceptible to corrosion.
• Expansion of capacity is rather easy by adding more membrane distillation modules.
3320 kg/h
torrefied material
pulverized and sieved 4000 kg/h
4000 kg/h water
70 °C
vacuum belt dryer 7320 kg/h
8000 kg/h mixing and and drying of
soaking torrefied / cleaned heating
material
saltwater 9360 kg/h saltwater 4200 kg/h
2440 kg/h torrefied / cleaned / fresh water
4680 kg/u dried material to compensate losses
4680 kg/h 200 kg/h
membrane distillation water
3120 kg/h
1560 kg/h conc. waterdamp water
saltwater
water vapour 4000 kg/h
evaporator condensor
1560 kg/h
solid salt

INVENT2 Final Report (Public)
42
Figure 51 Operation principle of membrane distillation.
The obtained 12 wt.% salt solution must be further concentrated. In principle, this can be realized by a vacuum dryer (low-grade heat needed) or spray dryer (high-grade heat needed). However, this kind of installations are rather susceptible to corrosion. An alternative with some good advantages is DVR – ZLD desalination module (supplier SaltTech; see Figure 52).
Figure 52 DVR – ZLD desalination module.
Heater
ΔT = +20°C
60 °C 70 °C 50 °C 60 °C
heat water vapour
30 °C 40 °C 40 °C 50 °C
heat exchanger membrane module
distillate
fresh water
0 % salt
salt solution
4% saltwater
ΔT = -20°C
conc.
temperatures mentioned are indicative salt solution
(to explain the principal operation) 12%
DVR - ZLD desalination modulecompressor
50 kg/h
(fresh 98 ⁰C
water) 2 bar
ΔT(2) = 13 ⁰C 125 ⁰C vapour
ΔT(1) = 34 ⁰C 85 ⁰C 0,6 bar
55 kg/h 2 bar
(12 % salt 85 ⁰C 91 ⁰C
solution)
heat heat DVR module (cyclone)
exchanger circulation exchanger
(1) pump (2) vapour / liquid
separator
85 ⁰C
ZLD module (cyclone)
liquid / solid material
separator
85 ⁰C
one module suitable for the production of 50 l/h fresh water. nearly solid salt
5 kg/h
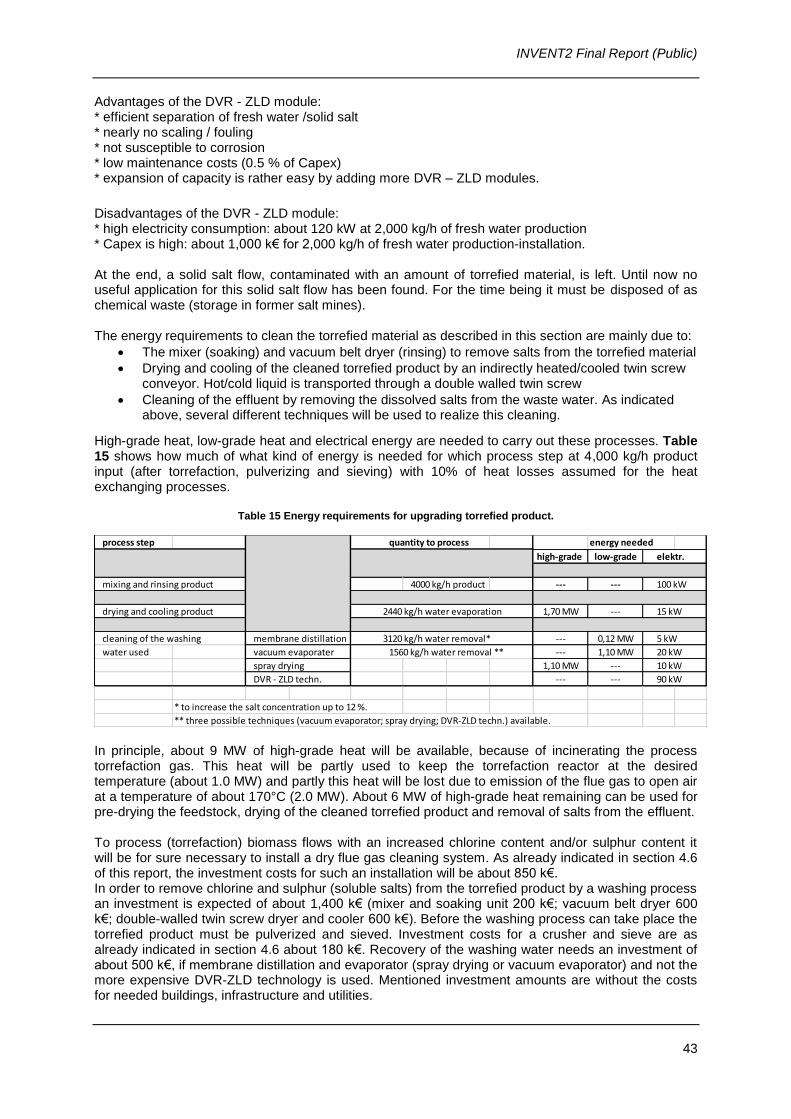
INVENT2 Final Report (Public)
43
Advantages of the DVR - ZLD module: * efficient separation of fresh water /solid salt * nearly no scaling / fouling * not susceptible to corrosion * low maintenance costs (0.5 % of Capex) * expansion of capacity is rather easy by adding more DVR – ZLD modules.
Disadvantages of the DVR - ZLD module: * high electricity consumption: about 120 kW at 2,000 kg/h of fresh water production * Capex is high: about 1,000 k€ for 2,000 kg/h of fresh water production-installation. At the end, a solid salt flow, contaminated with an amount of torrefied material, is left. Until now no useful application for this solid salt flow has been found. For the time being it must be disposed of as chemical waste (storage in former salt mines). The energy requirements to clean the torrefied material as described in this section are mainly due to:
• The mixer (soaking) and vacuum belt dryer (rinsing) to remove salts from the torrefied material
• Drying and cooling of the cleaned torrefied product by an indirectly heated/cooled twin screw conveyor. Hot/cold liquid is transported through a double walled twin screw
• Cleaning of the effluent by removing the dissolved salts from the waste water. As indicated above, several different techniques will be used to realize this cleaning.
High-grade heat, low-grade heat and electrical energy are needed to carry out these processes. Table 15 shows how much of what kind of energy is needed for which process step at 4,000 kg/h product input (after torrefaction, pulverizing and sieving) with 10% of heat losses assumed for the heat exchanging processes.
Table 15 Energy requirements for upgrading torrefied product.
In principle, about 9 MW of high-grade heat will be available, because of incinerating the process torrefaction gas. This heat will be partly used to keep the torrefaction reactor at the desired temperature (about 1.0 MW) and partly this heat will be lost due to emission of the flue gas to open air at a temperature of about 170°C (2.0 MW). About 6 MW of high-grade heat remaining can be used for pre-drying the feedstock, drying of the cleaned torrefied product and removal of salts from the effluent. To process (torrefaction) biomass flows with an increased chlorine content and/or sulphur content it will be for sure necessary to install a dry flue gas cleaning system. As already indicated in section 4.6 of this report, the investment costs for such an installation will be about 850 k€. In order to remove chlorine and sulphur (soluble salts) from the torrefied product by a washing process an investment is expected of about 1,400 k€ (mixer and soaking unit 200 k€; vacuum belt dryer 600 k€; double-walled twin screw dryer and cooler 600 k€). Before the washing process can take place the torrefied product must be pulverized and sieved. Investment costs for a crusher and sieve are as already indicated in section 4.6 about 180 k€. Recovery of the washing water needs an investment of about 500 k€, if membrane distillation and evaporator (spray drying or vacuum evaporator) and not the more expensive DVR-ZLD technology is used. Mentioned investment amounts are without the costs for needed buildings, infrastructure and utilities.
process step quantity to process energy needed
high-grade low-grade elektr.
mixing and rinsing product 4000 kg/h product --- --- 100 kW
drying and cooling product 2440 kg/h water evaporation 1,70 MW --- 15 kW
cleaning of the washing membrane distillation 3120 kg/h water removal* --- 0,12 MW 5 kW
water used vacuum evaporater 1560 kg/h water removal ** --- 1,10 MW 20 kW
spray drying 1,10 MW --- 10 kW
DVR - ZLD techn. --- --- 90 kW
* to increase the salt concentration up to 12 %.
** three possible techniques (vacuum evaporator; spray drying; DVR-ZLD techn.) available.
INVENT2 Final Report (Public)
44
5.4. Treatment of the wastewater effluent from the washing installation (HHNK) 5.4.1. General rules about wastewater discharge
HHNK is a water authority and is responsible for the water quality, the permits for wastewater discharge and for monitoring these discharges. HHNK works together with administrative bodies who are the ones issuing the permits and are responsible for their enforcement. For small installations, the corresponding administrative body would be the municipality, for large installations that would be the province and for the Ijsselmeer that would be Rijkswaterstaat.
Concerning the permits for wastewater discharge there are no all-purpose rules. There are certain parameters that are included in every permit, but their limits can vary significantly. In principle:
• COD < 125 mg/L
• Floating matter < 30 mg/L
• BOD < 20 mg/L
• Nitrogen, N < 10 mg/L
• Phosphate, P < 1 mg/L
Additionally, for specific wastewater streams, there are other parameters that have to be controlled, such as chlorine, Na + K, sulphite, PAHs, temperature, pH, heavy metals, depending on the composition of the wastewater effluent. Generally, only the substances that are expected to be present in such high concentrations that they can cause environmental damage are included in the permit. Therefore, this also depends on the location. In a trench less can be disposed of than in a canal and this makes each issued permit different; every permit is adapted to a specific situation. If concentrations of substances in a wastewater effluent are expected to be too high to discharge directly into nature, there are two solutions:
1. Discharge in the sewer system and pay for it
Discharge of wastewater in the (existing) sewer system are charged as Pollution Units (VE). This is calculated by the formula VE = [Q x (CZV + 4.57 x N-Kj)] / 54800, where Q is the volume of the stream (m3), CZV stands for COD (mg/L) and N-Kj is the Kjeldahl nitrogen (mg/L) (the nitrogen bound in organic substances, nitrogen in ammonia (NH3-N) and in ammonium (NH4
+-N)). Depending on what type of additional substances could be present in the wastewater effluent (e.g. Cl) there are supplementary VEs calculated. Each VE costs on average 58 €/year and varies per water authority. Many streams/compounds can be discharged in the sewer system, but not everything. These limits depend on: (a) the decisions made by each individual water authority that manages the sewage system and (b) location. If these limits are exceeded, then an own water treatment plant has to be installed.
2. Build an own wastewater treatment facility
A wastewater treatment unit can be an anaerobic process, an aerobic process or a combination of the two. An anaerobic process can remove COD and BOD, but no N. The goal is to reduce the VE’s (see formula in previous section) and therefore to reduce costs. An aerobic process can remove the rest of the COD as well as other components. For example, nitrification can be applied in order to mineralize the nitrogen, but also phosphorus can be captured in the bacteria. In this way the contaminants end up in the sewage sludge which has to be collected and processed further. For the treated water, a permit is needed, as discussed previously, and the corresponding (remaining) VE’s have to be charged and paid for accordingly. A general rule of thumb is that companies or installations that have a VE of 3,000 or higher could consider building an own aerobic treatment facility, at a VE of 10,000 an additional anaerobic unit could be considered.

INVENT2 Final Report (Public)
45
5.4.2. Relevance for pre-wash or post-wash effluent
• The COD and BOD of pre-washing effluent is very high for direct discharge to be considered.
• Relevant administrative and water authorities will pay attention to the COD, N and P content.
• If anaerobic digestion removes 90% of the COD (and 100% of the BOD) then these values would still be too high (~500 mg/L)
• Rule of thumb: Conversion of organic matter content to COD is estimated by multiplying by 1.6; Conversion of total C to COD is estimated by multiplying by 2.8.
• If non-biodegradable COD is proven to be present, this does not have to be paid for. These are exceptions that have to be discussed per individual case. Non-biodegradable COD is not an issue for pre-wash water, digester water or post-wash water. This could, however, be an issue for post-wash water of torrefied RDF/SRF.
• It is unfeasible to perform an analysis in order to measure all organic components or hydrocarbons present in the effluent.

INVENT2 Final Report (Public)
46
6. Conclusions The study performed on lab scale gave an indication of the washing efficiency expected with a certain
biomass type. This led to the conclusion that contacting between the biomass particles and water
plays an important role in the efficiency of the washing process. Additionally, among the biomass
streams screened it was concluded that SRF should not be subjected to washing prior to torrefaction
since no Cl could be extracted. However, after torrefaction the Cl in the torrefied SRF was accessible
and more than 90% of it could be washed away. Pre-washing is a necessary step for the removal of
alkalis (Na and K) and chloride (Cl) in substantial amounts, > 50wt.%.
Torrefaction testing revealed lower mass losses (higher mass yields) during torrefaction of the pre-
washed samples compared to the original samples. These major differences can be explained by the
loss in organic matter during the washing step, which seems to correspond to the most volatile
fraction. As a consequence, to reach the optimum mass yield during torrefaction (70-80%) higher
temperatures have to be used with the pre-washed material.
From the elemental composition of the upgraded fuels it can be concluded that high temperature
chlorine corrosion can be effectively mitigated since chlorine concentrations are reduced to non-critical
values except for road side grass that still exposes some corrosion risk. The removal of alkalis is
equally effective, effectively reducing the risk of alkali induced fouling. The energy required to
comminute the torrefied biomass pellets to sizes commonly used in pulverized coal boilers (e.g. < 500
m) is about 3 to 2 times lower than for the respective raw material. The wear and tear of the milling
equipment is significantly lower when milling the torrefied materials. The milling temperature is also
lower due to the lower attrition verified and as a consequence less ignition hazard is expected during
milling, compared to the raw materials. Fine particulate matter formation is strongly reduced by
upgrading the fuels, and therewith -alongside with lower aerosol emissions- the risk of alkali-
induced/fine particulate matter fouling is minimised effectively. The actual level of reduction is fuel-
specific. NOx emissions are not an area of concern for the fuels under investigation with the exception
of road side grass. The generally observed increase in NOx formation due to torrefaction is
compensated by partial removal of fuel nitrogen during pre-washing.
It can be concluded that pre-washing and torrefaction can greatly improve fuel quality also when
combustion related aspects are concerned. However, additional testing showed that slagging
mitigation will most likely be required for all of the fuels. Effective slagging suppression can be
achieved by means of mineral combustion additives. Alternatively, smart blending with other fuels
might be an option.