Embed Size (px)
Citation preview
Induced Alkalosis and
High-intensity Exercise Performance
Amelia Carr
Bachelor of Science (Honours)
This thesis is presented for the degree of
Doctor of Philosophy of the University of Western Australia
School of Sport Science, Exercise and Health
2011
2
Publications Arising from this Thesis
Carr, A., Hopkins, W., Gore, C. Effects of acute alkalosis and acidosis on performance:
a meta-analysis (2011) Sports Medicine (In Press). This paper appears in Chapter Two
(Part A).
Carr, A., Gore, C., Dawson, B. Induced alkalosis and caffeine supplementation: effects
on 2000 m rowing performance (2011) International Journal of Sport Nutrition and
Exercise Metabolism (In Press). This paper appears in Chapter Three.
Carr, A., Slater, G., Gore, C., Burke, L. Effect of sodium bicarbonate ingestion
protocol on [HCO3-], pH and gastrointestinal symptoms (2011) International Journal of
Sport Nutrition and Exercise Metabolism Jun; 21(3): 189-194. This paper appears in
Chapter Four.
Carr, A., Slater, G., Gore, C., Dawson, B., Burke, L. Bicarbonate Ingestion: Reliability
and Effect on Buffering and Performance. (Submitted to International Journal of Sports
Physiology and Performance and under review). This paper appears in Chapter Five.
3
Peer-Reviewed Conference Proceedings
Carr, A., Hopkins, W., Gore, C. Effects of acute alkalosis and acidosis on performance:
a meta-analysis. European College of Sport Science Annual Congress. Antalya, Turkey,
23rd
– 26th
June, 2010 (Podium Presentation).
Carr, A., Slater, G., Gore, C., Dawson, B. Burke, L. Rowing performance and induced
alkalosis after chronic and acute bicarbonate loading. European College of Sport
Science Annual Congress. Antalya, Turkey, 23rd
– 26th
June, 2010 (Poster Presentation).
Carr, A., Slater, G., Gore, C., Dawson, B., Burke, L. (2009). Effect of sodium
bicarbonate ingestion protocol on [HCO3-], pH and gastrointestinal symptoms.
European College of Sport Science Annual Congress. Oslo, Norway, 24th
– 27th
June,
2009 (Poster Presentation).
4
Overview
Sodium bicarbonate, and other agents that modify pH, have been investigated for a
number of years. Pre-exercise bicarbonate ingestion induces a blood alkalosis, which
potentially offsets fatigue associated with intramuscular acidity in high-intensity
exercise, facilitating improvements in athletic performance. Sodium bicarbonate is most
often ingested acutely, and a standard dose has been established (0.3 g.kg-1
BM) via
systematic dose-response investigations, but in some cases, chronic doses (0.5 g.kg-1
BM
daily) are taken on consecutive days.
A pertinent limitation of the sodium bicarbonate literature is the lack of contemporary
estimates of the physiological and performance effect magnitudes. Experimental
research is also limited in the evaluation of different ingestion protocols, estimated
performance effects when bicarbonate is combined with caffeine and the reliability of
performance and physiological effects associated with bicarbonate loading.
The purpose of this thesis is to investigate the effects of different modes of sodium
bicarbonate ingestion on blood alkalosis and high-intensity exercise performance.
Specifically, study one comprises a contemporary meta-analysis that quantifies
performance (in mean power) and physiological effects (blood bicarbonate
concentration and pH) of sodium bicarbonate, sodium citrate and ammonium chloride.
Study two, the first experimental study, evaluates performance, induced alkalosis and
post-test blood lactate concentration with standard doses of sodium bicarbonate,
caffeine, and both supplements combined. Physiological effects of several different
bicarbonate ingestion protocols are evaluated in study three, and gastrointestinal
symptoms are also quantified via responses to a detailed questionnaire. The final study
5
examines the effect and reliability of performance effects and induced alkalosis (mean
power in 2000 m rowing efforts) with acute and chronic bicarbonate ingestion.
Results of the four investigations indicate that acute pre-exercise sodium bicarbonate
ingestion can enhance performance by up to 2%. In some cases, gastrointestinal side
effects manifest, which may prevent performance improvements, and performance
effects are influenced by factors such as the level of athlete or performance test
duration. Ingesting a small pre-exercise meal that is high in carbohydrates can reduce
the incidence and severity of gastrointestinal symptoms and therefore provide more
favourable conditions for performance enhancement. Finally, athletes can expect
consistent performance results with both acute and chronic bicarbonate loading. The
studies included in this thesis make specific additions to the sodium bicarbonate
research area, first by providing a framework for the interpretation of performance
results (via estimates of performance effect magnitude and within-individual variation)
and secondly, with methodological considerations for future investigations (the
quantification of gastrointestinal symptoms and standardisation of ingestion protocols).
In conclusion, ingesting sodium bicarbonate can induce substantial performance
enhancements. The greatest ergogenic potential exists when the supplement is ingested
with a pre-exercise meal, which may increase the level of alkalosis and simultaneously
reduce the incidence of deleterious side effects. Both chronic and acute supplementation
will elicit consistent exercise performances.
6
Acknowledgements
I sincerely thank the following people, whose contributions have made this research and
thesis possible.
Professor Brian Dawson, for your continuous guidance throughout my PhD
candidature, and for supervising my research with insight and humour. I am grateful for
your scientific wisdom and experience.
Professor Chris Gore, for your invaluable scientific input, and the great amounts of
time you have made available to read and discuss my work. I‟m very appreciative of the
experiences in applied sport science I have gained while completing my PhD at the AIS.
Professor Louise Burke, for the expert advice you have provided throughout my PhD
candidature, and your many contributions to my projects. I‟m also grateful for all that I
have learned and experienced while working with the Sports Dieticians at the AIS.
Professor Will Hopkins, for the challenging and rewarding experiences you have
provided, and for encouraging me as a researcher. I have appreciated your time and
expertise while working with you in Canberra and Auckland.
Dr. Gary Slater, for the interest you have shown in my work, and for your involvement
in my projects. I‟m fortunate to have been able to collaborate with you, and for your
knowledge and research experience.
AIS Physiology staff and postgraduate students, for inspiring me with your
enthusiasm and abilities, and the interest and generosity you have shown in assisting me
with my work and research projects.
7
Research participants, for volunteering your time, attention and energies to these
research projects. I‟m appreciative of your dedication to giving maximal performance
efforts, and for your ability to persevere with some very challenging exercise tests and
supplementation protocols.
My family, particularly my parents, John and Rose Carr. Thank you for your belief in
my abilities, and for your consistent support and encouragement.
Brent, for being an incredible partner. Thank you for your love and support.
8
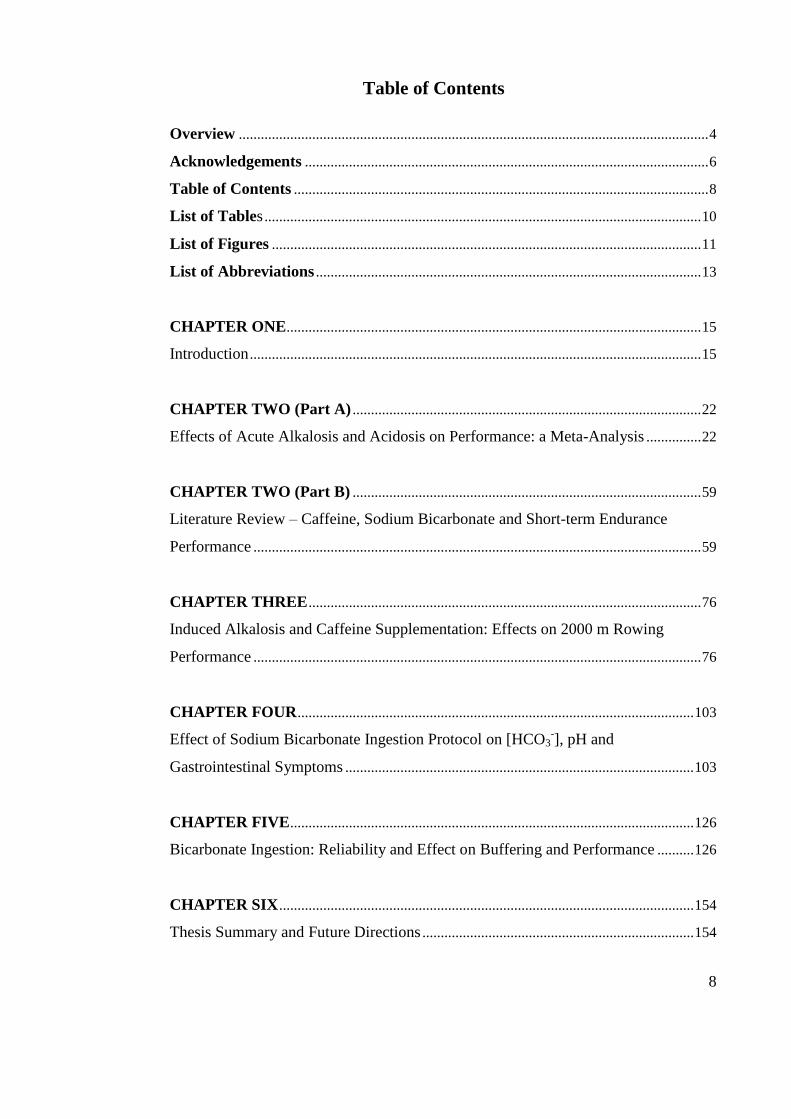
Table of Contents
Overview ................................................................................................................................ 4
Acknowledgements .............................................................................................................. 6
Table of Contents ................................................................................................................. 8
List of Tables ....................................................................................................................... 10
List of Figures ..................................................................................................................... 11
List of Abbreviations ......................................................................................................... 13
CHAPTER ONE................................................................................................................. 15
Introduction ........................................................................................................................... 15
CHAPTER TWO (Part A) ............................................................................................... 22
Effects of Acute Alkalosis and Acidosis on Performance: a Meta-Analysis ............... 22
CHAPTER TWO (Part B) ............................................................................................... 59
Literature Review – Caffeine, Sodium Bicarbonate and Short-term Endurance
Performance .......................................................................................................................... 59
CHAPTER THREE ........................................................................................................... 76
Induced Alkalosis and Caffeine Supplementation: Effects on 2000 m Rowing
Performance .......................................................................................................................... 76
CHAPTER FOUR ............................................................................................................ 103
Effect of Sodium Bicarbonate Ingestion Protocol on [HCO3-], pH and
Gastrointestinal Symptoms ............................................................................................... 103
CHAPTER FIVE .............................................................................................................. 126
Bicarbonate Ingestion: Reliability and Effect on Buffering and Performance .......... 126
CHAPTER SIX ................................................................................................................. 154
Thesis Summary and Future Directions .......................................................................... 154
9
APPENDICES................................................................................................................... 163
Participant Information Sheets and Informed Consent ................................................. 164
Questionnaires .................................................................................................................... 176
Raw Data ............................................................................................................................. 180
10
List of Tables
CHAPTER TWO
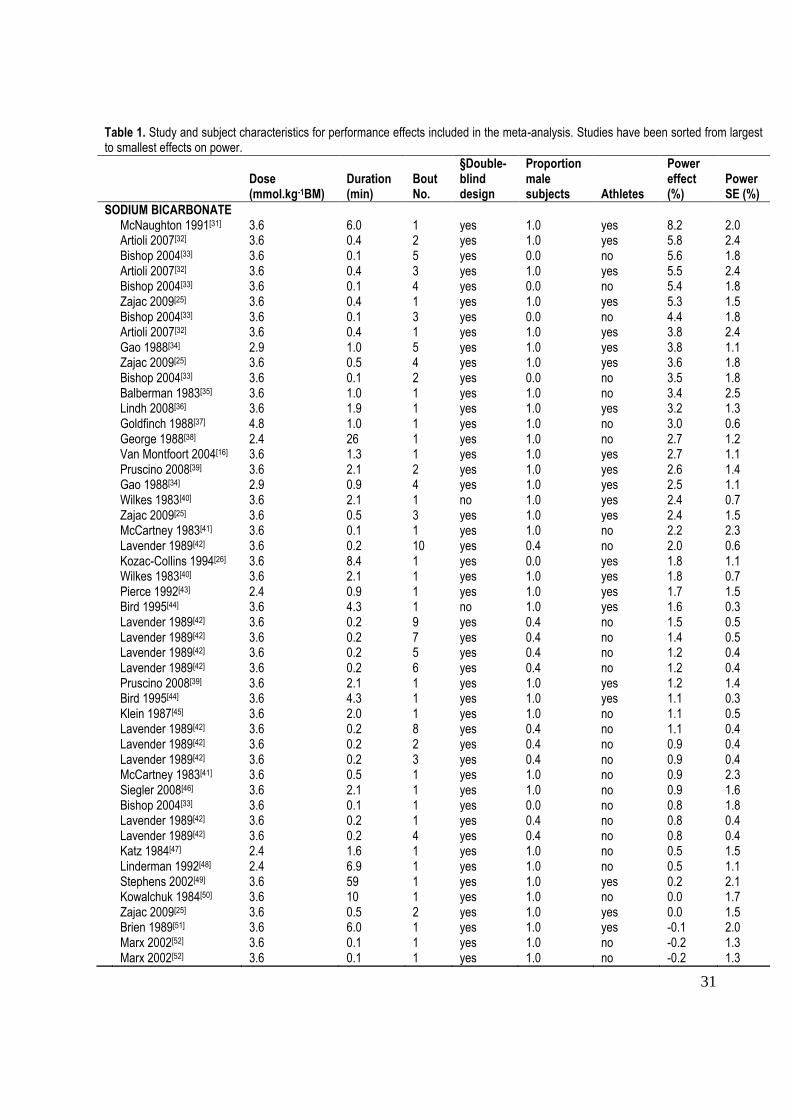
Table 1. Study and subject characteristics for performance effects included in the meta-
analysis. Studies have been sorted from largest to smallest effects on power. ............... 31
Table 2. Effects on mean power (with ±90% confidence limits and inferences) for
sodium bicarbonate, sodium citrate and ammonium chloride in the reference condition,
with modifying effects of study and subject characteristics. Reference condition: a
single 1-min sprint with blinded male athletes consuming 3.5 mmol.kg-1
BM sodium
bicarbonate, or 1.5 mmol.kg-1
BM sodium citrate, or 5.5 mmol.kg-1
BM ammonium
chloride. Effect magnitudes are interpreted with reference to thresholds for small
(0.5%), moderate (1.5%) and large (2.7%) effects. ........................................................ 39
CHAPTER THREE
Table 3. Rowing ergometer 2000 performance (mean ±SD) test data for baseline,
placebo, caffeine, sodium bicarbonate and ..................................................................... 88
CHAPTER FOUR
Table 4. Summary of ingestion protocols used. Protocols 1-6 and 8 used sodium
bicarbonate (NaHCO3) at a dose of 0.3 g.kg-1
BM, protocol 7 used NaCl with equimolar
amount of sodium, and protocol 9 used NaHCO3 at a dose of 0.3 g.kg-1
BM combined
with 0.1 g.kg-1
BM sodium citrate. ................................................................................ 110
CHAPTER FIVE
Table 5. Performance test measures, including mean (±SD) values for trial 1 (T1) and
trial 2 (T2), and mean (90% confidence interval) change in the mean, typical error (TE)
and coefficient of variation (CV). Effect size value and magnitude is also shown. ..... 140
11
List of Figures
CHAPTER TWO
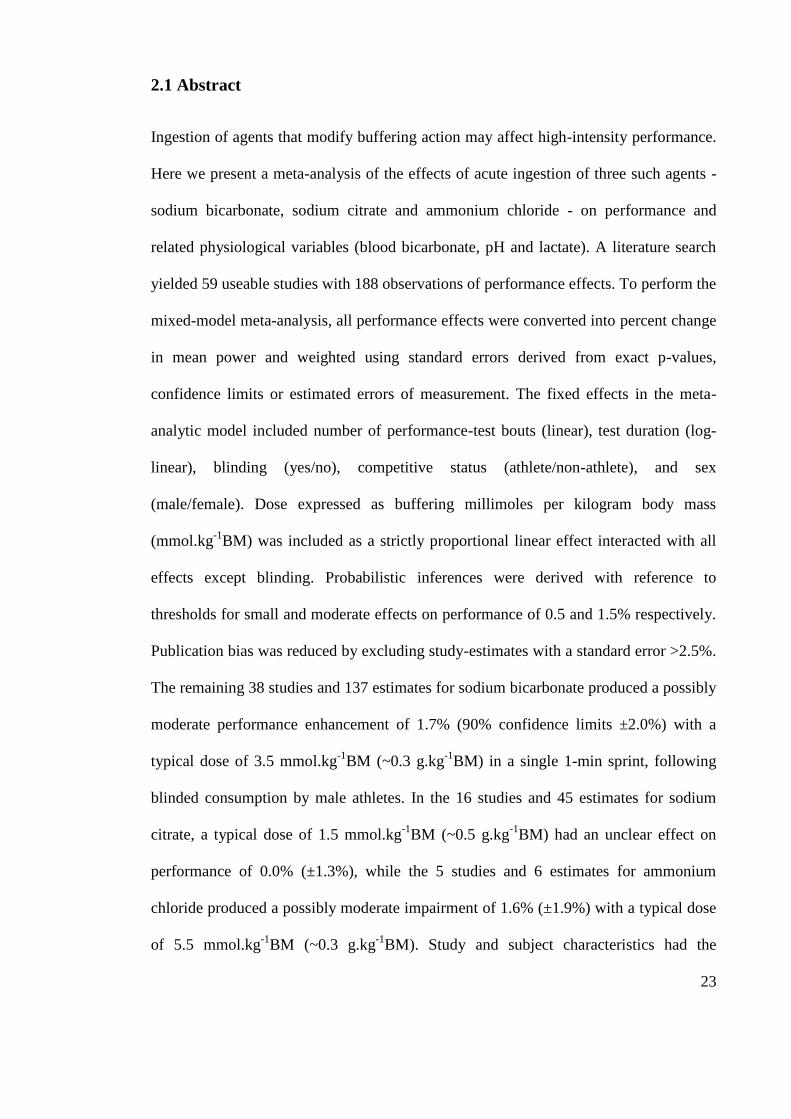
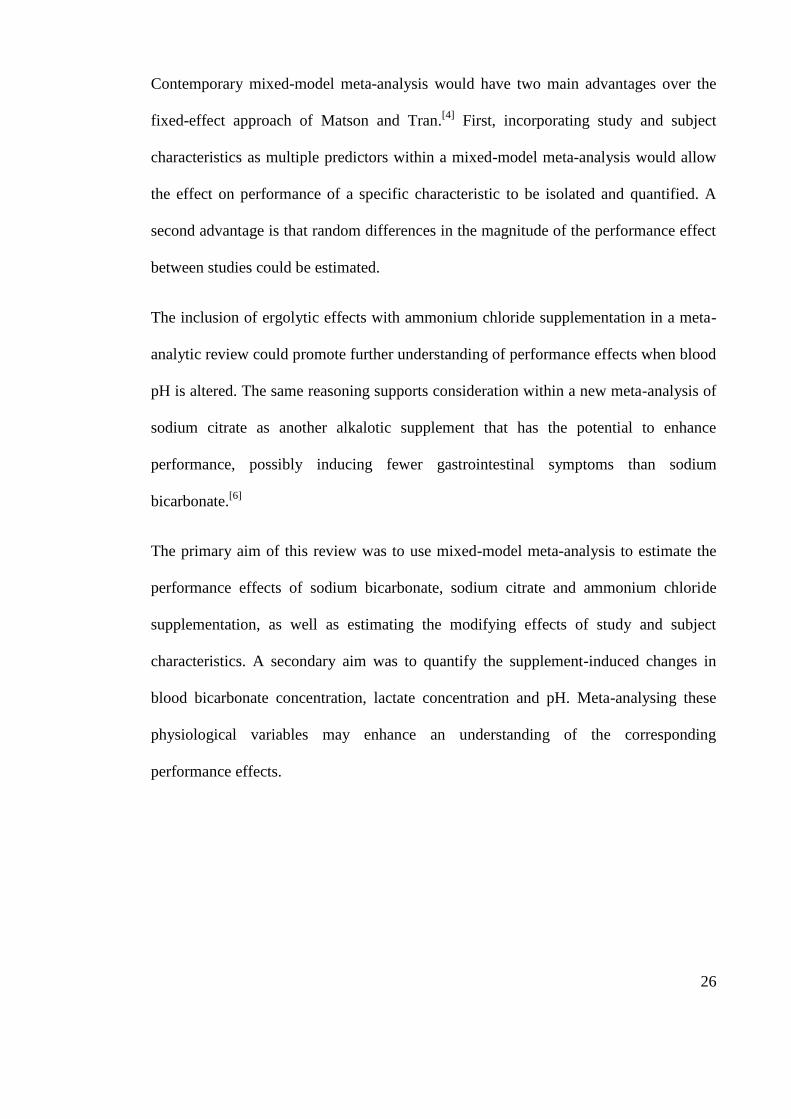
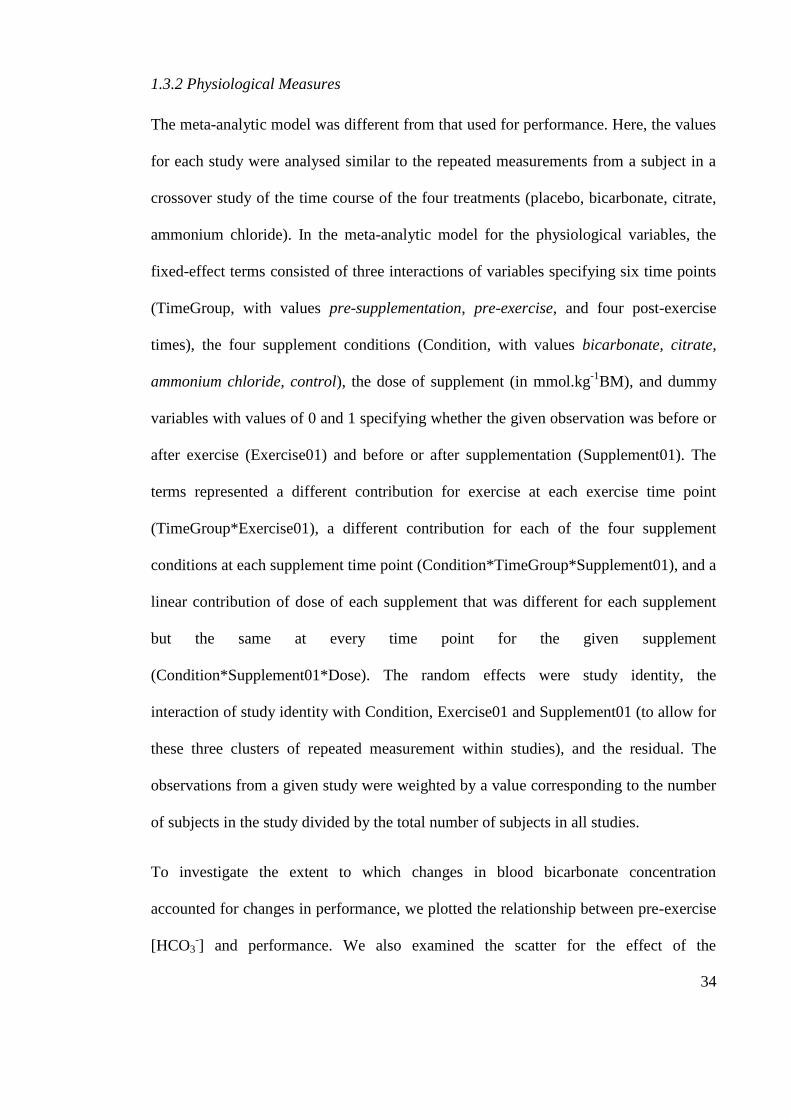
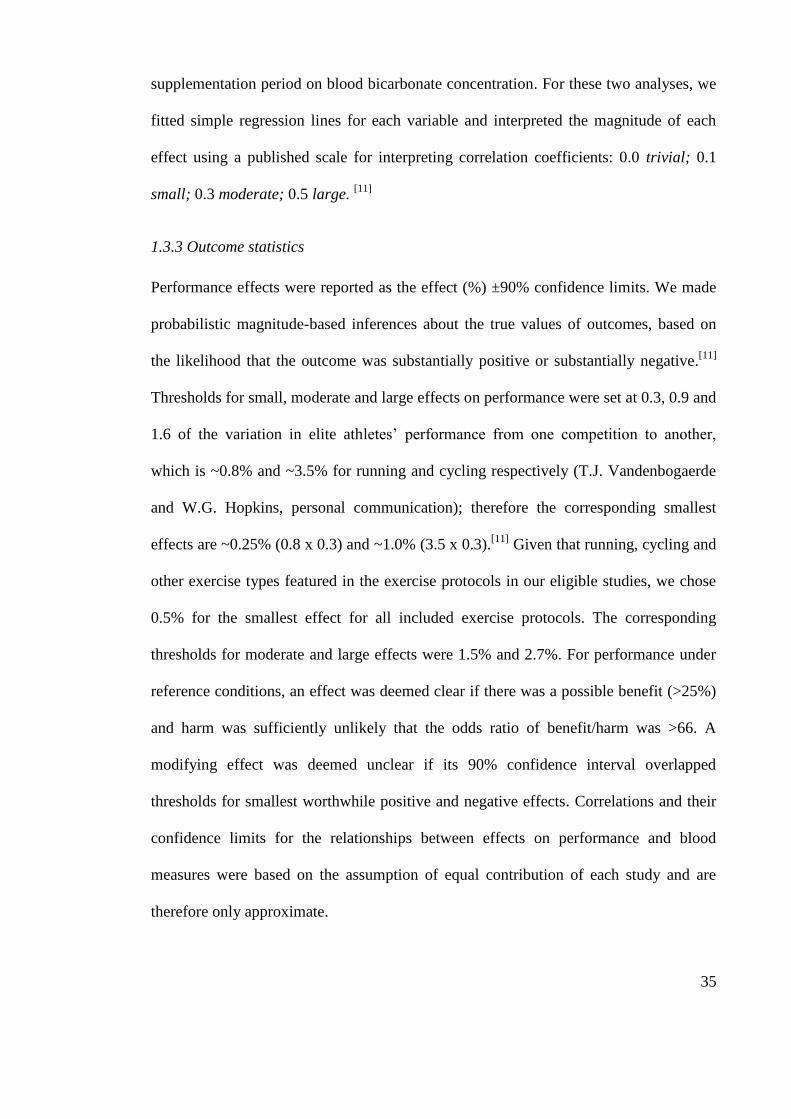
Figure 1. Scatter-plot to investigate publication bias for performance measures. The
dashed vertical line at a standard error of ~2.7% divides the plot into a region with
symmetric scatter to the left and a region to the right where a dearth of t-values within
the dashed rectangle is apparent. ..................................................................................... 37
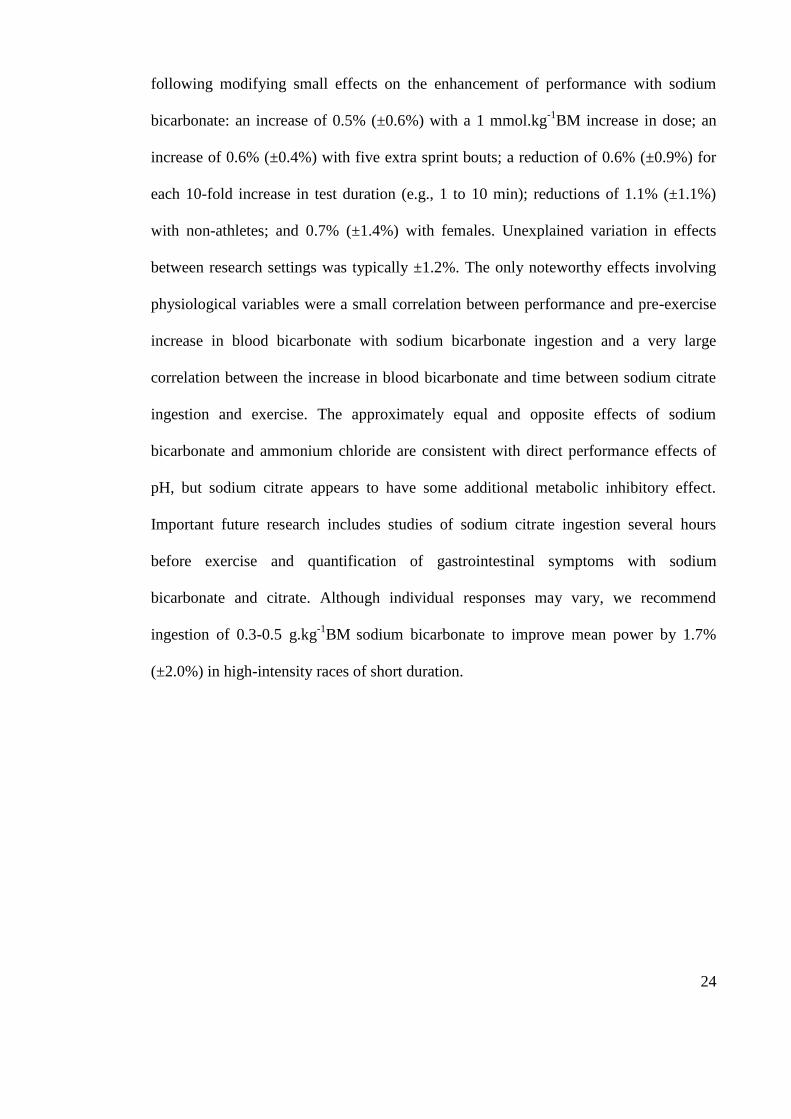
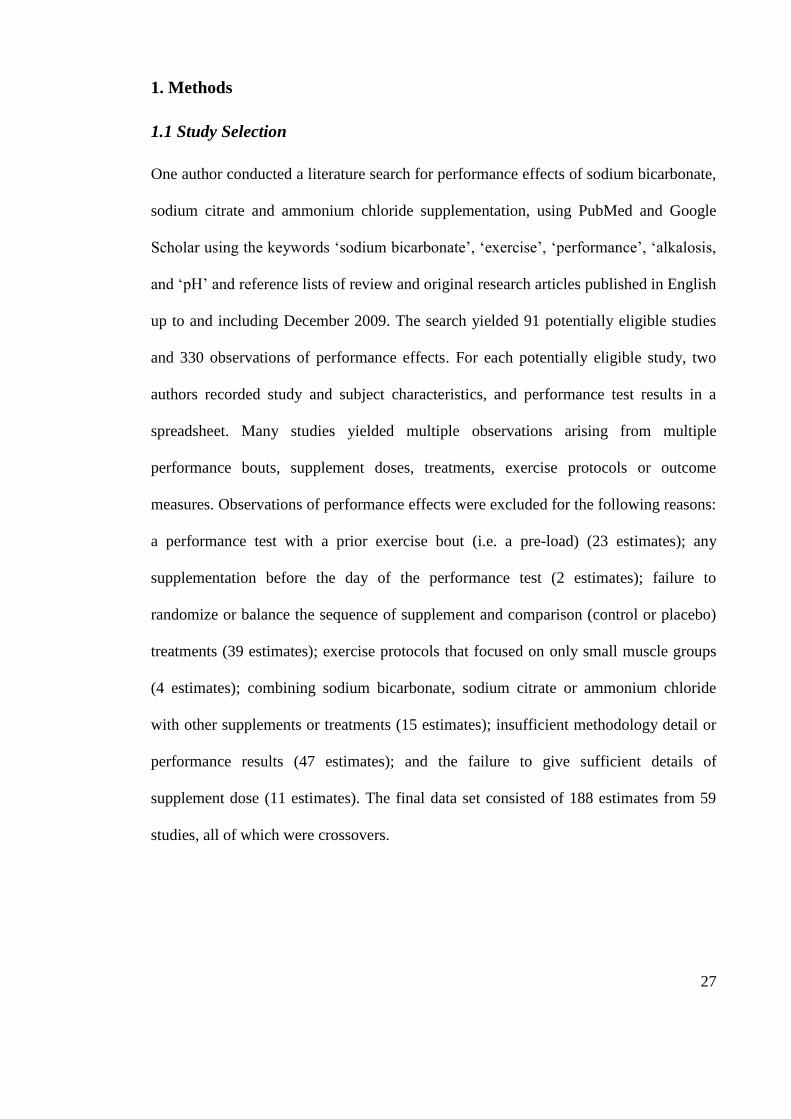
Figure 2. Time course of (mean ±90%CL) blood bicarbonate concentration, pH and
lactate concentration in relation to exercise commencement. Negative values are for
time before exercise, positive values indicate post-exercise time points. Standard
deviation (SD) bars represent the mean between-subjects standard deviation where
provided........................................................................................................................... 41
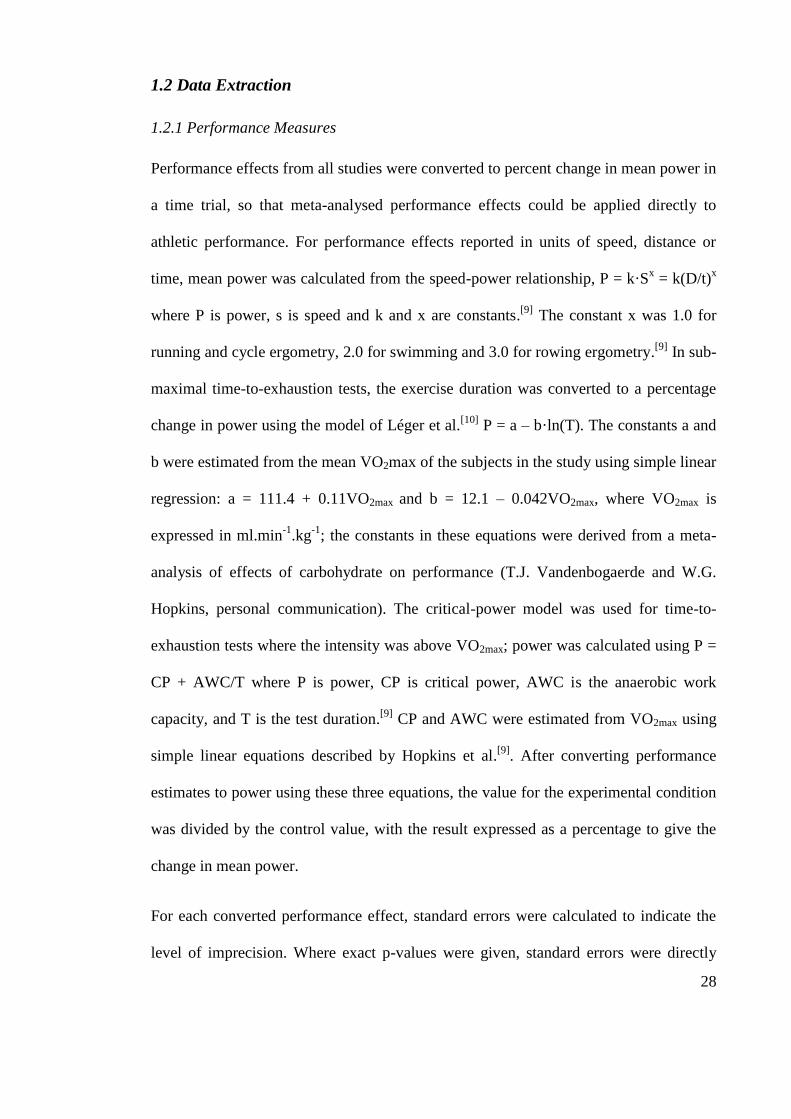
Figure 3. Individual study-estimates of percent effects on performance plotted against
pre-exercise change in blood bicarbonate concentration after supplement ingestion.
Regression lines are shown for the three supplements.................................................... 43
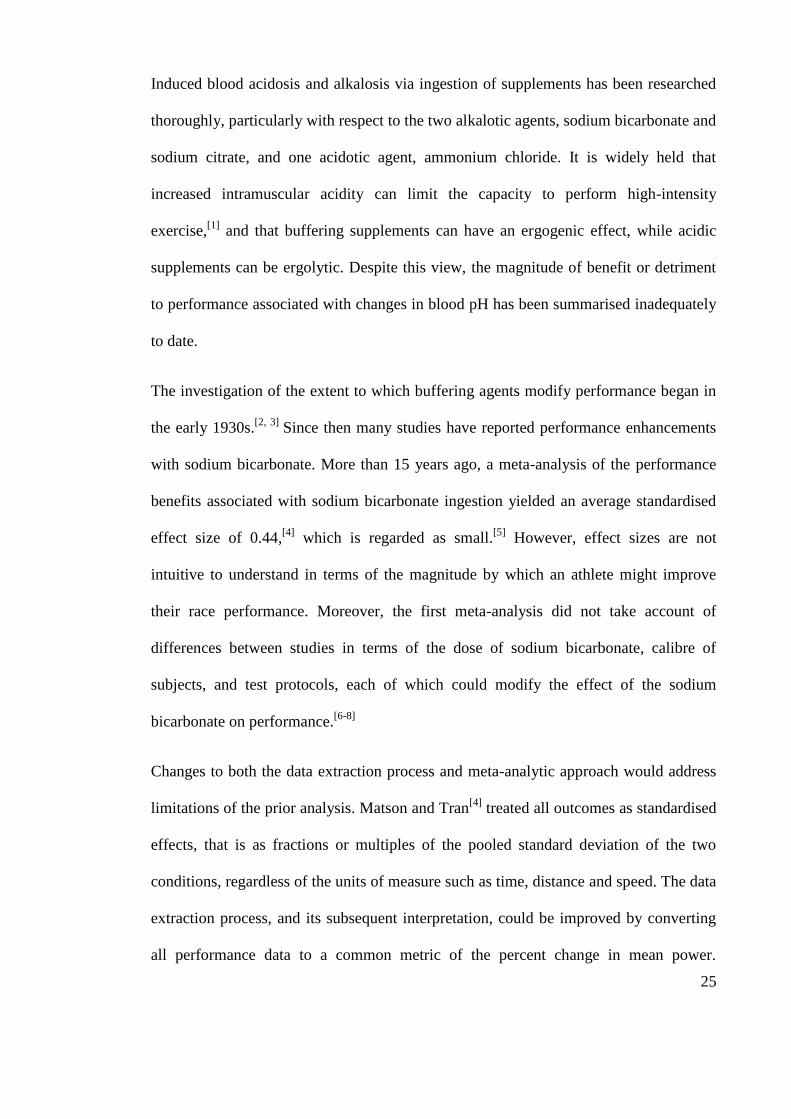
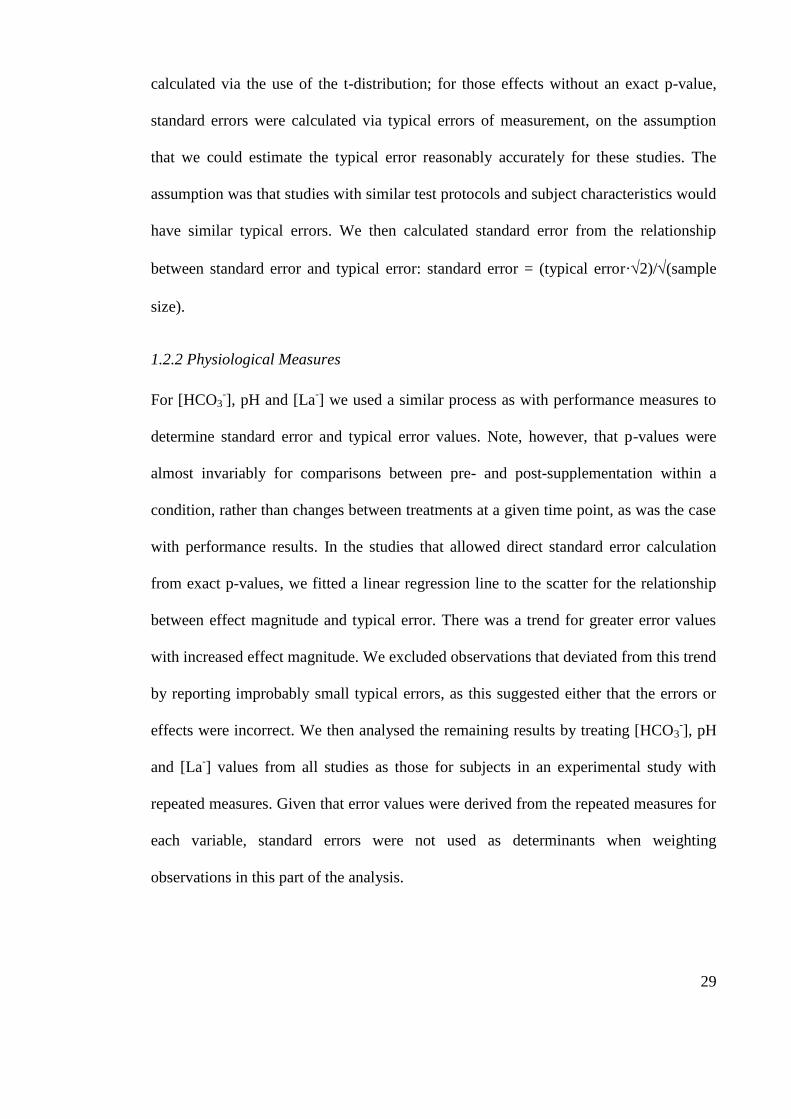
Figure 4. Individual study-estimates of percent effects on performance plotted against
pre-exercise change in blood bicarbonate concentration after supplement ingestion.
Regression lines are shown for each supplement. ........................................................... 45
CHAPTER THREE
Figure 5. Schematic of performance testing session illustrating capillary blood
sampling, capsule ingestion, warm-up and 2000 m performance test. ........................... 84
Figure 6. Ergometer power output (mean ±SD) for each 500 m section of the 2000 m
time trials (n = 8). ............................................................................................................ 89
Figure 7. Mean (±SD) blood bicarbonate concentration and pH prior to ingestion (PI),
prior to warm-up (PW) and post-2000 m test (PT) (n = 8). ............................................ 91
12
CHAPTER FOUR
Figure 8. The absolute scores for bicarbonate concentration (HCO3-) (Figure 8a), pH
(Figure 8b) and gastrointestinal (GI) symptoms rating (Figure 8c), where higher ratings
indicate greater severity of symptoms. ......................................................................... 116
CHAPTER FIVE
Figure 9. Overview of the timing of ergometer tests and capsule ingestion. 2000 m
ergometer trials in the three conditions were separated by 48 h. The first chronic
bicarbonate trial was performed after 1 day of bicarbonate ingestion and the second trial
after 3 days of loading. Therefore, in simulating supplementation strategies for use in a
regatta, the first and second chronic bicarbonate trials were not conducted under
identical conditions, but previous research6 suggests there would be no substantial
differences in blood buffering capacity between the first and second trials. ................ 131
Figure 10. Schematic of testing session, illustrating timing of capillary blood sampling
and GI (gastrointestinal) symptoms quantification, ingestion of capsules, standardized
meal and fluid, and performance test. ........................................................................... 135
Figure 11. Ergometer power output (mean ±SD) for each 500 m section of the 2000 m
time trials (n = 7). .......................................................................................................... 141
Figure 12. Mean (±SD) blood bicarbonate concentration at pre-ingestion, pre-warm up
and post-test time points (n = 7). ................................................................................... 142
13
List of Abbreviations
AWC anaerobic work capacity
ºC degrees celcius
CI confidence interval
CL confidence limits
CNS central nervous system
CP critical power
CV coefficient of variation
ES effect size
GI gastrointestinal
g.kg-1
BM grams per kilograms of body mass
[H+]
hydrogen ion concentration
[HCO3-] bicarbonate ion concentration
kg kilograms
kJ kilojoules
[K+]
potassium ion concentration
[La-] lactate ion concentration
m metres
14
mg milligrams
mg.kg-1
BM milligrams per kilogram of body mass
min minutes
mL millilitres
mL.min-1
.kg-1
millilitres per minute per kilogram of body mass
mm millimetres
mmol.L-1
millimoles per litre
mmol.kg-1
BM millimoles per kilogram of body mass
NaHCO3 sodium bicarbonate
NH4Cl ammonium chloride
RPE rating of perceived exertion
SD standard deviation
SE standard error
Strokes.min-1
strokes per minute
TE typical error
W watts
L microlitres

15
CHAPTER ONE
Introduction
16
1.0 Background
Sodium bicarbonate loading has been investigated over the past eighty years
(McNaughton, Siegler, & Midgley, 2008). Performance enhancements in high-intensity
exercise of ~1-7 min have commonly been demonstrated (Gao, Costill, Horswill, &
Park, 1988; Goldfinch, McNaughton, & Davies, 1988; McNaughton & Cedaro, 1991),
often associated with pre-exercise increases in blood bicarbonate concentration [HCO3-]
and pH (Matson & Tran, 1993). It is widely held that any ergogenic effects can be
attributed to reduced intramuscular acidity during exercise (Gledhill, 1984). To further
understand the mechanism, ergolytic effects with induced acidosis via ammonium
chloride ingestion have also been reported (Balberman & Roby, 1983; Brien &
McKenzie, 1989).
Historically, an acute dose of sodium bicarbonate of 0.3 grams per kilogram of body
mass (g.kg-1
BM) taken 1-3 h prior to exercise (Katz, Costill, King, Hargreaves, & Fink,
1984; Tiryaki & Atterbom, 1995) has been the standard protocol (McNaughton &
Cedaro, 1992), although gastro-intestinal upset can occur (Burke & Pyne, 2007).
Chronic doses of 0.5 g.kg-1
per day over several days (Douroudos, Fatouros,
Gourgoulis, Jamurtas, Tsitsios, Hatzinikolaou, Margonis, Mavromatidis, & Taxildaris,
2006; McNaughton & Thompson, 2001), as well as acute sodium citrate
supplementation (Ball & Maughan, 1997; Oopik, Kadak, Medijainen, & Karelson,
2008) have also been tested as strategies that potentially stimulate blood alkalosis with
minimal side effects. Many athletes take sodium bicarbonate prior to competition
(Burke & Pyne, 2007), often on consecutive days and in combination with other
nutritional ergogenic aids (Burke, 2008).
17
Despite the large volume of sodium bicarbonate research, the magnitude of performance
enhancement has yet to be adequately quantified. Furthermore, optimal ingestion
protocols, the reliability of bicarbonate-induced alkalosis and performance, and
ergogenic effects when sodium bicarbonate and caffeine are combined remain to be
investigated.
1.1 Aim
The overall aim of this thesis was to investigate the effect of different modes of sodium
bicarbonate ingestion on blood alkalosis and high-intensity exercise performance.
1.2 Objectives
1.2.1 Chapter Two: Effects of acute alkalosis and acidosis on performance: a
meta-analysis
The purpose of this review was to objectively quantify performance and physiological
effects of the pre-exercise ingestion of sodium bicarbonate, sodium citrate and
ammonium chloride.
1.2.2 Chapter Three: Induced alkalosis and caffeine supplementation: effects
on 2000 m rowing performance
This study aimed to determine performance effects of the ingestion of sodium
bicarbonate, caffeine and their combination, on 2000 m rowing efforts.
18
1.2.3 Chapter Four: Effect of sodium bicarbonate ingestion protocol on blood
bicarbonate concentration, pH and gastrointestinal symptoms
This investigation aimed to compare the effect of several different sodium bicarbonate
ingestion protocols on blood alkalosis and gastrointestinal symptoms, in an attempt to
identify one that was best tolerated.
1.2.4 Chapter Five: Bicarbonate Ingestion: Reliability and Effect on Buffering
and Performance
The purpose of this investigation was to determine the effect and reliability of acute and
chronic sodium bicarbonate ingestion on 2000 m rowing ergometer performance and
blood bicarbonate concentration [HCO3-].
1.3 Contributions of this research
The findings of the studies included in this thesis are potentially applicable to high-
intensity exercise performance in the context of high-level athletic competition and
scientific research. It may be possible to provide practical information for athletes and
coaches in terms of supplement ingestion strategies and likely performance outcomes.
Sport scientists may be able to better interpret performances in competition and
laboratory tests when athletes use blood buffering agents. By investigating performance
enhancement and reproducibility after the ingestion of sodium bicarbonate and/or
caffeine, and quantifying any corresponding physiological effects, the ultimate goal of
this research is to provide scientific evidence and practical guidelines that may lead to
enhanced athletic performance.
19
References
Balberman, S. E., & Roby, F. B. (1983). The effects of induced alkalosis and acidosis
on the work capacity of the quadriceps and hamstrings muscle groups.
International Journal of Sports Medicine, 4, 143.
Ball, D., & Maughan, R. J. (1997). The effect of sodium citrate ingestion on metabolic
response to intense exercise following diet manipulation in man. Experimental
Physiology, 82, 1041-1056.
Brien, D. M., & McKenzie, D. C. (1989). The effect of induced alkalosis and acidosis
on plasma lactate and work output in elite oarsmen. European Journal of
Applied Physiology, 58(8), 797-802.
Burke, L. M. (2008). Caffeine and sports performance. Applied Physiology Nutrition
and Metabolism, 33(6), 1319-1334.
Burke, L. M., & Pyne, D. B. (2007). Bicarbonate loading to enhance training and
competitive performance. International Journal of Sports Physiology and
Performance, 2, 93-97.
Douroudos, I. I., Fatouros, I. G., Gourgoulis, V., Jamurtas, A. Z., Tsitsios, T.,
Hatzinikolaou, A., Margonis, K., Mavromatidis, K., & Taxildaris, K. (2006).
Dose-related effects of prolonged NaHCO3 Ingestion during high-intensity
exercise. Medicine & Science in Sports & Exercise, 38(10), 1746-1753.
Gao, J., Costill, D. L., Horswill, C. A., & Park, S. H. (1988). Sodium bicarbonate
ingestion improves performance in interval swimming. European Journal of
Applied Physiology, 58, 171-174.
20
Gledhill, N. (1984). Bicarbonate ingestion and anaerobic performance. Sports Medicine,
1, 177-180.
Goldfinch, J., McNaughton, L. R., & Davies, P. (1988). Induced metabolic alkalosis and
its effects on 400-m racing time. European Journal of Applied Physiology, 57,
45-48.
Katz, A., Costill, D. L., King, D. S., Hargreaves, M., & Fink, W. J. (1984). Maximal
exercise tolerance after induced alkalosis. International Journal of Sports
Medicine, 5, 107-110.
Matson, L. G., & Tran, Z. V. (1993). Effects of sodium bicarbonate ingestion on
anaerobic performance: a meta-analytic review. International Journal of Sport
Nutrition, 3(1), 2-28.
McNaughton, L., & Cedaro, R. (1991). The effect of sodium bicarbonate on rowing
ergometer performance in elite rowers. The Australian Journal of Science and
Medicine in Sport, 23(3), 66-69.
McNaughton, L., & Cedaro, R. (1992). Sodium citrate ingestion and its effects on
maximal anaerobic exercise of different durations. European Journal of Applied
Physiology, 64, 36-41.
McNaughton, L., Siegler, J., & Midgley, A. (2008). Ergogenic effects of sodium
bicarbonate. Current Sports Medicine Reports, 7(4), 230-236.
McNaughton, L., & Thompson, D. (2001). Acute versus chronic sodium bicarbonate
ingestion and anaerobic work and power output. Journal of Sports Medicine and
Physical Fitness, 41, 456-462.
21
Oopik, V.,Timpmann, S., Kadak, K., Medijainen, L., & Karelson, K. (2008). The effects
of sodium citrate ingestion on metabolism and 1500-m racing time in trained
female runners. Journal of Sports Science and Medicine, 7, 125-131.
Tiryaki, G. R., & Atterbom, H. A. (1995). The effects of sodium bicarbonate and
sodium citrate on 600 m running time of trained females. Journal of Sports
Medicine and Physical Fitness, 35, 194-198.
22
CHAPTER TWO (Part A)
Literature Review
Study One
Effects of Acute Alkalosis and Acidosis on Performance: a Meta-
Analysis
Journal article accepted for publication with
Sports Medicine
Presented here in the journal submission format
Running Title: Meta-analysis: alkalosis, acidosis and performance
23
2.1 Abstract
Ingestion of agents that modify buffering action may affect high-intensity performance.
Here we present a meta-analysis of the effects of acute ingestion of three such agents -
sodium bicarbonate, sodium citrate and ammonium chloride - on performance and
related physiological variables (blood bicarbonate, pH and lactate). A literature search
yielded 59 useable studies with 188 observations of performance effects. To perform the
mixed-model meta-analysis, all performance effects were converted into percent change
in mean power and weighted using standard errors derived from exact p-values,
confidence limits or estimated errors of measurement. The fixed effects in the meta-
analytic model included number of performance-test bouts (linear), test duration (log-
linear), blinding (yes/no), competitive status (athlete/non-athlete), and sex
(male/female). Dose expressed as buffering millimoles per kilogram body mass
(mmol.kg-1
BM) was included as a strictly proportional linear effect interacted with all
effects except blinding. Probabilistic inferences were derived with reference to
thresholds for small and moderate effects on performance of 0.5 and 1.5% respectively.
Publication bias was reduced by excluding study-estimates with a standard error >2.5%.
The remaining 38 studies and 137 estimates for sodium bicarbonate produced a possibly
moderate performance enhancement of 1.7% (90% confidence limits ±2.0%) with a
typical dose of 3.5 mmol.kg-1
BM (~0.3 g.kg-1
BM) in a single 1-min sprint, following
blinded consumption by male athletes. In the 16 studies and 45 estimates for sodium
citrate, a typical dose of 1.5 mmol.kg-1
BM (~0.5 g.kg-1
BM) had an unclear effect on
performance of 0.0% (±1.3%), while the 5 studies and 6 estimates for ammonium
chloride produced a possibly moderate impairment of 1.6% (±1.9%) with a typical dose
of 5.5 mmol.kg-1
BM (~0.3 g.kg-1
BM). Study and subject characteristics had the
24
following modifying small effects on the enhancement of performance with sodium
bicarbonate: an increase of 0.5% (±0.6%) with a 1 mmol.kg-1
BM increase in dose; an
increase of 0.6% (±0.4%) with five extra sprint bouts; a reduction of 0.6% (±0.9%) for
each 10-fold increase in test duration (e.g., 1 to 10 min); reductions of 1.1% (±1.1%)
with non-athletes; and 0.7% (±1.4%) with females. Unexplained variation in effects
between research settings was typically ±1.2%. The only noteworthy effects involving
physiological variables were a small correlation between performance and pre-exercise
increase in blood bicarbonate with sodium bicarbonate ingestion and a very large
correlation between the increase in blood bicarbonate and time between sodium citrate
ingestion and exercise. The approximately equal and opposite effects of sodium
bicarbonate and ammonium chloride are consistent with direct performance effects of
pH, but sodium citrate appears to have some additional metabolic inhibitory effect.
Important future research includes studies of sodium citrate ingestion several hours
before exercise and quantification of gastrointestinal symptoms with sodium
bicarbonate and citrate. Although individual responses may vary, we recommend
ingestion of 0.3-0.5 g.kg-1
BM sodium bicarbonate to improve mean power by 1.7%
(±2.0%) in high-intensity races of short duration.
25
Induced blood acidosis and alkalosis via ingestion of supplements has been researched
thoroughly, particularly with respect to the two alkalotic agents, sodium bicarbonate and
sodium citrate, and one acidotic agent, ammonium chloride. It is widely held that
increased intramuscular acidity can limit the capacity to perform high-intensity
exercise,[1]
and that buffering supplements can have an ergogenic effect, while acidic
supplements can be ergolytic. Despite this view, the magnitude of benefit or detriment
to performance associated with changes in blood pH has been summarised inadequately
to date.
The investigation of the extent to which buffering agents modify performance began in
the early 1930s.[2, 3]
Since then many studies have reported performance enhancements
with sodium bicarbonate. More than 15 years ago, a meta-analysis of the performance
benefits associated with sodium bicarbonate ingestion yielded an average standardised
effect size of 0.44,[4]
which is regarded as small.[5]
However, effect sizes are not
intuitive to understand in terms of the magnitude by which an athlete might improve
their race performance. Moreover, the first meta-analysis did not take account of
differences between studies in terms of the dose of sodium bicarbonate, calibre of
subjects, and test protocols, each of which could modify the effect of the sodium
bicarbonate on performance.[6-8]
Changes to both the data extraction process and meta-analytic approach would address
limitations of the prior analysis. Matson and Tran[4]
treated all outcomes as standardised
effects, that is as fractions or multiples of the pooled standard deviation of the two
conditions, regardless of the units of measure such as time, distance and speed. The data
extraction process, and its subsequent interpretation, could be improved by converting
all performance data to a common metric of the percent change in mean power.
26
Contemporary mixed-model meta-analysis would have two main advantages over the
fixed-effect approach of Matson and Tran.[4]
First, incorporating study and subject
characteristics as multiple predictors within a mixed-model meta-analysis would allow
the effect on performance of a specific characteristic to be isolated and quantified. A
second advantage is that random differences in the magnitude of the performance effect
between studies could be estimated.
The inclusion of ergolytic effects with ammonium chloride supplementation in a meta-
analytic review could promote further understanding of performance effects when blood
pH is altered. The same reasoning supports consideration within a new meta-analysis of
sodium citrate as another alkalotic supplement that has the potential to enhance
performance, possibly inducing fewer gastrointestinal symptoms than sodium
bicarbonate.[6]
The primary aim of this review was to use mixed-model meta-analysis to estimate the
performance effects of sodium bicarbonate, sodium citrate and ammonium chloride
supplementation, as well as estimating the modifying effects of study and subject
characteristics. A secondary aim was to quantify the supplement-induced changes in
blood bicarbonate concentration, lactate concentration and pH. Meta-analysing these
physiological variables may enhance an understanding of the corresponding
performance effects.
27
1. Methods
1.1 Study Selection
One author conducted a literature search for performance effects of sodium bicarbonate,
sodium citrate and ammonium chloride supplementation, using PubMed and Google
Scholar using the keywords „sodium bicarbonate‟, „exercise‟, „performance‟, „alkalosis,
and „pH‟ and reference lists of review and original research articles published in English
up to and including December 2009. The search yielded 91 potentially eligible studies
and 330 observations of performance effects. For each potentially eligible study, two
authors recorded study and subject characteristics, and performance test results in a
spreadsheet. Many studies yielded multiple observations arising from multiple
performance bouts, supplement doses, treatments, exercise protocols or outcome
measures. Observations of performance effects were excluded for the following reasons:
a performance test with a prior exercise bout (i.e. a pre-load) (23 estimates); any
supplementation before the day of the performance test (2 estimates); failure to
randomize or balance the sequence of supplement and comparison (control or placebo)
treatments (39 estimates); exercise protocols that focused on only small muscle groups
(4 estimates); combining sodium bicarbonate, sodium citrate or ammonium chloride
with other supplements or treatments (15 estimates); insufficient methodology detail or
performance results (47 estimates); and the failure to give sufficient details of
supplement dose (11 estimates). The final data set consisted of 188 estimates from 59
studies, all of which were crossovers.
28
1.2 Data Extraction
1.2.1 Performance Measures
Performance effects from all studies were converted to percent change in mean power in
a time trial, so that meta-analysed performance effects could be applied directly to
athletic performance. For performance effects reported in units of speed, distance or
time, mean power was calculated from the speed-power relationship, P = k·Sx = k(D/t)
x
where P is power, s is speed and k and x are constants.[9]
The constant x was 1.0 for
running and cycle ergometry, 2.0 for swimming and 3.0 for rowing ergometry.[9]
In sub-
maximal time-to-exhaustion tests, the exercise duration was converted to a percentage
change in power using the model of Léger et al.[10]
P = a – b·ln(T). The constants a and
b were estimated from the mean VO2max of the subjects in the study using simple linear
regression: a = 111.4 + 0.11VO2max and b = 12.1 – 0.042VO2max, where VO2max is
expressed in ml.min-1
.kg-1
; the constants in these equations were derived from a meta-
analysis of effects of carbohydrate on performance (T.J. Vandenbogaerde and W.G.
Hopkins, personal communication). The critical-power model was used for time-to-
exhaustion tests where the intensity was above VO2max; power was calculated using P =
CP + AWC/T where P is power, CP is critical power, AWC is the anaerobic work
capacity, and T is the test duration.[9]
CP and AWC were estimated from VO2max using
simple linear equations described by Hopkins et al.[9]
. After converting performance
estimates to power using these three equations, the value for the experimental condition
was divided by the control value, with the result expressed as a percentage to give the
change in mean power.
For each converted performance effect, standard errors were calculated to indicate the
level of imprecision. Where exact p-values were given, standard errors were directly
29
calculated via the use of the t-distribution; for those effects without an exact p-value,
standard errors were calculated via typical errors of measurement, on the assumption
that we could estimate the typical error reasonably accurately for these studies. The
assumption was that studies with similar test protocols and subject characteristics would
have similar typical errors. We then calculated standard error from the relationship
between standard error and typical error: standard error = (typical error·2)/(sample
size).
1.2.2 Physiological Measures
For [HCO3-], pH and [La
-] we used a similar process as with performance measures to
determine standard error and typical error values. Note, however, that p-values were
almost invariably for comparisons between pre- and post-supplementation within a
condition, rather than changes between treatments at a given time point, as was the case
with performance results. In the studies that allowed direct standard error calculation
from exact p-values, we fitted a linear regression line to the scatter for the relationship
between effect magnitude and typical error. There was a trend for greater error values
with increased effect magnitude. We excluded observations that deviated from this trend
by reporting improbably small typical errors, as this suggested either that the errors or
effects were incorrect. We then analysed the remaining results by treating [HCO3-], pH
and [La-] values from all studies as those for subjects in an experimental study with
repeated measures. Given that error values were derived from the repeated measures for
each variable, standard errors were not used as determinants when weighting
observations in this part of the analysis.
30
1.2.3 Publication Bias and Outliers
To reduce effects of publication bias, we examined the standard error against the t-
value[11]
for each predicted effect, and inspected the plot for signs of asymmetrical
scatter (Figure 1). This plot is effectively an improved version of the funnel plot,
because the scatter of the effects is adjusted for the uncertainty in the estimates and for
the contribution of study covariates. Asymmetrical scatter may indicate a bias toward
publication of large performance effects, evidenced by a dearth of negative t-values at a
given standard error value. A vertical line was drawn at the standard error value that
divided the scatter into a symmetrical plot on the left and an asymmetrical plot on the
right. The meta-analysis was performed only for those estimates within the symmetrical
plot. The descriptive statistics for the 39 useable studies and corresponding 83
observations included in the meta-analysis are shown in Table 1. There were 38 studies
and 137 observations for sodium bicarbonate, 16 studies and 45 observations for sodium
citrate and 5 studies and 6 observations for ammonium chloride.
31
Table 1. Study and subject characteristics for performance effects included in the meta-analysis. Studies have been sorted from largest to smallest effects on power.
Dose (mmol.kg-1BM)
Duration (min)
Bout No.
§Double-blind design
Proportion male subjects Athletes
Power effect (%)
Power SE (%)
SODIUM BICARBONATE McNaughton 1991[31] 3.6 6.0 1 yes 1.0 yes 8.2 2.0 Artioli 2007[32] 3.6 0.4 2 yes 1.0 yes 5.8 2.4 Bishop 2004[33] 3.6 0.1 5 yes 0.0 no 5.6 1.8 Artioli 2007[32] 3.6 0.4 3 yes 1.0 yes 5.5 2.4 Bishop 2004[33] 3.6 0.1 4 yes 0.0 no 5.4 1.8 Zajac 2009[25] 3.6 0.4 1 yes 1.0 yes 5.3 1.5 Bishop 2004[33] 3.6 0.1 3 yes 0.0 no 4.4 1.8 Artioli 2007[32] 3.6 0.4 1 yes 1.0 yes 3.8 2.4 Gao 1988[34] 2.9 1.0 5 yes 1.0 yes 3.8 1.1 Zajac 2009[25] 3.6 0.5 4 yes 1.0 yes 3.6 1.8 Bishop 2004[33] 3.6 0.1 2 yes 0.0 no 3.5 1.8 Balberman 1983[35] 3.6 1.0 1 yes 1.0 no 3.4 2.5 Lindh 2008[36] 3.6 1.9 1 yes 1.0 yes 3.2 1.3 Goldfinch 1988[37] 4.8 1.0 1 yes 1.0 no 3.0 0.6 George 1988[38] 2.4 26 1 yes 1.0 no 2.7 1.2 Van Montfoort 2004[16] 3.6 1.3 1 yes 1.0 yes 2.7 1.1 Pruscino 2008[39] 3.6 2.1 2 yes 1.0 yes 2.6 1.4 Gao 1988[34] 2.9 0.9 4 yes 1.0 yes 2.5 1.1 Wilkes 1983[40] 3.6 2.1 1 no 1.0 yes 2.4 0.7 Zajac 2009[25] 3.6 0.5 3 yes 1.0 yes 2.4 1.5 McCartney 1983[41] 3.6 0.1 1 yes 1.0 no 2.2 2.3 Lavender 1989[42] 3.6 0.2 10 yes 0.4 no 2.0 0.6 Kozac-Collins 1994[26] 3.6 8.4 1 yes 0.0 yes 1.8 1.1 Wilkes 1983[40] 3.6 2.1 1 yes 1.0 yes 1.8 0.7 Pierce 1992[43] 2.4 0.9 1 yes 1.0 yes 1.7 1.5 Bird 1995[44] 3.6 4.3 1 no 1.0 yes 1.6 0.3 Lavender 1989[42] 3.6 0.2 9 yes 0.4 no 1.5 0.5 Lavender 1989[42] 3.6 0.2 7 yes 0.4 no 1.4 0.5 Lavender 1989[42] 3.6 0.2 5 yes 0.4 no 1.2 0.4 Lavender 1989[42] 3.6 0.2 6 yes 0.4 no 1.2 0.4 Pruscino 2008[39] 3.6 2.1 1 yes 1.0 yes 1.2 1.4 Bird 1995[44] 3.6 4.3 1 yes 1.0 yes 1.1 0.3 Klein 1987[45] 3.6 2.0 1 yes 1.0 no 1.1 0.5 Lavender 1989[42] 3.6 0.2 8 yes 0.4 no 1.1 0.4 Lavender 1989[42] 3.6 0.2 2 yes 0.4 no 0.9 0.4 Lavender 1989[42] 3.6 0.2 3 yes 0.4 no 0.9 0.4 McCartney 1983[41] 3.6 0.5 1 yes 1.0 no 0.9 2.3 Siegler 2008[46] 3.6 2.1 1 yes 1.0 no 0.9 1.6 Bishop 2004[33] 3.6 0.1 1 yes 0.0 no 0.8 1.8 Lavender 1989[42] 3.6 0.2 1 yes 0.4 no 0.8 0.4 Lavender 1989[42] 3.6 0.2 4 yes 0.4 no 0.8 0.4 Katz 1984[47] 2.4 1.6 1 yes 1.0 no 0.5 1.5 Linderman 1992[48] 2.4 6.9 1 yes 1.0 no 0.5 1.1 Stephens 2002[49] 3.6 59 1 yes 1.0 yes 0.2 2.1 Kowalchuk 1984[50] 3.6 10 1 yes 1.0 no 0.0 1.7 Zajac 2009[25] 3.6 0.5 2 yes 1.0 yes 0.0 1.5 Brien 1989[51] 3.6 6.0 1 yes 1.0 yes -0.1 2.0 Marx 2002[52] 3.6 0.1 1 yes 1.0 no -0.2 1.3 Marx 2002[52] 3.6 0.1 1 yes 1.0 no -0.2 1.3
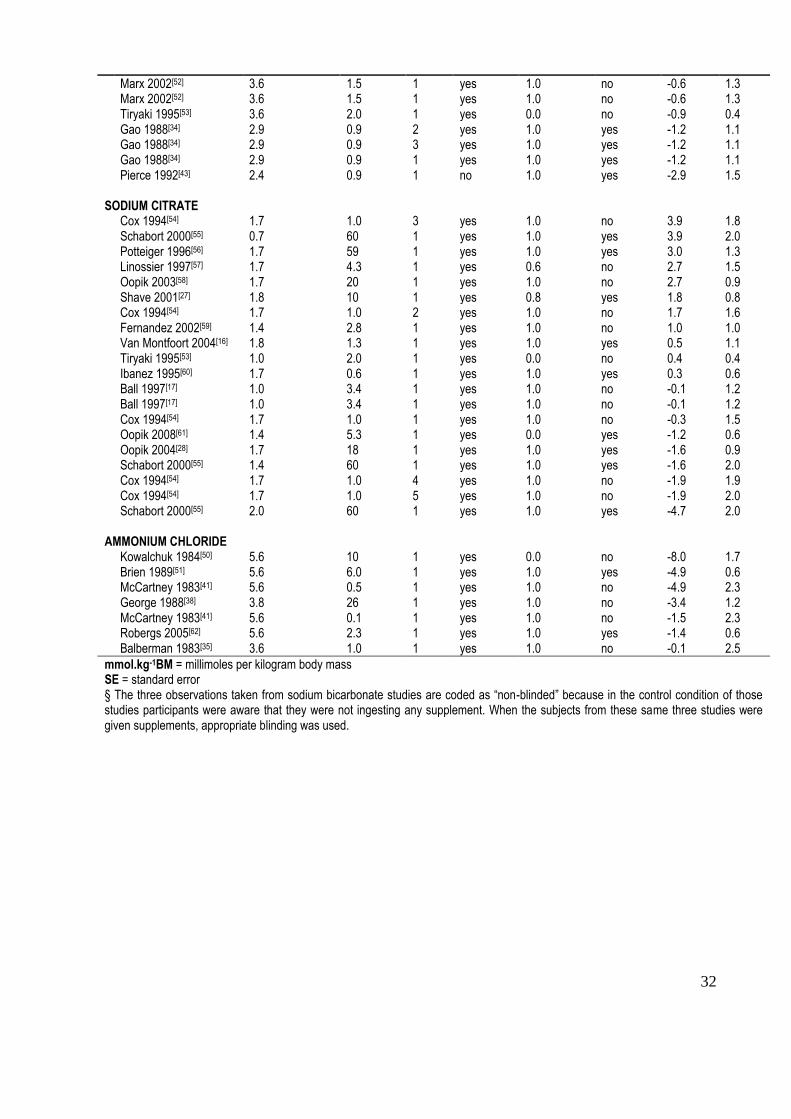
32
Marx 2002[52] 3.6 1.5 1 yes 1.0 no -0.6 1.3 Marx 2002[52] 3.6 1.5 1 yes 1.0 no -0.6 1.3 Tiryaki 1995[53] 3.6 2.0 1 yes 0.0 no -0.9 0.4 Gao 1988[34] 2.9 0.9 2 yes 1.0 yes -1.2 1.1 Gao 1988[34] 2.9 0.9 3 yes 1.0 yes -1.2 1.1 Gao 1988[34] 2.9 0.9 1 yes 1.0 yes -1.2 1.1 Pierce 1992[43] 2.4 0.9 1 no 1.0 yes -2.9 1.5 SODIUM CITRATE Cox 1994[54] 1.7 1.0 3 yes 1.0 no 3.9 1.8 Schabort 2000[55] 0.7 60 1 yes 1.0 yes 3.9 2.0 Potteiger 1996[56] 1.7 59 1 yes 1.0 yes 3.0 1.3 Linossier 1997[57] 1.7 4.3 1 yes 0.6 no 2.7 1.5 Oopik 2003[58] 1.7 20 1 yes 1.0 no 2.7 0.9 Shave 2001[27] 1.8 10 1 yes 0.8 yes 1.8 0.8 Cox 1994[54] 1.7 1.0 2 yes 1.0 no 1.7 1.6 Fernandez 2002[59] 1.4 2.8 1 yes 1.0 no 1.0 1.0 Van Montfoort 2004[16] 1.8 1.3 1 yes 1.0 yes 0.5 1.1 Tiryaki 1995[53] 1.0 2.0 1 yes 0.0 no 0.4 0.4 Ibanez 1995[60] 1.7 0.6 1 yes 1.0 yes 0.3 0.6 Ball 1997[17] 1.0 3.4 1 yes 1.0 no -0.1 1.2 Ball 1997[17] 1.0 3.4 1 yes 1.0 no -0.1 1.2 Cox 1994[54] 1.7 1.0 1 yes 1.0 no -0.3 1.5 Oopik 2008[61] 1.4 5.3 1 yes 0.0 yes -1.2 0.6 Oopik 2004[28] 1.7 18 1 yes 1.0 yes -1.6 0.9 Schabort 2000[55] 1.4 60 1 yes 1.0 yes -1.6 2.0 Cox 1994[54] 1.7 1.0 4 yes 1.0 no -1.9 1.9 Cox 1994[54] 1.7 1.0 5 yes 1.0 no -1.9 2.0 Schabort 2000[55] 2.0 60 1 yes 1.0 yes -4.7 2.0 AMMONIUM CHLORIDE Kowalchuk 1984[50] 5.6 10 1 yes 0.0 no -8.0 1.7 Brien 1989[51] 5.6 6.0 1 yes 1.0 yes -4.9 0.6 McCartney 1983[41] 5.6 0.5 1 yes 1.0 no -4.9 2.3 George 1988[38] 3.8 26 1 yes 1.0 no -3.4 1.2 McCartney 1983[41] 5.6 0.1 1 yes 1.0 no -1.5 2.3 Robergs 2005[62] 5.6 2.3 1 yes 1.0 yes -1.4 0.6 Balberman 1983[35] 3.6 1.0 1 yes 1.0 no -0.1 2.5
mmol.kg-1BM = millimoles per kilogram body mass SE = standard error § The three observations taken from sodium bicarbonate studies are coded as “non-blinded” because in the control condition of those studies participants were aware that they were not ingesting any supplement. When the subjects from these same three studies were given supplements, appropriate blinding was used.
33
1.3 Meta-analytic Model
1.3.1 Performance Measures
A mixed model meta-analysis was used to quantify overall mean performance effects
for each supplement, and modification of effects with different subject and study
characteristics. The Statistical Analysis System (Version 9.2, SAS Institute, Cary, NC)
was used to perform the meta-analyses. Percent effects on mean power output were
converted to factors (=1+effect/100), log transformed for the analysis, and then back-
transformed to percents. Effects were weighted with the inverse of the standard error
squared for that performance effect. Fixed effects (predictors) for the meta-analytic
model were subject blinding (yes or no), test duration (min), performance bouts
(number), subject competitive status (athlete or non-athlete) and subject sex (male or
female). Supplement dose (mmol.kg-1
BM) was modelled as a strictly proportional linear
effect interacted with all effects except subject blinding. Reference conditions for each
supplement were determined from the typical values of each predictor as derived from
eligible studies (e.g., 3.5 mmol.kg-1
BM sodium bicarbonate dose, 1-min test duration).
Supplement performance effects were calculated as the predicted performance effect
under the reference conditions. The modifying effects on the overall performance
outcome of changing values of specific predictors were also calculated: either
differences between levels of a nominal covariate (e.g., male-female) or approximately
two standard deviations of a numeric covariate (i.e., a typically low value to a typically
high value). Unexplained true variation within and between studies was estimated from
random effects and expressed as standard deviations.
34
1.3.2 Physiological Measures
The meta-analytic model was different from that used for performance. Here, the values
for each study were analysed similar to the repeated measurements from a subject in a
crossover study of the time course of the four treatments (placebo, bicarbonate, citrate,
ammonium chloride). In the meta-analytic model for the physiological variables, the
fixed-effect terms consisted of three interactions of variables specifying six time points
(TimeGroup, with values pre-supplementation, pre-exercise, and four post-exercise
times), the four supplement conditions (Condition, with values bicarbonate, citrate,
ammonium chloride, control), the dose of supplement (in mmol.kg-1
BM), and dummy
variables with values of 0 and 1 specifying whether the given observation was before or
after exercise (Exercise01) and before or after supplementation (Supplement01). The
terms represented a different contribution for exercise at each exercise time point
(TimeGroup*Exercise01), a different contribution for each of the four supplement
conditions at each supplement time point (Condition*TimeGroup*Supplement01), and a
linear contribution of dose of each supplement that was different for each supplement
but the same at every time point for the given supplement
(Condition*Supplement01*Dose). The random effects were study identity, the
interaction of study identity with Condition, Exercise01 and Supplement01 (to allow for
these three clusters of repeated measurement within studies), and the residual. The
observations from a given study were weighted by a value corresponding to the number
of subjects in the study divided by the total number of subjects in all studies.
To investigate the extent to which changes in blood bicarbonate concentration
accounted for changes in performance, we plotted the relationship between pre-exercise
[HCO3-] and performance. We also examined the scatter for the effect of the
35
supplementation period on blood bicarbonate concentration. For these two analyses, we
fitted simple regression lines for each variable and interpreted the magnitude of each
effect using a published scale for interpreting correlation coefficients: 0.0 trivial; 0.1
small; 0.3 moderate; 0.5 large. [11]
1.3.3 Outcome statistics
Performance effects were reported as the effect (%) ±90% confidence limits. We made
probabilistic magnitude-based inferences about the true values of outcomes, based on
the likelihood that the outcome was substantially positive or substantially negative.[11]
Thresholds for small, moderate and large effects on performance were set at 0.3, 0.9 and
1.6 of the variation in elite athletes‟ performance from one competition to another,
which is ~0.8% and ~3.5% for running and cycling respectively (T.J. Vandenbogaerde
and W.G. Hopkins, personal communication); therefore the corresponding smallest
effects are ~0.25% (0.8 x 0.3) and ~1.0% (3.5 x 0.3).[11]
Given that running, cycling and
other exercise types featured in the exercise protocols in our eligible studies, we chose
0.5% for the smallest effect for all included exercise protocols. The corresponding
thresholds for moderate and large effects were 1.5% and 2.7%. For performance under
reference conditions, an effect was deemed clear if there was a possible benefit (>25%)
and harm was sufficiently unlikely that the odds ratio of benefit/harm was >66. A
modifying effect was deemed unclear if its 90% confidence interval overlapped
thresholds for smallest worthwhile positive and negative effects. Correlations and their
confidence limits for the relationships between effects on performance and blood
measures were based on the assumption of equal contribution of each study and are
therefore only approximate.
36
2. Results
2.1 Performance Measures
Figure 1 shows the plot used to assess the presence of outliers and publication bias. No
study had a sufficiently large t value to justify its exclusion as an outlier, but an
asymmetrical scatter consistent with publication bias is apparent for predicted effects
with standard errors greater than ~2.7%. Performance effects with errors greater than
this value were therefore excluded from the analysis.
37
0 1 2 3 4 5 6-5
-3
-1
1
3
5
Standard Error (%)
t-value
Figure 1. Scatter-plot to investigate publication bias for performance measures. The dashed vertical line at a standard error of ~2.7% divides the plot into a region with symmetric scatter to the left and a region to the right where a dearth of t-values within the dashed rectangle is apparent.
38
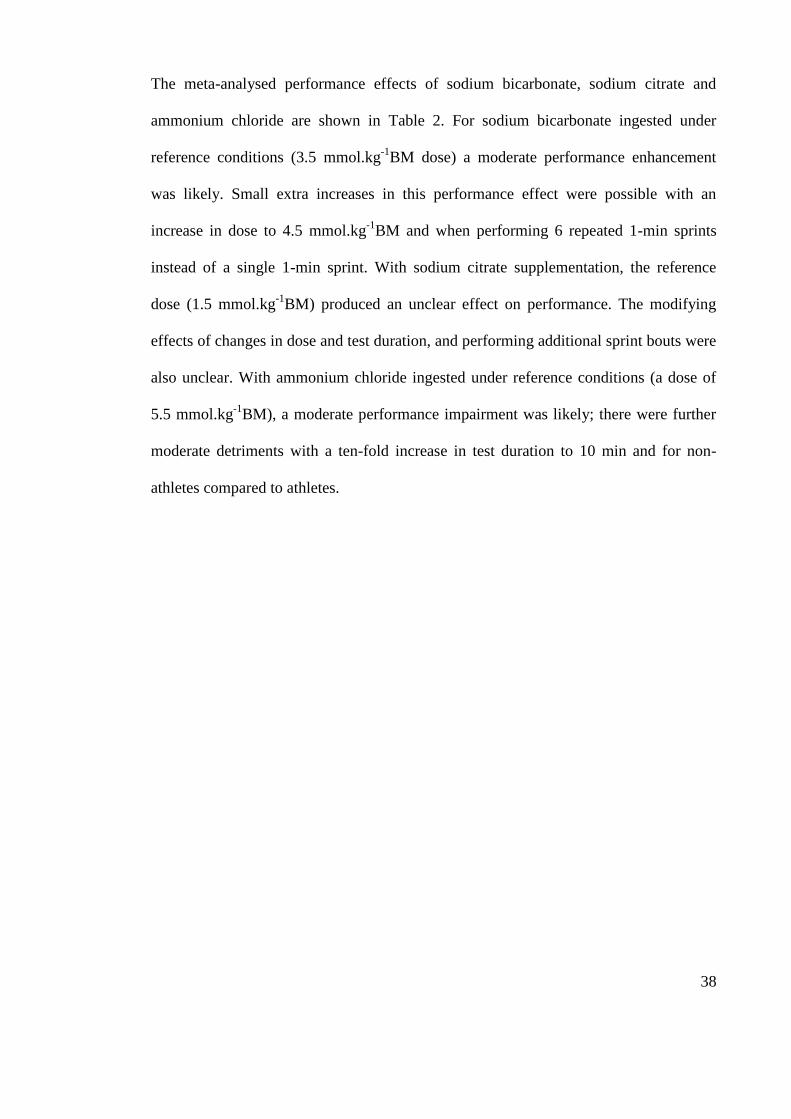
The meta-analysed performance effects of sodium bicarbonate, sodium citrate and
ammonium chloride are shown in Table 2. For sodium bicarbonate ingested under
reference conditions (3.5 mmol.kg-1
BM dose) a moderate performance enhancement
was likely. Small extra increases in this performance effect were possible with an
increase in dose to 4.5 mmol.kg-1
BM and when performing 6 repeated 1-min sprints
instead of a single 1-min sprint. With sodium citrate supplementation, the reference
dose (1.5 mmol.kg-1
BM) produced an unclear effect on performance. The modifying
effects of changes in dose and test duration, and performing additional sprint bouts were
also unclear. With ammonium chloride ingested under reference conditions (a dose of
5.5 mmol.kg-1
BM), a moderate performance impairment was likely; there were further
moderate detriments with a ten-fold increase in test duration to 10 min and for non-
athletes compared to athletes.
39
Table 2. Effects on mean power (with ±90% confidence limits and inferences) for sodium bicarbonate, sodium citrate and ammonium chloride in the reference condition, with modifying effects of study and subject characteristics. Reference condition: a single 1-min sprint with blinded male athletes consuming 3.5 mmol.kg-1BM sodium bicarbonate, or 1.5 mmol.kg-1BM sodium citrate, or 5.5 mmol.kg-1BM ammonium chloride. Effect magnitudes are interpreted with reference to thresholds for small (0.5%), moderate (1.5%) and large (2.7%) effects.
Effect (%) ±90%CL Inference
SODIUM BICARBONATE
Reference condition 1.7 2.0 moderate
Modifying effects
1 mmol.kg-1BM 0.5 0.6 small
5 extra bouts 0.6 0.4 small
10x duration -0.6 0.9 small
Non-athletes -1.1 1.1 small
Females -0.7 1.4 unclear
Non-blinded 0.2 0.7 unclear
SODIUM CITRATE
Reference condition 0.0 1.3 unclear
Modifying effects
1 mmol/kg 0.0 0.8 unclear
5 extra bouts -2.8 3.5 unclear
10x duration -0.1 1.1 unclear
Non-athletes 1.8 1.5 moderate
Females 0.1 2.0 Unclear
AMMONIUM CHLORIDE
Reference condition -1.6 1.9 moderate
Modifying effects
1 mmol/kg -0.3 0.3 trivial
10x duration -2.5 2.0 moderate
Non-athletes -2.6 2.8 moderate
Females -1.2 4.2 Unclear
Overall between-study random differences: ±1.2% (90%CL ±0.5%). mmol.kg-1BM = mmillimoles per kilogram body mass
40
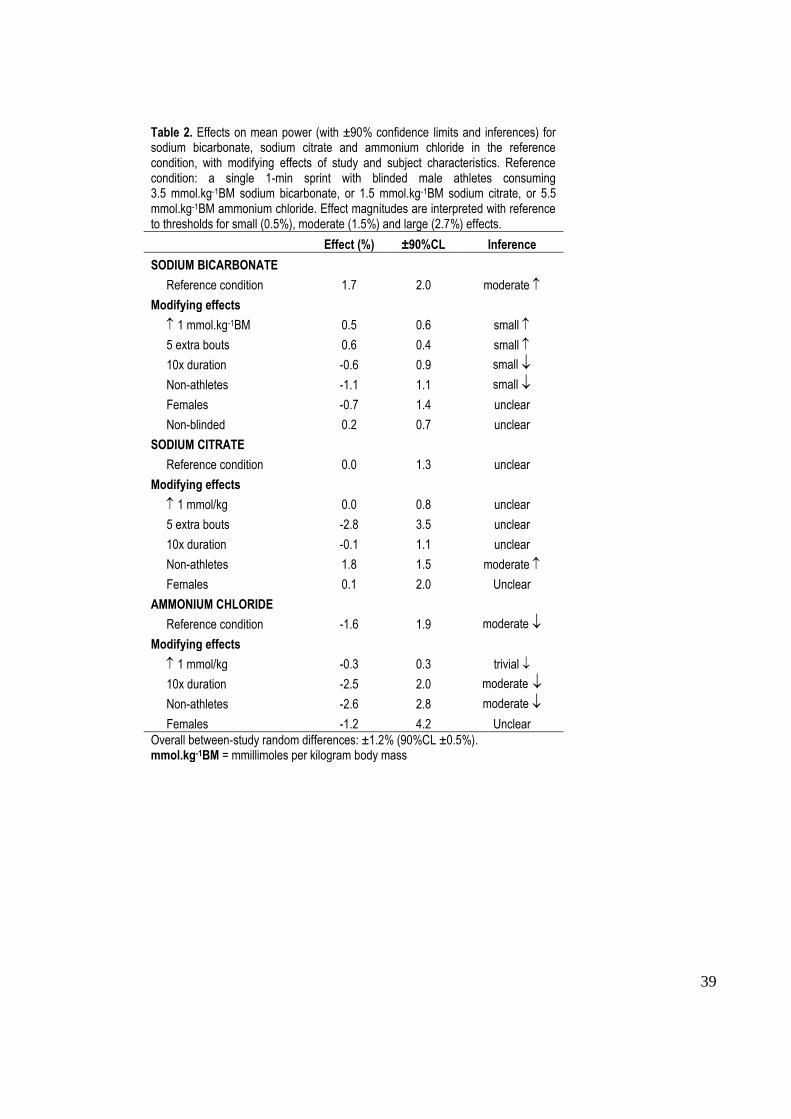
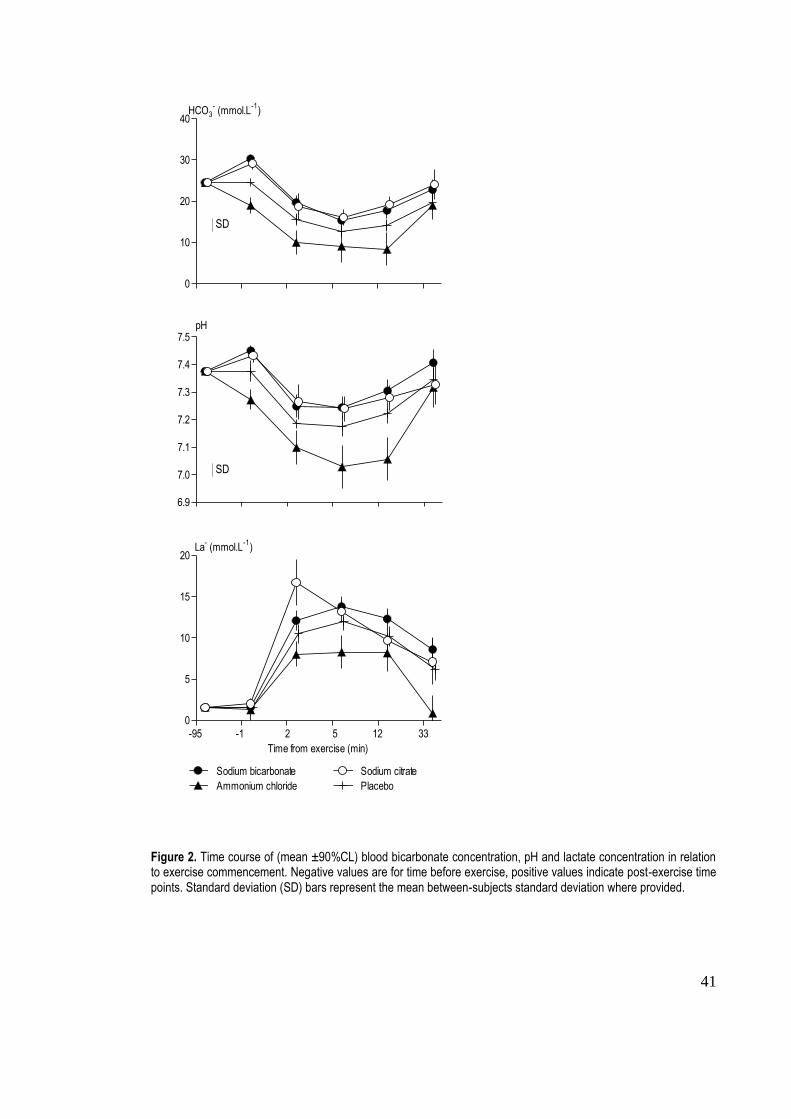
2.2 Physiological Measures
Figure 2 shows the meta-analysed time course of blood [HCO3-], pH and [La
-] for three
supplement conditions: sodium bicarbonate, sodium citrate, ammonium chloride and
placebo. The only clear mean (±90%CL) differences in [HCO3-] in comparison to the
placebo condition were an overall 3.9 (±0.9) mmol.L-1
increase with sodium
bicarbonate, and an overall 4.2 (±1.7) mmol.L-1
decrease with ammonium chloride.
There was also a clear mean increase in pH of 0.069 (±0.018) with sodium bicarbonate
compared with placebo.
41
0
10
20
30
40HCO3
- (mmol.L
-1)
6.9
7.0
7.1
7.2
7.3
7.4
7.5pH
0
5
10
15
20
-95 -1 52 12 33
Ammonium chloride Placebo
Sodium bicarbonate Sodium citrate
Time from exercise (min)
La- (mmol.L
-1)
Figure 2. Time course of (mean ±90%CL) blood bicarbonate concentration, pH and lactate concentration in relation to exercise commencement. Negative values are for time before exercise, positive values indicate post-exercise time points. Standard deviation (SD) bars represent the mean between-subjects standard deviation where provided.
SD
SD
42
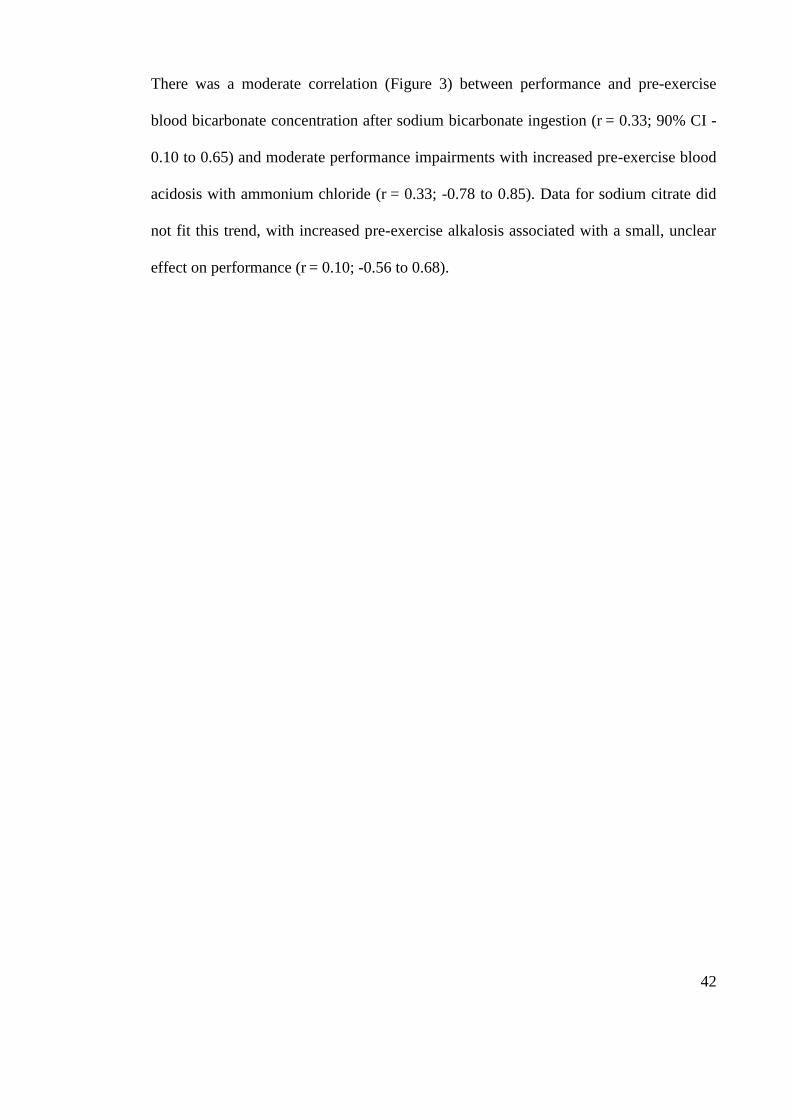
There was a moderate correlation (Figure 3) between performance and pre-exercise
blood bicarbonate concentration after sodium bicarbonate ingestion (r = 0.33; 90% CI -
0.10 to 0.65) and moderate performance impairments with increased pre-exercise blood
acidosis with ammonium chloride (r = 0.33; -0.78 to 0.85). Data for sodium citrate did
not fit this trend, with increased pre-exercise alkalosis associated with a small, unclear
effect on performance (r = 0.10; -0.56 to 0.68).
43
-10 -5 0 5 10
-10
-5
0
5
10
Sodium bicarbonate
Sodium citrate
Ammonium chloride
Change in power (%)
Change in [HCO3-] (mmol.L
-1)
Figure 3. Individual study-estimates of percent effects on performance plotted against pre-exercise change in blood bicarbonate concentration after supplement ingestion. Regression lines are shown for the three supplements.
44
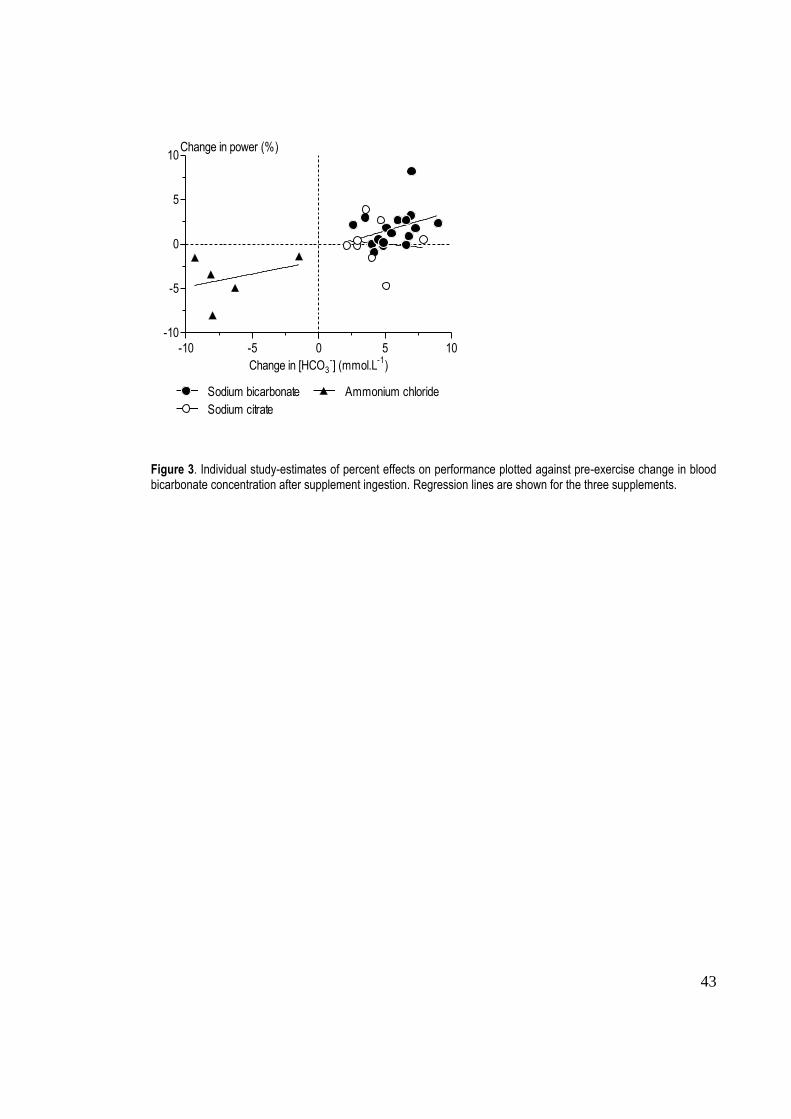
There was a very high correlation (Figure 4) between increased pre-exercise [HCO3-]
and time from sodium citrate ingestion (r = 0.76; 0.25 to 0.94). For sodium bicarbonate,
there was a trivial effect of supplement absorption time on [HCO3-] (r
= 0.07, -0.37 to
0.48), and there was a moderate decrement in [HCO3-] as time from ammonium chloride
ingestion increased (r = 0.42, -0.61 to 0.92); however both these effects were unclear.
45
0 30 60 90 120 150 180
-4
-2
0
2
4
6
Sodium bicarbonate
Sodium citrate
Ammonium chloride
Time (min)
Change in [HCO3-] per unit dose
[mmol.L-1
(mmol.kg-1
BM)-1
]
Figure 4. Individual study-estimates of percent effects on performance plotted against pre-exercise change in blood bicarbonate concentration after supplement ingestion. Regression lines are shown for each supplement.
46
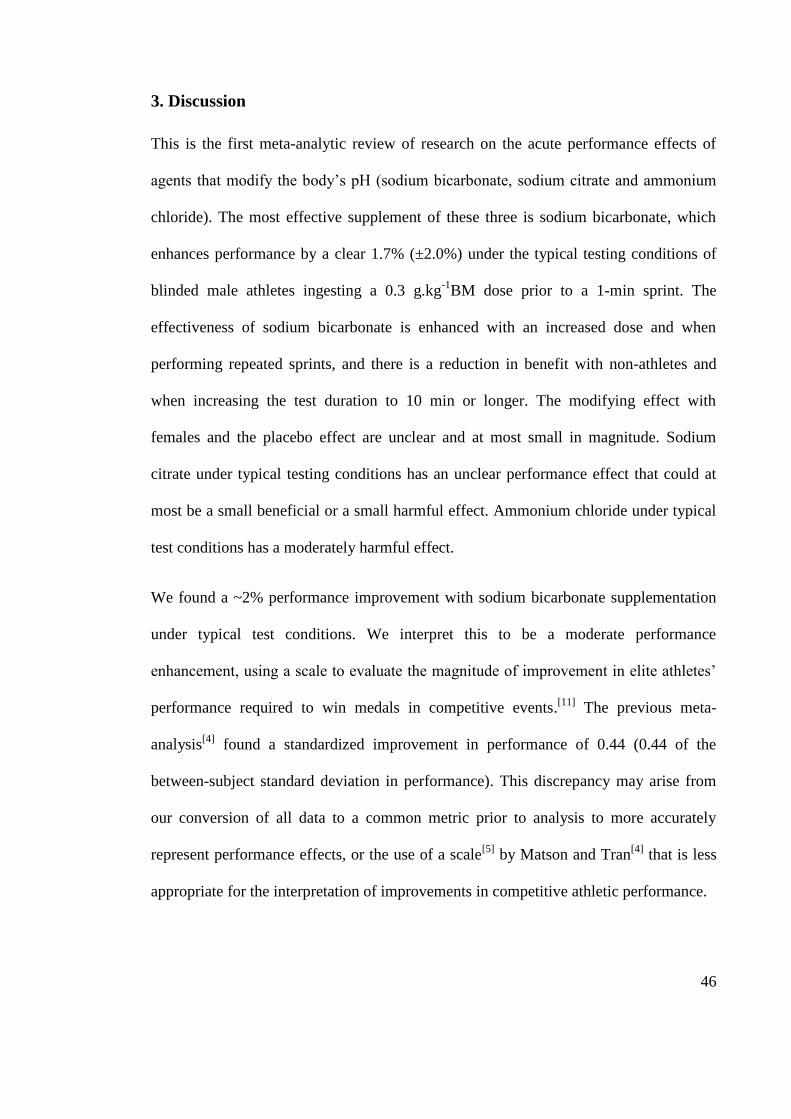
3. Discussion
This is the first meta-analytic review of research on the acute performance effects of
agents that modify the body‟s pH (sodium bicarbonate, sodium citrate and ammonium
chloride). The most effective supplement of these three is sodium bicarbonate, which
enhances performance by a clear 1.7% (±2.0%) under the typical testing conditions of
blinded male athletes ingesting a 0.3 g.kg-1
BM dose prior to a 1-min sprint. The
effectiveness of sodium bicarbonate is enhanced with an increased dose and when
performing repeated sprints, and there is a reduction in benefit with non-athletes and
when increasing the test duration to 10 min or longer. The modifying effect with
females and the placebo effect are unclear and at most small in magnitude. Sodium
citrate under typical testing conditions has an unclear performance effect that could at
most be a small beneficial or a small harmful effect. Ammonium chloride under typical
test conditions has a moderately harmful effect.
We found a ~2% performance improvement with sodium bicarbonate supplementation
under typical test conditions. We interpret this to be a moderate performance
enhancement, using a scale to evaluate the magnitude of improvement in elite athletes‟
performance required to win medals in competitive events.[11]
The previous meta-
analysis[4]
found a standardized improvement in performance of 0.44 (0.44 of the
between-subject standard deviation in performance). This discrepancy may arise from
our conversion of all data to a common metric prior to analysis to more accurately
represent performance effects, or the use of a scale[5]
by Matson and Tran[4]
that is less
appropriate for the interpretation of improvements in competitive athletic performance.
47
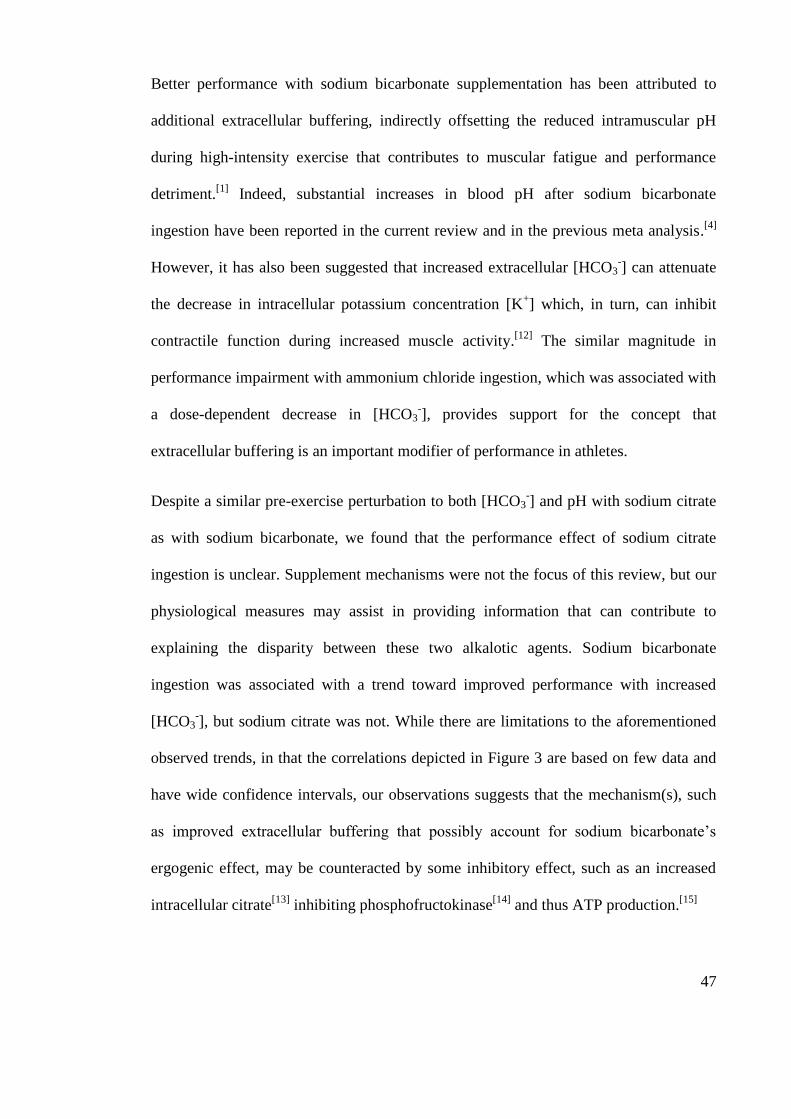
Better performance with sodium bicarbonate supplementation has been attributed to
additional extracellular buffering, indirectly offsetting the reduced intramuscular pH
during high-intensity exercise that contributes to muscular fatigue and performance
detriment.[1]
Indeed, substantial increases in blood pH after sodium bicarbonate
ingestion have been reported in the current review and in the previous meta analysis.[4]
However, it has also been suggested that increased extracellular [HCO3-] can attenuate
the decrease in intracellular potassium concentration [K+] which, in turn, can inhibit
contractile function during increased muscle activity.[12]
The similar magnitude in
performance impairment with ammonium chloride ingestion, which was associated with
a dose-dependent decrease in [HCO3-], provides support for the concept that
extracellular buffering is an important modifier of performance in athletes.
Despite a similar pre-exercise perturbation to both [HCO3-] and pH with sodium citrate
as with sodium bicarbonate, we found that the performance effect of sodium citrate
ingestion is unclear. Supplement mechanisms were not the focus of this review, but our
physiological measures may assist in providing information that can contribute to
explaining the disparity between these two alkalotic agents. Sodium bicarbonate
ingestion was associated with a trend toward improved performance with increased
[HCO3-], but sodium citrate was not. While there are limitations to the aforementioned
observed trends, in that the correlations depicted in Figure 3 are based on few data and
have wide confidence intervals, our observations suggests that the mechanism(s), such
as improved extracellular buffering that possibly account for sodium bicarbonate‟s
ergogenic effect, may be counteracted by some inhibitory effect, such as an increased
intracellular citrate[13]
inhibiting phosphofructokinase[14]
and thus ATP production.[15]
48
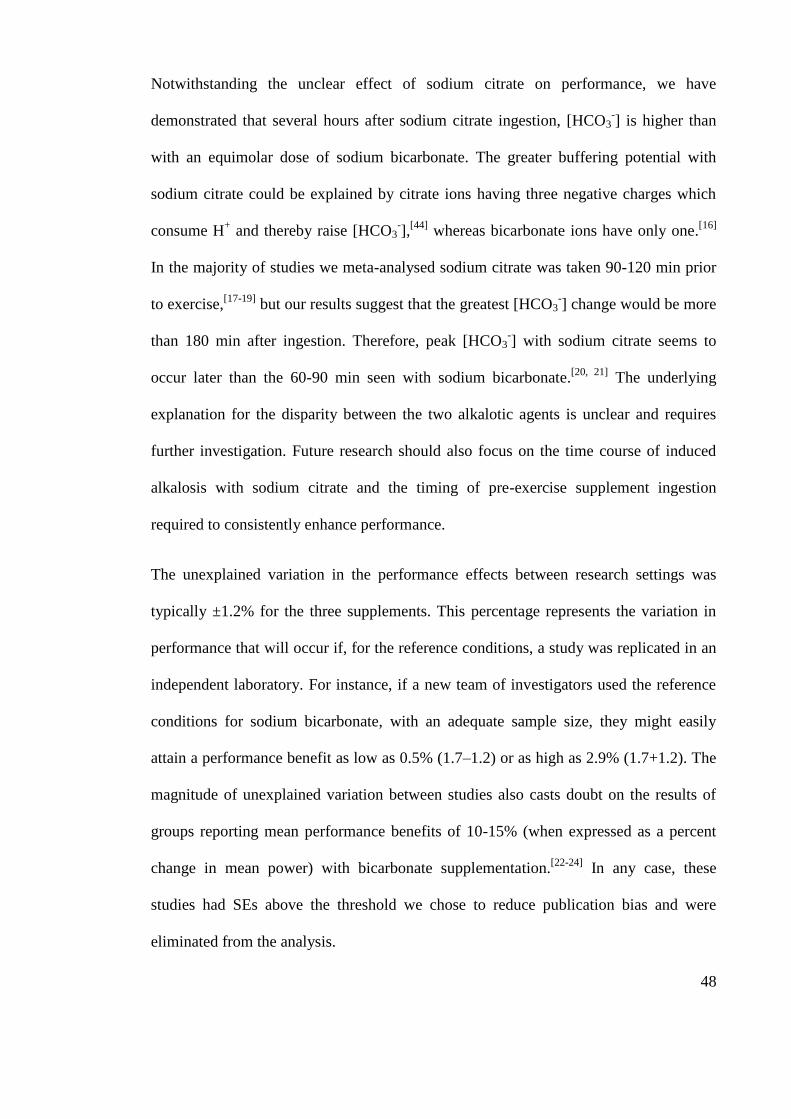
Notwithstanding the unclear effect of sodium citrate on performance, we have
demonstrated that several hours after sodium citrate ingestion, [HCO3-] is higher than
with an equimolar dose of sodium bicarbonate. The greater buffering potential with
sodium citrate could be explained by citrate ions having three negative charges which
consume H+ and thereby raise [HCO3
-],
[44] whereas bicarbonate ions have only one.
[16]
In the majority of studies we meta-analysed sodium citrate was taken 90-120 min prior
to exercise,[17-19]
but our results suggest that the greatest [HCO3-] change would be more
than 180 min after ingestion. Therefore, peak [HCO3-] with sodium citrate seems to
occur later than the 60-90 min seen with sodium bicarbonate.[20, 21]
The underlying
explanation for the disparity between the two alkalotic agents is unclear and requires
further investigation. Future research should also focus on the time course of induced
alkalosis with sodium citrate and the timing of pre-exercise supplement ingestion
required to consistently enhance performance.
The unexplained variation in the performance effects between research settings was
typically ±1.2% for the three supplements. This percentage represents the variation in
performance that will occur if, for the reference conditions, a study was replicated in an
independent laboratory. For instance, if a new team of investigators used the reference
conditions for sodium bicarbonate, with an adequate sample size, they might easily
attain a performance benefit as low as 0.5% (1.7–1.2) or as high as 2.9% (1.7+1.2). The
magnitude of unexplained variation between studies also casts doubt on the results of
groups reporting mean performance benefits of 10-15% (when expressed as a percent
change in mean power) with bicarbonate supplementation.[22-24]
In any case, these
studies had SEs above the threshold we chose to reduce publication bias and were
eliminated from the analysis.
49
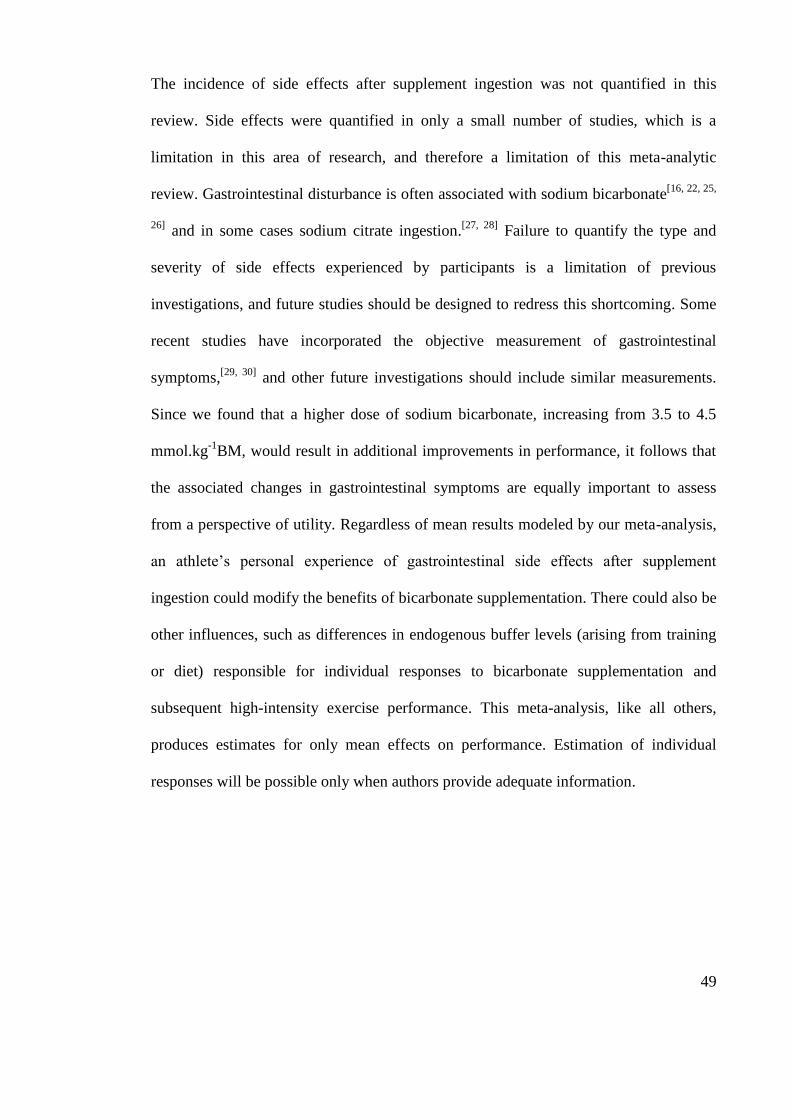
The incidence of side effects after supplement ingestion was not quantified in this
review. Side effects were quantified in only a small number of studies, which is a
limitation in this area of research, and therefore a limitation of this meta-analytic
review. Gastrointestinal disturbance is often associated with sodium bicarbonate[16, 22, 25,
26] and in some cases sodium citrate ingestion.
[27, 28] Failure to quantify the type and
severity of side effects experienced by participants is a limitation of previous
investigations, and future studies should be designed to redress this shortcoming. Some
recent studies have incorporated the objective measurement of gastrointestinal
symptoms,[29, 30]
and other future investigations should include similar measurements.
Since we found that a higher dose of sodium bicarbonate, increasing from 3.5 to 4.5
mmol.kg-1
BM, would result in additional improvements in performance, it follows that
the associated changes in gastrointestinal symptoms are equally important to assess
from a perspective of utility. Regardless of mean results modeled by our meta-analysis,
an athlete‟s personal experience of gastrointestinal side effects after supplement
ingestion could modify the benefits of bicarbonate supplementation. There could also be
other influences, such as differences in endogenous buffer levels (arising from training
or diet) responsible for individual responses to bicarbonate supplementation and
subsequent high-intensity exercise performance. This meta-analysis, like all others,
produces estimates for only mean effects on performance. Estimation of individual
responses will be possible only when authors provide adequate information.
50
4. Conclusion
We recommend ingestion of sodium bicarbonate at a dose of 0.3 g.kg-1
BM for
performance enhancements of ~2% in short-duration (~1-min), high intensity sprints,
for male and female athletes. The performance effect will be greater with an increase in
dose and when performing repeated sprints, and gains will be diminished with non-
athletes and with performances lasting ~10 min or more. We do not recommend sodium
citrate supplementation as it is currently implemented, but more research is needed to
investigate the possibility that there could be a performance benefit if exercise
commences ~3h after ingestion. Future investigations should also include detailed
documentation of gastrointestinal side effects, which could give more information about
individual responses to the supplement.
51
References
1. Gledhill N. Bicarbonate ingestion and anaerobic performance. Sports Med 1984;
1:177-80
2. Dennig H, Talbott JH, Edwards HT, et al. Effects of acidosis and alkalosis upon
capacity for work. J Clin Invest 1931; 9:601-13
3. Dill DB, Edwards HT, Talbott JH. Alkalosis and the capacity for work. J Biol Chem
1931; 97:58-9
4. Matson LG, Tran ZV. Effects of sodium bicarbonate ingestion on anaerobic
performance: a meta-analytic review. Int J Sport Nutr 1993; 3(1):2-28
5. Cohen J. Statistical power analysis for the behavioural sciences. Hillsdale, New
Jersey: Lawrence Erlbaum Associates; 1988
6. Burke LM, Pyne DB. Bicarbonate loading to enhance training and competitive
performance. Int J Sport Physiol Perform 2007; 2:93-7
7. Requena B, Zabala M, Padial P, et al. Sodium bicarbonate and sodium citrate:
ergogenic aids? J Strength Cond Res 2005; 19(1):213-24
8. McNaughton L, Siegler J, Midgley A. Ergogenic effects of sodium bicarbonate. Curr
Sports Med Rep 2008; 7(4):230-6
9. Hopkins WG, Schabort EJ, Hawley JA. Reliability of power in physical performance
tests. Sports Med 2001; 31(3):211-34
10. Léger. Gross energy cost of horizontal treadmill and track running. Sports Med
1984; 1:270-7
52
11. Hopkins WG, Marshall SW, Batterham AM, et al. Progressive statistics for studies
in sports medicine and exercise science. Med Sci Sports Exerc 2009; 41(1):3-12
12. Sostaric S, Skinner SL, Brown MJ, et al. Alkalosis increases muscle K+ release, but
lowers plasma [K+] and delays fatigue during dynamic forearm exercise. J
Physiol 2005; 570(1):185-205
13. Kowalchuk JM, Maltais SA, Yamaji K, et al. The effect of citrate loading on
exercise performance, acid-base balance and metabolism. Eur J Appl Physiol
1989; 58:858-64
14. Horswill CA. Effects of bicarbonate, citrate and phosphate loading on performance.
Int J Sport Nutr 1995; 5:111-9
15. Newsholme EA, Leech AR. Biochemistry for the Medical Sciences. Chichester,
London: John Wiley & Sons Ltd; 1983
16. Van Montfoort MCE, Van Dieren L, Hopkins WG, et al. Effects of ingestion of
bicarbonate, citrate, lactate and chloride on sprint running. Med Sci Sports Exerc
2004; 36(7):1239-43
17. Ball D, Maughan RJ. The effect of sodium citrate ingestion on metabolic response
to intense exercise following diet manipulation in man. Exp Physiol 1997;
82:1041-56
18. Potteiger JA, Webster MJ, Nickel GL, et al. The effects of buffer ingestion on
metabolic factors related to distance running performance. Eur J Appl Physiol
1996; 72:365-71
53
19. McNaughton L. Sodium citrate and anaerobic performance: implications of dosage.
Eur J Appl Physiol 1990; 61:392-7
20. Price MJ, Singh M. Time course of blood bicarbonate and pH three hours after
sodium bicarbonate ingestion. Int J Sport Physiol Perform 2008; 3:240-2
21. Renfree A. The time course for changes in plasma [H+] after sodium bicarbonate
ingestion. Int J Sport Physiol Perform 2007; 2:323-6
22. McNaughton L, Cedaro R. Sodium citrate ingestion and its effects on maximal
anaerobic exercise of different durations. Eur J Appl Physiol 1992; 64:36-41
23. McNaughton L, Strange N, Backx K. The effects of chronic sodium bicarbonate
ingestion on multiple bouts of anaerobic work and power output. J Hum Mov
Stud 2000; 38:307-22
24. McNaughton L, Dalton B, Palmer G. Sodium bicarbonate can be used as an
ergogenic aid in high-intensity, competitive cycle ergometry of 1 h duration. Eur
J Appl Physiol 1999; 80:64-9
25. Zajac A, Cholewa J, Poprzecki S, et al. Effects of sodium bicarbonate ingestion on
swim performance in youth athletes. J Sports Sci Med 2009; 8:45-50
26. Kozac-Collins K, Burke ER, Schoene R. Sodium bicarbonate ingestion does not
improve performance in women cyclists Med Sci Sports Exerc 1994;
26(12):1510-5
27. Shave R, Whyte G, Siemann A, et al. The effects of sodium citrate ingestion on
3,000-meter time-trial performance J Strength Cond Res 2001; 15(2):230-4
54
28. Oopik V, Saaremets I, Tipmann S, et al. Effects of acute ingestion of sodium citrate
on metabolism and 5-km running performance: a field study. Can J Appl Physiol
2004; 29(6):691-703
29. Tan F, Polglaze T, Cox G, et al. Effects of induced alkalosis on simulated match
performance in elite female water polo players. Int J Sport Nutr Exerc Metab
2010; 20(3):198-205
30. Cameron SL, McLay-Cooke RT, Brown RC, et al. Increased blood pH but not
performance with sodium bicarbonate supplementation in elite rugby union
players. Int J Sport Nutr Exerc Metab 2010; 20(4):307-21
31. McNaughton L, Cedaro R. The effect of sodium bicarbonate on rowing ergometer
performance in elite rowers. Aust J Sci Med Sport 1991; 23(3):66-9
32. Artioli GG, Gualano B, Coelho DF, et al. Does sodium-bicarbonate ingestion
improve simulated judo performance? Int J Sport Nutr Exerc Metab 2007;
17:206-20
33. Bishop D, Edge J, Davis C, et al. Induced metabolic acidosis affects muscle
metabolism and repeated-sprint ability. Med Sci Sports Exerc 2004; 36(5):807-
13
34. Gao J, Costill DL, Horswill CA, et al. Sodium bicarbonate ingestion improves
performance in interval swimming. Eur J Appl Physiol 1988; 58:171-4
35. Balberman SE, Roby FB. The effects of induced alkalosis and acidosis on the work
capacity of the quadriceps and hamstrings muscle groups. Int J Sports Med
1983; 4:143
55
36. Lindh AM, Peyrebrune MC, Ingham SA, et al. Sodium bicarbonate improves
swimming performance. Int J Sports Med 2008; 29:519-23
37. Goldfinch J, McNaugton L, Davies P. Induced metabolic acidosis and its effects on
400-m racing time. Eur J Appl Physiol 1988; 57:45-8
38. George KP, MacLaren DPM. The effect of induced alkalosis and acidosis on
endurance running at an intensity corresponding to 4mM blood lactate.
Ergonomics. 1988; 31(11):1639-45
39. Pruscino CL, Ross MLR, Gregory JR, et al. Effects of sodium bicarbonate, caffeine
and their combination on repeated 200-m freestyle performance. Int J Sport Nutr
Exerc Metab 2008; 18:116-30
40. Wilkes D, Gledhill N, Smyth R. Effect of acute induced metabolic akalosis on 800-
m racing time. Med Sci Sports Exerc 1983; 15(4):277-80
41. McCartney N, Heigenhauser GJF, Jones NL. Effects of pH on maximal output and
fatigue during short-term dynamic exercise. J Appl Physiol 1983; 55:225-9
42. Lavender G, Bird SR. Effect of sodium bicarbonate ingestion upon repeated sprints.
Brit J Sport Med 1989; 23(1):41-5
43. Pierce EF, Eastman NW, Hammer WH, et al. Effect of induced alkalosis on
swimming time trials. J Sports Sci 1992; 10:255-9
44. Bird SR, Wiles J, Robbins J. The effect of sodium bicarbonate ingestion on 1500-m
racing time. J Sports Sci 1995; 13:399-403
56
45. Klein L. The effect of bicarbonate ingestion on upper body power in trained
athletes. Med Sci Sports Exerc 1987; 19:567
46. Siegler JC, Keatley S, Midgley AW, et al. Pre-exercise alkalosis and acid-base
recovery. Int J Sports Med. 2008; 29:545-51
47. Katz A, Costill DL, King DS, et al. Maximal exercise tolerance after induced
alkalosis. Int J Sports Med 1984; 5:107-10
48. Linderman JK, Kirk L, Musselman J, et al. The effects of sodium bicarbonate and
pyridoxine-alpha-ketoglutarate on short-term maximal exercise capacity. J
Sports Sci 1992; 10:243-53
49. Stephens TJ, McKenna MJ, Canny BJ, et al. Effect of sodium bicarbonate on muscle
metabolism during intense endurance cycling. Med Sci Sports Exerc 2002;
43(4):614-21
50. Kowalchuk JM, Heigenhauser GJF, Jones NL. Effect of pH on metabolic and
cardiorespiratory responses during progressive exercise. J Appl Physiol 1984;
57(5):1558-63
51. Brien DM, McKenzie DC. The effect of induced alkalosis and acidosis on plasma
lactate and work output in elite oarsmen. Eur J Appl Physiol 1989; 58:797-802
52. Marx JO, Gordon SE, Vos NH, et al. Effect of alkalosis on plasma epinephrine
responses to high intensity cycle exercise in humans. Eur J Appl Physiol 2002;
87:72-7
53. Tiryaki GR, Atterbom HA. The effects of sodium bicarbonate and sodium citrate on
600 m running time of trained females. J Sports Med Phys Fit 1995; 35:194-8
57
54. Cox G, Jenkins DG. The physiological and ventilatory responses to repeated 60 s
sprints following sodium citrate ingestion. J Sports Sci 1994;12:469-75
55. Schabort E, Wilson G, Noakes TD. Dose-related elevations in venous pH with
citrate ingestion do not alter 40-km cycling time-trial performance. Eur J Appl
Phys 2000; 83:320-7
56. Potteiger JA, Nickel GL, Webster MJ, et al. Sodium citrate enhances 30 km cycling
performance. Int J Sports Med 1996; 17:7-11
57. Linossier MT, Dormois D, Brégère P, et al. Effect of sodium citrate on performance
and metabolism of human skeletal muscle during supramaximal cycling
exercise. Eur J Appl Physiol 1997; 76:48-54.
58. Oopik V, Saaremets I, Medijainen L, et al. Effects of sodium citrate ingestion before
exercise on endurance performance in well trained college runners. Brit J Sports
Med 2003; 37:485-9
59. Feriche Fernandez-Castanys B. The effect of sodium citrate intake on anaerobic
performance in normoxia and after sudden ascent to moderate altitude. J Sports
Med Phys Fit 2002; 42(2):179-85
60. Ibanez J, Pullinen T, Gorostiaga E, et al. Blood lactate and ammonia in short-term
anaerobic work following induced alkalosis. J Sports Med Phys Fit 1995;
35:187-93
61. Oopik V, Timpmann S, Kadak K, Medijainen L, et al. The effects of sodium citrate
ingestion on metabolism and 1500-m racing time in trained female runners. J
Sports Sci Med 2008; 7:125-31
58
62. Robergs R, Hutchinson K, Hendee S, et al. Influence of pre-exercise acidosis and
alkalosis on the kinetics of acid-base recovery following intense exercise. Int J
Sport Nutr Exerc Metab 2005; 14:59-74
59
CHAPTER TWO (Part B)
Literature Review – Caffeine, Sodium Bicarbonate and Short-
term Endurance Performance
60
2.0 Introduction
Caffeine can enhance short-term endurance performance (maximal efforts of 5-10 min)
(Wiles, Bird, & Hopkins, 1992; Jackman, Wendling, Friars, & Graham, 1996) but
research in this area is limited, particularly in the context of sport-specific performance
and the combination of caffeine with buffering agents. This brief review will focus first
on the performance effects of caffeine and corresponding proposed mechanisms, and
secondly, the rationale for examining effects of caffeine combined with sodium
bicarbonate on performance in simulated rowing competition.
2.1 Mechanisms of action
The exact mechanism by which caffeine improves performance remains unclear (Spriet,
1995; Graham, 2001; Magkos & Kavouras, 2004). The leading hypothesis is the
antagonism of adenosine receptors, which has been observed at caffeine concentrations
that manifest after moderate caffeine intake in humans (Fredholm, 1980, 1995;
Fredholm, Battig, Holmén, Nehlig, & Zvartau, 1999). Other proposed mechanisms that
are relevant to short-term endurance exercise, such as a direct action on calcium
metabolism, inhibition of cyclic AMP, and increased Na+/K
+ ATPase, have been
observed in isolated muscle preparations, but the caffeine concentrations required to
elicit a response would require a very high caffeine intake that is toxic to humans,
therefore counteracting any potential ergogenic effect (Fredholm, 1980, 1995; Fredholm
et al., 1999). Antagonism of adenosine receptors facilitates secondary effects on skeletal
muscle (Kalmar, 2005) and perceived exertion (Kalmar, 2005; Tarnopolsky, 2008) that
may also enhance short-term endurance performance.
61
2.1.1 Adenosine receptor antagonism
The antagonism of adenosine receptors in the central nervous system (CNS) can
facilitate improvement in short-term endurance performance via caffeine
supplementation. Ingested caffeine crosses the blood-brain barrier (McCall, Millington,
& Wurtman, 1982) and binds in the CNS with receptors for adenosine, which has a
similar molecular structure (Fredholm, 1980; McCall et al., 1982; Fredholm, 1995).
Adenosine has an inhibitory effect on neurotransmitter release (Fredholm & Hedqvist,
1980; Fredholm & Dunwiddie, 1988) and caffeine binding to adenosine receptors
stimulates increased release of dopamine, (Ferré, Fuxe, von Euler, Johansson, &
Fredholm, 1992; Fredholm, 1995; Ferré, 2008) which can enhance arousal and
motivation, prolong exercise time (Gandevia, 2001) and reduce central fatigue
(Gandevia, 2001; Davis, Zhao, Stock, Mehl, Buggy, & Hand, 2003). These
physiological effects could potentially enhance short-term endurance performance,
which may be limited by central fatigue (Gandevia, 2001).
2.1.2 Effects on skeletal muscle
Caffeine ingestion may sustain muscle force output during sustained, high-intensity
exercise and thereby enhance performance. It has been suggested that increased
dopamine release via adenosine receptor antagonism can increase muscle activation
(Kalmar, 2005). Muscle force output for a given neural input can increase with caffeine
ingestion (Tarnopolsky, 2008), possibly due to increased spinal and supraspinal
excitability (Kalmar & Cafarelli, 2004) which counteracts the inhibitory action of
adenosine on motor unit activation (Kalmar & Cafarelli, 2004; Kalmar, 2005). If
offsetting muscle fatigue is important in short-term endurance exercise, the ability to
sustain the force of muscle contraction may facilitate performance enhancement.
62
2.1.3 Altered perceived exertion
Caffeine ingestion can alter the perceptual response to high-intensity exercise (Doherty
and Smith, 2005), which for a short-term endurance time trial manifests as an improved
performance (compared with placebo) while attaining the same rating of perceived
exertion (Borg, 1970; Anderson, Bruce, Fraser, Stepto, Klein, Hopkins, & Hawley,
2000; Bruce, Anderson, Fraser, Stepto, Klein, Hopkins, & Hawley, 2000; Skinner,
Jenkins, Coombes, Taaffe, & Leveritt, 2010). It is likely that the reduced perceived
exertion for a set work output occurs due to the analgesic effects of caffeine (Kalmar,
2005), and caffeine may reduce pain perception via antagonism of A1 adenosine
receptors (Sawynok, 1998), therefore the athlete experiences less discomfort with the
accumulation of [H+] (Kalmar, 2005; Tarnopolsky, 2008) during high-intensity exercise.
Moreover, motor unit firing rates and muscle force output are maintained (Davis &
Green, 2009). Reduced perceptual response to the muscular pain associated with high-
intensity exercise could serve to sustain the force of muscle contraction and offset the
point at which exercise intensity is reduced due to voluntary withdrawal (Kalmar &
Cafarelli, 2004).
2.2 Caffeine and short-term endurance performance
Reported effects of caffeine on short-term endurance performance are limited. The first
investigation was conducted in the late 1940s, with a lack of performance effects found
with 1500 m running (Asmussen & Boje, 1948) and then no significant improvements
in high-intensity cycling time to exhaustion were reported in the 1960s (Margaria,
Aghemo, & Rovelli, 1964). However, small sample sizes (n = 3) were used in both
studies, which may have biased results (Hopkins, Marshall, Batterham, & Hanin, 2009).
An improved time to exhaustion at 100% VO2max has more recently been shown using
63
a larger sample size (n = 14) (Jackman et al., 1996). However, time to exhaustion tests
have limited applicability to sports performance in races, which are carried out over set
distances rather than to the point of exhaustion (Spriet, 1995; Burke, 2008); therefore,
the magnitude of increase in time to fatigue could over-represent the expected racing
improvement (Hopkins, Schabort, & Hawley, 2001) due to small increases in power
output eliciting large differences in exercise time (Hopkins et al., 2001). Over the past
20 years, time trials have been used to quantify short-term endurance performance after
caffeine ingestion. For example, simulated 1500 m run time improved by ~ 1.5% after a
3 g absolute dose of coffee (containing 150-200 mg caffeine), which was intended to
represent an athletes‟ pre-race coffee and caffeine consumption (Wiles et al., 1992).
Given the small number of investigations and conflicting findings, further research of
caffeine and performance in 5-10 min time trials are needed to evaluate short-term
endurance effects of caffeine.
2.3 Caffeine and sport-specific performance
It has been suggested that the majority of caffeine and exercise performance research
has a limited applicability to athletes‟ competition performance (Spriet, 1995). To
predict ergogenic effects in a competition, research should be conducted under
conditions that are similar to those in which athletes compete (Spriet, 1995; Burke,
2008). Performance tests should therefore simulate the demands of competition (i.e.
time trials conducted over the race distance rather than time-to-exhaustion tests) (Spriet,
1995) and may include, where appropriate, multiple trials separated by the amount of
time between different rounds in a competition, as has been performed in several recent
investigations (Slater, Rice, Sharpe, Tanner, Jenkins, Gore, & Hahn, 2005; Slater, Rice,
Tanner, Sharpe, Gore, Jenkins, & Hahn, 2006a; Slater, Rice, Tanner, Sharpe, Jenkins, &
64
Hahn, 2006b; Slater, Rice, Sharpe, Jenkins, & Hahn, 2007; Pruscino, Ross, Gregory,
Savage, & Flanagan, 2008). It may also be beneficial to evaluate the effects of caffeine
when study participants have ingested other nutritional ergogenic aids, such as buffering
agents, a regular part of some athletes‟ pre-race routines (Burke, 2008). However, it is
also important to control testing conditions (e.g. maintaining consistent environmental
conditions in the laboratory, recruiting well-trained subjects) to isolate any performance
effects of caffeine (Burke, 2008). Replicating competition demands under well-
controlled laboratory conditions is likely to provide experimental results that provide a
realistic indication of expected improvements in race or competition performance.
2.4 Caffeine, sodium bicarbonate and rowing performance
Rowing performance under simulated racing conditions has been investigated after
caffeine ingestion (Anderson et al., 2000; Bruce et al., 2000; Skinner et al., 2010) and
sodium bicarbonate supplementation (Brien & McKenzie, 1989; McNaughton &
Cedaro, 1991). An additive ergogenic effect may be possible if the supplements are
combined, due to the physiological demands of rowing (6-7 min high-intensity efforts)
coupled with the differing ergogenic mechanisms of caffeine and sodium bicarbonate.
2.4.1 Caffeine and rowing performance
There have been varied results reported of the effects of caffeine on rowing
performance, despite the use of similar experimental protocols. After 6 and 9 mg.kg-
1BM ingestion of caffeine, there were performance improvements of ~1% in a 2000 m
time trial for male (Bruce et al., 2000) and female (Anderson et al., 2000) well-trained
rowers. More recently, no significant performance effect on 2000 m performance was
found with 2,4 and 6 mg.kg-1
BM doses with well-trained oarsmen (Skinner et al., 2010).
65
Given that there are only a few investigations of this type, and findings have been
equivocal, further investigation of 2000 m rowing performance after caffeine
supplementation is warranted.
2.4.2 Sodium bicarbonate and rowing performance
There have been contrasting results reported for investigations of sodium bicarbonate
and rowing performance. In 1989, no significant performance improvements in a 6-min
test were found after 0.3 g.kg-1
sodium bicarbonate ingestion (Brien & McKenzie,
1989), however two years later a similar protocol and bicarbonate dose elicited
substantial performance improvements (McNaughton & Cedaro, 1991). Findings of
sodium bicarbonate supplementation studies could be more applicable to rowing regatta
performances if the performance test covered the same distance as an on-water race
(2000 m, even if simulated on the ergometer) rather than racing for a set period of time.
2.4.3 Combined effects of caffeine and sodium bicarbonate
There has been only one investigation of the potential additive ergogenic effects of
combined caffeine and sodium bicarbonate, in which repeated 200 m freestyle efforts
were performed, to simulate a major swimming competition (Pruscino et al., 2008).
While the authors did not find significant performance improvements, the outcome does
not necessarily indicate the likely effect on rowing performance, as rowing and
swimming races place very different physiological demands on the athlete. Rowing
racing requires 6-8 min efforts that are highly aerobic and anaerobic (Hagerman,
Hagerman, & Mickelson, 1979; Koutedakis & Sharp, 1985; Sechler, 1993) whereas
swimming 200 m requires maximal efforts of a shorter duration (~2 min) (Pruscino et
al., 2008). Therefore, investigation of the combined effects of caffeine and sodium
66
bicarbonate in a rowing context would provide further information on potential sport-
specific effects.
Proposed ergogenic mechanisms of sodium bicarbonate provide strong rationale for its
use prior to rowing events. It is widely held that sodium bicarbonate can improve
performance via offsetting elevations in intramuscular acidity (Linderman & Gosselink,
1994; Burke & Pyne, 2007; McNaughton, Siegler, & Midgley, 2008). Hydrogen ions
(H+) accumulate in the muscle throughout 2000 m races, due to the glycolytic activity
required to sustain high power outputs (Hagerman, Connors, Gault, Hagerman, &
Polinski, 1978; Hagerman et al., 1979). Increased intramuscular acidity and
corresponding decreases in muscle pH can impair muscle force production, and
contribute to fatigue onset (Johnson & Black, 1953; Hawley & Reilly, 1997).
Performance decrements can be prevented with the ingestion of sodium bicarbonate,
which elevates blood bicarbonate concentration [HCO3-] and pH (Matson & Tran,
1993). The corresponding increase in blood buffering potential alters the pH gradient
across the muscle cell membrane (Costill, Verstappen, Kuipers, Janssen, & Fink, 1984),
which during high-intensity exercise increases the rate of (H+) efflux from the muscle,
sustaining high-intensity exercise performance.
Caffeine combined with sodium bicarbonate might enhance rowing performance more
than either supplement taken in isolation. In a 2000 m race, after ingesting caffeine and
sodium bicarbonate, the athlete could theoretically complete a greater portion of the
2000 m distance before the accumulation of hydrogen ions occurs (due to increases in
blood buffering capacity (Costill et al., 1984)). When increased intracellular acidity
does eventuate at a later point in the race, the athlete may not be as acutely aware of the
reduction in muscle pH, due to reduced perceived exertion and pain (Sawynok, 1998;
67
Doherty & Smith, 2005), motivation to sustain high power outputs is likely to be greater
(due to antagonism of adenosine receptors in the central nervous system) and there may
be less force decrement, due to increased muscle activation (Kalmar & Cafarelli, 2004;
Kalmar, 2005). Therefore, via the primary actions of sodium bicarbonate on anaerobic
metabolism and caffeine on the central nervous system, the ability of rowers to perform
at near-maximal intensity (Hagerman et al., 1978) might be better sustained throughout
the 2000 m distance, which could substantially improve race performance.
2.4.4 Future investigations
The evaluation of combined acute caffeine and sodium bicarbonate ingestion in a
rowing context should incorporate an experimental design that replicates the demands
of rowing competition, and incorporate outcome measures that are consistent with
previous investigations. While performance tests used in previous caffeine performance
research (Anderson et al., 2000; Bruce et al., 2000; Skinner et al., 2010) simulate the
demands of a single 2000 m race, scheduling repeated 2000 m ergometer tests 48 h
apart, as has been performed in recent investigations (Slater et al., 2005; Slater et al.,
2006a; Slater et al., 2006b; Slater et al., 2007) would provide a performance evaluation
that is more salient to a multi-day rowing regatta. Further, the measurement of blood
bicarbonate concentration [HCO3-] and pH (to quantify induced alkalosis), and blood
lactate concentration (to quantify acid-base disturbance) induced by the combined
effects of exercise and supplementation would facilitate comparison with previous
studies that have examined the effect of sodium bicarbonate (McNaughton & Cedaro,
1991) and caffeine (Anderson et al., 2000; Bruce et al., 2000; Skinner et al., 2010) on
rowing performance.
68
2.5 Conclusion
It has been demonstrated that caffeine can enhance short-term endurance performance
(Wiles et al., 1992; Jackman et al., 1996; Anderson et al., 2000; Bruce et al., 2000),
most likely via antagonism of adenosine receptors (Fredholm, 1980, 1995; Fredholm et
al., 1999). However, there is conflicting evidence as to the effects of caffeine
supplementation on rowing performance. Furthermore, the interpretation of ergogenic
effects would be enhanced if repeated 2000 m efforts were performed to represent the
timing of heats and finals in a rowing regatta, and if the combined effects of caffeine
and sodium bicarbonate were also quantified. Therefore, it is necessary to evaluate the
effects of caffeine on rowing performance in the context of simulated multi-day regatta
racing, to make findings applicable to the competition performance of rowers.
69
References
Anderson, M. E., Bruce, C. R., Fraser, S. F., Stepto, N. K., Klein, R., Hopkins, W. G.,
& Hawley, J. A. (2000). Improved 2000-meter rowing performance in
competitive oarswomen after caffeine ingestion. International Journal of Sport
Nutrition and Exercise Metabolism, 10(4), 464-475.
Asmussen, E., & Boje, O. (1948). The effect of alcohol and some drugs on the capacity
for work. Acta Physiologica Scandinavica, 15(2), 109-113.
Borg, G. (1970). Perceived exertion as an indicator of somatic stress. Scandinavian
Journal of Rehabilitation Medicine, 2(2), 92-98.
Brien, D. M., & McKenzie, D. C. (1989). The effect of induced alkalosis and acidosis
on plasma lactate and work output in elite oarsmen. European Journal of
Applied Physiology, 58(8), 797-802.
Bruce, C. R., Anderson, M. E., Fraser, S. F., Stepto, N. K., Klein, R., Hopkins, W. G.,
& Hawley, J. A. (2000). Enhancement of 2000-m rowing performance after
caffeine ingestion. Medicine & Science in Sports & Exercise, 32(11), 1958-
1963.
Burke, L. M. (2008). Caffeine and sports performance. Applied Physiology Nutrition
and Metabolism, 33(6), 1319-1334.
Burke, L. M., & Pyne, D. B. (2007). Bicarbonate loading to enhance training and
competitive performance. International Journal of Sports Physiology and
Performance, 2(1), 93-97.
70
Costill, D. L., Verstappen, F., Kuipers, H., Janssen, E., & Fink, W. (1984). Acid-base
balance during repeated bouts of exercise: influence of HCO3. International
Journal of Sports Medicine, 5(5), 228-231.
Davis, J. K., & Green, J. M. (2009). Caffeine and anaerobic performance: ergogenic
value and mechanisms of action. Sports Medicine, 39(10), 813-832.
Davis, J. M., Zhao, Z., Stock, H. S., Mehl, K. A., Buggy, J., & Hand, G. A. (2003).
Central nervous system effects of caffeine and adenosine on fatigue. American
Journal of Physiology: Regulatory, Integrative and Comparative Physiology,
284(2), R399-R404.
Doherty, M., & Smith, P. M. (2005). Effects of caffeine ingestion on rating of perceived
exertion during and after exercise: a meta-analysis. Scandinavian Journal of
Medicine and Science in Sports, 15(2), 69-78.
Ferré, S. (2008). An update on the mechanisms of the psychostimulant effects of
caffeine. Journal of Neurochemistry, 105(4), 1067-1079.
Ferré, S., Fuxe, K., von Euler, G., Johansson, B., & Fredholm, B. B. (1992). Adenosine-
dopamine interactions in the brain. Neuroscience, 51(3), 501-512.
Fredholm, B. B., (1980). Are methylxanthine effects due to antagonism of endogenous
adenosine? Trends in Pharmacological Sciences, 1, 129-132.
Fredholm, B. B. (1995). Adenosine, adenosine receptors and the actions of caffeine.
Pharmacology and Toxicology, 76(2), 93-101.
71
Fredholm, B. B., Battig, K., Holmén, J., Nehlig, A., & Zvartau, E. E. (1999). Actions of
caffeine in the brain with special reference to factors that contribute to its
widespread use. Pharmacological Reviews, 51(1), 83-133.
Fredholm, B. B., & Dunwiddie, T. V. (1988). How does adenosine inhibit transmitter
release? Trends in Pharmacological Sciences, 9(4), 130-134.
Fredholm, B. B. & Hedqvist, P. (1980). Modulation of neurotransmission by purine
nucleotides and nucleosides. Biochemical Pharmacology, 29(12), 1635-1643.
Gandevia, S. C. (2001). Spinal and supraspinal factors in human muscle fatigue.
Physiological Reviews, 81(4), 1725-1789.
Graham, T. E. (2001). Caffeine and exercise: metabolism, endurance and performance.
Sports Medicine, 31(11), 785-807.
Hagerman, F. C., Connors, M. C., Gault, J. A., Hagerman, G. R., & Polinski, W. J.
(1978). Energy expenditure during simulated rowing. Journal of Applied
Physiology, 45(1), 87-93.
Hagerman, F. C., Hagerman, G. R., & Mickelson, T. C. (1979). Physiological profiles
of elite rowers. The Physician and Sportsmedicine, 7(7), 74-83.
Hawley, J. A., & Reilly, T. (1997). Fatigue revisited. Journal of Sports Sciences, 15(3),
245-246.
Hopkins, W. G., Marshall, S. W., Batterham, A. M., & Hanin, J. (2009). Progressive
statistics for studies in sports medicine and exercise science. Medicine & Science
in Sports & Exercise, 41(1), 3-12.
72
Hopkins, W. G., Schabort, E. J., & Hawley, J. A. (2001). Reliability of power in
physical performance tests. Sports Medicine, 31(3), 211-234.
Jackman, M., Wendling, P., Friars, D., & Graham, T. E. (1996). Metabolic,
catecholamine, and endurance responses to caffeine during intense exercise.
Journal of Applied Physiology, 81(4), 1658-1663.
Johnson, W. R., & Black, D. H. (1953). Comparison of effects of certain blood
alkalinizers and glucose upon competitive endurance performance. Journal of
Applied Physiology, 5(10), 577-578.
Kalmar, J. M. (2005). The influence of caffeine on voluntary muscle activation.
Medicine & Science in Sports & Exercise, 37(12), 2113-2119.
Kalmar, J. M., & Cafarelli, E. (2004). Caffeine: a valuable tool to study central fatigue
in humans? Exercise and Sport Science Reviews, 32(4), 143-147.
Koutedakis, Y., & Sharp, N. C. (1985). Lactic acid removal and heart rate frequencies
during recovery after strenuous rowing exercise. British Journal of Sports
Medicine, 19(4), 199-202.
Linderman, J. K., & Gosselink, K. L. (1994). The effects of sodium bicarbonate
ingestion on exercise performance. Sports Medicine, 18(2), 75-80.
Magkos, F., & Kavouras, S. A. (2004). Caffeine and ephedrine: physiological,
metabolic and performance-enhancing effects. Sports Medicine, 34(13), 871-
889.
73
Margaria, R., Aghemo, P., & Rovelli, E. (1964). The effect of some drugs on the
maximal capacity of athletic performance in man. Internationale Zeitschrift fur
Angewandte Physiologie Einschliesslich Arbeitsphysiologie, 20, 281-287.
Matson, L. G., & Tran, Z. V. (1993). Effects of sodium bicarbonate ingestion on
anaerobic performance: a meta-analytic review. International Journal of Sport
Nutrition, 3(1), 2-28.
McCall, A. L., Millington, W. R., & Wurtman, R. J. (1982). Blood-brain barrier
transport of caffeine: dose-related restriction of adenine transport. Life Sciences,
31(34), 2905-2715.
McNaughton, & Cedaro, R. (1991). The effect of sodium bicarbonate on rowing
ergometer performance in elite rowers. The Australian Journal of Science and
Medicine in Sport, 23(3), 66-69.
McNaughton, Siegler, J., & Midgley, A. (2008). Ergogenic effects of sodium
bicarbonate. Current Sports Medicine Reports, 7(4), 230-236.
Pruscino, C. L., Ross, M. L. R., Gregory, J. R., Savage, B., & Flanagan, T. R. (2008).
Effects of sodium bicarbonate, caffeine and their combination on repeated 200-
m freestyle performance. International Journal of Sport Nutrition and Exercise
Metabolism, 18(2), 116-130.
Sawynok, J. (1998). Adenosine receptor antagonism and nociception. European Journal
of Pharmacology, 317, 1-11.
Sechler, N. H. (1993). Physiological and biomechanical aspects of rowing: aspects for
training. Sports Medicine, 15(1), 24-42.
74
Skinner, T. L., Jenkins, D. G., Coombes, J. S., Taaffe, D. R., & Leveritt, M. D. (2010).
Dose response of caffeine on 2000-m rowing performance. Medicine & Science
in Sports & Exercise, 42(3), 571-576.
Slater, G. J., Rice, A. J., Sharpe, K., Jenkins, D., & Hahn, A. G. (2007). Influence of
nutrient intake after weigh-in on lightweight rowing performance. Medicine &
Science in Sports & Exercise, 39(1), 184-191.
Slater, G. J., Rice, A. J., Sharpe, K., Tanner, R., Jenkins, D., Gore, C. J., & Hahn, A. G.
(2005). Impact of acute weight loss and/or thermal stress on rowing ergometer
performance. Medicine & Science in Sports & Exercise, 37(8), 1387-1394.
Slater, G. J., Rice, A. J., Tanner, R., Sharpe, K., Gore, C. J., Jenkins, D. G., & Hahn, A.
G. (2006a). Acute weight loss followed by an aggressive nutritional recovery
strategy has little impact on on-water rowing performance. British Journal of
Sports Medicine, 40(1), 55-59.
Slater, G. J., Rice, A. J., Tanner, R., Sharpe, K., Jenkins, D., & Hahn, A. (2006b).
Impact of two different body mass management strategies on repeat rowing
performance. Medicine & Science in Sports & Exercise, 38(1), 138-146.
Spriet, L. L. (1995). Caffeine and performance. International Journal of Sport
Nutrition, 5 Suppl, S84-S99.
Tarnopolsky, M. A. (2008). Effect of caffeine on the neuromuscular system - potential
as an ergogenic aid. Applied Physiology Nutrition and Metabolism, 33(6), 1284-
1289.
75
Wiles, J. D., Bird, S. R., & Hopkins, J. (1992). Effect of caffeinated coffee on running
speed, respiratory factors, blood lactate and perceived exertion during 1500-m
treadmill running. British Journal of Sports Medicine, 26(2), 116-120.
76
CHAPTER THREE
Study Two
Induced Alkalosis and Caffeine Supplementation: Effects on 2000 m
Rowing Performance
Journal article accepted for publication with
International Journal of Sports Nutrition and Exercise Metabolism
Presented here in the journal submission format
Running title: Alkalosis and caffeine: performance effects
Key words: Blood pH, buffering, blood lactate, competition
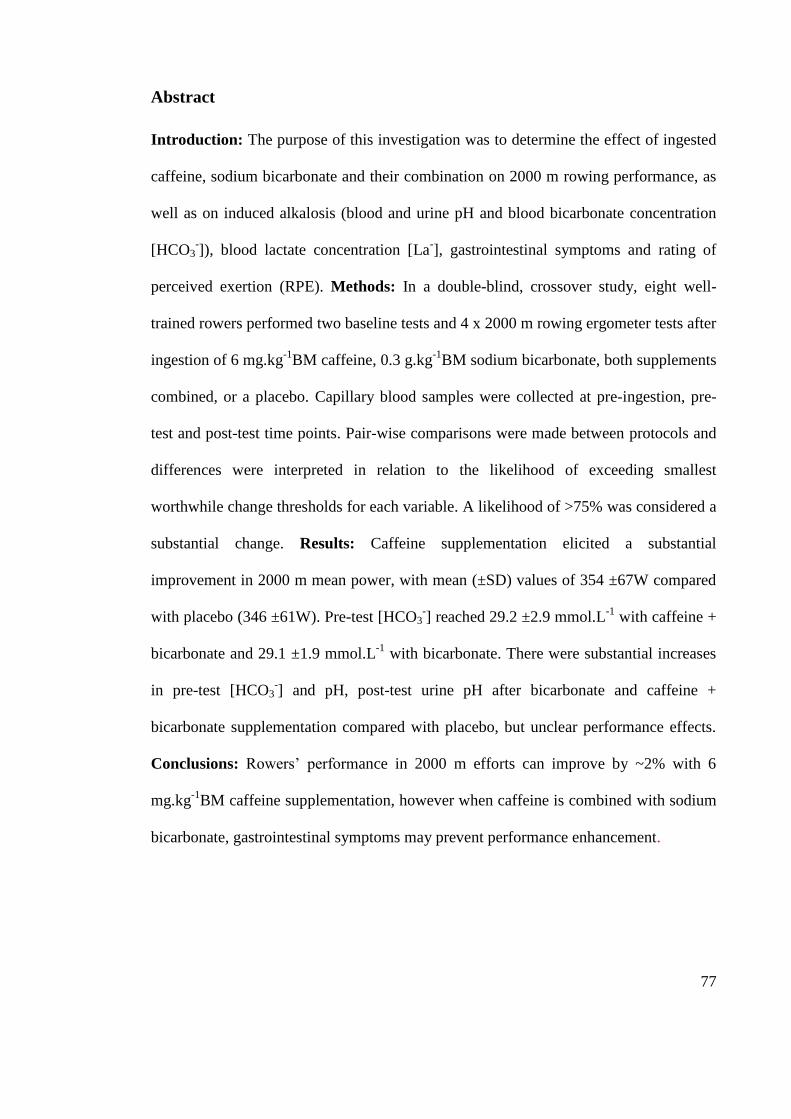
77
Abstract
Introduction: The purpose of this investigation was to determine the effect of ingested
caffeine, sodium bicarbonate and their combination on 2000 m rowing performance, as
well as on induced alkalosis (blood and urine pH and blood bicarbonate concentration
[HCO3-]), blood lactate concentration [La
-], gastrointestinal symptoms and rating of
perceived exertion (RPE). Methods: In a double-blind, crossover study, eight well-
trained rowers performed two baseline tests and 4 x 2000 m rowing ergometer tests after
ingestion of 6 mg.kg-1
BM caffeine, 0.3 g.kg-1
BM sodium bicarbonate, both supplements
combined, or a placebo. Capillary blood samples were collected at pre-ingestion, pre-
test and post-test time points. Pair-wise comparisons were made between protocols and
differences were interpreted in relation to the likelihood of exceeding smallest
worthwhile change thresholds for each variable. A likelihood of >75% was considered a
substantial change. Results: Caffeine supplementation elicited a substantial
improvement in 2000 m mean power, with mean (±SD) values of 354 ±67W compared
with placebo (346 ±61W). Pre-test [HCO3-] reached 29.2 ±2.9 mmol.L
-1 with caffeine +
bicarbonate and 29.1 ±1.9 mmol.L-1
with bicarbonate. There were substantial increases
in pre-test [HCO3-] and pH, post-test urine pH after bicarbonate and caffeine +
bicarbonate supplementation compared with placebo, but unclear performance effects.
Conclusions: Rowers‟ performance in 2000 m efforts can improve by ~2% with 6
mg.kg-1
BM caffeine supplementation, however when caffeine is combined with sodium
bicarbonate, gastrointestinal symptoms may prevent performance enhancement.
78
Introduction
A 2000 m rowing event requires 6-8 min efforts at a high percentage of VO2max
(Hagerman, Connors, Gault, Hagerman, & Polinski, 1978) and post-race blood lactate
concentration [La-] can reach 15-17 mmol.L
-1 (Hahn, 1989). Given these physiological
demands, rowers could benefit from nutritional ergogenic aids that may improve both
endurance and high intensity exercise performance.
Sodium bicarbonate loading can improve performance in high-intensity anaerobic
exercise of <10 min duration (Matson & Tran, 1993; Requena, Zabala, Padial, &
Feriche, 2005; Burke & Pyne, 2007; McNaughton, Siegler, & Midgley, 2008). Pre-
exercise sodium bicarbonate ingestion increases blood bicarbonate concentration
[HCO3-] and pH (Matson & Tran, 1993) and it has been suggested that induced alkalosis
prior to exercise can offset fatigue when pH decrement during exercise is delayed
(Gledhill, 1984). Investigations of sodium bicarbonate supplementation effects on
rowing performance have yielded equivocal results. McNaughton and Cedaro (1991)
reported that in a 6 min rowing ergometer test that simulated the demands of on-water
racing, significantly greater distance was covered after 0.3 g.kg-1
BM sodium
bicarbonate ingestion. Conversely, with a similar bicarbonate dose and 6 min ergometer
test, Brien and McKenzie (1989) found no significant differences in work outputs with
bicarbonate compared with placebo.
Caffeine supplementation can improve short-term (5-10 min) endurance performance
(Wiles, Bird, & Hopkins, 1992; Jackman, Wendling, Friars, & Graham, 1996) via
enhanced voluntary muscle activation (Kalmar, 2005; Ferré, 2008), reduced perceived
exertion and pain perception during exercise (Tarnopolsky, 2008; Ganio, Klau, Casa,
79
Armstrong, & Maresh, 2009) and the antagonism of adenosine receptors (McCartney,
Heigenhauser, & Jones, 1983; Keisler & Armsey, 2006; Graham, Battram, Dela, El-
Sohemy, & Thong, 2008). Performance enhancement with caffeine can also reduce
post-exercise rating of perceived exertion (Doherty & Smith, 2005) and increase post-
test blood [La-] (Anselme, Collomp, Mercier, Ahmaïdi, & Prefaut, 1992; Bell, Jacobs,
& Zamecnik, 1998). There have been conflicting outcomes to investigations of 6 mg.kg-
1BM
caffeine ingestion and rowing performance. Previously, 1-2% improvements in
well-trained male and female rowers have been demonstrated (Anderson, Bruce, Fraser,
Stepto, Klein, Hopkins, & Hawley, 2000; Bruce, Anderson, Fraser, Stepto, Klein,
Hopkins, & Hawley, 2000), but more recently only trivial performance differences
between caffeine and placebo trials (Skinner, Jenkins, Coombes, Taaffe, & Leveritt,
2010) have been found.
Given the potential for improved rowing performance with caffeine and sodium
bicarbonate supplementation, combining the two ergogenic aids may provide an
additive benefit. In the only investigation combining these two agents, no significant
differences in simulated 200 m swimming races were found between placebo and
caffeine, sodium bicarbonate and their combination (Pruscino, Ross, Gregory, Savage,
& Flanagan, 2008). Further investigation of the combination of caffeine and sodium
bicarbonate using a different sport-specific test (2000 m rowing efforts) is warranted, as
athletes do combine the two ergogenic aids for use in competition (Burke, 2008) and
effects on rowing efforts separated by 48 h (as required in a regatta) have not been
investigated in this context. Furthermore, there is disagreement in the published
literature as to the effects on rowing performance of sodium bicarbonate (Brien &
80
McKenzie, 1989; McNaughton & Cedaro, 1991) and caffeine (Anderson et al., 2000;
Bruce et al., 2000; Skinner et al., 2010).
Therefore, the primary purpose of this investigation was to determine the performance
effect of sodium bicarbonate, caffeine and their combination on 2000 m rowing efforts.
The secondary purpose was to investigate induced alkalosis and fatigue development
through the measurement of blood [HCO3-], [La
-] and pH, and rating of perceived
exertion. Specifically, it was hypothesised that 1) mean power in 2000 m rowing
ergometer efforts will substantially improve with 6 mg.kg-1
BM caffeine and 0.3 g.kg-
1BM
sodium bicarbonate, and when both agents are combined and 2) blood [HCO3
-] and
pH after supplementation in the bicarbonate and caffeine + bicarbonate conditions will
be substantially greater than in both the caffeine and placebo conditions.
81
Methods
Subjects
Eight well-trained rowers participated in this study (6 males and 2 females, with mean ±
SD personal best 2000 m ergometer times of 6:24.6 min:s ±12.9 s for males and 6:57.0
min:s ±2.1s for females and body mass 82.2 12.2 kg for males and 77.5 ±6.4 kg for
females). All subjects had previously competed at the Australian Rowing
Championships and six were scholarship holders at the Western Australian Institute of
Sport. All subjects were experienced with performing 2000 m rowing ergometer tests.
Written informed consent was obtained from each participant, and prior approval of the
protocol was granted by the University of Western Australia ethics committee.
Experimental overview
Subjects completed 6 x 2000 m rowing ergometer tests, including two baseline and four
experimental trials (sodium bicarbonate, caffeine, sodium bicarbonate + caffeine and
placebo) over a 3-week period. A crossover design was employed and double-blinded
treatments were administered in a semi-counterbalanced fashion. Testing was completed
in two cohorts, the first cohort (n=6) at the Canning Bridge Rowing Centre, Perth,
Western Australia and the second cohort (n=2) at the Australian National University,
Canberra, Australian Capital Territory. Testing was conducted over a 20-day period; the
first baseline test commenced on day 1, and two experimental trials were subsequently
performed, with 48 h between each trial to replicate the timing and physical demands of
consecutive races in a rowing regatta, as has been performed in several recent
investigations (Slater, Rice, Sharpe, Tanner, Jenkins, Gore, & Hahn, 2005; Slater, Rice,
Tanner, Sharpe, Gore, Jenkins, & Hahn, 2006; Slater, Rice, Tanner, Sharpe, Jenkins, &
82
Hahn, 2006; Slater, Rice, Sharpe, Jenkins, & Hahn, 2007). Participants then trained
normally and testing recommenced on day 15, with baseline and experimental tests
again separated by 48 h. The two performance tests (on days 1 and 15) were performed
to quantify the performance effects of differences in training status that may have
occurred throughout the 20-day testing period.
Dietary standardisation and training
Subjects recorded all food and fluid consumed (including details of the volume, type
and mass) and all training (type, duration and intensity of each session) performed for
the 24 h prior to their first baseline test, and they replicated their dietary intake and
training pattern prior to each subsequent test. Subjects abstained from caffeine ingestion
for the 48 h prior to each test and were provided with a comprehensive list of caffeine-
containing foods, beverages and medicines, all of which they needed to avoid to
maintain a caffeine abstinence.
Supplement Ingestion
Subjects arrived at each testing session after an overnight fast. For all experimental
conditions (sodium bicarbonate, caffeine, sodium bicarbonate + caffeine and placebo)
participants were issued with two supplement doses. The first dose was ingested 90 min
prior to the performance test (at -90 min) and was either 0.3 g.kg-1
BM sodium
bicarbonate powder encased in gelatine capsules (PPCA, NSW, Australia) or an equal
number of placebo capsules containing cornflour (White Wings foods, NSW, Australia).
The second dose was ingested 30 min prior to the performance test (at -30 min) and
was either 6 mg.kg-1
BM caffeine (No-Doz, Key Pharmaceuticals Pty Ltd, NSW,
Australia) in glucose capsules or an equal number of placebo capsules containing
83
glucose (Glucodin, NSW, Australia). In the sodium bicarbonate condition, sodium
bicarbonate was taken at -90 min and then placebo at -30 min, for the caffeine condition
participants ingested placebo at -90 min and caffeine at -30 min, in the caffeine +
sodium bicarbonate condition sodium bicarbonate was taken at -90 min and then
caffeine at -30 min, and placebo was ingested at -90 min and -30 min in the placebo
condition. All capsules were taken with 600 mL water.
Experimental trials
An overview of testing sessions is shown in Figure 5. All sessions commenced at the
same time of day (0600 hours) and subjects performed each test on the same type of
rowing ergometer (Concept IID, Concept, Vermont, USA), at the same time as at least
one other subject to simulate racing conditions. Drag factor on the ergometer was set
according to the Rowing Australia standards for their sex, age and weight classification.
Subjects completed a 7 min standardised warm-up, adapted from a previously published
protocol (Slater et al., 2005) (4 min at 70% of their maximal power output, followed by
a 3 min period that included passive rest and 2 x ten maximal strokes) before they
commenced the 2000 m test. Stroke rate, mean power and time elapsed for each 500 m
split were recorded. Immediately after the completion of all performance tests, subjects
indicated on a scale of 6-20 (Borg, 1970) their perceived exertion for the test.
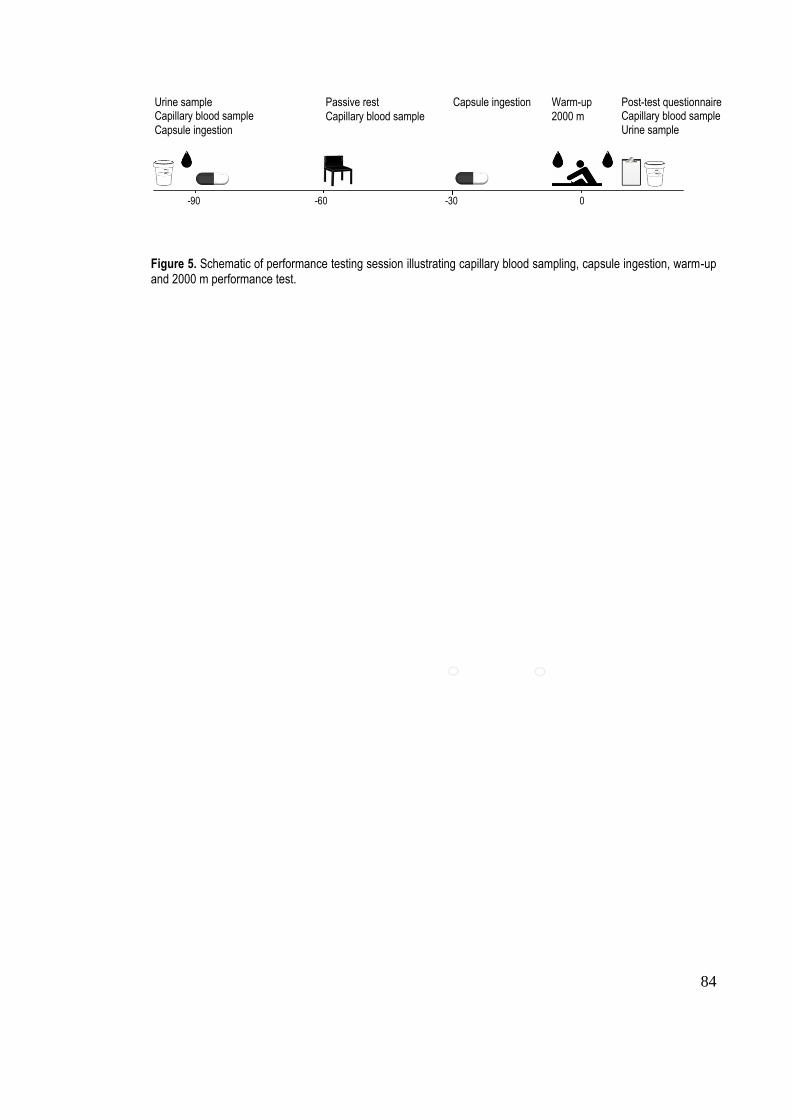
84
Figure 5. Schematic of performance testing session illustrating capillary blood sampling, capsule ingestion, warm-up and 2000 m performance test.
Warm-up
2000 m
Urine sample Capillary blood sample
Capsule ingestion
Passive rest
Capillary blood sample
Post-test questionnaire Capillary blood sample
Urine sample
-30 0 -60 -90
Capsule ingestion
85
Capillary blood sampling and analysis
Capillary blood samples were taken prior to supplement ingestion, prior to warming up
and 2 min after completing the performance test. Prior to capillary blood sampling, we
applied a hyperaemic ointment (Finalgon, Boehringer Ingelheim, NSW, Australia) to
the fingertip to increase blood flow. The ointment was then removed and the fingertip
was pierced with a sterile 2.0 mm retractable lancet (Medlance, Ozorkow, Poland). The
first drop of blood was removed and then 100 L blood was collected in a glass
capillary tube (Radiometer, Copenhagen, Denmark). For the first cohort, samples were
stored on ice and then analysed for [HCO3-], [La
-] and pH using a blood-gas analyser
(Radiometer ABL 725, Copenhagen, Denmark). For the second cohort, blood samples
were immediately analysed using a portable blood-gas analyser (iSTAT, Abbott,
Illinois, USA) for pH and bicarbonate concentration and a second, 20 µL sample was
collected and immediately analysed at the pre-test and post-test time points using a
portable blood lactate analyser (Lactate Pro, Arkray, Kyoto, Japan).
Urine pH
Subjects collected a urine sample immediately after waking (after an overnight fast and
prior to eating or drinking) and as soon as possible after completing each 2000 m test.
Samples were analysed using a pH meter (CyberScan pH1500, Eutech Instruments,
Singapore).
Post-test questionnaire
After each performance test, experimenters recorded subjects‟ verbal responses when
asked which treatment they thought they had received, reasons for their prediction,
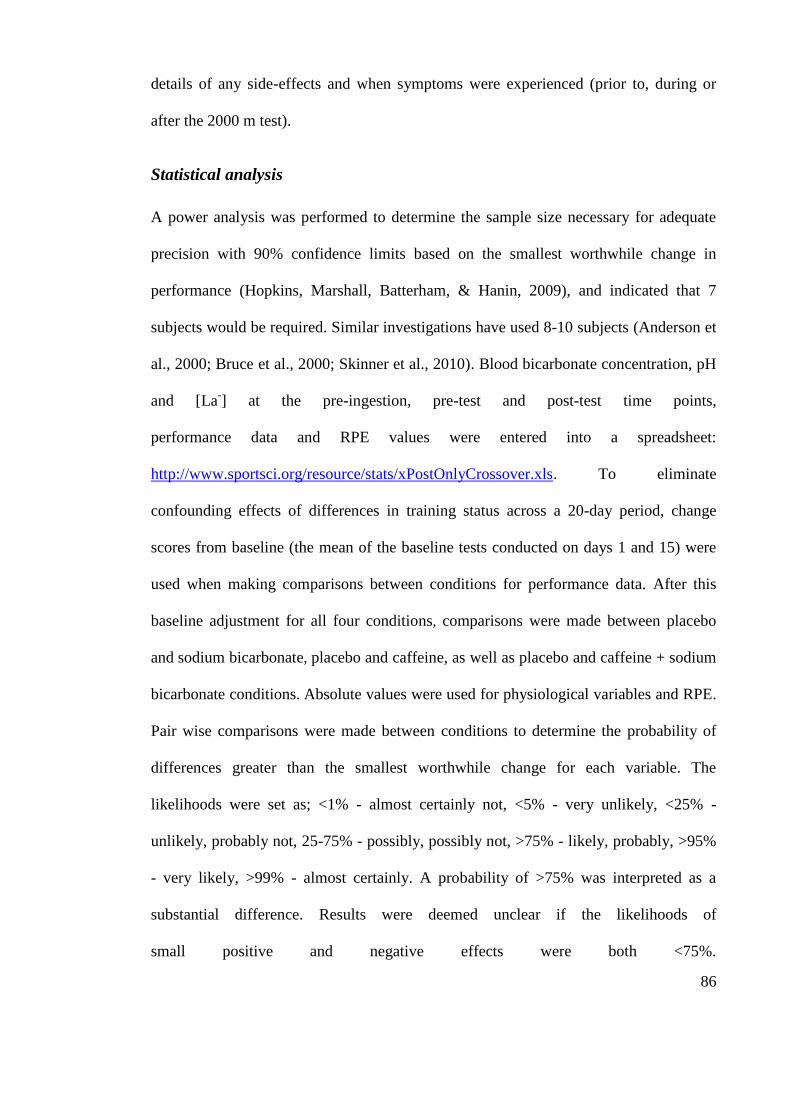
86
details of any side-effects and when symptoms were experienced (prior to, during or
after the 2000 m test).
Statistical analysis
A power analysis was performed to determine the sample size necessary for adequate
precision with 90% confidence limits based on the smallest worthwhile change in
performance (Hopkins, Marshall, Batterham, & Hanin, 2009), and indicated that 7
subjects would be required. Similar investigations have used 8-10 subjects (Anderson et
al., 2000; Bruce et al., 2000; Skinner et al., 2010). Blood bicarbonate concentration, pH
and [La-] at the pre-ingestion, pre-test and post-test time points,
performance data and RPE values were entered into a spreadsheet:
http://www.sportsci.org/resource/stats/xPostOnlyCrossover.xls. To eliminate
confounding effects of differences in training status across a 20-day period, change
scores from baseline (the mean of the baseline tests conducted on days 1 and 15) were
used when making comparisons between conditions for performance data. After this
baseline adjustment for all four conditions, comparisons were made between placebo
and sodium bicarbonate, placebo and caffeine, as well as placebo and caffeine + sodium
bicarbonate conditions. Absolute values were used for physiological variables and RPE.
Pair wise comparisons were made between conditions to determine the probability of
differences greater than the smallest worthwhile change for each variable. The
likelihoods were set as; <1% - almost certainly not, <5% - very unlikely, <25% -
unlikely, probably not, 25-75% - possibly, possibly not, >75% - likely, probably, >95%
- very likely, >99% - almost certainly. A probability of >75% was interpreted as a
substantial difference. Results were deemed unclear if the likelihoods of
small positive and negative effects were both <75%.
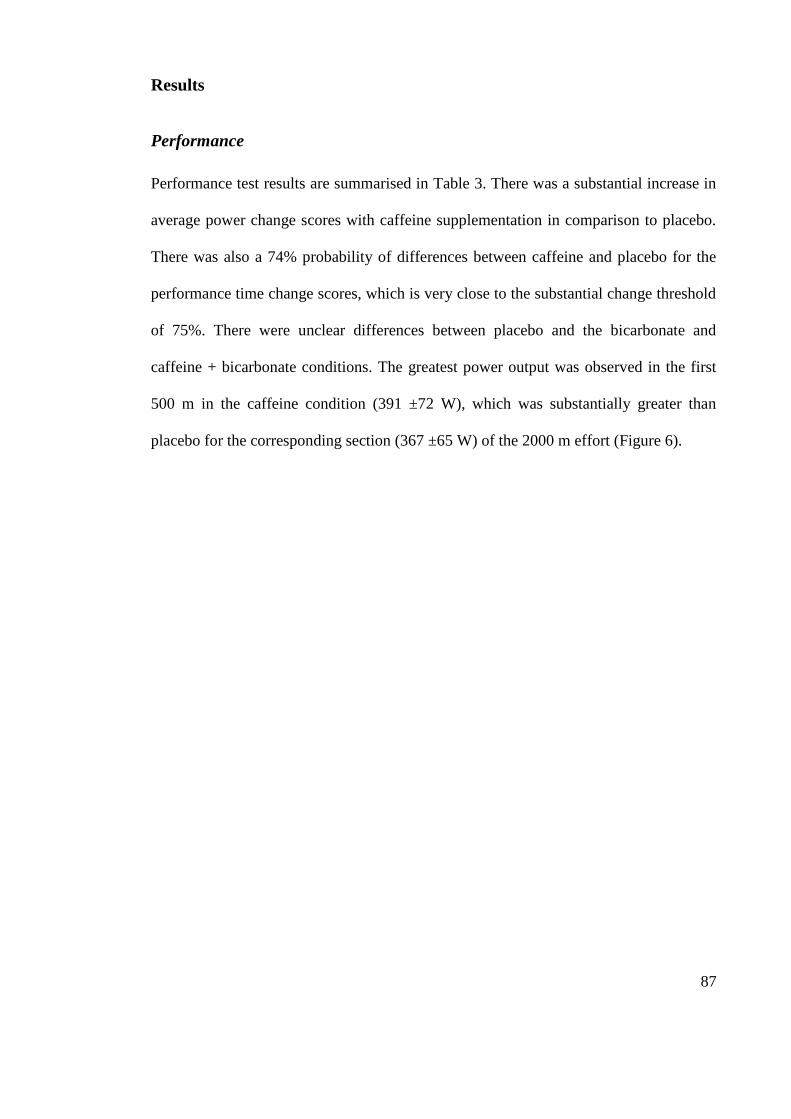
87
Results
Performance
Performance test results are summarised in Table 3. There was a substantial increase in
average power change scores with caffeine supplementation in comparison to placebo.
There was also a 74% probability of differences between caffeine and placebo for the
performance time change scores, which is very close to the substantial change threshold
of 75%. There were unclear differences between placebo and the bicarbonate and
caffeine + bicarbonate conditions. The greatest power output was observed in the first
500 m in the caffeine condition (391 ±72 W), which was substantially greater than
placebo for the corresponding section (367 ±65 W) of the 2000 m effort (Figure 6).
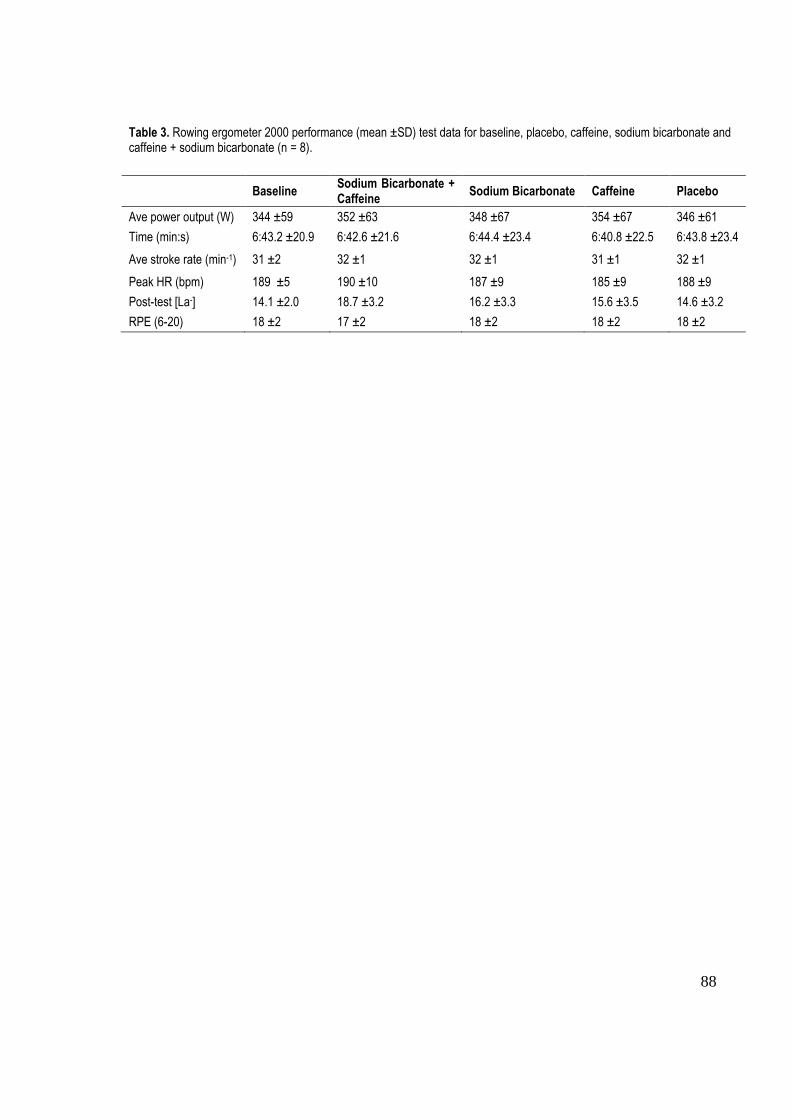
88
Table 3. Rowing ergometer 2000 performance (mean ±SD) test data for baseline, placebo, caffeine, sodium bicarbonate and caffeine + sodium bicarbonate (n = 8).
Baseline Sodium Bicarbonate + Caffeine
Sodium Bicarbonate Caffeine Placebo
Ave power output (W) 344 ±59 352 ±63 348 ±67 354 ±67 346 ±61
Time (min:s) 6:43.2 ±20.9 6:42.6 ±21.6 6:44.4 ±23.4 6:40.8 ±22.5 6:43.8 ±23.4
Ave stroke rate (min-1) 31 ±2 32 ±1 32 ±1 31 ±1 32 ±1
Peak HR (bpm) 189 ±5 190 ±10 187 ±9 185 ±9 188 ±9
Post-test [La-] 14.1 ±2.0 18.7 ±3.2 16.2 ±3.3 15.6 ±3.5 14.6 ±3.2
RPE (6-20) 18 ±2 17 ±2 18 ±2 18 ±2 18 ±2
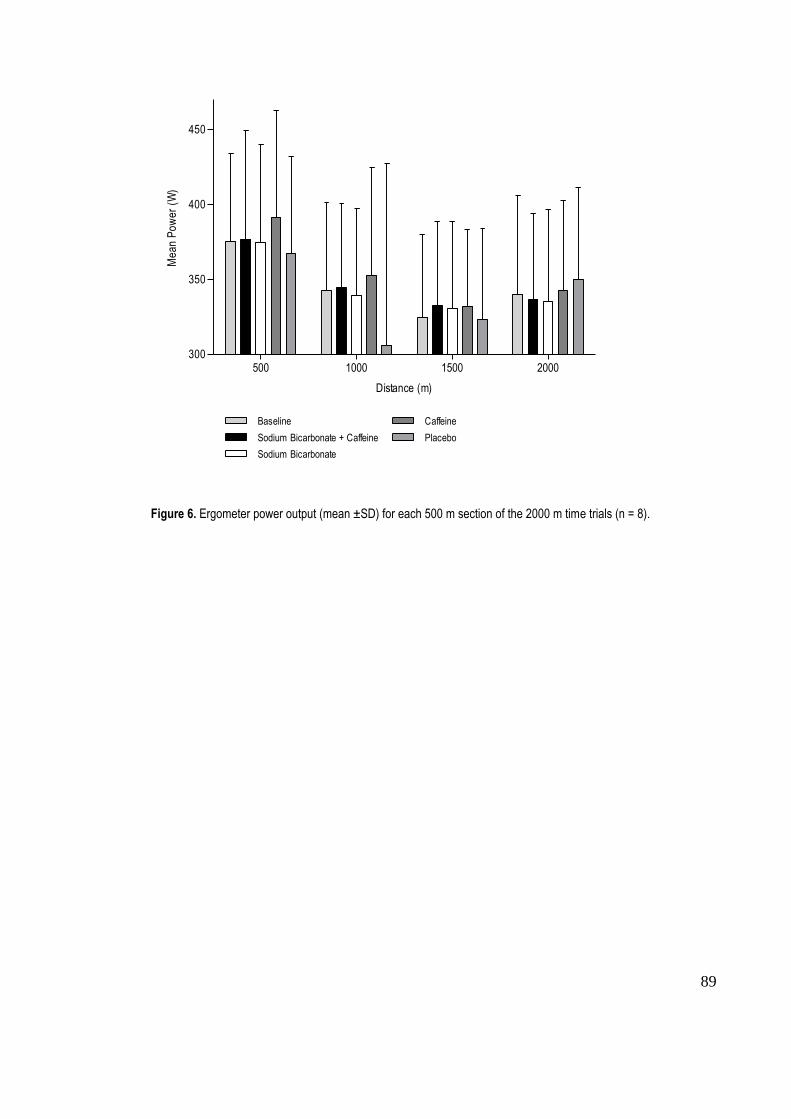
89
500 1000 1500 2000300
350
400
450
Baseline
Sodium Bicarbonate + Caffeine
Sodium Bicarbonate
Caffeine
Placebo
Distance (m)
Me
an
Po
we
r (W
)
Figure 6. Ergometer power output (mean ±SD) for each 500 m section of the 2000 m time trials (n = 8).
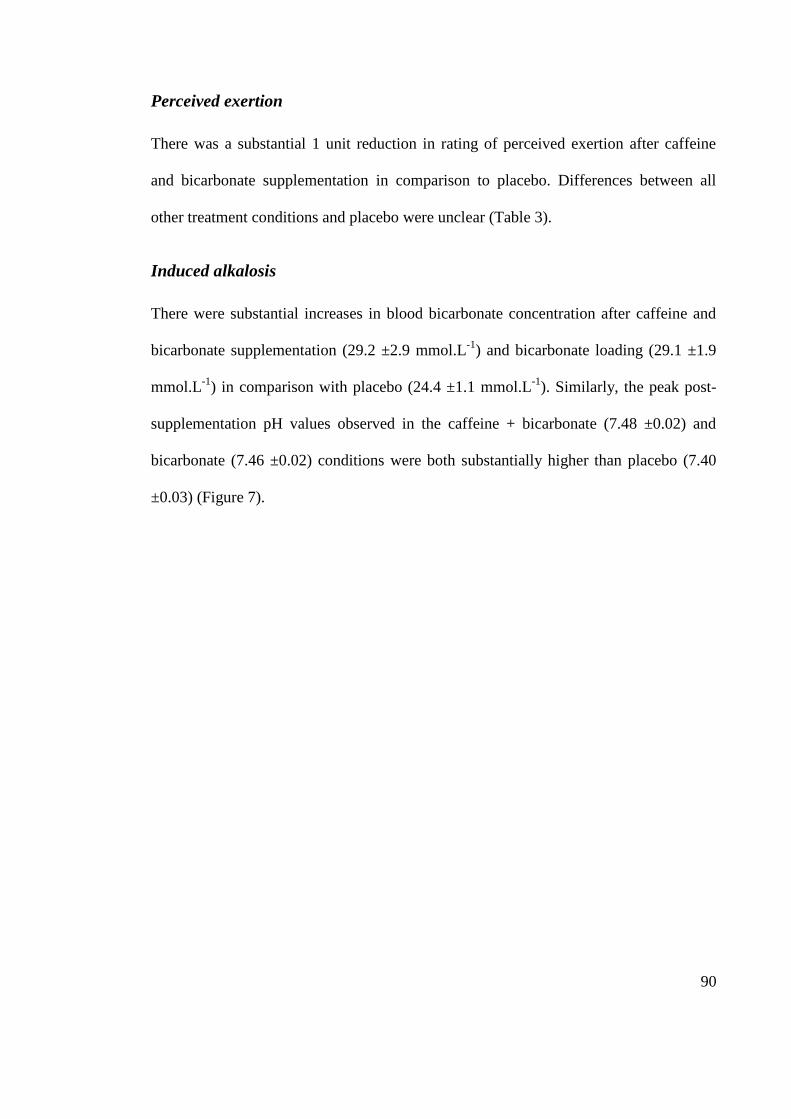
90
Perceived exertion
There was a substantial 1 unit reduction in rating of perceived exertion after caffeine
and bicarbonate supplementation in comparison to placebo. Differences between all
other treatment conditions and placebo were unclear (Table 3).
Induced alkalosis
There were substantial increases in blood bicarbonate concentration after caffeine and
bicarbonate supplementation (29.2 ±2.9 mmol.L-1
) and bicarbonate loading (29.1 ±1.9
mmol.L-1
) in comparison with placebo (24.4 ±1.1 mmol.L-1
). Similarly, the peak post-
supplementation pH values observed in the caffeine + bicarbonate (7.48 ±0.02) and
bicarbonate (7.46 ±0.02) conditions were both substantially higher than placebo (7.40
±0.03) (Figure 7).
91
10
15
20
25
30
35
[HC
O3
- ] mm
ol.L
-1
PI PW PT
7.1
7.2
7.3
7.4
7.5
Baseline
Sodium Bicarbonate + Caffeine
Sodium Bicarbonate
Caffeine
Placebo
pH
Figure 7. Mean (±SD) blood bicarbonate concentration and pH prior to ingestion (PI), prior to warm-up (PW) and post-2000 m test (PT) (n = 8).
92
Blood lactate concentration
Post-test blood [La-] in the caffeine + bicarbonate condition was 4.2 ±2.7 mmol.L
-1
higher than in the placebo condition (Table 3). There were unclear differences between
the placebo and both the caffeine and bicarbonate conditions (Table 3).
Urine pH
There was a substantial increase in post-test urine pH after bicarbonate (6.75 ±1.2) and
caffeine + bicarbonate (6.76 ±0.95) in comparison with placebo (5.94 ±0.53).
Post-test questionnaire
From 32 treatment conditions (4 treatments each for 8 subjects), subjects correctly
identified their treatment condition on 26 occasions. Six subjects correctly identified
when they had been given the caffeine treatment, 4 when they had received the caffeine
+ bicarbonate, 5 after bicarbonate supplementation and 5 correctly identified when they
had been given the placebo. Side effects were reported by all subjects after ingesting
bicarbonate, and symptoms included nausea, vomiting, diarrhoea and dizziness. After
caffeine, subjects reported an elevated or irregular heartbeat, increased alertness, hand
tremor, and feeling „hyperactive‟ and „on-edge‟.
93
Discussion
This is the first systematic investigation of effects of caffeine, sodium bicarbonate and
their combination on performance in a simulated rowing regatta, and the associated
acid-base disturbance indicated by blood [HCO3-], [La
-] and pH. We found a substantial
improvement in 2000 m performance after 6 mg.kg-1
BM
caffeine administration.
Despite substantial pre-test alkalosis in the bicarbonate and caffeine + bicarbonate
conditions, there were unclear performance effects in both conditions.
A ~2% performance enhancement after 6 mg.kg-1
BM caffeine is consistent with
previous reports on rowing performance with competitive male (Bruce et al., 2000) and
female rowers (Anderson et al., 2000), but contrasts with the recent report of no
significant differences in 2000 m rowing performance after caffeine and placebo
(Skinner et al., 2010), which could be explained by compromised caffeine absorption
due to co-ingestion of a pre-test meal (Skinner et al., 2010). In the current study and
earlier investigations (Anderson et al., 2000; Bruce et al., 2000) subjects completed each
trial after an overnight fast. The timing of co-ingested meals could be detrimental to
caffeine absorption (Skinner et al., 2010) but for some athletes pre-event meals are an
important part of competition preparation (Burke, 2008) and racing under fasted
conditions could hinder performance. To increase the external validity of future studies,
effects of standardised pre-test meals on caffeine absorption and subsequent
performance should be systematically investigated.
The ergogenic effect of caffeine demonstrated in the current investigation and
subjective data collected from our subjects provide some support for documented
effects of caffeine on the central nervous system. Caffeine ingestion can increase
94
perceptions of wakefulness and alertness (Kalmar, 2005; Ferré, 2008; Tarnopolsky,
2008). Subjects in this study reported feeling „more alert‟, „hyperactive‟ and „on-edge‟
after caffeine ingestion, responses which are consistent with the perception of increased
wakefulness. Furthermore, six of our eight subjects correctly identified when they had
been assigned the caffeine condition, suggesting that they experienced noticeable
changes after supplementation. While increased alertness with caffeine ingestion is not a
direct mechanism for performance enhancement (Graham et al., 2008; Tarnopolsky,
2008), observed effects in our subjects do provide evidence of central nervous system
stimulation, which can more directly enhance performance via other means, such as
reduced pain perception and perceived exertion (Tarnopolsky, 2008; Ganio et al., 2009).
Performance in our subjects after caffeine ingestion was substantially improved in
comparison to placebo, but RPE scores for these two conditions were very similar.
Therefore, if equal power outputs were attained for caffeine and placebo, perceived
exertion in the caffeine condition would be lower and this could be beneficial in actual
race efforts.
There was no clear performance benefit in the current investigation after ingestion of a
combination of 6 mg.kg-1
BM caffeine and 0.3 g.kg-1
BM sodium bicarbonate. This
finding is consistent with the only other investigation of performance effects with the
same supplement combination (Pruscino et al., 2008). Substantial blood alkalosis was
induced with both studies, and in the current investigation post-supplementation [HCO3-
] and pH pre-exercise values reached 29.2 ±2.9 mmol.L-1
and 7.48 ±0.02 respectively.
Furthermore, there was a substantial elevation in post-test urine pH compared to
placebo in this condition, consistent with previous results (Wilkes, Gledhill, & Smyth,
1983; McKenzie, 1988; Ibanez, Pullinen, Gorostiaga, Postigo, & Mero, 1995). The lack
95
of a performance enhancement with 2000 m rowing time trials and repeated 200 m
freestyle sprints (Pruscino et al., 2008) suggests that despite the demonstrated induced
alkalosis, the increased buffering potential may have been inadequate. It has been
reported that post-test blood [La-] can be higher than placebo after both sodium
bicarbonate (Wilkes et al., 1983; McNaughton & Cedaro, 1991; Cameron, McLay-
Cooke, Brown, Gray, & Fairbairn, 2010) and caffeine administration (Anselme et al.,
1992; Wiles et al., 1992; Bell et al., 1998) and in this investigation we also observed the
highest post-test blood [La-] after caffeine + bicarbonate supplementation. While the
interpretation of our [La-] data is limited by our measurements only being taken at one
post-test time point, it is possible that intracellular acidosis during exercise could be
substantially increased with caffeine + bicarbonate supplementation, and therefore the
proposed buffering action of HCO3- (Gledhill, 1984; Requena et al., 2005) could be
insufficient to counteract the inhibitory effect of increased acidosis on glycolysis and
muscle contraction (Johnson & Black, 1953; Sutton, Jones, & Toews, 1981)
The high incidence of side effects experienced by our subjects may explain the lack of
performance enhancement after bicarbonate in isolation and when combined with
caffeine. All subjects in our investigation reported gastrointestinal side effects
(including nausea, vomiting and stomach pain). Potentially, experiencing
gastrointestinal symptoms negates or confounds the ergogenic effect of sodium
bicarbonate (Cameron et al., 2010), especially if side effects are experienced before or
during a maximal effort, as was the case with participants in this investigation. Several
investigations have documented side effects after bicarbonate supplementation
(Stephens, McKenna, Canny, Snow, & McConnel, 2002; Van Montfoort, Van Dieren,
Hopkins, & Shearman, 2004; Cameron et al., 2010) and future investigations should
96
quantify specific symptoms so that the impact of gastrointestinal symptoms on
performance can be quantified.
Conclusion
Performance in well-trained rowers can improve by ~2% with 6 mg.kg-1
BM caffeine
supplementation. However, when caffeine is combined with sodium bicarbonate
supplements, gastrointestinal symptoms during exercise may prevent an enhancement in
2000 m rowing performance, despite enhanced blood buffering potential via induced
alkalosis.
97
References
Anderson, M. E., Bruce, C. R., Fraser, S. F., Stepto, N. K., Klein, R., Hopkins, W. G.,
& Hawley, J. A. (2000). Improved 2000-meter rowing performance in
competitive oarswomen after caffeine ingestion. International Journal of Sport
Nutrition and Exercise Metabolism, 10(4), 464-475.
Anselme, F., Collomp, K., Mercier, B., Ahmaïdi, S., & Prefaut, C. (1992). Caffeine
increases maximal anaerobic power and blood lactate concentration. European
Journal of Applied Physiology, 65(2), 188-191.
Bell, D. G., Jacobs, I., & Zamecnik, J. (1998). Effects of caffeine, ephedrine and their
combination on time to exhaustion during high-intensity exercise. European
Journal of Applied Physiology, 77(5), 427-433.
Borg, G. (1970). Perceived exertion as an indicator of somatic stress. Scandinavian
Journal of Rehabilitation Medicine, 2(2), 92-98.
Brien, D. M., & McKenzie, D. C. (1989). The effect of induced alkalosis and acidosis
on plasma lactate and work output in elite oarsmen. European Journal of
Applied Physiology, 58(8), 797-802.
Bruce, C. R., Anderson, M. E., Fraser, S. F., Stepto, N. K., Klein, R., Hopkins, W. G.,
& Hawley, J. A. (2000). Enhancement of 2000-m rowing performance after
caffeine ingestion. Medicine & Science in Sports & Exercise, 32(11), 1958-
1963.
Burke, L. M. (2008). Caffeine and sports performance. Applied Physiology Nutrition
and Metabolism, 33(6), 1319-1334.
98
Burke, L. M., & Pyne, D. B. (2007). Bicarbonate loading to enhance training and
competitive performance. International Journal of Sports Physiology and
Performance, 2(1), 93-97.
Cameron, S. L., McLay-Cooke, R. T., Brown, R. C., Gray, A. R., & Fairbairn, K. A.
(2010). Increased blood pH but not performance with sodium bicarbonate
supplementation in elite rugby union players. International Journal of Sport
Nutrition and Exercise Metabolism, 20(4), 307-321.
Doherty, M., & Smith, P. M. (2005). Effects of caffeine ingestion on rating of perceived
exertion during and after exercise: a meta-analysis. Scandinavian Journal of
Medicine and Science in Sports, 15(2), 69-78.
Ferré. (2008). An update on the mechanisms of the psychostimulant effects of caffeine.
Journal of Neurochemistry, 105(4), 1067-1079.
Ganio, M. S., Klau, J. F., Casa, D. J., Armstrong, L. E., & Maresh, C. M. (2009). Effect
of caffeine on sport-specific endurance performance: a systematic review.
Journal of Strength and Conditioning Research, 23(1), 315-324.
Gledhill, N. (1984). Bicarbonate ingestion and anaerobic performance. Sports Medicine,
1, 177-180.
Graham, T. E., Battram, D. S., Dela, F., El-Sohemy, A., & Thong, F. S. L. (2008). Does
caffeine alter muscle carbohydrate and fat metabolism during exercise? Applied
Physiology Nutrition and Metabolism, 33(6), 1311-1318.
99
Hagerman, F. C., Connors, M. C., Gault, J. A., Hagerman, G. R., & Polinski, W. J.
(1978). Energy expenditure during simulated rowing. Journal of Applied
Physiology, 45(1), 87-93.
Hahn, A. (1989). Rowing. In J. Draper & R. Telford (Eds). Sport specific guidelines for
the physiological assessment of the elite athlete (pp. 79-90). Canberra: National
Sports Research Program Australian Coaching Council.
Hopkins, W. G., Marshall, S. W., Batterham, A. M., & Hanin, J. (2009). Progressive
statistics for studies in sports medicine and exercise science. Medicine and
Science in Sports and Exercise, 41(1), 3-12.
Ibanez, J., Pullinen, T., Gorostiaga, E., Postigo, A., & Mero, A. (1995). Blood lactate
and ammonia in short-term anaerobic work following induced alkalosis. Journal
of Sports Medicine and Physical Fitness, 35(3), 187-193.
Jackman, M., Wendling, P., Friars, D., & Graham, T. E. (1996). Metabolic,
catecholamine, and endurance responses to caffeine during intense exercise.
Journal of Applied Physiology, 81(4), 1658-1663.
Johnson, W. R., & Black, D. H. (1953). Comparison of effects of certain blood
alkalinizers and glucose upon competitive endurance performance. Journal of
Applied Physiology, 5(10), 577-578.
Kalmar, J. M. (2005). The influence of caffeine on voluntary muscle activation.
Medicine & Science in Sports & Exercise, 37(12), 2113-2119.
Keisler, B. D., & Armsey, T. D. (2006). Caffeine as an ergogenic aid. Current Sports
Medicine Reports, 5(4), 215-219.
100
Matson, L. G., & Tran, Z. V. (1993). Effects of sodium bicarbonate ingestion on
anaerobic performance: a meta-analytic review. International Journal of Sport
Nutrition, 3(1), 2-28.
McCartney, N., Heigenhauser, G. J. F., & Jones, N. L. (1983). Effects of pH on
maximal output and fatigue during short-term dynamic exercise. Journal of
Applied Physiology, 55, 225-229.
McKenzie, D. C. (1988). Changes in urinary pH following bicarbonate loading.
Canadian Journal of Sport Science, 13(4), 254-256.
McNaughton, & Cedaro, R. (1991). The effect of sodium bicarbonate on rowing
ergometer performance in elite rowers. The Australian Journal of Science and
Medicine in Sport, 23(3), 66-69.
McNaughton, Siegler, J., & Midgley, A. (2008). Ergogenic effects of sodium
bicarbonate. Current Sports Medicine Reports, 7(4), 230-236.
Pruscino, C. L., Ross, M. L. R., Gregory, J. R., Savage, B., & Flanagan, T. R. (2008).
Effects of sodium bicarbonate, caffeine and their combination on repeated 200-
m freestyle performance. International Journal of Sport Nutrition and Exercise
Metabolism, 18(2), 116-130.
Requena, B., Zabala, M., Padial, P., & Feriche, B. (2005). Sodium bicarbonate and
sodium citrate: ergogenic aids? Journal of Strength and Conditioning Research,
19(1), 213-224.
101
Skinner, T. L., Jenkins, D. G., Coombes, J. S., Taaffe, D. R., & Leveritt, M. D. (2010).
Dose response of caffeine on 2000-m rowing performance. Medicine & Science
in Sports & Exercise, 42(3), 571-576.
Slater, Rice, A. J., Sharpe, K., Jenkins, D., & Hahn, A. G. (2007). Influence of nutrient
intake after weigh-in on lightweight rowing performance. Medicine & Science in
Sports & Exercise, 39(1), 184-191.
Slater, Rice, A. J., Sharpe, K., Tanner, R., Jenkins, D., Gore, C. J., & Hahn, A. G.
(2005). Impact of acute weight loss and/or thermal stress on rowing ergometer
performance. Medicine & Science in Sports & Exercise, 37(8), 1387-1394.
Slater, G. J., Rice, A. J., Tanner, R., Sharpe, K., Gore, C. J., Jenkins, D. G., & Hahn, A.
G. (2006). Acute weight loss followed by an aggressive nutritional recovery
strategy has little impact on on-water rowing performance. British Journal of
Sports Medicine, 40(1), 55-59.
Slater, G. J., Rice, A. J., Tanner, R. K., Sharpe, K., Jenkins, D. G., & Hahn, A. G.
(2006). Impact of two different body mass management strategies on repeat
rowing performance. Medicine & Science in Sports & Exercise, 38(1), 138-146.
Stephens, T. J., McKenna, M. J., Canny, B. J., Snow, R. J., & McConnel, G. K. (2002).
Effect of sodium bicarbonate on muscle metabolism during intense endurance
cycling. Medicine and Science in Sports and Exercise, 43(4), 614-621.
Sutton, J. R., Jones, N. L., & Toews, C. J. (1981). Effect of pH on muscle glycolysis
during exercise. Clinical Science, 61(3), 331-338.
102
Tarnopolsky, M. A. (2008). Effect of caffeine on the neuromuscular system - potential
as an ergogenic aid. Applied Physiology Nutrition and Metabolism, 33(6), 1284-
1289.
Van Montfoort, M. C. E., Van Dieren, L., Hopkins, W. G., & Shearman, J. P. (2004).
Effects of ingestion of bicarbonate, citrate, lactate and chloride on sprint
running. Medicine and Science in Sports and Exercise, 36(7), 1239-1243.
Wiles, J. D., Bird, S. R., & Hopkins, J. (1992). Effect of caffeinated coffee on running
speed, respiratory factors, blood lactate and perceived exertion during 1500-m
treadmill running. British Journal of Sports Medicine, 26(2), 116-120.
Wilkes, D., Gledhill, N., & Smyth, R. (1983). Effect of acute induced metabolic
akalosis on 800-m racing time. Medicine and Science in Sports and Exercise,
15(4), 277-280.
103
CHAPTER FOUR
Study Three
Effect of Sodium Bicarbonate Ingestion Protocol on [HCO3-], pH and
Gastrointestinal Symptoms
Journal article accepted for publication with
International Journal of Sport Nutrition and Exercise Metabolism
Presented here in the journal submission format
Key words: Ergogenic aid, buffering, induced alkalosis
104
Abstract
Sodium bicarbonate (NaHCO3) is often ingested at a dosage of 0.3 g.kg-1
body mass
(BM), however ingestion protocols are inconsistent in terms of using solution or
capsules, ingestion period, combining NaHCO3 with sodium citrate (Na3C6H5O7), and
co-ingested food and fluid. Purpose: To quantify the effect of ingesting 0.3 g.kg-1
BM
NaHCO3 on blood bicarbonate concentration [HCO3-],
pH, and gastrointestinal (GI)
symptoms over the subsequent 3-h using a range of ingestion protocols, and thus to
determine an optimal protocol. Methods: In a crossover design, 13 physically-active
subjects undertook eight NaHCO3 experimental ingestion protocols and one placebo
protocol. Capillary blood was taken every 30-min and analysed for pH and [HCO3-]. GI
symptoms were quantified every 30-min via questionnaire. Statistics used were pair
wise comparisons between protocols; differences were interpreted in relation to smallest
worthwhile changes for each variable. A likelihood of >75% was a substantial change.
Results: [HCO3-]
and pH were substantially greater than placebo for all ingestion
protocols at almost all time points. When NaHCO3 was co-ingested with food, the
greatest [HCO3-] (30.9 mmol.L
-1) and pH (7.49), and lowest incidence of GI symptoms
were observed. The greatest incidence of GI side effects was observed 90 min after
ingestion of 0.3g.kg-1
BM NaHCO3 solution. Conclusions: The changes in pH and
[HCO3-] for the eight NaHCO3 ingestion protocols were similar, therefore an optimal
protocol cannot be recommended. However, our results suggest that NaHCO3 co-
ingested with a high-carbohydrate meal should be taken 120-150 min prior to exercise
to induce substantial blood alkalosis and reduce GI symptoms.
105
Introduction
Sodium bicarbonate (NaHCO3) has been used as an ergogenic aid for events which are
dependent on the generation of energy via anaerobic glycolysis. (McNaughton, Strange,
and Backx, 2000). Its ingestion has been reported to improve competitive and
laboratory-based protocols of sustained exercise lasting 1-7 min involving swimming
(Gao, Costill, Horswill, and Park, 1988; Zajac, Cholewa, Poprzecki, Waskiewicz, and
Langfort, 2009) middle-distance running (Goldfinch, McNaughton, and Davies, 1988;
Wilkes, Gledhill, and Smyth, 1983; Van Montfoort, Van Dieren, Hopkins and
Shearman, 2004 and rowing (McNaughton and Cedaro, 1991). Similar findings have
also been reported for high-intensity performance at the end of 30-60 min protocols
(McNaughton, Dalton and Palmer, 1999); and repeated-sprint performance typical of
team sports (Lavender and Bird, 1989; McKenzie, Coutts, Stirling, Hoeben and Kuzara,
1986).
Sodium bicarbonate ingestion has been proposed to enhance performance by increasing
extracellular buffering capacity (Burke and Pyne, 2007; McNaughton, Siegler, and
Midgley, 2008), however there appears to be a threshold elevation in blood bicarbonate
concentration [HCO3-] and / or pH required (6 mmol.L
-1 and 0.05 respectively) before
ergogenic potential is evident (Bishop and Claudius, 2005; McNaughton and Cedaro,
1991; Van Montfoort et al., 2004; Wilkes et al., 1983). Post-exercise blood lactate
values can be 1-2 mmol.L-1
higher after NaHCO3 ingestion compared with placebo or
control trials (McNaughton et al., 1999; Wilkes et al., 1983).
A disadvantage of NaHCO3 supplementation is the possibility of gastrointestinal (GI)
upset, resulting in symptoms such as nausea, stomach pain, diarrhoea and vomiting
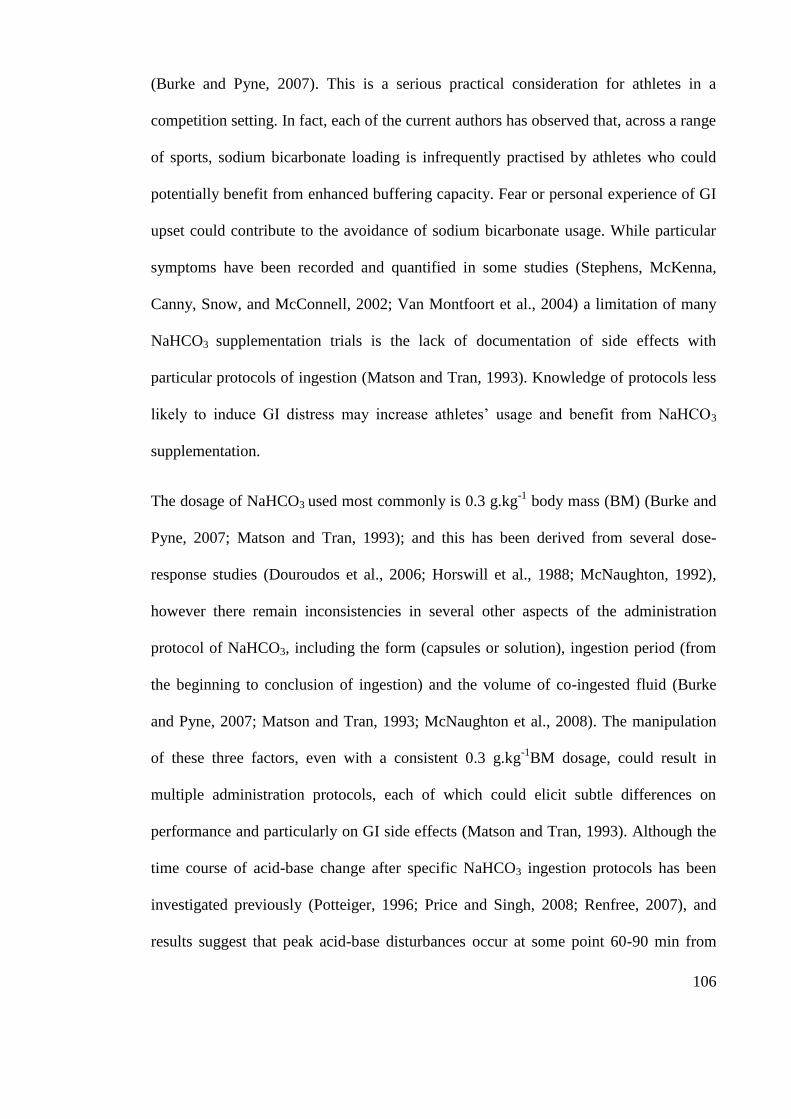
106
(Burke and Pyne, 2007). This is a serious practical consideration for athletes in a
competition setting. In fact, each of the current authors has observed that, across a range
of sports, sodium bicarbonate loading is infrequently practised by athletes who could
potentially benefit from enhanced buffering capacity. Fear or personal experience of GI
upset could contribute to the avoidance of sodium bicarbonate usage. While particular
symptoms have been recorded and quantified in some studies (Stephens, McKenna,
Canny, Snow, and McConnell, 2002; Van Montfoort et al., 2004) a limitation of many
NaHCO3 supplementation trials is the lack of documentation of side effects with
particular protocols of ingestion (Matson and Tran, 1993). Knowledge of protocols less
likely to induce GI distress may increase athletes‟ usage and benefit from NaHCO3
supplementation.
The dosage of NaHCO3 used most commonly is 0.3 g.kg-1
body mass (BM) (Burke and
Pyne, 2007; Matson and Tran, 1993); and this has been derived from several dose-
response studies (Douroudos et al., 2006; Horswill et al., 1988; McNaughton, 1992),
however there remain inconsistencies in several other aspects of the administration
protocol of NaHCO3, including the form (capsules or solution), ingestion period (from
the beginning to conclusion of ingestion) and the volume of co-ingested fluid (Burke
and Pyne, 2007; Matson and Tran, 1993; McNaughton et al., 2008). The manipulation
of these three factors, even with a consistent 0.3 g.kg-1
BM dosage, could result in
multiple administration protocols, each of which could elicit subtle differences on
performance and particularly on GI side effects (Matson and Tran, 1993). Although the
time course of acid-base change after specific NaHCO3 ingestion protocols has been
investigated previously (Potteiger, 1996; Price and Singh, 2008; Renfree, 2007), and
results suggest that peak acid-base disturbances occur at some point 60-90 min from
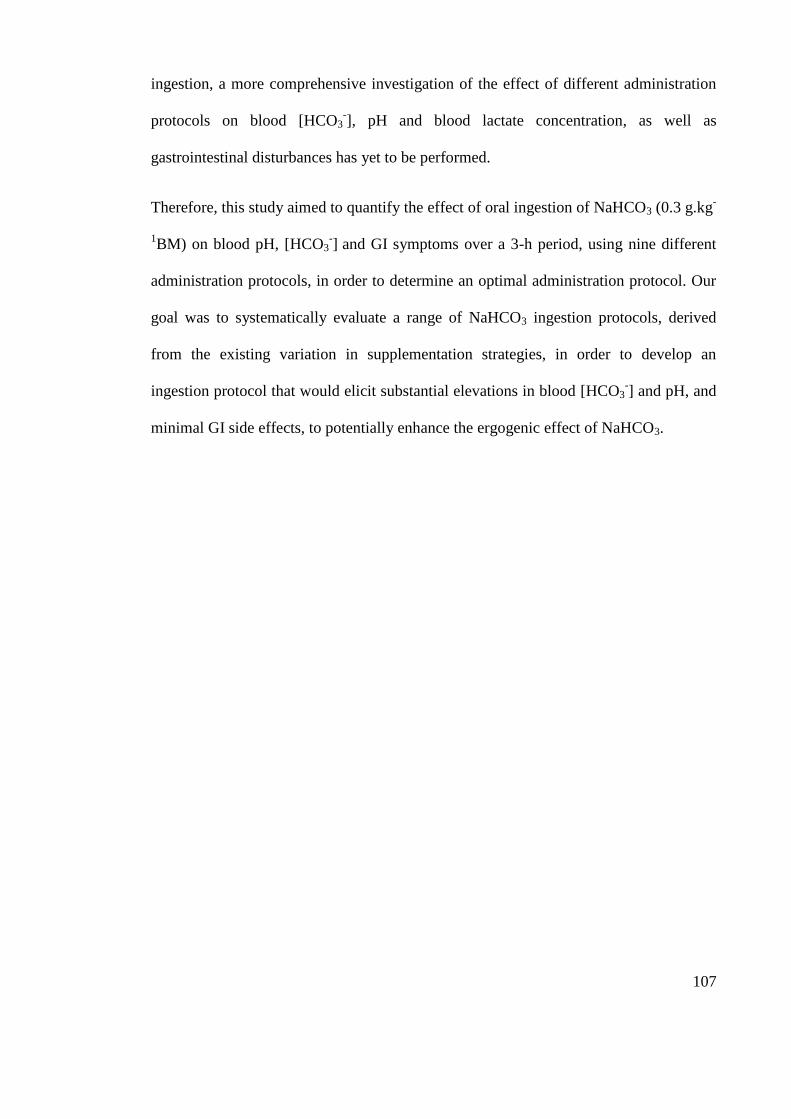
107
ingestion, a more comprehensive investigation of the effect of different administration
protocols on blood [HCO3-], pH and blood lactate concentration, as well as
gastrointestinal disturbances has yet to be performed.
Therefore, this study aimed to quantify the effect of oral ingestion of NaHCO3 (0.3 g.kg-
1BM) on blood pH, [HCO3
-]
and GI symptoms over a 3-h period, using nine different
administration protocols, in order to determine an optimal administration protocol. Our
goal was to systematically evaluate a range of NaHCO3 ingestion protocols, derived
from the existing variation in supplementation strategies, in order to develop an
ingestion protocol that would elicit substantial elevations in blood [HCO3-] and pH, and
minimal GI side effects, to potentially enhance the ergogenic effect of NaHCO3.
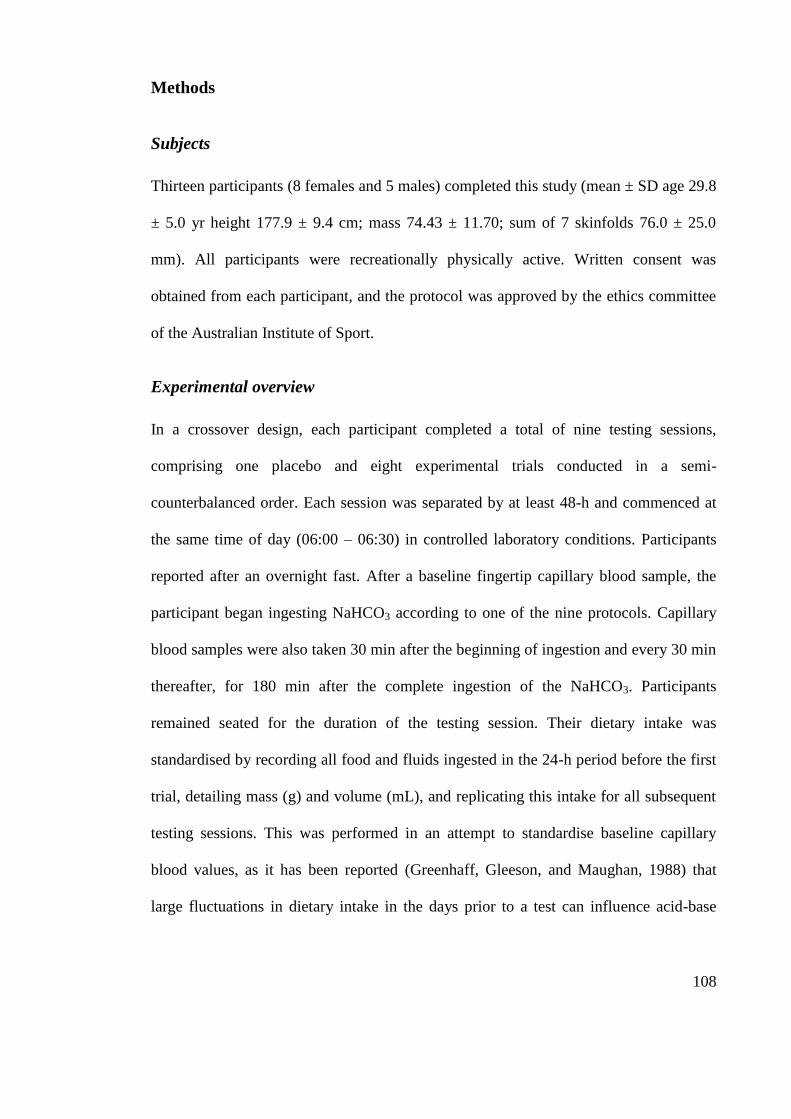
108
Methods
Subjects
Thirteen participants (8 females and 5 males) completed this study (mean ± SD age 29.8
± 5.0 yr height 177.9 ± 9.4 cm; mass 74.43 ± 11.70; sum of 7 skinfolds 76.0 ± 25.0
mm). All participants were recreationally physically active. Written consent was
obtained from each participant, and the protocol was approved by the ethics committee
of the Australian Institute of Sport.
Experimental overview
In a crossover design, each participant completed a total of nine testing sessions,
comprising one placebo and eight experimental trials conducted in a semi-
counterbalanced order. Each session was separated by at least 48-h and commenced at
the same time of day (06:00 – 06:30) in controlled laboratory conditions. Participants
reported after an overnight fast. After a baseline fingertip capillary blood sample, the
participant began ingesting NaHCO3 according to one of the nine protocols. Capillary
blood samples were also taken 30 min after the beginning of ingestion and every 30 min
thereafter, for 180 min after the complete ingestion of the NaHCO3. Participants
remained seated for the duration of the testing session. Their dietary intake was
standardised by recording all food and fluids ingested in the 24-h period before the first
trial, detailing mass (g) and volume (mL), and replicating this intake for all subsequent
testing sessions. This was performed in an attempt to standardise baseline capillary
blood values, as it has been reported (Greenhaff, Gleeson, and Maughan, 1988) that
large fluctuations in dietary intake in the days prior to a test can influence acid-base
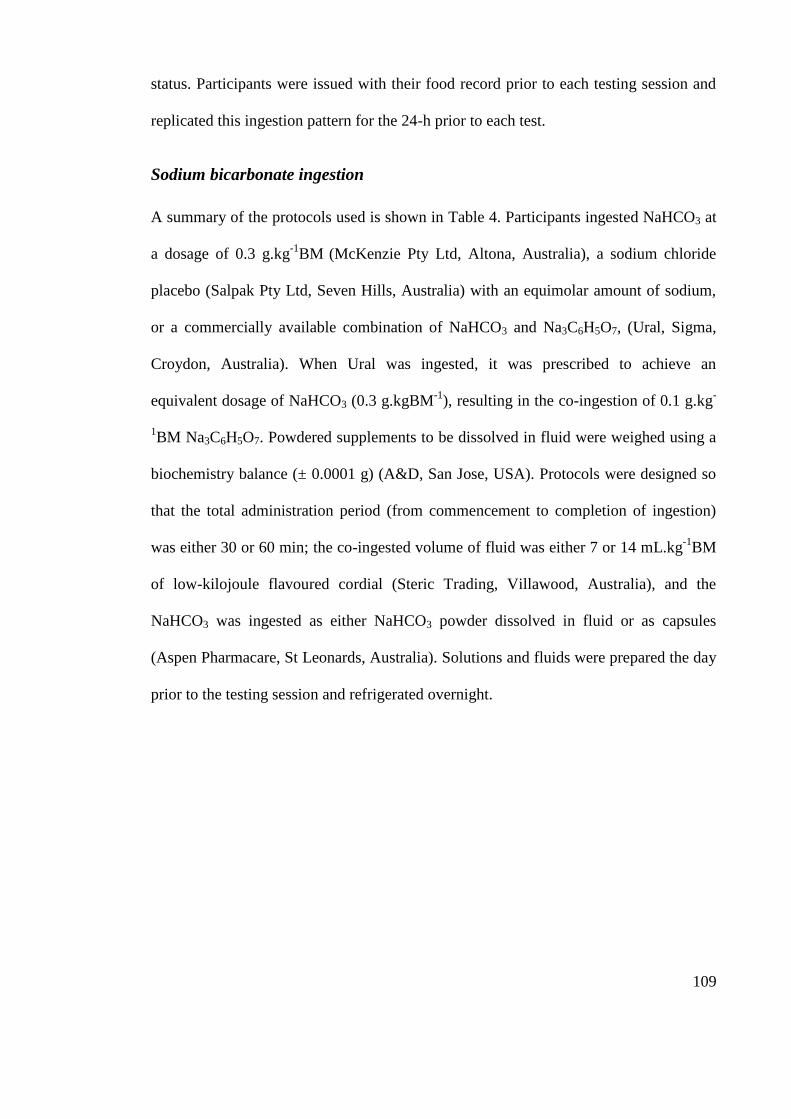
109
status. Participants were issued with their food record prior to each testing session and
replicated this ingestion pattern for the 24-h prior to each test.
Sodium bicarbonate ingestion
A summary of the protocols used is shown in Table 4. Participants ingested NaHCO3 at
a dosage of 0.3 g.kg-1
BM (McKenzie Pty Ltd, Altona, Australia), a sodium chloride
placebo (Salpak Pty Ltd, Seven Hills, Australia) with an equimolar amount of sodium,
or a commercially available combination of NaHCO3 and Na3C6H5O7, (Ural, Sigma,
Croydon, Australia). When Ural was ingested, it was prescribed to achieve an
equivalent dosage of NaHCO3 (0.3 g.kgBM-1
), resulting in the co-ingestion of 0.1 g.kg-
1BM Na3C6H5O7. Powdered supplements to be dissolved in fluid were weighed using a
biochemistry balance (± 0.0001 g) (A&D, San Jose, USA). Protocols were designed so
that the total administration period (from commencement to completion of ingestion)
was either 30 or 60 min; the co-ingested volume of fluid was either 7 or 14 mL.kg-1
BM
of low-kilojoule flavoured cordial (Steric Trading, Villawood, Australia), and the
NaHCO3 was ingested as either NaHCO3 powder dissolved in fluid or as capsules
(Aspen Pharmacare, St Leonards, Australia). Solutions and fluids were prepared the day
prior to the testing session and refrigerated overnight.
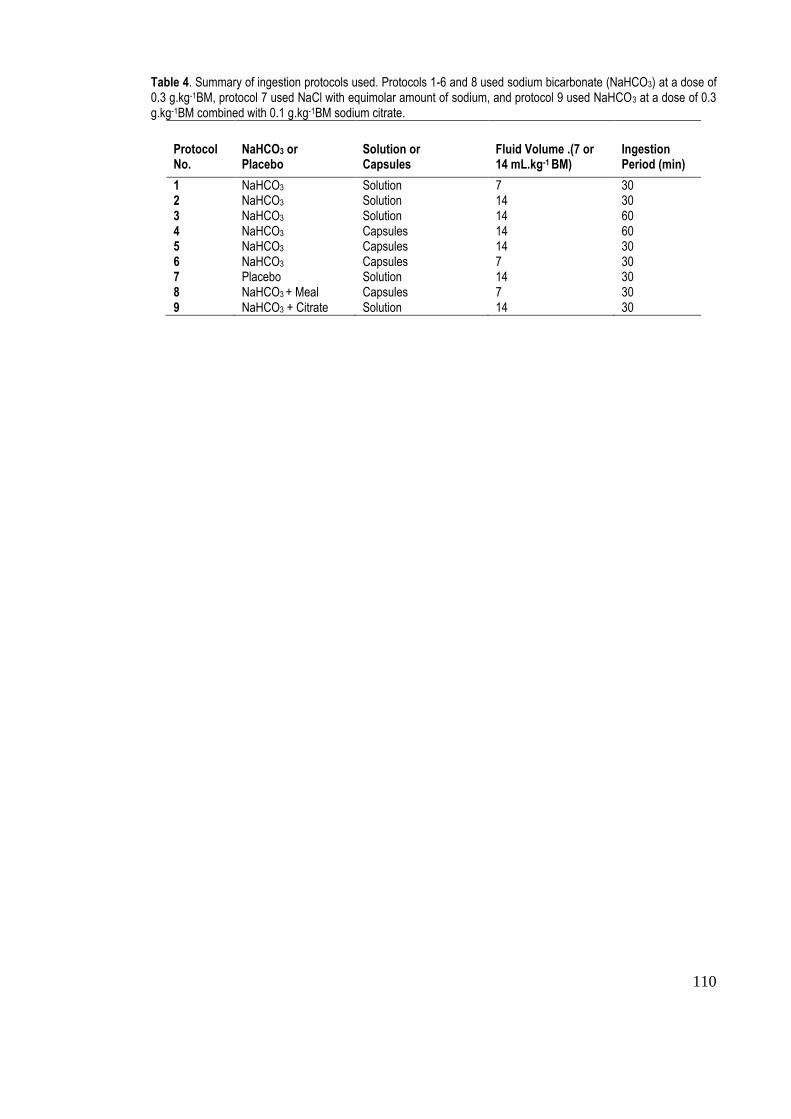
110
Table 4. Summary of ingestion protocols used. Protocols 1-6 and 8 used sodium bicarbonate (NaHCO3) at a dose of 0.3 g.kg-1BM, protocol 7 used NaCl with equimolar amount of sodium, and protocol 9 used NaHCO3 at a dose of 0.3 g.kg-1BM combined with 0.1 g.kg-1BM sodium citrate.
Protocol No.
NaHCO3 or Placebo
Solution or Capsules
Fluid Volume .(7 or 14 mL.kg-1 BM)
Ingestion Period (min)
1 NaHCO3 Solution 7 30 2 NaHCO3 Solution 14 30 3 NaHCO3 Solution 14 60 4 NaHCO3 Capsules 14 60 5 NaHCO3 Capsules 14 30 6 NaHCO3 Capsules 7 30 7 Placebo Solution 14 30 8 NaHCO3 + Meal Capsules 7 30 9 NaHCO3 + Citrate Solution 14 30
111
The total volume of fluid and number of capsules for each protocol was divided into
three equal amounts. Capsules and / or fluid (at a temperature of ~4ºC for fluids) were
ingested at 15 min intervals for the 30 min protocols and at 30 min intervals for the 60
min protocols. Participants were instructed to ingest each dose in as little time as
possible, typically over 2-3 min. When participants co-ingested the supplement with a
meal, they were provided with a food (toasted bread with fruit spread and cereal bars)
(Kellogg, Melbourne, Australia), which included 1.5 g carbohydrate per kg-1
BM. The
(mean ± SD) energy intake for the meal was 2275 ± 470 kJ. Participants ingested the
meal over the total ingestion period (30 min) for this protocol.
Capillary blood sampling and analysis
Prior to capillary blood sampling, participants immersed one hand in warm water
(~45oC) for ~1 min. The hand was then dried and one finger was pierced with a sterile
2.0 mm retractable lancet (Medlance, Ozorkow, Poland). The first drop of blood was
removed and then 100 L blood was collected in a glass capillary tube (Radiometer,
Copenhagen, Denmark). Blood samples were immediately analysed using a blood-gas
analyser (Radiometer ABL 725, Radiometer, Copenhagen, Denmark) for pH and
bicarbonate concentration.
Gastrointestinal symptoms
Participants were provided with a validated questionnaire (adapted with permission
from Jeukendrup et al., 2000) at the same time as each blood sample was taken to
quantify side effects. There were 16 items describing possible GI side effects, plus
heartburn, dizziness, headache and muscle cramp, and a 10-point Likert scale, ranging
112
from 1 = „no problem at all‟ to 10 = „the worst it has ever been‟ to indicate the severity
of that side effect at that point in time.
Statistical analysis
A contemporary analytical approach was used, calculating the probability of clinical or
practical significance, rather than the use of a p-value less than 0.05 to determine
statistical significance (Hopkins, Marshall, Batterham and Hanin, 2009). The smallest
worthwhile change in performance is 0.3 of the typical within-athlete random variation
(Hopkins, Hawley, and Burke, 1999), where the typical random variation in
performance (within an athlete) between one race and another is ~1.5% (Hopkins and
Hewson, 2001). Therefore, the smallest worthwhile change in performance for an
athlete is ~0.5% (1.5% x 0.3). The improvement in performance reported previously
after NaHCO3 supplementation is ~1.5% and the corresponding increases in blood
[HCO3-]
and pH are ~6 mmol.L
-1 and 0.05 (McNaughton et al., 1999; Parry-Billings and
MacLaren, 1986; Wilkes et al., 1983) respectively. By inference, the smallest
worthwhile changes in absolute blood [HCO3-] and pH that are likely to be associated
with improved performance are 2 mmol.L-1
and 0.02, respectively. The smallest
worthwhile change in GI symptoms was set at one unit on the scale provided in the
questionnaire.
Change scores from baseline were calculated from individual raw blood [HCO3-], pH
and GI symptoms for each protocol. For each post-ingestion time point (30, 60, 90, 120,
150, 180, 210 and 240 min), change scores were entered into a spreadsheet:
http://www.sportsci.org/resource/stats/xPostOnlyCrossover.xls. Pair wise comparisons
of change scores for each post-ingestion time point were made between protocols, to
113
determine if the probability of the difference between protocols at each time point was
greater than the smallest worthwhile change for blood bicarbonate concentration after
NaHCO3 supplementation. The likelihoods were set as; <1% - almost certainly not,
<5% - very unlikely, <25% - unlikely, probably not, 25-75% - possibly, possibly not,
>75% - likely, probably, >95% - very likely, >99% - almost certainly and were
interpreted relative to the smallest worthwhile effect for the respective bicarbonate
concentration, pH and GI symptoms data. A >75% probability that differences between
protocols were above the smallest worthwhile change threshold was interpreted as a
substantial difference.
114
Results
Figure 8 shows the time course of [HCO3-], pH and gastrointestinal symptoms at pre-
ingestion and all post-ingestion time points for all protocols.
Bicarbonate concentration
Blood [HCO3-]
for all experimental ingestion protocols was likely to be substantially
greater than that recorded in the placebo trial at almost all time points. The peak blood
[HCO3-]
(30.9 mmol.L
-1) and the greatest change in [HCO3
-]
from baseline (6.6 mmol.L
-
1) were recorded 150 min after ingestion commenced, with ingestion protocol 8.
Protocol 9 was the least effective protocol, and at each post-supplementation time point
there were substantial differences in [HCO3-] between this protocol and the protocol that
elicited the peak [HCO3-] at that time point (Figure 8a).
pH
The pH for all ingestion protocols was likely to be substantially greater than that
recorded in the placebo trial at almost all time points. The peak pH value (7.49) was
recorded 120 min post-ingestion for protocol 6 and the greatest change in pH from
baseline (0.08) was recorded 120 min post-ingestion with ingestion protocol 3. Protocol
9 was again the least effective protocol, and at each post-supplementation time point,
there was likely to be a substantial difference between pH measured with this protocol
and the highest pH value measured at that time point (Figure 8b).
Gastrointestinal symptoms
The greatest incidence of GI side effects was recorded 90 min post-ingestion, with
protocol 1. At four of the eight time points, the lowest incidence of GI symptoms was
115
recorded with protocol 8, substantial improvements were likely compared to protocol 1
at 90 min and protocol 3 at 180 min post-ingestion, where 1.5g.kg-1
BM carbohydrate
was co-ingested with the sodium bicarbonate dose (Figure 8c).
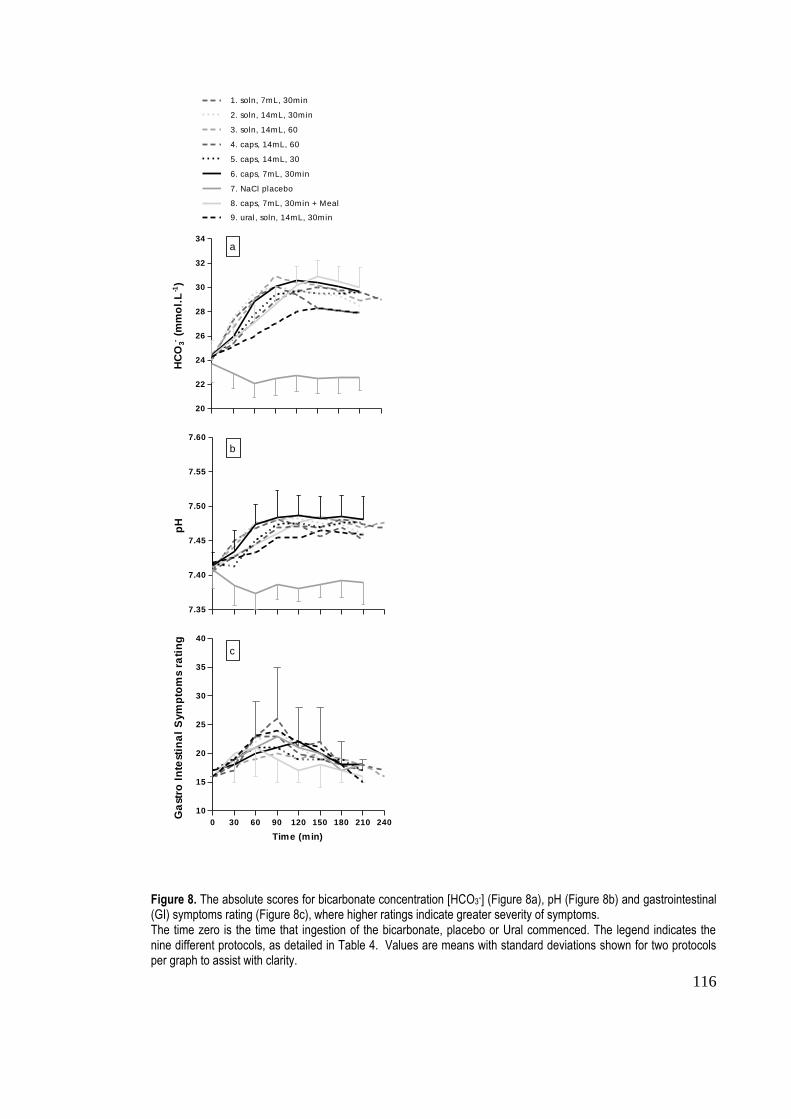
116
20
22
24
26
28
30
32
34
1. soln, 7mL, 30min
2. soln, 14mL, 30min
3. soln, 14mL, 60
4. caps, 14mL, 60
5. caps, 14mL, 30
6. caps, 7mL, 30min
7. NaCl placebo
8. caps, 7mL, 30min + Meal
9. ural, soln, 14mL, 30min
HC
O3-
(mm
ol.
L-1
)
7.35
7.40
7.45
7.50
7.55
7.60
pH
0 30 60 90 120 150 180 210 240
10
15
20
25
30
35
40
Time (min)
Ga
str
o I
nte
sti
na
l S
ym
pto
ms r
ati
ng
a
b
c
Figure 8. The absolute scores for bicarbonate concentration [HCO3-] (Figure 8a), pH (Figure 8b) and gastrointestinal (GI) symptoms rating (Figure 8c), where higher ratings indicate greater severity of symptoms. The time zero is the time that ingestion of the bicarbonate, placebo or Ural commenced. The legend indicates the nine different protocols, as detailed in Table 4. Values are means with standard deviations shown for two protocols per graph to assist with clarity.
117
Discussion
The main findings of our study were that peak blood alkalosis can be expected ~120-
150 min after commencing ingestion of various protocols involving NaHCO3 at 0.3
g.kg-1
BM. Among eight different supplement protocols, the lowest incidence of GI
distress occurred following the ingestion of NaHCO3 capsules, co-ingested with 7 mL
per kg of fluid and a standardised meal (1.5 g carbohydrate.kg-1
BM), suggesting that the
coingestion of a standardised meal is a more important consideration for NaHCO3
supplementation than fluid volumes or the capsule or solution form of NaHCO3 used.
The highest incidence of GI side effects occurred 90 min after the commencement of the
ingestion of a NaHCO3 solution in a small volume of fluid. Our results provide a
practical model for ingesting NaHCO3 prior to exercise to optimise blood alkalosis and
to reduce the occurrence of GI symptoms; specifically, the ingestion of the dose should
commence 120-150 min before the start of exercise and, if practical, should be co-
ingested with a small meal composed of carbohydrate-rich food choices.
The mean peak value for blood [HCO3-], measured in the current investigation, was 30.9
mmol.L-1
. This value is similar to the 29.4 mmol.L-1
reported by McNaughton and
Cedaro (1991) and the mean 31.5 mmol.L-1
value reported by Brien and McKenzie
(1989) after 0.3 g.kg-1
BM NaHCO3 ingestion. The mean peak change in [HCO3-] above
baseline (6.6 mmol.L-1
) was slightly greater than the range (3.2 – 5.9 mmol.L-1
) given in
Matson and Tran‟s (1993) meta-analysis of bicarbonate supplementation studies using a
0.3 g.kg-1
BM dosage, but similar to values reported by Wilkes et al. (1983) (7.3
mmol.L-1
) and Brien and McKenzie (1989) (6.6 mmol.L-1
), and slightly greater than that
found by Potteiger et al. (1996). These peak absolute and change values were found 120
min and 150 min after ingestion of NaHCO3 ingestion began.
118
The peak pH value recorded in this investigation was 7.49, occurring 120 min after the
commencement of ingestion of NaHCO3 capsules with protocol 6 (capsules ingested
over 30 minutes with the smaller volume of fluid). Wilkes et al. (1983) also reported a
pre-exercise / post-ingestion value of 7.49, while other studies have found values of
7.40 (Brien and McKenzie, 1989) and 7.48 (McNaughton and Cedaro, 1991; Potteiger
et al., 1996) in their experimental (alkalotic) conditions. At the 120-min time point, the
greatest change score for pH (0.08) recorded in the current investigation fell within the
0.03 – 0.09 range given by Matson and Tran (1993) for the typical change in capillary
blood pH after supplementation with 0.03 g.kg-1
BM NaHCO3. The change value
recorded in this investigation was also consistent with the 0.09 reported by Wilkes et al.
(1983) and 0.06 by Brien and McKenzie (1989).
It is difficult to compare our current observations for the time course of changes in
capillary blood values of [HCO3-] and pH values with the results from other studies in
which values are typically provided for „pre-ingestion‟, „pre-exercise‟, and „post-
exercise‟ rather than at regular intervals. Furthermore, it is often problematic to
determine the time from the beginning of ingestion, as the period allowed for
participants to ingest the NaHCO3 is often not reported. However, another investigation
in which capillary blood characteristics were monitored ever 30 min after the ingestion
of NaHCO3 (0.3 g.kg-1
BM) found that that lowest values for hydrogen ion
concentrations were found at 60 and 90 min after the completion of the ingestion
protocol while the greatest acid-base disturbance occurred between 90 and 120 min
(Renfree, 2007). There are some similarities between the protocols used in the Renfree
study and our current protocol 8, which produced the greatest alkalosis but at a later
timepoint: these include the time allowed for bicarbonate ingestion and the volume of
119
co-ingested fluid. However, differences in our protocol 8 which may explain a delayed
rate of bicarbonate ingestion include the ingestion of a meal and the use of bicarbonate
capsules rather than a solution. Potteiger et al. (1996) also reported a comprehensive
time course of [HCO3-] and pH after sodium bicarbonate ingestion, with blood samples
taken at 10-min intervals for 120 min. They found peak pH and [HCO3] to occur at
earlier time points (120 and 100 min respectively) than in the current investigation (150
and 120 min), and this may also be linked to the food ingestion included in the protocol
of the current investigation, and not that of Potteiger et al. (1996).
Relatively few studies have quantified GI symptoms associated with bicarbonate
loading with the use of a validated scale as has been done in this investigation. We
found that the greatest incidence of gastrointestinal symptoms for a single protocol was
recorded 90 min after the commencement of ingestion of NaHCO3, yet the lowest
incidence of symptoms was 120 min after the commencement of ingestion when
NaHCO3 was co-ingested with a meal. Van Montfoort et al. (2004), compared
Na3C6H5O7, sodium lactate and a sodium chloride placebo, using a 10 point scale to
describe the severity of two possible symptoms („feeling sick‟ and „stomach ache‟),
measured at 30-min intervals from the start of ingestion until 120 min after a
performance test. The greatest score for „feeling sick‟ was recorded 90 min after the
commencement of ingestion, in the sodium chloride condition. These results are similar
to those of the current investigation for „nausea‟ (conceptually similar to „feeling sick‟)
and for the timing of peak GI side effects, although these were present for several of the
NaHCO3 protocols as well as for the (sodium chloride) placebo condition. Van
Montfoort et al. (2004) also reported the greatest incidence of „stomach ache‟ 90 min
after the completion of performance testing in the Na3C6H5O7 condition. In our
120
investigation, high ratings of „upper abdominal pain‟, „left abdominal pain‟ and „right
abdominal pain‟ were recorded for the ingestion protocol using the Na3C6H5O7 –
NaHCO3 combination. Stephens et al. (2002) used a scale where participants reported
their stomach comfort level and bowel urgency rating on a scale of 1 to 5, however
details of the frequency of measurement of symptoms or the results of the scale were
not given. McNaughton (1992) also gave subjective information on the observation of
GI symptoms when doses of greater than 0.3 g.kg-1
BM were given in his dose-response
investigation. This information is difficult to compare with the results obtained in the
current study, due the lack of detail provided about the timing, type and severity of any
GI distress. Having an appreciation of the time frame for GI symptom development
could assist with refinement of ingestion protocols. Ideally, a supplementation protocol
should be prescribed so that exercise performance coincides with the greatest elevation
in [HCO3-] and pH with concurrent lowest incidence of GI symptoms. Based on the
results of the current study for ingestion protocol 8, the balance between optimal blood
alkalosis and minimised gastrointestinal disturbance will be achieved if exercise
commences 150 min after ingesting 0.3g.kg-1
BM sodium bicarbonate capsules over 30-
min.
While a performance test was not employed in this study, the results can be used to
identify supplementation protocols that are practical to use in further studies or in
preparation for sporting events. The high incidence of GI symptoms following the
NaHCO3- Na3C6H5O7 protocol suggests that this protocol was not beneficial. Subjects
preferred the use of capsules to the ingestion of a bicarbonate solution. We found few
differences between the seven experimental protocols of pure NaHCO3 ingestion in
terms of absolute blood [HCO3-]
and pH values and the changes recorded from baseline
121
values. There was also little influence of the manipulation of variables such as co-
ingested fluid volume, the use of capsules or solution, or the ingestion period. However,
the ingestion of a meal (1.5 g of carbohydrate per kg BM) over the 30-min bicarbonate
ingestion period in protocol 8 resulted in the greatest bicarbonate value and one of the
highest absolute pH values. The lowest incidence of GI side effects was also recorded at
four of the eight time points after this protocol.
In conclusion, from the measurement of blood [HCO3-], pH and GI symptoms in this
investigation, we suggest that the best protocol for bicarbonate loading involves the
dose 0.3 g.kg-1
BM of pure NaHCO3 (rather than a combination of sodium
bicarbonate/citrate) which should be taken 120-150 min before the start of exercise. The
supplement should be co-ingested with a small high-carbohydrate meal to optimise
blood alkalosis and to reduce the occurrence of GI symptoms.
122
References
Bishop, D., & Claudius, B. (2005). Effects of induced metabolic alkalosis on prolonged
intermittent-sprint performance. Med Sci Sports Exerc, 37(5), 759-767.
Burke, L. M., & Pyne, D. B. (2007). Bicarbonate loading to enhance training and
competitive performance. Int J Sports Physiol Perform, 2, 93-97.
Brien, D. M., & McKenzie, D. C. (1989). The effect of induced alkalosis and acidosis
on plasma lactate and work output in elite oarsmen. European Journal of
Applied Physiology, 58(8), 797-802.
Douroudos, I.I., Fatouros, I.G., Gourgoulis, V., Jamurtas, A. Z., Tsitsios, T.,
Hatzinkikolaou, A.,...Taxildaris, K. (2006). Dose-related effects of prolonged
NaHCO3 ingestion during high-intensity exercise. Med Sci Sports Exerc, 38 (10),
1746-1753.
Gao, J., Costill, D. L., Horswill, C. A., & Park, S. H. (1988). Sodium bicarbonate
ingestion improves performance in interval swimming. Eur J Appl Physiol, 58,
171-174.
Goldfinch, J., McNaughton, L. R., & Davies, P. (1988). Induced metabolic alkalosis and
its effects on 400-m racing time. Eur J Appl Physiol, 57, 45-48.
Greenhaff, P. L., Gleeson, M., & Maughan, R. J. (1988). The effects of diet and muscle
pH and metabolism during high intensity exercise. Eur J Appl Physiol, 57, 531-
539.
Hopkins, W. G., Hawley, J. A., & Burke, L. M. (1999). Design and analysis of research
on sport performance enhancement. Med Sci Sports Exerc, 31(3), 472-485.
123
Hopkins, W. G., & Hewson, D. J. (2001). Variability of competitive performance of
distance runners. Med Sci Sports Exerc 33(9), 1588-1592.
Hopkins, W. G., Marshall, S. W., Batterham, A. M., & Hanin, J. (2009). Progressive
statistics for studies in sports medicine and exercise science. Med Sci Sports
Exerc, 41(1), 3-12.
Horswill, C. A., Costill, D. L., Fink, W. J., Flynn, M. G., Kirwan, J. P., Mitchell, J. B.,
et al. (1988). Influence of sodium bicarbonate on sprint performance:
relationship to dosage. Med Sci Sports Exerc, 20(6), 566-569.
Jeukendrup, A. E., Vet-Joop, K., Sturk, A., Stegen, J. H. J. C., Senden, J., Saris, W. H.
M., & Wagenmakers, A.J. (2000). Relationship between gastro-intestinal
complaints and endotoxaemia, cytokine release and the acute-phase reaction
during and after a long-distance triathlon in highly trained men. Clin Sci, 98, 47-
55.
Lavender, G., & Bird, S. R. (1989). Effect of sodium bicarbonate ingestion upon
repeated sprints. Br J Sports Med, 23(1), 41-45.
Matson, L. G., & Tran, Z. V. (1993). Effects of sodium bicarbonate ingestion on
anaerobic performance: a meta-analytic review. Int J Sport Nutr, 3(1), 2-28.
McKenzie, D. C., Coutts, K. D., Stirling, D. R., Hoeben, H. H., & Kuzara, G. (1986).
Maximal work production following two levels of artificially induced metabolic
alkalosis. J Sports Sci, 4, 35-38.
McNaughton, L. R. (1992). Bicarbonate ingestion: Effects of dosage on 60 s cycle
ergometry. J Sports Sci, 10, 415-423.
124
McNaughton, L. R., & Cedaro, R. (1991). The effect of sodium bicarbonate on rowing
ergometer performance in elite rowers. Aust J Sci Med Sport, 23(3), 66-69.
McNaughton, L. R., Dalton, B., & Palmer, G. (1999). Sodium bicarbonate can be used
as an ergogenic aid in high-intensity, competitive cycle ergometry of 1 h
duration. Eur J Appl Physiol, 80, 64-69.
McNaughton, L. R., Siegler, J., & Midgley, A. (2008). Ergogenic effects of sodium
bicarbonate. Curr Sports Med Rep, 7(4), 230-236.
McNaughton, L. R., Strange, N., & Backx, K. (2000). The effects of chronic sodium
bicarbonate ingestion on multiple bouts of anaerobic work and power output. J
Hum Mov Stud, 38, 307-322.
Potteiger, J.A., Webster, M.J., Nickel, G.L., Haub, M.D., & Palmer, R.J. (1996). The
effects of buffer ingestion on metabolic factors related to distance running
performance. Eur J Appl Physiol, 72, 365-371.
Parry-Billings, M., & MacLaren, D. P. M. (1986). The effect of sodium bicarbonate and
sodium citrate ingestion on anaerobic power during intermittent exercise. Eur J
Appl Physiol, 55, 524-529.
Price, M. J., and Singh, M. (2008). Time course of blood bicarbonate and pH three
hours after sodium bicarbonate ingestion. Int J Sports Physiol Perform, 3, 240-
242.
Renfree, A. (2007). The time course for changes in plasma [H+] after sodium
bicarbonate ingestion. Int J Sports Physiol Perform, 2, 323-326.
125
Stephens, T. J., McKenna, M. J., Canny, B. J., Snow, R. J., & McConnell, G. K. (2002).
Effect of sodium bicarbonate on muscle metabolism during intense endurance
cycling. Med Sci Sports Exerc, 34(4), 614-621.
Van Montfoort, M. C. E., Van Dieren, L. V., Hopkins, W. G., & Shearman, J. P. (2004).
Effects of ingestion of bicarbonate, citrate, lactate and chloride on sprint
running. Med Sci Sports Exerc, 36(7), 1239-1243.
Wilkes, D., Gledhill, N., & Smyth, R. (1983). Effect of acute induced metabolic
alkalosis on 800-m racing time. Med Sci Sports Exerc, 15(4), 277-280.
Zajac, A., Cholewa, J., Poprzecki, S., Waskiewicz, Z., & Langfort, J. (2009). Effects of
sodium bicarbonate on swim performance in youth athletes. J Sports Sci Med, 8,
45-50.
126
CHAPTER FIVE
Study Four
Bicarbonate Ingestion: Reliability and Effect on Buffering and
Performance
Journal article submitted to
International Journal of Sports Physiology and Performance
Presented here in the journal submission format
Running title: Bicarbonate loading: effect and reliability
Key words: Induced alkalosis, ergometer performance, rowing regatta, typical error,
individual differences
127
Abstract
Purpose: This study aimed to determine the effect and reliability of acute and chronic
sodium bicarbonate ingestion for 2000 m rowing ergometer performance (W) and blood
bicarbonate concentration [HCO3-]. Methods: In a crossover study, 7 well-trained
rowers performed paired 2000 m rowing ergometer trials under 3 double-blinded
conditions 1) 0.3 grams per kilogram of body mass (g.kg-1
BM) acute sodium
bicarbonate, 2) 0.5 g.kg-1
BM daily chronic sodium bicarbonate for 3 days and 3)
calcium carbonate placebo, in semi-counterbalanced order. For 2000 m performance
and [HCO3-] we examined differences in effects between conditions via pair-wise
comparisons, with differences interpreted in relation to the likelihood of exceeding
smallest worthwhile change thresholds for each variable. We also calculated the within-
subject variation (typical error) expressed as a percent. Results: There were no
substantial differences in 2000 m performance between the three conditions, however
[HCO3-] was substantially greater after acute bicarbonate, than with chronic loading and
placebo. Typical error for 2000 m mean power was 2.1% (90% confidence interval 1.4
to 4.0%) for acute sodium bicarbonate, 3.6% (2.5 to 7.0%) for chronic sodium
bicarbonate and 1.6% (1.1 to 3.0%) for placebo. Post-supplementation [HCO3-] typical
error was 7.3% (5.0 to 14.5%) for acute bicarbonate, 2.9% (2.0 to 5.7%) for chronic
bicarbonate and 6.0% (1.4 to 11.9%) for placebo. Conclusion: We recommend that
performance in 2000 m rowing ergometer trials is reliable after acute and chronic
bicarbonate loading. However, performance may not substantially improve, even after
induced blood alkalosis.
128
Introduction
The physiological effects of sodium bicarbonate ingestion and the subsequent
performance implications in high-intensity exercise lasting 1-7 minutes have been
investigated since the 1930s.1 Sodium bicarbonate ingestion induces alkalosis and
manifests as increased blood bicarbonate concentration [HCO3-]2, with a standard dose
of 0.3 grams per kilogram of body mass (g.kg-1
BM) increasing resting [HCO3-] by ~6
mmol.L-1
.2 The majority of bicarbonate loading studies have focused on acute protocols,
with the entire dose being consumed 1-3 h prior to the exercise test.3, 4
More recently,
“chronic” or longer duration bicarbonate supplementation strategies have been
investigated in an attempt to ameliorate the gastrointestinal side effects often associated
with acute loading.5 The “chronic” protocols, which involve 3-5 days of a daily
bicarbonate intake of 0.5 g.kg-1
BM split into 3-4 doses,5 can produce performance
enhancements and elevations in [HCO3-] similar to those achieved with acute loading.
6
The 2000 m rowing event, involving 5-8 minutes of high-intensity exercise resulting in
high levels of lactic acidosis, has been identified as a potential target of strategies to
enhance buffering capacity. Although several studies have investigated the effect of
sodium bicarbonate supplementation on rowing performance, the protocols have been
limited to effects of acute loading with single rowing ergometer efforts.7, 8
Meanwhile,
investigations of other dietary interventions on rowing performance have incorporated
repeated rowing ergometer trials over several days to better simulate the demands of
multi-day regatta racing.9, 10
We were interested to study the effects of repeated bicarbonate loading strategies on
ergometer trials undertaken 48 h apart both because of its relevance to real-life sport and
129
the physiological issue of repeating alkalizing strategies. Furthermore, repeated trials
present the opportunity to measure the reliability of measures such as performance
(mean power, stroke rate), induced alkalosis [HCO3-] and associated test measures;
blood lactate concentration [La-], Rating of Perceived Exertion (RPE)
11 and
gastrointestinal (GI) symptoms. Specifically, the typical error can be calculated via
changes between repeated trials, and quantifies the expected variation from one
assessment to the next. Therefore, observed changes in athletes‟ performance on
different occasions can be interpreted as real changes or as an artefact of the error or
uncertainty associated with that measure.12
Typical error, when calculated for both
experimental and control groups, has further practical application; quantifying the
variation from the mean treatment response between individuals, which can aid sport
scientists to interpret true changes when monitoring individual athletes.12
Accordingly, the purpose of this investigation was to determine the effect and reliability
of both acute and chronic sodium bicarbonate supplementation on a) induced alkalosis
[HCO3-] and subsequent repeated 2000 m rowing ergometer performance and b)
associated test measures ([La-], RPE, GI symptoms).
130
Methods
Subjects
Seven well-trained rowers participated in this study (4 males and 3 females; mean ±SD
age 25.0 ±11.7 y; body mass 79.7 ±10.8 kg; height 179.3 ±8.5 cm; sum of 7 skinfolds
76.3 ±21.7 mm). All were experienced with performing 2000 m rowing ergometer tests
with personal best times of 6:33.6 min:s ± 17.6 s for males and 7:27 min:s ±28.8 s for
females. Prior written consent was obtained from each participant, and the protocol was
approved by the ethics committee of the Australian Institute of Sport.
Design
In a crossover design, participants completed performance tests under three double-
blinded conditions (chronic bicarbonate, acute bicarbonate and placebo) in semi-
counterbalanced order. Testing for each condition comprised two trials, separated by
48-h, to simulate the repeated performance efforts required when competing in a major
regatta. Therefore, each participant completed a total of six performance tests over an
18-day testing period (Figure 9).
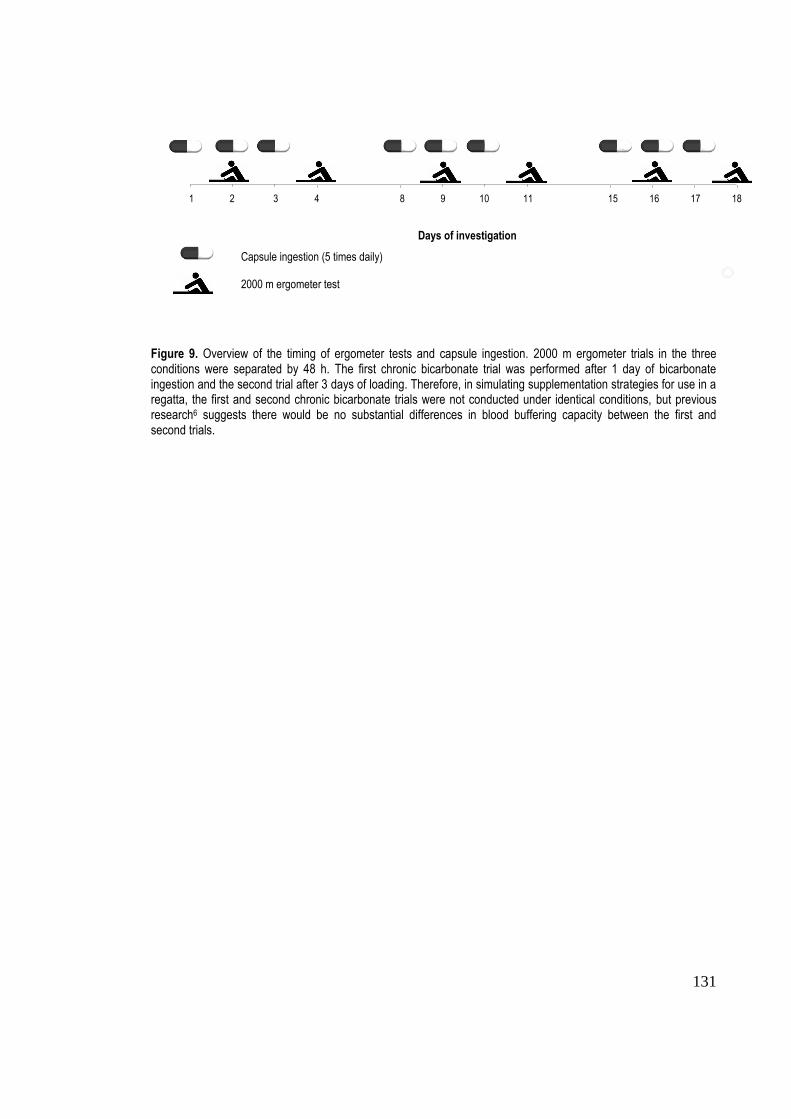
131
Figure 9. Overview of the timing of ergometer tests and capsule ingestion. 2000 m ergometer trials in the three conditions were separated by 48 h. The first chronic bicarbonate trial was performed after 1 day of bicarbonate ingestion and the second trial after 3 days of loading. Therefore, in simulating supplementation strategies for use in a regatta, the first and second chronic bicarbonate trials were not conducted under identical conditions, but previous research6 suggests there would be no substantial differences in blood buffering capacity between the first and second trials.
1 2 3 4 8 9 10 11 15 16 17 18
17 18
Days of investigation
Capsule ingestion (5 times daily) 2000 m ergometer test
Caps
132
Dietary standardization and training
Subjects recorded all food and fluid consumed (including details of the volume, type
and mass) and all training (type, duration and intensity of each session) performed for
the 24 h prior to the first 2000 m test. These dietary and training patterns were repeated
prior to each subsequent test and compliance to these protocols was checked on the
morning of each trial before subjects were cleared to proceed with the study.
Supplement Ingestion
In the acute bicarbonate condition, participants ingested 0.3 g.kg-1
BM sodium
bicarbonate capsules (Sodibic, Aspen Pharmacare, St Leonards, Australia) 120 min
prior to the first and second trials. In the chronic bicarbonate condition, participants
ingested 0.5 g.kg-1
BM sodium bicarbonate daily for a period of 3 days. The sodium
bicarbonate capsules were subdivided into 0.1 g.kg-1
BM doses which participants co-
ingested with meals and snacks throughout each day. No sodium bicarbonate capsules
were ingested acutely prior to the chronic bicarbonate supplementation trials.
The first chronic bicarbonate performance trial was performed after the first day of 0.5
g.kg-1
BM bicarbonate ingestion, and the second trial after 3 days of 0.5 g.kg-1
BM
bicarbonate ingestion (Figure 9). Therefore, participants completed the two chronic
bicarbonate trials under non-identical conditions. We specifically used this chronic
bicarbonate supplementation strategy because it simulated a rowing regatta where races
are often 48 h apart over a 5 day period and it would be impractical for athletes to ingest
bicarbonate for a period longer than 3 days. From a reliability perspective, original
work6 demonstrates no substantial differences in alkalosis achieved on the first and third
133
days of chronic ingestion; this suggests that subjects‟ blood buffering capacity would
not be different prior to their first and second chronic bicarbonate trials.
Timing of capsule ingestion, pre-test meal composition and co-ingested fluids were
standardized across all conditions to maintain subjects‟ blinding to the experimental
conditions. Therefore, in the placebo condition, participants ingested calcium carbonate
(Biotech Pharmaceuticals, Victoria, Australia) powder encased in gelatine capsules
(PCCA, NSW, Australia) matched for the number of bicarbonate capsules in a chronic
0.5 g.kg-1
BM dose on five occasions throughout the 3-day loading period. Similarly,
with acute supplementation, placebo capsules were ingested throughout the 3 days,
except for the 0.3 g.kg-1
BM doses taken prior to the two performance trials. Each
capsule dose was also co-ingested with 10 mL.kg-1
BM water. A standardized pre-test
meal [bread with fruit spread and cereal bars (Kellogg, Melbourne, Australia)] was
provided to subjects prior to each performance trial, comprising 2372 ± 336 kJ and 1.5
g.kg-1
BMcarbohydrate. The meal was consumed 120 min prior to the performance trial,
over a 30-min period. In previous work in our laboratory, we have demonstrated that
this ingestion protocol reduces the gastrointestinal symptoms associated with
bicarbonate loading.13
Experimental trials
Testing was conducted at the Physiology Laboratory of the Australian Institute of Sport.
An overview of each testing session is illustrated in Figure 10. Subjects arrived at the
laboratory after an overnight fast. Each session commenced at the same time of day
(0600 h) and was conducted under consistent environmental conditions, and subjects
performed each test on the same type of rowing ergometer (Concept IID, Morrisville,
134
USA) at the same time as another subject of similar ability to simulate racing
conditions. Drag factor on the ergometer was set according to the Rowing Australia
standards for gender, age and weight classification. Participants completed a 7-min
standardized warm-up, adapted from a previously published protocol9 (4 min at 70% of
maximal power output, followed by a 3-min period that included passive rest and 2 x 10
maximal strokes) before initiating the 2000 m test. Participants maintained the average
500 m split time from their most recent 2000 m ergometer test for the first 250 m, and
then experimenters removed the ergometer display screen from view, to minimise any
effect of pacing strategies on performance. Participants received verbal notification
when they reached 500 m, 1000 m and 1500 m, plus each 100 m of the final 500 m.
Stroke rate and mean power for each 500 m split were recorded. Immediately after the
completion of each performance test, participants indicated on a scale of 6-2011
their
perceived exertion for the test.
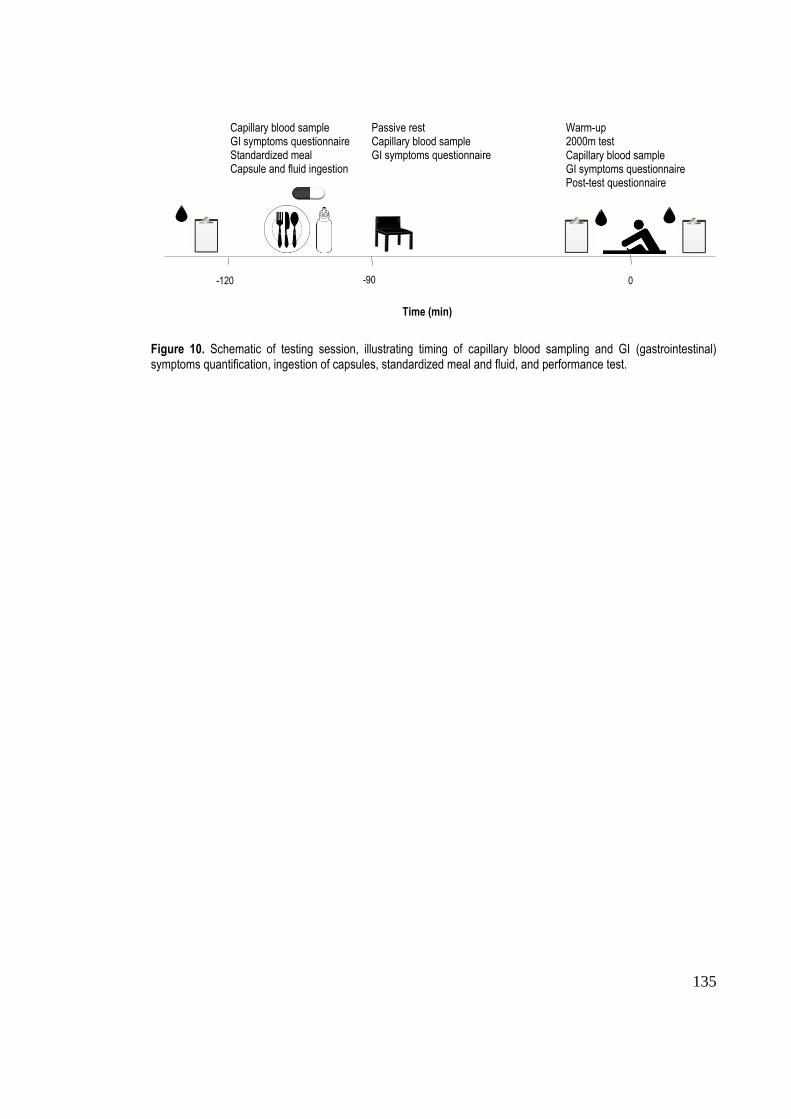
135
Figure 10. Schematic of testing session, illustrating timing of capillary blood sampling and GI (gastrointestinal) symptoms quantification, ingestion of capsules, standardized meal and fluid, and performance test.
-120 -90 0
Capillary blood sample GI symptoms questionnaire Standardized meal Capsule and fluid ingestion
Caps
Passive rest Capillary blood sample GI symptoms questionnaire
Caps
Warm-up 2000m test Capillary blood sample GI symptoms questionnaire Post-test questionnaire
Time (min)
136
Capillary blood sampling and analysis
Capillary blood samples were collected 120 min prior to the performance test (i.e.
immediately prior to administration of the pre-test capsule dose), prior to the warm-up
and 2 min after completion of the performance test. Prior to capillary blood sampling,
participants immersed one hand in warm water (~45oC) for ~1 min to increase blood
flow to the area. The hand was then dried and one finger was pierced with a sterile 2.0
mm retractable lancet (Medlance, Ozorkow, Poland). The first drop of blood was
removed and then 100 L blood was collected in a glass capillary tube (Radiometer,
Copenhagen, Denmark). Blood samples were immediately analyzed for bicarbonate
concentration using a portable blood-gas analyser (iSTAT, Abbott, Illinois, USA).
Blood lactate concentration was determined via analysis of an additional 20 µL sample
(Lactate Pro, Arkray, Kyoto, Japan) collected at the pre-warm up and post-test time
points.
Gastrointestinal symptoms
Participants completed a validated questionnaire14
at the same time as each blood
sample was taken (120 min prior to the performance test, immediately prior to the
warm-up and 2 min after the completion of the performance test) to quantify symptoms
experienced at that time point. There were 17 items describing possible side effects
associated with sodium bicarbonate ingestion, including nausea, bloating and stomach
pain, and a 10-point Likert scale, ranging from 1 = „no problem at all‟ to 10 = „the worst
it has ever been‟ to indicate the severity of each symptom.
137
Statistical analysis
A power analysis was performed to determine the sample size necessary for a crossover
investigation for adequate precision with 90% confidence limits based on the smallest
worthwhile change in performance (0.5%),15, 16
which indicated that 7 subjects would be
required. Similar investigations7, 8
have used 5-6 subjects. Data were log-transformed to
minimise heteroscedasticity.
Effect of interventions
Mean values for the first and second trials in each condition were calculated for blood
bicarbonate and blood lactate concentration at the pre-ingestion, pre-test and post-test
time points, performance (mean power and stroke rate), RPE and
GI symptoms, and were entered into a spreadsheet:
http://www.sportsci.org/resource/stats/xPostOnlyCrossover.xls. Pair wise comparisons
were made between conditions to determine the probability of differences greater than
the smallest worthwhile change for each variable. The smallest worthwhile change
threshold was set at 0.2 of the between group standard deviation for the placebo trial17
for all measures except performance, which was set at 0.5%.15, 16
The likelihoods were
set as; <1% - almost certainly not, <5% - very unlikely, <25% - unlikely, probably not,
25-75% - possibly, possibly not, >75% - likely, probably, >95% - very likely, >99% -
almost certainly. A probability of >75% was interpreted as a substantial difference.
Results were deemed unclear if the likelihoods of small positive and negative effects
were both <75%.
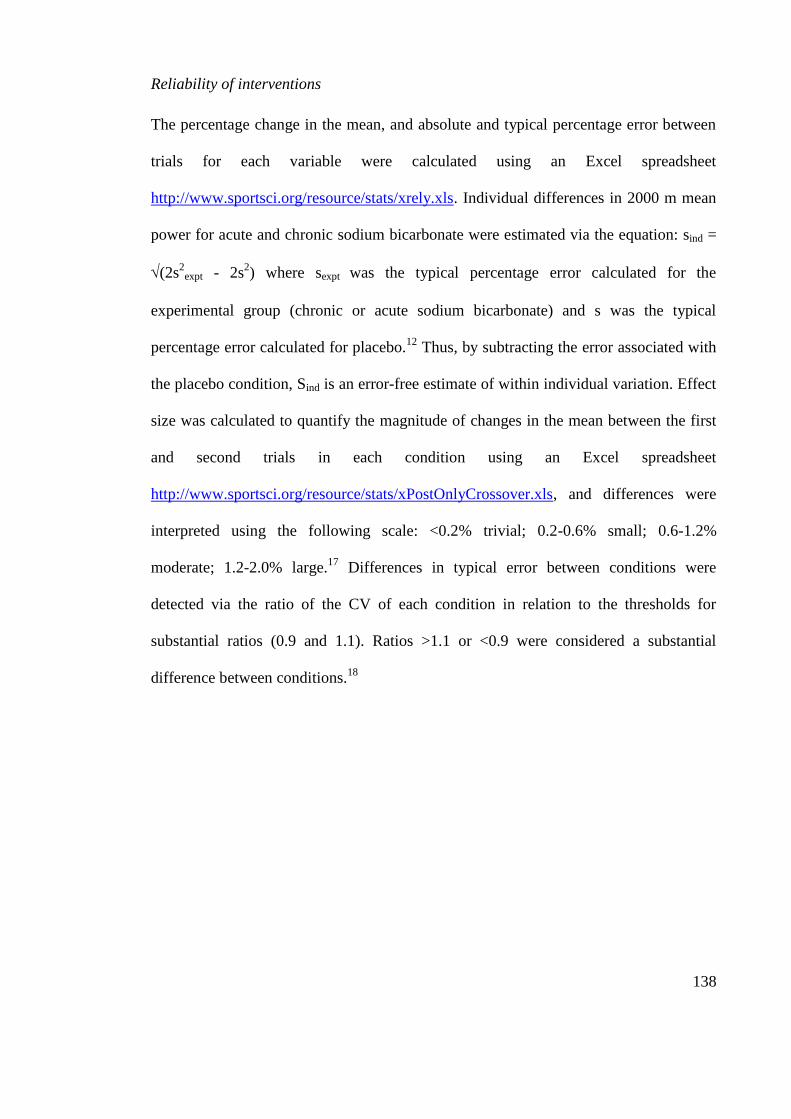
138
Reliability of interventions
The percentage change in the mean, and absolute and typical percentage error between
trials for each variable were calculated using an Excel spreadsheet
http://www.sportsci.org/resource/stats/xrely.xls. Individual differences in 2000 m mean
power for acute and chronic sodium bicarbonate were estimated via the equation: sind =
(2s2
expt - 2s2) where sexpt was the typical percentage error calculated for the
experimental group (chronic or acute sodium bicarbonate) and s was the typical
percentage error calculated for placebo.12
Thus, by subtracting the error associated with
the placebo condition, Sind is an error-free estimate of within individual variation. Effect
size was calculated to quantify the magnitude of changes in the mean between the first
and second trials in each condition using an Excel spreadsheet
http://www.sportsci.org/resource/stats/xPostOnlyCrossover.xls, and differences were
interpreted using the following scale: <0.2% trivial; 0.2-0.6% small; 0.6-1.2%
moderate; 1.2-2.0% large.17
Differences in typical error between conditions were
detected via the ratio of the CV of each condition in relation to the thresholds for
substantial ratios (0.9 and 1.1). Ratios >1.1 or <0.9 were considered a substantial
difference between conditions.18
139
Results
Effect of interventions
The results of performance tests are summarized in Table 5. There were no substantial
differences between conditions in either 2000 m mean power (Figure 11), stroke rate or
perceived exertion. The highest pre-warm-up [HCO3-] was observed after acute
bicarbonate loading and was substantially higher than that observed in placebo and
chronic bicarbonate trials. Mean post-test [HCO3-] was also substantially higher with
acute bicarbonate than with both placebo and chronic bicarbonate (Figure 12). Mean
post-test [La-] after acute loading was 2.1 mmol.L
-1 higher than in the placebo trials and
1.7 mmol.L-1
higher than with chronic bicarbonate supplementation, both of which were
substantial differences. There were no clear differences in the incidence of GI
symptoms between conditions at the pre-ingestion and pre-warm-up time points, but
post-exercise, the incidence with acute bicarbonate was substantially lower than with
chronic loading (Table 5).
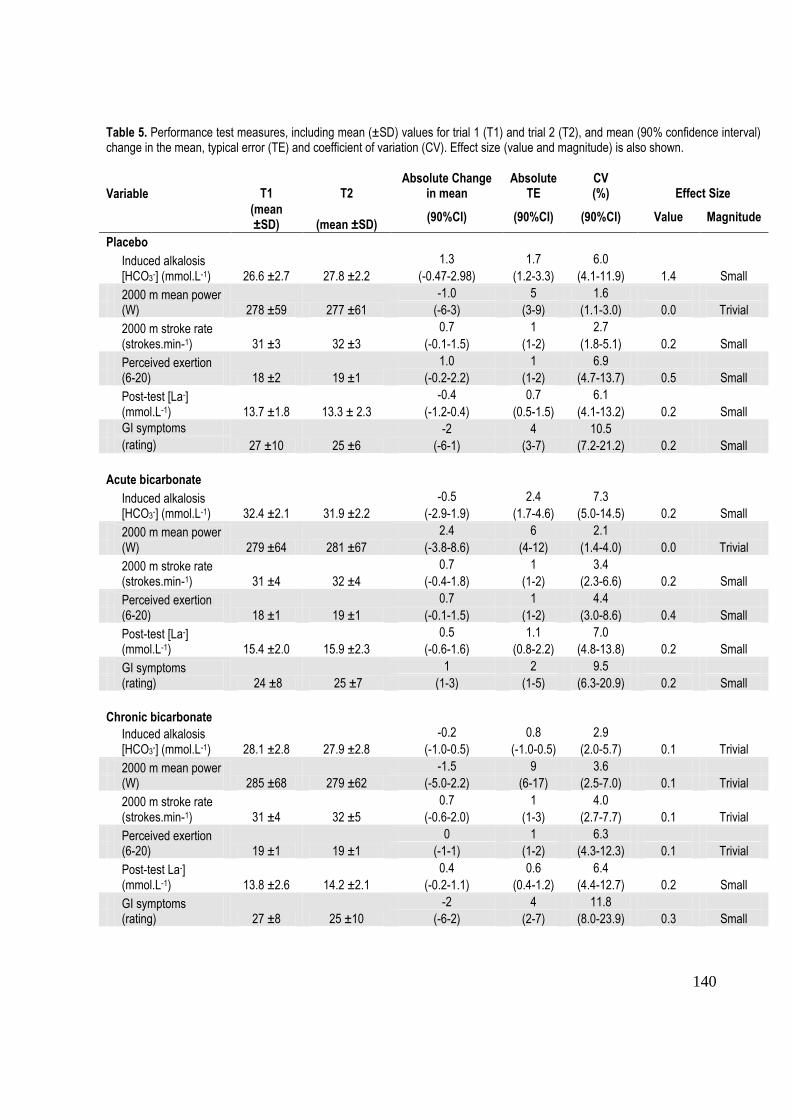
140
Table 5. Performance test measures, including mean (±SD) values for trial 1 (T1) and trial 2 (T2), and mean (90% confidence interval) change in the mean, typical error (TE) and coefficient of variation (CV). Effect size (value and magnitude) is also shown.
Variable T1 T2 Absolute Change
in mean
Absolute
TE CV (%) Effect Size
(mean ±SD) (mean ±SD)
(90%CI) (90%CI) (90%CI) Value Magnitude
Placebo
Induced alkalosis [HCO3-] (mmol.L-1) 26.6 ±2.7 27.8 ±2.2
1.3 1.7 6.0
(-0.47-2.98) (1.2-3.3) (4.1-11.9) 1.4 Small
2000 m mean power (W) 278 ±59 277 ±61
-1.0 5 1.6
(-6-3) (3-9) (1.1-3.0) 0.0 Trivial
2000 m stroke rate (strokes.min-1) 31 ±3 32 ±3
0.7 1 2.7
(-0.1-1.5) (1-2) (1.8-5.1) 0.2 Small
Perceived exertion (6-20) 18 ±2 19 ±1
1.0 1 6.9
(-0.2-2.2) (1-2) (4.7-13.7) 0.5 Small
Post-test [La-] (mmol.L-1) 13.7 ±1.8 13.3 ± 2.3
-0.4 0.7 6.1
(-1.2-0.4) (0.5-1.5) (4.1-13.2) 0.2 Small
GI symptoms
27 ±10 25 ±6
-2 4 10.5
(rating) (-6-1) (3-7) (7.2-21.2) 0.2 Small
Acute bicarbonate
Induced alkalosis [HCO3-] (mmol.L-1) 32.4 ±2.1 31.9 ±2.2
-0.5 2.4 7.3
(-2.9-1.9) (1.7-4.6) (5.0-14.5) 0.2 Small
2000 m mean power (W) 279 ±64 281 ±67
2.4 6 2.1
(-3.8-8.6) (4-12) (1.4-4.0) 0.0 Trivial
2000 m stroke rate (strokes.min-1) 31 ±4 32 ±4
0.7 1 3.4
(-0.4-1.8) (1-2) (2.3-6.6) 0.2 Small
Perceived exertion (6-20) 18 ±1 19 ±1
0.7 1 4.4
(-0.1-1.5) (1-2) (3.0-8.6) 0.4 Small
Post-test [La-] (mmol.L-1) 15.4 ±2.0 15.9 ±2.3
0.5 1.1 7.0
(-0.6-1.6) (0.8-2.2) (4.8-13.8) 0.2 Small
GI symptoms (rating) 24 ±8 25 ±7
1 2 9.5
(1-3) (1-5) (6.3-20.9) 0.2 Small
Chronic bicarbonate Induced alkalosis
[HCO3-] (mmol.L-1) 28.1 ±2.8 27.9 ±2.8
-0.2 0.8 2.9
(-1.0-0.5) (-1.0-0.5) (2.0-5.7) 0.1 Trivial
2000 m mean power (W) 285 ±68 279 ±62
-1.5 9 3.6
(-5.0-2.2) (6-17) (2.5-7.0) 0.1 Trivial
2000 m stroke rate (strokes.min-1) 31 ±4 32 ±5
0.7 1 4.0
(-0.6-2.0) (1-3) (2.7-7.7) 0.1 Trivial
Perceived exertion (6-20) 19 ±1 19 ±1
0 1 6.3
(-1-1) (1-2) (4.3-12.3) 0.1 Trivial
Post-test La-] (mmol.L-1) 13.8 ±2.6 14.2 ±2.1
0.4 0.6 6.4
(-0.2-1.1) (0.4-1.2) (4.4-12.7) 0.2 Small
GI symptoms (rating) 27 ±8 25 ±10
-2 4 11.8
(-6-2) (2-7) (8.0-23.9) 0.3 Small
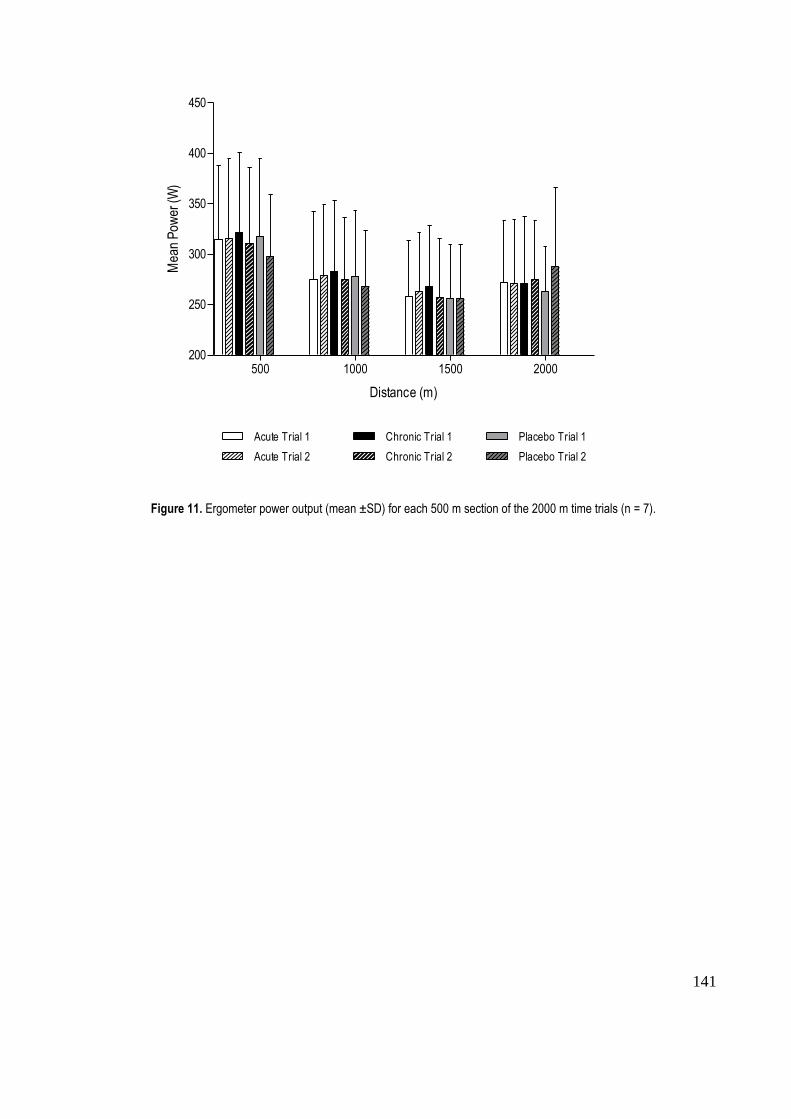
141
500 1000 1500 2000200
250
300
350
400
450
Acute Trial 1
Acute Trial 2
Chronic Trial 1
Chronic Trial 2
Placebo Trial 1
Placebo Trial 2
Distance (m)
Mea
n P
ower
(W)
Figure 11. Ergometer power output (mean ±SD) for each 500 m section of the 2000 m time trials (n = 7).
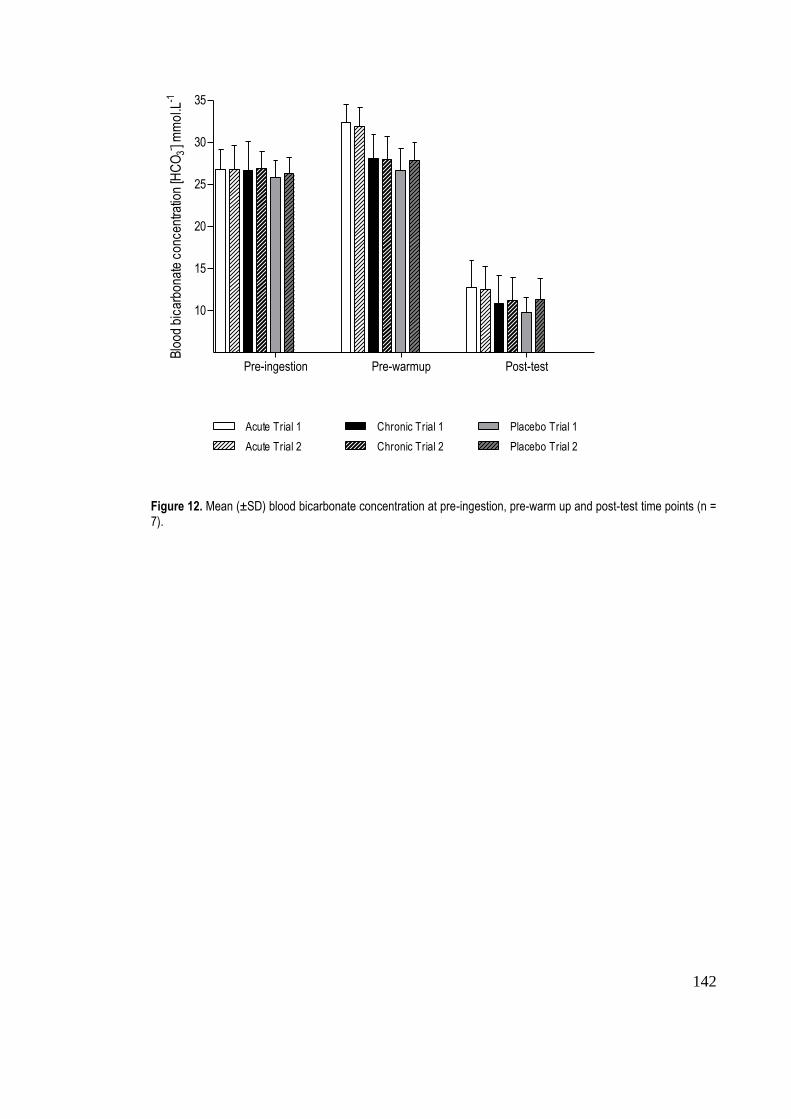
142
Pre-ingestion Pre-warmup Post-test
10
15
20
25
30
35
Acute Trial 1
Acute Trial 2
Chronic Trial 1
Chronic Trial 2
Placebo Trial 1
Placebo Trial 2
Blo
od b
icar
bona
te c
once
ntra
tion
[HC
O3- ] m
mo
l.L-1
Figure 12. Mean (±SD) blood bicarbonate concentration at pre-ingestion, pre-warm up and post-test time points (n = 7).
143
Reliability of interventions
The reliability of interventions for each measure is summarized in Table 5. Typical error
in [HCO3-] was substantially greater with acute bicarbonate compared with chronic
bicarbonate (ratio of CVs = 0.40) and placebo (ratio of CVs = 0.82). The effect size for
changes between trials for each condition was between 0.1 and 0.4 which were, at most,
small effects.
In the performance measures, typical error with chronic supplementation was greater
than that with acute supplementation (ratio of CVs of 0.58 and 0.85 for power and
stroke rate, respectively), and the error with both bicarbonate conditions was greater
than that for placebo. Individual differences in mean power were estimated to be 1.9%
for acute bicarbonate and 4.6% for chronic bicarbonate.
Typical error in post-test [La-] was substantially greater than placebo with acute
bicarbonate ingestion. There were small increases in the mean values between the first
and second trials with chronic and acute conditions, and small decreases with placebo.
The typical error of RPE was substantially lower with the acute loading protocol
compared with chronic and placebo trials (ratio of CVs of 0.70 and 0.64, respectively),
whereas the typical error of GI symptoms with chronic loading was substantially greater
than that for acute and placebo conditions (ratio of CVs of 1.24 and 1.11). There were
small increases in the mean RPE between the first and second trials for acute sodium
bicarbonate and placebo. There were small increases in the mean incidence of GI
symptoms between the first and second trials for acute supplementation, but small
decreases for the chronic and placebo conditions.
144
Discussion
This is the first systematic assessment of the effect and reliability of induced blood
alkalosis on subsequent 2000 m ergometer rowing performance using two sodium
bicarbonate ingestion protocols. A novel finding was that the reliability of mean power
output in 2000 m rowing ergometer efforts was ~3% with both acute and chronic
bicarbonate ingestion. We also found that post-supplementation blood [HCO3-] is
associated with typical error of ~3% for chronic bicarbonate loading and ~7% for acute
loading. However, overall, neither the chronic nor acute bicarbonate loading enhanced
performance.
We were surprised that neither of the bicarbonate loading protocols enhanced rowing
ergometer performance, despite the achievement of a substantial alkalosis with the acute
bicarbonate protocol. Systematic evaluations of the literature suggest there should be at
least some association between enhanced buffering potential and performance.2 Indeed,
a previous investigation of rowing ergometer performance after acute bicarbonate
loading reported positive effects.7 Although this conflicts with the results of the current
investigation, the findings of a recent meta-analysis conducted in our laboratory19
provide a potential explanation for the discrepancy. Specifically, the effect of
bicarbonate supplementation on performance in highly trained athletes is 1.7% (90%
confidence limits ±2.0%) which is 1.1% (±1.1%) greater than that seen in lower level
participants. Our participants were club-level athletes, and therefore of a lower calibre
than the National rowing team members recruited for the previous study.7 In our
investigation, post-exercise [HCO3-] was substantially higher than other conditions with
acute bicarbonate, but the fact that RPE values with this treatment were not substantially
different to the other conditions suggests that athletes of a lower calibre may not be able
145
to make use of additional blood buffering capacity and enhance their performance.
Furthermore, the recent meta-analysis19
specifies that performance outcomes can be
diminished with increased exercise durations. The previous investigation used a 6-min
test to simulate a 2000 m on-water race, whereas we replicated racing conditions by
simulating the same distance on the ergometer, and most participants completed the test
in over 7 min. Moreover, another study8 similar to the current investigation, has
reported no improvement in rowing performance with bicarbonate ingestion, which
together with the results of the recent meta-analysis suggests that findings of the current
investigation are not inconsistent with previous literature. The comparatively large body
of research pertaining to reliability of performance and physiological responses,
however, makes further discussion of our results more relevant to the reliability of
responses with bicarbonate supplementation.
The typical error values that we reported for mean power in 2000 m rowing efforts
(~3% for bicarbonate loading and 1.6% for placebo) are consistent with the only
previous investigation of the reliability of 2000 m rowing ergometer performance, in
which a typical error in mean power of 2.0% (95% confidence interval 1.3% to 3.1%)
was reported.20
Our typical error values for this rowing ergometer test also compare
favourably with that in most time trials, including cycle ergometer, treadmill and track
running tests, where the typical error expressed as a CV is ~1-5%.21
Our typical error
results are also consistent with those of studies that have examined the reliability of
mean power in tests of maximal rowing ergometer performance, which have been of
shorter duration and higher intensity, but have used the same type of ergometer
(Concept II) as in the current investigation. In a 90 s rowing test, a similar CV to the
current investigation was reported (3.1%).22
Collectively, the current study and relevant
146
literature suggest that the reliability of rowers‟ ergometer performance is not
compromised by prior ingestion of sodium bicarbonate.
An interesting finding of this investigation was the relatively poor reliability of induced
blood alkalosis after acute bicarbonate ingestion in comparison with that of
performance. Reproducibility of [HCO3-] values after buffer ingestion has not
previously been investigated, however the technical error of the iSTAT analyser (used
in this investigation to measure [HCO3-]), has been reported to be relatively low
(~2.5%).23
Intra-individual variation with repeated trials increases when there is a large
biological error component, which can be due to changes in an athlete‟s physical state.12
A potential source of biological error in the current investigation was participants‟
experience of gastrointestinal symptoms. The relatively high within-subject variability
of gastrointestinal symptoms suggests that athletes should be aware that the severity of
potential symptoms can vary when they use sodium bicarbonate on different occasions.
Furthermore, even when athletes are familiarised to bicarbonate supplementation via
trials conducted in training, there still exists the possibility that gastrointestinal distress
can manifest in a competition setting. Sport scientists should also be aware of the
implications of the relatively high variability inherent in repeated acute sodium
bicarbonate loading. The typical error associated with [HCO3-] after acute bicarbonate
loading was 2.4 mmol.L-1
, meaning that for an observed blood [HCO3-] of 30 mmol.L
-1,
the 95% confidence interval will be 25.3 to 34.7 mmol.L-1
. The practical importance of
this finding is that a sport scientist would need to find a large change in [HCO3-]
measurements following a specific acute bicarbonate loading protocol before it could be
ascertained that this was more effective than another protocol.
147
Blood lactate concentration [La-] measured after performance test completion in the
sodium bicarbonate conditions elicited typical errors of ~7%. The relatively high
variability of [La-] after high-intensity exercise in comparison with other experimental
variables, such as power output, is an observation consistent with previous research.24
It
should be acknowledged that the typical error associated with post-test blood lactate
measurements is partly due to the technical error of the blood lactate analyser used.
Reliability of the Lactate Pro analyser, which was used in the current investigation, has
recently been reported to be ~4% for [La-] recorded after maximal exercise.
25 The
overall large uncertainty of any measure of blood lactate is rarely mentioned when it
comes to interpretation of shifts in blood lactate curves, but should be taken into
account for complete clarity.26
Practical applications of reliability testing
The estimation of individual differences and typical error values in 2000 m mean
rowing power can aid in the interpretation of mean group results and individual
performance observations. The mean difference in performance between acute
bicarbonate and placebo was 0.9% and individual differences from mean responses
were estimated to be 1.9%. Comparing these two results suggests that some individuals
would produce more power with acute bicarbonate compared with placebo, most would
show little or no change and some would produce less power. The individual differences
estimate can also be used to devise confidence limits for observed performances of an
individual athlete, giving coaches an indication of the range of the true value and a
yardstick against which to judge whether observed differences in performance are real.
For example, an observed 2000 m effort for a particular athlete can be assumed to lie
within a range that is ±1.9% of the observed value at a 68% level of confidence, and
148
±3.7% at a 95% level of confidence.27
Such examples provide a basis for the calculation
of confidence limits using estimates of individual differences, but more precise
estimates are required, which can be obtained via reliability studies that have larger
sample sizes.17
Sample size (n) can be estimated via the equation: n = 8s2/d
2, where s is the typical error
and d is the smallest worthwhile change in performance.12
The smallest worthwhile
change is approximately 0.5 of the typical error,12
which for acute bicarbonate in the
current investigation was 1.1% (0.5 x 2.1%). Therefore, the recommended sample size
is 8(2.1)2/(1.05)
2 = 32 subjects. Given that subject numbers need to be quadrupled from
that required for a simple study to estimate individual differences,17
the required sample
size is greater than could be realistically used by most researchers (32 x 4 = 128);
nevertheless these calculations provide directions for future reliability studies that can
provide more precise estimates of individual differences.
A limitation of this study was that the first and second trials in the chronic loading
condition were performed under slightly different conditions (1 day of loading for the
first trial and 3 days for the second trial). However, the CV for induced alkalosis after
chronic loading was substantially lower than that for acute loading, therefore it seems
that the different conditions did not have an adverse effect on the reliability of induced
alkalosis. Furthermore, we scheduled the repeated trials 48 h apart to replicate the
repeated racing efforts that rowers perform at a regatta.9, 10
While we have demonstrated
that ergometer sessions timed similarly to regatta races can be highly reproducible, it is
difficult to transfer the findings to on-water racing due to the influence of variables such
as environmental conditions.12
Future studies should investigate the reliability of on-
149
water efforts after sodium bicarbonate ingestion, which would have greater construct
validity.
The heterogeneity of our subject population was increased by the inclusion of male and
female participants, which should be considered when applying findings of this
investigation to different athlete populations. Our participants were experienced rowers
who were skilled with 2000 m ergometer performance tests, but females can be less
reliable in repeated performance efforts than males, which is partially due to the
influence of the menstrual cycle.21
Potentially, a group of highly-trained, male rowers
would be more able to produce consistent performances, and therefore the typical
variation and individual differences from performances would be expected to be lower.
This should be acknowledged when providing feedback to elite rowers about observed
changes in 2000 m ergometer power.
Conclusion
Overall, in the current investigation, while there were no substantial performance
enhancements observed with either chronic or acute bicarbonate ingestion, we
recommend that rowing ergometer performance after bicarbonate loading will elicit
consistent results in athletes. Potentially, the presence or absence of performance
enhancement with bicarbonate loading is influenced by the level of athlete and duration
of exercise performed. Athletes should understand that, due to the high reliability of
rowing ergometer performance with bicarbonate loading, the nature and magnitude of
the performance response (either enhancement or detriment) is likely to be repeated
with subsequent trials.
150
References
1. Dennig H, Talbott JH, Edwards HT, Dill DB. Effects of acidosis and alkalosis
upon capacity for work. J Clin Invest. 1931;9:601-613.
2. Matson LG, Tran ZV. Effects of sodium bicarbonate ingestion on anaerobic
performance: a meta-analytic review. Int J Sport Nutr. 1993;3:2-28.
3. McNaughton L. Bicarbonate ingestion: effects of dosage on 60 s cycle
ergometry. J Sports Sci. 1992;10:415-423.
4. Tiryaki GR, Atterbom HA. The effects of sodium bicarbonate and sodium citrate
on 600 m running time of trained females. J Sports Med Phys Fit. 1995;35:194-
198.
5. Burke LM, Pyne DB. Bicarbonate loading to enhance training and competitive
performance. Int J Sports Physiol Perform. 2007;2:93-97.
6. McNaughton L, Thompson D. Acute versus chronic sodium bicarbonate
ingestion and anaerobic work and power output. J Sports Med Phys Fit.
2001;41:456-462.
7. McNaughton L, Cedaro R. The effect of sodium bicarbonate on rowing
ergometer performance in elite rowers. Aust J Sci Med Sport. 1991;23:66-69.
8. Brien DM, McKenzie DC. The effect of induced alkalosis and acidosis on
plasma lactate and work output in elite oarsmen. Eur J Appl Physiol.
1989;58:797-802.
151
9. Slater GJ, Rice AJ, Sharpe K, Jenkins D, Hahn AG. Influence of nutrient intake
after weigh-in on lightweight rowing performance. Med Sci Sports Exerc.
2007;39:184-191.
10. Slater GJ, Rice AJ, Tanner RK, Sharpe K, Jenkins D, Hahn A. Impact of two
different body mass management strategies on repeat rowing performance. Med
Sci Sports Exerc. 2006;38:138-146.
11. Borg G. Perceived exertion as an indicator of somatic stress. Scand J Rehabil
Med. 1970;2:92-98.
12. Hopkins WG. Measures of reliability in sports medicine and science. Sports
Med. 2000;30:1-15.
13. Carr AJ, Slater GJ, Gore CJ, Dawson B, Burke L. Effect of sodium bicarbonate
ingestion protocol on [HCO3-], pH and gastrointestinal symptoms. Int J Sport
Nutr Exerc Metab. 2011;In Press.
14. Jeukendrup AE, Vet-Joop K, Sturk A, Stegen JHJC, Senden J, Saris WHM,
Wagenmakers JM. Relationship between gastro-intestinal complaints and
endotoxaemia, cytokine release and the acute-phase reaction during and after a
long-distance triathlon in highly trained men. Clin Sci. 2000;98:47-55.
15. Hopkins WG, Hawley JA, Burke LM. Design and analysis of research on sport
performance enhancement. Med Sci Sports Exerc. 1999;31:472-485.
16. Hopkins WG, Hewson DJ. Variability of competitive performance of distance
runners. Med Sci Sports Exerc. 2001;33:1588-1592.
152
17. Hopkins, WG, Marshall SW, Batterham AM, Hanin J. Progressive statistics for
studies in sports medicine and exercise science. Med Sci Sports Exerc.
2009;41:3-12.
18. Gore CJ, Hopkins WG, Burge CM. Errors of blood volume parameters: a meta-
analysis. J Appl Physiol. 2005;99:1745-1758.
19. Carr AJ, Hopkins WG, Gore CJ. Effects of acute alkalosis and acidosis on
performance: a meta-analysis. Sports Med. Under Review.
20. Schabort EJ, Hawley JA, Hopkins WG, Blum H. High reliability of performance
of well-trained rowers on a rowing ergometer. J Sports Sci. 1999;17:627-632.
21. Hopkins WG, Schabort EJ, Hawley JA. Reliability of power in physical
performance tests. Sports Med. 2001;31:211-234.
22. Macfarlane DJ, Edmond IM, Walmsley A. Instrumentation of an ergometer to
monitor the reliabilty of rowing performance. J Sports Sci. 1997;15:167-173.
23. Dascombe BJ, Reaburn PRJ, Sirotic AC, Coutts AJ. The reliability of the i-
STAT clinical portable analyser. J Sci Med Sport. 2007;10:135-140.
24. Vogler AJ, Rice AJ, Gore CJ. Physiological responses to ergometer and on-
water instrumental rowing tests. Int J Sports Physiol Perform. 2010;5:342-358.
25. Tanner RK, Fuller KL, Ross MLR. Evaluation of three portable blood lactate
analysers: Lactate Pro, Lactate Scout and Lactate Plus. Eur J Appl Physiol.
2010;109:551-559.
153
26. Bentley DJ, Newell J, Bishop D. Incremental exercise test design and analysis:
implications for performance diagnostics in endurance athletes. Sports Med.
2007;37:575-586.
27. Atkinson G, Nevill AM. Statistical methods for assessing measurement error
(reliability) in variables relevant to sports medicine. Sports Med. 1998;26:217-
238.
154
CHAPTER SIX
Thesis Summary and Future Directions
155
6.1 Thesis summary
The effect of sodium bicarbonate and agents that modify blood pH on human
performance has been investigated since the 1930s, and it is widely accepted that
bicarbonate ingestion can induce blood alkalosis and improve high-intensity exercise
performance. However, the magnitude of performance effects with sodium bicarbonate
and other buffering agents, and the associated changes in physiological variables have
not been adequately reviewed. Furthermore, experimental research has not
systematically investigated the effect of variations in the ingestion protocol (e.g.
different co-ingested fluid volumes, the use of capsules or solutions, combining
bicarbonate with sodium citrate) on the magnitude of induced blood alkalosis, which
could have implications for subsequent performance. Effects of bicarbonate combined
with caffeine on short-term endurance performance have not been evaluated, but many
athletes ingest both supplements prior to important races. Moreover, the reliability of
induced alkalosis and subsequent performance has not been addressed, but is an
important consideration when evaluating experimental results. To address existing
shortcomings in the literature, a systematic review was conducted to quantify previous
research findings, and then three experimental studies to further investigate ergogenic
and physiological effects.
Study one presented a meta-analysis of effects of sodium bicarbonate, sodium citrate
and ammonium chloride on performance and physiological variables. The most notable
finding was that acute pre-exercise sodium bicarbonate ingestion can enhance
performance (expressed as mean power) by ~2%. Interestingly, performance outcomes
for sodium citrate showed an unclear effect, but the large correlation between time from
ingestion and blood [HCO3-] suggests that substantial alkalosis can be induced,
156
provided that the time between ingestion and exercise is >3 h. Study one findings
provided an indication of performance and physiological effects that theoretically could
be expected in the subsequent experimental studies.
Study two was the first experimental intervention, in which the effects of 6 mg.kg-1
BM
caffeine, 0.3 g.kg-1
BM sodium bicarbonate and their combination on 2000 m rowing
performance and induced alkalosis were investigated. There was a substantial
performance enhancement with caffeine supplementation and substantial increases in
[HCO3-] with sodium bicarbonate ingestion. However, there were no substantial
performance effects with sodium bicarbonate in isolation or when combined with
caffeine. It was concluded that high incidences of the gastrointestinal symptoms that can
be associated with bicarbonate may prevent performance enhancement despite an
enhanced buffering potential.
Study three examined the effect of different sodium bicarbonate ingestion protocols on
blood alkalosis [HCO3-], pH and gastrointestinal symptoms. One aim of this study was
to devise an ingestion protocol that would optimise blood alkalosis while minimising
gastrointestinal symptoms, as the results of study two suggested that a high incidence of
gastrointestinal symptoms can potentially compromise any ergogenic effects. Eight
ingestion protocols were devised, six via manipulations of the time period for
supplement ingestion (30 or 60 min), co-ingested fluid volume (7 or 14 mL.kg-1
BM)
and supplement form (solution or capsules), and two additional trials; one protocol that
combined sodium bicarbonate with sodium citrate, and another where a small
carbohydrate-rich meal was co-ingested with bicarbonate. Overall, the ingestion period,
fluid volume and supplement form had only trivial effects on the outcome measures.
However, the peak blood pH (7.49) and [HCO3-] (30.9 mmol.L
-1), and the lowest
157
incidence of side effects were observed at 120 and 150 min after supplementation, when
sodium bicarbonate was coingested with 1.5g.kg-1
carbohydrate. It was concluded that
sodium bicarbonate should be ingested 120-150 min prior to exercise with a small pre-
exercise meal to induce substantial blood alkalosis and reduce gastrointestinal
symptoms.
The aim of study four was to explore the effect and reliability of performance and
induced alkalosis with bicarbonate supplementation. Sodium bicarbonate was co-
ingested with a pre-exercise meal, consistent with the guidelines devised from the
findings of study three. Induced alkalosis [HCO3-] was measured and paired 2000 m
rowing ergometer trials were performed after acute bicarbonate, chronic bicarbonate
and placebo. Within-subject variation (typical error) for repeated chronic and acute
sodium bicarbonate, and subsequent performance in 2000 m rowing efforts was
expressed as a percentage. There were no substantial differences in performance
between the three conditions, however [HCO3-] was substantially greater after acute
bicarbonate in comparison with chronic bicarbonate or placebo. The typical percentage
error of repeated performances after acute loading was ~2% and after chronic
supplementation, ~4%. In comparison, typical error for [HCO3-] was relatively large, at
~7% for acute loading. It was concluded that performance in 2000 m rowing ergometer
trials is reliable after acute and chronic bicarbonate loading, despite the fact that
performance may not improve substantially, even after induced alkalosis.
Results of the four studies suggest that acute pre-exercise sodium bicarbonate ingestion
has the potential to enhance performance by ~2%, and that such improvements may be
associated with an induced blood alkalosis prior to exercise, and influenced by the
calibre of athlete and type of exercise performed. In some cases, ergogenic effects may
158
not eventuate and a possible cause is a high incidence of gastrointestinal symptoms,
therefore an ingestion protocol that minimises side effects while optimising buffering
potential should be used. Such optimal conditions are most likely when 0.3 g.kg-1
BM
sodium bicarbonate capsules are taken 120-150 min prior to exercise with a small, high
carbohydrate meal. Furthermore, athletes can expect consistent results in repeated
performances with both chronic and acute sodium bicarbonate supplementation.
The studies included in this thesis make specific additions to sodium
bicarbonate/caffeine and exercise performance research. The importance of quantifying
gastrointestinal symptoms (as emphasised in study two) indicates an important inclusion
for future research. Similarly, researchers should also implement a standardized
ingestion protocol that includes co-ingestion with a small meal as evidenced by the
findings of study three. Experimental results may be evaluated in light of the
performance effect magnitudes estimated in study one, and interpreted with greater
precision via comparison with typical error values and individual differences in sodium
bicarbonate responses estimated in study four. Therefore, this work can contribute
usefully to the experimental design of future sodium bicarbonate investigations and the
interpretation of performance outcomes.
159
6.2 Practical Applications
Outcomes of the current research provide guidelines for athletes and coaches that may
be incorporated into training programs and competition preparation.
Male athletes competing in high-intensity races may experience performance
enhancements of up to 2% with a standard 0.3 g.kg-1
BM pre-exercise dose of
sodium bicarbonate.
Acute doses of sodium bicarbonate should be taken 120 to 150 min prior to
exercise (training or competition) to minimise gastrointestinal symptoms and
induce substantial blood alkalosis, therefore increasing the potential for
performance enhancement.
Ingesting the standard dose of 0.3 g.kg-1
BM sodium bicarbonate as capsules or a
solution will elicit a similar blood alkalosis. A similar situation applies with the
volume of water ingested with the supplement; athletes can ingest small or large
volumes according to their preference without detriment to their physiological
state or performance.
A small meal high in carbohydrates, e.g. cereal bars or toasted bread, should be
consumed at the same time as the sodium bicarbonate dose, providing that the
athlete can tolerate a pre-event meal without adverse gastrointestinal symptoms.
Athletes should be aware that a sodium bicarbonate ingestion protocol should
incorporate a standard 0.3 g.kg-1
BM dose, ingested over 30-60 min, co-ingested
with a small meal where practical, as failure to do so could result in severe
gastrointestinal side effects which could be deleterious to performance.
160
If sodium bicarbonate is taken prior to consecutive training sessions, athletes can
be confident that with full effort the consistency of their ergometer-based
sessions will be reproducible.
Individual differences in the performance effects of sodium bicarbonate could
result in individual athlete effects being substantially smaller or larger in
magnitude than the mean treatment response for a group of athletes.
161
6.3 Future Research Directions
Several areas for future research have been elucidated via investigation of the topics
included in this thesis.
The time course of blood [HCO3-] and pH for at least three hours after sodium
citrate ingestion requires further investigation. There is a lack of studies where
citrate ingestion has preceded exercise testing by >90 min and study one results
suggest more time between ingestion and exercise performance could be
required for performance benefits. The timing of peak alkalosis after sodium
citrate ingestion would indicate the optimal time period for pre-exercise
ingestion, and subsequent investigations would need to evaluate exercise
performance commencing at that time point.
Performance-based sodium bicarbonate and sodium citrate investigations should
include detailed quantification of gastrointestinal symptoms, which is lacking in
the majority of the existing literature. Quantifying the incidence of side effects is
important because even when substantial performance improvements are
observed in a research investigation, side effects are likely to still exist and may
interfere with an athlete‟s competitive performance in races.
The reliability of repeated performances after sodium bicarbonate ingestion
requires further investigation. It would be advantageous to perform similar
investigations with other types of laboratory-based tests (e.g. cycle ergometer
and treadmill-based tests) to aid in the interpretation of test results. Furthermore,
tests that have greater external validity (e.g. on-water rowing time trials) would
be more applicable to competition performance.
162
Exploration of individual differences in performance effects with sodium
bicarbonate and other buffering substances is required. Study four provides a
basis for understanding the magnitude of individual differences, but similar
studies with larger sample sizes and heterogeneous subject groups are required
for more precise calculations. Estimates of individual differences can identify
the extent to which athletes‟ performances can differ from mean responses.
Moreover, coaches and sport scientists may be able to identify athlete
characteristics that predict the likely individual differences in performance.

163
APPENDICES
164
Appendix A
Participant Information Sheets and Informed Consent
Participant Information Sheet – Study Two
Informed Consent Form – Study Two
Participant Information Sheet – Study Three
Informed Consent Form – Study Three
Participant Information Sheet – Study Four
Informed Consent Form – Study Four
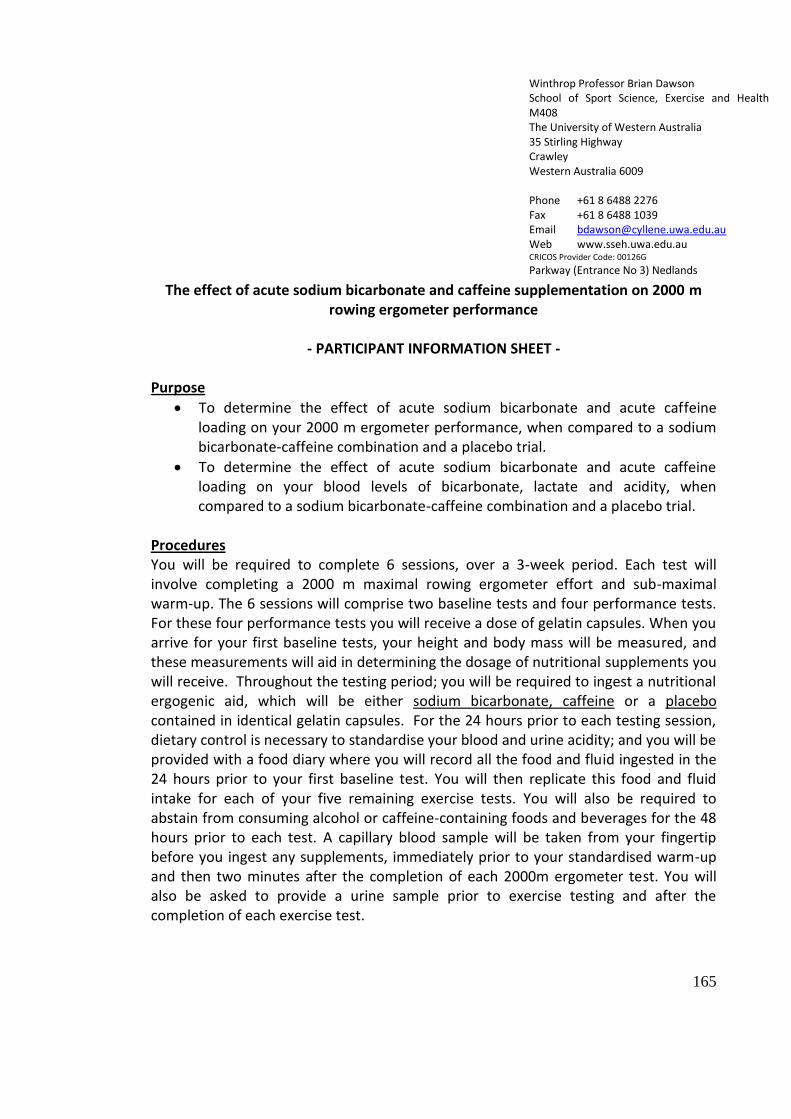
165
The effect of acute sodium bicarbonate and caffeine supplementation on 2000 m rowing ergometer performance
- PARTICIPANT INFORMATION SHEET -
Purpose
To determine the effect of acute sodium bicarbonate and acute caffeine loading on your 2000 m ergometer performance, when compared to a sodium bicarbonate-caffeine combination and a placebo trial.
To determine the effect of acute sodium bicarbonate and acute caffeine loading on your blood levels of bicarbonate, lactate and acidity, when compared to a sodium bicarbonate-caffeine combination and a placebo trial.
Procedures You will be required to complete 6 sessions, over a 3-week period. Each test will involve completing a 2000 m maximal rowing ergometer effort and sub-maximal warm-up. The 6 sessions will comprise two baseline tests and four performance tests. For these four performance tests you will receive a dose of gelatin capsules. When you arrive for your first baseline tests, your height and body mass will be measured, and these measurements will aid in determining the dosage of nutritional supplements you will receive. Throughout the testing period; you will be required to ingest a nutritional ergogenic aid, which will be either sodium bicarbonate, caffeine or a placebo contained in identical gelatin capsules. For the 24 hours prior to each testing session, dietary control is necessary to standardise your blood and urine acidity; and you will be provided with a food diary where you will record all the food and fluid ingested in the 24 hours prior to your first baseline test. You will then replicate this food and fluid intake for each of your five remaining exercise tests. You will also be required to abstain from consuming alcohol or caffeine-containing foods and beverages for the 48 hours prior to each test. A capillary blood sample will be taken from your fingertip before you ingest any supplements, immediately prior to your standardised warm-up and then two minutes after the completion of each 2000m ergometer test. You will also be asked to provide a urine sample prior to exercise testing and after the completion of each exercise test.
Winthrop Professor Brian Dawson School of Sport Science, Exercise and Health M408 The University of Western Australia 35 Stirling Highway Crawley Western Australia 6009 Phone +61 8 6488 2276 Fax +61 8 6488 1039 Email [email protected] Web www.sseh.uwa.edu.au CRICOS Provider Code: 00126G
Parkway (Entrance No 3) Nedlands
166
Measures Performance Measures For each exercise test, 2000m performance time, stroke rate, power output and 500m split time will be recorded. Capillary blood samples Blood acidity, bicarbonate and lactate concentration will be measured. Urine samples Urine pH will be measured. Perceived Exertion Immediately following the 2000m exercise test, a Rating of Perceived Exertion (RPE) will be taken. This is a scale marked 6 to 20 to indicate how hard you felt you were working. Questionnaire After you complete each performance test, you will be asked which treatment you thought you received (caffeine, sodium bicarbonate, caffeine-sodium bicarbonate combination, or placebo), and if you experienced any side-effects. Risks There is a risk that when you take sodium bicarbonate and caffeine, you will temporarily experience gastrointestinal side-effects such as nausea, vomiting and diarrhoea. However, based on previous research this is unlikely to occur for all participants, and you may not experience any adverse side effects at all. There is also a risk that after you complete the 2000 m ergometer efforts, you may experience muscular soreness. However, this will not be different from to what you would experience after maximal training sessions or competition. There is also a small risk of infection and bruising from as a result of blood sampling. The risk will be minimised however by the use of sterile equipment. Benefits You will receive feedback on your performance for each testing session, and after the completion of all testing. Throughout the project, you will also receive access to recovery and nutrition resources and information on nutritional ergogenic aids. Confidentiality
Confidentiality of your identity and data will be maintained. All data will be de-identified, so that no-one can be connected with his/her data, and the safe-keeping of data will be ensured at all times. There will be no video or audio data collected for the purpose of this experiment. Participant Rights Participation in this research is voluntary and you are free to withdraw from the study at any time without prejudice. You can withdraw for any reason and you do not need to justify your decision. If you withdraw from the study and you are an employee or student at the University of Western Australia (UWA) this will not prejudice your status and rights as employee or student of UWA. If you withdraw from the study and are a patient recruited from one of the affiliated clinics your treatment will not be prejudiced or affected in any way.
167
If you do withdraw we may wish to retain the data that we have recorded from you but only if you agree, otherwise your records will be destroyed. Your participation in this study does not prejudice any right to compensation that you may have under statute of common law. If you have any questions concerning the research at any time please feel free to ask the researcher who has contacted you about your concerns. Further information regarding this study may be obtained from Amelia Carr BSc - Exercise and Health Science (Hons1) PhD Candidate School of Sport Science, Exercise and Health University of Western Australia Physiology Australian Institute of Sport PH: (02) 6214 7343 Email: [email protected]; [email protected] COORDINATING SUPERVISOR Winthrop Professor Brian Dawson School of Sport Science, Exercise and Health University of Western Australia PH: (08) 6488 2276 Email: [email protected]
168
The effect of acute sodium bicarbonate and caffeine supplementation on 2000 m
rowing ergometer performance
Informed Consent Form
I, (the participant)___________________________ have read and understand the information provided and any questions I have asked have been answered to my satisfaction. I agree to participate in this activity, realising that I can withdraw at any time without reason and without prejudice.
I understand that all information provided is treated as strictly confidential and will not be released by the investigator unless required to by law. I have been advised as to what data is being collected, what the purpose is, and what will be done with the data upon completion of the research.
I agree that research data gathered for the study may be published provided my name or other identifying information is not used. Questions regarding this study may be directed to the researchers:
Amelia Carr BSc – Exercise and Health Science (Hons1) PhD Candidate School of Sport Science, Exercise and Health University of Western Australia / Physiology Australian Institute of Sport PH: + 61 2 6214 7343 Email: [email protected] [email protected]
COORDINATING SUPERVISOR: Winthrop Professor Brian Dawson School of Sport Science, Exercise and Health University of Western Australia PH: +61 8 6488 2276 Email- [email protected]
_____________________________ ________________________
Signature of participant Date
169
_____________________________ ________________________ Signature of parent / guardian Date _____________________________ ________________________ Signature of investigator Date The Human Research Ethics Committee at the University of Western Australia requires that all participants are informed that, if they have any complaint regarding the manner, in which a research project is conducted, it may be given to the researcher, or alternatively to the Secretary, Committee for Human Rights, Registrar’s Office, University of Western Australia, Crawley WA 6009 (telephone number+61 8 6488-3703). All study participants will be provided with a copy of the Information Sheet and Consent Form for their personal records.
170
Participant Information Sheet
Project Title: The effect of sodium bicarbonate ingestion protocols on blood
pH, [H+], [HCO3
-] and gastrointestinal side effects
The aim of this study is:
To monitor blood pH, HCO3- and gastrointestinal side effects over a three-hour
period, during eight different sodium bicarbonate administration protocols.
To determine an optimal administration protocol for sodium bicarbonate when
taken at a dosage of 0.3mg.kg-1
BM.
What is required?
You will be required to ingest sodium bicarbonate in capsule form. There will be a total
of eight trials; with each you will be required to ingest sodium bicarbonate using
different administration protocols. Each trial will take a total of three hours. This will
involve capillary blood sampling from the earlobe, ingesting sodium bicarbonate and
answering a questionnaire on several occasions. The dosage of sodium bicarbonate will
be 0.3mg per kilogram of your body mass. You will need to abstain from physical
exercise for twelve hours prior to each of your testing sessions. Your food and fluid
intake prior to your testing sessions will be standardised. You will have breakfast
provided in the AIS Nutrition department kitchen.
What will be measured?
Capillary blood samples: Blood pH, bicarbonate and hydrogen ion concentration will be
measured.
Urine samples: Urine pH will be measured.
Questionnaire: At regular intervals during each testing session, you will be asked
specific questions to detail any side effects you experience.
Risks of participating
Some side effects have been associated with the oral ingestion of sodium bicarbonate.
These include gastrointestinal side effects such as nausea, vomiting, stomach pain and
diarrhoea. However, the extent of side effects varies with each individual and you may
not experience any side effects. The oral ingestion of sodium bicarbonate has been
reported to reduce the occurrence of gastrointestinal tract side effects. You may
experience some discomfort as a result of capillary blood sampling; and there is a small
risk of infection from this procedure. However, all equipment used will be sterilised to
minimise this risk.
What you will receive
You will receive feedback on your results for each testing session, and after the
completion of all testing. You will be informed of the findings of this study; and the
implications for sodium bicarbonate supplementation prior to exercise performance.
171
Consent
Your written informed consent is required for your participation in this study. You are
free at any time to withdraw consent to further participation without prejudice in any
way. You need give no reason, nor justification for such a decision, and in such cases,
the record of your participation is to be destroyed, unless otherwise agreed. Your
participation in this study does not prejudice any right to compensation, which you may
have under statute or common law.
Further Questions
For more information, please contact:
Amelia Carr
Department of Physiology
Australian Institute of Sport
Ph (02) 6214 7343
Email – [email protected]

172
‘INFORMED CONSENT’ FORM (Adult)
Project Title: Effect of sodium bicarbonate ingestion protocol on [HCO3-], pH and
gastrointestinal symptoms
Principal Researchers: Amelia Carr, Dr Gary Slater, Prof Chris Gore, Prof Brian
Dawson, Prof Louise Burke
This is to certify that I, hereby agree to participate as a volunteer in a scientific
investigation as an authorised part of the research program of the Australian Sports
Commission under the supervision of Prof Chris Gore.
The investigation and my part in the investigation have been defined and fully explained
to me by Amelia Carr and I understand the explanation. A copy of the procedures of this
investigation and a description of any risks and discomforts has been provided to me
and has been discussed in detail with me.
I have been given an opportunity to ask whatever questions I may have had and all
such questions and inquiries have been answered to my satisfaction.
I understand that I am free to deny any answers to specific items or questions in
interviews or questionnaires.
I understand that I am free to withdraw consent and to discontinue participation in
the project or activity at any time, without disadvantage to myself.
I understand that I am free to withdraw my data from analysis without disadvantage
to myself.
I understand that any data or answers to questions will remain confidential with
regard to my identity.
I certify to the best of my knowledge and belief, I have no physical or mental illness
or weakness that would increase the risk to me of participating in this investigation.
I am participating in this project of my (his/her) own free will and I have not been
coerced in any way to participate.
Signature of Subject: _______________________________ Date: ___/___/___
I, the undersigned, was present when the study was explained to the subject/s in detail
and to the best of my knowledge and belief it was understood.
Signature of Researcher: _____________________________ Date: ___/___/___
173
Project Title: The effect of acute and serial bicarbonate loading on 2 km rowing
ergometer performance
The aims of the study are:
To determine the effect of serial sodium bicarbonate loading on your 2km
ergometer performance as well as your blood levels of bicarbonate, lactate and
acidity, when compared to a placebo trial.
To compare the effect of acute versus serial bicarbonate loading on your 2km
ergometer performance as well as blood levels of bicarbonate, lactate and
acidity.
What is required?
You will be required to complete six sessions, over a 3-week period, which will each
involve completing a 2km maximal rowing ergometer effort and sub-maximal warm-up.
For these tests you will receive a placebo, serial loading with sodium bicarbonate or
completing a test 90 minutes after taking sodium bicarbonate. All but one of the
research team will not know which treatment you receive.
Your height, body mass and skin folds will be measured, and these measurements will
aid in determining the dosage of nutritional supplements you will receive. Throughout
the testing period; you will be required to ingest a nutritional ergogenic aid, which will
be either sodium bicarbonate or a placebo contained in identical gelatine capsules. On
each occasion, you will ingest approximately 25 capsules. For the 24 hours prior to each
testing session, strict dietary control is necessary to standardise your blood and urine
acidity.
During each test session, a capillary blood sample will be taken from your fingertip
before you ingest any supplement, immediately prior to and then two minutes after the
completion of each 2km ergometer test. You will also be asked to provide a urine
sample prior to exercise testing and after the completion of each exercise test.
What will be measured?
Performance Measures: For each exercise test, 2km performance time, stroke rate,
power output and 500m split time will be recorded.
Capillary blood samples: Blood acidity, bicarbonate and lactate concentration will be
measured.
Urine samples: Urine pH will be measured.
Perceived Exertion: Immediately following the exercise test, a Rating of Perceived
Exertion (RPE) will be taken. This is a scale marked 6 to 20 to indicate how hard you
felt you were working.
174
Questionnaire: After your performance tests, you will also be asked which treatment
you thought you received (serial loading bicarbonate, acute loading bicarbonate or
placebo). You also will be required to respond to a questionnaire to quantify any
gastrointestinal symptoms at the same time as your blood samples are taken.
Risks of Participating
There is a risk that when you take sodium bicarbonate, you will experience
gastrointestinal symptoms such as nausea, vomiting and diarrhoea. There is also a risk
that after you complete the 2 km ergometer efforts, you may experience muscular
soreness. However, this will not be different from to what you would experience after
maximal training sessions or competition. There is also a small risk of infection and
bruising from as a result of blood sampling. The risk will be minimised however by the
use of sterile equipment.
What you will receive
You will receive feedback on your performance for each testing session, and after the
completion of all testing.
Consent
Your written informed consent is required for your participation in this study.
Further Questions
For more information, please contact:
Amelia Carr
PhD Scholar (University of Western Australia)
Department of Physiology
Australian Institute of Sport
(02) 6214 7343
Complaints or concerns
If you have any concerns with respect to the conduct of this study, you may contact the
Secretary of the AIS Ethics Committee (Dr John Williams) on 02 6214 1816.

175
Informed Consent Form
Project Title: The effect of repeated sodium bicarbonate loading on 2km rowing
ergometer performance
Principal Researchers: Dr Tony Rice, Amelia Carr, Prof. Chris Gore, Prof. Louise
Burke, Prof. Brian Dawson
This is to certify that I, ________________________________ hereby agree to
participate as a volunteer in a scientific investigation as an authorised part of the
research program of the Australian Sports Commission under the supervision of Amelia
Carr.
The investigation and my part in the investigation have been defined and fully explained
to me by Amelia Carr and I understand the explanation. A copy of the procedures of this
investigation and a description of any risks and discomforts has been provided to me
and has been discussed in detail with me.
I have been given an opportunity to ask whatever questions I may have had and all
such questions and inquiries have been answered to my satisfaction.
I understand that I am free to deny any answers to specific items or questions in
interviews or questionnaires.
I understand that I am free to withdraw consent and to discontinue participation in
the project or activity at any time.
I understand that any data or answers to questions will remain confidential with
regard to my identity.
I certify to the best of my knowledge and belief, I have no physical or mental illness
or weakness that would increase the risk to me (him/her) of participating in this
investigation.
I am participating in this project of my (his/her) own free will and I have not been
coerced in any way to participate.
Signature of Subject: _______________________________ Date: ___/___/___
I, the undersigned, was present when the study was explained to the subject/s in detail
and to the best of my knowledge and belief it was understood.
Signature of Researcher: _____________________________ Date: ___/___/___
176
Appendix B
Questionnaires
Post-test questionnaire – Study Two
Gastrointestinal symptoms questionnaire – Study Three
Post-test questionnaire – Study Four
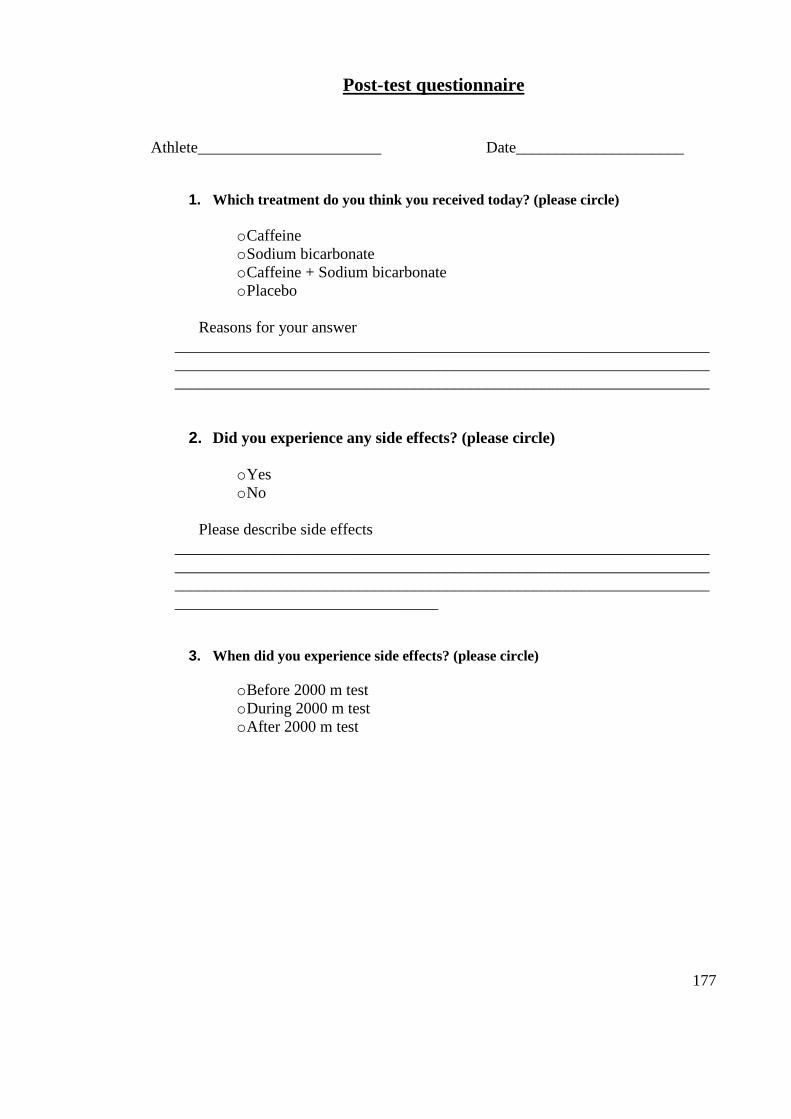
177
Post-test questionnaire
Athlete_______________________ Date_____________________
1. Which treatment do you think you received today? (please circle)
o Caffeine
o Sodium bicarbonate
o Caffeine + Sodium bicarbonate
o Placebo
Reasons for your answer
___________________________________________________________________
___________________________________________________________________
___________________________________________________________________
2. Did you experience any side effects? (please circle)
o Yes
o No
Please describe side effects
___________________________________________________________________
___________________________________________________________________
___________________________________________________________________
_________________________________
3. When did you experience side effects? (please circle)
o Before 2000 m test
o During 2000 m test
o After 2000 m test
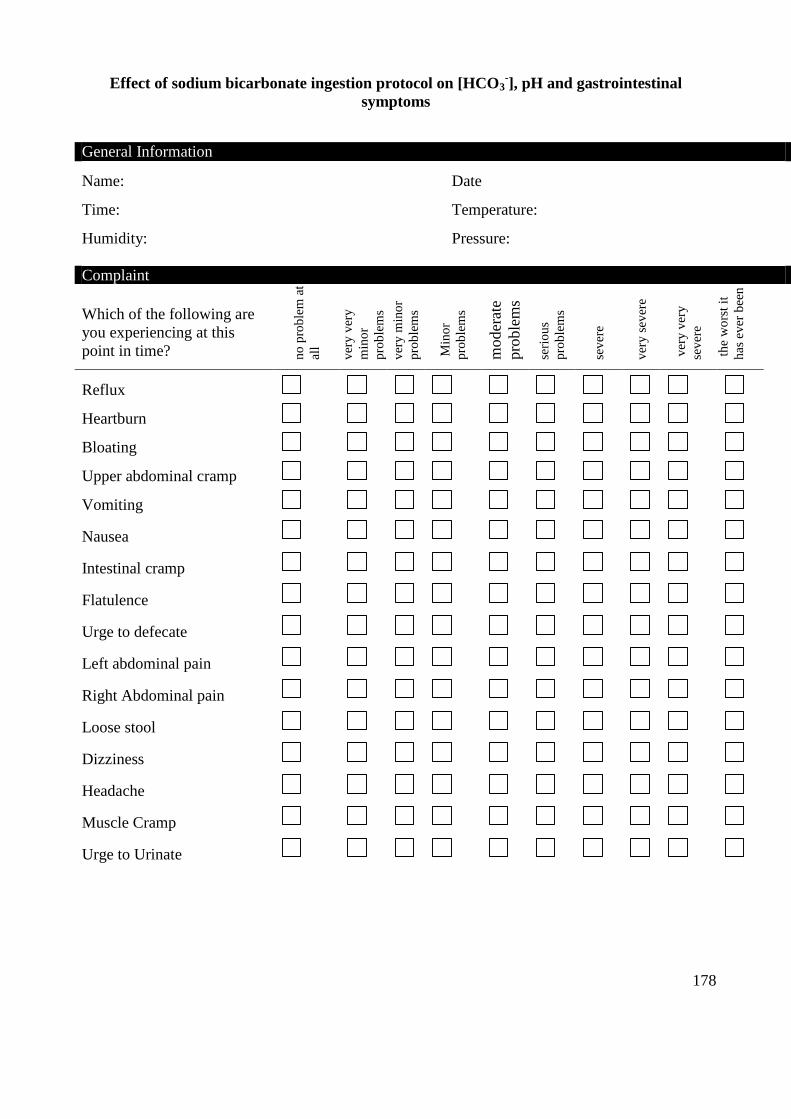
178
Effect of sodium bicarbonate ingestion protocol on [HCO3-], pH and gastrointestinal
symptoms
General Information
Name: Date
Time: Temperature:
Humidity: Pressure:
Complaint
Which of the following are
you experiencing at this
point in time? no
pro
ble
m a
t
all
ver
y v
ery
min
or
pro
ble
ms
ver
y m
ino
r
pro
ble
ms
Min
or
pro
ble
ms
moder
ate
pro
ble
ms
seri
ou
s
pro
ble
ms
sev
ere
ver
y s
ever
e
ver
y v
ery
sev
ere
th
e w
ors
t it
has
ev
er b
een
Reflux
Heartburn
Bloating
Upper abdominal cramp
Vomiting
Nausea
Intestinal cramp
Flatulence
Urge to defecate
Left abdominal pain
Right Abdominal pain
Loose stool
Dizziness
Headache
Muscle Cramp
Urge to Urinate
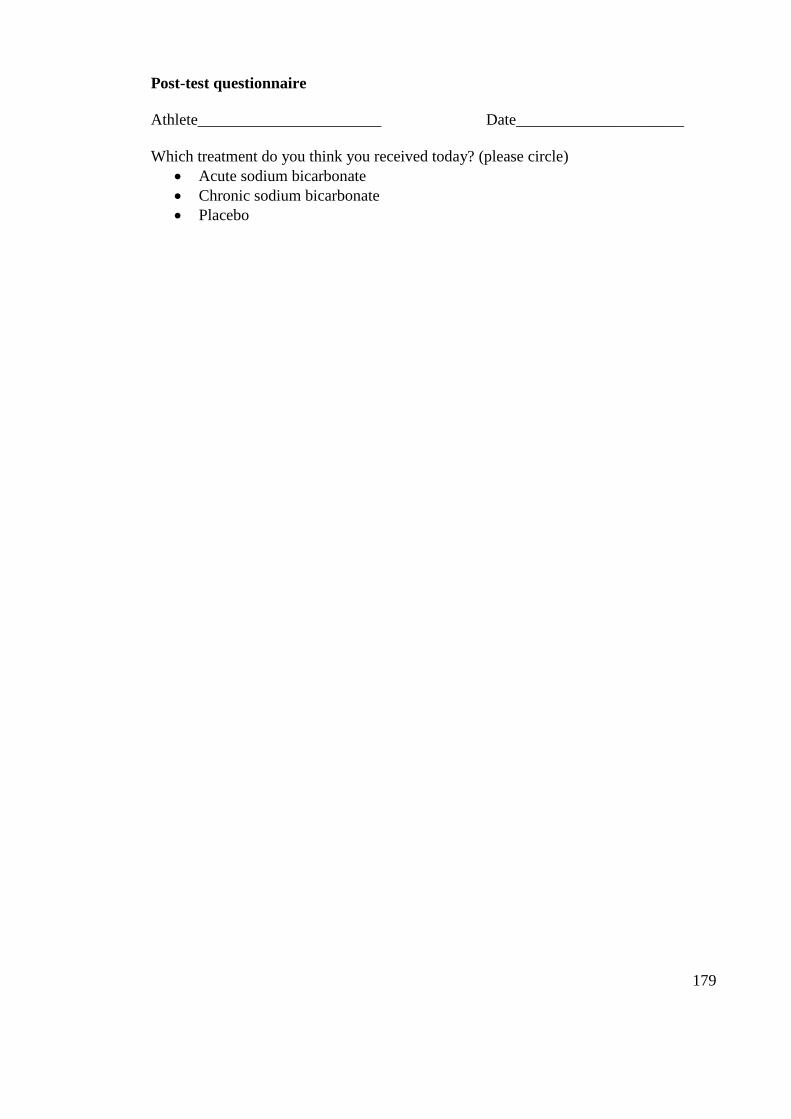
179
Post-test questionnaire
Athlete_______________________ Date_____________________
Which treatment do you think you received today? (please circle)
Acute sodium bicarbonate
Chronic sodium bicarbonate
Placebo
180
Appendix C
Raw Data
Raw Data – Chapter Three
Raw Data – Chapter Four
Raw Data – Chapter Five
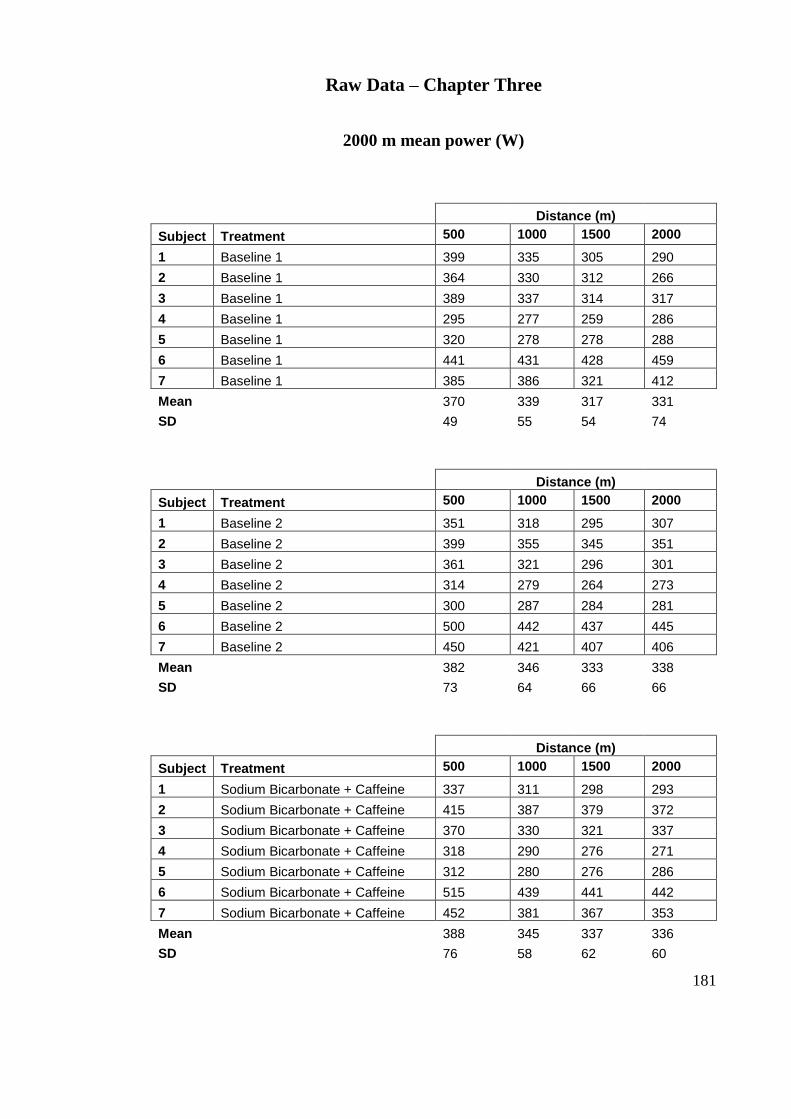
181
Raw Data – Chapter Three
2000 m mean power (W)
Distance (m)
Subject Treatment 500 1000 1500 2000
1 Baseline 1 399 335 305 290
2 Baseline 1 364 330 312 266
3 Baseline 1 389 337 314 317
4 Baseline 1 295 277 259 286
5 Baseline 1 320 278 278 288
6 Baseline 1 441 431 428 459
7 Baseline 1 385 386 321 412
Mean 370 339 317 331
SD 49 55 54 74
Distance (m)
Subject Treatment 500 1000 1500 2000
1 Baseline 2 351 318 295 307
2 Baseline 2 399 355 345 351
3 Baseline 2 361 321 296 301
4 Baseline 2 314 279 264 273
5 Baseline 2 300 287 284 281
6 Baseline 2 500 442 437 445
7 Baseline 2 450 421 407 406
Mean 382 346 333 338
SD 73 64 66 66
Distance (m)
Subject Treatment 500 1000 1500 2000
1 Sodium Bicarbonate + Caffeine 337 311 298 293
2 Sodium Bicarbonate + Caffeine 415 387 379 372
3 Sodium Bicarbonate + Caffeine 370 330 321 337
4 Sodium Bicarbonate + Caffeine 318 290 276 271
5 Sodium Bicarbonate + Caffeine 312 280 276 286
6 Sodium Bicarbonate + Caffeine 515 439 441 442
7 Sodium Bicarbonate + Caffeine 452 381 367 353
Mean 388 345 337 336
SD 76 58 62 60
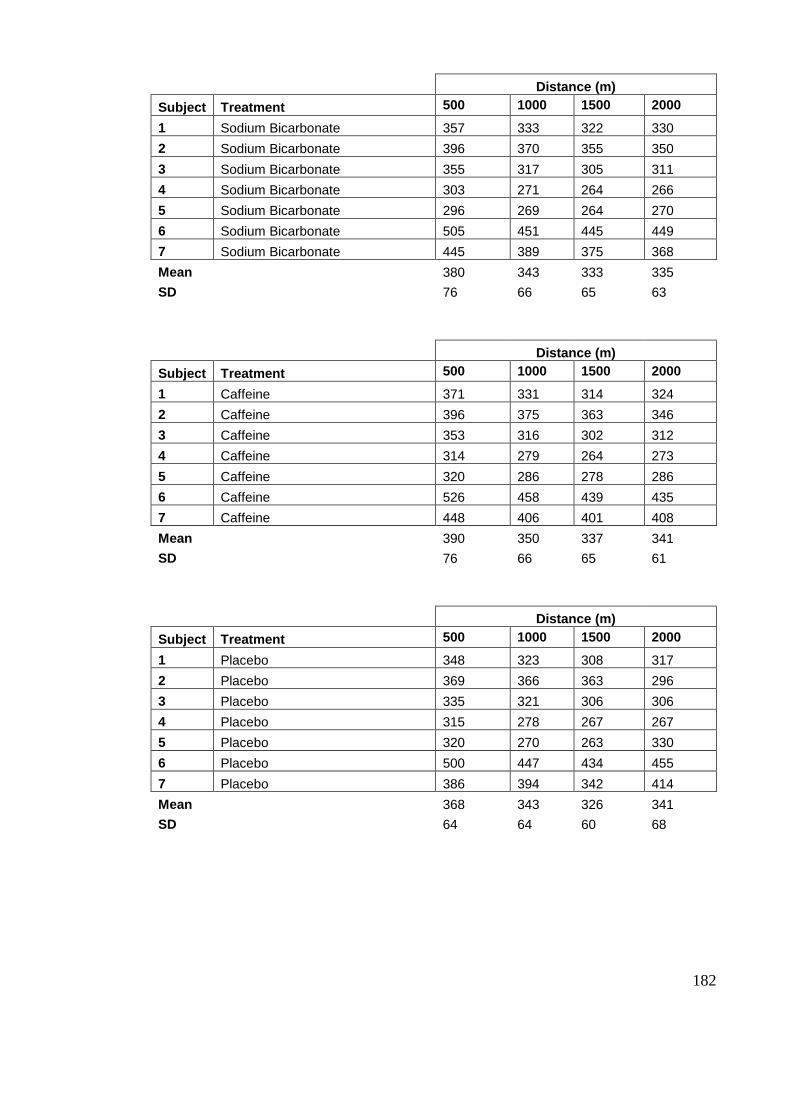
182
Distance (m)
Subject Treatment 500 1000 1500 2000
1 Sodium Bicarbonate 357 333 322 330
2 Sodium Bicarbonate 396 370 355 350
3 Sodium Bicarbonate 355 317 305 311
4 Sodium Bicarbonate 303 271 264 266
5 Sodium Bicarbonate 296 269 264 270
6 Sodium Bicarbonate 505 451 445 449
7 Sodium Bicarbonate 445 389 375 368
Mean 380 343 333 335
SD 76 66 65 63
Distance (m)
Subject Treatment 500 1000 1500 2000
1 Caffeine 371 331 314 324
2 Caffeine 396 375 363 346
3 Caffeine 353 316 302 312
4 Caffeine 314 279 264 273
5 Caffeine 320 286 278 286
6 Caffeine 526 458 439 435
7 Caffeine 448 406 401 408
Mean 390 350 337 341
SD 76 66 65 61
Distance (m)
Subject Treatment 500 1000 1500 2000
1 Placebo 348 323 308 317
2 Placebo 369 366 363 296
3 Placebo 335 321 306 306
4 Placebo 315 278 267 267
5 Placebo 320 270 263 330
6 Placebo 500 447 434 455
7 Placebo 386 394 342 414
Mean 368 343 326 341
SD 64 64 60 68
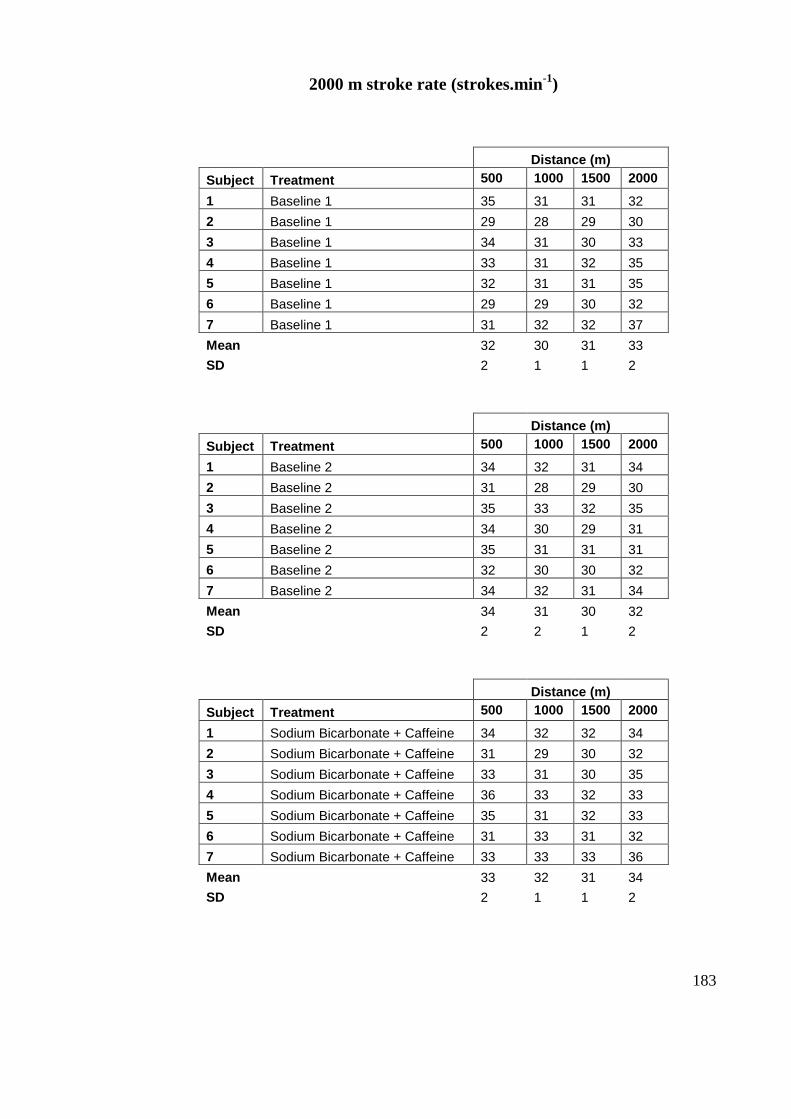
183
2000 m stroke rate (strokes.min-1
)
Distance (m)
Subject Treatment 500 1000 1500 2000
1 Baseline 1 35 31 31 32
2 Baseline 1 29 28 29 30
3 Baseline 1 34 31 30 33
4 Baseline 1 33 31 32 35
5 Baseline 1 32 31 31 35
6 Baseline 1 29 29 30 32
7 Baseline 1 31 32 32 37
Mean 32 30 31 33
SD 2 1 1 2
Distance (m)
Subject Treatment 500 1000 1500 2000
1 Baseline 2 34 32 31 34
2 Baseline 2 31 28 29 30
3 Baseline 2 35 33 32 35
4 Baseline 2 34 30 29 31
5 Baseline 2 35 31 31 31
6 Baseline 2 32 30 30 32
7 Baseline 2 34 32 31 34
Mean 34 31 30 32
SD 2 2 1 2
Distance (m)
Subject Treatment 500 1000 1500 2000
1 Sodium Bicarbonate + Caffeine 34 32 32 34
2 Sodium Bicarbonate + Caffeine 31 29 30 32
3 Sodium Bicarbonate + Caffeine 33 31 30 35
4 Sodium Bicarbonate + Caffeine 36 33 32 33
5 Sodium Bicarbonate + Caffeine 35 31 32 33
6 Sodium Bicarbonate + Caffeine 31 33 31 32
7 Sodium Bicarbonate + Caffeine 33 33 33 36
Mean 33 32 31 34
SD 2 1 1 2
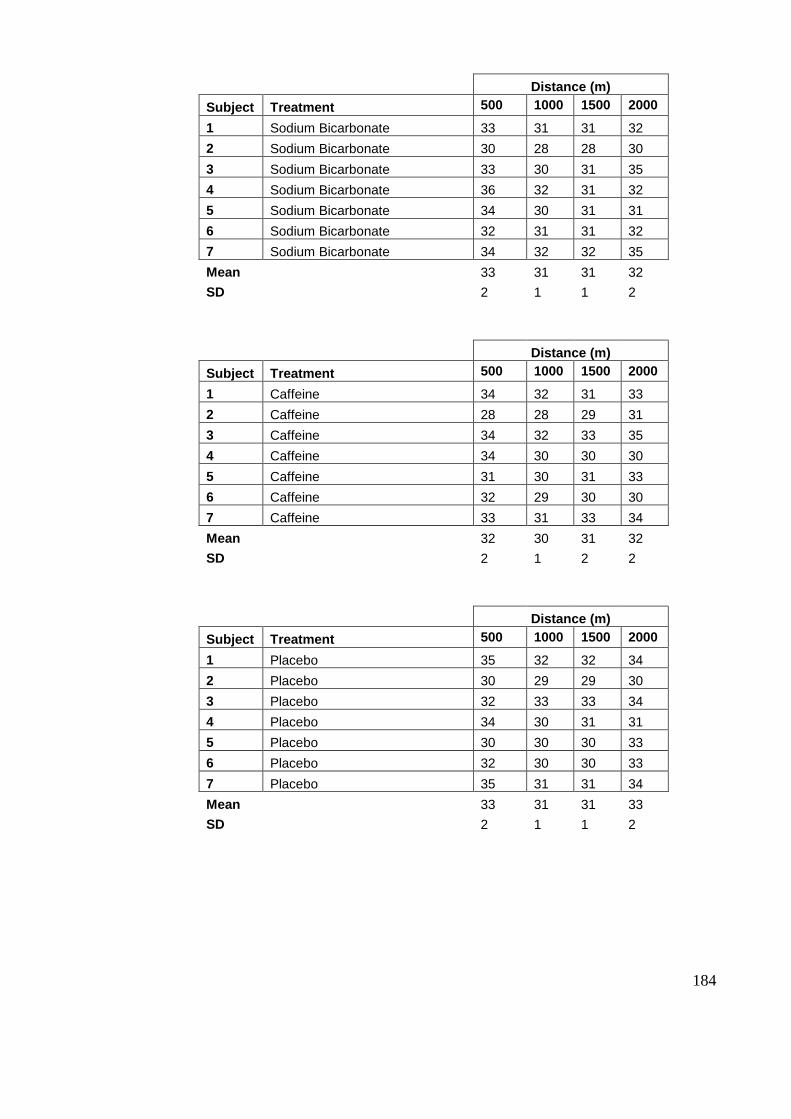
184
Distance (m)
Subject Treatment 500 1000 1500 2000
1 Sodium Bicarbonate 33 31 31 32
2 Sodium Bicarbonate 30 28 28 30
3 Sodium Bicarbonate 33 30 31 35
4 Sodium Bicarbonate 36 32 31 32
5 Sodium Bicarbonate 34 30 31 31
6 Sodium Bicarbonate 32 31 31 32
7 Sodium Bicarbonate 34 32 32 35
Mean 33 31 31 32
SD 2 1 1 2
Distance (m)
Subject Treatment 500 1000 1500 2000
1 Caffeine 34 32 31 33
2 Caffeine 28 28 29 31
3 Caffeine 34 32 33 35
4 Caffeine 34 30 30 30
5 Caffeine 31 30 31 33
6 Caffeine 32 29 30 30
7 Caffeine 33 31 33 34
Mean 32 30 31 32
SD 2 1 2 2
Distance (m)
Subject Treatment 500 1000 1500 2000
1 Placebo 35 32 32 34
2 Placebo 30 29 29 30
3 Placebo 32 33 33 34
4 Placebo 34 30 31 31
5 Placebo 30 30 30 33
6 Placebo 32 30 30 33
7 Placebo 35 31 31 34
Mean 33 31 31 33
SD 2 1 1 2
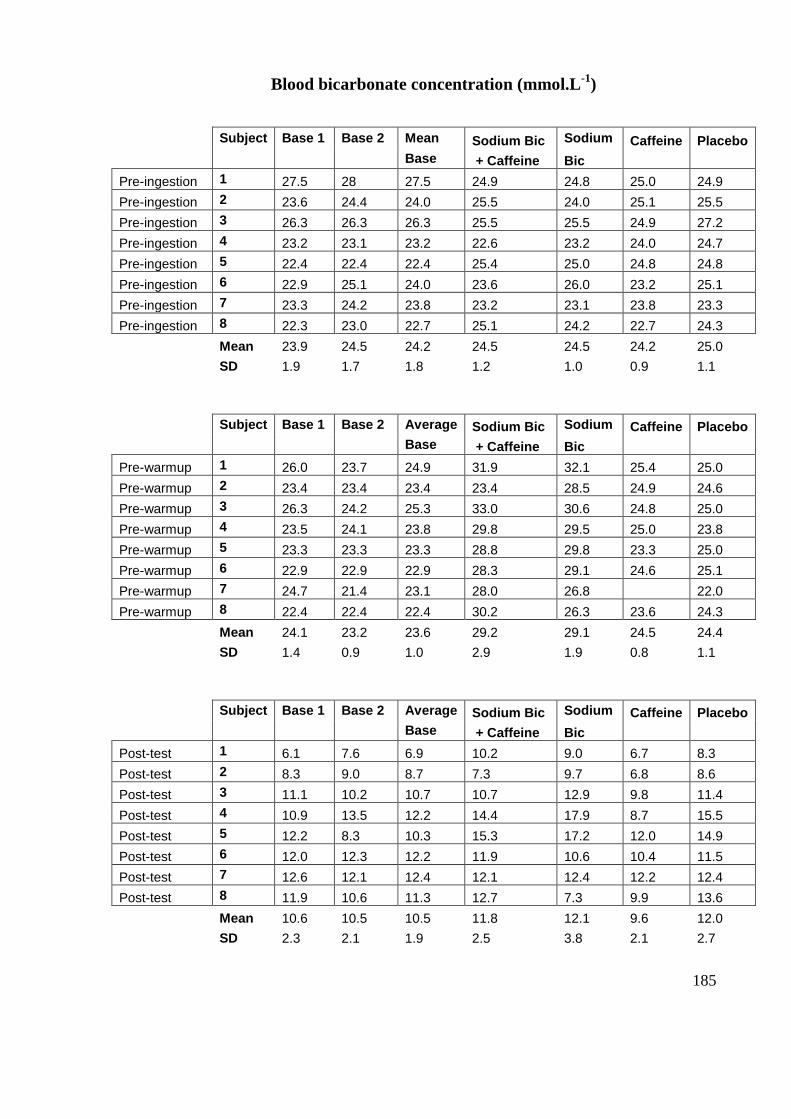
185
Blood bicarbonate concentration (mmol.L-1
)
Subject Base 1 Base 2 Mean Sodium Bic Sodium Caffeine Placebo
Base + Caffeine Bic
Pre-ingestion 1 27.5 28 27.5 24.9 24.8 25.0 24.9
Pre-ingestion 2 23.6 24.4 24.0 25.5 24.0 25.1 25.5
Pre-ingestion 3 26.3 26.3 26.3 25.5 25.5 24.9 27.2
Pre-ingestion 4 23.2 23.1 23.2 22.6 23.2 24.0 24.7
Pre-ingestion 5 22.4 22.4 22.4 25.4 25.0 24.8 24.8
Pre-ingestion 6 22.9 25.1 24.0 23.6 26.0 23.2 25.1
Pre-ingestion 7 23.3 24.2 23.8 23.2 23.1 23.8 23.3
Pre-ingestion 8 22.3 23.0 22.7 25.1 24.2 22.7 24.3
Mean 23.9 24.5 24.2 24.5 24.5 24.2 25.0
SD 1.9 1.7 1.8 1.2 1.0 0.9 1.1
Subject Base 1 Base 2 Average Sodium Bic Sodium Caffeine Placebo
Base + Caffeine Bic
Pre-warmup 1 26.0 23.7 24.9 31.9 32.1 25.4 25.0
Pre-warmup 2 23.4 23.4 23.4 23.4 28.5 24.9 24.6
Pre-warmup 3 26.3 24.2 25.3 33.0 30.6 24.8 25.0
Pre-warmup 4 23.5 24.1 23.8 29.8 29.5 25.0 23.8
Pre-warmup 5 23.3 23.3 23.3 28.8 29.8 23.3 25.0
Pre-warmup 6 22.9 22.9 22.9 28.3 29.1 24.6 25.1
Pre-warmup 7 24.7 21.4 23.1 28.0 26.8 22.0
Pre-warmup 8 22.4 22.4 22.4 30.2 26.3 23.6 24.3
Mean 24.1 23.2 23.6 29.2 29.1 24.5 24.4
SD 1.4 0.9 1.0 2.9 1.9 0.8 1.1
Subject Base 1 Base 2 Average Sodium Bic Sodium Caffeine Placebo
Base + Caffeine Bic
Post-test 1 6.1 7.6 6.9 10.2 9.0 6.7 8.3
Post-test 2 8.3 9.0 8.7 7.3 9.7 6.8 8.6
Post-test 3 11.1 10.2 10.7 10.7 12.9 9.8 11.4
Post-test 4 10.9 13.5 12.2 14.4 17.9 8.7 15.5
Post-test 5 12.2 8.3 10.3 15.3 17.2 12.0 14.9
Post-test 6 12.0 12.3 12.2 11.9 10.6 10.4 11.5
Post-test 7 12.6 12.1 12.4 12.1 12.4 12.2 12.4
Post-test 8 11.9 10.6 11.3 12.7 7.3 9.9 13.6
Mean 10.6 10.5 10.5 11.8 12.1 9.6 12.0
SD 2.3 2.1 1.9 2.5 3.8 2.1 2.7
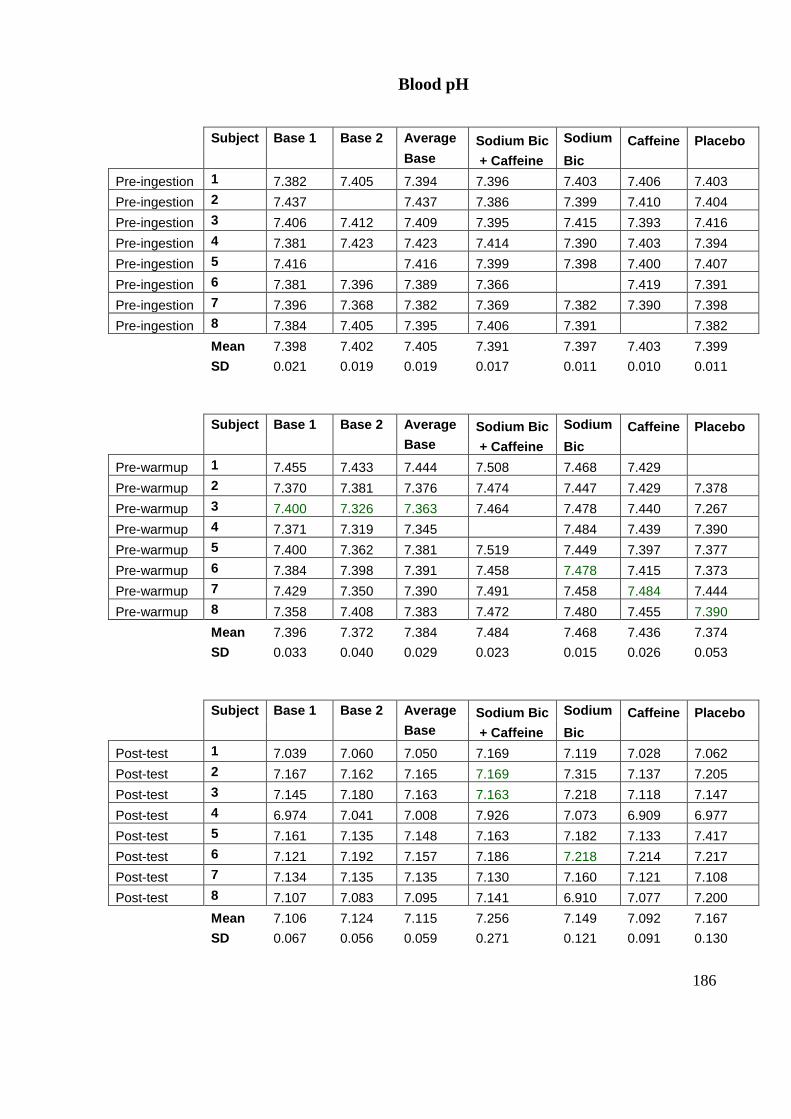
186
Blood pH
Subject Base 1 Base 2 Average Sodium Bic Sodium Caffeine Placebo
Base + Caffeine Bic
Pre-ingestion 1 7.382 7.405 7.394 7.396 7.403 7.406 7.403
Pre-ingestion 2 7.437 7.437 7.386 7.399 7.410 7.404
Pre-ingestion 3 7.406 7.412 7.409 7.395 7.415 7.393 7.416
Pre-ingestion 4 7.381 7.423 7.423 7.414 7.390 7.403 7.394
Pre-ingestion 5 7.416 7.416 7.399 7.398 7.400 7.407
Pre-ingestion 6 7.381 7.396 7.389 7.366 7.419 7.391
Pre-ingestion 7 7.396 7.368 7.382 7.369 7.382 7.390 7.398
Pre-ingestion 8 7.384 7.405 7.395 7.406 7.391 7.382
Mean 7.398 7.402 7.405 7.391 7.397 7.403 7.399
SD 0.021 0.019 0.019 0.017 0.011 0.010 0.011
Subject Base 1 Base 2 Average Sodium Bic Sodium Caffeine Placebo
Base + Caffeine Bic
Pre-warmup 1 7.455 7.433 7.444 7.508 7.468 7.429
Pre-warmup 2 7.370 7.381 7.376 7.474 7.447 7.429 7.378
Pre-warmup 3 7.400 7.326 7.363 7.464 7.478 7.440 7.267
Pre-warmup 4 7.371 7.319 7.345 7.484 7.439 7.390
Pre-warmup 5 7.400 7.362 7.381 7.519 7.449 7.397 7.377
Pre-warmup 6 7.384 7.398 7.391 7.458 7.478 7.415 7.373
Pre-warmup 7 7.429 7.350 7.390 7.491 7.458 7.484 7.444
Pre-warmup 8 7.358 7.408 7.383 7.472 7.480 7.455 7.390
Mean 7.396 7.372 7.384 7.484 7.468 7.436 7.374
SD 0.033 0.040 0.029 0.023 0.015 0.026 0.053
Subject Base 1 Base 2 Average Sodium Bic Sodium Caffeine Placebo
Base + Caffeine Bic
Post-test 1 7.039 7.060 7.050 7.169 7.119 7.028 7.062
Post-test 2 7.167 7.162 7.165 7.169 7.315 7.137 7.205
Post-test 3 7.145 7.180 7.163 7.163 7.218 7.118 7.147
Post-test 4 6.974 7.041 7.008 7.926 7.073 6.909 6.977
Post-test 5 7.161 7.135 7.148 7.163 7.182 7.133 7.417
Post-test 6 7.121 7.192 7.157 7.186 7.218 7.214 7.217
Post-test 7 7.134 7.135 7.135 7.130 7.160 7.121 7.108
Post-test 8 7.107 7.083 7.095 7.141 6.910 7.077 7.200
Mean 7.106 7.124 7.115 7.256 7.149 7.092 7.167
SD 0.067 0.056 0.059 0.271 0.121 0.091 0.130
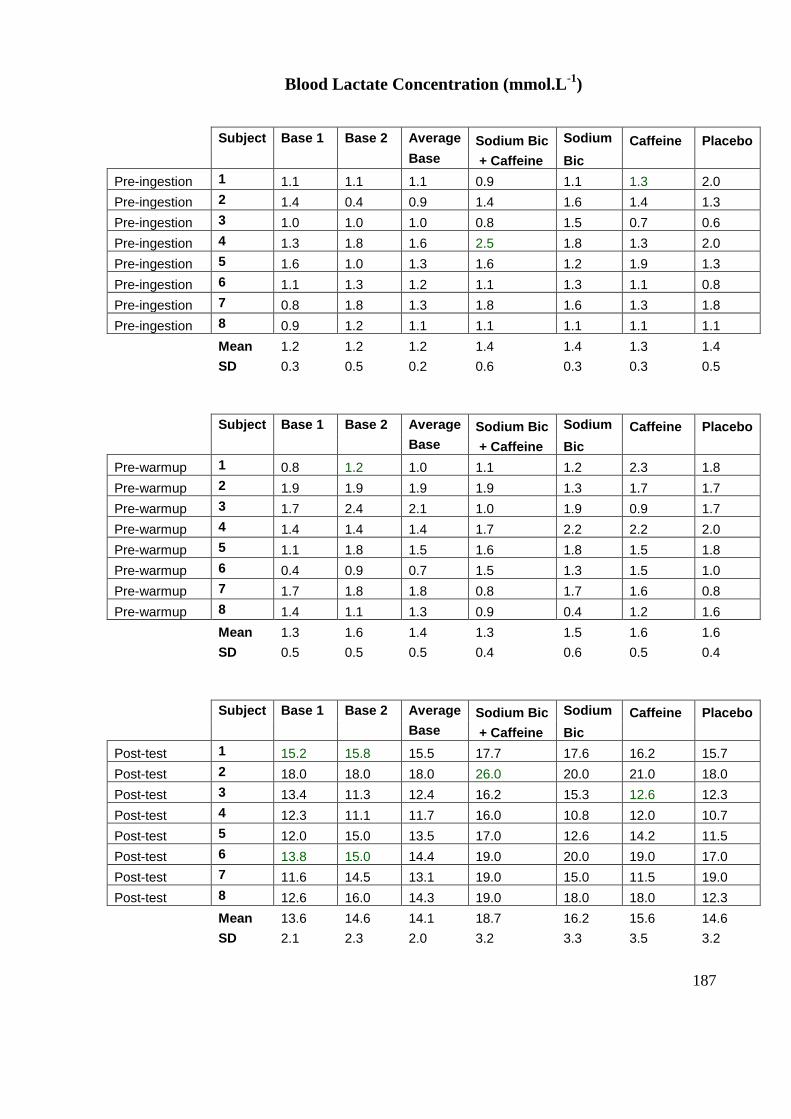
187
Blood Lactate Concentration (mmol.L-1
)
Subject Base 1 Base 2 Average Sodium Bic Sodium Caffeine Placebo
Base + Caffeine Bic
Pre-ingestion 1 1.1 1.1 1.1 0.9 1.1 1.3 2.0
Pre-ingestion 2 1.4 0.4 0.9 1.4 1.6 1.4 1.3
Pre-ingestion 3 1.0 1.0 1.0 0.8 1.5 0.7 0.6
Pre-ingestion 4 1.3 1.8 1.6 2.5 1.8 1.3 2.0
Pre-ingestion 5 1.6 1.0 1.3 1.6 1.2 1.9 1.3
Pre-ingestion 6 1.1 1.3 1.2 1.1 1.3 1.1 0.8
Pre-ingestion 7 0.8 1.8 1.3 1.8 1.6 1.3 1.8
Pre-ingestion 8 0.9 1.2 1.1 1.1 1.1 1.1 1.1
Mean 1.2 1.2 1.2 1.4 1.4 1.3 1.4
SD 0.3 0.5 0.2 0.6 0.3 0.3 0.5
Subject Base 1 Base 2 Average Sodium Bic Sodium Caffeine Placebo
Base + Caffeine Bic
Pre-warmup 1 0.8 1.2 1.0 1.1 1.2 2.3 1.8
Pre-warmup 2 1.9 1.9 1.9 1.9 1.3 1.7 1.7
Pre-warmup 3 1.7 2.4 2.1 1.0 1.9 0.9 1.7
Pre-warmup 4 1.4 1.4 1.4 1.7 2.2 2.2 2.0
Pre-warmup 5 1.1 1.8 1.5 1.6 1.8 1.5 1.8
Pre-warmup 6 0.4 0.9 0.7 1.5 1.3 1.5 1.0
Pre-warmup 7 1.7 1.8 1.8 0.8 1.7 1.6 0.8
Pre-warmup 8 1.4 1.1 1.3 0.9 0.4 1.2 1.6
Mean 1.3 1.6 1.4 1.3 1.5 1.6 1.6
SD 0.5 0.5 0.5 0.4 0.6 0.5 0.4
Subject Base 1 Base 2 Average Sodium Bic Sodium Caffeine Placebo
Base + Caffeine Bic
Post-test 1 15.2 15.8 15.5 17.7 17.6 16.2 15.7
Post-test 2 18.0 18.0 18.0 26.0 20.0 21.0 18.0
Post-test 3 13.4 11.3 12.4 16.2 15.3 12.6 12.3
Post-test 4 12.3 11.1 11.7 16.0 10.8 12.0 10.7
Post-test 5 12.0 15.0 13.5 17.0 12.6 14.2 11.5
Post-test 6 13.8 15.0 14.4 19.0 20.0 19.0 17.0
Post-test 7 11.6 14.5 13.1 19.0 15.0 11.5 19.0
Post-test 8 12.6 16.0 14.3 19.0 18.0 18.0 12.3
Mean 13.6 14.6 14.1 18.7 16.2 15.6 14.6
SD 2.1 2.3 2.0 3.2 3.3 3.5 3.2
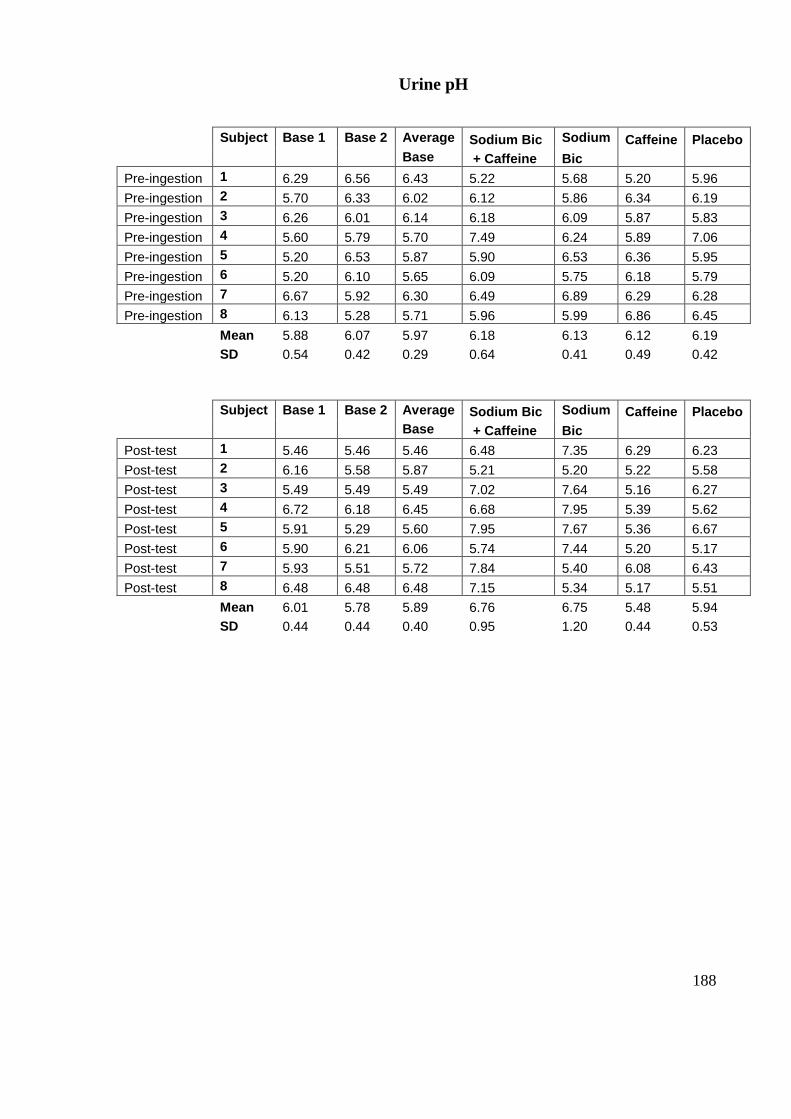
188
Urine pH
Subject Base 1 Base 2 Average Sodium Bic Sodium Caffeine Placebo
Base + Caffeine Bic
Pre-ingestion 1 6.29 6.56 6.43 5.22 5.68 5.20 5.96
Pre-ingestion 2 5.70 6.33 6.02 6.12 5.86 6.34 6.19
Pre-ingestion 3 6.26 6.01 6.14 6.18 6.09 5.87 5.83
Pre-ingestion 4 5.60 5.79 5.70 7.49 6.24 5.89 7.06
Pre-ingestion 5 5.20 6.53 5.87 5.90 6.53 6.36 5.95
Pre-ingestion 6 5.20 6.10 5.65 6.09 5.75 6.18 5.79
Pre-ingestion 7 6.67 5.92 6.30 6.49 6.89 6.29 6.28
Pre-ingestion 8 6.13 5.28 5.71 5.96 5.99 6.86 6.45
Mean 5.88 6.07 5.97 6.18 6.13 6.12 6.19
SD 0.54 0.42 0.29 0.64 0.41 0.49 0.42
Subject Base 1 Base 2 Average Sodium Bic Sodium Caffeine Placebo
Base + Caffeine Bic
Post-test 1 5.46 5.46 5.46 6.48 7.35 6.29 6.23
Post-test 2 6.16 5.58 5.87 5.21 5.20 5.22 5.58
Post-test 3 5.49 5.49 5.49 7.02 7.64 5.16 6.27
Post-test 4 6.72 6.18 6.45 6.68 7.95 5.39 5.62
Post-test 5 5.91 5.29 5.60 7.95 7.67 5.36 6.67
Post-test 6 5.90 6.21 6.06 5.74 7.44 5.20 5.17
Post-test 7 5.93 5.51 5.72 7.84 5.40 6.08 6.43
Post-test 8 6.48 6.48 6.48 7.15 5.34 5.17 5.51
Mean 6.01 5.78 5.89 6.76 6.75 5.48 5.94
SD 0.44 0.44 0.40 0.95 1.20 0.44 0.53
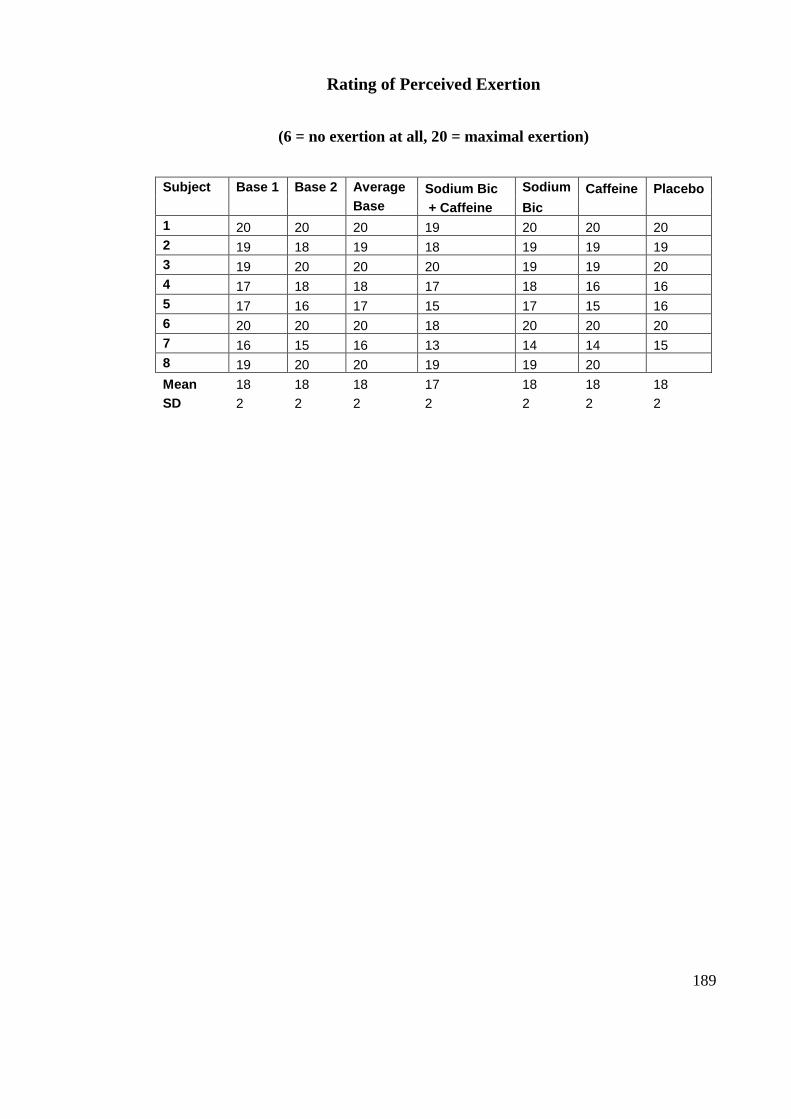
189
Rating of Perceived Exertion
(6 = no exertion at all, 20 = maximal exertion)
Subject Base 1 Base 2 Average Sodium Bic Sodium Caffeine Placebo
Base + Caffeine Bic
1 20 20 20 19 20 20 20
2 19 18 19 18 19 19 19
3 19 20 20 20 19 19 20
4 17 18 18 17 18 16 16
5 17 16 17 15 17 15 16
6 20 20 20 18 20 20 20
7 16 15 16 13 14 14 15
8 19 20 20 19 19 20
Mean 18 18 18 17 18 18 18
SD 2 2 2 2 2 2 2
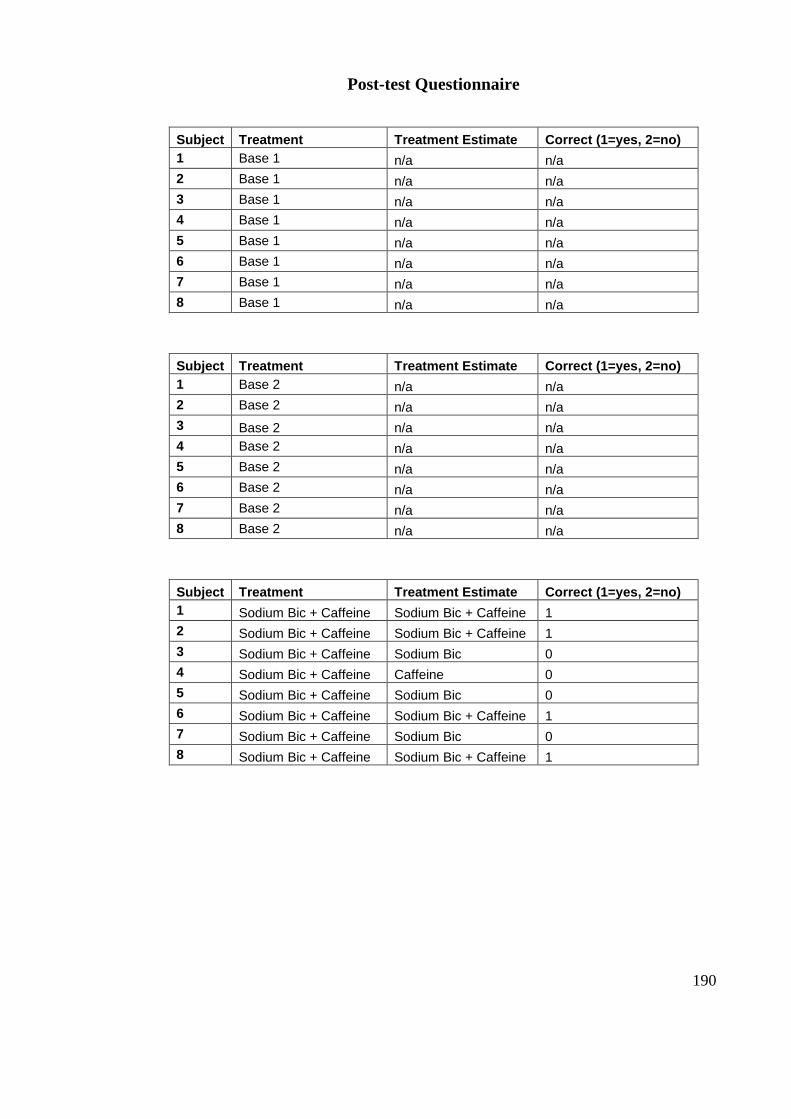
190
Post-test Questionnaire
Subject Treatment Treatment Estimate Correct (1=yes, 2=no)
1 Base 1 n/a n/a
2 Base 1 n/a n/a
3 Base 1 n/a n/a
4 Base 1 n/a n/a
5 Base 1 n/a n/a
6 Base 1 n/a n/a
7 Base 1 n/a n/a
8 Base 1 n/a n/a
Subject Treatment Treatment Estimate Correct (1=yes, 2=no)
1 Base 2 n/a n/a
2 Base 2 n/a n/a
3 Base 2 n/a n/a
4 Base 2 n/a n/a
5 Base 2 n/a n/a
6 Base 2 n/a n/a
7 Base 2 n/a n/a
8 Base 2 n/a n/a
Subject Treatment Treatment Estimate Correct (1=yes, 2=no)
1 Sodium Bic + Caffeine Sodium Bic + Caffeine 1
2 Sodium Bic + Caffeine Sodium Bic + Caffeine 1
3 Sodium Bic + Caffeine Sodium Bic 0
4 Sodium Bic + Caffeine Caffeine 0
5 Sodium Bic + Caffeine Sodium Bic 0
6 Sodium Bic + Caffeine Sodium Bic + Caffeine 1
7 Sodium Bic + Caffeine Sodium Bic 0
8 Sodium Bic + Caffeine Sodium Bic + Caffeine 1
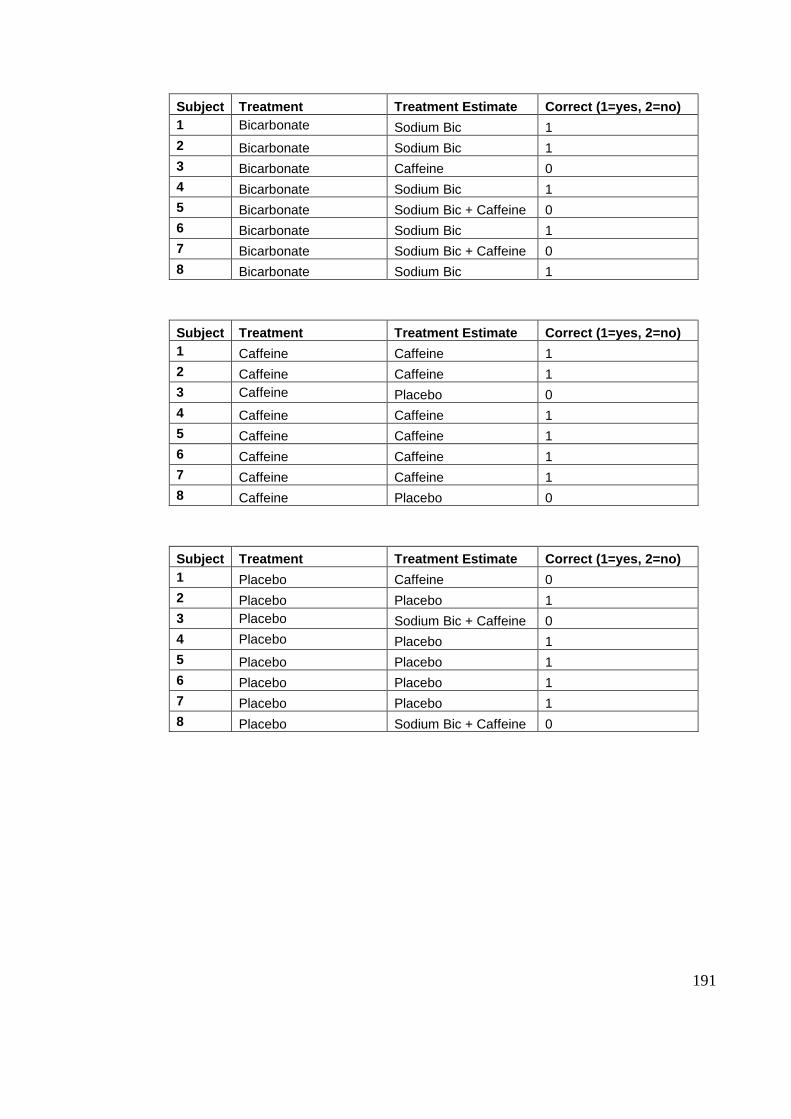
191
Subject Treatment Treatment Estimate Correct (1=yes, 2=no)
1 Bicarbonate Sodium Bic 1
2 Bicarbonate Sodium Bic 1
3 Bicarbonate Caffeine 0
4 Bicarbonate Sodium Bic 1
5 Bicarbonate Sodium Bic + Caffeine 0
6 Bicarbonate Sodium Bic 1
7 Bicarbonate Sodium Bic + Caffeine 0
8 Bicarbonate Sodium Bic 1
Subject Treatment Treatment Estimate Correct (1=yes, 2=no)
1 Caffeine Caffeine 1
2 Caffeine Caffeine 1
3 Caffeine Placebo 0
4 Caffeine Caffeine 1
5 Caffeine Caffeine 1
6 Caffeine Caffeine 1
7 Caffeine Caffeine 1
8 Caffeine Placebo 0
Subject Treatment Treatment Estimate Correct (1=yes, 2=no)
1 Placebo Caffeine 0
2 Placebo Placebo 1
3 Placebo Sodium Bic + Caffeine 0
4 Placebo Placebo 1
5 Placebo Placebo 1
6 Placebo Placebo 1
7 Placebo Placebo 1
8 Placebo Sodium Bic + Caffeine 0
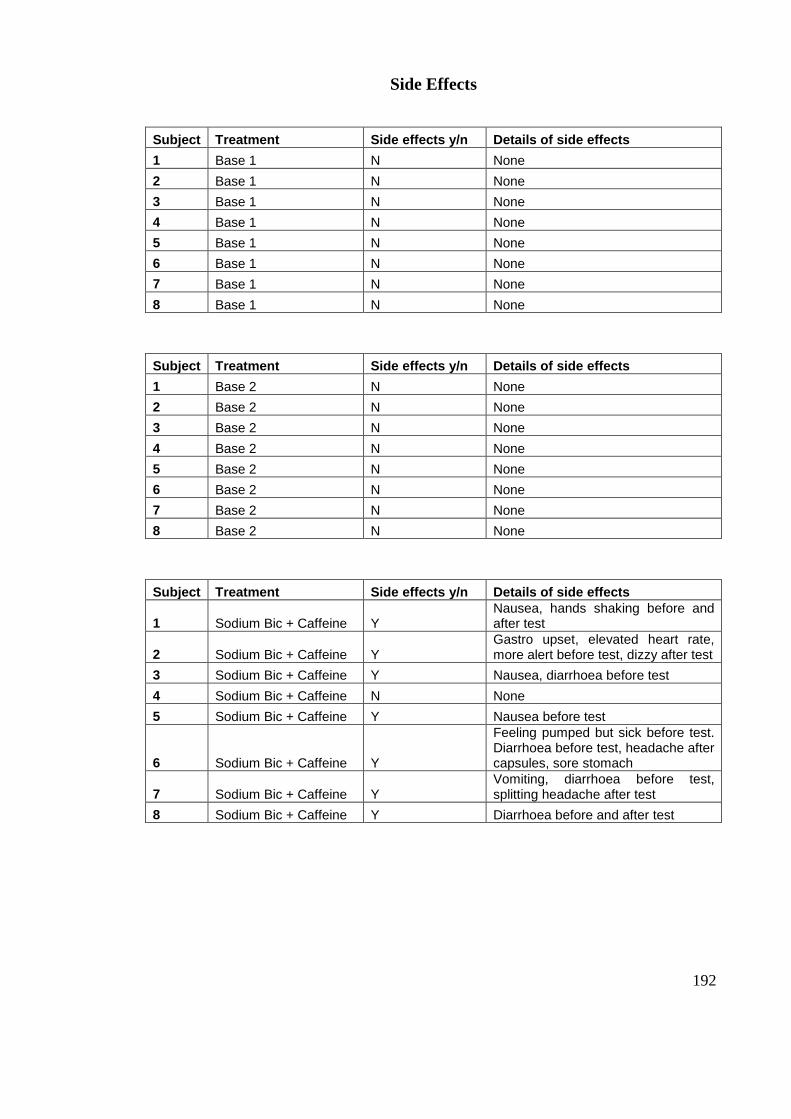
192
Side Effects
Subject Treatment Side effects y/n Details of side effects
1 Base 1 N None
2 Base 1 N None
3 Base 1 N None
4 Base 1 N None
5 Base 1 N None
6 Base 1 N None
7 Base 1 N None
8 Base 1 N None
Subject Treatment Side effects y/n Details of side effects
1 Base 2 N None
2 Base 2 N None
3 Base 2 N None
4 Base 2 N None
5 Base 2 N None
6 Base 2 N None
7 Base 2 N None
8 Base 2 N None
Subject Treatment Side effects y/n Details of side effects
1 Sodium Bic + Caffeine Y Nausea, hands shaking before and after test
2 Sodium Bic + Caffeine Y Gastro upset, elevated heart rate, more alert before test, dizzy after test
3 Sodium Bic + Caffeine Y Nausea, diarrhoea before test
4 Sodium Bic + Caffeine N None
5 Sodium Bic + Caffeine Y Nausea before test
6 Sodium Bic + Caffeine Y
Feeling pumped but sick before test. Diarrhoea before test, headache after capsules, sore stomach
7 Sodium Bic + Caffeine Y Vomiting, diarrhoea before test, splitting headache after test
8 Sodium Bic + Caffeine Y Diarrhoea before and after test
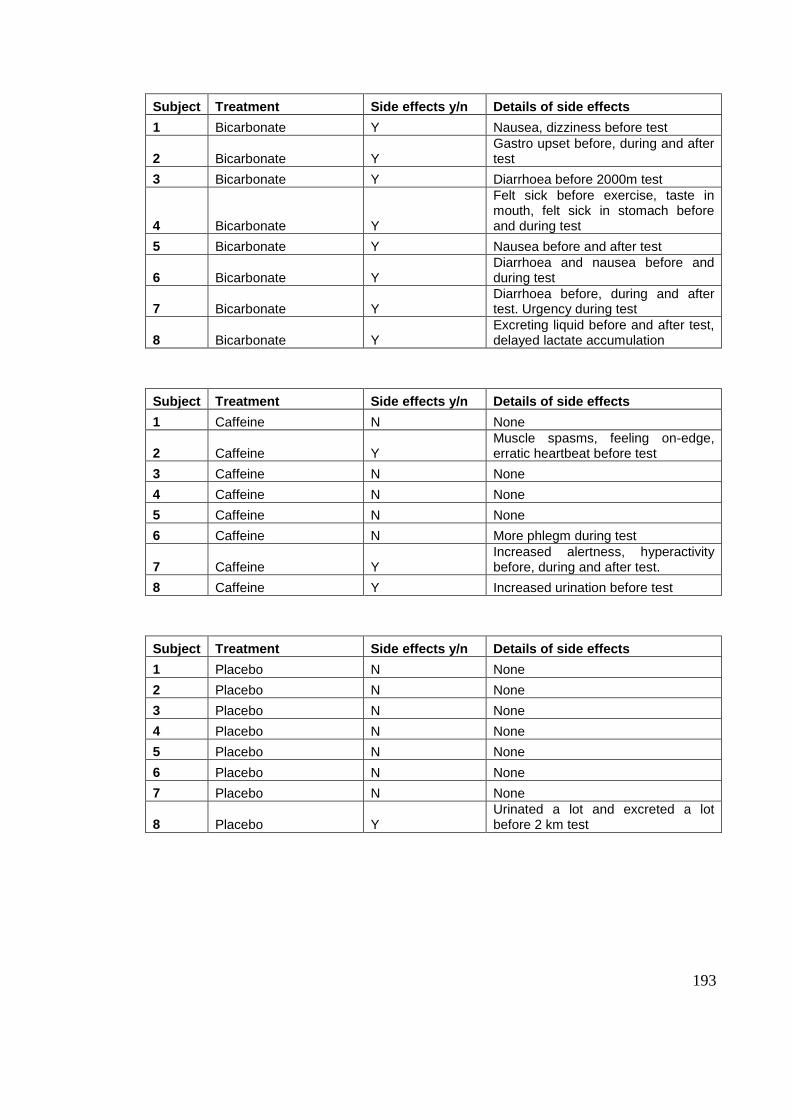
193
Subject Treatment Side effects y/n Details of side effects
1 Bicarbonate Y Nausea, dizziness before test
2 Bicarbonate Y Gastro upset before, during and after test
3 Bicarbonate Y Diarrhoea before 2000m test
4 Bicarbonate Y
Felt sick before exercise, taste in mouth, felt sick in stomach before and during test
5 Bicarbonate Y Nausea before and after test
6 Bicarbonate Y Diarrhoea and nausea before and during test
7 Bicarbonate Y Diarrhoea before, during and after test. Urgency during test
8 Bicarbonate Y Excreting liquid before and after test, delayed lactate accumulation
Subject Treatment Side effects y/n Details of side effects
1 Caffeine N None
2 Caffeine Y Muscle spasms, feeling on-edge, erratic heartbeat before test
3 Caffeine N None
4 Caffeine N None
5 Caffeine N None
6 Caffeine N More phlegm during test
7 Caffeine Y Increased alertness, hyperactivity before, during and after test.
8 Caffeine Y Increased urination before test
Subject Treatment Side effects y/n Details of side effects
1 Placebo N None
2 Placebo N None
3 Placebo N None
4 Placebo N None
5 Placebo N None
6 Placebo N None
7 Placebo N None
8 Placebo Y Urinated a lot and excreted a lot before 2 km test
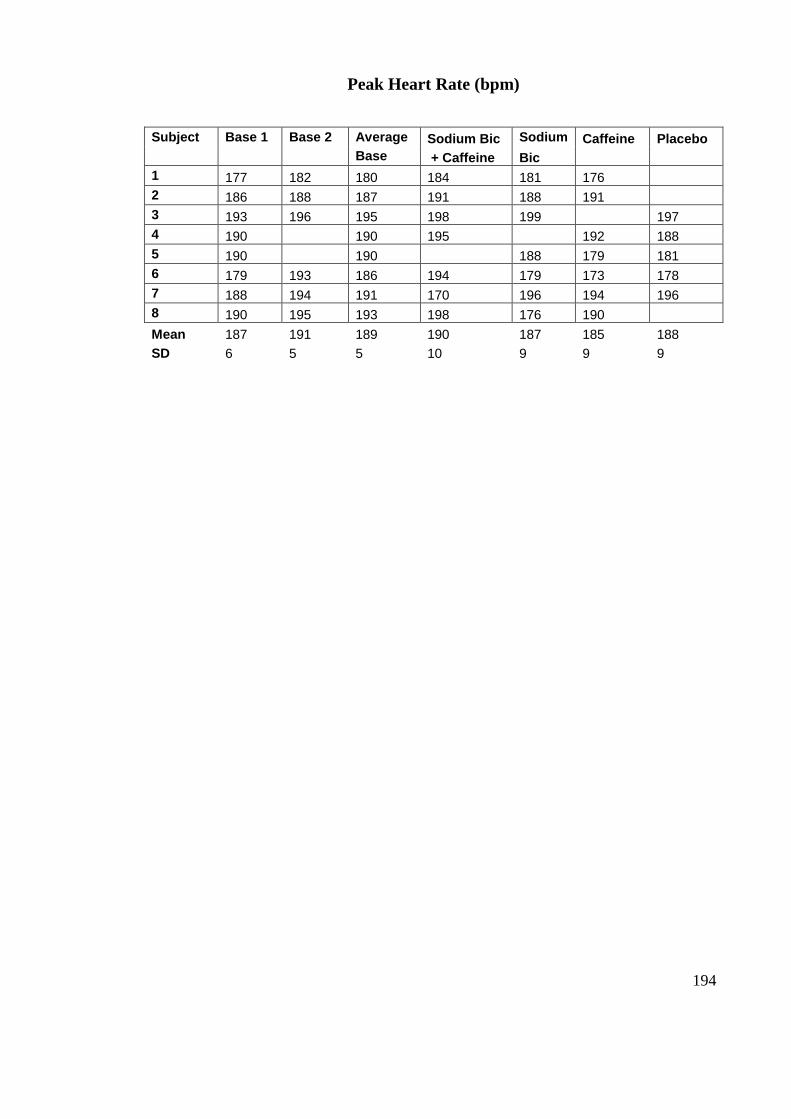
194
Peak Heart Rate (bpm)
Subject Base 1 Base 2 Average Sodium Bic Sodium Caffeine Placebo
Base + Caffeine Bic
1 177 182 180 184 181 176
2 186 188 187 191 188 191
3 193 196 195 198 199 197
4 190 190 195 192 188
5 190 190 188 179 181
6 179 193 186 194 179 173 178
7 188 194 191 170 196 194 196
8 190 195 193 198 176 190
Mean 187 191 189 190 187 185 188
SD 6 5 5 10 9 9 9
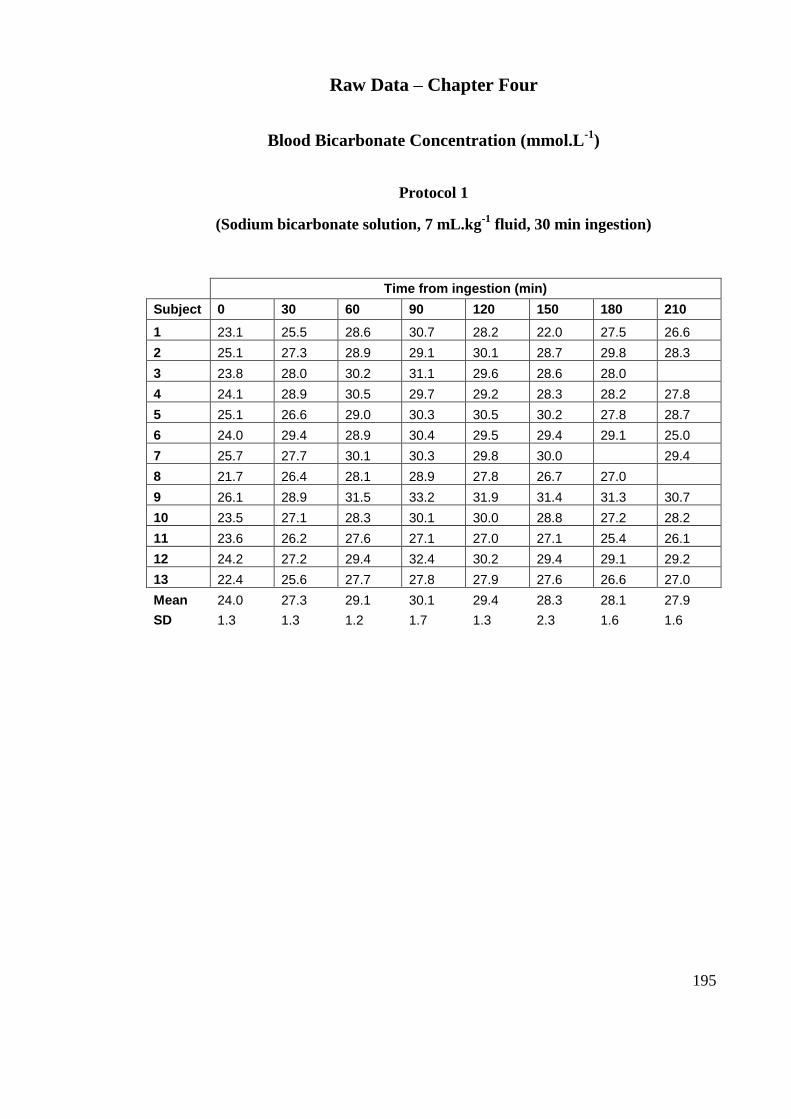
195
Raw Data – Chapter Four
Blood Bicarbonate Concentration (mmol.L-1
)
Protocol 1
(Sodium bicarbonate solution, 7 mL.kg-1
fluid, 30 min ingestion)
Time from ingestion (min)
Subject 0 30 60 90 120 150 180 210
1 23.1 25.5 28.6 30.7 28.2 22.0 27.5 26.6
2 25.1 27.3 28.9 29.1 30.1 28.7 29.8 28.3
3 23.8 28.0 30.2 31.1 29.6 28.6 28.0
4 24.1 28.9 30.5 29.7 29.2 28.3 28.2 27.8
5 25.1 26.6 29.0 30.3 30.5 30.2 27.8 28.7
6 24.0 29.4 28.9 30.4 29.5 29.4 29.1 25.0
7 25.7 27.7 30.1 30.3 29.8 30.0 29.4
8 21.7 26.4 28.1 28.9 27.8 26.7 27.0
9 26.1 28.9 31.5 33.2 31.9 31.4 31.3 30.7
10 23.5 27.1 28.3 30.1 30.0 28.8 27.2 28.2
11 23.6 26.2 27.6 27.1 27.0 27.1 25.4 26.1
12 24.2 27.2 29.4 32.4 30.2 29.4 29.1 29.2
13 22.4 25.6 27.7 27.8 27.9 27.6 26.6 27.0
Mean 24.0 27.3 29.1 30.1 29.4 28.3 28.1 27.9
SD 1.3 1.3 1.2 1.7 1.3 2.3 1.6 1.6
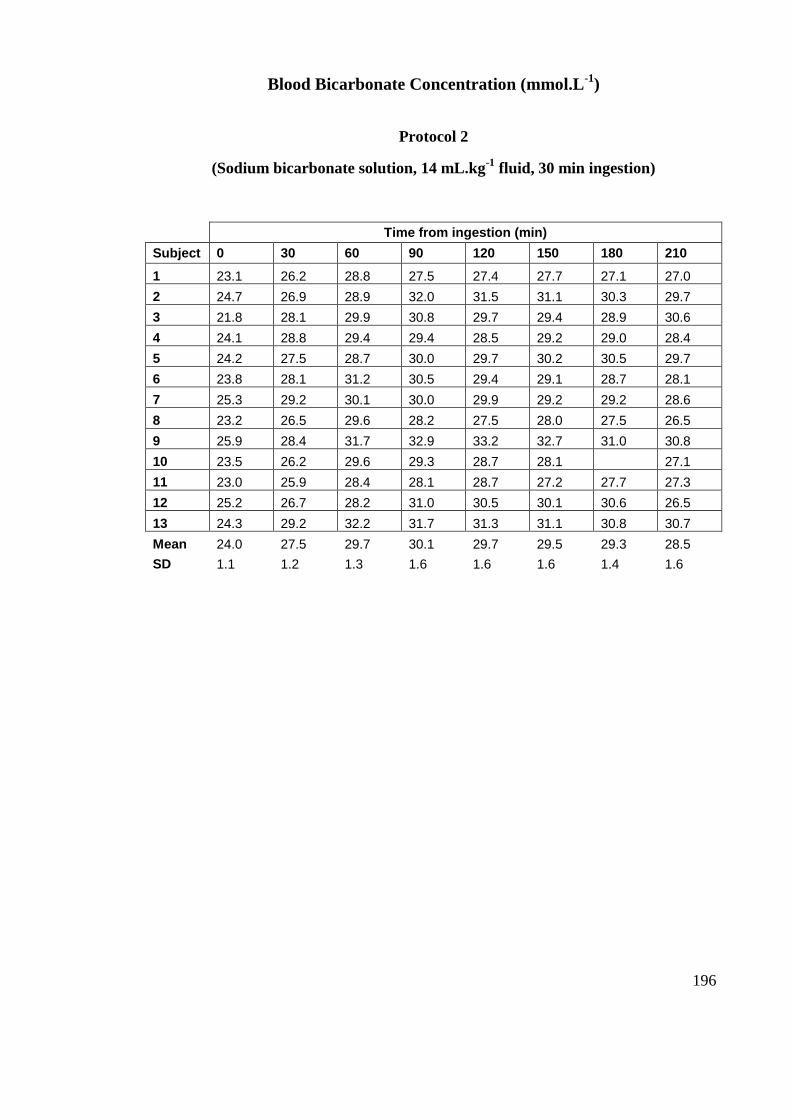
196
Blood Bicarbonate Concentration (mmol.L-1
)
Protocol 2
(Sodium bicarbonate solution, 14 mL.kg-1
fluid, 30 min ingestion)
Time from ingestion (min)
Subject 0 30 60 90 120 150 180 210
1 23.1 26.2 28.8 27.5 27.4 27.7 27.1 27.0
2 24.7 26.9 28.9 32.0 31.5 31.1 30.3 29.7
3 21.8 28.1 29.9 30.8 29.7 29.4 28.9 30.6
4 24.1 28.8 29.4 29.4 28.5 29.2 29.0 28.4
5 24.2 27.5 28.7 30.0 29.7 30.2 30.5 29.7
6 23.8 28.1 31.2 30.5 29.4 29.1 28.7 28.1
7 25.3 29.2 30.1 30.0 29.9 29.2 29.2 28.6
8 23.2 26.5 29.6 28.2 27.5 28.0 27.5 26.5
9 25.9 28.4 31.7 32.9 33.2 32.7 31.0 30.8
10 23.5 26.2 29.6 29.3 28.7 28.1 27.1
11 23.0 25.9 28.4 28.1 28.7 27.2 27.7 27.3
12 25.2 26.7 28.2 31.0 30.5 30.1 30.6 26.5
13 24.3 29.2 32.2 31.7 31.3 31.1 30.8 30.7
Mean 24.0 27.5 29.7 30.1 29.7 29.5 29.3 28.5
SD 1.1 1.2 1.3 1.6 1.6 1.6 1.4 1.6
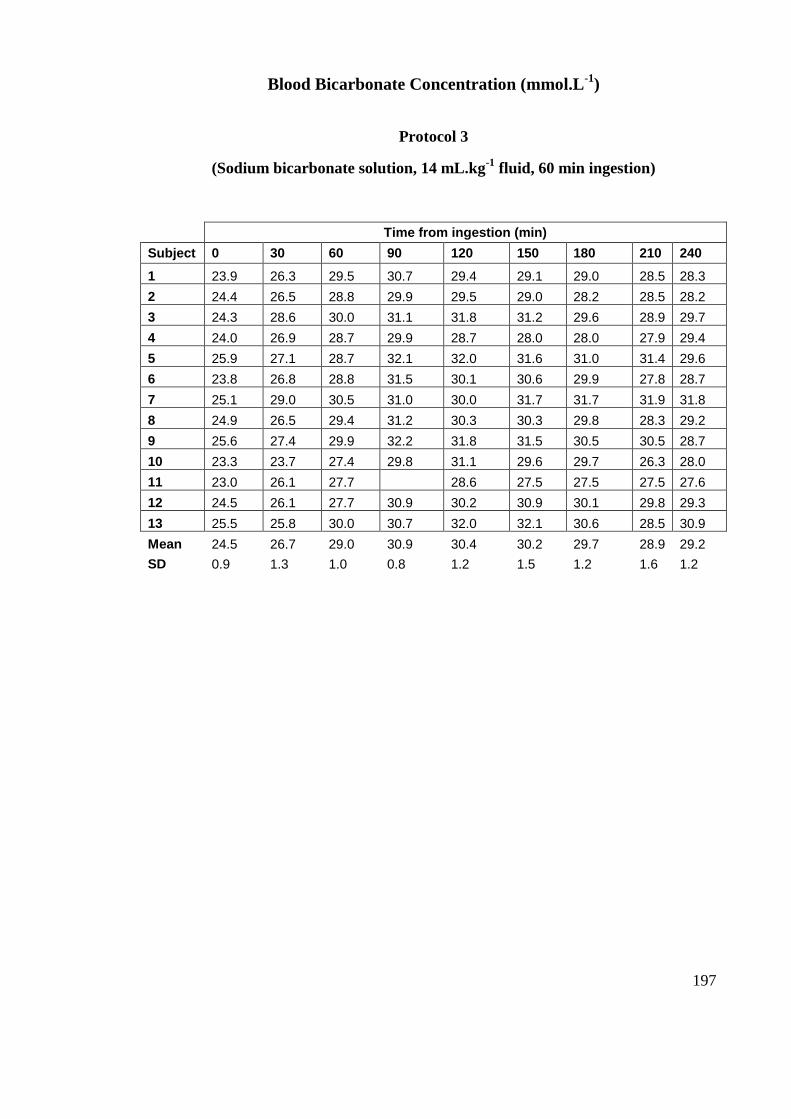
197
Blood Bicarbonate Concentration (mmol.L-1
)
Protocol 3
(Sodium bicarbonate solution, 14 mL.kg-1
fluid, 60 min ingestion)
Time from ingestion (min)
Subject 0 30 60 90 120 150 180 210 240
1 23.9 26.3 29.5 30.7 29.4 29.1 29.0 28.5 28.3
2 24.4 26.5 28.8 29.9 29.5 29.0 28.2 28.5 28.2
3 24.3 28.6 30.0 31.1 31.8 31.2 29.6 28.9 29.7
4 24.0 26.9 28.7 29.9 28.7 28.0 28.0 27.9 29.4
5 25.9 27.1 28.7 32.1 32.0 31.6 31.0 31.4 29.6
6 23.8 26.8 28.8 31.5 30.1 30.6 29.9 27.8 28.7
7 25.1 29.0 30.5 31.0 30.0 31.7 31.7 31.9 31.8
8 24.9 26.5 29.4 31.2 30.3 30.3 29.8 28.3 29.2
9 25.6 27.4 29.9 32.2 31.8 31.5 30.5 30.5 28.7
10 23.3 23.7 27.4 29.8 31.1 29.6 29.7 26.3 28.0
11 23.0 26.1 27.7 28.6 27.5 27.5 27.5 27.6
12 24.5 26.1 27.7 30.9 30.2 30.9 30.1 29.8 29.3
13 25.5 25.8 30.0 30.7 32.0 32.1 30.6 28.5 30.9
Mean 24.5 26.7 29.0 30.9 30.4 30.2 29.7 28.9 29.2
SD 0.9 1.3 1.0 0.8 1.2 1.5 1.2 1.6 1.2
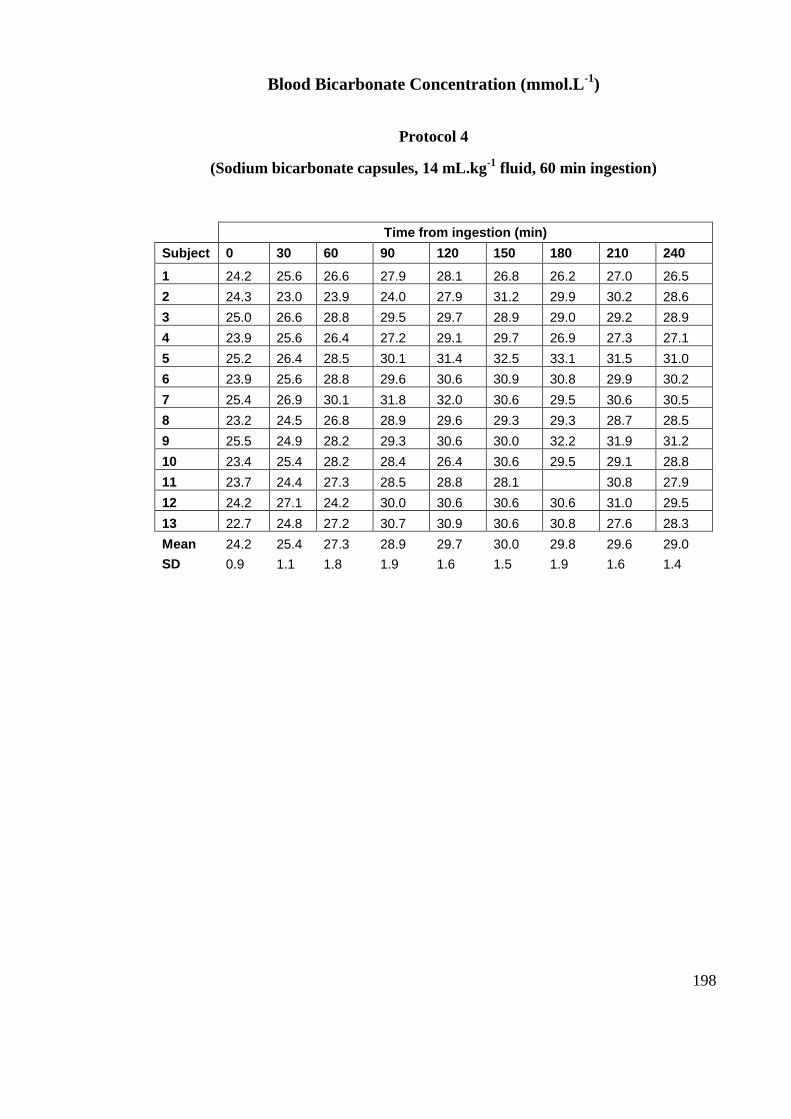
198
Blood Bicarbonate Concentration (mmol.L-1
)
Protocol 4
(Sodium bicarbonate capsules, 14 mL.kg-1
fluid, 60 min ingestion)
Time from ingestion (min)
Subject 0 30 60 90 120 150 180 210 240
1 24.2 25.6 26.6 27.9 28.1 26.8 26.2 27.0 26.5
2 24.3 23.0 23.9 24.0 27.9 31.2 29.9 30.2 28.6
3 25.0 26.6 28.8 29.5 29.7 28.9 29.0 29.2 28.9
4 23.9 25.6 26.4 27.2 29.1 29.7 26.9 27.3 27.1
5 25.2 26.4 28.5 30.1 31.4 32.5 33.1 31.5 31.0
6 23.9 25.6 28.8 29.6 30.6 30.9 30.8 29.9 30.2
7 25.4 26.9 30.1 31.8 32.0 30.6 29.5 30.6 30.5
8 23.2 24.5 26.8 28.9 29.6 29.3 29.3 28.7 28.5
9 25.5 24.9 28.2 29.3 30.6 30.0 32.2 31.9 31.2
10 23.4 25.4 28.2 28.4 26.4 30.6 29.5 29.1 28.8
11 23.7 24.4 27.3 28.5 28.8 28.1 30.8 27.9
12 24.2 27.1 24.2 30.0 30.6 30.6 30.6 31.0 29.5
13 22.7 24.8 27.2 30.7 30.9 30.6 30.8 27.6 28.3
Mean 24.2 25.4 27.3 28.9 29.7 30.0 29.8 29.6 29.0
SD 0.9 1.1 1.8 1.9 1.6 1.5 1.9 1.6 1.4
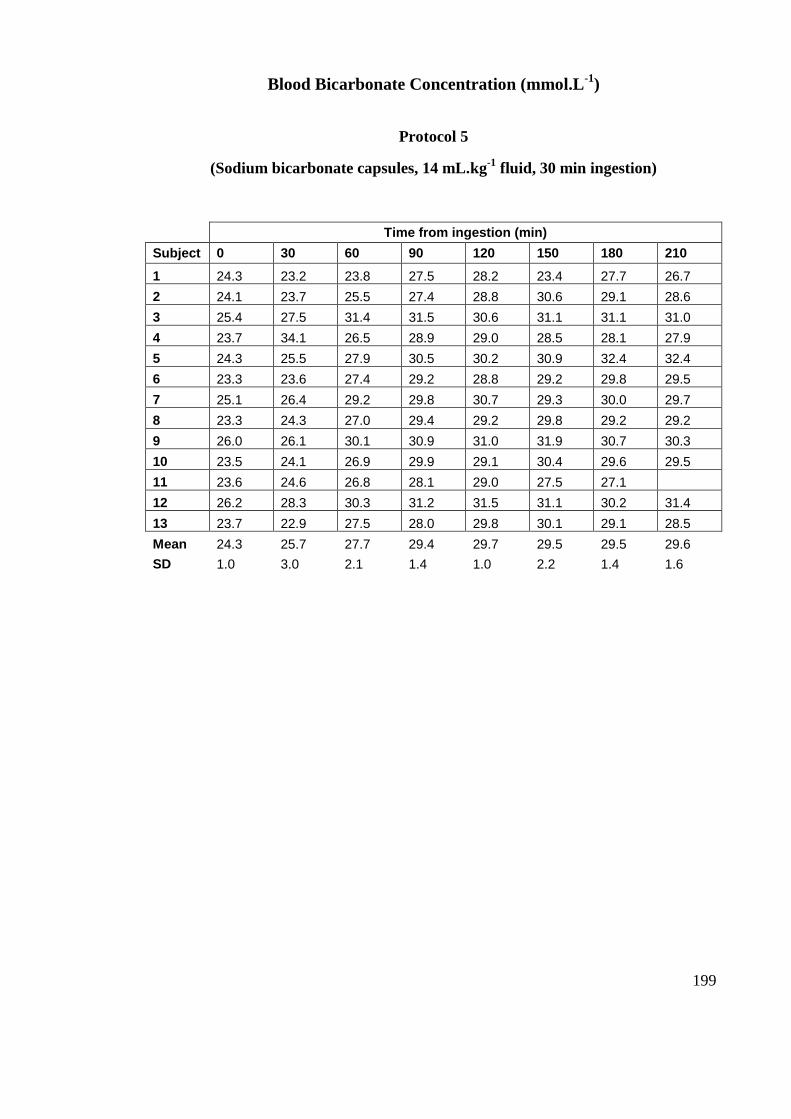
199
Blood Bicarbonate Concentration (mmol.L-1
)
Protocol 5
(Sodium bicarbonate capsules, 14 mL.kg-1
fluid, 30 min ingestion)
Time from ingestion (min)
Subject 0 30 60 90 120 150 180 210
1 24.3 23.2 23.8 27.5 28.2 23.4 27.7 26.7
2 24.1 23.7 25.5 27.4 28.8 30.6 29.1 28.6
3 25.4 27.5 31.4 31.5 30.6 31.1 31.1 31.0
4 23.7 34.1 26.5 28.9 29.0 28.5 28.1 27.9
5 24.3 25.5 27.9 30.5 30.2 30.9 32.4 32.4
6 23.3 23.6 27.4 29.2 28.8 29.2 29.8 29.5
7 25.1 26.4 29.2 29.8 30.7 29.3 30.0 29.7
8 23.3 24.3 27.0 29.4 29.2 29.8 29.2 29.2
9 26.0 26.1 30.1 30.9 31.0 31.9 30.7 30.3
10 23.5 24.1 26.9 29.9 29.1 30.4 29.6 29.5
11 23.6 24.6 26.8 28.1 29.0 27.5 27.1
12 26.2 28.3 30.3 31.2 31.5 31.1 30.2 31.4
13 23.7 22.9 27.5 28.0 29.8 30.1 29.1 28.5
Mean 24.3 25.7 27.7 29.4 29.7 29.5 29.5 29.6
SD 1.0 3.0 2.1 1.4 1.0 2.2 1.4 1.6
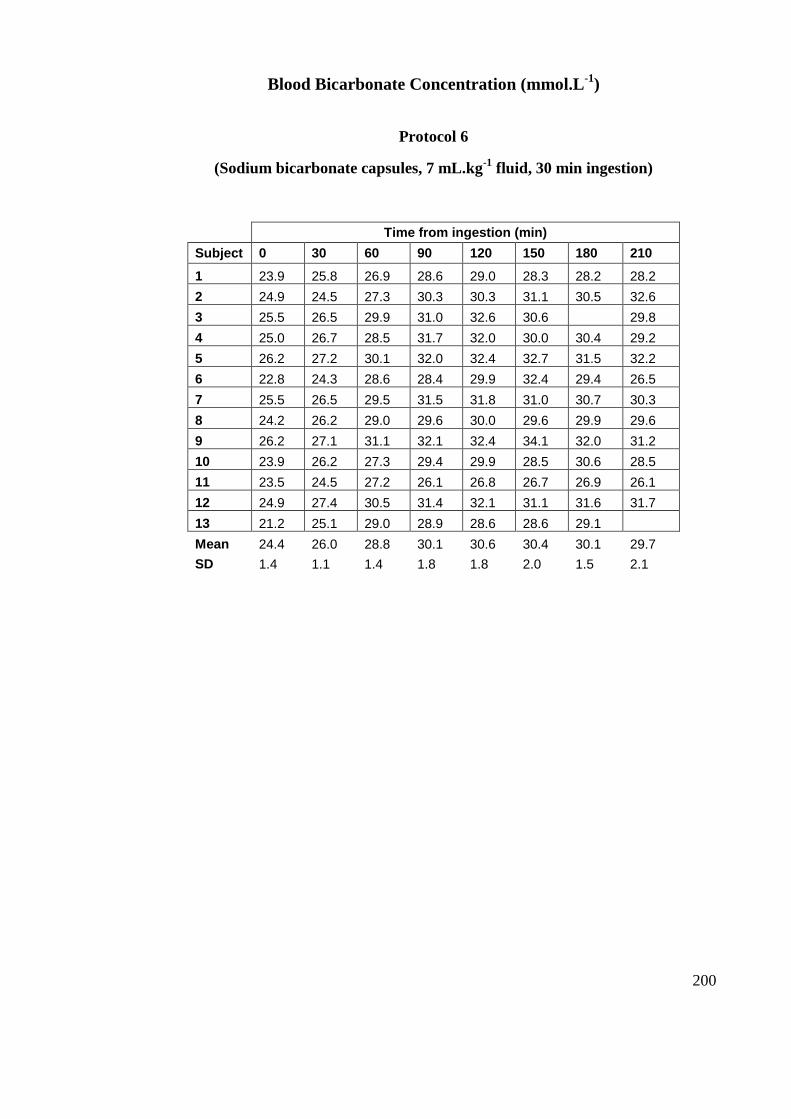
200
Blood Bicarbonate Concentration (mmol.L-1
)
Protocol 6
(Sodium bicarbonate capsules, 7 mL.kg-1
fluid, 30 min ingestion)
Time from ingestion (min)
Subject 0 30 60 90 120 150 180 210
1 23.9 25.8 26.9 28.6 29.0 28.3 28.2 28.2
2 24.9 24.5 27.3 30.3 30.3 31.1 30.5 32.6
3 25.5 26.5 29.9 31.0 32.6 30.6 29.8
4 25.0 26.7 28.5 31.7 32.0 30.0 30.4 29.2
5 26.2 27.2 30.1 32.0 32.4 32.7 31.5 32.2
6 22.8 24.3 28.6 28.4 29.9 32.4 29.4 26.5
7 25.5 26.5 29.5 31.5 31.8 31.0 30.7 30.3
8 24.2 26.2 29.0 29.6 30.0 29.6 29.9 29.6
9 26.2 27.1 31.1 32.1 32.4 34.1 32.0 31.2
10 23.9 26.2 27.3 29.4 29.9 28.5 30.6 28.5
11 23.5 24.5 27.2 26.1 26.8 26.7 26.9 26.1
12 24.9 27.4 30.5 31.4 32.1 31.1 31.6 31.7
13 21.2 25.1 29.0 28.9 28.6 28.6 29.1
Mean 24.4 26.0 28.8 30.1 30.6 30.4 30.1 29.7
SD 1.4 1.1 1.4 1.8 1.8 2.0 1.5 2.1
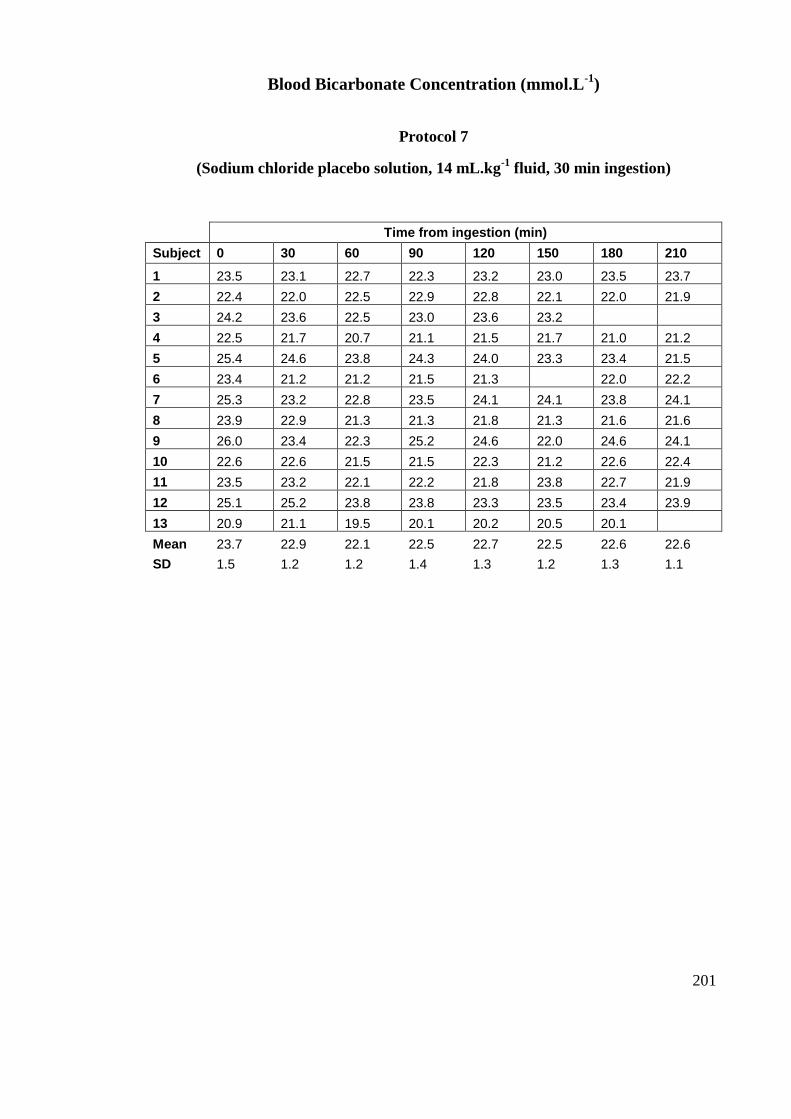
201
Blood Bicarbonate Concentration (mmol.L-1
)
Protocol 7
(Sodium chloride placebo solution, 14 mL.kg-1
fluid, 30 min ingestion)
Time from ingestion (min)
Subject 0 30 60 90 120 150 180 210
1 23.5 23.1 22.7 22.3 23.2 23.0 23.5 23.7
2 22.4 22.0 22.5 22.9 22.8 22.1 22.0 21.9
3 24.2 23.6 22.5 23.0 23.6 23.2
4 22.5 21.7 20.7 21.1 21.5 21.7 21.0 21.2
5 25.4 24.6 23.8 24.3 24.0 23.3 23.4 21.5
6 23.4 21.2 21.2 21.5 21.3 22.0 22.2
7 25.3 23.2 22.8 23.5 24.1 24.1 23.8 24.1
8 23.9 22.9 21.3 21.3 21.8 21.3 21.6 21.6
9 26.0 23.4 22.3 25.2 24.6 22.0 24.6 24.1
10 22.6 22.6 21.5 21.5 22.3 21.2 22.6 22.4
11 23.5 23.2 22.1 22.2 21.8 23.8 22.7 21.9
12 25.1 25.2 23.8 23.8 23.3 23.5 23.4 23.9
13 20.9 21.1 19.5 20.1 20.2 20.5 20.1
Mean 23.7 22.9 22.1 22.5 22.7 22.5 22.6 22.6
SD 1.5 1.2 1.2 1.4 1.3 1.2 1.3 1.1
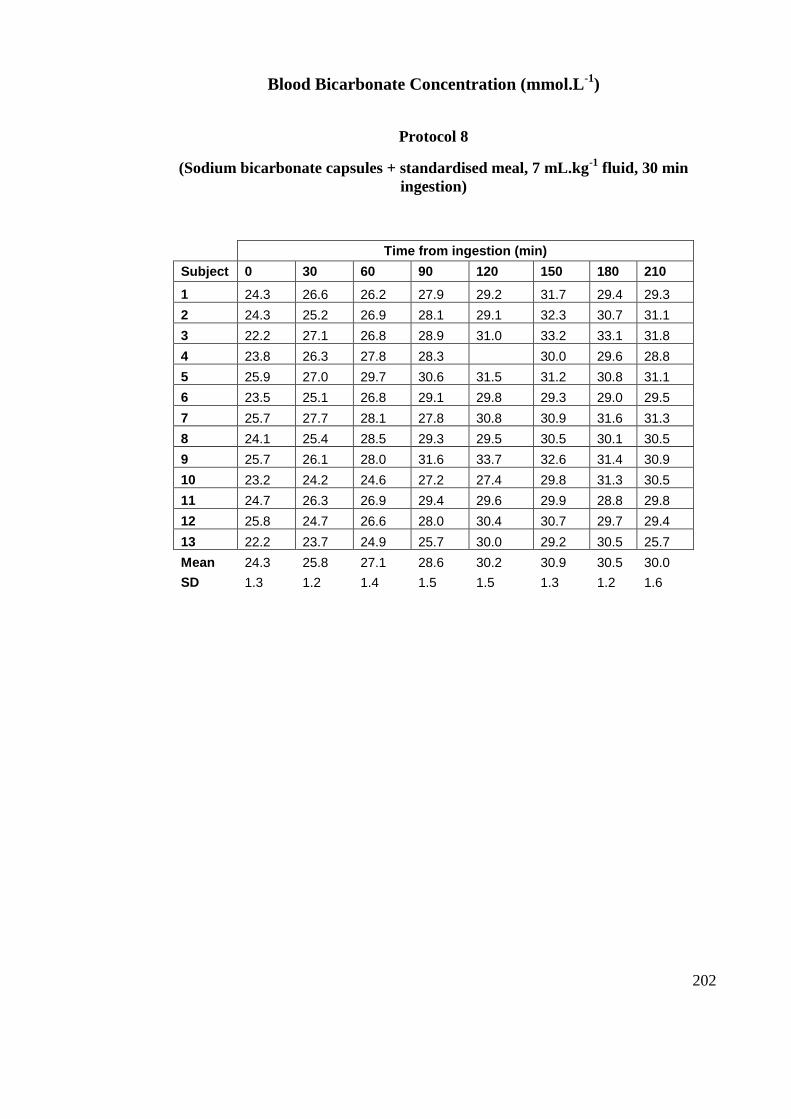
202
Blood Bicarbonate Concentration (mmol.L-1
)
Protocol 8
(Sodium bicarbonate capsules + standardised meal, 7 mL.kg-1
fluid, 30 min
ingestion)
Time from ingestion (min)
Subject 0 30 60 90 120 150 180 210
1 24.3 26.6 26.2 27.9 29.2 31.7 29.4 29.3
2 24.3 25.2 26.9 28.1 29.1 32.3 30.7 31.1
3 22.2 27.1 26.8 28.9 31.0 33.2 33.1 31.8
4 23.8 26.3 27.8 28.3 30.0 29.6 28.8
5 25.9 27.0 29.7 30.6 31.5 31.2 30.8 31.1
6 23.5 25.1 26.8 29.1 29.8 29.3 29.0 29.5
7 25.7 27.7 28.1 27.8 30.8 30.9 31.6 31.3
8 24.1 25.4 28.5 29.3 29.5 30.5 30.1 30.5
9 25.7 26.1 28.0 31.6 33.7 32.6 31.4 30.9
10 23.2 24.2 24.6 27.2 27.4 29.8 31.3 30.5
11 24.7 26.3 26.9 29.4 29.6 29.9 28.8 29.8
12 25.8 24.7 26.6 28.0 30.4 30.7 29.7 29.4
13 22.2 23.7 24.9 25.7 30.0 29.2 30.5 25.7
Mean 24.3 25.8 27.1 28.6 30.2 30.9 30.5 30.0
SD 1.3 1.2 1.4 1.5 1.5 1.3 1.2 1.6
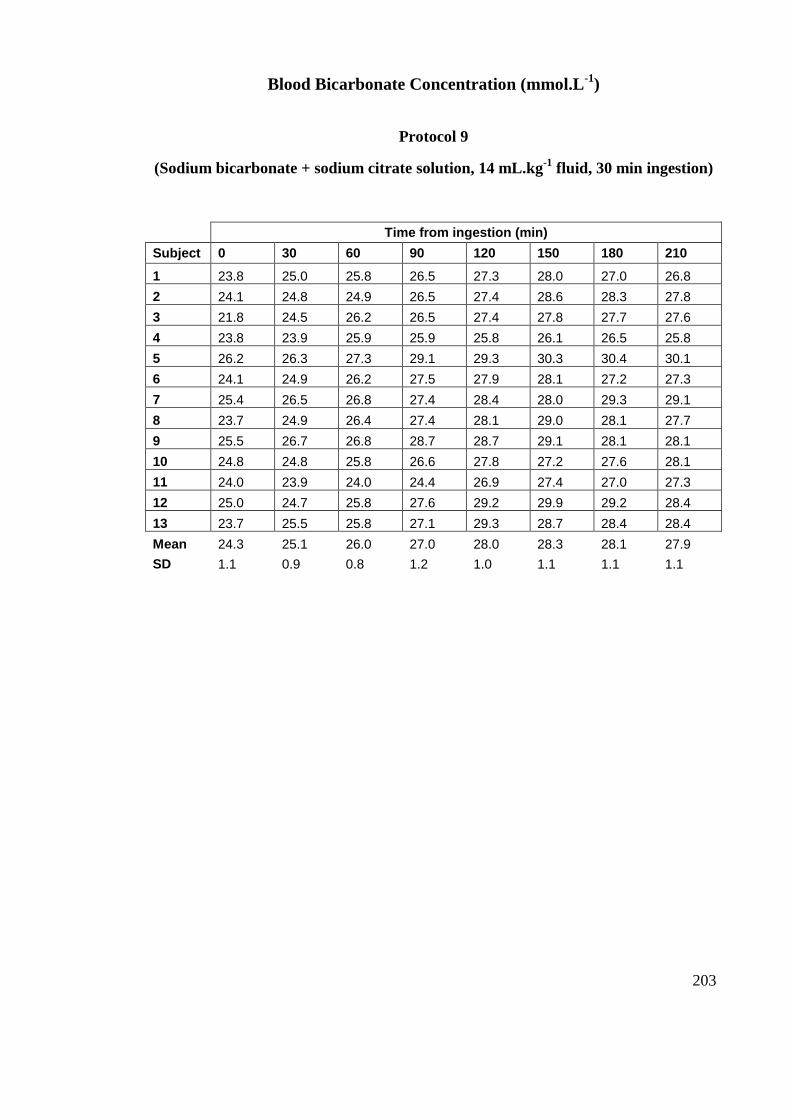
203
Blood Bicarbonate Concentration (mmol.L-1
)
Protocol 9
(Sodium bicarbonate + sodium citrate solution, 14 mL.kg-1
fluid, 30 min ingestion)
Time from ingestion (min)
Subject 0 30 60 90 120 150 180 210
1 23.8 25.0 25.8 26.5 27.3 28.0 27.0 26.8
2 24.1 24.8 24.9 26.5 27.4 28.6 28.3 27.8
3 21.8 24.5 26.2 26.5 27.4 27.8 27.7 27.6
4 23.8 23.9 25.9 25.9 25.8 26.1 26.5 25.8
5 26.2 26.3 27.3 29.1 29.3 30.3 30.4 30.1
6 24.1 24.9 26.2 27.5 27.9 28.1 27.2 27.3
7 25.4 26.5 26.8 27.4 28.4 28.0 29.3 29.1
8 23.7 24.9 26.4 27.4 28.1 29.0 28.1 27.7
9 25.5 26.7 26.8 28.7 28.7 29.1 28.1 28.1
10 24.8 24.8 25.8 26.6 27.8 27.2 27.6 28.1
11 24.0 23.9 24.0 24.4 26.9 27.4 27.0 27.3
12 25.0 24.7 25.8 27.6 29.2 29.9 29.2 28.4
13 23.7 25.5 25.8 27.1 29.3 28.7 28.4 28.4
Mean 24.3 25.1 26.0 27.0 28.0 28.3 28.1 27.9
SD 1.1 0.9 0.8 1.2 1.0 1.1 1.1 1.1
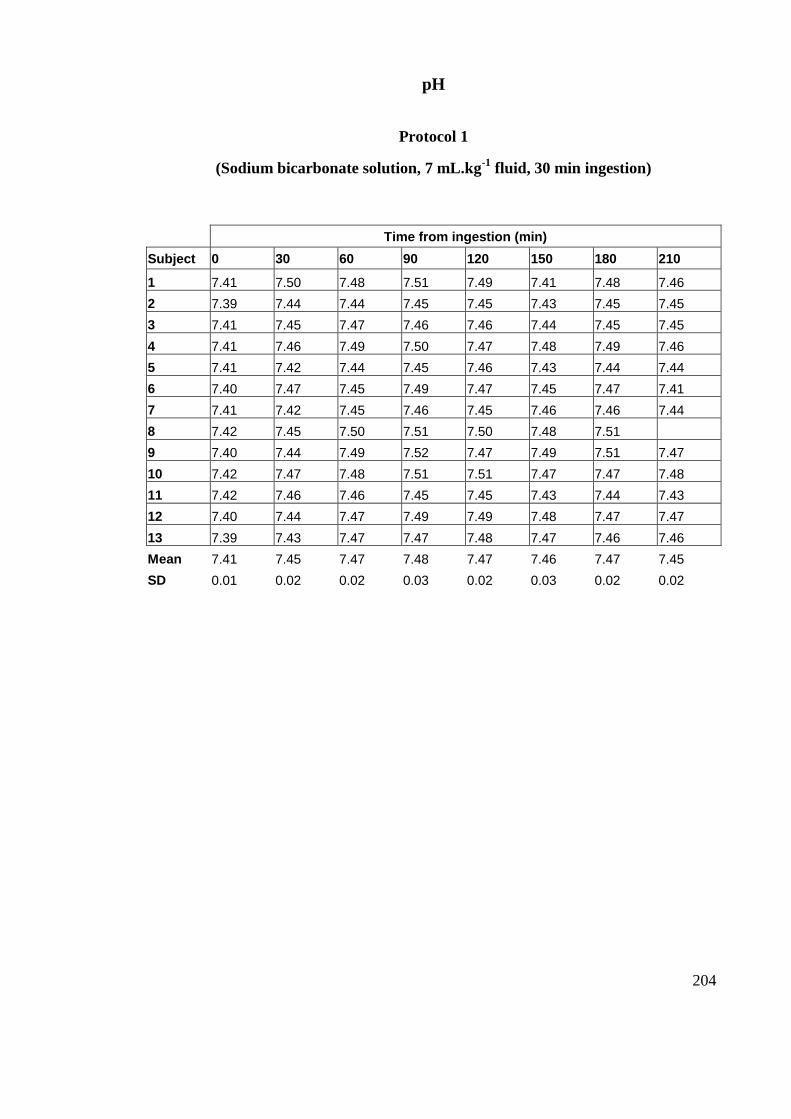
204
pH
Protocol 1
(Sodium bicarbonate solution, 7 mL.kg-1
fluid, 30 min ingestion)
Time from ingestion (min)
Subject 0 30 60 90 120 150 180 210
1 7.41 7.50 7.48 7.51 7.49 7.41 7.48 7.46
2 7.39 7.44 7.44 7.45 7.45 7.43 7.45 7.45
3 7.41 7.45 7.47 7.46 7.46 7.44 7.45 7.45
4 7.41 7.46 7.49 7.50 7.47 7.48 7.49 7.46
5 7.41 7.42 7.44 7.45 7.46 7.43 7.44 7.44
6 7.40 7.47 7.45 7.49 7.47 7.45 7.47 7.41
7 7.41 7.42 7.45 7.46 7.45 7.46 7.46 7.44
8 7.42 7.45 7.50 7.51 7.50 7.48 7.51
9 7.40 7.44 7.49 7.52 7.47 7.49 7.51 7.47
10 7.42 7.47 7.48 7.51 7.51 7.47 7.47 7.48
11 7.42 7.46 7.46 7.45 7.45 7.43 7.44 7.43
12 7.40 7.44 7.47 7.49 7.49 7.48 7.47 7.47
13 7.39 7.43 7.47 7.47 7.48 7.47 7.46 7.46
Mean 7.41 7.45 7.47 7.48 7.47 7.46 7.47 7.45
SD 0.01 0.02 0.02 0.03 0.02 0.03 0.02 0.02

205
pH
Protocol 2
(Sodium bicarbonate solution, 14 mL.kg-1
fluid, 30 min ingestion)
Time from ingestion (min)
Subject 0 30 60 90 120 150 180 210
1 7.42 7.42 7.49 7.45 7.49 7.51 7.48 7.45
2 7.42 7.43 7.46 7.50 7.48 7.48 7.46 7.46
3 7.39 7.44 7.48 7.48 7.46 7.46 7.46 7.52
4 7.40 7.45 7.47 7.47 7.48 7.46 7.47 7.46
5 7.37 7.41 7.43 7.47 7.45 7.45 7.46 7.44
6 7.42 7.47 7.50 7.48 7.48 7.49 7.48 7.45
7 7.42 7.47 7.48 7.47 7.47 7.47 7.47 7.45
8 7.44 7.47 7.51 7.50 7.49 7.54 7.48 7.49
9 7.43 7.47 7.51 7.54 7.57 7.53 7.52 7.48
10 7.43 7.46 7.50 7.50 7.48 7.48 7.48 7.46
11 7.41 7.43 7.45 7.45 7.47 7.43 7.45 7.42
12 7.40 7.41 7.43 7.47 7.46 7.42 7.46 7.41
13 7.41 7.46 7.50 7.48 7.49 7.48 7.48 7.50
Mean 7.41 7.45 7.48 7.48 7.48 7.48 7.47 7.46
SD 0.02 0.02 0.03 0.02 0.03 0.04 0.02 0.03
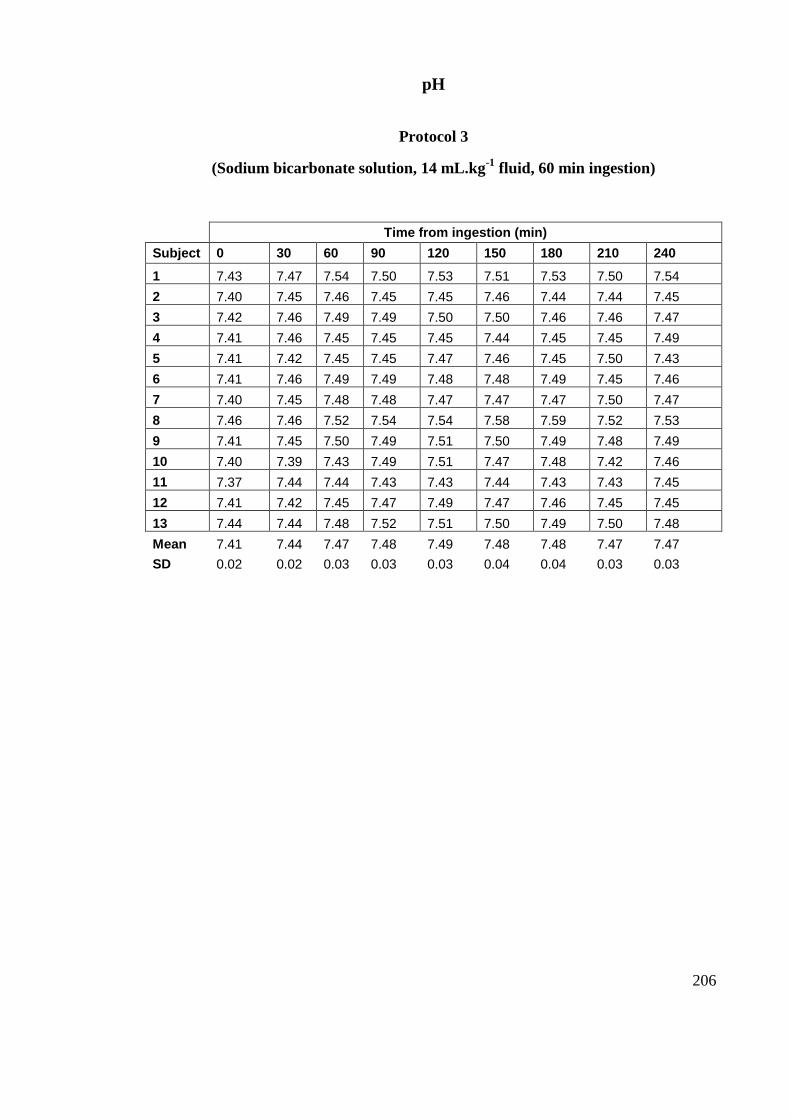
206
pH
Protocol 3
(Sodium bicarbonate solution, 14 mL.kg-1
fluid, 60 min ingestion)
Time from ingestion (min)
Subject 0 30 60 90 120 150 180 210 240
1 7.43 7.47 7.54 7.50 7.53 7.51 7.53 7.50 7.54
2 7.40 7.45 7.46 7.45 7.45 7.46 7.44 7.44 7.45
3 7.42 7.46 7.49 7.49 7.50 7.50 7.46 7.46 7.47
4 7.41 7.46 7.45 7.45 7.45 7.44 7.45 7.45 7.49
5 7.41 7.42 7.45 7.45 7.47 7.46 7.45 7.50 7.43
6 7.41 7.46 7.49 7.49 7.48 7.48 7.49 7.45 7.46
7 7.40 7.45 7.48 7.48 7.47 7.47 7.47 7.50 7.47
8 7.46 7.46 7.52 7.54 7.54 7.58 7.59 7.52 7.53
9 7.41 7.45 7.50 7.49 7.51 7.50 7.49 7.48 7.49
10 7.40 7.39 7.43 7.49 7.51 7.47 7.48 7.42 7.46
11 7.37 7.44 7.44 7.43 7.43 7.44 7.43 7.43 7.45
12 7.41 7.42 7.45 7.47 7.49 7.47 7.46 7.45 7.45
13 7.44 7.44 7.48 7.52 7.51 7.50 7.49 7.50 7.48
Mean 7.41 7.44 7.47 7.48 7.49 7.48 7.48 7.47 7.47
SD 0.02 0.02 0.03 0.03 0.03 0.04 0.04 0.03 0.03
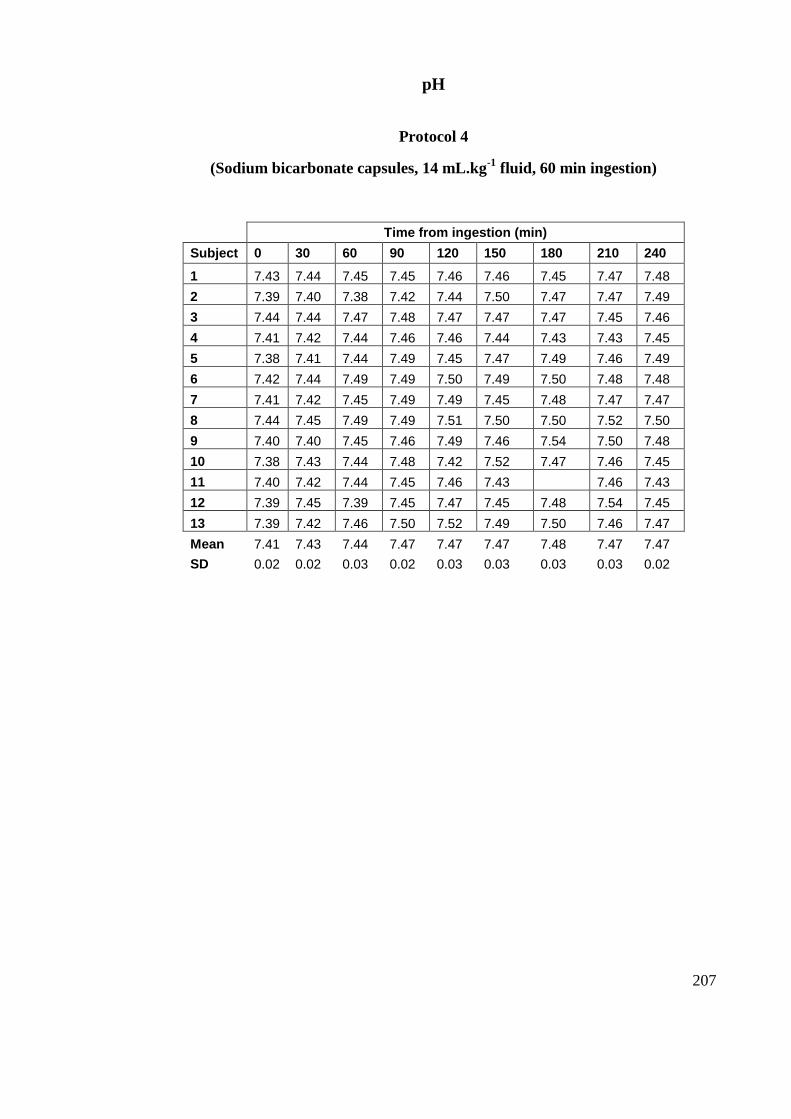
207
pH
Protocol 4
(Sodium bicarbonate capsules, 14 mL.kg-1
fluid, 60 min ingestion)
Time from ingestion (min)
Subject 0 30 60 90 120 150 180 210 240
1 7.43 7.44 7.45 7.45 7.46 7.46 7.45 7.47 7.48
2 7.39 7.40 7.38 7.42 7.44 7.50 7.47 7.47 7.49
3 7.44 7.44 7.47 7.48 7.47 7.47 7.47 7.45 7.46
4 7.41 7.42 7.44 7.46 7.46 7.44 7.43 7.43 7.45
5 7.38 7.41 7.44 7.49 7.45 7.47 7.49 7.46 7.49
6 7.42 7.44 7.49 7.49 7.50 7.49 7.50 7.48 7.48
7 7.41 7.42 7.45 7.49 7.49 7.45 7.48 7.47 7.47
8 7.44 7.45 7.49 7.49 7.51 7.50 7.50 7.52 7.50
9 7.40 7.40 7.45 7.46 7.49 7.46 7.54 7.50 7.48
10 7.38 7.43 7.44 7.48 7.42 7.52 7.47 7.46 7.45
11 7.40 7.42 7.44 7.45 7.46 7.43 7.46 7.43
12 7.39 7.45 7.39 7.45 7.47 7.45 7.48 7.54 7.45
13 7.39 7.42 7.46 7.50 7.52 7.49 7.50 7.46 7.47
Mean 7.41 7.43 7.44 7.47 7.47 7.47 7.48 7.47 7.47
SD 0.02 0.02 0.03 0.02 0.03 0.03 0.03 0.03 0.02
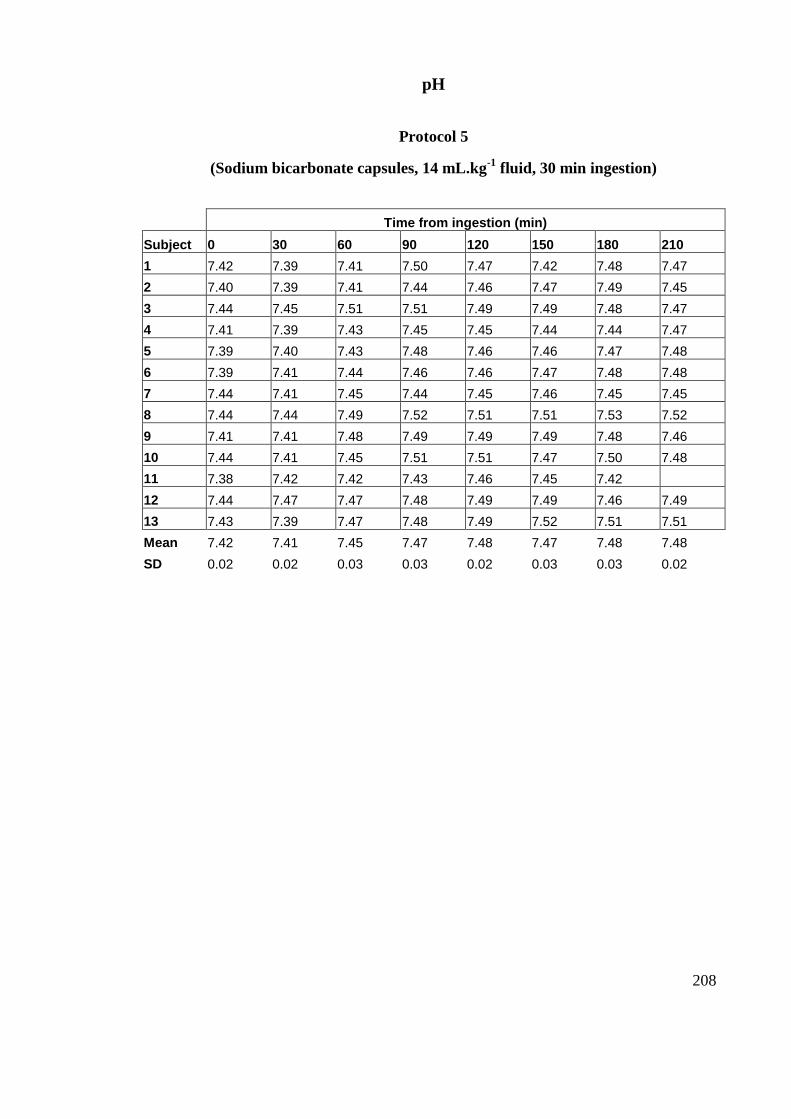
208
pH
Protocol 5
(Sodium bicarbonate capsules, 14 mL.kg-1
fluid, 30 min ingestion)
Time from ingestion (min)
Subject 0 30 60 90 120 150 180 210
1 7.42 7.39 7.41 7.50 7.47 7.42 7.48 7.47
2 7.40 7.39 7.41 7.44 7.46 7.47 7.49 7.45
3 7.44 7.45 7.51 7.51 7.49 7.49 7.48 7.47
4 7.41 7.39 7.43 7.45 7.45 7.44 7.44 7.47
5 7.39 7.40 7.43 7.48 7.46 7.46 7.47 7.48
6 7.39 7.41 7.44 7.46 7.46 7.47 7.48 7.48
7 7.44 7.41 7.45 7.44 7.45 7.46 7.45 7.45
8 7.44 7.44 7.49 7.52 7.51 7.51 7.53 7.52
9 7.41 7.41 7.48 7.49 7.49 7.49 7.48 7.46
10 7.44 7.41 7.45 7.51 7.51 7.47 7.50 7.48
11 7.38 7.42 7.42 7.43 7.46 7.45 7.42
12 7.44 7.47 7.47 7.48 7.49 7.49 7.46 7.49
13 7.43 7.39 7.47 7.48 7.49 7.52 7.51 7.51
Mean 7.42 7.41 7.45 7.47 7.48 7.47 7.48 7.48
SD 0.02 0.02 0.03 0.03 0.02 0.03 0.03 0.02
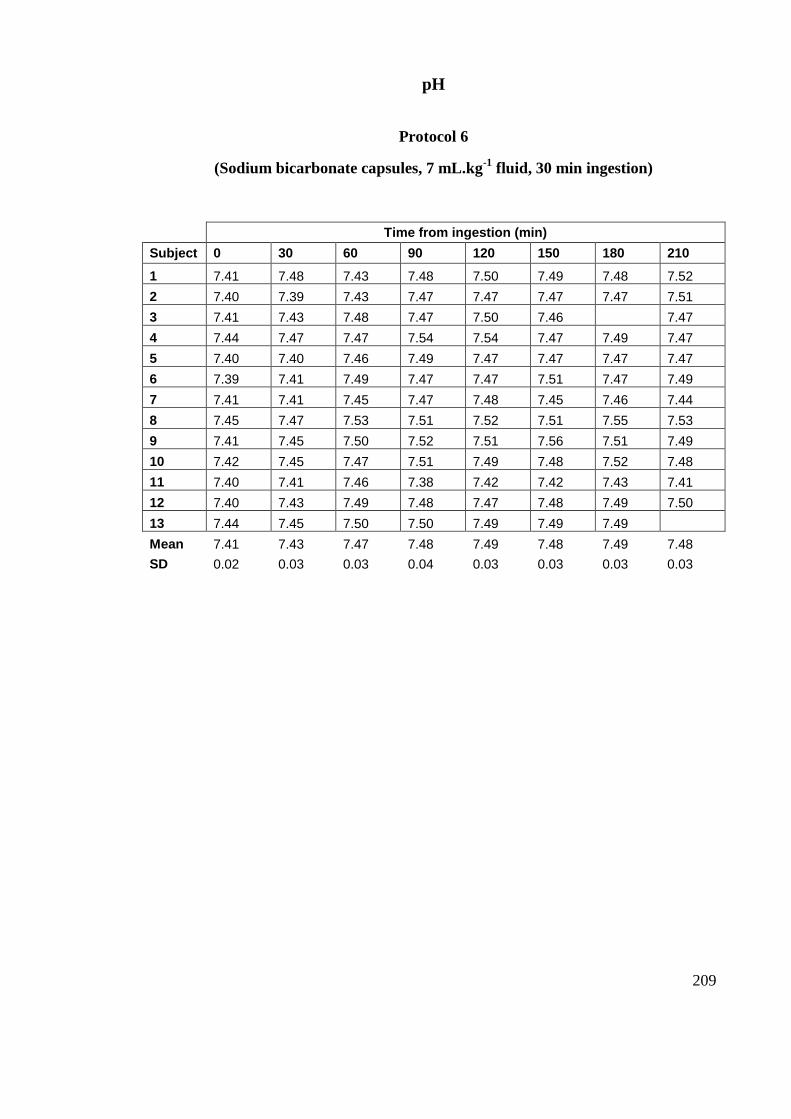
209
pH
Protocol 6
(Sodium bicarbonate capsules, 7 mL.kg-1
fluid, 30 min ingestion)
Time from ingestion (min)
Subject 0 30 60 90 120 150 180 210
1 7.41 7.48 7.43 7.48 7.50 7.49 7.48 7.52
2 7.40 7.39 7.43 7.47 7.47 7.47 7.47 7.51
3 7.41 7.43 7.48 7.47 7.50 7.46 7.47
4 7.44 7.47 7.47 7.54 7.54 7.47 7.49 7.47
5 7.40 7.40 7.46 7.49 7.47 7.47 7.47 7.47
6 7.39 7.41 7.49 7.47 7.47 7.51 7.47 7.49
7 7.41 7.41 7.45 7.47 7.48 7.45 7.46 7.44
8 7.45 7.47 7.53 7.51 7.52 7.51 7.55 7.53
9 7.41 7.45 7.50 7.52 7.51 7.56 7.51 7.49
10 7.42 7.45 7.47 7.51 7.49 7.48 7.52 7.48
11 7.40 7.41 7.46 7.38 7.42 7.42 7.43 7.41
12 7.40 7.43 7.49 7.48 7.47 7.48 7.49 7.50
13 7.44 7.45 7.50 7.50 7.49 7.49 7.49
Mean 7.41 7.43 7.47 7.48 7.49 7.48 7.49 7.48
SD 0.02 0.03 0.03 0.04 0.03 0.03 0.03 0.03
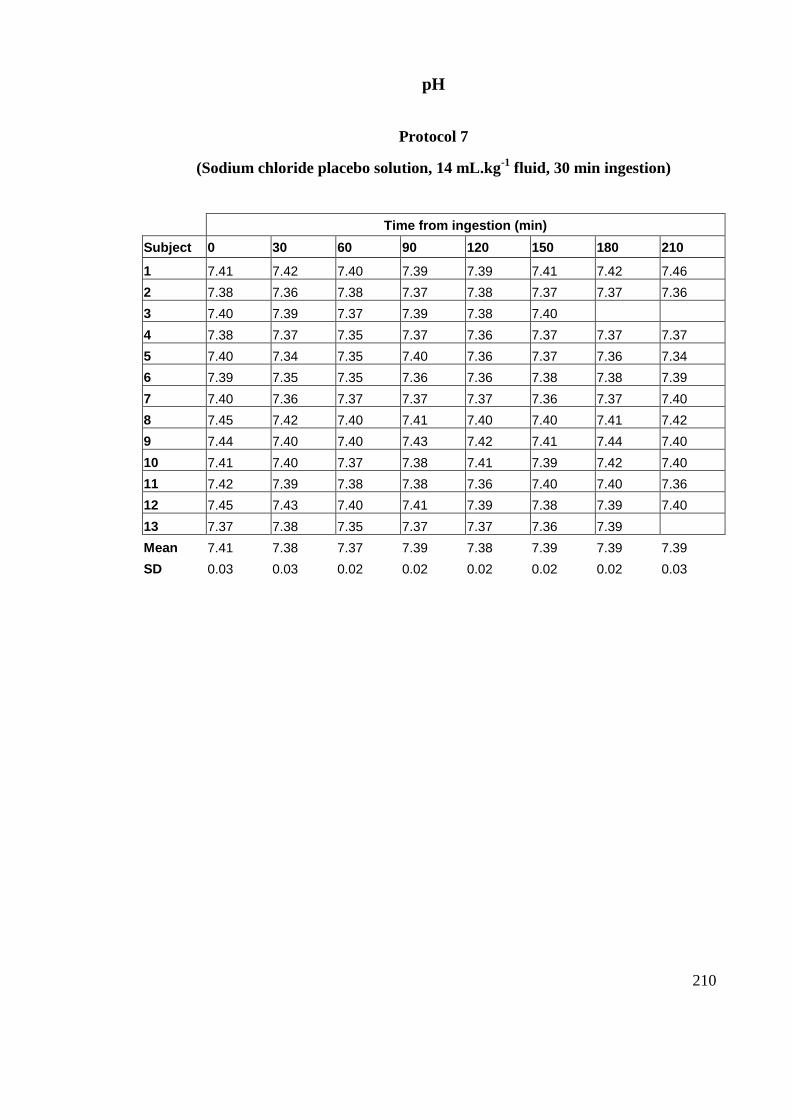
210
pH
Protocol 7
(Sodium chloride placebo solution, 14 mL.kg-1
fluid, 30 min ingestion)
Time from ingestion (min)
Subject 0 30 60 90 120 150 180 210
1 7.41 7.42 7.40 7.39 7.39 7.41 7.42 7.46
2 7.38 7.36 7.38 7.37 7.38 7.37 7.37 7.36
3 7.40 7.39 7.37 7.39 7.38 7.40
4 7.38 7.37 7.35 7.37 7.36 7.37 7.37 7.37
5 7.40 7.34 7.35 7.40 7.36 7.37 7.36 7.34
6 7.39 7.35 7.35 7.36 7.36 7.38 7.38 7.39
7 7.40 7.36 7.37 7.37 7.37 7.36 7.37 7.40
8 7.45 7.42 7.40 7.41 7.40 7.40 7.41 7.42
9 7.44 7.40 7.40 7.43 7.42 7.41 7.44 7.40
10 7.41 7.40 7.37 7.38 7.41 7.39 7.42 7.40
11 7.42 7.39 7.38 7.38 7.36 7.40 7.40 7.36
12 7.45 7.43 7.40 7.41 7.39 7.38 7.39 7.40
13 7.37 7.38 7.35 7.37 7.37 7.36 7.39
Mean 7.41 7.38 7.37 7.39 7.38 7.39 7.39 7.39
SD 0.03 0.03 0.02 0.02 0.02 0.02 0.02 0.03
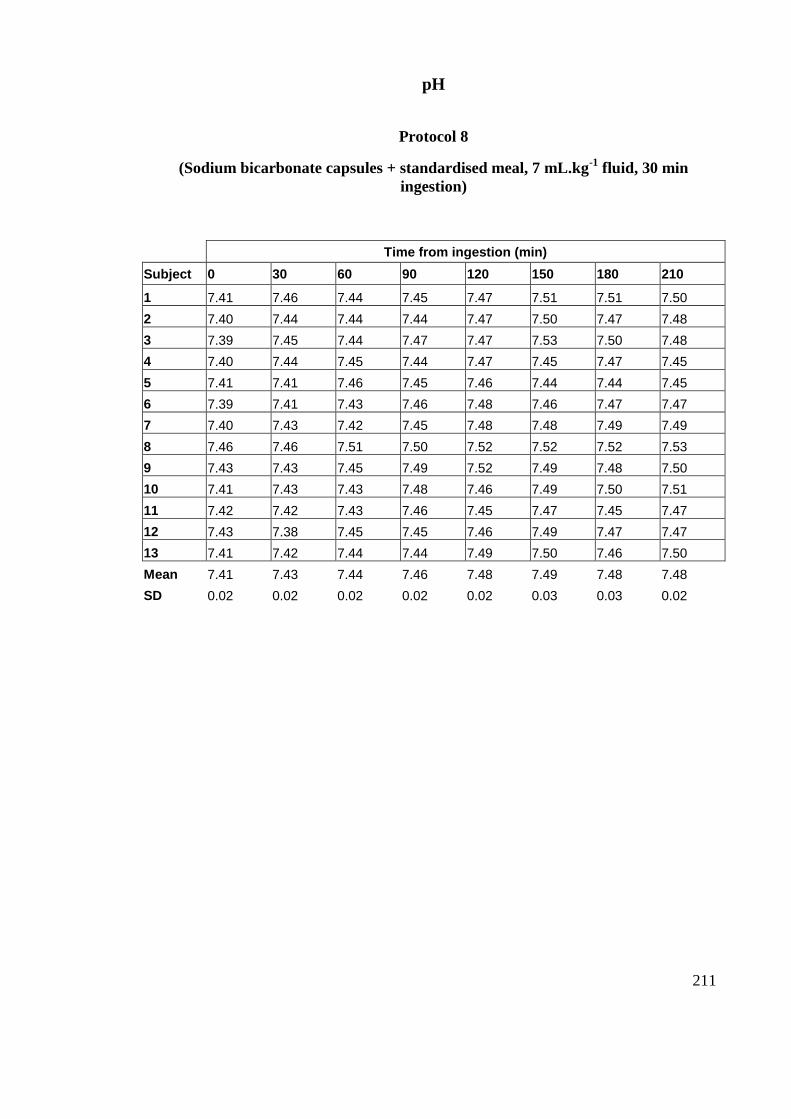
211
pH
Protocol 8
(Sodium bicarbonate capsules + standardised meal, 7 mL.kg-1
fluid, 30 min
ingestion)
Time from ingestion (min)
Subject 0 30 60 90 120 150 180 210
1 7.41 7.46 7.44 7.45 7.47 7.51 7.51 7.50
2 7.40 7.44 7.44 7.44 7.47 7.50 7.47 7.48
3 7.39 7.45 7.44 7.47 7.47 7.53 7.50 7.48
4 7.40 7.44 7.45 7.44 7.47 7.45 7.47 7.45
5 7.41 7.41 7.46 7.45 7.46 7.44 7.44 7.45
6 7.39 7.41 7.43 7.46 7.48 7.46 7.47 7.47
7 7.40 7.43 7.42 7.45 7.48 7.48 7.49 7.49
8 7.46 7.46 7.51 7.50 7.52 7.52 7.52 7.53
9 7.43 7.43 7.45 7.49 7.52 7.49 7.48 7.50
10 7.41 7.43 7.43 7.48 7.46 7.49 7.50 7.51
11 7.42 7.42 7.43 7.46 7.45 7.47 7.45 7.47
12 7.43 7.38 7.45 7.45 7.46 7.49 7.47 7.47
13 7.41 7.42 7.44 7.44 7.49 7.50 7.46 7.50
Mean 7.41 7.43 7.44 7.46 7.48 7.49 7.48 7.48
SD 0.02 0.02 0.02 0.02 0.02 0.03 0.03 0.02
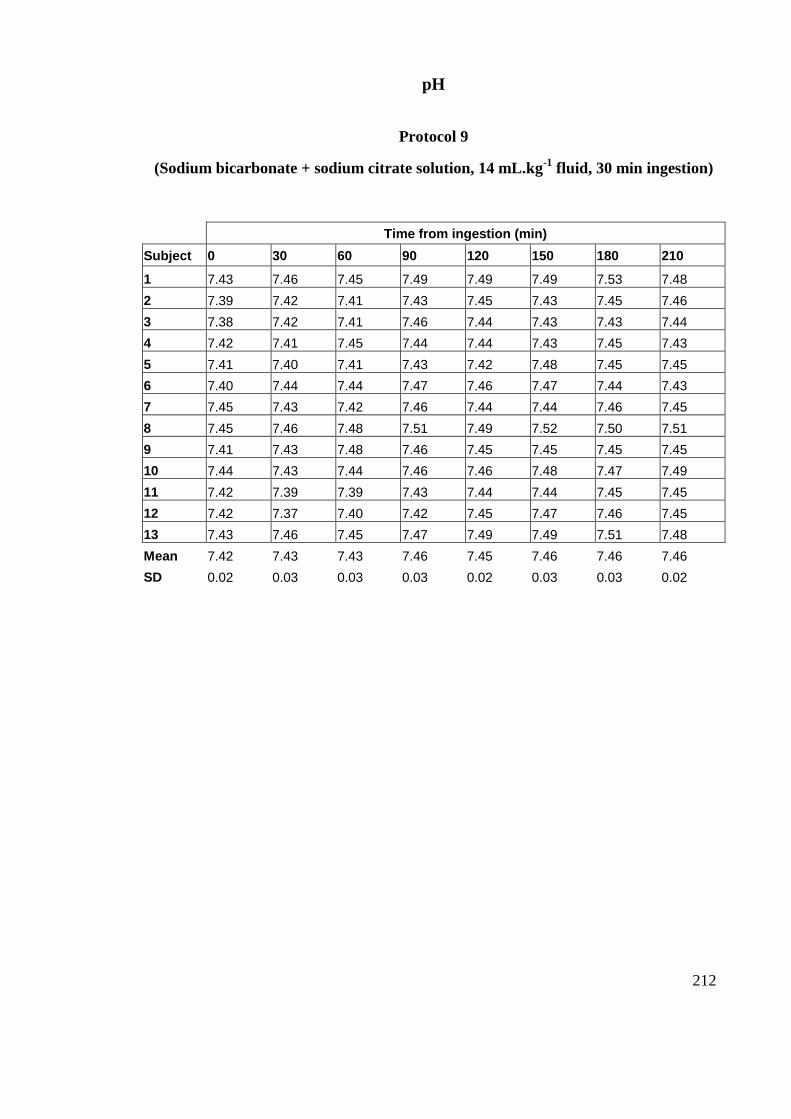
212
pH
Protocol 9
(Sodium bicarbonate + sodium citrate solution, 14 mL.kg-1
fluid, 30 min ingestion)
Time from ingestion (min)
Subject 0 30 60 90 120 150 180 210
1 7.43 7.46 7.45 7.49 7.49 7.49 7.53 7.48
2 7.39 7.42 7.41 7.43 7.45 7.43 7.45 7.46
3 7.38 7.42 7.41 7.46 7.44 7.43 7.43 7.44
4 7.42 7.41 7.45 7.44 7.44 7.43 7.45 7.43
5 7.41 7.40 7.41 7.43 7.42 7.48 7.45 7.45
6 7.40 7.44 7.44 7.47 7.46 7.47 7.44 7.43
7 7.45 7.43 7.42 7.46 7.44 7.44 7.46 7.45
8 7.45 7.46 7.48 7.51 7.49 7.52 7.50 7.51
9 7.41 7.43 7.48 7.46 7.45 7.45 7.45 7.45
10 7.44 7.43 7.44 7.46 7.46 7.48 7.47 7.49
11 7.42 7.39 7.39 7.43 7.44 7.44 7.45 7.45
12 7.42 7.37 7.40 7.42 7.45 7.47 7.46 7.45
13 7.43 7.46 7.45 7.47 7.49 7.49 7.51 7.48
Mean 7.42 7.43 7.43 7.46 7.45 7.46 7.46 7.46
SD 0.02 0.03 0.03 0.03 0.02 0.03 0.03 0.02

213
Gastrointestinal symptoms (rating)
Protocol 1
(Sodium bicarbonate solution, 7 mL.kg-1
fluid, 30 min ingestion)
Time from ingestion (min)
Subject 0 30 60 90 120 150 180 210
1 16 16 23 48 16 19 16 16
2 16 16 18 32 16 16 16 16
3
4 16 18 23 20 16 16 16 17
5 16 19 16 16 16 24 22 16
6 16 20 36 29 16 18 16 16
7 16 16 30 27 27 23 19 18
8 16 18 21 33 27 27 17
9 16 16 28 25 37 23 16 16
10 16 21 21 25 22 37 27 21
11 16 16 16 19 18 18 16 16
12 16 16 16 16 17 16 16 16
13
Mean 16 17 23 26 21 22 18 17
SD 0 2 6 9 7 6 4 2

214
Gastrointestinal symptoms (rating)
Protocol 2
(Sodium bicarbonate solution, 14 mL.kg-1
fluid, 30 min ingestion)
Time from ingestion (min)
Subject 0 30 60 90 120 150 180 210
1 16 16 26 21 16 16 16 16
2 16 19 16 16 16 19 19 16
3 16 18 20 16 16 16 16 16
4 16 18 23 25 18 16 16 16
5 16 19 22 25 19 24 25 25
6 17 19 21 41 21 17 16 16
7 18 19 27 25 18 16 16 16
8 16 16 18 18 18 18 18
9 16 16 16 16 39 19 22 16
10 16 18 21 28 26 21 16 16
11
12 16 16 16 16 16 16 16 16
13 23 36 41 36 29 24 26 33
Mean 17 19 22 24 21 19 19 18
SD 2 5 7 8 7 3 4 6
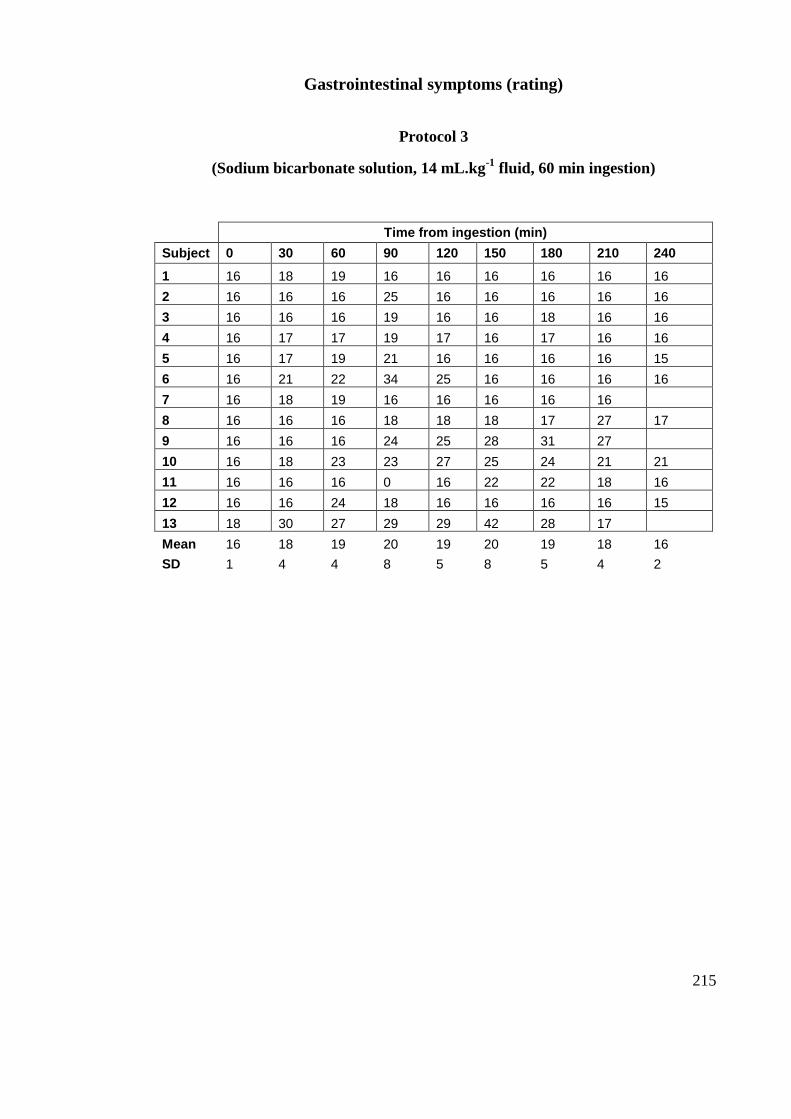
215
Gastrointestinal symptoms (rating)
Protocol 3
(Sodium bicarbonate solution, 14 mL.kg-1
fluid, 60 min ingestion)
Time from ingestion (min)
Subject 0 30 60 90 120 150 180 210 240
1 16 18 19 16 16 16 16 16 16
2 16 16 16 25 16 16 16 16 16
3 16 16 16 19 16 16 18 16 16
4 16 17 17 19 17 16 17 16 16
5 16 17 19 21 16 16 16 16 15
6 16 21 22 34 25 16 16 16 16
7 16 18 19 16 16 16 16 16
8 16 16 16 18 18 18 17 27 17
9 16 16 16 24 25 28 31 27
10 16 18 23 23 27 25 24 21 21
11 16 16 16 0 16 22 22 18 16
12 16 16 24 18 16 16 16 16 15
13 18 30 27 29 29 42 28 17
Mean 16 18 19 20 19 20 19 18 16
SD 1 4 4 8 5 8 5 4 2
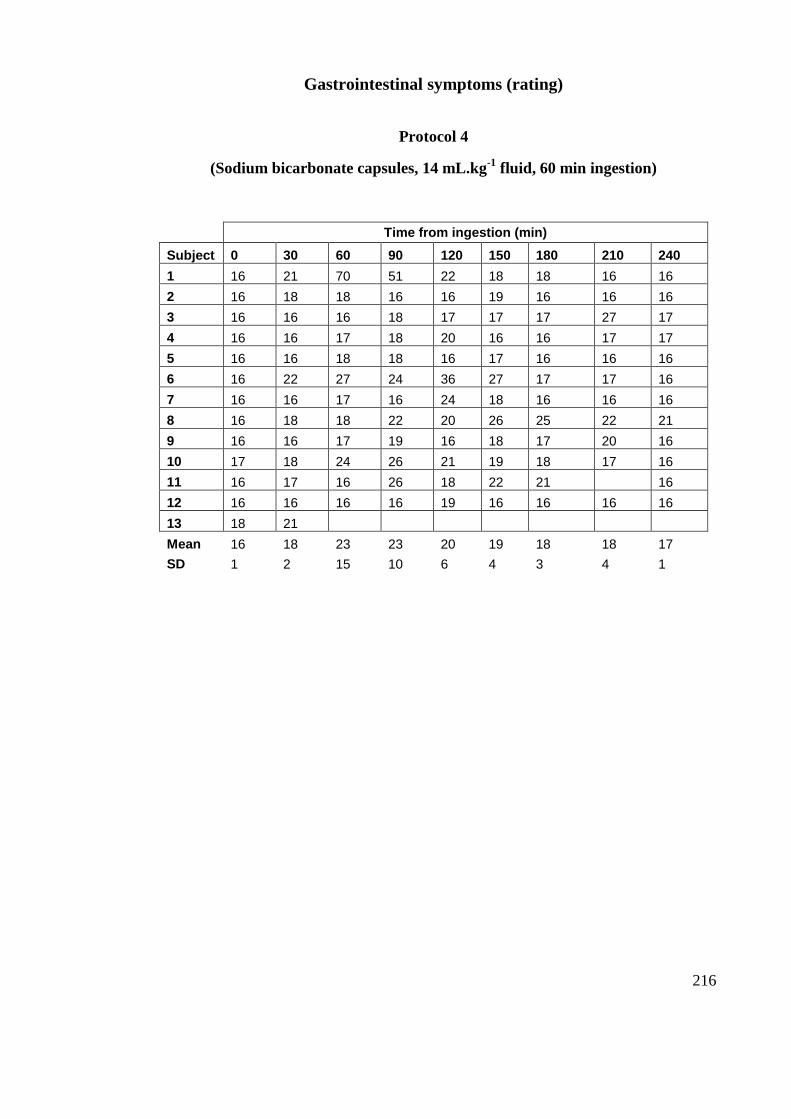
216
Gastrointestinal symptoms (rating)
Protocol 4
(Sodium bicarbonate capsules, 14 mL.kg-1
fluid, 60 min ingestion)
Time from ingestion (min)
Subject 0 30 60 90 120 150 180 210 240
1 16 21 70 51 22 18 18 16 16
2 16 18 18 16 16 19 16 16 16
3 16 16 16 18 17 17 17 27 17
4 16 16 17 18 20 16 16 17 17
5 16 16 18 18 16 17 16 16 16
6 16 22 27 24 36 27 17 17 16
7 16 16 17 16 24 18 16 16 16
8 16 18 18 22 20 26 25 22 21
9 16 16 17 19 16 18 17 20 16
10 17 18 24 26 21 19 18 17 16
11 16 17 16 26 18 22 21 16
12 16 16 16 16 19 16 16 16 16
13 18 21
Mean 16 18 23 23 20 19 18 18 17
SD 1 2 15 10 6 4 3 4 1
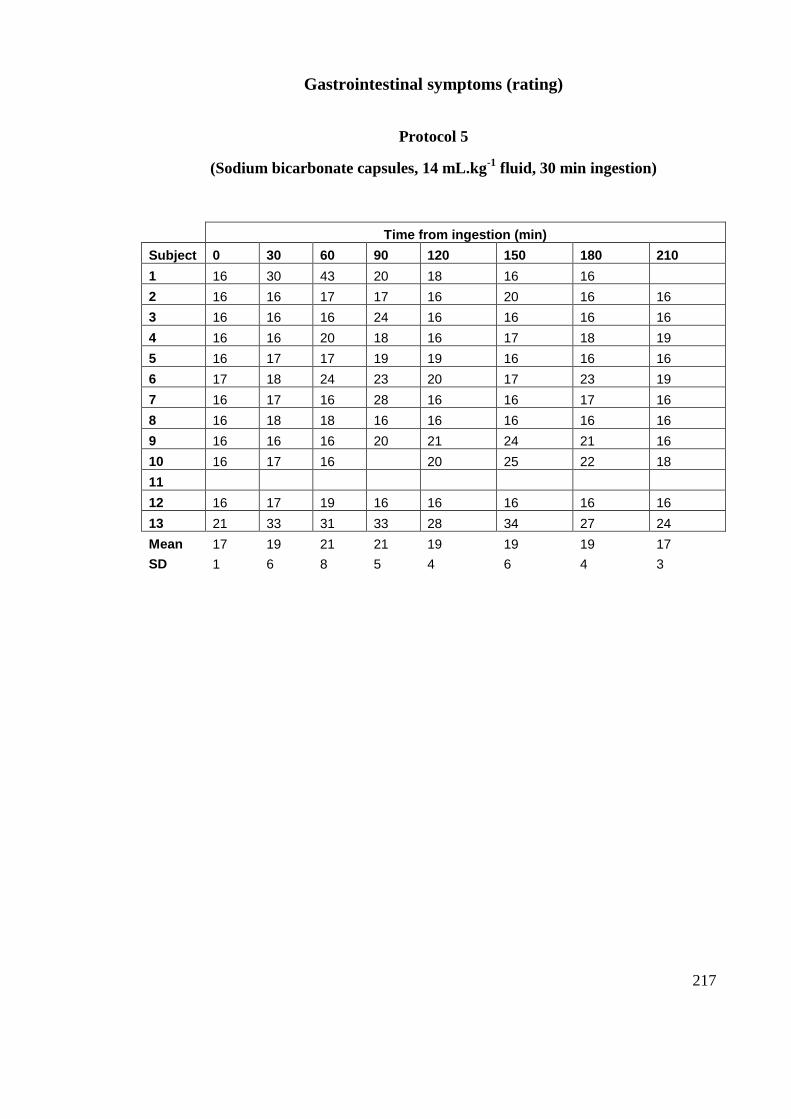
217
Gastrointestinal symptoms (rating)
Protocol 5
(Sodium bicarbonate capsules, 14 mL.kg-1
fluid, 30 min ingestion)
Time from ingestion (min)
Subject 0 30 60 90 120 150 180 210
1 16 30 43 20 18 16 16
2 16 16 17 17 16 20 16 16
3 16 16 16 24 16 16 16 16
4 16 16 20 18 16 17 18 19
5 16 17 17 19 19 16 16 16
6 17 18 24 23 20 17 23 19
7 16 17 16 28 16 16 17 16
8 16 18 18 16 16 16 16 16
9 16 16 16 20 21 24 21 16
10 16 17 16 20 25 22 18
11
12 16 17 19 16 16 16 16 16
13 21 33 31 33 28 34 27 24
Mean 17 19 21 21 19 19 19 17
SD 1 6 8 5 4 6 4 3
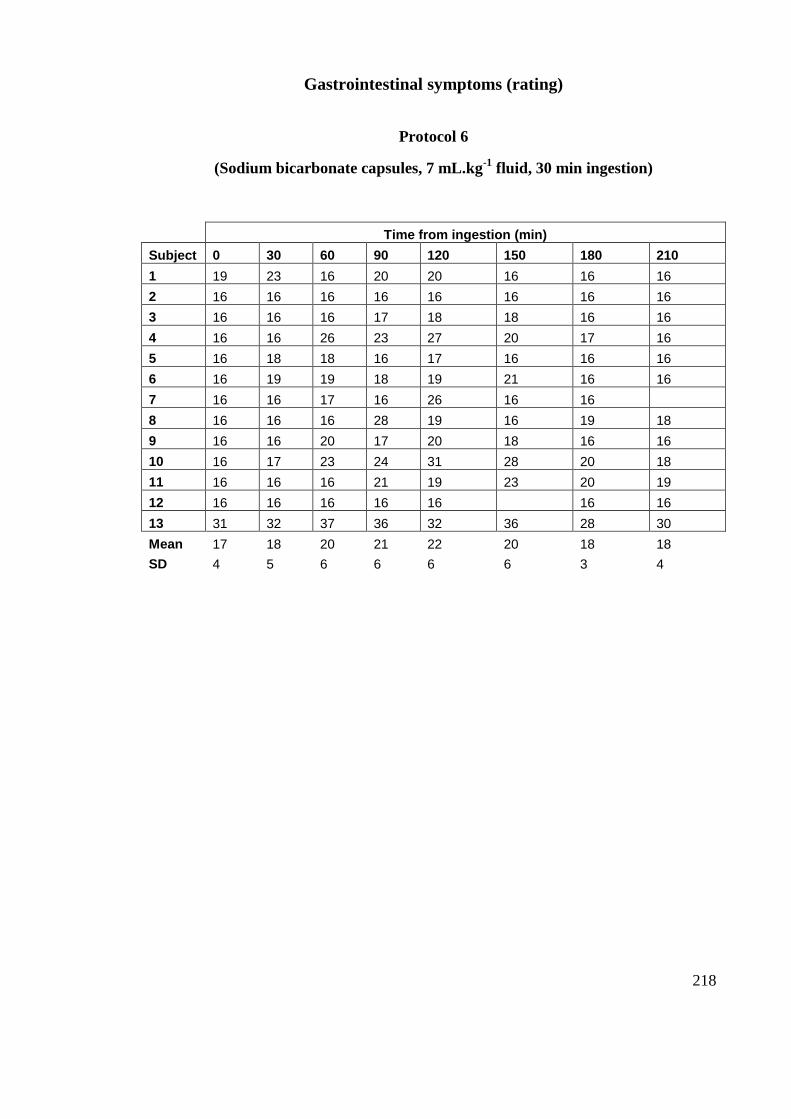
218
Gastrointestinal symptoms (rating)
Protocol 6
(Sodium bicarbonate capsules, 7 mL.kg-1
fluid, 30 min ingestion)
Time from ingestion (min)
Subject 0 30 60 90 120 150 180 210
1 19 23 16 20 20 16 16 16
2 16 16 16 16 16 16 16 16
3 16 16 16 17 18 18 16 16
4 16 16 26 23 27 20 17 16
5 16 18 18 16 17 16 16 16
6 16 19 19 18 19 21 16 16
7 16 16 17 16 26 16 16
8 16 16 16 28 19 16 19 18
9 16 16 20 17 20 18 16 16
10 16 17 23 24 31 28 20 18
11 16 16 16 21 19 23 20 19
12 16 16 16 16 16 16 16
13 31 32 37 36 32 36 28 30
Mean 17 18 20 21 22 20 18 18
SD 4 5 6 6 6 6 3 4
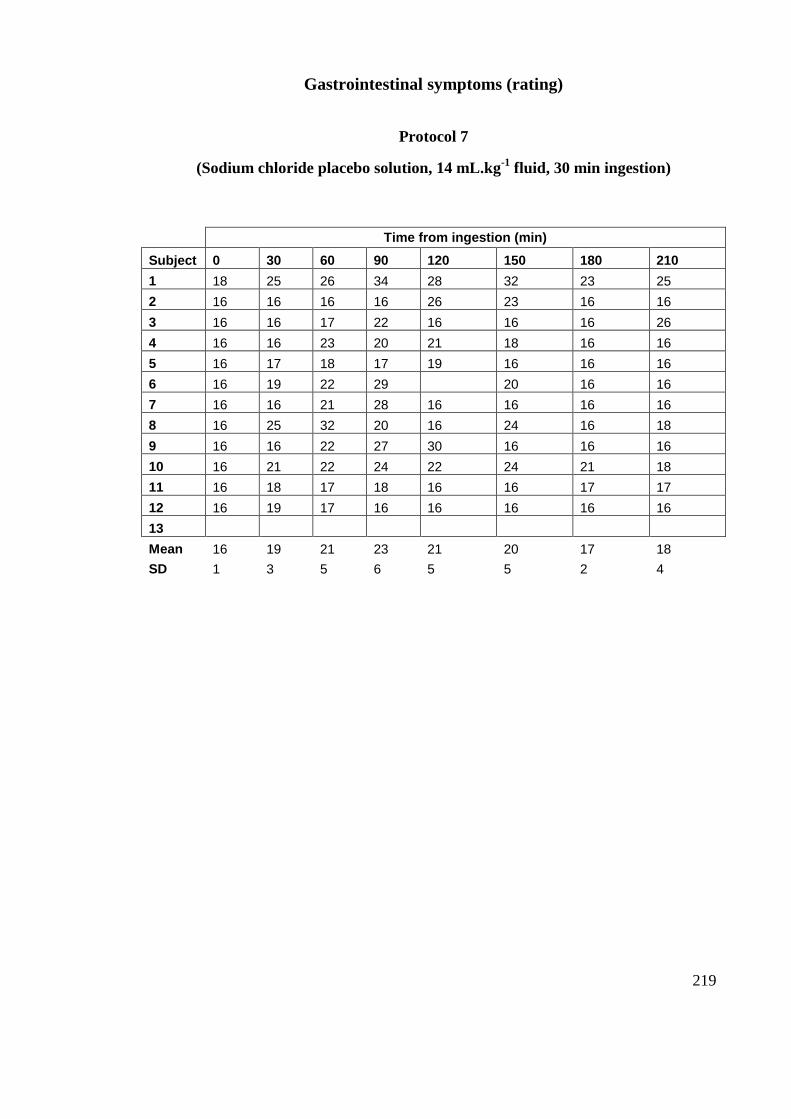
219
Gastrointestinal symptoms (rating)
Protocol 7
(Sodium chloride placebo solution, 14 mL.kg-1
fluid, 30 min ingestion)
Time from ingestion (min)
Subject 0 30 60 90 120 150 180 210
1 18 25 26 34 28 32 23 25
2 16 16 16 16 26 23 16 16
3 16 16 17 22 16 16 16 26
4 16 16 23 20 21 18 16 16
5 16 17 18 17 19 16 16 16
6 16 19 22 29 20 16 16
7 16 16 21 28 16 16 16 16
8 16 25 32 20 16 24 16 18
9 16 16 22 27 30 16 16 16
10 16 21 22 24 22 24 21 18
11 16 18 17 18 16 16 17 17
12 16 19 17 16 16 16 16 16
13
Mean 16 19 21 23 21 20 17 18
SD 1 3 5 6 5 5 2 4
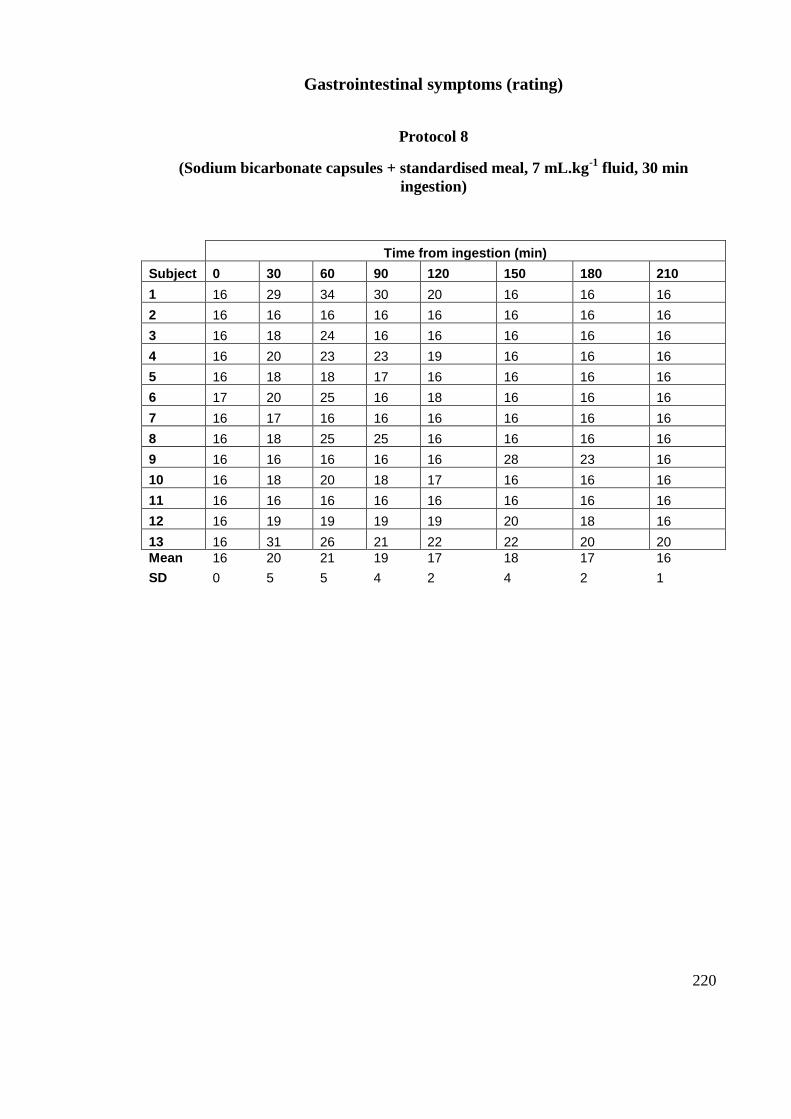
220
Gastrointestinal symptoms (rating)
Protocol 8
(Sodium bicarbonate capsules + standardised meal, 7 mL.kg-1
fluid, 30 min
ingestion)
Time from ingestion (min)
Subject 0 30 60 90 120 150 180 210
1 16 29 34 30 20 16 16 16
2 16 16 16 16 16 16 16 16
3 16 18 24 16 16 16 16 16
4 16 20 23 23 19 16 16 16
5 16 18 18 17 16 16 16 16
6 17 20 25 16 18 16 16 16
7 16 17 16 16 16 16 16 16
8 16 18 25 25 16 16 16 16
9 16 16 16 16 16 28 23 16
10 16 18 20 18 17 16 16 16
11 16 16 16 16 16 16 16 16
12 16 19 19 19 19 20 18 16
13 16 31 26 21 22 22 20 20
Mean 16 20 21 19 17 18 17 16
SD 0 5 5 4 2 4 2 1
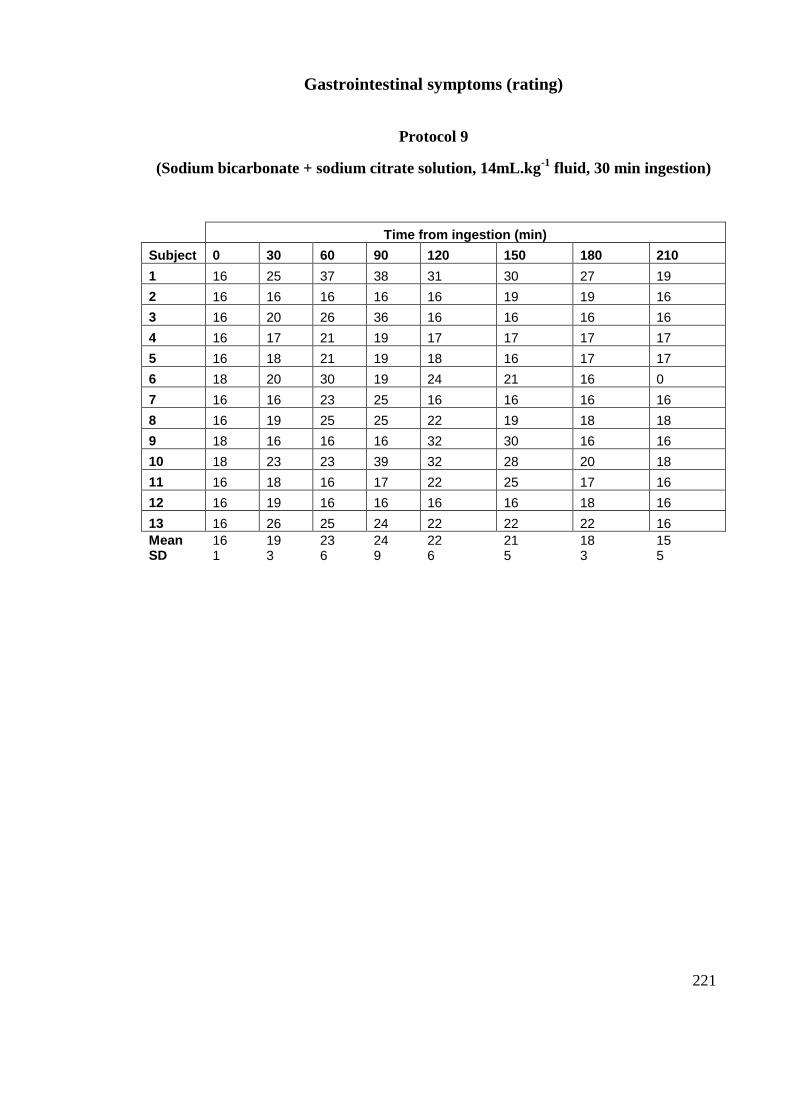
221
Gastrointestinal symptoms (rating)
Protocol 9
(Sodium bicarbonate + sodium citrate solution, 14mL.kg-1
fluid, 30 min ingestion)
Time from ingestion (min)
Subject 0 30 60 90 120 150 180 210
1 16 25 37 38 31 30 27 19
2 16 16 16 16 16 19 19 16
3 16 20 26 36 16 16 16 16
4 16 17 21 19 17 17 17 17
5 16 18 21 19 18 16 17 17
6 18 20 30 19 24 21 16 0
7 16 16 23 25 16 16 16 16
8 16 19 25 25 22 19 18 18
9 18 16 16 16 32 30 16 16
10 18 23 23 39 32 28 20 18
11 16 18 16 17 22 25 17 16
12 16 19 16 16 16 16 18 16
13 16 26 25 24 22 22 22 16
Mean 16 19 23 24 22 21 18 15 SD 1 3 6 9 6 5 3 5
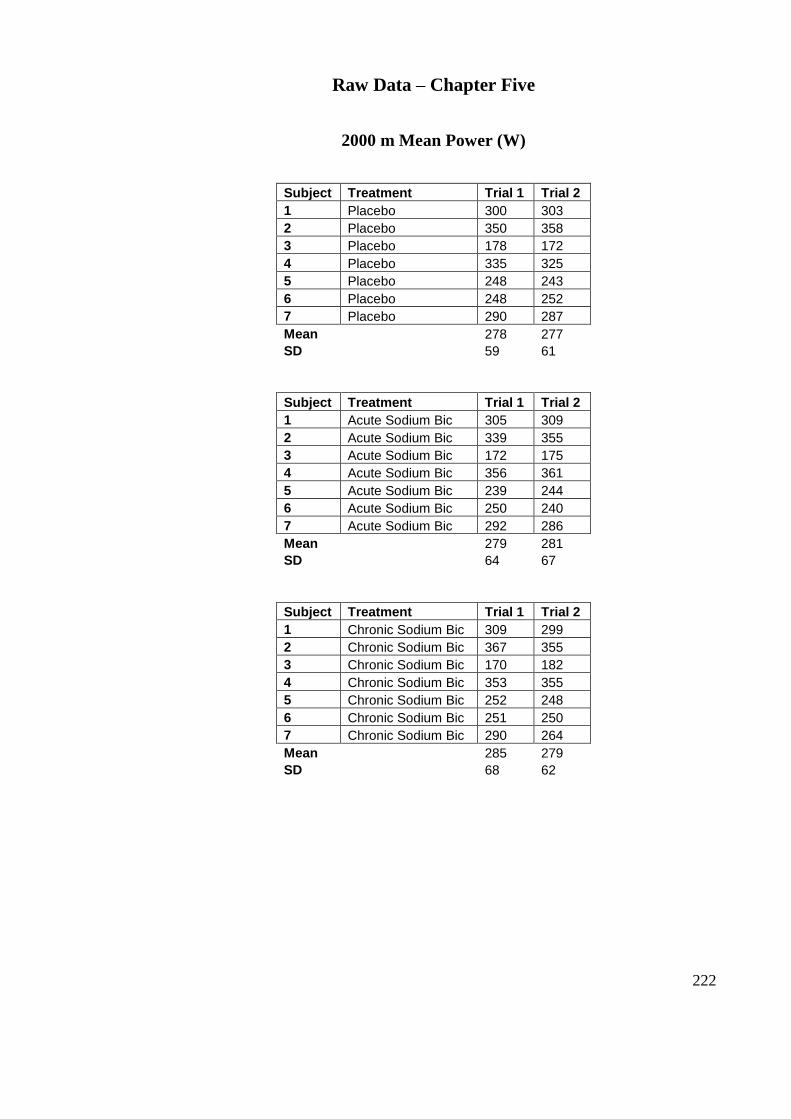
222
Raw Data – Chapter Five
2000 m Mean Power (W)
Subject Treatment Trial 1 Trial 2
1 Placebo 300 303
2 Placebo 350 358
3 Placebo 178 172
4 Placebo 335 325
5 Placebo 248 243
6 Placebo 248 252
7 Placebo 290 287
Mean 278 277
SD 59 61
Subject Treatment Trial 1 Trial 2
1 Acute Sodium Bic 305 309
2 Acute Sodium Bic 339 355
3 Acute Sodium Bic 172 175
4 Acute Sodium Bic 356 361
5 Acute Sodium Bic 239 244
6 Acute Sodium Bic 250 240
7 Acute Sodium Bic 292 286
Mean 279 281
SD 64 67
Subject Treatment Trial 1 Trial 2
1 Chronic Sodium Bic 309 299
2 Chronic Sodium Bic 367 355
3 Chronic Sodium Bic 170 182
4 Chronic Sodium Bic 353 355
5 Chronic Sodium Bic 252 248
6 Chronic Sodium Bic 251 250
7 Chronic Sodium Bic 290 264
Mean 285 279
SD 68 62
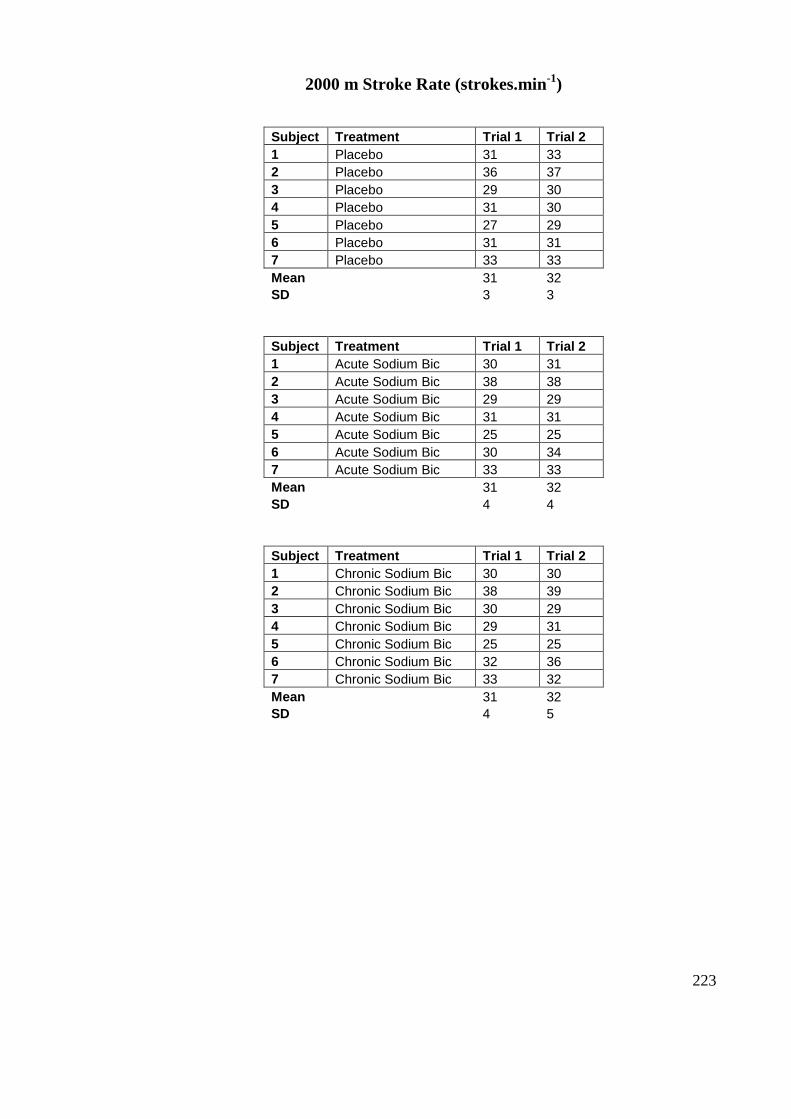
223
2000 m Stroke Rate (strokes.min-1
)
Subject Treatment Trial 1 Trial 2
1 Placebo 31 33
2 Placebo 36 37
3 Placebo 29 30
4 Placebo 31 30
5 Placebo 27 29
6 Placebo 31 31
7 Placebo 33 33
Mean 31 32
SD 3 3
Subject Treatment Trial 1 Trial 2
1 Acute Sodium Bic 30 31
2 Acute Sodium Bic 38 38
3 Acute Sodium Bic 29 29
4 Acute Sodium Bic 31 31
5 Acute Sodium Bic 25 25
6 Acute Sodium Bic 30 34
7 Acute Sodium Bic 33 33
Mean 31 32
SD 4 4
Subject Treatment Trial 1 Trial 2
1 Chronic Sodium Bic 30 30
2 Chronic Sodium Bic 38 39
3 Chronic Sodium Bic 30 29
4 Chronic Sodium Bic 29 31
5 Chronic Sodium Bic 25 25
6 Chronic Sodium Bic 32 36
7 Chronic Sodium Bic 33 32
Mean 31 32
SD 4 5

224
Blood Bicarbonate Concentration (mmol.L-1
)
Subject Treatment Trial 1 Trial 2
Pre-ingestion 1 Placebo 27.8 24.3
Pre-ingestion 2 Placebo 28.3 27.6
Pre-ingestion 3 Placebo 22.6 23.9
Pre-ingestion 4 Placebo 26.3 29.2
Pre-ingestion 5 Placebo 24.1 26.1
Pre-ingestion 6 Placebo 25.8 25.7
Pre-ingestion 7 Placebo 25.6 27.0
Mean 25.8 26.3
SD 2.0 1.9
Subject Treatment Trial 1 Trial 2
Pre-ingestion 1 Acute Sodium Bic 27.8 26.6
Pre-ingestion 2 Acute Sodium Bic 29.8 29.8
Pre-ingestion 3 Acute Sodium Bic 23.6 22.8
Pre-ingestion 4 Acute Sodium Bic 28.4 28.7
Pre-ingestion 5 Acute Sodium Bic 24.2 25.2
Pre-ingestion 6 Acute Sodium Bic 25.9 24.6
Pre-ingestion 7 Acute Sodium Bic 27.6 30.0
Mean 26.8 26.8
SD 2.3 2.8
Subject Treatment Trial 1 Trial 2
Pre-ingestion 1 Chronic Sodium Bic 27.8 25.7
Pre-ingestion 2 Chronic Sodium Bic 30.4 26.7
Pre-ingestion 3 Chronic Sodium Bic 23.0 25.3
Pre-ingestion 4 Chronic Sodium Bic 25.2 29.6
Pre-ingestion 5 Chronic Sodium Bic 24.1 25.9
Pre-ingestion 6 Chronic Sodium Bic 23.8 25.4
Pre-ingestion 7 Chronic Sodium Bic 32.1 30.0
Mean 26.6 26.9
SD 3.5 2.0
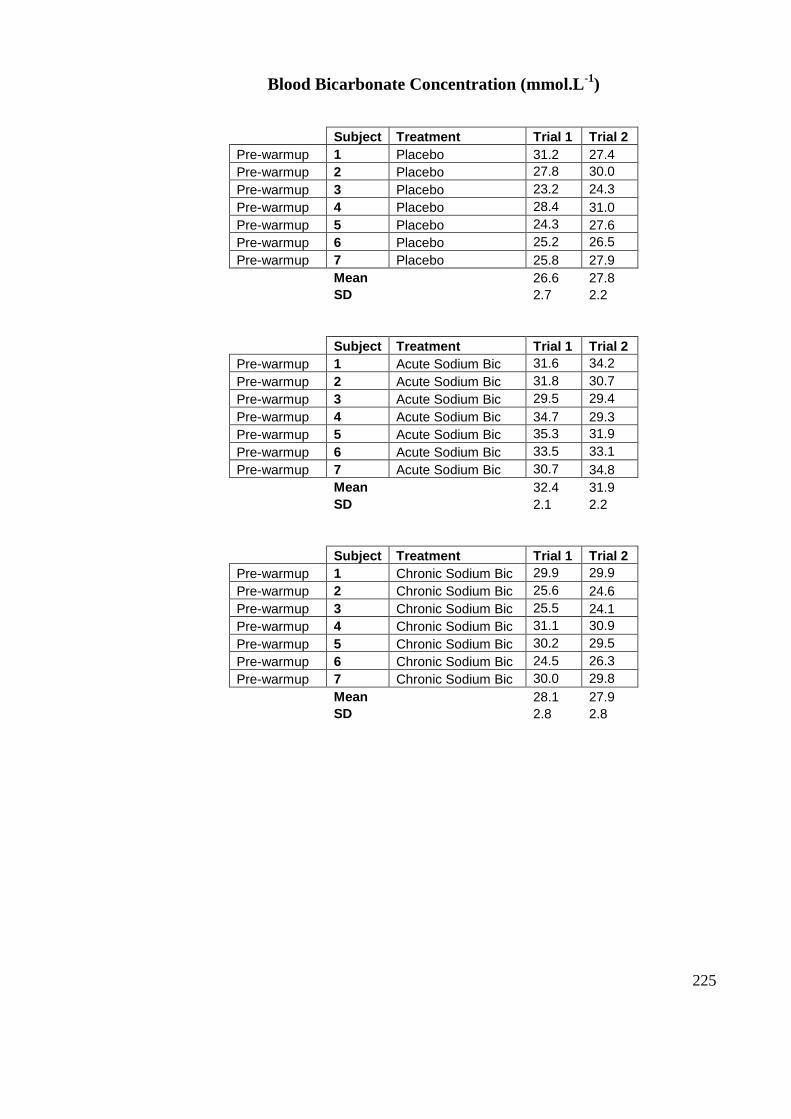
225
Blood Bicarbonate Concentration (mmol.L-1
)
Subject Treatment Trial 1 Trial 2
Pre-warmup 1 Placebo 31.2 27.4
Pre-warmup 2 Placebo 27.8 30.0
Pre-warmup 3 Placebo 23.2 24.3
Pre-warmup 4 Placebo 28.4 31.0
Pre-warmup 5 Placebo 24.3 27.6
Pre-warmup 6 Placebo 25.2 26.5
Pre-warmup 7 Placebo 25.8 27.9
Mean 26.6 27.8
SD 2.7 2.2
Subject Treatment Trial 1 Trial 2
Pre-warmup 1 Acute Sodium Bic 31.6 34.2
Pre-warmup 2 Acute Sodium Bic 31.8 30.7
Pre-warmup 3 Acute Sodium Bic 29.5 29.4
Pre-warmup 4 Acute Sodium Bic 34.7 29.3
Pre-warmup 5 Acute Sodium Bic 35.3 31.9
Pre-warmup 6 Acute Sodium Bic 33.5 33.1
Pre-warmup 7 Acute Sodium Bic 30.7 34.8
Mean 32.4 31.9
SD 2.1 2.2
Subject Treatment Trial 1 Trial 2
Pre-warmup 1 Chronic Sodium Bic 29.9 29.9
Pre-warmup 2 Chronic Sodium Bic 25.6 24.6
Pre-warmup 3 Chronic Sodium Bic 25.5 24.1
Pre-warmup 4 Chronic Sodium Bic 31.1 30.9
Pre-warmup 5 Chronic Sodium Bic 30.2 29.5
Pre-warmup 6 Chronic Sodium Bic 24.5 26.3
Pre-warmup 7 Chronic Sodium Bic 30.0 29.8
Mean 28.1 27.9
SD 2.8 2.8
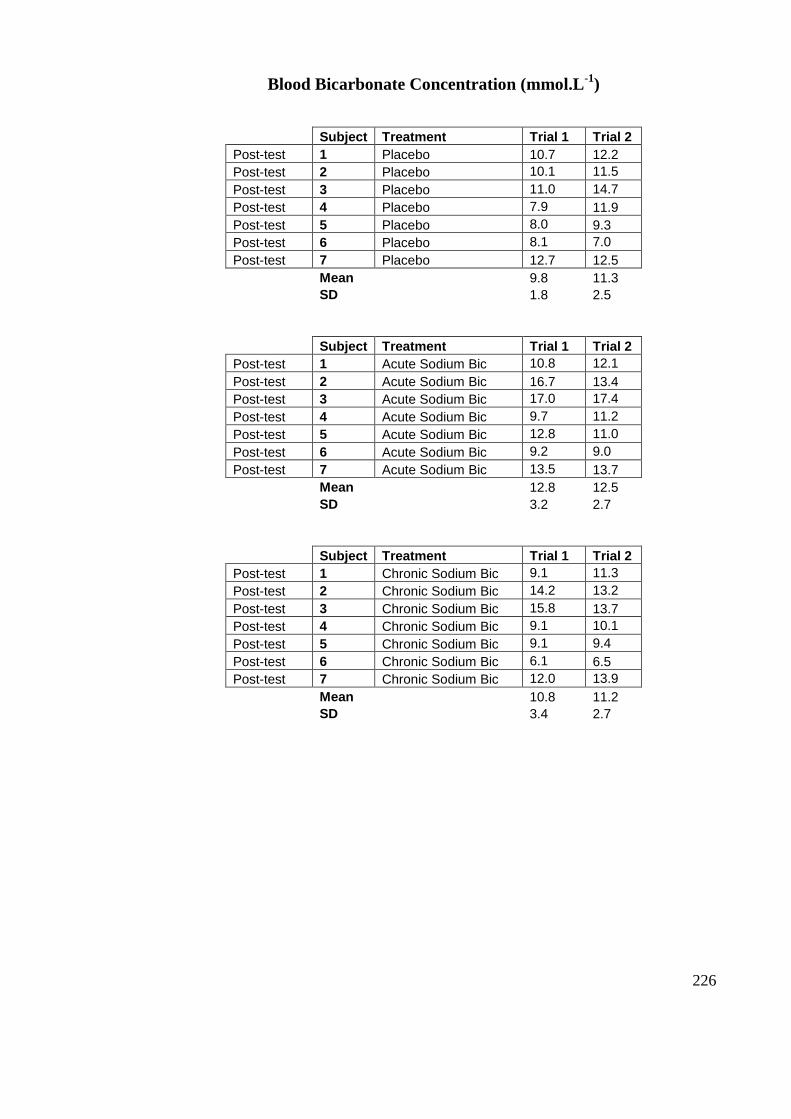
226
Blood Bicarbonate Concentration (mmol.L-1
)
Subject Treatment Trial 1 Trial 2
Post-test 1 Placebo 10.7 12.2
Post-test 2 Placebo 10.1 11.5
Post-test 3 Placebo 11.0 14.7
Post-test 4 Placebo 7.9 11.9
Post-test 5 Placebo 8.0 9.3
Post-test 6 Placebo 8.1 7.0
Post-test 7 Placebo 12.7 12.5
Mean 9.8 11.3
SD 1.8 2.5
Subject Treatment Trial 1 Trial 2
Post-test 1 Acute Sodium Bic 10.8 12.1
Post-test 2 Acute Sodium Bic 16.7 13.4
Post-test 3 Acute Sodium Bic 17.0 17.4
Post-test 4 Acute Sodium Bic 9.7 11.2
Post-test 5 Acute Sodium Bic 12.8 11.0
Post-test 6 Acute Sodium Bic 9.2 9.0
Post-test 7 Acute Sodium Bic 13.5 13.7
Mean 12.8 12.5
SD 3.2 2.7
Subject Treatment Trial 1 Trial 2
Post-test 1 Chronic Sodium Bic 9.1 11.3
Post-test 2 Chronic Sodium Bic 14.2 13.2
Post-test 3 Chronic Sodium Bic 15.8 13.7
Post-test 4 Chronic Sodium Bic 9.1 10.1
Post-test 5 Chronic Sodium Bic 9.1 9.4
Post-test 6 Chronic Sodium Bic 6.1 6.5
Post-test 7 Chronic Sodium Bic 12.0 13.9
Mean 10.8 11.2
SD 3.4 2.7
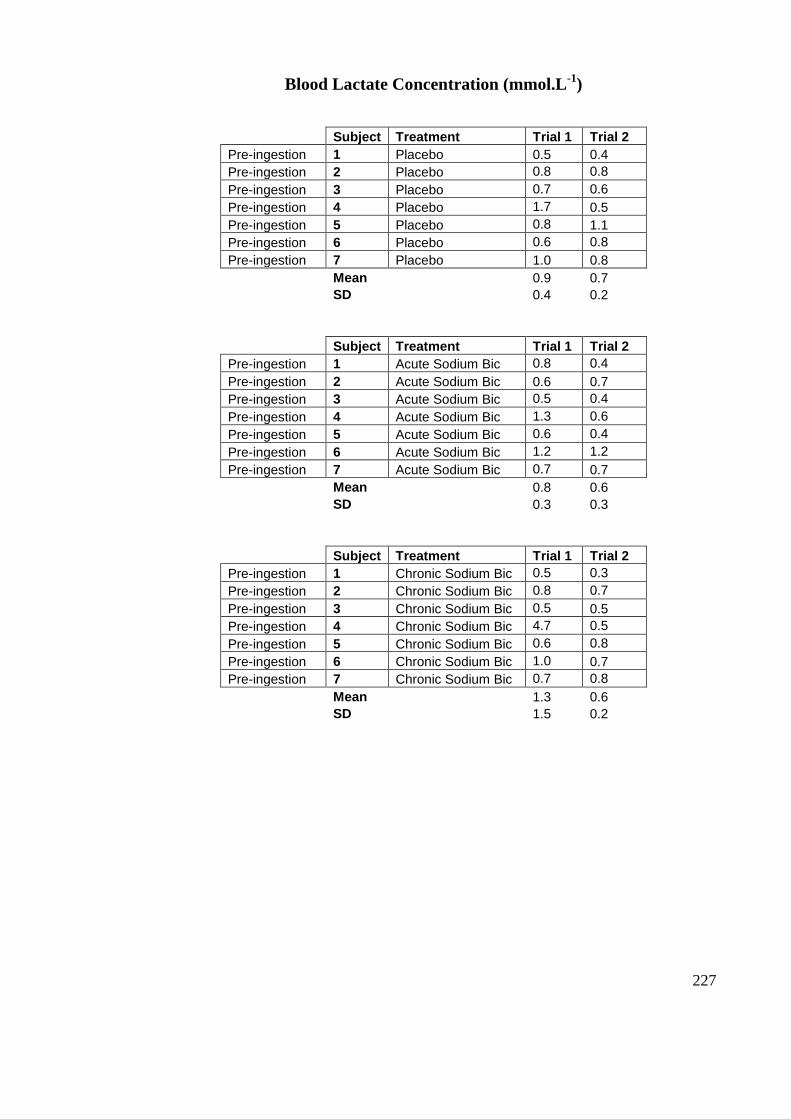
227
Blood Lactate Concentration (mmol.L-1
)
Subject Treatment Trial 1 Trial 2
Pre-ingestion 1 Placebo 0.5 0.4
Pre-ingestion 2 Placebo 0.8 0.8
Pre-ingestion 3 Placebo 0.7 0.6
Pre-ingestion 4 Placebo 1.7 0.5
Pre-ingestion 5 Placebo 0.8 1.1
Pre-ingestion 6 Placebo 0.6 0.8
Pre-ingestion 7 Placebo 1.0 0.8
Mean 0.9 0.7
SD 0.4 0.2
Subject Treatment Trial 1 Trial 2
Pre-ingestion 1 Acute Sodium Bic 0.8 0.4
Pre-ingestion 2 Acute Sodium Bic 0.6 0.7
Pre-ingestion 3 Acute Sodium Bic 0.5 0.4
Pre-ingestion 4 Acute Sodium Bic 1.3 0.6
Pre-ingestion 5 Acute Sodium Bic 0.6 0.4
Pre-ingestion 6 Acute Sodium Bic 1.2 1.2
Pre-ingestion 7 Acute Sodium Bic 0.7 0.7
Mean 0.8 0.6
SD 0.3 0.3
Subject Treatment Trial 1 Trial 2
Pre-ingestion 1 Chronic Sodium Bic 0.5 0.3
Pre-ingestion 2 Chronic Sodium Bic 0.8 0.7
Pre-ingestion 3 Chronic Sodium Bic 0.5 0.5
Pre-ingestion 4 Chronic Sodium Bic 4.7 0.5
Pre-ingestion 5 Chronic Sodium Bic 0.6 0.8
Pre-ingestion 6 Chronic Sodium Bic 1.0 0.7
Pre-ingestion 7 Chronic Sodium Bic 0.7 0.8
Mean 1.3 0.6
SD 1.5 0.2
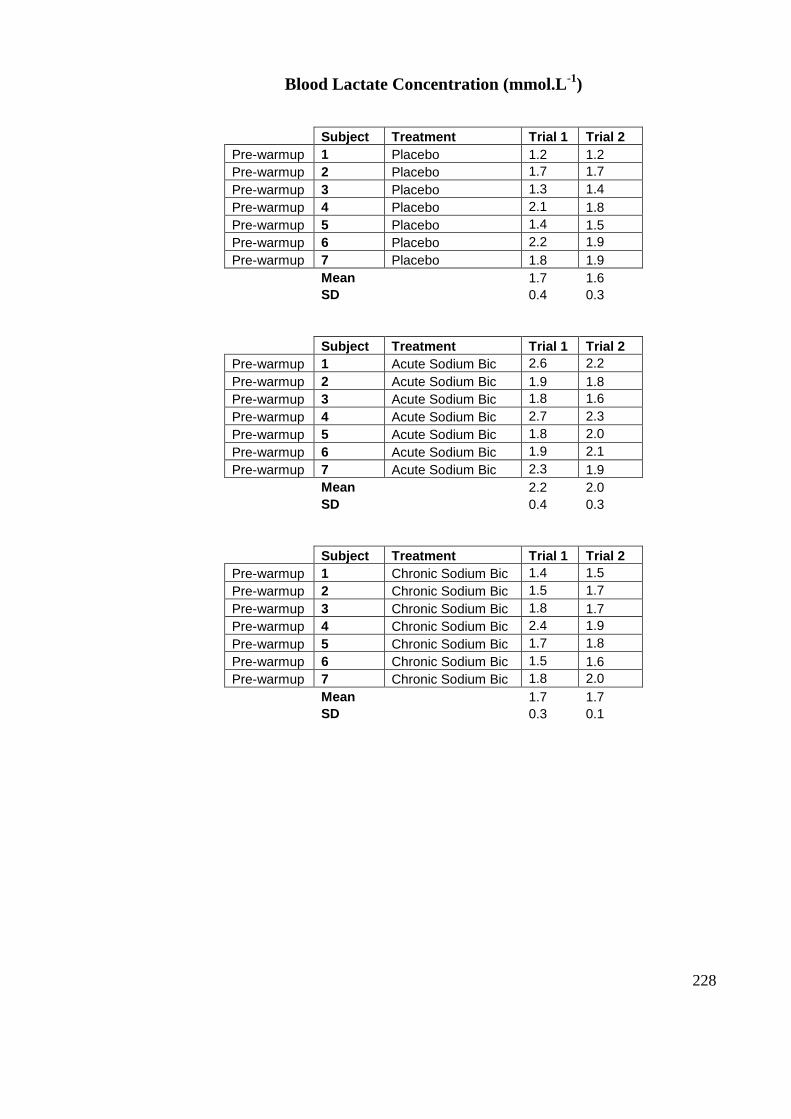
228
Blood Lactate Concentration (mmol.L-1
)
Subject Treatment Trial 1 Trial 2
Pre-warmup 1 Placebo 1.2 1.2
Pre-warmup 2 Placebo 1.7 1.7
Pre-warmup 3 Placebo 1.3 1.4
Pre-warmup 4 Placebo 2.1 1.8
Pre-warmup 5 Placebo 1.4 1.5
Pre-warmup 6 Placebo 2.2 1.9
Pre-warmup 7 Placebo 1.8 1.9
Mean 1.7 1.6
SD 0.4 0.3
Subject Treatment Trial 1 Trial 2
Pre-warmup 1 Acute Sodium Bic 2.6 2.2
Pre-warmup 2 Acute Sodium Bic 1.9 1.8
Pre-warmup 3 Acute Sodium Bic 1.8 1.6
Pre-warmup 4 Acute Sodium Bic 2.7 2.3
Pre-warmup 5 Acute Sodium Bic 1.8 2.0
Pre-warmup 6 Acute Sodium Bic 1.9 2.1
Pre-warmup 7 Acute Sodium Bic 2.3 1.9
Mean 2.2 2.0
SD 0.4 0.3
Subject Treatment Trial 1 Trial 2
Pre-warmup 1 Chronic Sodium Bic 1.4 1.5
Pre-warmup 2 Chronic Sodium Bic 1.5 1.7
Pre-warmup 3 Chronic Sodium Bic 1.8 1.7
Pre-warmup 4 Chronic Sodium Bic 2.4 1.9
Pre-warmup 5 Chronic Sodium Bic 1.7 1.8
Pre-warmup 6 Chronic Sodium Bic 1.5 1.6
Pre-warmup 7 Chronic Sodium Bic 1.8 2.0
Mean 1.7 1.7
SD 0.3 0.1
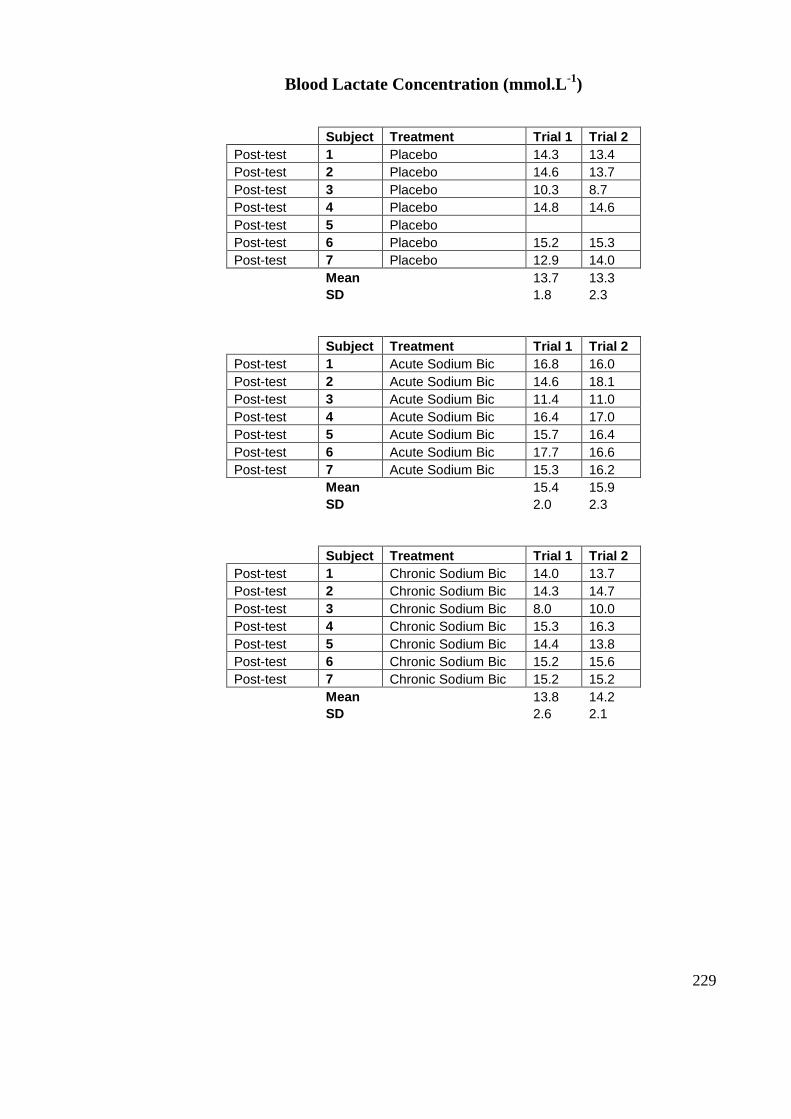
229
Blood Lactate Concentration (mmol.L-1
)
Subject Treatment Trial 1 Trial 2
Post-test 1 Placebo 14.3 13.4
Post-test 2 Placebo 14.6 13.7
Post-test 3 Placebo 10.3 8.7
Post-test 4 Placebo 14.8 14.6
Post-test 5 Placebo
Post-test 6 Placebo 15.2 15.3
Post-test 7 Placebo 12.9 14.0
Mean 13.7 13.3
SD 1.8 2.3
Subject Treatment Trial 1 Trial 2
Post-test 1 Acute Sodium Bic 16.8 16.0
Post-test 2 Acute Sodium Bic 14.6 18.1
Post-test 3 Acute Sodium Bic 11.4 11.0
Post-test 4 Acute Sodium Bic 16.4 17.0
Post-test 5 Acute Sodium Bic 15.7 16.4
Post-test 6 Acute Sodium Bic 17.7 16.6
Post-test 7 Acute Sodium Bic 15.3 16.2
Mean 15.4 15.9
SD 2.0 2.3
Subject Treatment Trial 1 Trial 2
Post-test 1 Chronic Sodium Bic 14.0 13.7
Post-test 2 Chronic Sodium Bic 14.3 14.7
Post-test 3 Chronic Sodium Bic 8.0 10.0
Post-test 4 Chronic Sodium Bic 15.3 16.3
Post-test 5 Chronic Sodium Bic 14.4 13.8
Post-test 6 Chronic Sodium Bic 15.2 15.6
Post-test 7 Chronic Sodium Bic 15.2 15.2
Mean 13.8 14.2
SD 2.6 2.1
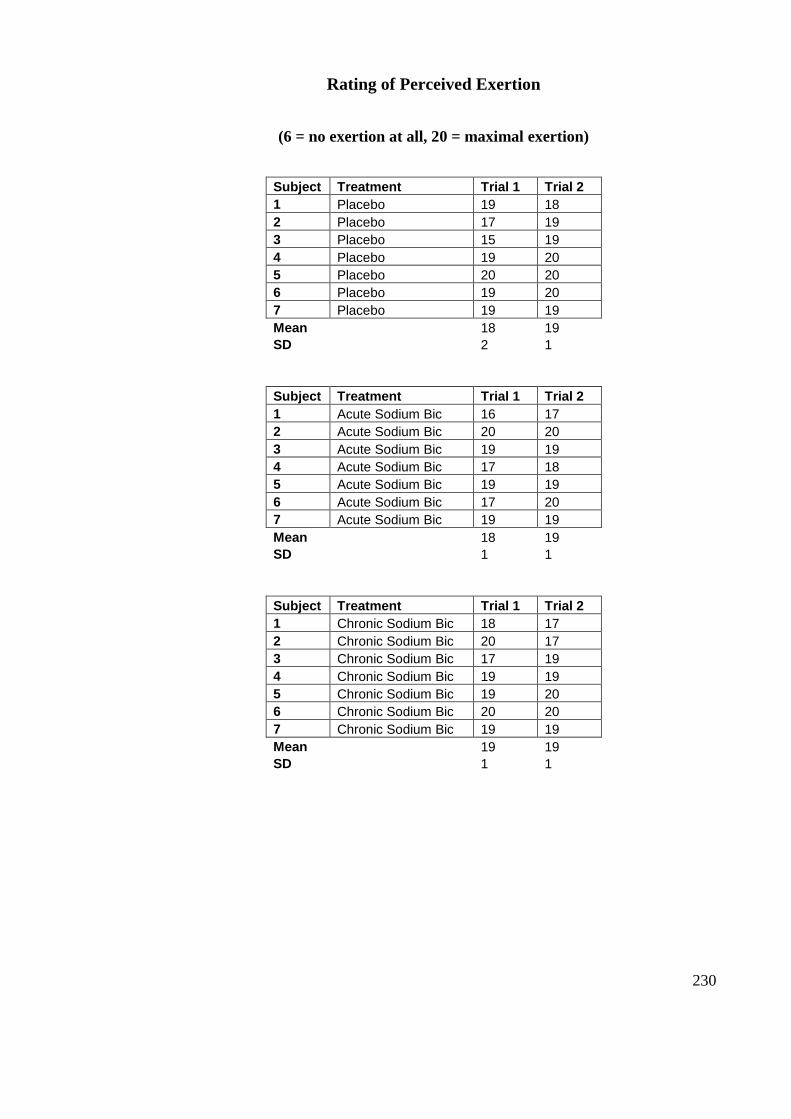
230
Rating of Perceived Exertion
(6 = no exertion at all, 20 = maximal exertion)
Subject Treatment Trial 1 Trial 2
1 Placebo 19 18
2 Placebo 17 19
3 Placebo 15 19
4 Placebo 19 20
5 Placebo 20 20
6 Placebo 19 20
7 Placebo 19 19
Mean 18 19
SD 2 1
Subject Treatment Trial 1 Trial 2
1 Acute Sodium Bic 16 17
2 Acute Sodium Bic 20 20
3 Acute Sodium Bic 19 19
4 Acute Sodium Bic 17 18
5 Acute Sodium Bic 19 19
6 Acute Sodium Bic 17 20
7 Acute Sodium Bic 19 19
Mean 18 19
SD 1 1
Subject Treatment Trial 1 Trial 2
1 Chronic Sodium Bic 18 17
2 Chronic Sodium Bic 20 17
3 Chronic Sodium Bic 17 19
4 Chronic Sodium Bic 19 19
5 Chronic Sodium Bic 19 20
6 Chronic Sodium Bic 20 20
7 Chronic Sodium Bic 19 19
Mean 19 19
SD 1 1
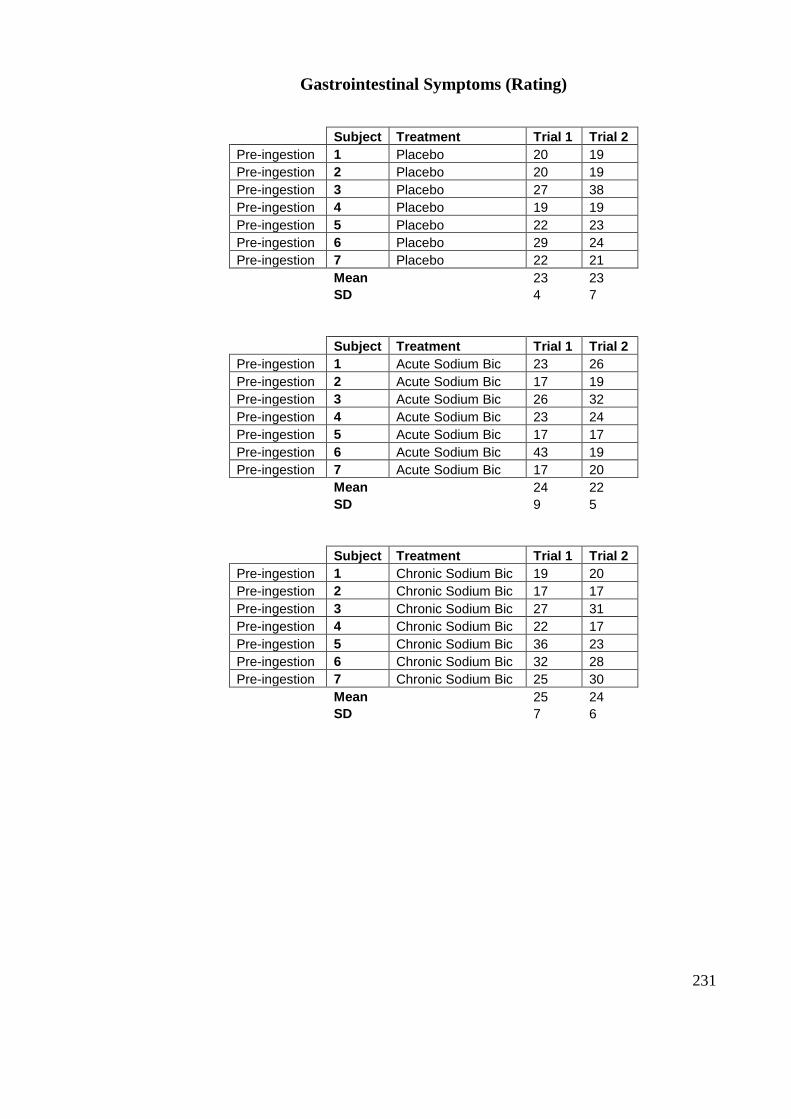
231
Gastrointestinal Symptoms (Rating)
Subject Treatment Trial 1 Trial 2
Pre-ingestion 1 Placebo 20 19
Pre-ingestion 2 Placebo 20 19
Pre-ingestion 3 Placebo 27 38
Pre-ingestion 4 Placebo 19 19
Pre-ingestion 5 Placebo 22 23
Pre-ingestion 6 Placebo 29 24
Pre-ingestion 7 Placebo 22 21
Mean 23 23
SD 4 7
Subject Treatment Trial 1 Trial 2
Pre-ingestion 1 Acute Sodium Bic 23 26
Pre-ingestion 2 Acute Sodium Bic 17 19
Pre-ingestion 3 Acute Sodium Bic 26 32
Pre-ingestion 4 Acute Sodium Bic 23 24
Pre-ingestion 5 Acute Sodium Bic 17 17
Pre-ingestion 6 Acute Sodium Bic 43 19
Pre-ingestion 7 Acute Sodium Bic 17 20
Mean 24 22
SD 9 5
Subject Treatment Trial 1 Trial 2
Pre-ingestion 1 Chronic Sodium Bic 19 20
Pre-ingestion 2 Chronic Sodium Bic 17 17
Pre-ingestion 3 Chronic Sodium Bic 27 31
Pre-ingestion 4 Chronic Sodium Bic 22 17
Pre-ingestion 5 Chronic Sodium Bic 36 23
Pre-ingestion 6 Chronic Sodium Bic 32 28
Pre-ingestion 7 Chronic Sodium Bic 25 30
Mean 25 24
SD 7 6
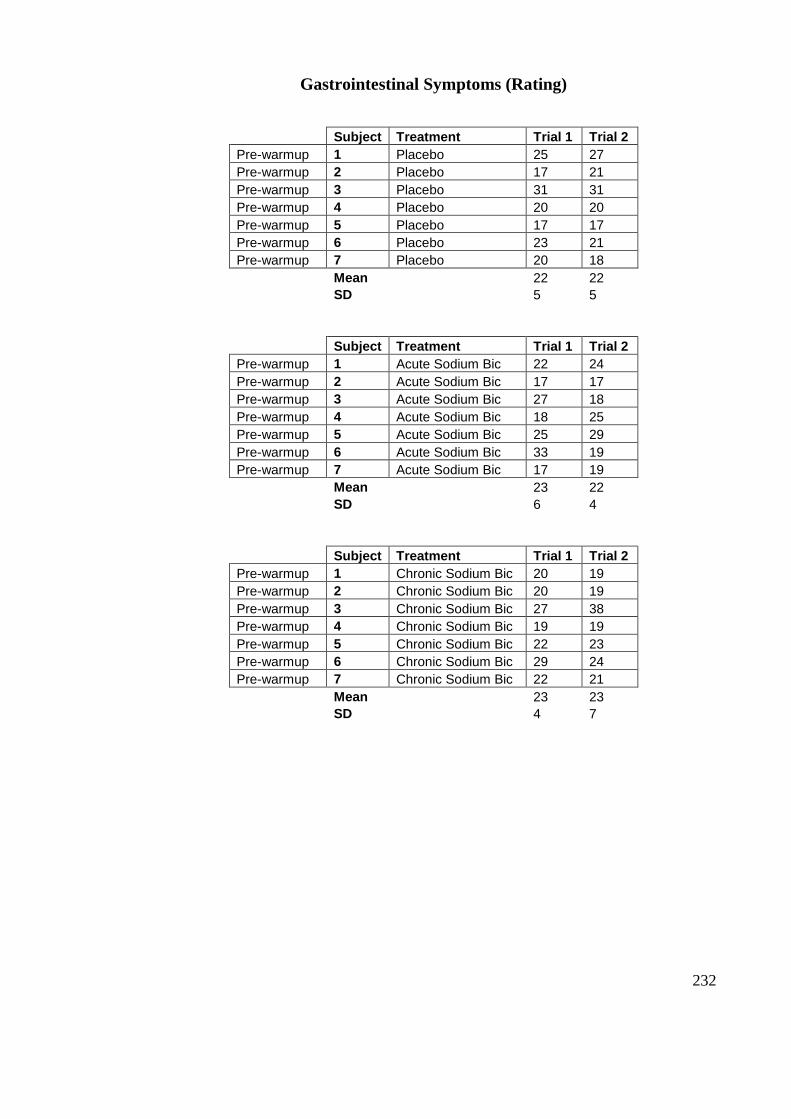
232
Gastrointestinal Symptoms (Rating)
Subject Treatment Trial 1 Trial 2
Pre-warmup 1 Placebo 25 27
Pre-warmup 2 Placebo 17 21
Pre-warmup 3 Placebo 31 31
Pre-warmup 4 Placebo 20 20
Pre-warmup 5 Placebo 17 17
Pre-warmup 6 Placebo 23 21
Pre-warmup 7 Placebo 20 18
Mean 22 22
SD 5 5
Subject Treatment Trial 1 Trial 2
Pre-warmup 1 Acute Sodium Bic 22 24
Pre-warmup 2 Acute Sodium Bic 17 17
Pre-warmup 3 Acute Sodium Bic 27 18
Pre-warmup 4 Acute Sodium Bic 18 25
Pre-warmup 5 Acute Sodium Bic 25 29
Pre-warmup 6 Acute Sodium Bic 33 19
Pre-warmup 7 Acute Sodium Bic 17 19
Mean 23 22
SD 6 4
Subject Treatment Trial 1 Trial 2
Pre-warmup 1 Chronic Sodium Bic 20 19
Pre-warmup 2 Chronic Sodium Bic 20 19
Pre-warmup 3 Chronic Sodium Bic 27 38
Pre-warmup 4 Chronic Sodium Bic 19 19
Pre-warmup 5 Chronic Sodium Bic 22 23
Pre-warmup 6 Chronic Sodium Bic 29 24
Pre-warmup 7 Chronic Sodium Bic 22 21
Mean 23 23
SD 4 7
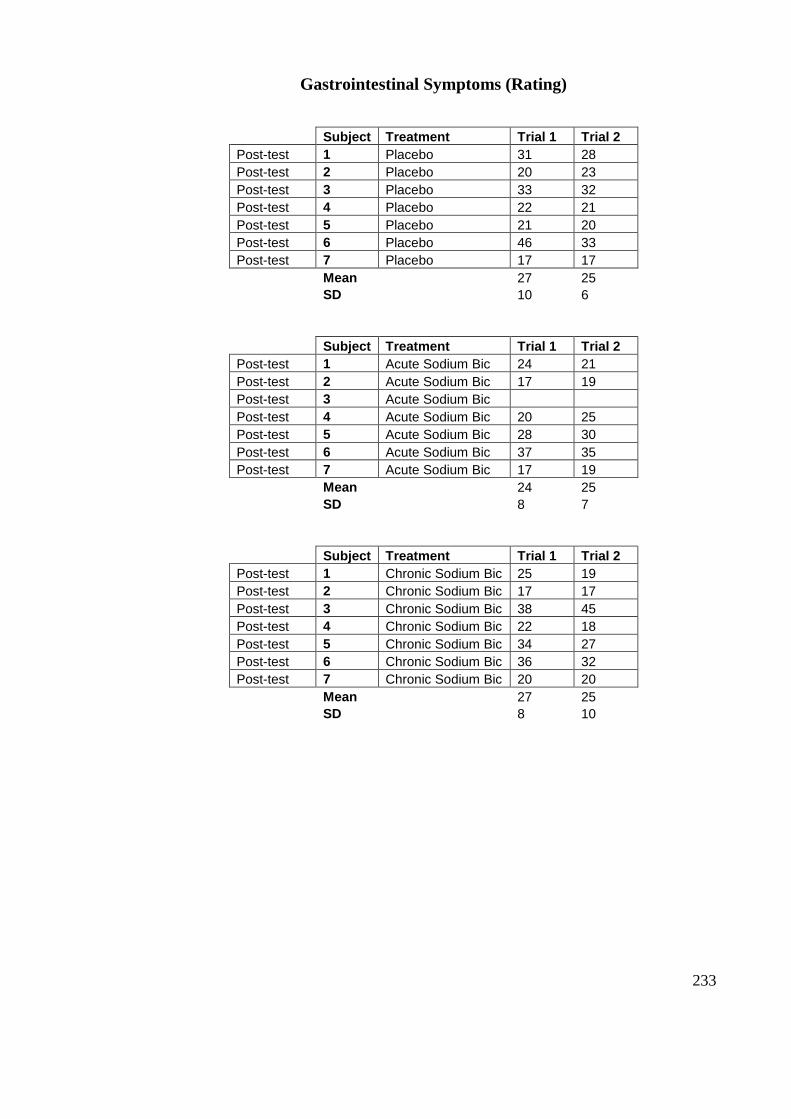
233
Gastrointestinal Symptoms (Rating)
Subject Treatment Trial 1 Trial 2
Post-test 1 Placebo 31 28
Post-test 2 Placebo 20 23
Post-test 3 Placebo 33 32
Post-test 4 Placebo 22 21
Post-test 5 Placebo 21 20
Post-test 6 Placebo 46 33
Post-test 7 Placebo 17 17
Mean 27 25
SD 10 6
Subject Treatment Trial 1 Trial 2
Post-test 1 Acute Sodium Bic 24 21
Post-test 2 Acute Sodium Bic 17 19
Post-test 3 Acute Sodium Bic
Post-test 4 Acute Sodium Bic 20 25
Post-test 5 Acute Sodium Bic 28 30
Post-test 6 Acute Sodium Bic 37 35
Post-test 7 Acute Sodium Bic 17 19
Mean 24 25
SD 8 7
Subject Treatment Trial 1 Trial 2
Post-test 1 Chronic Sodium Bic 25 19
Post-test 2 Chronic Sodium Bic 17 17
Post-test 3 Chronic Sodium Bic 38 45
Post-test 4 Chronic Sodium Bic 22 18
Post-test 5 Chronic Sodium Bic 34 27
Post-test 6 Chronic Sodium Bic 36 32
Post-test 7 Chronic Sodium Bic 20 20
Mean 27 25
SD 8 10


![Simple Algorithm of Arterial Blood Gas Analysis to Ensure ... · a. acidosis→ hyperkalemia b. alkalosis→ hypokalemia Base excess & base deficit [9,10] In human physiology base](https://img.pdfslide.us/doc/110x75/5e68d1f9a3c8150f0033b9c4/simple-algorithm-of-arterial-blood-gas-analysis-to-ensure-a-acidosisa-hyperkalemia.jpg)