Embed Size (px)
Citation preview
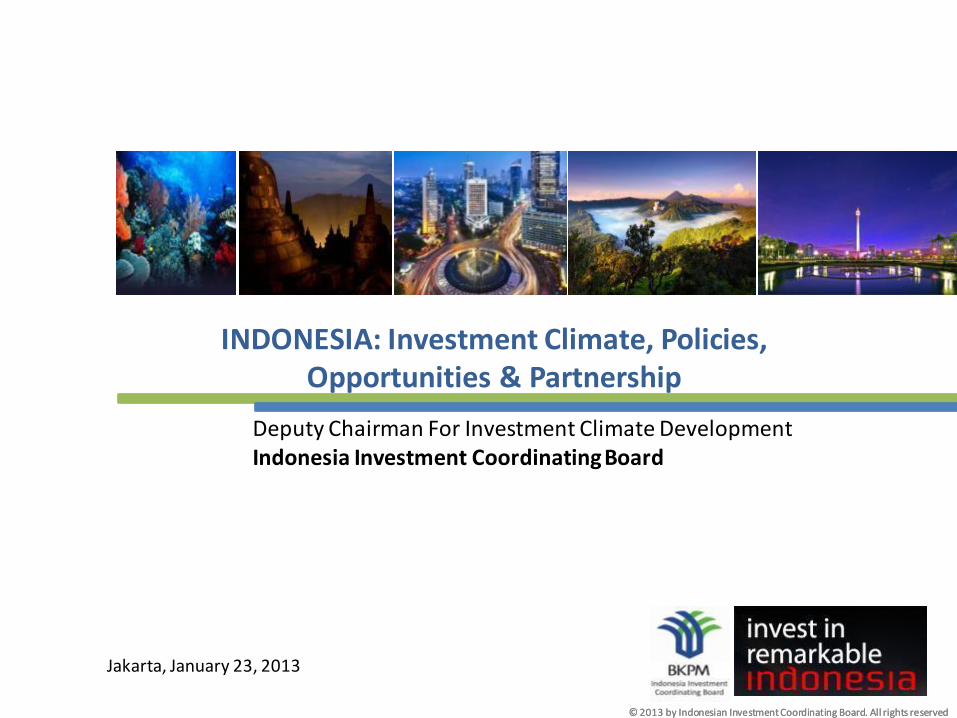
© 2013 by Indonesian Investment Coordinating Board. All rights reserved © 2013 by Indonesian Investment Coordinating Board. All rights reserved
INDONESIA: Investment Climate, Policies, Opportunities & Partnership
Deputy Chairman For Investment Climate Development Indonesia Investment Coordinating Board
Jakarta, January 23, 2013
Indonesia Investment Coordinating Board
1
2
3
4
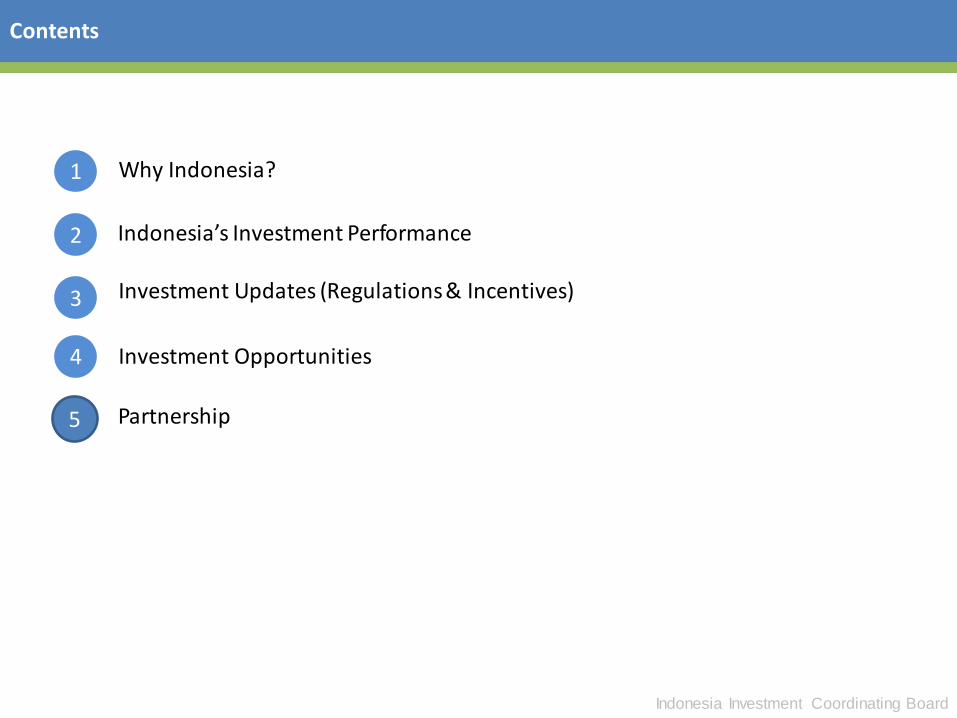
Why Indonesia?
Indonesia’s Investment Performance
Investment Updates (Regulations & Incentives)
Investment Opportunities
Contents
4 5 Partnership
Indonesia Investment Coordinating Board
Why Indonesia?
Indonesia Investment Coordinating Board
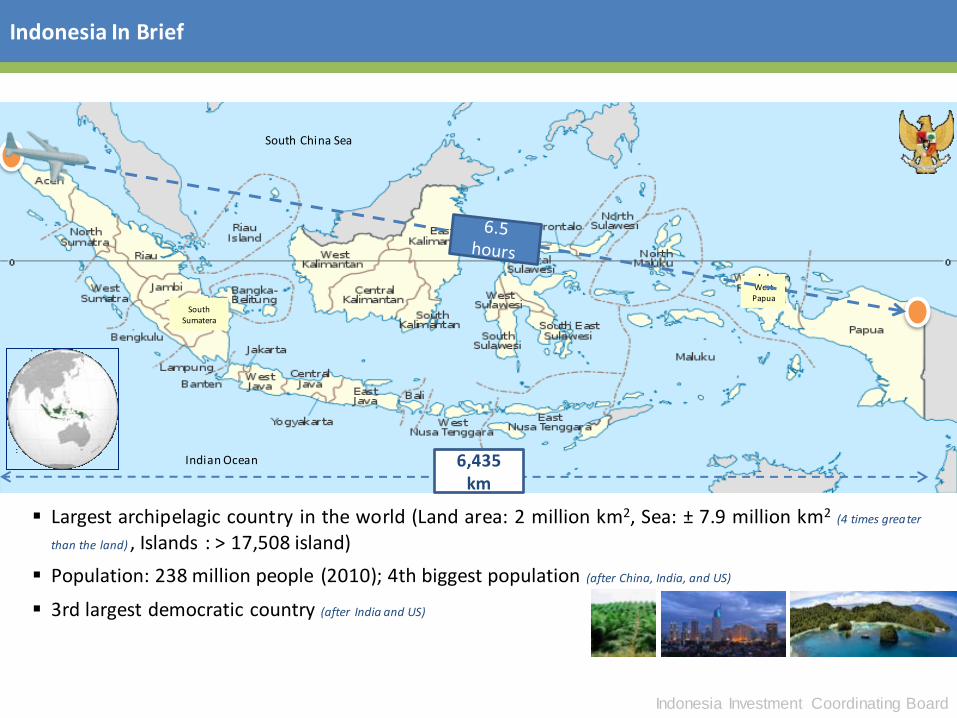
Indonesia In Brief
Largest archipelagic country in the world (Land area: 2 million km2, Sea: ± 7.9 million km2 (4 times greater
than the land) , Islands : > 17,508 island)
Population: 238 million people (2010); 4th biggest population (after China, India, and US)
3rd largest democratic country (after India and US)
South Sumatera
West Papua
6,435 km
South China Sea
Indian Ocean
The Investment Coordinating Board of the Republic of Indonesia
5
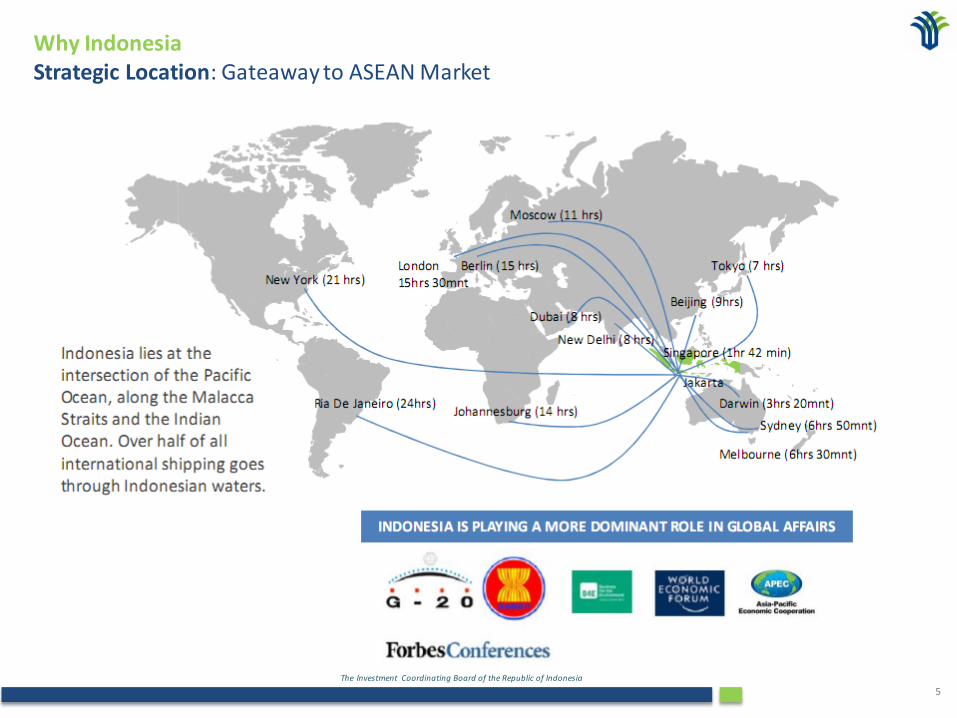
Why Indonesia Strategic Location: Gateaway to ASEAN Market
The Investment Coordinating Board of the Republic of Indonesia
6
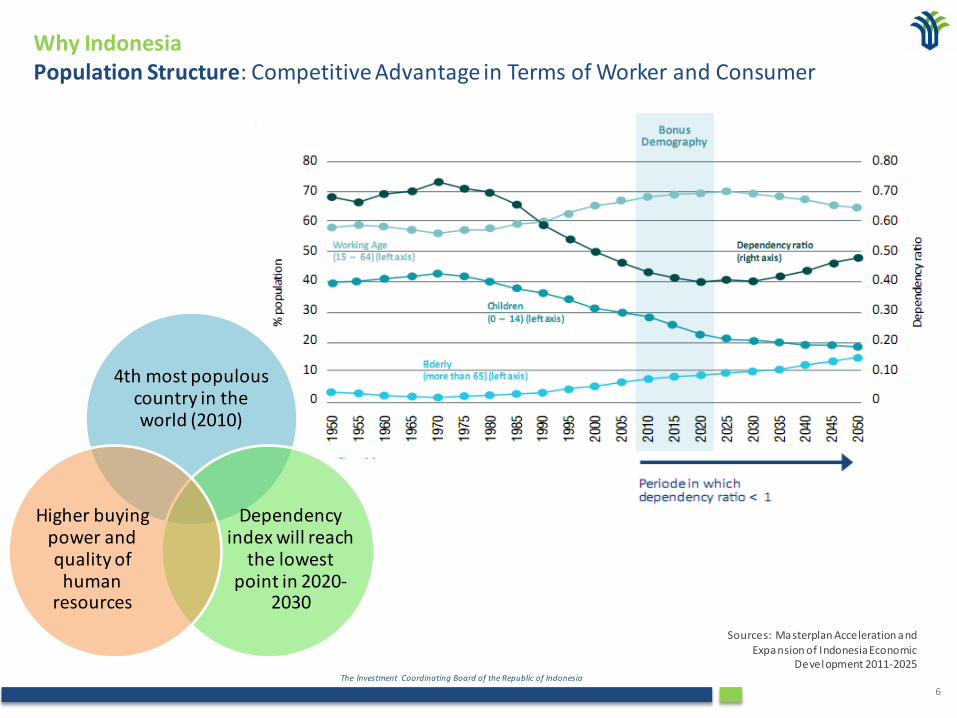
Why Indonesia Population Structure: Competitive Advantage in Terms of Worker and Consumer
4th most populous country in the world (2010)
Dependency index will reach
the lowest point in 2020-
2030
Higher buying power and quality of human
resources
Sources: Masterplan Acceleration and
Expansion of Indonesia Economic Development 2011-2025
The Investment Coordinating Board of the Republic of Indonesia
7
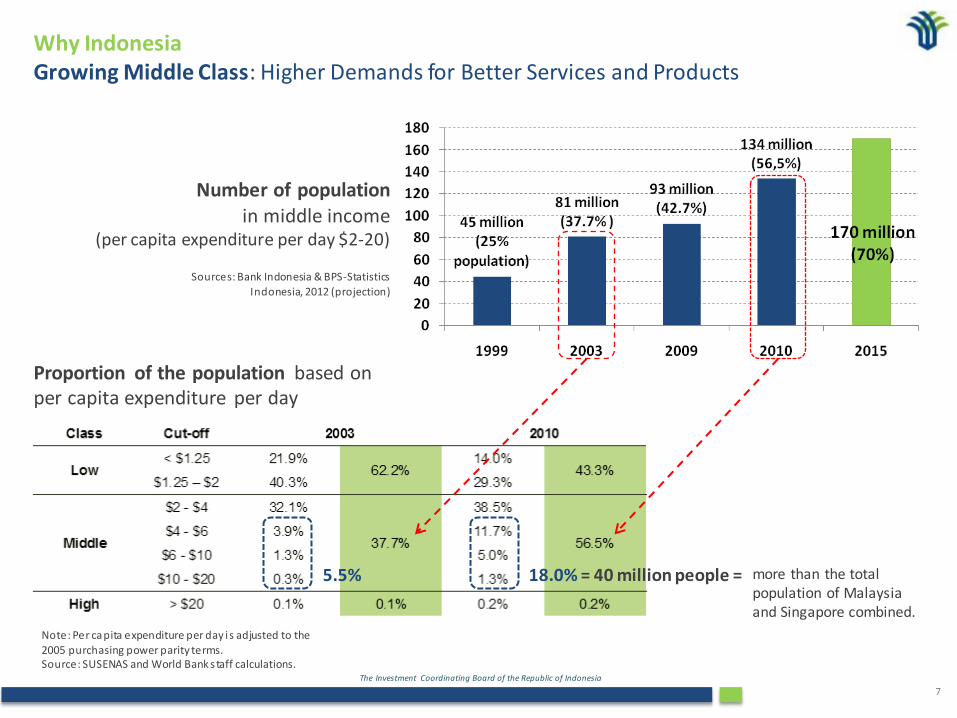
Sources: Bank Indonesia & BPS-Statistics Indonesia, 2012 (projection)
Number of population in middle income
(per capita expenditure per day $2-20)
Note: Per capita expenditure per day i s adjusted to the
2005 purchasing power parity terms. Source: SUSENAS and World Bank s taff calculations.
Proportion of the population based on per capita expenditure per day
5.5% 18.0% = 40 million people =
Why Indonesia Growing Middle Class: Higher Demands for Better Services and Products
more than the total population of Malaysia and Singapore combined.
The Investment Coordinating Board of the Republic of Indonesia
8
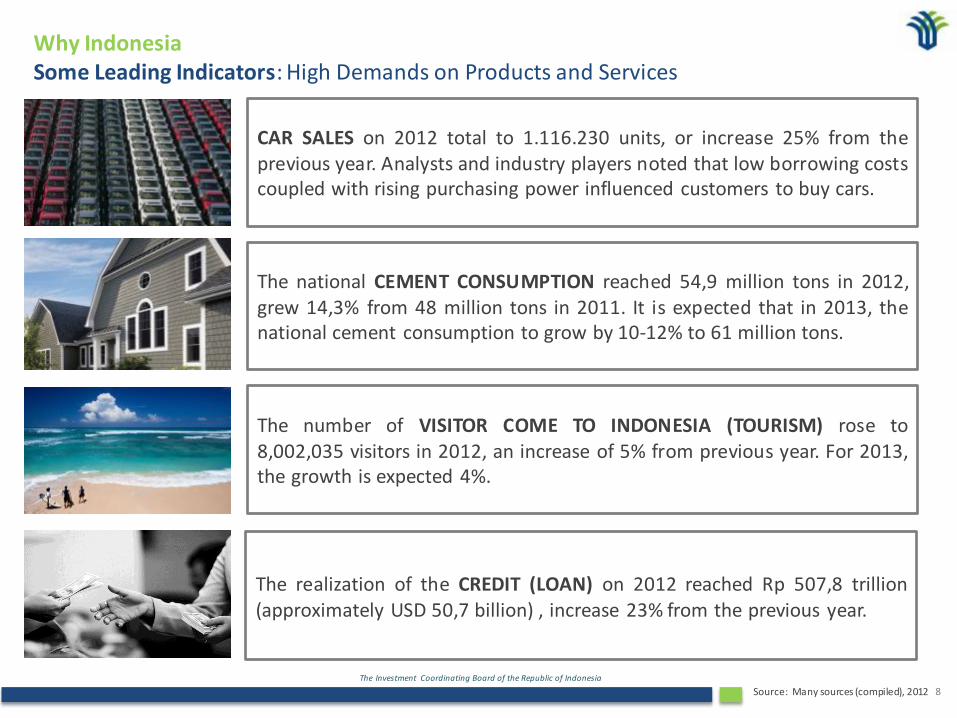
Why Indonesia Some Leading Indicators: High Demands on Products and Services
CAR SALES on 2012 total to 1.116.230 units, or increase 25% from the previous year. Analysts and industry players noted that low borrowing costs coupled with rising purchasing power influenced customers to buy cars.
The national CEMENT CONSUMPTION reached 54,9 million tons in 2012, grew 14,3% from 48 million tons in 2011. It is expected that in 2013, the national cement consumption to grow by 10-12% to 61 million tons.
The number of VISITOR COME TO INDONESIA (TOURISM) rose to 8,002,035 visitors in 2012, an increase of 5% from previous year. For 2013, the growth is expected 4%.
The realization of the CREDIT (LOAN) on 2012 reached Rp 507,8 trillion (approximately USD 50,7 billion) , increase 23% from the previous year.
Source: Many sources (compiled), 2012
The Investment Coordinating Board of the Republic of Indonesia
9
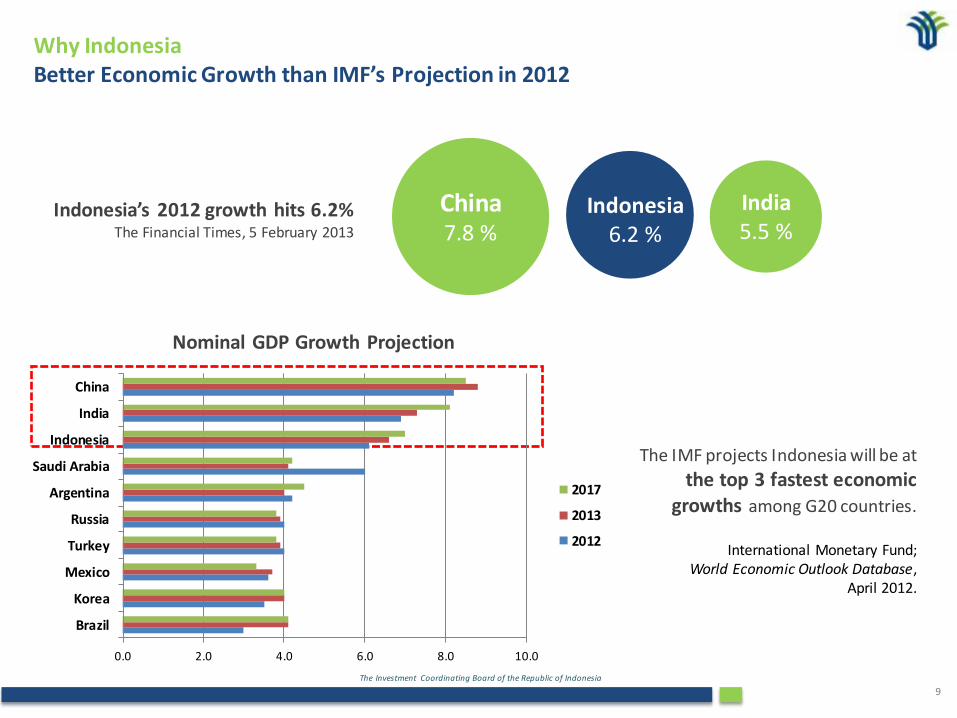
Why Indonesia Better Economic Growth than IMF’s Projection in 2012
Nominal GDP Growth Projection
0.0 2.0 4.0 6.0 8.0 10.0
Brazil
Korea
Mexico
Turkey
Russia
Argentina
Saudi Arabia
Indonesia
India
China
2017
2013
2012
The IMF projects Indonesia will be at
the top 3 fastest economic growths among G20 countries.
International Monetary Fund;
World Economic Outlook Database, April 2012.
China 7.8 %
India 5.5 %
Indonesia 6.2 %
Indonesia’s 2012 growth hits 6.2% The Financial Times, 5 February 2013
The Investment Coordinating Board of the Republic of Indonesia
10
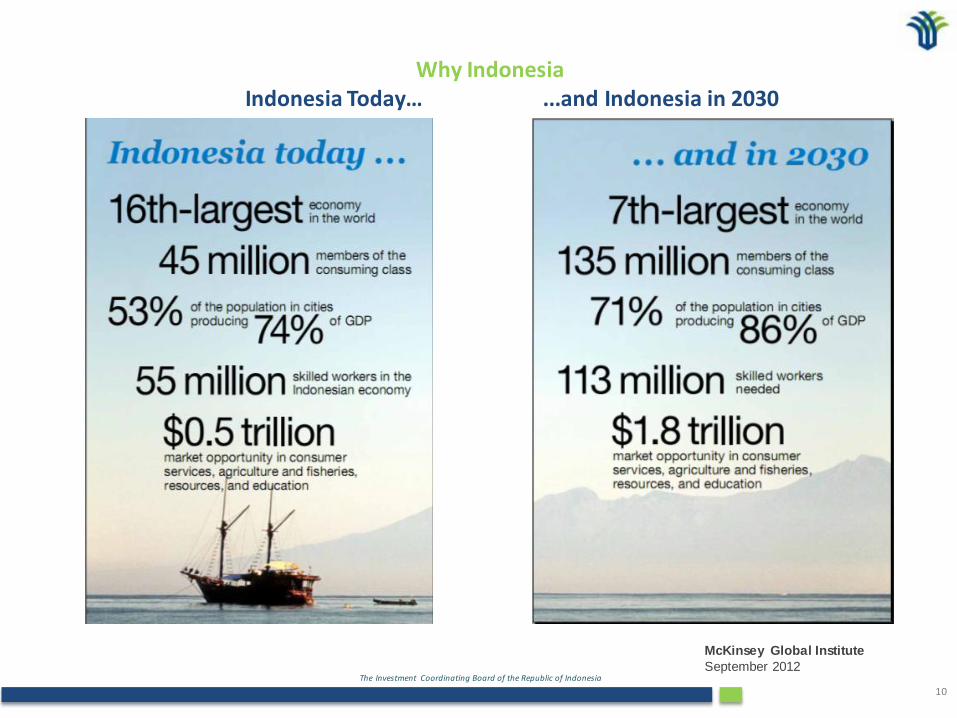
McKinsey Global Institute
September 2012
Why Indonesia Indonesia Today… ...and Indonesia in 2030
The Investment Coordinating Board of the Republic of Indonesia
11
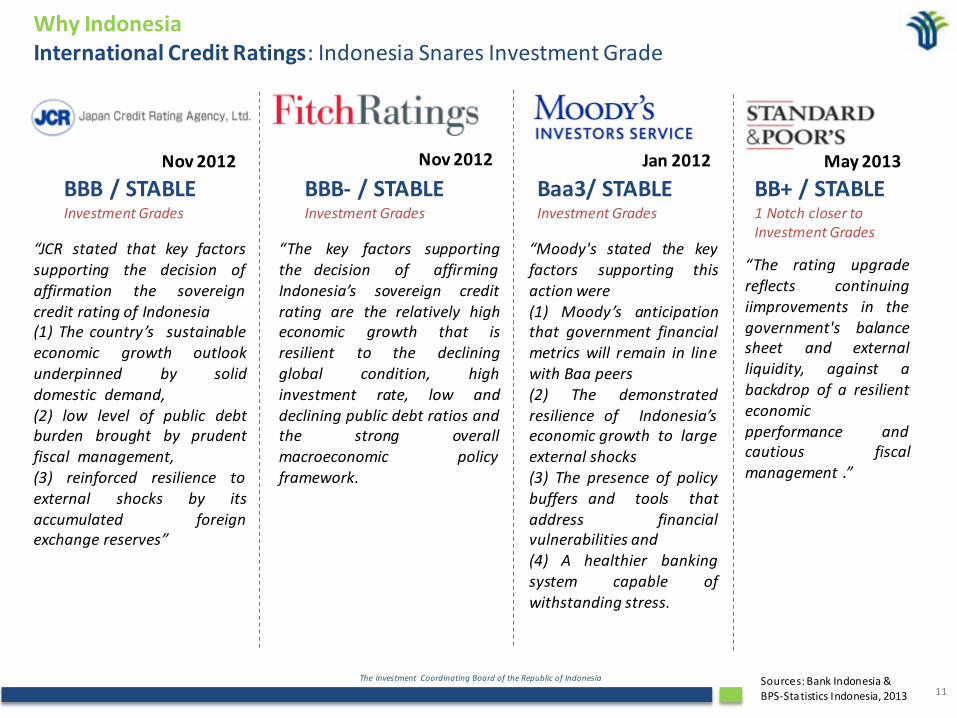
Nov 2012 Nov 2012 Jan 2012
Baa3/ STABLE Investment Grades
BBB- / STABLE Investment Grades
“The key factors supporting the decision of affirming Indonesia’s sovereign credit rating are the relatively high economic growth that is resilient to the declining global condition, high investment rate, low and declining public debt ratios and the strong overall macroeconomic policy framework.
“Moody's stated the key factors supporting this action were (1) Moody’s anticipation that government financial metrics will remain in line with Baa peers (2) The demonstrated resilience of Indonesia’s economic growth to large external shocks (3) The presence of policy buffers and tools that address financial vulnerabilities and (4) A healthier banking system capable of withstanding stress.
“JCR stated that key factors supporting the decision of affirmation the sovereign credit rating of Indonesia (1) The country’s sustainable economic growth outlook underpinned by solid domestic demand, (2) low level of public debt burden brought by prudent fiscal management, (3) reinforced resilience to external shocks by its accumulated foreign exchange reserves”
BBB / STABLE Investment Grades
May 2013
BB+ / STABLE 1 Notch closer to Investment Grades
“The rating upgrade reflects continuing iimprovements in the government's balance sheet and external liquidity, against a backdrop of a resilient economic pperformance and cautious fiscal management .”
Sources: Bank Indonesia &
BPS-Statistics Indonesia, 2013
Why Indonesia International Credit Ratings: Indonesia Snares Investment Grade
The Investment Coordinating Board of the Republic of Indonesia
12
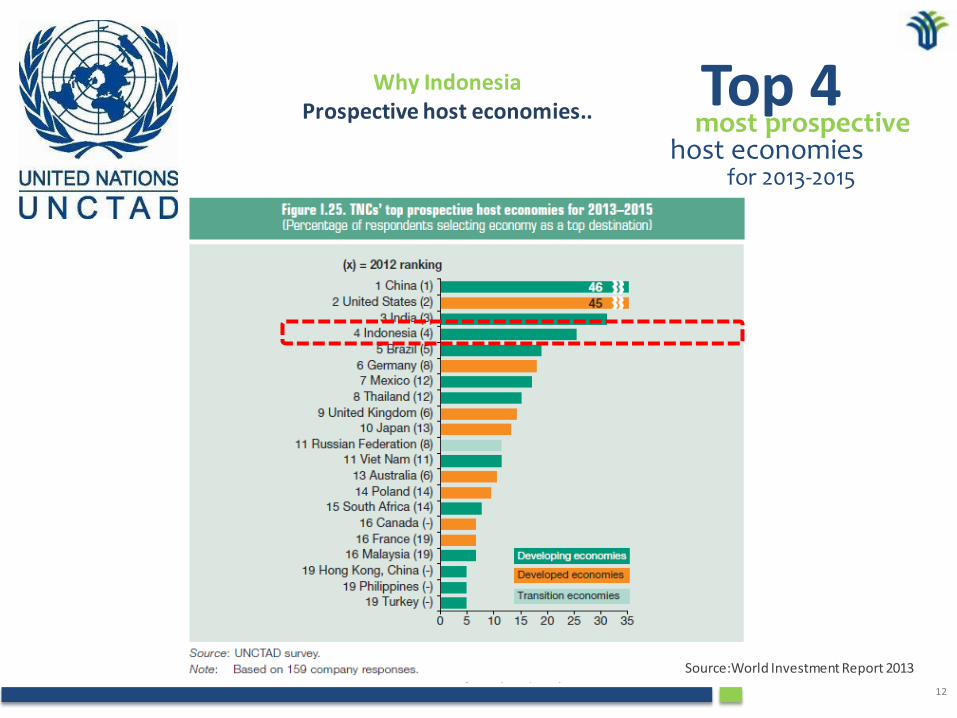
most prospective host economies for 2013-2015
Top 4
Source:World Investment Report 2013
Why Indonesia Prospective host economies..
The Investment Coordinating Board of the Republic of Indonesia
13
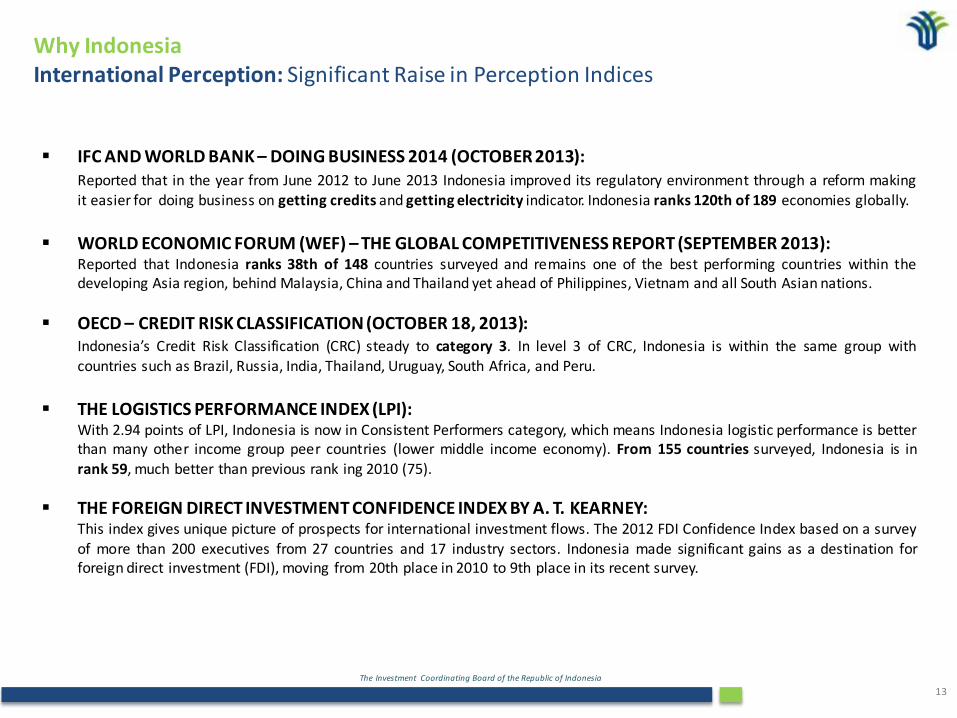
IFC AND WORLD BANK – DOING BUSINESS 2014 (OCTOBER 2013): Reported that in the year from June 2012 to June 2013 Indonesia improved its regulatory environment through a reform making
it easier for doing business on getting credits and getting electricity indicator. Indonesia ranks 120th of 189 economies globally.
WORLD ECONOMIC FORUM (WEF) – THE GLOBAL COMPETITIVENESS REPORT (SEPTEMBER 2013): Reported that Indonesia ranks 38th of 148 countries surveyed and remains one of the best performing countries within the
developing Asia region, behind Malaysia, China and Thailand yet ahead of Philippines, Vietnam and all South Asian nations.
OECD – CREDIT RISK CLASSIFICATION (OCTOBER 18, 2013): Indonesia’s Credit Risk Classification (CRC) steady to category 3. In level 3 of CRC, Indonesia is within the same group with
countries such as Brazil, Russia, India, Thailand, Uruguay, South Africa, and Peru.
THE LOGISTICS PERFORMANCE INDEX (LPI): With 2.94 points of LPI, Indonesia is now in Consistent Performers category, which means Indonesia logistic performance is better
than many other income group peer countries (lower middle income economy). From 155 countries surveyed, Indonesia is in rank 59, much better than previous rank ing 2010 (75).
THE FOREIGN DIRECT INVESTMENT CONFIDENCE INDEX BY A. T. KEARNEY: This index gives unique picture of prospects for international investment flows. The 2012 FDI Confidence Index based on a survey
of more than 200 executives from 27 countries and 17 industry sectors. Indonesia made significant gains as a destination for foreign direct investment (FDI), moving from 20th place in 2010 to 9th place in its recent survey.
Why Indonesia International Perception: Significant Raise in Perception Indices
Indonesia Investment Coordinating Board
Indonesia’s Investment Performace
The Investment Coordinating Board of the Republic of Indonesia
15
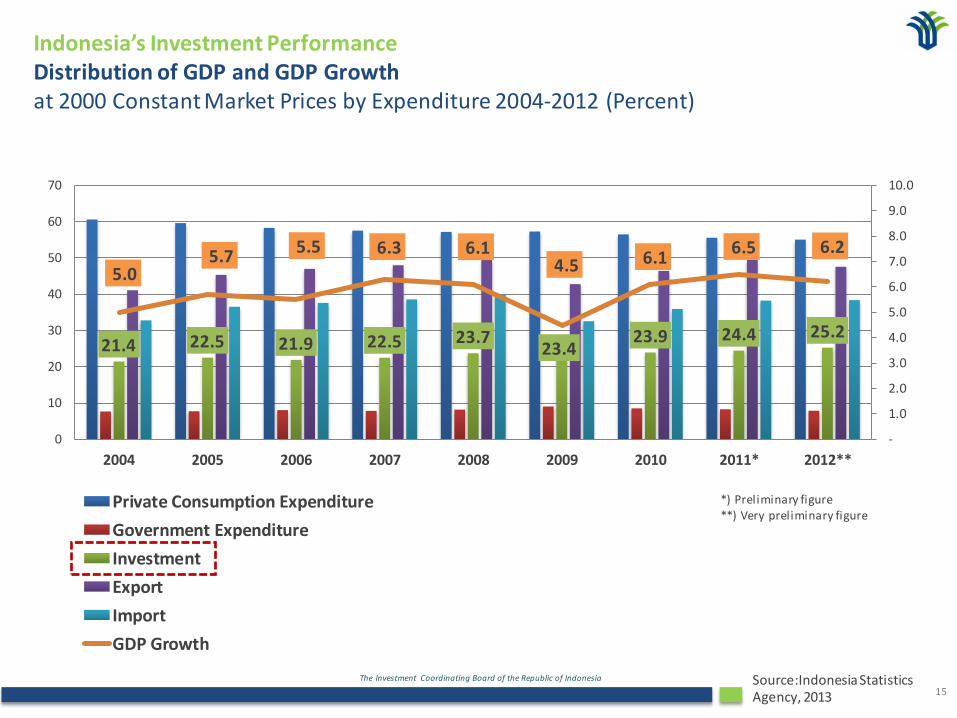
21.4 22.5 21.9 22.5 23.7 23.4
23.9 24.4 25.2
5.0 5.7
5.5 6.3 6.1 4.5 6.1
6.5 6.2
-
1.0
2.0
3.0
4.0
5.0
6.0
7.0
8.0
9.0
10.0
0
10
20
30
40
50
60
70
2004 2005 2006 2007 2008 2009 2010 2011* 2012**
Private Consumption Expenditure
Government Expenditure
Investment
Export
Import
GDP Growth
Indonesia’s Investment Performance Distribution of GDP and GDP Growth at 2000 Constant Market Prices by Expenditure 2004-2012 (Percent)
Source:Indonesia Statistics Agency, 2013
*) Preliminary figure **) Very preliminary figure
The Investment Coordinating Board of the Republic of Indonesia
16
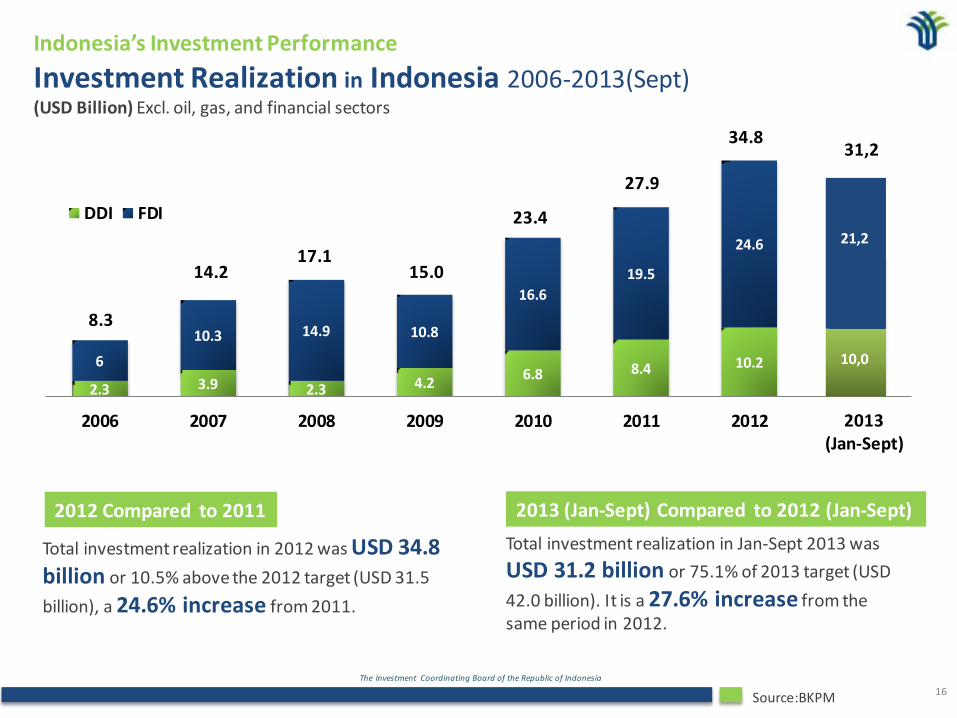
2.3 3.9 2.3 4.2 6.8 8.4 10.2
10 6
10.3 14.9 10.8
16.6
19.5
24.6
21,2
2006 2007 2008 2009 2010 2011 2012 2013 (S1)
DDI FDI
Total investment realization in 2012 was USD 34.8 billion or 10.5% above the 2012 target (USD 31.5
billion), a 24.6% increase from 2011.
Indonesia’s Investment Performance
Investment Realization in Indonesia 2006-2013(Sept) (USD Billion) Excl. oil, gas, and financial sectors
Source:BKPM
Total investment realization in Jan-Sept 2013 was
USD 31.2 billion or 75.1% of 2013 target (USD
42.0 billion). It is a 27.6% increase from the same period in 2012.
2012 Compared to 2011 2013 (Jan-Sept) Compared to 2012 (Jan-Sept)
8.3
14.2 17.1
15.0
23.4
27.9
34.8 31,2
10,0
21,2
2013 (Jan-Sept)
The Investment Coordinating Board of the Republic of Indonesia
17
Indonesia Investment Performance
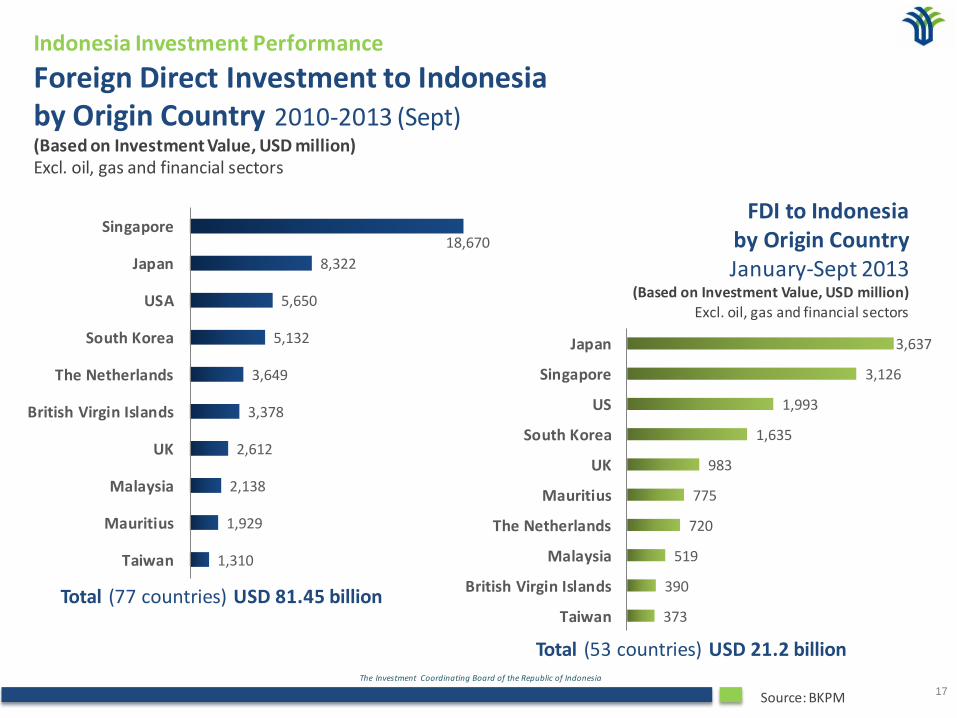
Foreign Direct Investment to Indonesia by Origin Country 2010-2013 (Sept) (Based on Investment Value, USD million) Excl. oil, gas and financial sectors
Source: BKPM
Total (77 countries) USD 81.45 billion
FDI to Indonesia by Origin Country January-Sept 2013
(Based on Investment Value, USD million)
Excl. oil, gas and financial sectors
Total (53 countries) USD 21.2 billion
1,310
1,929
2,138
2,612
3,378
3,649
5,132
5,650
8,322
18,670
Taiwan
Mauritius
Malaysia
UK
British Virgin Islands
The Netherlands
South Korea
USA
Japan
Singapore
373
390
519
720
775
983
1,635
1,993
3,126
3,637
Taiwan
British Virgin Islands
Malaysia
The Netherlands
Mauritius
UK
South Korea
US
Singapore
Japan
The Investment Coordinating Board of the Republic of Indonesia
18
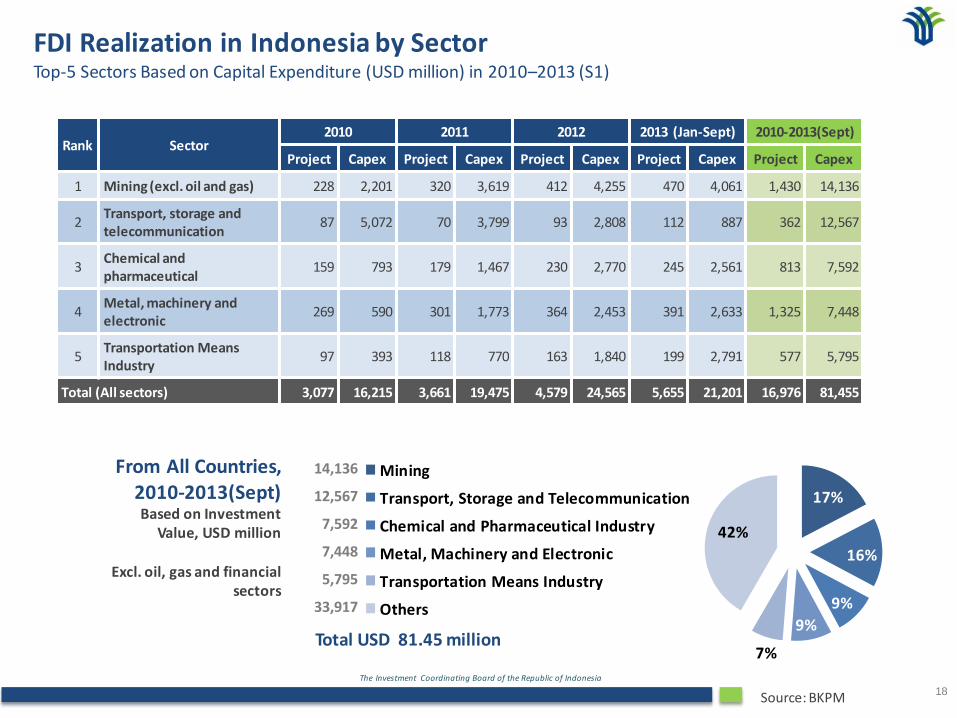
Rank Sector 2010 2011 2012 2013 (Jan-Sept) 2010-2013(Sept)
Project Capex Project Capex Project Capex Project Capex Project Capex
1 Mining (excl. oil and gas) 228 2,201 320 3,619 412 4,255 470 4,061 1,430 14,136
2 Transport, storage and telecommunication
87 5,072 70 3,799 93 2,808 112 887 362 12,567
3 Chemical and pharmaceutical
159 793 179 1,467 230 2,770 245 2,561 813 7,592
4 Metal, machinery and electronic
269 590 301 1,773 364 2,453 391 2,633 1,325 7,448
5 Transportation Means Industry
97 393 118 770 163 1,840 199 2,791 577 5,795
Total (All sectors) 3,077 16,215 3,661 19,475 4,579 24,565 5,655 21,201 16,976 81,455
FDI Realization in Indonesia by Sector Top-5 Sectors Based on Capital Expenditure (USD million) in 2010–2013 (S1)
Source: BKPM
From All Countries, 2010-2013(Sept) Based on Investment
Value, USD million
Excl. oil, gas and financial
sectors
Total USD 81.45 million
17%
16%
9%
9%
7%
42%
Mining
Transport, Storage and Telecommunication
Chemical and Pharmaceutical Industry
Metal, Machinery and Electronic
Transportation Means Industry
Others
14,136
12,567
7,592
7,448
5,795
33,917
The Investment Coordinating Board of the Republic of Indonesia
19
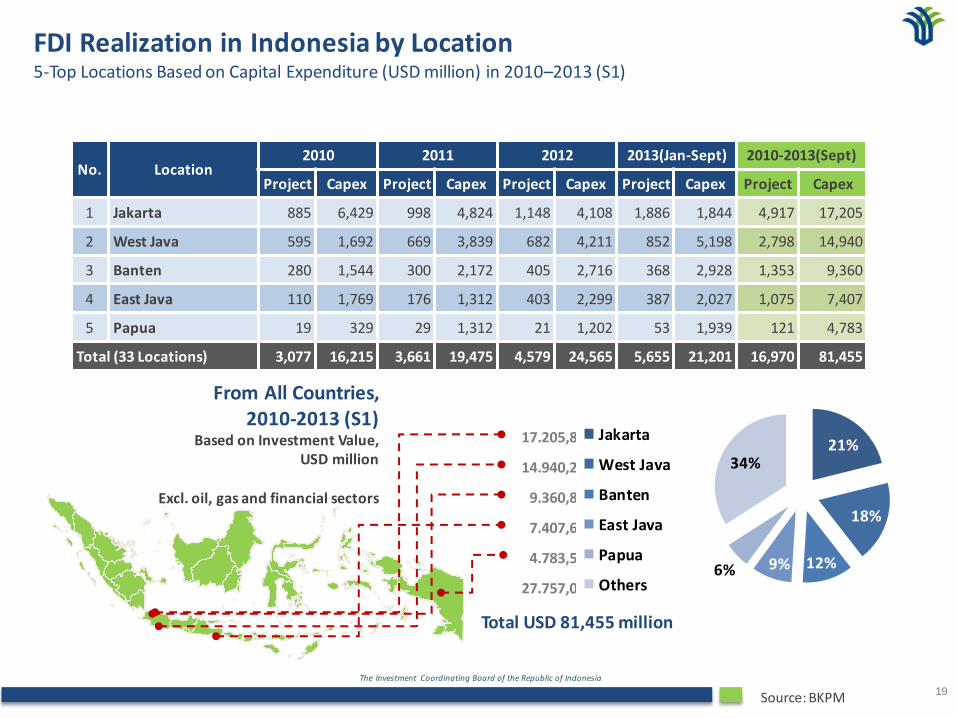
No. Location 2010 2011 2012 2013(Jan-Sept) 2010-2013(Sept)
Project Capex Project Capex Project Capex Project Capex Project Capex
1 Jakarta 885 6,429 998 4,824 1,148 4,108 1,886 1,844 4,917 17,205
2 West Java 595 1,692 669 3,839 682 4,211 852 5,198 2,798 14,940
3 Banten 280 1,544 300 2,172 405 2,716 368 2,928 1,353 9,360
4 East Java 110 1,769 176 1,312 403 2,299 387 2,027 1,075 7,407
5 Papua 19 329 29 1,312 21 1,202 53 1,939 121 4,783
Total (33 Locations) 3,077 16,215 3,661 19,475 4,579 24,565 5,655 21,201 16,970 81,455
Source: BKPM
FDI Realization in Indonesia by Location 5-Top Locations Based on Capital Expenditure (USD million) in 2010–2013 (S1)
From All Countries, 2010-2013 (S1)
Based on Investment Value, USD million
Excl. oil, gas and financial sectors
Total USD 81,455 million
21%
18%
12% 9% 6%
34%
Jakarta
West Java
Banten
East Java
Papua
Others
17.205,8
14.940,2
9.360,8
7.407,6
4.783,5
27.757,0
Indonesia Investment Coordinating Board
Investment Updates (Regulations & Incentives)
Indonesia Investment Coordinating Board
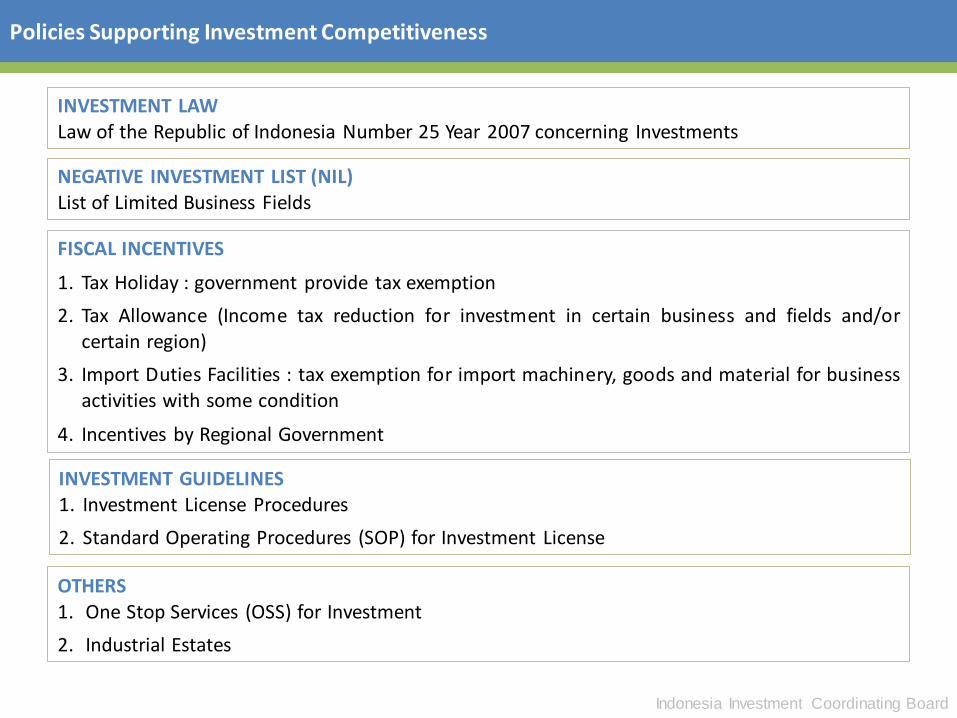
Policies Supporting Investment Competitiveness
FISCAL INCENTIVES
1. Tax Holiday : government provide tax exemption
2. Tax Allowance (Income tax reduction for investment in certain business and fields and/or certain region)
3. Import Duties Facilities : tax exemption for import machinery, goods and material for business activities with some condition
4. Incentives by Regional Government
NEGATIVE INVESTMENT LIST (NIL) List of Limited Business Fields
INVESTMENT LAW Law of the Republic of Indonesia Number 25 Year 2007 concerning Investments
INVESTMENT GUIDELINES 1. Investment License Procedures
2. Standard Operating Procedures (SOP) for Investment License
OTHERS 1. One Stop Services (OSS) for Investment
2. Industrial Estates
Indonesia Investment Coordinating Board
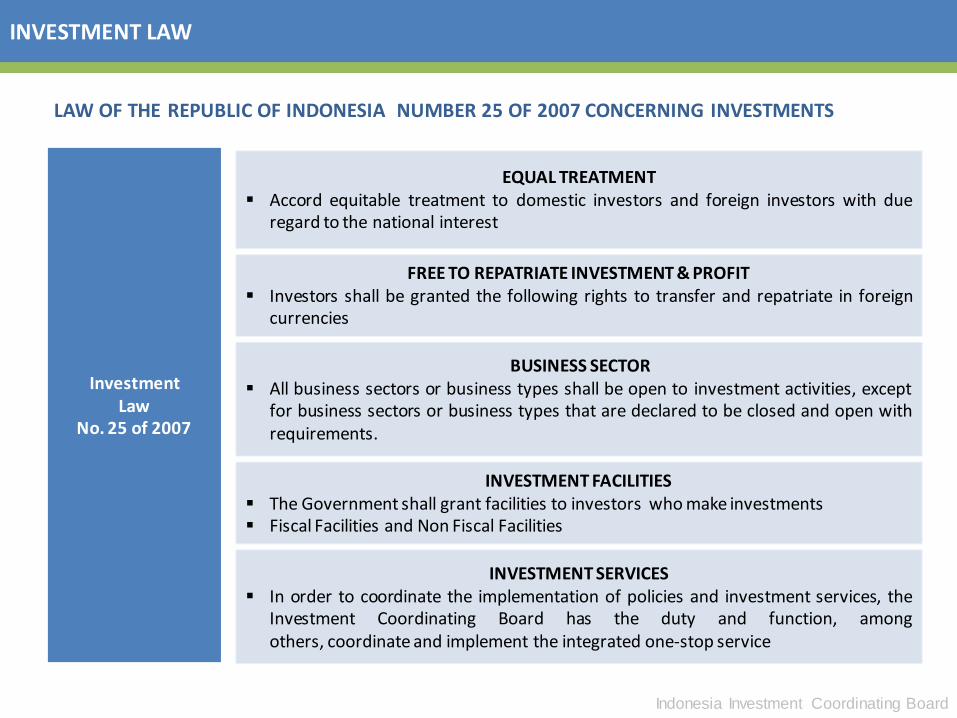
INVESTMENT LAW
FREE TO REPATRIATE INVESTMENT & PROFIT Investors shall be granted the following rights to transfer and repatriate in foreign
currencies
EQUAL TREATMENT Accord equitable treatment to domestic investors and foreign investors with due
regard to the national interest
Investment Law
No. 25 of 2007
INVESTMENT FACILITIES The Government shall grant facilities to investors who make investments Fiscal Facilities and Non Fiscal Facilities
BUSINESS SECTOR All business sectors or business types shall be open to investment activities, except
for business sectors or business types that are declared to be closed and open with requirements.
LAW OF THE REPUBLIC OF INDONESIA NUMBER 25 OF 2007 CONCERNING INVESTMENTS
INVESTMENT SERVICES In order to coordinate the implementation of policies and investment services, the
Investment Coordinating Board has the duty and function, among others, coordinate and implement the integrated one-stop service
Indonesia Investment Coordinating Board
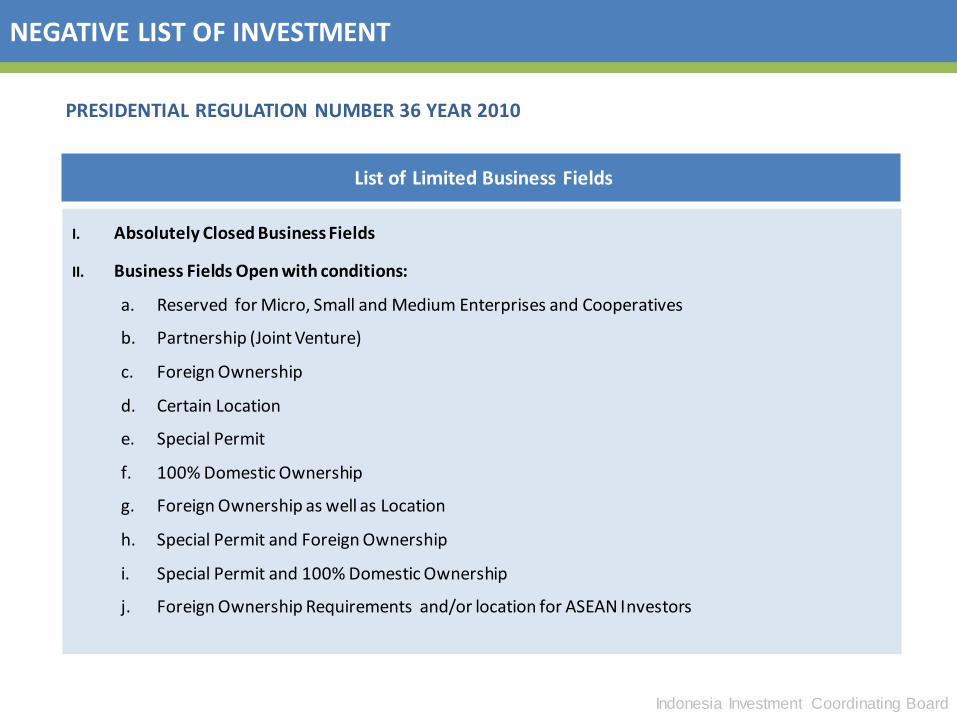
NEGATIVE LIST OF INVESTMENT
I. Absolutely Closed Business Fields
II. Business Fields Open with conditions:
a. Reserved for Micro, Small and Medium Enterprises and Cooperatives
b. Partnership (Joint Venture)
c. Foreign Ownership
d. Certain Location
e. Special Permit
f. 100% Domestic Ownership
g. Foreign Ownership as well as Location
h. Special Permit and Foreign Ownership
i. Special Permit and 100% Domestic Ownership
j. Foreign Ownership Requirements and/or location for ASEAN Investors
List of Limited Business Fields
PRESIDENTIAL REGULATION NUMBER 36 YEAR 2010
Indonesia Investment Coordinating Board
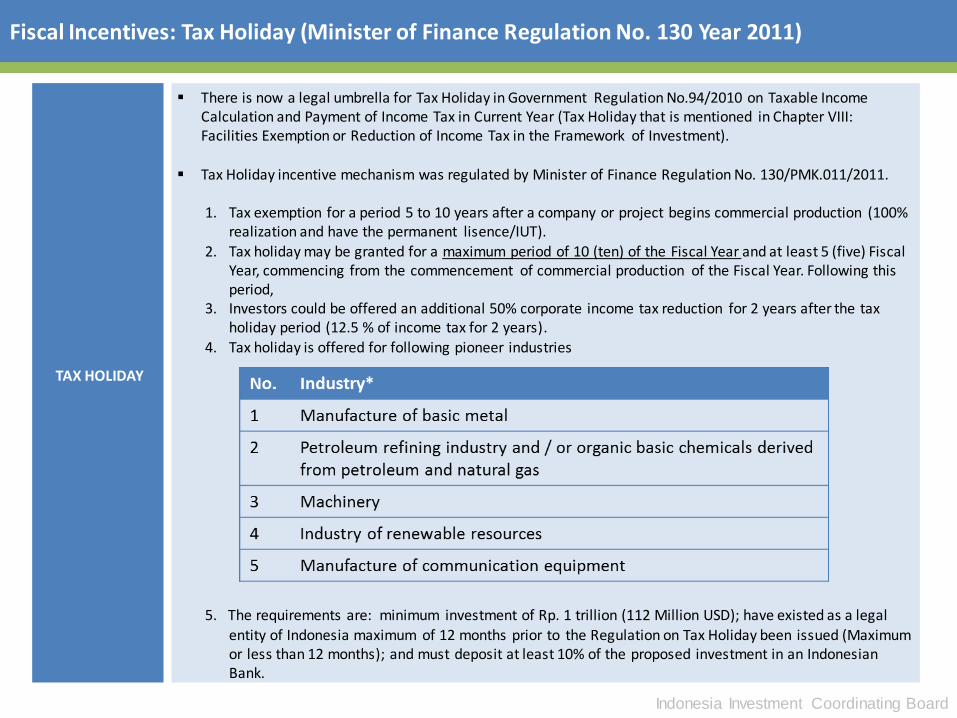
TAX HOLIDAY
There is now a legal umbrella for Tax Holiday in Government Regulation No.94/2010 on Taxable Income Calculation and Payment of Income Tax in Current Year (Tax Holiday that is mentioned in Chapter VIII: Facilities Exemption or Reduction of Income Tax in the Framework of Investment).
Tax Holiday incentive mechanism was regulated by Minister of Finance Regulation No. 130/PMK.011/2011.
1. Tax exemption for a period 5 to 10 years after a company or project begins commercial production (100% realization and have the permanent lisence/IUT).
2. Tax holiday may be granted for a maximum period of 10 (ten) of the Fiscal Year and at least 5 (five) Fiscal Year, commencing from the commencement of commercial production of the Fiscal Year. Following this period,
3. Investors could be offered an additional 50% corporate income tax reduction for 2 years after the tax holiday period (12.5 % of income tax for 2 years).
4. Tax holiday is offered for following pioneer industries 5. The requirements are: minimum investment of Rp. 1 trillion (112 Million USD); have existed as a legal
entity of Indonesia maximum of 12 months prior to the Regulation on Tax Holiday been issued (Maximum or less than 12 months); and must deposit at least 10% of the proposed investment in an Indonesian Bank.
Fiscal Incentives: Tax Holiday (Minister of Finance Regulation No. 130 Year 2011)
Indonesia Investment Coordinating Board
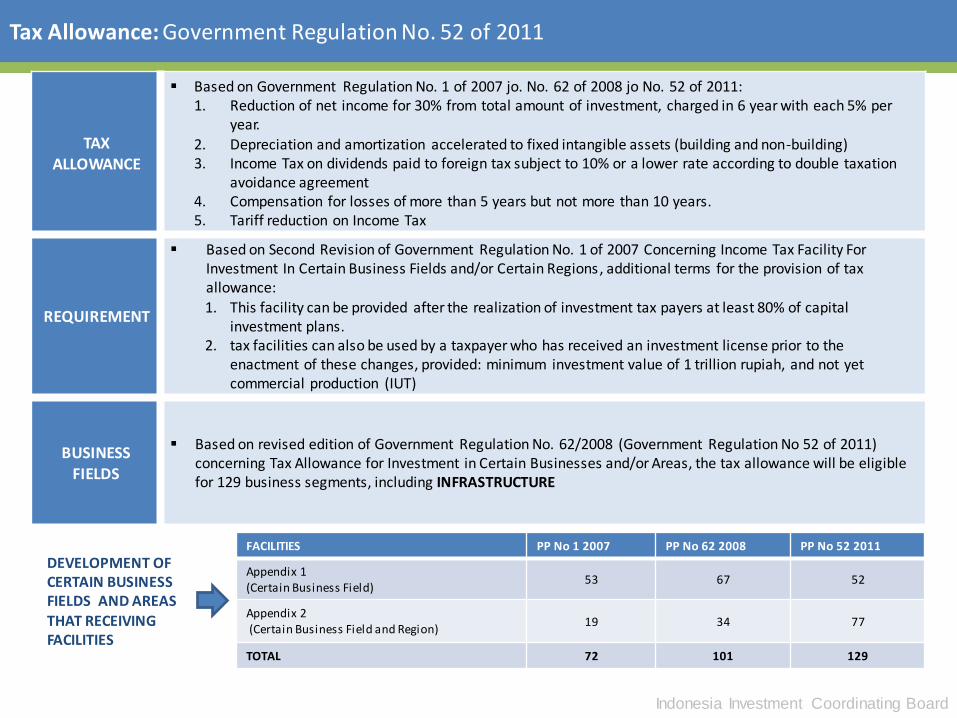
Tax Allowance: Government Regulation No. 52 of 2011
TAX ALLOWANCE
Based on Government Regulation No. 1 of 2007 jo. No. 62 of 2008 jo No. 52 of 2011: 1. Reduction of net income for 30% from total amount of investment, charged in 6 year with each 5% per
year.
2. Depreciation and amortization accelerated to fixed intangible assets (building and non-building) 3. Income Tax on dividends paid to foreign tax subject to 10% or a lower rate according to double taxation
avoidance agreement 4. Compensation for losses of more than 5 years but not more than 10 years. 5. Tariff reduction on Income Tax
REQUIREMENT
Based on Second Revision of Government Regulation No. 1 of 2007 Concerning Income Tax Facility For Investment In Certain Business Fields and/or Certain Regions, additional terms for the provision of tax allowance: 1. This facility can be provided after the realization of investment tax payers at least 80% of capital
investment plans. 2. tax facilities can also be used by a taxpayer who has received an investment license prior to the
enactment of these changes, provided: minimum investment value of 1 trillion rupiah, and not yet commercial production (IUT)
BUSINESS FIELDS
Based on revised edition of Government Regulation No. 62/2008 (Government Regulation No 52 of 2011) concerning Tax Allowance for Investment in Certain Businesses and/or Areas, the tax allowance will be eligible for 129 business segments, including INFRASTRUCTURE
FACILITIES PP No 1 2007 PP No 62 2008 PP No 52 2011
Appendix 1 (Certain Business Field)
53 67 52
Appendix 2 (Certain Business Field and Region)
19 34 77
TOTAL 72 101 129
DEVELOPMENT OF CERTAIN BUSINESS FIELDS AND AREAS THAT RECEIVING FACILITIES
Indonesia Investment Coordinating Board
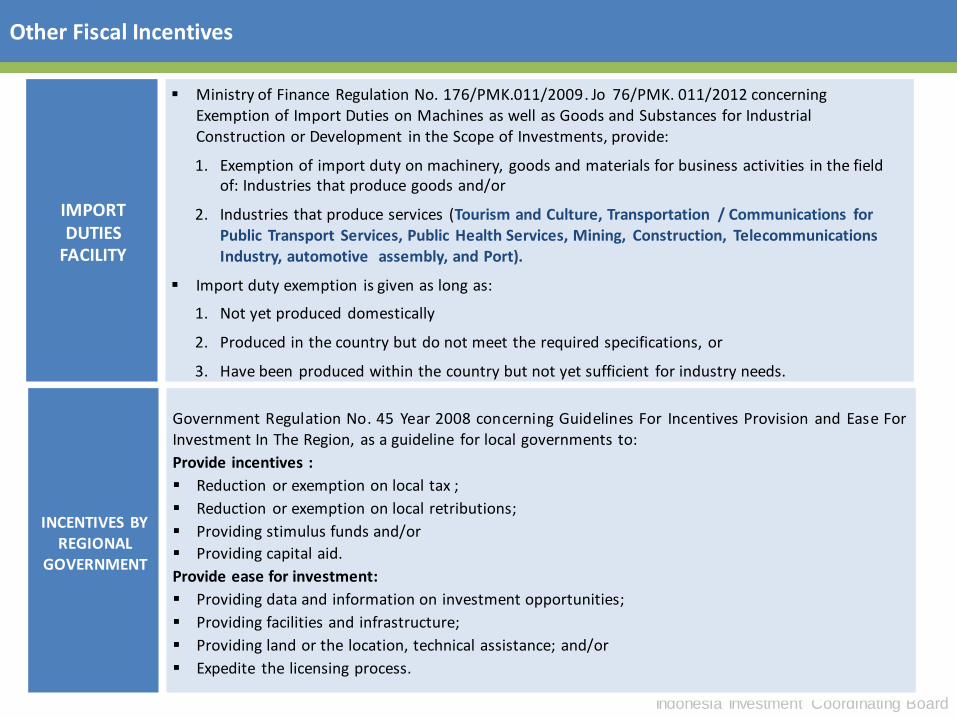
Other Fiscal Incentives
IMPORT DUTIES
FACILITY
Ministry of Finance Regulation No. 176/PMK.011/2009. Jo 76/PMK. 011/2012 concerning Exemption of Import Duties on Machines as well as Goods and Substances for Industrial Construction or Development in the Scope of Investments, provide:
1. Exemption of import duty on machinery, goods and materials for business activities in the field of: Industries that produce goods and/or
2. Industries that produce services (Tourism and Culture, Transportation / Communications for Public Transport Services, Public Health Services, Mining, Construction, Telecommunications Industry, automotive assembly, and Port).
Import duty exemption is given as long as:
1. Not yet produced domestically
2. Produced in the country but do not meet the required specifications, or
3. Have been produced within the country but not yet sufficient for industry needs.
INCENTIVES BY REGIONAL
GOVERNMENT
Government Regulation No. 45 Year 2008 concerning Guidelines For Incentives Provision and Ease For Investment In The Region, as a guideline for local governments to:
Provide incentives :
Reduction or exemption on local tax ;
Reduction or exemption on local retributions;
Providing stimulus funds and/or
Providing capital aid.
Provide ease for investment:
Providing data and information on investment opportunities;
Providing facilities and infrastructure;
Providing land or the location, technical assistance; and/or
Expedite the licensing process.
Indonesia Investment Coordinating Board
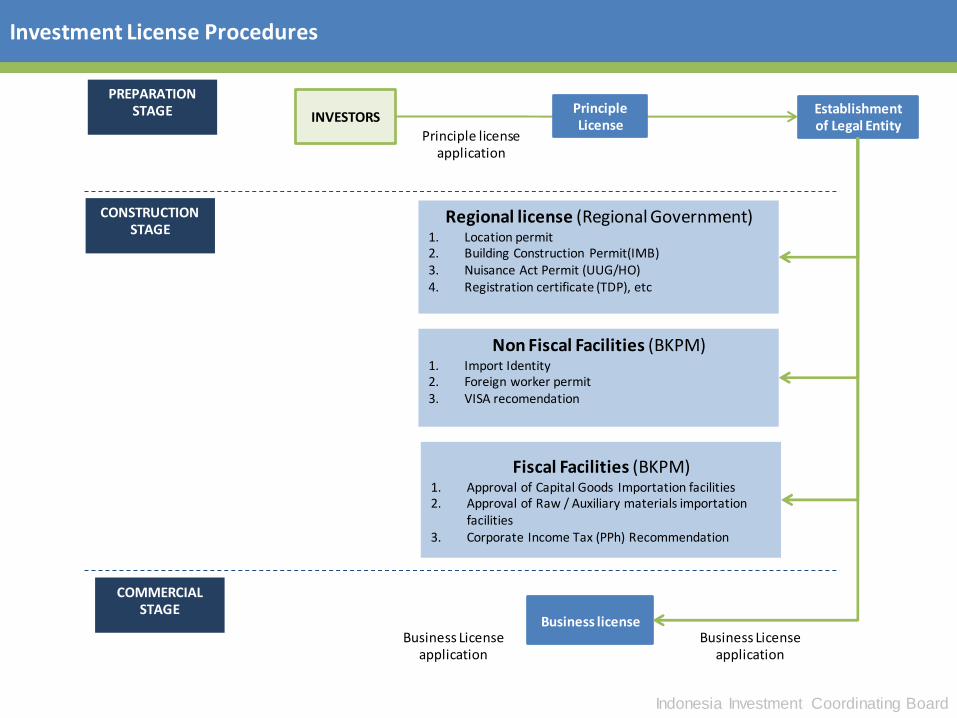
Investment License Procedures
Establishment of Legal Entity
Regional license (Regional Government) 1. Location permit 2. Building Construction Permit(IMB) 3. Nuisance Act Permit (UUG/HO) 4. Registration certificate (TDP), etc
Non Fiscal Facilities (BKPM) 1. Import Identity 2. Foreign worker permit 3. VISA recomendation
Fiscal Facilities (BKPM) 1. Approval of Capital Goods Importation facilities 2. Approval of Raw / Auxiliary materials importation
facilities 3. Corporate Income Tax (PPh) Recommendation
Business license
Principle license application
Business License application
COMMERCIAL STAGE
PREPARATION STAGE
CONSTRUCTION STAGE
INVESTORS
Business License application
Principle License
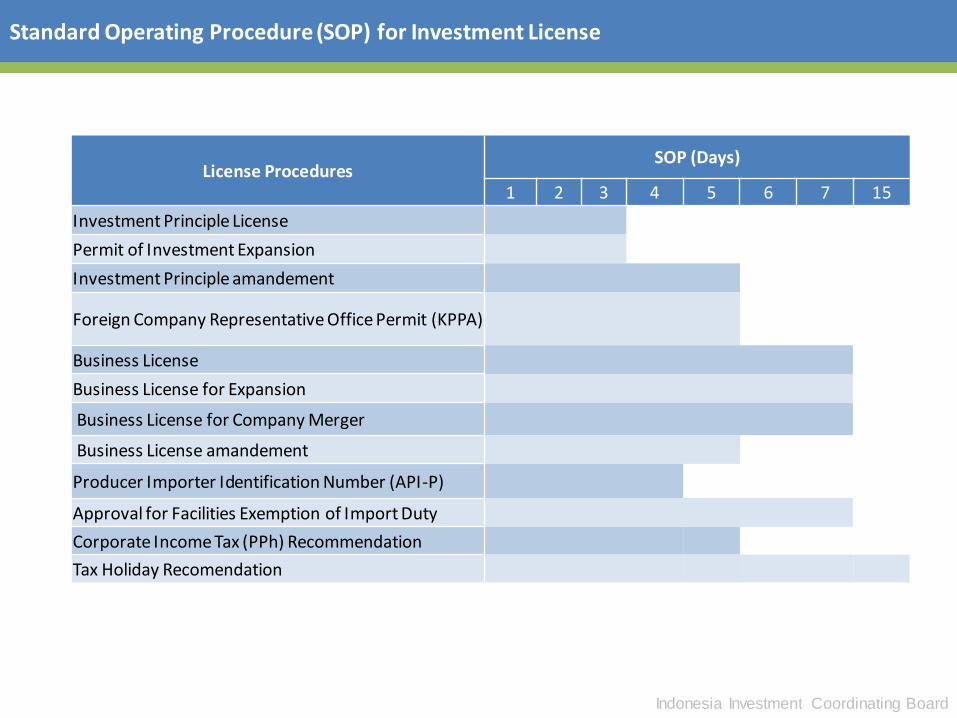
Indonesia Investment Coordinating Board
License Procedures SOP (Days)
1 2 3 4 5 6 7 15
Investment Principle License
Permit of Investment Expansion
Investment Principle amandement
Foreign Company Representative Office Permit (KPPA)
Business License
Business License for Expansion
Business License for Company Merger
Business License amandement
Producer Importer Identification Number (API-P)
Approval for Facilities Exemption of Import Duty
Corporate Income Tax (PPh) Recommendation
Tax Holiday Recomendation
Standard Operating Procedure (SOP) for Investment License
Indonesia Investment Coordinating Board
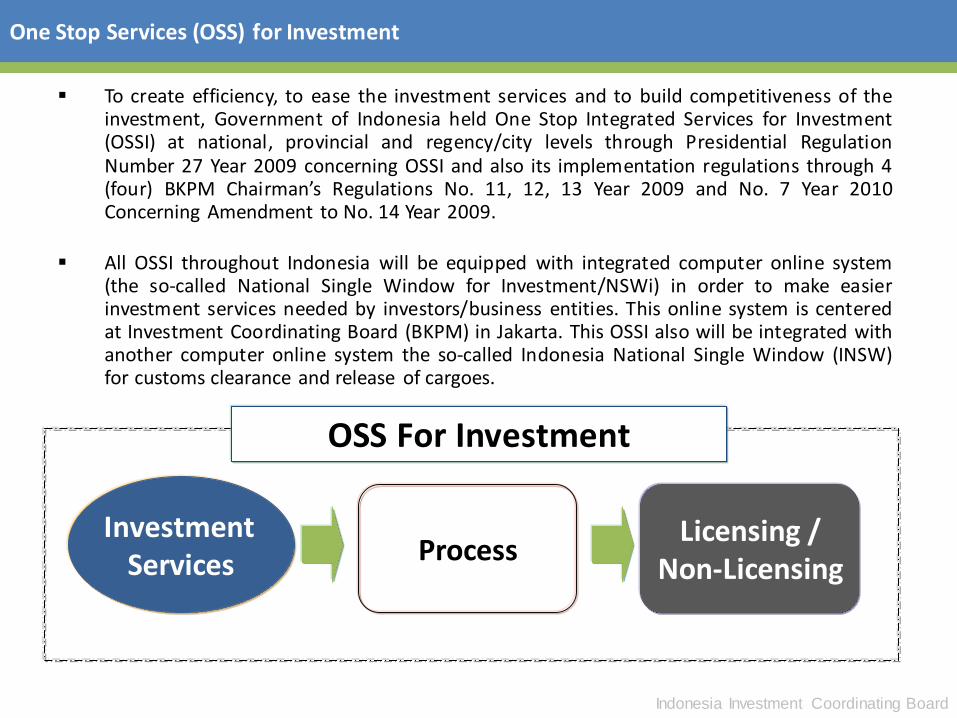
To create efficiency, to ease the investment services and to build competitiveness of the investment, Government of Indonesia held One Stop Integrated Services for Investment (OSSI) at national, provincial and regency/city levels through Presidential Regulation Number 27 Year 2009 concerning OSSI and also its implementation regulations through 4 (four) BKPM Chairman’s Regulations No. 11, 12, 13 Year 2009 and No. 7 Year 2010 Concerning Amendment to No. 14 Year 2009.
All OSSI throughout Indonesia will be equipped with integrated computer online system (the so-called National Single Window for Investment/NSWi) in order to make easier investment services needed by investors/business entities. This online system is centered at Investment Coordinating Board (BKPM) in Jakarta. This OSSI also will be integrated with another computer online system the so-called Indonesia National Single Window (INSW) for customs clearance and release of cargoes.
OSS For Investment
Investment Services Process
Licensing / Non-Licensing
One Stop Services (OSS) for Investment
Indonesia Investment Coordinating Board
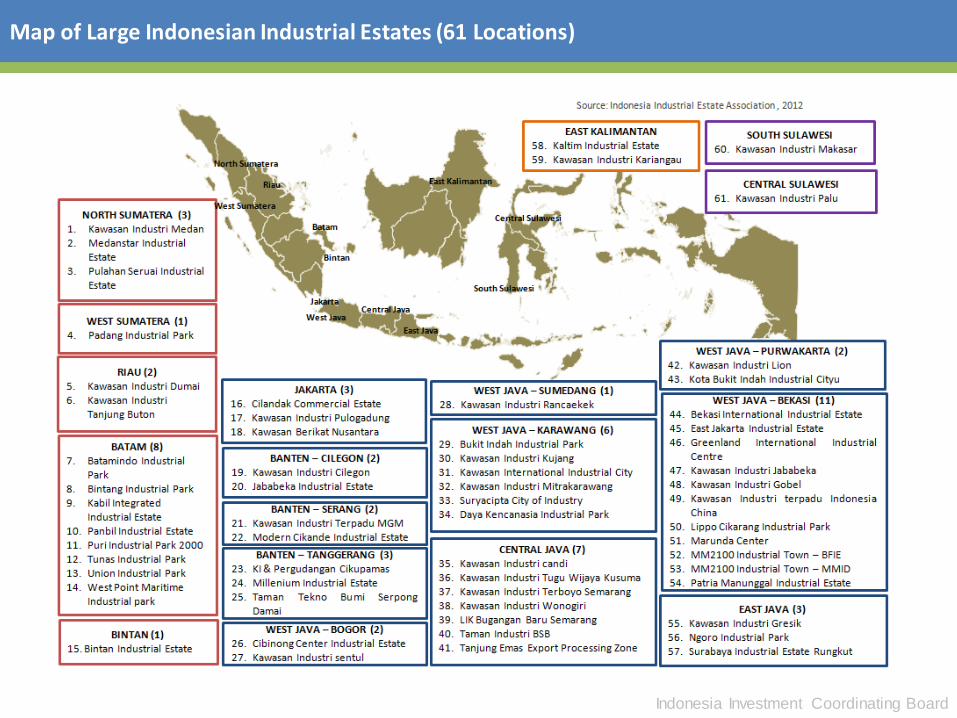
Map of Large Indonesian Industrial Estates (61 Locations)
Indonesia Investment Coordinating Board
Investment Opportunities
1
2
3
4
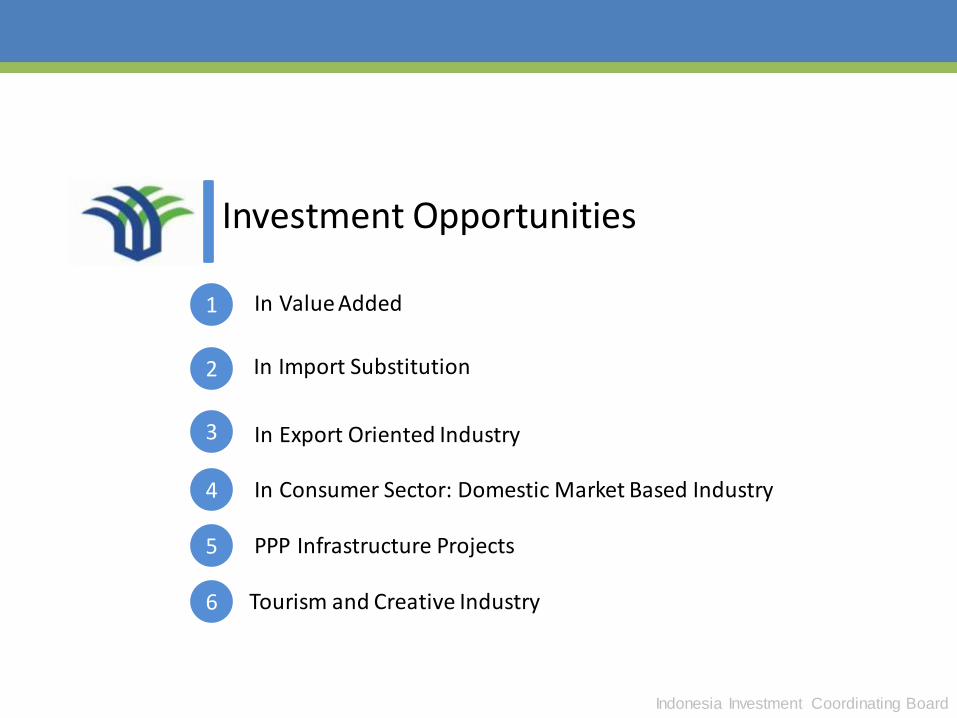
In Value Added
In Import Substitution
In Consumer Sector: Domestic Market Based Industry
5 PPP Infrastructure Projects
In Export Oriented Industry
6 Tourism and Creative Industry
Indonesia Investment Coordinating Board
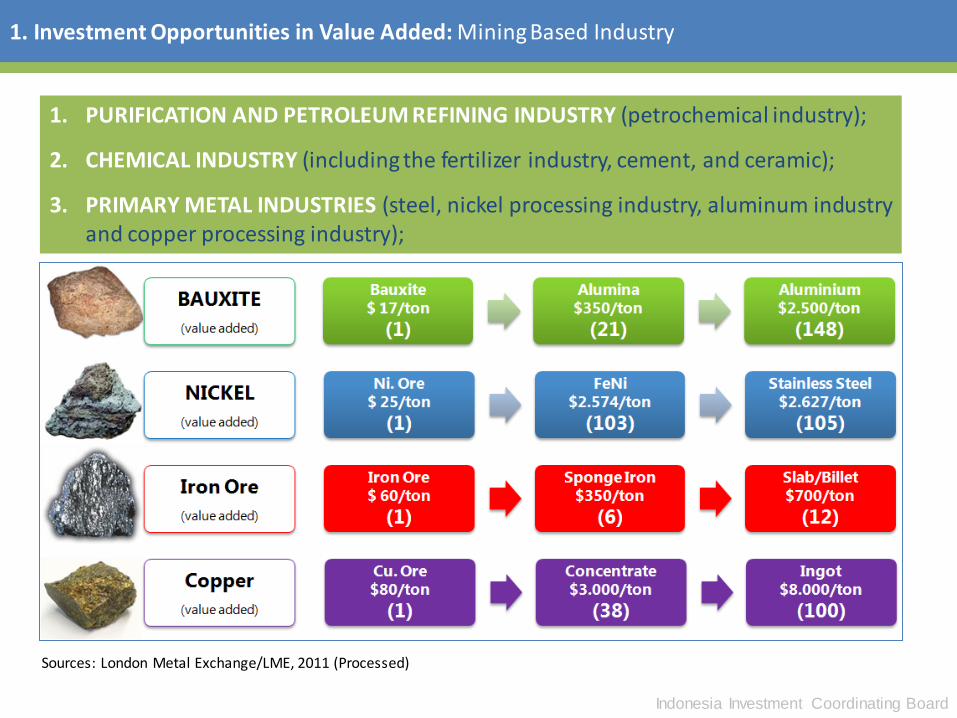
1. Investment Opportunities in Value Added: Mining Based Industry
1. PURIFICATION AND PETROLEUM REFINING INDUSTRY (petrochemical industry);
2. CHEMICAL INDUSTRY (including the fertilizer industry, cement, and ceramic);
3. PRIMARY METAL INDUSTRIES (steel, nickel processing industry, aluminum industry and copper processing industry);
Sources: London Metal Exchange/LME, 2011 (Processed)
Indonesia Investment Coordinating Board
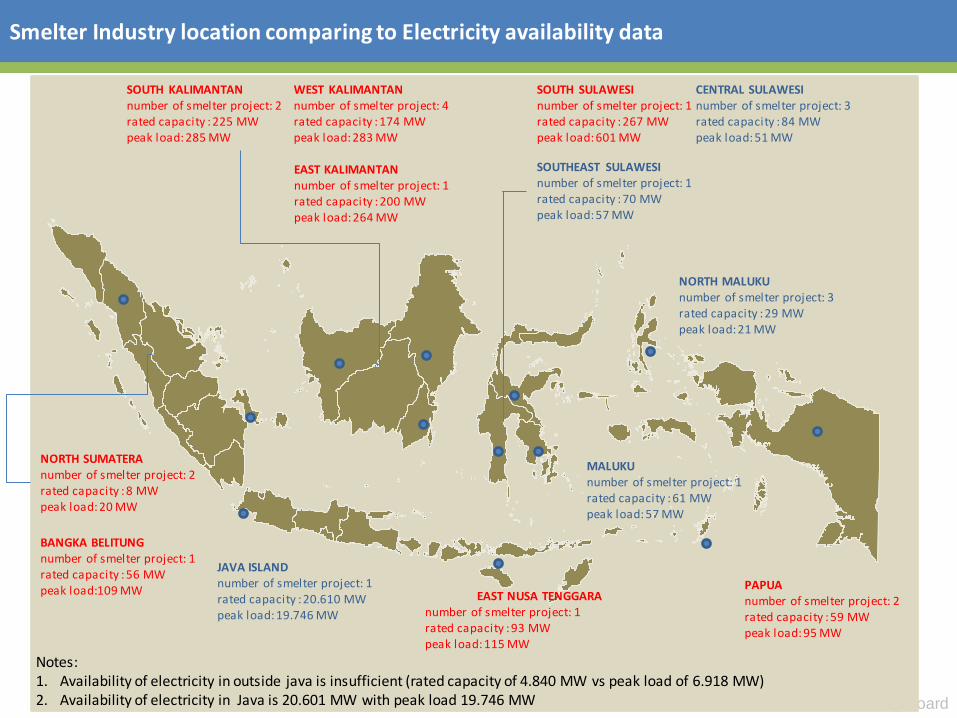
Smelter Industry location comparing to Electricity availability data
NORTH SUMATERA number of smelter project: 2 rated capacity : 8 MW peak load: 20 MW
BANGKA BELITUNG number of smelter project: 1 rated capacity : 56 MW peak load:109 MW
JAVA ISLAND number of smelter project: 1 rated capacity : 20.610 MW peak load: 19.746 MW
EAST NUSA TENGGARA number of smelter project: 1 rated capacity : 93 MW peak load: 115 MW
EAST KALIMANTAN number of smelter project: 1 rated capacity : 200 MW peak load: 264 MW
SOUTH KALIMANTAN number of smelter project: 2 rated capacity : 225 MW peak load: 285 MW
WEST KALIMANTAN number of smelter project: 4 rated capacity : 174 MW peak load: 283 MW
SOUTHEAST SULAWESI number of smelter project: 1 rated capacity : 70 MW peak load: 57 MW
CENTRAL SULAWESI number of smelter project: 3 rated capacity : 84 MW peak load: 51 MW
SOUTH SULAWESI number of smelter project: 1 rated capacity : 267 MW peak load: 601 MW
PAPUA number of smelter project: 2 rated capacity : 59 MW peak load: 95 MW
NORTH MALUKU number of smelter project: 3 rated capacity : 29 MW peak load: 21 MW
MALUKU number of smelter project: 1 rated capacity : 61 MW peak load: 57 MW
Notes: 1. Availability of electricity in outside java is insufficient (rated capacity of 4.840 MW vs peak load of 6.918 MW) 2. Availability of electricity in Java is 20.601 MW with peak load 19.746 MW
Indonesia Investment Coordinating Board
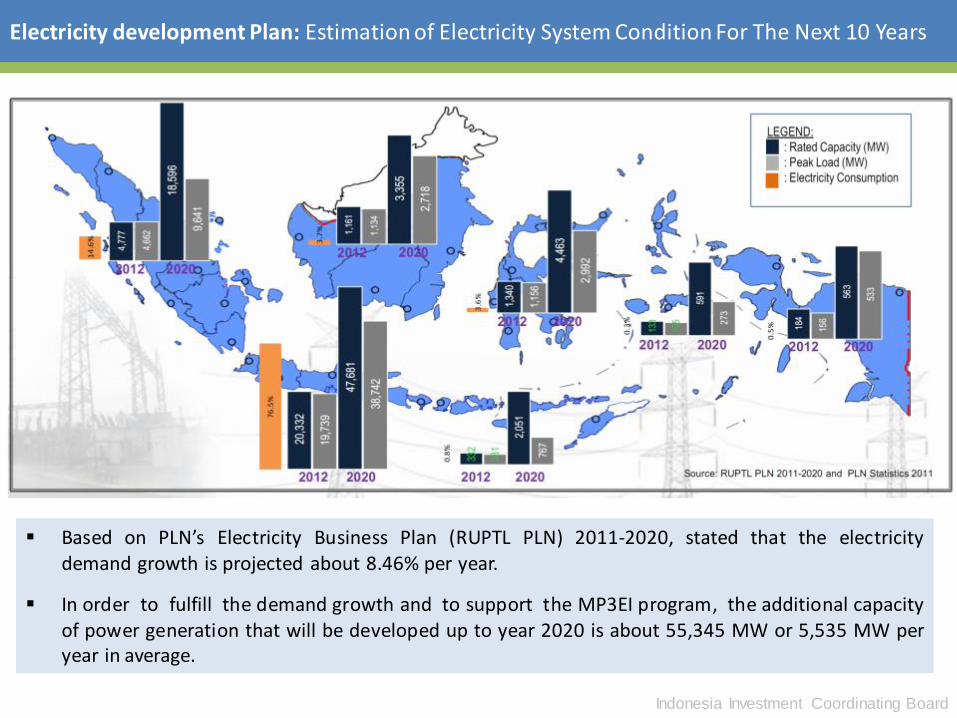
Electricity development Plan: Estimation of Electricity System Condition For The Next 10 Years
Based on PLN’s Electricity Business Plan (RUPTL PLN) 2011-2020, stated that the electricity demand growth is projected about 8.46% per year.
In order to fulfill the demand growth and to support the MP3EI program, the additional capacity of power generation that will be developed up to year 2020 is about 55,345 MW or 5,535 MW per year in average.
Indonesia Investment Coordinating Board
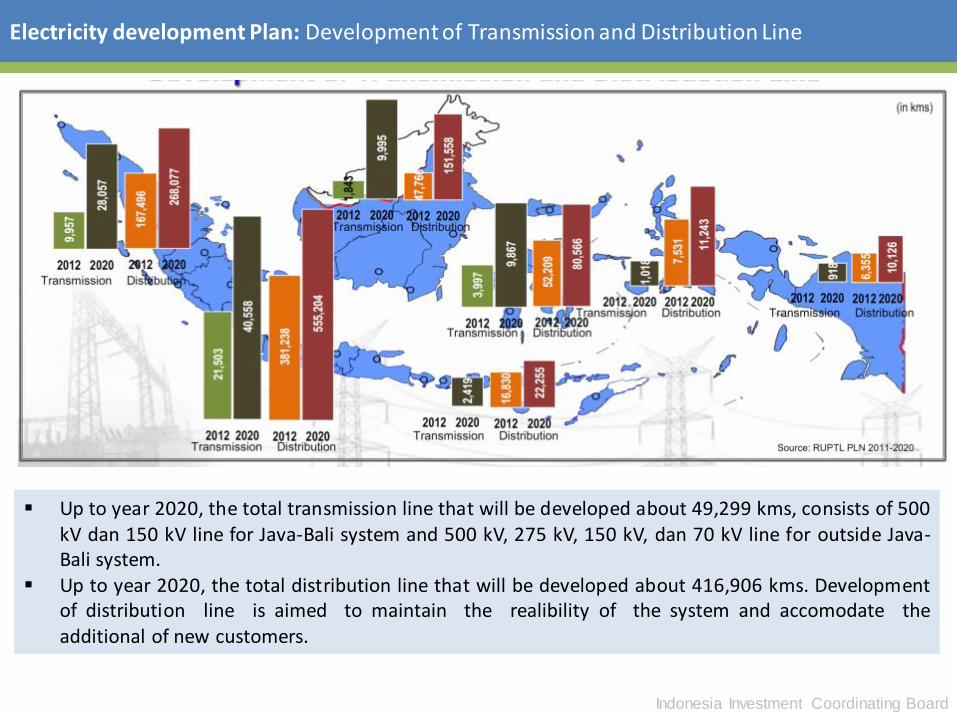
Electricity development Plan: Development of Transmission and Distribution Line
Up to year 2020, the total transmission line that will be developed about 49,299 kms, consists of 500 kV dan 150 kV line for Java-Bali system and 500 kV, 275 kV, 150 kV, dan 70 kV line for outside Java-Bali system.
Up to year 2020, the total distribution line that will be developed about 416,906 kms. Development of distribution line is aimed to maintain the realibility of the system and accomodate the additional of new customers.
Indonesia Investment Coordinating Board
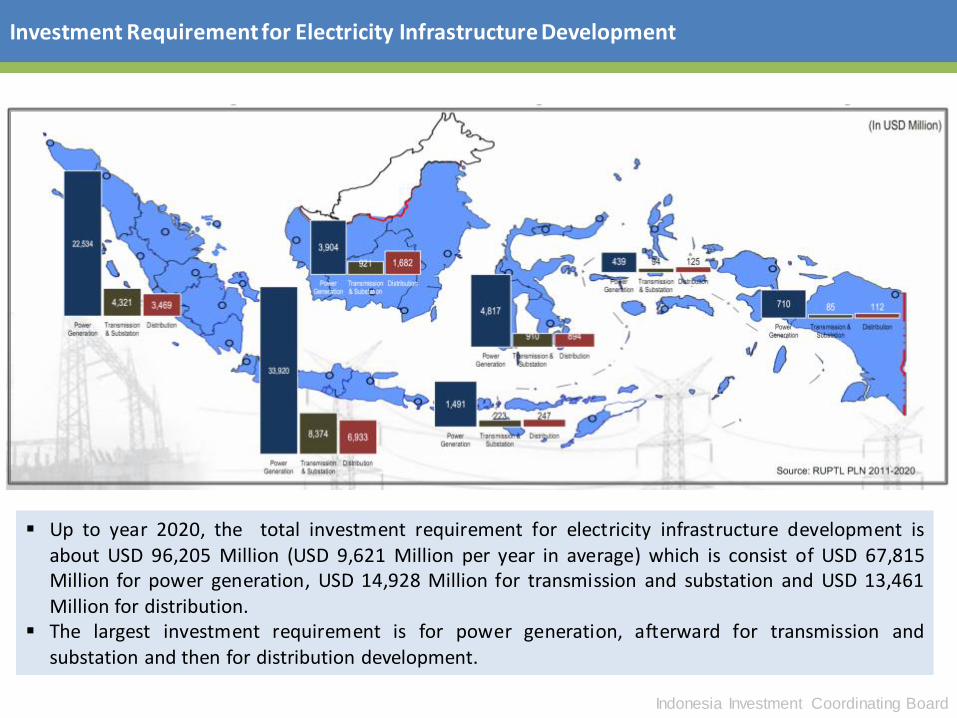
Investment Requirement for Electricity Infrastructure Development
Up to year 2020, the total investment requirement for electricity infrastructure development is about USD 96,205 Million (USD 9,621 Million per year in average) which is consist of USD 67,815 Million for power generation, USD 14,928 Million for transmission and substation and USD 13,461 Million for distribution.
The largest investment requirement is for power generation, afterward for transmission and substation and then for distribution development.
Indonesia Investment Coordinating Board
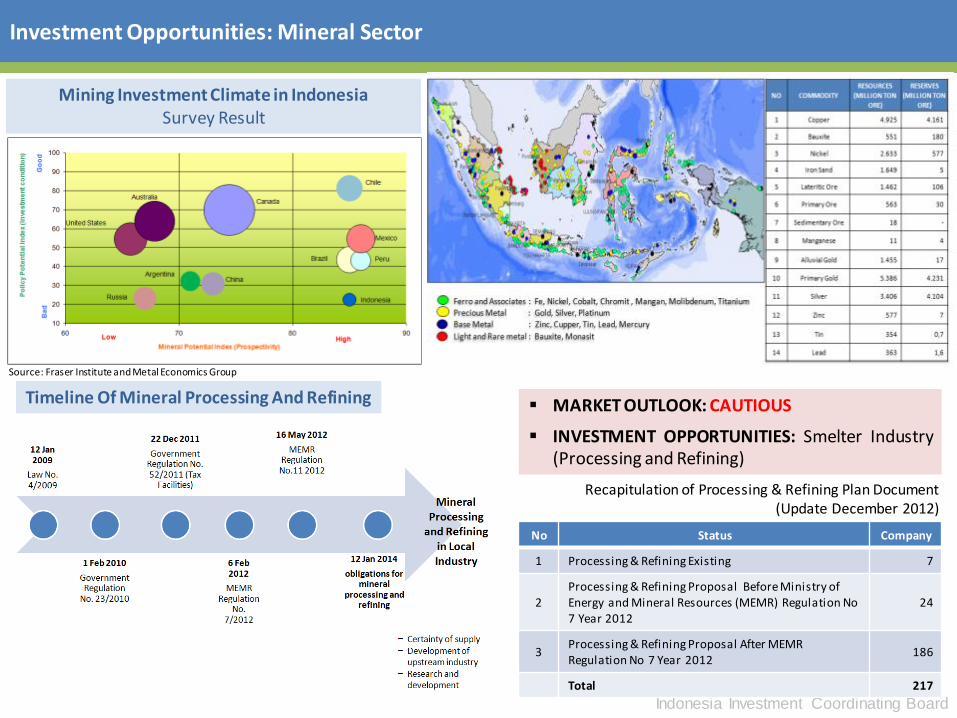
Investment Opportunities: Mineral Sector
Mining Investment Climate in Indonesia Survey Result
Source: Fraser Institute and Metal Economics Group
No Status Company
1 Processing & Refining Existing 7
2 Processing & Refining Proposal Before Ministry of Energy and Mineral Resources (MEMR) Regulation No 7 Year 2012
24
3 Processing & Refining Proposal After MEMR Regulation No 7 Year 2012
186
Total 217
Timeline Of Mineral Processing And Refining MARKET OUTLOOK: CAUTIOUS
INVESTMENT OPPORTUNITIES: Smelter Industry (Processing and Refining)
Recapitulation of Processing & Refining Plan Document (Update December 2012)
Indonesia Investment Coordinating Board
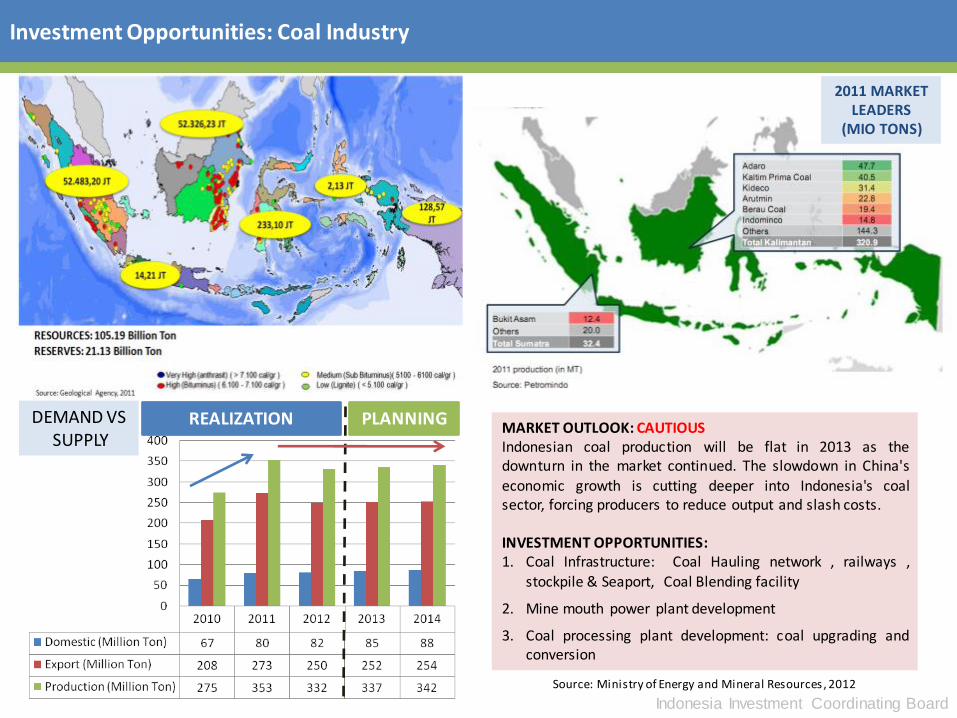
Investment Opportunities: Coal Industry
Source: Ministry of Energy and Mineral Resources , 2012
2011 MARKET LEADERS
(MIO TONS)
MARKET OUTLOOK: CAUTIOUS Indonesian coal production will be flat in 2013 as the downturn in the market continued. The slowdown in China's
economic growth is cutting deeper into Indonesia's coal sector, forcing producers to reduce output and slash costs. INVESTMENT OPPORTUNITIES: 1. Coal Infrastructure: Coal Hauling network , railways ,
stockpile & Seaport, Coal Blending facility
2. Mine mouth power plant development
3. Coal processing plant development: coal upgrading and conversion
REALIZATION PLANNING DEMAND VS SUPPLY
Indonesia Investment Coordinating Board
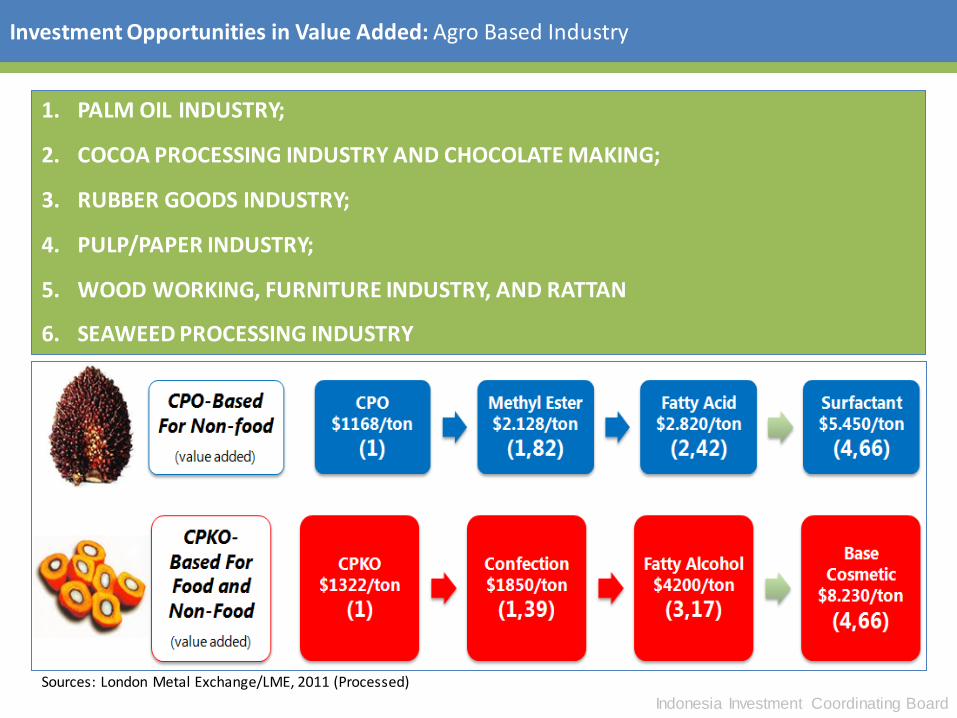
Investment Opportunities in Value Added: Agro Based Industry
1. PALM OIL INDUSTRY;
2. COCOA PROCESSING INDUSTRY AND CHOCOLATE MAKING;
3. RUBBER GOODS INDUSTRY;
4. PULP/PAPER INDUSTRY;
5. WOOD WORKING, FURNITURE INDUSTRY, AND RATTAN
6. SEAWEED PROCESSING INDUSTRY
Sources: London Metal Exchange/LME, 2011 (Processed)
Indonesia Investment Coordinating Board
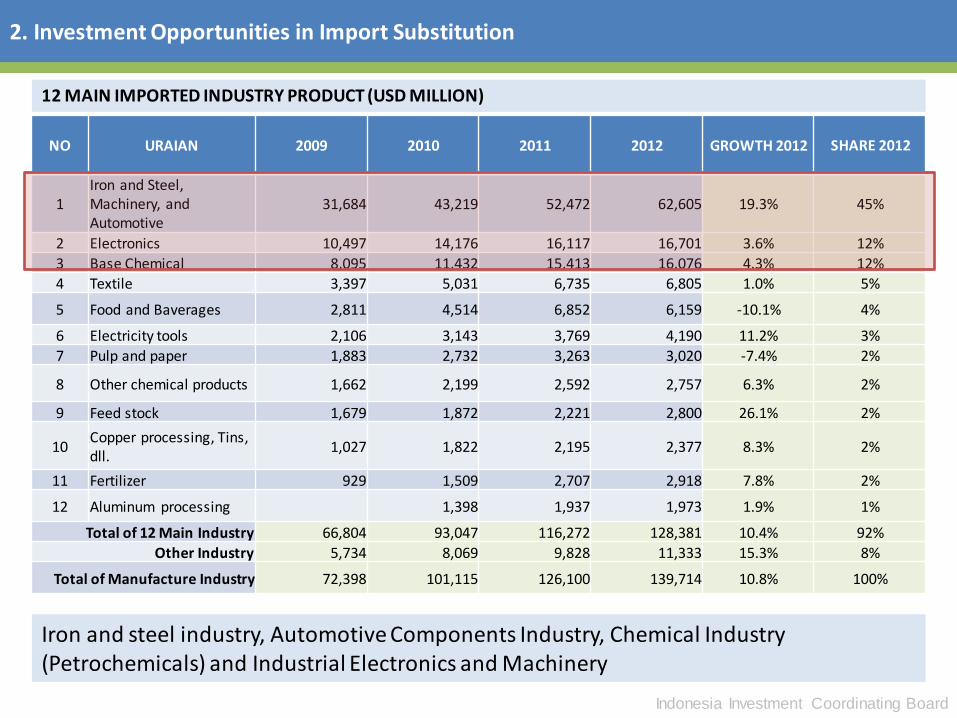
2. Investment Opportunities in Import Substitution
NO URAIAN 2009 2010 2011 2012 GROWTH 2012
SHARE 2012
1 Iron and Steel, Machinery, and Automotive
31,684 43,219 52,472 62,605 19.3% 45%
2 Electronics 10,497 14,176 16,117 16,701 3.6% 12%
3 Base Chemical 8,095 11,432 15,413 16,076 4.3% 12%
4 Textile 3,397 5,031 6,735 6,805 1.0% 5%
5 Food and Baverages 2,811 4,514 6,852 6,159 -10.1% 4%
6 Electricity tools 2,106 3,143 3,769 4,190 11.2% 3%
7 Pulp and paper 1,883 2,732 3,263 3,020 -7.4% 2%
8 Other chemical products 1,662 2,199 2,592 2,757 6.3% 2%
9 Feed stock 1,679 1,872 2,221 2,800 26.1% 2%
10 Copper processing, Tins, dll.
1,027 1,822 2,195 2,377 8.3% 2%
11 Fertilizer 929 1,509 2,707 2,918 7.8% 2%
12 Aluminum processing 1,398 1,937 1,973 1.9% 1%
Total of 12 Main Industry 66,804 93,047 116,272 128,381 10.4% 92%
Other Industry 5,734 8,069 9,828 11,333 15.3% 8%
Total of Manufacture Industry 72,398 101,115 126,100 139,714 10.8% 100%
12 MAIN IMPORTED INDUSTRY PRODUCT (USD MILLION)
Iron and steel industry, Automotive Components Industry, Chemical Industry (Petrochemicals) and Industrial Electronics and Machinery
Indonesia Investment Coordinating Board
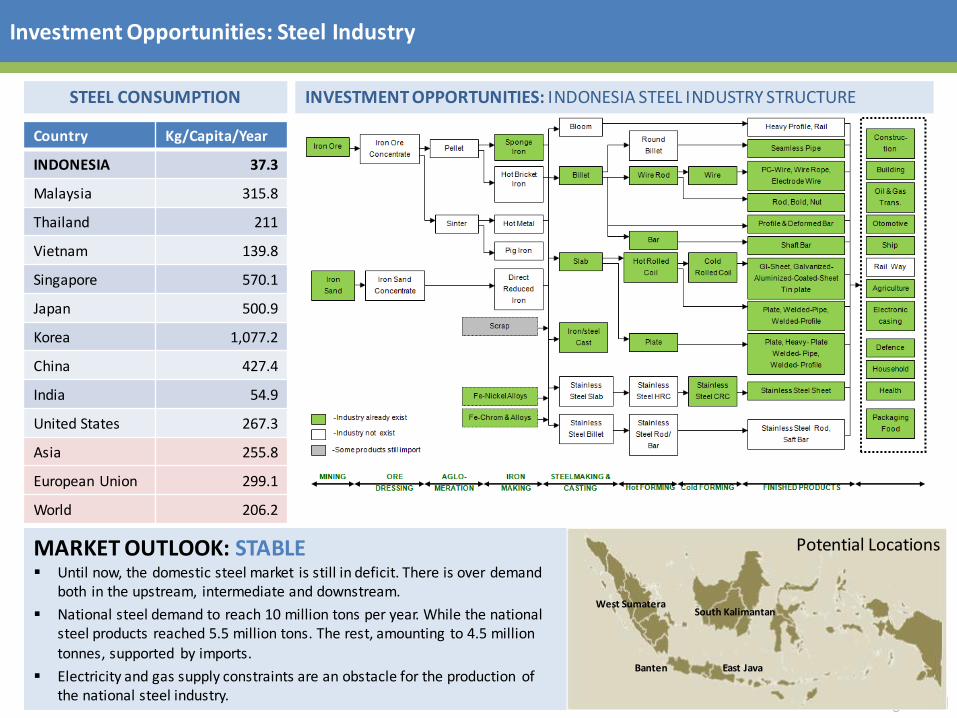
Investment Opportunities: Steel Industry
Country Kg/Capita/Year
INDONESIA 37.3
Malaysia 315.8
Thailand 211
Vietnam 139.8
Singapore 570.1
Japan 500.9
Korea 1,077.2
China 427.4
India 54.9
United States 267.3
Asia 255.8
European Union 299.1
World 206.2
STEEL CONSUMPTION INVESTMENT OPPORTUNITIES: INDONESIA STEEL INDUSTRY STRUCTURE
West Sumatera
East Java Banten
South Kalimantan
MARKET OUTLOOK: STABLE Until now, the domestic steel market is still in deficit. There is over demand
both in the upstream, intermediate and downstream.
National steel demand to reach 10 million tons per year. While the national steel products reached 5.5 million tons. The rest, amounting to 4.5 million
tonnes, supported by imports.
Electricity and gas supply constraints are an obstacle for the production of the national steel industry.
Potential Locations
Indonesia Investment Coordinating Board
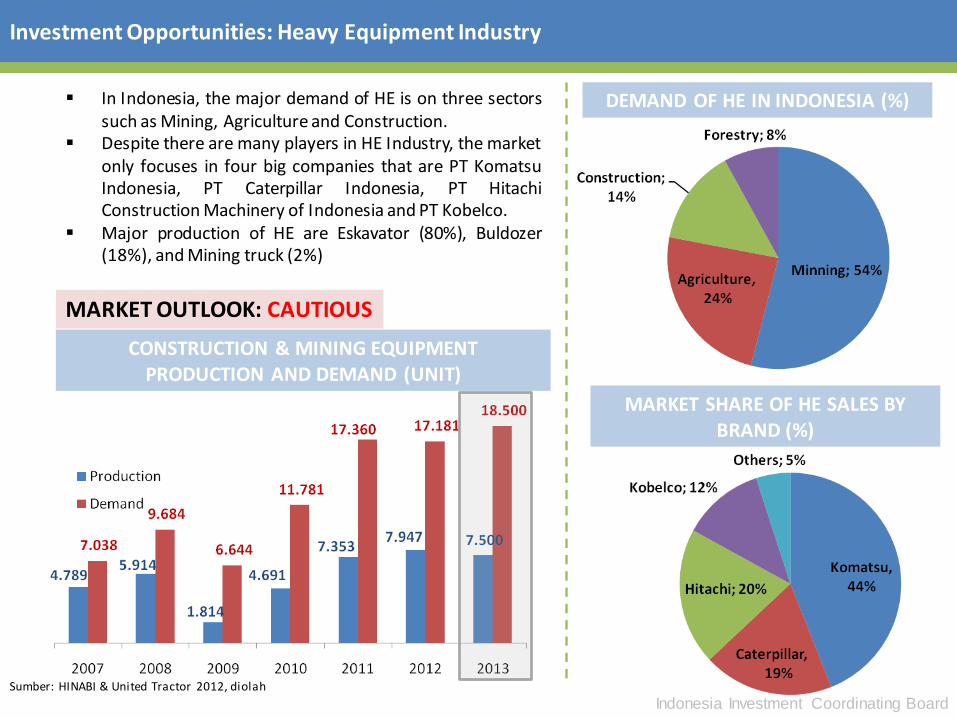
Investment Opportunities: Heavy Equipment Industry
In Indonesia, the major demand of HE is on three sectors such as Mining, Agriculture and Construction.
Despite there are many players in HE Industry, the market only focuses in four big companies that are PT Komatsu Indonesia, PT Caterpillar Indonesia, PT Hitachi Construction Machinery of Indonesia and PT Kobelco.
Major production of HE are Eskavator (80%), Buldozer (18%), and Mining truck (2%)
DEMAND OF HE IN INDONESIA (%)
MARKET SHARE OF HE SALES BY BRAND (%)
CONSTRUCTION & MINING EQUIPMENT PRODUCTION AND DEMAND (UNIT)
Sumber: HINABI & United Tractor 2012, diolah
MARKET OUTLOOK: CAUTIOUS
Indonesia Investment Coordinating Board
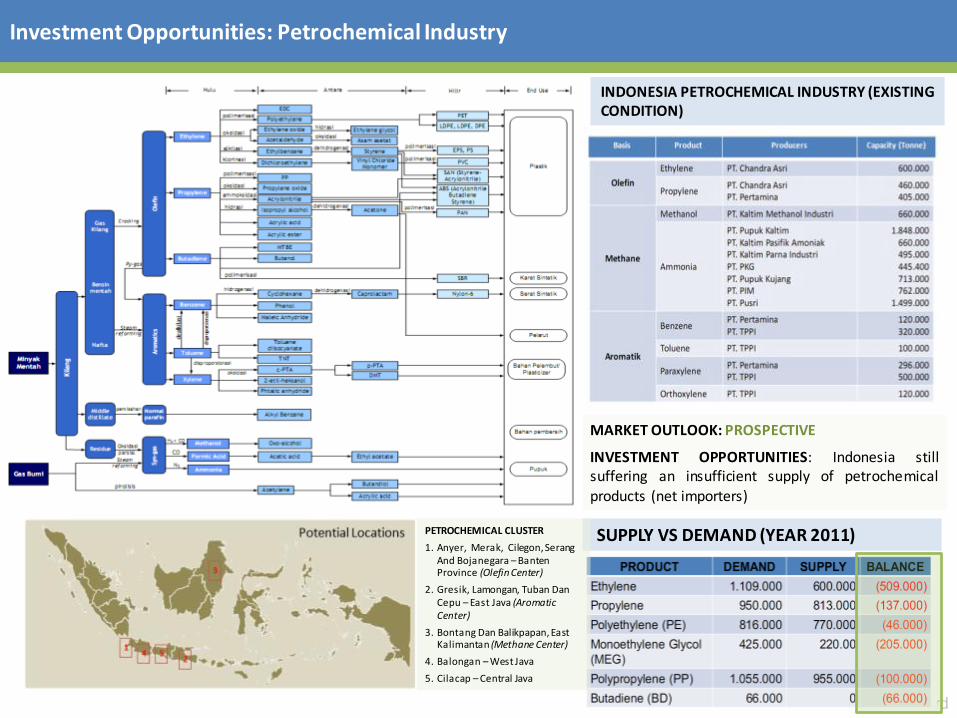
Investment Opportunities: Petrochemical Industry
INDONESIA PETROCHEMICAL INDUSTRY (EXISTING CONDITION)
MARKET OUTLOOK: PROSPECTIVE
INVESTMENT OPPORTUNITIES: Indonesia still suffering an insufficient supply of petrochemical products (net importers)
SUPPLY VS DEMAND (YEAR 2011) PETROCHEMICAL CLUSTER
1. Anyer, Merak, Cilegon, Serang And Bojanegara – Banten Province (Olefin Center)
2. Gresik, Lamongan, Tuban Dan Cepu – East Java (Aromatic Center)
3. Bontang Dan Balikpapan, East Kalimantan (Methane Center)
4. Balongan – West Java
5. Cilacap – Central Java
Indonesia Investment Coordinating Board
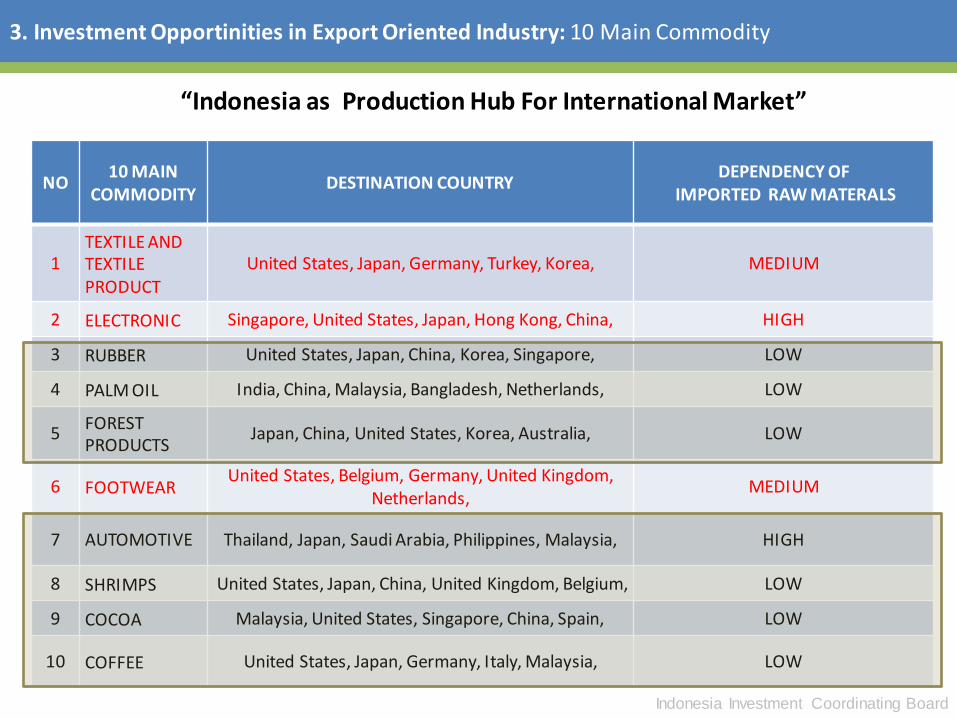
3. Investment Opportinities in Export Oriented Industry: 10 Main Commodity
“Indonesia as Production Hub For International Market”
NO 10 MAIN
COMMODITY DESTINATION COUNTRY
DEPENDENCY OF IMPORTED RAW MATERALS
1 TEXTILE AND TEXTILE PRODUCT
United States, Japan, Germany, Turkey, Korea, MEDIUM
2 ELECTRONIC Singapore, United States, Japan, Hong Kong, China, HIGH
3 RUBBER United States, Japan, China, Korea, Singapore, LOW
4 PALM OIL India, China, Malaysia, Bangladesh, Netherlands, LOW
5 FOREST PRODUCTS
Japan, China, United States, Korea, Australia, LOW
6 FOOTWEAR United States, Belgium, Germany, United Kingdom,
Netherlands, MEDIUM
7 AUTOMOTIVE Thailand, Japan, Saudi Arabia, Philippines, Malaysia, HIGH
8 SHRIMPS United States, Japan, China, United Kingdom, Belgium, LOW
9 COCOA Malaysia, United States, Singapore, China, Spain, LOW
10 COFFEE United States, Japan, Germany, Italy, Malaysia, LOW
Indonesia Investment Coordinating Board
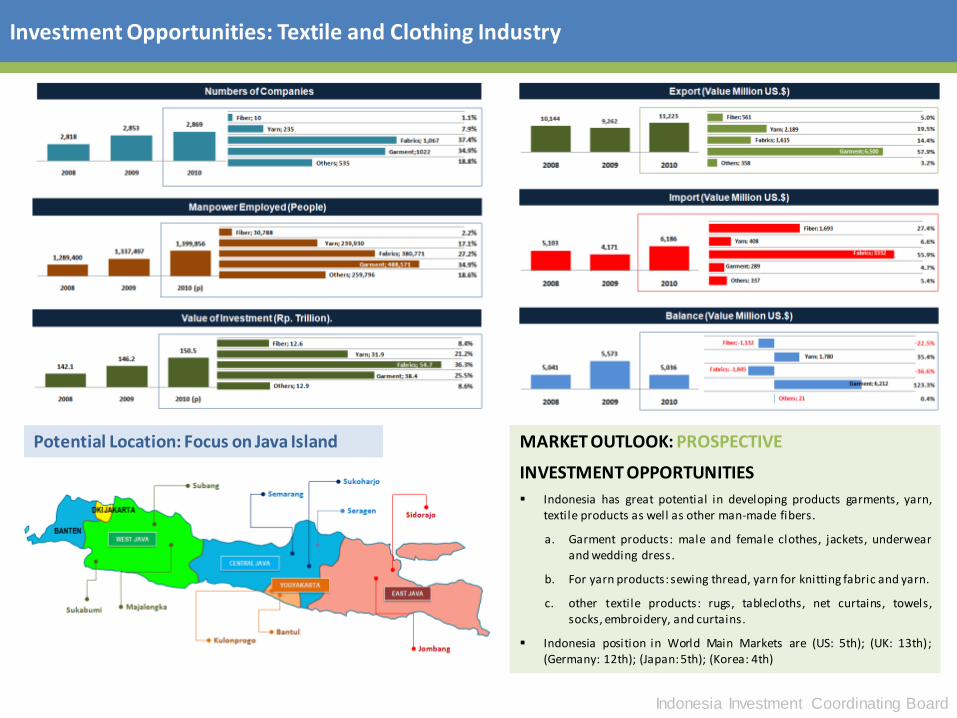
Investment Opportunities: Textile and Clothing Industry
Potential Location: Focus on Java Island MARKET OUTLOOK: PROSPECTIVE
INVESTMENT OPPORTUNITIES
Indonesia has great potential in developing products garments, yarn, textile products as well as other man-made fibers.
a. Garment products: male and female clothes, jackets, underwear and wedding dress.
b. For yarn products: sewing thread, yarn for knitting fabric and yarn.
c. other textile products: rugs, tablecloths, net curtains, towels, socks, embroidery, and curtains.
Indonesia position in World Main Markets are (US: 5th); (UK: 13th); (Germany: 12th); (Japan: 5th); (Korea: 4th)
Indonesia Investment Coordinating Board
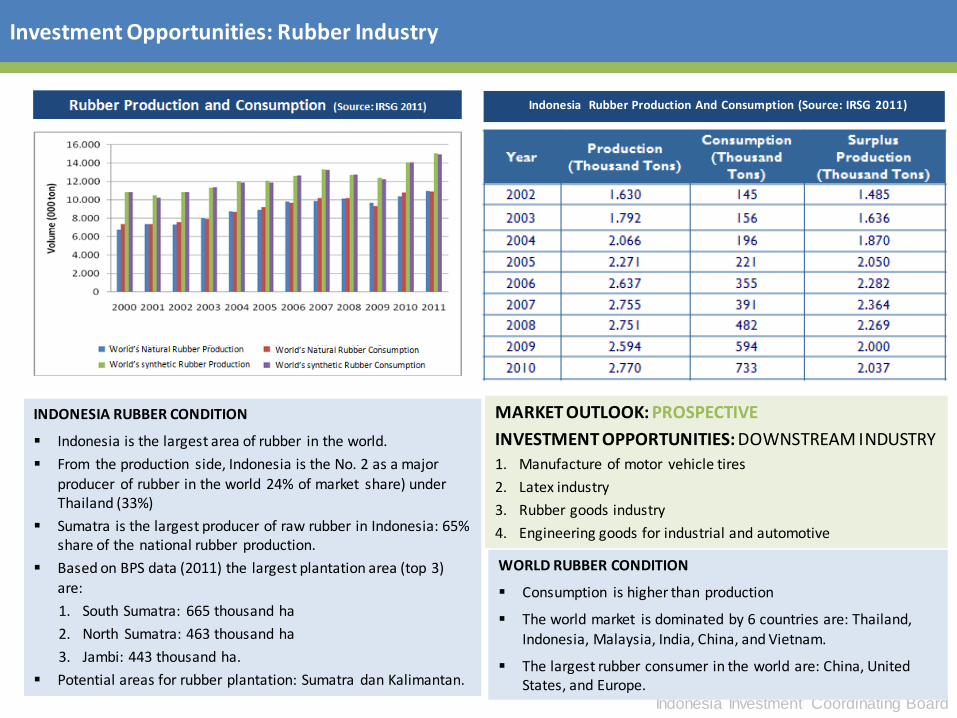
Investment Opportunities: Rubber Industry
WORLD RUBBER CONDITION
Consumption is higher than production
The world market is dominated by 6 countries are: Thailand, Indonesia, Malaysia, India, China, and Vietnam.
The largest rubber consumer in the world are: China, United States, and Europe.
INDONESIA RUBBER CONDITION
Indonesia is the largest area of rubber in the world.
From the production side, Indonesia is the No. 2 as a major
producer of rubber in the world 24% of market share) under Thailand (33%)
Sumatra is the largest producer of raw rubber in Indonesia: 65% share of the national rubber production.
Based on BPS data (2011) the largest plantation area (top 3) are:
1. South Sumatra: 665 thousand ha
2. North Sumatra: 463 thousand ha
3. Jambi: 443 thousand ha.
Potential areas for rubber plantation: Sumatra dan Kalimantan.
MARKET OUTLOOK: PROSPECTIVE
INVESTMENT OPPORTUNITIES: DOWNSTREAM INDUSTRY
1. Manufacture of motor vehicle tires
2. Latex industry
3. Rubber goods industry
4. Engineering goods for industrial and automotive
Indonesia Rubber Production And Consumption (Source: IRSG 2011)
Indonesia Investment Coordinating Board
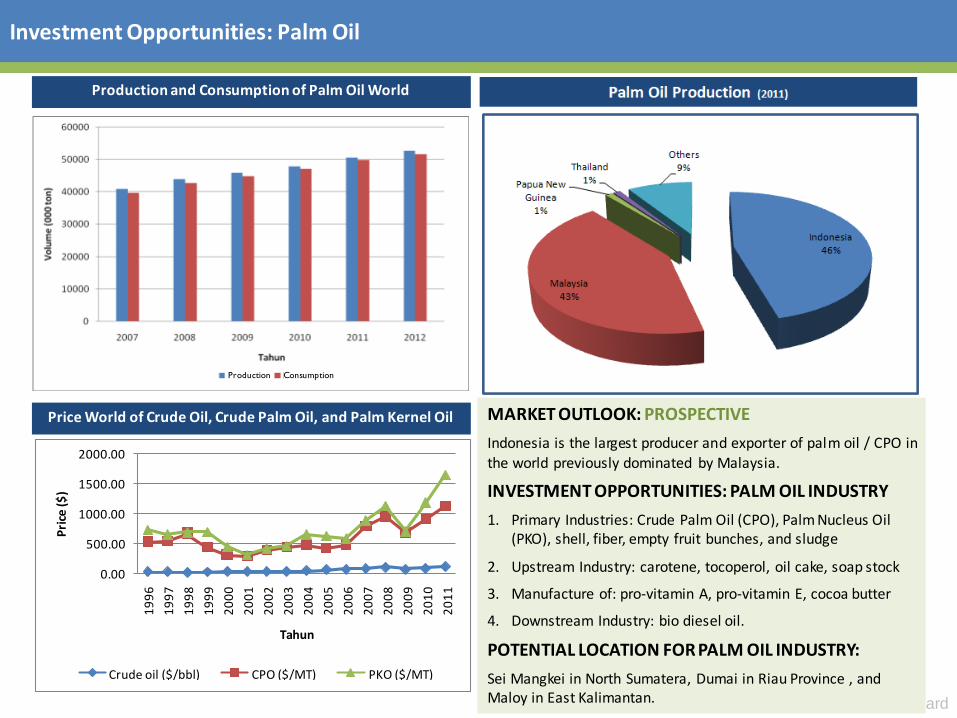
Investment Opportunities: Palm Oil
Production and Consumption of Palm Oil World
Production Consumption
MARKET OUTLOOK: PROSPECTIVE
Indonesia is the largest producer and exporter of palm oil / CPO in the world previously dominated by Malaysia.
INVESTMENT OPPORTUNITIES: PALM OIL INDUSTRY
1. Primary Industries: Crude Palm Oil (CPO), Palm Nucleus Oil (PKO), shell, fiber, empty fruit bunches, and sludge
2. Upstream Industry: carotene, tocoperol, oil cake, soap stock
3. Manufacture of: pro-vitamin A, pro-vitamin E, cocoa butter
4. Downstream Industry: bio diesel oil.
POTENTIAL LOCATION FOR PALM OIL INDUSTRY:
Sei Mangkei in North Sumatera, Dumai in Riau Province , and Maloy in East Kalimantan.
0.00
500.00
1000.00
1500.00
2000.00
19
96
19
97
19
98
19
99
20
00
20
01
20
02
20
03
20
04
20
05
20
06
20
07
20
08
20
09
20
10
20
11
Pri
ce($
)
Tahun
Crude oil ($/bbl) CPO ($/MT) PKO ($/MT)
Price World of Crude Oil, Crude Palm Oil, and Palm Kernel Oil
Indonesia Investment Coordinating Board
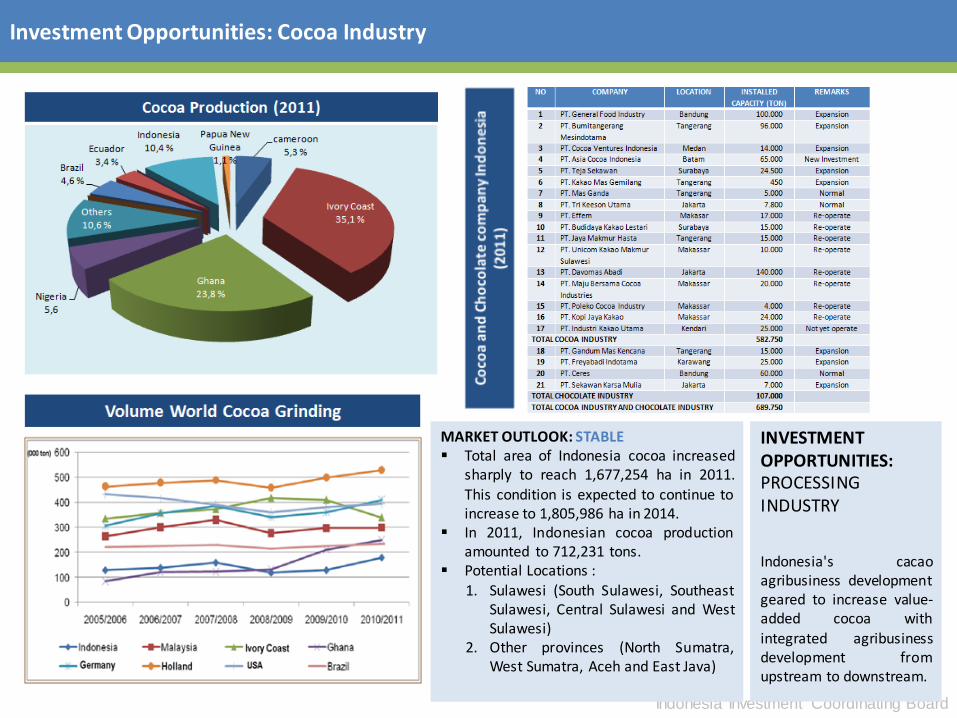
Investment Opportunities: Cocoa Industry
MARKET OUTLOOK: STABLE Total area of Indonesia cocoa increased
sharply to reach 1,677,254 ha in 2011. This condition is expected to continue to increase to 1,805,986 ha in 2014.
In 2011, Indonesian cocoa production amounted to 712,231 tons.
Potential Locations : 1. Sulawesi (South Sulawesi, Southeast
Sulawesi, Central Sulawesi and West Sulawesi)
2. Other provinces (North Sumatra, West Sumatra, Aceh and East Java)
INVESTMENT OPPORTUNITIES: PROCESSING INDUSTRY
Indonesia's cacao agribusiness development geared to increase value-added cocoa with integrated agribusiness development from upstream to downstream.
Indonesia Investment Coordinating Board
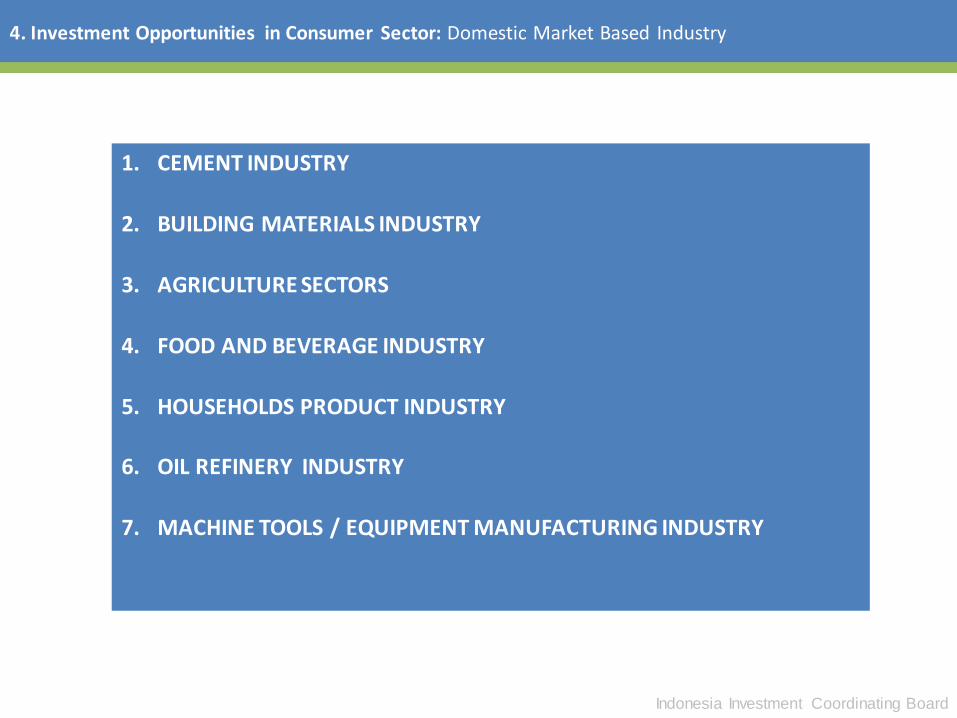
4. Investment Opportunities in Consumer Sector: Domestic Market Based Industry
1. CEMENT INDUSTRY
2. BUILDING MATERIALS INDUSTRY
3. AGRICULTURE SECTORS
4. FOOD AND BEVERAGE INDUSTRY
5. HOUSEHOLDS PRODUCT INDUSTRY
6. OIL REFINERY INDUSTRY
7. MACHINE TOOLS / EQUIPMENT MANUFACTURING INDUSTRY
Indonesia Investment Coordinating Board
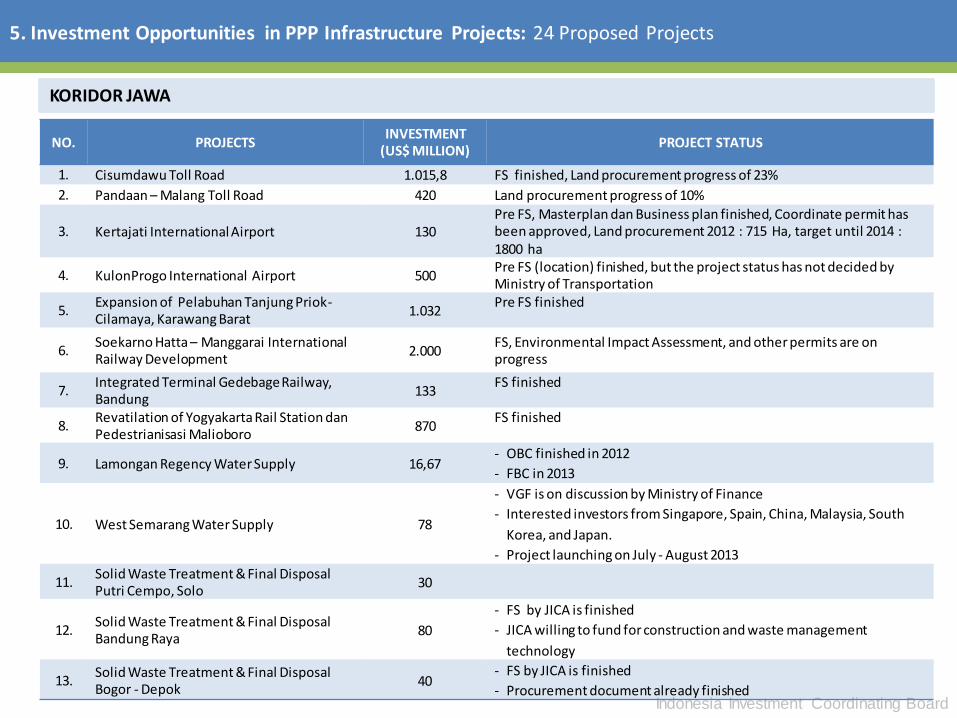
5. Investment Opportunities in PPP Infrastructure Projects: 24 Proposed Projects
NO. PROJECTS INVESTMENT
(US$ MILLION) PROJECT STATUS
1. Cisumdawu Toll Road 1.015,8 FS finished, Land procurement progress of 23%
2. Pandaan – Malang Toll Road 420 Land procurement progress of 10%
3. Kertajati International Airport 130 Pre FS, Masterplan dan Business plan finished, Coordinate permit has been approved, Land procurement 2012 : 715 Ha, target until 2014 : 1800 ha
4. KulonProgo International Airport 500 Pre FS (location) finished, but the project status has not decided by Ministry of Transportation
5. Expansion of Pelabuhan Tanjung Priok- Cilamaya, Karawang Barat
1.032 Pre FS finished
6. Soekarno Hatta – Manggarai International Railway Development
2.000 FS, Environmental Impact Assessment, and other permits are on progress
7. Integrated Terminal Gedebage Railway, Bandung
133 FS finished
8. Revatilation of Yogyakarta Rail Station dan Pedestrianisasi Malioboro
870 FS finished
9. Lamongan Regency Water Supply 16,67 - OBC finished in 2012
- FBC in 2013
10. West Semarang Water Supply 78
- VGF is on discussion by Ministry of Finance
- Interested investors from Singapore, Spain, China, Malaysia, South
Korea, and Japan.
- Project launching on July - August 2013
11. Solid Waste Treatment & Final Disposal Putri Cempo, Solo
30
12. Solid Waste Treatment & Final Disposal Bandung Raya
80
- FS by JICA is finished
- JICA willing to fund for construction and waste management
technology
13. Solid Waste Treatment & Final Disposal Bogor - Depok
40 - FS by JICA is finished
- Procurement document already finished
KORIDOR JAWA
Indonesia Investment Coordinating Board
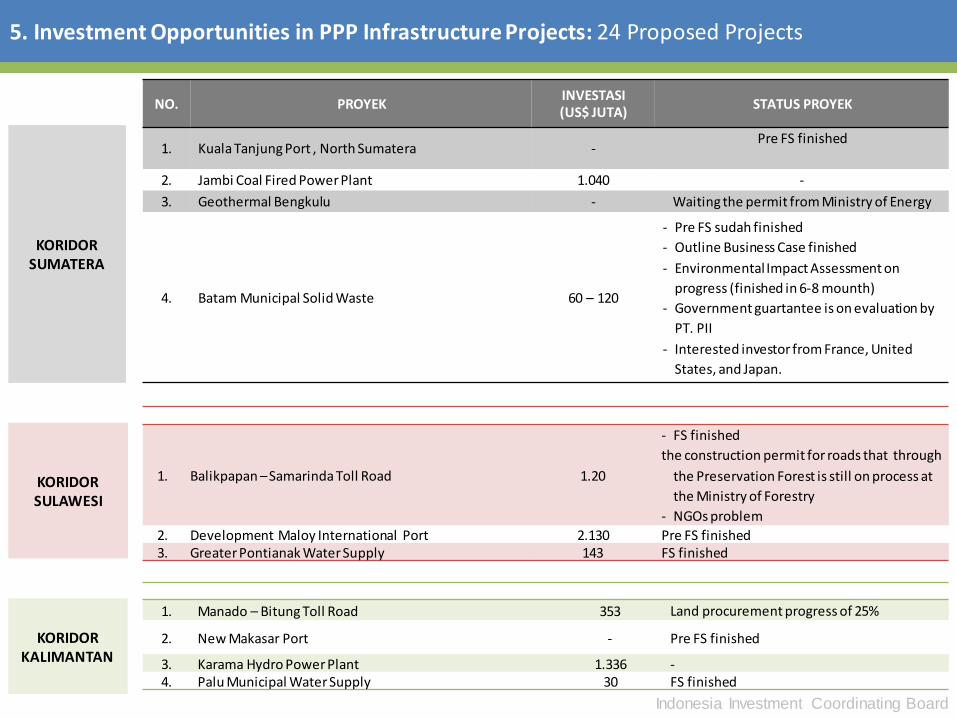
5. Investment Opportunities in PPP Infrastructure Projects: 24 Proposed Projects
KORIDOR SUMATERA
NO. PROYEK INVESTASI (US$ JUTA)
STATUS PROYEK
1. Kuala Tanjung Port , North Sumatera - Pre FS finished
2. Jambi Coal Fired Power Plant 1.040 -
3. Geothermal Bengkulu - Waiting the permit from Ministry of Energy
4. Batam Municipal Solid Waste 60 – 120
- Pre FS sudah finished
- Outline Business Case finished
- Environmental Impact Assessment on
progress (finished in 6-8 mounth)
- Government guartantee is on evaluation by
PT. PII
- Interested investor from France, United
States, and Japan.
KORIDOR KALIMANTAN
1. Balikpapan – Samarinda Toll Road 1.20
- FS finished
the construction permit for roads that through
the Preservation Forest is still on process at
the Ministry of Forestry
- NGOs problem
2. Development Maloy International Port 2.130 Pre FS finished 3. Greater Pontianak Water Supply 143 FS finished
KORIDOR SULAWESI
1. Manado – Bitung Toll Road 353 Land procurement progress of 25%
2. New Makasar Port - Pre FS finished
3. Karama Hydro Power Plant 1.336 - 4. Palu Municipal Water Supply 30 FS finished
Indonesia Investment Coordinating Board
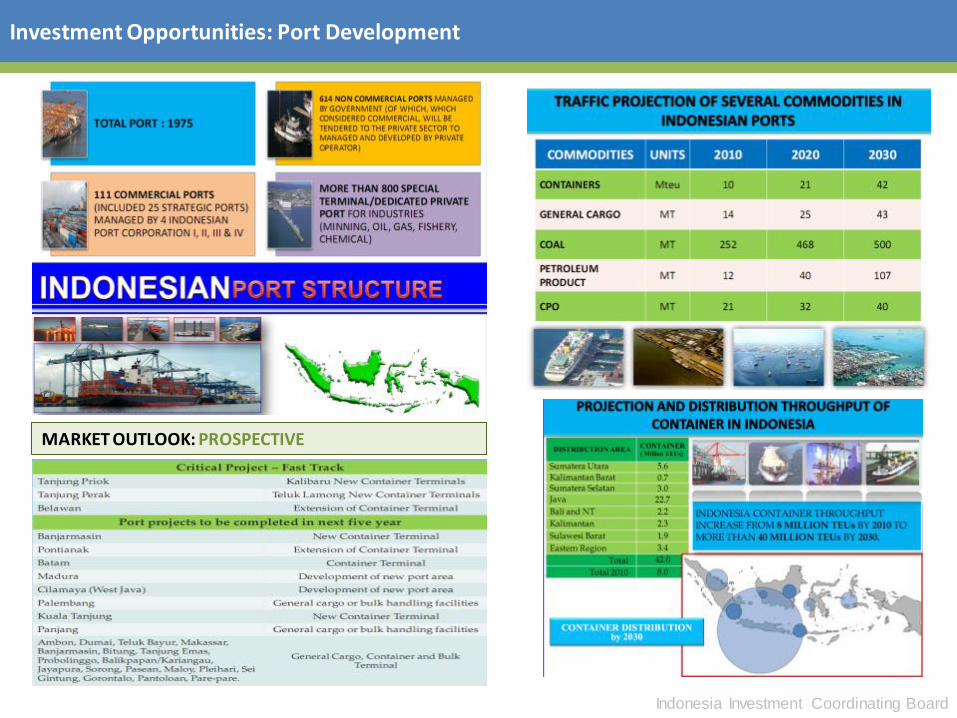
Investment Opportunities: Port Development
MARKET OUTLOOK: PROSPECTIVE
Indonesia Investment Coordinating Board
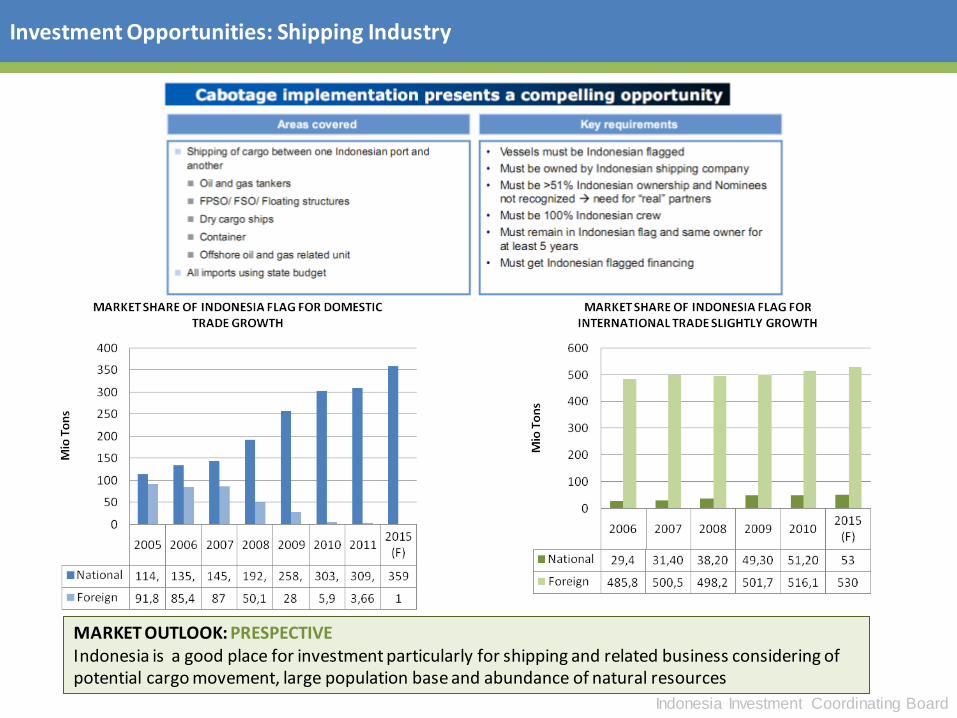
Investment Opportunities: Shipping Industry
MARKET OUTLOOK: PRESPECTIVE Indonesia is a good place for investment particularly for shipping and related business considering of potential cargo movement, large population base and abundance of natural resources
Indonesia Investment Coordinating Board
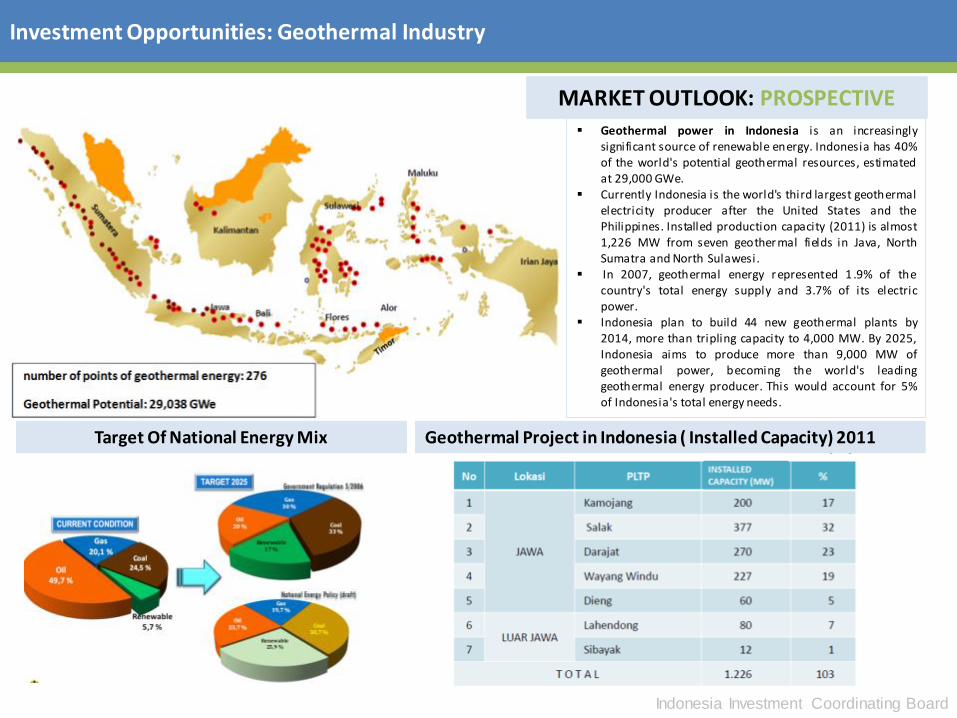
Investment Opportunities: Geothermal Industry
Geothermal Project in Indonesia ( Installed Capacity) 2011 Target Of National Energy Mix
MARKET OUTLOOK: PROSPECTIVE Geothermal power in Indonesia is an increasingly
significant source of renewable energy. Indonesia has 40% of the world's potential geothermal resources, estimated at 29,000 GWe.
Currently Indonesia is the world's third largest geothermal electricity producer after the United States and the Philippines. Installed production capacity (2011) is almost 1,226 MW from seven geothermal fields in Java, North Sumatra and North Sulawesi.
In 2007, geothermal energy represented 1 .9% of the country's total energy supply and 3.7% of its electric power.
Indonesia plan to build 44 new geothermal plants by 2014, more than tripling capacity to 4,000 MW. By 2025, Indonesia aims to produce more than 9,000 MW of geothermal power, becoming the world's leading geothermal energy producer. This would account for 5% of Indonesia's total energy needs.
Indonesia Investment Coordinating Board
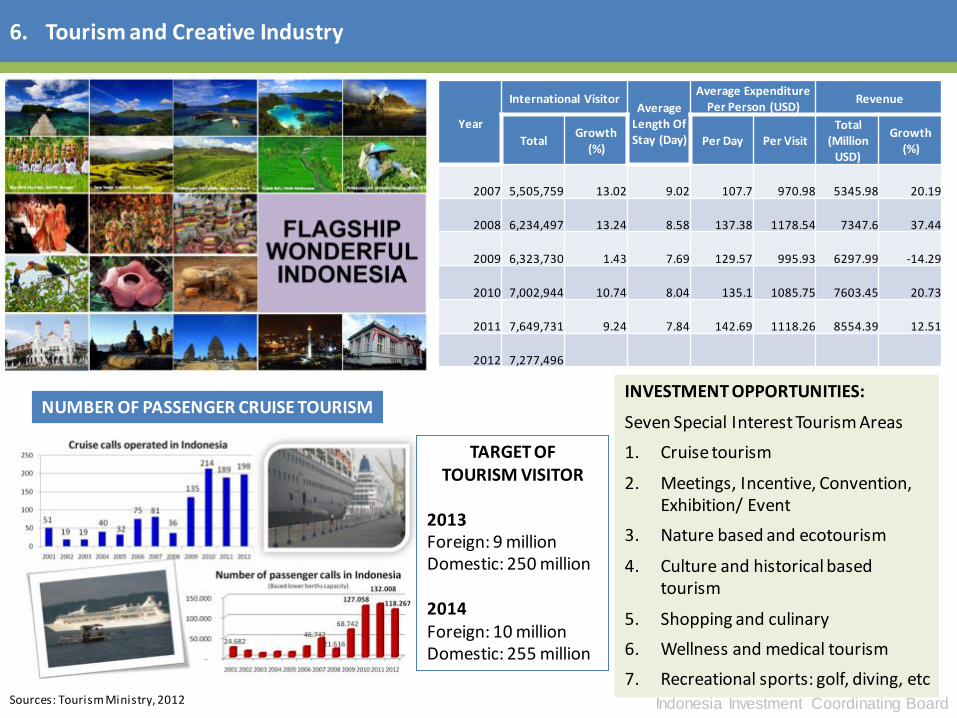
6. Tourism and Creative Industry
Year
International Visitor Average
Length Of Stay (Day)
Average Expenditure Per Person (USD)
Revenue
Total Growth
(%) Per Day Per Visit
Total (Million
USD)
Growth (%)
2007
5,505,759 13.02 9.02 107.7 970.98 5345.98 20.19
2008
6,234,497 13.24 8.58 137.38 1178.54 7347.6 37.44
2009
6,323,730 1.43 7.69 129.57 995.93 6297.99 -14.29
2010
7,002,944 10.74 8.04 135.1 1085.75 7603.45 20.73
2011
7,649,731 9.24 7.84 142.69 1118.26 8554.39 12.51
2012
7,277,496
INVESTMENT OPPORTUNITIES:
Seven Special Interest Tourism Areas
1. Cruise tourism
2. Meetings, Incentive, Convention, Exhibition/ Event
3. Nature based and ecotourism
4. Culture and historical based tourism
5. Shopping and culinary
6. Wellness and medical tourism
7. Recreational sports: golf, diving, etc
NUMBER OF PASSENGER CRUISE TOURISM
TARGET OF TOURISM VISITOR
2013 Foreign: 9 million Domestic: 250 million 2014 Foreign: 10 million Domestic: 255 million
Sources: Tourism Ministry, 2012
Indonesia Investment Coordinating Board
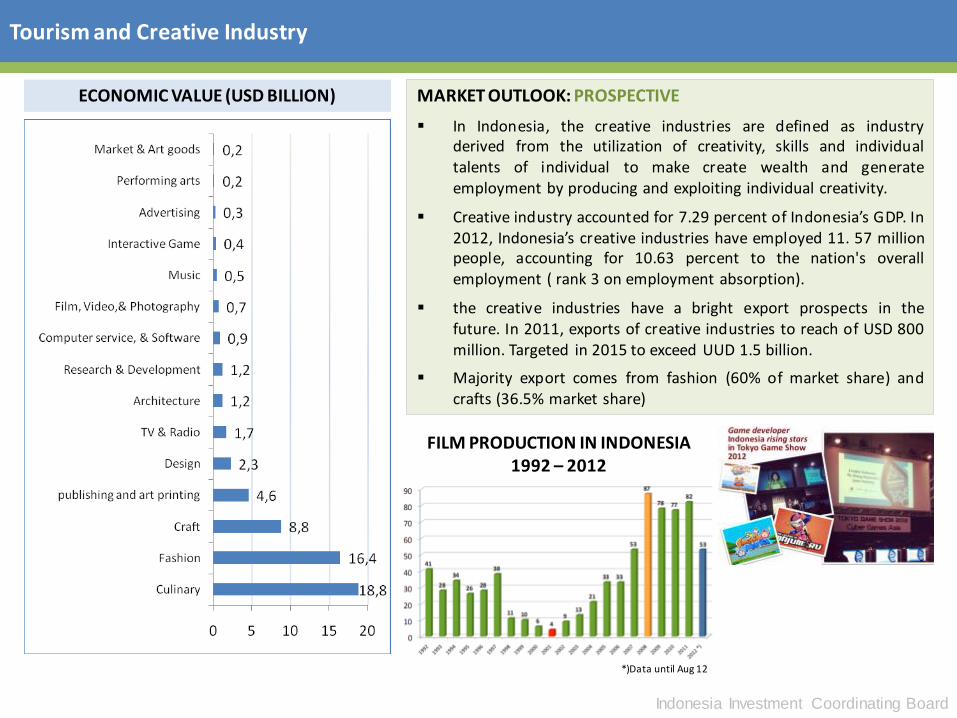
Tourism and Creative Industry
ECONOMIC VALUE (USD BILLION) MARKET OUTLOOK: PROSPECTIVE
In Indonesia, the creative industries are defined as industry derived from the utilization of creativity, skills and individual talents of individual to make create wealth and generate employment by producing and exploiting individual creativity.
Creative industry accounted for 7.29 percent of Indonesia’s GDP. In 2012, Indonesia’s creative industries have employed 11. 57 million people, accounting for 10.63 percent to the nation's overall employment ( rank 3 on employment absorption).
the creative industries have a bright export prospects in the future. In 2011, exports of creative industries to reach of USD 800 million. Targeted in 2015 to exceed UUD 1.5 billion.
Majority export comes from fashion (60% of market share) and crafts (36.5% market share)
*)Data until Aug 12
FILM PRODUCTION IN INDONESIA 1992 – 2012
Indonesia Investment Coordinating Board
BUSINESS PARTNERSHIP PROGRAM IN ORDER
FOREIGN INVESTMENT AND DOMESTIC INVESTMENTS
Indonesia Investment Coordinating Board
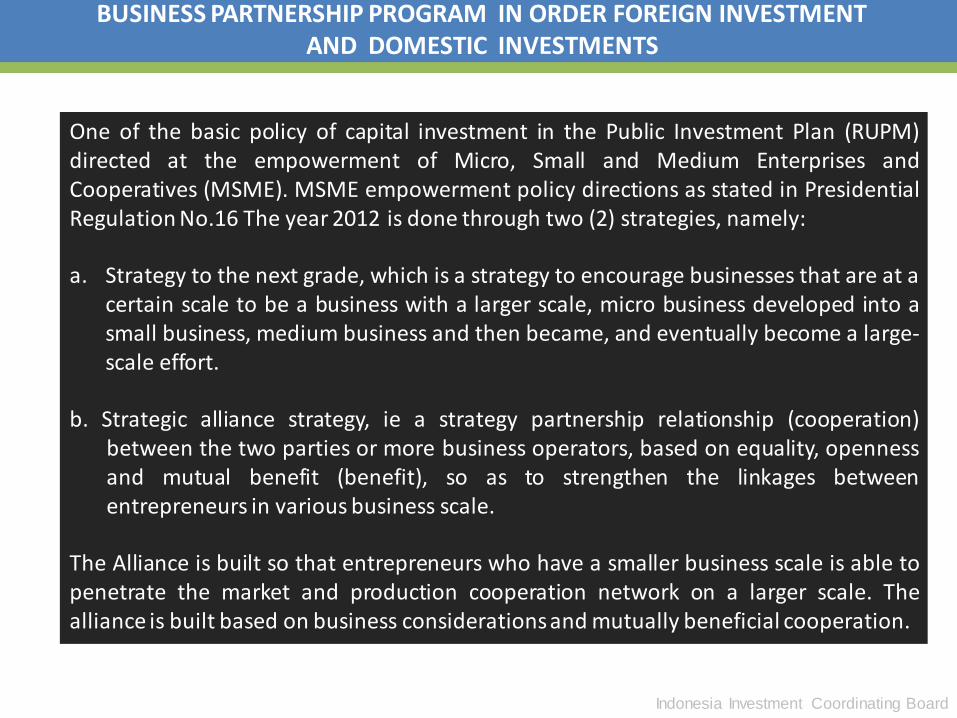
BUSINESS PARTNERSHIP PROGRAM IN ORDER FOREIGN INVESTMENT AND DOMESTIC INVESTMENTS
One of the basic policy of capital investment in the Public Investment Plan (RUPM) directed at the empowerment of Micro, Small and Medium Enterprises and Cooperatives (MSME). MSME empowerment policy directions as stated in Presidential Regulation No.16 The year 2012 is done through two (2) strategies, namely: a. Strategy to the next grade, which is a strategy to encourage businesses that are at a
certain scale to be a business with a larger scale, micro business developed into a small business, medium business and then became, and eventually become a large-scale effort.
b. Strategic alliance strategy, ie a strategy partnership relationship (cooperation) between the two parties or more business operators, based on equality, openness and mutual benefit (benefit), so as to strengthen the linkages between entrepreneurs in various business scale.
The Alliance is built so that entrepreneurs who have a smaller business scale is able to penetrate the market and production cooperation network on a larger scale. The alliance is built based on business considerations and mutually beneficial cooperation.
Indonesia Investment Coordinating Board
RESERVATION LINE OF BUSINESS & PARTNERSHIP
1. Determination of business areas that are reserved for MSME
2. Determination of an open field with the requirements of business partnerships
(Presidential Regulation No.16 The year 2012)
Indonesia Investment Coordinating Board
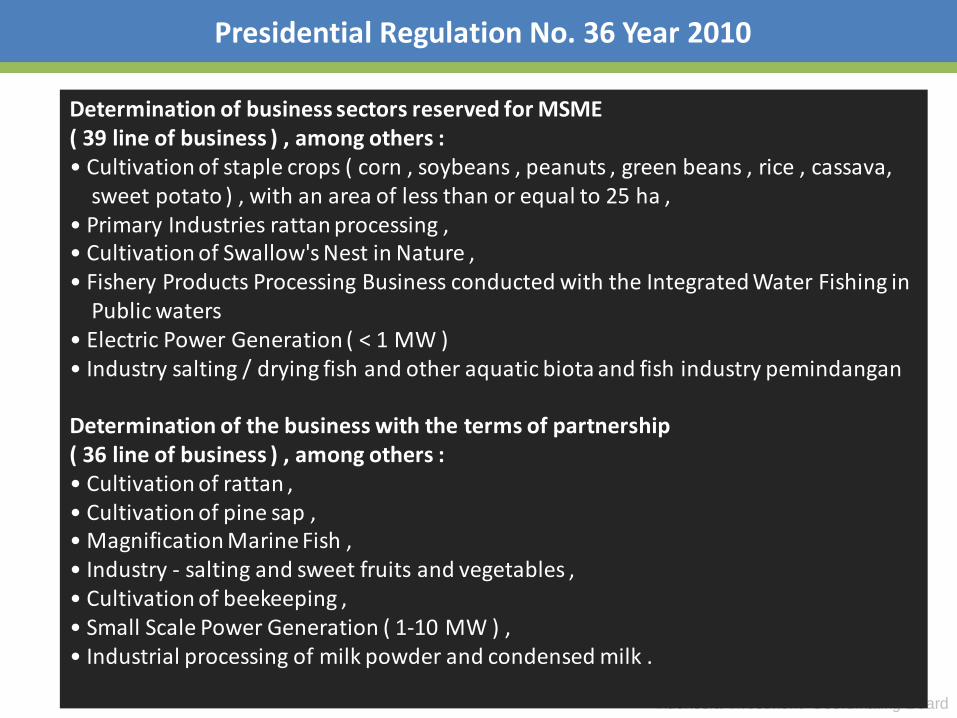
Presidential Regulation No. 36 Year 2010
Determination of business sectors reserved for MSME ( 39 line of business ) , among others : • Cultivation of staple crops ( corn , soybeans , peanuts , green beans , rice , cassava, sweet potato ) , with an area of less than or equal to 25 ha , • Primary Industries rattan processing , • Cultivation of Swallow's Nest in Nature , • Fishery Products Processing Business conducted with the Integrated Water Fishing in Public waters • Electric Power Generation ( < 1 MW ) • Industry salting / drying fish and other aquatic biota and fish industry pemindangan Determination of the business with the terms of partnership ( 36 line of business ) , among others : • Cultivation of rattan , • Cultivation of pine sap , • Magnification Marine Fish , • Industry - salting and sweet fruits and vegetables , • Cultivation of beekeeping , • Small Scale Power Generation ( 1-10 MW ) , • Industrial processing of milk powder and condensed milk .
THANK YOU
Invest in...
© 2013 by Indonesian Investment Coordinating Board. All rights reserved
CONTACT US BADAN KOORDINASI PENANAMAN MODAL (BKPM) Jl. Jend. Gatot Subroto No. 44, Jakarta 12190
P.O. Box 3186, Indonesia P : +62 21 5292 1334 F : +62 21 5264 211 E : [email protected]
Indonesia Investment Promotion Center (IIPC)