Embed Size (px)
Citation preview

Page - 1
OVERVIEW OF INDONESIA WATER SYSTEM AND POLICIES1
Ir. M. Donny Azdan, MA., MS., Ph.D
2
I. WATER RESOURCES MANAGEMENT REFORM
Water resources management reform which is characterized by the enactment of Law No.7/2004 on Water Resources is intended to anticipate the complexity of water resources development problems and shifting in water resources management paradigm by giving more attention to social functions, environment and economy that is directed to achieve the synergic and harmonic integration of interregional, intersectoral, and intergenerational. Reformation started with the formation of the coordination team of Water Resources Management (TKPSDA) in 2001 in charge of formulating national policies on water resources and various policy tools, as well as encouraging the establishment of the new Water Resources Law. In line with the spirit of democratization, decentralization and openness, fundamental reforms in the Law of No.7/2004 is that the three main pillars of water resource management in the previous Law No.11/1974 which consists of the conservation, utilization and control of destructive force, is supported by three other pillars of community participation, steady institutional and good information systems and data.
Principles of water resources management policies, which are contained in the Law of No. 7/2004 are derived into seven government regulations (GR)3, namely Water Resources Management, Irrigation, Development of Drinking Supply System (SPAM), Ground Water, Dams, Rivers, and Swamp. Until the year of 2011, the government has published six regulations except for regulation on swamp4
Principles of water resources reform through Law of No.7/2004 are:
.
1. Clarity of water resources management responsibilities between central and regional
In accordance with the Law No.7/2004, water resources management is conducted based on river basin. To provide the clarity of the authority and responsibility of water resource management between the central and regional government (provincial, and regency/municipality), the Minister of Public Works
1 Presented at the workshop Sustainable Water Management for Agriculture, organized by the Ministry of Agriculture, Jakarta December 13, 2011. 2 Director of Water and Irrigation, Ministry of National development Planning/Bappenas 3 Previous Law No. 11/1974, only mandates five government regulations which are GR 22/1982 on Water Management, GR 23/1982 on Irrigation (changed by GR 77/2001), GR 20/1990 on Water Pollution Control (changed by GR 82/2001), GR 27/1991 on Swamp, and GR 35/1991 on River. 4 Government Regulation derivative of Law No 7/2004 which has been published are GR 16/2005 on Development of Drinking Supply System, GR 20/2006 on Irrigation, GR 42/2008 on the Water Resources Management, GR 43/2008 on Ground Water, GR 37/2010 on Dams, and GR 38/2011 on River.

Page - 2
has issued regulation No.11A/PRT/M/2006 regarding the criteria and determination of river basins, which consists of national strategic river basins, international and inter-province river basins under the authority of the central government, inter-regency/municipality city river basins under the authority of the province and the river basins within one regency/municipality under the authority of the regency/city.
2. Institutional arrangement of Water resources management
To realize the integrated management of water resources management it is important to build a coordination system that can integrate the interests of various sectors, regions and stakeholders. Coordination of water resources management at national level is facilitated by the National Water Resources Council, and at provincial level by the Provincial Water Resources Council, while at the District level and the river basin level the formation of the council is optional depending on the needs of the region5
3. Strengthening and integration of planning and implementation of Water resource management
.
Water resources management based on river basin area is basically inter-sectoral and inter-regional therefore requires an integrated reference in its implementation. Law No.7 of 2004 has mandated the preparation of Water Resources Management Scheme and Water Resources Management Plan for each river basin as a reference in the management of water resources. Preparation process of the Scheme and Plan is carried out through coordination body (council), and public consultation to solicit the people's aspirations and then will be ratified by the authorities according to the authority and responsibility of their jurisdiction6
4. Developing a network information system of Water Resources Management
.
Law No.7 of 2004 mandates the implementation of water resource management information system in line with the authority of managers, which includes information on the hydrology hydrometeorology, hydrogeology, water policy, water infrastructure, water technology, water resources environment, as well as socio-economic and cultural activities.
5. Strengthening public participation
Law No. 7 of 2004 mandates that the public has equal opportunity to participate in any process of water resources management, even in the planning process,
5 National Water Resources Council was established through Presidential Decree No. 6 of 2009 on the Establishment of National Water Resources Council, chaired by Coordinating Minister for Economic. 6 Scheme and Plan of River Basin of central authority established through the Regulation of Minister of Public Works, River Basin of provincial authority through Governor Decree, and River Basin of regency/municipality authority by regent/mayors decree.

Page - 3
implementation, or monitoring. Public participation could be in forms of communicating thoughts and ideas in the planning, donating time, effort, materials and funds in the construction and operation and maintenance process, or participating in reporting and communicating complaints to the appropriate authorities regarding to monitoring of management activities.
6. Strengthening the financing system for the sustainability of water resources management
Sustainability of water resources management requires consistent and continuous funding. Law No.7 of 2004 mandates that water resource management funding sources may come from government budgets, private sector, and water resources management service fees and the amount of funding is determined based on actual need of water resources management. The use of water resources apart from daily basic and agricultural needs must also bear the cost of water resources management services, such as for hydroelectric power, industry, and plantations.
II. IRRIGATION MANAGEMENT POLICY IN SUPPORTING AGRICULTURAL DEVELOPMENT
As part of the water resources reform, irrigation sector has been through reforms in management and development concept. Reforms of this policy are intended to enable the effective and efficient implementation of irrigation in a sustainable manner in its role as one of the supporter in the development of the agricultural sector7
The reform is based on the complexity problems in irrigation management, such as:
.
a. Vulnerability of water availability 8
b. Shifting value of water from a public good category which is abundant and can be utilized at no cost to become an economic and social good category;
;
c. Increased competition in water use between irrigation and other sectors;
d. Changes in the use of irrigated lands.
Irrigation management system which is outlined in Government Regulation No. 20 of 2006 on Irrigation highlights the important role of the society in the whole process of management. The new policy of irrigation management is known as the Development and Management of Participatory Irrigation systems (PPSIP), with the outline as follows:
7 BPS Strategic Data of 2011 shows the contribution of agriculture sector (including forestry, fisheries, and livestock) to GDP in 2009 was 15.3%, and absorbs 39.9 percent of total Economically Active labor that works (status February 2010). 8 Study Indonesia Climate Change Sectoral Roadmap for Water Resources Sector conducted by Bappenas in 2009 shows a condition on water balance in 2009 where the deficit balance occurs in Java-Bali, nearly-critical in Sumatra, Sulawesi, and Maluku, and surplus in Kalimantan and Papua.

Page - 4
1. Development and management of irrigation is conducted through a participative approach which involves all stakeholders especially farmers in the whole process of decision making and implementation of development and management.
2. Development and management of irrigation systems is conducted in an integrated manner by considering the interests of the users of irrigation at the upper, middle, and downstream.
3. Distribution of authority and responsibility among central government, provincial governments, regency/municipality governments, and farmers.
4. Task redefinition of irrigation management institutions, empowerment of water user associations, and establishment of irrigation commissions as institution of coordination and communication.
5. The importance of asset management to ensure efficient financing of irrigation management.
III. IRRIGATION MANAGEMENT IN NATIONAL DEVELOPMENT PLANNING AND ITS ACHIEVEMENTS
Irrigation sector is intended to support the national priority on food security, which is one of 11 national development priorities within 2010-2014 (See Table 1). Subsequently, irrigation management policies derived into the Medium-term National Development Plan (RPJMN) 2010-2014, including estimation of financing that is required during the period. Irrigation management policy is carried out through activities of Development and Management of Irrigation, Swamp and Other Water Networks, which is part of the Water Resources Management Program.
Policies on irrigation development in RPJMN 2010-2014 is directed to improve irrigation/swamp network services to support national food security by:
a) Establishing new irrigation areas by prioritizing areas outside of Java Island and improve the function of the irrigation network, especially in the area where the availability of water is assured and the farmers are ready to manage the land;
b) Rehabilitate damaged irrigation networks, especially in high productive area;
c) Optimization of irrigation services through the Operation and Maintenance of irrigation networks;
d) Increasing participation of farmers in the operation and maintenance activities through out-contracting system;
e) Improving the efficiency of water utilization through water-saving agricultural technologies such as the System of Rice Intensification/SRI, water re-use, lining

Page - 5
irrigation canals to reduce water leaks, maintaining the function of agricultural land, and supporting local government in improving the reliability of irrigation networks, through the provision of a special allocation fund (DAK).
During the period of 2010-2014, the government has set targets to be achieved in the development and management of irrigation as well as the support of baseline fund to ensure sustainability of its management (See Figure 1). The figure and table below shows that the largest allocation of the water resources sector within 2010-2014 is for irrigation sector (37%).
Table 1. Targets of Irrigation Development and Management 2010-2014
No Indicators Targets
1 Service area of irrigation networks built/upgraded (1000 ha) 129,38
2 Service area of irrigation networks rehabilitated (millions ha) 1,34
3 Service area of irrigation networks operated and maintained (millions ha)
2,315
4 Service area of swamp networks extended (1000 ha) 10
5 Service area of swamp networks rehabilitated (1000 ha) 450
6 Service area of swamp networks operated and maintained (millions ha)
1,2
7 Number of groundwater wells built/upgraded (units) 70
8 Number of groundwater wells rehabilitated (units) 1.875
9 The number of groundwater wells operated and maintained (units)
2.192
10 Services area of fishpond water system networks built/upgraded (ha)
1.000
11 Services area of fishpond water system networks rehabilitated (ha)
175.000
Source: RPJMN 2010-2014
Figure 1. Fund Allocation of Water Resources Management 2010-2014
(Source: RPJMN 2010-2014)

Page - 6
Support for development and management of irrigation is also realized through the activities of the Management and Conservation of reservoirs, ponds, natural ponds and other water reservoirs, which are directed to guarantee the availability of water for irrigation development and management (See Table 2). At the national level, the percentage of irrigated area which availability of water is assured by dams and other water reservoir is around 797.971 ha (10.7%) from 7.47 million ha of Irrigated areas.
Table 2. Targets of Management and Conservation of Reservoirs, Ponds, Natural Ponds and Other Water Reservoirs
No Indicators Targets
1 Number of Dams and ponds/natural ponds that are constructed
11 Dams finished; 1 Dam in construction process; 158 ponds/natural ponds finished
2 Number of Dams, ponds/natural ponds that are rehabilitated
29 Dams finished; dan 298 ponds/natural ponds finished
3 Number of Dams, ponds/natural ponds that are operated and maintained
182 Dams, ponds/natural ponds
Source: RPJMN 2010-2014
Annual implementation of RPJMN 2010-2014 is derived into Government Annual Work Plan (RKP). Entering the second year of RPJMN 2010-2014 which have been carried out and still on going through RKP 2010 and RKP 2011, there are many irrigation sector achievements which support the national food security particularly in agricultural production. Efforts that have been carried out in 2010 to support the achievement of national food security are as follows: (1) maintaining and improving the availability and sustainability of water with the development of 45 ponds scattered throughout Indonesia and construction of eight reservoirs, namely: Rajui in Aceh, Titab in Bali, Jatigede in West Java, Jatibarang in Central Java, Bajulmati and Gonggang in East Java, Marangkayu in East Kalimantan, and preparation of Karian dam in Banten; (2) improving the quality and coverage of irrigation system services, through upgrading/building of 115 thousand hectares, rehabilitation of 293 thousand hectares, as well as operation and maintenance of 2.315 million hectares of irrigation networks under the authority of the Central Government; (3) improving the quality and coverage of swamp system services, through upgrading of 8.08 thousand hectares, rehabilitation of 79.37 thousand hectares, as well as operation and maintenance of 1.108 million hectares of swamp networks; and (4) improving the utilization of ground water for agriculture through the construction of 84 ground water wells to serve the 2.246 hectares of irrigated areas, rehabilitation of 97 units of ground water wells to serve the 8.882 hectares of irrigated area, as well as operation and maintenance of 188 units of ground water wells to serve the 9.180 hectares of irrigated area.
Page - 7
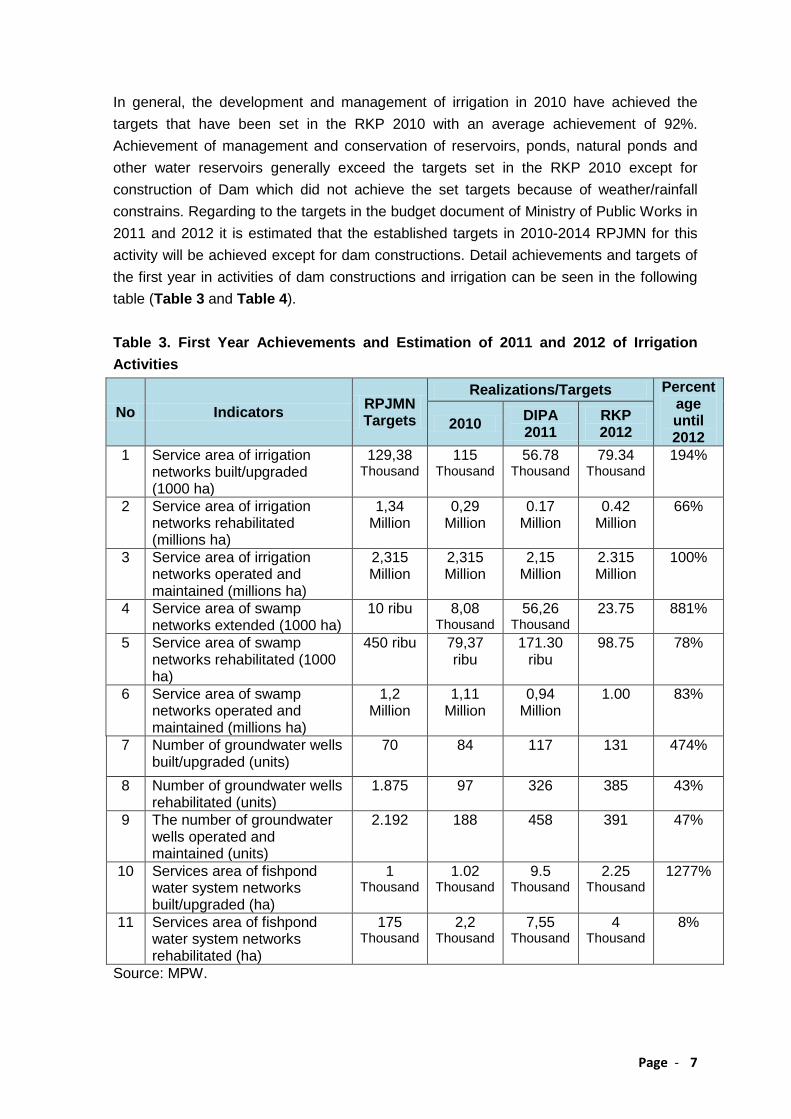
In general, the development and management of irrigation in 2010 have achieved the targets that have been set in the RKP 2010 with an average achievement of 92%. Achievement of management and conservation of reservoirs, ponds, natural ponds and other water reservoirs generally exceed the targets set in the RKP 2010 except for construction of Dam which did not achieve the set targets because of weather/rainfall constrains. Regarding to the targets in the budget document of Ministry of Public Works in 2011 and 2012 it is estimated that the established targets in 2010-2014 RPJMN for this activity will be achieved except for dam constructions. Detail achievements and targets of the first year in activities of dam constructions and irrigation can be seen in the following table (Table 3 and Table 4). Table 3. First Year Achievements and Estimation of 2011 and 2012 of Irrigation Activities
No Indicators RPJMN Targets
Realizations/Targets Percentage until 2012
2010 DIPA 2011
RKP 2012
1 Service area of irrigation networks built/upgraded (1000 ha)
129,38 Thousand
115 Thousand
56.78 Thousand
79.34 Thousand
194%
2 Service area of irrigation networks rehabilitated (millions ha)
1,34 Million
0,29 Million
0.17 Million
0.42 Million
66%
3 Service area of irrigation networks operated and maintained (millions ha)
2,315 Million
2,315 Million
2,15 Million
2.315 Million
100%
4 Service area of swamp networks extended (1000 ha)
10 ribu 8,08 Thousand
56,26 Thousand
23.75 881%
5 Service area of swamp networks rehabilitated (1000 ha)
450 ribu 79,37 ribu
171.30 ribu
98.75 78%
6 Service area of swamp networks operated and maintained (millions ha)
1,2 Million
1,11 Million
0,94 Million
1.00 83%
7 Number of groundwater wells built/upgraded (units)
70 84 117 131 474%
8 Number of groundwater wells rehabilitated (units)
1.875 97 326 385 43%
9 The number of groundwater wells operated and maintained (units)
2.192 188 458 391 47%
10 Services area of fishpond water system networks built/upgraded (ha)
1 Thousand
1.02 Thousand
9.5 Thousand
2.25 Thousand
1277%
11 Services area of fishpond water system networks rehabilitated (ha)
175 Thousand
2,2 Thousand
7,55 Thousand
4 Thousand
8%
Source: MPW.

Page - 8
Table 4. First Year Achievements and Estimation of 2011 and 2012 of Reservoirs Activities
No Indicator Target RPJMN
Realisation/Target Percentage
achieved up to 2012
2010 DIPA 2011 RKP 2012
1 Number of Dams and ponds/natural ponds constructed
11 Dams finished; 1
Dam in construction
process;
-
8 Dams in constructi
on process
9 Dams in construction process 0%
158 ponds/natural
ponds constructed
45 ponds
60 ponds/natural ponds constructe
d.
87 ponds/natural ponds constructe
d.
122%
2 Number of Dams and ponds/natural ponds rehabilitated
29 Dams; 12 Dams;
39 Dams; 24 Dams; 259%
298 ponds/natural
ponds
21 ponds
50 ponds/natural ponds
62 ponds/natural ponds
45%
3 Number of Dams and ponds/ natural ponds operated
182 Dams,ponds/natural ponds
14 Dams
179 Dams/
ponds/natural ponds
389 Dams/ ponds/natural ponds
214%
4 Number of water source areas conserved
15 areas 13 areas
13 areas 36 areas 413%
Source: MPW
IV. CHALLENGES AHEAD - NATIONAL FOOD SECURITY A. National Rice Production
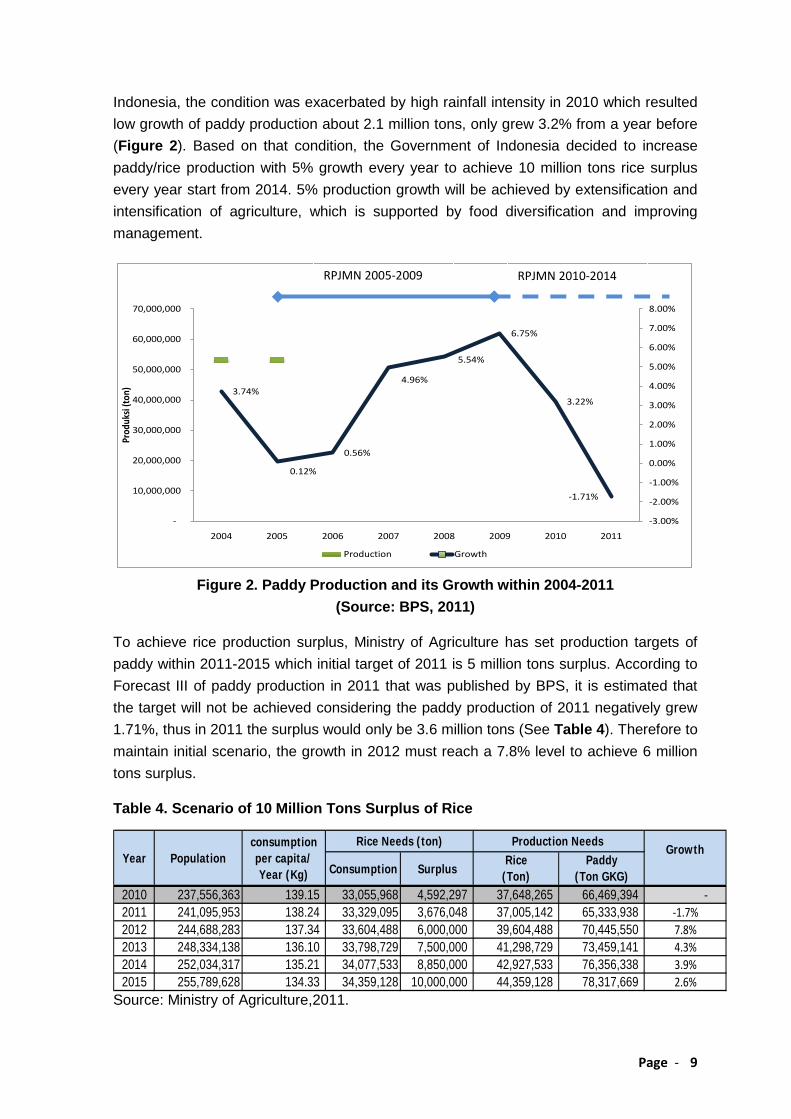
Productions of paddy/rice at the national level in the last few years have significantly increased. Achievement of rice production in 2008 which reached 59.9 million tons is the highest compared to the production achieved before. This achievement received appreciation from the Food and Agriculture Organization (FAO) at the food International summit held in Rome, June 2008. Rice production in 2009 which was the last year implementation of RPJMN 2005-2009 reached 64.4 million tons of dried unhusked rice, an increase of 4.07 million tons (6.75 percent) compared to 2008 which is the highest achievement in 5 years implementation of RPJMN 2005-2009 with an average production 3.6% each year. Food producer’s welfare will increase, while consumers will be benefited by price stability. More than half of the population of poor families depends on agricultural activities, so benefits of improving food production will be enjoyed more by the poor.
The global financial crisis which occurred at the end period of RPJMN 2005-2009 and the beginning of RPJMN 2010-2014 has impacted on world and domestic food price. In
Page - 9
Indonesia, the condition was exacerbated by high rainfall intensity in 2010 which resulted low growth of paddy production about 2.1 million tons, only grew 3.2% from a year before (Figure 2). Based on that condition, the Government of Indonesia decided to increase paddy/rice production with 5% growth every year to achieve 10 million tons rice surplus every year start from 2014. 5% production growth will be achieved by extensification and intensification of agriculture, which is supported by food diversification and improving management.
3.74%
0.12%
0.56%
4.96%
5.54%
6.75%
3.22%
-1.71%
-3.00%
-2.00%
-1.00%
0.00%
1.00%
2.00%
3.00%
4.00%
5.00%
6.00%
7.00%
8.00%
-
10,000,000
20,000,000
30,000,000
40,000,000
50,000,000
60,000,000
70,000,000
2004 2005 2006 2007 2008 2009 2010 2011
Prod
uksi
(ton
)
Production Growth
Figure 2. Paddy Production and its Growth within 2004-2011
(Source: BPS, 2011)
To achieve rice production surplus, Ministry of Agriculture has set production targets of paddy within 2011-2015 which initial target of 2011 is 5 million tons surplus. According to Forecast III of paddy production in 2011 that was published by BPS, it is estimated that the target will not be achieved considering the paddy production of 2011 negatively grew 1.71%, thus in 2011 the surplus would only be 3.6 million tons (See Table 4). Therefore to maintain initial scenario, the growth in 2012 must reach a 7.8% level to achieve 6 million tons surplus.
Table 4. Scenario of 10 Million Tons Surplus of Rice
Rice Paddy(Ton) (Ton GKG)
2010 237,556,363 139.15 33,055,968 4,592,297 37,648,265 66,469,394 - 2011 241,095,953 138.24 33,329,095 3,676,048 37,005,142 65,333,938 -1.7%2012 244,688,283 137.34 33,604,488 6,000,000 39,604,488 70,445,550 7.8%2013 248,334,138 136.10 33,798,729 7,500,000 41,298,729 73,459,141 4.3%2014 252,034,317 135.21 34,077,533 8,850,000 42,927,533 76,356,338 3.9%2015 255,789,628 134.33 34,359,128 10,000,000 44,359,128 78,317,669 2.6%
Consumption SurplusGrowth
Year Populationconsumption per capita/ Year (Kg)
Rice Needs (ton) Production Needs
Source: Ministry of Agriculture,2011.
RPJMN 2010-2014 RPJMN 2005-2009
Page - 10
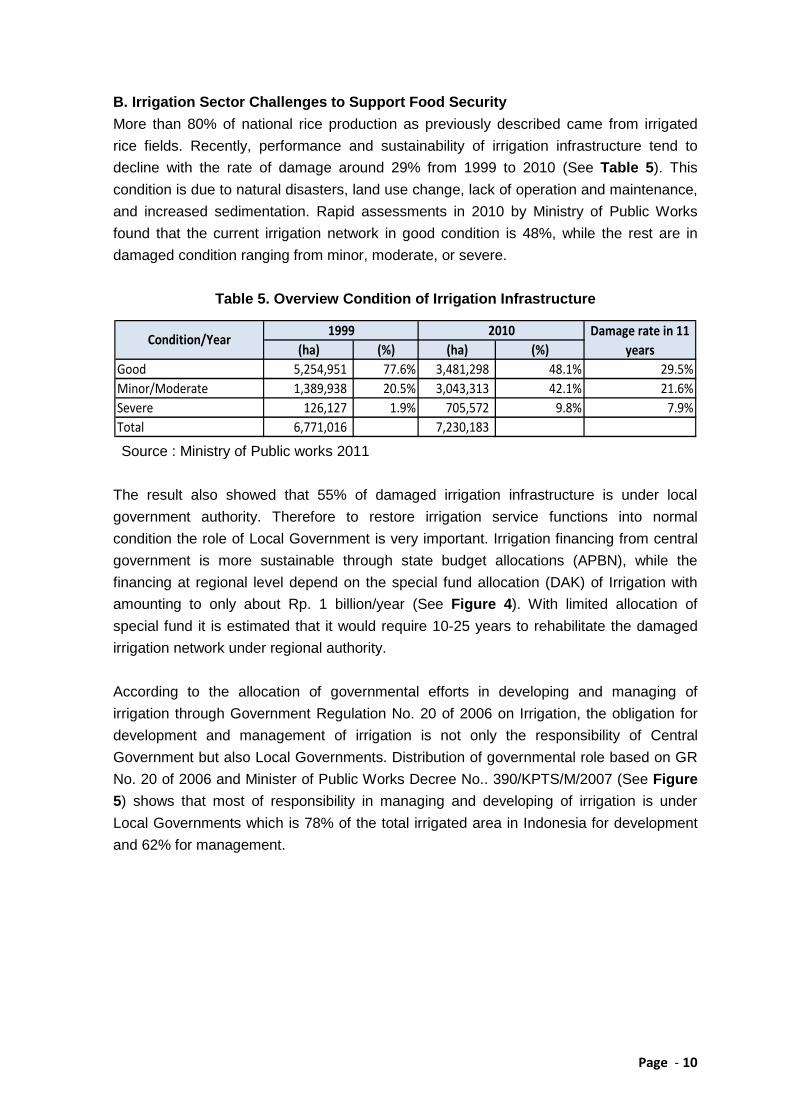
B. Irrigation Sector Challenges to Support Food Security More than 80% of national rice production as previously described came from irrigated rice fields. Recently, performance and sustainability of irrigation infrastructure tend to decline with the rate of damage around 29% from 1999 to 2010 (See Table 5). This condition is due to natural disasters, land use change, lack of operation and maintenance, and increased sedimentation. Rapid assessments in 2010 by Ministry of Public Works found that the current irrigation network in good condition is 48%, while the rest are in damaged condition ranging from minor, moderate, or severe.
Table 5. Overview Condition of Irrigation Infrastructure
(ha) (%) (ha) (%)Good 5,254,951 77.6% 3,481,298 48.1% 29.5%Minor/Moderate 1,389,938 20.5% 3,043,313 42.1% 21.6%Severe 126,127 1.9% 705,572 9.8% 7.9%Total 6,771,016 7,230,183
20101999Condition/Year
Damage rate in 11 years
Source : Ministry of Public works 2011 The result also showed that 55% of damaged irrigation infrastructure is under local government authority. Therefore to restore irrigation service functions into normal condition the role of Local Government is very important. Irrigation financing from central government is more sustainable through state budget allocations (APBN), while the financing at regional level depend on the special fund allocation (DAK) of Irrigation with amounting to only about Rp. 1 billion/year (See Figure 4). With limited allocation of special fund it is estimated that it would require 10-25 years to rehabilitate the damaged irrigation network under regional authority. According to the allocation of governmental efforts in developing and managing of irrigation through Government Regulation No. 20 of 2006 on Irrigation, the obligation for development and management of irrigation is not only the responsibility of Central Government but also Local Governments. Distribution of governmental role based on GR No. 20 of 2006 and Minister of Public Works Decree No.. 390/KPTS/M/2007 (See Figure 5) shows that most of responsibility in managing and developing of irrigation is under Local Governments which is 78% of the total irrigated area in Indonesia for development and 62% for management.

Page - 11
Figure 4. Condition of Indonesian Irrigated Area of 2010
(Source: Ministry of Public works, 2011)
Figure 5. Development and Management of Irrigation System (Source : GR No 20 of 2006 and Minister of Public Works Decree No. 390/KPTS/M/2007)
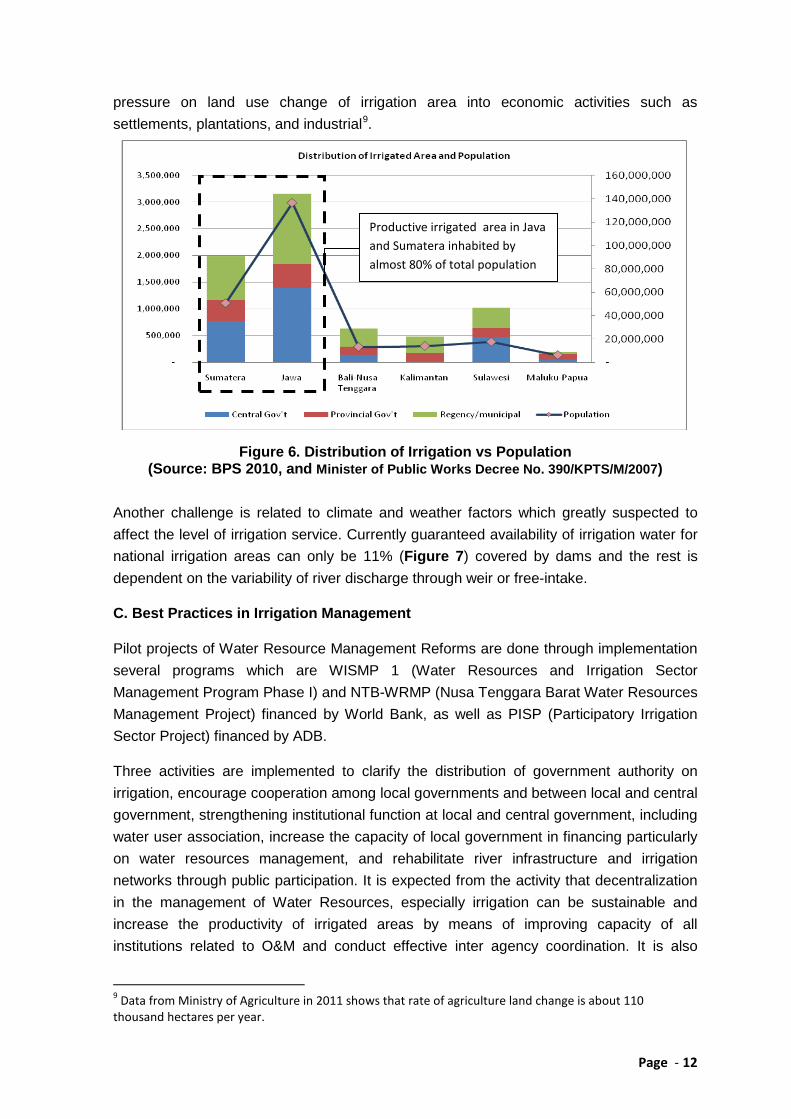
The local government’s role in maintaining the function of irrigated area is very strategic due to most of the national irrigation areas are located in highly populated areas. The Population Census of 2010 showed that almost 80% of the total population of Indonesia is located in the Sumatra and Java Island which have 5.1 million hectares or 69% of the total irrigated area in Indonesia. The high number of population leads to the increasing
Development Management
Regency/Municipal
Provincial
Central
Page - 12
pressure on land use change of irrigation area into economic activities such as settlements, plantations, and industrial9
.
Figure 6. Distribution of Irrigation vs Population
(Source: BPS 2010, and Minister of Public Works Decree No. 390/KPTS/M/2007)
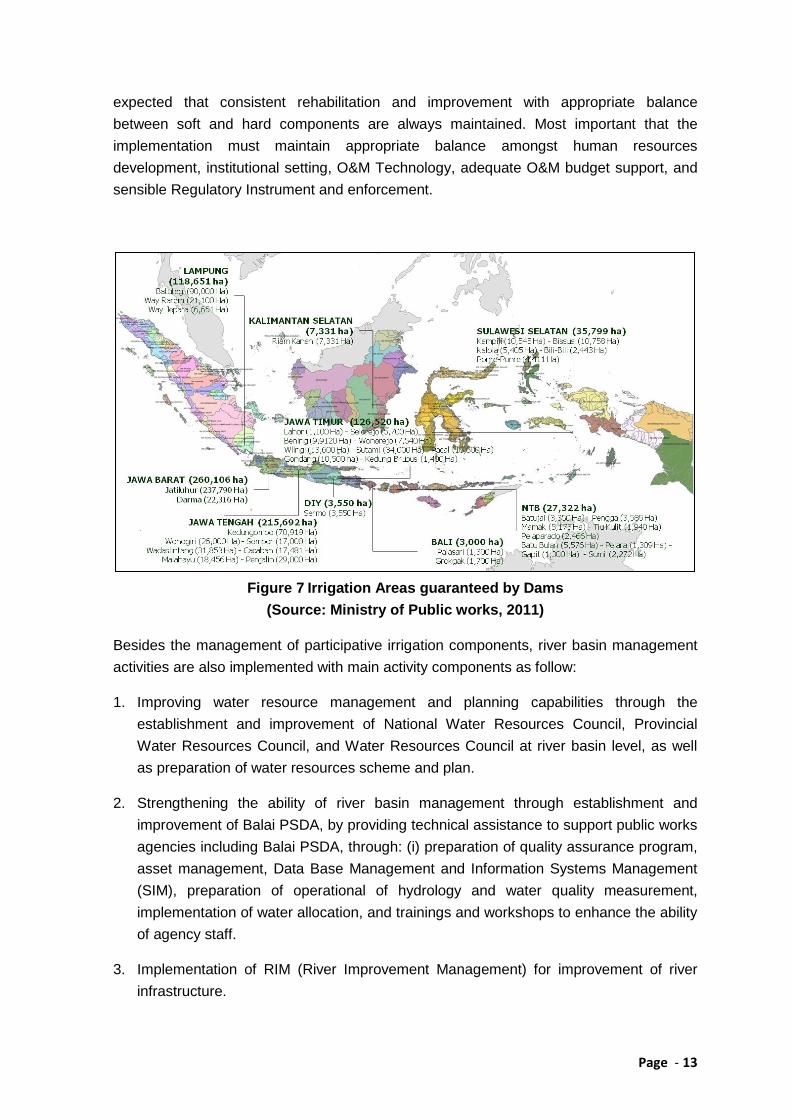
Another challenge is related to climate and weather factors which greatly suspected to affect the level of irrigation service. Currently guaranteed availability of irrigation water for national irrigation areas can only be 11% (Figure 7) covered by dams and the rest is dependent on the variability of river discharge through weir or free-intake.
C. Best Practices in Irrigation Management
Pilot projects of Water Resource Management Reforms are done through implementation several programs which are WISMP 1 (Water Resources and Irrigation Sector Management Program Phase I) and NTB-WRMP (Nusa Tenggara Barat Water Resources Management Project) financed by World Bank, as well as PISP (Participatory Irrigation Sector Project) financed by ADB.
Three activities are implemented to clarify the distribution of government authority on irrigation, encourage cooperation among local governments and between local and central government, strengthening institutional function at local and central government, including water user association, increase the capacity of local government in financing particularly on water resources management, and rehabilitate river infrastructure and irrigation networks through public participation. It is expected from the activity that decentralization in the management of Water Resources, especially irrigation can be sustainable and increase the productivity of irrigated areas by means of improving capacity of all institutions related to O&M and conduct effective inter agency coordination. It is also
9 Data from Ministry of Agriculture in 2011 shows that rate of agriculture land change is about 110 thousand hectares per year.
Productive irrigated area in Java and Sumatera inhabited by almost 80% of total population
Page - 13
expected that consistent rehabilitation and improvement with appropriate balance between soft and hard components are always maintained. Most important that the implementation must maintain appropriate balance amongst human resources development, institutional setting, O&M Technology, adequate O&M budget support, and sensible Regulatory Instrument and enforcement.
Figure 7 Irrigation Areas guaranteed by Dams
(Source: Ministry of Public works, 2011)
Besides the management of participative irrigation components, river basin management activities are also implemented with main activity components as follow:
1. Improving water resource management and planning capabilities through the establishment and improvement of National Water Resources Council, Provincial Water Resources Council, and Water Resources Council at river basin level, as well as preparation of water resources scheme and plan.
2. Strengthening the ability of river basin management through establishment and improvement of Balai PSDA, by providing technical assistance to support public works agencies including Balai PSDA, through: (i) preparation of quality assurance program, asset management, Data Base Management and Information Systems Management (SIM), preparation of operational of hydrology and water quality measurement, implementation of water allocation, and trainings and workshops to enhance the ability of agency staff.
3. Implementation of RIM (River Improvement Management) for improvement of river infrastructure.

Page - 14
d. Lessons Learnt
Several important achievements of the three activities provide lessons in improving the management of water resources and irrigation in the future are as follows:
1. Improvements in the governance of water resources sector through the establishment of the National Water Resources Council, the Provincial Water Resources Council, and the Water Resources Council River Basin (TKPSDA), and Balai PSDA, with a proportional membership from all stakeholders. Some of TKPSDA especially in Java have reviewed their Scheme and Plan and several Provincial Water Resources Councils have prepared a draft of provincial policy in Water Resources management.
2. Improvements in water resources management unit at the provincial level in terms of database management, hydrology, water quality monitoring and pilot of water allocation. Nevertheless, more intensive efforts are required to optimize the role and functions of institutions at the central and provincial/regency and internalize the processes such as data collection and processing, quality assurance, asset management, monitoring and evaluation into the routine activities of the government to improve the operation and service.
3. In terms of participatory irrigation management, projects have formed large numbers of Water User Association (WUA) and have implemented their responsibilities in maintaining and operating of tertiary channels in accordance with the principle of PPSIP. At the district level irrigation committees have been formed and its implementation has been able to increase its role in providing support for WUA through participatory decision-making in managing irrigation systems. Furthermore, there has been an increase in WUA’s participation in financing and managing tertiary channel, and in some cases, WUA also contributed in the operation and maintenance of secondary network.
4. In terms of production, the assessment results showed an increase about 15-20% through increased cropping intensity and production. In NTB there was an increase of planted area about 24.5% and production increase about 4.4% and for several areas which adopted SRI system production increase significantly about 20-40%.
V. CONCLUSIONS AND RECOMMENDATIONS
1. Shifting paradigm in water resources management in Indonesia that was marked by the issuance of Law No. 7 in 2004 has shown significant improvement. However, the challenges for implementation in the era of decentralization and regional autonomy and also climate change issues need a more consistent implementation by all stakeholders both at the national and local levels.
Page - 15
2. Pilot reforms implemented through several strategic projects of Water Resources have shown satisfactory results. However, the scope of the activities conducted were quite small to on a national scale, therefore the role of government, especially local governments to disseminate and internalize management processes into routine activities should be encouraged and improved for sustainability of management.
3. Irrigation management as one of supporting sector in achieving national food security needs to be continuously improved. Targets for expansion of agricultural area in improving production capacity require intensive synchronization in the future, between ministries at the central government level (Ministry of Agriculture and Public Works) and with local government. Sustainability performance of irrigation infrastructure needs a consistent operation and maintenance of irrigation systems in terms of management and financing in order to maintain and improve irrigation infrastructure services. Public participation and integration with local wisdom in irrigation management should be encouraged especially in the operation and maintenance of irrigation infrastructure, thus its role as social capital could be realized and sustainable as a solution for the limitation of government budget.
4. A forecast in rice production decline in 2011 warrants a change of strategy in its prevention. With all the limitations in expansion of irrigated area, the increase in agricultural cultivation technology that is eco-friendly and low-cost through the expansion of the area of high technology adoption and increase in researches to produce low-cost technologies is one strategy that could be developed.
---------