Embed Size (px)
Citation preview
Country Brief:
Theme: Role of Government in
Power Sector and Energy Market
INDONESIA
Contents
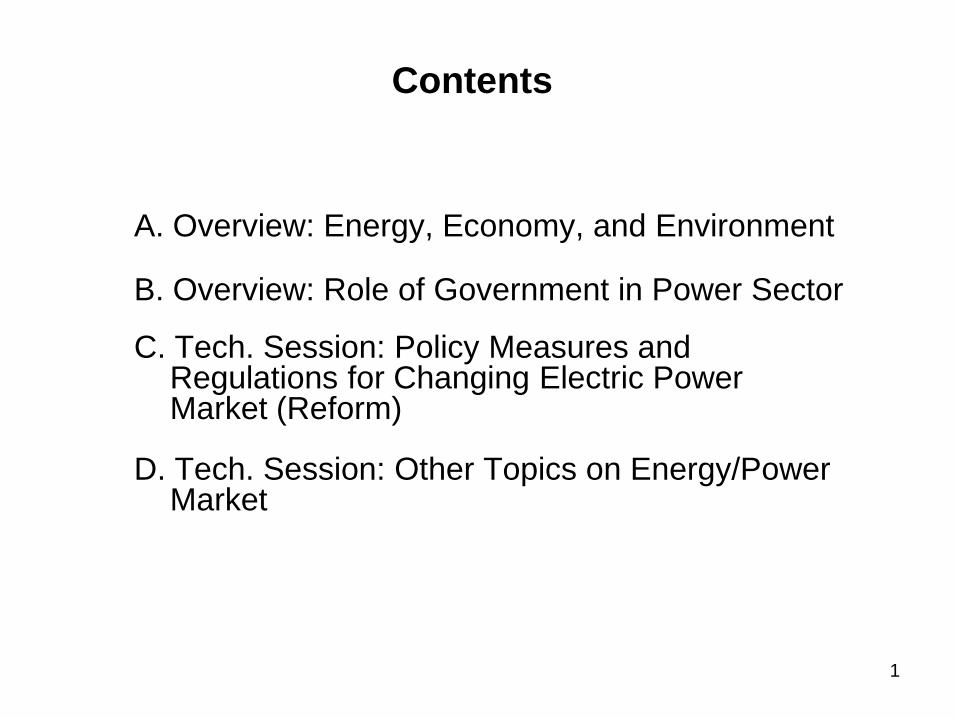
A. Overview: Energy, Economy, and Environment
B. Overview: Role of Government in Power Sector
C. Tech. Session: Policy Measures and Regulations for Changing Electric Power Market (Reform)
D. Tech. Session: Other Topics on Energy/Power Market
1

A. Overview:
Energy, Economy, and Environment
2

Country Overview
Area Total: 1,919,440 km2, land: 1,826,440 km2, water: 93,000 km2
Energy Resources Crude oil :3.7 billion barrels (et end of 2012) (BP)
Natural gas: 2.9 Trillion m3 (et end of 2012) (BP)
Coal: 5,529 million tonnes (et end of 2012) (BP)
Population 244.5 million (end of 2012) (IMF)
Annual Growth 1.43% (2000-2012)
GDP 878.2 billion USD (2012) (IMF)
Annual Growth 5.42% (2000-2012)
GDP per Capita 3,592 USD (2012) (IMF)
Total Primary
Energy Supply
159.4 million toe (2012) BP
TPES per Capita 0.65 toe (2012)
TPES per GDP 0.18 toe/thousand USD (2012)
Electrification ratio 76.56% (2012) (PLN + Non PLN) 3

Historical Trend of Energy and Power
• Indonesia is a resource rich country with a growing demand for energy.
From 2000 to 2012, total primary energy supply grew at an average
annual rate of 4.5% from 99.1 million toe to 159.4 million toe for the
same period.
• In 2012, Carbon Dioxide Emissions are 495.2 million tones.
• The government's commitment to reduce GHG emissions up to 26% in
2020 with national efforts and 41% with international assistance.
Renewable energy and energy efficiency both are prioritized to achieve
emission reduction targets
Source: BP [statistical_review_of_world_energy_2013]
4
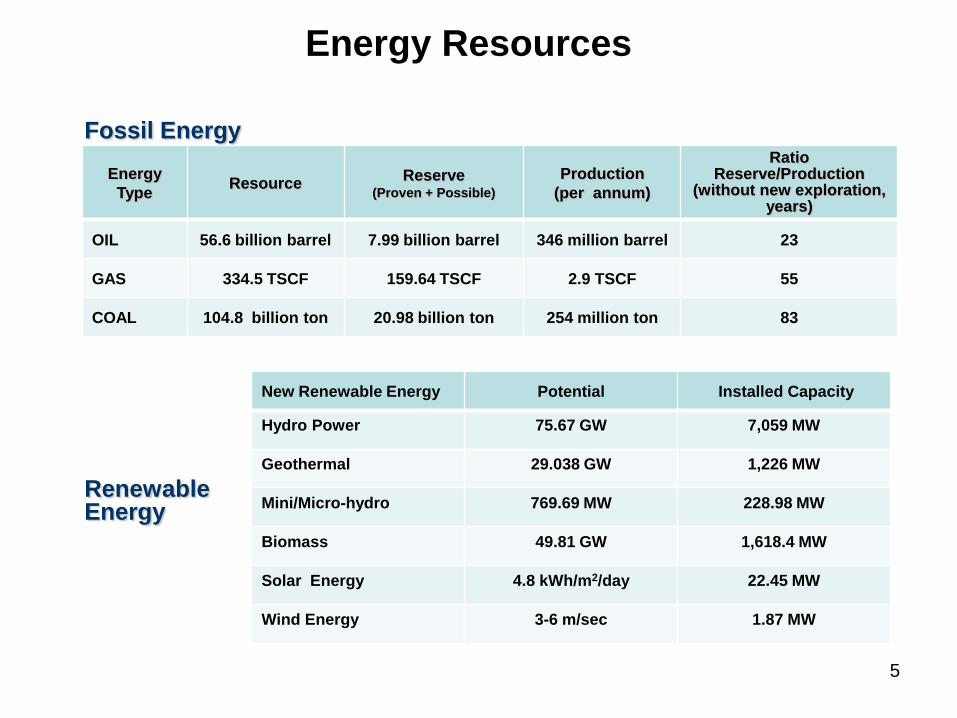
Energy Resources
Energy
Type Resource
Reserve (Proven + Possible)
Production
(per annum)
Ratio Reserve/Production
(without new exploration, years)
OIL 56.6 billion barrel 7.99 billion barrel 346 million barrel 23
GAS 334.5 TSCF 159.64 TSCF 2.9 TSCF 55
COAL 104.8 billion ton 20.98 billion ton 254 million ton 83
New Renewable Energy Potential Installed Capacity
Hydro Power 75.67 GW 7,059 MW
Geothermal 29.038 GW 1,226 MW
Mini/Micro-hydro 769.69 MW 228.98 MW
Biomass 49.81 GW 1,618.4 MW
Solar Energy 4.8 kWh/m2/day 22.45 MW
Wind Energy 3-6 m/sec 1.87 MW
Fossil Energy
Renewable Energy
5

National Energy Mix Target (Presidential Regulation No. 5 Year 2006)
Energy Mix (2025)
Energy Elasticity < 1
Reduce oil share from energy
mix
More new and renewable
energy sources (e.g. Bio-fuel,
geothermal, solar, hydro, and
wind power more than 17% in
year 2025)
Intensify energy diversification
(fuel switching)
Improve energy efficiency
(energy elasticity < 1 ).
Non Fossil Energy/NRE: 17 %
Coal 33%
Oil
20%
NRE,17%
Biofuel 5%
Geothermal 5%
Biomass, Nuclear, Hydro
Power, Solar, Wind Power 5%
Liquefaction Coal 2%
Gas 30%
6
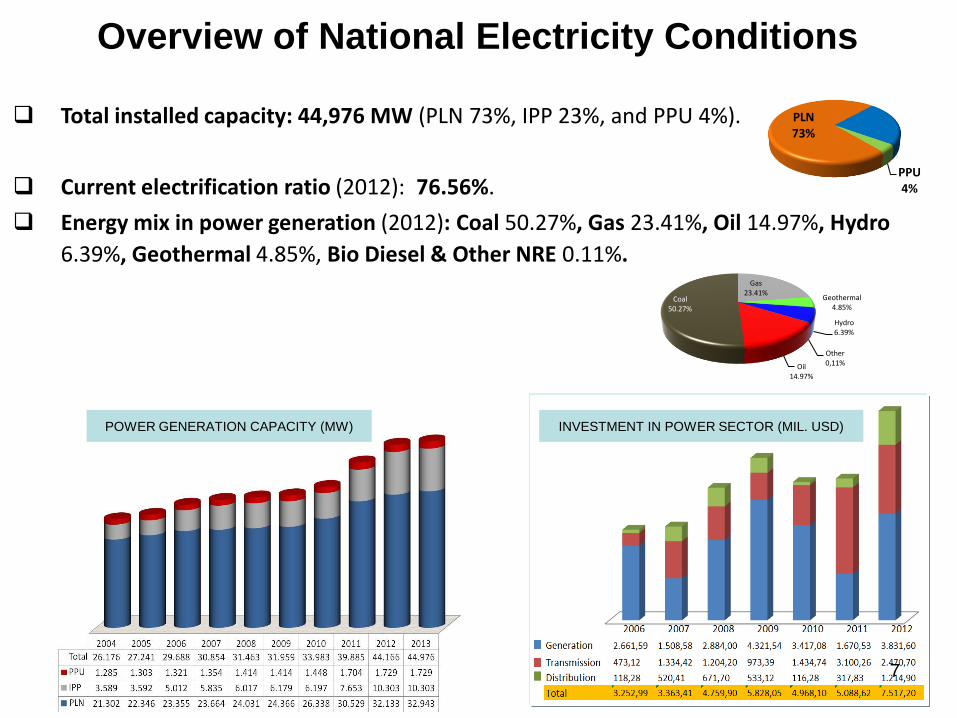
Overview of National Electricity Conditions
Total installed capacity: 44,976 MW (PLN 73%, IPP 23%, and PPU 4%).
Current electrification ratio (2012): 76.56%.
Energy mix in power generation (2012): Coal 50.27%, Gas 23.41%, Oil 14.97%, Hydro
6.39%, Geothermal 4.85%, Bio Diesel & Other NRE 0.11%.
Oil 14.97%
Coal 50.27%
Gas 23.41%
Geothermal 4.85%
Hydro 6.39%
Other 0,11%
INVESTMENT IN POWER SECTOR (MIL. USD) POWER GENERATION CAPACITY (MW)
PLN 73%
IPP 23%
PPU 4%
7

Realization of Energy Mix (2008 – 2013)
2008 2009 2010 2011 2012 2013
APBN-P
Realization
up to June
2013
Oil 36% 25% 22% 22,95% 14,97% 10,87% 12,57%
Gas 17% 25% 25% 21,00% 23,41% 22,45% 23,32%
Coal 35% 39% 38% 44,06% 50,27% 55,15% 50,29%
Hydro 9% 8% 12% 6,80% 6,39% 6,40% 8,99%
Gethermal 3% 3% 3% 5,13% 4,85% 4,60% 4,74%
Bio Diesel & Other RE 0% 0% 0% 0,07% 0,11% 0,52% 0,09%
0%
10%
20%
30%
40%
50%
60%
70%
80%
90%
100%
8
: Existing transmission line
: Planning transmission line
: Power generation
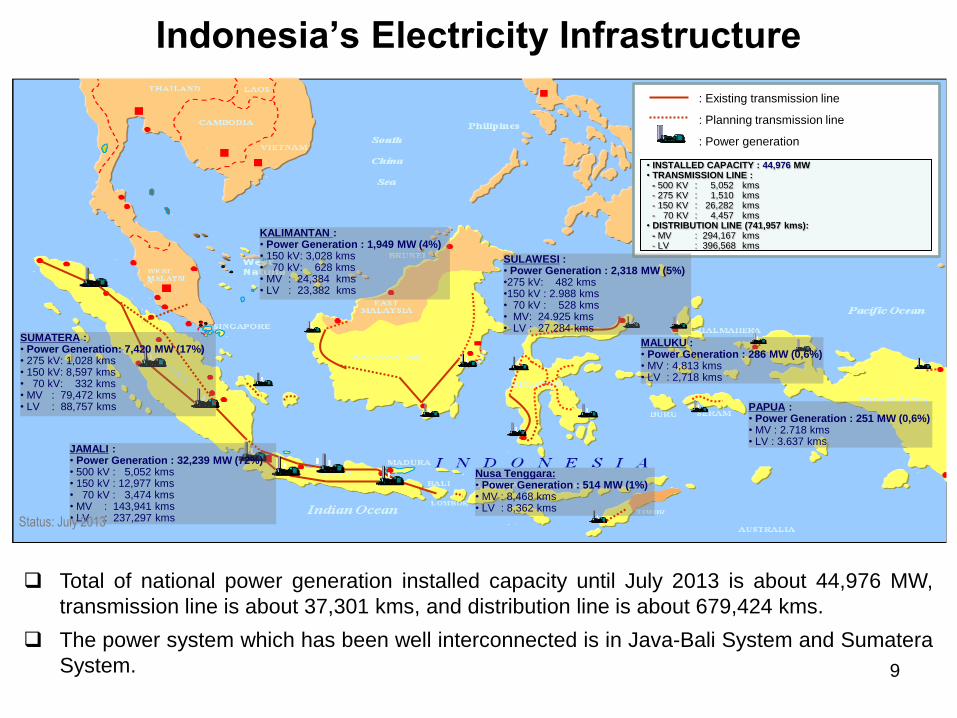
• INSTALLED CAPACITY : 44,976 MW • TRANSMISSION LINE : - 500 KV : 5,052 kms - 275 KV : 1,510 kms - 150 KV : 26,282 kms - 70 KV : 4,457 kms • DISTRIBUTION LINE (741,957 kms): - MV : 294,167 kms - LV : 396,568 kms
SUMATERA : • Power Generation: 7,420 MW (17%) • 275 kV: 1,028 kms • 150 kV: 8,597 kms • 70 kV: 332 kms • MV : 79,472 kms • LV : 88,757 kms
JAMALI : • Power Generation : 32,239 MW (72%) • 500 kV : 5,052 kms • 150 kV : 12,977 kms • 70 kV : 3,474 kms • MV : 143,941 kms • LV : 237,297 kms
Nusa Tenggara: • Power Generation : 514 MW (1%) • MV : 8,468 kms • LV : 8,362 kms
KALIMANTAN : • Power Generation : 1,949 MW (4%) • 150 kV: 3,028 kms • 70 kV: 628 kms • MV : 24,384 kms • LV : 23,382 kms
SULAWESI : • Power Generation : 2,318 MW (5%) •275 kV: 482 kms •150 kV : 2.988 kms • 70 kV : 528 kms • MV: 24.925 kms • LV : 27.284 kms
PAPUA : • Power Generation : 251 MW (0,6%) • MV : 2.718 kms • LV : 3.637 kms
MALUKU : • Power Generation : 286 MW (0,6%) • MV : 4,813 kms • LV : 2,718 kms
Indonesia’s Electricity Infrastructure
Total of national power generation installed capacity until July 2013 is about 44,976 MW,
transmission line is about 37,301 kms, and distribution line is about 679,424 kms.
The power system which has been well interconnected is in Java-Bali System and Sumatera
System.
Status: July 2013
9

Category :
> 60 %
41 - 60 %
20 - 40 %
Aceh 90,96%
Sumut 86,70%
Sumbar 76,14%
Riau 85,09%
Sumsel 73,97.%
Bengkulu 79,37%
Babel 94,13%
Lampung 74,91%
Jakarta 99,99%
Banten 77,52%
Jabar 76,03%
Jateng 79,95%
Jambi 70,37%
DIY 77,26%
Jatim 74,31%
Bali 74,95%
NTB 53,63%
NTT 53,42%
Kalbar 71,46%
Kalsel 76,74%
Kaltim 73,08%
Sulut 76,22%
Sulteng 66,83%
Sulsel 76,29%
Malut 74,12%
Maluku 72,07%
Papua 34,62%
Sulbar 66,65%
Kepri 83,56%
Sultra 60,53%
Papua Barat 67,88%
Kalteng 73,32%
Gorontalo 60,99%
Electrification Ratio (2012)
10

B. Overview:
Role of Government in Power Sector
Under Law 30/2009 on Electricity
11

Important Points of
Law No. 30/2009 on Electricity
Electricity supply for public use will be controlled by the state, carried out by both the
Government and Regional Government based on the principles of regional autonomy.
Electricity provision is principle carried out by state owned enterprise (BUMN), but
regional owned enterprise (BUMD), private business entity, cooperative and self-
supporting community can also participate in this business.
Existing regulations in the electricity business is strengthened to encourage private
sector participation, such as Independent Power Producers (IPPs) can sell
electricity to PLN and Private Power Utilities (PPUs) can sell electricity to public within
their concession areas.
Regional tariff pricing will be introduced. Issues related to retail tariff will be regulated
by the Government and its values must be approved by Parliament (DPR) and local
parliament (DPRD). This value is determined by several factors i.e.: cost of supply,
consumer’s capabilities, quality of supply and services. Whenever the retail tariff is set
below its cost of supply, the Government or local government should provide subsidy
(The detail in Government Regulation 14/2002 on Electricity Supply Business).
Cross border trade/transactions of electricity is allowed with certain requirement
(Government Regulation 42/2012 concerning on Cross Border Electricity Trade).
Safety and environmental standard is applied in the development of power plants
(Government Regulation 62 on Supporting Electricity Business).
12
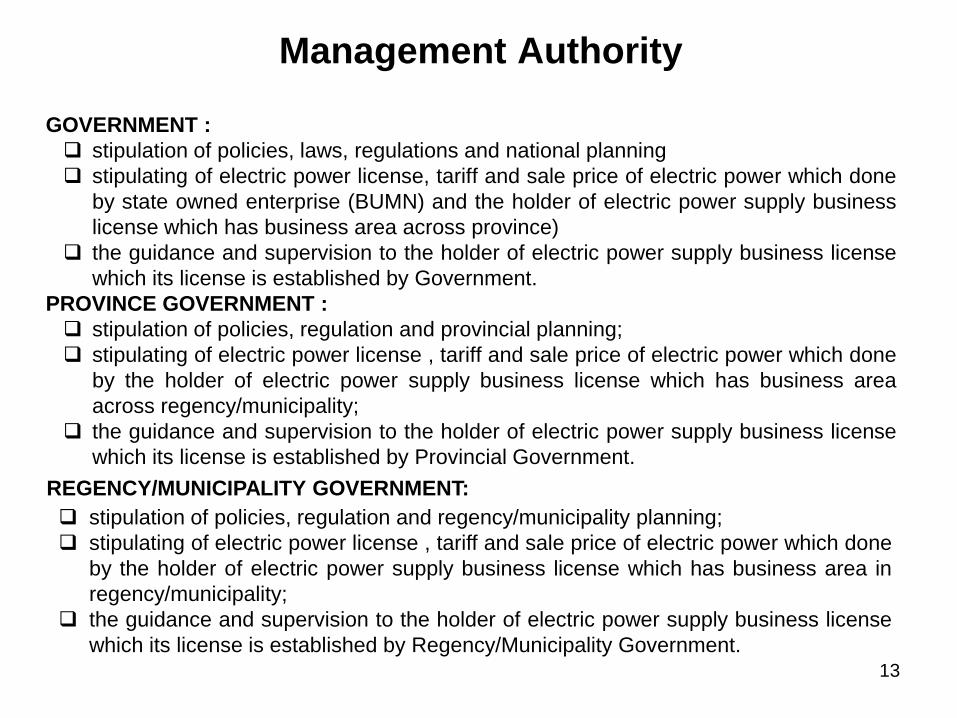
Management Authority
13
GOVERNMENT :
stipulation of policies, laws, regulations and national planning
stipulating of electric power license, tariff and sale price of electric power which done
by state owned enterprise (BUMN) and the holder of electric power supply business
license which has business area across province)
the guidance and supervision to the holder of electric power supply business license
which its license is established by Government.
PROVINCE GOVERNMENT :
stipulation of policies, regulation and provincial planning;
stipulating of electric power license , tariff and sale price of electric power which done
by the holder of electric power supply business license which has business area
across regency/municipality;
the guidance and supervision to the holder of electric power supply business license
which its license is established by Provincial Government.
REGENCY/MUNICIPALITY GOVERNMENT:
stipulation of policies, regulation and regency/municipality planning;
stipulating of electric power license , tariff and sale price of electric power which done
by the holder of electric power supply business license which has business area in
regency/municipality;
the guidance and supervision to the holder of electric power supply business license
which its license is established by Regency/Municipality Government.

Role Of Government In Power Sector
Issuance of Business license of electric power supply (IUPL)
MINISTER
GOVERNOR
REGENT/
MAYOR
- State Own Enterprise (PLN)
- business area across province
- Selling electricity to the holder of electric power
supply business license which is established by
Minister
business area across regency/ municipality
business area in regency/municipality
AUTHORITY OF LICENSE ESTABLISHMENT
Role of Minister/Governor/Regent/Major based on authority related to issuance of IUPL
1. set tariff for consumers
2. approval of the sale price electricity and rental network
3. permit utilization of electricty network for telematics
4. direct and supervise
5. impose administrative sanctions 14

Electricity Consumption by Segment of Customer (2011)
RESIDENTIAL92.8%
BUSINESS4.3%
INDUSTRY0.1%
GOVERNMENT0.6%
OTHERS2.2%
Number of Customers
RESIDENTIAL41.3%
BUSINESS16.5%
INDUSTRY34.7%
GOVERNMENT3.7%
OTHERS3.7%
Energy Consumption
RESIDENTIAL35.8%
BUSINESS21.9%
INDUSTRY33.8%
GOVERNMENT4.5%
OTHERS3.9%
RevenueSEGMENT NO. OF CUST TWH/ YEAR M $ / YEAR
RESIDENTIAL 42,347,588 64.58 4,537
BUSINESS 1,971,211 25.85 2,779
INDUSTRY 50,027 54.23 4,288
GOVERNMENT 252,651 5.80 573
OTHERS 1,009,582 5.83 497
TOTAL 45,631,059 156.29 12,674 15

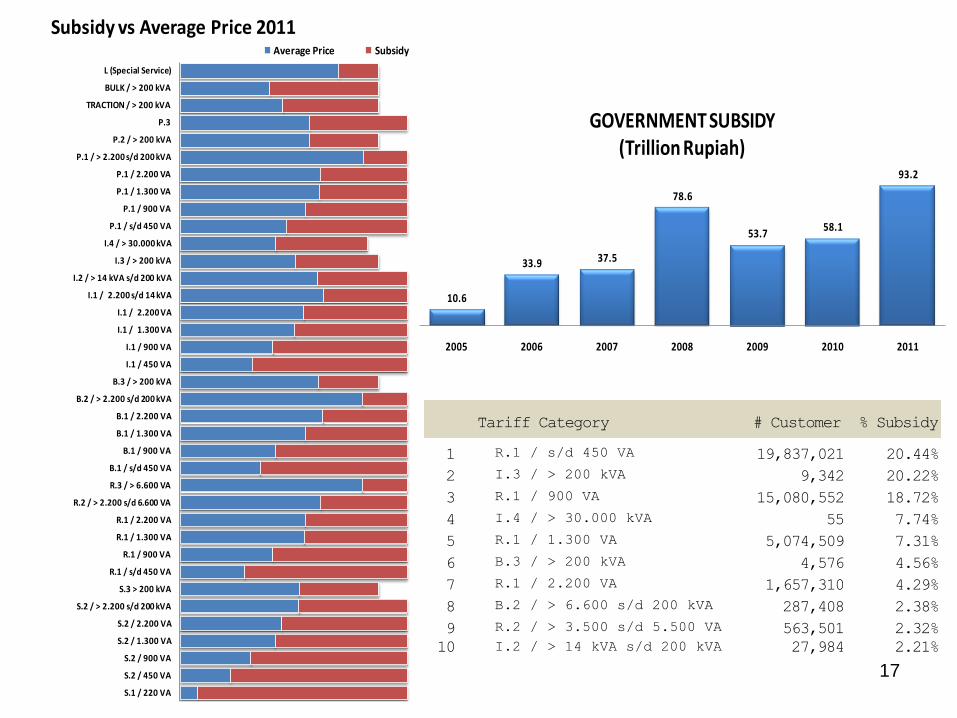
Standards of Life: electrification, residential tariff rates
• Electrification ratio:76.5% (as of end 2012).
• The Indonesian government sets the electricity tariff for all consumer types. The amount of subsidy is determined annually by the government, based on the difference between the average cost of electricity production proposed by (PLN),
• There are six electricity tariff blocks (Residential) for subscription options. • In 2011, the government spent 93.18 trillion Rp on electricity subsidy.
Year
Average Electricity
Cost
(Rp/kWh)
Subsidy
(Trillion Rp)
2005 710 10,64
2006 934 33,90
2007 920 37,48
2008 1.271 78,58
2009 1.009 53,72
2010 1.008 58,11
2011 1.251 93,18
16
S.1 / 220 VA
S.2 / 450 VA
S.2 / 900 VA
S.2 / 1.300 VA
S.2 / 2.200 VA
S.2 / > 2.200 s/d 200 kVA
S.3 > 200 kVA
R.1 / s/d 450 VA
R.1 / 900 VA
R.1 / 1.300 VA
R.1 / 2.200 VA
R.2 / > 2.200 s/d 6.600 VA
R.3 / > 6.600 VA
B.1 / s/d 450 VA
B.1 / 900 VA
B.1 / 1.300 VA
B.1 / 2.200 VA
B.2 / > 2.200 s/d 200 kVA
B.3 / > 200 kVA
I.1 / 450 VA
I.1 / 900 VA
I.1 / 1.300 VA
I.1 / 2.200 VA
I.1 / 2.200 s/d 14 kVA
I.2 / > 14 kVA s/d 200 kVA
I.3 / > 200 kVA
I.4 / > 30.000 kVA
P.1 / s/d 450 VA
P.1 / 900 VA
P.1 / 1.300 VA
P.1 / 2.200 VA
P.1 / > 2.200 s/d 200 kVA
P.2 / > 200 kVA
P.3
TRACTION / > 200 kVA
BULK / > 200 kVA
L (Special Service)
Subsidy vs Average Price 2011Average Price Subsidy
10.6
33.9 37.5
78.6
53.7 58.1
93.2
2005 2006 2007 2008 2009 2010 2011
GOVERNMENT SUBSIDY(Trillion Rupiah)
Tariff Category # Customer % Subsidy
1 R.1 / s/d 450 VA 19,837,021 20.44%
2 I.3 / > 200 kVA 9,342 20.22%
3 R.1 / 900 VA 15,080,552 18.72%
4 I.4 / > 30.000 kVA 55 7.74%
5 R.1 / 1.300 VA 5,074,509 7.31%
6 B.3 / > 200 kVA 4,576 4.56%
7 R.1 / 2.200 VA 1,657,310 4.29%
8 B.2 / > 6.600 s/d 200 kVA 287,408 2.38%
9 R.2 / > 3.500 s/d 5.500 VA 563,501 2.32%
10 I.2 / > 14 kVA s/d 200 kVA 27,984 2.21%
17

Tariff Policy
• Maintain the sustainability of electricity supply
• Improving the quality of customer service
• Considering: – Fairness
– Affordability
– Cost of Production
– Operational Efficiency
– Operational Size
– Interconnection System
18

PLN Electricity Tarif Adjusment For 2013
S2/sd 20
0K
S.1 S2/450
S2/900
S2/1300
S2/2200
S3I1/sd 14
K
LR1/450
R1/900
R1/1300
R1/2200
R2 B1/450
B1/900
B1/1300
B1/sd 55
00
P1/sd 55
00
I2 B3R3 B2 I1/450
I1/900
I1/1300
I1/2200
P2P3 T CI3 I4P1/450
P1/900
P1/1300
P1/sd 20
0K
S2
/sd
20
0K
S.1
S2
/45
0
S2
/90
0
S2
/13
00
S2
/22
00
S3
I1/s
d 1
4K
LR1/4
50
R1/9
00
R1/1
300
R1/2
200
R2
B1
/45
0
B1
/90
0
B1
/13
00
B1
/sd
55
00
P1
/sd
55
00
I2 B3
R3
B2
I1/4
50
I1/9
00
I1/1
30
0
I1/2
20
0
P2
P3
T CI3 I4P1
/45
0
P1
/90
0
P1
/13
00
P1
/sd
20
0K
COST LV:
1352 Rp/kWh
MV
1113
HV
1006
Subsidiy
(Rp/kWh) Decreasing of
Subsidy (Rp/kWh)
Electricity Bill
(Rp/kWh)
(Rp/k
Wh)
No more Subsidy
S2
/sd
20
0K
S.1
S2
/45
0
S2
/90
0
S2
/13
00
S2
/22
00
S3
I1/s
d 1
4K
LR1/4
50
R1/9
00
R1/1
300
R1/2
200
R2
B1
/45
0
B1
/90
0
B1
/13
00
B1
/sd
55
00
P1
/sd
55
00
I2 B3
R3
B2
I1/4
50
I1/9
00
I1/1
30
0
I1/2
20
0
P2
P3
T CI3 I4P1
/45
0
P1
/90
0
P1
/13
00
P1
/sd
20
0K
RA
KS
I
UR
AH
AY
AN
AN
KH
US
US
19

Electricity Tariff Structure
20

Electricity Tariff Road-map
MID TERM:
To increase the tariff, towards
the economic price
Cost of Goods Sold
2012 2013 2014 2015
Rp/kWh
LONG TERM:
- Automatic tariff adjustment
- Subject to primary energy
prices and exchange rate
fluctuation
COGS
2015
Rp/kWh
21
Environmental/Low carbon initiatives:
renewables, energy efficiencies, fuel switching
• The Clean Technology Fund (of the World Bank) and the Asian Development
Bank (ADB) have established a fund for lending to renewable energy projects
in Indonesia, including those developed by PLN. The funds will be used to
finance 880 MW of geothermal development, as well as biomass projects.
• The objective of Law on Energy No. 30 of 2007 is to secure sustainable energy
supplies and promote conservation and the use of renewable energy
resources.
• The government has set objectives to increase the use of renewable sources
for power generation. The goal is that renewables account for 17% of
Indonesia’s installed generating capacity by 2025. The 17% would be
comprised of 5% from biofuel, 5 % from geothermal, 5% from a combination of
biomass, hydro, solar, wind and nuclear, and 2% from liquefied coal.
• The Government of Indonesia has promoted Feed-in Tariff for Geothermal,
Hydro ≤ 10 MW, and Biomass ≤ 10 MW and also Ceiling Price for Photovoltaic.
22

Energy Security for Electricity
a. Demand and Supply of Electricity
• Determinant of electricity demand associated with economic growth targets and the
Government's commitment to increase the supply of electricity evenly.
• Electricity demand growth in the past 5 years is higher (7.5%) than the power plant
capacity growth (7,6%), but there are the crisis of electricity supply in some areas
because additional capacity mostly in Java island. So far, the outage outside Java Bali
has been resolved temporary, in some areas have been resolved with the rent of
power generation and purchase of excess power.
b. Price for Electricity
• Electricity tariffs determined by the Government to ensure affordability for majority
people and still consider the business competitiveness. But the electricity tariff is also
important to ensure sustainability of electricity supply in accordance with increased
demand
• Along with the trend of rising prices in general, including primary energy, the
production cost (BPP) of electricity tended to increase, so electricity tariffs need to be
adjusted in order to maintain the sustainability of supply
c. Accesibility of Electricity
• Government's commitment to continuously improve the electrification ratio is to
increase the number of household customers about 2.4 million per year in average.
PLN’s majority of customers and revenue derived from unaffordable house hold
category (450-900 VA), so that need the efforts to strengthen PLN's revenue structure
• Development of electricity distribution system for the next 3 years prioritized to
distribute electricity from new power plant 10,000 MW fast track program phase I and
phase II
23
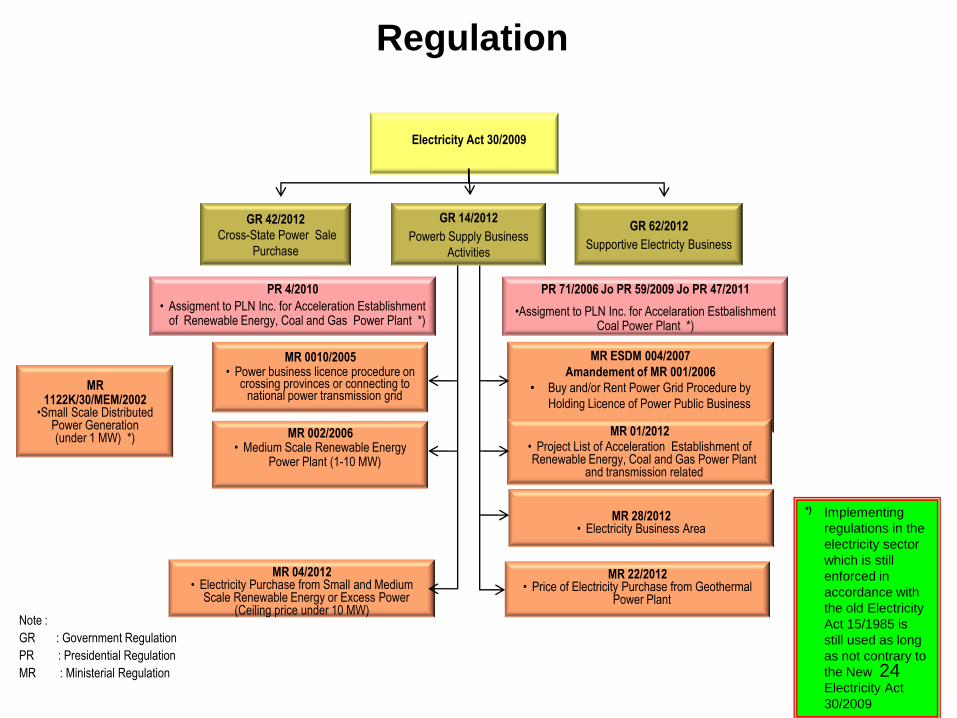
Regulation
MR 04/2012 • Electricity Purchase from Small and Medium
Scale Renewable Energy or Excess Power (Ceiling price under 10 MW)
PR 4/2010
• Assigment to PLN Inc. for Acceleration Establishment of Renewable Energy, Coal and Gas Power Plant *)
MR 0010/2005 • Power business licence procedure on
crossing provinces or connecting to national power transmission grid
MR 002/2006 • Medium Scale Renewable Energy
Power Plant (1-10 MW)
MR 1122K/30/MEM/2002
•Small Scale Distributed Power Generation (under 1 MW) *)
Note :
GR : Government Regulation
PR : Presidential Regulation
MR : Ministerial Regulation
*) Implementing
regulations in the
electricity sector
which is still
enforced in
accordance with
the old Electricity
Act 15/1985 is
still used as long
as not contrary to
the New
Electricity Act
30/2009
MR 22/2012 • Price of Electricity Purchase from Geothermal
Power Plant
MR ESDM 004/2007
Amandement of MR 001/2006
• Buy and/or Rent Power Grid Procedure by
Holding Licence of Power Public Business
PR 71/2006 Jo PR 59/2009 Jo PR 47/2011
•Assigment to PLN Inc. for Accelaration Estbalishment Coal Power Plant *)
MR 28/2012
• Electricity Business Area
MR 01/2012 • Project List of Acceleration Establishment of Renewable Energy, Coal and Gas Power Plant
and transmission related
GR 62/2012
Supportive Electricty Business
GR 14/2012
Powerb Supply Business
Activities
GR 42/2012
Cross-State Power Sale
Purchase
Electricity Act 30/2009
24

C. Technical Session:
Policy Measures and Regulations for Changing
Electric Power Market (Reform)
25
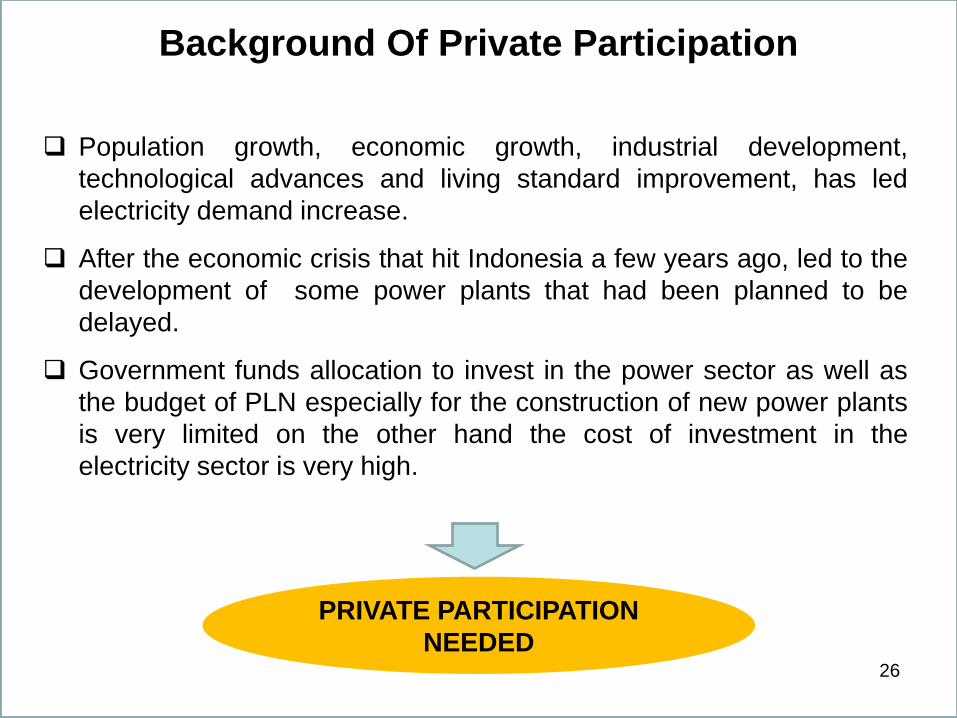
PRIVATE PARTICIPATION
NEEDED
Population growth, economic growth, industrial development,
technological advances and living standard improvement, has led
electricity demand increase.
After the economic crisis that hit Indonesia a few years ago, led to the
development of some power plants that had been planned to be
delayed.
Government funds allocation to invest in the power sector as well as
the budget of PLN especially for the construction of new power plants
is very limited on the other hand the cost of investment in the
electricity sector is very high.
Background Of Private Participation
26
• A major structural Electricity Sector Reform designed since early 1990s by World Bank and development donor agencies (such USAID). – Driving by larger industrial deregulation attempt in 1980s
– Main objective to end the monopoly of state-owned electric utility, introducing market-oriented industrial structure, creation of electricity market, facilitation for private investment.
• ESR getting more momentum after the economic crisis in 1997 – economic stabilization loans from WB and IMF string attached to
the conditionality to do reform (deregulation and privatization) of electricity and oil and gas sector.
– Asian Development Bank (ADB) and USAID assisted the policy formulation for the Power Sector Reform (PSR) and drafted the draft of the law.
Electricity Sector Reform
27

• Element of Proposed Reform (1998 White Paper and Electricity Law
No. 20/2002):
– Separation of PLN’s asset in Java-Bali and non-Java Bali. • Java & Bali system accounted of 75% of energy sold by PLN and more mature
infrastructure.
– Unbundling of the PLN into generation, transmission and distribution
companies; • Later, privatization of unbundled companies.
– Separation of Government policy-making and regulatory function for
electricity sector. • Establishment of electricity market regulatory body.
– Establishment of electricity market (power pool) in Java-Bali system.
– Rationalization of Independent Power Producers (IPP).
• Civil Society Organization and Labor Union took the 2002 Electricity
Law to the Constitutional Court in 2003.
– The Electricity Law were revoked by the Constitutional Court in 2004,
practically ending the “Electricity Sector Restructuring” Program.
Cont’ Electricity Sector Reform
28

Tender
Direct
Selection
Direct
Appointment
Government Control on IPP (Government Regulation No. 14/2012 on Activity of Electricity Provision Business)
Commercial Operation
Operation Worthy Tests
(Adopted by Operation Worthy Certificate)
IUPL Mechanism, Selling Price and Contract
National Electricity General Plan (RUKN) and the
Electricity Supply Business Plan of PLN (RUPTL)
Bidding
Process
29
National Electricity General Plan (RUKN) and the Electricity Supply Business Plan of PLN (RUPTL) as reference for power sector investment program
Private sector participation: Independent Power Producer (IPP)
EPC Contractors
Public Private Partnership (PPP)
Principally, all IPP projects should be based on bidding
process, except for: – Renewable energy power plant – Marginal gas – Mine mouth power plant – Excess power – System in crisis condition – Expansion of the existing/installed power plant.
Investment Mechanism And Private Sector Participation
Scheme
30

Status of IPP Projects
Large Scale (> 10 MW) Medium & Small Scale (up to 10 MW)
Stage Number Total Cap. (MW) Number Total Cap. (MW)
Operation 27 9,552 21 53
Construction 18 1,689 27 111
Financing 42 8,503 104 531
87 19,744 152 695
- Based on the issuance of business licenses, overall there are 239 of IPP plants (20,438.8 MW),
Consist of 87 projects are large-scale IPP’s (capacity > 10 MW, total: 19,744.21 MW), while 152 plants
are the small and medium-scale IPP’s (capacity up to 10 MW, total: 694.59 MW).
- Of 60 large-scale IPP projects under construction and financing, 18 IPP have problems: the financing
(10), Forest area (3), Land (2), others (3).
- Of 131 small and medium-scale IPP projects under construction and financing, 19 IPP have problems:
the financing (1), Forest area (6), Land (8), others (4).
31
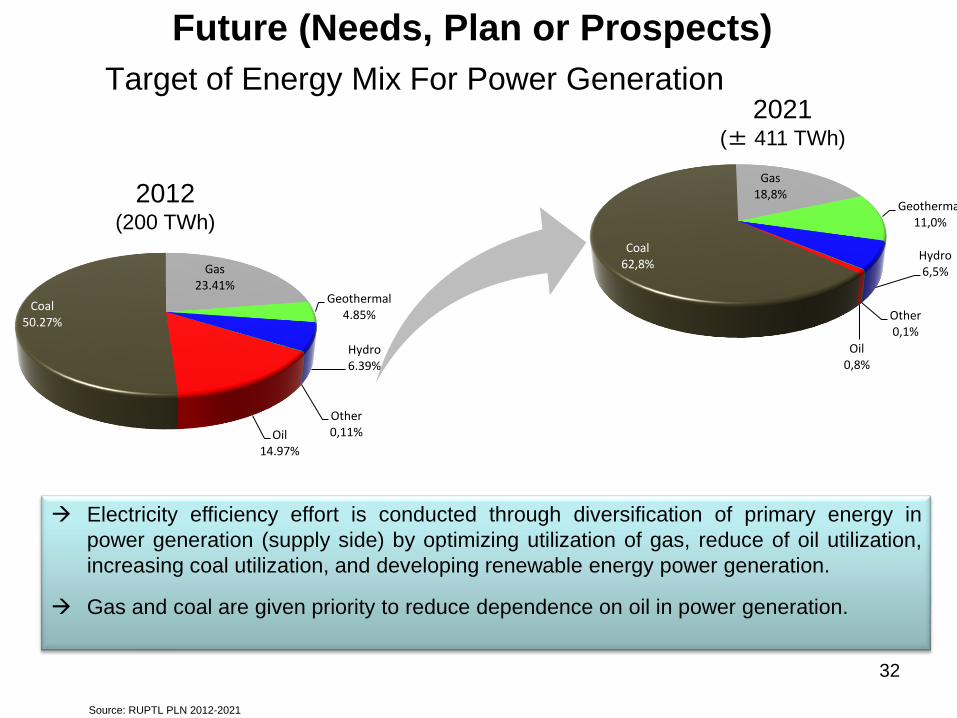
Electricity efficiency effort is conducted through diversification of primary energy in
power generation (supply side) by optimizing utilization of gas, reduce of oil utilization,
increasing coal utilization, and developing renewable energy power generation.
Gas and coal are given priority to reduce dependence on oil in power generation.
Target of Energy Mix For Power Generation
Oil 14.97%
Coal 50.27%
Gas 23.41%
Geothermal 4.85%
Hydro 6.39%
Other 0,11%
Oil 0,8%
Coal 62,8%
Gas 18,8%
Geothermal 11,0%
Hydro 6,5%
Other 0,1%
Source: RUPTL PLN 2012-2021
2012 (200 TWh)
2021 (± 411 TWh)
Future (Needs, Plan or Prospects)
32

Power Generation Development Planning
Total power generation that will be developed up to 2021 is about of 57 GW or in average
5.7 GW p.a.
PLN will develop about of 53% of the total capacity and the rest (47%) will be developed by
IPP/private
Source: RUPTL PLN 2012-2021
0
1.000
2.000
3.000
4.000
5.000
6.000
7.000
8.000
9.000
10.000
MW
2012 2013 2014 2015 2016 2017 2018 2019 2020 2021
GeoPP 110 5 63 188 660 1.375 1.260 1.588 1.045 55
PS - - - - - 1.040 - - 450 450
HEPP 130 85 - 78 546 694 660 936 482 183
MHPP 18 158 150 201 32 6 6 2 2 -
GTPP 272 412 652 1.963 138 131 181 180 30 85
CCPP 740 160 90 550 250 - - - - 750
CFPP 4.304 3.098 2.705 2.199 4.707 5.652 7.213 2.630 2.950 2.240
Other 0,2 25 145 17 7 16 15 6 - -
33
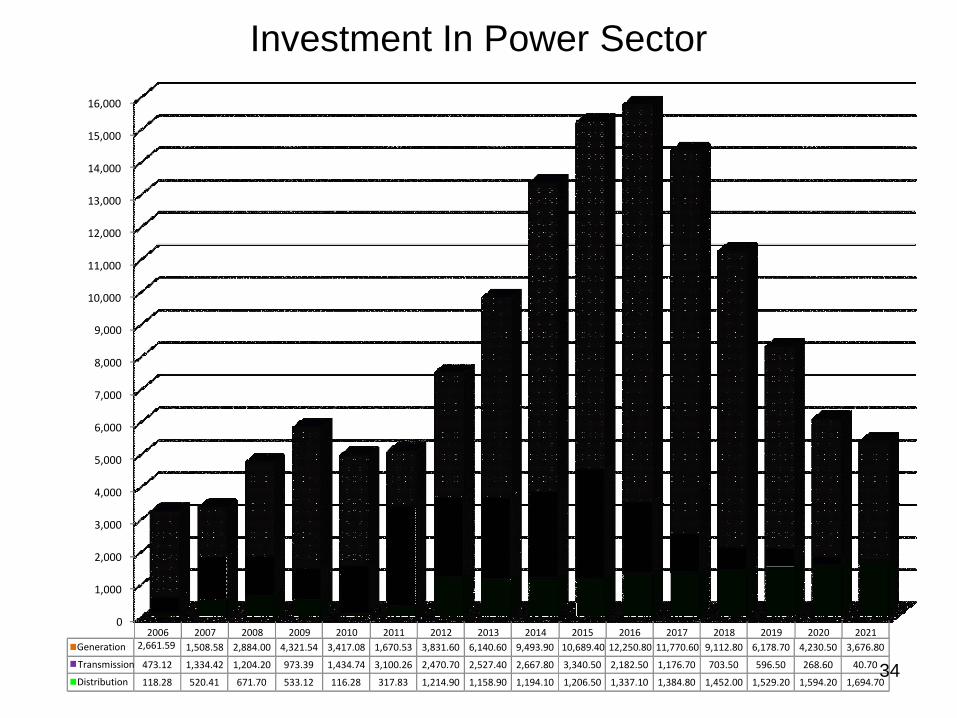
Realization Requirement M
illio
n U
SD
0
1,000
2,000
3,000
4,000
5,000
6,000
7,000
8,000
9,000
10,000
11,000
12,000
13,000
14,000
15,000
16,000
2006 2007 2008 2009 2010 2011 2012 2013 2014 2015 2016 2017 2018 2019 2020 2021
Generation 2,661.59 1,508.58 2,884.00 4,321.54 3,417.08 1,670.53 3,831.60 6,140.60 9,493.90 10,689.40 12,250.80 11,770.60 9,112.80 6,178.70 4,230.50 3,676.80
Transmission 473.12 1,334.42 1,204.20 973.39 1,434.74 3,100.26 2,470.70 2,527.40 2,667.80 3,340.50 2,182.50 1,176.70 703.50 596.50 268.60 40.70
Distribution 118.28 520.41 671.70 533.12 116.28 317.83 1,214.90 1,158.90 1,194.10 1,206.50 1,337.10 1,384.80 1,452.00 1,529.20 1,594.20 1,694.70
Investment In Power Sector
34

D. Technical Session:
Other Topics on Energy/Power Market
35
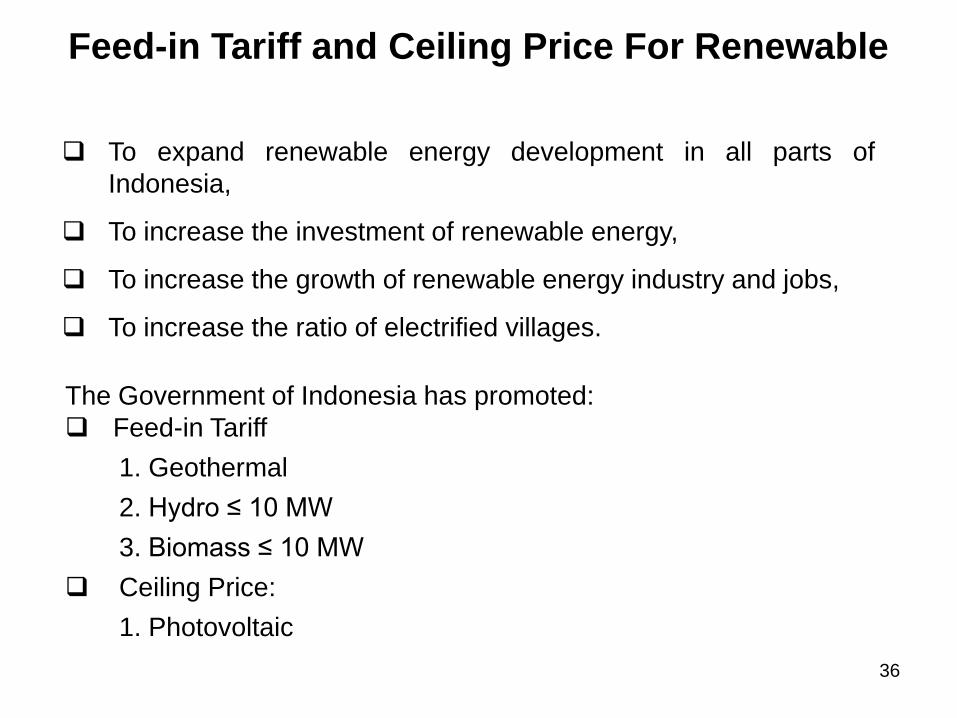
To expand renewable energy development in all parts of
Indonesia,
To increase the investment of renewable energy,
To increase the growth of renewable energy industry and jobs,
To increase the ratio of electrified villages.
Feed-in Tariff and Ceiling Price For Renewable
The Government of Indonesia has promoted:
Feed-in Tariff
1. Geothermal
2. Hydro ≤ 10 MW
3. Biomass ≤ 10 MW
Ceiling Price:
1. Photovoltaic
36
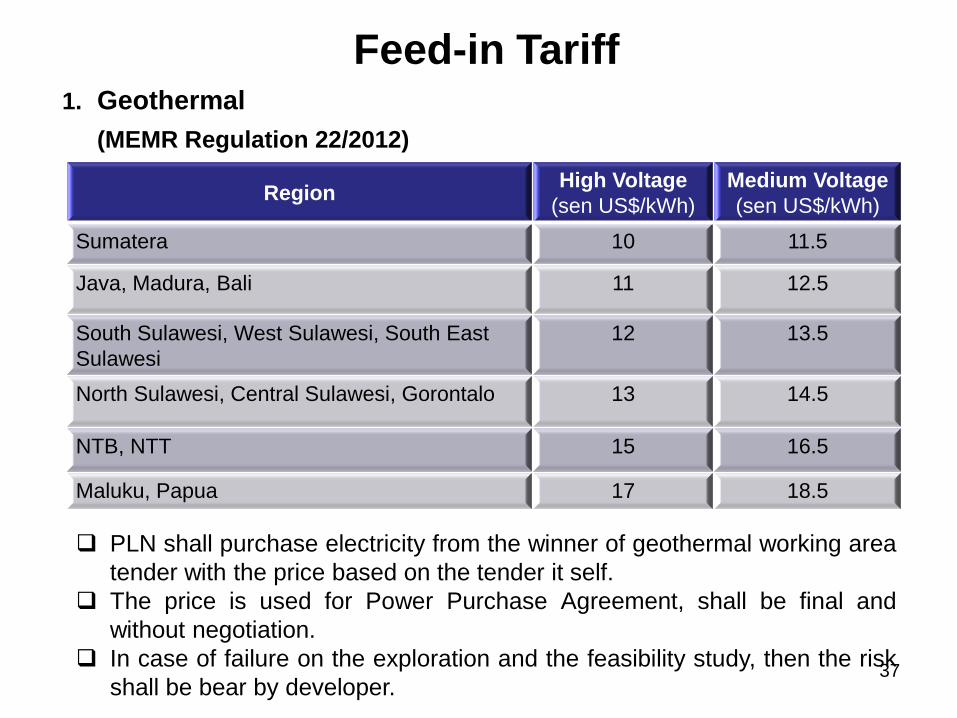
1. Geothermal
(MEMR Regulation 22/2012)
PLN shall purchase electricity from the winner of geothermal working area
tender with the price based on the tender it self.
The price is used for Power Purchase Agreement, shall be final and
without negotiation.
In case of failure on the exploration and the feasibility study, then the risk
shall be bear by developer.
Region High Voltage
(sen US$/kWh)
Medium Voltage
(sen US$/kWh)
Sumatera 10 11.5
Java, Madura, Bali 11 12.5
South Sulawesi, West Sulawesi, South East
Sulawesi
12 13.5
North Sulawesi, Central Sulawesi, Gorontalo 13 14.5
NTB, NTT 15 16.5
Maluku, Papua 17 18.5
Feed-in Tariff
37

2. Hydro ≤ 10 MW
Feed-in Tariff (2)
No
.
FIT
(Rp/ kWh)
Interconnected
With Remark
1 656 x F Medium Voltage Ministerial Regulation
No. 04/2012
2 1,004 x F Low Voltage Ministerial Regulation
No. 04/2012
With Factor as follows:
F = 1 Java, Bali Region
F = 1.2 Sumatera, Sulawesi Region
F = 1.3 Kalimantan, Nusa Tenggara
Region
F = 1.5 Maluku, Papua Region
38

3. Biomass ≤ 10 MW (Based on Biomass and Biogas)
No
.
FIT
(Rp/ kWh)
Interconnected
With Remark
1 975 x F Medium Voltage Ministerial Regulation
No. 04/2012
2 1,325 x F Low Voltage Ministerial Regulation
No. 04/2012
With Factor as follows:
F = 1 Java, Bali, Sumatera Region
F = 1.2 Sulawesi , Kalimantan, Nusa Tenggara
Region
F = 1.3 Maluku, Papua Region
Feed-in Tariff (3)
39
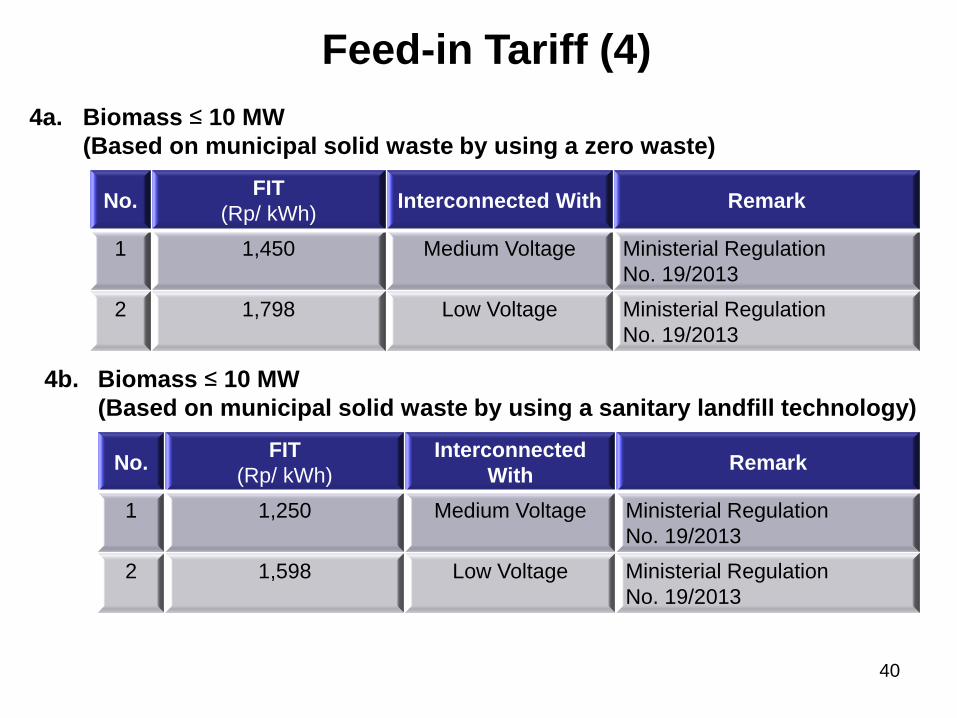
4a. Biomass ≤ 10 MW
(Based on municipal solid waste by using a zero waste)
No. FIT
(Rp/ kWh) Interconnected With Remark
1 1,450 Medium Voltage Ministerial Regulation
No. 19/2013
2 1,798 Low Voltage Ministerial Regulation
No. 19/2013
Feed-in Tariff (4)
4b. Biomass ≤ 10 MW
(Based on municipal solid waste by using a sanitary landfill technology)
No. FIT
(Rp/ kWh)
Interconnected
With Remark
1 1,250 Medium Voltage Ministerial Regulation
No. 19/2013
2 1,598 Low Voltage Ministerial Regulation
No. 19/2013
40
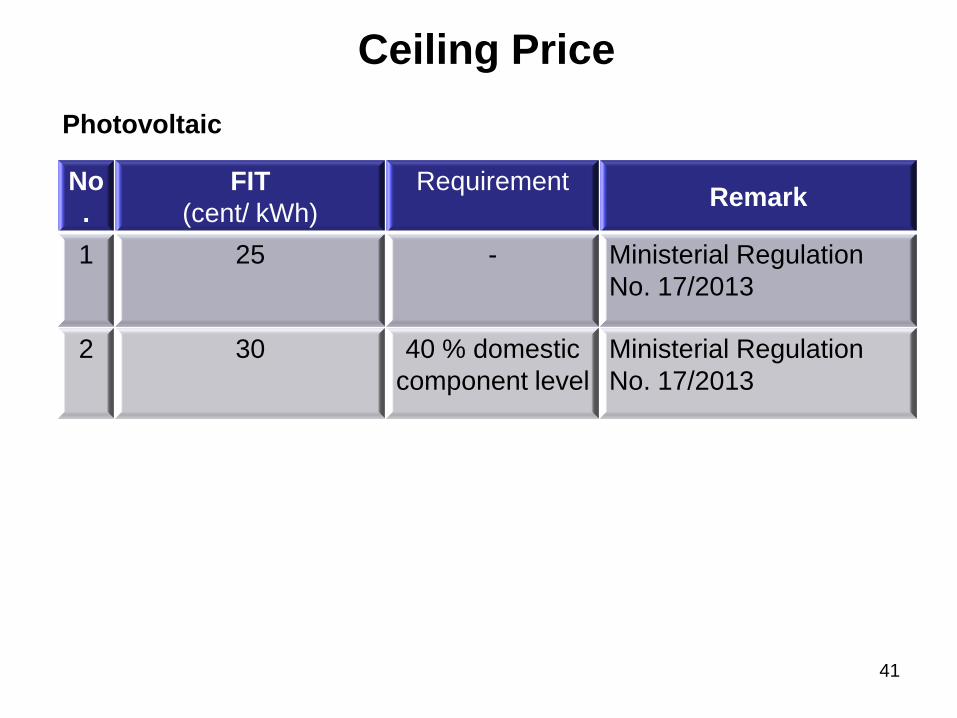
Photovoltaic
Ceiling Price
No
.
FIT
(cent/ kWh)
Requirement
Remark
1 25 - Ministerial Regulation
No. 17/2013
2 30 40 % domestic
component level
Ministerial Regulation
No. 17/2013
41

Thank you
42

![arXiv:1807.01232v2 [cs.CV] 25 Sep 2018 · Unclassified 1138. km 95.4 km 1750.8 km 164.5 km 3148.7 km Total 3685.0 km 425.3 km 3536.9 km 1029.5 km 8676.6 km 2.5 Challenge 3 - Las](https://img.pdfslide.us/doc/110x75/5f107f837e708231d44967c4/arxiv180701232v2-cscv-25-sep-2018-unclassiied-1138-km-954-km-17508-km.jpg)