Embed Size (px)
Citation preview

India Strategy & Top Ideas
All eyes on Fed Rate hikes and Chinese policy actions
R Sreesankar [email protected]
+91-22-66322214
Click to edit Master title style LilladherPrabhudas September 2015
Prabhudas Lilladher Pvt. Ltd. and/or its associates (the 'Firm') does and/or seeks to do business with companies covered in its research reports. As a result investors should be aware that the Firm may have a conflict of interest that could affect the objectivity of the report. Investors should consider this report as only a single factor in making their investment decision.
Please refer to important disclosures and disclaimers at the end of the report.

LilladherPrabhudas Contents
9/9/2015 2
Page No.
Large Caps
HDFC Bank 24
Infosys 26
State Bank of India 28
ICICI Bank 30
Larsen & Toubro 32
Maruti Suzuki 35
Tata Motors 37
Indian Oil Corporation 39
IndusInd Bank 41
Mid-Caps
Glenmark Pharmaceuticals 44
Cummins India 46
Motherson Sumi Systems 48
Aurobindo Pharma 50
MindTree 52
Persistent Systems 55
Jubilant Life Sciences 57
Sadbhav Engineering 59
JK Lakshmi Cement 61
Rallis India 63
Va Tech Wabag 65
Page No.
Domestic beginning to see bright spots, global negative outlook 3-4
Global Growth – US to lead the Growth 5
South West Monsoon-Below the LPA 6
Low oil prices lead to CAD under control 7
Tax collections up 8
Traction in plan expenditure 9
Inflation continues to move down 10
Markets
Equity markets under pressure across the globe 11
IT and Healthcare sectors leads the way 12
Small and Midcaps underperform 13
Global Currencies – A painful month 14
FII outflows in second half of August 15
Global Agri commodities - Sugar and wheat weaken further 16
Global Industrial Commodities continues to decline 17
Equity markets weak across the board 18
Indian Market – Valuation and Strategy 19
Nifty Valuations: Historic Trends 20
Nifty Valuation 21
Top Pick Summary 22
(Prices as on September 08, 2015)

LilladherPrabhudas Domestic beginning to see bright spots, global
negative outlook • Metal index the worst hit : The CNX Metal index has turned out the worst performance having lost over 45% in the last twelve months,
reflecting the 16 year low in steel prices. The outlook for the global commodities continue to remain negative despite the large losses and underperformance of the sector.
• Infrastructure, outlay higher and Orders for new projects on the rise: The allocation for the road sector has been higher, though we would have been happy with a speedier implementation on awarding of road projects from the government side to speed up the government spending as well as the economic recovery. In the first four months alone, 2700km worth Rs350bn has been awarded.
• Politics, All eyes on Bihar elections: From GST and land bills, the attention has now shifted to Bihar elections expected in less than 60 days. The outcome though will not affect the number game at the centre, a strong performance by the ruling BJP led coalition will help them increase their numbers in the upper house of the parliament and send a strong a signal to the Indian equity markets.
• Interest rates, will it be a RBI reduction or by market forces? The repo rates under the Liquidity Adjustment Factor (LAF) was reduced by 25bps from 7.50% to 7.25% in the bi-monthly monetary policy on June 2, 2015. Since then we have seen the inflation rates correcting sharply and the WPI based inflation has remained negative, while the CPI too has corrected to 3.8%, much below the RBIS comfort zone of 6%. The banks have reduced the deposit rates and we strongly believe further reductions in interest rates may happen through transition.
• IT and Pharma Sector, expected to do well, while FMCG may face headwinds: We had maintained our neutral stance on the IT sector ahead of the 2QFY16 results, while the sector outlook of the street was negative. With Infosys reporting results better than expected and with a guidance beating the street expectations, the IT sector have seen an improved demand and the sector has seen a sharp out performance over the last two months. In case of the FMCG companies, while the lower commodity prices have helped see an expansion in margins, the slowing growth in the rural sector is resulting in demand headwinds. Should the monsoon remain below normal, the expected pick up in demand in rural areas may not materialize leading to an underperformance.
• Falling CAD, have we seen the best of it: The steady decline seen in merchandise exports since July 2014 have seen a reversal in July 2015. The exports, which were at a monthly run rate of US$22bn and have improved to over US$23bn in July 2015. Given the slower global growth and relative out performance of the Indian Rupee, the headwinds for exports are likely to continue. The CAD has crossed the US$12bn for the first time in the last eight months.
9/9/2015 3

LilladherPrabhudas Contd…
• Correction in Private sector banks overdone? The privates sector banks space has seen a sharp correction in the last fortnight alone. Axis Bank, ICICI Bank and Yes bank have seen the maximum corrections. Axis Bank has corrected from 2.5x FY17 ABV to 1.9x, ICICI to 1.5x from 2.1x FY17ABV and Yes Bank to 1.6x from 2.2x FY17ABV. We believe that the correction has been steep and the fundamentals do not warrant a steep correction of that nature. Though the pace of the economic recovery is slower than anticipated, we expect to see lower NPA additions and hence lower credit costs and higher profits. Hence, we continue to recommend an overweight position in the financials. While the broader calls remain the above, within the financials we continue to remain heavily leaned towards the private sector banks. The 1QFY16 performance of the private sector banks was in line with expectations, the shocks and the volatility of the PSU banks makes us continue to believe that the PSU banks are at best trading bets. Our preferred picks continue to be HDFC Bank, ICICI Bank, IndusInd Bank and State Bank of India among the PSU banks.
• PCs and CVs preferred over two wheelers: The outlook for automobiles especially for passenger cars and commercial vehicles looks good till the festival season in October 2015. Our top picks in the sector continues to be Maruti Suzuki and Tata Motors and we have added Motherson Sumi Systems to the top picks following the massive underperformance seen in the last three months. Tata Motors have been an under performer in the last one year and the negatives in terms of transition and JLRs China operations is overdone in the price.
• Indian Oil Corporation, a big beneficiary of falling oil prices: The benign crude oil prices benefit the down stream companies much better than the upstream companies and within the downstream companies, (i) IOC is cheaper in terms of valuation, (ii) the Rs100bn OFS overhang is over as they are done with the sale and (iii) unlike HPCL and BPCL which are pure marketing margin stories, IOC will also benefit from a surge in petrochemical margins.
• Global Commodities and Agricultural commodities continue to be under pressure: The global commodities and the agricultural commodities continue to remain under pressure, more complicated by the recent weakness in the Chinese Renminbi as well.
• Market trading range revised downwards: The equity market is trading at a one year forward multiple of 16.4x, still at a marginal premium to the 10 year average. This is mainly on account of downward revision of FY16 earnings. We have revised our estimate for the market trading range to 7500-8200 in the near term.
• Our preferred picks continue to be HDFC Bank, SBI, IndusInd and ICICI bank among the financials, L&T and Sadbhav Engineering among Engineering & Capital Goods and Infosys,, MindTree and Persistent among IT, JK Lakshmi Cement among Basic materials and Tata Motors, Motherson Sumi Sytems and Maruti Suzuki among Automobiles with Glenmark, Jubilant Life and Aurobindo Pharma among Pharmaceuticals.
9/9/2015 4

LilladherPrabhudas Global Growth – US to lead the Growth
• US expected to lead the Global growth: US economy is expected to drive global growth in both 2015 and 2016. US economy shrug off the global economic anxiety in the second quarter with a 2.3% growth. The rebound in growth after a sluggish first quarter was supported by consumer spending, government outlays and exports. The world growth for CY2015 is expected at 2.4%.
• US Non farm pay roll and un employment levels to a new low: The non farm payroll additions were at 173,000 in August 2015 thereby keeping the un employment levels to a new low of 5.1%. Energy sector continues to see increased lay offs, as job cuts in energy sector surged, reflecting the low oil prices. The payroll additions have also dropped below the 12 month average of 245,000.
• Crude oil Prices, at five year lows: The Brent crude oil prices have further corrected to a new low at US$42.69 to a barrel on 24th August 2015. Since then, though crude prices recovered, it is still hovering below the lows achieved in July 2015.
• Global Volatility and Indian Volatility higher: The CBOE VIX volatility index, a measure of the cost of equity portfolio protection has have seen higher volatility and trades at 27.80, with the Indian VIX at 24.56 at relatively higher levels indicating higher volatility. Both these have shot up post August 20, 2015.
• Tough time for emerging Markets: As capital flows back to the USA in expectations of higher interest rates, some emerging markets, especially those with the twin deficits of government and external deficit will particularly be vulnerable with renewed pressures on their currency. The “ fragile five” in this category are Brazil, India, Indonesia, Turkey and South Africa. Of this according to us, India is relatively stable as the government and the central bank are following a different management. In addition to the countries with fiscal and CADs, countries with weak institutions, exposure to low commodity prices and high political risk could also be vulnerable. This could include Russia, Venezuela and Columbia. We have seen a severe pain in all these markets ranging from depreciating currencies to economic turmoil, with India being the sole exception so far.
• Fed Rate hike, will it happen now? It is anticipated that we will see a monetary tightening cycle for the first time since 2004. With un employment levels at 5.1% at a new low, price pressures will rise as a tight labor market forces wage inflation. It is expected that the sooner Fed raises rates, there will be more room to take action during the next downturn. However, it needs to be wait and seen with Japan and China in the middle of a monetary easing programme, how a divergent policy will work, especially when if it contributes to a strengthening Dollar.
9/9/2015 5

LilladherPrabhudas South West Monsoon-Below the LPA
Source: IMD
• The country as a whole witnessed 640.7mm rainfall from 01 June 2015 till 02 September 2015. As against the Long Period Average (LPA) of 728.3mm, the rainfall was short to the extent of 12% on the lower side from LPA.
• After a good rainfall during June and second half of July, the country has witnessed a deficient rainfall till now with some parts of North-West and East & North-East region witnessing heavy rainfall while South Peninsula & major parts of Central India witnessing deficient rainfall.
• As of September 2, 2015, 2 subdivisions have witnessed excess monsoon and 17 subdivisions have witnessed normal rain while 17 subdivisions have had below normal/deficient rainfall till now. There is no subdivision where rainfall is scanty (i.e.-66% to -99%) or no rain.
• The lower rainfall is reflected in the water storage levels across the country. Water storage at 91 major reservoirs has dipped to 87% of the storage of corresponding period last year and 88% of storage of average of last 10 years.
• As per the data released by the government, as of August 28, 2015, total kharif sowing is completed in 967.8 lakh hectares (which is ~84% of average seasonal Kharif sowing) which is higher by ~1% y-o-y. Except cotton and jute (which are lower by 8% and 4% y-o-y resp) all other Kharif crop have seen year on year higher sowing till now.
Cumulative Seasonal Rainfall Map as on September 02, 2015
9/9/2015 6

LilladherPrabhudas Low oil prices lead to CAD under control
9/9/2015 7
• The CAD has been under control, thanks to the low oil prices. Over the last five months, the ,trade deficit have been hovering around
US$10bn a month. While the low oil prices continue to be a boon, the challenge is going to be managing an increase in non oil non gold
imports once the domestic economy recovers. CAD in July 2015 has shot up above US$12bn.
External debt break-up between ST and LT
Source: RBI, PL Research * Data revised on exchange rate fluctuation
Trade Deficit
Source: RBI, PL Research
US $ Mn Sep'14 Oct'14 Nov'14 Dec'14 Jan'15 Feb’15 Mar’15 Apr’15 May’15 Jun’15 Jul’15 YTD YTD YoY
Exports 28,903 26,094 25,961 25,398 23,883 21,545 23,951 22,055 22,347 22,289 23,137 89,828 105,905
Imports 43,151 39,452 42,822 34,833 32,206 28,392 35,745 33,047 32,753 33,117 35,950 134,866 153,264
- Oil 14,497 12,365 11,716 9,942 8,248 6,101 7,413 7,443 8,539 8,676 9,487 34,145 55,360
- Gold 3,752 4,170 5,610 1,340 1,550 1,980 4,980 3,131 2,420 1,967 2,965 10,483 9,268
- Non Oil Non Gold 24,902 22,916 25,496 23,551 22,408 20,311 23,351 25,604 21,794 22,473 23,498 90,239 88,636
Trade Deficit (14,247) (13,357) (16,861) (9,435) (8,323) (6,847) (11,794) (10,992) (10,406) (10,827) (12,812) (45,038) (47,359)
3.6 2.8 4.7 4.4 17.7 19.5 28.1 45.8 43.3 52.4 64.9 78.2 96.6 91.5 87.8 86.2 85.5 84.7
97.7 96.0 100.2 108.2 116.3 119.6
144.3 178.6 181.2
208.5 241.0
267.6 312.8 354.8 362.3 369.7 376.4 391.1
0
100
200
300
400
500
2000
-01
20
01
-02
20
02
-03
20
03
-04
20
04
-05
2005
-06
20
06
-07
2007
-08
20
08
-09
2009
-10
20
10
-11
2011
-12
20
12
-13
20
13
-14
Jun
-14
Sep
-14
Dec
-14
Mar
-15
(US$
bn
)
Short Term Debt Long Term Debt

LilladherPrabhudas Tax collections up
Source: Controller General of Accounts – Ministry of Finance, PL Research
Trends in Government’s Fiscal Deficit • Non tax revenues were up , mainly on account of income from auction of telecom licenses.
• Excise duties are up due to increase in excise on petroleum products earlier in the year. On a higher base, there is a strong month on month increase in Excise duties.
• The service tax has been hiked w.e.f. July 1, 2015 and we expect this to reflect from July 2015 onwards in increased revenues.
Source: Controller General of Accounts – Ministry of Finance, PL Research
Trends in Tax Receipts
9/9/2015 8
(Rs bn) Upto
Jul'14
Upto
Jul'15 YoY %
Budget
Est
% to total
Budget Est.Shortfall
Revenue Receipts 1,756 2,090 19% 11,416 18% (9,326)
Tax Revenue (Net) 1,469 1,539 5% 9,198 17% (7,660)
Non-Tax Revenue 288 551 92% 2,217 25% (1,666)
Non-Debt Capital Receipts 34 69 104% 803 9% (734)
Recovery of Loans 33 35 8% 108 33% (72)
Other Receipts 1 34 NA 695 5% (661)
Total Receipts 1,790 2,159 21% 12,218 18% (10,060)
Non-Plan Expenditure 3,719 4,431 19% 13,122 34% (8,691)
On Revenue Account 3,380 4,087 21% 12,060 34% (7,973)
(i) of which Interest Payments 1,186 1,276 8% 4,561 28% (3,285)
On Capital Account 338 344 2% 1,062 32% (718)
(i) of which Loans disbursed 99 99 0% 10 89
Plan Expenditure 1,320 1,578 20% 4,653 34% (3,074)
On Revenue Account 1,040 1,062 2% 3,300 32% (2,238)
On Capital Account 280 516 84% 1,353 38% (836)
(i) of which Loans disbursed 76 104 36% 231 (127)
Total Expenditure 5,039 6,010 19% 17,775 34% (11,765)
Fiscal Deficit 3,249 3,851 19% 5,556 69% (1,705)
Revenue Deficit 2,664 3,060 15% 3,945 78% (885)
Primary Deficit 2,063 2,575 25% 995 259% 1,580
Tax Revenue (in Rs.Bn) Upto
Jul'14
Upto
Jul'15 YoY %
Budget
Est
% to total
Budget Est. Shortfall
Corporate Tax 625 663 6% 4,706 14% (4,043)
Income Tax 649 620 -5% 3,274 19% (2,654)
Customs 539 664 23% 2,083 32% (1,419)
Union Excise Duties 323 580 80% 2,298 25% (1,718)
Service Tax 416 485 17% 2,098 23% (1,612)
Other Tax 37 39 5% 36 108% 3
Gross Tax Revenue 2,589 3,051 18% 14,495 21% (11,444)
Surcharges 12 16 27% 57 27% (41)
Assignment to states 1,108 1,497 35% 5,240 29% (3,743)
Net Tax Revenue 1,469 1,539 5% 9,198 17% (7,660)

LilladherPrabhudas Traction in plan expenditure
9/9/2015 9
• The plan expenditure has seen a substantial increase in the first four months of FY16 with both the ministry of Surface transport and Highways as well as Ministry of urban transport seeing the increased spend.
• The current low oil prices have resulted in the lower outgo of planned subsidies in the petroleum sector.
Source: Controller General of Accounts – Ministry of Finance, PL Research
In Rs Bn Upto
Jul'14
Upto
Jul'15 YoY %
Budget
Est
% to total
Budget Est.
Non-Plan Expenditure 3,719 4,431 19% 12,199 36%
-Dept. of Fertil izers 207 353 70% 730 48%
-Dept. of Food & PDS 483 539 12% 1250 43%
-Dept. of Petroleum & Gas 250 92 -63% 301 31%
Plan Expenditure 1,320 1,578 20% 12,199 13%
-Min. of Road Transport & Highway 78 272 249% 429 63%
-Min. of Rural Development 271 350 29% 733 48%
-Min. of Urban Development 25 54 113% 161 33%
-Min. of Agriculture 80 67 -16% 218 31%
-Min. of Railways 100 113 12% 400 28%
-Min. of Drinking Water & Sanitation 27 51 87% 62 81%
-Min. of Health & Family Welfare 69 101 45% 267 38%
-Min. of Human Resource 184 173 -6% 549 32%
Plan Expenditure and Non-plan expenditure

LilladherPrabhudas Inflation continues to move down
• Both the retail and the wholesale inflation saw a decrease in July 2015. The whole sale inflation still continues to be in the negative territory , both m-o-m as well as y-o-y leading to the real rates remaining positive.
• 10yr G-Sec Yield is trading at 7.80%, and has been in a range of 7.74% to 7.89% in the last one month.
• The June 2015 IIP data continue to be disappointing at 3.8%, though it was marginally better than the 2.7% achieved in May 2015.
Source: Bloomberg, PL Research
Source: Bloomberg, PL Research
CPI Inflation
GDP Growth YoY (Quarterly)
Source: Bloomberg, PL Research
10yr. G-Sec Yield & Liquidity
9/9/2015 10
-
2.0
4.0
6.0
8.0
10.0 (2,500)
(2,000)
(1,500)
(1,000)
(500)
-
500
1,000
1,500
Aug
-10
Dec
-10
Apr
-11
Aug
-11
Dec
-11
Apr
-12
Aug
-12
De
c-1
2
Apr
-13
Aug
-13
Dec
-13
Apr
-14
Aug
-14
Dec
-14
Apr
-15
Aug
-15
Liquidity (Rs bn) 10yr. G-Sec Yied (%) (RHS)
0
2
4
6
8
10
12
Sep
-05
Dec
-05
Mar
-06
Jun
-06
Se
p-0
6D
ec-0
6M
ar-0
7Ju
n-0
7Se
p-0
7D
ec-0
7M
ar-
08
Jun
-08
Sep
-08
De
c-0
8M
ar-0
9Ju
n-0
9Se
p-0
9D
ec-0
9M
ar-
10
Jun
-10
Sep
-10
De
c-1
0M
ar-1
1Ju
n-1
1S
ep
-11
Dec
-11
Mar
-12
Jun
-12
Sep
-12
Dec
-12
Mar
-13
Jun
-13
Sep
-13
Dec
-13
Mar
-14
Jun
-14
Sep
-14
Dec
-14
Ma
r-1
5Ju
n-1
5
(%)
8.6
7.98.2 8.5 8.3
6.87.4
7.0
5.6
4.6
3.3
4.3
5.2 5.4 5.34.9 5.0
5.4
3.8
3.0
4.0
5.0
6.0
7.0
8.0
9.0
Jan
-14
Feb
-14
Mar
-14
Apr
-14
May
-14
Jun-
14
Jul-
14
Aug
-14
Se
p-1
4
Oct
-14
Nov
-14
Dec
-14
Jan
-15
Feb
-15
Mar
-15
Apr
-15
May
-15
Jun-
15
Jul-
15
Consumer Price Index (CPI)

LilladherPrabhudas Equity markets under pressure across the globe
• MoM: The Equity markets across the board have come under pressure due to increased risk aversion with money moving out of EMs. Hong Kong was one of the biggest losers along with China, Germany and Japan.
• YoY and YTD: On a y-o-y basis, China, Japan and Russia are the only markets on the positive side, with China the biggest gainer. While on a YTD basis, Russia, Japan and Germany are on the positive side, with Russia the biggest gainer though Russian Ruble declined 82% during the period.
Source: Bloomberg, PL Research
Source: Bloomberg, PL Research
Month-on-Month
Year-on-Year
Source: Bloomberg, PL Research
Calendar Year-to-date
9/9/2015 11
1.6
(4.6)
(7.1) (7.1) (7.3) (7.8)(9.0) (9.2)
(10.7)(10.9)(12.2)(12.8)
(14.2)(16.0)(14.0)(12.0)(10.0)
(8.0)(6.0)(4.0)(2.0)
-2.0 4.0
Ru
ssia
S.Ko
rea
USA
S&P
Bra
zil
Indo
nesi
a
FTSE
Indi
a
Au
stra
lia
Japa
n
Ger
man
y
Chin
a
Hon
g Ko
ng
(%)
21.1
0.0
(8.3)(5.3) (7.1)
(15.3)
(7.4) (6.9) (6.3)
4.9 2.5
(2.3)
(11.3)(20.0)
(15.0)
(10.0)
(5.0)
-
5.0
10.0
15.0
20.0
25.0
Ru
ssia
S.Ko
rea
USA
S&P
Bra
zil
Indo
nesi
a
FTSE
Indi
a
Au
stra
lia
Japa
n
Ger
man
y
Chin
a
Hon
g Ko
ng
(%)
16.7
(6.6) (4.3) (2.6)
(24.9)
(15.3)(11.5)
(5.7)(10.4)
16.4
4.4
38.1
(17.3)(30.0)
(20.0)
(10.0)
-
10.0
20.0
30.0
40.0
50.0
Ru
ssia
S.Ko
rea
USA
S&P
Bra
zil
Indo
nesi
a
FTSE
Indi
a
Au
stra
lia
Japa
n
Ger
man
y
Chin
a
Hon
g Ko
ng
(%)

LilladherPrabhudas IT and Healthcare sectors leads the way
• MoM: Despite the carnage that we had seen in the last month, both IT and Healtcare sector have given positive returns. Healthcare sector has been the star performer of the last one month and have out performed in the last one month. Strong performance from Infosys and Cognizant has been one of the reasons for the relative out performance. Low crude oil prices led to a strong performance from the downstream oil marketing companies, while metals, realty and up stream oil companies disappoint with steel prices reaching a 16 year low.
• YTD and YoY: On a YTD and YoY basis, Capital goods, Health care, IT and FMCG continue to have a strong performance, while Metals and Realty continue to languish.
Source: Bloomberg, PL Research
Source: Bloomberg, PL Research
Month-on-Month
Year-on-Year
Source: Bloomberg, PL Research
Calendar Year-to-date
9/9/2015 12
3.4 2.2
(4.7) (5.5)
(9.6) (10.3)(12.2)
(13.9) (14.0) (15.1) (16.4)(20.0)
(15.0)
(10.0)
(5.0)
-
5.0
(%)
29.9
7.4 11.2 5.7
(31.1)
(2.3)
(24.7)
1.4 1.0
(15.7)
(43.3)(50.0)(40.0)(30.0)(20.0)(10.0)
-10.0 20.0 30.0 40.0
(%)
20.6
6.1 10.7
0.1
(19.1)
(7.4)(12.6) (12.9)
1.0
(15.7)
(33.3)(40.0)
(30.0)
(20.0)
(10.0)
-
10.0
20.0
30.0
(%)

LilladherPrabhudas Small and Midcaps underperform
• MoM: After periods of strong out performance, Small caps and Mid caps have underperformed in the last one month.
• YoY: The Mid cap index continue to out perform over the last six months and twelve months, while the small cap index has out performed over the last twelve months, while it has underperformed the large caps over the six month period.
Source: Bloomberg, PL Research
Source: Bloomberg, PL Research
Month-on-Month
Year-on-Year
Source: Bloomberg, PL Research
Calendar Year-to-date
9/9/2015 13
(7.3)
(8.6) (8.6)(9.1)(10.0)
(9.0)
(8.0)
(7.0)
(6.0)
(5.0)
(4.0)
(3.0)
(2.0)
(1.0)
-
BSEMDCAP Index BSE500 Index BSE100 Index BSESMCAP Index
(%)
14.9
(0.4)
(3.5)
4.7
(5.0)
-
5.0
10.0
15.0
20.0
BSEMDCAP Index BSE500 Index BSE100 Index BSESMCAP Index
(%)
3.6
(3.9)
(5.4)
(2.7)
(6.0)
(5.0)
(4.0)
(3.0)
(2.0)
(1.0)
-
1.0
2.0
3.0
4.0
5.0
BSEMDCAP Index BSE500 Index BSE100 Index BSESMCAP Index
(%)

LilladherPrabhudas Global Currencies – A painful month
• MoM: Emerging market currencies continued to be under pressure with both Brazil and Malaysia being the worst hit with losses of over 9%, followed by South Africa, Indonesia, Turkey and Russia at around 5% each.
• CYTD and YoY: On a CYTD basis, Brazil is the worst performer(41.5%) followed by Turkey(26.1%) and Malaysia (21.1%). On a y-o-y basis, Russia(82.2%), Brazil (67.6%), Turkey(36.5%), Malaysia(33.0%) and South Africa (25.7%) were the biggest losers.
Source: Bloomberg, PL Research
Source: Bloomberg, PL Research
Month-on-Month
Year-on-Year
Source: Bloomberg, PL Research
Calendar Year-to-date
9/9/2015 14
3.7 2.8
1.9
(0.1)(0.8)
(2.0)(2.2)(2.3)(2.4)(2.4)(2.8)(3.5)(4.9)
(5.6)(5.9)(5.9)
(9.0)(9.8)(12.0)
(10.0)
(8.0)
(6.0)
(4.0)
(2.0)
-
2.0
4.0
6.0
(%)
14.1
(0.6)
1.8 2.5
(14.1)(9.0)(8.9)
(4.5)(2.4)
7.3
(2.8)(5.1)
(14.4)(10.5)
(26.1)
(16.1)
(41.5)
(21.0)
(50.0)
(40.0)
(30.0)
(20.0)
(10.0)
-
10.0
20.0
(%)
24.9
(15.0)
7.1
(5.7)
(21.8)(16.6)(11.9)(7.2)(3.5)
14.7
(8.7)(9.6)(20.5)
(82.2)
(36.5)(25.7)
(67.6)
(33.0)
(100.0)
(80.0)
(60.0)
(40.0)
(20.0)
-
20.0
40.0
(%)

LilladherPrabhudas FII outflows in second half of August
• FIIs were net sellers in August 2015 to the extent of Rs172.09bn(US$2.64bn) , while the DIIs were net buyers to the extent of Rs162.48bn(US$2.50bn). The domestic inflows continue to remain encouraging with strong positive flows with the CYTD flows at Rs438.72bn(US$6.75bn) as against an outflow of Rs303.2bn(US$5bn) in CY2014.
9/9/2015 15
(200.00)(150.00)(100.00)
(50.00)-
50.00 100.00 150.00 200.00 250.00
Jan
-13
Feb
-13
Mar
-13
Ap
r-1
3M
ay-1
3Ju
n-1
3Ju
l-13
Au
g-1
3Se
p-1
3O
ct-1
3N
ov-
13
Dec
-13
Jan
-14
Feb
-14
Ma
r-1
4A
pr-1
4M
ay-1
4Ju
n-1
4Ju
l-14
Aug
-14
Sep
-14
Oct
-14
Nov
-14
Dec
-14
Jan
-15
Feb
-15
Mar
-15
Apr
-15
Ma
y-1
5Ju
n-1
5Ju
l-15
Aug
-15
DII Net Cash Market FII Net Cash Market
CY13 - Total FII buying Rs1,112.77bn against DII net
selling at Rs-734.64bn
CY14FII Rs970.68bnDII Rs-303.21bn
CY15FII Rs438.72bnDII Rs264.10bn

LilladherPrabhudas Global Agri commodities - Sugar and wheat
weaken further • Wheat, sugar, corn, palm oil and soya all continue to have a
weak performance in the last one month. Only rice recovered 2.4% following the 4.8% recovery seen in July 2015. On a 12 month performance, all these commodities continue to remain under pressure with sugar and wheat being the largest losers at 42.7% and 21.2% respectively.
• Sugar continues to be under severe pressure as the Brazilian currency gets hammered, and with Brazil being the largest exporter of sugar is taking the brunt of it.
• Despite the expected effects of El Nino leading to shortages in agricultural commodities, the agricultural commodities continue to remain under pressure.
Source: Bloomberg, PL Research
Source: Bloomberg, PL Research *Price in US$
Performance of Global Agricultural Commodities
Year-on-Year Performance
Source: Bloomberg, PL Research *Price in US$
Month-on-Month Performance
9/9/2015 16
50
60
70
80
90
100
110
120
130
Sep
-14
Oct
-14
No
v-1
4
Dec
-14
Jan
-15
Feb
-15
Mar
-15
Apr
-15
May
-15
Jun
-15
Jul-
15
Aug
-15
Sep
-15
Rice Wheat Corn Soya Plam Oil Sugar
2.4
(1.5)
(2.8)
(5.7)(6.6)
(8.4)(10.0)
(8.0)
(6.0)
(4.0)
(2.0)
-
2.0
4.0
Rice Sugar Corn Wheat Soya Palm Oil
(%)
(8.9)
(42.7)
(7.5)
(21.2)
(15.3)
(4.4)
(45.0)
(40.0)
(35.0)
(30.0)
(25.0)
(20.0)
(15.0)
(10.0)
(5.0)
-
Rice Sugar Corn Wheat Soya Palm Oil
(%)

LilladherPrabhudas Global Industrial Commodities continues to
decline • The global commodities continue to remain under
pressure during the last one month. The performance of both the BSE Metal index as well as the NSE Metal index reflect this trend. While crude was up 1.3% in the last one month, Nickel was the biggest loser at 10.5%. On a YoY basis, all the global commodities, Thermal Coal, Lead, Aluminum, inc, Copper, Nickel and Brent Crude, all have lost over 20% with Brent having lost over 51.1% during the period.
Source: Bloomberg, PL Research *Price in US$
Source: Bloomberg, PL Research *Price in US$
Month-on-Month
Year-on-Year
Source: Bloomberg, PL Research *Price in US$
Calendar Year-to-date
9/9/2015 17
1.3 0.3
(0.2) (0.6)(1.6)
(7.0)
(10.5)(12.0)
(10.0)
(8.0)
(6.0)
(4.0)
(2.0)
-
2.0
Brent crude
Lead Aluminium Thermal Coal
Copper Zinc Nickel
(%)
(51.1)
(23.9) (24.4) (25.4) (26.4) (24.8)
(46.7)
(60.0)
(50.0)
(40.0)
(30.0)
(20.0)
(10.0)
-
Brent
crude
Lead Aluminium Thermal
Coal
Copper Zinc Nickel
(%)
(11.1)(7.8)
(13.5)
(2.0)
(19.3)(17.6)
(34.7)(40.0)
(35.0)
(30.0)
(25.0)
(20.0)
(15.0)
(10.0)
(5.0)
-
Brent
crude
Lead Aluminium Thermal
Coal
Copper Zinc Nickel
(%)

LilladherPrabhudas Equity markets weak across the board
Sources : Bloomberg
• Following the weather induced contraction in the first quarter of CY2015, the US economy grew at 2.3% in the second quarter of 2015 supported by strong spending in consumer spending, government outlays and exports. The strong Dollar and the increasing retrenchment in energy sector created headwinds which could challenge the growth forecasts of 2.4%. The non farm payroll increased by 173,000 jobs in August 2015 after seeing an average monthly gain of 247,000 in the previous 12 months, keeping the un employment levels at a new low of 5.1%. The pay roll addition for June and July were revised upwards to 245,000 each from 231,000 and 215,000 respectively.
• The Eurozone has continued to benefit from the low commodity prices. The momentum was expected to ebb in the second half, however the same has already started taking effect. The Euro zone grew by 0.3% in 2QCY15 with Germany growing by 0.4% and France reporting zero growth. The benefits from a weak oil price, weak euro, easy monetary policies and a more prudent fiscal policy is being offset by the weak investment demand in Germany and France.
• The Chinese government in early August adjusted the exchange rate in a way that allowed the Renminbi to depreciate against the Dollar, This devaluation pushed down commodity prices as well as emerging market currencies which was already under pressure ahead of a possible US Fed rate increase.
• Nifty after touching a high of 8,996 had corrected, but with the strong FII selling that we have witnessed in the second half of August of Rs172.09bn, the market has been correcting sharply. We believe that till the time the FII selling subsides, the market direction continues to look negative, though the Nifty at 7,688 looks attractive at 16.3X September 16 earnings, closer to the ten year average.
World Equity Indices:
9/9/2015 18
Index Country Value YTD (%) 1 Week (%) 1 Mth (%) 3 Mth (%)
Dow Jones USA 16,493 (7.46) (0.21) (5.07) (7.16)
S&P 500 USA 1,969 (4.35) (0.14) (5.21) (5.32)
Nasdaq USA 4,812 1.60 0.74 (4.59) (4.03)
FTSE 100 LONDON 6,146 (6.40) 1.45 (8.52) (9.00)
DAX GERMANY 10,271 4.75 2.55 (10.61) (6.63)
CAC 40 FRANCE 4,598 7.62 1.26 (10.80) (5.19)
Nikkei JAPAN 18,403 5.45 1.70 (11.20) (8.43)
TSX CANADA 13,631 (6.85) (1.65) (4.70) (8.01)
MICEX RUSSIA 1,714 22.74 0.95 1.40 3.02
JSE SA 44,107 0.31 2.62 (5.01) (2.84)
SGX SA 7,688 (7.18) (1.25) (10.23) (4.17)
TING TURKEY 88,474 (16.65) (1.99) (8.00) (7.19)
IBOV BRAZIL 46,762 (6.49) 0.29 (3.74) (11.46)
Jakarta Comp INDONESIA 4,332 (17.13) (1.58) (9.19) (11.60)
PSEI Phillipine PHILIPPINES 6,938 (4.05) (1.91) (7.90) (5.27)
SE THAI 50 THAILAND 898 (10.33) 0.98 (4.04) (8.53)
Euro Stoxx EUROZONE 3,234 2.78 1.41 (11.10) (6.45)
IBEX 35 SPAIN 9,866 (4.02) (1.27) (11.74) (9.80)
Hang Seng HONG KONG 21,780 (7.73) 2.80 (11.29) (19.30)
AS30 AUSTRALIA 5,218 (3.16) 1.93 (4.65) (4.77)
Shanghai CHINA 3,242 0.24 1.14 (13.40) (36.59)
Taiwan TAIWAN 8,232 (11.55) 2.45 (2.49) (10.44)
Kospi KOREA 1,921 0.28 0.30 (4.44) (6.93)
CNX Nifty INDIA 7,688 (7.18) (1.25) (10.23) (4.17)
BSE Sensex INDIA 25,318 (7.93) (1.47) (10.34) (4.39)
KLCI MALAYSIA 1,601 (9.11) 0.67 (4.86) (7.42)
NZX 50 NEWZEALAND 5,668 1.79 1.39 (3.42) (3.32)
MEXBOL MEXICO 43,084 (0.14) 0.40 (3.96) (3.22)

LilladherPrabhudas Indian Market – Valuation and Strategy
• NIFTY earnings estimates for FY16 revised downwards: With the global recovery taking more time than expected and with the domestic activity being subdued, we have seen the FY16 EPS estimate getting revised downwards to Rs436.9 from the earlier estimates of Rs448.3 and the FY17 estimates to Rs.524.1 from 541.0. There definitely seems to be an improvement in the confidence levels in IT companies, as Infosys have come outwit h a strong set of numbers for 1QFY16 and their guidance was also positive. However the global commodity prices continues to remain under pressure with the Renminbis devaluation not helping their cause. With the strong preference for risk aversion, the Emerging markets have been under pressure and India is not exempted from the rout though we continue to strongly believe that India is on a relatively on a better positioning. Reflecting the sentiments, we are revising our near term trading range for the market to 7500-8200 levels. NIFTY at 7688 is trading at 17.6 FY16E and at 14.7 FY17E estimated free-float earnings. The last ten-year average for NIFTY’s one-year forward PE is at 16.0x, implying the NIFTY at 16.4x (12 month forward multiple for Sep 16 EPS of Rs470.5) is continuing to trade at a marginal premium to its last 10-years average of one-year forward multiple of 16.0x. We have already seen a 12% reduction in EPS estimates for FY16 since April 2015.
• The earnings growth is expected to be led by sectors namely financials, Automobiles, Oil& Gas, FMCG, Pharma and IT. Going forward, we expect the slippages to be lower than what we saw in FY15 and hence the provisioning is expected to be lower leading to higher net earnings, Automobiles, with good performance from both the PCs and the CVs though the Motorcycles continue to see headwinds, The benign crude oil prices helping the earnings growth of the downstream oil companies and FMCGs though the demand becomes an issue for FMCGs . Good export potential keeps the pharma sector in limelight with optimistic demand environment and a weak currency keeps IT in demand.
• The chart on Page 20 indicates MSCI India’s premium to MSCI Asia (excluding Japan) over the last ten years. The average of the last 10-year’s premium was at 28% and the current premium is at 37%. The out performance of the Indian market has been behind this and the recent relative strength of the currency and the out performance have resulted in the market becoming expensive Vs peers. Despite the same, the relative strength of the economy among the EMs is expected be beneficial. We continue to believe that the superior economic fundamentals and political and policy scenario will keep the Indian markets at a premium to peers in the region for the near term.
• The South west monsoon has been below normal so far by 12% till 02 September 2015. With the southern peninsula receiving a large deficit of 22% in rainfall, the demand levels and the rural income impact these areas are going to be crucial for the FMCG companies. Though the rains have seen an improvement from the initial large deficiencies, in most of the sub divisions, the rainfall have been below normal. The effect of the crop losses in the rural consumption is not yet clear, yet it is expected that this could slow down the rural consumption which is something which needs to watched out for the FMCG companies in particular.
• The near term trading range for the Nifty seems to be between 7500-8200 levels, given the current weakness. Given the headwinds that we are seeing in emerging markets and in currencies, we are revising our 12 month Nifty target down to 8800-9000 levels. The commentaries on future outlook remains robust and we believe that this makes us more bullish on the sector. We continue to remain overweight in Financial services, while remaining neutral in IT, Automobiles, FMCG, Healthcare and Engineering &Capital Goods.
9/9/2015 19

LilladherPrabhudas Nifty Valuations: Historic Trends
Source: Bloomberg, PL Research
Nifty 1-year forward P/E
Source: Bloomberg, PL Research
MSCI India Premium to MSCI Asia (Ex‐Japan)
9/9/2015 20
37%37%
-30%
-20%
-10%
0%
10%
20%
30%
40%
50%
60%
70%
Se
p-0
5
Dec
-05
Mar
-06
Jun-
06
Se
p-0
6
Dec
-06
Mar
-07
Jun-
07
Se
p-0
7
Dec
-07
Mar
-08
Jun-
08
Se
p-0
8
Dec
-08
Mar
-09
Jun-
09
Se
p-0
9
De
c-0
9
Mar
-10
Jun-
10
Se
p-1
0
De
c-1
0
Mar
-11
Jun-
11
Sep-
11
De
c-1
1
Mar
-12
Jun-
12
Sep-
12
De
c-1
2
Mar
-13
Jun-
13
Sep-
13
De
c-1
3
Mar
-14
Jun-
14
Sep-
14
De
c-1
4
Mar
-15
Jun-
15
Se
p-1
5
10 year Avg.
28%
16.4
-
5.0
10.0
15.0
20.0
25.0
30.0
Sep
-05
Dec
-05
Mar
-06
Jun-
06
Sep
-06
De
c-0
6
Mar
-07
Jun-
07
Sep
-07
Dec
-07
Mar
-08
Jun-
08
Sep
-08
De
c-0
8
Mar
-09
Jun-
09
Sep
-09
Dec
-09
Mar
-10
Jun-
10
Sep
-10
De
c-1
0
Mar
-11
Jun-
11
Sep
-11
Dec
-11
Mar
-12
Jun-
12
Sep
-12
De
c-1
2
Mar
-13
Jun-
13
Sep
-13
De
c-1
3
Mar
-14
Jun-
14
Sep
-14
De
c-1
4
Mar
-15
Jun-
15
Sep
-15
10 year Avg.
16.0x

LilladherPrabhudas Nifty Valuation
9/9/2015 21
Note: Telecom Nos. are Bloomberg Consensus / Sector Weightages are updated as on September 08, 2015
Weight-
age (%)FY14 FY15 FY16E FY17E
Weight-
age (%)FY14 FY15 FY16E FY17E
Banking & Fin. 30.3% Cement 2.9%
PER (x) 20.8 18.5 15.6 13.0 PER (x) 25.7 28.8 28.8 21.9
PAT Growth (%) 2.4 12.6 18.3 20.0 PAT Growth (%) (15.5) (10.5) (0.2) 31.4
Technology 17.3% Telecom 2.4%
PER (x) 24.5 22.0 19.3 17.0 PER (x) 40.7 23.1 20.0 19.3
PAT Growth (%) 28.6 11.2 13.9 13.8 PAT Growth (%) 44.2 76.7 15.1 3.9
FMCG 10.1% Media 0.7%
PER (x) 38.3 35.6 31.4 27.3 PER (x) 39.0 35.6 33.6 26.5
PAT Growth (%) 13.4 7.7 13.1 15.3 PAT Growth (%) 24.0 9.6 5.8 26.8
Auto 9.0% Nifty as on Sep 08 7,688
PER (x) 17.8 16.5 15.1 11.9
PAT Growth (%) 22.0 8.4 9.2 26.4 EPS (Rs) - Free Float 354.9 373.5 436.9 524.1
Growth (%) 4.8 5.2 17.0 20.0
Pharma 8.4% PER (x) 21.7 20.6 17.6 14.7
PER (x) 37.9 40.2 35.0 29.5
PAT Growth (%) 38.5 (5.7) 14.7 18.6 EPS (Rs) - Free Float
Nifty Cons. 354.9 373.5 451.7 548.8
Oil & Gas 8.2% Var. (PLe v/s Cons.) (%) - - (3.3) (4.5)
PER (x) 8.5 11.0 9.4 8.3
PAT Growth (%) 10.6 (22.5) 16.5 14.3 Sensex as on Sep 08 25,318
Eng. & Power 7.5% EPS (Rs) - Free Float 1,184.9 1,238.0 1,347.8 1,628.6
PER (x) 15.9 17.8 14.8 12.7 Growth (%) 11.5 4.5 8.9 20.8
PAT Growth (%) (17.4) (10.5) 20.0 16.8 PER (x) 21.4 20.5 18.8 15.5
Metals 3.2%
PER (x) 9.6 60.2 12.2 9.4 Sensex Cons. 1,184.9 1,238.0 1,373.8 1,670.2
PAT Growth (%) 7.2 (84.1) 392.5 30.5 Var. (PLe v/s Cons.) (%) - - (1.9) (2.5)

LilladherPrabhudas Top Pick Summary
9/9/2015 22
2016E 2017E 2016E 2017E 2016E 2017E 2016E 2017E 2016E 2017E 2016E 2017E
Large Cap
HDFC Bank 1,004 1,200 19.5% 2,516.6 20.8 21.8 20.1 24.2 18.7 20.0 1.9 2.0 20.1 16.2 3.7 3.2
Infosys 1,059 1,340 26.6% 2,422.5 13.6 14.6 8.8 17.7 23.1 24.2 23.1 24.2 18.1 15.3 4.0 3.5
State Bank of India 228 350 53.3% 1,704.8 11.7 11.7 16.3 19.7 11.3 12.3 0.7 0.7 11.2 9.3 1.6 1.4
ICICI Bank 261 390 49.5% 1,512.2 17.1 18.8 14.6 15.6 15.0 15.5 1.8 1.8 11.8 10.2 2.1 1.8
Larsen & Toubro 1,565 2,000 27.8% 1,454.3 15.0 20.0 31.7 25.4 14.2 16.0 5.7 6.3 25.0 20.0 3.2 2.9
Maruti Suzuki 4,139 4,712 13.8% 1,250.4 15.7 19.2 42.5 34.6 20.5 23.1 20.6 23.1 23.6 17.6 4.5 3.7
Tata Motors 331 518 56.5% 1,065.1 4.8 16.3 (12.8) 26.7 21.8 21.3 12.6 13.5 7.6 6.0 1.4 1.2
Indian Oil Corporation 392 548 39.7% 952.6 (9.4) 5.4 155.7 2.0 17.2 15.7 10.9 10.6 7.6 7.4 1.2 1.1
IndusInd Bank 840 1,050 24.9% 456.7 25.3 25.1 19.8 25.7 15.9 15.4 1.8 1.9 20.9 16.6 2.9 2.5
Mid Caps
Glenmark Pharmaceuticals 1,006 1,186 17.9% 272.9 25.8 37.4 130.0 89.8 27.2 33.8 15.5 23.7 25.0 13.2 5.3 3.8
Cummins India 1,055 1,285 21.8% 292.6 16.6 18.3 21.7 29.8 27.4 30.3 27.3 30.0 34.1 26.3 8.8 7.3
Motherson Sumi Systems 281 400 42.1% 248.1 15.7 20.2 (9.2) 58.4 35.7 43.1 21.3 29.3 27.9 17.6 8.9 6.6
Aurobindo Pharma 727 761 4.8% 212.2 15.5 14.7 (38.7) 24.8 34.1 32.6 21.3 22.9 21.2 17.0 6.4 4.9
MindTree 1,319 1,500 13.7% 110.4 24.3 18.7 13.9 14.8 26.9 24.8 26.5 24.5 18.1 15.7 4.4 3.5
Persistent Systems 709 910 28.4% 56.7 11.9 18.3 (4.4) 20.9 18.6 19.8 18.4 19.6 20.4 16.9 3.6 3.1
Jubilant Life Sciences 306 578 89.1% 48.7 13.3 12.4 NA 39.0 19.6 21.9 12.2 14.6 9.0 6.5 1.6 1.3
Sadbhav Engineering 284 380 34.0% 48.1 18.0 26.4 24.1 43.0 9.9 12.8 8.8 11.0 34.0 23.8 3.2 2.9
JK Lakshmi Cement 360 450 25.0% 42.4 21.8 22.1 (86.5) 825.4 1.5 13.1 4.3 8.9 209.1 22.6 3.1 2.8
Rallis India 207 270 30.3% 40.3 11.6 14.9 19.3 22.3 21.5 22.8 27.7 30.6 21.5 17.6 4.3 3.7
Va Tech Wabag 666 1,000 50.2% 36.2 12.5 12.5 28.4 23.6 14.7 16.1 11.7 12.4 25.6 20.7 3.6 3.1
* For Banks P/ABV
RoE (%)Upside
Mcap
(Rs bn)
RoCE (%)CMP (Rs.) TP (Rs)
Revenue Growth (%) Earnings Growth (%) PER (x) P/BV (x)*

LilladherPrabhudas
LARGE CAP
9/9/2015 23

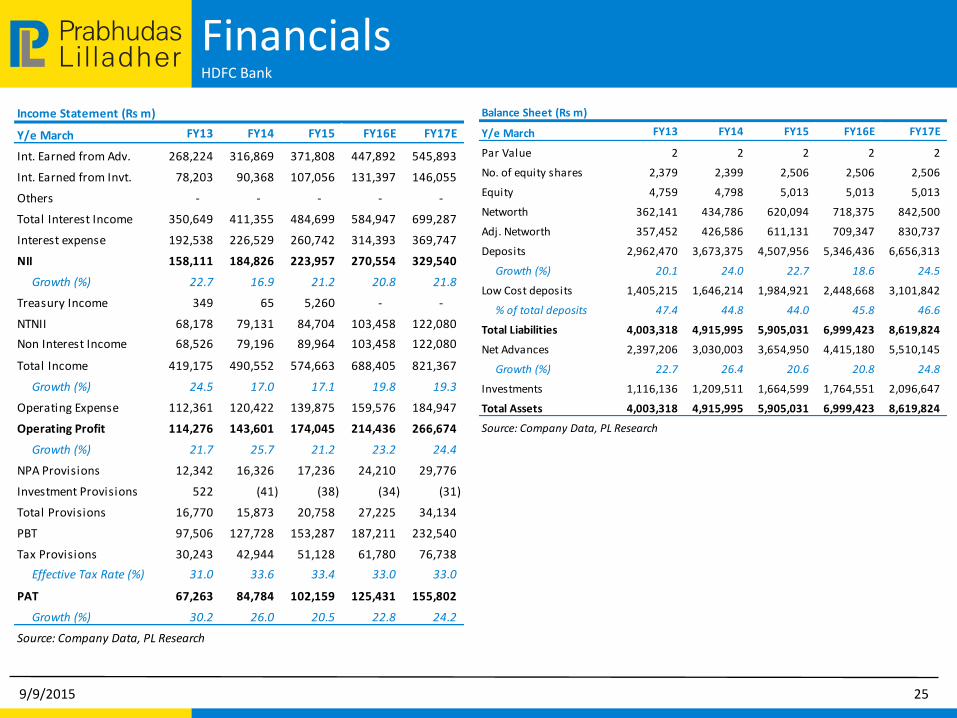
LilladherPrabhudas HDFC Bank
CMP: Rs1,004 TP: Rs1,200 Rating: BUY MCap: Rs2,516.6bn
Revenue growth remains impressive: HDFCB delivered ~25% YoY growth in core revenues led by strong growth in NII and robust core fees/FX income/recovery from written‐off accounts. Core other income grew 28% YoY and HDFCB had treasury gains of Rs1.26bn during the quarter which boosted overall other income growth to 33% YoY. NII growth was led by healthy loan growth and better retail mix. Margins, however, compressed by 10bps QoQ as CASA mix declined 440bps QoQ to 39.6% led by sharp surge in time deposits. HDFCB opened 87 branches during the quarter & increased its branch network to 4,101.
Loan growth remains healthy; retail mix increases by 173bps QoQ: Overall loan growth stood at ~22% YoY (4.5% QoQ) led by healthy growth in retail portfolio ‐ particularly personal loans, home loan and business banking segments, all of which reported double‐digit sequential growth. Wholesale loan book reported muted 1% QoQ growth. The mix of retail loans has, thus, increased by 173bps QoQ to ~49%. HDFCB indicated healthy loan growth prospects on underlying improvement in product segments where it has gained market share and as it benefits from increasing footprint.
Asset quality broadly stable; outlook remains positive: GNPLs increased by 6% QoQ as bank reported a slippage rate of 1.4% (annualized), largely belonging to agriculture & SME segment. Coverage ratio declined by 207bps QoQ, while outstanding restructured assets stood at 0.1% of total loans. HDFCB made floating provisions of Rs650m, taking the total quantum of such provisions to Rs15.9bn. We maintain our earnings estimates and ‘BUY’ rating with a PT of Rs1,200.
9/9/2015 24
Key Financials (Rs m)
Y/e March FY13 FY14 FY15 FY16E FY17E
Net interest income 158,111 184,826 223,957 270,554 329,540
Growth (%) 22.7 16.9 21.2 20.8 21.8
Operating profit 114,276 143,601 174,045 214,436 266,674
PAT 67,263 84,784 102,159 125,431 155,802
EPS (Rs) 28.5 35.5 41.7 50.0 62.2
Growth (%) 28.7 24.7 17.4 20.1 24.2
Net DPS (Rs) 5.5 6.8 8.0 9.0 10.5
Source: Company Data, PL Research
Profitability & valuation
Y/e March FY13 FY14 FY15 FY16E FY17E
NIM (%) 4.6 4.4 4.3 4.4 4.4
RoAE (%) 20.3 21.3 19.4 18.7 20.0
RoAA (%) 1.8 1.9 1.9 1.9 2.0
P / BV (x) 6.6 5.5 4.1 3.5 3.0
P / ABV (x) 6.8 5.9 4.3 3.7 3.2
PE (x) 35.3 28.3 24.1 20.1 16.2
Net dividend yield (%) 0.5 0.7 0.8 0.9 1.0
Source: Company Data, PL Research
Stock Performance
(%) 1M 6M 12M
Absolute (8.1) (7.5) 16.1
Relative to Sensex 2.2 6.6 23.4
LilladherPrabhudas Financials
HDFC Bank
9/9/2015 25
Income Statement (Rs m)
Y/e March FY13 FY14 FY15 FY16E FY17E
Int. Earned from Adv. 268,224 316,869 371,808 447,892 545,893
Int. Earned from Invt. 78,203 90,368 107,056 131,397 146,055
Others - - - - -
Total Interest Income 350,649 411,355 484,699 584,947 699,287
Interest expense 192,538 226,529 260,742 314,393 369,747
NII 158,111 184,826 223,957 270,554 329,540
Growth (%) 22.7 16.9 21.2 20.8 21.8
Treasury Income 349 65 5,260 - -
NTNII 68,178 79,131 84,704 103,458 122,080
Non Interest Income 68,526 79,196 89,964 103,458 122,080
Total Income 419,175 490,552 574,663 688,405 821,367
Growth (%) 24.5 17.0 17.1 19.8 19.3
Operating Expense 112,361 120,422 139,875 159,576 184,947
Operating Profit 114,276 143,601 174,045 214,436 266,674
Growth (%) 21.7 25.7 21.2 23.2 24.4
NPA Provisions 12,342 16,326 17,236 24,210 29,776
Investment Provisions 522 (41) (38) (34) (31)
Total Provisions 16,770 15,873 20,758 27,225 34,134
PBT 97,506 127,728 153,287 187,211 232,540
Tax Provisions 30,243 42,944 51,128 61,780 76,738
Effective Tax Rate (%) 31.0 33.6 33.4 33.0 33.0
PAT 67,263 84,784 102,159 125,431 155,802
Growth (%) 30.2 26.0 20.5 22.8 24.2
Source: Company Data, PL Research
Balance Sheet (Rs m)
Y/e March FY13 FY14 FY15 FY16E FY17E
Par Value 2 2 2 2 2
No. of equity shares 2,379 2,399 2,506 2,506 2,506
Equity 4,759 4,798 5,013 5,013 5,013
Networth 362,141 434,786 620,094 718,375 842,500
Adj. Networth 357,452 426,586 611,131 709,347 830,737
Deposits 2,962,470 3,673,375 4,507,956 5,346,436 6,656,313
Growth (%) 20.1 24.0 22.7 18.6 24.5
Low Cost deposits 1,405,215 1,646,214 1,984,921 2,448,668 3,101,842
% of total deposits 47.4 44.8 44.0 45.8 46.6
Total Liabilities 4,003,318 4,915,995 5,905,031 6,999,423 8,619,824
Net Advances 2,397,206 3,030,003 3,654,950 4,415,180 5,510,145
Growth (%) 22.7 26.4 20.6 20.8 24.8
Investments 1,116,136 1,209,511 1,664,599 1,764,551 2,096,647
Total Assets 4,003,318 4,915,995 5,905,031 6,999,423 8,619,824
Source: Company Data, PL Research

LilladherPrabhudas Infosys
CMP: Rs1,059 TP: Rs1,340 Rating: BUY MCap: Rs2,422.5bn
Infosys’ Q1FY16 performance was ahead of expectation on all counts with upward revision of FY16 revenue guidance and Aspiration 2020 reiterated. Infosys’ initiatives over the last one year are showing signs of early success. Management remains confident of achieving industry leading growth by FY17. Full benefits of the management efforts will be visible in H2FY16 and that will drive multiple expansion. However, volatility in demand environment and macro challenges could yield negative surprises.
Strong beat to expectation in 1QFY16: Revenue grew by 4.5% (4.4%@cc) QoQ, ahead of the most bullish expectation (Cons./PLe: +3%/2.6%). Q1FY16 performance (both in terms of volume and USD revenue growth) was the strongest Q1 since Q1FY11. We see the quarter performance as an early sign of success of new initiatives like 1) Focus on Top 15 clients from CEO office, 2) Centralized team for large deal RFPs, 3) Investment in automation, platform, & solution, 4) Offering solution using “DT”.
Concern on margin – Strong growth could resolve: EBITDA margin have likely bottomed out in Q1FY16. We expect Infosys to achieve its stated objective of improving EBIT margin to 30% by 2020 and retaining EBIT margin at 25% (-/+1%) in the near term driven by: 1) Investments in automation, solution, & platforms. 2) Focus on increasing Rev/Emp, 3) Improving client mining, 4) Improvement in Utilization which is lower than peers like TCS.
Upward revision of guidance – Alienate sceptics: FY16 USD revenue guidance has been revised upward to 7.2-9.2% YoY (from 6.2-8.2%). We expect momentum to accelerate as Infosys enters the strongest quarter putting low-double digit growth at sight. Management indicated seasonality impact on H2FY16 to be possibly lower than usual.
Valuation & Recommendation – Retain ‘BUY’, revise TP to Rs1,340: We expect initiatives translating into improved growth momentum in FY16. The stock is currently trading at 15.3x FY17E EPS of Rs69.
9/9/2015 26
Key Financials (Rs m)
Y/e March FY13 FY14 FY15 FY16E FY17E
Revenue (Rs m) 403,520 501,330 533,190 605,695 693,964
Growth (%) 19.6 24.2 6.4 13.6 14.6
EBITDA (Rs m) 115,580 134,150 149,000 164,173 186,656
PAT (Rs m) 94,210 106,480 123,290 134,172 157,957
EPS (Rs) 41.2 46.5 53.9 58.6 69.0
Growth (%) (71.7) 13.0 15.8 8.8 17.7
Net DPS (Rs) 10.5 15.7 22.2 30.0 34.9
Source: Company Data, PL Research
Profitability & valuation
Y/e March FY13 FY14 FY15 FY16E FY17E
EBITDA margin (%) 28.6 26.8 27.9 27.1 26.9
RoE (%) 25.7 24.4 24.1 23.1 24.2
RoCE (%) 25.6 24.3 24.0 23.1 24.2
EV / sales (x) 5.5 4.3 4.0 3.4 2.9
EV / EBITDA (x) 19.1 16.1 14.2 12.7 10.9
PER (x) 25.7 22.8 19.6 18.1 15.3
P / BV (x) 6.1 5.1 4.4 4.0 3.5
Net dividend yield (%) 1.0 1.5 2.1 2.8 3.3
Source: Company Data, PL Research
Stock Performance
(%) 1M 6M 12M
Absolute (3.4) (5.8) 12.0
Relative to Sensex 7.0 8.2 19.3

LilladherPrabhudas Financials
Infosys
9/9/2015 27
Income Statement (Rs m)
Y/e March FY13 FY14 FY15 FY16E FY17E
Net Revenue 403,520 501,330 533,190 605,695 693,964
Direct Expenses 241,510 307,670 318,150 367,054 422,507
% of Net Sales 59.9 61.4 59.7 60.6 60.9
Employee Cost - - - - -
% of Net Sales 0.0 0.0 0.0 0.0 0.0
SG&A Expenses 46,430 59,510 66,040 74,468 84,802
% of Net Sales 11.5 11.9 12.4 12.3 12.2
Other Expenses - - - - -
% of Net Sales 0.0 0.0 0.0 0.0 0.0
EBITDA 115,580 134,150 149,000 164,173 186,656
Margin (%) 28.6 26.8 27.9 27.1 26.9
Depreciation 11,290 13,740 10,680 12,621 13,152
PBIT 104,290 120,410 138,320 151,551 173,504
Interest Expenses - - - - -
PBT 127,880 147,100 172,590 183,797 213,455
Total tax 33,670 40,620 49,290 49,625 55,498
Effective Tax rate (%) 26.3 27.6 28.6 27.0 26.0
PAT 94,210 106,480 123,290 134,172 157,957
Extraordinary Gain/(Loss) - - - - -
Adjusted PAT 94,210 106,480 123,290 134,172 157,957
Source: Company Data, PL Research
Balance Sheet (Rs m)
Y/e March FY13 FY14 FY15 FY16E FY17E
Share Capital 11,440 11,440 11,440 11,440 11,440
Reserves & Surplus 355,630 432,960 508,130 573,760 651,752
Shareholder's Fund 397,970 475,300 547,630 613,260 691,252
Preference Share Capital - - - - -
Total Debt - - - - -
Other Liabilities(net) 1,490 3,230 460 460 460
Deferred Tax Liability 1,190 640 1,600 1,600 1,600
Total Liabilities 400,650 479,170 549,690 615,320 693,312
Gross Block 106,760 134,120 155,470 180,303 208,756
Less: Depreciation 42,080 55,250 64,220 76,841 89,993
Net Block 64,680 78,870 91,250 103,462 118,763
Capital Work in Progress - - - - -
Cash & Cash Equivalent 235,710 292,210 313,420 346,173 393,628
Total Current Assets 335,740 397,480 462,210 505,686 577,808
Total Current Liabilities 62,860 91,380 113,830 103,888 113,320
Net Current Assets 272,880 306,100 348,380 401,798 464,488
Other Assets 45,700 61,490 100,310 100,310 100,310
Total Assets 400,650 479,170 549,690 615,320 693,312
Source: Company Data, PL Research

LilladherPrabhudas State Bank of India
CMP: Rs228 TP: 350 Rating: BUY MCap: Rs1,727.7bn
SBIN has been reporting declining trend in slippages for few quarters.
Margins have been under pressure as cost of deposits remain sticky while
lending yield declined due to recent cut in base rate. However, we expect
trends to improve as deposit portfolio re-prices gradually. SBIN is well
capitalized and has a very strong liability franchise which the bank will
be able to leverage as credit growth revives, meanwhile push into retail
will remain the focus area in FY16.
Other income drives revenue growth; NII disappoints: During Q1FY16,
SBIN reported 20% YoY growth in other income, led by strong treasury
gains (Rs8.7 bn), modest growth in fee income and higher recoveries from
written‐off account (Rs4.3 bn). NII growth has lagged loan book as lending
yields remain under pressure following recent cuts in base rate while
deposit cost remains sticky and will take longer to reprice. SBIN guided for
13‐14% loan growth during FY16 and suggested for early signs of revival in
project lending.
Slippages broadly stable; SME/Mid‐corporate remains the vulnerable
segments: Asset quality remained stable as fresh slippages stood at
Rs73.1bn (26% YoY decline; 2.3% annualized), while SBIN refinanced assets
worth Rs64.8bn consisting of five accounts (metal, port and power
accounts). Management explained that fears of deficient monsoon has
resulted in higher slippages in agriculture while within SME segment it is
mostly the small‐ticket loans (<Rs100mn) where the NPL formation rate
remains higher else the bank is seeing some signs of recovery.
Margins recovery to be gradual; retain ‘BUY’: SBIN has been flushed with
deposits as time deposits grew 18% YoY which the bank has parked into
low-yielding investments. We expect margin recovery to be slow and
gradual and will be a function of credit growth and deposit maturity
profile. We estimate RoA to improve gradually and maintain ‘BUY’ with PT
of Rs350 based on Mar-17 ABV.
9/9/2015 28
Key Financials (Rs m)
Y/e March FY13 FY14 FY15 FY16E FY17E
Net interest income 443,313 492,822 550,156 614,782 686,973
Growth (%) 2.4 11.2 11.6 11.7 11.7
Operating profit 310,817 321,092 389,139 431,360 497,134
PAT 141,050 108,912 131,020 153,336 184,800
EPS (Rs) 20.8 15.2 17.5 20.4 24.4
Growth (%) 16.1 -26.9 15.3 16.3 19.7
Net DPS (Rs) 4.1 1.5 3.5 3.7 3.8
Source: Company Data, PL Research
Profitability & valuation
Y/e March FY13 FY14 FY15 FY16E FY17E
NIM (%) 3.2 3.0 3.0 2.9 2.9
RoAE (%) 15.4 10.0 10.6 11.3 12.3
RoAA (%) 1.0 0.6 0.7 0.7 0.7
P / BV (x) 1.6 1.4 1.3 1.2 1.1
P / ABV (x) 2.2 2.2 1.8 1.6 1.4
PE (x) 11.0 15.0 13.0 11.2 9.3
Net dividend yield (%) 1.8 0.7 1.5 1.6 1.6
Source: Company Data, PL Research
Stock Performance
(%) 1M 6M 12M
Absolute (18.8) (22.3) (11.0)
Relative to Sensex (8.5) (8.2) (3.7)

LilladherPrabhudas Financials
State Bank of India
9/9/2015 29
Income Statement (Rs m)
Y/e March FY13 FY14 FY15 FY16E FY17E
Int. Earned from Adv. 905,371 1,024,841 1,123,439 1,224,266 1,381,199
Int. Earned from Invt. 272,006 319,419 370,878 435,161 492,361
Others - - - - -
Total Interest Income 1,196,571 1,363,508 1,523,971 1,684,434 1,900,440
Interest expense 753,258 870,686 973,814 1,069,652 1,213,467
NII 443,313 492,822 550,156 614,782 686,973
Growth (%) 2.4 11.2 11.6 11.7 11.7
Treasury Income 10,981 20,767 36,182 57,890 92,625
NTNII 149,367 164,762 189,577 192,702 194,053
Non Interest Income 160,348 185,529 225,759 250,592 286,678
Total Income 1,356,919 1,549,037 1,749,730 1,935,027 2,187,118
Growth (%) 12.3 14.2 13.0 10.6 13.0
Operating Expense 292,844 357,259 386,776 434,015 476,517
Operating Profit 310,817 321,092 389,139 431,360 497,134
Growth (%) (1.6) 3.3 21.2 10.8 15.2
NPA Provisions 106,570 144,785 187,129 193,015 204,041
Investment Provisions (9,670) 5,633 (5,904) (3,542) 2,125
Total Provisions 111,308 159,354 195,995 202,500 221,313
PBT 199,509 161,739 193,144 228,860 275,821
Tax Provisions 58,459 52,827 62,124 75,524 91,021
Effective Tax Rate (%) 29.3 32.7 32.2 33.0 33.0
PAT 141,050 108,912 131,020 153,336 184,800
Growth (%) 20.5 (22.8) 20.3 17.0 20.5
Source: Company Data, PL Research
Balance Sheet (Rs m)
Y/e March FY13 FY14 FY15 FY16E FY17E
Par Value 1 1 1 1 1
No. of equity shares 6,840 7,466 7,466 7,566 7,566
Equity 6,840 7,466 7,466 7,566 7,566
Networth 988,837 1,182,822 1,284,383 1,428,088 1,576,953
Adj. Networth 769,272 871,862 1,036,006 1,187,192 1,338,481
Deposits 12,027,396 13,944,085 15,767,933 17,865,068 20,759,209
Growth (%) 15.2 15.9 13.1 13.3 16.2
Low Cost deposits 5,390,634 5,984,004 6,764,443 7,896,360 9,196,330
% of total deposits 44.8 42.9 42.9 44.2 44.3
Total Liabilities 15,662,609 17,922,346 20,480,799 23,175,405 26,870,108
Net Advances 10,456,165 12,098,287 13,000,264 14,573,296 16,817,584
Growth (%) 20.5 15.7 7.5 12.1 15.4
Investments 3,509,273 3,983,082 4,950,274 5,927,348 6,986,616
Total Assets 15,662,609 17,922,346 20,428,632 28,198,553 32,812,368
Source: Company Data, PL Research

LilladherPrabhudas ICICI Bank
CMP: Rs261 TP: Rs390 Rating: BUY MCap: Rs1,512.2bn
ICICI Bank (ICICIBC) has been reporting relatively stable operating performance even as macro-environment remains challenging. Declining trend in NPL formation, granular residual restructured book, coupled with positive management guidance and reasonable valuations makes us retain our ‘BUY’ rating with TP of Rs390 based on Mar-17 ABV.
NII growth on track; other income sluggish on lower treasury gains: ICICIBC in Q1FY16 reported 14% YoY growth in NII led by 22bps YoY & 11bps QoQ margin improvement to 3.6% mainly on strong growth in Retail & SME. Other income growth of ~5% was low mainly on lower treasury gains, while core fee income saw marginal uptick which is being mainly contributed by retail segment. Management has guided for double‐digit fee growth in FY16, led by retail fees.
Asset quality remains stable partly on lower slippages and partly from higher write‐offs: In Q1FY16, Fresh slippages of Rs16.7bn were lower than Rs32.6bn in Q4FY15. The bank has up-fronted some of its restructuring and hence, restructured Rs19.6bn in Q1FY16. Management guided NIL pipeline on restructured or 5:25 scheme. Guidance on credit cost is at 90‐95bps of loans for FY16 (currently at 97bps) as management re‐affirmed stressed accretion to be lower in FY16 than FY15 mainly on lower restructuring, lower lumpy relapses in restructured book and lower rate of slippages from loan book.
Advances book tilt remains towards retail: Advances has grown by 15% YoY in Q1FY16 with strong growth of 25% in retail with contribution from all segments, especially housing & un‐secured. Management has guided for 18‐20% loan growth with 25% growth in retail for FY16 and stable margins of at ~3.5%. ICICIBC is trading at ~25% discount to AXSB valuations and we believe discount would narrow on improving asset quality trends, high growth towards retail and re‐gaining market share in CASA enabling ICICIBC to improve its ROE profile in line with peers.
9/9/2015 30
Key Financials (Rs m)
Y/e March FY13 FY14 FY15 FY16E FY17E
Net interest income 138,664 164,756 190,396 223,026 264,898
Growth (%) 29.2 18.8 15.6 17.1 18.8
Operating profit 131,992 165,946 197,199 222,238 259,538
PAT 83,255 98,105 111,753 128,327 148,307
EPS (Rs) 14.4 17.0 19.3 22.1 25.6
Growth (%) 28.7 17.7 13.6 14.6 15.6
Net DPS (Rs) 4.0 4.5 5.0 6.4 7.0
Source: Company Data, PL Research
Profitability & valuation
Y/e March FY13 FY14 FY15 FY16E FY17E
NIM (%) 2.9 3.1 3.2 3.3 3.3
RoAE (%) 13.1 14.0 14.5 15.0 15.5
RoAA (%) 1.6 1.7 1.8 1.8 1.8
P / BV (x) 2.3 2.1 1.9 1.7 1.5
P / ABV (x) 2.9 2.6 2.4 2.1 1.8
PE (x) 18.1 15.3 13.5 11.8 10.2
Net dividend yield (%) 1.5 1.7 1.9 2.5 2.7
Source: Company Data, PL Research
Stock Performance
(%) 1M 6M 12M
Absolute (15.9) (25.0) (16.8)
Relative to Sensex (5.6) (11.0) (9.5)

LilladherPrabhudas Financials
ICICI Bank
9/9/2015 31
Income Statement (Rs m)
Y/e March FY13 FY14 FY15 FY16E FY17E
Int. Earned from Adv. 273,411 314,279 356,311 411,043 501,728
Int. Earned from Invt. 110,093 115,571 119,446 138,578 160,370
Others - - - - -
Total Interest Income 400,756 441,782 490,911 563,143 678,025
Interest expense 262,092 277,026 300,515 340,117 413,127
NII 138,664 164,756 190,396 223,026 264,898
Growth (%) 29.2 18.8 15.6 17.1 18.8
Treasury Income 4,364 7,654 15,485 - -
NTNII 79,093 96,625 106,277 141,487 162,851
Non Interest Income 83,457 104,279 121,761 141,487 162,851
Total Income 484,213 546,060 612,673 704,630 840,876
Growth (%) 18.0 12.8 12.2 15.0 19.3
Operating Expense 90,129 103,089 114,958 142,275 168,211
Operating Profit 131,992 165,946 197,199 222,238 259,538
Growth (%) 27.1 25.7 18.8 12.7 16.8
NPA Provisions 13,948 22,523 31,410 36,019 43,517
Investment Provisions 1,262 711 2,980 - -
Total Provisions 18,025 26,264 38,996 38,913 47,671
PBT 113,967 139,682 158,203 183,325 211,867
Tax Provisions 30,712 41,577 46,450 54,997 63,560
Effective Tax Rate (%) 26.9 29.8 29.4 30.0 30.0
PAT 83,255 98,105 111,753 128,327 148,307
Growth (%) 28.8 17.8 13.9 14.8 15.6
Source: Company Data, PL Research
Balance Sheet (Rs m)
Y/e March FY13 FY14 FY15 FY16E FY17E
Par Value 2 2 2 2 2
No. of equity shares 5,768 5,775 5,798 5,798 5,798
Equity 11,536 11,550 11,597 11,597 11,597
Networth 667,015 732,068 804,219 903,327 1,007,253
Adj. Networth 644,708 699,087 741,663 846,208 948,912
Deposits 2,926,135 3,319,137 3,615,627 4,324,290 5,279,958
Growth (%) 14.5 13.4 8.9 19.6 22.1
Low Cost deposits 1,225,762 1,423,784 1,643,799 1,881,066 2,296,782
% of total deposits 41.9 42.9 45.5 43.5 43.5
Total Liabilities 5,367,946 5,946,416 6,461,293 7,684,060 9,254,940
Net Advances 2,902,494 3,387,026 3,875,221 4,599,887 5,639,461
Growth (%) 14.4 16.7 14.4 18.7 22.6
Investments 1,713,936 1,770,218 1,865,800 2,114,876 2,464,954
Total Assets 5,367,946 5,946,416 6,461,293 7,684,060 9,254,940
Source: Company Data, PL Research

LilladherPrabhudas Larsen & Toubro
CMP: Rs1,565 TP: Rs2,000 Rating: BUY MCap: Rs1,454.3bn
Strong Guidance: L&T maintained its guidance of 15% sales growth, 15%
order inflow growth and 100bps improvement in margin (excl. services).
While order flow for the quarter was down 21% YoY to Rs263bn, L&T
remains confident of achieving 15% growth in inflow for FY16, given strong
pipeline of orders. The current prospect pipeline is Rs5trn (v/s Rs6.3trn at
the start of Q1FY16 and Rs5trn at the start of Q1FY15). Out of prospect
pipeline of Rs5trn, Rs2.4trn is from Infrastructure, Rs1.3trn from Power,
Rs250bn from Metal & Material handling, Rs450bn from Hydrocarbon and
Rs650bn from various other sectors. Order book stood at Rs2.3trn, up 22%
YoY. L&T believes the revenue growth could be back-ended as large order
flow will start contributing meaningfully from H2FY16: The consolidated
working capital as percentage of sales for at end of FY15 stood at ~ 25%,
down from 26% Sales in Q3FY15, an improvement of 100 bps
Worst behind for Hydrocarbon business: L&T had recently carved out
hydrocarbon business into subsidiary. Sales in hydrocarbon business
increased 41% YoY to Rs22bn and L&T posted an EBITDA of Rs0.9bn for
Q1FY16 (v/s loss of Rs8.9bn). Orders booked in FY15 (International and
Domestic) are contributing to revenue growth. L&T is in the process of
closing three legacy projects by end of FY16; the company expects the
close out cost in these projects to be compensated by pending claims
against the projects. L&T has a fixed cost of US$50m in Hydrocarbon
business, the company expects under recovery of ~US$25m to lead to
EBITDA break-even and loss at PAT level in Hydrocarbon businesses.
Outlook and Valuation: : The stock is trading at core PE of 17.2x FY17E
earnings. We have revised our earnings downward by ~5% for FY16E &
FY17E respectively to factor in weak performance in Q1FY16. L&T
continues to be the best play in the Indian infrastructure space, given its
strong business model, diverse skill sets, strong execution capabilities and
relatively healthy/large balance sheet.
9/9/2015 32
Key Financials (Rs m)
Y/e March FY13 FY14 FY15 FY16E FY17E
Revenue (Rs m) 744,980 851,284 920,046 1,058,053 1,269,663
Growth (%) 15.8 14.3 8.1 15.0 20.0
EBITDA (Rs m) 98,592 107,543 113,356 136,944 165,710
PAT (Rs m) 49,578 43,135 44,077 58,060 72,831
EPS (Rs) 80.6 46.5 47.4 62.5 78.4
Growth (%) 6.7 (42.2) 1.9 31.7 25.4
Net DPS (Rs) 18.1 14.3 13.6 16.1 20.2
Source: Company Data, PL Research
Profitability & valuation
Y/e March FY13 FY14 FY15 FY16E FY17E
EBITDA margin (%) 13.2 12.6 12.3 12.9 13.1
RoE (%) 15.7 15.6 13.3 14.2 16.0
RoCE (%) 7.8 5.9 5.0 5.7 6.3
EV / sales (x) 2.0 2.7 2.6 2.3 2.0
EV / EBITDA (x) 15.2 21.1 20.8 17.7 15.2
PER (x)* 13.8 23.8 23.4 17.8 14.2
P / BV (x) 2.8 3.8 3.6 3.2 2.9
Net dividend yield (%) 1.2 0.9 0.9 1.0 1.3
Source: Company Data, PL Research * Core PE
Stock Performance
(%) 1M 6M 12M
Absolute (14.7) (14.3) (4.0)
Relative to Sensex (4.3) (0.3) 3.3

LilladherPrabhudas SOTP
9/9/2015 33
Fair Value (Rs) Basis
L&T Core business 1,574 23x FY17E EPS Ex dividends
L&T Hydrocarbon business 7 10x FY17E EPS
L&T IDPL 139 1.5x P/B and ‐1x for Hyderabad metro
L&T InfoTech 161 12x FY17E EPS
L&T Finance Holding 79 83% stake; 20% Hold co discount on current market cap
L&T's equity investment in BTG 4 1.5x equity investment
Other businesses 65 1.5x book value
Target price 2,000

LilladherPrabhudas Financials
Larsen & Toubro
9/9/2015 34
Income Statement (Rs m)
Y/e March FY13 FY14 FY15 FY16E FY17E
Net Revenue 744,980 851,284 920,046 1,058,053 1,269,663
Direct Expenses 584,652 663,842 727,468 829,211 998,271
% of Net Sales 78.5 78.0 79.1 78.4 78.6
Employee Cost 62,242 80,276 79,222 91,898 105,682
% of Net Sales 8.4 9.4 8.6 8.7 8.3
SG&A Expenses (506) (378) - - -
% of Net Sales (0.1) (0.0) 0.0 0.0 0.0
Other Expenses - - - - -
% of Net Sales 0.0 0.0 0.0 0.0 0.0
EBITDA 98,592 107,543 113,356 136,944 165,710
Margin (%) 13.2 12.6 12.3 12.9 13.1
Depreciation 16,371 14,458 26,225 27,536 28,913
PBIT 82,221 93,085 87,131 109,407 136,797
Interest Expenses 20,950 31,414 28,507 30,788 33,867
PBT 75,598 74,892 72,172 89,555 113,733
Total tax 23,985 26,076 22,836 29,553 38,669
Effective Tax rate (%) 31.7 34.8 31.6 33.0 34.0
PAT 52,057 49,020 47,648 58,060 72,831
Extraordinary Gain/(Loss) 2,479 5,885 3,572 - -
Adjusted PAT 49,578 43,135 44,077 58,060 72,831
Source: Company Data, PL Research
Balance Sheet (Rs m)
Y/e March FY13 FY14 FY15 FY16E FY17E
Share Capital 1,231 1,854 1,859 1,859 1,859
Reserves & Surplus 337,366 375,262 407,232 450,457 505,672
Shareholder's Fund 338,597 377,116 409,091 452,280 502,337
Preference Share Capital - - - - -
Total Debt 573,409 862,988 955,700 1,037,667 1,119,928
Other Liabilities(net) - - - - -
Deferred Tax Liability 3,779 6,179 5,396 5,396 5,396
Total Liabilities 915,785 1,246,283 1,370,186 1,495,342 1,627,661
Gross Block 356,028 401,773 437,842 474,345 504,345
Less: Depreciation - - - - -
Net Block 356,028 401,773 437,842 474,345 504,345
Capital Work in Progress 40,175 42,626 42,626 42,626 42,626
Cash & Cash Equivalent 123,390 122,055 153,683 169,021 150,132
Total Current Assets 924,034 1,150,574 1,335,860 1,446,919 1,668,049
Total Current Liabilities 515,266 453,944 571,655 594,060 712,872
Net Current Assets 408,768 696,630 764,205 852,859 955,176
Other Assets 23,140 24,166 29,392 29,392 29,392
Total Assets 915,785 1,246,283 1,370,186 1,495,343 1,627,660
Source: Company Data, PL Research
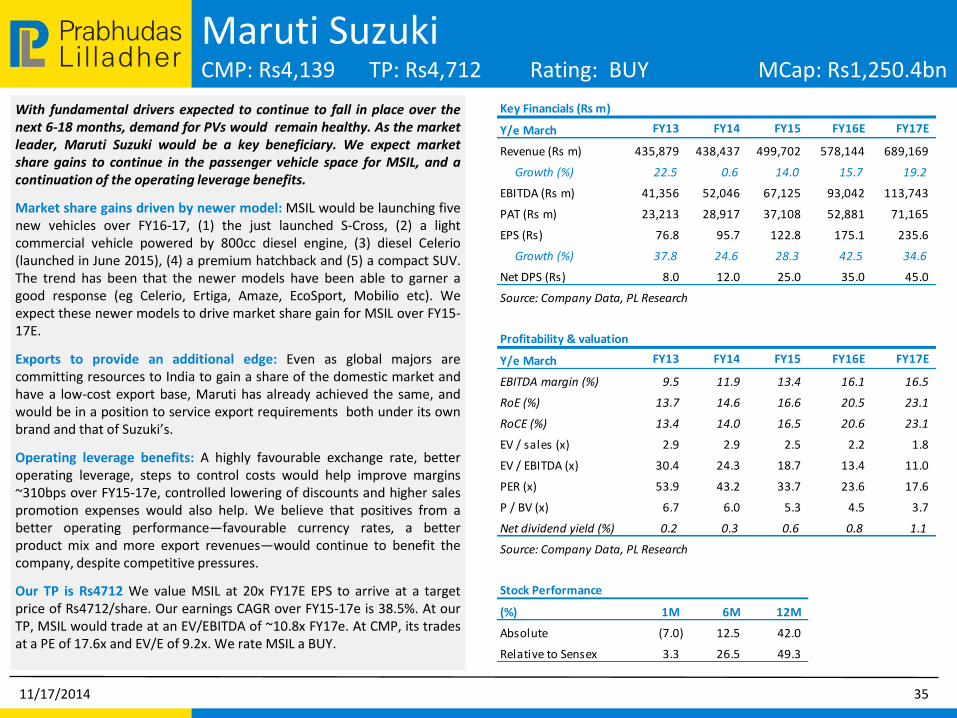
LilladherPrabhudas Maruti Suzuki
CMP: Rs4,139 TP: Rs4,712 Rating: BUY MCap: Rs1,250.4bn
With fundamental drivers expected to continue to fall in place over the next 6-18 months, demand for PVs would remain healthy. As the market leader, Maruti Suzuki would be a key beneficiary. We expect market share gains to continue in the passenger vehicle space for MSIL, and a continuation of the operating leverage benefits.
Market share gains driven by newer model: MSIL would be launching five new vehicles over FY16-17, (1) the just launched S-Cross, (2) a light commercial vehicle powered by 800cc diesel engine, (3) diesel Celerio (launched in June 2015), (4) a premium hatchback and (5) a compact SUV. The trend has been that the newer models have been able to garner a good response (eg Celerio, Ertiga, Amaze, EcoSport, Mobilio etc). We expect these newer models to drive market share gain for MSIL over FY15-17E.
Exports to provide an additional edge: Even as global majors are committing resources to India to gain a share of the domestic market and have a low-cost export base, Maruti has already achieved the same, and would be in a position to service export requirements both under its own brand and that of Suzuki’s.
Operating leverage benefits: A highly favourable exchange rate, better operating leverage, steps to control costs would help improve margins ~310bps over FY15-17e, controlled lowering of discounts and higher sales promotion expenses would also help. We believe that positives from a better operating performance—favourable currency rates, a better product mix and more export revenues—would continue to benefit the company, despite competitive pressures.
Our TP is Rs4712 We value MSIL at 20x FY17E EPS to arrive at a target price of Rs4712/share. Our earnings CAGR over FY15-17e is 38.5%. At our TP, MSIL would trade at an EV/EBITDA of ~10.8x FY17e. At CMP, its trades at a PE of 17.6x and EV/E of 9.2x. We rate MSIL a BUY.
11/17/2014 35
Key Financials (Rs m)
Y/e March FY13 FY14 FY15 FY16E FY17E
Revenue (Rs m) 435,879 438,437 499,702 578,144 689,169
Growth (%) 22.5 0.6 14.0 15.7 19.2
EBITDA (Rs m) 41,356 52,046 67,125 93,042 113,743
PAT (Rs m) 23,213 28,917 37,108 52,881 71,165
EPS (Rs) 76.8 95.7 122.8 175.1 235.6
Growth (%) 37.8 24.6 28.3 42.5 34.6
Net DPS (Rs) 8.0 12.0 25.0 35.0 45.0
Source: Company Data, PL Research
Profitability & valuation
Y/e March FY13 FY14 FY15 FY16E FY17E
EBITDA margin (%) 9.5 11.9 13.4 16.1 16.5
RoE (%) 13.7 14.6 16.6 20.5 23.1
RoCE (%) 13.4 14.0 16.5 20.6 23.1
EV / sales (x) 2.9 2.9 2.5 2.2 1.8
EV / EBITDA (x) 30.4 24.3 18.7 13.4 11.0
PER (x) 53.9 43.2 33.7 23.6 17.6
P / BV (x) 6.7 6.0 5.3 4.5 3.7
Net dividend yield (%) 0.2 0.3 0.6 0.8 1.1
Source: Company Data, PL Research
Stock Performance
(%) 1M 6M 12M
Absolute (7.0) 12.5 42.0
Relative to Sensex 3.3 26.5 49.3

LilladherPrabhudas Financials
Maruti Suzuki
11/17/2014 36
Income Statement (Rs m)
Y/e March FY13 FY14 FY15 FY16E FY17E
Net Revenue 435,879 438,437 499,702 578,144 689,169
Direct Expenses 325,590 313,488 350,080 390,825 466,912
% of Net Sales 74.7 71.5 70.1 67.6 67.7
Employee Cost 10,696 13,681 16,066 19,118 22,368
% of Net Sales 2.5 3.1 3.2 3.3 3.2
SG&A Expenses 33,700 34,360 37,948 42,205 48,242
% of Net Sales 7.7 7.8 7.6 7.3 7.0
Other Expenses 24,538 24,861 28,483 32,954 37,904
% of Net Sales 5.6 5.7 5.7 5.7 5.5
EBITDA 41,356 52,046 67,125 93,042 113,743
Margin (%) 9.5 11.9 13.4 16.1 16.5
Depreciation 18,612 20,844 24,703 27,752 29,601
PBIT 22,744 31,202 42,422 65,290 84,142
Interest Expenses 1,460 1,416 2,060 1,142 1,072
PBT 28,978 36,585 48,677 72,439 93,638
Total tax 5,988 8,755 11,570 19,559 22,473
Effective Tax rate (%) 20.7 23.9 23.8 27.0 24.0
PAT 23,920 27,830 37,108 52,881 71,165
Extraordinary Gain/(Loss) - - - - -
Adjusted PAT 23,213 28,917 37,108 52,881 71,165
Source: Company Data, PL Research
Balance Sheet (Rs m)
Y/e March FY13 FY14 FY15 FY16E FY17E
Share Capital 1,510 1,510 1,510 1,510 1,510
Reserves & Surplus 184,279 208,270 235,532 277,840 335,411
Shareholder's Fund 185,789 209,780 237,043 279,350 336,922
Preference Share Capital - - - - -
Total Debt 13,892 18,239 1,802 2,802 2,752
Other Liabilities(net) - - - - -
Deferred Tax Liability 4,087 5,866 4,810 4,810 4,810
Total Liabilities 203,768 233,885 243,655 286,962 344,484
Gross Block 198,007 227,018 275,238 315,238 365,238
Less: Depreciation 100,015 119,114 143,817 171,570 201,170
Net Block 97,992 107,904 131,421 143,668 164,068
Capital Work in Progress 19,422 26,214 10,000 15,000 15,000
Cash & Cash Equivalent 78,532 107,477 128,323 156,211 201,618
Total Current Assets 78,684 70,061 65,950 75,588 85,712
Total Current Liabilities 63,112 71,472 86,856 100,434 118,436
Net Current Assets 15,572 (1,412) (20,906) (24,846) (32,724)
Other Assets - - - - -
Total Assets 203,768 233,885 248,655 286,962 344,484
Source: Company Data, PL Research

LilladherPrabhudas Tata Motors
CMP: Rs331 TP: Rs518 Rating: BUY MCap: Rs1,123.8bn
Expectation of improved JLR sales in China in CY16, ramp-up of new models like XE and Discovery Sport in global markets, improved CV demand in India, and attractive valuations render Tata Motors a compelling Buy.
JLR faces a short-term negative outlook due to weakness in China: We are positive on TTMT, given the strong product portfolio at JLR. With the earlier launches like the New Range Rover, New Range Rover Sport and Jaguar F‐Type doing well, volume is expected to be strong. New launches like the XE, the new Discovery Sport and the F‐Pace (likely in Q4FY16) should be able to sustain the momentum. However, until volumes ramp‐up at the local production in China, sales in that geography are likely to trend lower YoY in H1FY16, but should start trending upwards in H2. For JLR, FY16 margins to be lower YoY, as lower China sales and higher marketing spend get factored in. In FY17 however, most of these constraints would be removed and would result in a positive outlook from a medium‐to-long-term perspective.
India PV recovery: New launches in the India PV space can rejuvenate it from the lows of FY14. An improved performance in the standalone operations is likely in FY16. This would arrest the bleeding on the standalone operations.
CV recovery: With the M&HCV volumes already on the move, and a recovery expected in LCVs by 4QFY16, Tata Motors, as the largest CV manufacturer would be a beneficiary of the cyclical upmove. This would help the turnaround in the India operations to get completed in FY17.
Our TP is Rs518: We value JLR to 7x Mar’17E PE at Rs460/share. With M&HCV segment bottoming out, we built in a strong recovery in volumes and margins in FY17E in the India operations. Our TP is Rs518.
11/17/2014 37
Key Financials (Rs m)
Y/e March FY13 FY14 FY15 FY16E FY17E
Revenue (Rs m) 1,888,176 2,328,337 2,627,963 2,754,392 3,202,505
Growth (%) 14.0 23.3 12.9 4.8 16.3
EBITDA (Rs m) 265,689 374,029 439,237 403,301 491,285
PAT (Rs m) 104,953 149,764 159,809 147,034 186,330
EPS (Rs) 32.9 46.5 49.6 43.3 54.9
Growth (%) (16.8) 41.4 6.7 (12.8) 26.7
Net DPS (Rs) 2.0 2.0 0.0 0.0 2.0
Source: Company Data, PL Research
Profitability & valuation
Y/e March FY13 FY14 FY15 FY16E FY17E
EBITDA margin (%) 14.1 16.1 16.7 14.6 15.3
RoE (%) 29.7 29.0 26.2 21.8 21.3
RoCE (%) 16.8 18.0 15.7 12.6 13.5
EV / sales (x) 0.7 0.6 0.5 0.4 0.4
EV / EBITDA (x) 4.8 3.5 3.3 3.0 2.5
PER (x) 10.1 7.1 6.7 7.6 6.0
P / BV (x) 2.8 1.6 1.9 1.4 1.2
Net dividend yield (%) 0.6 0.6 0.0 0.0 0.6
Source: Company Data, PL Research
Stock Performance
(%) 1M 6M 12M
Absolute (15.9) (41.4) (34.4)
Relative to Sensex (5.6) (27.4) (27.1)
LilladherPrabhudas Financials
Tata Motors
11/17/2014 38
Income Statement (Rs m)
Y/e March FY13 FY14 FY15 FY16E FY17E
Net Revenue 1,888,176 2,328,337 2,627,963 2,754,392 3,202,505
Direct Expenses 1,383,635 1,668,698 1,861,996 2,035,476 2,383,682
% of Net Sales 73.3 71.7 70.9 73.9 74.4
Employee Cost 165,841 215,564 255,490 261,667 296,232
% of Net Sales 8.8 9.3 9.7 9.5 9.2
SG&A Expenses 73,012 70,046 71,240 53,949 31,307
% of Net Sales 3.9 3.0 2.7 2.0 1.0
Other Expenses - - - - -
% of Net Sales 0.0 0.0 0.0 0.0 0.0
EBITDA 265,689 374,029 439,237 403,301 491,285
Margin (%) 14.1 16.1 16.7 14.6 15.3
Depreciation 75,693 110,782 133,886 147,275 162,002
PBIT 169,780 237,595 276,599 220,086 284,358
Interest Expenses 35,533 47,338 48,615 36,461 35,550
PBT 136,335 188,690 217,026 193,960 259,661
Total tax 37,710 47,648 76,429 46,126 72,458
Effective Tax rate (%) 27.7 25.3 35.2 23.8 27.9
PAT 98,926 139,910 139,863 147,034 186,330
Extraordinary Gain/(Loss) (6,027) (9,854) (19,946) - -
Adjusted PAT 104,953 149,764 159,809 147,034 186,330
Source: Company Data, PL Research
Balance Sheet (Rs m)
Y/e March FY13 FY14 FY15 FY16E FY17E
Share Capital 6,381 6,438 6,438 6,792 6,792
Reserves & Surplus 369,992 649,597 556,181 777,841 956,305
Shareholder's Fund 376,373 656,035 562,619 784,633 963,097
Preference Share Capital - - - - -
Total Debt 437,755 549,545 692,115 697,115 677,115
Other Liabilities(net) 3,705 4,207 4,333 4,333 4,333
Deferred Tax Liability (23,807) (7,748) (13,900) (13,900) (13,900)
Total Liabilities 794,026 1,202,038 1,245,167 1,472,181 1,630,645
Gross Block 1,031,320 1,329,282 1,582,066 1,932,066 2,257,066
Less: Depreciation 517,227 688,154 744,241 891,516 1,053,518
Net Block 514,094 641,128 837,825 1,040,550 1,203,548
Capital Work in Progress 184,536 332,626 286,401 - -
Cash & Cash Equivalent 298,796 403,985 474,525 767,749 743,357
Total Current Assets 832,193 1,046,103 1,034,685 1,376,388 1,451,964
Total Current Liabilities 865,468 917,596 1,070,091 1,152,094 1,239,204
Net Current Assets (33,274) 128,507 (35,407) 224,294 212,760
Other Assets 41,024 49,788 46,970 46,970 46,970
Total Assets 794,026 1,258,916 1,289,157 1,472,181 1,630,645
Source: Company Data, PL Research

LilladherPrabhudas Indian Oil Corporation
CMP: Rs392 TP: Rs548 Rating: BUY MCap: Rs952.6bn
Strong earnings recovery after a washout FY15: IOCL’s earnings are likely to grow at 61% CAGR over FY15-17E led by 1) higher petrochem earnings 2) healthy marketing margins 3) improved refining profitability and 4) zero subsidy losses. Earnings growth get an optical uplift as FY15 stand alone earnings were hit by inventory losses of Rs 178bn (Rs156bn for refining, Rs22bn in marketing). Also, recent share sale has removed overhang plaguing IOCL’s stock performance where it has underperformed its OMC peers.
Petrochemicals recovery gaining traction: Profitability of IOCL’s petrochemicals segment has improved sharply due to falling naphtha prices, in line with crude prices. Falling feedstock prices and firm product prices meant that integrated Asian crackers’ profitability has improved sharply. IOCL’s Q1FY16 petchem EBIT was Rs13.9bn (Rs2.2bn in Q1FY15);operating profits to expand to Rs68.8bn/Rs71.4bn in FY16/17E against Rs38.4bn in FY15.
Marketing profits to remain firm; benign crude price outlook to cut inventory losses: IOCL, with India’s largest retail outlet network of ~25,000 units, will benefit from expanding marketing margins. We have factored in diesel and petrol margins of Rs2/litre and Rs2.25/litre, respectively, lower than recent margin trends. Also, benign crude price outlook will mean no inventory losses.
Refining margins aided by lower fuel & oil loss to stay healthy: we expect refining margins to stay healthy aided by lower fuel & losses for the domestic refiners. Sharp fall in crude oil prices will help cut F&O losses; OMC refinery F&O stands at 5-9%.Despite 1QFY16 GRMs of US$10.8/bbl, we have conservatively factored in US$4/bbl for FY16/17E.
Valuation & Recommendation: IOCL with a well-diversified business portfolio is attractively valued at current prices. We have a BUY rating with a price target of Rs 548, valued at PER of 10x FY16E. At our price target, it implies core PBV of 1.6xFY16E, with ROE of 16-18%.
11/17/2014 39
Key Financials (Rs m)
Y/e March FY13 FY14 FY15 FY16E FY17E
Revenue (Rs m) 4,617,797 4,883,449 4,495,087 4,072,664 4,294,556
Growth (%) 12.9 5.8 (8.0) (9.4) 5.4
EBITDA (Rs m) 137,676 170,565 105,359 268,236 271,397
PAT (Rs m) 44,490 70,855 49,120 125,580 128,058
EPS (Rs) 18.3 29.2 20.2 51.7 52.7
Growth (%) 5.3 59.3 (30.7) 155.7 2.0
Net DPS (Rs) 0.0 0.0 0.0 0.0 0.0
Source: Company Data, PL Research
Profitability & valuation
Y/e March FY13 FY14 FY15 FY16E FY17E
EBITDA margin (%) 3.0 3.5 2.3 6.6 6.3
RoE (%) 7.2 10.8 7.2 17.2 15.7
RoCE (%) 5.8 6.8 4.9 10.9 10.6
EV / sales (x) 0.4 0.4 0.4 0.4 0.4
EV / EBITDA (x) 13.1 11.4 15.9 6.3 6.0
PER (x) 21.4 13.4 19.4 7.6 7.4
P / BV (x) 1.5 1.4 1.4 1.2 1.1
Net dividend yield (%) 0.0 0.0 0.0 0.0 0.0
Source: Company Data, PL Research
Stock Performance
(%) 1M 6M 12M
Absolute (8.0) 12.5 (2.1)
Relative to Sensex 2.4 26.5 5.2

LilladherPrabhudas Financials
Indian Oil Corporation
11/17/2014 40
Income Statement (Rs m)
Y/e March FY13 FY14 FY15 FY16E FY17E
Net Revenue 4,617,797 4,883,449 4,495,087 4,072,664 4,294,556
Direct Expenses 4,480,121 4,712,884 4,389,727 3,804,428 4,023,159
% of Net Sales 97.0 96.5 97.7 93.4 93.7
Employee Cost - - - - -
% of Net Sales 0.0 0.0 0.0 0.0 0.0
SG&A Expenses - - - - -
% of Net Sales 0.0 0.0 0.0 0.0 0.0
Other Expenses - - - - -
% of Net Sales 0.0 0.0 0.0 0.0 0.0
EBITDA 137,676 170,565 105,359 268,236 271,397
Margin (%) 3.0 3.5 2.3 6.6 6.3
Depreciation 56,915 63,600 52,190 63,623 66,676
PBIT 80,761 106,965 53,169 204,613 204,721
Interest Expenses 70,835 59,079 41,746 51,182 51,099
PBT 45,042 99,778 70,144 182,722 184,835
Total tax 8,770 30,113 21,426 55,305 55,854
Effective Tax rate (%) 19.5 30.2 30.5 30.3 30.2
PAT 44,490 70,855 49,120 125,580 128,058
Extraordinary Gain/(Loss) - - - - -
Adjusted PAT 44,490 70,855 49,120 125,580 128,058
Source: Company Data, PL Research
Balance Sheet (Rs m)
Y/e March FY13 FY14 FY15 FY16E FY17E
Share Capital 24,280 24,280 24,280 24,280 24,280
Reserves & Surplus 606,092 654,851 664,043 747,432 832,128
Shareholder's Fund 630,372 679,130 688,323 771,712 856,408
Preference Share Capital - - - - -
Total Debt 867,142 1,026,241 736,084 751,778 678,631
Other Liabilities(net) 12,618 11,706 10,733 12,570 13,494
Deferred Tax Liability 63,323 64,567 68,356 86,335 104,724
Total Liabilities 1,573,454 1,781,644 1,503,495 1,622,395 1,653,257
Gross Block 1,071,600 1,263,476 1,401,010 1,725,006 1,827,522
Less: Depreciation 410,782 538,472 597,306 548,744 608,470
Net Block 660,818 725,005 803,704 1,176,261 1,219,052
Capital Work in Progress 189,921 380,609 367,180 65,122 47,707
Cash & Cash Equivalent 185,706 195,995 172,898 258,588 279,327
Total Current Assets 1,343,798 1,401,345 1,004,678 1,001,205 1,009,274
Total Current Liabilities 803,549 885,143 833,458 867,019 889,493
Net Current Assets 540,249 516,203 171,219 134,186 119,781
Other Assets 8,959 878 705 - -
Total Assets 1,573,454 1,781,644 1,503,495 1,622,395 1,653,257
Source: Company Data, PL Research

LilladherPrabhudas IndusInd Bank
CMP: Rs840 TP: Rs1,050 Rating: Accumulate MCap: Rs456.7bn
Revenue growth in‐line; margin improvement to follow: IIB delivered 23% YoY growth in core revenues led by uniform growth in core fees and NII. Margins held stable at 3.68%; however, recent capital‐raising, revival in consumer business loan growth and moderation in funding cost will lend buoyancy to NIMs, going ahead. CASA mix improved further led by strong traction in savings deposits (despite recent cut in SA rate). The bank aspires to achieve ~40% CASA mix and ~4% NIM over the next two years as it increases its branch network to 1,200 (from 811 currently), realigns its savings rate (has cut savings rate to 4% for account balances <Rs100,000) and looks forward to a recovery in CV cycle, signs of which are already visible.
Consumer loan growth picks up; share increases to ~42%: Share of consumer loan portfolio increased marginally to 42% led by strong revival in commercial vehicle segment. IIB is still in the process of taking over Rs45bn Gems & Jewellery portfolio that it acquired from RBS, which coupled with its plan to re‐classify its business banking portfolio from corporate to retail segment, will potentially increase share of consumer finance business to ~50%.
Asset quality holding well; asset granularity helping limit RWA growth: IIB reported stable trend in NPL ratios, marginally aided by Rs230m of fully provided bad loan sale to ARC. Coverage ratio, thus, declined by 202bps to 60.6%. Restructured portfolio also increased to 0.63% (0.53% in Q4FY15) while o/s SR portfolio equates to 30bps of total loans. Post recent capital infusion, the bank is well capitalized and has Tier‐I of ~16%, while the regulatory relief on retail loans has further helped IIB in controlling RWA growth. We maintain “Accumulate” with PT of Rs1,050.
11/17/2014 41
Key Financials (Rs m)
Y/e March FY13 FY14 FY15E FY16E FY17E
Net interest income 22,329 28,907 34,203 42,858 53,631
Growth (%) 31.0 29.5 18.3 25.3 25.1
Operating profit 18,395 25,960 30,982 39,127 50,161
PAT 10,612 14,080 17,937 22,446 28,974
EPS (Rs) 21.4 26.9 33.6 40.2 50.5
Growth (%) 24.6 25.4 24.9 19.8 25.7
Net DPS (Rs) 3.0 3.5 3.9 5.4 6.5
Source: Company Data, PL Research
Profitability & valuation
Y/e March FY13 FY14 FY15E FY16E FY17E
NIM (%) 3.5 3.7 3.7 3.7 3.7
RoAE (%) 17.2 16.9 18.2 15.9 15.4
RoAA (%) 1.6 1.8 1.9 1.8 1.9
P / BV (x) 5.9 5.1 4.5 2.8 2.5
P / ABV (x) 6.0 5.2 4.6 2.9 2.5
PE (x) 39.2 31.3 25.0 20.9 16.6
Net dividend yield (%) 0.4 0.4 0.5 0.6 0.8
Source: Company Data, PL Research
Stock Performance
(%) 1M 6M 12M
Absolute 14.0 11.9 72.3
Relative to Sensex 8.1 10.0 60.6

LilladherPrabhudas Financials
IndusInd Bank
11/17/2014 42
Income Statement (Rs m)
Y/e March FY13 FY14 FY15E FY16E FY17E
Int. Earned from Adv. 56,103 66,274 77,169 94,805 114,589
Int. Earned from Invt. 12,825 14,770 16,804 22,000 27,832
Others - - - - -
Total Interest Income 69,832 82,535 96,920 118,049 144,125
Interest expense 47,504 53,628 62,717 75,192 90,494
NII 22,329 28,907 34,203 42,858 53,631
Growth (%) 31.0 29.5 18.3 25.3 25.1
Treasury Income 644 518 3,172 750 750
NTNII 12,985 18,387 20,867 29,539 38,020
Non Interest Income 13,630 18,905 24,039 30,289 38,770
Total Income 83,462 101,441 120,958 148,338 182,894
Growth (%) 31.0 21.5 19.2 22.6 23.3
Operating Expense 17,564 21,853 27,259 34,019 42,240
Operating Profit 18,395 25,960 30,982 39,127 50,161
Growth (%) 34.0 41.1 19.3 26.3 28.2
NPA Provisions 2,196 3,137 3,891 4,779 5,585
Investment Provisions 13 876 - - -
Total Provisions 2,631 4,676 3,891 5,525 6,787
PBT 15,764 21,283 27,092 33,602 43,374
Tax Provisions 5,152 7,203 9,155 11,156 14,400
Effective Tax Rate (%) 32.7 33.8 33.8 33.2 33.2
PAT 10,612 14,080 17,937 22,446 28,974
Growth (%) 32.2 32.7 27.4 25.1 29.1
Source: Company Data, PL Research
Balance Sheet (Rs m)
Y/e March FY13 FY14 FY15E FY16E FY17E
Par Value 10 10 10 10 11
No. of equity shares 523 526 544 574 521
Equity 5,229 5,256 5,435 5,735 5,735
Networth 76,195 90,319 106,445 175,530 200,142
Adj. Networth 74,828 88,479 104,236 172,712 196,652
Deposits 541,167 605,023 741,344 911,853 1,152,582
Growth (%) 27.7 11.8 22.5 23.0 26.4
Low Cost deposits 158,674 196,909 253,540 318,237 411,472
% of total deposits 29.3 32.5 34.2 34.9 35.7
Total Liabilities 733,065 870,259 1,091,160 1,358,500 1,689,391
Net Advances 443,206 551,018 687,882 853,662 1,072,199
Growth (%) 26.4 24.3 24.8 24.1 25.6
Investments 196,542 215,630 248,594 331,782 402,462
Total Assets 733,065 870,259 1,068,254 1,358,500 1,689,391
Source: Company Data, PL Research

LilladherPrabhudas
MID-CAP
9/9/2015 43
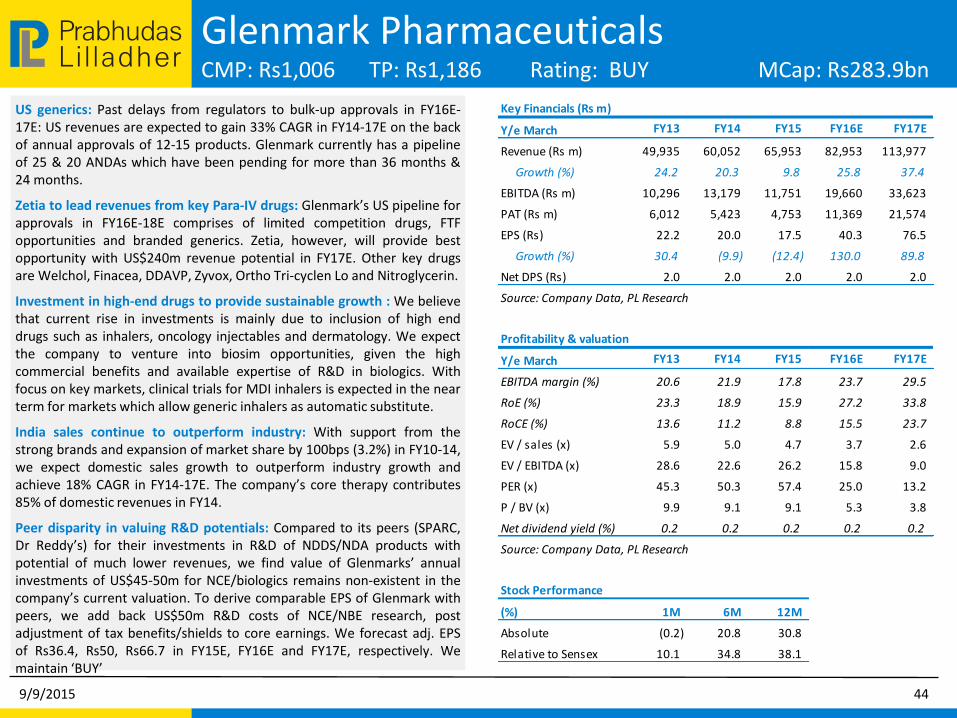
LilladherPrabhudas Glenmark Pharmaceuticals
CMP: Rs1,006 TP: Rs1,186 Rating: BUY MCap: Rs283.9bn
US generics: Past delays from regulators to bulk-up approvals in FY16E-17E: US revenues are expected to gain 33% CAGR in FY14-17E on the back of annual approvals of 12-15 products. Glenmark currently has a pipeline of 25 & 20 ANDAs which have been pending for more than 36 months & 24 months.
Zetia to lead revenues from key Para-IV drugs: Glenmark’s US pipeline for approvals in FY16E-18E comprises of limited competition drugs, FTF opportunities and branded generics. Zetia, however, will provide best opportunity with US$240m revenue potential in FY17E. Other key drugs are Welchol, Finacea, DDAVP, Zyvox, Ortho Tri-cyclen Lo and Nitroglycerin.
Investment in high-end drugs to provide sustainable growth : We believe that current rise in investments is mainly due to inclusion of high end drugs such as inhalers, oncology injectables and dermatology. We expect the company to venture into biosim opportunities, given the high commercial benefits and available expertise of R&D in biologics. With focus on key markets, clinical trials for MDI inhalers is expected in the near term for markets which allow generic inhalers as automatic substitute.
India sales continue to outperform industry: With support from the strong brands and expansion of market share by 100bps (3.2%) in FY10-14, we expect domestic sales growth to outperform industry growth and achieve 18% CAGR in FY14-17E. The company’s core therapy contributes 85% of domestic revenues in FY14.
Peer disparity in valuing R&D potentials: Compared to its peers (SPARC, Dr Reddy’s) for their investments in R&D of NDDS/NDA products with potential of much lower revenues, we find value of Glenmarks’ annual investments of US$45-50m for NCE/biologics remains non-existent in the company’s current valuation. To derive comparable EPS of Glenmark with peers, we add back US$50m R&D costs of NCE/NBE research, post adjustment of tax benefits/shields to core earnings. We forecast adj. EPS of Rs36.4, Rs50, Rs66.7 in FY15E, FY16E and FY17E, respectively. We maintain ‘BUY’
9/9/2015 44
Key Financials (Rs m)
Y/e March FY13 FY14 FY15 FY16E FY17E
Revenue (Rs m) 49,935 60,052 65,953 82,953 113,977
Growth (%) 24.2 20.3 9.8 25.8 37.4
EBITDA (Rs m) 10,296 13,179 11,751 19,660 33,623
PAT (Rs m) 6,012 5,423 4,753 11,369 21,574
EPS (Rs) 22.2 20.0 17.5 40.3 76.5
Growth (%) 30.4 (9.9) (12.4) 130.0 89.8
Net DPS (Rs) 2.0 2.0 2.0 2.0 2.0
Source: Company Data, PL Research
Profitability & valuation
Y/e March FY13 FY14 FY15 FY16E FY17E
EBITDA margin (%) 20.6 21.9 17.8 23.7 29.5
RoE (%) 23.3 18.9 15.9 27.2 33.8
RoCE (%) 13.6 11.2 8.8 15.5 23.7
EV / sales (x) 5.9 5.0 4.7 3.7 2.6
EV / EBITDA (x) 28.6 22.6 26.2 15.8 9.0
PER (x) 45.3 50.3 57.4 25.0 13.2
P / BV (x) 9.9 9.1 9.1 5.3 3.8
Net dividend yield (%) 0.2 0.2 0.2 0.2 0.2
Source: Company Data, PL Research
Stock Performance
(%) 1M 6M 12M
Absolute (0.2) 20.8 30.8
Relative to Sensex 10.1 34.8 38.1

LilladherPrabhudas Financials
Glenmark Pharmaceuticals
9/9/2015 45
Income Statement (Rs m)
Y/e March FY13 FY14 FY15 FY16E FY17E
Net Revenue 49,935 60,052 65,953 82,953 113,977
Direct Expenses 19,563 22,240 23,199 29,034 36,473
% of Net Sales 39.2 37.0 35.2 35.0 32.0
Employee Cost 7,829 10,261 12,024 15,180 18,236
% of Net Sales 15.7 17.1 18.2 18.3 16.0
SG&A Expenses 12,246 14,371 18,978 19,079 25,645
% of Net Sales 24.5 23.9 28.8 23.0 22.5
Other Expenses - - - - -
% of Net Sales 0.0 0.0 0.0 0.0 0.0
EBITDA 10,296 13,179 11,751 19,660 33,623
Margin (%) 20.6 21.9 17.8 23.7 29.5
Depreciation 1,270 2,168 2,600 3,168 3,782
PBIT 9,026 11,011 9,151 16,492 29,841
Interest Expenses 1,600 1,886 1,902 2,081 2,105
PBT 7,534 9,240 7,814 14,889 28,230
Total tax 1,107 1,513 1,190 3,534 6,493
Effective Tax rate (%) 14.7 16.4 15.2 23.7 23.0
PAT 6,012 5,423 4,753 11,369 21,574
Extraordinary Gain/(Loss) - - - - -
Adjusted PAT 6,012 5,423 4,753 11,369 21,574
Source: Company Data, PL Research
Balance Sheet (Rs m)
Y/e March FY13 FY14 FY15 FY16E FY17E
Share Capital 271 271 271 282 282
Reserves & Surplus 27,359 29,562 29,732 53,346 73,826
Shareholder's Fund 27,630 29,833 30,003 53,629 74,108
Preference Share Capital - - - - -
Total Debt 27,649 32,670 42,849 35,272 28,062
Other Liabilities(net) 1,095 654 1,217 1,319 1,360
Deferred Tax Liability (3,803) (5,142) (2,750) (3,048) (3,613)
Total Liabilities 52,571 58,015 71,320 87,172 99,918
Gross Block 32,968 37,786 42,734 48,004 53,274
Less: Depreciation 5,286 7,430 10,029 13,198 16,980
Net Block 27,682 30,357 32,704 34,806 36,294
Capital Work in Progress - - - - -
Cash & Cash Equivalent 6,658 8,544 12,492 9,645 11,147
Total Current Assets 37,268 47,627 53,233 61,015 74,163
Total Current Liabilities 13,568 21,109 20,007 9,458 11,412
Net Current Assets 23,700 26,518 33,225 51,556 62,751
Other Assets 604 602 580 638 701
Total Assets 52,571 58,015 71,320 87,172 99,918
Source: Company Data, PL Research

LilladherPrabhudas Cummins India
CMP: Rs1,055 TP: Rs1,285 Rating: BUY MCap: Rs292.6bn
Technology edge in new CPCB-2 Norms: Central Pollution Control Board (CPCB) has notified CPCB-2 norms for implementation w.e.f July 1, 2014 or Diesel gensets up to 800kw (~1000hp). We expect KKC to benefit most, as stringent norms would lead to increased consolidation, given the technology requirements.
Expecting strong bounce back in domestic markets: Management commented that it is seeing early signs of recovery in the markets led by government spending in sectors like Mining, Construction, Defence etc. They also believe domestic Power gen market has bottomed out and should see recovery from here on. Management has guided for domestic sales growth to be between 10-15% and export sales growth to be 10-15% for FY16. KKC has corrected prices in Q4FY15 to gain back its lost market share over the last few quarters (due to lower price hike by competitors post new CPCB norms). The company has been successful in gaining back market share, especially in the Domestic power gen sales (up 20% QoQ). KKC remains confident of gaining further market share as it has made necessary corrections in pricing and products in line with market requirement. The company is also working on reducing costs to improve margins. In the longer term, KKC expects domestic market to grow in high teens and export market to grow in mid teens. The company remains confident about its long-term growth prospects, with our strong leadership in products, technologies, customer relationships and leadership talent
Outlook and Valuation: The stock is trading at 26.3x FY17E earnings. Cummins continues to be the best franchise in the Capital goods space. Outlook for Cummins continues to be positive, given the strong ramp-up in exports and likely improvement in market position, post changes in emission norms. Low capitalization utilization of 50-60% also leaves upside surprise on margin once volumes improve.
9/9/2015 46
Key Financials (Rs m)
Y/e March FY17E FY14 FY15 FY16E FY17E
Revenue (Rs m) 45,894 39,786 44,058 51,358 60,733
Growth (%) 11.5 (13.3) 10.7 16.6 18.3
EBITDA (Rs m) 8,349 6,986 7,351 8,988 11,236
PAT (Rs m) 6,846 5,676 7,044 8,572 11,126
EPS (Rs) 24.7 20.5 25.4 30.9 40.1
Growth (%) 26.8 (17.1) 24.1 21.7 29.8
Net DPS (Rs) 13.0 13.0 14.0 13.6 13.6
Source: Company Data, PL Research
Profitability & valuation
Y/e March FY17E FY14 FY15 FY16E FY17E
EBITDA margin (%) 18.2 17.6 16.7 17.5 18.5
RoE (%) 30.9 22.9 25.7 27.4 30.3
RoCE (%) 30.8 23.0 25.8 27.3 30.0
EV / sales (x) 6.3 7.3 6.6 5.7 4.8
EV / EBITDA (x) 34.8 41.8 39.7 32.5 25.8
PER (x) 42.7 51.5 41.5 34.1 26.3
P / BV (x) 12.3 11.4 10.0 8.8 7.3
Net dividend yield (%) 1.2 1.2 1.3 1.3 1.3
Source: Company Data, PL Research
Stock Performance
(%) 1M 6M 12M
Absolute (11.1) 16.4 49.8
Relative to Sensex (0.8) 30.4 57.1

LilladherPrabhudas Financials
Cummins India
9/9/2015 47
Income Statement (Rs m)
Y/e March FY17E FY14 FY15 FY16E FY17E
Net Revenue 45,894 39,786 44,058 51,358 60,733
Direct Expenses 28,874 24,241 27,225 31,842 37,290
% of Net Sales 62.9 60.9 61.8 62.0 61.4
Employee Cost 3,386 3,396 3,936 4,365 5,162
% of Net Sales 7.4 8.5 8.9 8.5 8.5
SG&A Expenses - - - - -
% of Net Sales 0.0 0.0 0.0 0.0 0.0
Other Expenses 5,285 5,162 5,547 6,163 7,045
% of Net Sales 11.5 13.0 12.6 12.0 11.6
EBITDA 8,349 6,986 7,351 8,988 11,236
Margin (%) 18.2 17.6 16.7 17.5 18.5
Depreciation 473 528 797 806 934
PBIT 7,876 6,459 6,553 8,181 10,301
Interest Expenses 46 42 45 - -
PBT 10,492 8,194 9,374 10,454 13,568
Total tax 2,872 2,175 1,515 1,882 2,442
Effective Tax rate (%) 27.4 26.5 16.2 18.0 18.0
PAT 6,846 6,019 7,859 8,572 11,126
Extraordinary Gain/(Loss) - 343 815 - -
Adjusted PAT 6,846 5,676 7,044 8,572 11,126
Source: Company Data, PL Research
Balance Sheet (Rs m)
Y/e March FY17E FY14 FY15 FY16E FY17E
Share Capital 554 554 554 554 554
Reserves & Surplus 23,313 25,097 28,311 32,550 39,346
Shareholder's Fund 23,867 25,652 29,172 33,367 40,164
Preference Share Capital - - - - -
Total Debt 150 - - 200 400
Other Liabilities(net) - - - - -
Deferred Tax Liability - - - - -
Total Liabilities 24,018 25,652 29,172 33,567 40,564
Gross Block 11,703 16,203 21,203 25,203 29,203
Less: Depreciation 5,526 6,054 6,851 7,658 8,592
Net Block 6,177 10,149 14,352 17,545 20,611
Capital Work in Progress 1,208 - - - -
Cash & Cash Equivalent 8,579 5,818 5,449 4,545 6,165
Total Current Assets 23,035 22,625 24,521 25,884 33,304
Total Current Liabilities 12,350 11,611 13,721 12,882 15,371
Net Current Assets 10,685 11,014 10,800 13,002 17,933
Other Assets (328) (465) (631) (631) (631)
Total Assets 24,017 25,652 29,172 33,567 40,564
Source: Company Data, PL Research

LilladherPrabhudas Motherson Sumi Systems
CMP: Rs281 TP: Rs400 Rating: BUY MCap: Rs372.1bn
We are positive on MSS’ prospects from a long‐term perspective. Their target for FY20 indicates a revenue CAGR expectation of 26.8% in addition positives from new order pipeline, debt reduction and improvement in subsidiary profitability We have a ‘BUY’ rating with a price target of Rs400.
Healthy order position: Continuous inflow of new orders from European OEMs will help MSS to continuously grow its overseas sales. It is also a recognised partner for many key global OEMs, which helps in procuring new orders.
Realisable targets set by company: MSS’ target for FY20 indicates a revenue CAGR expectation of 26.8% in addition to the standard RoCE expectation of 40% and a dividend payout ratio of 40%. Given the company’s track record in terms of accomplishing its published targets, revenue targets seem plausible. However, nature of possible acquisitions, their profitability and the time required for their turnaround would eventually decide whether the profitability target is met.
Multiple growth drivers: Growth drivers for MSS include: an increase in global market share of existing product portfolio. potential acquisitions if these come along with customer recommendations. An increase in content per car, addition of more business verticals and technology and entry into alliances with developmental partners if required, business with new customers and in newer geographies, cross‐selling across the customer portfolio, along with in‐sourcing opportunities.
Our TP is Rs400: New order pipeline for MSS remains strong. Debt reduction continues and subsidiary profitability is on an upswing. We maintain ‘BUY’ with a price target of Rs400. At our PT, MSS would trade a PE of 25xFY17e, while at CMP, it trades at 18.9xFY17e.
9/9/2015 48
Key Financials (Rs m)
Y/e March FY13 FY14 FY15 FY16E FY17E
Revenue (Rs m) 253,124 304,279 350,319 405,265 487,201
Growth (%) 71.3 20.2 15.1 15.7 20.2
EBITDA (Rs m) 16,394 25,851 32,140 40,352 55,597
PAT (Rs m) 5,535 8,910 9,805 13,351 21,152
EPS (Rs) 9.4 10.1 11.1 10.1 16.0
Growth (%) 4.9 NA NA (9.2) 58.4
Net DPS (Rs) 2.0 2.5 3.0 3.5 4.0
Source: Company Data, PL Research
Profitability & valuation
Y/e March FY13 FY14 FY15 FY16E FY17E
EBITDA margin (%) 6.5 8.5 9.2 10.0 11.4
RoE (%) 26.6 34.0 31.2 35.7 43.1
RoCE (%) 11.5 19.1 19.1 21.3 29.3
EV / sales (x) 0.8 0.9 0.8 1.0 0.8
EV / EBITDA (x) 12.7 11.1 8.8 10.1 7.3
PER (x) 29.9 NA 25.3 27.9 17.6
P / BV (x) 7.2 8.4 7.5 8.9 6.6
Net dividend yield (%) 0.7 0.9 1.1 1.2 1.4
Source: Company Data, PL Research
Stock Performance
(%) 1M 6M 12M
Absolute (19.3) (12.6) 9.5
Relative to Sensex (9.0) 1.4 16.8

LilladherPrabhudas Financials
Motherson Sumi Systems
9/9/2015 49
Income Statement (Rs m)
Y/e March FY13 FY14 FY15 FY16E FY17E
Net Revenue 253,124 304,279 350,319 405,265 487,201
Direct Expenses 179,043 210,112 235,582 273,728 321,984
% of Net Sales 70.7 69.1 67.2 67.5 66.1
Employee Cost 42,827 51,065 63,653 68,895 82,824
% of Net Sales 16.9 16.8 18.2 17.0 17.0
SG&A Expenses 14,860 17,251 18,944 22,290 26,796
% of Net Sales 5.9 5.7 5.4 5.5 5.5
Other Expenses - - - - -
% of Net Sales 0.0 0.0 0.0 0.0 0.0
EBITDA 16,394 25,851 32,140 40,352 55,597
Margin (%) 6.5 8.5 9.2 10.0 11.4
Depreciation 7,145 8,172 9,206 10,357 11,393
PBIT 9,249 17,680 22,934 29,995 44,204
Interest Expenses 4,122 4,825 5,147 3,257 3,094
PBT 8,342 15,961 18,171 26,941 41,338
Total tax 3,835 4,994 5,256 7,813 11,575
Effective Tax rate (%) 46.0 31.3 28.9 29.0 28.0
PAT 4,445 7,650 8,625 13,351 21,152
Extraordinary Gain/(Loss) (1,090) (1,260) (1,180) - -
Adjusted PAT 5,535 8,910 9,805 13,351 21,152
Source: Company Data, PL Research
Balance Sheet (Rs m)
Y/e March FY13 FY14 FY15 FY16E FY17E
Share Capital 588 882 882 1,323 1,323
Reserves & Surplus 22,302 28,711 32,356 40,290 55,250
Shareholder's Fund 22,890 29,592 33,238 41,612 56,573
Preference Share Capital - - - - -
Total Debt 49,039 48,397 54,105 51,105 48,105
Other Liabilities(net) 4,025 7,896 10,143 10,143 10,143
Deferred Tax Liability 560 496 (451) (351) (251)
Total Liabilities 76,513 86,382 97,034 102,508 114,569
Gross Block 107,425 126,336 148,351 164,351 184,351
Less: Depreciation 54,655 67,147 77,504 88,897 101,429
Net Block 52,770 59,189 70,847 75,455 82,922
Capital Work in Progress 3,859 6,471 - - -
Cash & Cash Equivalent 6,661 9,810 19,569 17,107 16,881
Total Current Assets 70,075 86,030 102,303 114,485 134,209
Total Current Liabilities 50,907 66,057 76,766 88,081 103,212
Net Current Assets 19,167 19,973 25,537 26,404 30,997
Other Assets - - - - -
Total Assets 76,513 86,382 97,034 102,508 114,569
Source: Company Data, PL Research

LilladherPrabhudas Aurobindo Pharma
CMP: Rs727 TP: Rs761 Rating: Accumulate MCap: Rs424.4bn
Diversified portfolio strategy to be a winner: The strategy to leverage on its manufacturing and strong product filings capability is likely to result in strong earnings growth. Unlocking Injectable Portfolio with launches of more products from Unit IV would accelerate growth and margin expansion in US. We believe that main drivers for Aurobindo are a) Business mix improvement with more formulation sales, b) Scaling up of Aurolife’s control substances sales c) Scale‐up of injectable business and d) Higher operating cash flow to reduce debt.
US remains mainstay for growth: Formulation growth will be driven by injectables and orals. It has filed 22 products from Unit IV (NPNC injectable/ophthalmic) and expects approval of 3-5 products to start with. It is targeting US$36m sales from this unit in FY15E. The company plans to file 100 products from this facility, addressing brand size of US$40bn and hopes to achieve sales of US$200-300m in 2-3 years. High value para-IV opportunities especially in injectables would provide boost for growth, margin and operating cash flow in FY15E-17E.
Maintainable margins revised: Management revised maintainable operating margins to 22-24% in FY15E-16E. Core EU formulation sales of US$100m are from six key markets – UK, Netherlands, Italy, Spain, Germany and Portugal. It expects to turn profitable in EU in FY16E, while FY15E is earmarked for operational break-even. The company’s EU acquisition include additional sales of US$430m in FY15E, while we expect improvement in EBITDA margin in FY16E.
Strong candidate for valuation re-rating: The stock currently trades at PER of 21.2x and 17.0x of FY16E and FY17E, which is at a significant (20%) discount to mid-cap peers. Better cash flow from launches of high margin and limited competition drugs to further reduce gearing ratio and narrow valuation differential with peers in the industry. Our SOTP valuation of Aurobindo’s set a near term price target at Rs761. We maintain ‘ACCUMULATE’.
9/9/2015 50
Key Financials (Rs m)
Y/e March FY13 FY14 FY15 FY16E FY17E
Revenue (Rs m) 58,553 80,998 120,432 139,067 159,481
Growth (%) 26.5 38.3 48.7 15.5 14.7
EBITDA (Rs m) 8,891 21,328 24,863 30,595 38,275
PAT (Rs m) 4,573 13,759 16,354 20,057 25,024
EPS (Rs) 15.7 47.2 56.0 34.3 42.9
Growth (%) 8.6 200.6 18.6 (38.7) 24.8
Net DPS (Rs) 1.5 3.0 4.5 4.5 4.5
Source: Company Data, PL Research
Profitability & valuation
Y/e March FY13 FY14 FY15 FY16E FY17E
EBITDA margin (%) 15.2 26.3 20.6 22.0 24.0
RoE (%) 18.5 43.3 36.7 34.1 32.6
RoCE (%) 9.4 21.2 20.3 21.3 22.9
EV / sales (x) 4.2 3.1 2.0 3.3 2.8
EV / EBITDA (x) 27.4 11.6 9.9 14.8 11.6
PER (x) 46.3 15.4 13.0 21.2 17.0
P / BV (x) 8.1 5.6 4.1 6.4 4.9
Net dividend yield (%) 0.2 0.4 0.6 0.6 0.6
Source: Company Data, PL Research
Stock Performance
(%) 1M 6M 12M
Absolute (6.0) 32.9 72.0
Relative to Sensex 4.4 47.0 79.3

LilladherPrabhudas Financials
Aurobindo Pharma
9/9/2015 51
Income Statement (Rs m)
Y/e March FY13 FY14 FY15 FY16E FY17E
Net Revenue 58,553 80,998 120,432 139,067 159,481
Direct Expenses 36,242 43,234 64,691 74,401 82,133
% of Net Sales 61.9 53.4 53.7 53.5 51.5
Employee Cost 6,633 8,319 13,023 15,993 18,340
% of Net Sales 11.3 10.3 10.8 11.5 11.5
SG&A Expenses 6,788 8,117 17,856 18,079 20,733
% of Net Sales 11.6 10.0 14.8 13.0 13.0
Other Expenses - - - - -
% of Net Sales 0.0 0.0 0.0 0.0 0.0
EBITDA 8,891 21,328 24,863 30,595 38,275
Margin (%) 15.2 26.3 20.6 22.0 24.0
Depreciation 2,487 3,125 3,326 4,693 4,820
PBIT 6,403 18,203 21,537 25,902 33,456
Interest Expenses 1,313 1,079 843 862 897
PBT 5,376 17,356 22,275 26,683 34,218
Total tax 827 3,635 5,966 6,671 9,239
Effective Tax rate (%) 15.4 20.9 26.8 25.0 27.0
PAT 2,939 11,729 15,758 20,057 25,024
Extraordinary Gain/(Loss) (1,634) (2,031) (596) - -
Adjusted PAT 4,573 13,759 16,354 20,057 25,024
Source: Company Data, PL Research
Balance Sheet (Rs m)
Y/e March FY13 FY14 FY15 FY16E FY17E
Share Capital 291 291 292 584 584
Reserves & Surplus 25,766 37,210 51,267 65,496 86,646
Shareholder's Fund 26,058 37,501 51,559 66,080 87,230
Preference Share Capital - - - - -
Total Debt 34,445 37,783 38,879 36,240 33,616
Other Liabilities(net) 110 257 258 213 168
Deferred Tax Liability 680 2,054 2,058 1,257 573
Total Liabilities 61,292 77,595 92,754 103,791 121,587
Gross Block 37,635 41,830 56,367 64,867 73,367
Less: Depreciation 11,246 14,613 17,939 22,632 27,452
Net Block 26,389 27,217 38,428 42,235 45,915
Capital Work in Progress 2,185 3,097 2,826 2,185 2,185
Cash & Cash Equivalent 2,307 1,984 4,889 7,474 12,455
Total Current Assets 41,367 56,312 82,791 96,439 112,816
Total Current Liabilities 11,436 17,303 36,343 43,062 46,449
Net Current Assets 29,931 39,009 46,448 53,377 66,367
Other Assets 2,565 8,074 4,855 5,796 6,922
Total Assets 61,292 77,595 92,754 103,791 121,587
Source: Company Data, PL Research

LilladherPrabhudas MindTree
CMP: Rs1,319 TP: Rs1,500 Rating: BUY MCap: Rs110.4bn
MindTree has strengthened its analytical capabilities with the recent acquisition of Bluefin and Relational. We expect MTCL to deliver USD revenue growth in high-teens for FY16 including acquisition.
Beat at Revenue and Earnings: MTCL Q1FY16 revenue grew by 6.9% QoQ to Rs9,816m (PLe: Rs9,745m, Cons: Rs9,715m) in INR terms and grew by 4.8% QoQ in USD terms to $154.9m (PLe: US$153.7m, Cons.: US$153.2m). Despite currency depreciation, EBITDA margins contracted by 184bps QoQ to 17.6% (PLe: 18.2% Cons: 18.8%) due to visa cost, M&A integration, and realization dip, in-line with management guidance. EPS declined by 7.2% QoQ to Rs16.5 (PLe: Rs16.1, Cons: Rs16.1), due to Forex gain.
Strengthening analytical capabilities through inorganic booster: Mindtree strengthened its analytical capabilities with acquisition of Bluefin Solution (SAP HANA) and Relational Solutions (CPG analytics) in all cash transaction of £42.3m (Upfront: £34m, Over three years: $8.3mn) and $10m (Upfront: $7m, Over two years: $3mn) respectively with EV/Sales of 1.5x and 3.1x respectively. Bluefin will be margin dilutive whereas Relational will be margin accretive. However, both the deals are expected to be EPS accretive. We see these acquisitions to strengthen capabilities and client list providing cross-selling opportunities.
FY16 outlook positive – On-track to beat NASSCOM: Management was confident of beating NASSCOM guidance (12-14%) excluding Q1FY16 acquisition. Deal closure in Q1FY16 is the highest ever. Hence, MTCL expects Q2FY16 growth to be stronger than Q1FY16 (organically).
Margin pressure manageable: Q2FY16 margin will be impacted by wage hike and fresher hiring, but it will be offset by non-accrual of visa cost. However, M&A integration will have an impact on Q2FY16 margin.
Valuation & Recommendation – BUY, with revised TP Rs1,500: We expect FY16 revenue momentum to accelerate with soft EBIT margin due to investment, but industry leading growth would continue to justify valuation premium. The stock is currently trading at 15.7x FY17E EPS of Rs17
9/9/2015 52
Key Financials (Rs m)
Y/e March FY13 FY14 FY15 FY16E FY17E
Revenue (Rs m) 23,618 30,316 35,619 44,266 52,523
Growth (%) 23.3 28.4 17.5 24.3 18.7
EBITDA (Rs m) 4,864 6,104 7,096 7,805 8,919
PAT (Rs m) 3,393 4,512 5,367 6,115 7,017
EPS (Rs) 40.5 53.9 64.1 73.1 83.8
Growth (%) (23.7) 33.0 18.9 13.9 14.8
Net DPS (Rs) 12.0 25.0 10.0 11.0 13.0
Source: Company Data, PL Research
Profitability & valuation
Y/e March FY13 FY14 FY15 FY16E FY17E
EBITDA margin (%) 20.6 20.1 19.9 17.6 17.0
RoE (%) 29.9 30.5 29.4 26.9 24.8
RoCE (%) 28.9 30.1 28.9 26.5 24.5
EV / sales (x) 4.6 3.6 3.0 2.4 1.9
EV / EBITDA (x) 22.5 17.9 15.0 13.3 11.2
PER (x) 32.5 24.5 20.6 18.1 15.7
P / BV (x) 8.4 6.7 5.5 4.4 3.5
Net dividend yield (%) 0.9 1.9 0.8 0.8 1.0
Source: Company Data, PL Research
Stock Performance
(%) 1M 6M 12M
Absolute (7.3) (11.2) 39.6
Relative to Sensex (13.9) (12.4) 28.3

LilladherPrabhudas Operating Metrics
MindTree
9/9/2015 53
Y/e March FY12 FY13 FY14 FY15E FY16E FY17E
Volume (persons months) 80,671 85,803 97,203 110,209 131,590 156,592
Realization (US$ / Hr) 28 29 26 30 30 30
Currency (USDINR) 48 54 60 61 64 63
SW Devp. Cost (% of Sales) 64.0 60.4 58.8 58.2 62.0 62.7
SG&A (% of sales) 20.7 19.0 21.1 21.8 20.3 20.3
Revenue (US$ m) 403 436 502 584 697 834
EBITDA Margin Expansion/(Erosion) (bps) 352 530 (46) (21) (229) (65)
Tax Rate (%) 16.4 20.0 22.0 22.4 20.1 20.3
Source: Company Data, PL Research

LilladherPrabhudas Financials
MindTree
9/9/2015 54
Income Statement (Rs m)
Y/e March FY13 FY14 FY15 FY16E FY17E
Net Revenue 23,618 30,316 35,619 44,266 52,523
Direct Expenses 14,274 17,820 20,744 27,465 32,917
% of Net Sales 60.4 58.8 58.2 62.0 62.7
Employee Cost - - - - -
% of Net Sales 0.0 0.0 0.0 0.0 0.0
SG&A Expenses 4,480 6,392 7,779 8,997 10,687
% of Net Sales 19.0 21.1 21.8 20.3 20.3
Other Expenses - - - - -
% of Net Sales 0.0 0.0 0.0 0.0 0.0
EBITDA 4,864 6,104 7,096 7,805 8,919
Margin (%) 20.6 20.1 19.9 17.6 17.0
Depreciation 624 809 1,018 1,340 1,523
PBIT 4,240 5,295 6,078 6,465 7,397
Interest Expenses 10 4 1 6 5
PBT 4,240 5,787 6,912 7,656 8,798
Total tax 847 1,275 1,545 1,541 1,782
Effective Tax rate (%) 20.0 22.0 22.4 20.1 20.3
PAT 3,393 4,512 5,367 6,115 7,017
Extraordinary Gain/(Loss) - - - - -
Adjusted PAT 3,393 4,512 5,367 6,115 7,017
Source: Company Data, PL Research
Balance Sheet (Rs m)
Y/e March FY13 FY14 FY15 FY16E FY17E
Share Capital 837 837 837 837 837
Reserves & Surplus 12,300 15,568 19,287 24,481 30,410
Shareholder's Fund 13,137 16,405 20,128 25,322 31,251
Preference Share Capital - - - - -
Total Debt 249 27 23 23 23
Other Liabilities(net) 57 168 334 334 334
Deferred Tax Liability - - - - -
Total Liabilities 13,443 16,600 20,485 25,679 31,608
Gross Block 6,407 7,846 9,881 11,165 12,688
Less: Depreciation 3,818 4,410 5,248 6,588 8,110
Net Block 2,589 3,436 4,633 4,577 4,578
Capital Work in Progress 571 496 354 354 354
Cash & Cash Equivalent 5,509 6,519 9,114 11,777 16,165
Total Current Assets 7,470 9,528 13,183 19,161 26,355
Total Current Liabilities 3,467 4,394 6,064 6,791 8,058
Net Current Assets 4,003 5,134 7,119 12,369 18,297
Other Assets 2,023 2,199 3,028 3,028 3,028
Total Assets 13,443 16,600 20,485 25,679 31,608
Source: Company Data, PL Research
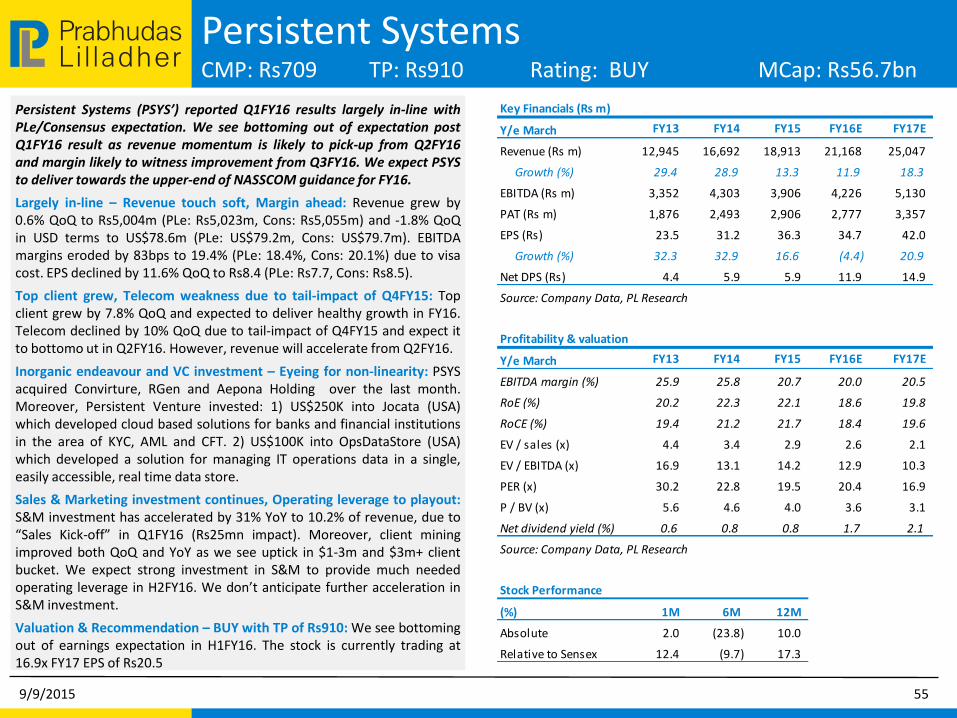
LilladherPrabhudas Persistent Systems
CMP: Rs709 TP: Rs910 Rating: BUY MCap: Rs56.7bn
Persistent Systems (PSYS’) reported Q1FY16 results largely in-line with PLe/Consensus expectation. We see bottoming out of expectation post Q1FY16 result as revenue momentum is likely to pick-up from Q2FY16 and margin likely to witness improvement from Q3FY16. We expect PSYS to deliver towards the upper-end of NASSCOM guidance for FY16.
Largely in-line – Revenue touch soft, Margin ahead: Revenue grew by 0.6% QoQ to Rs5,004m (PLe: Rs5,023m, Cons: Rs5,055m) and -1.8% QoQ in USD terms to US$78.6m (PLe: US$79.2m, Cons: US$79.7m). EBITDA margins eroded by 83bps to 19.4% (PLe: 18.4%, Cons: 20.1%) due to visa cost. EPS declined by 11.6% QoQ to Rs8.4 (PLe: Rs7.7, Cons: Rs8.5).
Top client grew, Telecom weakness due to tail-impact of Q4FY15: Top client grew by 7.8% QoQ and expected to deliver healthy growth in FY16. Telecom declined by 10% QoQ due to tail-impact of Q4FY15 and expect it to bottomo ut in Q2FY16. However, revenue will accelerate from Q2FY16.
Inorganic endeavour and VC investment – Eyeing for non-linearity: PSYS acquired Convirture, RGen and Aepona Holding over the last month. Moreover, Persistent Venture invested: 1) US$250K into Jocata (USA) which developed cloud based solutions for banks and financial institutions in the area of KYC, AML and CFT. 2) US$100K into OpsDataStore (USA) which developed a solution for managing IT operations data in a single, easily accessible, real time data store.
Sales & Marketing investment continues, Operating leverage to playout: S&M investment has accelerated by 31% YoY to 10.2% of revenue, due to “Sales Kick-off” in Q1FY16 (Rs25mn impact). Moreover, client mining improved both QoQ and YoY as we see uptick in $1-3m and $3m+ client bucket. We expect strong investment in S&M to provide much needed operating leverage in H2FY16. We don’t anticipate further acceleration in S&M investment.
Valuation & Recommendation – BUY with TP of Rs910: We see bottoming out of earnings expectation in H1FY16. The stock is currently trading at 16.9x FY17 EPS of Rs20.5
9/9/2015 55
Key Financials (Rs m)
Y/e March FY13 FY14 FY15 FY16E FY17E
Revenue (Rs m) 12,945 16,692 18,913 21,168 25,047
Growth (%) 29.4 28.9 13.3 11.9 18.3
EBITDA (Rs m) 3,352 4,303 3,906 4,226 5,130
PAT (Rs m) 1,876 2,493 2,906 2,777 3,357
EPS (Rs) 23.5 31.2 36.3 34.7 42.0
Growth (%) 32.3 32.9 16.6 (4.4) 20.9
Net DPS (Rs) 4.4 5.9 5.9 11.9 14.9
Source: Company Data, PL Research
Profitability & valuation
Y/e March FY13 FY14 FY15 FY16E FY17E
EBITDA margin (%) 25.9 25.8 20.7 20.0 20.5
RoE (%) 20.2 22.3 22.1 18.6 19.8
RoCE (%) 19.4 21.2 21.7 18.4 19.6
EV / sales (x) 4.4 3.4 2.9 2.6 2.1
EV / EBITDA (x) 16.9 13.1 14.2 12.9 10.3
PER (x) 30.2 22.8 19.5 20.4 16.9
P / BV (x) 5.6 4.6 4.0 3.6 3.1
Net dividend yield (%) 0.6 0.8 0.8 1.7 2.1
Source: Company Data, PL Research
Stock Performance
(%) 1M 6M 12M
Absolute 2.0 (23.8) 10.0
Relative to Sensex 12.4 (9.7) 17.3

LilladherPrabhudas Financials
Persistent Systems
9/9/2015 56
Income Statement (Rs m)
Y/e March FY13 FY14 FY15 FY16E FY17E
Net Revenue 12,945 16,692 18,913 21,168 25,047
Direct Expenses - - - - -
% of Net Sales 0.0 0.0 0.0 0.0 0.0
Employee Cost 7,311 9,517 11,317 12,943 15,363
% of Net Sales 56.5 57.0 59.8 61.1 61.3
SG&A Expenses 2,283 2,872 3,690 4,000 4,554
% of Net Sales 17.6 17.2 19.5 18.9 18.2
Other Expenses - - - - -
% of Net Sales 0.0 0.0 0.0 0.0 0.0
EBITDA 3,352 4,303 3,906 4,226 5,130
Margin (%) 25.9 25.8 20.7 20.0 20.5
Depreciation 783 1,026 939 1,118 1,205
PBIT 2,569 3,277 2,967 3,108 3,926
Interest Expenses - - - - -
PBT 2,630 3,427 3,900 3,753 4,536
Total tax 754 934 993 976 1,179
Effective Tax rate (%) 28.7 27.3 25.5 26.0 26.0
PAT 1,876 2,493 2,906 2,777 3,357
Extraordinary Gain/(Loss) - - - - -
Adjusted PAT 1,876 2,493 2,906 2,777 3,357
Source: Company Data, PL Research
Balance Sheet (Rs m)
Y/e March FY13 FY14 FY15 FY16E FY17E
Share Capital 800 800 800 800 800
Reserves & Surplus 9,383 11,423 13,255 15,081 17,248
Shareholder's Fund 10,183 12,223 14,055 15,881 18,048
Preference Share Capital - - - - -
Total Debt 653 426 142 142 142
Other Liabilities(net) - - - - -
Deferred Tax Liability - - - - -
Total Liabilities 10,836 12,649 14,197 16,023 18,190
Gross Block 6,951 8,523 9,384 9,725 10,476
Less: Depreciation 3,449 4,468 5,331 6,568 7,773
Net Block 3,502 4,054 4,053 3,157 2,703
Capital Work in Progress 1,174 307 40 40 40
Cash & Cash Equivalent 3,850 5,851 8,152 9,034 10,890
Total Current Assets 3,852 5,297 6,454 8,805 11,777
Total Current Liabilities 1,894 2,785 3,549 3,179 3,529
Net Current Assets 1,959 2,512 2,906 5,627 8,248
Other Assets 912 880 464 464 464
Total Assets 10,836 12,649 14,197 16,023 18,190
Source: Company Data, PL Research

LilladherPrabhudas Jubilant Life Sciences
CMP: Rs306 TP: Rs578 Rating: BUY MCap: Rs48.7bn
Overcoming strong headwinds across business verticals in Pharma and Chemical segments, Jubilant Life (JOL) is set to achieve turnaround on the back of CMO, Radiopharma and Symtet. The company’s Nutritional products and Radiopharma sales are expected to gain further momentum with price rise and approvals in Rubi-Fill and Magnevist in FY16E-17E. With price rise in value-added products of Pyridine, JOL invests in pyridine consuming front-end products which will benefit in better realizations in global markets including China.
While JOL’s revenues are likely to improve at 13% CAGR, we estimate EBITDA to grow at 60% CAGR in FY15-17E due to a) rise in CMO profitability, b) break-even in Symtet, c) higher realisation in Radio Pharma and d) no further recurrence of remediation costs (as it was Rs1.05bn in FY15). With achievement of milestones in key business verticals, we believe the high discount of JOL valuation vis-a-vis peers will be narrowed down and gradually re-rated to its normalised 1-yr forward PE 12x-14x by FY17 from the current PE 6x-8x. JOL trades at PE 9.0x and 6.5x of FY16E and FY17E, respectively.
We estimate EBITDA margin of 21% and 22.2% in FY16E and FY17E, respectively, though the company’s average EBITDA margin is at 20-23% with its normalised business in Pharma and Chemical (LSI) business.
Normalised PAT to grow at 53% CAGR in FY15-17E, respectively, with assumptions of 25% effective tax rate. Higher probability of profit in subsidiary with previous operating losses to provide upside potentials to our estimates.
Maintain JOL’s guidance of annual capex of Rs4-4.5bn in FY16E-17E. ROE and ROCE to grow to 22% and 15% in FY17 from (0.4)% and 3.5% in FY15, respectively.
9/9/2015 57
Key Financials (Rs m)
Y/e March FY13 FY14 FY15 FY16E FY17E
Revenue (Rs m) 51,128 57,216 57,761 65,443 73,547
Growth (%) 20.2 11.9 1.0 13.3 12.4
EBITDA (Rs m) 10,028 9,259 6,392 13,743 16,327
PAT (Rs m) 3,449 3,235 (97) 5,417 7,532
EPS (Rs) 21.6 20.9 (0.6) 34.0 47.3
Growth (%) (5.1) (3.2) NA NA 39.0
Net DPS (Rs) 3.0 3.0 3.0 3.0 3.0
Source: Company Data, PL Research
Profitability & valuation
Y/e March FY13 FY14 FY15 FY16E FY17E
EBITDA margin (%) 19.6 16.2 11.1 21.0 22.2
RoE (%) 14.6 12.7 (0.4) 19.6 21.9
RoCE (%) 9.0 8.1 3.5 12.2 14.6
EV / sales (x) 1.7 1.5 1.5 1.3 1.0
EV / EBITDA (x) 8.7 9.3 13.6 6.0 4.6
PER (x) 14.1 14.6 NA 9.0 6.5
P / BV (x) 2.0 1.8 2.0 1.6 1.3
Net dividend yield (%) 1.0 1.0 1.0 1.0 1.0
Source: Company Data, PL Research
Stock Performance
(%) 1M 6M 12M
Absolute 6.4 96.8 76.0
Relative to Sensex 16.7 110.8 83.3

LilladherPrabhudas Financials
Jubilant Life Sciences
9/9/2015 58
Income Statement (Rs m)
Y/e March FY13 FY14 FY15 FY16E FY17E
Net Revenue 51,128 57,216 57,761 65,443 73,547
Direct Expenses 27,451 32,107 34,919 33,965 37,656
% of Net Sales 53.7 56.1 60.5 51.9 51.2
Employee Cost 9,626 11,052 10,903 12,041 13,238
% of Net Sales 18.8 19.3 18.9 18.4 18.0
SG&A Expenses 4,024 4,798 5,548 5,694 6,325
% of Net Sales 7.9 8.4 9.6 8.7 8.6
Other Expenses - - - - -
% of Net Sales 0.0 0.0 0.0 0.0 0.0
EBITDA 10,028 9,259 6,392 13,743 16,327
Margin (%) 19.6 16.2 11.1 21.0 22.2
Depreciation 2,538 2,812 2,880 3,277 3,527
PBIT 7,490 6,447 3,512 10,466 12,801
Interest Expenses 2,987 3,237 3,553 4,178 3,703
PBT 5,333 4,218 884 7,223 10,043
Total tax 1,524 696 805 1,806 2,511
Effective Tax rate (%) 28.6 16.5 91.0 25.0 25.0
PAT 1,527 1,090 (578) 5,417 7,532
Extraordinary Gain/(Loss) (1,922) (2,145) (481) - -
Adjusted PAT 3,449 3,235 (97) 5,417 7,532
Source: Company Data, PL Research
Balance Sheet (Rs m)
Y/e March FY13 FY14 FY15 FY16E FY17E
Share Capital 159 154 159 159 159
Reserves & Surplus 24,602 26,111 24,376 30,720 37,677
Shareholder's Fund 24,761 26,265 24,535 30,879 37,836
Preference Share Capital - - - - -
Total Debt 42,452 43,953 42,085 37,336 31,389
Other Liabilities(net) 3,554 3,889 1,068 1,222 1,379
Deferred Tax Liability 2,922 2,371 2,380 2,669 3,071
Total Liabilities 73,689 76,478 70,068 72,106 73,674
Gross Block 68,701 73,306 62,924 67,424 71,924
Less: Depreciation 19,027 22,319 25,170 28,447 31,973
Net Block 49,675 50,988 37,755 38,978 39,951
Capital Work in Progress 4,369 4,724 17,325 17,325 17,325
Cash & Cash Equivalent 3,817 5,135 4,338 4,430 4,791
Total Current Assets 25,611 29,280 27,279 28,071 29,581
Total Current Liabilities 10,020 12,128 16,254 16,278 17,134
Net Current Assets 15,591 17,153 11,026 11,793 12,447
Other Assets 3,798 3,274 3,569 3,604 3,532
Total Assets 73,689 76,478 70,068 72,106 73,674
Source: Company Data, PL Research

LilladherPrabhudas Sadbhav Engineering
CMP: Rs284 TP: Rs380 Rating: BUY MCap: Rs48.1bn
Strong bidding momentum: Order book at the end of FY15 stood at Rs82bn, down 10% YoY. SEL is targeting to win Rs25-30bn worth BOT projects over the next 6-12 months apart from EPC orders in Roads. In the recent round of biddings of 4/5 BOT projects, SADE did not manage to win any project as competition continues to remain high (however not irrational). They also believe that since equity available with most players is limited, the competition should moderate in forth coming bids and SADE should be able to win projects with its increased threshold IRR of 17%-18%. NHAI has already awarded ~ 2500-2750KMs in first 4 months and tenders worth Rs250-300bn should be up for bidding over next few months.
BOT projects: Healthy traffic growth/improved financing should aid cash flow: SEL saw average traffic growth of ~8-10% across projects. They believe that traffic has bottomed out and expect steady recovery in traffic growth, going ahead. At SPV level SEL has been able to refinance debt in few projects (Aurangabad- Jalna/ Hyderabad- Yadgiri/ Bijapur-Hungud/ Dhule) and reduce interest cost by ~100-120bps, it expect benefit of ~ Rs 40-45 crs in a 12 month period due to re-financing . They have also been able to renegotiate payment tenure for this project (more back ended payment) and been able to tie-up funds for the first major maintenance due between FY16-FY19 in the above 4 projects at various times. This measure should help improve cash flow of the projects in medium term.
Outlook and valuation: The stock is trading at Core PE of 11.3x FY17E earnings. We believe healthy order book (Rs82bn, 2.8x FY15 sales) provides strong visibility and an improving outlook in its key segments of Roads/mining/Irrigation augur well for future growth. Limited commitment on the current BOT portfolio and well-funded balance sheet makes it well-placed to benefit from improved ordering in the Road sector
11/17/2014 59
Key Financials (Rs m)
Y/e March FY17E FY14 FY15 FY16E FY17E
Revenue (Rs m) 18,110 23,581 29,702 35,044 44,293
Growth (%) (32.2) 30.2 26.0 18.0 26.4
EBITDA (Rs m) 1,557 2,494 3,006 3,898 5,103
PAT (Rs m) 741 1,064 1,141 1,416 2,025
EPS (Rs) 4.9 7.0 6.7 8.4 11.9
Growth (%) (47.5) 42.9 (4.1) 24.1 43.0
Net DPS (Rs) 0.5 0.7 0.7 0.7 0.7
Source: Company Data, PL Research
Profitability & valuation
Y/e March FY17E FY14 FY15 FY16E FY17E
EBITDA margin (%) 8.6 10.6 10.1 11.1 11.5
RoE (%) 9.3 11.9 9.8 9.9 12.8
RoCE (%) 9.6 10.3 8.4 8.8 11.0
EV / sales (x) 2.7 2.2 1.9 1.6 1.3
EV / EBITDA (x) 31.7 20.4 19.0 14.6 11.3
PER (x) 57.8 40.4 42.2 34.0 23.8
P / BV (x) 5.1 4.5 3.5 3.2 2.9
Net dividend yield (%) 0.2 0.2 0.2 0.2 0.2
Source: Company Data, PL Research
Stock Performance
(%) 1M 6M 12M
Absolute (15.3) (20.7) 35.8
Relative to Sensex (4.9) (6.7) 43.1

LilladherPrabhudas Financials
Sadbhav Engineering
11/17/2014 60
Income Statement (Rs m)
Y/e March FY17E FY14 FY15 FY16E FY17E
Net Revenue 18,110 23,581 29,702 35,044 44,293
Direct Expenses 15,197 19,450 24,362 28,936 36,546
% of Net Sales 83.9 82.5 82.0 82.6 82.5
Employee Cost 428 602 974 877 1,093
% of Net Sales 2.4 2.6 3.3 2.5 2.5
SG&A Expenses 928 1,035 1,360 1,332 1,550
% of Net Sales 5.1 4.4 4.6 3.8 3.5
Other Expenses - - - - -
% of Net Sales 0.0 0.0 0.0 0.0 0.0
EBITDA 1,557 2,494 3,006 3,898 5,103
Margin (%) 8.6 10.6 10.1 11.1 11.5
Depreciation 318 474 817 1,051 1,196
PBIT 1,239 2,020 2,189 2,847 3,908
Interest Expenses 844 958 891 999 1,165
PBT 1,108 1,205 1,462 2,023 2,935
Total tax 368 (242) 321 607 910
Effective Tax rate (%) 33.2 (20.1) 22.0 30.0 31.0
PAT 741 1,064 1,141 1,416 2,025
Extraordinary Gain/(Loss) - - - - -
Adjusted PAT 741 1,064 1,141 1,416 2,025
Source: Company Data, PL Research
Balance Sheet (Rs m)
Y/e March FY17E FY14 FY15 FY16E FY17E
Share Capital 151 152 170 170 170
Reserves & Surplus 8,174 9,189 13,521 14,608 16,495
Shareholder's Fund 8,325 9,572 13,628 14,906 16,793
Preference Share Capital - - - - -
Total Debt 6,731 8,633 9,383 9,433 9,983
Other Liabilities(net) - - - - -
Deferred Tax Liability 317 357 244 244 244
Total Liabilities 15,373 18,562 23,255 24,583 27,020
Gross Block 5,148 7,301 8,601 9,901 11,201
Less: Depreciation 1,845 2,319 3,136 4,188 5,383
Net Block 3,303 4,982 5,465 5,713 5,818
Capital Work in Progress - - - - -
Cash & Cash Equivalent 5,602 5,972 5,664 6,545 6,913
Total Current Assets 16,221 20,088 24,580 29,055 35,792
Total Current Liabilities 9,535 11,717 12,102 15,998 20,902
Net Current Assets 6,686 8,370 12,478 13,057 14,890
Other Assets - - - - -
Total Assets 15,373 18,562 23,255 24,583 27,020
Source: Company Data, PL Research

LilladherPrabhudas JK Lakshmi Cement
CMP: Rs360 TP: Rs450 Rating: BUY MCap: Rs42.4bn
JK Lakshmi cement (JKLC) is the 5th largest cement producer in North India with a ~7% market share in the region with a capacity of 6.6mtpa. This backed by 1) one of the most efficient operations, 2) entry into the most profitable eastern region with a capacity of 2.7mtpa, and 3) increasing consolidation in Gujarat (~40% of its total volumes) ranks JKLC as one of our top pick in the sector with a PT of Rs446 at EV/T of US$100 FY17E capacity of 12m tonnes.
Efficient and focused producer: JKLC is the second lowest cost producer in the region on the back of 100% pet-coke usage (one of the first mover), thermal and waste heat recovery based CPP, balanced rail/road mix and low fixed overheads. We expect the trend to continue at its upcoming green field plant in Durg on the back of proximity to both slag source and end markets with well laid logistics.
Greenfield expansion in Durg to drive the next round of volume growth: JKLC has commissioned a 2.7mtpa cement plant in Durg, Chhattisgarh at a cost of Rs17.5bn. Thanks to better market dynamics of the region on the front of consolidation and demand outlook, the addition would improve the earnings profile of JKLC.
Concerns on over-leveraged balance sheet overstated: Our interaction suggest that investors are concerned on the company due to steep increase in interest cost and high gearing. On the contrary, we believe that growth in EBITDA (on the back of capacity expansion) would more than off-set the increase in interest and depreciation cost. We expect 27% CAGR (FY15-17) in PAT even after 37%/30% increase in interest and depreciation cost. On the leverage, company is comfortably placed with D/E and Net debt/EBITDA at 0.9x and 2.1x FY17.
9/9/2015 61
Key Financials (Rs m)
Y/e March FY13 FY14 FY15 FY16E FY17E
Revenue (Rs m) 20,550 20,566 23,071 28,100 34,323
Growth (%) 19.6 0.1 12.2 21.8 22.1
EBITDA (Rs m) 4,287 3,020 3,495 3,620 5,679
PAT (Rs m) 1,879 1,073 1,497 203 1,876
EPS (Rs) 16.0 9.1 12.7 1.7 15.9
Growth (%) 40.9 (42.9) 39.5 (86.5) 825.4
Net DPS (Rs) 2.5 2.0 2.0 0.4 4.0
Source: Company Data, PL Research
Profitability & valuation
Y/e March FY13 FY14 FY15 FY16E FY17E
EBITDA margin (%) 20.9 14.7 15.1 12.9 16.5
RoE (%) 15.4 8.4 11.3 1.5 13.1
RoCE (%) 9.9 5.7 6.5 4.3 8.9
EV / sales (x) 2.5 2.7 2.6 2.2 1.7
EV / EBITDA (x) 12.1 18.2 17.2 16.7 10.5
PER (x) 22.6 39.5 28.3 209.1 22.6
P / BV (x) 3.4 3.3 3.1 3.1 2.8
Net dividend yield (%) 0.7 0.6 0.6 0.1 1.1
Source: Company Data, PL Research
Stock Performance
(%) 1M 6M 12M
Absolute 4.2 (10.3) 28.9
Relative to Sensex 5.6 (5.0) 22.6

LilladherPrabhudas Financials
JK Lakshmi Cements
9/9/2015 62
Income Statement (Rs m)
Y/e March FY13 FY14 FY15 FY16E FY17E
Net Revenue 20,550 20,566 23,071 28,100 34,323
Direct Expenses 8,926 9,732 10,798 13,019 15,035
% of Net Sales 43.4 47.3 46.8 46.3 43.8
Employee Cost 1,132 1,230 1,461 1,844 2,121
% of Net Sales 5.5 6.0 6.3 6.6 6.2
SG&A Expenses 4,215 4,568 5,162 6,575 7,683
% of Net Sales 20.5 22.2 22.4 23.4 22.4
Other Expenses 1,989 2,016 2,155 3,042 3,805
% of Net Sales 9.7 9.8 9.3 10.8 11.1
EBITDA 4,287 3,020 3,495 3,620 5,679
Margin (%) 20.9 14.7 15.1 12.9 16.5
Depreciation 1,489 1,352 1,119 1,820 1,895
PBIT 2,798 1,668 2,376 1,800 3,784
Interest Expenses 835 772 907 1,913 1,872
PBT 2,354 1,154 1,118 233 2,327
Total tax 596 229 162 30 451
Effective Tax rate (%) 25.3 19.9 14.5 13.0 19.4
PAT 1,757 925 956 203 1,876
Extraordinary Gain/(Loss) (122) (148) (541) - -
Adjusted PAT 1,879 1,073 1,497 203 1,876
Source: Company Data, PL Research
Balance Sheet (Rs m)
Y/e March FY13 FY14 FY15 FY16E FY17E
Share Capital 589 589 589 589 589
Reserves & Surplus 11,648 12,302 12,896 13,040 14,367
Shareholder's Fund 12,598 13,032 13,485 13,628 14,956
Preference Share Capital - - - - -
Total Debt 13,370 16,313 20,813 20,813 19,813
Other Liabilities(net) 364 419 399 482 584
Deferred Tax Liability 1,134 1,226 1,342 1,372 1,628
Total Liabilities 27,466 30,990 36,039 36,295 36,981
Gross Block 26,782 29,305 45,245 45,545 48,605
Less: Depreciation 12,436 13,590 14,850 16,670 18,565
Net Block 14,346 15,715 30,395 28,875 30,040
Capital Work in Progress 7,832 9,938 408 2,246 1,967
Cash & Cash Equivalent 4,191 4,829 4,006 3,782 3,875
Total Current Assets 8,950 8,923 9,232 9,634 10,540
Total Current Liabilities 3,971 4,675 5,084 5,548 6,655
Net Current Assets 4,979 4,248 4,147 4,086 3,885
Other Assets - - - - -
Total Assets 27,466 30,990 36,039 36,295 36,981
Source: Company Data, PL Research

LilladherPrabhudas Rallis India
CMP: Rs207 TP: Rs270 Rating: BUY MCap: Rs40.3bn
Rallis India has de-risked its domestic pesticide portfolio over the last three years by diversifying in high growth agro-segments like Seeds (33% revenue CAGR over FY15-FY17E), PGN (23.5% CAGR) & Exports (12.2% CAGR FY15-FY17E). Rallis is expected to deliver 21% earnings CAGR over FY15-FY17E, stable margins at ~16% and high RoEs in the range of 23%. With the capex cycle behind, Rallis is expected to generate Rs4.1bn free cash over FY15-FY17E. The stock is trading at a P/E of 17.6x FY17E earnings and an EV/EBITDA of 10.2x FY17E. Poor monsoon and down-trading by farmers can lead to a weak off-take of pesticides in this season which can offer good entry points in Rallis. However, Strong parentage, diversification across Agriculture value chain and a lean balance sheet makes Rallis a compelling “BUY” on dips for the long term.
Seed business on an exponential growth path, operating levers to kick-in: With virtually insignificant revenues in FY11 from Seeds, Rallis has clogged a turnover of Rs3.1bn in FY15, further growing to Rs5.3bn@33% CAGR by FY17E. Rallis is still having margins in single digits vis-a-vis other seed companies where margin profile is ~20%. Rallis’ learning curve in the seed business and better product awareness created amongst farmers over the last four seasons leaves significant room for operating leverage
Huge CRAM opportunity to unfold globally, Rallis well positioned with Dahej facility: Though the initial ramp-up at Dahej has been slow, there are slew of projects in different stages of execution. We strongly believe that the shift in manufacturing base from China (due to stringent EHS) and Japan (diversifying ingredient base due to Tsunami disruptions) will benefit Indian CRAM companies like Rallis. Further,~US$5bn worth products are going off-patent over the next three years providing immense opportunity
Strong franchise available at reasonable valuations, recommend “BUY”: Rallis has successfully turned around its seed subsidiary (Metahelix) and has shown remarkable performance in exports. We expect the seed business and exports to aid growth over the next two years, thus, diversifying it from the domestic crop protection business which is struggling currently.
9/9/2015 63
Key Financials (Rs m)
Y/e March FY13 FY14 FY15 FY16E FY17E
Revenue (Rs m) 14,582 17,466 18,218 20,325 23,361
Growth (%) 14.4 19.8 4.3 11.6 14.9
EBITDA (Rs m) 2,105 2,612 2,771 3,188 3,808
PAT (Rs m) 1,189 1,518 1,572 1,876 2,294
EPS (Rs) 6.1 7.8 8.1 9.6 11.8
Growth (%) 20.0 27.6 3.5 19.3 22.3
Net DPS (Rs) 2.3 2.4 2.5 2.7 3.0
Source: Company Data, PL Research
Profitability & valuation
Y/e March FY13 FY14 FY15 FY16E FY17E
EBITDA margin (%) 14.4 15.0 15.2 15.7 16.3
RoE (%) 20.3 22.7 20.5 21.5 22.8
RoCE (%) 26.1 29.6 26.5 27.7 30.6
EV / sales (x) 2.8 2.3 2.2 1.9 1.7
EV / EBITDA (x) 19.1 15.5 14.7 12.4 10.2
PER (x) 33.9 26.5 25.6 21.5 17.6
P / BV (x) 6.5 5.6 4.9 4.3 3.7
Net dividend yield (%) 1.1 1.2 1.2 1.3 1.4
Source: Company Data, PL Research
Stock Performance
(%) 1M 6M 12M
Absolute (8.3) (19.8) (14.3)
Relative to Sensex 2.0 (5.8) (6.9)

LilladherPrabhudas Financials
Rallis India
9/9/2015 64
Income Statement (Rs m)
Y/e March FY13 FY14 FY15 FY16E FY17E
Net Revenue 14,582 17,466 18,218 20,325 23,361
Direct Expenses 8,779 10,085 9,946 11,164 12,680
% of Net Sales 60.2 57.7 54.6 54.9 54.3
Employee Cost 944 1,105 1,294 1,400 1,499
% of Net Sales 6.5 6.3 7.1 6.9 6.4
SG&A Expenses - - - - -
% of Net Sales 0.0 0.0 0.0 0.0 0.0
Other Expenses 2,753 3,663 4,208 4,573 5,373
% of Net Sales 18.9 21.0 23.1 22.5 23.0
EBITDA 2,105 2,612 2,771 3,188 3,808
Margin (%) 14.4 15.0 15.2 15.7 16.3
Depreciation 316 407 496 525 553
PBIT 1,790 2,206 2,275 2,663 3,255
Interest Expenses 185 126 101 65 64
PBT 1,722 2,144 2,215 2,708 3,353
Total tax 535 617 618 772 956
Effective Tax rate (%) 31.1 28.8 27.9 28.5 28.5
PAT 1,189 1,518 1,572 1,876 2,294
Extraordinary Gain/(Loss) - - - - -
Adjusted PAT 1,189 1,518 1,572 1,876 2,294
Source: Company Data, PL Research
Balance Sheet (Rs m)
Y/e March FY13 FY14 FY15 FY16E FY17E
Share Capital 194 194 194 194 194
Reserves & Surplus 6,012 6,984 7,948 9,122 10,651
Shareholder's Fund 6,206 7,179 8,143 9,316 10,845
Preference Share Capital - - - - -
Total Debt 265 406 452 314 337
Other Liabilities(net) 107 140 141 146 169
Deferred Tax Liability 286 330 357 385 397
Total Liabilities 6,864 8,055 9,093 10,162 11,747
Gross Block 5,831 6,508 6,764 7,414 8,114
Less: Depreciation 1,953 2,326 2,768 3,293 3,846
Net Block 3,878 4,182 3,996 4,121 4,268
Capital Work in Progress 345 211 265 - -
Cash & Cash Equivalent 456 344 314 1,411 2,102
Total Current Assets 5,799 6,467 7,895 9,147 11,112
Total Current Liabilities 5,036 4,930 5,263 5,306 5,842
Net Current Assets 763 1,537 2,632 3,841 5,270
Other Assets 1,682 1,874 1,958 1,958 1,958
Total Assets 6,864 8,055 9,093 10,162 11,737
Source: Company Data, PL Research

LilladherPrabhudas Va Tech Wabag
CMP: Rs666 TP: Rs1,000 Rating: BUY MCap: Rs36.2bn
Va Tech Wabag (VATW) is amongst the key beneficiaries of the strong capex of various government and funding agencies on providing improved water sources both domestically and globally. The water opportunity is huge with Rs13.5trn estimated to be invested in urban water supply and sewerage in India alone over the next 20 years. VATW also benefits from a strong presence in fast growing water markets of Philippines, Turkey, Romania and the MENA region. Strong book-to-bill ratio of 2.24x and growing visibility of new orders makes us believe that VATW is best placed to capture this multi-year growth opportunity and achieve its Euro1bn turnover vision over the next 8 years (at a CAGR 15%). VATW trades at 20.7x FY17E earnings and 11.1x EV/EBITDA FY17E, which are at a premium to its average valuations, post listing in 2010. VATW has been consolidating over the last 15 months primarily on account of the losses built in Oman desalination project. With Oman losses factored in by the management on conservative accounting policy, we feel VATW can deliver a 26% earnings growth over FY15-FY17E period. Further, VATW is an attractive proposition due to continuous flow of new orders, excellent project execution track record, marquee client reference list, asset-light business model, cash rich balance sheet and limited options available in water space. All these factors makes VATW a long-term portfolio stock. Maintain “BUY”
Key catalysts include: 1) Desalination projects worth Rs50bn to be awarded in Tamil-Nadu, 2) Multiple domestic opportunities through the Ganga Rejuvenation plan (Rs510bn), Swachh Bharat Mission (Sewage and Solid waste management - Rs500bn) and creation of 100 smart cities (Rs480bn). Assuming even if 25-30% of announcements materializes, incremental opportunity would provide significant business traction.
Strong past performance, order-book of Rs 61bn and cash of Rs4.2bn offers comfort: With Rs61bn order book spread evenly across segments and geographies, VATW provides strong visibility. Further, cash of Rs4.2bn provides strength to operations and cash-in on emerging opportunities as and when they arise.
9/9/2015 65
Key Financials (Rs m)
Y/e March FY13 FY14 FY15 FY16E FY17E
Revenue (Rs m) 16,019 22,301 24,284 27,312 30,733
Growth (%) 11.4 39.2 8.9 12.5 12.5
EBITDA (Rs m) 1,371 2,005 2,044 2,520 3,056
PAT (Rs m) 885 1,133 1,101 1,414 1,747
EPS (Rs) 16.7 21.3 20.3 26.0 32.2
Growth (%) 17.1 27.8 (4.8) 28.4 23.6
Net DPS (Rs) 3.5 4.0 4.0 4.5 5.5
Source: Company Data, PL Research
Profitability & valuation
Y/e March FY13 FY14 FY15 FY16E FY17E
EBITDA margin (%) 8.6 9.0 8.4 9.2 9.9
RoE (%) 13.0 14.6 12.6 14.7 16.1
RoCE (%) 11.7 12.5 11.0 11.7 12.4
EV / sales (x) 2.1 1.5 1.4 1.2 1.1
EV / EBITDA (x) 24.3 16.6 17.1 13.5 11.1
PER (x) 40.0 31.3 32.8 25.6 20.7
P / BV (x) 4.9 4.2 4.0 3.6 3.1
Net dividend yield (%) 0.5 0.6 0.6 0.7 0.8
Source: Company Data, PL Research
Stock Performance
(%) 1M 6M 12M
Absolute (13.3) (23.2) (4.3)
Relative to Sensex (2.9) (9.2) 3.1

LilladherPrabhudas Financials
Va Tech Wabag
9/9/2015 66
Income Statement (Rs m)
Y/e March FY13 FY14 FY15 FY16E FY17E
Net Revenue 16,019 22,301 24,284 27,312 30,733
Direct Expenses 11,766 16,979 18,328 20,452 23,000
% of Net Sales 73.5 76.1 75.5 74.9 74.8
Employee Cost 2,058 2,217 2,777 3,012 3,268
% of Net Sales 12.8 9.9 11.4 11.0 10.6
SG&A Expenses - - - - -
% of Net Sales 0.0 0.0 0.0 0.0 0.0
Other Expenses 824 1,099 1,136 1,329 1,410
% of Net Sales 5.1 4.9 4.7 4.9 4.6
EBITDA 1,371 2,005 2,044 2,520 3,056
Margin (%) 8.6 9.0 8.4 9.2 9.9
Depreciation 109 150 109 157 169
PBIT 1,262 1,855 1,935 2,363 2,887
Interest Expenses 212 252 392 350 379
PBT 1,333 1,662 1,671 2,155 2,667
Total tax 456 526 566 733 907
Effective Tax rate (%) 34.2 31.6 33.9 34.0 34.0
PAT 885 1,133 1,101 1,414 1,747
Extraordinary Gain/(Loss) - - - - -
Adjusted PAT 885 1,133 1,101 1,414 1,747
Source: Company Data, PL Research
Balance Sheet (Rs m)
Y/e March FY13 FY14 FY15 FY16E FY17E
Share Capital 53 53 109 109 109
Reserves & Surplus - - - - -
Shareholder's Fund 7,154 8,412 9,028 10,156 11,553
Preference Share Capital - - - - -
Total Debt 822 1,583 1,806 2,448 2,766
Other Liabilities(net) 1,137 1,816 2,441 2,834 3,089
Deferred Tax Liability 2 37 30 30 30
Total Liabilities 9,115 11,847 13,305 15,467 17,437
Gross Block 987 1,752 2,521 2,721 2,921
Less: Depreciation 477 560 607 764 934
Net Block 511 1,192 1,913 1,956 1,987
Capital Work in Progress 324 7 6 - -
Cash & Cash Equivalent 2,900 3,933 3,489 5,244 6,136
Total Current Assets 17,770 22,135 23,152 26,659 29,723
Total Current Liabilities 9,791 12,511 12,372 14,178 15,582
Net Current Assets 7,979 9,625 10,780 12,481 14,140
Other Assets 268 792 229 250 280
Total Assets 9,115 11,847 13,305 15,467 17,437
Source: Company Data, PL Research

LilladherPrabhudas Disclaimer
9/9/2015 67
BUY : Over 15% Outperformance to Sensex over 12-months
Accumulate : Outperformance to Sensex over 12-months
Reduce : Underperformance to Sensex over 12-months
Sell : Over 15% underperformance to Sensex over 12-months
Trading Buy : Over 10% absolute upside in 1-month
Trading Sell : Over 10% absolute decline in 1-month
Not Rated (NR) : No specific call on the stock
Under Review (UR) : Rating likely to change shortly
Prabhudas Lilladher Pvt. Ltd.
3rd Floor, Sadhana House, 570, P. B. Marg, Worli, Mumbai 400 018, India.
Tel: (91 22) 6632 2222 Fax: (91 22) 6632 2209
Rating Distribution of Research Coverage PL’s Recommendation Nomenclature
40.0%47.0%
13.0%
0.0%0%
10%
20%
30%
40%
50%
BUY Accumulate Reduce Sell
% o
f To
tal C
ove
rage
DISCLAIMER/DISCLOSURES ANALYST CERTIFICATION We/I, Mr. R Sreesankar (B.Sc), Research Analysts, authors and the names subscribed to this report, hereby certify that all of the views expressed in this research report accurately reflect our views about the subject issuer(s) or securities. We also certify that no part of our compensation was, is, or will be directly or indirectly related to the specific recommendation(s) or view(s) in this report. Terms & conditions and other disclosures: Prabhudas Lilladher Pvt. Ltd, Mumbai, India (hereinafter referred to as “PL”) is engaged in the business of Stock Broking, Portfolio Manager, Depository Participant and distribution for third party financial products. PL is a subsidiary of Prabhudas Lilladher Advisory Services Pvt Ltd. which has its various subsidiaries engaged in business of commodity broking, investment banking, financial services (margin funding) and distribution of third party financial/other products, details in respect of which are available at www.plindia.com This document has been prepared by the Research Division of PL and is meant for use by the recipient only as information and is not for circulation. This document is not to be reported or copied or made available to others without prior permission of PL. It should not be considered or taken as an offer to sell or a solicitation to buy or sell any security. The information contained in this report has been obtained from sources that are considered to be reliable. However, PL has not independently verified the accuracy or completeness of the same. Neither PL nor any of its affiliates, its directors or its employees accepts any responsibility of whatsoever nature for the information, statements and opinion given, made available or expressed herein or for any omission therein. Recipients of this report should be aware that past performance is not necessarily a guide to future performance and value of investments can go down as well. The suitability or otherwise of any investments will depend upon the recipient's particular circumstances and, in case of doubt, advice should be sought from an independent expert/advisor. Either PL or its affiliates or its directors or its employees or its representatives or its clients or their relatives may have position(s), make market, act as principal or engage in transactions of securities of companies referred to in this report and they may have used the research material prior to publication. PL may from time to time solicit or perform investment banking or other services for any company mentioned in this document. PL is in the process of applying for certificate of registration as Research Analyst under Securities and Exchange Board of India (Research Analysts) Regulations, 2014 PL submits that no material disciplinary action has been taken on us by any Regulatory Authority impacting Equity Research Analysis activities. PL or its research analysts or its associates or his relatives do not have any financial interest in the subject company. PL or its research analysts or its associates or his relatives do not have actual/beneficial ownership of one per cent or more securities of the subject company at the end of the month immediately preceding the date of publication of the research report. PL or its research analysts or its associates or his relatives do not have any material conflict of interest at the time of publication of the research report. PL or its associates might have received compensation from the subject company in the past twelve months. PL or its associates might have managed or co-managed public offering of securities for the subject company in the past twelve months or mandated by the subject company for any other assignment in the past twelve months. PL or its associates might have received any compensation for investment banking or merchant banking or brokerage services from the subject company in the past twelve months. PL or its associates might have received any compensation for products or services other than investment banking or merchant banking or brokerage services from the subject company in the past twelve months PL or its associates might have received any compensation or other benefits from the subject company or third party in connection with the research report. PL encourages independence in research report preparation and strives to minimize conflict in preparation of research report. PL or its analysts did not receive any compensation or other benefits from the subject Company or third party in connection with the preparation of the research report. PL or its Research Analysts do not have any material conflict of interest at the time of publication of this report. It is confirmed that Mr. R Sreesankar (B.Sc), Research Analysts of this report have not received any compensation from the companies mentioned in the report in the preceding twelve months Compensation of our Research Analysts is not based on any specific merchant banking, investment banking or brokerage service transactions. The Research analysts for this report certifies that all of the views expressed in this report accurately reflect his or her personal views about the subject company or companies and its or their securities, and no part of his or her compensation was, is or will be, directly or indirectly related to specific recommendations or views expressed in this report. The research analysts for this report has not served as an officer, director or employee of the subject company PL or its research analysts have not engaged in market making activity for the subject company Our sales people, traders, and other professionals or affiliates may provide oral or written market commentary or trading strategies to our clients that reflect opinions that are contrary to the opinions expressed herein, and our proprietary trading and investing businesses may make investment decisions that are inconsistent with the recommendations expressed herein. In reviewing these materials, you should be aware that any or all o the foregoing, among other things, may give rise to real or potential conflicts of interest. PL and its associates, their directors and employees may (a) from time to time, have a long or short position in, and buy or sell the securities of the subject company or (b) be engaged in any other transaction involving such securities and earn brokerage or other compensation or act as a market maker in the financial instruments of the subject company or act as an advisor or lender/borrower to the subject company or may have any other potential conflict of interests with respect to any recommendation and other related information and opinions.