Embed Size (px)
Citation preview

Real estate May 13, 2014
Oberoi Realty
Bloomberg: OBER IN Reuters: OEBO.BO
BUY
Institutional Equities
India Research
RESULT REVIEW
Recommendation
CMP: Rs203
Target Price: Rs296
Previous Target Price: Rs285
Upside (%) 46%
Stock Information Market Cap. (Rs bn / US$ mn) 67/1,114
52-week High/Low (Rs) 284/153
3m ADV (Rs mn /US$ mn) 37/0.6
Beta 0.9
Sensex/ Nifty 23,551/7,014
Share outstanding (mn) 328
Stock Performance (%) 1M 3M 12M YTD
Absolute (10.1) 9.7 (15.2) (13.3)
Rel. to Sensex (13.5) (4.7) (27.6) (22.1)
Performance
Source: Bloomberg
Earnings Revision
(%) FY14E FY15E
Revenue - 4.1
EBITDA - 1.3
PAT 11.0 5.7
Source: Company
Analysts Contact Parikshit Kandpal
022 6184 4311
150 170 190 210 230 250 270
15,000 17,000 19,000 21,000 23,000 25,000
Ap
r-1
3
Jun
-13
Jul-
13
Au
g-1
3
Sep
-13
No
v-1
3
Dec
-13
Jan
-14
Mar
-14
Ap
r-1
4
Sensex (LHS) Oberoi (RHS)
Multiple triggers Oberoi Realty Ltd. (ORL) 4QFY14 Revenue, EBIDTA and Profit was 23%,
30.9% and 15% ahead of our estimate - pickup in unit sales in Exquisite &
Priviera projects resulted in this outperformance. With ~7mn sqft of new
launches planned for FY15E (Mulund ~3.2mn sqft, Borivali ~3.2mn, Worli –
~0.6mn sqft), ORL has multiple triggers panned out for re-rating. We
maintain our BUY on ORL’s with increased NAV of Rs296/share.
Sales recovery positively impact 4QFY14 performance
ORL 4QFY14 Consolidated Net revenue, EBIDTA & PAT de-grew (27.4%),
(29.5%) & (47%) YoY respectively, ahead of our estimates by 23.0%, 30.9% &
15.0% respectively. EBIDTA margin expanded by 421bps YoY to 56.9% on
account of higher margins in Priviera & Exquisite. The customer advances
remains stable at Rs6,402.6mn. Balance sheet remains strong.
New launches of ~7mn sqft during FY15E ORL has finalized Ritz Carlton as Worli Hotel operator and will be launching
the project during 1HFY15E. Besides this ORL is planning to launch Mulund
& Borivali projects during 2HFY15E, with affordable luxury theme. The ticket
size for Borivali shall be Rs20mn/unit whilst for Mulund Rs30mn/unit. These
new launches shall provide much needed visibility on pre-sales and launch
success remain key re-rating trigger.
Best placed v/s Western peers ORL stands out as a leader in our competitive business mapping of the
Western developers. High land bank quality, superior brand recall and
relatively healthy access to finance are the key contributing factors. We
expect ORL to capture incremental market share outside home location and
deliver above industry average growth.
Maintain BUY: NAV increased to Rs296/share We have incorporated ORL’s Borivali project valuation and debt into our
estimates. We have cut our FY15E & FY16E EPS estimates by 11% & 5.7%
owing to debt finance of Rs8bn for Borivali project. We maintain BUY stance
with a increased SOTP-based target price of Rs296/share (previous target
Rs285/share). We believe that the near-term catalysts are: (i) Mulund & Worli
launch; (ii) successful foray outside Mumbai & (iii) new land acquisitions.
Key risks: (i) Unaffordability may lead to a 8-10% real estate price
correction; (ii) Delays in new land acquisitions remains key de-rating trigger.
Key Financial - Consolidated
Y/E Mar (Rs mn) FY12 FY13 FY14 FY15E FY16E
Operating income 8,247 10,476 7,985 17,177 28,428
EBITDA 4,835 6,121 4,348 10,296 16,428
Net profit 4,633 5,049 3,111 6,475 10,724
EPS (Rs) 14.1 15.4 9.2 19.7 32.7
RoCE (%) 17.3 17.3 10.8 19.8 26.0
P/E (x) 14.4 13.2 22.1 10.3 6.2
Source: Company, Karvy Institutional Research
2
May 13, 2014
Real Estate
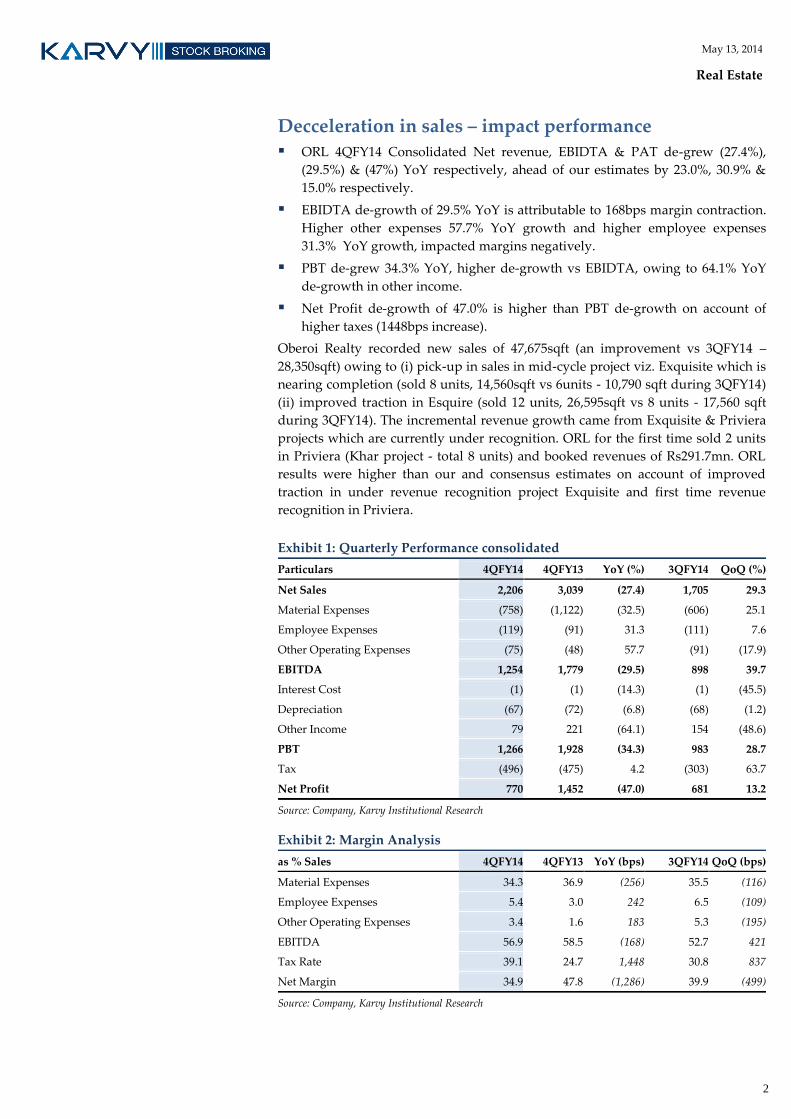
Decceleration in sales – impact performance
ORL 4QFY14 Consolidated Net revenue, EBIDTA & PAT de-grew (27.4%),
(29.5%) & (47%) YoY respectively, ahead of our estimates by 23.0%, 30.9% &
15.0% respectively.
EBIDTA de-growth of 29.5% YoY is attributable to 168bps margin contraction.
Higher other expenses 57.7% YoY growth and higher employee expenses
31.3% YoY growth, impacted margins negatively.
PBT de-grew 34.3% YoY, higher de-growth vs EBIDTA, owing to 64.1% YoY
de-growth in other income.
Net Profit de-growth of 47.0% is higher than PBT de-growth on account of
higher taxes (1448bps increase).
Oberoi Realty recorded new sales of 47,675sqft (an improvement vs 3QFY14 –
28,350sqft) owing to (i) pick-up in sales in mid-cycle project viz. Exquisite which is
nearing completion (sold 8 units, 14,560sqft vs 6units - 10,790 sqft during 3QFY14)
(ii) improved traction in Esquire (sold 12 units, 26,595sqft vs 8 units - 17,560 sqft
during 3QFY14). The incremental revenue growth came from Exquisite & Priviera
projects which are currently under recognition. ORL for the first time sold 2 units
in Priviera (Khar project - total 8 units) and booked revenues of Rs291.7mn. ORL
results were higher than our and consensus estimates on account of improved
traction in under revenue recognition project Exquisite and first time revenue
recognition in Priviera.
Exhibit 1: Quarterly Performance consolidated
Particulars 4QFY14 4QFY13 YoY (%) 3QFY14 QoQ (%)
Net Sales 2,206 3,039 (27.4) 1,705 29.3
Material Expenses (758) (1,122) (32.5) (606) 25.1
Employee Expenses (119) (91) 31.3 (111) 7.6
Other Operating Expenses (75) (48) 57.7 (91) (17.9)
EBITDA 1,254 1,779 (29.5) 898 39.7
Interest Cost (1) (1) (14.3) (1) (45.5)
Depreciation (67) (72) (6.8) (68) (1.2)
Other Income 79 221 (64.1) 154 (48.6)
PBT 1,266 1,928 (34.3) 983 28.7
Tax (496) (475) 4.2 (303) 63.7
Net Profit 770 1,452 (47.0) 681 13.2
Source: Company, Karvy Institutional Research
Exhibit 2: Margin Analysis
as % Sales 4QFY14 4QFY13 YoY (bps) 3QFY14 QoQ (bps)
Material Expenses 34.3 36.9 (256) 35.5 (116)
Employee Expenses 5.4 3.0 242 6.5 (109)
Other Operating Expenses 3.4 1.6 183 5.3 (195)
EBITDA 56.9 58.5 (168) 52.7 421
Tax Rate 39.1 24.7 1,448 30.8 837
Net Margin 34.9 47.8 (1,286) 39.9 (499)
Source: Company, Karvy Institutional Research

3
May 13, 2014
Real Estate
Sales momentum – marginal recovery
ORL has recorded improvement in pre-sales volume with new sales at 47,675sqft
vs 28,350sqft during 3QFY14. The management sounded upbeat on change in
sentiment post elections contingent on (i) stable Government & (ii) economic
recovery. As of now ORL is holding on to prices and focusing on completing
Exquisite (200 units in inventory, pending cost Rs500mn, current quarterly sales
runrate 9 units). The projects is expected to be delivered by Dec-13 and may see
buying recovery post completion. Esquire will see increased momentum from
1QFY15E as all approvals are in place now. Oasis Worli may get launched during
1HFY15E whilst Mulund & Borivali projects may get launched end FY15E.
Exhibit 3: 4QFY14 – new sales
Pre-sales - mnsf 1QFY12 2QFY12 3QFY12 4QFY12 1QFY13 2QFY13 3QFY13 4QFY13 1QFY14 2QFY14 3QFY14 4QFY14
Oberoi Esquire 0.17 0.13 0.07 0.07 0.06 0.07 0.05 0.05 0.03 0.02 0.02 0.03
Oberoi Exquisite 0.01 0.02 0.01 0.03 0.03 0.03 0.04 0.04 0.02 0.02 0.01 0.01
Oberoi Splendor
Grande 0.03 0.03 0.03 0.04 0.02 0.02 0.02 0.01 - - - 0.00
Oberoi Splendor 0.00 0.00 0.01 0.02 0.01 0.01 0.01 0.02 - - - -
Oberoi Oasis - 0.11 - -
Oberoi Priviera
0.00
Total 0.21 0.18 0.12 0.17 0.12 0.13 0.12 0.12 0.05 0.15 0.03 0.05
Pre-Sales - Rs mn
Oberoi Esquire 1,973 1,486 852 1,036 927 1,100 784 780 411 433 349 435
Oberoi Exquisite 211 276 229 442 495 488 781 740 478 385 226 352
Oberoi Splendor
Grande 368 413 403 651 374 345 311 202 36 - - 42
Oberoi Splendor 67 65 297 456 190 287 199 505 - 3,179 - -
Oberoi Oasis - - -
Oberoi Priviera
292
Total 2,619 2,239 1,780 2,585 1,986 2,220 2,074 2,227 925 3,997 575 1,122
Source: Company, Karvy Institutional Research
Oberoi Esquire will hit revenue recognition during 2HFY15E whilst Worli project
shall hit P&L during FY15E. ORL has done 23 units pre-sales in Worli project and
recorded 12 units as of 4QFY14.
Exhibit 4: Cumulative sales trend
Project Area (msf)
Area sold as
of 4QFY14
(mnsf)
Sales Value
(Rs mn)
Average
realisation
(Rs/sqft)
PoCM (%)
Balance
Revenues to be
recognised (Rs
mn)
Cash to be
received (Rs
mn)
Oberoi Esquire 1.5 1.0 13,287 13,246 <20% 13,287 8,287
Oberoi Exquisite 1.5 1.0 14,149 13,431 88% 933 560
Oberoi Splendor Grande 0.3 0.3 4,187 14,599 100% - 7
Oberoi Splendor 1.3 1.3 15,714 12,304 100% - 111
Oberoi Oasis 1.8 0.1 3,491 27,704 <20% 3,179 2,408
Oberoi Priviera* 0.0 0.0 292 62,064 38% 0 0
Total 6.4 3.7 51,120 13,902 17,399 11,373
Source: Company, Karvy Institutional Research; *: On Carpet area & carpet price.
4
May 13, 2014
Real Estate
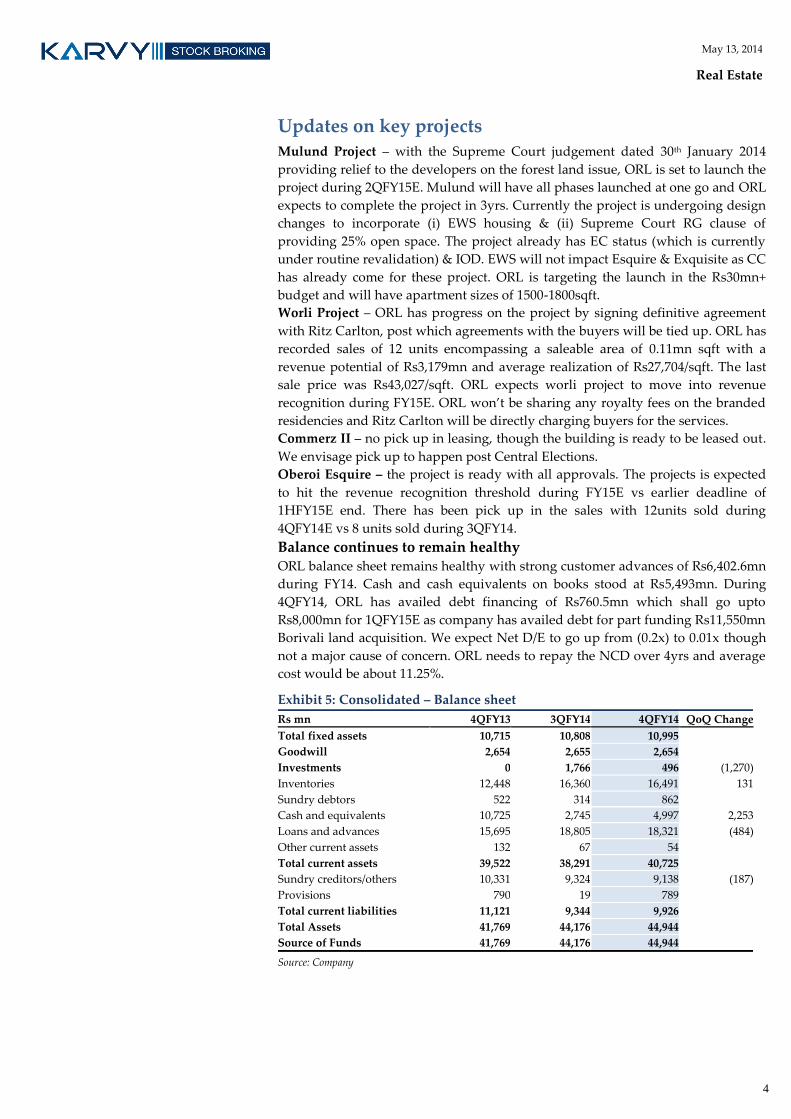
Updates on key projects Mulund Project – with the Supreme Court judgement dated 30th January 2014
providing relief to the developers on the forest land issue, ORL is set to launch the
project during 2QFY15E. Mulund will have all phases launched at one go and ORL
expects to complete the project in 3yrs. Currently the project is undergoing design
changes to incorporate (i) EWS housing & (ii) Supreme Court RG clause of
providing 25% open space. The project already has EC status (which is currently
under routine revalidation) & IOD. EWS will not impact Esquire & Exquisite as CC
has already come for these project. ORL is targeting the launch in the Rs30mn+
budget and will have apartment sizes of 1500-1800sqft.
Worli Project – ORL has progress on the project by signing definitive agreement
with Ritz Carlton, post which agreements with the buyers will be tied up. ORL has
recorded sales of 12 units encompassing a saleable area of 0.11mn sqft with a
revenue potential of Rs3,179mn and average realization of Rs27,704/sqft. The last
sale price was Rs43,027/sqft. ORL expects worli project to move into revenue
recognition during FY15E. ORL won’t be sharing any royalty fees on the branded
residencies and Ritz Carlton will be directly charging buyers for the services.
Commerz II – no pick up in leasing, though the building is ready to be leased out.
We envisage pick up to happen post Central Elections.
Oberoi Esquire – the project is ready with all approvals. The projects is expected
to hit the revenue recognition threshold during FY15E vs earlier deadline of
1HFY15E end. There has been pick up in the sales with 12units sold during
4QFY14E vs 8 units sold during 3QFY14.
Balance continues to remain healthy ORL balance sheet remains healthy with strong customer advances of Rs6,402.6mn
during FY14. Cash and cash equivalents on books stood at Rs5,493mn. During
4QFY14, ORL has availed debt financing of Rs760.5mn which shall go upto
Rs8,000mn for 1QFY15E as company has availed debt for part funding Rs11,550mn
Borivali land acquisition. We expect Net D/E to go up from (0.2x) to 0.01x though
not a major cause of concern. ORL needs to repay the NCD over 4yrs and average
cost would be about 11.25%.
Exhibit 5: Consolidated – Balance sheet
Rs mn 4QFY13 3QFY14 4QFY14 QoQ Change
Total fixed assets 10,715 10,808 10,995
Goodwill 2,654 2,655 2,654
Investments 0 1,766 496 (1,270)
Inventories 12,448 16,360 16,491 131
Sundry debtors 522 314 862
Cash and equivalents 10,725 2,745 4,997 2,253
Loans and advances 15,695 18,805 18,321 (484)
Other current assets 132 67 54
Total current assets 39,522 38,291 40,725
Sundry creditors/others 10,331 9,324 9,138 (187)
Provisions 790 19 789
Total current liabilities 11,121 9,344 9,926
Total Assets 41,769 44,176 44,944
Source of Funds 41,769 44,176 44,944
Source: Company
5
May 13, 2014
Real Estate
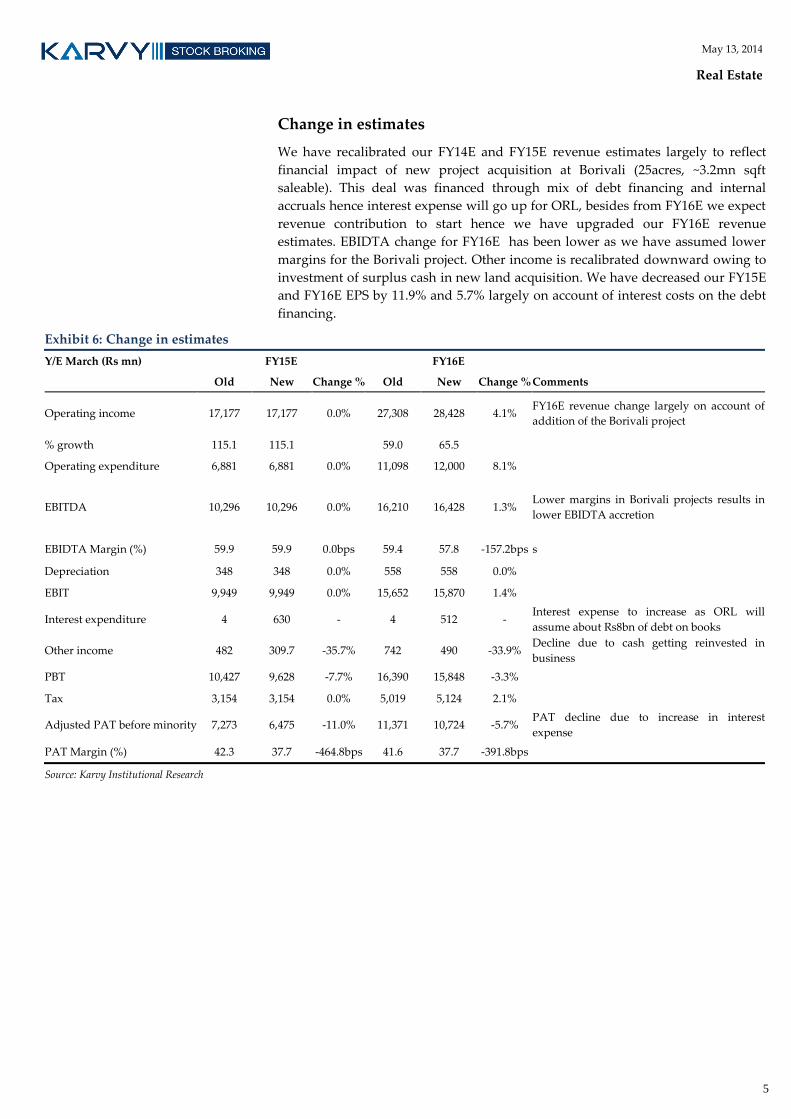
Change in estimates
We have recalibrated our FY14E and FY15E revenue estimates largely to reflect
financial impact of new project acquisition at Borivali (25acres, ~3.2mn sqft
saleable). This deal was financed through mix of debt financing and internal
accruals hence interest expense will go up for ORL, besides from FY16E we expect
revenue contribution to start hence we have upgraded our FY16E revenue
estimates. EBIDTA change for FY16E has been lower as we have assumed lower
margins for the Borivali project. Other income is recalibrated downward owing to
investment of surplus cash in new land acquisition. We have decreased our FY15E
and FY16E EPS by 11.9% and 5.7% largely on account of interest costs on the debt
financing.
Exhibit 6: Change in estimates
Y/E March (Rs mn) FY15E FY16E
Old New Change % Old New Change % Comments
Operating income 17,177 17,177 0.0% 27,308 28,428 4.1% FY16E revenue change largely on account of
addition of the Borivali project
% growth 115.1 115.1
59.0 65.5
Operating expenditure 6,881 6,881 0.0% 11,098 12,000 8.1%
EBITDA 10,296 10,296 0.0% 16,210 16,428 1.3% Lower margins in Borivali projects results in
lower EBIDTA accretion
EBIDTA Margin (%) 59.9 59.9 0.0bps 59.4 57.8 -157.2bps s
Depreciation 348 348 0.0% 558 558 0.0%
EBIT 9,949 9,949 0.0% 15,652 15,870 1.4%
Interest expenditure 4 630 - 4 512 - Interest expense to increase as ORL will
assume about Rs8bn of debt on books
Other income 482 309.7 -35.7% 742 490 -33.9% Decline due to cash getting reinvested in
business
PBT 10,427 9,628 -7.7% 16,390 15,848 -3.3%
Tax 3,154 3,154 0.0% 5,019 5,124 2.1%
Adjusted PAT before minority 7,273 6,475 -11.0% 11,371 10,724 -5.7% PAT decline due to increase in interest
expense
PAT Margin (%) 42.3 37.7 -464.8bps 41.6 37.7 -391.8bps
Source: Karvy Institutional Research

6
May 13, 2014
Real Estate
Investment Rationale
Strong balance sheet lends scope for locational diversification
outside home location
Regional to Top 8 cities aspiration is driving domestic realty players to diversify
outside their core regions. Whilst we believe that pan India theme has its own
challenges we expect ORL’s competitive position to change in markets outside its
core. NCR now contributes 15% to Sobha’s sales volume and we expect similar
numbers to pan out for Oberoi on back of strong brand recall replication in other
markets. Moreover, a debt free balance sheet augurs well for any acquisition
opportunity in newer markets though ORL remains focused on JDA (Joint
development agreement) model of diversification.
Exhibit 7: Strategy to move out of home markets
Mumbai Pune NCR Bangalore Chennai Hyderabad Overall Comments
DLF
Broad based presence across markets, strong
competitive positioning, though Mumbai exit
remains key dampener
Oberoi
Diversification outside Mumbai remains key re-
rating trigger; we see strong change in competitive
positioning over next 2-3yrs with NCR, Bangalore
markets as new additions. We estimate new
markets to contribute 10-15% to volumes
Sobha
Successful NCR foray sets tone for a stronger
growth outside home turf Bangalore. We rate
Sobha as a mid-quartile
Prestige
Middling in most regions. Competitive positioning
in Bangalore remains strong, Chennai
consolidating
Puravankara
Middling on most locations. Bangalore & Chennai
remain dominant regions. Looking to diversify
outside the home markets
Godrej
We rate Godrej as a mid-quartile for diversification
outside Mumbai. Launches have met with strong
success. Brand leveraging will help further
consolidation in the competitive positioning
Kolte
Middling on most locations. Kolte is a dominant
Pune player with emerging presence in Bangalore
where it is looking to further consolidate and
improve market share, whilst in Mumbai the
company is looking towards its first launch.
Source: Karvy Institutional Research; Note: Strong; Relatively Strong; Average; Relatively Weak Weak
Gaining market share in newer location offers an option value and should a
developer exercise this option successfully the growth can be ahead of industry. It
remains as a long term option to be exercised and a potential re-rating trigger for
ORL.

7
May 13, 2014
Real Estate
Dominant Western markets positioning
ORL is best placed amongst the Western peers on account of its superior land bank
quality, access to finance, healthy balance sheet and high potential for successful
foray in newer markets. The micro factors are well supported by strong execution,
quality construction & management bandwidth. We highlight our finding in
exhibit 8 to arrive at overall competitive positioning.
Exhibit 8: Overall competitive positioning of real estate developers
Macro
Competitive
- 30% weight
Business
Competitive -
25% weight
Land bank
& Pricing -
20% weight
Balance
Sheet
positioning -
25% weight
Overall Comments
Oberoi
Top quartile with no debt, higher return ratios and strong
cash-flows
Godrej
A top quartile on macro competitive whilst mid-quartile on
all other parameter. High leverage is the key overhang. We
rate it a mid-quartile
HDIL
Middling in all parameter
Hiranandani
Raheja
Middling in all parameter
Sunteck
Overall a Mid -quartile on back of low leverage, high return
ratios
Wadhwa
Middling in all parameter
Kolte Patil
A Mid -quartile on all parameters
Source: Karvy Institutional Research; Note: Strong; Relatively Strong; Average; Relatively Weak Weak
On overall competitive positioning, we find that the top real estate players
include Oberoi, Godrej, Hirandandani & Sunteck in Western markets. ORL with
the right mix of branding, execution capability, balance sheet strength and
underlying business fundamentals remains best poised amongst the peers.
Notwithstanding their scores differ on these factors we see limited differentiation
on an overall basis.

8
May 13, 2014
Real Estate
Valuation – NAV increased to Rs296/share
SOTP Valuation We have adopted DCF methodology to arrive at ORL’s NAV/share. We have
introduced the Borivali (~3.2mn sqft project into our SOTP). We value the
residential real estate business at Rs161/share (vs Rs123/share earlier), hotels at
Rs21/share, commercial annuity assets at Rs90/share, social infrastructure at
Rs10/share, other assets at Rs15/share and net debt (Rs1) (vs Rs27/share earlier) to
arrive at total SOTP valuation of Rs296/share for the Company (vs Rs285/share
earlier). We don’t ascribe any NAV discount to ORL as we have only valued the
projects which have visibility over the next 5years. For land bank beyond 5 years
we ascribe 1x P/BV for invested equity.
Exhibit 9: Sum of the Parts
Rs mn Rs/share Comments
Gross NAV Residential 52,887 161 NAV based on the methodology discussed below
Gross NAV Hotels 6,961 21 8x FY15E EV/EBIDTA
Gross NAV Commercial 29,599 90 NAV based on the methodology discussed
Social Infra 3,134 10 discounting at 12% cap rate viz. school, hospital etc
Other Assets 4,911 15 investments in other projects at 1x P/BV,viz. Sangam city, Juhu hotel etc
Less: Net Debt 258 (1) Increase in debt to Rs8bn has resulted in ORL being a Net debt company
NAV 97,235 296
Source: Karvy Institutional Research
Real estate development – NAV calculation methodology
We have divided ORL’s entire land bank into residential projects (based on the
information given by the company)
We have arrived at the sale price/sq ft. and the anticipated sales volumes for
each project based on our discussions with industry experts
We have deducted the cost of construction based on our assumed cost
estimates which have been arrived at after discussions with industry experts
We have further deducted marketing and other costs which have been
assumed at 5% of the sales revenue
We have then deducted income tax based on the tax applicable for the project
The resultant cash inflows at the project level have been discounted based on
WACC of 14% (cost of equity 14% based on beta of 1x & debt/equity ratio of
0x). All the project level NAVs have then been summed up to arrive at the
NAV of the company
For commercial office we have discounted rentals using 14% WACC for the
forecasted period and terminal value using the cap rate of 11%
Social infrastructure created by ORL viz. School, Hospital etc has been
discounted using cap rate of 12%
Other assets have been valued at 1x P/BV of invested equity
From the NAV, we have deducted the net debt as of FY15E to arrive at the
final valuation of the company.
Location Gross NAV
(Rs mn)
Rs/
Share
Residential
Goregaon 13,716 42
JVLR 6,943 21
Worli - Residential 8,132 25
Mulund 11,421 35
Borivali 12,675 39
Total Residential 52,887 161
Hotels
Westin Hotel 4,085 12
Worli Hotel 2,876 9
Total Hotel 6,961 21
Commercial
Commerz-All Phases 20,712 63
Oberoi Mall 6,274 19
Worli Commercial 2,613 8
Total Commercial 29,599 90
Grand Total 89,448 273
Source: Karvy Institutional Research

9
May 13, 2014
Real Estate
Key valuation assumptions
In exhibit 10 we highlight our sales and cost inflation forecasts. We expect
property price appreciation in line with WPI inflation i.e. 5%. We forecast other
costs including marketing, SGA and employees’ costs at 5% of sales.
Exhibit 10: Base case assumptions
Discount rate 14%
Annual rate of inflation-sales price 5%
Annual rate of inflation-cost of construction 5%
Other costs – marketing, SGA, employee cost (as % of sales) 5%
Tax rate (%) 33%
Source: Karvy Institutional Research
In the exhibit 11 we highlight our sale price and construction cost forecasts. Our
pricing assumptions are moderate and at a 0-10% premium to the current
prevailing prices on account of ORL 15-20% brand premium vs peers.
Exhibit 11: Base property price and construction cost assumptions
Location Prices Cost
Rs/sq ft Rs/sq ft
Goregaon 14,000 5,500
Worli 35,000 7,500
Mulund 11,500 4,000
Borivali 12,000 5,000
JVLR 13,500 5,000
Source: Karvy Institutional Research
10
May 13, 2014
Real Estate
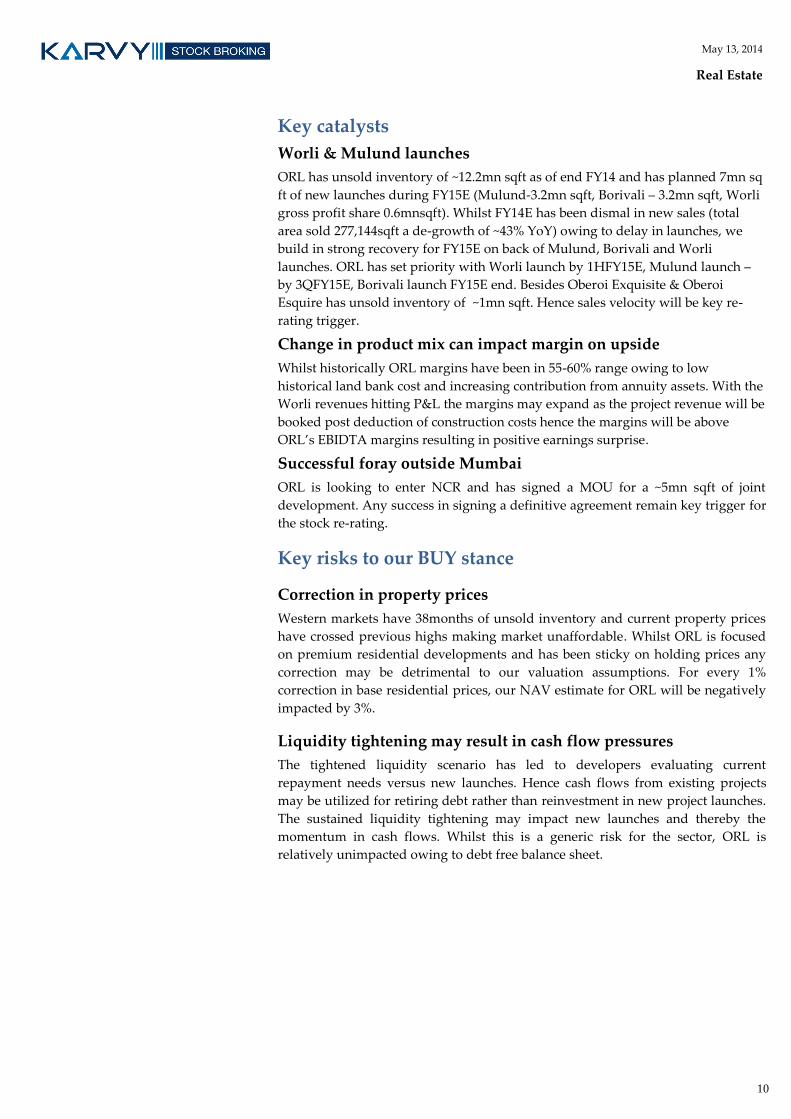
Key catalysts
Worli & Mulund launches
ORL has unsold inventory of ~12.2mn sqft as of end FY14 and has planned 7mn sq
ft of new launches during FY15E (Mulund-3.2mn sqft, Borivali – 3.2mn sqft, Worli
gross profit share 0.6mnsqft). Whilst FY14E has been dismal in new sales (total
area sold 277,144sqft a de-growth of ~43% YoY) owing to delay in launches, we
build in strong recovery for FY15E on back of Mulund, Borivali and Worli
launches. ORL has set priority with Worli launch by 1HFY15E, Mulund launch –
by 3QFY15E, Borivali launch FY15E end. Besides Oberoi Exquisite & Oberoi
Esquire has unsold inventory of ~1mn sqft. Hence sales velocity will be key re-
rating trigger.
Change in product mix can impact margin on upside
Whilst historically ORL margins have been in 55-60% range owing to low
historical land bank cost and increasing contribution from annuity assets. With the
Worli revenues hitting P&L the margins may expand as the project revenue will be
booked post deduction of construction costs hence the margins will be above
ORL’s EBIDTA margins resulting in positive earnings surprise.
Successful foray outside Mumbai
ORL is looking to enter NCR and has signed a MOU for a ~5mn sqft of joint
development. Any success in signing a definitive agreement remain key trigger for
the stock re-rating.
Key risks to our BUY stance
Correction in property prices
Western markets have 38months of unsold inventory and current property prices
have crossed previous highs making market unaffordable. Whilst ORL is focused
on premium residential developments and has been sticky on holding prices any
correction may be detrimental to our valuation assumptions. For every 1%
correction in base residential prices, our NAV estimate for ORL will be negatively
impacted by 3%.
Liquidity tightening may result in cash flow pressures
The tightened liquidity scenario has led to developers evaluating current
repayment needs versus new launches. Hence cash flows from existing projects
may be utilized for retiring debt rather than reinvestment in new project launches.
The sustained liquidity tightening may impact new launches and thereby the
momentum in cash flows. Whilst this is a generic risk for the sector, ORL is
relatively unimpacted owing to debt free balance sheet.
11
May 13, 2014
Real Estate
Financials - Consolidated
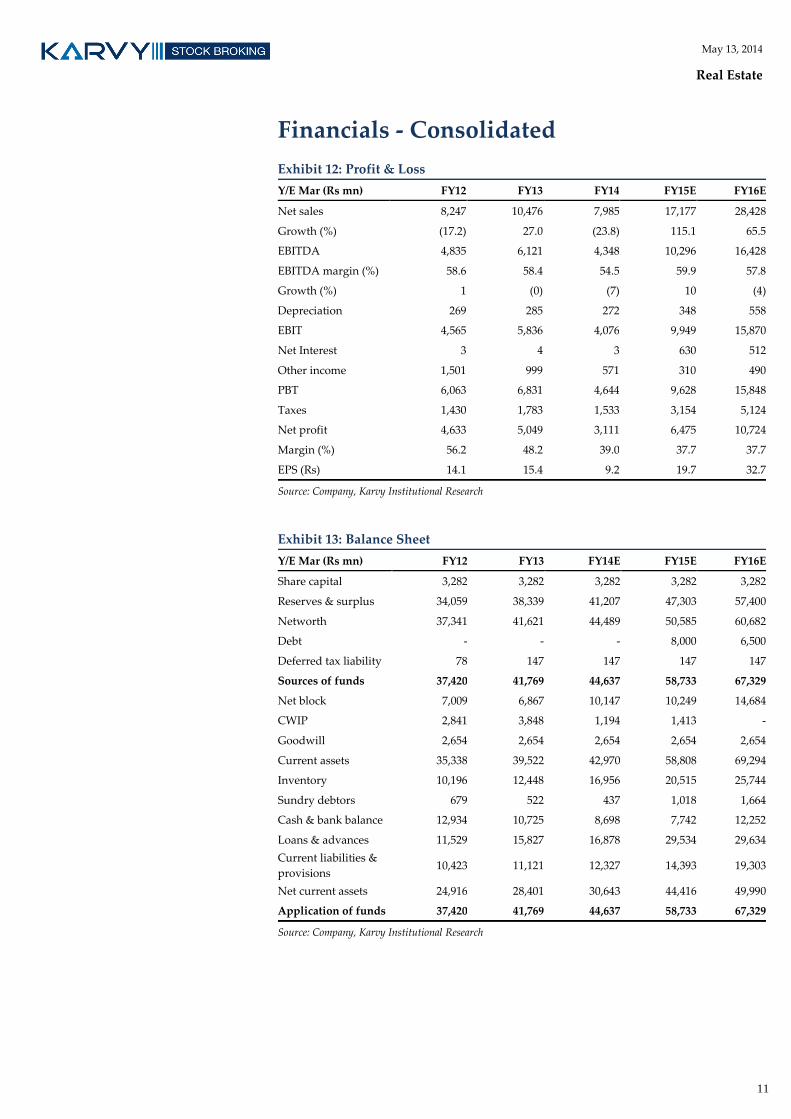
Exhibit 12: Profit & Loss
Y/E Mar (Rs mn) FY12 FY13 FY14 FY15E FY16E
Net sales 8,247 10,476 7,985 17,177 28,428
Growth (%) (17.2) 27.0 (23.8) 115.1 65.5
EBITDA 4,835 6,121 4,348 10,296 16,428
EBITDA margin (%) 58.6 58.4 54.5 59.9 57.8
Growth (%) 1 (0) (7) 10 (4)
Depreciation 269 285 272 348 558
EBIT 4,565 5,836 4,076 9,949 15,870
Net Interest 3 4 3 630 512
Other income 1,501 999 571 310 490
PBT 6,063 6,831 4,644 9,628 15,848
Taxes 1,430 1,783 1,533 3,154 5,124
Net profit 4,633 5,049 3,111 6,475 10,724
Margin (%) 56.2 48.2 39.0 37.7 37.7
EPS (Rs) 14.1 15.4 9.2 19.7 32.7
Source: Company, Karvy Institutional Research
Exhibit 13: Balance Sheet
Y/E Mar (Rs mn) FY12 FY13 FY14E FY15E FY16E
Share capital 3,282 3,282 3,282 3,282 3,282
Reserves & surplus 34,059 38,339 41,207 47,303 57,400
Networth 37,341 41,621 44,489 50,585 60,682
Debt - - - 8,000 6,500
Deferred tax liability 78 147 147 147 147
Sources of funds 37,420 41,769 44,637 58,733 67,329
Net block 7,009 6,867 10,147 10,249 14,684
CWIP 2,841 3,848 1,194 1,413 -
Goodwill 2,654 2,654 2,654 2,654 2,654
Current assets 35,338 39,522 42,970 58,808 69,294
Inventory 10,196 12,448 16,956 20,515 25,744
Sundry debtors 679 522 437 1,018 1,664
Cash & bank balance 12,934 10,725 8,698 7,742 12,252
Loans & advances 11,529 15,827 16,878 29,534 29,634
Current liabilities &
provisions 10,423 11,121 12,327 14,393 19,303
Net current assets 24,916 28,401 30,643 44,416 49,990
Application of funds 37,420 41,769 44,637 58,733 67,329
Source: Company, Karvy Institutional Research
12
May 13, 2014
Real Estate
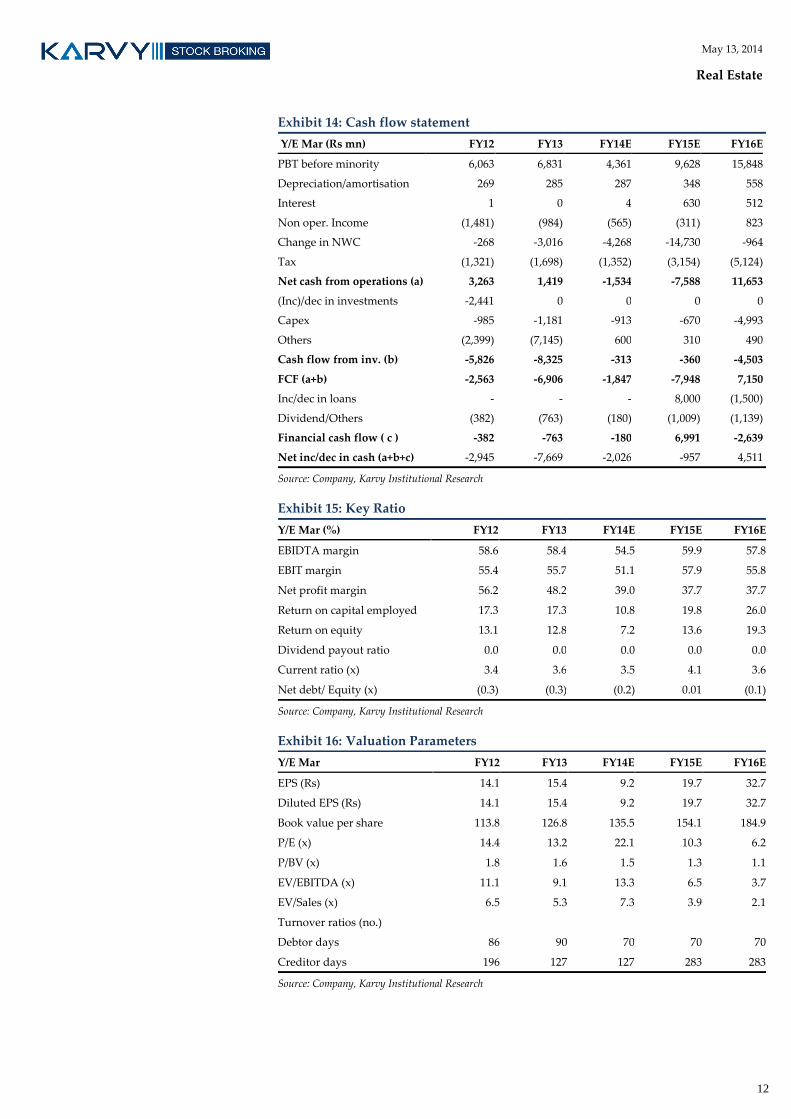
Exhibit 14: Cash flow statement
Y/E Mar (Rs mn) FY12 FY13 FY14E FY15E FY16E
PBT before minority 6,063 6,831 4,361 9,628 15,848
Depreciation/amortisation 269 285 287 348 558
Interest 1 0 4 630 512
Non oper. Income (1,481) (984) (565) (311) 823
Change in NWC -268 -3,016 -4,268 -14,730 -964
Tax (1,321) (1,698) (1,352) (3,154) (5,124)
Net cash from operations (a) 3,263 1,419 -1,534 -7,588 11,653
(Inc)/dec in investments -2,441 0 0 0 0
Capex -985 -1,181 -913 -670 -4,993
Others (2,399) (7,145) 600 310 490
Cash flow from inv. (b) -5,826 -8,325 -313 -360 -4,503
FCF (a+b) -2,563 -6,906 -1,847 -7,948 7,150
Inc/dec in loans - - - 8,000 (1,500)
Dividend/Others (382) (763) (180) (1,009) (1,139)
Financial cash flow ( c ) -382 -763 -180 6,991 -2,639
Net inc/dec in cash (a+b+c) -2,945 -7,669 -2,026 -957 4,511
Source: Company, Karvy Institutional Research
Exhibit 15: Key Ratio
Y/E Mar (%) FY12 FY13 FY14E FY15E FY16E
EBIDTA margin 58.6 58.4 54.5 59.9 57.8
EBIT margin 55.4 55.7 51.1 57.9 55.8
Net profit margin 56.2 48.2 39.0 37.7 37.7
Return on capital employed 17.3 17.3 10.8 19.8 26.0
Return on equity 13.1 12.8 7.2 13.6 19.3
Dividend payout ratio 0.0 0.0 0.0 0.0 0.0
Current ratio (x) 3.4 3.6 3.5 4.1 3.6
Net debt/ Equity (x) (0.3) (0.3) (0.2) 0.01 (0.1)
Source: Company, Karvy Institutional Research
Exhibit 16: Valuation Parameters
Y/E Mar FY12 FY13 FY14E FY15E FY16E
EPS (Rs) 14.1 15.4 9.2 19.7 32.7
Diluted EPS (Rs) 14.1 15.4 9.2 19.7 32.7
Book value per share 113.8 126.8 135.5 154.1 184.9
P/E (x) 14.4 13.2 22.1 10.3 6.2
P/BV (x) 1.8 1.6 1.5 1.3 1.1
EV/EBITDA (x) 11.1 9.1 13.3 6.5 3.7
EV/Sales (x) 6.5 5.3 7.3 3.9 2.1
Turnover ratios (no.)
Debtor days 86 90 70 70 70
Creditor days 196 127 127 283 283
Source: Company, Karvy Institutional Research
Institutional Equities Team Rahul Sharma
Head – Institutional Equities /
Research / Pharma +91‐22 61844310 [email protected]
Gurdarshan Singh Kharbanda Head ‐ Sales‐Trading +91‐22 61844368/69 [email protected]
INSTITUTIONAL RESEARCH
Analysts Industry / Sector Desk Phone Email ID
Hatim Broachwala, CFA Banking +91‐22 61844329 [email protected]
Maruti Kadam Research Associate +91‐22 61844322 [email protected]
Mitul Shah Automobiles/Auto Ancillary +91‐22 61844312 [email protected]
Parikshit Kandpal Infra / Real Estate / Strategy/Consumer +91‐22 61844311 [email protected]
Rahul Singh Textile/MidCap +91‐40‐44857911 [email protected]
Rajesh Kumar Ravi Cement/ Logistics/ Paints +91‐22 61844313 [email protected]
Rupesh Sankhe Power/Capital Goods +91‐22 61844315 [email protected]
Varun Chakri Research Associate +91 22 61844326 [email protected]
Vinesh Vala Research Associate +91 22 61844325 [email protected]
INSTITUTIONAL SALES
Celine Dsouza Sales +91 22 61844341 [email protected]
Edelbert Dcosta Sales +91 22 61844344 [email protected]
INSTITUTIONAL SALES TRADING & DEALING
Bhavesh Gandhi Institutional Sales/Trading +91‐22 61844361 [email protected]
Prashant Oza Institutional Sales/Trading +91‐22 61844370 /71 [email protected]
Pratik Sanghvi Institutional Dealing +91‐22 61844366 /67 [email protected]

For further enquiries please contact:
Tel: +91‐22‐6184 4300
Disclosures Appendix
Analyst certification
The following analyst(s), who is (are) primarily responsible for this report, certify (ies) that the views expressed
herein accurately reflect his (their) personal view(s) about the subject security (ies) and issuer(s) and that no part of
his (their) compensation was, is or will be directly or indirectly related to the specific recommendation(s) or views
contained in this research report.
Disclaimer
The information and views presented in this report are prepared by Karvy Stock Broking Limited. The information
contained herein is based on our analysis and upon sources that we consider reliable. We, however, do not vouch for
the accuracy or the completeness thereof. This material is for personal information and we are not responsible for any
loss incurred based upon it. The investments discussed or recommended in this report may not be suitable for all
investors. Investors must make their own investment decisions based on their specific investment objectives and
financial position and using such independent advice, as they believe necessary. While acting upon any information
or analysis mentioned in this report, investors may please note that neither Karvy nor Karvy Stock Broking nor any
person connected with any associate companies of Karvy accepts any liability arising from the use of this information
and views mentioned in this document.
The author, directors and other employees of Karvy and its affiliates may hold long or short positions in the above
mentioned companies from time to time. Every employee of Karvy and its associate companies are required to
disclose their individual stock holdings and details of trades, if any, that they undertake. The team rendering
corporate analysis and investment recommendations are restricted in purchasing/selling of shares or other securities
till such a time this recommendation has either been displayed or has been forwarded to clients of Karvy. All
employees are further restricted to place orders only through Karvy Stock Broking Ltd. This report is intended for a
restricted audience and we are not soliciting any action based on it. Neither the information nor any opinion
expressed herein constitutes an offer or an invitation to make an offer, to buy or sell any securities, or any options,
futures nor other derivatives related to such securities.
Karvy Stock Broking Limited Institutional Equities
Office No. 702, 7th Floor, Hallmark Business Plaza, Opp.‐Gurunanak Hospital, Mumbai 400 051 Regd Off : 46, Road No 4, Street No 1, Banjara Hills, Hyderabad – 500 034.
Karvy Stock Broking Research is also available on: Bloomberg ‐ KRVY <GO>, Thomson Publisher & Reuters.
Stock Ratings Absolute ReturnsBuy : > 15%Hold : 5‐15%Sell : < 5%