Embed Size (px)
Citation preview
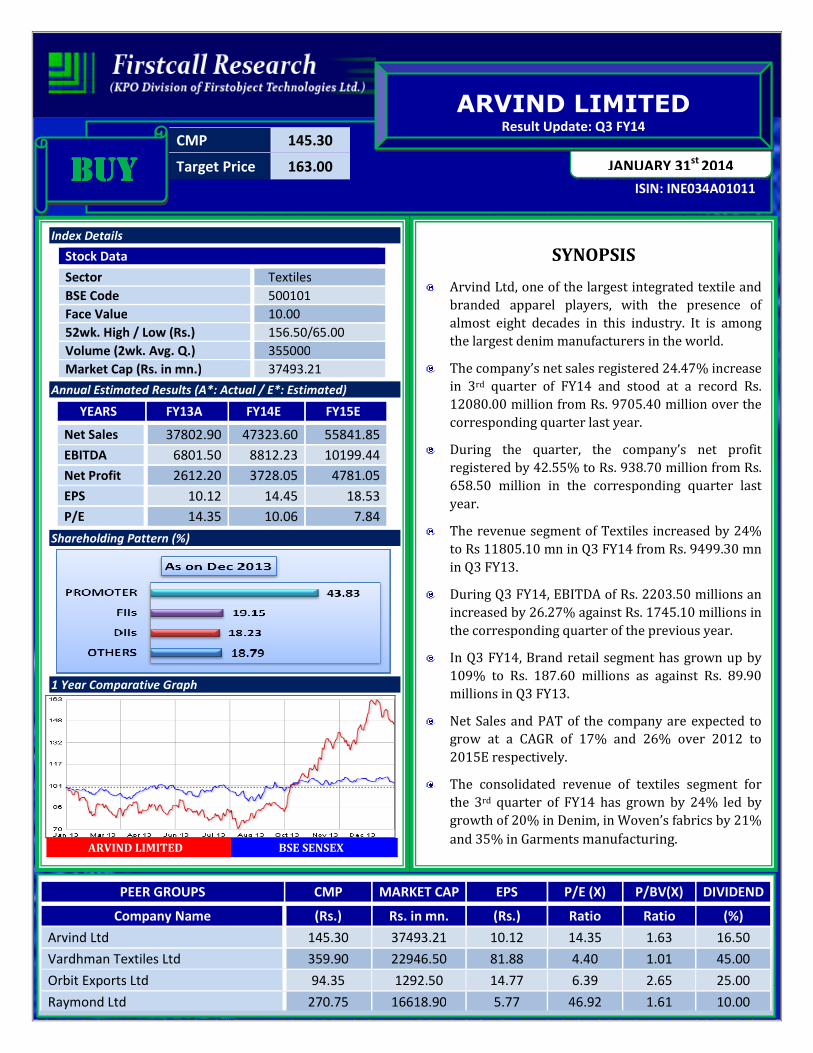
CMP 145.30
Target Price 163.00
ISIN: INE034A01011
JANUARY 31st
2014
ARVIND LIMITED Result Update: Q3 FY14
BUYBUYBUYBUY
Index Details
Stock Data
Sector Textiles
BSE Code 500101
Face Value 10.00
52wk. High / Low (Rs.) 156.50/65.00
Volume (2wk. Avg. Q.) 355000
Market Cap (Rs. in mn.) 37493.21
Annual Estimated Results (A*: Actual / E*: Estimated)
YEARS FY13A FY14E FY15E
Net Sales 37802.90 47323.60 55841.85
EBITDA 6801.50 8812.23 10199.44
Net Profit 2612.20 3728.05 4781.05
EPS 10.12 14.45 18.53
P/E 14.35 10.06 7.84
Shareholding Pattern (%)
1 Year Comparative Graph
ARVIND LIMITED BSE SENSEX
SYNOPSIS
Arvind Ltd, one of the largest integrated textile and
branded apparel players, with the presence of
almost eight decades in this industry. It is among
the largest denim manufacturers in the world.
The company’s net sales registered 24.47% increase
in 3rd quarter of FY14 and stood at a record Rs.
12080.00 million from Rs. 9705.40 million over the
corresponding quarter last year.
During the quarter, the company’s net profit
registered by 42.55% to Rs. 938.70 million from Rs.
658.50 million in the corresponding quarter last
year.
The revenue segment of Textiles increased by 24%
to Rs 11805.10 mn in Q3 FY14 from Rs. 9499.30 mn
in Q3 FY13.
During Q3 FY14, EBITDA of Rs. 2203.50 millions an
increased by 26.27% against Rs. 1745.10 millions in
the corresponding quarter of the previous year.
In Q3 FY14, Brand retail segment has grown up by
109% to Rs. 187.60 millions as against Rs. 89.90
millions in Q3 FY13.
Net Sales and PAT of the company are expected to
grow at a CAGR of 17% and 26% over 2012 to
2015E respectively.
The consolidated revenue of textiles segment for
the 3rd quarter of FY14 has grown by 24% led by
growth of 20% in Denim, in Woven’s fabrics by 21%
and 35% in Garments manufacturing.
PEER GROUPS CMP MARKET CAP EPS P/E (X) P/BV(X) DIVIDEND
Company Name (Rs.) Rs. in mn. (Rs.) Ratio Ratio (%)
Arvind Ltd 145.30 37493.21 10.12 14.35 1.63 16.50
Vardhman Textiles Ltd 359.90 22946.50 81.88 4.40 1.01 45.00
Orbit Exports Ltd 94.35 1292.50 14.77 6.39 2.65 25.00
Raymond Ltd 270.75 16618.90 5.77 46.92 1.61 10.00

Recommendation & Analysis - ‘BUY’
Arvind Limited, one of the largest integrated textile and branded apparel players, posted strong revenue growth
in terms of volumes and profitability during the quarter. Net Sales of Rs. 12080 million for the 3rd quarter of the
current year 2013-14 as against Rs. 9705.40 millions in the corresponding quarter of the previous year. The
company has reported an Operating profit of Rs. 2203.50 millions an increased by 26.27% in Q3 FY14 from Rs.
1745.10 million in Q3 FY13 and a net profit of Rs. 938.70 million showed an increase of 42.55% against Rs.
658.50 million reported respectively in the corresponding quarter of the previous year. Earning per share has
also improved from Rs. 2.55 in Q3 FY13 to Rs. 3.64 in Q3 FY14.
During the nine months ended of 31st Dec 2013, the company achieved net sales of Rs. 34941.60 millions
representing growth of Rs 25.61% over the same period last year while the net profit grew faster pace of 51.23%
and was at Rs. 2665.00 millions against Rs.1761.10 million. In the end of 31st Dec 2013, the revenue segment of
Textiles increased by 25% to Rs 34271.40 mn from Rs. 27336.90 mn and Brand retail segment has grown up by
170% to Rs. 455.60 mn from Rs. 168.50 mn for the nine months end of 31st Dec 2012.
Despite the dampened growth environment across the economy, Arvind Ltd has been able to achieve this
performance due to its continued focus on building a robust business driven by its core values. The company
continues to register all round volume growth as well as price gains across all business segments. The
consolidated revenue of textiles segment has grown by 24% led by growth of 20% in Denim, 21% in Woven’s
fabrics and 35% in Garments manufacturing. Brands & Retail business has registered very strong growth of 30%.
The company expects that the current growth momentum continue for the near future. We expect the company
to post a CAGR of 17% and 26% in its top-line and bottom-line respectively. Hence, we recommend ‘BUY’ for
‘Arvind Ltd’ with a target price of Rs. 163.00on the stock.
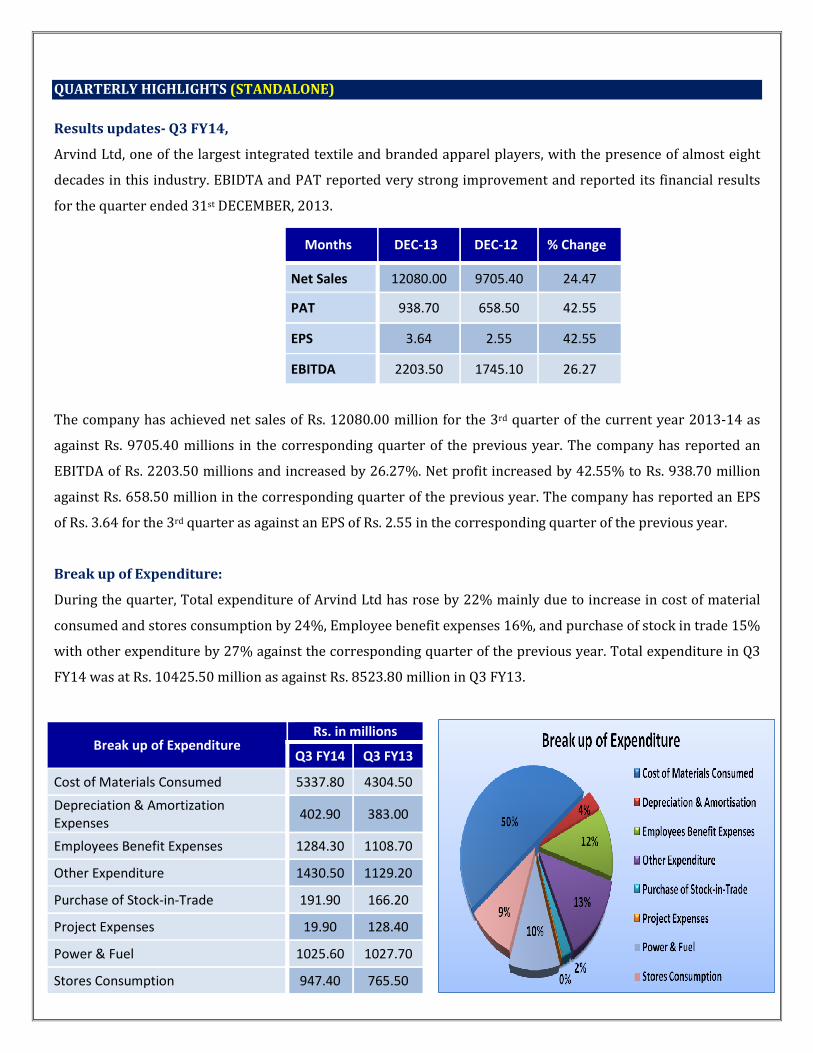
QUARTERLY HIGHLIGHTS (STANDALONE)
Results updates- Q3 FY14,
Arvind Ltd, one of the largest integrated textile and branded apparel players, with the presence of almost eight
decades in this industry. EBIDTA and PAT reported very strong improvement and reported its financial results
for the quarter ended 31st DECEMBER, 2013.
The company has achieved net sales of Rs. 12080.00 million for the 3rd quarter of the current year 2013-14 as
against Rs. 9705.40 millions in the corresponding quarter of the previous year. The company has reported an
EBITDA of Rs. 2203.50 millions and increased by 26.27%. Net profit increased by 42.55% to Rs. 938.70 million
against Rs. 658.50 million in the corresponding quarter of the previous year. The company has reported an EPS
of Rs. 3.64 for the 3rd quarter as against an EPS of Rs. 2.55 in the corresponding quarter of the previous year.
Break up of Expenditure:
During the quarter, Total expenditure of Arvind Ltd has rose by 22% mainly due to increase in cost of material
consumed and stores consumption by 24%, Employee benefit expenses 16%, and purchase of stock in trade 15%
with other expenditure by 27% against the corresponding quarter of the previous year. Total expenditure in Q3
FY14 was at Rs. 10425.50 million as against Rs. 8523.80 million in Q3 FY13.
Months DEC-13 DEC-12 % Change
Net Sales 12080.00 9705.40 24.47
PAT 938.70 658.50 42.55
EPS 3.64 2.55 42.55
EBITDA 2203.50 1745.10 26.27
Break up of Expenditure Rs. in millions
Q3 FY14 Q3 FY13
Cost of Materials Consumed 5337.80 4304.50
Depreciation & Amortization
Expenses 402.90 383.00
Employees Benefit Expenses 1284.30 1108.70
Other Expenditure 1430.50 1129.20
Purchase of Stock-in-Trade 191.90 166.20
Project Expenses 19.90 128.40
Power & Fuel 1025.60 1027.70
Stores Consumption 947.40 765.50

Segment Revenue
COMPANY PROFILE
Arvind Limited started in the year 1931 with the aim of manufacturing the high-end superfine fabrics. Company
invested in very sophisticated technology with 52,560 ring spindles, 2552 doubling spindles and 1122 looms. It
was one of the few companies in those days to start along with spinning and weaving facilities in addition to full-
fledged facilities for dyeing, bleaching, finishing and mercerizing. With 100 Arvind stores up and running, Arvind
Ltd is now aiming to grow the format multi fold to over 400 stores over the next five years.
Arvind Ltd., a US $ 1 Bn Lalbhai Group company is one of the largest apparel brand and retail companies and a
pioneer of denim in India. It has the largest portfolio of foreign licensed apparel brands like Arrow, US Polo,
GANT, Nautica, Izod and Tommy Hilfiger. The company owns & operates India’s largest 225-outlet strong value
retail chain under the brand name ‘Megamart’. It is setting-up exclusive stores across the country - ‘The Arvind
Store’ that brings the best of fabric and ready-mades to its customers. It also manufactures a range of cotton
shirting, denim, knits and bottom weights (Khakis) fabrics and Jeans and Shirts Garments. Arvind, through its
subsidiary company Arvind Lifestyle Brands Limited, is marketing in India the branded apparel under various
brands and is also licensee in India for various international brands.
Apart from this, company is present in Denim, Woven’s and Voiles Fabrics, Technical Textiles, Real Estate and
Organic Cotton Production through cotton farming. The company has forayed into real estate to realize the cash
flow of large land bank either through sale or development in form of joint venture or on its own. It entered
technical textile segment to cater to large demand in the industrial sectors Like Personal Protection, Industrial
Filtration, Wind Energy, Defence, Auto Components, Transportation, and Housing & Infrastructure.
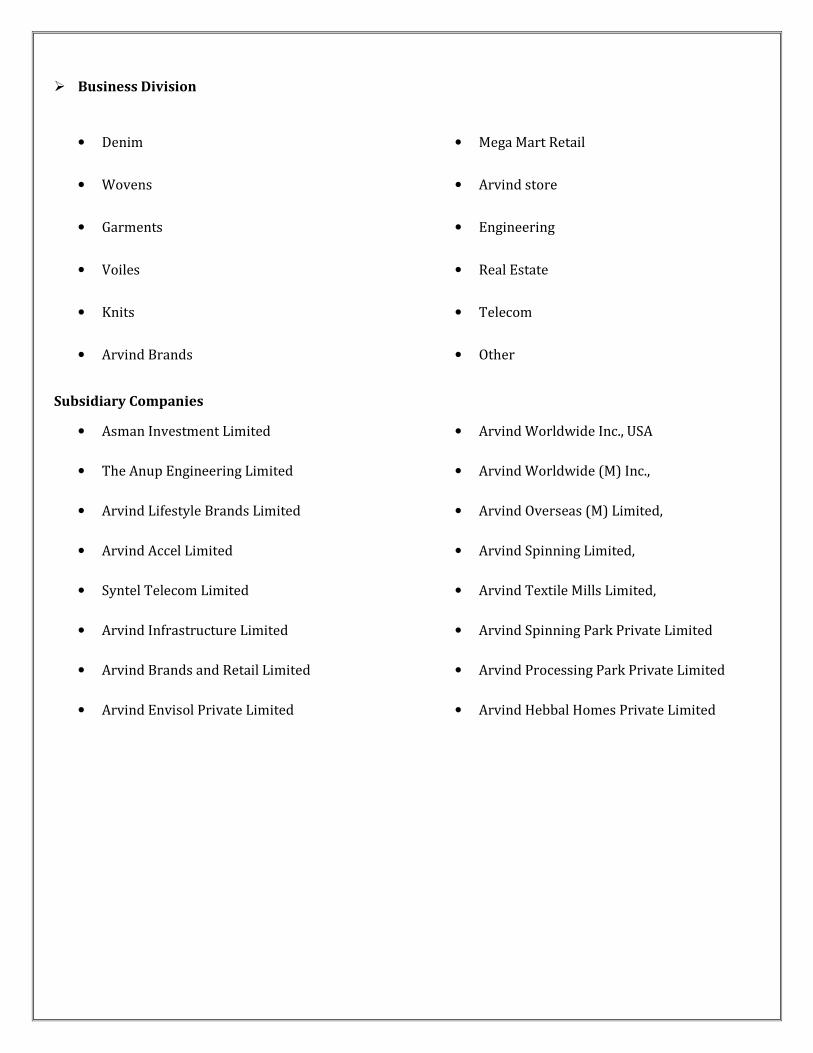
� Business Division
• Denim
• Wovens
• Garments
• Voiles
• Knits
• Arvind Brands
• Mega Mart Retail
• Arvind store
• Engineering
• Real Estate
• Telecom
• Other
Subsidiary Companies
• Asman Investment Limited
• The Anup Engineering Limited
• Arvind Lifestyle Brands Limited
• Arvind Accel Limited
• Syntel Telecom Limited
• Arvind Infrastructure Limited
• Arvind Brands and Retail Limited
• Arvind Envisol Private Limited
• Arvind Worldwide Inc., USA
• Arvind Worldwide (M) Inc.,
• Arvind Overseas (M) Limited,
• Arvind Spinning Limited,
• Arvind Textile Mills Limited,
• Arvind Spinning Park Private Limited
• Arvind Processing Park Private Limited
• Arvind Hebbal Homes Private Limited
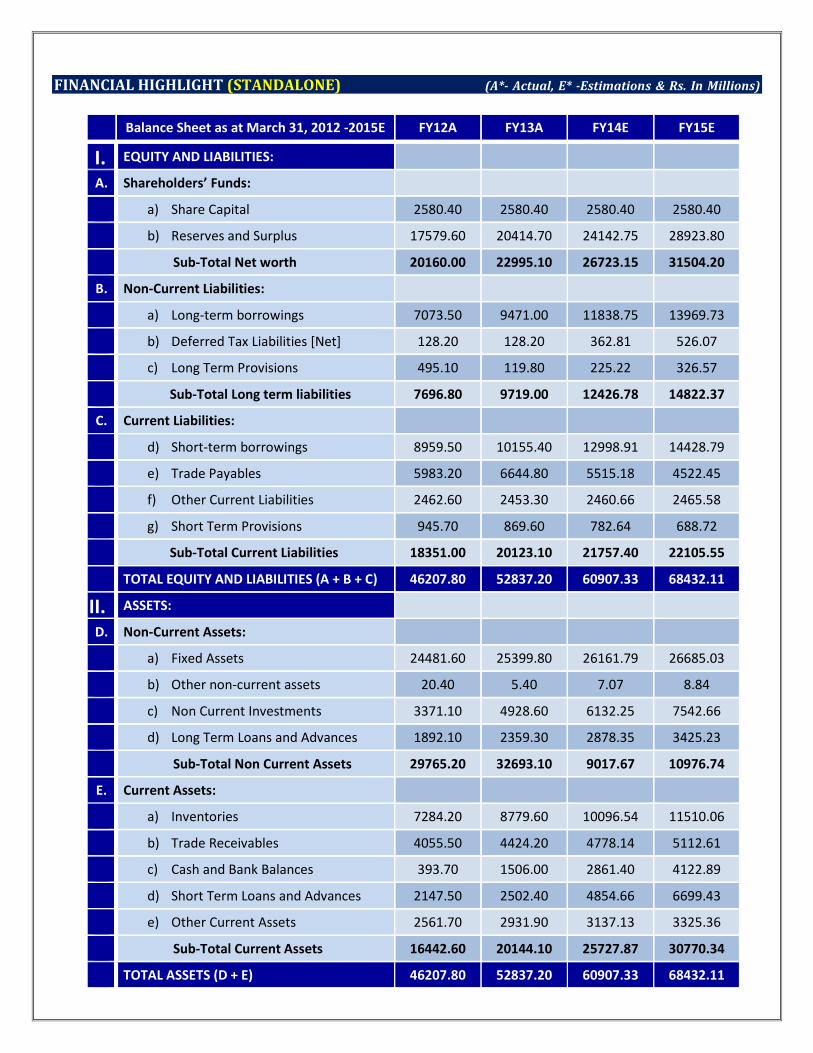
FINANCIAL HIGHLIGHT (STANDALONE) (A*- Actual, E* -Estimations & Rs. In Millions)
Balance Sheet as at March 31, 2012 -2015E FY12A FY13A FY14E FY15E
I. EQUITY AND LIABILITIES:
A. Shareholders’ Funds:
a) Share Capital 2580.40 2580.40 2580.40 2580.40
b) Reserves and Surplus 17579.60 20414.70 24142.75 28923.80
Sub-Total Net worth 20160.00 22995.10 26723.15 31504.20
B. Non-Current Liabilities:
a) Long-term borrowings 7073.50 9471.00 11838.75 13969.73
b) Deferred Tax Liabilities [Net] 128.20 128.20 362.81 526.07
c) Long Term Provisions 495.10 119.80 225.22 326.57
Sub-Total Long term liabilities 7696.80 9719.00 12426.78 14822.37
C. Current Liabilities:
d) Short-term borrowings 8959.50 10155.40 12998.91 14428.79
e) Trade Payables 5983.20 6644.80 5515.18 4522.45
f) Other Current Liabilities 2462.60 2453.30 2460.66 2465.58
g) Short Term Provisions 945.70 869.60 782.64 688.72
Sub-Total Current Liabilities 18351.00 20123.10 21757.40 22105.55
TOTAL EQUITY AND LIABILITIES (A + B + C) 46207.80 52837.20 60907.33 68432.11
II. ASSETS:
D. Non-Current Assets:
a) Fixed Assets 24481.60 25399.80 26161.79 26685.03
b) Other non-current assets 20.40 5.40 7.07 8.84
c) Non Current Investments 3371.10 4928.60 6132.25 7542.66
d) Long Term Loans and Advances 1892.10 2359.30 2878.35 3425.23
Sub-Total Non Current Assets 29765.20 32693.10 9017.67 10976.74
E. Current Assets:
a) Inventories 7284.20 8779.60 10096.54 11510.06
b) Trade Receivables 4055.50 4424.20 4778.14 5112.61
c) Cash and Bank Balances 393.70 1506.00 2861.40 4122.89
d) Short Term Loans and Advances 2147.50 2502.40 4854.66 6699.43
e) Other Current Assets 2561.70 2931.90 3137.13 3325.36
Sub-Total Current Assets 16442.60 20144.10 25727.87 30770.34
TOTAL ASSETS (D + E) 46207.80 52837.20 60907.33 68432.11
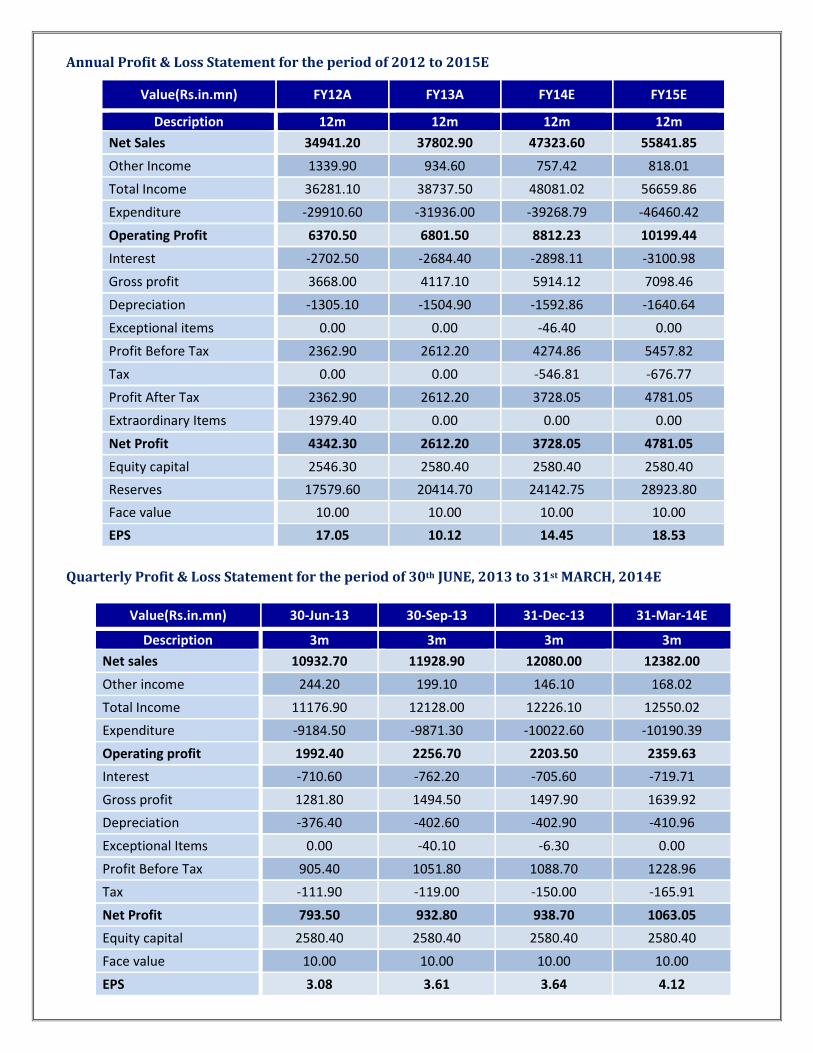
Annual Profit & Loss Statement for the period of 2012 to 2015E
Value(Rs.in.mn) FY12A FY13A FY14E FY15E
Description 12m 12m 12m 12m
Net Sales 34941.20 37802.90 47323.60 55841.85
Other Income 1339.90 934.60 757.42 818.01
Total Income 36281.10 38737.50 48081.02 56659.86
Expenditure -29910.60 -31936.00 -39268.79 -46460.42
Operating Profit 6370.50 6801.50 8812.23 10199.44
Interest -2702.50 -2684.40 -2898.11 -3100.98
Gross profit 3668.00 4117.10 5914.12 7098.46
Depreciation -1305.10 -1504.90 -1592.86 -1640.64
Exceptional items 0.00 0.00 -46.40 0.00
Profit Before Tax 2362.90 2612.20 4274.86 5457.82
Tax 0.00 0.00 -546.81 -676.77
Profit After Tax 2362.90 2612.20 3728.05 4781.05
Extraordinary Items 1979.40 0.00 0.00 0.00
Net Profit 4342.30 2612.20 3728.05 4781.05
Equity capital 2546.30 2580.40 2580.40 2580.40
Reserves 17579.60 20414.70 24142.75 28923.80
Face value 10.00 10.00 10.00 10.00
EPS 17.05 10.12 14.45 18.53
Quarterly Profit & Loss Statement for the period of 30th JUNE, 2013 to 31st MARCH, 2014E
Value(Rs.in.mn) 30-Jun-13 30-Sep-13 31-Dec-13 31-Mar-14E
Description 3m 3m 3m 3m
Net sales 10932.70 11928.90 12080.00 12382.00
Other income 244.20 199.10 146.10 168.02
Total Income 11176.90 12128.00 12226.10 12550.02
Expenditure -9184.50 -9871.30 -10022.60 -10190.39
Operating profit 1992.40 2256.70 2203.50 2359.63
Interest -710.60 -762.20 -705.60 -719.71
Gross profit 1281.80 1494.50 1497.90 1639.92
Depreciation -376.40 -402.60 -402.90 -410.96
Exceptional Items 0.00 -40.10 -6.30 0.00
Profit Before Tax 905.40 1051.80 1088.70 1228.96
Tax -111.90 -119.00 -150.00 -165.91
Net Profit 793.50 932.80 938.70 1063.05
Equity capital 2580.40 2580.40 2580.40 2580.40
Face value 10.00 10.00 10.00 10.00
EPS 3.08 3.61 3.64 4.12

Ratio Analysis
Particulars FY12A FY13A FY14E FY15E
EPS (Rs.) 17.05 10.12 14.45 18.53
EBITDA Margin (%) 18.23 17.99 18.62 18.26
PBT Margin (%) 6.76 6.91 9.03 9.77
PAT Margin (%) 6.76 6.91 7.88 8.56
P/E Ratio (x) 8.52 14.35 10.06 7.84
ROE (%) 11.74 11.36 13.95 15.18
ROCE (%) 21.23 19.49 20.18 19.77
Debt Equity Ratio 0.80 0.85 0.93 0.90
EV/EBITDA (x) 5.81 5.51 4.25 3.68
Book Value (Rs.) 79.04 89.11 103.56 122.09
P/BV 1.84 1.63 1.40 1.19
Charts
OUTLOOK AND CONCLUSION
� At the current market price of Rs. 145.30, the stock P/E ratio is at 10.06 x FY14E and 7.84 x FY15E
respectively.
� Earning per share (EPS) of the company for the earnings for FY14E and FY15E is seen at Rs.14.45 and
Rs.18.53respectively.
� Net Sales and PAT of the company are expected to grow at a CAGR of 17% and 26% over 2012 to 2015E
respectively.
� On the basis of EV/EBITDA, the stock trades at 4.25 x for FY14E and 3.68 x for FY15E.
� Price to Book Value of the stock is expected to be at 1.40 x and 1.19 x respectively for FY14E and FY15E.
� We expect that the company surplus scenario is likely to continue for the next three years, will keep its
growth story in the coming quarters also. We recommend ‘BUY’ in this particular scrip with a target price of
Rs.163.00 for Medium to Long term investment.
INDUSTRY OVERVIEW
The Indian Textile Industry counts among the leading textile industries in the world. Apart from providing the
basic necessities of life, its role in the country’s economic growth is significant. India’s textile industry
contributes about 14 per cent to industrial production; 4 per cent to the country’s gross domestic product (GDP);
17 per cent to its export earnings; and is a source of direct employment for over 35 million people, which makes
it the second largest provider of employment after agriculture. Abundant raw materials, healthy foreign direct
investments (FDI) and a government willing to invest ensures a bright future for India’s textile sector.
Market Size
• The industry is expected to touch US$ 220 billion by 2020, according to estimates by Alok Industries Ltd.
Also, India has the capacity to improve its textile and apparel share in the world trade from the current 4.5
per cent to 8 per cent and reach US$ 80 billion by 2020.
• Garment exports from India grew by 19 per in the period July 2012–July 2013 to touch US$ 1.27 billion, on
the back of increasing demand in developed economies such as the US, according to the Apparel Export
Promotion Council (AEPC).
• India has the advantage of abundant resources of raw materials. It is one of the largest producers of cotton
yarn in the world and there are good resources of fibres such as polyester, silk, viscose, etc. The country is
also home to a wide range of cotton fibre and has a rapidly developing synthetic fibre industry.
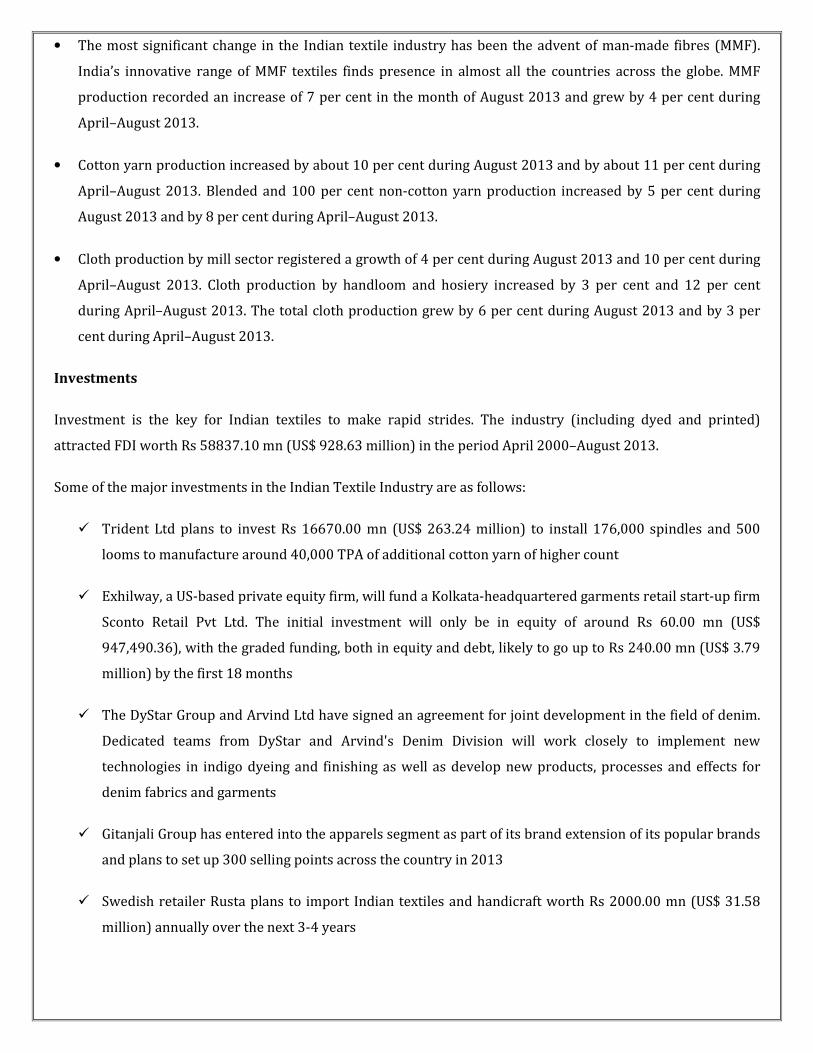
• The most significant change in the Indian textile industry has been the advent of man-made fibres (MMF).
India’s innovative range of MMF textiles finds presence in almost all the countries across the globe. MMF
production recorded an increase of 7 per cent in the month of August 2013 and grew by 4 per cent during
April–August 2013.
• Cotton yarn production increased by about 10 per cent during August 2013 and by about 11 per cent during
April–August 2013. Blended and 100 per cent non-cotton yarn production increased by 5 per cent during
August 2013 and by 8 per cent during April–August 2013.
• Cloth production by mill sector registered a growth of 4 per cent during August 2013 and 10 per cent during
April–August 2013. Cloth production by handloom and hosiery increased by 3 per cent and 12 per cent
during April–August 2013. The total cloth production grew by 6 per cent during August 2013 and by 3 per
cent during April–August 2013.
Investments
Investment is the key for Indian textiles to make rapid strides. The industry (including dyed and printed)
attracted FDI worth Rs 58837.10 mn (US$ 928.63 million) in the period April 2000–August 2013.
Some of the major investments in the Indian Textile Industry are as follows:
� Trident Ltd plans to invest Rs 16670.00 mn (US$ 263.24 million) to install 176,000 spindles and 500
looms to manufacture around 40,000 TPA of additional cotton yarn of higher count
� Exhilway, a US-based private equity firm, will fund a Kolkata-headquartered garments retail start-up firm
Sconto Retail Pvt Ltd. The initial investment will only be in equity of around Rs 60.00 mn (US$
947,490.36), with the graded funding, both in equity and debt, likely to go up to Rs 240.00 mn (US$ 3.79
million) by the first 18 months
� The DyStar Group and Arvind Ltd have signed an agreement for joint development in the field of denim.
Dedicated teams from DyStar and Arvind's Denim Division will work closely to implement new
technologies in indigo dyeing and finishing as well as develop new products, processes and effects for
denim fabrics and garments
� Gitanjali Group has entered into the apparels segment as part of its brand extension of its popular brands
and plans to set up 300 selling points across the country in 2013
� Swedish retailer Rusta plans to import Indian textiles and handicraft worth Rs 2000.00 mn (US$ 31.58
million) annually over the next 3-4 years

Government Initiatives
India is expected to become a significant player in the global textile economy, both as a consumer and as a
producer of textiles. The efforts of the government have resulted in the industry growth rate of 8–9 per cent
during the past 2–3 years.
The Ministry of Textiles is responsible for policy formulation, planning, development, export promotion and
trade regulation in respect of the textile sector. This includes all natural and man-made cellulosic fibres that go
into the making of textiles, clothing and handicrafts.
Some of initiatives taken by the government to further promote the industry are as under:
� The Government of India plans to set up a Rs 1000.00 mn (US$ 15.79 million) venture capital fund to
provide equity support to start-ups in the textile sector, in order to encourage innovative ideas
� The Government has allowed 100 per cent FDI in the sector through the automatic route. In the 12thFive
Year Plan (2012–17), the government plans to spend US$ 9.1 billion on textiles as against US$ 4 billion in
the 11th Plan
� In order to make textile processing units more environment-friendly and globally competitive, the
Cabinet Committee on Economic Affairs (CCEA) has approved an Integrated Processing Development
Scheme (IPDS) with an investment of Rs 5000.00 mn (US$ 78.94 million)
� Under the Technology Upgradation Fund Scheme (TUFS), the cotton textile industry of India will receive
margin money from the Ministry of Finance. The industry is also expected to attract Rs 40000.00 mn (US$
631.65 million) in the form of investments over the next six months
� The Government of India has allotted Rs 7000.00 million (US$ 110.53 million) in the next Five Year Plan
for the development of technical textiles. In 2012–13, the technical textiles industry reached Rs 7.48
trillion (US$ 118.19 billion) at an annual growth rate of 3.5 per cent
� In the new textile policy, the Government of Gujarat has announced 5 per cent interest subsidy on bank
loans for five years, for those who establish new plants for value addition chain like ginning, processing,
weaving, knitting, and machine carpeting
Road Ahead:
The future for the Indian textile industry looks promising, buoyed by both strong domestic consumption as well
as export demand. With consumerism and disposable income on the rise, the retail sector has experienced a
rapid growth in the past decade with the entry of several international players like Marks & Spencer, Guess and
Next into the Indian market. The organised apparel segment is expected to grow at a compound annual growth
rate (CAGR) of more than 13 per cent over a 10-year period.
Disclaimer:
This document prepared by our research analysts does not constitute an offer or solicitation for the purchase or sale
of any financial instrument or as an official confirmation of any transaction. The information contained herein is
from publicly available data or other sources believed to be reliable but do not represent that it is accurate or
complete and it should not be relied on as such. Firstcall India Equity Advisors Pvt. Ltd. or any of it’s affiliates shall
not be in any way responsible for any loss or damage that may arise to any person from any inadvertent error in the
information contained in this report. This document is provide for assistance only and is not intended to be and must
not alone be taken as the basis for an investment decision.

Firstcall India Equity Research: Email – [email protected]
C.V.S.L.Kameswari Pharma
U. Janaki Rao Capital Goods
Ashish.Kushwaha IT, Consumer Durable & Banking
Anil Kumar Diversified
Suhani Adilabadkar Diversified
M. Vinayak Rao Diversified
Firstcall India also provides
Firstcall India Equity Advisors Pvt.Ltd focuses on, IPO’s, QIP’s, F.P.O’s,Takeover
Offers, Offer for Sale and Buy Back Offerings.
Corporate Finance Offerings include Foreign Currency Loan Syndications,
Placement of Equity / Debt with multilateral organizations, Short Term Funds
Management Debt & Equity, Working Capital Limits, Equity & Debt
Syndications and Structured Deals.
Corporate Advisory Offerings include Mergers & Acquisitions(domestic and
cross-border), divestitures, spin-offs, valuation of business, corporate
restructuring-Capital and Debt, Turnkey Corporate Revival – Planning &
Execution, Project Financing, Venture capital, Private Equity and Financial
Joint Ventures
Firstcall India also provides Financial Advisory services with respect to raising
of capital through FCCBs, GDRs, ADRs and listing of the same on International
Stock Exchanges namely AIMs, Luxembourg, Singapore Stock Exchanges and
other international stock exchanges.
For Further Details Contact:
3rd Floor,Sankalp,The Bureau,Dr.R.C.Marg,Chembur,Mumbai 400 071
Tel. : 022-2527 2510/2527 6077/25276089 Telefax : 022-25276089
E-mail: [email protected]
www.firstcallindiaequity.com