Embed Size (px)
Citation preview
India:Latin America's Next Big Thing?
Inter-American Development Bank
Special Report on Integration and Trade
“This book makes an unprecedented contribution to understanding the past, present, and possible futures of economic relations between Latin America and India. Will these relations follow the same path taken by Latin America and China? If not, how might they differ? Using solid knowledge of economic history, hard-to-get data, and sound comparative analysis, the authors shed light on challenges that will be faced in coming years to intensify these relations, arguing that eventual success can be a win-win proposition. A book worth reading from both an academic and a policy-making perspective.” Fernando Henrique Cardoso, President of the Fernando Henrique Cardoso Institute (IFHC), Former President of Brazil
"India and Latin America are increasingly important actors on the global economic stage. Yet in terms of their engagement with each other, they could be likened to two giant ships passing in the night. India: Latin America's next big thing? poses a highly pertinent question and explains why the answer may well be affirmative sooner than we might guess. Thoroughly researched and clearly presented, this study examines the major economic questions facing India and Latin America. By elucidating the uneven and sequentially eccentric development paths both have taken, the study asks how their growing interaction could benefit each. A very useful source for economists and non-economists alike interested in two hugely important regions of the world—and their future relationship."
Edward Luce, Financial Times Editor (Washington DC) and author of “In Spite of the Gods: The Strange Rise of Modern India”
"What policy lessons does India's dramatic economic transformation hold for the countries of Latin America? What opportunities and challenges does it offer the region? What synergies exist between India and Latin America? This report offers the first analytic and in-depth analysis of these and other important questions. Thoroughly researched and lucidly written, it is essential reading for policy makers in both Latin America and India."
Arvind Panagariya, Jagdish Bhagwati Professor of Indian Political Economy at Columbia University and author of "India: The Emerging Giant."
INTEGRATION AND TRADE
Mauricio Mesquita MoreiraCoordinator
India: Latin America's Next Big Thing?
978-1-59782-118-6
C
M
Y
CM
MY
CY
CMY
K

India: Latin America’s Next Big Thing?
CoordinatorMauricio Mesquita Moreira
Inter-American Development Bank
The views expressed herein are those of the authors alone, and do not necessarily reflect the views of the Inter-American Development Bank or any of its member countries.
© Inter-American Development Bank, 2010. All rights reserved. No part of this book may be reproduced or utilized in any form or by any means, electronic or mechanical, including photocopying, recording, or by informa-tion storage or retrieval system, without permission from the IDB.
Inter-American Development Bank1300 New York Avenue, N.W.Washington, D.C. 20577www.iadb.org
Cataloging-in-Publication data provided by theInter-American Development BankFelipe Herrera Library
India : Latin America’s next big thing? / [coordinated and written by Mauricio Mesquita Moreira].
p. cm. Includes bibliographical references. ISBN 978-1-59782-118-6
1. Latin America—Commerce—India. 2. India—Commerce—Latin America. 3. Latin America—Foreign economic relations—India. 4. India—Foreign economic relations—Latin America. 5. India—Economic conditions. I. Moreira, Maurício Mesquita. II. Inter-American Development Bank.
HF3230.5.Z75 I53 2010
Editor: Roger HamiltonProofreader: Mark PayneTypesetting: The Word Express, Inc.Cover design: Fernando Ronzoni, Design Unit, Department of General Services, IDB
>> Contents
Prologue . . . . . . . . . . . . . . . . . . . . . . . . ix
Acknowledgements . . . . . . . . . . . . . . . . . . . xi
Introduction . . . . . . . . . . . . . . . . . . . . . . xiii
Chapter 1
India’s Growth Story: A Latin American Perspective . . . . . . . 1
Chapter 2
The Bilateral Relationship: Trade, Investment and Cooperation . . 53
Chapter 3
The Competitive Challenges . . . . . . . . . . . . . . . . 99
Summary and Conclusions . . . . . . . . . . . . . . . . 137
<< India: Latin America’s Next Big Thing?iv
Boxes
Box 1.1 India’s Trade Agreements . . . . . . . . . . . . . 10Box 1.2 India’s Special Economic Zones . . . . . . . . . . . .11Box 1.3 Indian Institutes of Technology . . . . . . . . . . . 27Box 1.4 India’s and LAC’s Diaspora Networks . . . . . . . . 32Box 2.1 Trends in Indian Outward FDI Policy . . . . . . . . 72Box 2.2 Tata sets up BPO/IT Center in Uruguay . . . . . . . 78Box 2.3 Brazilian Marcopolo and Indian Tata Motors join
forces to manufacture buses and coaches for Indian and other international markets. . . . . . . . . . . 79
Box 2.4 Microfinance in India . . . . . . . . . . . . . . . 83Box 2.5 Conditional Cash Transfer Program in LAC . . . . . . 84Box 2.6 Revamping South-South Cooperation:
India-Brazil-South Africa (IBSA) Dialogue Forum . . . 85Box 3.1 Emerging Local IT Firms . . . . . . . . . . . . . 108Box 3.2 Indian FDI in business process services in LAC.
The case of Genpact Mexico . . . . . . . . . . . . 109Box 3.3 Jaguar & Land Rover bought by Tata . . . . . . . . 130
Tables
Table 1 Tariff Structure: India and Brazil (%) . . . . . . . 13Table 2 Sources of Growth: India, China and Selected Latin
American Countries. Annual percentage rate of change, 1990–2003 (%) . . . . . . . . . . . 36
Table 3 India’s Sectoral Employment Growth – Current Daily Status . . . . . . . . . . . . . . . . . 40
Table 1.A.1 Predicted Value of Manufacturing Exports . . . . . 51Table 1.A.2 Predicted Value of Labor-Intensive Manufacturing
Exports . . . . . . . . . . . . . . . . . . . 52Table 4 Dietary Energy Consumption of Meat and
Vegetables (kcal/person/day) 2005 . . . . . . . . 56Table 5 China & India Tariffs on LAC’s Exports, 2007 . . . 64Table 6 LAC Tariffs on India’s and China’s Exports . . . . 65
vContents >>
Table 7 Main Determinants of Ocean Freight Rates for Imports from India and China: Selected LAC Countries, 2005 . . . . . . . . . . . . . . . 68
Table 8 Selected India-LAC Cooperation Initiatives . . . . 81Table 2.A.1 Income Elasticity of Import Demand Dependent
Variable: Ln Bilateral Imports . . . . . . . . . . 93Table 2.A.2 Determinants of Ocean Shipping Costs for Imports 97
Figures
Figure 1 Trends in GDP Per Capita Growth: China, India, Korea, Mexico and Brazil, 1954–2007, constant 2000 International US$ . . . . . . . . . . . . . . 4
Figure 2 Share of World Merchandise Exports: China, India, Korea, Brazil and Mexico, 1962–2006 . . . . . . . . 5
Figure 3 GDP Per Capita Relative to the U.S: India, China, Korea, Mexico and Brazil, 1950–2007, constant 2000 International US$ . . . . . . . . . . . . . . 8
Figure 4 Privatization Proceeds for India, China and LAC, 1989–99 and 2000–07, US$ millions . . . . . . . . 15
Figure 5 Trends in Goods Trade to GDP Ratio: India, China, Korea, Brazil and Mexico, current US$ . . . . . . . 17
Figure 6 Exports of Manufacturing Goods Post-Trade Liberalization: China, India, Brazil and Mexico, initial year to 2006 . . . . . . . . . . . . . . . 18
Figure 7 Ratio of the Observed to the Predicted Value of Manufactured Exports: India, China, Brazil and Mexico, 1962–2006 . . . . . . . . . . . . . . . 20
Figure 8 Ratio of the Observed to the Predicted Value of Labor-Intensive Exports: India, China, Brazil and Mexico, 1962–2006 . . . . . . . . . . . . . . . 20
Figure 9 Selected Education Indicators for LAC, India and China. Latest year available . . . . . . . . . . 25
Figure 10 Share of Services in Total Exports: India, China, LAC, Brazil and Mexico, 1982–2006 (%) . . . . . . 29
<< India: Latin America’s Next Big Thing?vi
Figure 11 Composition of India and LAC Service Exports . . . 29Figure 12 Annual Growth and Contribution to Growth by
Sector, India, 1991–92 to 2006–07 . . . . . . . . . 34Figure 13 Share of Agriculture in Total Employment after
the Reforms: China and India . . . . . . . . . . . 41Figure 14 Selected Natural Resources Per Capita: China,
India and LAC, 2005 . . . . . . . . . . . . . . 55Figure 15 Percentage of Potential Rain-Irrigated Arable Land
in Use. LAC, China and India, 1994 . . . . . . . . 55Figure 16 Bilateral Trade Between LAC and India and LAC
and China, 1995–2007 . . . . . . . . . . . . . . 56Figure 17 GDP and Trade to GDP Ratios: China and India,
1980–2007, US$ 2005 PPP and % . . . . . . . . . 57Figure 18 World’s, China’s and India’s Income Elasticity of
Import Demand for LAC Goods, 1990–2000 and 2001–2006 . . . . . . . . . . . . . . . . . . 58
Figure 19 China’s and India’s Income Elasticity of Import Demand for LAC Goods, 1990–2000, 2001–2006 . . 59
Figure 20 Trade Complementarity Index: India, China and LAC 61Figure 21 LAC Net Exports to India and China by Product
Category, 1995–2007 . . . . . . . . . . . . . . 63Figure 22 Tariffs and Ad Valorem Freight Expenditures on
LAC Imports from China and India, 2005 (%) . . . . 66Figure 23 Median Sectoral Responses from Selected LAC
Countries to a 10% Reduction in either Freight or Tariffs Imposed on Chinese and Indian Imports . . . 70
Figure 24 Stock of Direct Investments Abroad: India, China, Brazil, Mexico and Latin America, 1982–2007 . . . . 73
Figure 25 FDI Outflows and Mergers and Acquisitions: Latin America, India and China. Annual averages, 2005–07, US$ Million . . . . . . . . . . . . . . 74
Figure 26 Direction of India’s Outward FDI, 1991–95 and 2002–06 (%) . . . . . . . . . . . . . . . . . 76
Figure 27 Exports of Computer and Information Services Top World Exporters, 2007 . . . . . . . . . . . 100
viiContents >>
Figure 28 Exports of Other Business Services: Top World Exporters, 2007 . . . . . . . . . . . . . . . . 102
Figure 29 U.S. International Purchases of Computer Information Services. Cross-border and through Affiliates, 2007 . . . . . . . . . . . . . . . . 103
Figure 30 U.S. International Purchases of Other Business, Professional and Technical Service: Cross-border and through Affiliates, 2007 . . . . . . . . . . . 104
Figure 31 Composition of U.S. International Purchases of Other Business, Professional and Technical Services. India, LAC and Selected LAC countries: Cross-border and through Affiliates,* 2007 . . . . . 105
Figure 32 Restrictiveness Indexes for Professional Services . . . 113Figure 33 Commitments in GATS and Income Levels . . . . . 114Figure 34 Shares of U.S. Manufactured Imports: India,
China and Selected LAC Economies, 1996–2008. . . 116Figure 35 Shares of U.S. Manufactured Imports: India,
China and Selected LAC Economies, 1996–2008. . . 118Figure 36 Shares of World Manufactured Imports: India,
China and Selected LAC Economies, 1996–2007 . . . 119Figure 37 LAC’s Market Share Losses to India in the US Market:
Manufacturing Goods Exports, 1996/97–2007/08 . . 122Figure 38 LAC’s Market Share Losses to China in the
US Market: Manufacturing Goods Exports, 1996/97–2007/08 . . . . . . . . . . . . . . . . 123
Figure 39 Distribution of LAC’s Market Share Losses to India and China by Selected Sub-Regions and Countries: Manufacturing Goods, U.S. Market, 1996–07 to 2007–08 . . . . . . . . . . . . . . . . . . . 123
Figure 40 The Percentage Market Share Impact of a 10% Increase in India’s and/or China’s Market Shares: U.S. Market, 2000–2008 . . . . . . . . . . . . 125
Figure 41 Concentration of World Manufacturing Exports: Herfindahl-Hirschman Index (HHI), 1980–2006, 1980 = 100 . . . . . . . . . . . . . . . . . . 131

>> Prologue
Economic historians when looking back at the 21st century will be probably talking about a seismic change in the world’s economic ge-ography led by Asia. They will not be just talking about Japan, Korea
or China. It is very likely that India will be among the protagonists because of its extraordinary resources—most precious of all, the size and skills of its labor force—its resilient democracy and because of the impressive growth record the country has achieved in the last few decades.
At first blush, India and Latin America may not seem like a natural fit. Placed on opposite sides of the globe, they have few cultural and his-torical ties. And even though India is not yet on the radar of most Latin American and Caribbean policymakers and businessmen, at least not to the same extent as China, the region cannot afford to continue to ignore the implications of its emergence. True, bilateral trade and investment have yet to acquire a critical mass and India has yet to become a major competitor in world markets for goods. However, any cursory analysis of the complementarity between the two economies shows that the potential for massive bilateral trade is there; not unlike that which the region has been experiencing with China. Likewise, recent trends and the ultimate political imperative to generate jobs suggest that India is on its way to becoming a major exporter of manufacturing goods. In services, it is already the dominant world exporter.
It is with these facts in mind, and with the aim to better inform the Bank’s and its stakeholders’ policies, that the Integration and Trade Sector
<< India: Latin America’s Next Big Thing?x
of the Inter-American Development Bank has prepared this report. The focus is on trade and investment between Latin America and the Carib-bean and India. The motivation is to better understand and promote the potential for greater trade and integration between the two economies, while singling out the main obstacles that have so far blocked its realization. But that is not all. In its search for useful policy lessons, the report also looks at the strikingly similarities in the development strategies pursued by both economies and their frequently divergent results. It also delves into the competitive implications for LAC producers of the emergence of another one-billion-plus-people economy.
Only 100 years ago, Europe towered over the rest of the world. By some forecasts, the combined gross domestic products of China and India will be 10 times larger than Europe’s entire annual output by 2040. Latin American countries are aware of such projections, which is why trade pacts with Asian counterparts are proliferating. Latin American countries have signed, negotiated or implemented more than 25 pacts with Asian countries over the past few years, and India is among these partners already. In the past, Latin America and India were rarely at the table when major decisions were made. Now they are often seated side-by-side, shaping global negotiations on topics ranging from trade to climate change. We are starting to see what the century of Asia will look like and Latin America cannot afford to be absent.
Luis Alberto MorenoPresident IDB
>> Acknowledgements
India: Latin America’s Next Big Thing? is the product of a collaborative research effort within the Trade and Integration Sector (INT) of the Inter-American Development Bank under the general supervision of
Antoni Estevadeordal, Sector Manager. The report was coordinated and written by Mauricio Mesquita Moreira, INT Research Coor-dinator, based on research done within and outside the Bank. The in-house work benefited from the collaboration of: Juan Blyde, INT trade economist, in estimating the determinants of India’s and China’s export freights to LAC in Chapter II and in researching and writing the services section of Chapter III; and of Christian Volpe, INT trade economist, in carrying out estimates of the impact of transport costs on LAC-INDIA bilateral trade, discussed in Chapter II.
Kati Suominen, INT trade economist, oversaw the commission-ing of the external inputs, which consisted of 11 background papers on specific issues related to India’s emergence and its economic relationship with Latin America and the Caribbean. These papers were the follow-ing: Shashi Buluswar, Tamy Gelman and Peter Tynan, “India’s Inte-gration into the Global Economy: Lessons and Opportunities for Latin America and the Caribbean”; Ashok Kotwal and Bharat Ramaswami, “Growth and Poverty – Experience of India and Mexico”; Suman Bery, “India’s Development Journey: Any Lessons for Latin America?”; Pranab Bardhan, “Some Reflections on Democracy and Political Economy of Development in India”; Anna Lee Saxenian and Janaki Srinivasan,
<< India: Latin America’s Next Big Thing?xii
“Diaspora Networks Understanding India: Latin American Perspectives”; Gangadhar Prasad Shukla, “Fiscal Federalism in India: A Comparative Study”; Pawan Agarwal, “Indian Higher Education: Contradictions and Optimism”; Jessica Wallack, “A Tale of Two Transitions: From Public Toward Private Provision of Infrastructure in India and Latin America”; Rajiv Kumar, “India: Towards a Competitive Manufacturing Sector”; Saulo Nogueira and André Nassar, “Dynamics of the Agri-Food Sec-tor in India and MERCOSUR: Differences, Trends and Potential Com- plementarities”; Jessica Mullan, Martin Kenney and Rafiq Dossani, “Will It Be a Winner Takes All in the Increased Offshoring of IT-based Activities: The Current State of Play for Latin America.”
We would like to thank Yee Wong and Marco Antonio Martinez for providing excellent research assistance.
>> Introduction
Over the past decade, the economic performance and future prospects of Latin America and the Caribbean (LAC) have been radically transformed by the emergence of China, a fast growing, immensely
populous and resource-scarce economy. China’s rise has brought both opportunities and challenges for all countries in the region (see Devlin, Estevadeordal and Rodriguez 2004).
For LAC, opportunities so far have taken the form of a vast new market for natural resources, largely mineral and agricultural. Demand has been driven not only by China’s direct and massive needs, but also, and at least until recently, by China’s contribution to a fast growing world economy. These two trends alone have helped to turn a low-growth re-gion, with low savings and high budget and current account deficits, into a more dynamic economy driven by better fundamentals. On the import side, China has given LAC the opportunity to tap into a new and reliable source of cheaper manufacturing goods for producers and consumers.
But opportunities also bring challenges. The strength of China’s competitiveness in manufacturing—based on low wages, large-scale, high productivity growth and a supportive state—soon became evident as LAC share of world exports began to erode, threatening the region’s long-term survival as an exporter of manufacturing goods.
This competitive pressure has forced policy makers to confront difficult challenges. Perhaps the toughest among them is to find relevant niches in a crowded world market, where LAC enjoys geographical and
<< India: Latin America’s Next Big Thing?xiv
natural resource advantages while avoiding the risks of specializing in a small number of basic products with little potential for creating jobs and growth.
While the full impact of China’s emergence is still unfolding, the region is already coming to terms with a new “shock” brought about by the fast growth and increasing presence of another one-billion-plus-people economy: India.
For decades after its independence in 1947, India remained a relative backwater of international economic activity, with a large, but under-utilized workforce and an economy that was all but closed to trade and investment. The population was predominantly rural and agrarian and most industries were heavily controlled—if not outright owned—by the national government. Severe import restrictions and heavy trade tariffs closed off the market to foreign products, and entrepreneurism on any scale beyond “mom-and-pop shops” was strangled by red tape. Hundreds of thousands of the best educated Indians left their country to seek better rewards for their talents.1
Then, in the mid 1980s, India began to change course. First it made modest, “business-oriented” reforms. These were soon followed by an all-out attempt in the early 1990s to open up and deregulate the economy. In the less than 20 years since then, India has exploded into a regional, and even global, economic powerhouse, growing at between 6.5 percent and 8 percent over the last decade.2 This surge in growth put India among the ranks of the world’s fastest growing economies. India’s economic growth has been fueled by—and in turn, contributed to—its integration into the global marketplace. Trade in goods and services, which accounted for only a fraction of India’s economy two decades ago, in 2007 comprised 46 percent of the country’s GDP. Inward foreign investment has risen equally dramatically, from less than $100 million in 1990–91 to $32.5 billion in 2007–08, while portfolio investment shot up from $6 million to $29.4 billion during the same period.3
1 Buluswar, Gelman and Tynan (2009). 2 Source: World Bank WDI.3 Reserve Bank of India.
Introduction >> xv
What do these changes mean for LAC? What challenges and op-portunities do they bring? Can LAC repeat with India the explosive trade it had with China in the last decade? Would India merely amplify China’s impact and present the same sort of policy challenges with which the region is already struggling? Or will India pose a different set of issues?
We try to address these questions in this report by focusing on the main channel through which India’s emergence is likely to be felt: trade and investment in goods and services. The analysis is divided into three chapters, followed by conclusions and policy recommendations.
In the first chapter we provide background for the analysis and pres-ent major highlights of India’s growth over the last two decades. We show that both LAC and India followed a long and winding road back to world markets and ended-up paying a high price in term of growth forgone. We argue that whereas market–oriented reforms seem to be clearly behind India’s take-off, their pace was slower and their scope was much more limited than similar reforms in LAC.
We also argue that despite the importance of the reforms, and par-ticularly the trade reforms, India’s growth story defies any cookie-cutter characterization. It can hardly be described as an export-led growth story or as an unprecedented “service-led” story. But it does have some of the key elements we usually associate with high growth, such as relatively high rates of investment in physical capital and productivity growth. We conclude the chapter by addressing the issue of sustainability and by discussing two main concerns which are no strangers to LAC: fiscal fundamentals and insufficient job growth, particularly at the bottom of the income distribution.
In Chapter 2 we analyze LAC-India bilateral trade, investment and cooperation, and assess its determinants, potential, and constraints. If trade theory is any guide, there seems to be a large potential for LAC to trade with India, and largely for the same reasons that its trade with China has taken off: India is, by any measure, a country that is relatively scarce in natural resources and abundant in labor, whereas most of LAC is the opposite. Moreover, size and the similarity of consumer preferences between the two economies can also provide powerful incentives to trade.
<< India: Latin America’s Next Big Thing?xvi
However, we show that both the volume and diversification of bi-lateral trade fall short of what is suggested by theory. This is particularly evident when China—whose endowments complement LAC’s to the same extent as India’s—is used as a benchmark. The high tariffs and transport costs and, to a lesser extent, the mismatch between India’s exports and LAC’s imports seem to be the main explanation behind this “missing trade.”
We argue that the benefits of actions to reduce these trade costs likely extend beyond trade. They will also provide firmer ground for boosting still limited bilateral investments. In addition, they will strengthen and consolidate the growing number of India-LAC cooperation initiatives in areas that include education, poverty alleviation, and joint action in international fora.
In Chapter 3 we try to assess the competitive pressures on LAC’s producers of services and goods arising from India’s emergence. Unlike the case of China, India’s penetration in world markets has been driven more by services than goods, which raises entirely different questions for LAC. This chapter takes a close look at this challenge, analyzing India’s and LAC’s competitive strengths based on available, hard-to-get, data on trade in services. It also examines goods and, unlike services and unlike the case of China, the issue here is more India’s potential as an exporter rather than the current size of its presence in world markets.
The final chapter summarizes the main findings and spells out the main policy recommendations for both maximizing opportunities in bilat-eral trade with India and for meeting the challenges that the emergence of this country poses to the region.
India’s Growth Story: A Latin American Perspective
When economists talk about growth these days they use words such as “mystery,” “elusive,” and “knowledge gaps.”1 This posture of humility reflects the profession’s difficulties in forging a consensus
on the key drivers of economic growth, either in terms of theory or in terms of explanations centered on concrete country experiences. That has been particularly the case with the East Asian tigers in the 1980s and 1990s, and more recently with China.
The debate about India’s growth is no exception. The very complex interplay of government intervention, market forces, and trade, which marks India’s experience, is the perfect breeding ground for a variety of theories on the factors that really made the difference. Lacking definitive answers to counterfactual questions, such as how much India would have grown without government intervention, the debate remains inconclusive and, as is the case with other countries, is likely to be settled and resettled in more political than technical terms.
However, even the most skeptical analyst is likely to agree that what happened to India cannot be understood without considering the role of trade and integration. In other countries as well, including Japan, China, and Latin America in its recent growth spurt, trade and integration have
1 As Helpman (2004:ix) sums up: “For centuries economists have been preoccupied with the growth of nations, and they have studied this subject continually since Adam Smith. This effort has produced a better understanding of economic growth. But the subject has proved elusive, and many mysteries remain.”
>> 1
<< India: Latin America’s Next Big Thing?2
been major drivers of growth. It was not always laissez-faire. There has been plenty of government intervention, but all of these countries have experienced an extraordinary increase in trade flows.
This said, we do not pretend to give a full and definitive explanation of India’s robust growth in this chapter. Instead we focus on the most vis-ible elements of this story—India’s reintegration into the world economy, and look at them from a Latin American perspective. The ultimate goal is to inform the analysis of the following chapters.
Leaving the “whirlpool of economic imperialism”
India’s growth story, at least until the early nineties, resembles that of LAC’s largest countries more than that of its East Asian counterparts. As in Brazil and Mexico, the prevailing wisdom in India in the 1950s favored inward-oriented industrialization as the best growth strategy. The years of colonial rule, with all their distortions and inequities, had given trade a bad name, a perception that was compounded by the economic stagnation of the interwar period and the “success” of socialist, autarkic economies.
Nehru declared in 1946 that international trade was a “whirlpool of economic imperialism,”2 and Latin American leaders generally agreed, although their rhetoric was more pragmatic and conciliatory. The mantra in LAC was that free trade was imposing “structural constraints” on the region’s growth.
True, India went much further than LAC in intervening in markets and restricting trade and integration. Even though five-year develop-ment plans were also a feature of economic policy well into the 1970s in countries such as Brazil, India’s plans, adopted right after independence in 1947, involved much tighter control of resource allocation.
Policy instruments such as the “license raj” adopted in 1951, in which the state gained control over the establishment, location, and expansion of a wide range of businesses, were not in Latin American policymakers’ “playbook,” except perhaps those in Cuba. Likewise, India’s restrictions on foreign direct investment (FDI), which reduced foreign ownership to
2 J. Nehru. The Discovery of India , 1946 p. 546, cited in Srinivasan and Tendulkar (2003).
3India’s Growth Story: A Latin American Perspective >>
a bare minimum, and the adoption of a labor law that controlled even the tasks being assigned to employees, were far more radical than measures taken in LAC.3
Yet, if there were important nuances in scope and implementation, the “core” of both India’s and LAC’s strategy was exactly the same: extremely high tariffs, a multitude of non-tariff barriers, and fixed and multiple exchange rates, coupled with the expansion of the state’s role in producing goods, particularly capital-intensive products such as steel, petrochemicals, and heavy machinery.
The results of this “Big Push” into industry are the subject of heated controversies. In India as in Latin America, some argue that the inward-oriented strategy boosted growth as well as technological and entrepreneurial skills, which were an important support for the market-oriented reforms adopted later on. But critics point out that when the growth happened, it was either too slow, or unsustainable, or both. They argue that the severe price distortions resulting from this strategy led to low job growth, inequality, frequent balance of payments crises, and low productivity, as domestic firms faced little competition and did not have full access to imported goods and technology.4
While it would be wrong to outright dismiss any progress made during the “import substitution” years, it is clear that both India and LAC missed invaluable growth opportunities by having turned their backs on the world economy for far too long and on a scale that could hardly be justified by the usual “infant industry” argument or its modern variants.5 This point is made clear by a comparison of their performance and the benchmarking of their growth against that of the East Asian countries.
Figure 1 shows that from the mid-1950s to the early 1980s,—a period in which the inward-looking strategy was in full swing in India
3 For a description of India’s policy regime after independence see e.g. Bhagwati and Srinivasan (1975), Srinivasan and Tendulkar (2003) and Panagarya (2008). For a dis- cussion of Brazil’s and Mexico’s industrialization policies see e.g Moreira (1995) and Ros (1994), respectively. 4 For a sympathetic view of India’s policies before the 1990s reforms see e.g. Rodrik and Subramanian 2005. For a rebuke of this view see Srinivasan 2005. 5 See, e.g. Rodrick and Hausman (2003).
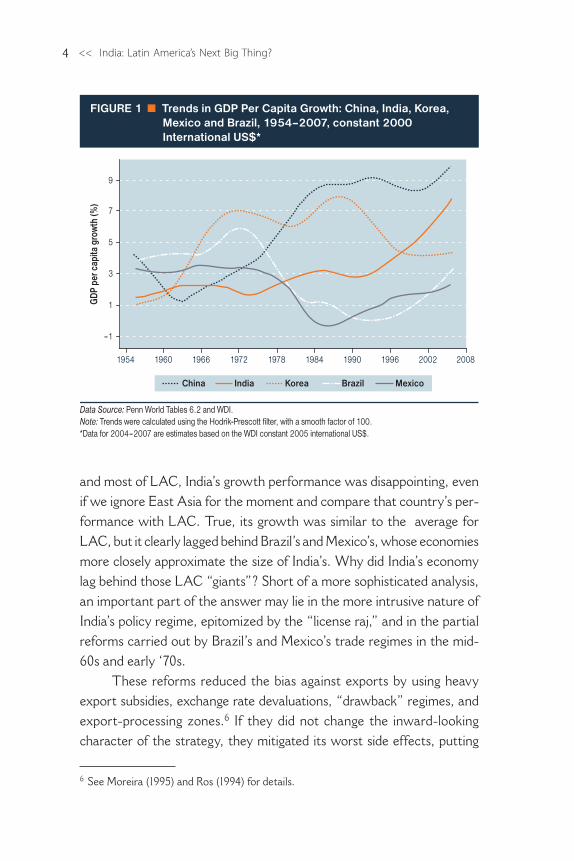
<< India: Latin America’s Next Big Thing?4
and most of LAC, India’s growth performance was disappointing, even if we ignore East Asia for the moment and compare that country’s per-formance with LAC. True, its growth was similar to the average for LAC, but it clearly lagged behind Brazil’s and Mexico’s, whose economies more closely approximate the size of India’s. Why did India’s economy lag behind those LAC “giants”? Short of a more sophisticated analysis, an important part of the answer may lie in the more intrusive nature of India’s policy regime, epitomized by the “license raj,” and in the partial reforms carried out by Brazil’s and Mexico’s trade regimes in the mid-60s and early ‘70s.
These reforms reduced the bias against exports by using heavy export subsidies, exchange rate devaluations, “drawback” regimes, and export-processing zones.6 If they did not change the inward-looking character of the strategy, they mitigated its worst side effects, putting
6 See Moreira (1995) and Ros (1994) for details.
–1
1
3
5
7
9
1954 1960 1966 1972 1978 1984 1990 1996 2002 2008
GDP
per
cap
ita g
row
th (%
)
Data Source: Penn World Tables 6.2 and WDI.Note: Trends were calculated using the Hodrik-Prescott filter, with a smooth factor of 100. *Data for 2004–2007 are estimates based on the WDI constant 2005 international US$.
India Korea Brazil MexicoChina
FIGURE 1 Trends in GDP Per Capita Growth: China, India, Korea,Mexico and Brazil, 1954–2007, constant 2000 International US$*
5India’s Growth Story: A Latin American Perspective >>
prices more in line with the countries’ comparative advantages, increasing local firms’ exposure to the international market, and alleviating balance of payment constraints.
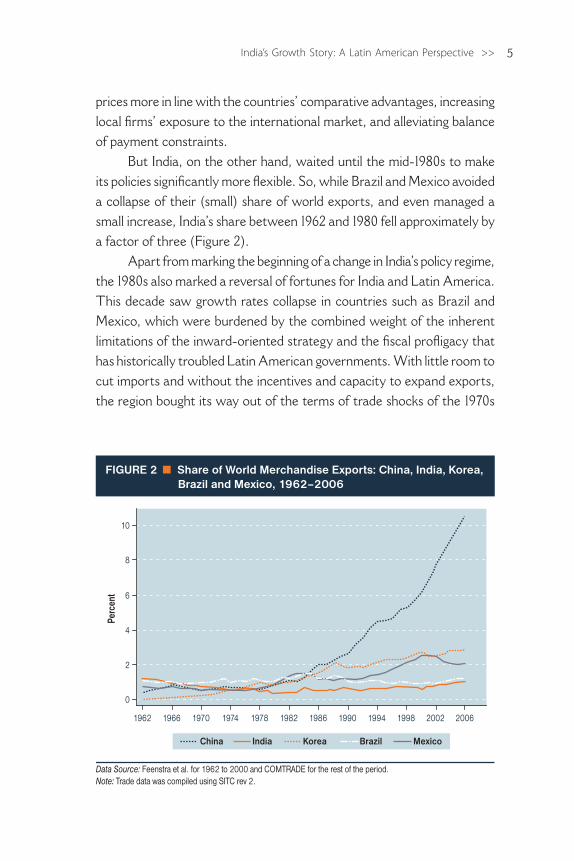
But India, on the other hand, waited until the mid-1980s to make its policies significantly more flexible. So, while Brazil and Mexico avoided a collapse of their (small) share of world exports, and even managed a small increase, India’s share between 1962 and 1980 fell approximately by a factor of three (Figure 2).
Apart from marking the beginning of a change in India’s policy regime, the 1980s also marked a reversal of fortunes for India and Latin America. This decade saw growth rates collapse in countries such as Brazil and Mexico, which were burdened by the combined weight of the inherent limitations of the inward-oriented strategy and the fiscal profligacy that has historically troubled Latin American governments. With little room to cut imports and without the incentives and capacity to expand exports, the region bought its way out of the terms of trade shocks of the 1970s
0
2
4
6
8
10
Perc
ent
1962 1966 1970 1974 1978 1982 1986 1990 1994 1998 2002 2006
FIGURE 2 Share of World Merchandise Exports: China, India, Korea, Brazil and Mexico, 1962–2006
Data Source: Feenstra et al. for 1962 to 2000 and COMTRADE for the rest of the period.Note: Trade data was compiled using SITC rev 2.
India Korea Brazil MexicoChina
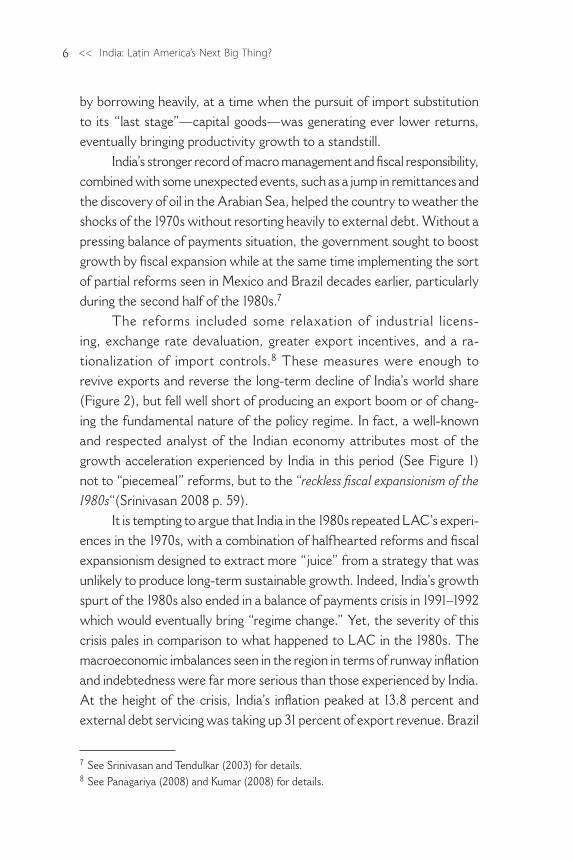
<< India: Latin America’s Next Big Thing?6
by borrowing heavily, at a time when the pursuit of import substitution to its “last stage”—capital goods—was generating ever lower returns, eventually bringing productivity growth to a standstill.
India’s stronger record of macro management and fiscal responsibility, combined with some unexpected events, such as a jump in remittances and the discovery of oil in the Arabian Sea, helped the country to weather the shocks of the 1970s without resorting heavily to external debt. Without a pressing balance of payments situation, the government sought to boost growth by fiscal expansion while at the same time implementing the sort of partial reforms seen in Mexico and Brazil decades earlier, particularly during the second half of the 1980s.7
The reforms included some relaxation of industrial licens-ing, exchange rate devaluation, greater export incentives, and a ra-tionalization of import controls.8 These measures were enough to revive exports and reverse the long-term decline of India’s world share (Figure 2), but fell well short of producing an export boom or of chang-ing the fundamental nature of the policy regime. In fact, a well-known and respected analyst of the Indian economy attributes most of the growth acceleration experienced by India in this period (See Figure 1) not to “piecemeal” reforms, but to the “reckless fiscal expansionism of the 1980s“(Srinivasan 2008 p. 59).
It is tempting to argue that India in the 1980s repeated LAC’s experi-ences in the 1970s, with a combination of halfhearted reforms and fiscal expansionism designed to extract more “juice” from a strategy that was unlikely to produce long-term sustainable growth. Indeed, India’s growth spurt of the 1980s also ended in a balance of payments crisis in 1991–1992 which would eventually bring “regime change.” Yet, the severity of this crisis pales in comparison to what happened to LAC in the 1980s. The macroeconomic imbalances seen in the region in terms of runway inflation and indebtedness were far more serious than those experienced by India. At the height of the crisis, India’s inflation peaked at 13.8 percent and external debt servicing was taking up 31 percent of export revenue. Brazil
7 See Srinivasan and Tendulkar (2003) for details.8 See Panagariya (2008) and Kumar (2008) for details.
7India’s Growth Story: A Latin American Perspective >>
got close to hyperinflation and the debt-service-to-exports ratio reached 81 percent. In Mexico, the figures were not as bad, but inflation reached triple digits and debt service peaked at 51 percent of export revenue.9
The severity of the crisis in LAC and the ensuing political, insti-tutional, and economic turmoil cost the region, with a few exceptions, more than a decade of growth, despite the radical shift of development strategy adopted by most countries. India, by contrast, would make the transition to the new regime with a more favorable macroeconomic environment and with an economy responding rapidly to reforms, which were much more moderate than those seen in Latin America, particularly with regard to trade.
If the comparison between India’s and Latin America’s economies says something relevant about the value of even “piecemeal” reforms and fiscal rectitude for spurring growth, the comparison with East Asia shows even more clearly the opportunity costs paid by these economies for not having fully embraced the opportunities presented by the world economy.
Even when Brazil and Mexico were outperforming India in the 1960s and 1970s, posting robust rates of growth that they have not repeated since, it was already becoming clear that a more outward-oriented and market friendly strategy could deliver better and faster results. Countries such as Korea (see Figure 1) and Taiwan were using such a strategy to outperform the best performers in LAC in the late 60s, and never looked back. China soon followed in 1978 with even more spectaculars results. In the 1980s, with the collapse of LAC’s growth, the performance gap grew too large to be ignored even by India, which was still trailing well behind East Asia despite improvements in its growth rate.
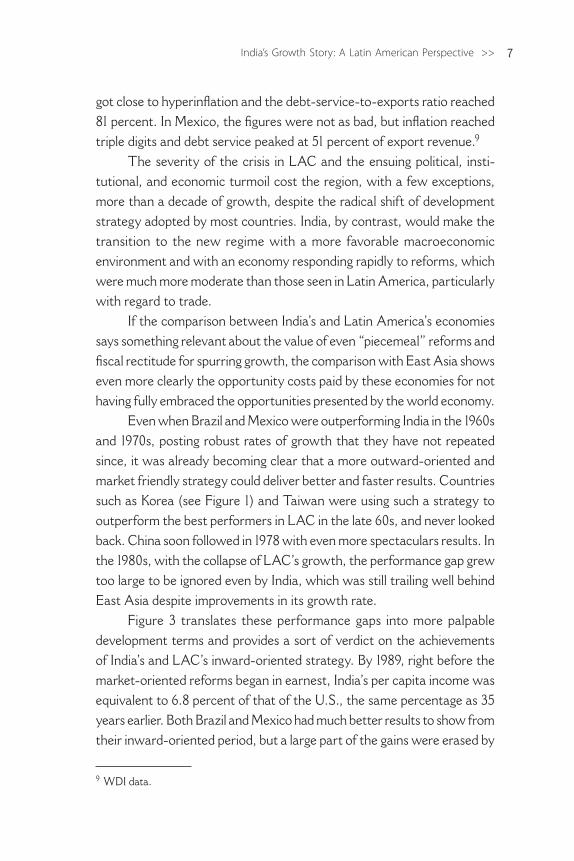
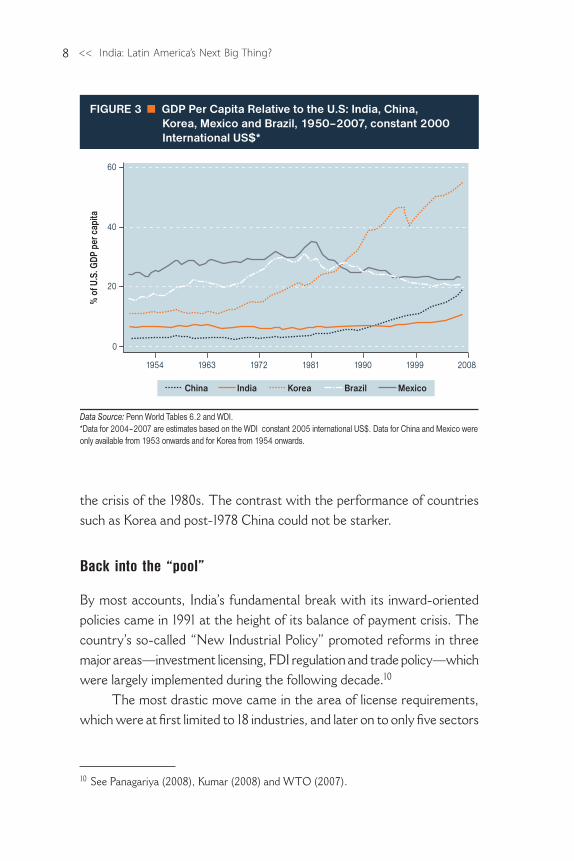
Figure 3 translates these performance gaps into more palpable development terms and provides a sort of verdict on the achievements of India’s and LAC’s inward-oriented strategy. By 1989, right before the market-oriented reforms began in earnest, India’s per capita income was equivalent to 6.8 percent of that of the U.S., the same percentage as 35 years earlier. Both Brazil and Mexico had much better results to show from their inward-oriented period, but a large part of the gains were erased by
9 WDI data.
<< India: Latin America’s Next Big Thing?8
the crisis of the 1980s. The contrast with the performance of countries such as Korea and post-1978 China could not be starker.
Back into the “pool”
By most accounts, India’s fundamental break with its inward-oriented policies came in 1991 at the height of its balance of payment crisis. The country’s so-called “New Industrial Policy” promoted reforms in three major areas—investment licensing, FDI regulation and trade policy—which were largely implemented during the following decade.10
The most drastic move came in the area of license requirements, which were at first limited to 18 industries, and later on to only five sectors
0
20
40
60
1954 1963 1972 1981 1990 1999 2008
FIGURE 3 GDP Per Capita Relative to the U.S: India, China, Korea, Mexico and Brazil, 1950–2007, constant 2000 International US$*
% o
f U.S
. GDP
per
cap
ita
Data Source: Penn World Tables 6.2 and WDI.*Data for 2004–2007 are estimates based on the WDI constant 2005 international US$. Data for China and Mexico were only available from 1953 onwards and for Korea from 1954 onwards.
India Korea Brazil MexicoChina
10 See Panagariya (2008), Kumar (2008) and WTO (2007).
9India’s Growth Story: A Latin American Perspective >>
for reasons of health, national security, and environmental protection.11 Large firms and groups were also given more leeway to expand and di-versify their activities, and small and medium-sized firms (SMEs), which had traditionally been the beneficiaries of a reservation policy in which they were granted the exclusive rights of producing for a large number of products, saw this reservation reduced eventually to 326 products by 2007.
FDI, which until then was heavily regulated and limited to 40 percent of total venture capital, was gradually shifted to a regime of automatic approval. This regime was initially applied to 34 industries through 51 percent equity participation, and was subsequently expanded to most industries with 100 percent participation, except for agriculture, public sector monopolies, and sectors still subject to industrial licensing or that were part of the SME reservation products.
On trade policy, the reforms began to gradually dismantle the protectionist apparatus, eliminating import licenses and reducing tariffs. Import licenses, which covered virtually all items, were initially removed for all intermediate inputs and capital goods, and much later (2002) for consumer goods as well. Tariffs, whose simple average was as high as 128 percent, with a wide dispersion (standard deviation) of 41 percent, were reduced to 32 percent in 2002 (with a standard deviation of 16). By 2007, the simple average had dropped to 15.8 percent (with a standard deviation of 15).12
In conjunction with the multilateral liberalization, India also made some moves towards regional integration, seeking to reinforce and deepen existing agreements and negotiate new ones, including two with LAC (See Box 1.1 and Chapter 2). Apart from the agreements with Sri Lanka (1998) and the less developed members of the South Asia Free Trade Area (SAFTA, 2004), the preferences negotiated so far have not been substan-tial and have added little to the progress made at the multilateral level.
11 The five sectors are distillation and brewing of alcoholic drinks, tobacco products, elec-tronic aerospace and defense equipment, explosives and specified hazardous chemicals. The public sector monopolies are atomic energy, radioactive substances and railway transport (WTO 2007). 12 World Bank 2000 and WTO 2007. The figure for 2007 does not include specific tariffs, whose ad-valorem equivalent raises the average to 17.5 with a standard deviation of 20.7.
<< India: Latin America’s Next Big Thing?10
Trade policy reforms were complemented by an attempt to raise the profile of export processing zones with the establishment in 2001 of Special Economic Zones (SEZs). Until then, SEZs had played a very marginal role in India’s exports. India’s SEZs follow in the footsteps of their Chinese counterparts, and offer the usual tax incentives boosted by waivers from environmental, labor, and FDI regulations, conditional “only” on net export earnings (see Box 1.2).
Trade liberalization was also extended to services in tandem with FDI deregulation, but much of this happened in the late 1990s and early 2000s. Financial services, telecommunications and land transportation have so far been the main beneficiaries. Restrictions on foreign banks, for instance, have been phased out since 2005. In 2009
n Box 1.1 India’s Trade Agreements
India implemented its first bilateral free trade agreement (FTA) with Ceylon in 1961, but the pace of FTA proposals and negotiations did not pick up until after 1995. During the 1990s, India completed five bilateral and regional FTAs, nearly all with its South Asian neighbors except for Mongolia (Sri Lanka 2000, Afghanistan 2003, ASEAN 2003, Singapore 2005 and South Asia Free Trade Agreement 2006). By 2009, India had negotiated, implemented, or proposed 27 bilateral or regional FTAs with countries and regional groups such as ASEAN (2003), Chile (2006), Japan (2005), Singapore (2005) and MERCOSUR (2004). Only five of these trade agreements, however, have completed negotiations or been implemented—and Indian FTAs are often less comprehensive than US, Mexican or Chilean trade agreements.a
Like most countries, stalled Doha negotiations are leading India to actively pursue bilateral and regional FTAs, which are often used to expand political influence through trade and economic cooperation. A brief analysis of the scope of Indian liberalization in select FTAs with Latin American partners could provide some useful lessons learned about the challenges and potential for deepening inter-regional trade cooperation. The two FTAs that India signed with MERCOSUR and Chile are, however, of recent vintage, and this fact alone makes it difficult to draw solid inferences. So far, both trade agreements have had limited direct impact on trade flows, partly because they cover a very narrow offer list of products. The agreement with MERCOSUR includes only 450 products each (out of more than 5,000).b The Chile FTA is a partial scope agreement which, by definition, is also less comprehensive. While the agreement with Chile addresses market access, rules of origin, safeguards, and dispute resolution issues, tariffs are reduced for only some products and the agreement excludes investment and services. In May 2009, the Chilean government expressed interest in widening the scope of the FTA to include more product categories and further reduce tariffs.
a The five FTAs implemented since 2000.b According to UNCTAD, the Mercosur FTA offers great trade potential, totaling an estimated $13.6 billion in exports from Mercosur and $12.7 billion in Indian exports. See UNCTAD (2004).
11India’s Growth Story: A Latin American Perspective >>
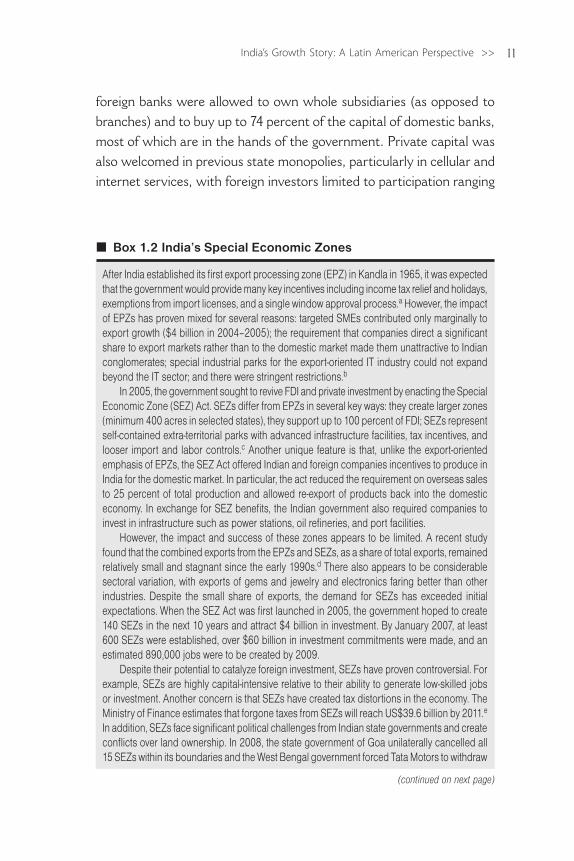
n Box 1.2 India’s Special Economic Zones
After India established its first export processing zone (EPZ) in Kandla in 1965, it was expected that the government would provide many key incentives including income tax relief and holidays, exemptions from import licenses, and a single window approval process.a However, the impact of EPZs has proven mixed for several reasons: targeted SMEs contributed only marginally to export growth ($4 billion in 2004–2005); the requirement that companies direct a significant share to export markets rather than to the domestic market made them unattractive to Indian conglomerates; special industrial parks for the export-oriented IT industry could not expand beyond the IT sector; and there were stringent restrictions.b
In 2005, the government sought to revive FDI and private investment by enacting the Special Economic Zone (SEZ) Act. SEZs differ from EPZs in several key ways: they create larger zones (minimum 400 acres in selected states), they support up to 100 percent of FDI; SEZs represent self-contained extra-territorial parks with advanced infrastructure facilities, tax incentives, and looser import and labor controls.c Another unique feature is that, unlike the export-oriented emphasis of EPZs, the SEZ Act offered Indian and foreign companies incentives to produce in India for the domestic market. In particular, the act reduced the requirement on overseas sales to 25 percent of total production and allowed re-export of products back into the domestic economy. In exchange for SEZ benefits, the Indian government also required companies to invest in infrastructure such as power stations, oil refineries, and port facilities.
However, the impact and success of these zones appears to be limited. A recent study found that the combined exports from the EPZs and SEZs, as a share of total exports, remained relatively small and stagnant since the early 1990s.d There also appears to be considerable sectoral variation, with exports of gems and jewelry and electronics faring better than other industries. Despite the small share of exports, the demand for SEZs has exceeded initial expectations. When the SEZ Act was first launched in 2005, the government hoped to create 140 SEZs in the next 10 years and attract $4 billion in investment. By January 2007, at least 600 SEZs were established, over $60 billion in investment commitments were made, and an estimated 890,000 jobs were to be created by 2009.
Despite their potential to catalyze foreign investment, SEZs have proven controversial. For example, SEZs are highly capital-intensive relative to their ability to generate low-skilled jobs or investment. Another concern is that SEZs have created tax distortions in the economy. The Ministry of Finance estimates that forgone taxes from SEZs will reach US$39.6 billion by 2011.e In addition, SEZs face significant political challenges from Indian state governments and create conflicts over land ownership. In 2008, the state government of Goa unilaterally cancelled all 15 SEZs within its boundaries and the West Bengal government forced Tata Motors to withdraw
(continued on next page)
foreign banks were allowed to own whole subsidiaries (as opposed to branches) and to buy up to 74 percent of the capital of domestic banks, most of which are in the hands of the government. Private capital was also welcomed in previous state monopolies, particularly in cellular and internet services, with foreign investors limited to participation ranging
<< India: Latin America’s Next Big Thing?12
from 49 percent (cellular services) to 100 percent (internet service providers).13
On the macro level, the reforms were supported by a substantial devaluation of the rupee (22.8 percent) in 1991, followed by the (man-aged) floating and unification of the exchange rate and the convertibility of the rupee for current account transactions. Capital controls were also gradually relaxed, though mostly for portfolio and FDI inflows. Mean-while, the financial sector went through its own deregulation, which led to the elimination of administered interest rates for most operations and a reduction of cash reserve requirements.14
How radical were the reforms?
Though brief and far from exhaustive, this description of India’s reforms leaves little doubt regarding the country’s clear shift in growth strategy during the 1990s. But how radical was this shift? From a purely Indian perspective, the 1990s may look nothing short of revolutionary, but for
13 For details see Srinivasan and Tendulkar (2003), Panagarya (2004) and Wallack (2007). 14 See Prasad (2009) and Bery and Singh (2006).
n Box 1.2 India’s Special Economic Zones (continued)
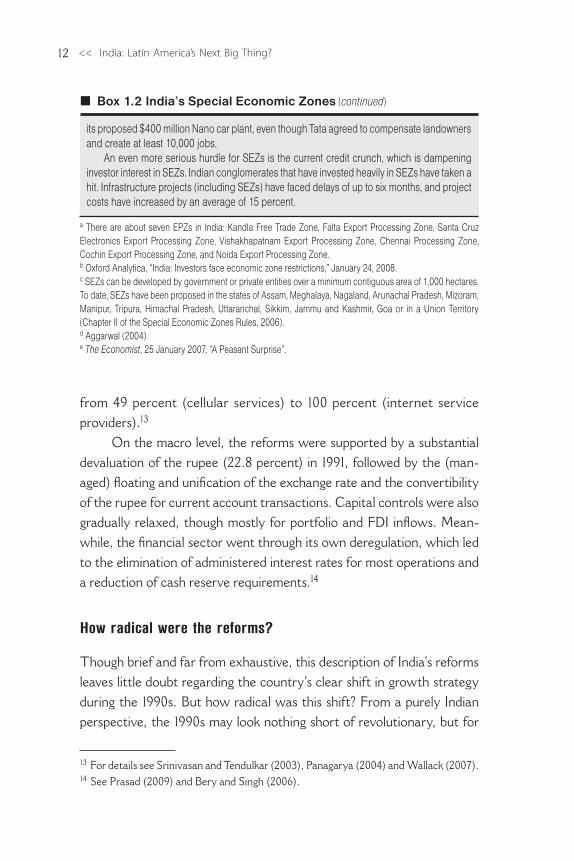
its proposed $400 million Nano car plant, even though Tata agreed to compensate landowners and create at least 10,000 jobs.
An even more serious hurdle for SEZs is the current credit crunch, which is dampening investor interest in SEZs. Indian conglomerates that have invested heavily in SEZs have taken a hit. Infrastructure projects (including SEZs) have faced delays of up to six months, and project costs have increased by an average of 15 percent.
a There are about seven EPZs in India: Kandla Free Trade Zone, Falta Export Processing Zone, Santa Cruz Electronics Export Processing Zone, Vishakhapatnam Export Processing Zone, Chennai Processing Zone, Cochin Export Processing Zone, and Noida Export Processing Zone.b Oxford Analytica, “India: Investors face economic zone restrictions,” January 24, 2008.c SEZs can be developed by government or private entities over a minimum contiguous area of 1,000 hectares. To date, SEZs have been proposed in the states of Assam, Meghalaya, Nagaland, Arunachal Pradesh, Mizoram, Manipur, Tripura, Himachal Pradesh, Uttaranchal, Sikkim, Jammu and Kashmir, Goa or in a Union Territory (Chapter II of the Special Economic Zones Rules, 2006). d Aggarwal (2004).e The Economist, 25 January 2007, “A Peasant Surprise”.
13India’s Growth Story: A Latin American Perspective >>
a seasoned Latin American policymaker, that country’s embrace of pro-market and pro-trade economics may look overly cautious, in terms of both the speed and scope of the reforms.
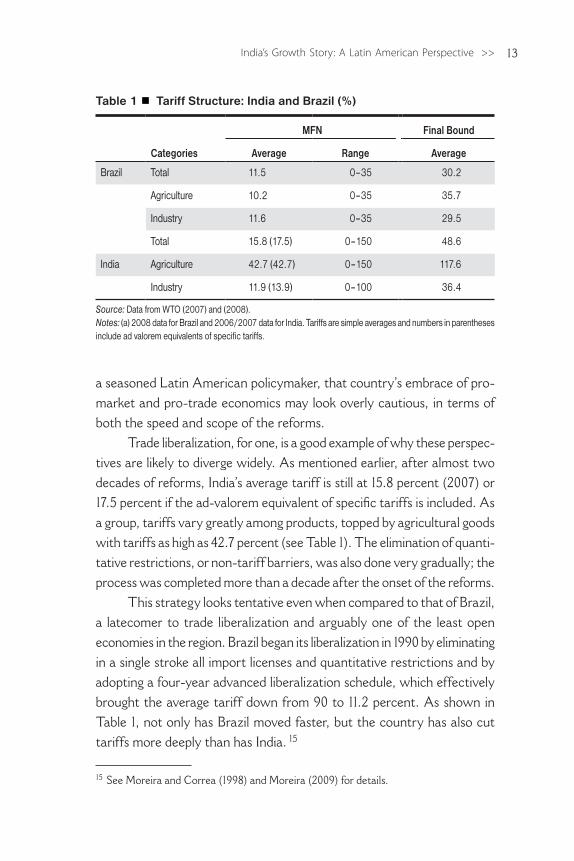
Trade liberalization, for one, is a good example of why these perspec-tives are likely to diverge widely. As mentioned earlier, after almost two decades of reforms, India’s average tariff is still at 15.8 percent (2007) or 17.5 percent if the ad-valorem equivalent of specific tariffs is included. As a group, tariffs vary greatly among products, topped by agricultural goods with tariffs as high as 42.7 percent (see Table 1). The elimination of quanti-tative restrictions, or non-tariff barriers, was also done very gradually; the process was completed more than a decade after the onset of the reforms.
This strategy looks tentative even when compared to that of Brazil, a latecomer to trade liberalization and arguably one of the least open economies in the region. Brazil began its liberalization in 1990 by eliminating in a single stroke all import licenses and quantitative restrictions and by adopting a four-year advanced liberalization schedule, which effectively brought the average tariff down from 90 to 11.2 percent. As shown in Table 1, not only has Brazil moved faster, but the country has also cut tariffs more deeply than has India. 15
15 See Moreira and Correa (1998) and Moreira (2009) for details.
Table 1 Tariff Structure: India and Brazil (%)
Categories
MFN Final Bound
Average Range Average
Brazil Total 11.5 0–35 30.2
Agriculture 10.2 0–35 35.7
Industry 11.6 0–35 29.5
Total 15.8 (17.5) 0–150 48.6
India Agriculture 42.7 (42.7) 0–150 117.6
Industry 11.9 (13.9) 0–100 36.4
Source: Data from WTO (2007) and (2008). Notes: (a) 2008 data for Brazil and 2006/2007 data for India. Tariffs are simple averages and numbers in parentheses include ad valorem equivalents of specific tariffs.
<< India: Latin America’s Next Big Thing?14
If we review the experiences of Chile and Mexico, which are among LAC’s most open economies, the contrast is considerably starker. In its first attempt at liberalization in 1973, Chile removed all non- tariff barriers and cut tariffs to a uniform 10 percent. Later, after a few setbacks, it reduced tariffs to a uniform 6 percent (2003) and signed one of the most wide-ranging networks of trade agreements in the world.16 Mexico did not move as early nor as fast as Chile, but from 1985 to 1993 it cut tariffs from 30 to 15.5 percent while eliminating virtually all non-tariff barriers. From 1994 onwards, the signing of trade agreements with the US and Canada (1994) and the European Union, among others, exposed the Mexican economy to virtually free trade with the most competitive producers in the world.17
The more aggressive and wide-ranging nature of LAC’s reforms is also evident in other traditional fronts, such as privatization. In India as in LAC, inward orientation was accompanied by an ever-increasing number of state enterprises with objectives ranging from infrastructure and industry development to generating employment. But in India, state-run companies became even more important than in LAC, accounting on average for as much as 41 percent of gross fixed investment in 1978–91, as opposed to the region’s average of 18 percent.18
In India as in LAC, f iscal and eff iciency concerns have driven governments to privatize state-managed companies. But, as with trade liberalization, India has taken a more cautious route, shunning as much as possible the Latin American model centered on the outright sale of assets. From 1991 to 2000, India emphasized selling minority shares, and from then on, “disinvestment”, as it is known there, has been taking the form of strategic sales in which controlling interests are sold to the private sector with the government usually remaining an important shareholder.
The result so far has been a form of privatization that falls well behind LAC’s in both speed and in scope and compares unfavorably even with
16 See Edwards (1985) and WTO (2003). 17 See Ten Kate (1992) and WTO (2008) for details of Mexico’s liberalization and current trade regime. 18 World Bank (1995).
15India’s Growth Story: A Latin American Perspective >>
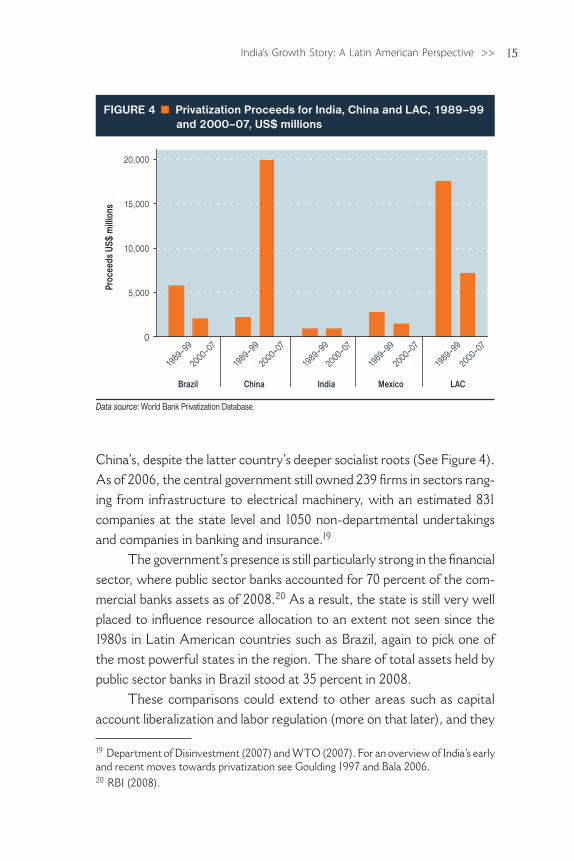
China’s, despite the latter country’s deeper socialist roots (See Figure 4). As of 2006, the central government still owned 239 firms in sectors rang-ing from infrastructure to electrical machinery, with an estimated 831 companies at the state level and 1050 non-departmental undertakings and companies in banking and insurance.19
The government’s presence is still particularly strong in the financial sector, where public sector banks accounted for 70 percent of the com-mercial banks assets as of 2008.20 As a result, the state is still very well placed to influence resource allocation to an extent not seen since the 1980s in Latin American countries such as Brazil, again to pick one of the most powerful states in the region. The share of total assets held by public sector banks in Brazil stood at 35 percent in 2008.
These comparisons could extend to other areas such as capital account liberalization and labor regulation (more on that later), and they
19 Department of Disinvestment (2007) and WTO (2007). For an overview of India’s early and recent moves towards privatization see Goulding 1997 and Bala 2006.20 RBI (2008).
0
5,000
10,000
15,000
20,000
Pro
ceed
s US
$ m
illio
ns
Brazil China India Mexico LAC
1989–99
2000–07
1989–99
2000–07
1989–99
2000–07
1989–99
2000–07
1989–99
2000–07
Data source: World Bank Privatization Database.
FIGURE 4 Privatization Proceeds for India, China and LAC, 1989–99 and 2000–07, US$ millions

<< India: Latin America’s Next Big Thing?16
would all point in the same direction, with India adopting a much more cautious and pragmatic embrace of market oriented reforms than LAC.21
The reasons behind these divergent strategies seems to be rooted less in ideological differences between policymakers in LAC and India and more in the different institutional and political experiences that have marked the implementation of the respective reforms. For example, one cannot lose sight of the fact that some of the more challenging and fast-moving reforms in LAC took place under authoritarian governments, including outright dictatorships and “one-party” democracies. In contrast, India’s reformers had to operate under the rules of a peculiar and resilient democracy, built on top of a poorer, more hierarchical and more hetero-geneous society than that of LAC.
As Bardhan (2008, p. 20) explains, social heterogeneity in India has led to elite fragmentation, adding that “while on the economic front this fragmentation gives some ‘autonomy’ to the state, allowing it to regulate large parts of the economy and sometimes supersede the dominant interest groups, it also paralyses the ability to take bold decisions.”
Whatever the underlying causes of the different strategies, the reality is that India’s brand of reforms has been associated with better growth results than has LAC’s, which in itself should give pause for Latin American policymakers and economists alike.
The take-off and its mysteries
As Figure 1 shows, India’s growth clearly shifted into a higher gear in the 1990s, leaving LAC well behind and gradually closing the gap with China. But what exactly is behind India’s acceleration? Is it the same pattern we have seen before in East Asia, including China? Well, not exactly. Some observes prefer to call it the “service-led growth model” (McKinsey 2007),
21 Bardham (2008, p. 28), one of the shrewdest observers of the India economy, for instance, does not dispute this assessment that “In privatization, deregulation and trade liberaliza-tion Indian progress has been slower and halting [than LAC.]” For a discussion of capital account liberalization in India see Prasad (2009) and Bery and Singh (2006). For LAC see, for instance, Singh et al. (2005). On labor regulation in India see Ahsan and Pages (2007) and in LAC, Heckman and Pages (2004).
17India’s Growth Story: A Latin American Perspective >>
something that would be unprecedented in the history of development economics, at least when referring to large, continental states. But is it? In fact, this characterization also seems misleading. What is absolutely clear, however, is that India’s growth story defies any easy, cookie-cutter characterization.
Export-led growth?
The East-Asian model is also known as “export-led growth” and for good reason. The term describes a process whereby booming manufacturing exports, backed by massive amounts of investment and savings, increase the share of goods trade in GDP—so called openness—and leads the whole country into a high growth trajectory.
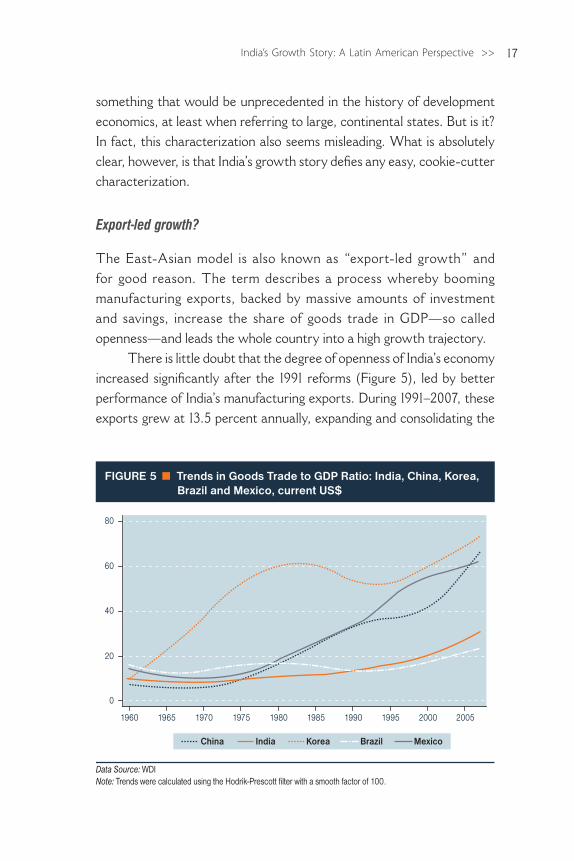
There is little doubt that the degree of openness of India’s economy increased significantly after the 1991 reforms (Figure 5), led by better performance of India’s manufacturing exports. During 1991–2007, these exports grew at 13.5 percent annually, expanding and consolidating the
0
20
40
60
80
1960 1965 1970 1975 1980 1985 1990 1995 2000 2005
Data Source: WDINote: Trends were calculated using the Hodrik-Prescott filter with a smooth factor of 100.
FIGURE 5 Trends in Goods Trade to GDP Ratio: India, China, Korea, Brazil and Mexico, current US$
India Korea Brazil MexicoChina
<< India: Latin America’s Next Big Thing?18
gains of the “piecemeal reforms” of the second half of the eighties. Yet, the trend in openness so far has fallen well short of what we have seen in China, Korea, or even Mexico, reflecting the fact that the export boom has not been as impressive as its two digit growth rate might suggest.
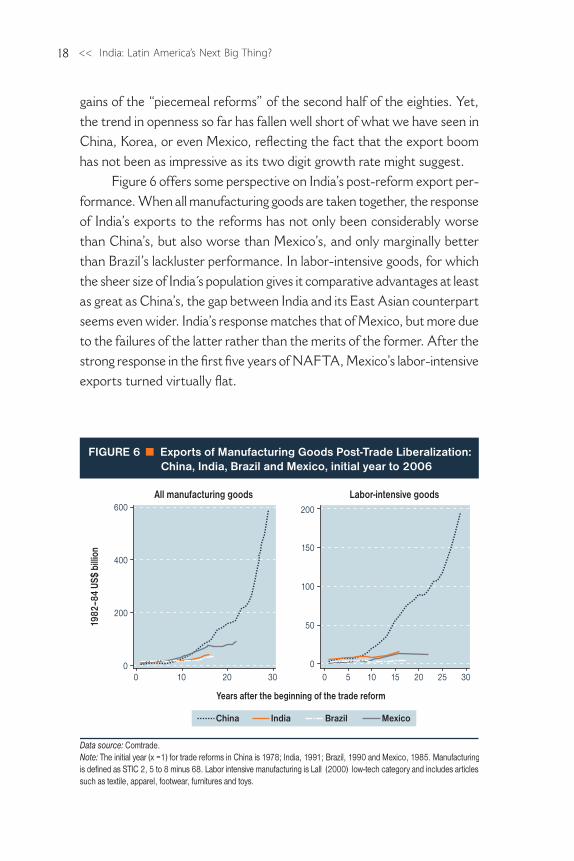
Figure 6 offers some perspective on India’s post-reform export per-formance. When all manufacturing goods are taken together, the response of India’s exports to the reforms has not only been considerably worse than China’s, but also worse than Mexico’s, and only marginally better than Brazil’s lackluster performance. In labor-intensive goods, for which the sheer size of India s population gives it comparative advantages at least as great as China’s, the gap between India and its East Asian counterpart seems even wider. India’s response matches that of Mexico, but more due to the failures of the latter rather than the merits of the former. After the strong response in the first five years of NAFTA, Mexico’s labor-intensive exports turned virtually flat.
0
200
400
600
1982
–84
US$
billi
on
0 10 20 30
All manufacturing goods
0
50
100
150
200
0 5 10 15 20 25 30
Labor-intensive goods
Data source: Comtrade.Note: The initial year (x =1) for trade reforms in China is 1978; India, 1991; Brazil, 1990 and Mexico, 1985. Manufacturing is defined as STIC 2, 5 to 8 minus 68. Labor intensive manufacturing is Lall (2000) low-tech category and includes articles such as textile, apparel, footwear, furnitures and toys.
FIGURE 6 Exports of Manufacturing Goods Post-Trade Liberalization: China, India, Brazil and Mexico, initial year to 2006
Years after the beginning of the trade reform
India Brazil MexicoChina
19India’s Growth Story: A Latin American Perspective >>
As expected, there is controversy about when trade reforms truly began in these countries. But moving these dates back and forth does not seem to change the overall message. For instance, if we had adopted 1985 as the starting date for India’s reforms—the year when the “piecemeal” changes began to gain some traction—the gap with China would have been even wider and the message of the Figure would be even more clear, i.e., that India, as an exporter of manufacturing goods, has been responding so far at a speed and magnitude more akin to a LAC country than to an East Asian “tiger”.
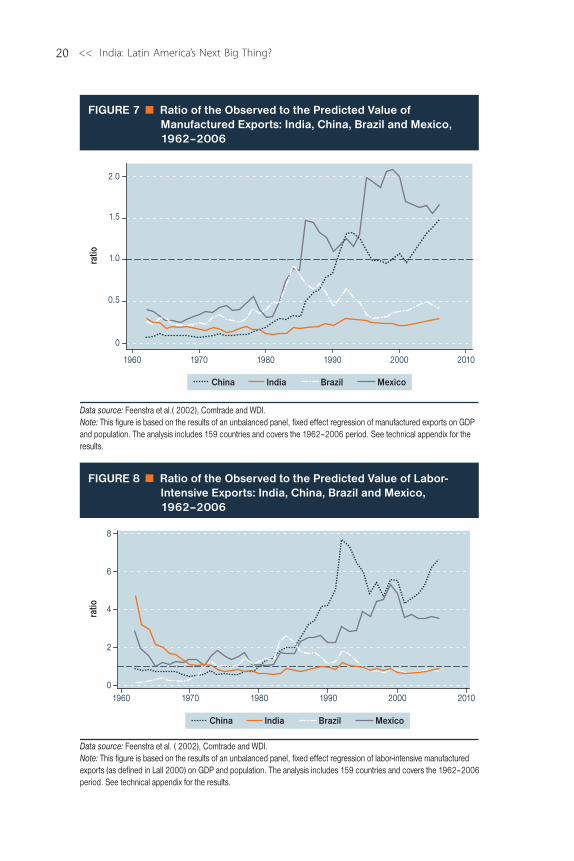
The limitations of India’s manufacturing performance are also evi-dent in a simple econometric exercise in which data for 159 countries for 1962–2006 is used to estimate the value of manufacturing exports pre-dicted by the countries’ GDP and population, controlling for the influence of common time trends and other unobserved country characteristics that are constant over time. This is basically an attempt to capture the importance of two possible determinants of manufacturing exports—labor abundance and market size—that are particularly relevant for a develop-ing country such as India. The predicted value is then compared to the countries’ observed manufacturing exports (see Figure 7).
Once again the results put India and Brazil in the same league, with both countries showing levels of manufacturing exports that are well below the “norm.” As of 2006, their manufacturing exports were 29 and 43 percent, respectively, of the level of their predicted exports. India’s posi-tion had improved some since the early eighties, but Brazil was still strug-gling to reach the relatively modest levels of the mid 1980s. These results contrast starkly with the performance of China and Mexico, which have transitioned from negative to positive outliers over the period of reforms.
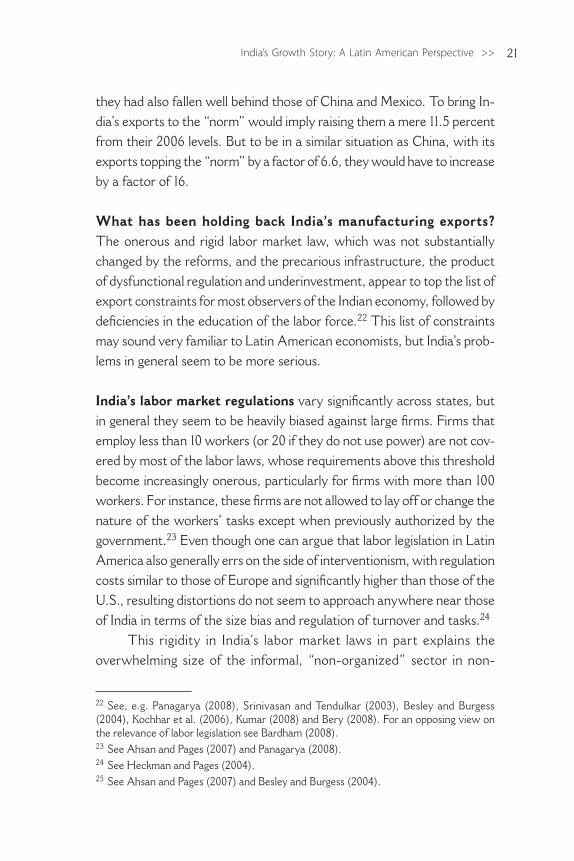
Figure 8 repeats the same exercise for labor-intensive, low-tech exports. India’s exports of these goods are also below the “norm” for most of the period, including the last decade when market-oriented reforms were deepened. But the gap to the “norm” is much smaller than in the case of all goods. Still, India seems to have shifted from a situation in the early 1960s, when its exports of those goods were well above the “norm” and compared favorably with those of China, Mexico, and Brazil, to a situation where its exports had not only dropped below the “norm,” but
<< India: Latin America’s Next Big Thing?20
0
2
4
6
8
ratio
1960 1970 1980 1990 2000 2010
Data source: Feenstra et al. ( 2002), Comtrade and WDI.Note: This figure is based on the results of an unbalanced panel, fixed effect regression of labor-intensive manufactured exports (as defined in Lall 2000) on GDP and population. The analysis includes 159 countries and covers the 1962–2006 period. See technical appendix for the results.
FIGURE 8 Ratio of the Observed to the Predicted Value of Labor-Intensive Exports: India, China, Brazil and Mexico, 1962–2006
India Brazil MexicoChina
0
0.5
1.0
1.5
2.0
ratio
1960 1970 1980 1990 2000 2010
FIGURE 7 Ratio of the Observed to the Predicted Value of Manufactured Exports: India, China, Brazil and Mexico, 1962–2006
Data source: Feenstra et al.( 2002), Comtrade and WDI.Note: This figure is based on the results of an unbalanced panel, fixed effect regression of manufactured exports on GDP and population. The analysis includes 159 countries and covers the 1962–2006 period. See technical appendix for the results.
India Brazil MexicoChina
21India’s Growth Story: A Latin American Perspective >>
they had also fallen well behind those of China and Mexico. To bring In-dia’s exports to the “norm” would imply raising them a mere 11.5 percent from their 2006 levels. But to be in a similar situation as China, with its exports topping the “norm” by a factor of 6.6, they would have to increase by a factor of 16.
What has been holding back India’s manufacturing exports? The onerous and rigid labor market law, which was not substantially changed by the reforms, and the precarious infrastructure, the product of dysfunctional regulation and underinvestment, appear to top the list of export constraints for most observers of the Indian economy, followed by deficiencies in the education of the labor force.22 This list of constraintsmay sound very familiar to Latin American economists, but India’s prob-lems in general seem to be more serious.
India’s labor market regulations vary significantly across states, but in general they seem to be heavily biased against large firms. Firms that employ less than 10 workers (or 20 if they do not use power) are not cov-ered by most of the labor laws, whose requirements above this threshold become increasingly onerous, particularly for firms with more than 100 workers. For instance, these firms are not allowed to lay off or change the nature of the workers’ tasks except when previously authorized by the government.23 Even though one can argue that labor legislation in Latin America also generally errs on the side of interventionism, with regulation costs similar to those of Europe and significantly higher than those of the U.S., resulting distortions do not seem to approach anywhere near those of India in terms of the size bias and regulation of turnover and tasks.24
This rigidity in India’s labor market laws in part explains the overwhelming size of the informal, “non-organized” sector in non-
22 See, e.g. Panagarya (2008), Srinivasan and Tendulkar (2003), Besley and Burgess (2004), Kochhar et al. (2006), Kumar (2008) and Bery (2008). For an opposing view on the relevance of labor legislation see Bardham (2008). 23 See Ahsan and Pages (2007) and Panagarya (2008).24 See Heckman and Pages (2004).25 See Ahsan and Pages (2007) and Besley and Burgess (2004).
<< India: Latin America’s Next Big Thing?22
agricultural activities, particularly manufacturing.25 As of 2000–2001, the informal sector accounted for as much as 86 percent of employment in manufacturing and for as little as 26 percent of output.26 This level of informality seems to dwarf the already relatively high levels seen in LAC, where, according to the OECD (2009), the average share of informal employment in non-agricultural activities in the late 1990s was 54 percent compared to 83.4 percent for India.
India’s labor legislation is thought to be particularly damaging for labor-intensive industries, including the large-scale firms that would be in a better position to compete with its large-scale Asian counterparts.27 AsPanagariya 2006:34 put it, “The IDA [Industrial Disputes Act] has hada detrimental effect on the entry of large-scale firms in the unskilled- labor intensive sector in at least two mutually reinforcing ways. First, firms are afraid that should they go bust for any reason, they would be stuck with having to pay full wages to a large workforce despite bankruptcy. Second, the legislation has disproportionately strengthened the hand of the unions in wage negotiations. Consequently, the wages in the organized sector are several times those in the non-organized sector.”28
The infrastructure constraint, in turn, is considered to be the most restricting in the case of electricity, ports, and airports. In terms of electricity, Indian f irms are seen as paying “punishing” prices to compensate for subsidies to households and losses in transmission and distribution, while getting very unreliable service in return.29 In fact, 2000 data on electricity prices for a sample of mostly OECD and some Latin American countries put India’s industrial tariffs among the top six—almost twice the price paid, for instance, in Chile—but the sec-
26 Kumar (2008)27 McKinsey (2001), for instance, argues that in apparel the average Indian manufacturer and exporter employs fewer than 50 machines, whereas producers in China and Sri Lanka often have 1000 machines under one roof. A 500-machine factory would be the minimum efficient size.28 The IDA is the more controversial piece of legislation and deals with the conditions for hiring and retrenching workers and with the closure of establishments. See Ahsan and Pages (2007)and Panagarya (2008, chapter 13). 29 Panagarya (op cit, p.37) and Panagarya (2008, chapter 17).
23India’s Growth Story: A Latin American Perspective >>
ond lowest in household tariffs, only ahead of South Africa (5 percent lower than in Chile).30
This tentative evidence on prices is accompanied by more robust data on service quality that suggests some serious shortcomings, even by not so demanding Latin American standards. Using data from the World Bank Investment Climate Surveys for the first five years of this decade, Wallack (2007) shows that India’s firms suffered more daily electricity outages than firms in any LAC country surveyed—67 days, on average, compared to 41.5 days for the next closest country (Panama). At the other end of the spectrum, the average firm in Uruguay, Brazil, and Chile reported less than four days with electricity outages.
Problems with power supply have led a substantial number of Indian firms to opt for in-house electricity generation. In 2006, 40 percent of firms reported owning a generator compared to 34 percent of Chilean firms, 17 percent of Brazilian firms, and 16 percent of Argentine firms. This costly option is usually only affordable for medium and large firms, putting an extra burden on the small and non-organized firms, particularly in labor-intensive sectors.
The most frequently cited problems with ports and airports are congestion and red tape. Unlike those related to electricity, these prob-lems appear to be similar in many LAC countries. As Wallack (op. cit, appendix p. 15) put it, “India’s port infrastructure appears less functional than Latin America’s, but not markedly so. The country still does not have a deepwater port; Latin America has several (in Chile, Bahamas, Mexico, Ecuador, and Argentina) as well as a number of promising sites. [ …] Indian ports’ turnaround time remains slow by world and regional standards. It takes an average 85 hours to unload and reload a ship at India’s major ports, 10 times longer than in Hong Kong and Singapore.”
Similar figures for LAC‘s largest container port, Santos, Brazil, suggest somewhat better performance, but still far from East Asian standards. In the first three weeks of January 2008, container ships in Santos had a turnaround time between 35 to 50 hours.31 The Global Ports
30 UK electricity association as quoted in http://www.solarbuzz.com/Solarpricesworld.htm. 31 Jose Antonio Balau. Presentation at the CNI-BID seminar on Transport Costs and Trade. Brasilia, October 2008.
<< India: Latin America’s Next Big Thing?24
congestion index for February 2008, which measures ship delays in bulk cargo ports, puts India (2.5 days) in a better situation than Brazil (7.4 days), but behind Colombia (0.75 days).32
India’s airport network is seen as comparable to that of LAC countries with similar land area, such as Mexico and Argentina, and superior to that of the LAC region as a whole. “Major cities are linked by 10 or more flights a day, with multiple daily connections to state capitals and regional centers. Latin America, in contrast, still suffers from having Miami and Houston as effective hubs.”33
Yet, with a growth of air traffic second only to China and without any major upgrade or expansion, India’s airports appear to have reached a degree of congestion that may be worse than in the worst cases in LAC, such as Mexico and Brazil. The growing gap between supply and demand has led to “crowded waiting areas, long delays for take off and landing and near misses as a strained air traffic control agency manages the increasing traffic.”34 India’s airports have been ranked among the worst in the world for customer amenities and services in the surveys conducted by the Inter-national Air Transport Association’s Global Airport Monitor Program.35
When infrastructure is evaluated as whole, including the part directly related to trade, it appears that India still has a long way to go to match the standards of the OECD or China, but it generally performs better than most LAC countries. For instance, India ranks 70th on the infrastructure pillar of the competitiveness index of the Global Competitiveness Report 2008–09, well behind Chile (30), but virtually on par with Mexico (68), and ahead of Brazil (78), Argentina (87), Colombia (80) and Peru (110). India’s logistic performance index for 2007—a World Bank indicator that combines perception surveys and hard data and that varies from 1 to 5—is below China’s (3.07 against 3.32), but clearly ahead of LAC’s average (2.57) and of countries such as Brazil (2.75) and Mexico (2.85).36
32 February 15, 2008 bulletin. http://www.g-ports.com/gp_Congestion.aspx.33 Wallack (op. cit, appendix p. 13).34 Wallack (op. cit, appendix p. 14).35 Wallack (op. cit).36 Similar results are obtained with the Doing Business Indicators, Trading across Borders (2009), where India is well behind the OECD average, but scores better or on par with
25India’s Growth Story: A Latin American Perspective >>
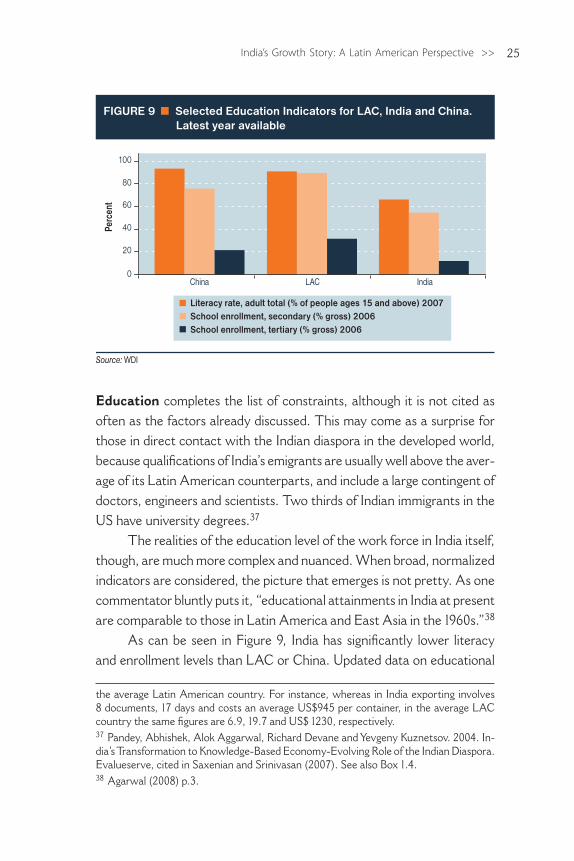
Education completes the list of constraints, although it is not cited as often as the factors already discussed. This may come as a surprise for those in direct contact with the Indian diaspora in the developed world, because qualifications of India’s emigrants are usually well above the aver-age of its Latin American counterparts, and include a large contingent of doctors, engineers and scientists. Two thirds of Indian immigrants in the US have university degrees.37
The realities of the education level of the work force in India itself, though, are much more complex and nuanced. When broad, normalized indicators are considered, the picture that emerges is not pretty. As one commentator bluntly puts it, “educational attainments in India at present are comparable to those in Latin America and East Asia in the 1960s.”38
As can be seen in Figure 9, India has significantly lower literacy and enrollment levels than LAC or China. Updated data on educational
0
20
40
60
80
100
China LAC India
FIGURE 9 Selected Education Indicators for LAC, India and China.Latest year available
Perc
ent
Source: WDI
Literacy rate, adult total (% of people ages 15 and above) 2007School enrollment, secondary (% gross) 2006School enrollment, tertiary (% gross) 2006
the average Latin American country. For instance, whereas in India exporting involves 8 documents, 17 days and costs an average US$945 per container, in the average LAC country the same figures are 6.9, 19.7 and US$ 1230, respectively.37 Pandey, Abhishek, Alok Aggarwal, Richard Devane and Yevgeny Kuznetsov. 2004. In-dia’s Transformation to Knowledge-Based Economy-Evolving Role of the Indian Diaspora. Evalueserve, cited in Saxenian and Srinivasan (2007). See also Box 1.4. 38 Agarwal (2008) p.3.
<< India: Latin America’s Next Big Thing?26
attainments is hard to come by, but the latest available and comparable figures also put India well behind these two economies. In 2000, India’s average years of schooling and the percentage of the population with no schooling were 4.5 and 40.7 percent, respectively, whereas the same figures for LAC and China were 6.6 and 14.6 percent and 6.4 and 18 percent, respectively (Barro and Lee 2001).
Though relevant, these normalized indices do not tell the whole story. As in the case of China, the sheer size of India’s population means that absolute numbers also matter. This is particularly the case for higher education for which India had an enrollment of 13.7 million in 2005–2006, whereas the entire LAC region had about 14 million students. The fig-ures for technology-related professions are even more impressive, with India graduating 464,743 engineers in 2004–05 —not as much as China’s 600,000, but well above the 70,000 engineers in the U.S. and 100,000 in all of Europe. In LAC, roughly comparable figures for Brazil, Chile, and Mexico for 2006 are 37,900, 12,410 and 60,800 graduating engineers, respectively.39
The quality of these Indian graduates is widely seen as very het-erogeneous, reflecting the mixed quality of India’s rapidly growing higher education sector. But this is also the case for LAC, and India, unlike most LAC countries, appears to have a core of world class institutions. Among them are the Indian Institutes of Technology, the National Institutes of Technology, and the Indian Institutes of Management (see Box 1.3), which are big enough to ensure that the country has the resources to expand into skill-intensive areas such as IT-services (see next section), despite its overall lackluster educational indices.40
The exuberance of India’s absolute figures at the top of the educa-tional pyramid does not, however, detract from the argument that the
39 Data for China, India, US and Europe from http://inhome.rediff.com/money/2006/jun/ 09bspec.htm. Data for LAC countries from UNESCO (2008). 40 See Aggarwal (op. cit) for a detailed analysis of India’s higher education sector. As Aggarwal (p. 12) points out: “Although a small number of students get the opportunity to study at these elite institutions, several hundred thousand students undertake intense preparations in an attempt to gain admission into them. This has, in itself, given rise to a huge coaching industry but then the result is improved learning outcomes for a large sec-tion of the population.”
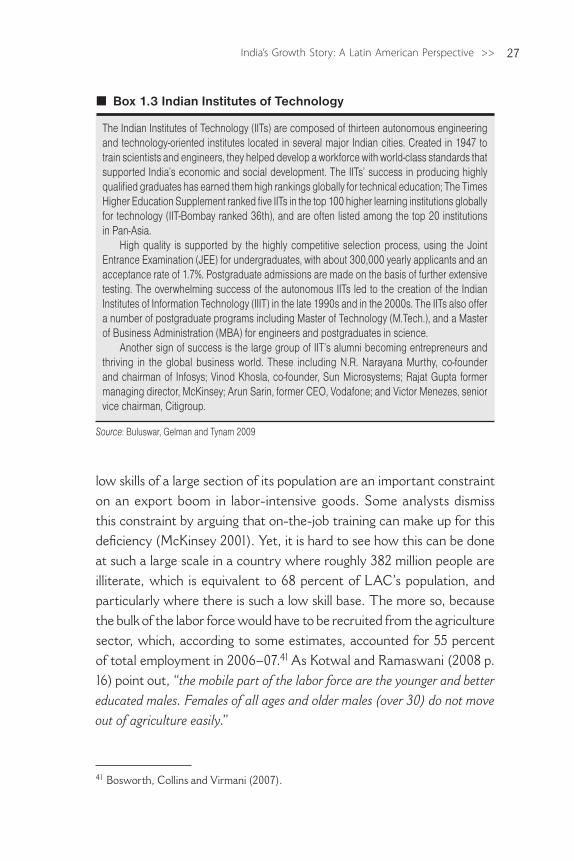
27India’s Growth Story: A Latin American Perspective >>
low skills of a large section of its population are an important constraint on an export boom in labor-intensive goods. Some analysts dismiss this constraint by arguing that on-the-job training can make up for this deficiency (McKinsey 2001). Yet, it is hard to see how this can be done at such a large scale in a country where roughly 382 million people are illiterate, which is equivalent to 68 percent of LAC’s population, and particularly where there is such a low skill base. The more so, because the bulk of the labor force would have to be recruited from the agriculture sector, which, according to some estimates, accounted for 55 percent of total employment in 2006–07.41 As Kotwal and Ramaswani (2008 p. 16) point out, “the mobile part of the labor force are the younger and better educated males. Females of all ages and older males (over 30) do not move out of agriculture easily.”
41 Bosworth, Collins and Virmani (2007).
n Box 1.3 Indian Institutes of Technology
The Indian Institutes of Technology (IITs) are composed of thirteen autonomous engineering and technology-oriented institutes located in several major Indian cities. Created in 1947 to train scientists and engineers, they helped develop a workforce with world-class standards that supported India’s economic and social development. The IITs’ success in producing highly qualified graduates has earned them high rankings globally for technical education; The Times Higher Education Supplement ranked five IITs in the top 100 higher learning institutions globally for technology (IIT-Bombay ranked 36th), and are often listed among the top 20 institutions in Pan-Asia.
High quality is supported by the highly competitive selection process, using the Joint Entrance Examination (JEE) for undergraduates, with about 300,000 yearly applicants and an acceptance rate of 1.7%. Postgraduate admissions are made on the basis of further extensive testing. The overwhelming success of the autonomous IITs led to the creation of the Indian Institutes of Information Technology (IIIT) in the late 1990s and in the 2000s. The IITs also offer a number of postgraduate programs including Master of Technology (M.Tech.), and a Master of Business Administration (MBA) for engineers and postgraduates in science.
Another sign of success is the large group of IIT’s alumni becoming entrepreneurs and thriving in the global business world. These including N.R. Narayana Murthy, co-founder and chairman of Infosys; Vinod Khosla, co-founder, Sun Microsystems; Rajat Gupta former managing director, McKinsey; Arun Sarin, former CEO, Vodafone; and Victor Menezes, senior vice chairman, Citigroup.
Source: Buluswar, Gelman and Tynam 2009
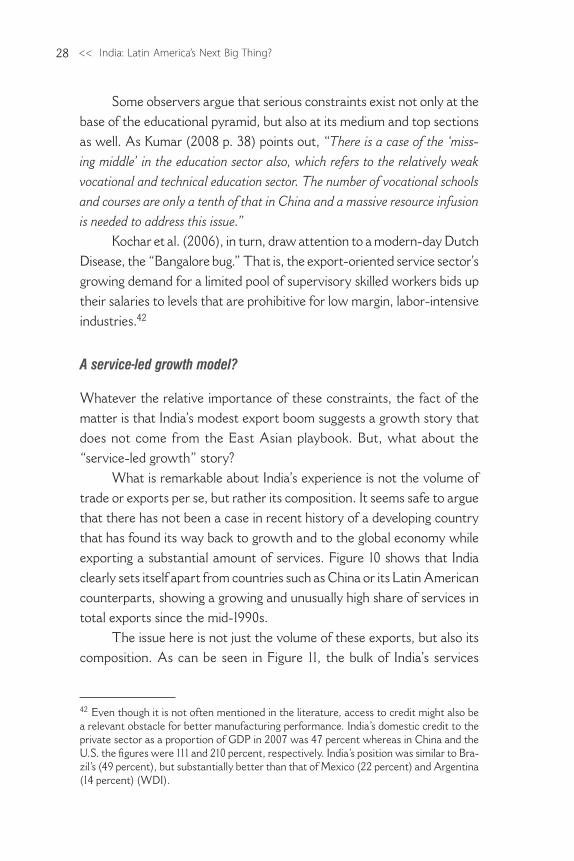
<< India: Latin America’s Next Big Thing?28
Some observers argue that serious constraints exist not only at the base of the educational pyramid, but also at its medium and top sections as well. As Kumar (2008 p. 38) points out, “There is a case of the ‘miss-ing middle’ in the education sector also, which refers to the relatively weak vocational and technical education sector. The number of vocational schools and courses are only a tenth of that in China and a massive resource infusion is needed to address this issue.”
Kochar et al. (2006), in turn, draw attention to a modern-day Dutch Disease, the “Bangalore bug.” That is, the export-oriented service sector’s growing demand for a limited pool of supervisory skilled workers bids up their salaries to levels that are prohibitive for low margin, labor-intensive industries.42
A service-led growth model?
Whatever the relative importance of these constraints, the fact of the matter is that India’s modest export boom suggests a growth story that does not come from the East Asian playbook. But, what about the “service-led growth” story?
What is remarkable about India’s experience is not the volume of trade or exports per se, but rather its composition. It seems safe to argue that there has not been a case in recent history of a developing country that has found its way back to growth and to the global economy while exporting a substantial amount of services. Figure 10 shows that India clearly sets itself apart from countries such as China or its Latin American counterparts, showing a growing and unusually high share of services in total exports since the mid-1990s.
The issue here is not just the volume of these exports, but also its composition. As can be seen in Figure 11, the bulk of India’s services
42 Even though it is not often mentioned in the literature, access to credit might also be a relevant obstacle for better manufacturing performance. India’s domestic credit to the private sector as a proportion of GDP in 2007 was 47 percent whereas in China and the U.S. the figures were 111 and 210 percent, respectively. India’s position was similar to Bra-zil’s (49 percent), but substantially better than that of Mexico (22 percent) and Argentina (14 percent) (WDI).
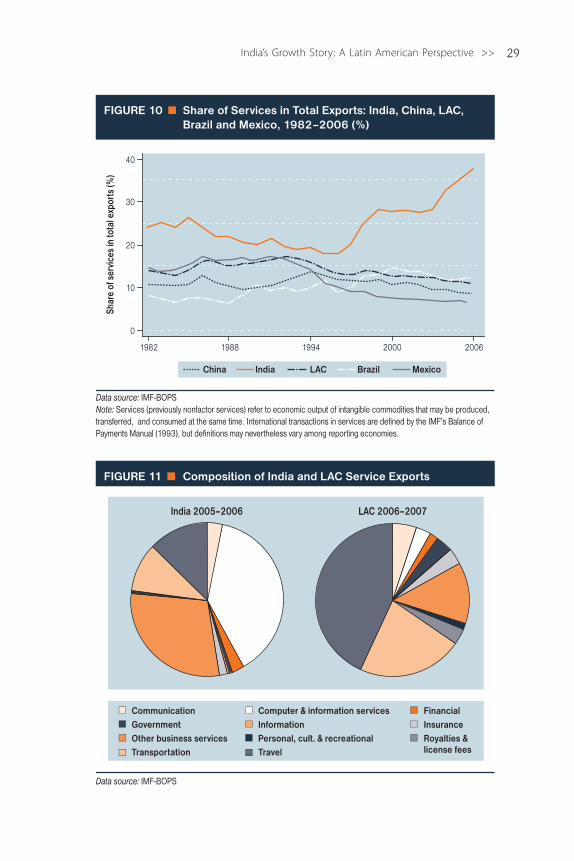
29India’s Growth Story: A Latin American Perspective >>
0
10
20
30
40
Shar
e of
ser
vice
s in
tota
l exp
orts
(%)
1982 1988 1994 2000 2006
Data source: IMF-BOPSNote: Services (previously nonfactor services) refer to economic output of intangible commodities that may be produced, transferred, and consumed at the same time. International transactions in services are defined by the IMF's Balance of Payments Manual (1993), but definitions may nevertheless vary among reporting economies.
FIGURE 10 Share of Services in Total Exports: India, China, LAC, Brazil and Mexico, 1982–2006 (%)
India LAC Brazil MexicoChina
India 2005–2006 LAC 2006–2007
Communication
Government
Other business services
Transportation
Computer & information services
Information
Personal, cult. & recreational
Travel
Financial
Insurance
Royalties & license fees
Data source: IMF-BOPS
FIGURE 11 Composition of India and LAC Service Exports
<< India: Latin America’s Next Big Thing?30
exports is made up of so-called IT (information technology) and ITES (in-formation technology enabled sectors), which fall into the IMF categories of computer and “other business professional and non-technical” services, respectively. This contrasts sharply with the composition of LAC’s ser-vice exports, which are dominated by travel (tourism) and transportation services (more on this in Chapter 3).
A series of policies and fortunate events. India’s most formidable and well known success in services exports is in the computer and informa-tion category, made up mostly of software. India is well ahead of any other exporters in this category, with huge gaps separating it from LAC countries and even China (see Chapter 3). What is behind this success?
To the dismay of Latin American policymakers hoping to emulate India’s IT export boom, there is no clear-cut answer to this question. By most accounts, India’s IT success is the result of a complex mix of public policies, both good and bad, and fortuitous events.
Srinivasan (2005) offers one of the best accounts and draws attention to the key elements of the story. A first element was the inward-oriented policies that virtually banned imports of computer hardware and soft-ware and restricted technology transfer and FDI, eventually driving out companies such as IBM. These policies were similar to Brazil’s disastrous informatics policy of the 1980s, which failed to develop a competitive computer industry and imposed huge costs on the rest of the economy.43 In India, though, those policies apparently contributed in some way to developing a critical mass of software skills, ready to be tapped in a more open, favorable policy environment.
Second, there was the policy shift in the mid-1980s that lifted re-strictions on the import of software and hardware, brought tariffs down moderately, and targeted the software industry with incentives, with a clear objective of making the industry globally competitive.
The real breakthrough, though, would come with the third ele-ment, which was the market-oriented reforms of the early nineties that opened the way for the development of a supportive telecommunications
43 See Moreira (op cit).
31India’s Growth Story: A Latin American Perspective >>
infrastructure and introduced the Software Technology Parks, which are special economic zones where software firms are free to operate with-out any of the constraints of India’s policy regime or infrastructure. For example, they enjoy tax and import tariff exemptions, no restrictions on FDI or technology imports, and dedicated telecommunications and power infrastructure (see Box 1.2).44
These elements were complemented by other not directly related policies and fortuitous events such as:
a. India’s investment in higher education and R&D, particularly the setup of the IITs network (Box 1.3) and public sector R&D labs (clustered in the cities of Bangalore, Chennai, Hyderabad, Mumbai, New Delhi, and Pune) led to a critical mass of English-speaking engineers.
b. The massive, and initially deplored, emigration of skilled Indians to developed countries after independence, particularly to the U.S, resulted in Indian expatriates transferring knowledge, contacts, reputations, and capital back home, which turned out to be a key element in developing the country’s software and IT industry at home (see Box 1.4)
c. The unexpected Y2K crisis (the adaptation of computer systems to the year 2000), with leading US firms turning to Indian software firms to address the problem. “It helped to legitimate India as a reliable location for software development and resulted in a substantial increase in customers and orders for Indian software service companies”(Saxenian and Srinivasan 2007 p. 15)
High profile but small contribution. Despite its enormous success and policy significance, in addition to the likely positive externalities for the whole economy that are hard to measure, the boom in IT service exports cannot explain most of India’s growth in the 1990s and beyond. Or can it?
National accounts data helps to bring some perspective to the IT boom. As can be seen in Figure 12, the business services sector, which
44 See Gordon and Gupta (2004) for some empirical evidence about the role of reforms in the 1990s.
<< India: Latin America’s Next Big Thing?32
n Box 1.4 India’s and LAC’s Diaspora Networks
Recent literature on migration suggests that migrants can alter the development trajectory through the diffusion of knowledge and/or technology transfers. These would be the benefits of “brain circulation”, in marked contrast to the better known costs of “brain drain.” India’s case seems to prove this point, particularly the growth of the IT industry in Bangalore. The development of this industry depended on initial contributions from US-educated Indian engineers based in Silicon Valley. These contributions can be broken down into four basic categories:
1. Indians in Silicon Valley served as reputational intermediaries: their accomplishments helped eliminate negative stereotypes about the quality of work in India. This in turn allowed them to match US-based customers with Indian service providers, as well as to convince US-based firms to set up software development centers in India.
2. US-educated Indians invested significant personal time and effort in making the business case for establishing subsidiaries in India, as well as in the hard work of setting up and ensuring the success of these centers.
3. A smaller network of successful US-educated Indians actively contributed to influential policy reform in areas such as promoting a domestic venture capital industry, removing obstacles to foreign investment, deregulation of the telecommunications sector, and so forth.
4. A virtuous cycle of growing US markets for the low cost, high quality services of domestic Indian businesses, growing Silicon Valley investments in Bangalore start-ups and overseas development centers, and successful policy reforms in key areas contributed to the return of growing numbers of experienced engineers, entrepreneurs, and investors to India.
Unlike India, LAC could be cited as a counterproof to the benefits of “brain circulation”. Despite the sizeable migrant community (according to the 2005 American Community Survey, the US has a population of 3,084,580 Central Americans, 2,238,836 South Americans and 26,781,547 Mexicans.), LAC’s diaspora have so far failed to generate the same kind of benefits enjoyed by India. What is behind this contrast? A number of possible explanations are worth mentioning:
Scale: Although sizable, LAC’s diaspora is much smaller than that of India or China, limiting the potential volume of economic remittances or investments generated by a diaspora. However, this does not seem to tell the whole story since there is substantial evidence of significant contributions by highly skilled overseas communities from smaller nations such as Israel, Taiwan, and Ireland.
The skill composition, geographic location, and concentration: the Indian diaspora consists of a mix of both skilled and unskilled components pursuing a variety of occupations in a range of sectors and geographies. This ensures that the diaspora maintains a number of different forms of linkages including both financial and social remittances, instead of relying on one or the other completely. LAC’s diaspora, by contrast, is made up largely of low-skilled workers. For instance, whereas two thirds of Indian immigrants in the US have university degrees, only a very small proportion of the Mexican immigrant population has tertiary education. Moreover, the high concentration of portions of the Indian diaspora in certain industries and locations has
Continued on next page
33India’s Growth Story: A Latin American Perspective >>
n Box 1.4 India’s and LAC’s Diaspora Networks (continued)
Source: Saxenian and Srinivasan (2007).
driven some significant contributions, such as those made in the Indian software industry for example. LAC’s diaspora is more dispersed in both sectoral and geographic terms.
Scale of diaspora efforts: The Colombian and Chilean diaspora networks, for example, spanned a number of sectors and geographical areas without achieving sufficient concentration in any one sector or location. This limits the ability to create a strong sense of collective purpose, as well as to build bonds with counterparts at home. In the high-skilled immigrant technology networks from India, like those from China, Taiwan, and Israel, the alumni networks from elite colleges and universities have provided a key source of shared professional identities and trust among those living overseas as well as with their counterparts who remained at home. In each of these cases, classmates in both government and industry circles served as home country collaborators. Alumni networks were crucial to diaspora contributions in the Indian software industry and in medical tourism, as they were in the Taiwanese and Chinese semiconductor and computer industries, and the Israeli security and software industries. The limited number of high quality educational institutions in LAC of the sort that created these far-flung professional networks, may explain the lack of similar effects coming from the region’s diaspora.
The role of the State: The opening of the Indian economy in the mid-1980s facilitated the initial diaspora contributions to the software industry; and subsequent policy reforms, often influenced by the diaspora, were critical to their ongoing contributions. It seems that LAC nations suffer from two limitations: the limitation of the small scale and dispersed nature of their diaspora communities, and the limitations of governments that are unwilling to open up or unable to make the necessary investments in stability and in building a domestic base of skill and technology. One of the most important investments, albeit very long term, would be to improve educational institutions at all levels.
includes IT and ITE services,registered the second highest annual growth from 1991–91 to 2006–2007, right behind communications. Yet, it only explains 5.5 percent of the accumulated GDP growth in the period, re-flecting its small share of the whole economy (3.7 percent in 2006–07). Even if we add the contribution of the fastest growing service sectors (business services, communication, hotel and restaurant and banking and insurance), which account for most of the growth in services, the contribution to overall growth is not more than 23 percent (accounting for 17 percent of GDP in 2006–07).
True, if we add all the service sectors together their 7.8 percent average annual growth explains as much as 72 percent of accumulated economic growth in the period, with a GDP share that reaches 64 percent
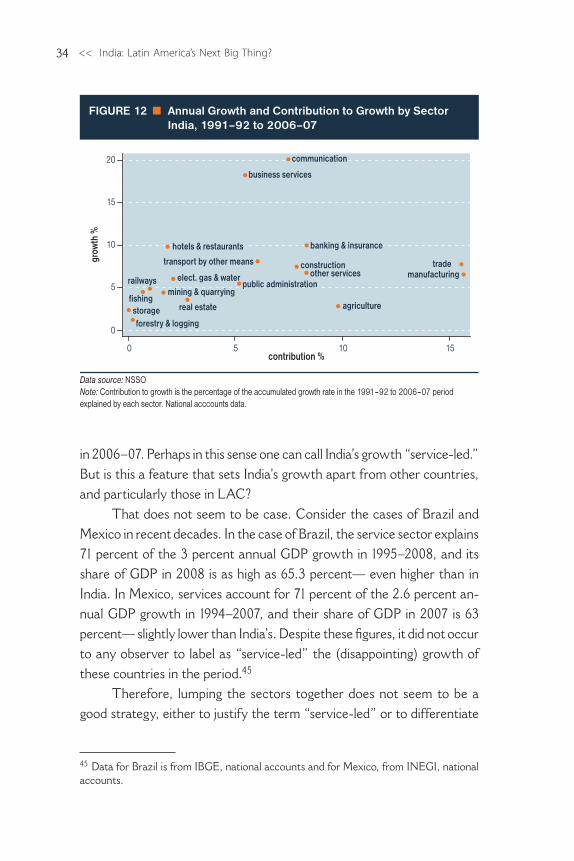
<< India: Latin America’s Next Big Thing?34
in 2006–07. Perhaps in this sense one can call India’s growth “service-led.” But is this a feature that sets India’s growth apart from other countries, and particularly those in LAC?
That does not seem to be case. Consider the cases of Brazil and Mexico in recent decades. In the case of Brazil, the service sector explains 71 percent of the 3 percent annual GDP growth in 1995–2008, and its share of GDP in 2008 is as high as 65.3 percent— even higher than in India. In Mexico, services account for 71 percent of the 2.6 percent an-nual GDP growth in 1994–2007, and their share of GDP in 2007 is 63 percent— slightly lower than India’s. Despite these figures, it did not occur to any observer to label as “service-led” the (disappointing) growth of these countries in the period.45
Therefore, lumping the sectors together does not seem to be a good strategy, either to justify the term “service-led” or to differentiate
agriculture
forestry & logging
fishingmining & quarrying
elect. gas & waterconstruction trade
hotels & restaurants
railways
transport by other means
storage
communication
banking & insurance
real estate
business services
public administrationother services manufacturing
0
5
10
15
20
grow
th %
0 5 10 15contribution %
Data source: NSSONote: Contribution to growth is the percentage of the accumulated growth rate in the 1991–92 to 2006–07 period explained by each sector. National acccounts data.
FIGURE 12 Annual Growth and Contribution to Growth by SectorIndia, 1991–92 to 2006–07
45 Data for Brazil is from IBGE, national accounts and for Mexico, from INEGI, national accounts.
35India’s Growth Story: A Latin American Perspective >>
India’s growth “strategy.” This is especially the case since: (a) the service sector in developing countries tends to be dominated by informal and low productivity activities, whose contribution to GDP is usually calculated as a residual; (b) its growth may merely reflect the economies’ inability to generate higher productivity jobs in other activities; and (c) its growth can be the result of the outsourcing (splintering) of tasks from other sec-tors of the economy, whose performance ultimately drives growth.46 In short, calling India’s growth “service-led” does not seem to carry us very far towards solving the “mystery.”
Plain vanilla growth?
A potentially more revealing way of looking at India’s growth story is the time-honored growth accounting exercise, whereby the sources of GDP growth per capita are decomposed and narrowed down to changes in three supply factors: total factor productivity, physical capital, and human capital. Total factor productivity (TFP) measures the joint effectiveness of all the inputs combined in producing the economy’s overall output and can be thought of as a proxy for technological change. Physical capital is the stock of machines, equipment and structures, whereas human capital is the stock of education and training represented by the labor force.47
Economists use this framework to account for differences in income and growth across countries, and both theory and the empirical evidence point to TFP as the main driver of long-term growth. That does not mean that factor accumulation (i.e. physical and human capital) is a minor issue. TFP growth, at least in part, depends on how robust this accumulation is and vice-versa. Available evidence suggests that accumulation is par-ticularly important at low levels of per capita income.
So, what does this type of exercise tell us about India’s growth, particularly as compared to LAC’s? Before proceeding, readers should be
46 Singh (2006) presents some evidence that outsourcing, though relevant in the 1980s, did not play a major role in the 1990s. The evidence, though, is far from conclusive. 47 See Helpman 2004 for a non-technical and insightful explanation.
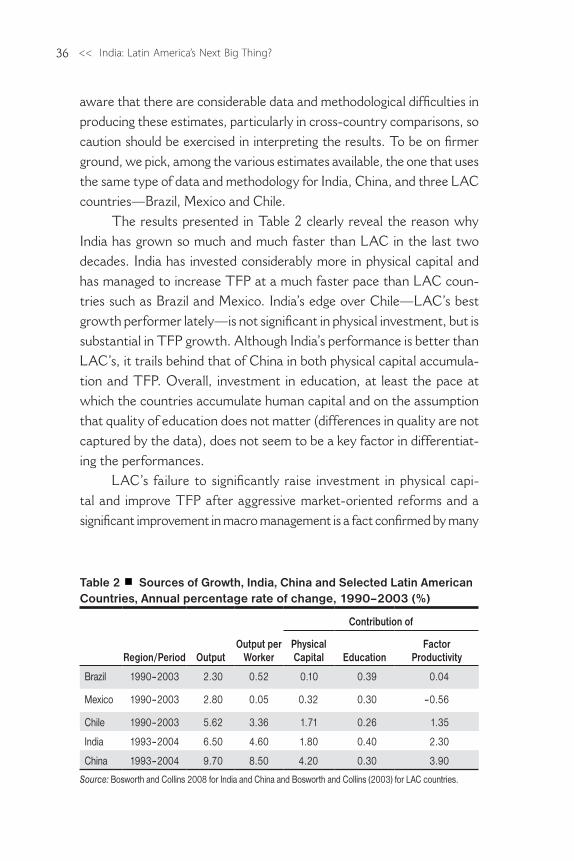
<< India: Latin America’s Next Big Thing?36
aware that there are considerable data and methodological difficulties in producing these estimates, particularly in cross-country comparisons, so caution should be exercised in interpreting the results. To be on firmer ground, we pick, among the various estimates available, the one that uses the same type of data and methodology for India, China, and three LAC countries—Brazil, Mexico and Chile.
The results presented in Table 2 clearly reveal the reason why India has grown so much and much faster than LAC in the last two decades. India has invested considerably more in physical capital and has managed to increase TFP at a much faster pace than LAC coun-tries such as Brazil and Mexico. India’s edge over Chile—LAC’s best growth performer lately—is not significant in physical investment, but is substantial in TFP growth. Although India’s performance is better than LAC’s, it trails behind that of China in both physical capital accumula-tion and TFP. Overall, investment in education, at least the pace at which the countries accumulate human capital and on the assumption that quality of education does not matter (differences in quality are not captured by the data), does not seem to be a key factor in differentiat-ing the performances.
LAC’s failure to significantly raise investment in physical capi-tal and improve TFP after aggressive market-oriented reforms and a significant improvement in macro management is a fact confirmed by many
Table 2 Sources of Growth, India, China and Selected Latin American Countries, Annual percentage rate of change, 1990–2003 (%)
Region/Period
Output
Output per
Worker
Contribution of
PhysicalCapital
Education
FactorProductivity
Brazil 1990–2003 2.30 0.52 0.10 0.39 0.04
Mexico 1990–2003 2.80 0.05 0.32 0.30 –0.56
Chile 1990–2003 5.62 3.36 1.71 0.26 1.35
India 1993–2004 6.50 4.60 1.80 0.40 2.30
China 1993–2004 9.70 8.50 4.20 0.30 3.90
Source: Bosworth and Collins 2008 for India and China and Bosworth and Collins (2003) for LAC countries.
37India’s Growth Story: A Latin American Perspective >>
other studies that use a similar methodology.48 The relatively slow pace of India’s reforms and its better results make this disappointing performance even more puzzling. The growth accounting framework helps us to better understand the immediate drivers behind India’s growth and the differences with respect to LAC. Unfortunately, it only goes so far. It does not tell us why investment and TFP have responded much better to market incen-tives in India, even though they were administered much more sparingly.
One possible and somewhat comforting explanation may lie in the fact that India, both in terms of per capita income and the functioning of its markets, is departing from a much “smaller base” than the average LAC country, so the mere process of catching up is bound to produce more powerful results, as was the case for Brazil and Mexico in the 1960s and 1970s. In fact, given that government intervention in neither country was ever as pervasive as it was (is) in India, the latter’s catch-up benefits, at least in theory, could go beyond what these LAC countries experienced decades ago.49
In all, we can argue that despite the prominent role of the reforms, and particularly trade reforms, India’s growth story defies any cookie-cutter characterization. It can hardly be described as an export-led growth story or as an unprecedented “service-led” story. But it does have some of the key elements usually associated with high growth, such as relatively high rates of investment in physical capital and productivity growth. Coinci-dence or not, this is exactly what has been missing in LAC.
Sustainable?
Is India’s current pattern of growth sustainable? As LAC knows only too well, growth can hardly be sustainable if it is not supported by sustainable
48 See, for instance, Blyde and Fernández-Arias (2005). 49 Hsieh and Klenow (2009) findings, for instance, suggest that there are still big distor-tions in India’s economy and that a further deepening of the reforms may have a big impact on productivity. According to the authors, if rates of return across firms in India were as homogenous as in the US (assuming that in a free market economy rates of return across firms are equalized and the U.S. is a good proxy for such an economy) TFP would increase between 50 to 60 percent. The same figure for China is 25 to 40 percent.
<< India: Latin America’s Next Big Thing?38
fiscal policies, and if it fails to generate enough jobs at the bottom of the income distribution, and thus fuels a trend of growing inequality. These seem to be the two main causes for concern with regard to India’s cur-rent cycle of prosperity.
The fiscal imperative. As Srinivisan (2008) pointed out, India’s brand of fiscal federalism combined with increasing political fragmentation has been putting considerable strain on the country’s public finances, chal-lenging its hard-won and much envied reputation for fiscal rectitude, at least from a Latin American point of view.
After reigning in the high budget deficits of the 1980s, India saw its combined central and state deficits crawling back up again, reaching a peak of nearly 10 percent of GDP in 2001–02 and fueling a growing public debt. Living up to its reputation, the government managed to reverse this potentially explosive course, bringing down the deficit to 5.3 percent of GDP in 2008–09. The combined public debt, after reaching a peak of 81 percent of GDP in 2003–04, has also reversed course, falling to 77 percent of GDP in 2006–07.50
Despite improvements, concerns remain about the long-term sustainability of the debt, particularly given the fiscal burden that the current world crisis will bring.51 There are also legitimate concerns about the compatibility between the incentives of the current system of fiscal federalism and the need to maintain fiscal discipline. Some analysts call for “urgent” reform.52
Creating (high productivity) jobs. As important as the fiscal issue is, the challenge of generating jobs seems to be by far the most daunting. Whatever label we attach to India’s growth, there seems to be a con-
50 Data from the Reserve Bank of India, Handbook of Statistics on the Indian Economy. http://www.rbi.org.in/scripts/AnnualPublications.aspx?head=Handbook%20of%20Statistics%20on%20Indian%20Economy51 The government has unveiled three stimulus packages since December 2008, amount-ing to 2 percent of GDP, including lowering retail fuel prices, cutting taxes on consumer products and injecting capital into state-run banks.52 Srinivasan (op cit. p. 60). For a review of India’s fiscal federalism see Shukla (2007).
39India’s Growth Story: A Latin American Perspective >>
sensus among analysts that job generation has been disappointing. The idiosyncrasies of India’s labor market and data collection make it virtually impossible to sum up the situation with just one simple indicator. Yet, there are some clear signs that employment has been slow to respond.
A number of analysts point to the stagnation of employment in the so-called organized sector, which, as discussed before, accounts for only 8 to 10 percent of the workforce. Between 1991–92 and 2005–06, the annual average rate of growth of this sector was virtually zero (–0.1 percent), with the level of employment in 2005–06 slightly lower than it was at the beginning of the period. This performance has done little to reduce informality.53 As has been argued elsewhere, apart from the undesirable implications for the basic rights of the workforce, high levels of informality can hurt productivity and growth because firms have dif-ficulties accessing critical inputs, particularly credit, and cannot engage in formal business relationships.54
The figures for total employment (“organized” and “unorganized” sectors) paint a more mixed picture. As can be seen in Table 3, annual employment growth dropped sharply in the first decade of the reforms. This outcome resulted mainly from the performance of the agricultural sector, although even manufacturing and services had job growth rates well below what they experienced in the 1980s. From 1999–00 onwards there was marked improvement in job growth, but again, this was ex-plained mainly by agriculture’s exceptional performance. Job growth in manufacturing improved quite significantly (3.2 percent), but remained below the rates of the 1980s despite higher output growth, whereas for services the rates dropped sharply (1.9 percent).
Since these figures mainly reflect the performance of the unorganized sector, for which it is hard to overstate the problems of data collection and for which international comparisons are hazardous to draw, they should be interpreted with caution. Yet they seem to confirm the picture
53 Directorate General of Employment and Training, Ministry of Labour & Employment, Government of India. Table 14. See for instance Singh (2006), Pal and Ghosh (2007), and Kotwal and Ramaswani (2008) for a discussion of this issue. 54 OECD (2009)
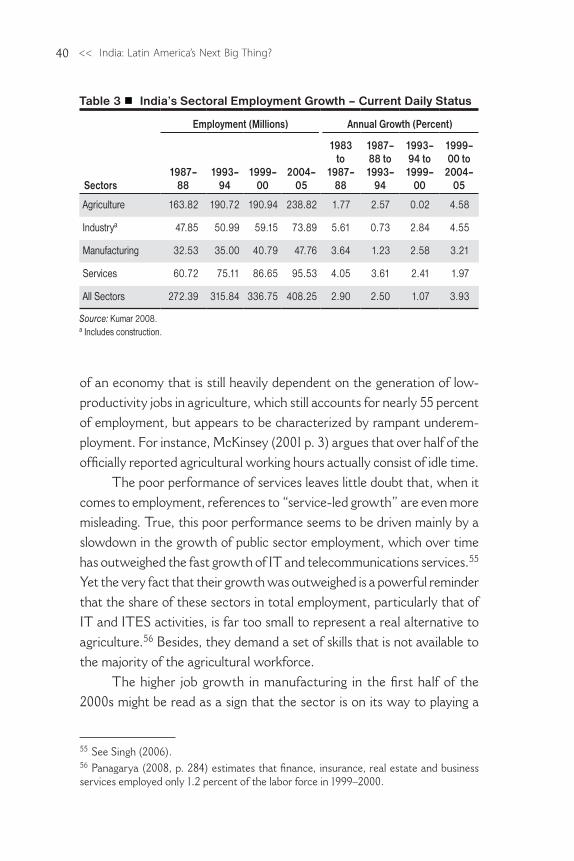
<< India: Latin America’s Next Big Thing?40
of an economy that is still heavily dependent on the generation of low-productivity jobs in agriculture, which still accounts for nearly 55 percent of employment, but appears to be characterized by rampant underem-ployment. For instance, McKinsey (2001 p. 3) argues that over half of the officially reported agricultural working hours actually consist of idle time.
The poor performance of services leaves little doubt that, when it comes to employment, references to “service-led growth” are even more misleading. True, this poor performance seems to be driven mainly by a slowdown in the growth of public sector employment, which over time has outweighed the fast growth of IT and telecommunications services.55 Yet the very fact that their growth was outweighed is a powerful reminder that the share of these sectors in total employment, particularly that of IT and ITES activities, is far too small to represent a real alternative to agriculture.56 Besides, they demand a set of skills that is not available to the majority of the agricultural workforce.
The higher job growth in manufacturing in the first half of the 2000s might be read as a sign that the sector is on its way to playing a
55 See Singh (2006). 56 Panagarya (2008, p. 284) estimates that finance, insurance, real estate and business services employed only 1.2 percent of the labor force in 1999–2000.
Table 3 India’s Sectoral Employment Growth – Current Daily Status
Sectors
Employment (Millions) Annual Growth (Percent)
1987– 88
1993–94
1999–00
2004–05
1983to
1987–88
1987–88 to
1993–94
1993–94 to
1999–00
1999–00 to
2004–05
Agriculture 163.82 190.72 190.94 238.82 1.77 2.57 0.02 4.58
Industrya 47.85 50.99 59.15 73.89 5.61 0.73 2.84 4.55
Manufacturing 32.53 35.00 40.79 47.76 3.64 1.23 2.58 3.21
Services 60.72 75.11 86.65 95.53 4.05 3.61 2.41 1.97
All Sectors 272.39 315.84 336.75 408.25 2.90 2.50 1.07 3.93
Source: Kumar 2008.a Includes construction.
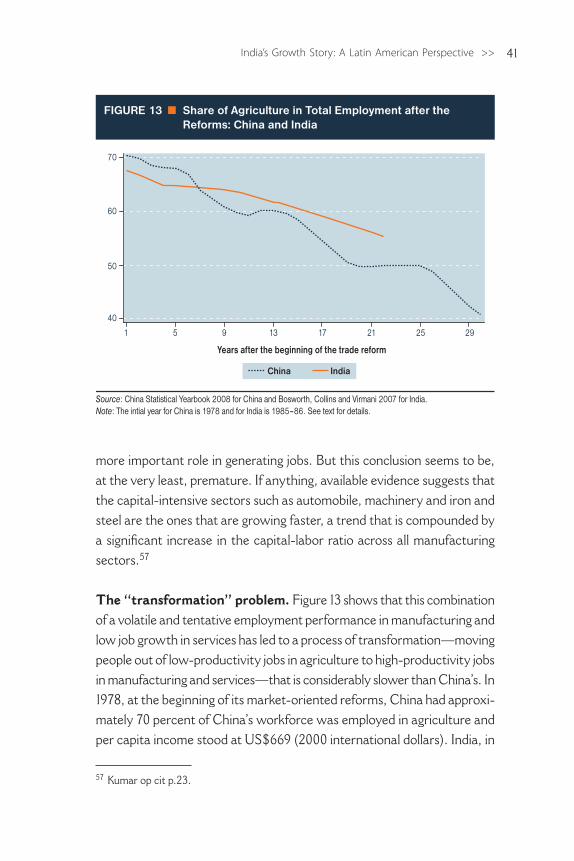
41India’s Growth Story: A Latin American Perspective >>
more important role in generating jobs. But this conclusion seems to be, at the very least, premature. If anything, available evidence suggests that the capital-intensive sectors such as automobile, machinery and iron and steel are the ones that are growing faster, a trend that is compounded by a significant increase in the capital-labor ratio across all manufacturing sectors.57
The “transformation” problem. Figure 13 shows that this combination of a volatile and tentative employment performance in manufacturing and low job growth in services has led to a process of transformation—moving people out of low-productivity jobs in agriculture to high-productivity jobs in manufacturing and services—that is considerably slower than China’s. In 1978, at the beginning of its market-oriented reforms, China had approxi-mately 70 percent of China’s workforce was employed in agriculture and per capita income stood at US$669 (2000 international dollars). India, in
Source: China Statistical Yearbook 2008 for China and Bosworth, Collins and Virmani 2007 for India.Note: The intial year for China is 1978 and for India is 1985–86. See text for details.
FIGURE 13 Share of Agriculture in Total Employment after the Reforms: China and India
IndiaChina
40
50
60
70
1 5 9 13 17 21 25 29
Years after the beginning of the trade reform
57 Kumar op cit p.23.
<< India: Latin America’s Next Big Thing?42
turn, at the start of its “piecemeal reforms” process in 1985, notwithstand-ing a level of per capita income that was more than twice that of China (US$ 1500), had almost the same share of total employment in agriculture (67 percent). As reforms progressed in both countries, the exodus from agriculture proceeded at a much faster pace in China.
This scenario seems to put a very high premium on India’s ability to remove constraints on the export of labor-intensive goods, which, as discussed earlier arise from deficiencies in labor regulations, infrastructure and human capital. Naturally, these same constraints affect growth in all sectors of the economy, and addressing them will generate benefits that go well beyond the labor-intensive manufacturing sector. Yet this one sector seems to offer the most efficient and well-proven answer to the employment generation needs of an economy that still has very high levels of rural poverty and growing inequality.
As figures on job growth suggest, the service sector does not seem to be a viable proposition unless one is thinking about questionable alter-native forms of underemployment, with the rural population migrating into low productivity, informal, service jobs in the cities, a process well too familiar to countries in LAC.
The urgency and importance of generating higher productivity jobs in India is vividly underlined by the poverty figures. If the official poverty line is used, the rate of progress looks encouraging, with the percentage of people living in poverty falling from approximately 55 percent in the early 1970s to just below 30 percent in 2005, with a significant increase in the rate of poverty reduction between the pre- and post-reform periods.58
But if internationally comparable indicators are used, such as the World Bank’s poverty headcount ratio at $1.25 a day (PPP), the gains look less impressive, with the poverty ratio falling from 55 percent in 1983 to only 42 percent in 2005.59 This rate of poverty reduction looks especially lackluster compared to China’s, which managed to bring the same ratio down from 69 percent in 1984 to 16 percent in 2005. The 42 percent level achieved in 2005 leaves no doubt that India still faces a social challenge
58 See Panagarya (2008, chapter 7). 59 Word Development Indicators.
43India’s Growth Story: A Latin American Perspective >>
that is considerably steeper and more pressing than that of China, or even of LAC, whose average poverty ratio of 8.2 percent in 2005 is commonly regarded as an insurmountable social “debt.”
The poverty challenge is compounded by high levels of inequality, not so much in terms of income—Brazil, arguably the worst case in LAC, in 2005 had a 0.56 Gini coefficient against India’s 0.37—but certainly in terms of wealth.60 As Bardhan (2008), put it, “India’s wealth inequality (say, in land distribution, and even more in education or human capital) is high. For example, the Gini coefficient of household wealth inequality, on the basis of National Sample Survey data, is estimated to be 0.63 in rural India and 0.66 in urban India. India’s educational inequality is one of the worst in the world: according to data in the World Development Report 2006, the Gini coefficient of the distribution of adult schooling years in the population was 0.56 in India in 1998/2000, which is higher than that in almost all Latin American countries.”61
Whatever the path India takes to meet the job challenge, there will be important repercussions for both India-LAC bilateral relations and LAC’s presence in world markets. For instance, if India moves aggressively to remove the constraints holding back labor-intensive exports—a move that not only seems to be the most promising, but that the government with measures such as SEZ has already signaled to be willing to make—LAC‘s manufacturing exports sector will have to prepare itself for another major competitive shock, compounding the already formidable challenge represented by China. Implications for LAC’s own job problems are not hard to fathom.
The counterpart of more pressure on manufacturing, though, is likely to be greater opportunities for agriculture and mining. A boom in labor-intensive exports is likely to move people out of agriculture faster, making it easier for the Indian government to remove the current prohibi-tive barriers to trade—in themselves an impediment to faster structural transformation and sustainable growth. In an environment with faster and sustainable growth and without significant trade barriers, the mere
60 Word Development Indicators.61 The jury is still out on whether or not the reforms have increased inequality. See Pal and Ghosh (2007) for a review of some of the conflicting evidence.
<< India: Latin America’s Next Big Thing?44
complementarity between LAC and India’s factor endowments would be enough to jump-start bilateral trade that so far, as we will see in the next chapter, has been “missing.” A greater supply of jobs in a more competi-tive labor-intensive sector might also make it easier for the government to lower trade barriers for all manufacturing sectors, thus creating other valuable opportunities for trade. We will explore these issues in greater depth in the next two chapters.
45India’s Growth Story: A Latin American Perspective >>
References
Agarwal, Pawan. (2008). “Indian Higher Education: Contradictions and Optimism” Background paper prepared for the IADB report “India: Latin America’s Next Big Thing?”.
Aggarwal, Aradhna. (2004). “Export processing zones in India: analysis of the export performance.” Working paper No 148. Indian Council For Research On International Economic Relations. November.
Ahsan, Ahamad and Carmen Pages. (2007). “Are All Labor Regulations Equal? Assessing the Effects of Job Security, Labor Dispute and Contract Labor Laws in India.” World Bank Policy Research Work-ing Paper No 4259. Washington, D.C.: World Bank.
Bala, Madhu. (2006). “Economic Policy And State Owned Enterprises: Evolution Towards Privatization in India.” Indira Gandhi National Open University (IGNOU), Mimeo.
Bardham, Pranab. (2008). “Some Reflections on Democracy and Politi-cal Economy of Development in India.” University of California at Berkeley. Background paper prepared for the IADB report “India: Latin America’s Next Big Thing?”.
Barro, Robert J. and Jong-Wha Lee. (2001). International Data on Edu-cational Attainment: Updates and Implications,” Oxford Economic Papers, Oxford University Press, 53(3):541–63, July.
Bery, Suman. (2008). “India’s Development Journey: Any Lessons for Latin America?” Background paper prepared for the IADB report “India: Latin America’s Next Big Thing?”.
Bery, Suman and Kanhaiya Singh. (2006). “Domestic Financial Liberaliza-tion and International Financial Integration: An Indian Perspective.” In Jahangir Aziz, Eswar Prasad, and Steven Dunaway (eds.), China and India: Learning from Each Other. Washington, D.C.: International Monetary Fund: 145–180.
Besley, Timothy and Robin Burgess. (2004). “Can Labor Regulation Hinder Economic Performance? Evidence from India.” Quarterly Journal of Economics, Feb. pp.91–134.
Bhagwati, Jagdish and T. N. Srinivasan. (1975). Foreign Trade Regimes and Economic Development: India. New York: Columbia University Press.
<< India: Latin America’s Next Big Thing?46
Blyde, Juan S. and Eduardo Fernández-Arias. (2005). “Why Latin America is Falling Behind,” in E. Fernández-Arias, Rodolfo Manuelli and Juan S. Blyde (eds.), Sources of Growth in Latin America: What is Miss-ing? Washington, D.C.: Inter-American Development Bank, 2005.
Bosworth, Barry and Susan Collins. (2003). “The Empirics of Growth: An Update.” Brookings Papers on Economic Activity, 2:2003. pp. 113–206.
Bosworth, Barry and Susan Collins. (2008). “Accounting for Growth: Comparing China and India.” Journal of Economic Perspectives.Vol. 22, No. 1, Winter 2008, pages 45–66.
Bosworth, Barry, Susan Collins and Arvind Virmani. (2007). “Sources of Growth in the Indian Economy.” NBER Working Paper 12901. February.
Buluswar, Shashi, Tamy Gelman and Peter Tynan. (2009). “India’s Inte-gration into the Global Economy: Lessons and Opportunities for Latin America and the Caribbean.” Dalberg Global Development Advisors. Background paper prepared for the IADB report “India: Latin America’s Next Big Thing?”.
Department of Disinvestment. (2007). White Paper on Disinvestment of Central Public Sector Enterprises (31st July, 2007). Government of India, Ministry of Finance.
Devlin, Robert, Antoni Estevadeordal and Andres Rodriguez (2004) The Emergence of China: Opportunities and Challenges for Latin America and the Caribbean. Washington, D.C.: IADB and Harvard University Press.
Edwards, Sebastian. (1985). “Stabilization with Liberalization: an Evalu-ation of Ten Years of Chile’s Experiment with Free Market Policies, 1973–83.” Economic Development and Cultural Change 33 (2), 223–254.
Feenstra, Robert C. , Robert E. Lipsey, Haiyan Deng and Alyson C. Ma (2002) “World Trade Flows: 1962–2000.” Working Paper. 11040. NBER.
Gordon, James and Poonam Gupta (2004). “Understanding India’s Services Revolution.” IMF Working paper. WP/04/171. September.

47India’s Growth Story: A Latin American Perspective >>
Goulding, A. J. (1997). “Retreating from the Commanding Heights: Privatization in an Indian Context.” Journal of International Affairs, Winter, 50(2), 581–612.
Helpman, Elhanan. (2004). The Mystery of Economic Growth. Cambridge, M.A.: Harvard University Press.
Heckman, James and Carmen Pages. (2004). Law and Employment: Lessons from Latin America and the Caribbean. National Bureau of Economic Research Conference Report Series. University of Chicago Press.
Hengyong Mo Gordon, James and Poonam Gupta (2004). “Understand-ing India’s Services Revolution.” IMF Working paper. WP/04/171. September.
Hsieh, Chang-Tai and Peter J. Klenow (2009). “Misallocation and Manu-facturing TFP in China and India.” Quarterly Journal of Economics 224(4): 1403–1447.
Kochhar, Kalpana, Utsav Kumar, Raghuram Rajan, Arvind Subramanian, Ioannis Tokatlidis. (2006). “India’s Patterns of Development: What Happened, What Follows.” NBER Working paper 12023.
Kotwal, Ashok and Ramaswani, Bharat.(2008). “Growth and Poverty – Experience of India and Mexico” Background paper prepared for the IADB report “India: Latin America’s Next Big Thing?”.
Kumar, Rajiv. (2008). “India: Towards a Competitive Manufacturing Sector.” Indian Council for Research on International Economic Relations, Background paper prepared for the IADB report “India: Latin America’s Next Big Thing?”.
Lall, Sanjaya. (2000). “The Technological Structure and Performance of Developing Country Manufactured Exports, 1985–98.” Oxford Development Studies, 28(3) p.337–369.
McKinsey. (2001). India: The Growth Imperative. McKinsey Global Insti-tute, August.
McKinsey. (2007). The ‘Bird of Gold’: The Rise of India’s Consumer Market. McKinsey Global Institute, May.
Moreira, Mauricio Mesquita. (1995). Industrialization, Trade and Market Failures: The Role of Government Intervention in Brazil and South Korea. London: Macmillan.
<< India: Latin America’s Next Big Thing?48
Moreira, Mauricio Mesquita. (2009). “Brazil’s Trade Policy: Old and New Issues,” in Lael Brainard and Leonardo Martinez-Diaz (eds.), Brazil as an Economic Superpower? Understanding Brazil’s Changing Role in the Global Economy. Washington, D.C.: Brookings Institu-tion Press.
Moreira, Mauricio Mesquita and Paulo G. Correa. (1998). “A First Look at the Impacts of Trade Liberalization on the Brazilian Manufactur-ing Industry.” World Development, Vol. 26, No. 10, October, 1998.
OECD. (2009). Is Informal Normal? Towards More and Better Jobs in De-veloping Countries. Edited by Johannes P. Jütting and Juan R. de Laiglesia. Paris, OECD Development Center.
Pal, Parthapratim and Jayati Ghosh. (2007). “Inequality in India: A Survey of Recent Trends.” DESA Working Paper No. 4 ST/ESA/2007/DWP/45, July.
Panagarya, Arvind. (2006). “Transforming India.” Paper written for pre-sentation at the conference “India: An Emerging Giant,” October 13–15, 2006 at Columbia university.
Panagarya, Arvind. (2004). “India in the 1980s and 1990s: A Triumph of Reforms.” IMF Working paper. WP/04/43.
Panagarya, Arvind. (2008). India: The Emerging Giant. New York: Oxford University Press.
Prasad, Eswar. (2009). “Some New Perspectives On India’s Approach To Capital Account Liberalization.” Working Paper 14658, NBER.
RBI. (2008). “Report On Trend and Progress of Banking in India 2007–08.” Reserve Bank of India. Report submitted to the Central Govern-ment in terms of Section 36(2) of the Banking Regulation Act, 1949.
Rodrick, Dani and Ricardo Hausman. (2003). “Economic Development As Self-Discovery,” Journal of Development Economics, Vol. 72, No. 2. (Dec).
Rodrik, Dani and Arvind Subramanian. (2005). “From ‘Hindu Growth’ to Productivity Surge: The Mystery of the Indian Growth Transition.” Working Paper 10376, NBER.
Ros, Jaime. (1994). Mexico’s Trade and Industrialization Experience since 1960. A Reconsideration of Past Policies and Assessment of Current
49India’s Growth Story: A Latin American Perspective >>
Reforms,” in Gerry Helleiner (ed.), Trade Policy and Industrialization in Turbulent Times. London, U.K.: Routledge, 1994.
Saxenian, AnnaLee and Janaki Srinivasan. (2007). “Diaspora Networks Understanding India: Latin American Perspectives.” Background paper prepared for the IADB report “India: Latin America’s Next Big Thing?”.
Shukla, Gangadhar Prasad. (2007). “Fiscal Federalism in India: a Com-parative Study.” Background paper prepared for the IADB report “India: Latin America’s Next Big Thing?”.
Singh, Anoop, Agnes Belaisch, Charles Collyns, Paula De Masi, Reva Krieger, Guy Meredith, Robert Rennhack. (2005). “Stabilization and Reform in Latin America: A Macroeconomic Perspective of the Experience Since the 1990s.” IMF Occasional Paper No. 238.
Singh, Nirvikar. (2006). “Services-Led Industrialization in India: Assess-ment and Lessons.” This paper was written for a project on Indus- trial Development for the 21st Century, sponsored by UNDESA.
Srinivasan T. N. (2005). “Information Technology Enabled Services and India’s Growth Prospects,” in Susan M. Collins and Lael Brainard (eds.) Offshoring White-Collar Work. Brookings Trade Forum, Washington, D.C.: Brookings Institution Press.
Srinivasan T. N. (2008). “Unfinished Reform Agendum: Fiscal Consolida-tion and Reforms,” in Jagdish N. Bhagwati and Charles W. Calomiris (eds.). Sustaining India’s Growth Miracle. New York: Columbia University Press.
Srinivasan, T. N. and Suresh D. Tendulkar. (2003). Reintegrating India in the World Economy. D.C.: Institute for International Economics.
Ten Kate, Adriaan. (1992). “Trade Liberalization and Economic Stabiliza-tion in Mexico: Lessons of Experience.” World Development 20(5), 659–672.
UNCTAD. (2004) “Regionalism and South-South Cooperation: The case of Mercosur and India.” Report prepared by staff of the project on Strategies and Preparedness for Trade and Globalisation in India and the UNCTAD Secretariat in Geneva. June.
UNESCO. (2008). Global Education Digest. Geneva.
<< India: Latin America’s Next Big Thing?50
Wallack, Jessica. (2007). “A Tale of Two Transitions: From Public Toward Private Provision of Infrastructure in India and Latin America.” Center for Development Finance, Institute for Financial and Man-agement Research, Chennai, India. Background paper prepared for the IADB report “India: Latin America’s Next Big Thing?”
World Bank, World Development Indicators.World Bank. (1995). Bureaucrats in Business. The Economics and Politics
of Government Ownership. Washington, D.C.: Oxford University Press for the World Bank.
WTO. (2003). “Trade Police Review. Report by the Secretariat. Chile”. WT/TPR/G/124, Geneva, November, WTO.
WTO. (2007). “Trade Police Review. Report by the Secretariat. India”. WT/TPR/S/182/Rev.1, Geneva, July, WTO.
WTO. (2008). “Trade Police Review: Report by the Secretariat. Mexico”. WT/TPR/S/195/Rev.1, May, WTO.
WTO. (2009). “Trade Police Review: Report by the Secretariat. Brazil”. WT/TPR/S/212. Geneva, February, WTO.
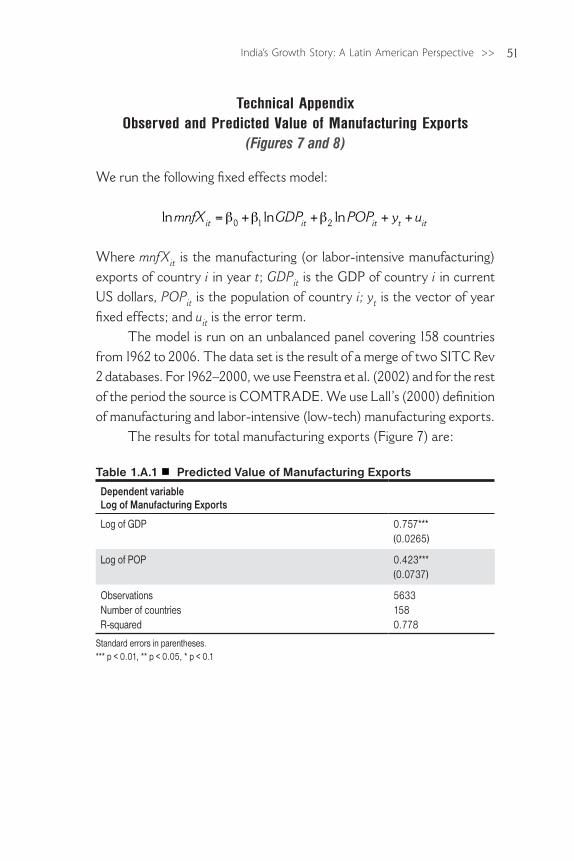
51India’s Growth Story: A Latin American Perspective >>
Technical AppendixObserved and Predicted Value of Manufacturing Exports
(Figures 7 and 8)
We run the following fixed effects model:
ln ln lnmnfX GDP POP y uit it it t it= + + + +β β β0 1 2
Where mnfXit is the manufacturing (or labor-intensive manufacturing) exports of country i in year t; GDPit is the GDP of country i in current US dollars, POPit is the population of country i; yt is the vector of year fixed effects; and uit is the error term.
The model is run on an unbalanced panel covering 158 countries from 1962 to 2006. The data set is the result of a merge of two SITC Rev 2 databases. For 1962–2000, we use Feenstra et al. (2002) and for the rest of the period the source is COMTRADE. We use Lall’s (2000) definition of manufacturing and labor-intensive (low-tech) manufacturing exports.
The results for total manufacturing exports (Figure 7) are:
Table 1.A.1 Predicted Value of Manufacturing Exports
Dependent variable Log of Manufacturing Exports
Log of GDP 0.757***(0.0265)
Log of POP 0.423***(0.0737)
ObservationsNumber of countriesR-squared
56331580.778
Standard errors in parentheses.*** p < 0.01, ** p < 0.05, * p < 0.1
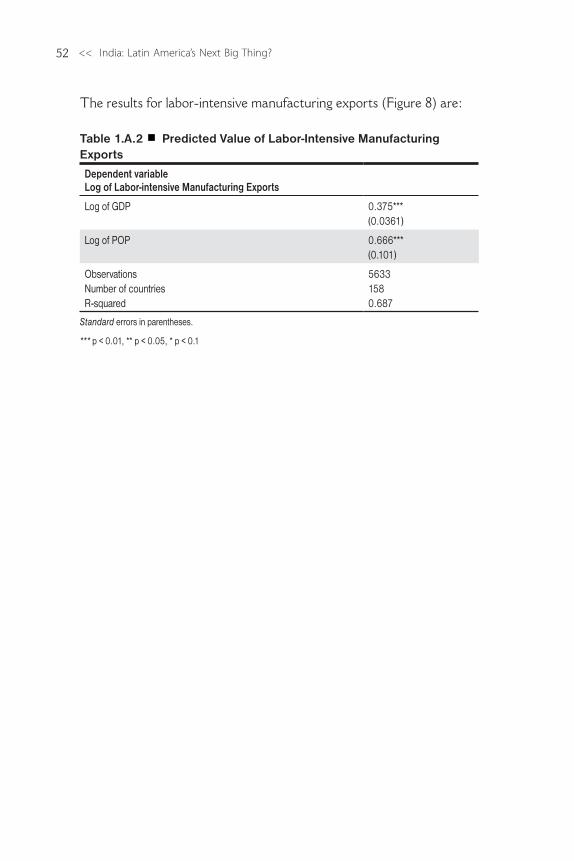
<< India: Latin America’s Next Big Thing?52
The results for labor-intensive manufacturing exports (Figure 8) are: Table 1.A.2 Predicted Value of Labor-Intensive Manufacturing Exports
Dependent variable Log of Labor-intensive Manufacturing Exports
Log of GDP 0.375***(0.0361)
Log of POP
0.666***(0.101)
Observations Number of countries R-squared
56331580.687
Standard errors in parentheses.
*** p < 0.01, ** p < 0.05, * p < 0.1
>> 2The Bilateral Relationship: Trade, Investment and Cooperation
So far we have discussed the general outline of India’s growth trajec-tory, its similarities with LAC’s own growth story, and the issue of sustainability. But what about the specific issues of bilateral trade
and investment flows between LAC and India? Are they relevant for understanding how these two economies interact? We know that trade and investment do not occur in a policy vacuum, but rather tend to closely reflect government policies. And as we have seen, India largely lacked a policy environment conducive to trade and investment at least until the early 1990s, when that country and most of LAC finally took more decisive steps towards opening up their economies.
But trade and investment respond not just to policies, but also to more fundamental determinants associated with intrinsic characteristics of the economies involved. In fact, these characteristics condition policy responses. In the case of trade, for instance, economic theory draws attention to issues such as the complementarity of the countries’ factor endowments (i.e. their stock of factors of production such as labor, capital, or land), their individual size, and the distance between them. In the case of investment, theory is not so clear, but these same factors play a role.
In this chapter we focus on the interaction between policy and “fundamentals” to assess: (a) the potential of the trade, investment and cooperation between LAC and India; (b) the extent to which this potential has been fulfilled so far, and (c) the role played by policies. We focus mainly on trade because of its stronger fundamentals and because
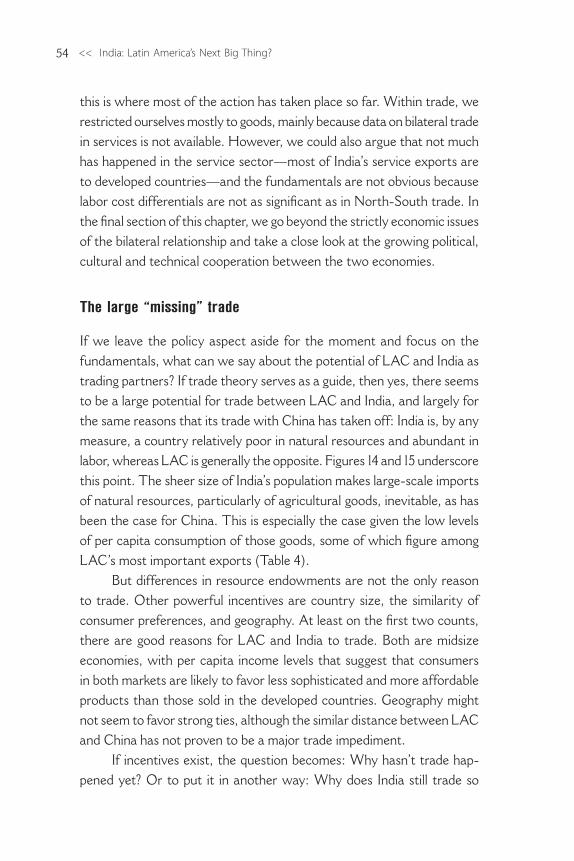
<< India: Latin America’s Next Big Thing?54
this is where most of the action has taken place so far. Within trade, we restricted ourselves mostly to goods, mainly because data on bilateral trade in services is not available. However, we could also argue that not much has happened in the service sector—most of India’s service exports are to developed countries—and the fundamentals are not obvious because labor cost differentials are not as significant as in North-South trade. In the final section of this chapter, we go beyond the strictly economic issues of the bilateral relationship and take a close look at the growing political, cultural and technical cooperation between the two economies.
The large “missing” trade
If we leave the policy aspect aside for the moment and focus on the fundamentals, what can we say about the potential of LAC and India as trading partners? If trade theory serves as a guide, then yes, there seems to be a large potential for trade between LAC and India, and largely for the same reasons that its trade with China has taken off: India is, by any measure, a country relatively poor in natural resources and abundant in labor, whereas LAC is generally the opposite. Figures 14 and 15 underscore this point. The sheer size of India’s population makes large-scale imports of natural resources, particularly of agricultural goods, inevitable, as has been the case for China. This is especially the case given the low levels of per capita consumption of those goods, some of which figure among LAC’s most important exports (Table 4).
But differences in resource endowments are not the only reason to trade. Other powerful incentives are country size, the similarity of consumer preferences, and geography. At least on the first two counts, there are good reasons for LAC and India to trade. Both are midsize economies, with per capita income levels that suggest that consumers in both markets are likely to favor less sophisticated and more affordable products than those sold in the developed countries. Geography might not seem to favor strong ties, although the similar distance between LAC and China has not proven to be a major trade impediment.
If incentives exist, the question becomes: Why hasn’t trade hap-pened yet? Or to put it in another way: Why does India still trade so
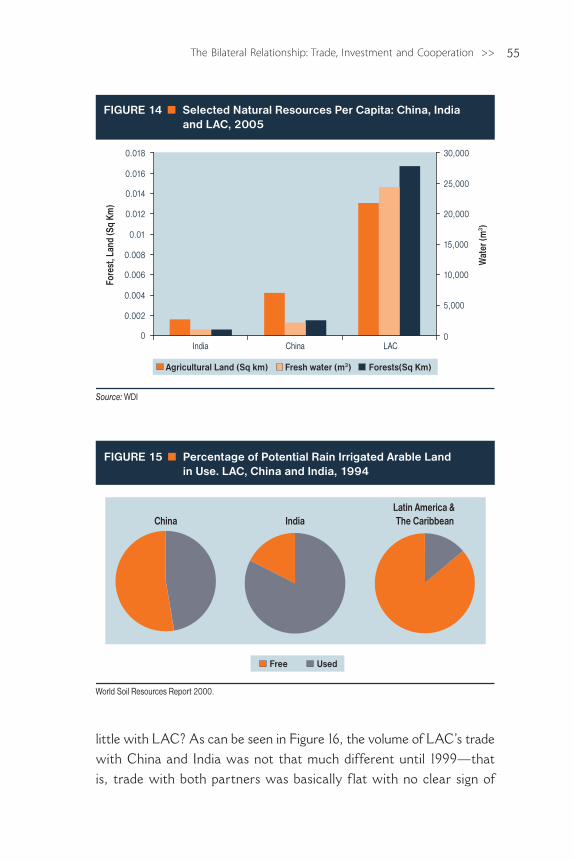
55The Bilateral Relationship: Trade, Investment and Cooperation >>
little with LAC? As can be seen in Figure 16, the volume of LAC’s trade with China and India was not that much different until 1999—that is, trade with both partners was basically f lat with no clear sign of
0
0.002
0.004
0.006
0.008
0.01
0.012
0.014
0.016
0.018
India China LAC0
5,000
10,000
15,000
20,000
25,000
30,000
FIGURE 14 Selected Natural Resources Per Capita: China, India and LAC, 2005
Source: WDI
Wat
er (m
3 )
Fore
st, L
and
(Sq
Km)
Agricultural Land (Sq km) Fresh water (m3) Forests(Sq Km)
China IndiaLatin America & The Caribbean
World Soil Resources Report 2000.
FIGURE 15 Percentage of Potential Rain Irrigated Arable Land in Use. LAC, China and India, 1994
Free Used
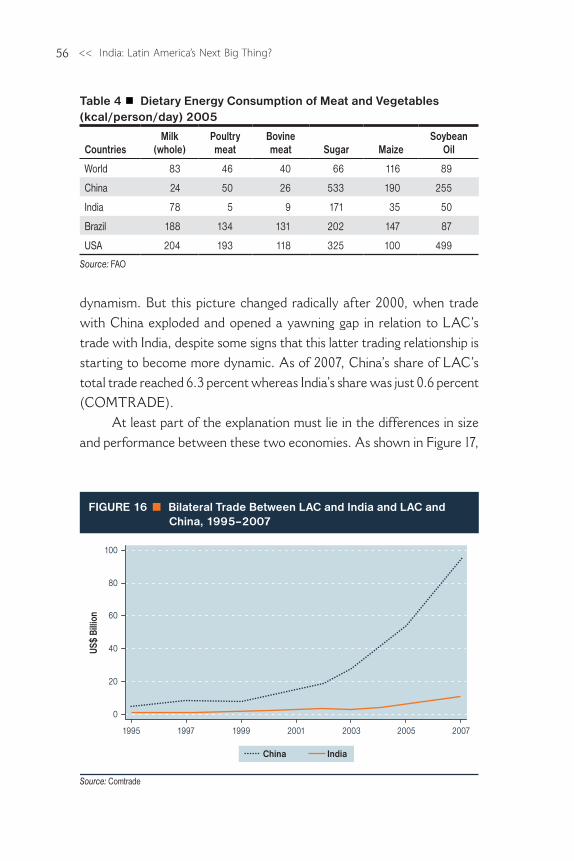
<< India: Latin America’s Next Big Thing?56
dynamism. But this picture changed radically after 2000, when trade with China exploded and opened a yawning gap in relation to LAC’s trade with India, despite some signs that this latter trading relationship is starting to become more dynamic. As of 2007, China’s share of LAC’s total trade reached 6.3 percent whereas India’s share was just 0.6 percent (COMTRADE).
At least part of the explanation must lie in the differences in size and performance between these two economies. As shown in Figure 17,
Table 4 Dietary Energy Consumption of Meat and Vegetables (kcal/person/day) 2005
CountriesMilk
(whole)Poultry meat
Bovine meat Sugar Maize
Soybean Oil
World 83 46 40 66 116 89
China 24 50 26 533 190 255
India 78 5 9 171 35 50
Brazil 188 134 131 202 147 87
USA 204 193 118 325 100 499
Source: FAO
0
20
40
60
80
100
US$
Billi
on
1995 1997 1999 2001 2003 2005 2007
Source: Comtrade
FIGURE 16 � Bilateral Trade Between LAC and India and LAC and China, 1995–2007
IndiaChina
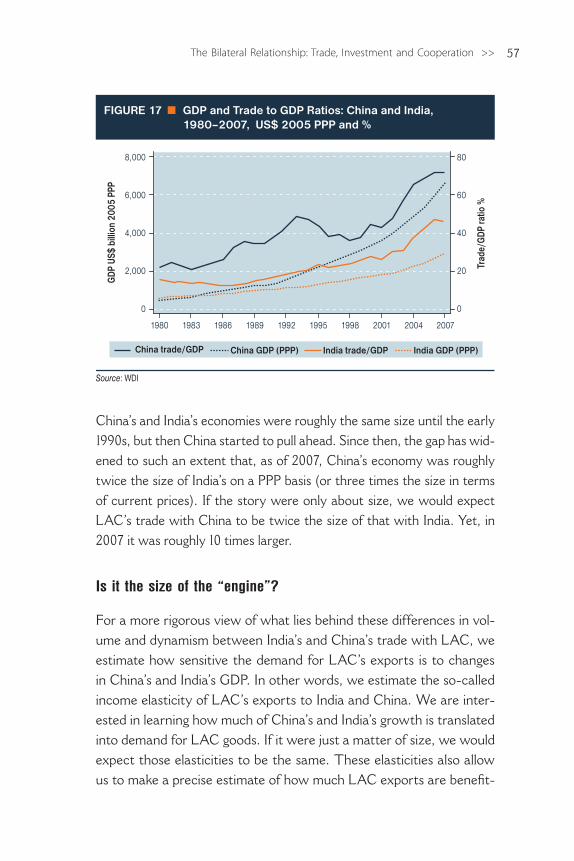
57The Bilateral Relationship: Trade, Investment and Cooperation >>
China’s and India’s economies were roughly the same size until the early 1990s, but then China started to pull ahead. Since then, the gap has wid-ened to such an extent that, as of 2007, China’s economy was roughly twice the size of India’s on a PPP basis (or three times the size in terms of current prices). If the story were only about size, we would expect LAC’s trade with China to be twice the size of that with India. Yet, in 2007 it was roughly 10 times larger.
Is it the size of the “engine”?
For a more rigorous view of what lies behind these differences in vol-ume and dynamism between India’s and China’s trade with LAC, we estimate how sensitive the demand for LAC’s exports is to changes in China’s and India’s GDP. In other words, we estimate the so-called income elasticity of LAC’s exports to India and China. We are inter-ested in learning how much of China’s and India’s growth is translated into demand for LAC goods. If it were just a matter of size, we would expect those elasticities to be the same. These elasticities also allow us to make a precise estimate of how much LAC exports are benefit-
China GDP (PPP)China trade/GDP India trade/GDP India GDP (PPP)
Source: WDI
FIGURE 17 GDP and Trade to GDP Ratios: China and India, 1980–2007, US$ 2005 PPP and %
0
20
40
60
80
Trad
e/G
DP ra
tio %
0
2,000
4,000
6,000
8,000
GDP
US$
bill
ion
2005
PPP
1980 1983 1986 1989 1992 1995 1998 2001 2004 2007
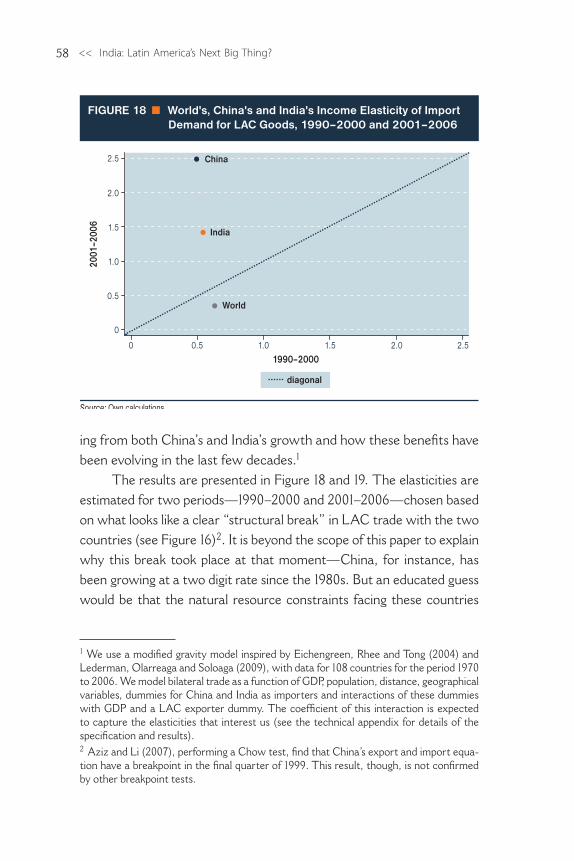
<< India: Latin America’s Next Big Thing?58
ing from both China’s and India’s growth and how these benefits have been evolving in the last few decades.1
The results are presented in Figure 18 and 19. The elasticities are estimated for two periods—1990–2000 and 2001–2006 —chosen based on what looks like a clear “structural break” in LAC trade with the two countries (see Figure 16)2. It is beyond the scope of this paper to explain why this break took place at that moment—China, for instance, has been growing at a two digit rate since the 1980s. But an educated guess would be that the natural resource constraints facing these countries
diagonal
0
0.5
1.0
1.5
2.0
2.5
2001
–200
6
0 0.5 1.0 1.5 2.0 2.5
1990–2000
Source: Own calculations.
FIGURE 18 World's, China's and India's Income Elasticity of Import Demand for LAC Goods, 1990–2000 and 2001–2006
China
India
World
diagonal
1 We use a modified gravity model inspired by Eichengreen, Rhee and Tong (2004) and Lederman, Olarreaga and Soloaga (2009), with data for 108 countries for the period 1970 to 2006. We model bilateral trade as a function of GDP, population, distance, geographical variables, dummies for China and India as importers and interactions of these dummies with GDP and a LAC exporter dummy. The coefficient of this interaction is expected to capture the elasticities that interest us (see the technical appendix for details of the specification and results). 2 Aziz and Li (2007), performing a Chow test, find that China’s export and import equa-tion have a breakpoint in the final quarter of 1999. This result, though, is not confirmed by other breakpoint tests.
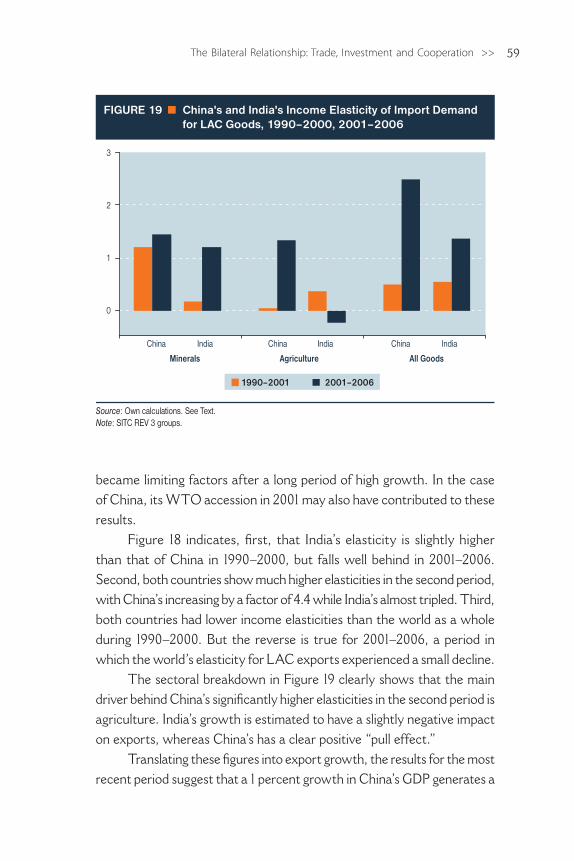
59The Bilateral Relationship: Trade, Investment and Cooperation >>
became limiting factors after a long period of high growth. In the case of China, its WTO accession in 2001 may also have contributed to these results.
Figure 18 indicates, first, that India’s elasticity is slightly higher than that of China in 1990–2000, but falls well behind in 2001–2006. Second, both countries show much higher elasticities in the second period, with China’s increasing by a factor of 4.4 while India’s almost tripled. Third, both countries had lower income elasticities than the world as a whole during 1990–2000. But the reverse is true for 2001–2006, a period in which the world’s elasticity for LAC exports experienced a small decline.
The sectoral breakdown in Figure 19 clearly shows that the main driver behind China’s significantly higher elasticities in the second period is agriculture. India’s growth is estimated to have a slightly negative impact on exports, whereas China’s has a clear positive “pull effect.”
Translating these figures into export growth, the results for the most recent period suggest that a 1 percent growth in China’s GDP generates a
FIGURE 19 China's and India's Income Elasticity of Import Demand for LAC Goods, 1990–2000, 2001–2006
Source: Own calculations. See Text.Note: SITC REV 3 groups.
0
1
2
3
Minerals Agriculture All Goods
China India China India China India
1990–2001 2001–2006
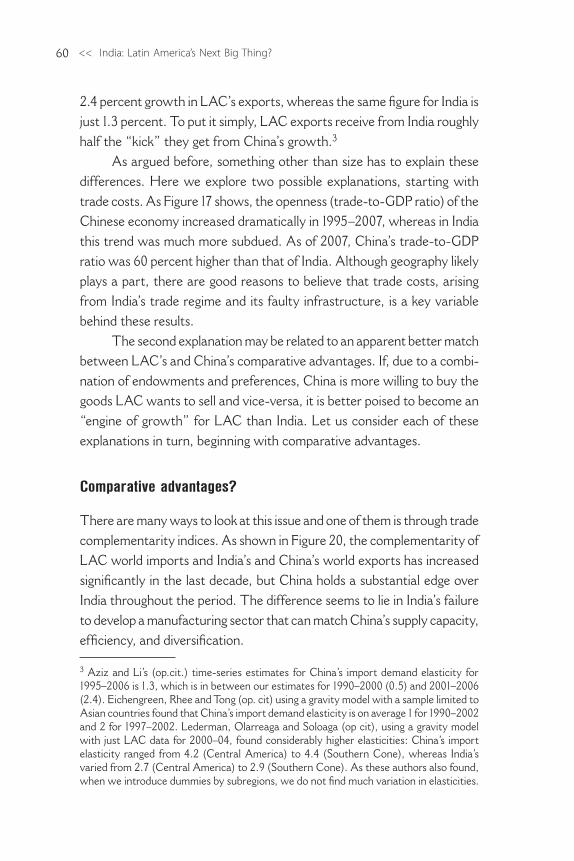
<< India: Latin America’s Next Big Thing?60
2.4 percent growth in LAC’s exports, whereas the same figure for India is just 1.3 percent. To put it simply, LAC exports receive from India roughly half the “kick” they get from China’s growth.3
As argued before, something other than size has to explain these differences. Here we explore two possible explanations, starting with trade costs. As Figure 17 shows, the openness (trade-to-GDP ratio) of the Chinese economy increased dramatically in 1995–2007, whereas in India this trend was much more subdued. As of 2007, China’s trade-to-GDP ratio was 60 percent higher than that of India. Although geography likely plays a part, there are good reasons to believe that trade costs, arising from India’s trade regime and its faulty infrastructure, is a key variable behind these results.
The second explanation may be related to an apparent better match between LAC’s and China’s comparative advantages. If, due to a combi-nation of endowments and preferences, China is more willing to buy the goods LAC wants to sell and vice-versa, it is better poised to become an “engine of growth” for LAC than India. Let us consider each of these explanations in turn, beginning with comparative advantages.
Comparative advantages?
There are many ways to look at this issue and one of them is through trade complementarity indices. As shown in Figure 20, the complementarity of LAC world imports and India’s and China’s world exports has increased significantly in the last decade, but China holds a substantial edge over India throughout the period. The difference seems to lie in India’s failure to develop a manufacturing sector that can match China’s supply capacity, efficiency, and diversification.
3 Aziz and Li’s (op.cit.) time-series estimates for China’s import demand elasticity for 1995–2006 is 1.3, which is in between our estimates for 1990–2000 (0.5) and 2001–2006 (2.4). Eichengreen, Rhee and Tong (op. cit) using a gravity model with a sample limited to Asian countries found that China’s import demand elasticity is on average 1 for 1990–2002 and 2 for 1997–2002. Lederman, Olarreaga and Soloaga (op cit), using a gravity model with just LAC data for 2000–04, found considerably higher elasticities: China’s import elasticity ranged from 4.2 (Central America) to 4.4 (Southern Cone), whereas India’s varied from 2.7 (Central America) to 2.9 (Southern Cone). As these authors also found, when we introduce dummies by subregions, we do not find much variation in elasticities.
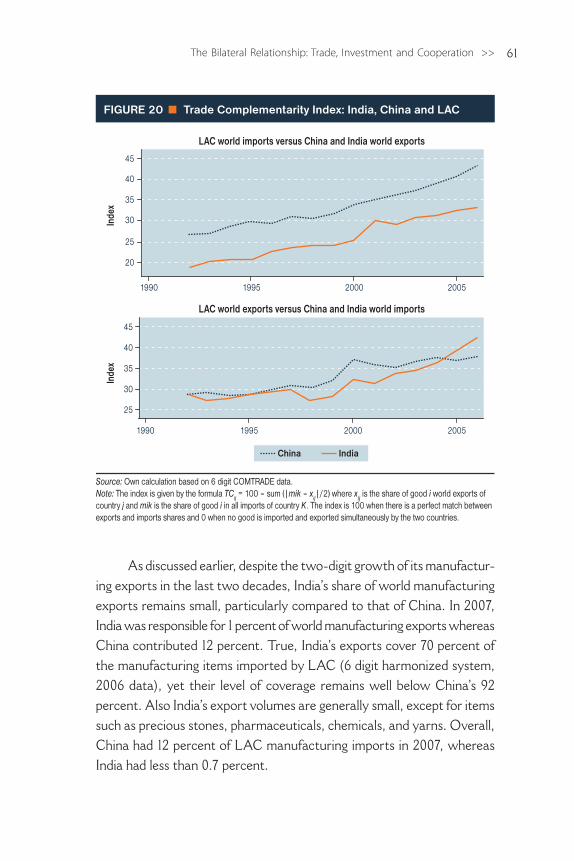
61The Bilateral Relationship: Trade, Investment and Cooperation >>
As discussed earlier, despite the two-digit growth of its manufactur-ing exports in the last two decades, India’s share of world manufacturing exports remains small, particularly compared to that of China. In 2007, India was responsible for 1 percent of world manufacturing exports whereas China contributed 12 percent. True, India’s exports cover 70 percent of the manufacturing items imported by LAC (6 digit harmonized system, 2006 data), yet their level of coverage remains well below China’s 92 percent. Also India’s export volumes are generally small, except for items such as precious stones, pharmaceuticals, chemicals, and yarns. Overall, China had 12 percent of LAC manufacturing imports in 2007, whereas India had less than 0.7 percent.
China India
LAC world imports versus China and India world exports
20
25
30
35
40
45
Inde
xIn
dex
1990 1995 2000 2005
FIGURE 20 Trade Complementarity Index: India, China and LAC
LAC world exports versus China and India world imports
25
30
35
40
45
1990 1995 2000 2005
Source: Own calculation based on 6 digit COMTRADE data.Note: The index is given by the formula TC
ij = 100 – sum (|mik – x
ij|/2) where x
ij is the share of good i world exports of
country j and mik is the share of good i in all imports of country K. The index is 100 when there is a perfect match between exports and imports shares and 0 when no good is imported and exported simultaneously by the two countries.
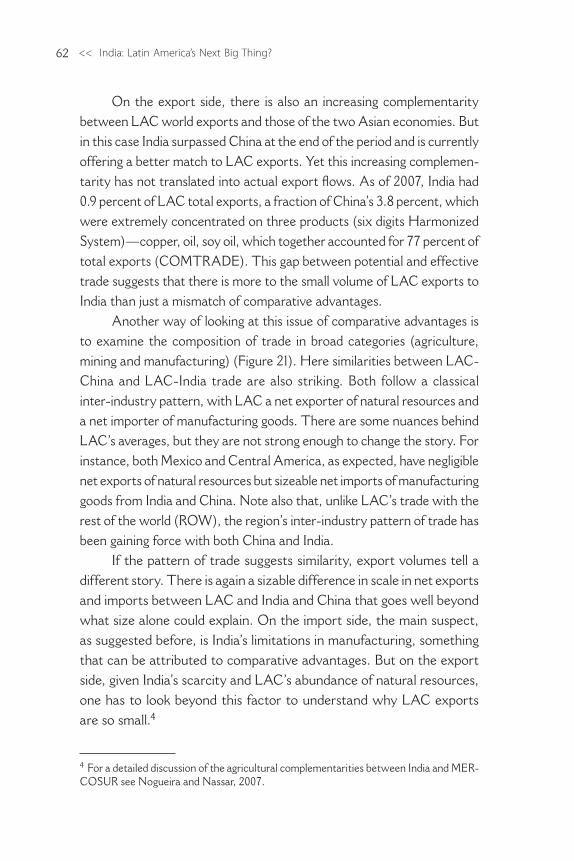
<< India: Latin America’s Next Big Thing?62
On the export side, there is also an increasing complementarity between LAC world exports and those of the two Asian economies. But in this case India surpassed China at the end of the period and is currently offering a better match to LAC exports. Yet this increasing complemen-tarity has not translated into actual export flows. As of 2007, India had 0.9 percent of LAC total exports, a fraction of China’s 3.8 percent, which were extremely concentrated on three products (six digits Harmonized System)—copper, oil, soy oil, which together accounted for 77 percent of total exports (COMTRADE). This gap between potential and effective trade suggests that there is more to the small volume of LAC exports to India than just a mismatch of comparative advantages.
Another way of looking at this issue of comparative advantages is to examine the composition of trade in broad categories (agriculture, mining and manufacturing) (Figure 21). Here similarities between LAC-China and LAC-India trade are also striking. Both follow a classical inter-industry pattern, with LAC a net exporter of natural resources and a net importer of manufacturing goods. There are some nuances behind LAC’s averages, but they are not strong enough to change the story. For instance, both Mexico and Central America, as expected, have negligible net exports of natural resources but sizeable net imports of manufacturing goods from India and China. Note also that, unlike LAC’s trade with the rest of the world (ROW), the region’s inter-industry pattern of trade has been gaining force with both China and India.
If the pattern of trade suggests similarity, export volumes tell a different story. There is again a sizable difference in scale in net exports and imports between LAC and India and China that goes well beyond what size alone could explain. On the import side, the main suspect, as suggested before, is India’s limitations in manufacturing, something that can be attributed to comparative advantages. But on the export side, given India’s scarcity and LAC’s abundance of natural resources, one has to look beyond this factor to understand why LAC exports are so small.4
4 For a detailed discussion of the agricultural complementarities between India and MER-COSUR see Nogueira and Nassar, 2007.
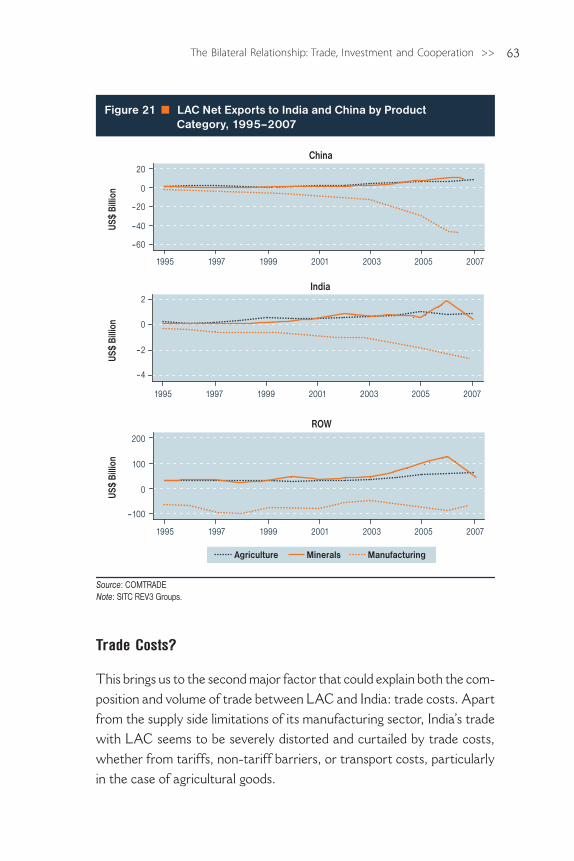
63The Bilateral Relationship: Trade, Investment and Cooperation >>
Trade Costs?
This brings us to the second major factor that could explain both the com-position and volume of trade between LAC and India: trade costs. Apart from the supply side limitations of its manufacturing sector, India’s trade with LAC seems to be severely distorted and curtailed by trade costs, whether from tariffs, non-tariff barriers, or transport costs, particularly in the case of agricultural goods.
Source: COMTRADENote: SITC REV3 Groups.
Minerals ManufacturingAgriculture
Figure 21 LAC Net Exports to India and China by Product Category, 1995–2007
–60
–40
–20
0
20
–4
–2
0
2
–100
0
100
200
1995 1997 1999 2001 2003 2005 2007
1995 1997 1999 2001 2003 2005 2007
1995 1997 1999 2001 2003 2005 2007
China
India
ROW
US$
Billi
onUS
$ Bi
llion
US$
Billi
on
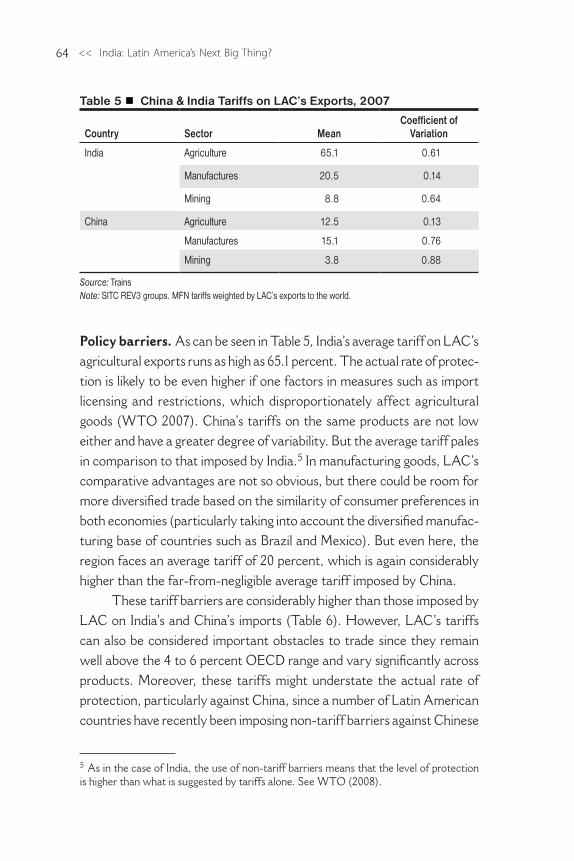
<< India: Latin America’s Next Big Thing?64
Policy barriers. As can be seen in Table 5, India’s average tariff on LAC’s agricultural exports runs as high as 65.1 percent. The actual rate of protec-tion is likely to be even higher if one factors in measures such as import licensing and restrictions, which disproportionately affect agricultural goods (WTO 2007). China’s tariffs on the same products are not low either and have a greater degree of variability. But the average tariff pales in comparison to that imposed by India.5 In manufacturing goods, LAC’s comparative advantages are not so obvious, but there could be room for more diversified trade based on the similarity of consumer preferences in both economies (particularly taking into account the diversified manufac-turing base of countries such as Brazil and Mexico). But even here, the region faces an average tariff of 20 percent, which is again considerably higher than the far-from-negligible average tariff imposed by China.
These tariff barriers are considerably higher than those imposed by LAC on India’s and China’s imports (Table 6). However, LAC’s tariffs can also be considered important obstacles to trade since they remain well above the 4 to 6 percent OECD range and vary significantly across products. Moreover, these tariffs might understate the actual rate of protection, particularly against China, since a number of Latin American countries have recently been imposing non-tariff barriers against Chinese
Table 5 China & India Tariffs on LAC’s Exports, 2007
Country Sector MeanCoefficient of
Variation
India Agriculture 65.1 0.61
Manufactures 20.5 0.14
Mining 8.8 0.64
China Agriculture 12.5 0.13
Manufactures 15.1 0.76
Mining 3.8 0.88
Source: TrainsNote: SITC REV3 groups. MFN tariffs weighted by LAC’s exports to the world.
5 As in the case of India, the use of non-tariff barriers means that the level of protection is higher than what is suggested by tariffs alone. See WTO (2008).
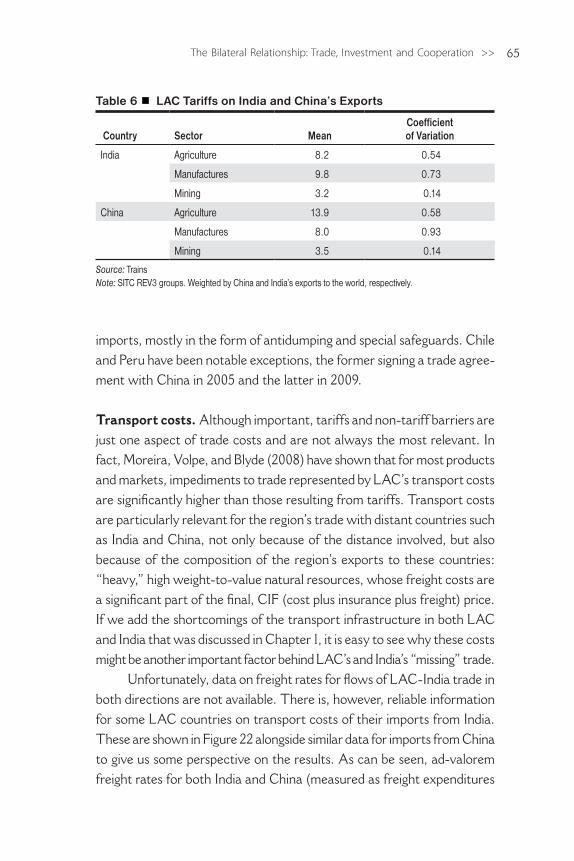
65The Bilateral Relationship: Trade, Investment and Cooperation >>
imports, mostly in the form of antidumping and special safeguards. Chile and Peru have been notable exceptions, the former signing a trade agree-ment with China in 2005 and the latter in 2009.
Transport costs. Although important, tariffs and non-tariff barriers are just one aspect of trade costs and are not always the most relevant. In fact, Moreira, Volpe, and Blyde (2008) have shown that for most products and markets, impediments to trade represented by LAC’s transport costs are significantly higher than those resulting from tariffs. Transport costs are particularly relevant for the region’s trade with distant countries such as India and China, not only because of the distance involved, but also because of the composition of the region’s exports to these countries: “heavy,” high weight-to-value natural resources, whose freight costs are a significant part of the final, CIF (cost plus insurance plus freight) price. If we add the shortcomings of the transport infrastructure in both LAC and India that was discussed in Chapter 1, it is easy to see why these costs might be another important factor behind LAC’s and India’s “missing” trade.
Unfortunately, data on freight rates for flows of LAC-India trade in both directions are not available. There is, however, reliable information for some LAC countries on transport costs of their imports from India. These are shown in Figure 22 alongside similar data for imports from China to give us some perspective on the results. As can be seen, ad-valorem freight rates for both India and China (measured as freight expenditures
Table 6 LAC Tariffs on India and China’s Exports
Country Sector MeanCoefficient of Variation
India Agriculture 8.2 0.54
Manufactures 9.8 0.73
Mining 3.2 0.14
China Agriculture 13.9 0.58
Manufactures 8.0 0.93
Mining 3.5 0.14
Source: Trains Note: SITC REV3 groups. Weighted by China and India’s exports to the world, respectively.
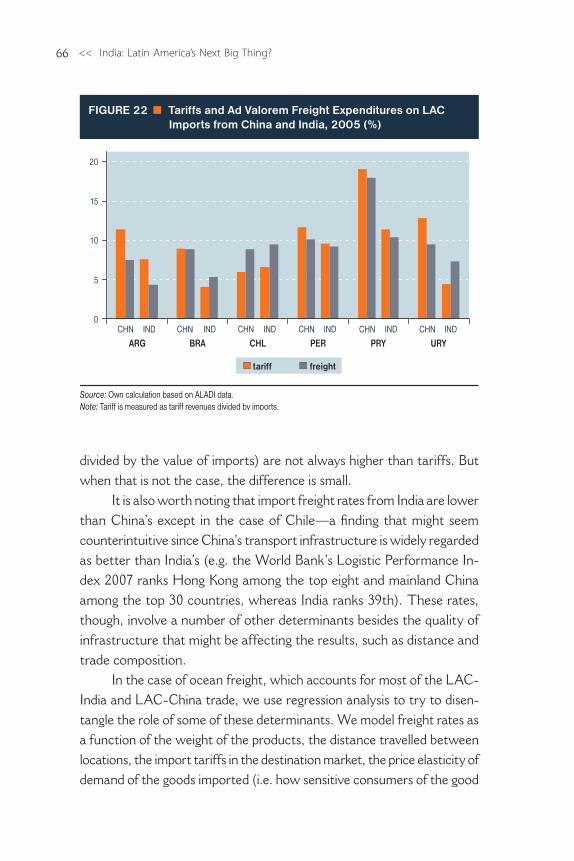
<< India: Latin America’s Next Big Thing?66
divided by the value of imports) are not always higher than tariffs. But when that is not the case, the difference is small.
It is also worth noting that import freight rates from India are lower than China’s except in the case of Chile—a finding that might seem counterintuitive since China’s transport infrastructure is widely regarded as better than India’s (e.g. the World Bank’s Logistic Performance In-dex 2007 ranks Hong Kong among the top eight and mainland China among the top 30 countries, whereas India ranks 39th). These rates, though, involve a number of other determinants besides the quality of infrastructure that might be affecting the results, such as distance and trade composition.
In the case of ocean freight, which accounts for most of the LAC-India and LAC-China trade, we use regression analysis to try to disen-tangle the role of some of these determinants. We model freight rates as a function of the weight of the products, the distance travelled between locations, the import tariffs in the destination market, the price elasticity of demand of the goods imported (i.e. how sensitive consumers of the good
0
5
15
20
10
ARG BRA CHL PER PRY URYCHN IND CHN IND CHN IND CHN IND CHN IND CHN IND
Source: Own calculation based on ALADI data.Note: Tariff is measured as tariff revenues divided by imports.
FIGURE 22 Tariffs and Ad Valorem Freight Expenditures on LAC Imports from China and India, 2005 (%)
tariff freight
67The Bilateral Relationship: Trade, Investment and Cooperation >>
are to changes in prices), the volume of imports, and the quality of the infrastructure for both sides of the trade. Other important determinants of freight rates, such as competition in shipping services, are not included because of the lack of data.6
Following Clark et al. (2004), we use two proxies for infrastructure quality in the exporting countries: first, a measure of port infrastructure that consists of the number of ports that have lifts with leverage capac-ity of at least 50 tons (squared) divided by the product of the country population and its surface area; and a general infrastructure index that is the simple average of normalized indices of communication (fixed and mobile telephone lines per capita) and transport (paved roads, railroads and airports) infrastructure. We run the model with very detailed 2005 import data (six digits SITIC) at the port level for five LAC countries (Brazil, Chile, Ecuador, Peru, and Uruguay) and the U.S. and use the results to decompose the differences between ocean freight rates of LAC imports from India and China.7
As can be seen in Table 7, the average freight rate of imports from China is estimated to be 24 to 27 percent higher than the average freight rate of imports from India for this sample of LAC countries. Most of this difference is explained by the composition of imports: LAC imports from China are “heavier” (higher weight-to-value) than the region’s imports from India. Both distance and import tariffs in LAC countries also favor India, but the difference is too small to be relevant. The price elastic-ity of imports favors China, but again explains very little of the overall result. The volume of imports, which could clearly favor China, is not included in the decomposition because it was not statistically significant
6 We expect freight rates to increase with the weight of the product, distance and the level of import tariffs. The rationale for the last variable is that anything that raises the price of a good lowers the percentage impact of a given transportation charge on the delivered price and, therefore, allows more room for shippers to increase rates without provoking a reaction from consumers. On the other hand, we expect freight rates to fall with the volume of imports (economies of scale), the price elasticity of demand (the more sensitive is the consumer to price changes, the more difficult it is to increase the freight rates), and the quality of infrastructure. See appendix for details. 7 The decomposition is based on Hummels, Lugosvkyy and Skiba (2009). Details of the model, regression results and a brief description of the database are presented in the ap-pendix.
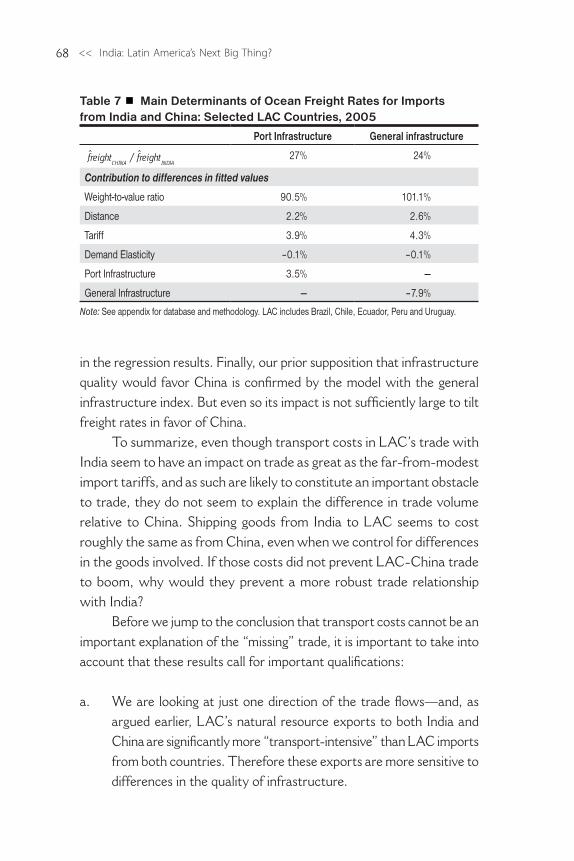
<< India: Latin America’s Next Big Thing?68
in the regression results. Finally, our prior supposition that infrastructure quality would favor China is confirmed by the model with the general infrastructure index. But even so its impact is not sufficiently large to tilt freight rates in favor of China.
To summarize, even though transport costs in LAC’s trade with India seem to have an impact on trade as great as the far-from-modest import tariffs, and as such are likely to constitute an important obstacle to trade, they do not seem to explain the difference in trade volume relative to China. Shipping goods from India to LAC seems to cost roughly the same as from China, even when we control for differences in the goods involved. If those costs did not prevent LAC-China trade to boom, why would they prevent a more robust trade relationship with India?
Before we jump to the conclusion that transport costs cannot be an important explanation of the “missing” trade, it is important to take into account that these results call for important qualifications:
a. We are looking at just one direction of the trade flows—and, as argued earlier, LAC’s natural resource exports to both India and China are significantly more “transport-intensive” than LAC imports from both countries. Therefore these exports are more sensitive to differences in the quality of infrastructure.
Table 7 Main Determinants of Ocean Freight Rates for Imports from India and China: Selected LAC Countries, 2005
Port Infrastructure General infrastructure
ˆ / ˆfreight freightCHINA INDIA
27% 24%
Contribution to differences in fitted values
Weight-to-value ratio 90.5% 101.1%
Distance 2.2% 2.6%
Tariff 3.9% 4.3%
Demand Elasticity –0.1% –0.1%
Port Infrastructure 3.5% —
General Infrastructure — –7.9%
Note: See appendix for database and methodology. LAC includes Brazil, Chile, Ecuador, Peru and Uruguay.
69The Bilateral Relationship: Trade, Investment and Cooperation >>
b. We are not including important determinants of freight rates in the analysis, such as the availability and level of competition in shipping services that would clearly favor China. We know, for instance, that India, unlike China, has no direct shipping services to LAC (Fonseca, Azevedo and Velloso, 2005). Goods have to be shipped first to Singapore or Europe, which increases both freight rates and shipping times.
c. Note that freight expenditures do not include the time costs of transportation (depreciation and inventory costs), which in most cases are at least as high as freight rates. The lack of direct service is likely to translate into significantly higher time costs in LAC trade with India than would be explained by distance—an obstacle that cannot be captured by our model. In the case of Brazil, for instance, shipping a good directly from Santos to Mumbai would take an esti-mated 27 days and 15 hours (http://www.distances.com/). Shipping via Singapore would take 36 days and 18 hours, increasing shipping times by approximately nine days. Using Moreira, Volpe and Blyde’s (2008) tariff equivalent of time cost estimates to export, the time necessary to complete the whole itinerary would be equivalent to a 16.6 percent import tariff. The costs represented would add to the already high and sometimes prohibitive tariff and freight rates that exporters face in doing business with India.
d. Finally, variables used to proxy the quality of infrastructure might be underestimating China’s superiority, and therefore, diminishing the role of infrastructure in explaining the results.
In the face of the data limitations, exactly how relevant are these qualifications? This is an impossible empirical question, but nevertheless policymakers would do well to assume that both tariffs and transport costs deserve special attention if the goal is to jumpstart LAC-India trade.
To illustrate the significance of the expected returns from addressing these trade costs, we run a simulation based on estimates of a modified gravity model (see Moreira, Volpe and Blyde, op. cit. Chapter 3). In this “workhorse” of trade economists, bilateral trade is modeled as a function
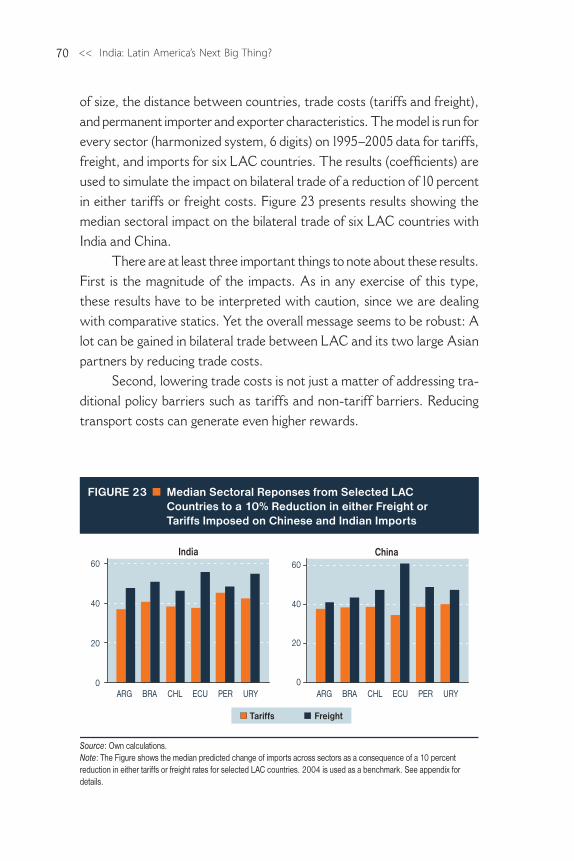
<< India: Latin America’s Next Big Thing?70
of size, the distance between countries, trade costs (tariffs and freight), and permanent importer and exporter characteristics. The model is run for every sector (harmonized system, 6 digits) on 1995–2005 data for tariffs, freight, and imports for six LAC countries. The results (coefficients) are used to simulate the impact on bilateral trade of a reduction of 10 percent in either tariffs or freight costs. Figure 23 presents results showing the median sectoral impact on the bilateral trade of six LAC countries with India and China.
There are at least three important things to note about these results. First is the magnitude of the impacts. As in any exercise of this type, these results have to be interpreted with caution, since we are dealing with comparative statics. Yet the overall message seems to be robust: A lot can be gained in bilateral trade between LAC and its two large Asian partners by reducing trade costs.
Second, lowering trade costs is not just a matter of addressing tra-ditional policy barriers such as tariffs and non-tariff barriers. Reducing transport costs can generate even higher rewards.
FIGURE 23 � Median Sectoral Reponses from Selected LAC Countries to a 10% Reduction in either Freight or Tariffs Imposed on Chinese and Indian Imports
Source: Own calculations.Note: The Figure shows the median predicted change of imports across sectors as a consequence of a 10 percent reduction in either tariffs or freight rates for selected LAC countries. 2004 is used as a benchmark. See appendix for details.
Tariffs Freight
0
20
40
60
ARG BRA CHL ECU PER URY
India
0
20
40
60
ARG BRA CHL ECU PER URY
China
71The Bilateral Relationship: Trade, Investment and Cooperation >>
And third, this exercise focuses on just one end of bilateral trade. As we have seen, both India and China, but particularly the former, impose very high tariffs on LAC exports, and transport costs can be at least as high as the tariffs. If the trade cost elasticities of LAC’s exports to India and China are anywhere near those estimated for imports, we could see even bigger trade gains by addressing trade costs on the other end of the trading relationship.
Cross-border investment: some signs of activity
Economic theory provides much less guidance with regard to foreign direct investment (FDI) than to trade. But some insights from both theoretical and empirical studies can shed light on the LAC-India relationship. For in-stance, we know that: (a) most FDI takes place between developed, capital abundant countries; (b) it originates in countries with highly skilled labor forces and large firms with intangible assets; (c) it may be complementary to trade and; (d) FDI is positively related to trade costs (i.e. high tariffs or transports costs may result in the substitution of direct investment for trade), though these costs tend to reduce the levels of both trade and investment.8
If we consider the countries’ characteristics and the policy regime that prevailed in both LAC and India before the reforms in the early 1990s, it comes as no surprise that there was little FDI between these economies. In fact, there was even less outward FDI (OFDI) from these economies. What else could we expect from poor and middle-income economies, relatively scarce in capital and skills, without a critical mass of large firms with intangible assets, but with highly protectionist trade and investment polices?
The market-oriented reforms and resulting growth have clearly cre-ated a more favorable environment for OFDI in both economies. Apart from the removal of policy restrictions that were particularly binding in India (see Box 2.1), lower protection at home has made it clear to domestic firms that if they want to survive in a more competitive environment, they have to go abroad to gain scale and tap into the advantages of proximity.
8 See Markusen (2002).
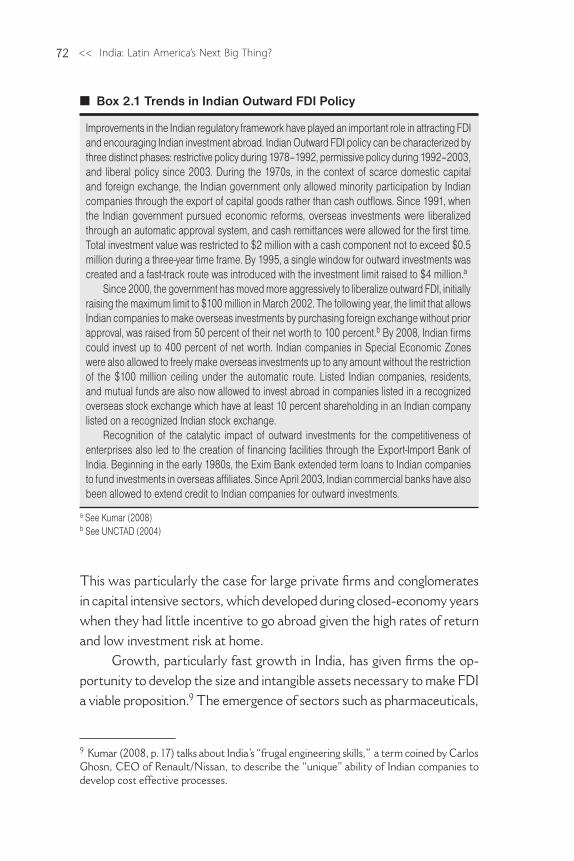
<< India: Latin America’s Next Big Thing?72
This was particularly the case for large private firms and conglomerates in capital intensive sectors, which developed during closed-economy years when they had little incentive to go abroad given the high rates of return and low investment risk at home.
Growth, particularly fast growth in India, has given firms the op-portunity to develop the size and intangible assets necessary to make FDI a viable proposition.9 The emergence of sectors such as pharmaceuticals,
9 Kumar (2008, p. 17) talks about India’s “frugal engineering skills,” a term coined by Carlos Ghosn, CEO of Renault/Nissan, to describe the “unique” ability of Indian companies to develop cost effective processes.
n Box 2.1 Trends in Indian Outward FDI Policy
Improvements in the Indian regulatory framework have played an important role in attracting FDI and encouraging Indian investment abroad. Indian Outward FDI policy can be characterized by three distinct phases: restrictive policy during 1978–1992, permissive policy during 1992–2003, and liberal policy since 2003. During the 1970s, in the context of scarce domestic capital and foreign exchange, the Indian government only allowed minority participation by Indian companies through the export of capital goods rather than cash outflows. Since 1991, when the Indian government pursued economic reforms, overseas investments were liberalized through an automatic approval system, and cash remittances were allowed for the first time. Total investment value was restricted to $2 million with a cash component not to exceed $0.5 million during a three-year time frame. By 1995, a single window for outward investments was created and a fast-track route was introduced with the investment limit raised to $4 million.a
Since 2000, the government has moved more aggressively to liberalize outward FDI, initially raising the maximum limit to $100 million in March 2002. The following year, the limit that allows Indian companies to make overseas investments by purchasing foreign exchange without prior approval, was raised from 50 percent of their net worth to 100 percent.b By 2008, Indian firms could invest up to 400 percent of net worth. Indian companies in Special Economic Zones were also allowed to freely make overseas investments up to any amount without the restriction of the $100 million ceiling under the automatic route. Listed Indian companies, residents, and mutual funds are also now allowed to invest abroad in companies listed in a recognized overseas stock exchange which have at least 10 percent shareholding in an Indian company listed on a recognized Indian stock exchange.
Recognition of the catalytic impact of outward investments for the competitiveness of enterprises also led to the creation of financing facilities through the Export-Import Bank of India. Beginning in the early 1980s, the Exim Bank extended term loans to Indian companies to fund investments in overseas affiliates. Since April 2003, Indian commercial banks have also been allowed to extend credit to Indian companies for outward investments.
a See Kumar (2008)b See UNCTAD (2004)
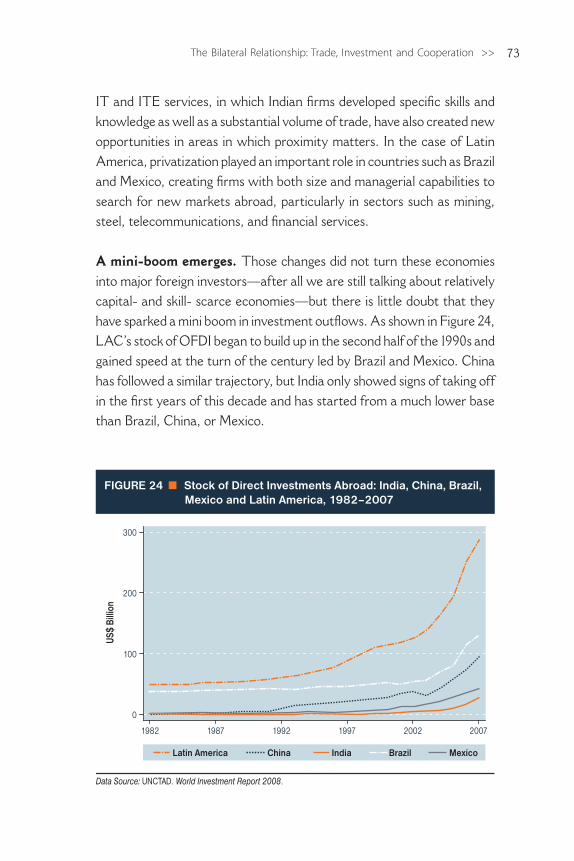
73The Bilateral Relationship: Trade, Investment and Cooperation >>
IT and ITE services, in which Indian firms developed specific skills and knowledge as well as a substantial volume of trade, have also created new opportunities in areas in which proximity matters. In the case of Latin America, privatization played an important role in countries such as Brazil and Mexico, creating firms with both size and managerial capabilities to search for new markets abroad, particularly in sectors such as mining, steel, telecommunications, and financial services.
A mini-boom emerges. Those changes did not turn these economies into major foreign investors—after all we are still talking about relatively capital- and skill- scarce economies —but there is little doubt that they have sparked a mini boom in investment outflows. As shown in Figure 24, LAC’s stock of OFDI began to build up in the second half of the 1990s and gained speed at the turn of the century led by Brazil and Mexico. China has followed a similar trajectory, but India only showed signs of taking off in the first years of this decade and has started from a much lower base than Brazil, China, or Mexico.
Data Source: UNCTAD. World Investment Report 2008.
FIGURE 24 Stock of Direct Investments Abroad: India, China, Brazil, Mexico and Latin America, 1982–2007
0
100
200
300
US$
Billi
on
1982 1987 1992 1997 2002 2007
IndiaLatin America Brazil MexicoChina
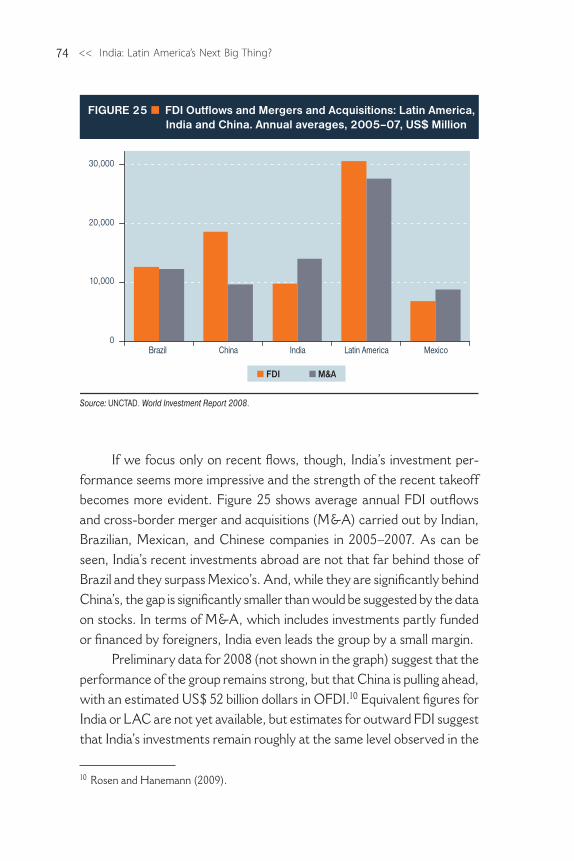
<< India: Latin America’s Next Big Thing?74
If we focus only on recent flows, though, India’s investment per-formance seems more impressive and the strength of the recent takeoff becomes more evident. Figure 25 shows average annual FDI outflows and cross-border merger and acquisitions (M&A) carried out by Indian, Brazilian, Mexican, and Chinese companies in 2005–2007. As can be seen, India’s recent investments abroad are not that far behind those of Brazil and they surpass Mexico’s. And, while they are significantly behind China’s, the gap is significantly smaller than would be suggested by the data on stocks. In terms of M&A, which includes investments partly funded or financed by foreigners, India even leads the group by a small margin.
Preliminary data for 2008 (not shown in the graph) suggest that the performance of the group remains strong, but that China is pulling ahead, with an estimated US$ 52 billion dollars in OFDI.10 Equivalent figures for India or LAC are not yet available, but estimates for outward FDI suggest that India’s investments remain roughly at the same level observed in the
FDI M&A
0
10,000
20,000
30,000
Brazil China India Latin America Mexico
Source: UNCTAD. World Investment Report 2008.
FIGURE 25 FDI Outflows and Mergers and Acquisitions: Latin America, India and China. Annual averages, 2005–07, US$ Million
10 Rosen and Hanemann (2009).
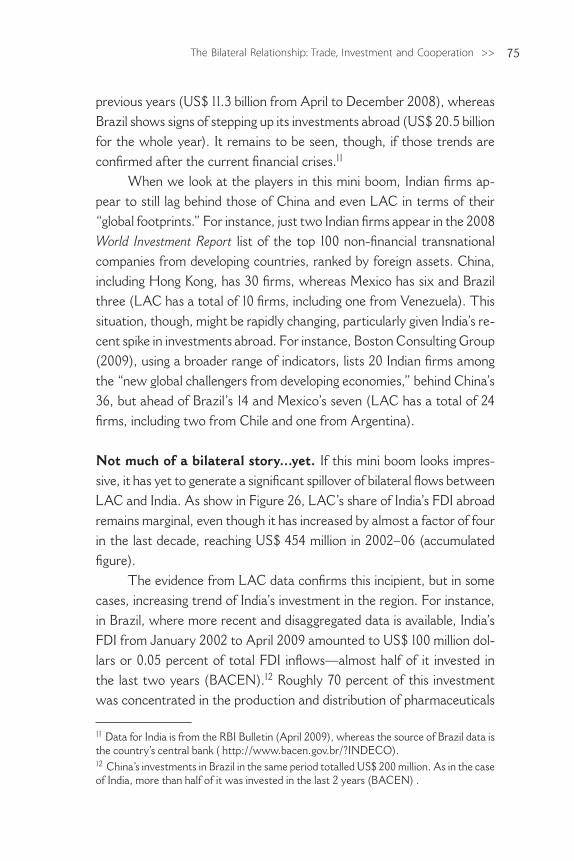
75The Bilateral Relationship: Trade, Investment and Cooperation >>
previous years (US$ 11.3 billion from April to December 2008), whereas Brazil shows signs of stepping up its investments abroad (US$ 20.5 billion for the whole year). It remains to be seen, though, if those trends are confirmed after the current financial crises.11
When we look at the players in this mini boom, Indian firms ap-pear to still lag behind those of China and even LAC in terms of their “global footprints.” For instance, just two Indian firms appear in the 2008 World Investment Report list of the top 100 non-financial transnational companies from developing countries, ranked by foreign assets. China, including Hong Kong, has 30 firms, whereas Mexico has six and Brazil three (LAC has a total of 10 firms, including one from Venezuela). This situation, though, might be rapidly changing, particularly given India’s re-cent spike in investments abroad. For instance, Boston Consulting Group (2009), using a broader range of indicators, lists 20 Indian firms among the “new global challengers from developing economies,” behind China’s 36, but ahead of Brazil’s 14 and Mexico’s seven (LAC has a total of 24 firms, including two from Chile and one from Argentina).
Not much of a bilateral story…yet. If this mini boom looks impres-sive, it has yet to generate a significant spillover of bilateral flows between LAC and India. As show in Figure 26, LAC’s share of India’s FDI abroad remains marginal, even though it has increased by almost a factor of four in the last decade, reaching US$ 454 million in 2002–06 (accumulated figure).
The evidence from LAC data confirms this incipient, but in some cases, increasing trend of India’s investment in the region. For instance, in Brazil, where more recent and disaggregated data is available, India’s FDI from January 2002 to April 2009 amounted to US$ 100 million dol-lars or 0.05 percent of total FDI inflows—almost half of it invested in the last two years (BACEN).12 Roughly 70 percent of this investment was concentrated in the production and distribution of pharmaceuticals
11 Data for India is from the RBI Bulletin (April 2009), whereas the source of Brazil data is the country’s central bank ( http://www.bacen.gov.br/?INDECO). 12 China’s investments in Brazil in the same period totalled US$ 200 million. As in the case of India, more than half of it was invested in the last 2 years (BACEN) .
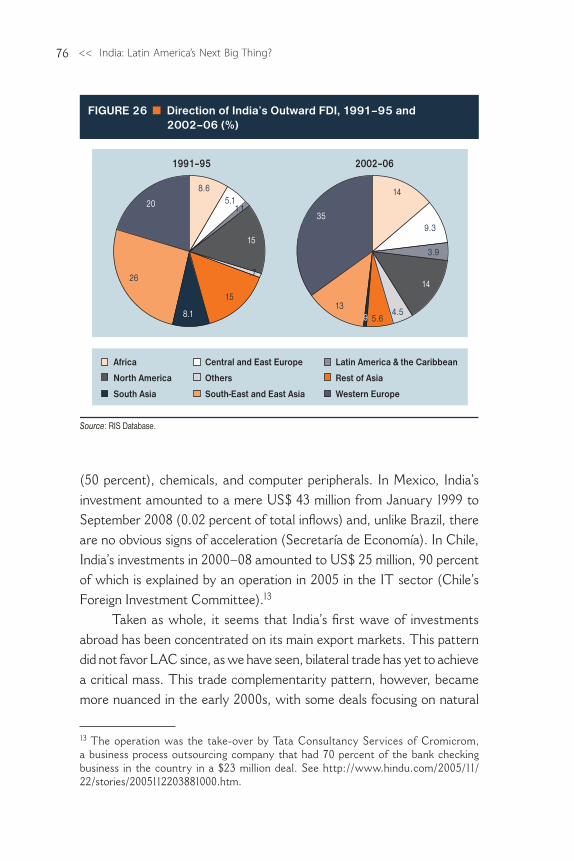
<< India: Latin America’s Next Big Thing?76
(50 percent), chemicals, and computer peripherals. In Mexico, India’s investment amounted to a mere US$ 43 million from January 1999 to September 2008 (0.02 percent of total inflows) and, unlike Brazil, there are no obvious signs of acceleration (Secretaría de Economía). In Chile, India’s investments in 2000–08 amounted to US$ 25 million, 90 percent of which is explained by an operation in 2005 in the IT sector (Chile’s Foreign Investment Committee).13
Taken as whole, it seems that India’s first wave of investments abroad has been concentrated on its main export markets. This pattern did not favor LAC since, as we have seen, bilateral trade has yet to achieve a critical mass. This trade complementarity pattern, however, became more nuanced in the early 2000s, with some deals focusing on natural
13 The operation was the take-over by Tata Consultancy Services of Cromicrom, a business process outsourcing company that had 70 percent of the bank checking business in the country in a $23 million deal. See http://www.hindu.com/2005/11/ 22/stories/2005112203881000.htm.
1991–95 2002–06
Source: RIS Database.
FIGURE 26 � Direction of India’s Outward FDI, 1991–95 and 2002–06 (%)
Africa
North America
South Asia
Central and East Europe
Others
South-East and East Asia
Latin America & the Caribbean
Rest of Asia
Western Europe
8.65.1
1.1
15
.7
15
8.1
26
2014
9.3
3.9
14
4.55.6.9
13
35
77The Bilateral Relationship: Trade, Investment and Cooperation >>
resources and on the purchase of strategic assets (i.e. access to brands and technology) (Kumar 2008).
India’s recent interest in natural resources can obviously boost its presence in LAC given the resource complementarity between the two economies discussed earlier. Its potential is illustrated by the recent ac-quisition (2007) of the development rights for 20 million tons of iron ore reserves in Bolivia by the Indian company Jindal Steel and Power’s. The company plans to invest US$2.1 billion on an integrated plant for steel, power, sponge iron, and iron ore pellets. This project will constitute the single largest investment by an Indian company in Latin America, and also the largest foreign investment in a single project in Bolivia. 14
Other examples of this trend are: the Indian Oil and Natural Gas Company‘s (ONGC) US$200 million investment in natural gas reserves in Trinidad and Tobago (2005) and the company’s recent joint venture with Petrobras, the Brazilian national oil conglomerate, for exploration and development projects in both India and Brazil. Along the same lines, in April 2008 the governments of India and Venezu-ela entered into a joint venture agreement (with the former to invest US$ 356 million for a 40 percent stake) to develop oil fields in Venezuela’s Orinoco basin.15
Apart from natural resources, there have been other deals that have preceded any significant trade, particularly in IT and ITES services and in the automobile industry, which have not involved substantial resources but that might be an indication of things to come. For instance, IT firms such as Infosys, Tata Consulting Services (TCS), Sasken and Genpact have all set up facilities in Mexico, Argentina, Chile and Uruguay (see Box 2.2), and Tata joined forces with Fiat to manufacture pick-up trucks in Cordoba, Argentina. Sold under the Fiat name, these trucks leverage the core chassis platform of Tata’s “new-generation” trucks.16
LAC’s investments in India are even more modest than India’s invest-ments in LAC and unlike the latter, there are few signs of an upward trend.
14 Buluswar, Gelman and Tynan (2009).15 Buluswar, Gelman and Tynan (op cit).16 Buluswar, Gelman and Tynan (op cit.)
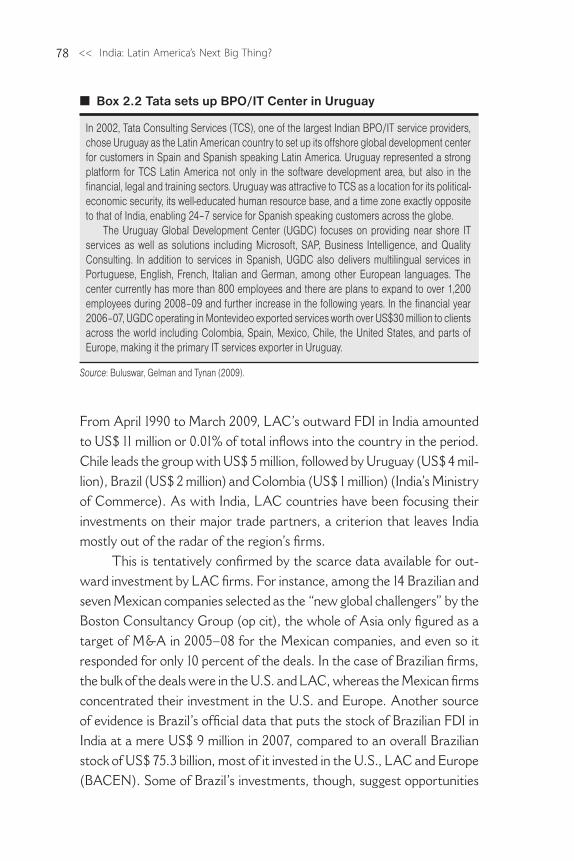
<< India: Latin America’s Next Big Thing?78
From April 1990 to March 2009, LAC’s outward FDI in India amounted to US$ 11 million or 0.01% of total inflows into the country in the period. Chile leads the group with US$ 5 million, followed by Uruguay (US$ 4 mil-lion), Brazil (US$ 2 million) and Colombia (US$ 1 million) (India’s Ministry of Commerce). As with India, LAC countries have been focusing their investments on their major trade partners, a criterion that leaves India mostly out of the radar of the region’s firms.
This is tentatively confirmed by the scarce data available for out-ward investment by LAC firms. For instance, among the 14 Brazilian and seven Mexican companies selected as the “new global challengers” by the Boston Consultancy Group (op cit), the whole of Asia only figured as a target of M&A in 2005–08 for the Mexican companies, and even so it responded for only 10 percent of the deals. In the case of Brazilian firms, the bulk of the deals were in the U.S. and LAC, whereas the Mexican firms concentrated their investment in the U.S. and Europe. Another source of evidence is Brazil’s official data that puts the stock of Brazilian FDI in India at a mere US$ 9 million in 2007, compared to an overall Brazilian stock of US$ 75.3 billion, most of it invested in the U.S., LAC and Europe (BACEN). Some of Brazil’s investments, though, suggest opportunities
n Box 2.2 Tata sets up BPO/IT Center in Uruguay
In 2002, Tata Consulting Services (TCS), one of the largest Indian BPO/IT service providers, chose Uruguay as the Latin American country to set up its offshore global development center for customers in Spain and Spanish speaking Latin America. Uruguay represented a strong platform for TCS Latin America not only in the software development area, but also in the financial, legal and training sectors. Uruguay was attractive to TCS as a location for its political-economic security, its well-educated human resource base, and a time zone exactly opposite to that of India, enabling 24–7 service for Spanish speaking customers across the globe.
The Uruguay Global Development Center (UGDC) focuses on providing near shore IT services as well as solutions including Microsoft, SAP, Business Intelligence, and Quality Consulting. In addition to services in Spanish, UGDC also delivers multilingual services in Portuguese, English, French, Italian and German, among other European languages. The center currently has more than 800 employees and there are plans to expand to over 1,200 employees during 2008–09 and further increase in the following years. In the financial year 2006–07, UGDC operating in Montevideo exported services worth over US$30 million to clients across the world including Colombia, Spain, Mexico, Chile, the United States, and parts of Europe, making it the primary IT services exporter in Uruguay.
Source: Buluswar, Gelman and Tynan (2009).
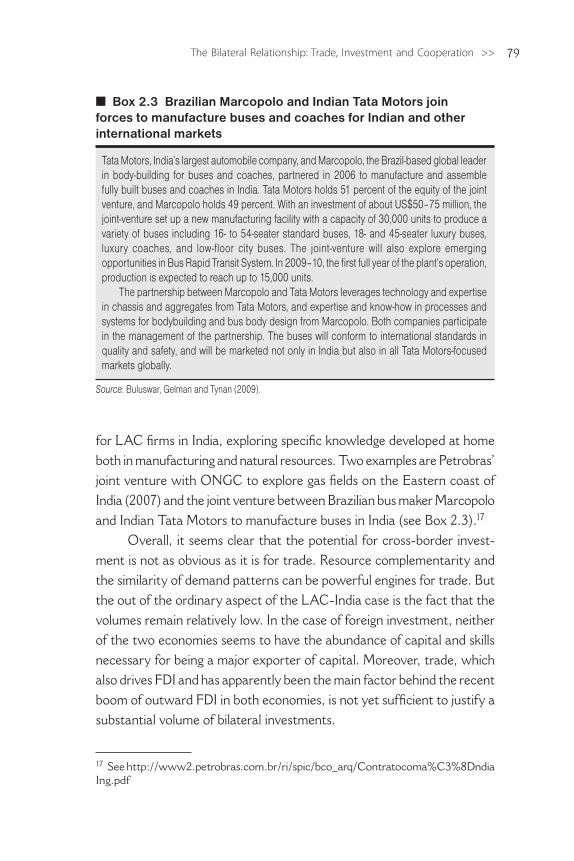
79The Bilateral Relationship: Trade, Investment and Cooperation >>
for LAC firms in India, exploring specific knowledge developed at home both in manufacturing and natural resources. Two examples are Petrobras’ joint venture with ONGC to explore gas fields on the Eastern coast of India (2007) and the joint venture between Brazilian bus maker Marcopolo and Indian Tata Motors to manufacture buses in India (see Box 2.3).17
Overall, it seems clear that the potential for cross-border invest-ment is not as obvious as it is for trade. Resource complementarity and the similarity of demand patterns can be powerful engines for trade. But the out of the ordinary aspect of the LAC-India case is the fact that the volumes remain relatively low. In the case of foreign investment, neither of the two economies seems to have the abundance of capital and skills necessary for being a major exporter of capital. Moreover, trade, which also drives FDI and has apparently been the main factor behind the recent boom of outward FDI in both economies, is not yet sufficient to justify a substantial volume of bilateral investments.
17 See http://www2.petrobras.com.br/ri/spic/bco_arq/Contratocoma%C3%8Dndia Ing.pdf
n Box 2.3 Brazilian Marcopolo and Indian Tata Motors join forces to manufacture buses and coaches for Indian and other international markets
Tata Motors, India’s largest automobile company, and Marcopolo, the Brazil-based global leader in body-building for buses and coaches, partnered in 2006 to manufacture and assemble fully built buses and coaches in India. Tata Motors holds 51 percent of the equity of the joint venture, and Marcopolo holds 49 percent. With an investment of about US$50–75 million, the joint-venture set up a new manufacturing facility with a capacity of 30,000 units to produce a variety of buses including 16- to 54-seater standard buses, 18- and 45-seater luxury buses, luxury coaches, and low-floor city buses. The joint-venture will also explore emerging opportunities in Bus Rapid Transit System. In 2009–10, the first full year of the plant’s operation, production is expected to reach up to 15,000 units.
The partnership between Marcopolo and Tata Motors leverages technology and expertise in chassis and aggregates from Tata Motors, and expertise and know-how in processes and systems for bodybuilding and bus body design from Marcopolo. Both companies participate in the management of the partnership. The buses will conform to international standards in quality and safety, and will be marketed not only in India but also in all Tata Motors-focused markets globally.
Source: Buluswar, Gelman and Tynan (2009).
<< India: Latin America’s Next Big Thing?80
That does not mean that there are no incentives to invest. Both Indian and LAC firms have developed specific and intangible assets and are large enough economies to make bilateral FDI a viable proposition. Likewise, resource complementarity can also drive investments, and examples are already there for us to see.
But in the end, the goal of robust bilateral investments will have to wait for these economies to grow and accumulate more capital and skills, which is a medium- to long-term proposition. This does not mean that policymakers should sit and wait. There is a policy action that can be implemented in the short term that can both make this goal more realistic and shorten its time horizon: the removal of the most obvious and costly obstacles to trade. As trade brings these two economies together, the incentives to invest will become clearer and the barriers, particularly the informational barrier, will become less relevant.
Cooperation: building on and moving beyond trade and investment
Even though trade and investment are likely to be the main drivers of a closer India-LAC relationship, the opportunities go well beyond market-driven issues to include a wide range of technical and political cooperation possibilities. Just as the similarity of per capita incomes can be a powerful incentive to trade, similar stages of development provide opportunities for a mutually beneficial exchange of knowledge and policy experiences in key developmental areas. Income and production pattern similarities also mean that countries, more often than not, share interests in shaping the rules and institutions that govern the world economy.
Whereas the governments of India and LAC countries have been slow to address the most obvious barriers to bilateral trade, they have more readily taken advantage of opportunities for cooperation. For ex-ample, in the best spirit of the so-called South-South cooperation, they have signed numerous agreements, particularly in the last decade. As shown in Table 8, these agreements cover at least 21 areas of interest, ranging from information technology, to education and poverty allevia- tion, and involve an ever expanding number of LAC countries.
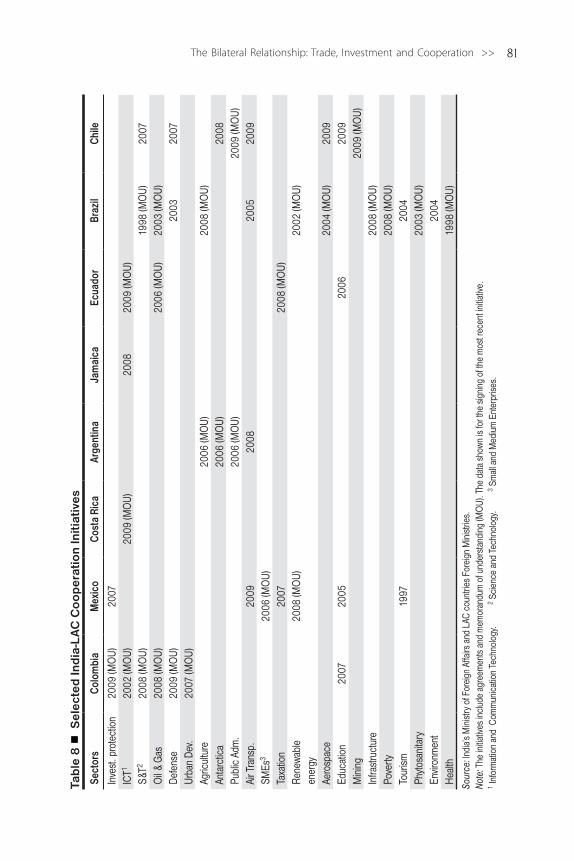
81The Bilateral Relationship: Trade, Investment and Cooperation >>
Tab
le 8
S
ele
cte
d In
dia
-LA
C C
oo
pe
rati
on
Init
iati
ves
Sect
ors
Colo
mbi
aM
exic
oCo
sta
Rica
Arge
ntin
aJa
mai
caEc
uado
rBr
azil
Chile
Inve
st. p
rote
ctio
n20
09 (M
OU)
2007
ICT1
2002
(MO
U)20
09 (M
OU)
2008
2009
(MO
U)S&
T220
08 (M
OU)
1998
(MO
U)20
07O
il & G
as20
08 (M
OU)
2006
(MO
U)20
03 (M
OU)
Defe
nse
2009
(MO
U)20
0320
07Ur
ban
Dev.
2007
(MO
U)Ag
ricul
ture
2006
(MO
U)20
08 (M
OU)
Anta
rctic
a20
06 (M
OU)
2008
Publ
ic A
dm.
2006
(MO
U)20
09 (M
OU)
Air T
rans
p.20
0920
0820
0520
09SM
Es3
2006
(MO
U)Ta
xatio
n20
0720
08 (M
OU)
Rene
wabl
e en
ergy
2008
(MO
U)20
02 (M
OU)
Aero
spac
e20
04 (M
OU)
2009
Educ
atio
n20
0720
0520
0620
09M
inin
g20
09 (M
OU)
Infra
stru
ctur
e20
08 (M
OU)
Pove
rty20
08 (M
OU)
Tour
ism19
9720
04Ph
ytosa
nita
ry20
03 (M
OU)
Envir
onm
ent
2004
Hea
lth19
98 (M
OU)
Sour
ce: I
ndia
’s M
inist
ry o
f For
eign
Affa
irs a
nd L
AC c
ount
ries
Fore
ign
Min
istrie
s.No
te: T
he in
itiativ
es in
clud
e ag
reem
ents
and
mem
oran
dum
of u
nder
stan
ding
(MO
U). T
he d
ata
show
n is
for t
he s
igni
ng o
f the
mos
t rec
ent i
nitia
tive.
1 Info
rmat
ion
and
Com
mun
icat
ion
Tech
nolo
gy.
2 Sci
ence
and
Tec
hnol
ogy.
3 Sm
all a
nd M
ediu
m E
nter
prise
s.
<< India: Latin America’s Next Big Thing?82
India-LAC cooperation on international diplomacy has also increased, often in the form of shared positions in international fora such as the UN and the WTO. This was clearly the case during negotiations involving the generalized system of preferences (GSP), the composition of the UN Security Council, the latest multilateral trade liberalization rounds and, more recently, the climate change negotiations and the discussions involving the Group of Twenty (G-20) Finance Ministers and Central Bank Governors.
However numerous and diverse, these initiatives probably just scratch the surface of a rich pool of opportunities that India and LAC have to learn from each other. India can provide valuable lessons based on its successes in elite college education, ICT (see Chapter 1), aerospace, microfinance (see Box 2.4) and pharmaceuticals, just to name a few. Latin America can provide success stories in agriculture, mining, aeronautics, biofuels, private pension schemes, and poverty alleviation programs (see Box 2.5), which could take India a long way in addressing some of its growth constraints.
Building on trade. This surge in cooperation seems to be rooted in the same shift in development strategy that opened both LAC and India to international trade in the late 1980s and early 1990s. Although there were instances of cooperation between India and LAC before this period, they were few and far between and were generally beset by problems of implementation. As one analyst put it bluntly in the late 1990s, “Latin America has always been on the periphery of India’s foreign policy con-cerns. What goes on in that part of the world has never really mattered to India.” (Sahni 1997, p.77).
The case of Brazil—India’s main trade partner in the region and the case in which India-LAC cooperation has assumed its most sophisticated form—illustrates this point well. Until 1990, cooperation between India and Brazil had consisted solely of the signing of two agreements with little or no practical consequence. Between 1990 and 2008, a total of 23 agree-ments or memoranda of understandings were signed in several areas (see Table 8)—most of them after trade between the two economies finally took off in the 2000s (see Chapter 1).
83The Bilateral Relationship: Trade, Investment and Cooperation >>
This clear correlation only reinforces the imperative of addressing the ubiquitous trade costs that still holds back trade and investment between the two economies. The relationship between trade and cooperation is probably not a one-way street (high levels of cooperation are also likely to boost trade and investment), but the case of Brazil and India suggests that it was only after these countries had embraced trade and started to value the opportunities presented by their considerable reciprocal markets that the political will to cooperate gained enough momentum to spur further progress.
n Box 2.4 Microfinance in India
Ideas relating to microcredit can be found at various times since the 18th and 19th centuries. However, the origins of microcredit as it is currently practiced can be linked to several organizations founded in Bangladesh, especially the Grameen Bank in the 1970s, established by 2006 Nobel Prize winner Muhammad Yunus. The success of the Grameen Bank inspired the world, and by 2007 an estimated more than 3,000 microcredit institutions have served more than 130 million clients around the globe. India has been one of the leading countries providing microfinance to low-income households, with more than 60 million clients by 2007.
Microfinance in India most often takes the form of links between self-help groups (SHGs) and banks. These links created through a program managed by the National Bank for Agriculture and Rural Development, which finances more than 500 banks that on-lend funds to the SHGs. The SHGs normally comprise 20 or fewer members who pool savings for a few months and allocate them to members who temporarily need small amounts for purposes ranging from household emergencies to school fees. SHGs that prove themselves capable of managing their funds, then qualify to borrow from a local bank to invest in small business or farm activities. The SHGs-Bank linkage program has become the largest microcredit program in India. However, many other microfinance structures exist, such as NGOs that lend directly to borrowers, or microfinance institutions organized as cooperatives. The microcredit delivery model has also evolved over time. For instance, latest models include delivery of financial services with technical assistance and agricultural business development services. India’s experience represents an invaluable stock of knowledge for countries in Latin America for setting up microfinance arrangements to meet specific needs.
Despites its benefits, microfinance should not be considered a panacea for eliminating poverty, particularly in the short-run. For example, researchers from the Poverty Action Lab at the Massachusetts Institute of Technology designed an experiment to measure the impact of access to microcredit in the city of Hyderabad, India. The study found no measurable impact on poverty during the period of study (18 months). Nevertheless, they found that as many as one-third more businesses were created in slums with microcredit branches, which suggests that there may be effects over the longer time period required for these businesses to begin to prosper. This type of study helps to put in perspective the scope of microfinance policies as a tool for poverty reduction.
Sources: “State of the Microcredit Summit Campaign Report 2007,” Banerjee et al. (2009) and Wanchoo (2007).
<< India: Latin America’s Next Big Thing?84
n Box 2.5 Conditional Cash Transfer Programs in LAC
During the last decade, conditional cash transfer (CCT) programs have grown to become an important piece of the social protection sector in many countries of Latin America. The experience of LAC with these programs is increasingly being promoted as best practice in the social sector for developing countries in other parts of the world. CCT programs aim to reduce poverty by making welfare programs conditional upon actions by beneficiaries. The government transfers the money only to persons who meet certain criteria, like enrolling children into public schools, getting regular checkups at the doctor’s office, or receiving vaccinations. Many countries in LAC have implemented CCT programs, including Argentina (Plan Familias), Brazil (Bolsa Familia), Chile (Chile Solidario), Colombia (Familias en Acción), Costa Rica (Superémonos in kind transfer), Dominican Republic (Solidaridad), Ecuador (Bono de Desarrollo Humano), Honduras (PRAF), Jamaica (PATH), Mexico (PROGRESA/Oportunidades), Nicaragua (Red de Protección Social), Peru (Juntos), El Salvador (Red Solidaria), and Uruguay (PANES). The largest programs are Plan Familias in Argentina, Bolsa Familia in Brazil, and Oportunidades in Mexico, which together benefit more than 16 million poor families.
Most of the conditional cash transfer programs in LAC have been well implemented with respect to targeting, general administration, and impact evaluation. Evaluations performed in Brazil, Chile, Colombia, Costa Rica, Ecuador, Honduras, Jamaica, Mexico, and Nicaragua have generally shown that these programs can be very effective tools for reducing poverty and inequality in the long term and for alleviating poverty in the short term. The experiences indicate that well designed and implemented CCT programs can have a wide range of good outcomes, such as raising consumption levels and increasing the use of health and education services.
Implementing CCTs, however, does not come without challenges. For instance, these programs generate full synergies between social assistance and human capital development only if health and education services are extensive and of reasonable quality. They can also be difficult to administer. Both household targeting systems and compliance monitoring are data intensive, and the programs require extensive coordination across agencies and often levels of government. Finally, their impact in reducing a country’s total level of poverty depends on the scope of the program, which is often constrained by fiscal considerations. Even the best-designed CCT program cannot meet all the needs of a comprehensive social protection system. They must be viewed as part of a larger suite of policies that includes other interventions such as workfare or employment programs and/or social pensions.
Although LAC’s experience with CCT programs is successful, it is important to understand that wholesale replication in other countries without considering local realities might alter the results. Countries should assess the effectiveness of CCT programs under different country conditions and make modifications according to their own characteristics. As pointed out by India’s then-minister of housing and poverty alleviation, Kumari Selja, during a visit to Brazil in 2006, India’s large poor population represents a daunting fiscal challenge to large scale implementation of CCT programs.
Sources: Bouillon and Tejerina (2007), Fiszbein and Schady (2009), Handa and Davis (2006), Rawlings and Rubio (2003) and Vieira (2007).
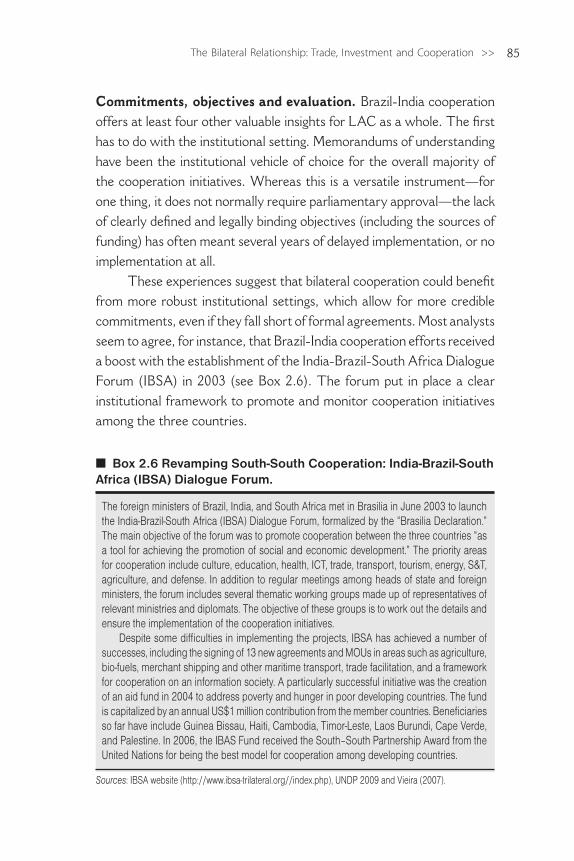
85The Bilateral Relationship: Trade, Investment and Cooperation >>
Commitments, objectives and evaluation. Brazil-India cooperation offers at least four other valuable insights for LAC as a whole. The first has to do with the institutional setting. Memorandums of understanding have been the institutional vehicle of choice for the overall majority of the cooperation initiatives. Whereas this is a versatile instrument—for one thing, it does not normally require parliamentary approval—the lack of clearly defined and legally binding objectives (including the sources of funding) has often meant several years of delayed implementation, or no implementation at all.
These experiences suggest that bilateral cooperation could benefit from more robust institutional settings, which allow for more credible commitments, even if they fall short of formal agreements. Most analysts seem to agree, for instance, that Brazil-India cooperation efforts received a boost with the establishment of the India-Brazil-South Africa Dialogue Forum (IBSA) in 2003 (see Box 2.6). The forum put in place a clear institutional framework to promote and monitor cooperation initiatives among the three countries.
n Box 2.6 Revamping South-South Cooperation: India-Brazil-South Africa (IBSA) Dialogue Forum.
The foreign ministers of Brazil, India, and South Africa met in Brasilia in June 2003 to launch the India-Brazil-South Africa (IBSA) Dialogue Forum, formalized by the “Brasilia Declaration.” The main objective of the forum was to promote cooperation between the three countries “as a tool for achieving the promotion of social and economic development.” The priority areas for cooperation include culture, education, health, ICT, trade, transport, tourism, energy, S&T, agriculture, and defense. In addition to regular meetings among heads of state and foreign ministers, the forum includes several thematic working groups made up of representatives of relevant ministries and diplomats. The objective of these groups is to work out the details and ensure the implementation of the cooperation initiatives.
Despite some difficulties in implementing the projects, IBSA has achieved a number of successes, including the signing of 13 new agreements and MOUs in areas such as agriculture, bio-fuels, merchant shipping and other maritime transport, trade facilitation, and a framework for cooperation on an information society. A particularly successful initiative was the creation of an aid fund in 2004 to address poverty and hunger in poor developing countries. The fund is capitalized by an annual US$1 million contribution from the member countries. Beneficiaries so far have include Guinea Bissau, Haiti, Cambodia, Timor-Leste, Laos Burundi, Cape Verde, and Palestine. In 2006, the IBAS Fund received the South–South Partnership Award from the United Nations for being the best model for cooperation among developing countries.
Sources: IBSA website (http://www.ibsa-trilateral.org//index.php), UNDP 2009 and Vieira (2007).
<< India: Latin America’s Next Big Thing?86
The second insight has to do with the definition of so-called “com-parative advantages” in cooperation (UNDP 2009). Even though it is tempting—for obvious reasons—to define cooperation objectives based on the countries’ well known competitive strengths, in practice, this narrow focus can lead to poor results since these initiatives have often stumbled on the countries’ legitimate commercial interests. That has been the case in Brazil and India’s efforts to carry out joint research in areas such as biofuels (ethanol) and pharmaceuticals. In fact, one can argue that in cases such as these, greater bilateral trade and investment is the fastest and most efficient means for transfering knowledge. Cooperation should focus on areas such as public policy, where the market does not do a good job as a knowledge transmission mechanism.
The third insight relates to evaluation. Despite the numerous agree-ments signed between India and Brazil, there is hardly any quantitative information that would allow for an objective assessment of their impact. The same lack of hard data on results also seems to apply to other Indian cooperation initiatives in LAC. One has to rely on the often subjective assessment of government officials to gauge the effectiveness of these initiatives. An effort to collect data and assess results would help countries to design more efficient cooperation mechanisms to maximize scarce resources.
Along these lines, Gupta and Singh (2004) offers one of the few quantitative, though indirect, assessments of the increasing number of S&T cooperation initiatives between India and LAC. They computed the scientific and technical articles co-authored by Indian and LAC research-ers in 1991–2000 and found that they almost doubled during the period, though they still account for only a small fraction (2.9 percent) of India’s cross-border co-authored papers. We need more metrics like this to make sense of the growing numbers of agreements being signed.
Finally, Brazil’s and India’s experience make it clear their current brand of South-South cooperation is much more pragmatic and results-oriented than the one advocated during the early seventies, when the UN General Assembly created a Special Unit within the United Nations to boost technical cooperation among developing countries.
87The Bilateral Relationship: Trade, Investment and Cooperation >>
Rather than being defined by rhetorical opposition to “exploita-tion” or the interests of the “rich North,” alliances and collaboration have been defined in terms of specific issues. Pursuing these interests in some instances involves taking political and legitimate stances against the interests of the “North”—as has been the case of the G-20 during the negotiations of the Doha Round—but there is also recognition that the “Southern” countries’ interests are diverse and go well beyond the “North-South” divide.
India and Brazil have been on the same side of several political and economic global issues in the last decades, but there has also been consider-able divergence. Nunes de Oliveira, Onuki and Oliveira (2006), for instance, built indices to reflect Brazil’s and India’s votes in the UN and WTO in 1994–2004 on issues such as security, trade, human rights, environment, and labor regulation. They found that the correlation between the two countries’ votes not only declined sharply during the period, but was as low as 0.5 in 2004. This “pick and choose,” or shifting pattern of coali- tions, where countries avoid committing ex-ante to ideology-inspired packages of collaborations, seems to be the best way to spot the best opportunities and maximize the benefits of LAC-India cooperation.
<< India: Latin America’s Next Big Thing?88
References
Abdenur, Adriana. (2007). “The Strategic Triad: Form and Content in Brazil’s Triangular Cooperation Practices.” The New School for Social Research. International Affairs Working Paper 2007–06. November.
Aziz, Jahangir and Li, Xiangming, China’s Changing Trade Elasticities (November 2007). IMF Working Papers, pp. 1–27, 2007.
Banerjee, Abhijit, Esther Duflo, Rachel Glennerster and Cynthia Kinnan. (2009). “The miracle of microfinance? Evidence from a random-ized evaluation.” Massachusetts Institute of Technology. Boston, Massachusetts. Unpublished document.
Bouillon, César Patricio and Luis Tejerina. (2007). “Do We Know What Works? A Systematic Review of Impact Evaluations of Social Programs in Latin America and the Caribbean.” Inter-American Development Bank. Washington, D.C.
Broda, Christian and David Weinstein. (2006). “Globalization and the Gains from Variety.” Quarterly Journal of Economics. Vol 121, Issue 2.
Buluswar, Shashi, Tamy Gelman and Peter Tynan. (2009). “India’s Inte-gration into the Global Economy: Lessons and Opportunities for Latin America and the Caribbean.” Dalberg Global Development Advisors. Background paper prepared for the IADB report “India: Latin America’s Next Big Thing?”.
Clark, Ximena, David Dollar and Alejandro Micco. (2004). “Port Ef- ficiency, Maritime Transport Costs, and Bilateral Trade.” Journal of Development Economics. Vol. 75. December.
Daley-Harris, Sam. State of Microcredit Summit Campaign Report 2007, Microcredit Summit Campaign, Washington, 2007. http://www.microcreditsummit.org/pubs/reports/socr/2007.html.
Eichengreen, Barry, Yeongseop Rhee and Hui Tong. (2004). “The Impact Of China On The Exports of other Asian Countries.” NBER Work-ing 10768. (September).
Fiszbein, Ariel and Norbert Schady. (2009). “Conditional Cash Transfers: Reducing Present and Future Poverty.” World Bank Policy Research Report. Washington D.C.: World Bank.
89The Bilateral Relationship: Trade, Investment and Cooperation >>
Fonseca, Renato, Marcelo S. Azevedo and Edson Velloso. (2005). “O Potencial de Comércio entre Brasil e Índia. Um exame com base nas estruturas de vantagem comparativa.” Estudos CNI No 3, Brasília, July.
Gupta, B. M. and Mohinder Singh. (2004) “India’s Collaboration with Latin America as Reflected in Co-authored Papers.” DESIDOC Bulletin of Information Technology, Vol. 24, No 3, May 2004, pp.9–21.
Handa, Sudhanshu and Benjamin Davis. (2006). “The Experience of Conditional Cash Transfers in Latin America and the Caribbean.” ESA Working Paper No. 06–07.
Helpman, Elhanan, Marc Melitz, and Yona Rubinstein. (2008). “Estimating Trade Flows: Trading Partners and Trading Volumes.” The Quarterly Journal of Economics, MIT Press, vol. 123(2), pages 441–487, 05.
Hummels, David, Voludymyr Lugovskyy and Alexandre Skyba. (2009). “The Trade Reducing Effects of Market Power in International Shipping,” Journal of Development Economics, vol. 89(1), pages 84–97, May.
Kumar, Rajiv. (2008). “India: Towards a Competitive Manufacturing Sector,” Indian Council for Research on International Economic Relations, Background paper prepared for the IADB report “India: Latin America’s Next Big Thing?”.
Lederman, Daniel, Marcelo Olarreaga, and Izidro Soloaga. (2009). “The Growth of China and India in World Trade: Opportunity or Threat for Latin America and the Caribbean?” In Daniel Lederman, Marcelo Olarreaga, Guillermo Perry (eds.) China’s and India’s Challenge to Latin America: Opportunity or Threat? Washington: World Bank.
Markusen, James R. (2002). Multinational Firms and the Theory of Inter-national Trade. Cambridge: MIT Press.
Moreira, Mauricio Mesquita, Christian Volpe, and Juan Blyde. (2008). Unclogging the Arteries: The Impact of Transport Costs on Latin American and Caribbean Trade. IDB and Harvard University Press. Washington, D.C.
Neves Junior, Edson José. (2009). “Brasil–India: Que Cooperação é Pos-sivel?” Paper presented at the Annual Meeting of the ISA-ABRI Joint International Meetings. Rio de Janeiro, PUC, July.
<< India: Latin America’s Next Big Thing?90
Nogueira, Saulo and André Nassar. (2007). “Dynamics of the Agri-Food Sector in India and MERCOSUR: differences, trends and potential complementarities.” Background paper prepared for the IADB report “India: Latin America’s Next Big Thing?”.
Nunes de Oliveira, Amancio Jorge, Janina Onuki and Emmanuel de Oliveira. (2006). “Coalizões Sul-Sul e Multilateralismo: Índia, Brasil e África do Sul. Contexto Internacional.” Rio de Janeiro, vol. 28, no 2, July/December 2006, pp. 465–504.
Rawlings, Laura and Gloria Rubio. (2003). “Evaluating the impact of conditional cash transfer programs: lessons from Latin America.” World Bank Policy Research Working Paper No. 3119.
RBI Bulletin (April 2009). Reserve Bank of India http://www.bulletin.rbi.org.in.
Rosen, Daniel H. and Thilo Hanemann. (2009). “China’s Changing Outbound Foreign Direct Investment.” Police Brief. No PB09–1 4. Peterson Institute for International Economics. June.
Sahni, Varun (1997). “India and Latin America,” in Lalit Mansingh and M. Venkatraman (eds.) Indian Foreign Policy: Agenda for the 21st Century. Vol. 2. Konark Publishers, New Delhi.
UNCTAD. (2004). World Investment Report. Geneva.UNDP. (2009). Enhancing South-South and Triangular Cooperation. Study
of the Current Situation and Existing Practices in Policy, Institutions and Operation of South-South and Triangular Cooperation. Study commissioned by the Special Unit for South-South Cooperation, UNDP. New York, United Nations Development Program.
Veira, Maira Bae Valadão. (2007). Relações Brasil-India (1991–2006). Master thesis presented at the International Relations Program of the Federal University of Rio de Grande do Sul.
Wanchoo, Rajat. (2007). “Micro-finance in India: the changing face of micro-credit schemes.” MPRA Paper No. 3675. November.
WTO (2007). “Trade Police Review. Report by the Secretariat. India.” WT/TPR/S/182/Rev.1, Geneva, July, WTO.
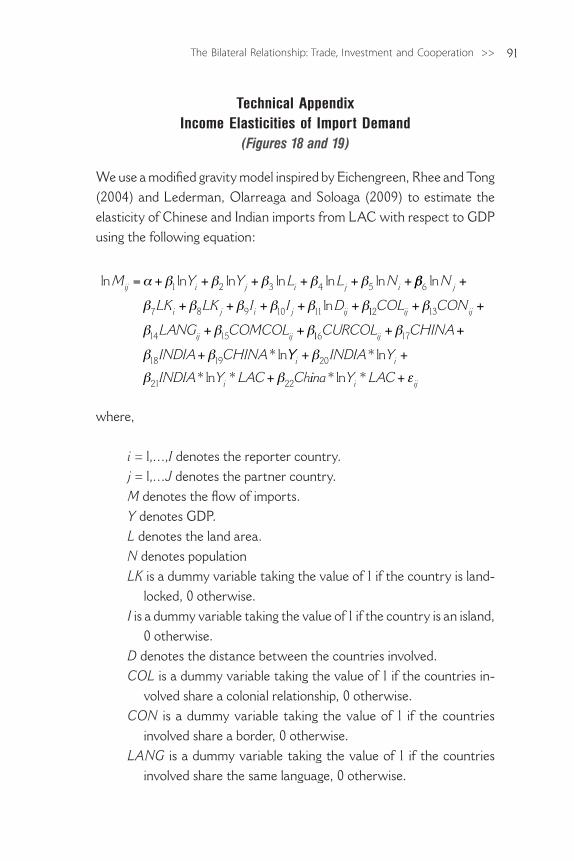
91The Bilateral Relationship: Trade, Investment and Cooperation >>
Technical AppendixIncome Elasticities of Import Demand
(Figures 18 and 19)
We use a modified gravity model inspired by Eichengreen, Rhee and Tong (2004) and Lederman, Olarreaga and Soloaga (2009) to estimate the elasticity of Chinese and Indian imports from LAC with respect to GDP using the following equation:
ln ln ln ln ln lnM Y Y L L Nij i j i j i= + + + + + +α β β β β β1 2 3 4 5 ββ
β β β β β β6
7 8 9 10 11
ln
ln
N
LK LK I I Dj
i j i j ij
+
+ + + + + 112 13
14 15
COL CON
LANG COMCOLij ij
ij ij
+ +
+ +
β
β β β116 17
18 19
CURCOL CHINA
INDIA CHINAij + +
+
β
β β * lnYY INDIA Y
INDIA Y LAC Chi i
i
+ +
+
β
β β20
21 22
* ln
* ln * iina Y LACi ij* ln * +ε
where,
i = l,…,I denotes the reporter country.j = l,…J denotes the partner country.M denotes the flow of imports.Y denotes GDP.L denotes the land area.N denotes populationLK is a dummy variable taking the value of 1 if the country is land-
locked, 0 otherwise.I is a dummy variable taking the value of 1 if the country is an island,
0 otherwise.D denotes the distance between the countries involved.COL is a dummy variable taking the value of 1 if the countries in-
volved share a colonial relationship, 0 otherwise. CON is a dummy variable taking the value of 1 if the countries
involved share a border, 0 otherwise.LANG is a dummy variable taking the value of 1 if the countries
involved share the same language, 0 otherwise.
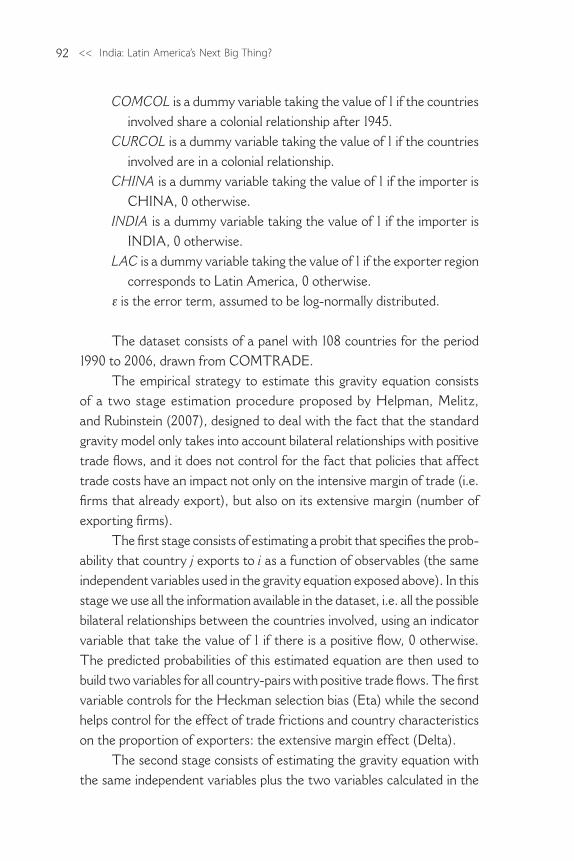
<< India: Latin America’s Next Big Thing?92
COMCOL is a dummy variable taking the value of 1 if the countries involved share a colonial relationship after 1945.
CURCOL is a dummy variable taking the value of 1 if the countries involved are in a colonial relationship.
CHINA is a dummy variable taking the value of 1 if the importer is CHINA, 0 otherwise.
INDIA is a dummy variable taking the value of 1 if the importer is INDIA, 0 otherwise.
LAC is a dummy variable taking the value of 1 if the exporter region corresponds to Latin America, 0 otherwise.
ε is the error term, assumed to be log-normally distributed.
The dataset consists of a panel with 108 countries for the period 1990 to 2006, drawn from COMTRADE.
The empirical strategy to estimate this gravity equation consists of a two stage estimation procedure proposed by Helpman, Melitz, and Rubinstein (2007), designed to deal with the fact that the standard gravity model only takes into account bilateral relationships with positive trade flows, and it does not control for the fact that policies that affect trade costs have an impact not only on the intensive margin of trade (i.e. firms that already export), but also on its extensive margin (number of exporting firms).
The first stage consists of estimating a probit that specifies the prob-ability that country j exports to i as a function of observables (the same independent variables used in the gravity equation exposed above). In this stage we use all the information available in the dataset, i.e. all the possible bilateral relationships between the countries involved, using an indicator variable that take the value of 1 if there is a positive flow, 0 otherwise. The predicted probabilities of this estimated equation are then used to build two variables for all country-pairs with positive trade flows. The first variable controls for the Heckman selection bias (Eta) while the second helps control for the effect of trade frictions and country characteristics on the proportion of exporters: the extensive margin effect (Delta).
The second stage consists of estimating the gravity equation with the same independent variables plus the two variables calculated in the
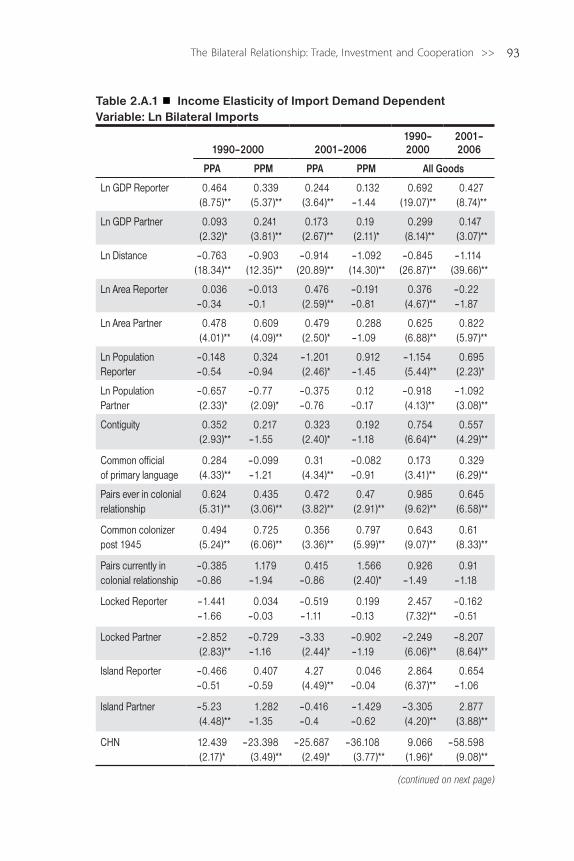
93The Bilateral Relationship: Trade, Investment and Cooperation >>
(continued on next page)
Table 2.A.1 Income Elasticity of Import Demand Dependent Variable: Ln Bilateral Imports
1990–2000 2001–20061990–2000
2001–2006
PPA PPM PPA PPM All Goods
Ln GDP Reporter 0.464(8.75)**
0.339(5.37)**
0.244(3.64)**
0.132–1.44
0.692(19.07)**
0.427(8.74)**
Ln GDP Partner 0.093(2.32)*
0.241(3.81)**
0.173(2.67)**
0.19(2.11)*
0.299(8.14)**
0.147(3.07)**
Ln Distance –0.763(18.34)**
–0.903(12.35)**
–0.914(20.89)**
–1.092(14.30)**
–0.845(26.87)**
–1.114(39.66)**
Ln Area Reporter 0.036–0.34
–0.013–0.1
0.476(2.59)**
–0.191–0.81
0.376(4.67)**
–0.22–1.87
Ln Area Partner 0.478(4.01)**
0.609(4.09)**
0.479(2.50)*
0.288–1.09
0.625(6.88)**
0.822(5.97)**
Ln Population Reporter
–0.148–0.54
0.324–0.94
–1.201(2.46)*
0.912–1.45
–1.154(5.44)**
0.695(2.23)*
Ln Population Partner
–0.657(2.33)*
–0.77(2.09)*
–0.375–0.76
0.12–0.17
–0.918(4.13)**
–1.092(3.08)**
Contiguity 0.352(2.93)**
0.217–1.55
0.323(2.40)*
0.192–1.18
0.754(6.64)**
0.557(4.29)**
Common official of primary language
0.284(4.33)**
–0.099–1.21
0.31(4.34)**
–0.082–0.91
0.173(3.41)**
0.329(6.29)**
Pairs ever in colonial relationship
0.624(5.31)**
0.435(3.06)**
0.472(3.82)**
0.47(2.91)**
0.985(9.62)**
0.645(6.58)**
Common colonizer post 1945
0.494(5.24)**
0.725(6.06)**
0.356(3.36)**
0.797(5.99)**
0.643(9.07)**
0.61(8.33)**
Pairs currently in colonial relationship
–0.385–0.86
1.179–1.94
0.415–0.86
1.566(2.40)*
0.926–1.49
0.91–1.18
Locked Reporter –1.441–1.66
0.034–0.03
–0.519–1.11
0.199–0.13
2.457(7.32)**
–0.162–0.51
Locked Partner –2.852(2.83)**
–0.729–1.16
–3.33(2.44)*
–0.902–1.19
–2.249(6.06)**
–8.207(8.64)**
Island Reporter –0.466–0.51
0.407–0.59
4.27(4.49)**
0.046–0.04
2.864(6.37)**
0.654–1.06
Island Partner –5.23(4.48)**
1.282–1.35
–0.416–0.4
–1.429–0.62
–3.305(4.20)**
2.877(3.88)**
CHN 12.439(2.17)*
–23.398(3.49)**
–25.687(2.49)*
–36.108(3.77)**
9.066(1.96)*
–58.598(9.08)**
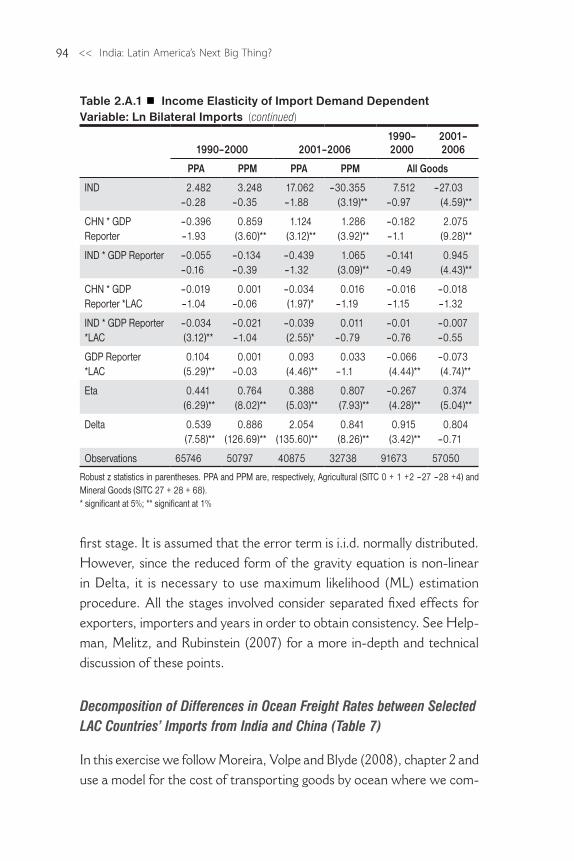
<< India: Latin America’s Next Big Thing?94
Table 2.A.1 Income Elasticity of Import Demand Dependent Variable: Ln Bilateral Imports
1990–2000 2001–20061990–2000
2001–2006
PPA PPM PPA PPM All Goods
IND 2.482–0.28
3.248–0.35
17.062–1.88
–30.355(3.19)**
7.512–0.97
–27.03(4.59)**
CHN * GDP Reporter
–0.396–1.93
0.859(3.60)**
1.124(3.12)**
1.286(3.92)**
–0.182–1.1
2.075(9.28)**
IND * GDP Reporter –0.055–0.16
–0.134–0.39
–0.439–1.32
1.065(3.09)**
–0.141–0.49
0.945(4.43)**
CHN * GDP Reporter *LAC
–0.019–1.04
0.001–0.06
–0.034(1.97)*
0.016–1.19
–0.016–1.15
–0.018–1.32
IND * GDP Reporter *LAC
–0.034(3.12)**
–0.021–1.04
–0.039(2.55)*
0.011–0.79
–0.01–0.76
–0.007–0.55
GDP Reporter *LAC
0.104(5.29)**
0.001–0.03
0.093(4.46)**
0.033–1.1
–0.066(4.44)**
–0.073(4.74)**
Eta 0.441(6.29)**
0.764(8.02)**
0.388(5.03)**
0.807(7.93)**
–0.267(4.28)**
0.374(5.04)**
Delta 0.539(7.58)**
0.886(126.69)**
2.054(135.60)**
0.841(8.26)**
0.915(3.42)**
0.804–0.71
Observations 65746 50797 40875 32738 91673 57050
Robust z statistics in parentheses. PPA and PPM are, respectively, Agricultural (SITC 0 + 1 +2 –27 –28 +4) and Mineral Goods (SITC 27 + 28 + 68).* significant at 5%; ** significant at 1%
(continued)
first stage. It is assumed that the error term is i.i.d. normally distributed. However, since the reduced form of the gravity equation is non-linear in Delta, it is necessary to use maximum likelihood (ML) estimation procedure. All the stages involved consider separated fixed effects for exporters, importers and years in order to obtain consistency. See Help-man, Melitz, and Rubinstein (2007) for a more in-depth and technical discussion of these points.
Decomposition of Differences in Ocean Freight Rates between Selected LAC Countries’ Imports from India and China (Table 7)
In this exercise we follow Moreira, Volpe and Blyde (2008), chapter 2 and use a model for the cost of transporting goods by ocean where we com-
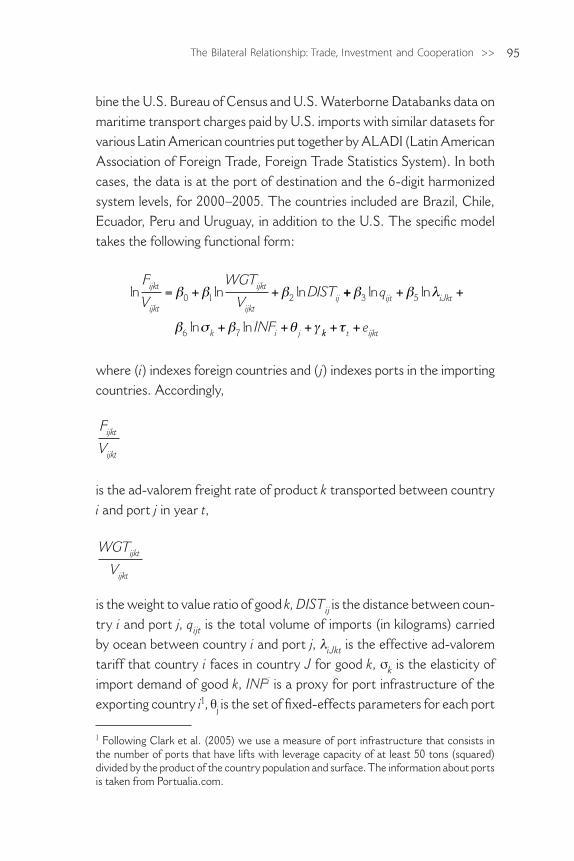
95The Bilateral Relationship: Trade, Investment and Cooperation >>
bine the U.S. Bureau of Census and U.S. Waterborne Databanks data on maritime transport charges paid by U.S. imports with similar datasets for various Latin American countries put together by ALADI (Latin American Association of Foreign Trade, Foreign Trade Statistics System). In both cases, the data is at the port of destination and the 6-digit harmonized system levels, for 2000–2005. The countries included are Brazil, Chile, Ecuador, Peru and Uruguay, in addition to the U.S. The specific model takes the following functional form:
ln ln lnF
V
WGT
VDISTijkt
ijkt
ijkt
ijktij= + +β β β0 1 2 ++ + +
+ + +
β β λ
β σ β θ γ
3 5
6 7
ln ln
ln ln
q
INF
ijt iJkt
k i j kk t ijkte+ +τ
where (i) indexes foreign countries and ( j) indexes ports in the importing countries. Accordingly,
F
Vijkt
ijkt
is the ad-valorem freight rate of product k transported between country i and port j in year t,
WGT
Vijkt
ijkt
is the weight to value ratio of good k, DISTij is the distance between coun-try i and port j, qijt is the total volume of imports (in kilograms) carried by ocean between country i and port j, λiJkt is the effective ad-valorem tariff that country i faces in country J for good k, σk is the elasticity of import demand of good k, INFi is a proxy for port infrastructure of the exporting country i1, θj
is the set of fixed-effects parameters for each port
1 Following Clark et al. (2005) we use a measure of port infrastructure that consists in the number of ports that have lifts with leverage capacity of at least 50 tons (squared) divided by the product of the country population and surface. The information about ports is taken from Portualia.com.
<< India: Latin America’s Next Big Thing?96
of entry in the importing countries (this is our measure of port efficiency in the importing country), γ k are the product fixed-effect, and eijkt is the error term.
The data on freight, trade values and weight come from the U.S. Import Waterborne Databank (U.S. Department of Transportation) and ALADI. Import duties for the U.S. are calculated with data from the U.S. Census Imports of Merchandise. Distance from port to port is taken from Shipanalysis. We use estimates of σk at 6-digit HS taken from Broda-Weinstein (2006). In order to control for endogeneity between freight rates and volumes, we instrument the latter with the countries’ GDP and run the model in two-stages (2SLS).
We also run an alternative specification replacing INFi for a general measure of infrastructure INFRAi, is based on Clark et al. (2005), which is a simple average of normalized telecommunication and transport in-frastructure indices.
We used the results from the estimation (Table 2.A.2) to decom-pose the differences in shipping prices between LAC and each of its Asian partners, i.e. India and China, among its various determinants. The decomposition is based on Hummels, Lugovskyy and Skiba (2009).
The impact of transport costs on trade (Figure 23)
To assess the impact of transport costs and tariffs on LAC-India and LAC-China bilateral trade we use the results of a bilateral, multi-sector trade model estimated by Moreira, Volpe and Blyde (2008), chapter 3. The authors estimate the equation
lnM ln f Dcdz ck dk k cdz cdz k cd cdk= + + +( )+ +λ λ β τ δ εln
where Mcdz is country c’s total imports of variety z in sector k from country d; is importer fixed-effect, λdk is exporter fixed-effect; fcdz is the ad-valorem transport cost for good z from country d to country c; τcdz is the real tariff rate applied by country c on good z originated in country d; Dcd is the bilateral distance between country c and d and ε is an error term.
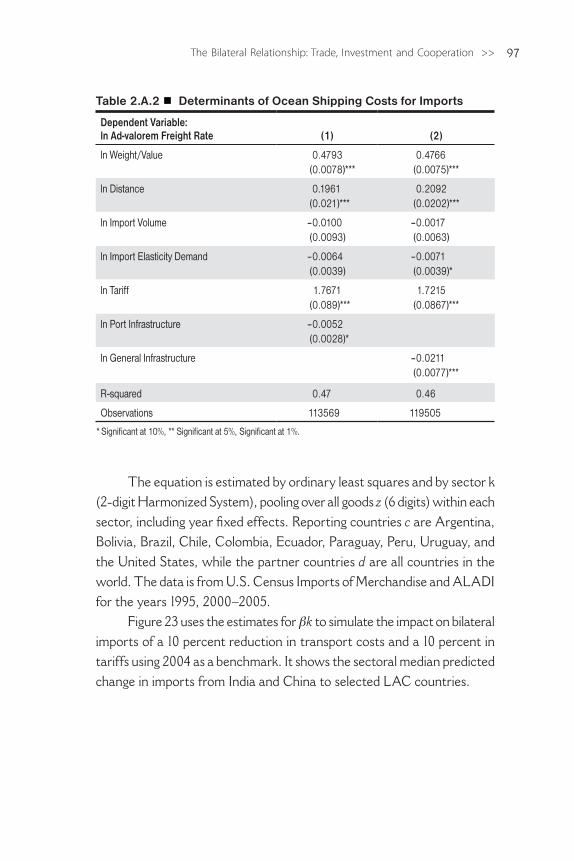
97The Bilateral Relationship: Trade, Investment and Cooperation >>
The equation is estimated by ordinary least squares and by sector k (2-digit Harmonized System), pooling over all goods z (6 digits) within each sector, including year fixed effects. Reporting countries c are Argentina, Bolivia, Brazil, Chile, Colombia, Ecuador, Paraguay, Peru, Uruguay, and the United States, while the partner countries d are all countries in the world. The data is from U.S. Census Imports of Merchandise and ALADI for the years 1995, 2000–2005.
Figure 23 uses the estimates for βk to simulate the impact on bilateral imports of a 10 percent reduction in transport costs and a 10 percent in tariffs using 2004 as a benchmark. It shows the sectoral median predicted change in imports from India and China to selected LAC countries.
Table 2.A.2 Determinants of Ocean Shipping Costs for Imports
Dependent Variable:ln Ad-valorem Freight Rate (1) (2)
ln Weight/Value
0.4793(0.0078)***
0.4766(0.0075)***
ln Distance
0.1961(0.021)***
0.2092(0.0202)***
ln Import Volume
–0.0100(0.0093)
–0.0017(0.0063)
ln Import Elasticity Demand
–0.0064(0.0039)
–0.0071(0.0039)*
ln Tariff
1.7671(0.089)***
1.7215(0.0867)***
ln Port Infrastructure
–0.0052(0.0028)*
ln General Infrastructure
–0.0211(0.0077)***
R-squared 0.47 0.46
Observations 113569 119505
* Significant at 10%, ** Significant at 5%, Significant at 1%.

>> The Competitive Challenges
The greatest competitive challenges China poses to LAC are in manu-facturing, and that country’s success has been well documented (see e.g. Moreira 2007, Hanson and Robertson 2008 and Freund and
Ozden 2009). In contrast, the challenges raised by India are broader, more nuanced and, in some cases have yet to be perceived. Furthermore, India’s challenges arise in a context in which the region is already trying to respond to China, adding another layer of complexity to the analysis. LAC’s policy responses to India cannot ignore China and vice-versa, since the issues are deeply intertwined.
We wish to explore what we believe are the two main areas in which India poses, or is perceived to pose, a competitive chal-lenge: Information Technology (IT) and Business, Professional and Technical (BPT) services and manufacturing. The contexts of these sectors are radically different. India is already a leading exporter of IT and BPT services, whereas LAC has yet to move into this area on an economically relevant scale. As such, this is not a situation in which LAC’s position is being threatened by a powerful newcomer. Rather, LAC’s chances to exploit a new income-generating opportunity —often mentioned as a safe haven from the Chinese manufacturing onslaught—hinge on its abilities to grow and compete under the shadow of a powerful incumbent.
India has yet to become a major exporter of manufactured goods, whereas LAC has already established players in an activity that ac-
3
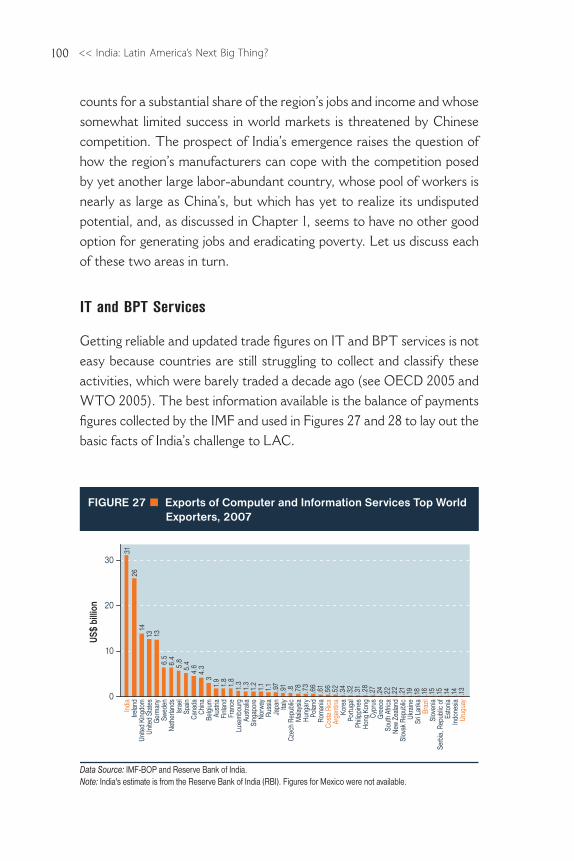
<< India: Latin America’s Next Big Thing?100
counts for a substantial share of the region’s jobs and income and whose somewhat limited success in world markets is threatened by Chinese competition. The prospect of India’s emergence raises the question of how the region’s manufacturers can cope with the competition posed by yet another large labor-abundant country, whose pool of workers is nearly as large as China’s, but which has yet to realize its undisputed potential, and, as discussed in Chapter 1, seems to have no other good option for generating jobs and eradicating poverty. Let us discuss each of these two areas in turn.
IT and BPT Services
Getting reliable and updated trade figures on IT and BPT services is not easy because countries are still struggling to collect and classify these activities, which were barely traded a decade ago (see OECD 2005 and WTO 2005). The best information available is the balance of payments figures collected by the IMF and used in Figures 27 and 28 to lay out the basic facts of India’s challenge to LAC.
3126
1413 13
6.5
6.4
5.8
5.4
4.6
4.3
31.
91.
81.
81.
31.
31.
21.
11.
1.9
7.9
1 .8 .78
.73
.66
.61
.56
.52
.34
.32
.31
.28
.27
.24
.22
.22
.21
.19
.18 .16
.15
.15
.14
.14 .13
0
10
20
30
US$
billi
on
Indi
aIre
land
Unite
d Ki
ngdo
mUn
ited
Stat
esG
erm
any
Swed
enNe
ther
land
sIs
rael
Spai
nCa
nada
Chin
aBe
lgiu
mAu
stria
Finl
and
Fran
ceLu
xem
bour
gAu
stra
liaSi
ngap
ore
Norw
ayRu
ssia
Japa
nIta
lyCz
ech
Repu
blic
Mal
aysia
Hun
gary
Pola
ndRo
man
iaCo
sta
Rica
Arge
ntin
aKo
rea
Portu
gal
Philip
pine
sH
ong
Kong
Cypr
usG
reec
eSo
uth
Afric
aNe
w Ze
alan
dSl
ovak
Rep
ublic
Ukra
ine
Sri L
anka
Braz
ilSl
oven
iaSe
rbia
, Rep
ublic
of
Esto
nia
Indo
nesia
Urug
uay
Data Source: IMF-BOP and Reserve Bank of India. Note: India's estimate is from the Reserve Bank of India (RBI). Figures for Mexico were not available.
FIGURE 27 Exports of Computer and Information Services Top World Exporters, 2007
101The Competitive Challenges >>
Figure 27 shows that India’s main revealed competitive strength is in IT (or CI) services, a category that includes the development, testing, and maintenance of software and information systems. The country’s export volume is one of the highest in the world, dwarfing that of any individual Latin American country as well as the total of the region’s lead-ing exporters—Costa Rica, Argentina, Brazil and Uruguay.
It is true that this data might be inflating India’s position since countries such as the U.S. sell most of their IT services through foreign affiliates (see e.g. Koncz and Flatness 2008). But this does not change the fact that India enjoys a dominant global position, whereas LAC has yet to make a significant dent in this market.
The good news is that India’s strong presence has not stopped the leading LAC exporters from experiencing robust growth in their IT exports. Between 2000 and 2007 exports from Costa Rica, Argentina, Brazil, and Uruguay grew at an annual average rate of 28, 14, 17 and 32 percent, respectively. Since they are starting from a very small base, the relevant question is how long this growth can continue.
India’s advantage in BPT services, which include a wide array of products—from customer support to accounting to R&D—does not seem to be as significant as in IT services.1 For instance, Figure 28 uses the IMF category “other business services” as a proxy and shows that the leading developing country exporter in this case is China, not India. India’s position is strong, but the gap in this category with the major LAC exporters is not as wide as in IT services. Brazil’s US$11 billion exports are not that much less than India’s US$ 17 billion, and if we could add Mexico’s exports (figures which are not yet available) to those of Brazil, Argentina and Chile, the region’s total exports would almost certainly surpass those of India. As in the case of IT, LAC’s exports have also been growing sharply, with Brazil, Argentina, and Chile posting annual average export growth of 14, 31 and 13 percent, respectively, in 2001–08.
1 Other examples of BOP services are data entry, processing and conversion services, customer support services, technical support services, telemarketing services, inventory and logistics information services, accounting and reconciliation services, electronic pub-lishing, payroll processing, employee IT help-desk services, medical transcription services, insurance processing, bookkeeping and accounting services, among others.
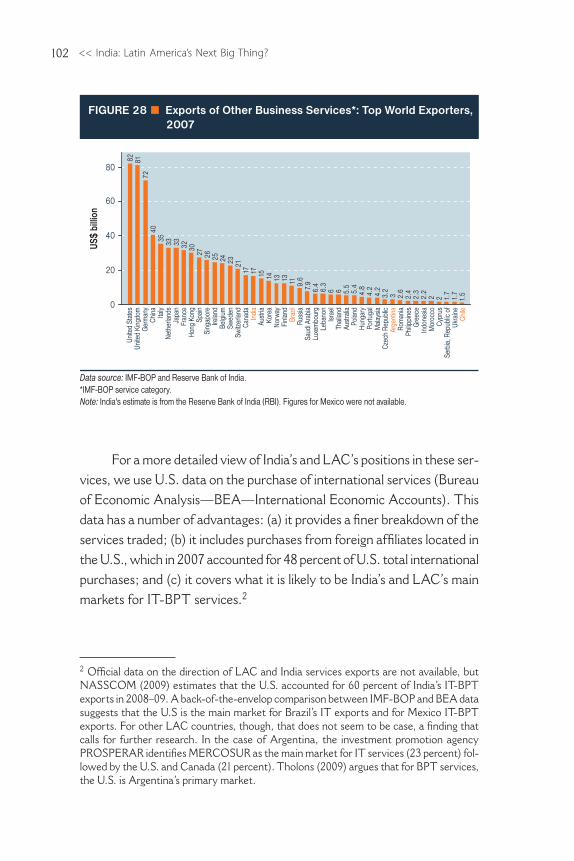
<< India: Latin America’s Next Big Thing?102
For a more detailed view of India’s and LAC’s positions in these ser-vices, we use U.S. data on the purchase of international services (Bureau of Economic Analysis—BEA—International Economic Accounts). This data has a number of advantages: (a) it provides a finer breakdown of the services traded; (b) it includes purchases from foreign affiliates located in the U.S., which in 2007 accounted for 48 percent of U.S. total international purchases; and (c) it covers what it is likely to be India’s and LAC’s main markets for IT-BPT services.2
2 Official data on the direction of LAC and India services exports are not available, but NASSCOM (2009) estimates that the U.S. accounted for 60 percent of India’s IT-BPT exports in 2008–09. A back-of-the-envelop comparison between IMF-BOP and BEA data suggests that the U.S is the main market for Brazil’s IT exports and for Mexico IT-BPT exports. For other LAC countries, though, that does not seem to be case, a finding that calls for further research. In the case of Argentina, the investment promotion agency PROSPERAR identifies MERCOSUR as the main market for IT services (23 percent) fol-lowed by the U.S. and Canada (21 percent). Tholons (2009) argues that for BPT services, the U.S. is Argentina’s primary market.
82 8172
4035 33 33 32 30
27 26 25 24 23 2117 17 15 14 13 13 11 9.
67.
96.
46.
36 6 5.
55.
44.
84.
24.
23.
23 2.
62.
42.
32.
22 2 1.
71.
71.
5
0
20
40
60
80
US$
billi
on
Unite
d St
ates
Unite
d Ki
ngdo
mG
erm
any
Chin
aIta
lyNe
ther
land
sJa
pan
Fran
ceH
ong
Kong
Spai
nSi
ngap
ore
Irela
ndBe
lgiu
mSw
eden
Switz
erla
ndCa
nada
Indi
aAu
stria
Kore
aNo
rway
Finl
and
Braz
ilRu
ssia
Saud
i Ara
bia
Luxe
mbo
urg
Leba
non
Isra
elTh
aila
ndAu
stra
liaPo
land
Hun
gary
Portu
gal
Mal
aysia
Czec
h Re
publ
icAr
gent
ina
Rom
ania
Philip
pine
sG
reec
eIn
done
siaM
oroc
coCy
prus
Serb
ia, R
epub
lic o
fUk
rain
eCh
ile
Data source: IMF-BOP and Reserve Bank of India. *IMF-BOP service category.Note: India's estimate is from the Reserve Bank of India (RBI). Figures for Mexico were not available.
FIGURE 28 Exports of Other Business Services*: Top World Exporters, 2007
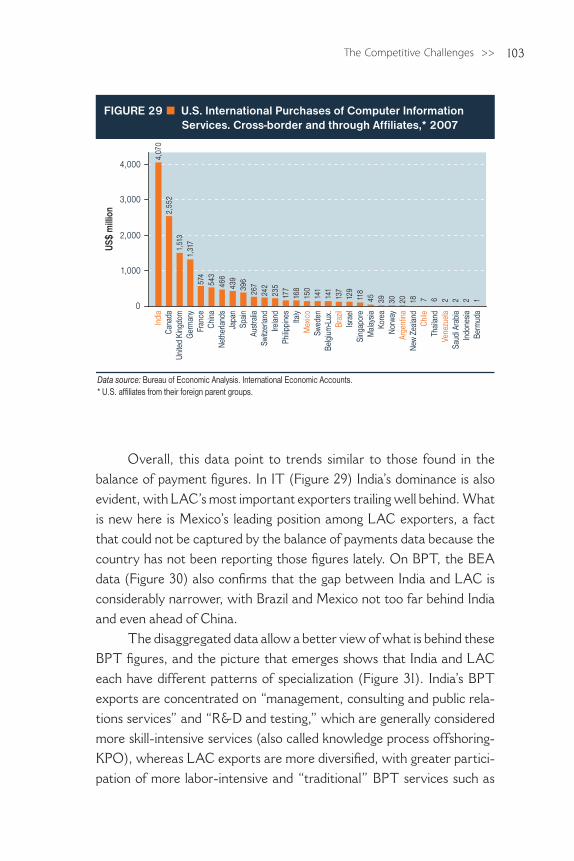
103The Competitive Challenges >>
Overall, this data point to trends similar to those found in the balance of payment figures. In IT (Figure 29) India’s dominance is also evident, with LAC’s most important exporters trailing well behind. What is new here is Mexico’s leading position among LAC exporters, a fact that could not be captured by the balance of payments data because the country has not been reporting those figures lately. On BPT, the BEA data (Figure 30) also confirms that the gap between India and LAC is considerably narrower, with Brazil and Mexico not too far behind India and even ahead of China.
The disaggregated data allow a better view of what is behind these BPT figures, and the picture that emerges shows that India and LAC each have different patterns of specialization (Figure 31). India’s BPT exports are concentrated on “management, consulting and public rela- tions services” and “R&D and testing,” which are generally considered more skill-intensive services (also called knowledge process offshoring-KPO), whereas LAC exports are more diversified, with greater partici-pation of more labor-intensive and “traditional” BPT services such as
FIGURE 29 U.S. International Purchases of Computer Information Services. Cross-border and through Affiliates,* 2007
US$
mill
ion
0
1,000
2,000
3,000
4,0002,
552
Indi
a
1,51
3Ca
nada
4,07
0
Unite
d Ki
ngdo
m1,
317
Ger
man
y57
4Fr
ance
466
Chin
a54
3Ne
ther
land
s43
9Ja
pan
396
Spai
n26
7Au
stra
lia24
2Sw
itzer
land
235
Irela
nd17
7Ph
ilippi
nes
168
Italy
150
Mex
ico
141
Swed
en14
1Be
lgiu
m-L
ux.
137
Braz
il12
9Is
rael
118
Sing
apor
e45
Mal
aysia
39Ko
rea
30No
rway
20Ar
gent
ina
18Ne
w Ze
alan
d7
Chile
6Th
aila
nd2
Vene
zuel
a2
Saud
i Ara
bia
2In
done
sia1
Berm
uda
Data source: Bureau of Economic Analysis. International Economic Accounts.* U.S. affiliates from their foreign parent groups.
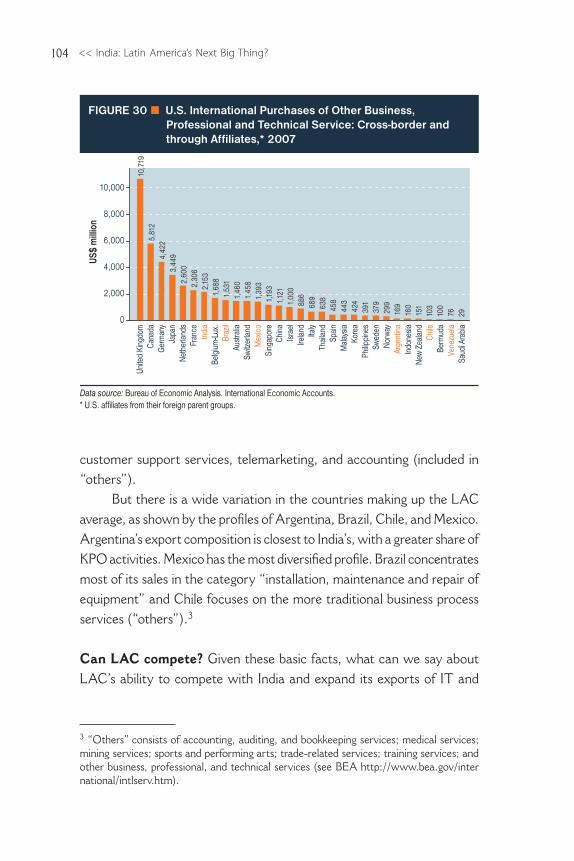
<< India: Latin America’s Next Big Thing?104
10,7
195,
812
4,42
23,
449
2,60
02,
306
2,15
31,
688
1,53
11,
460
1,45
81,
393
1,19
31,
121
1,00
088
668
963
845
844
342
439
137
929
916
916
015
110
310
076 29
US$
mill
ion
0
2,000
4,000
6,000
8,000
10,000
Unite
d Ki
ngdo
mCa
nada
Ger
man
yJa
pan
Neth
erla
nds
Fran
ceIn
dia
Belg
ium
-Lux
.Br
azil
Aust
ralia
Switz
erla
ndM
exic
oSi
ngap
ore
Chin
aIs
rael
Irela
nd Italy
Thai
land
Spai
nM
alay
siaKo
rea
Philip
pine
sSw
eden
Norw
ayAr
gent
ina
Indo
nesia
New
Zeal
and
Chile
Berm
uda
Vene
zuel
aSa
udi A
rabi
a
Data source: Bureau of Economic Analysis. International Economic Accounts.* U.S. affiliates from their foreign parent groups.
FIGURE 30 U.S. International Purchases of Other Business,Professional and Technical Service: Cross-border and through Affiliates,* 2007
customer support services, telemarketing, and accounting (included in “others”).
But there is a wide variation in the countries making up the LAC average, as shown by the profiles of Argentina, Brazil, Chile, and Mexico. Argentina’s export composition is closest to India’s, with a greater share of KPO activities. Mexico has the most diversified profile. Brazil concentrates most of its sales in the category “installation, maintenance and repair of equipment” and Chile focuses on the more traditional business process services (“others”).3
Can LAC compete? Given these basic facts, what can we say about LAC’s ability to compete with India and expand its exports of IT and
3 “Others” consists of accounting, auditing, and bookkeeping services; medical services; mining services; sports and performing arts; trade-related services; training services; and other business, professional, and technical services (see BEA http://www.bea.gov/inter national/intlserv.htm).
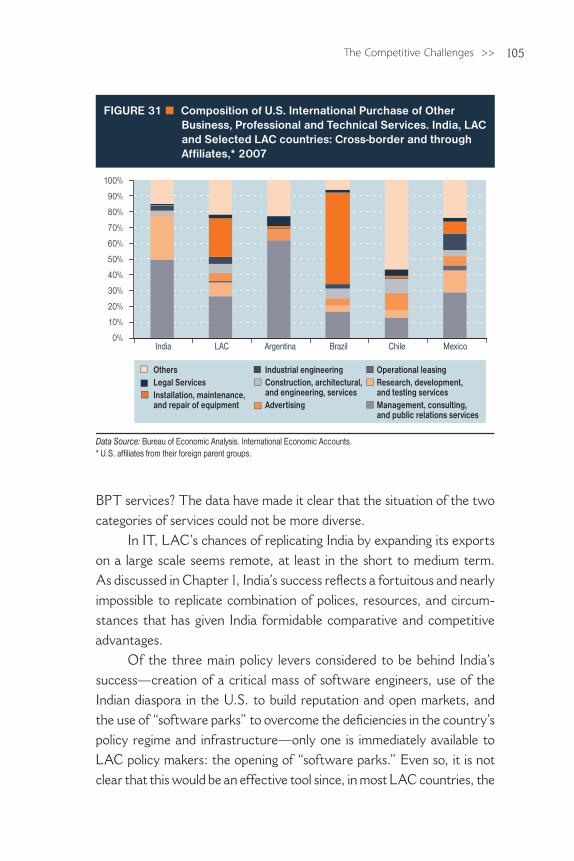
105The Competitive Challenges >>
BPT services? The data have made it clear that the situation of the two categories of services could not be more diverse.
In IT, LAC’s chances of replicating India by expanding its exports on a large scale seems remote, at least in the short to medium term. As discussed in Chapter 1, India’s success reflects a fortuitous and nearly impossible to replicate combination of polices, resources, and circum-stances that has given India formidable comparative and competitive advantages.
Of the three main policy levers considered to be behind India’s success —creation of a critical mass of software engineers, use of the Indian diaspora in the U.S. to build reputation and open markets, and the use of “software parks” to overcome the deficiencies in the country’s policy regime and infrastructure—only one is immediately available to LAC policy makers: the opening of “software parks.” Even so, it is not clear that this would be an effective tool since, in most LAC countries, the
0%
10%
20%
30%
40%
50%
60%
70%
80%
90%
100%
India
FIGURE 31 � Composition of U.S. International Purchase of Other Business, Professional and Technical Services. India, LAC and Selected LAC countries: Cross-border and through Affiliates,* 2007
LAC Argentina Brazil Chile Mexico
Data Source: Bureau of Economic Analysis. International Economic Accounts.* U.S. affiliates from their foreign parent groups.
OthersLegal ServicesInstallation, maintenance, and repair of equipment
Industrial engineeringConstruction, architectural, and engineering, servicesAdvertising
Operational leasingResearch, development, and testing servicesManagement, consulting, and public relations services
<< India: Latin America’s Next Big Thing?106
constraints that these parks must overcome are not nearly as important as they were in India (see Chapter 1).
Building up a critical mass of engineers is clearly amenable to policy intervention, and lack of engineering expertise is generally seen as an important constraint for all LAC countries. The region presently has a limited supply of engineers, and these are generally more costly and less qualified than Indian engineers.4 Yet, even if we assume that LAC poli-cymakers can do what is needed to produce a large cadre of high quality engineers—an accomplishment that has remained elusive since, perhaps, colonial times—the results would only bear fruit in the long term, and even then the gains would not be comparable to India’s. The key constraint here is one that is not amenable to policy intervention: population size. This is not a significant handicap for countries such as Brazil and Mexico, but it is clearly a major obstacle to other players in the region.
If supply-side constraints seem to rule out a large-scale export of IT services, they are less significant a restriction for establishing a greater presence in market niches that reflect the region’s strengths. Most analysts point to physical (common times zones, lower transport, and communica-tion costs) and cultural (e.g. common language) proximity as important assets in the provision of IT services, a factor that puts the region in a privileged position to serve both the growing U.S. Latino market and the regional market.5 This is especially the case since there is a perception that buyers need to reduce their risks and diversify away from the dominant IT suppliers. These nearshore advantages appear to be behind the recent rapid growth in the region’s IT exports, in which India seems to be more a business partner than a competitor.
As a clear sign of LAC’s advantages and potential in those niches, the most important IT firms in India (e.g. TCS, WIPRO, and Infosys) have been investing in the region, bringing in key technical and commercial inputs. Mullan, Kenney and Dossani (op. cit., p.29) cite the case of Mexico, the LAC country that hosts the largest number of Indian IT affiliates:
4 See, e.g. A.T. Kearney 2009, Mullan, Kenney and Dossani 2008 and McKinsey, 2005.5 See e.g. OECD 2005, WTO 2005 and Mullan, Kenney and Dossani op. cit.
107The Competitive Challenges >>
“The catalyst for Indian firms launching these operations here [Mex-ico] has been to establish closer proximity to their U.S. customers and create a near-shore option for their global delivery models.”
Mexico is not the only country in the region that is benefiting from Indian IT investment. There are also Indian “footprints” in Argentina, Colombia, Brazil, and Uruguay, probably again due to physical and cultural proximity to U.S. and regional markets (see Box 2.2).
Local companies were also quick to identify these advantages, even though few have yet to set their sights beyond the local mar-ket. Most are experiencing rapid growth, but remain a long way from having the size and global exposure of their Indian counterparts. To put things in perspective, TCS, one of India’s largest IT f irms, has more than 130,000 employees based in 42 countries, with sales of US$5.7 billion in fiscal year 2007–08.6 By contrast, most LAC local firms are still far from the US$1 billion annual sales mark and the labor force is usually under five percent of TCS’ headcount. (See Box 3.1)
This huge size disadvantage underscores the need for a niche market strategy. The chances of success of such a strategy are examined in a case study on the IT industry in Uruguay by Snoeck et al. (2007). The authors explain how Uruguayan entrepreneurs during the 1980s perceived that some market niches for customized software were of no interest to large IT companies. As a result, Uruguayan IT consultants developed tailor-made solutions for specific types of firms in Uruguay and then used this know-how to target similar firms in other countries. This strategy led to the expansion of Uruguayan IT companies in several LAC countries during the 1990s.
In the area of BPT services, we have seen that, at least in terms of overall exports, LAC does not seem to be too far behind India, although the diversity of services involved and the different nature of the resource requirements complicate the diagnostic. What seems clear is that in the more lucrative, sophisticated, and skill-intensive BPT services, LAC faces
6 Data for the fiscal year 2007/08 from the company’s website.
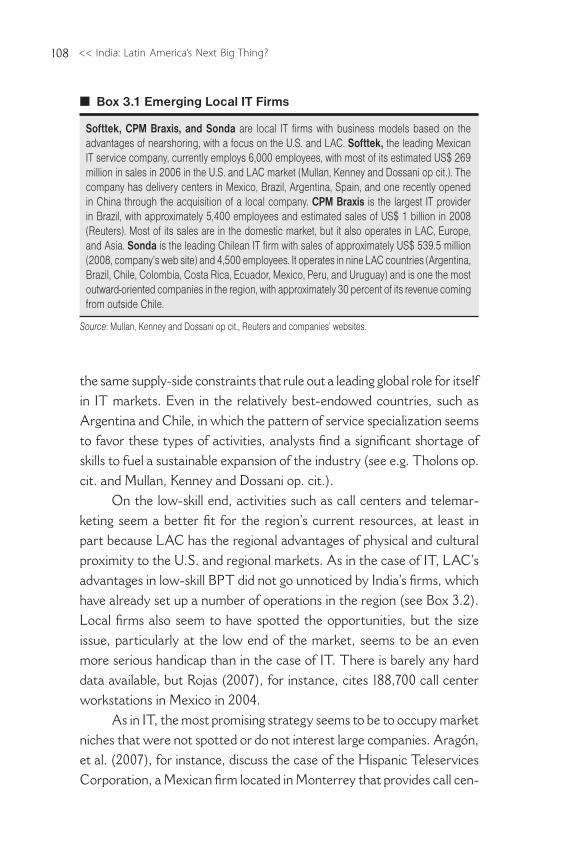
<< India: Latin America’s Next Big Thing?108
the same supply-side constraints that rule out a leading global role for itself in IT markets. Even in the relatively best-endowed countries, such as Argentina and Chile, in which the pattern of service specialization seems to favor these types of activities, analysts find a significant shortage of skills to fuel a sustainable expansion of the industry (see e.g. Tholons op. cit. and Mullan, Kenney and Dossani op. cit.).
On the low-skill end, activities such as call centers and telemar-keting seem a better fit for the region’s current resources, at least in part because LAC has the regional advantages of physical and cultural proximity to the U.S. and regional markets. As in the case of IT, LAC’s advantages in low-skill BPT did not go unnoticed by India’s firms, which have already set up a number of operations in the region (see Box 3.2). Local firms also seem to have spotted the opportunities, but the size issue, particularly at the low end of the market, seems to be an even more serious handicap than in the case of IT. There is barely any hard data available, but Rojas (2007), for instance, cites 188,700 call center workstations in Mexico in 2004.
As in IT, the most promising strategy seems to be to occupy market niches that were not spotted or do not interest large companies. Aragón, et al. (2007), for instance, discuss the case of the Hispanic Teleservices Corporation, a Mexican firm located in Monterrey that provides call cen-
n Box 3.1 Emerging Local IT Firms
Softtek, CPM Braxis, and Sonda are local IT firms with business models based on the advantages of nearshoring, with a focus on the U.S. and LAC. Softtek, the leading Mexican IT service company, currently employs 6,000 employees, with most of its estimated US$ 269 million in sales in 2006 in the U.S. and LAC market (Mullan, Kenney and Dossani op cit.). The company has delivery centers in Mexico, Brazil, Argentina, Spain, and one recently opened in China through the acquisition of a local company. CPM Braxis is the largest IT provider in Brazil, with approximately 5,400 employees and estimated sales of US$ 1 billion in 2008 (Reuters). Most of its sales are in the domestic market, but it also operates in LAC, Europe, and Asia. Sonda is the leading Chilean IT firm with sales of approximately US$ 539.5 million (2008, company’s web site) and 4,500 employees. It operates in nine LAC countries (Argentina, Brazil, Chile, Colombia, Costa Rica, Ecuador, Mexico, Peru, and Uruguay) and is one the most outward-oriented companies in the region, with approximately 30 percent of its revenue coming from outside Chile.
Source: Mullan, Kenney and Dossani op cit., Reuters and companies’ websites.
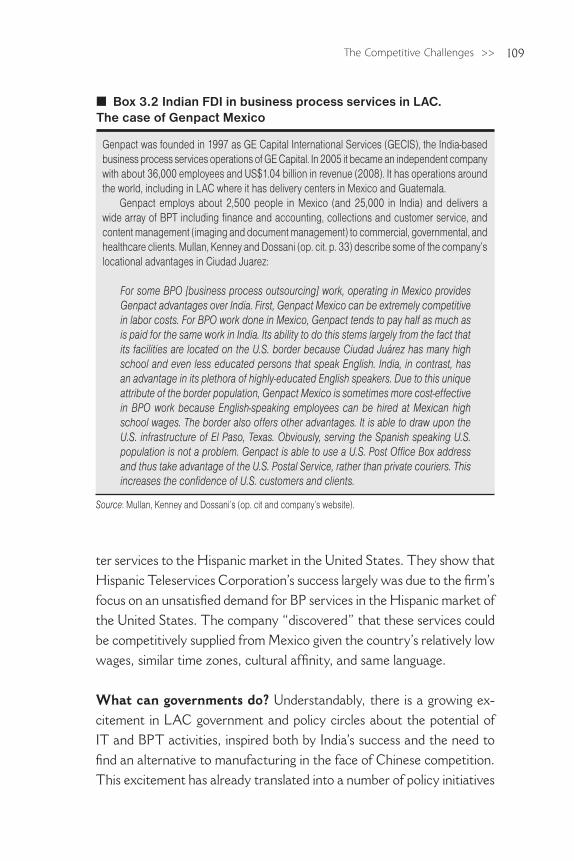
109The Competitive Challenges >>
ter services to the Hispanic market in the United States. They show that Hispanic Teleservices Corporation’s success largely was due to the firm’s focus on an unsatisfied demand for BP services in the Hispanic market of the United States. The company “discovered” that these services could be competitively supplied from Mexico given the country’s relatively low wages, similar time zones, cultural affinity, and same language.
What can governments do? Understandably, there is a growing ex-citement in LAC government and policy circles about the potential of IT and BPT activities, inspired both by India’s success and the need to find an alternative to manufacturing in the face of Chinese competition. This excitement has already translated into a number of policy initiatives
n Box 3.2 Indian FDI in business process services in LAC. The case of Genpact Mexico
Genpact was founded in 1997 as GE Capital International Services (GECIS), the India-based business process services operations of GE Capital. In 2005 it became an independent company with about 36,000 employees and US$1.04 billion in revenue (2008). It has operations around the world, including in LAC where it has delivery centers in Mexico and Guatemala.
Genpact employs about 2,500 people in Mexico (and 25,000 in India) and delivers a wide array of BPT including finance and accounting, collections and customer service, and content management (imaging and document management) to commercial, governmental, and healthcare clients. Mullan, Kenney and Dossani (op. cit. p. 33) describe some of the company’s locational advantages in Ciudad Juarez:
For some BPO [business process outsourcing] work, operating in Mexico provides Genpact advantages over India. First, Genpact Mexico can be extremely competitive in labor costs. For BPO work done in Mexico, Genpact tends to pay half as much as is paid for the same work in India. Its ability to do this stems largely from the fact that its facilities are located on the U.S. border because Ciudad Juárez has many high school and even less educated persons that speak English. India, in contrast, has an advantage in its plethora of highly-educated English speakers. Due to this unique attribute of the border population, Genpact Mexico is sometimes more cost-effective in BPO work because English-speaking employees can be hired at Mexican high school wages. The border also offers other advantages. It is able to draw upon the U.S. infrastructure of El Paso, Texas. Obviously, serving the Spanish speaking U.S. population is not a problem. Genpact is able to use a U.S. Post Office Box address and thus take advantage of the U.S. Postal Service, rather than private couriers. This increases the confidence of U.S. customers and clients.
Source: Mullan, Kenney and Dossani’s (op. cit and company’s website).
<< India: Latin America’s Next Big Thing?110
throughout the region that target these activities, particularly in the area of software.
In 2003, for instance, Mexico launched a program to promote IT services based on providing grants and certification to local firms (Prosoft). Brazil has had a number of initiatives in place since the early 1990s that combine government procurement, tax incentives, grants, and financing. These initiatives were revamped in 2003 when software was selected as one of the priority sectors in the country’s new industrial policy (Brazil Federal Government 2003). Chile, in turn, focuses more broadly on “high-tech” investments, but uses initiatives such as CORFO’s (Chile Economic Development Agency) Invest Chile Program to provide grants to foreign investors in the area of IT and BPT services.7
As valuable as these initiatives might be, we need to cut through the hype and take a more detached look before supporting the commit-ment of substantial public resources to these activities. A few sobering comments are in order. As mentioned earlier, India’s combination of policies, resources, and circumstances can hardly be replicated in the region. Furthermore, and, as discussed in Chapter I, despite the impres-sive global success of India’s IT-BPT services, the sector’s contribution to India’s growth and particularly to job creation has been disappointing. This should not be surprising, since these sectors account for just a small fraction of world trade. Reliable and updated estimates are hard to come by, but a WTO estimate for 2003 put the combined world exports of IT and BPT at US$494.2 billion (WTO 2005), or roughly 6.6 percent of world merchandise exports—hardly a new development panacea.
More important than these facts is the dearth of analyses that would give us robust answers to hard, technical questions. What are the market failures that justify putting government money in this sector and not in others? What are the expected social returns? For instance, can we be sure that government intervention can prevent capture by
7 For a more detailed analysis of Mexico’s Prosoft see Mullan, Kenney and Dos-sani op. cit. For Chile see http://www.investchile.cl/incjs/download.aspx?glb_cod_nodo=20080827173707&hdd_nom_archivo=Chile, Nearshore Platform for BPO and IT Services.pdf.
111The Competitive Challenges >>
special interests which often undermine even the most technically sound interventions?
These are notoriously difficult questions to answer, but even if we do not get full answers, just the effort to address them might provide valuable information that could save substantial public resources. The fact that most LAC countries face insurmountable size constraints to go beyond a niche strategy in IT-BPT services only makes this effort more valuable. Bear in mind that we are not arguing that there are no opportunities and that governments should not keep a watchful eye to make sure they are taken advantage of. We are only urging a more careful analysis before governments commit more resources.
Although it is beyond the scope of this report to offer such an analy-sis, it would appear that the sector’s main constraint—a limited supply of engineers and other college graduates—can only be addressed by policies that correct long-standing deficiencies in LAC’s educational sector. This key constraint can hardly be solved by sector-specific policies alone. Such policies usually come in all shapes and formats, but lack a proper evalua-tion of costs, risks, and benefits.
For, instance, A.T. Kearney (2009, p.17), when advising the region on how to promote the sector, recommends: (a) increase LAC governments’ direct support to the industry via tax incentives and investment promotion; (b) increase coordination between government, industry, and academia; (c) “coordinate efforts across countries to avoid market cannibalization and incentivize presence of single player in multiple countries”; and (d) “promote the right sector and right players with a plan—identify sector, lure the global leading players, build scale and develop sector.”
Even though some of these ideas make a lot of technical sense, it is exactly in this kind of policy advice where the devil is in the details, particularly in the political economy details. Without a more robust jus-tification, this recipe could be easily extended to other sectors and, as we know too well, LAC governments do not have unlimited resources (even if sometimes they behave as if they did).
There are, however, other sector-specific policies whose technical justification is widely acknowledged and that carry fewer implementa-tion risks. For example, when the objective is to build a critical mass

<< India: Latin America’s Next Big Thing?112
of skilled labor, it should not be assumed that the stock of specialized human capital must all be national. Foreigners can provide an initial pool of skills in certain areas and establish seeds for training and trans-ferring know-how. Yet, there are still a lot of restrictions in LAC on the use of foreign professional services such as engineering and other technical services.
Figure 32 compares a sample of countries in terms of an index of restrictions for professional services.8 The index, developed by Nguyen-Hong (2000), is calculated separately for domestic and foreign suppliers. The foreign index measures restrictions that hinder foreign suppliers from entering and operating in an economy. The domestic index presents restric-tions that are applied to domestic suppliers. The tighter the restriction, the higher the score. The difference between the foreign and domestic index scores is a measure of discrimination against foreigners.
As can be seen, restrictions imposed on foreign professionals (rep-resented by the bars) are much higher in the LAC countries (shaded in grey) than in India. Likewise, levels of discrimination against foreigners (represented by the dots) are also higher in LAC than in India. It is impor-tant to stress that restrictions on importing certain services, in this case, professional services, could be hindering the prospects of exporting other type of services, such as IT services. Clearly, LAC will be able to accumu-late specialized human capital much faster if these restrictions are lifted.9
The restrictions on foreign professionals are part of a broader issue involving the liberalization of service imports. This may sound as if it has nothing to do with the ability of the region to export services, but many services are used as inputs for other sectors, including the service sec-tor itself, and their inefficient provision may act like a tax on production, limiting output or reducing competitiveness.
8 The index accounts for aspects such as licensing and accreditation of professionals, activi-ties reserved by law to the profession, nationality or citizenship requirements, residency and local presence requirements, advertising, marketing and solicitation, etc.9 The argument that the barriers on trade in services in LAC are still high is corroborated by the Mullan, Kenney and Dossani (op. cit.) account of the experience of the Indian IT firm, TCS, in Mexico. According to the company, it takes three months to get visas for Indian employees to travel to Mexico.
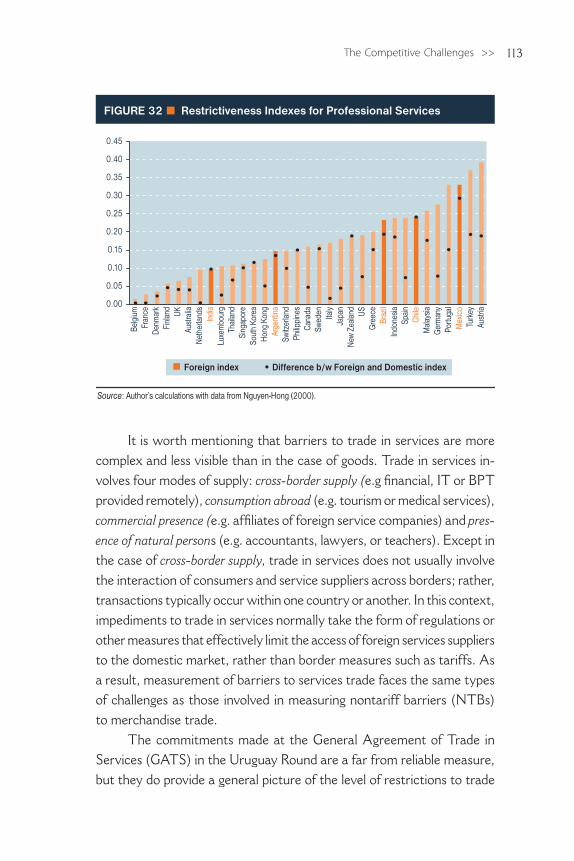
113The Competitive Challenges >>
It is worth mentioning that barriers to trade in services are more complex and less visible than in the case of goods. Trade in services in-volves four modes of supply: cross-border supply (e.g financial, IT or BPT provided remotely), consumption abroad (e.g. tourism or medical services), commercial presence (e.g. affiliates of foreign service companies) and pres-ence of natural persons (e.g. accountants, lawyers, or teachers). Except in the case of cross-border supply, trade in services does not usually involve the interaction of consumers and service suppliers across borders; rather, transactions typically occur within one country or another. In this context, impediments to trade in services normally take the form of regulations or other measures that effectively limit the access of foreign services suppliers to the domestic market, rather than border measures such as tariffs. As a result, measurement of barriers to services trade faces the same types of challenges as those involved in measuring nontariff barriers (NTBs) to merchandise trade.
The commitments made at the General Agreement of Trade in Services (GATS) in the Uruguay Round are a far from reliable measure, but they do provide a general picture of the level of restrictions to trade
0.00
0.05
0.10
0.15
0.20
0.25
0.30
0.35
0.40
0.45Be
lgiu
mFr
ance
Denm
ark
Finl
and
UKAu
stra
liaNe
ther
land
sIn
dia
Luxe
mbo
urg
Thai
land
Sing
apor
eSo
uth
Kore
aH
ong
Kong
Arge
ntin
aSw
itzer
land
Philip
pine
sCa
nada
Swed
en Italy
Japa
nNe
w Ze
alan
dUS
Gre
ece
Braz
ilIn
done
siaSp
ain
Chile
Mal
aysia
Ger
man
yPo
rtuga
lM
exic
oTu
rkey
Aust
ria
FIGURE 32 � Restrictiveness Indexes for Professional Services
Source: Author’s calculations with data from Nguyen-Hong (2000).
Difference b/w Foreign and Domestic indexForeign index
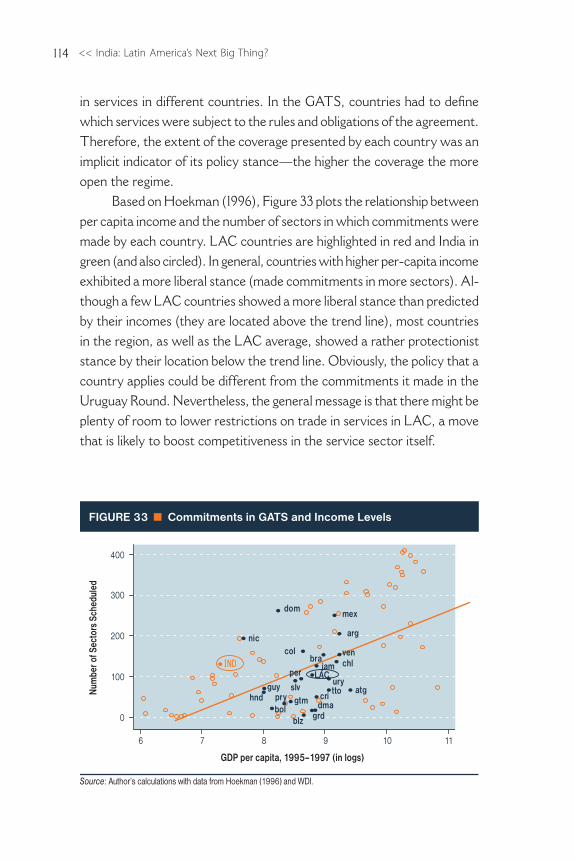
<< India: Latin America’s Next Big Thing?114
in services in different countries. In the GATS, countries had to define which services were subject to the rules and obligations of the agreement. Therefore, the extent of the coverage presented by each country was an implicit indicator of its policy stance—the higher the coverage the more open the regime.
Based on Hoekman (1996), Figure 33 plots the relationship between per capita income and the number of sectors in which commitments were made by each country. LAC countries are highlighted in red and India in green (and also circled). In general, countries with higher per-capita income exhibited a more liberal stance (made commitments in more sectors). Al-though a few LAC countries showed a more liberal stance than predicted by their incomes (they are located above the trend line), most countries in the region, as well as the LAC average, showed a rather protectionist stance by their location below the trend line. Obviously, the policy that a country applies could be different from the commitments it made in the Uruguay Round. Nevertheless, the general message is that there might be plenty of room to lower restrictions on trade in services in LAC, a move that is likely to boost competitiveness in the service sector itself.
0
100
200
300
400
6 7 8 9 10 11
dom mex
arg
venchlbra
col
jam
nic
IND
guyhnd
uryatgtto
per
slvgtm cri
dmagrdblz
bolpry
GDP per capita, 1995–1997 (in logs)
LAC
Num
ber o
f Sec
tors
Sch
edul
ed
Source: Author’s calculations with data from Hoekman (1996) and WDI.
FIGURE 33 � Commitments in GATS and Income Levels
115The Competitive Challenges >>
Another example of a less risky sector-specific policy is the removal of anti-export biases against the export of services, which are common in countries of the region. This bias is associated with the ambiguity and lack of definition in the treatment of exporters of services (Prieto 2003). Generally, institutions in charge of implementing international trade procedures and guidelines (i.e. Central Banks, National Custom Systems, etc.) have a long tradition of regulating trade in goods. Regula- tion of trade in services, however, is much more recent. Given the intan-gibility of services trade, the formalization of many of these transactions is not always easy. In order to address this challenge, these institu- tions have often imposed def initions of trade in services that are overly restrictive, leaving a large bulk of services transactions in the informal sector, which causes many service exporters to lose potential benefits.
A similar problem arises in meeting financial needs. Normally the only financial products available for trade in services were designed for merchandise trade, and thus are inadequate for satisfying the specific demands of services. In particular, banks require guarantees in physical assets or output of economic activity that are not possible for at least several services industries. This hampers access to adequate financing and inhibits services trade. Addressing these shortcomings is likely to help foster the export of services in general without having to select a specific sector in particular.
Manufacturing
As discussed in Chapter 1, judging by India’s current participation in world manufacturing exports, the country does not seem to pose a major challenge to LAC’s manufacturers. Yet, a careful look at India’s recent export trends, factor endowments, and its policy and political economy constraints suggest that current exports do not provide the whole picture. All these factors point in the direction of India having both the potential and the political imperative to be a major exporter of manufacturing goods and, therefore, being a force to reckon with in the not so distant future.
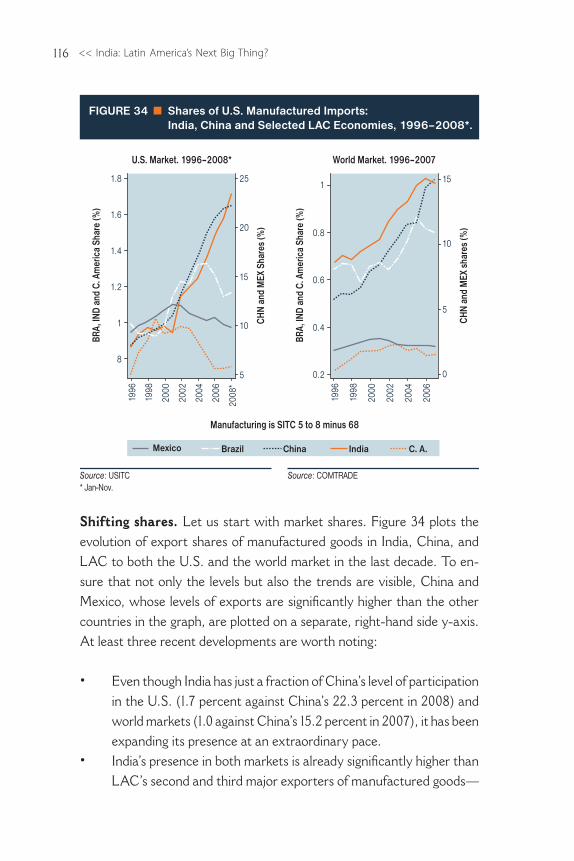
<< India: Latin America’s Next Big Thing?116
Shifting shares. Let us start with market shares. Figure 34 plots the evolution of export shares of manufactured goods in India, China, and LAC to both the U.S. and the world market in the last decade. To en-sure that not only the levels but also the trends are visible, China and Mexico, whose levels of exports are significantly higher than the other countries in the graph, are plotted on a separate, right-hand side y-axis. At least three recent developments are worth noting:
• Even though India has just a fraction of China’s level of participation in the U.S. (1.7 percent against China’s 22.3 percent in 2008) and world markets (1.0 against China’s 15.2 percent in 2007), it has been expanding its presence at an extraordinary pace.
• India’s presence in both markets is already significantly higher than LAC’s second and third major exporters of manufactured goods—
FIGURE 34 � Shares of U.S. Manufactured Imports: India, China and Selected LAC Economies, 1996–2008*.
ChinaMexico India C. A.
Manufacturing is SITC 5 to 8 minus 68
BRA,
IND
and
C. A
mer
ica
Shar
e (%
)
BRA,
IND
and
C. A
mer
ica
Shar
e (%
)
8
1.4
1.2
1
1.6
1.8
1996
1998
2000
2002
2004
2006
2008
*
5
10
15
20
25
U.S. Market. 1996–2008*
Source: USITC* Jan-Nov.
Source: COMTRADE
CHN
and
MEX
Sha
res
(%)
0.6
0.4
0.2
0.8
1
1996
1998
2000
2002
2004
2006
5
10
0
15
World Market. 1996–2007
CHN
and
MEX
sha
res
(%)
Brazil
117The Competitive Challenges >>
Brazil and Central America. Even though this presence is still signifi-cantly smaller than Mexico’s, it has been following a steep upward trend, whereas Mexico’s seems to have peaked in the early 2000s.
Figures 35 and 36 break down India’s participation into four different categories of industries, which roughly reflect differences in the use of fac-tors of production such as labor, capital and R&D (see Lall 2000): i.e. low technology (e.g. textile, apparel, footwear and toys), medium technology (e.g. automotive, basic machinery and basic chemicals) and high technol-ogy (e.g. electronics, telecommunication and pharmaceuticals) industries and resource-based sectors (e.g. foods processing and basic metals).10
It is immediately clear that whereas China shows a strong and ever-growing presence in all categories, India’s performance is more uneven, with promising results in low and high technology goods—particularly in the former—and with lackluster performance in the other two categories.
In both the U.S. and the world market, India’s exports of low- technology, labor-intensive goods are driven mainly by textiles and ap-parel. Even though its shares are still a long way from the levels achieved by China (a 3 percent market share against China’s 43 percent in the U.S. in 2008 and a 2.2 percent market share against China’s 28 percent in the world market in 2007), they are increasing at a very fast pace. This performance looks particularly impressive when compared to LAC’s. India’s share in the U.S. market (3 percent) is twice that of Brazil’s (1.5 percent), significantly higher than Central America’s (2.4 percent), and fast approaching Mexico’s dwindling share (7 percent).
In high-tech goods, India’s exports are heavily concentrated in pharmaceuticals, particularly in the U.S. market (54 percent of the total in 2008), and to a lesser extent in IT and telecommunication goods, par-ticularly for markets outside the U.S. Overall, India still has a very small
10 This type of classification does not entirely account for the ever growing process of vertical integration or fragmentation, whereby countries specialize in different stages of the manufacturing process. This phenomenon complicates the task of pinpointing the goods factor intensity, particularly when goods are classified at a high level of aggregation (SITC 3 digits, in the case in point), but does not completely invalidate the analytical relevance of this type of exercise.
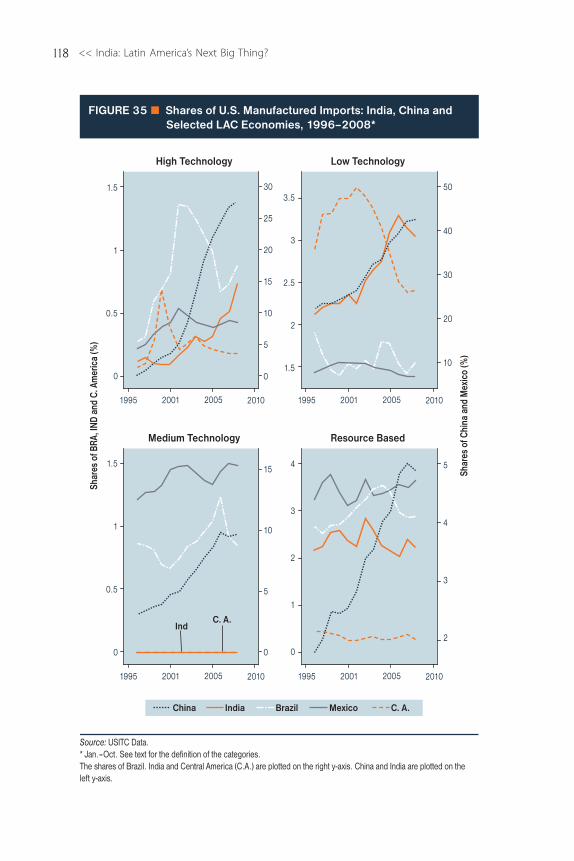
<< India: Latin America’s Next Big Thing?118
Shar
es o
f BRA
, IN
D an
d C.
Am
eric
a (%
)
0
0.5
1
1.5
0
0.5
1
1.5
3.5
2.5
1.5
2
3
30
25
20
10
0
5
15
50
10
20
30
40
1995 2001 2005 20101995 2001 2005 2010
1995 2001 2005 20101995 2001 2005 2010
High Technology Low Technology
4
2
0
1
3
5
10
0
15 5
4
2
3
Medium Technology Resource Based
Source: USITC Data.* Jan.–Oct. See text for the definition of the categories.The shares of Brazil. India and Central America (C.A.) are plotted on the right y-axis. China and India are plotted on the left y-axis.
FIGURE 35 Shares of U.S. Manufactured Imports: India, China and Selected LAC Economies, 1996–2008*
Shar
es o
f Chi
na a
nd M
exic
o (%
)
C. A.Ind
India C. A.Brazil MexicoChina
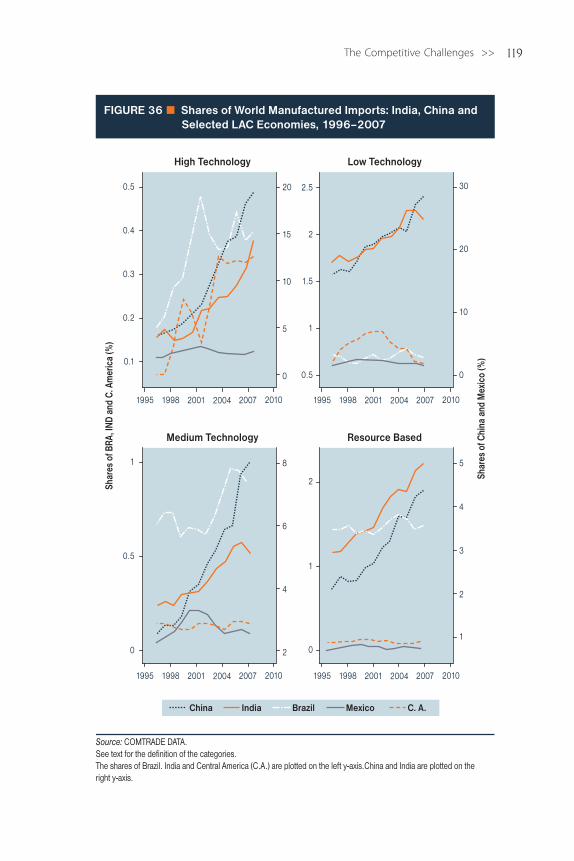
119The Competitive Challenges >>
Chn
Chn
Chn
Chn
Mex
MexMex
MexC. A.
C. A.
C. A.
C. A.
Bra
Bra Bra
Bra
Ind
Ind
Ind
Ind
0.1
0.2
0.3
0.4
0.5 2.5
1.5
0.5
1
2
20
10
0
5
15
30
10
0
20
1995 1998 2001 2004 2007 2010 1995 1998 2001 2004 2007 2010
1995 1998 2001 2004 2007 2010 1995 1998 2001 2004 2007 2010
High Technology Low Technology
0
0.5
1
2
1
0
8
4
2
6
5
4
2
1
3
Medium Technology Resource Based
Source: COMTRADE DATA.See text for the definition of the categories.The shares of Brazil. India and Central America (C.A.) are plotted on the left y-axis.China and India are plotted on the right y-axis.
FIGURE 36 Shares of World Manufactured Imports: India, China and Selected LAC Economies, 1996–2007
Shar
es o
f Chi
na a
nd M
exic
o (%
)
Shar
es o
f BRA
, IN
D an
d C.
Am
eric
a (%
)
India C. A.Brazil MexicoChina
<< India: Latin America’s Next Big Thing?120
share of the U.S. (0.7 percent) and world market (0.4 percent), but the trend seems promising and, again, its share contrasts with LAC, even though India’s superiority in this case is not as clear cut as in low-tech goods. In the all important U.S. market, Mexico still has a strong presence (12 percent in 2008), but its share is declining, after being overtaken by China in the early 2000s. Central America’s participation, which peaked at a low 0.6 percent in 1999, is also in decline, and Brazil, which has shown some signs of dynamism in the early 2000s with a share reaching 1.4 percent, is too dependent on volatile exports of small airplanes. The picture in world markets definitely looks better for LAC, at least for Brazil and Central America, which have managed to hold on to gains made in the early 2000s. But, unlike India or China, they stabilized their gains at very low levels of participation.
Although there are some contrasts between the U.S. and world market in regard to medium technology and resource-based goods, overall India has yet to show that it can have a significant presence in these areas, which, coincidentally, are those where LAC performs best. This is particularly true for the U.S. market, where India’s participation in medium technology goods is virtually non-existent and where its 2 percent share of resource-based products is not negligible, but is explained basically by diamonds. LAC, in turn, shows signs of resilience in these categories in the face of China’s ever-increasing pressure. This is par-ticularly the case with Mexico, which has managed to slightly increase its already solid participation in medium-tech goods in the period. The picture in world markets is similar, except that India’s participation in medium technology goods, which is driven by exports of steel, vehicles, and automobile parts to Europe and East Asian markets, looks much more promising.
These data paint a broad picture of both the trend and the composi-tion of India’s challenge to LAC in U.S. and world markets, but they do not address the issue of causality. Are India’s products directly dislocating LAC producers in those markets? Or have its gains been made exclusively at the expense of other producers? Or to put it in another way, are India’s and LAC’s market shares in any way (negatively) correlated? As shown
121The Competitive Challenges >>
in Figures 35 and 36, this may be a relevant issue, particularly for high and low technology products.
To try to answer this question, we apply two methodologies. The first is based on a variation of the traditional constant market approach as suggested by Batista (2005). The intuition behind it is that the growth of LAC’s exports can be decomposed into the sum of: (i) the growth of world exports, (ii) the growth differential between India’s and LAC’s exports and, (iii) the growth differential between LAC’s and the rest of the world’s exports.11
In this framework, a market share loss for LAC (in any 5-digit, SITC product) is interpreted as a reflection of the fact that its exports have grown less than world exports because they were (i) less dynamic than those of India and/or (ii) less dynamic than those of the rest of the world. We measure the variation between the average export values of 1996–07 and 2007–08 and we focus on the U.S. market, where more recent data is available.
Figure 37 presents the losses due to component (i), i.e., market share losses that can be attributed directly to India, measured as a per-centage of total LAC exports in 2007–08. To give some perspective to
11 Formally, LAC’s export growth, measured in terms of 2007/08 exports, can be decom-posed according to the following expression:
1 11
1
1996 7
2007 8−
= −
+
X
X mLAC
LAC WORLD
/
/
+ ⋅
+−
X
M m
XIndia
India
LAC2007 8
2007 8
199611
/
/
//
/
/
/
7
2007 8
2007 8
2007 8
11
X
X
M
LAC
REST
+
⋅+ mm
X
XREST
LAC
LAC
−
1996 7
2007 8
/
/
where,X ij are the exports of the country/region j in the period i.M i are the world exports in the period i. mj is the growth rate for exports in the country/region j between the average of 1996 and 1997 and the average of 2007 and 2008, measured in own 2007/8 exports. The results shown in Figure 37 are given by (b).
(a) World exports growth
(c) gains or losses to the rest of the world
(b) gains or losses to India
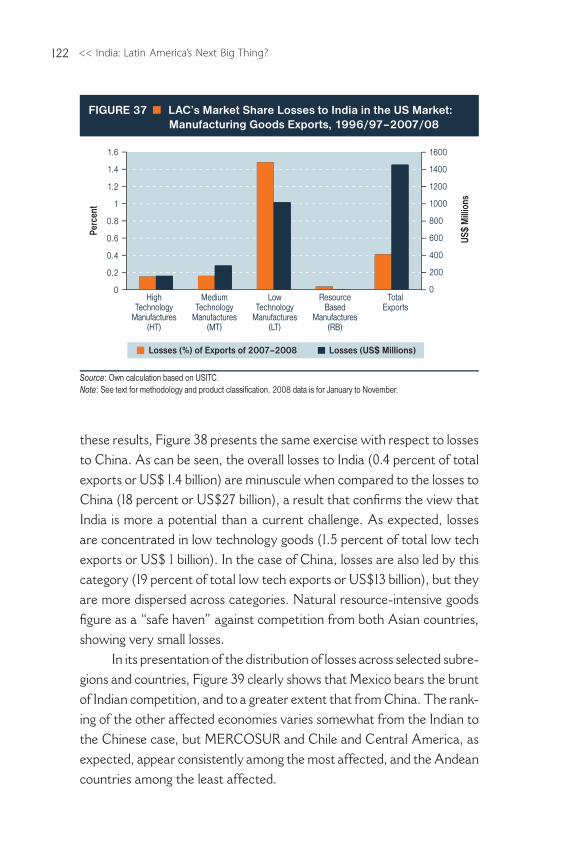
<< India: Latin America’s Next Big Thing?122
these results, Figure 38 presents the same exercise with respect to losses to China. As can be seen, the overall losses to India (0.4 percent of total exports or US$ 1.4 billion) are minuscule when compared to the losses to China (18 percent or US$27 billion), a result that confirms the view that India is more a potential than a current challenge. As expected, losses are concentrated in low technology goods (1.5 percent of total low tech exports or US$ 1 billion). In the case of China, losses are also led by this category (19 percent of total low tech exports or US$13 billion), but they are more dispersed across categories. Natural resource-intensive goods figure as a “safe haven” against competition from both Asian countries, showing very small losses.
In its presentation of the distribution of losses across selected subre-gions and countries, Figure 39 clearly shows that Mexico bears the brunt of Indian competition, and to a greater extent that from China. The rank-ing of the other affected economies varies somewhat from the Indian to the Chinese case, but MERCOSUR and Chile and Central America, as expected, appear consistently among the most affected, and the Andean countries among the least affected.
FIGURE 37 � LAC’s Market Share Losses to India in the US Market:Manufacturing Goods Exports, 1996/97–2007/08
1.6 1600
1400
1200
1000
800
600
400
200
0
1.4
1.2
1
0.8
0.6
0.4
0.2
0
Perc
ent
US$
Mill
ions
HighTechnology
Manufactures(HT)
MediumTechnology
Manufactures(MT)
LowTechnology
Manufactures(LT)
ResourceBased
Manufactures(RB)
TotalExports
Source: Own calculation based on USITC.Note: See text for methodology and product classification. 2008 data is for January to November.
Losses (US$ Millions)Losses (%) of Exports of 2007–2008
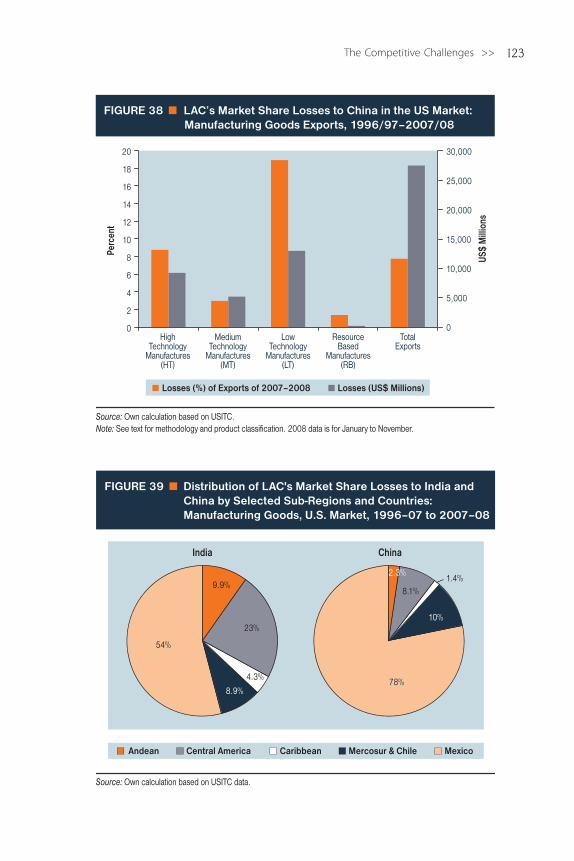
123The Competitive Challenges >>
Losses (%) of Exports of 2007–2008 Losses (US$ Millions)
20 30,000
25,000
20,000
15,000
10,000
5,000
0
18
16
14
12
10
8
6
4
2
0
Perc
ent
US$
Mill
ions
HighTechnology
Manufactures(HT)
MediumTechnology
Manufactures(MT)
LowTechnology
Manufactures(LT)
ResourceBased
Manufactures(RB)
TotalExports
Source: Own calculation based on USITC.Note: See text for methodology and product classification. 2008 data is for January to November.
FIGURE 38 � LAC’s Market Share Losses to China in the US Market:Manufacturing Goods Exports, 1996/97–2007/08
Andean Caribbean Mexico
Source: Own calculation based on USITC data.
FIGURE 39 � Distribution of LAC's Market Share Losses to India and China by Selected Sub-Regions and Countries:Manufacturing Goods, U.S. Market, 1996–07 to 2007–08
India China
9.9%8.1%
1.4%
78%
10%23%
4.3%
8.9%
2.3%
54%
Central America Mercosur & Chile
<< India: Latin America’s Next Big Thing?124
The other methodology we use to develop a better sense of the causality issue is based on a simple econometric model that tests more rigorously if there is a negative and statistically significant correlation be-tween India’s and China’s market shares and those of Mexico’s and LAC’s three main manufacturing subregions—MERCOSUR and Chile, Central America, and the Andean countries. This is done for the U.S. market at a more disaggregated sector level, covering the 2000–08 period.12 The model tells us not only which sectors of each subregion had a negative market share correlation with either China’s or India’s market shares (or both) over the period of analysis, but also how high these correlations were.
In Figures 40a to 40d, we use these negative correlations to estimate what would be the percentage impact on the market share of each sector of each subregion of a 10 percent increase of the market share of either India or China. A number of findings come out of these exercises, which mostly confirms the arguments we made before. First, the breadth and scope of India’s competition with LAC manufacturing is a far cry from that of China’s. In every subregion, the sectors whose market share is negatively correlated with China’s, and, therefore, which are likely to be facing direct competition from Chinese goods, greatly outnumber those that are likely to face a similar situation with India.
Second, the average percentage impact on market shares for all subregions is significantly higher in the case of China than India. For instance, for Mexico (Figure 40b), the average negative impact of a 10 percent increase in China’s market share is 3.9 percent whereas the same figure for a 10 percent increase in India’s market share is 0.5 percent. This wide gap also holds in the results for the other subregions.
And third, whereas in the case of China the most exposed and sensi-tive sectors across the subregions can be easily described as labor-intensive, in the case of India, the situation is not so clear cut, except perhaps for the case of “silk and yarns and woven fabrics” and “special woven fabrics,” which appear in most subregions’ lists. Most of the other sectors could be generally described as resource-intensive, such as cement and nickel, glass, metal, and rubber products. This might appear to contradict the results
12 Two digits of the harmonized system. See technical appendix for details.
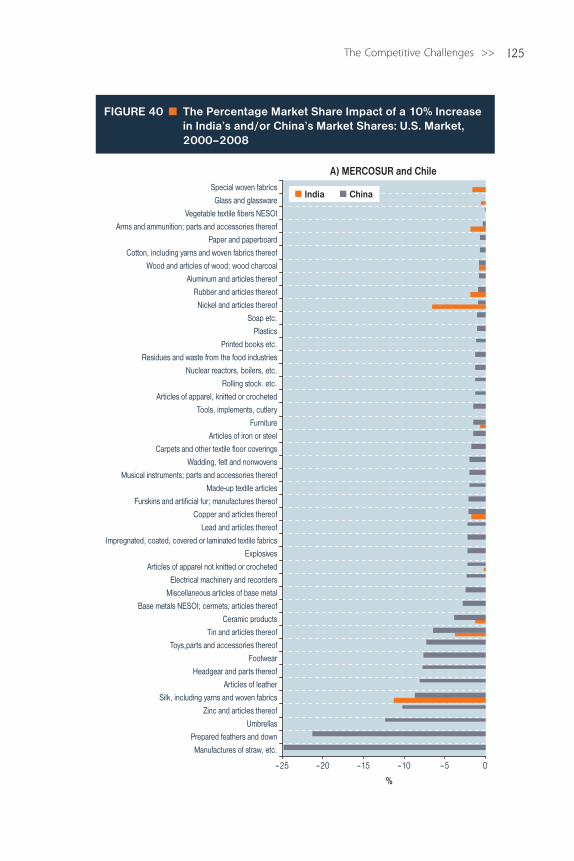
125The Competitive Challenges >>
Special woven fabrics
0–5–10–15–25
%
–20
FIGURE 40 The Percentage Market Share Impact of a 10% Increase in India’s and/or China’s Market Shares: U.S. Market, 2000–2008
A) MERCOSUR and Chile
Glass and glassware
Vegetable textile fibers NESOI
Arms and ammunition; parts and accessories thereof
Paper and paperboard
Cotton, including yarns and woven fabrics thereof
Wood and articles of wood; wood charcoal
Aluminum and articles thereof
Rubber and articles thereof
Nickel and articles thereof
Soap etc.
Plastics
Printed books etc.
Residues and waste from the food industries
Nuclear reactors, boilers, etc.
Rolling stock. etc.
Articles of apparel, knitted or crocheted
Tools, implements, cutlery
Furniture
Articles of iron or steel
Carpets and other textile floor coverings
Wadding, felt and nonwovens
Musical instruments; parts and accessories thereof
Made-up textile articles
Furskins and artificial fur; manufactures thereof
Copper and articles thereof
Lead and articles thereof
Impregnated, coated, covered or laminated textile fabrics
Explosives
Articles of apparel not knitted or crocheted
Electrical machinery and recorders
Miscellaneous articles of base metal
Base metals NESOI; cermets; articles thereof
Ceramic products
Tin and articles thereof
Toys,parts and accessories thereof
Footwear
Headgear and parts thereof
Articles of leather
Silk, including yarns and woven fabrics
Zinc and articles thereof
Manufactures of straw, etc.
Prepared feathers and down
Umbrellas
India China
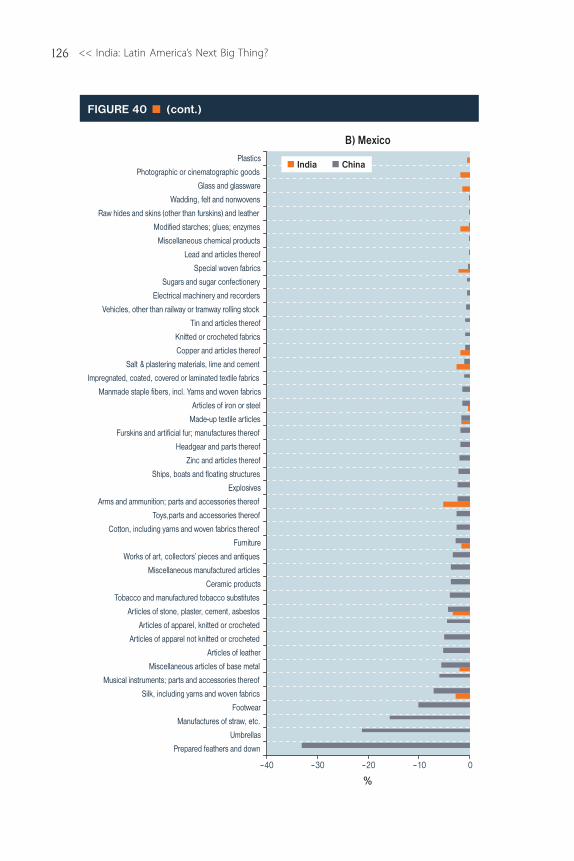
<< India: Latin America’s Next Big Thing?126
0–10–20–40
%–30
B) MexicoPlastics
Photographic or cinematographic goods
Glass and glassware
Wadding, felt and nonwovens
Raw hides and skins (other than furskins) and leather
Modified starches; glues; enzymes
Miscellaneous chemical products
Lead and articles thereof
Special woven fabrics
Sugars and sugar confectionery
Electrical machinery and recorders
Vehicles, other than railway or tramway rolling stock
Tin and articles thereof
Knitted or crocheted fabrics
Copper and articles thereof
Salt & plastering materials, lime and cement
Impregnated, coated, covered or laminated textile fabrics
Manmade staple fibers, incl. Yarns and woven fabrics
Articles of iron or steel
Made-up textile articles
Furskins and artificial fur; manufactures thereof
Headgear and parts thereof
Zinc and articles thereof
Ships, boats and floating structures
Explosives
Arms and ammunition; parts and accessories thereof
Toys,parts and accessories thereof
Cotton, including yarns and woven fabrics thereof
Furniture
Works of art, collectors’ pieces and antiques
Miscellaneous manufactured articles
Ceramic products
Tobacco and manufactured tobacco substitutes
Articles of stone, plaster, cement, asbestos
Articles of apparel, knitted or crocheted
Articles of apparel not knitted or crocheted
Articles of leather
Miscellaneous articles of base metal
Musical instruments; parts and accessories thereof
Silk, including yarns and woven fabrics
Footwear
Prepared feathers and down
Umbrellas
Manufactures of straw, etc.
FIGURE 40 � (cont.)
India China
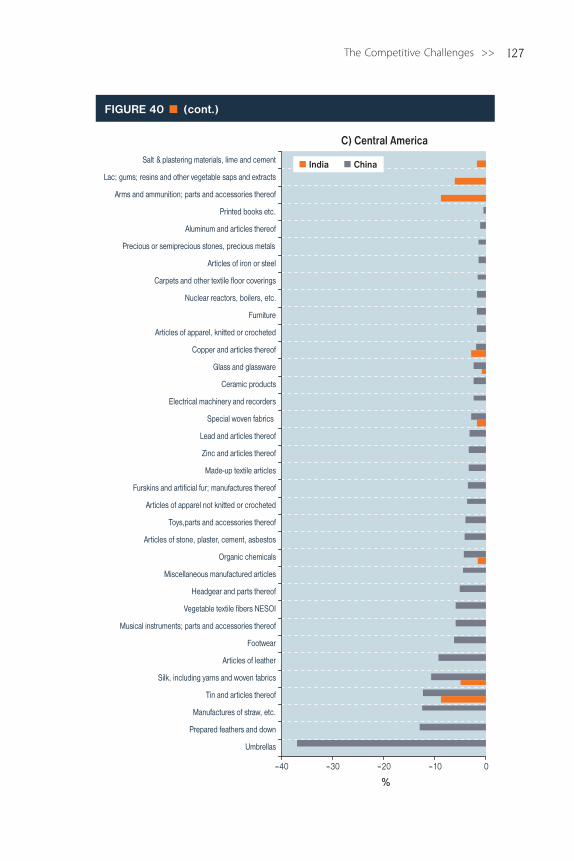
127The Competitive Challenges >>
Salt & plastering materials, lime and cement
0–10–20–40
%–30
C) Central America
Lac; gums; resins and other vegetable saps and extracts
Arms and ammunition; parts and accessories thereof
Printed books etc.
Aluminum and articles thereof
Precious or semiprecious stones, precious metals
Articles of iron or steel
Carpets and other textile floor coverings
Nuclear reactors, boilers, etc.
Furniture
Articles of apparel, knitted or crocheted
Copper and articles thereof
Glass and glassware
Ceramic products
Electrical machinery and recorders
Special woven fabrics
Lead and articles thereof
Zinc and articles thereof
Made-up textile articles
Furskins and artificial fur; manufactures thereof
Articles of apparel not knitted or crocheted
Toys,parts and accessories thereof
Articles of stone, plaster, cement, asbestos
Organic chemicals
Miscellaneous manufactured articles
Headgear and parts thereof
Vegetable textile fibers NESOI
Musical instruments; parts and accessories thereof
Footwear
Articles of leather
Silk, including yarns and woven fabrics
Tin and articles thereof
Manufactures of straw, etc.
Prepared feathers and down
Umbrellas
FIGURE 40 � (cont.)
India China
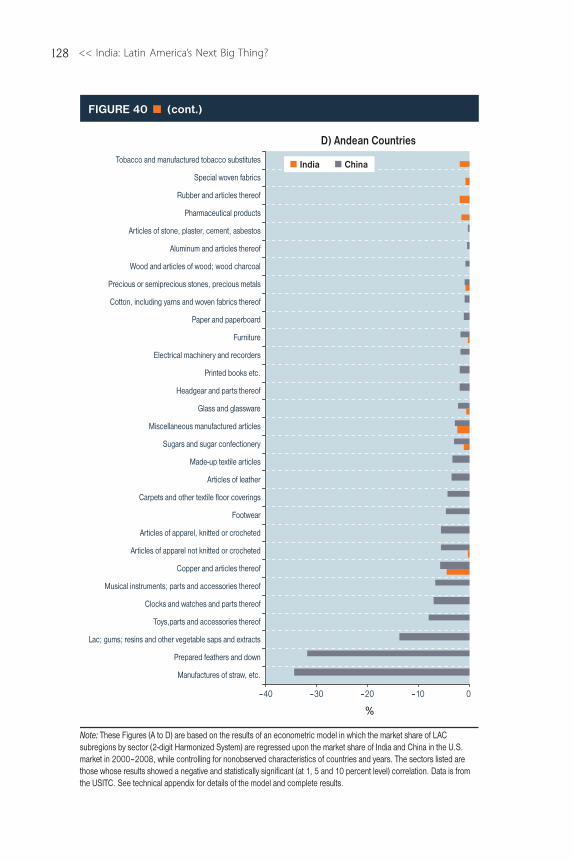
<< India: Latin America’s Next Big Thing?128
0–10–20–40
%
–30
D) Andean Countries
Manufactures of straw, etc.
Prepared feathers and down
Lac; gums; resins and other vegetable saps and extracts
Toys,parts and accessories thereof
Clocks and watches and parts thereof
Musical instruments; parts and accessories thereof
Copper and articles thereof
Articles of apparel not knitted or crocheted
Articles of apparel, knitted or crocheted
Footwear
Carpets and other textile floor coverings
Articles of leather
Made-up textile articles
Sugars and sugar confectionery
Miscellaneous manufactured articles
Glass and glassware
Headgear and parts thereof
Printed books etc.
Electrical machinery and recorders
Furniture
Paper and paperboard
Cotton, including yarns and woven fabrics thereof
Precious or semiprecious stones, precious metals
Wood and articles of wood; wood charcoal
Aluminum and articles thereof
Articles of stone, plaster, cement, asbestos
Pharmaceutical products
Rubber and articles thereof
Special woven fabrics
Tobacco and manufactured tobacco substitutes
Note: These Figures (A to D) are based on the results of an econometric model in which the market share of LAC subregions by sector (2-digit Harmonized System) are regressed upon the market share of India and China in the U.S. market in 2000–2008, while controlling for nonobserved characteristics of countries and years. The sectors listed are those whose results showed a negative and statistically significant (at 1, 5 and 10 percent level) correlation. Data is from the USITC. See technical appendix for details of the model and complete results.
FIGURE 40 � (cont.)
India China
129The Competitive Challenges >>
presented in Figure 37, where the labor-intensive sector experienced the biggest losses to India’s competition. But this exercise, unlike the other, does not take into account the importance or size of the market share of each sector in the subregions. It just reflects how sensitive each sec-tor is to changes in India’s or China’s market shares in the U.S. market, no matter how important these sectors are for the subregions’ exports.
Beyond the rear mirror. This barrage of data leaves little doubt that India’s competition with LAC manufacturers and the related dislocation so far has been limited, particularly when compared to the impact of China. It would be unwise, though, to write off India as a major competitor in the near future.
As shown earlier in this chapter, there are clear signs that India’s presence in categories such as high tech and labor-intensive goods has been increasing rapidly, both in U.S. and world markets. There are also strong signs yet to be captured by the trade data but visible in outward FDI flows (see Chapter 2) that India is likely to play a more important role in the so-called medium technology industries, particularly in the automobile sector. Domestic car firms such as Tata Motors and Reliance have been planning major inroads in world markets, especially through the acquisition of consolidated brands (see Box 3.3).
But above all, as we discussed at length in Chapter 1, India seems doomed to be a major exporter of labor-intensive goods because of a pow-erful combination of economic and political pressures. On the one hand, there are 1.1 billion people sitting on a limited amount of natural resources, most of them still working in low productivity jobs in agriculture; and on the other, there is the political pressure to generate higher productivity jobs, unlikely to be delivered by the high-skill service sectors, in order to reduce poverty levels that are still unsustainably high.
Why this potential has not yet been fully unleashed appears to be related to a number of binding constraints, also discussed at length in Chapter 1, ranging from labor regulations, to infrastructure, to hu-man capital. The burning question, then, is: Will India overcome these constraints? The country has already come a long way in reforming its policy regime, and despite the political challenges involved in tackling those
<< India: Latin America’s Next Big Thing?130
issues, particularly the labor law, there are no good grounds for ruling out this possibility. Quite the contrary, as shown by the government’s recent initiatives—particularly the National Highway Development Project, the Electricity Act of 2003, and the legislation creating special economics zones à la China—some of these constraints are already being addressed.13 Moreover, the results of India’s recent general election, held between April and May of 2009, seem to signal strong support for an agenda of market-oriented reforms, which is likely to be instrumental in helping the government to address those constraints.
How long this is going to take and when the effects on exports are going to kick in is anybody’s guess. The current global financial crisis only adds to the uncertainties surrounding these questions. But again, the slow but sure pace of India’s reforms, combined with the fact that labor-intensive manufacturing is one of the few, if not the only, options that India has to generate the jobs it needs to overcome poverty and deprivation,
13 The National Highway Development Project aims at upgrading India’a national highways to 4 to 6 lanes. The first phase of the project was approved in December 2000. See http://www.nhai.org/. The special economic zones are discussed in Box 1.3. The Electricity Act of 2003 offers a comprehensive framework to reform the energy sector, allowing for a bigger role for the private sector. See Wallack (2007) for the pros and cons of the act.
n Box 3.3 Jaguar & Land Rover bought by Tata
In March 2008, the Indian powerhouse Tata Motors bought Jaguar and Land Rover from the Ford Motor Company for US$2.3 billion. While Ford lost US$15 billion on these two brands in the past two years, Tata Motors Chairman Ratan Tata hailed them as “two iconic British brands with worldwide growth prospects.” Tata Motors, part of the Indian conglomerate Tata Group, made headlines in January 2008 when it unveiled the Nano, a US$2,500 hatchback model. Tata Motors is the world’s fourth largest truck manufacturer and the world’s second largest bus manufacturer with US$8.8 billion in revenues in 2007–08. The purchase of Jaguar and Land Rover from Ford marks two additions to their growing international portfolio, which includes Daewoo Commercial Vehicles Company of South Korea (acquired in 2004), a 21 percent stake in Spain’s Hispano Carrocera (acquired in 2005), a joint venture with Brazil’s Marcopolo (2006), and joint venture with Thailand’s Thornburi Automotive (2006). The symbolism of this purchase is not lost on Indians: “Their” companies now own icons of prestige that were once only the stuff of Bollywood movies.
Source: Buluswar, Gelman and Tynan (2009)
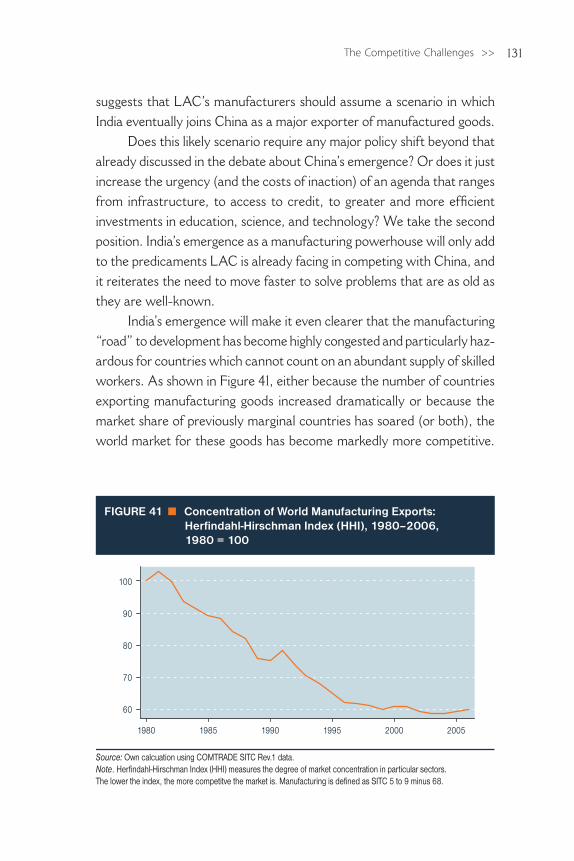
131The Competitive Challenges >>
suggests that LAC’s manufacturers should assume a scenario in which India eventually joins China as a major exporter of manufactured goods.
Does this likely scenario require any major policy shift beyond that already discussed in the debate about China’s emergence? Or does it just increase the urgency (and the costs of inaction) of an agenda that ranges from infrastructure, to access to credit, to greater and more efficient investments in education, science, and technology? We take the second position. India’s emergence as a manufacturing powerhouse will only add to the predicaments LAC is already facing in competing with China, and it reiterates the need to move faster to solve problems that are as old as they are well-known.
India’s emergence will make it even clearer that the manufacturing “road” to development has become highly congested and particularly haz-ardous for countries which cannot count on an abundant supply of skilled workers. As shown in Figure 41, either because the number of countries exporting manufacturing goods increased dramatically or because the market share of previously marginal countries has soared (or both), the world market for these goods has become markedly more competitive.
Source: Own calcuation using COMTRADE SITC Rev.1 data.Note. Herfindahl-Hirschman Index (HHI) measures the degree of market concentration in particular sectors.The lower the index, the more competitve the market is. Manufacturing is defined as SITC 5 to 9 minus 68.
FIGURE 41 � Concentration of World Manufacturing Exports: Herfindahl-Hirschman Index (HHI), 1980–2006, 1980 = 100
60
70
80
90
100
1980 1985 1990 1995 2000 2005
<< India: Latin America’s Next Big Thing?132
Market concentration between 1980 and 2005 fell by as much as 40 per-cent and India’s effect has not yet been seen.
What this crowded market means is that LAC’s opportunities for relying mostly on manufacturing to generate jobs and attain the status of a developed region—as many countries have done before and as China is doing now—are slim. The so-called fundamentals, particularly the relatively limited labor supply and the abundance of natural resources, are firmly stacked against the region.
However, this does not necessarily mean that we are marching to the tune predicted by trade models inspired by classical economist David Ricardo; that is, that the region’s future is limited to complete specializa-tion in agriculture and mining. The relatively large regional market, the opportunities to process and industrialize natural resources, and the region’s proximity to the U.S. market, not to mention the skills acquired during all those years of industrialization, seem to be assets powerful enough to ensure that manufacturing will remain an important activity in the region. How important it will be, though, hinges on the ability of the region’s governments to address the region’s most obvious shortcomings in its infrastructure and labor force.
133The Competitive Challenges >>
References
Aragón, Edgar, Marcia Campos and Anne Fouquet. 2007. “The Emergence of New Successful Export Activities in Mexico.” Inter-American Development Bank, Mimeo.
A.T. Kearney. (2009). “The Future of Outsourcing in Latin America.” Presentation made in the Second Conference of the Latin America and The Caribbean Trade and Investment Agencies II. San Salvador, April 23.
Batista, Jorge Chami (2005). Competition between Brazil and other ex-porting countries in the US market. A new extension of constant market share analysis. Discussion Paper of the Instituto de Economia da UFRJ. No 010/2005. Rio de Janeiro.
Brazil Federal Government. (2003). Direztrizes de Política Industrial, Tecnológica e de Comércio Exterior, Brasilia, DF: MDICE. www.mdic.gov.br. November.
Buluswar, Shashi, Tamy Gelman and Peter Tyna. (2009). “India’s Inte-gration into the Global Economy: Lessons and Opportunities for Latin America and the Caribbean”. Dalberg Global Development Advisors. Background paper prepared for the IADB report “India: Latin America’s Next Big Thing?”.
Freund, Caroline and Caglar Ozden.(2009). “The Effect of China’s Exports on Latin America Trade with the World.” In Daniel Lederman, Mar-celo Olarreaga, Guillermo Perry (eds.) China’s and India’s Challenge to Latin America: Opportunity or Threat? Washington: World Bank.
Hanson, Gordon H. and Raymond Robertson. (2008). “China and the Manufacturing Exports of Other Developing Countries.” NBER Working Papers 14497, National Bureau of Economic Research, Inc.
Hoekman, Bernard (1996). “Assessing the General Agreement on Trade in Services” in Will Martin, and L. Alan Winters (eds.) The Uruguay Round and the Developing Countries. Cambridge, U.K.: Cambridge University Press.
Koncz, Jennifer and Anne Flatness. (2008). “U.S. International Services Cross-Border Trade in 2007 and Services Supplied Through Affiliates in 2006.” Survey Of Current Business. Bureau of Economic Activity.
<< India: Latin America’s Next Big Thing?134
Lall, Sanjaya (2000). “The technological structure and performance of developing country manufactured exports, 1985–98.” Oxford De-velopment Studies, 28(3) p.337–369.
McKinsey (2005). The emerging global labor market: Part I – The demand for offshore talent in services. Washington, D.C.: MGI.
Moreira, Mauricio Mesquita. (2007). “Fear of China: Is There a Future for Manufacturing in Latin America?” World Development Vol. 35, No. 3, pp. 355–376, 2007.
Mullan, Jessica, Martin Kenney and Rafiq Dossani. (2008). “Will It Be a Winner Takes All in the Increased Offshoring IT-based Activities: The Current State of Play for Latin America.” Background paper prepared for the IADB report “India: Latin America’s Next Big Thing?”.
NASSCOM. (2009). Strategic Review 2009. India’s National Association of Software and Services Companies. http://www.nasscom.org/Nasscom/templates/NormalPage.aspx?id=55816.
Nguyen-Hong, Due. (2000). “Restrictions on Trade in Professional Ser-vices.” Productivity Commission Staff Research Paper, Ausinfo, Canberra, August.
OECD. (2005). OECD Information Technology Outlook 2004, Chapter 2, Globalisation of the ICT sectors and International sourcing of ICT-enabled services, Paris: Organization for Economic Co-operation and Development.
Prieto, Francisco. (2003). “Fomento y Diversificación de la Exportaciones de Servicios” Serie Comercio Internacional 38, CEPAL, Santiago de Chile.
Rojas, Yazmin. (2007). “Call Centers in the Northeast of Mexico.” International Business Articles, April, May and June 2007. U.S. Department of Commerce.
Snoeck, Michele, Carlos Casacuberta, Rosario Domingo, Hector Pastori and Lucia Pittaluga. (2007). “The Emergence of New Successful Export Activities in Uruguay.” IDB working paper, unpublished.
Tholons. (2009). “Argentina Outsourcing – Creating a Roadmap to Suc-cess.” Tholons Advisory, Investments and Research. Mimeo.
135The Competitive Challenges >>
Wallack, Jessica. (2007). “A Tale of Two Transitions: From Public Toward Private Provision of Infrastructure in India and Latin America.” Center for Development Finance, Institute for Financial and Management Research, Chennai, India. Background paper prepared for the IADB report “India: Latin America’s Next Big Thing?”.
WTO. (2005). World Trade Report 2005. Exploring the Links Between Trade, Standards and the WTO. Geneva, Switzerland: World Trade Organization.
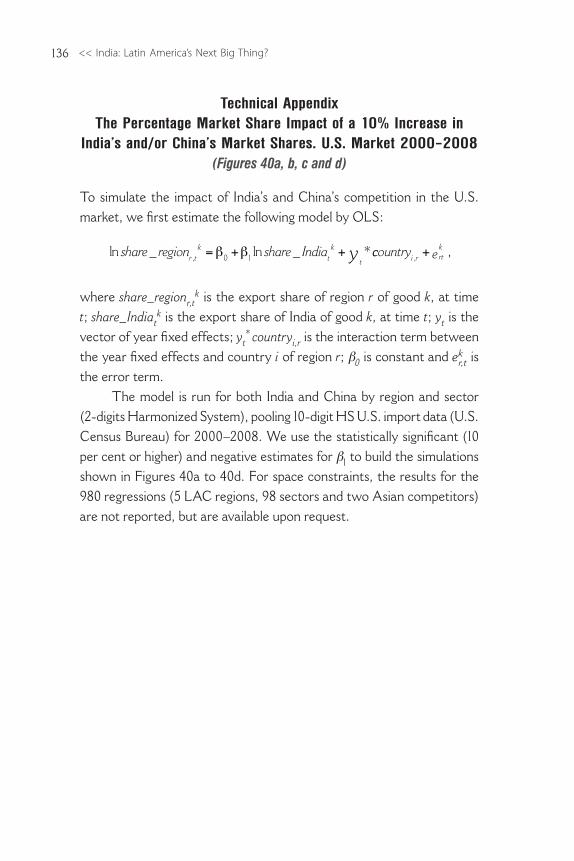
<< India: Latin America’s Next Big Thing?136
Technical Appendix The Percentage Market Share Impact of a 10% Increase in
India’s and/or China’s Market Shares. U.S. Market 2000–2008 (Figures 40a, b, c and d)
To simulate the impact of India’s and China’s competition in the U.S. market, we first estimate the following model by OLS:
ln _ ln _ *,share region share Indiar tk
tk
ty= + +β β0 1 ccountry ei r rt
k, + ,
where share_regionr,t
k is the export share of region r of good k, at time t; share_Indiat
k is the export share of India of good k, at time t; yt is the vector of year fixed effects; yt
* countryi,r is the interaction term between the year fixed effects and country i of region r; β0 is constant and ek
r,t is the error term.
The model is run for both India and China by region and sector (2-digits Harmonized System), pooling 10-digit HS U.S. import data (U.S. Census Bureau) for 2000–2008. We use the statistically significant (10 per cent or higher) and negative estimates for β1 to build the simulations shown in Figures 40a to 40d. For space constraints, the results for the 980 regressions (5 LAC regions, 98 sectors and two Asian competitors) are not reported, but are available upon request.
>> Summary and Conclusions
Filling the void
Is India the next big thing for Latin America? The analysis and findings contained in this report clearly indicate that the fundamentals exist for a strong trade relationship between the two regions. LAC has the natural resources that India needs to grow and thrive. As was the case with China, this “natural resource pull” should be strong enough to send bilateral trade soaring. Aside from this factor, similarity in demand patterns provides another good reason to trade, particularly in manufactured goods aimed at these two economies’ vast low- and middle-income populations. The puzzle, then, is why has it not yet happened?
A simple examination of the trade costs between the two economies offers a quick solution to this puzzle. Tariffs imposed on LAC’s exports to India are close to prohibitive, particularly on agricultural products. Tariffs imposed on India’s exports to LAC are not as high, but cannot be deemed harmless either. If we add to these already formidable obstacles, the hard-to-quantify-but-no-less-damaging non-tariff barriers and high costs of shipping goods between the two economies, the answer to why it has not happened yet appears obvious.
Despite frequent declarations of commitment to trade and integra-tion, governments on both sides of the relationship have yet to effectively address the most obvious and serious obstacles to bilateral trade. True, we need to acknowledge that trade agreements have been signed between
<< India: Latin America’s Next Big Thing?138
India and LAC partners such as MERCOSUR and Chile. However, the limited scope of these initiatives conspires to severely reduce their effec-tiveness. Unless they incorporate more LAC countries and substantially expand the number of products covered, they are not going to solve the paradox of the “missing trade.” Moreover, they can address only part of the trade costs. An effective trade agenda must also bring transport costs down by working on a regulatory framework that promotes investment and competition in transport services between the two economies.
Without reducing trade costs it is hard to be optimistic about bi-lateral investments. Despite the recent boom in outward FDI from both India and LAC, a very small proportion of these investments has gone to reinforcing the bilateral relationship. There have been a few emblematic examples in IT services, mining, and manufacturing, and these might be revealing of the relationship’s potential. However, such examples have been exceptions rather than the rule.
The bulk of LAC’s and India’s outward FDI goes to their major trad-ing partners in the U.S., Europe, and Asia, and this is far from surprising. Trade brings economies together, making the incentives to invest clearer and the barriers, particularly the informational barrier, less relevant. Without a critical mass of trade, the prospects for bilateral investments between LAC and India appear dim.
More trade also appears to be a key ingredient for strengthening and consolidating a growing movement towards cooperation between the two economies that were barely part of each other’s foreign policy agenda until they opened their borders to international trade. The similarity of per capita incomes and production patterns in both economies represents a wealth of possibilities for the exchange of knowledge and policy experi-ences, as well as for joint action on global regulatory issues. A testament to this potential is both the increasing number of cooperation agreements being signed and India-LAC collaboration in international fora.
More trade is likely to strengthen the virtuous circle in which trade boosts incentives for cooperation while cooperation creates even more opportunities to trade. In this regard, cooperation would benefit from an institutional setting more capable of making political and economic commitments, as well as from an effort to collect and evaluate data. This
139Summary and Conclusions >>
emerging pattern of India-LAC cooperation, which is based on specific interests and issues rather than open-ended commitments, seems best suited to reflect the countries’ diverse interests and to maximize the benefits from cooperation.
Facing the challenges
As regards the competitive challenges posed by India’s emergence, two sectors stand out: IT and BPT services and manufacturing.
In IT and BPT services, India cannot be seen as the new kid on the block. India is already a leading player, whereas LAC is still trying to become a significant member of the club. In IT, LAC’s supply constraints—e.g. the limited stock of engineers—rule out large-scale exports. But these con-straints are less an obstacle to the region’s ability to enter market niches in which the region can demonstrate its strengths. Nearshore advantages (e.g. cultural and physical proximity) give the region an important advan-tage for serving both the growing U.S. Latino market and the regional market; this fact has not gone unnoticed among the major Indian IT firms.
In BPT, the gap between LAC and India is considerably smaller, particularly in low-skill activities such as call centers and telemarketing, which are a better fit for the region’s current resources and nearshore advantages. As in IT, Indian companies are already investing to exploit these advantages and in this sense are helping rather than hindering the development of this industry in LAC.
A number of LAC countries already have sectoral policies in place to promote the export of IT-BPT services, which are generally well focused on reducing the tax burden and alleviating credit constraints. However, they usually lack a more general cost-benefit analysis and overlook the key binding constraint on the industry’s development: the supply of qualified engineers. In this regard, it is not only necessary to improve local skills, but also to carry out initiatives to liberalize trade in services, particularly of foreign engineers and other professionals. Whereas building local skills can produce results only in the medium to long term, foreigners can pro-vide an immediate injection of skills and establish seeds for training and transferring know-how.
<< India: Latin America’s Next Big Thing?140
Manufacturing presents a very different set of circumstances. On the surface, India’s current share of world manufacturing exports does not pose a major challenge to LAC’s manufacturers. But a careful look at that country’s recent export trends, factor endowments, and political economy constraints reveals a huge potential and political imperative to be a major exporter of manufacturing goods. As such, India will be a force to reckon with in the not so distant future.
India’s presence in high tech and labor-intensive goods has been in-creasing rapidly, both in the U.S. and world markets. There are also strong signs not yet captured by the trade data, but visible in outward FDI flows, that India is likely to play a more important role in the so-called medium technology industries, particularly in the automobile sector.
To unleash its full manufacturing potential, India will have to over-come a number of important binding constraints, including labor regula-tions, infrastructure, and human capital. The country, though, does not seem to have any other realistic option. Its extremely successful IT-BP services cannot provide better jobs to the more than half a billion people who still perform very low productivity tasks in agriculture. The govern-ment has already given strong signs that it is willing to move to overcome these constraints, and the results of the recent election seem to strengthen the political momentum.
All this suggests that governments in the region would be wise to acknowledge a scenario in which India joins China as a major exporter of manufactured goods. Such a scenario will only add to the predicaments LAC already faces in competing with China. It has become abundantly clear that the manufacturing “road” to development has become highly congested and particularly hazardous for countries that cannot count on an abundant supply of skilled workers.
We argue in the report that this likely scenario exponentially in-creases the urgency (and the costs of inaction) of an agenda that address LAC’s well known deficiencies in education, access to credit, S&T, and infrastructure. Addressing these deficiencies is crucial to enable the re-gion to increase productivity, diversify away from simple, labor-intensive goods, and make better use of its natural resources and proximity to the world largest market.
141Summary and Conclusions >>
The future of manufacturing in the region and its ability to expand employment well beyond limited agricultural and mining jobs depends on the political will to address these “simple” and “basic” issues head on. Some speak of a more challenging agenda of heavier government intervention to address a number of failures in product and factor markets. In a moment when the heavy hand of the state is being felt not only in China and India, but also in far less likely countries such as the U.S. and the U.K., this sort of agenda cannot be completely dismissed. Yet, it seems wiser, especially given the region’s poor record with this level of intervention and its scar-city of resources, to concentrate government efforts on more basic and valuable activities such as building and running infrastructure efficiently and insisting that schools and universities produce the resources needed for development and growth. After all these years, the region clearly cannot take all of this for granted.
India:Latin America's Next Big Thing?
Inter-American Development Bank
Special Report on Integration and Trade
“This book makes an unprecedented contribution to understanding the past, present, and possible futures of economic relations between Latin America and India. Will these relations follow the same path taken by Latin America and China? If not, how might they differ? Using solid knowledge of economic history, hard-to-get data, and sound comparative analysis, the authors shed light on challenges that will be faced in coming years to intensify these relations, arguing that eventual success can be a win-win proposition. A book worth reading from both an academic and a policy-making perspective.” Fernando Henrique Cardoso, President of the Fernando Henrique Cardoso Institute (IFHC), Former President of Brazil
"India and Latin America are increasingly important actors on the global economic stage. Yet in terms of their engagement with each other, they could be likened to two giant ships passing in the night. India: Latin America's next big thing? poses a highly pertinent question and explains why the answer may well be affirmative sooner than we might guess. Thoroughly researched and clearly presented, this study examines the major economic questions facing India and Latin America. By elucidating the uneven and sequentially eccentric development paths both have taken, the study asks how their growing interaction could benefit each. A very useful source for economists and non-economists alike interested in two hugely important regions of the world—and their future relationship."
Edward Luce, Financial Times Editor (Washington DC) and author of “In Spite of the Gods: The Strange Rise of Modern India”
"What policy lessons does India's dramatic economic transformation hold for the countries of Latin America? What opportunities and challenges does it offer the region? What synergies exist between India and Latin America? This report offers the first analytic and in-depth analysis of these and other important questions. Thoroughly researched and lucidly written, it is essential reading for policy makers in both Latin America and India."
Arvind Panagariya, Jagdish Bhagwati Professor of Indian Political Economy at Columbia University and author of "India: The Emerging Giant."
INTEGRATION AND TRADE
Mauricio Mesquita MoreiraCoordinator
India: Latin America's Next Big Thing?
978-1-59782-118-6
C
M
Y
CM
MY
CY
CMY
K