Embed Size (px)
Citation preview

BTMU Focus Latin America – Special Report | 5 January 2016 1
BTMU FOCUS LATIN AMERICA
Gauging Latin America’s
Dependence on Commodities
MUFG UNION BANK, N.A.
ECONOMIC RESEARCH (NEW YORK)
Hongrui Zhang
Latin America Economist
(212) 782-5708
5 JANUARY 2016 The Bank of Tokyo-Mitsubishi UFJ, Ltd. A member of MUFG, a global financial group
[SPECIAL REPORT]
Degree of Commodity Dependence of Major Latin American Economies*
PUBLIC FINANCE INVESTMENT
Gross Exports Net Exports Fiscal Revenues FDI
Argentina High Moderate Low Low
Brazil High Low Low Moderate
Chile Very High High Moderate High
Colombia Very High Moderate Moderate High
Mexico Very Low Very Low High Very Low
Peru Very High Moderate Moderate High
*Own classification
Source: BTM U
COUNTRYTRADE
Latin America as a region is, in essence, commodity-dependent: exports are severely
concentrated in raw materials; governments tend to rely on revenues from natural
resources to finance their budgets; and investments are, to some degree, swayed by
commodity cycles. But on a deeper level, the degree of dependence varies greatly across
countries.
The end of the commodity-price boom has been a major force behind the sharp slowdown
in most Latin American economies. This evidently does not bode well for Latin America’s
growth prospects, and makes it even more pressing to implement the structural reforms
needed to put the region back on a sustainable and higher economic growth path.
The downturn in commodity prices does not explain the stark divergence in economic
performance between Argentina and Brazil, on one side, and Chile, Colombia and Peru,
on the other. This divergence suggests that a high degree of dependence does not
necessarily make an economy more vulnerable to swings in the commodity market. It very
much depends on how a country manages the extraordinary windfalls throughout the
boom and bust cycle.
<EXECUTIVE SUMMARY>

BTMU Focus Latin America – Special Report | 5 January 2016 2
TABLE OF CONTENTS
1. Introduction
2. Gauging Latin America’s Dependence on Commodities
2.1. Trade
2.2. Fiscal Revenue
2.3. Investment
3. Concluding Remarks
REFERENCES
APPENDIX
3
4
4
8
10
14
16
17

BTMU Focus Latin America – Special Report | 5 January 2016
3
Figure 1: Commodity Prices and GDP Growth
Nominal index (2008, October=100) Real index (2010=100), 2005 US dollars %, compound annual growth rate (CAGR)
Source: World Bank Commodity Price Data; Thomson Reuters Datastream; World Development Indicators; BTM U
a) Selected Commodity Prices b) Commodity Prices c) GDP Growth
0 2 4 6 8
Peru
Mexico
Colombia
Chile
Brazil
Argentina
Latin America
OECD
World
2014 2003-13
0
20
40
60
80
100
120
140
160
180
200
Jan-0
8
Jan-0
9
Jan-1
0
Jan-1
1
Jan-1
2
Jan-1
3
Jan-1
4
Jan-1
5
Corn
Soybean
Iron Ore
Copper
Oil
Peak af ter crisis of 2008
0
20
40
60
80
100
120
140
160
1960 1970 1980 1990 2000 2010
Agriculture Metals Energy
1. Introduction
It was good while it lasted. After reaping the benefits from a
decade-long, Chinese-led commodity boom that roughly peaked in
2012 (Figure 1-a, b)1, and enjoying years of stunning GDP growth;
Latin American economies, commonly labeled as commodity-
dependent, have been struggling to cope with the fall in commodity
prices and its immediate impact on terms of trade and economic
growth. Chile and Peru, both members of the Pacific Alliance trade
bloc, for instance, saw their growth rates slashed in 2014 (Figure 1-c).
Members of Mercosur, the other free-trade bloc in the region, fared
even worse: Argentina and Brazil barely grew in 2014; while
Venezuela slipped into a severe recession. This gloomy situation is
expected to linger for a while as the Brazilian economy, the largest in
the region, is currently mired in a protracted and deep recession,
while other major economies continue to grow at a sluggish rate.
Going forward, commodity prices will likely remain relatively low for
a while 2 , restrained by ample supply as a result of previous
investments in new capacity, and a sapping global demand for raw
materials, especially from China and emerging markets. This
naturally raises several questions over the influence of commodities
on Latin America. How commodity-dependent is the region? How can
this reliance hurt the economy? Does the downturn in commodity
prices explain the recent poor economic results in major Latin
American economies? If yes, what are the implications down on the
road? Those are some of the relevant questions that this report
seeks to answer.
1 Erten and Ocampo (2013) found strong evidence that the boom was largely driven by demand, particularly from China.
2 This is basically the consensus view of commodity experts and market analysts, though agricultural, metal and energy prices
are still well above their historical averages in real terms.
Latin America has seen
better days: Major
economies are struggling to
cope with lower agricultural,
metal and energy prices.
Low commodity prices raise
several questions: How
reliant is Latin America on
commodity? Does it explain
the recent poor economic
results?

BTMU Focus Latin America – Special Report | 5 January 2016
4
Figure 2: Exports and Imports of Primary Commodities*
% of GDP, 2014 % of to tal exports, 2014 % of to tal imports, 2014
*Primary commodities include food and agricultural raw materials (agriculture), metals and energy. See Annex for detailed definition.
Source: IM F, WEO Oct. 2015; UN Comtrade; BTM U
a) Net Exports b) Gross Exports c) Gross Imports
[15, 30]
[5, 15]
[0, 5]
[-5, 0]
[-15, -5]
[80, 100]
[65, 80]
[50, 65]
[35, 50]
[20, 35]
[40, 55]
[30, 40]
[25, 30]
[20, 25]
[15, 20]
2. Gauging Latin America’s Dependence on Commodities
Dependence is a relative concept, conditional on the lens through
which is measured. Take the examples of Mexico and Colombia,
both usually categorized as oil-dependent. In 2014, Mexico’s net oil
exports made up only 0.7% of GDP which, compared to Colombia’s
7.5%, looks trivial, and hardly anyone would label the Mexican
economy as oil-dependent. Yet the picture is quite different if
dependence is measured by sources of fiscal revenue: oil-related
income accounted for around 30% of Mexico’s total fiscal income in
2014, which is nearly twice as much as Colombia’s 18.1%.
Most indicators or indexes of dependence are primary based on
trade data. But in order to have a deeper understanding of the nature
of Latin America’s dependence on natural resources, this report will
widen that scope to include data on investments and public finance.
2.1. Trade
The degree of commodity dependence of Latin American
economies can be directly gauged through their current trade
structures (Figure 2). Some findings are worth underlining.
South America’s gross exports are heavily dominated by
primary commodities 3 , making up about 70% of the total
3 See Appendix I for detailed definition of primary commodity exports.
Commodity dependence is
a relative concept, relying
on the lens through which
is measured.
Gross exports of major
Latin American economies,
with the exception of
Mexico, are heavily
concentrated in primary
commodities.

BTMU Focus Latin America – Special Report | 5 January 2016
5
Figure 3: Historical and Global Perspective of Latin America's Reliance on Primary Commodity Exports
a) Top 25 Economies by Net Primary Com. Exports* b) Evolution of Gross Primary Commodity Exports
As % of nominal GDP, 2014 % of to tal exports
*Using M SCI classification. Some countries, such as Saudi Arabia and Venezuela, are not included because of lack of data.
Source: IM F, WEO Oct. 2015; UN Comtrade; BTM U
0 5 10 15 20 25 30
MexicoVietnam
DenmarkSouth AfricaNetherlands
BrazilIndonesia
BahrainNicaraguaArgentinaMalaysiaUruguayCanada
ColombiaPeru
AustraliaNew Zealand
NigeriaEcuador
ChileRussia
ParaguayNorwayBolivia
Kazakhstan
Agriculture Metals Energy
0
25
50
75
100
20141962
0
25
50
75
100
0
25
50
75
100
0
25
50
75
100
0
25
50
75
100
0
25
50
75
100
20141962 20141962
20141962
Argentina
Chile
Mexico
Brazil
Colombia
Peru20141962
20141962
DevelopedMarkets
Emerging Markets
Frontier Markets
Not Classif ied
Pacif ic Alliance members
Mercosurmembers
exports. Among LA6 countries (i.e., Argentina, Brazil, Chile,
Colombia, Mexico and Peru), Mexico is the only one whose
exports are not concentrated in primary commodities (about
20% in 2014).
On average, primary commodities do not make up a large
portion of the region’s total imports. The percentages range
from 18% to 32% among LA6 countries.
Net exports as a share of GDP are perhaps a better indicator
because it shows the net effect on the economy. In general,
the numbers are as expected and consistent with the
previous findings, with just one exception. Brazil’s net exports
of primary commodities only represented 3.3% in 2014, and
have stayed around 3% over the past 5 years, reflecting its
limited trade openness. But more importantly, it suggests that
at least through the trade channel, the crash in commodity
prices might not have hurt Brazil as much as Chile or Peru.
What about from a global perspective? Where does the region
stand compared with other net primary commodity exporters?
Surprisingly (or not), most Latin American economies stand in high
positions (Figure 3-a). Indeed, 11 out of the top 25 economies are
located in the region. Perhaps more interesting is the fact that 3 of
Brazil’s net exports make
up a small share of GDP,
implying that at least
through the trade channel,
the fall in commodity
prices may not have put a
big dent in the economy.
The dependence of Latin
American economies on
commodity exports is high
even from a global
perspective.

BTMU Focus Latin America – Special Report | 5 January 2016
6
the 4 members of the Pacific Alliance rank above the two largest
economies of Mercosur: Argentina and Brazil. And yet the formers
have posted much better economic results lately than the latters,
despite being more reliant on commodity exports. Another appealing
surprise is the absent of a clear relationship between market
development and degree of export commodity dependence. In fact,
there are as many developed markets in the top 25 as there are
emerging or frontier markets, suggesting that commodity
dependence could be a curse as well as a blessing4.
Now, from a historical perspective, the findings are even more
revealing (Figure 3-b). First off, LA6 countries have reduced their
dependence on commodity exports over time, though Mexico is the
only country whose exports are not concentrated in raw materials
now. The second largest economy of Latin America managed to pull
that off, partly due to NAFTA (signed in December 1992 and entered
into force on January 1994), and partly because of its proximity to a
major importer of manufacturing products such as the US.
Second, the recent commodity-price boom, couple with the
voracious appetite of China for raw materials, contributed to beef up
the already strong dominance of commodities in the region’s exports.
This by no means hints that growth in non-primary commodity
exports was lackluster. Quite the opposite actually: all LA6 countries
except Mexico recorded double-digit annual growth rates from 2003
to 2011. But evidently primary exports climbed at a much faster pace.
One last point worth noting is that the composition of commodity
exports in most LA6 countries has remained relatively stable over the
last three decades. Agricultural products such as soybean still
dominate Argentine and Brazilian exports; while metals such as
copper continue to make up a big share of Chilean and Peruvian
exports. Colombia, though, is the notable exception. Agricultural
exports used to represent the biggest part of the pie, but now they
only account for around 13%. In contrast, oil exports ballooned from
25% in mid-1990s to about 65% in 2014.
Up to now, the message is clear: the trade sector of most Latin
American economies has and continues to gravitate around natural
resources, leaving it very susceptible to big turnaround in prices. Not
4 There is empirical evidence backing up both theses. On one hand, high natural resource endowments tend to lead to higher
commodity exports, which in turn prompts the real exchange rate to appreciate, making the manufacturing sector less competitive (i.e., the well-known Dutch disease, see Sachs and Warner 1995). On the other hand, natural resource endowments have helped countries such as Australia, Canada and Norway to growth and diversify (World Bank 2005). Moreover, Mehlum, Moene and Torvik (2005) found that the curse can be turned into a blessing for countries with good institutions.
From a historical
perspective, major
economies in Latin
America did make
headway in reducing its
dependence on commodity
exports, though only
Mexico escaped from it.
The latest commodity-price
boom, however, beefed up
the dominance of natural
resources, and brought
forth major structural
changes.

BTMU Focus Latin America – Special Report | 5 January 2016
7
surprisingly, export earnings started to fall in 2013 in all LA6
countries except Mexico. Still, it would be a mistake to see the
region’s dependence on natural resources the same as it was three
decades ago. In fact, there are major structural shifts.
China has overtaken the US as the world’s biggest importer
of primary commodities (Figure 4-a). Of course, the blame is
not on the US, as its imports in fact surged more than
threefold over the last two decades, but instead on the
astonishing rise of China as a critical player in the commodity
market. Indeed, the numbers leave no room for doubts 5 .
China consumes almost half of world’s refined copper, and is
by far the world’s largest importer of copper, with a share of
45% in 2014. It also consumes around 12% of world’s oil, and
is responsible for about 9% of all oil imports.
The expanded influence of China has led to some major
changes in the trade structure of most major Latin American
economies in a relatively short period of time (Figure 4-b). For
instance, China is now the main trading partner for Brazil,
Chile and Peru; and the destination for almost 20% of
Colombia’s oil exports (only 5% in 2009). In contrast, the US
market has been steadily losing ground for some time (Figure
4-c). Thus, is it China behind the recent fall in Latin America’s
export revenues? The answer is yes. Yet the reason is not
because China is consuming or importing less agricultural,
metal and energy commodities; but because the pace of
5 See Appendix II for China’s consumption, production and imports of commodities.
China has become an
extremely influential player
in the commodity market.
In a short period of time,
China has dethroned the
US as the main export
market for Brazil, Chile and
Peru.
Figure 4: Primary Commodity Imports and Exports
% of world's to tal primary imports, nominal % of to tal primary exports % of to tal primary exports
Source: UN Comtrade; BTM U
c) Primary Commodity Exports to USa) US & China's Primary Com. Imports b) Primary Com. Exports to China
0
5
10
15
20
25
30
1965 1980 1995 2010
Argentina
Brazil
Chile
Colombia
Mexico
Peru
0
15
30
45
60
75
90
1965 1980 1995 2010
Mexico
Colombia
Peru
Argentina
Brazil
Chile
0
5
10
15
20
0
5
10
15
20
25Total Primary Agriculture
20141962 20141962
0
10
20
30
40
0
5
10
15Metals Energy
20141962 20141962
USA
China
BTMU Focus Latin America – Special Report | 5 January 2016
8
Figure 5: General Government Revenue% real change yoy
Source: BTM U estimates, using data from IM F-WEO Oct. 2015
-10
-5
0
5
10
15
20
1993 96 99 02 05 08 11 14
-20
-10
0
10
20
1993 96 99 02 05 08 11 14
BrazilArgentina Chile
MexicoColombia Peru
No Data
NoData
-20
-10
0
10
20
30
1993 96 99 02 05 08 11 14
-5
0
5
10
15
1993 96 99 02 05 08 11 14-20
-10
0
10
20
1993 96 99 02 05 08 11 14
-30
-20
-10
0
10
20
30
1993 96 99 02 05 08 11 14
Boom Period:2003-12
growth has slowed substantially in the last two years,
dragging prices down6.
The high degree of commodity export dependence has no doubt
implications beyond the trade sector. The recent sharp depreciation
observed in most Latin American currencies, for instance, was at
least in part prompted by the sudden drop in exports, which in turn
fueled inflation and hurt capital and consumption spending through
higher import costs.
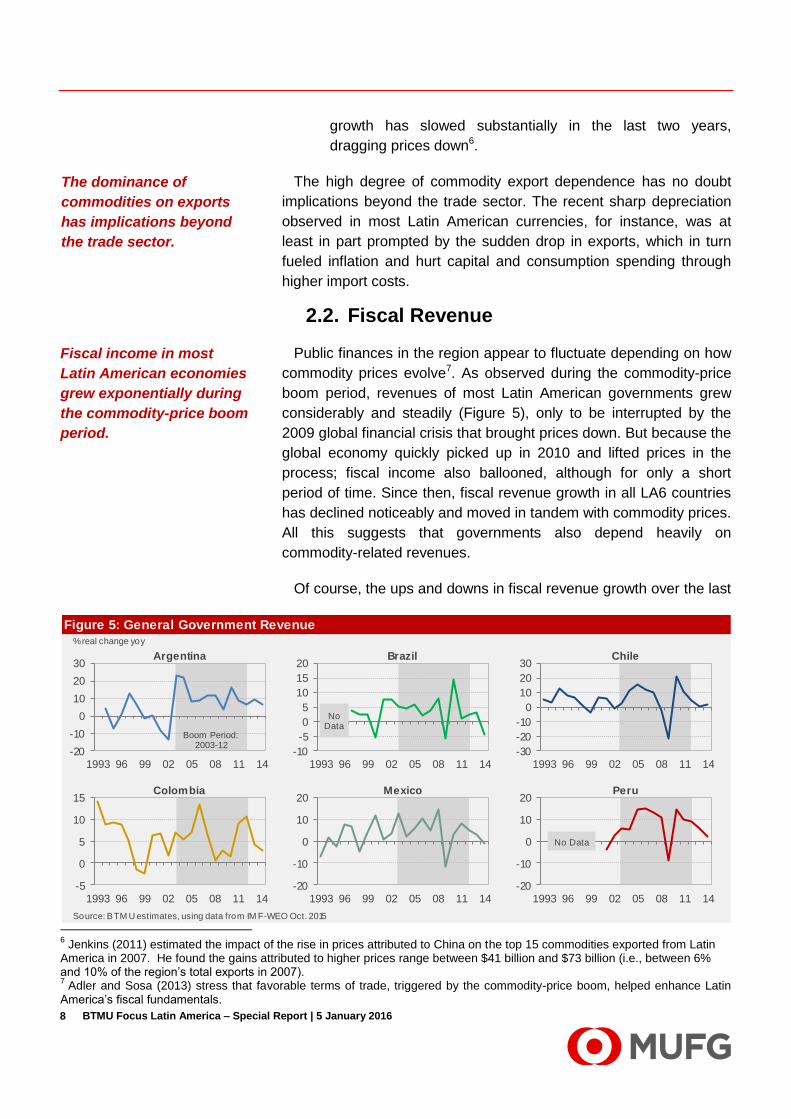
2.2. Fiscal Revenue
Public finances in the region appear to fluctuate depending on how
commodity prices evolve7. As observed during the commodity-price
boom period, revenues of most Latin American governments grew
considerably and steadily (Figure 5), only to be interrupted by the
2009 global financial crisis that brought prices down. But because the
global economy quickly picked up in 2010 and lifted prices in the
process; fiscal income also ballooned, although for only a short
period of time. Since then, fiscal revenue growth in all LA6 countries
has declined noticeably and moved in tandem with commodity prices.
All this suggests that governments also depend heavily on
commodity-related revenues.
Of course, the ups and downs in fiscal revenue growth over the last
6 Jenkins (2011) estimated the impact of the rise in prices attributed to China on the top 15 commodities exported from Latin
America in 2007. He found the gains attributed to higher prices range between $41 billion and $73 billion (i.e., between 6% and 10% of the region’s total exports in 2007). 7 Adler and Sosa (2013) stress that favorable terms of trade, triggered by the commodity-price boom, helped enhance Latin
America’s fiscal fundamentals.
Fiscal income in most
Latin American economies
grew exponentially during
the commodity-price boom
period.
The dominance of
commodities on exports
has implications beyond
the trade sector.
BTMU Focus Latin America – Special Report | 5 January 2016
9
decade or so cannot be solely attributed to the recent commodity
cycle. Both robust economic growth and increased tax burden must
have driven revenues up too. This makes it more challenging to
determine how commodity-dependent Latin American governments
are. One way to overcome this problem is to gauge the fiscal income
(tax-related or not) that can be directly credited to the commodity
sector. Some important insights are provided by this indicator.
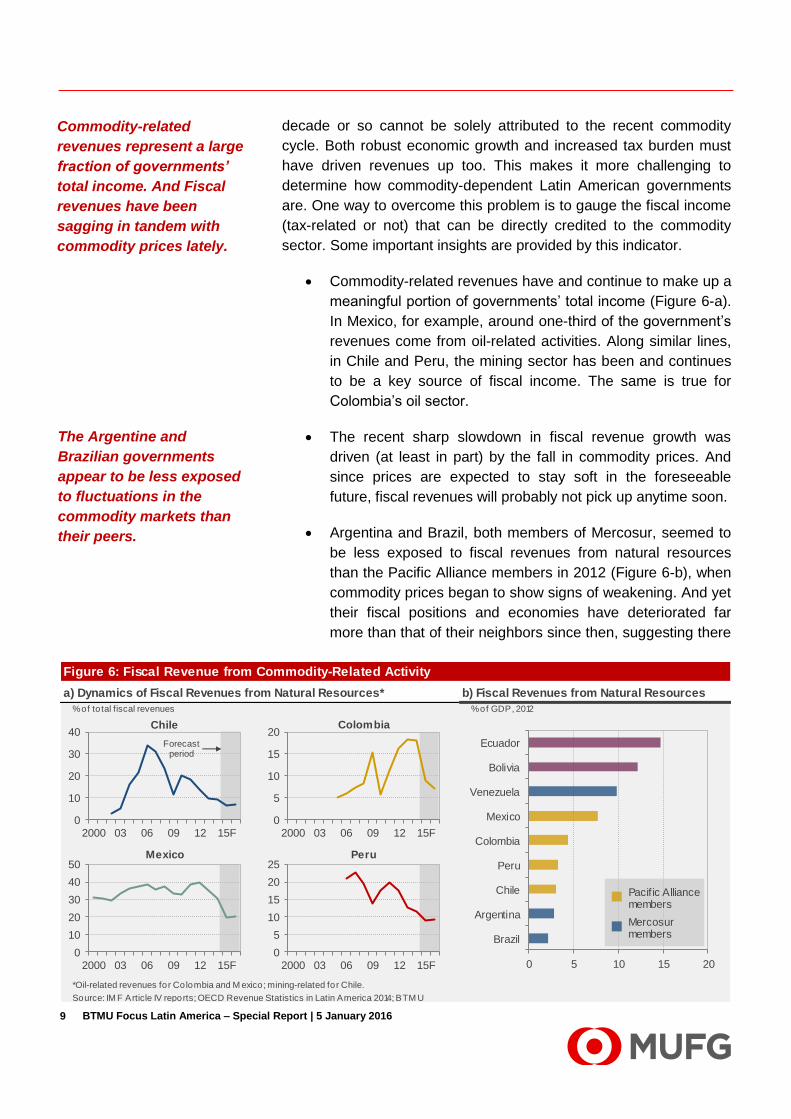
Commodity-related revenues have and continue to make up a
meaningful portion of governments’ total income (Figure 6-a).
In Mexico, for example, around one-third of the government’s
revenues come from oil-related activities. Along similar lines,
in Chile and Peru, the mining sector has been and continues
to be a key source of fiscal income. The same is true for
Colombia’s oil sector.
The recent sharp slowdown in fiscal revenue growth was
driven (at least in part) by the fall in commodity prices. And
since prices are expected to stay soft in the foreseeable
future, fiscal revenues will probably not pick up anytime soon.
Argentina and Brazil, both members of Mercosur, seemed to
be less exposed to fiscal revenues from natural resources
than the Pacific Alliance members in 2012 (Figure 6-b), when
commodity prices began to show signs of weakening. And yet
their fiscal positions and economies have deteriorated far
more than that of their neighbors since then, suggesting there
Commodity-related
revenues represent a large
fraction of governments’
total income. And Fiscal
revenues have been
sagging in tandem with
commodity prices lately.
The Argentine and
Brazilian governments
appear to be less exposed
to fluctuations in the
commodity markets than
their peers.
Figure 6: Fiscal Revenue from Commodity-Related Activity
a) Dynamics of Fiscal Revenues from Natural Resources* b) Fiscal Revenues from Natural Resources
% of to tal fiscal revenues % of GDP, 2012
*Oil-related revenues for Colombia and M exico; mining-related for Chile.
Source: IM F Article IV reports; OECD Revenue Statistics in Latin America 2014; BTM U
Chile Colombia
Mexico Peru
0 5 10 15 20
Brazil
Argentina
Chile
Peru
Colombia
Mexico
Venezuela
Bolivia
Ecuador
Pacif ic Alliance members
Mercosurmembers
0
10
20
30
40
2000 03 06 09 12 15F
0
10
20
30
40
50
2000 03 06 09 12 15F0
5
10
15
20
25
2000 03 06 09 12 15F
0
5
10
15
20
2000 03 06 09 12 15F
Forecast period

BTMU Focus Latin America – Special Report | 5 January 2016
10
could be other factors behind.
There is no doubt the commodity boom has been tremendously
beneficial to Latin American governments, as it boosted revenues to
the highest level on record, and allowed them to increase public
investments and social spending. But paradoxically, it has also made
governments more dependent on commodity revenues, and more
prone to overspend and keep undue fiscal stimulus8, which wound up
making them more vulnerable to a downturn in the commodity market,
as evidenced in the widening fiscal deficit of all net commodity
exporters (Figure 7).
In theory, those fiscal risks can be swiftly restrained if governments
adjust their spending to balance the budget. Most of the resulting
spillover effects would thus be fenced off from the real economy.
That should not be a daunting task for countries with a relatively
strong fiscal framework (e.g., members of Pacific Alliance), and have
saved the extraordinary windfall in foreign assets, or used it to
enhance their fiscal accounts. But for governments that have
squandered the windfalls on unproductive spending, and made little
headway in firming up their accounts; trimming the budget could be
economically painful and politically infeasible, as observed in Brazil.
Worse yet, the lingering fiscal fragility could act as an amplifier of
other domestic and external shocks.
2.3. Investment
It is no coincidence that Chile, Colombia and Peru, all major net
commodity exporters, experienced a massive investment boom
8 Adler and Magud (2013) argue that the income windfalls associated with the recent commodity boom was much larger than
those observed during the 1970s. Yet it seems the effort to save those windfalls was not stronger than before.
Slashing spending to
balance the budget could
be economically painful
and politically infeasible
for governments that have
overspent and not
improved their fiscal
position during the boom
period.
Figure 7: General Government Deficit
% of GDP
Source: IM F, WEO Oct. 2015; UN Comtrade; BTM U
-7
-6
-5
-4
-3
-2
-1
0
1
2
3
Argentina Brazil Bolivia Chile Colombia Ecuadro Mexico NicaraguaParaguay Peru Uruguay
2000-02 (Pre-boom)
2003-12 (Boom)
2013-15F (Post-boom)
Pacific Alliance members
Mercosurmembers

BTMU Focus Latin America – Special Report | 5 January 2016
11
Figure 8: Capital Flows and FDI to Latin America
a) Capital Flows to Latin America b) Inward FDI to Latin America
Billion USD Billion USD
*Non-residential capital inflows; **Residential capital outflows
Source: Institute of International Finance; ECLAC, FDI in Latin America and the Caribbean Report; BTM U
-200
-100
0
100
200
300
400
1990 95 00 05 10 15E
ArgentinaEcuadorVenezuelaPeruColombiaChileMexicoBrazilTotal Capital Inflows*Total Capital Outflows**Net Capital Flows
0
5
10
15
20
25
0
20
40
60
80
0
10
20
30
0
5
10
15
20
0
10
20
30
40
50
0
5
10
15
20141999
Argentina
Chile
Mexico
Brazil
Colombia
Peru
20141999
20141999 20141999
20141999 20141999
Total FDI
period during the last decade or so, when at the same time
commodity prices skyrocketed to record levels. Even in Argentina, a
country that has not yet regained access to the global capital markets
since its default in 2002, gross fixed capital formation (a measure of
investment) grew at an average annual rate of 6.8% between 2005
and 2014. It is not coincidence either that investment spending has
been falling in most countries of the region lately.
In principle, the co-movement between investments and commodity
prices does not imply a causal relationship nor confirm the sheer
dependence of the former on the latter. The enormous inflow of
capitals to Latin America, largely spurred by generous global liquidity
conditions, must have been another major driving force as well
(Figure 8-a). Still, there is persuasive evidence that commodity prices
were and continue to be a driving factor for investment growth in
most major economies of the region.
The large inflows of foreign direct investments (FDI) to major
net commodity exporters during the last decade or so were
driven by sky-high commodity prices (Figure 8-b). True, this
could have been fueled by favorable global liquidity conditions
as well, but the fact that the commodity sector attracted more
FDI than other sectors, which is reflected in its increased
share (Figure 9-a), suggests foreign investors were lured in
Latin America enjoyed a
massive and protracted
investment boom during
the last decade.
Commodity prices were
and continue to be a
driving factor for
investment growth in Latin
America.

BTMU Focus Latin America – Special Report | 5 January 2016
12
part by the rise in agricultural, metal and energy prices. It is
important to note that FDI flows amount to a small fraction of
the overall investments, and do not say much about the
preferences and behavior of domestic investors, at least not
directly. However, there are no compelling reasons to believe
domestic and foreign investors may have behaved differently
either.
FDI data reveal patterns of dependence among LA6 countries
that are fairly similar to those described in the previous
sections. Chile, Colombia and Peru, the so-called Andean
countries, display high degree of reliance: more than 40% of
the total FDI between 2004 and 2013 went to the commodity
sector (Figure 9-a). Mexico and Brazil, in contrast, show a
relatively low degree of dependence. The visible surprise is
Argentina, but capital controls and its isolation from the global
capital markets may have played a vital role in deterring
foreign investors.
There is a strong correlation between global commodity
prices and Latin America’s investment ratio (Figure 9-b). The
ratio rose sharply from 2003 to 2008 in tandem with
commodity prices. It plunged in 2009 due to the global
financial crisis, but briefly recovered in 2010 and 2011 as
most prices did. It has dropped steadily since then. Of course,
correlation is not always causation, but it might hold in this
case. Indeed, the weak correlation between the investment
ratios of Latin American and advanced economies suggests
the absent of a powerful and common factor, such as the
abundance of liquidity, driving capital spending across the
FDI and trade data show
similar patterns of
dependence. The Andean
economies display high
degree of commodity
dependence.
Commodity prices have
been a major driving factor
of investments in all major
Latin American economies
except Mexico.
Figure 9: Investment and Commodity Prices
Average % share % of GDP Index (2005=100) % of GDP Index (2005=100)
Source: IM F, WEO Oct. 2015; ECLAC, FDI in Latin America and the Caribbean Report; BTM U
a) Foreign Direct Investment b) Investment Ratios and Commodity Prices
0
50
100
150
200
250
17
18
19
20
21
22
23
24
25
92 95 98 01 04 07 10 13
Investment Ratio - LCommodity Prices - R
1992-02: 0.07
2003-14: -0.40
Correlation
0
50
100
150
200
250
17
18
19
20
21
22
23
24
92 95 98 01 04 07 10 13
Investment Ratio - LCommodity Prices - R
1992-02: -0.33
2003-14: 0.80
Correlation
Latin America Advanced Economies
0% 25% 50% 75% 100%
ArgentinaBrazilChile
ColombiaMexico
Peru
ArgentinaBrazilChile
ColombiaMexico
Peru
Natural Resources Other Sectors
1998-03
2004-13

BTMU Focus Latin America – Special Report | 5 January 2016
13
globe. In other words, a force that influences both groups
differently should have been the driving factor behind Latin
America’s investment boom. The obvious candidate is the
commodity-price boom. We tested this hypothesis through
different econometric techniques and found statistical
evidence supporting it9, which is in line with other studies10.
Still, the lack of data makes it hard to gauge the degree of
dependence, but recent empirical evidence suggests
commodity prices have been a major driving factor of
investments in all LA6 countries except Mexico11.
9 We used Granger test to see whether swings in global commodity prices have causal effects on Latin America’s investment
ratio. We found statistical evidence supporting the hypothesis, but Granger test can produce biased results when the variables are first-order integrated, so then we decided to analyze whether the variables have a long-run relationship (i.e., whether they cointegrate or not). Again, the evidence seems to support the hypothesis. 10
See World Economic Outlook (October 2015, chapter 2), Monetary Policy Report of Chile’s central bank (June 2015), and IMF Selected Issues Paper on Peru (May 2015). 11
See Chapter 4 of the April 2015 Regional Economic Outlook: Western Hemisphere.

BTMU Focus Latin America – Special Report | 5 January 2016
14
Figure 10: Degree of Commodity Dependence of Major Latin American Economies*
PUBLIC FINANCE INVESTMENT
Gross Exports Net Exports Fiscal Revenues FDI
Argentina High Moderate Low Low
Brazil High Low Low Moderate
Chile Very High High Moderate High
Colombia Very High Moderate Moderate High
Mexico Very Low Very Low High Very Low
Peru Very High Moderate Moderate High
*Own classification based on previous analysis
Source: BTM U
TRADECOUNTRY
3. Concluding Remarks
Yes, Latin America as a region is, in essence, commodity-
dependent: exports are severely concentrated in raw materials;
governments tend to rely on revenues from natural resource to
finance their budgets; and investments are, to some degree, swayed
by commodity cycles. Nevertheless, on a country level, the reality is
in fact far more complex and interesting.
The degree of dependence varies greatly across countries,
even among those that are frequently labeled as “heavily-
dependents” (Figure 10). Chile, Colombia and Peru, for
instance, show a relatively high level. In contrast, Argentina
and Brazil do not exhibit the same patterns as commonly
believed. In fact, natural resources seem to be less influential
in the two largest economies of South America.
Countries have different patterns of dependence (Figure 10).
For example, commodities play a critical role in providing
revenues to the Mexican government, but not so much in
driving exports. On the contrary, raw materials are heavily
weighted in Argentina and Brazil’s exports, but neither
country exhibits a high level of commodity dependence in its
fiscal revenues.
Now, two implications are clear from the previous findings. First,
the end of the commodity-price boom has been a major force behind
the sharp slowdown in most Latin American economies, as the fall in
prices and its ongoing effects are now discernible in the light of the
patterns of commodity dependence described above. Exports and
investments, for instance, have been plunging over the last two or
three years, leading most currencies to depreciate. Fiscal revenues
Latin American economies
are, in general, commodity-
dependent. But the degree
of dependence varies
greatly across countries,
even among those labeled
as “heavily-dependent”.
The end of the commodity-
price boom has been a
major force behind the
sharp slowdown in most
Latin American economies.

BTMU Focus Latin America – Special Report | 5 January 2016 15
have been falling lately, forcing governments to slash spending.
Likewise, households have begun to spend less, triggering a self-
reinforcing cycle of lower domestic demand and weaker GDP growth.
All this evidently does not bode well for the region’s growth
prospects: should commodity prices remain low in the coming years;
major Latin American economies, perhaps except Mexico, will
probably grow at a much slower pace than during the last decade.
This makes it even more pressing to implement the structural reforms
needed to put the region back on a sustainable and higher economic
growth path.
Second, the downturn in commodity prices does not explain the
stark divergence in economic performance among major economies
of the region (Figure 11). Brazil, a country with a relatively moderate
reliance on commodities, is currently mired in a deep and protracted
economic recession. And its neighbor Argentina is not doing much
better either. Intriguingly, the Andean economies, which exhibit a
higher degree of commodity dependence, have so far weathered the
downturn and are expected to grow above 2% in 2015 and 2016.
The divergence between those two groups suggests that a high
degree of dependence does not necessarily make an economy more
vulnerable to swings in the commodity market than other with a low
level. It very much hinges on how a country manages the commodity
cycles. In countries with relatively strong commitment to fiscal and
monetary discipline such as Chile, Colombia and Peru; rules are in
place to prevent governments from squandering the extraordinary
windfall during boom periods, indirectly encouraging them to save it
for the rainy days. Thus, it is hardly surprising that those three
countries, in contrast to Argentina and Brazil, were able to use
countercyclical measures to cushion the recent impact of lower
commodity prices. Worse yet, when boom periods come to an end,
the underlying weaknesses in the economy, which are frequently
concealed by the bonanza, tend to be exposed and act as an
amplifier of other shocks. This could well be the case of Brazil.
Figure 11: Forecasted GDP Growth Rates
Argentina Brazil Chile Colombia Mexico Peru
2015
2016
Source: Consensus Economics; BTM U
1.1
-0.2
-3.5
2.2
2.1
2.2
2.9
2.6
2.4
2.8
2.8
3.4
The slump in commodity
prices does not explain the
stark divergence in
economic performance
among major economies of
the region.
A high degree of
dependence does not
necessarily make an
economy more vulnerable
to swings in the
commodity market. It very
much depends on how a
country manages the
extraordinary windfalls
throughout the boom and
bust cycle.

BTMU Focus Latin America – Special Report | 5 January 2016
16
REFERENCES
Adler, Gustavo, and Nicolás Magud. 2013. “Four Decades of Terms-of-Trade Booms: Saving-
Investment Patterns and a New Metric of Income Windfall.” IMF Working Papers, International
Monetary Fund, Washington, DC.
Adler, Gustavo, and Sebastián Sosa. 2013. “External Conditions and Debt Sustainability in Latin
America.” IMF Working Papers, International Monetary Fund, Washington, DC.
Erten, Bilge, and José Antonio Ocampo. 2013. “Super Cycles of Commodity Prices since the Mid-
nineteenth Century.” World Development, 44 (2013), 14-30.
International Monetary Fund. 2015. “World Economic Outlook: Adjusting to Lower Commodity Prices.”
October 2015. Washington, DC.
Jenkins, Rhys. 2011. “The China Effect on Commodity Prices and Latin American export earnings.”
Cepal Review No. 103.
Magud, Nicolás, and Sebastián Sosa. 2015. “Recent Investment Weakness in Latin America: Is
There a Puzzle?” April 2015. Regional Economic Outlook: Western Hemisphere, International
Monetary Fund, Washington, DC.
Mehlum, Halvor, Karl Moene, and Ragnar Torvik. 2005. “Institutions and the Resource Curse.”
Economic Journal, 116, 1-20.
Nowak, Sylwia, Jochen Andritzky, Andreas Jobst and Natalia Tamirisa. 2009. “Macroeconomic
Fundamentals, Price Discovery and Volatility Dynamics in Emerging Markets.” IMF Working
Papers, International Monetary Fund, Washington, DC.
Sachs, Jeffrey D., and Andrew M. Warner. 1995. “Natural Resource Abundance and Economic
Growth.” NBER Working Paper No. 5398, National Bureau of Economic Research
World Bank. 2005. “Economic Growth in the 1990s. Learning from a Decade of Reform.” Washington,
DC.

BTMU Focus Latin America – Special Report | 5 January 2016
17
Appendix I
Definition of Primary Commodities
Energy Metals Agriculture
SITC 3 (including but not exclusively)
Oil
Natural gas
SITC 27, 28 and 68 (including but not exclusively)
Copper
Aluminum
Iron ore
Nickel
Zinc
Lead
Silver
SITC 0, 1, 2 and 4 (including but not exclusively)
Food and live animals (e.g. soybeans)
Beverages and tobacco
Animal and vegetable oils, fats and waxes (e.g. soybean oil)
SITC: Standard International Trade Classification
Appendix II
The Importance of China in the Commodity Market: Statistics form Selected
Commodities
Table A1: Oil
Global share (%), average
Period Consumption Imports
1980-1984 2.8 -
1985-1989 3.4 0.1
1990-1994 4.0 0.6
1995-1999 5.3 1.5
2000-2004 6.8 3.9
2005-2009 8.7 7.0
2010-2014 11.1 10.1
Source: US Energy Information Administration
Table A2: Copper
Global share (%), average
Period Consumption* Production* Imports**
1995-1999 10.0 8.6 5.9
2000-2004 17.3 11.0 15.8
2005-2009 27.7 19.0 22.9
2010-2014 44.1 29.3 39.1
*Only include refined copper; ** include copper concentrates and blister and refined copper Source: Comisión Chilena del Cobre

BTMU Focus Latin America – Special Report | 5 January 2016
18
Table A3: Corn
Global share (%), average
Period Consumption Production
1980-1984 14.5 15.0
1985-1989 14.6 16.1
1990-1994 17.0 19.3
1995-1999 18.9 20.2
2000-2004 19.8 19.3
2005-2009 19.4 19.8
2010-2014 21.6 21.7
Source: US Department of Agriculture
Table A4: Soybean
Global share (%), average
Period Soybean Meal Soybean Oil
Consumption Production Consumption Production
1980-1984 1.8 2.4 1.9 1.5
1985-1989 2.1 4.4 5.4 3.5
1990-1994 3.4 5.1 6.5 4.2
1995-1999 9.5 7.6 13.2 6.6
2000-2004 13.6 13.9 17.4 13.1
2005-2009 19.0 19.1 24.4 18.2
2010-2014 26.4 26.5 28.6 25.3
Source: US Department of Agriculture
For reference to our previous reports, see our website at: http://researchreports.mufg-americas.com/reports/economic-research
The information herein is provided for information purposes only, and is not to be used or considered as an offer or the solicitation of an
offer to sell or to buy or subscribe for securities or other financial instruments. Neither this nor any other communication prepared by The
Bank of Tokyo-Mitsubishi UFJ, Ltd. (collectively with its various offices and affiliates, "BTMU") is or should be construed as investment
advice, a recommendation to enter into a particular transaction or pursue a particular strategy, or any statement as to the likelihood that a
particular transaction or strategy will be effective in light of your business objectives or operations. Before entering into any particular
transaction, you are advised to obtain such independent financial, legal, accounting and other advice as may be appropriate under the
circumstances. In any event, any decision to enter into a transaction will be yours alone, not based on information prepared or provided by
BTMU. BTMU hereby disclaims any responsibility to you concerning the characterization or identification of terms, conditions, and legal or
accounting or other issues or risks that may arise in connection with any particular transaction or business strategy. While BTMU believes
that any relevant factual statements herein and any assumptions on which information herein are based, are in each case accurate, BTMU
makes no representation or warranty regarding such accuracy and shall not be responsible for any inaccuracy in such statements or
assumptions. Note that BTMU may have issued, and may in the future issue, other reports that are inconsistent with or that reach
conclusions different from the information set forth herein. Such other reports, if any, reflect the different assumptions, views and/or
analytical methods of the analysts who prepared them, and BTMU is under no obligation to ensure that such other reports are brought to
your attention. The Bank of Tokyo-Mitsubishi UFJ, Ltd. retains copyright to this report and no part of this report may be reproduced or re-
distributed without the written permission of The Bank of Tokyo-Mitsubishi UFJ, Ltd. The Bank of Tokyo-Mitsubishi UFJ, Ltd. expressly
prohibits the re-distribution of this report to Retail Customers, via the internet or otherwise and The Bank of Tokyo-Mitsubishi UFJ, Ltd., its
subsidiaries or affiliates accept no liability whatsoever to any third parties resulting from such re-distribution.