Embed Size (px)
Citation preview
- 1 -
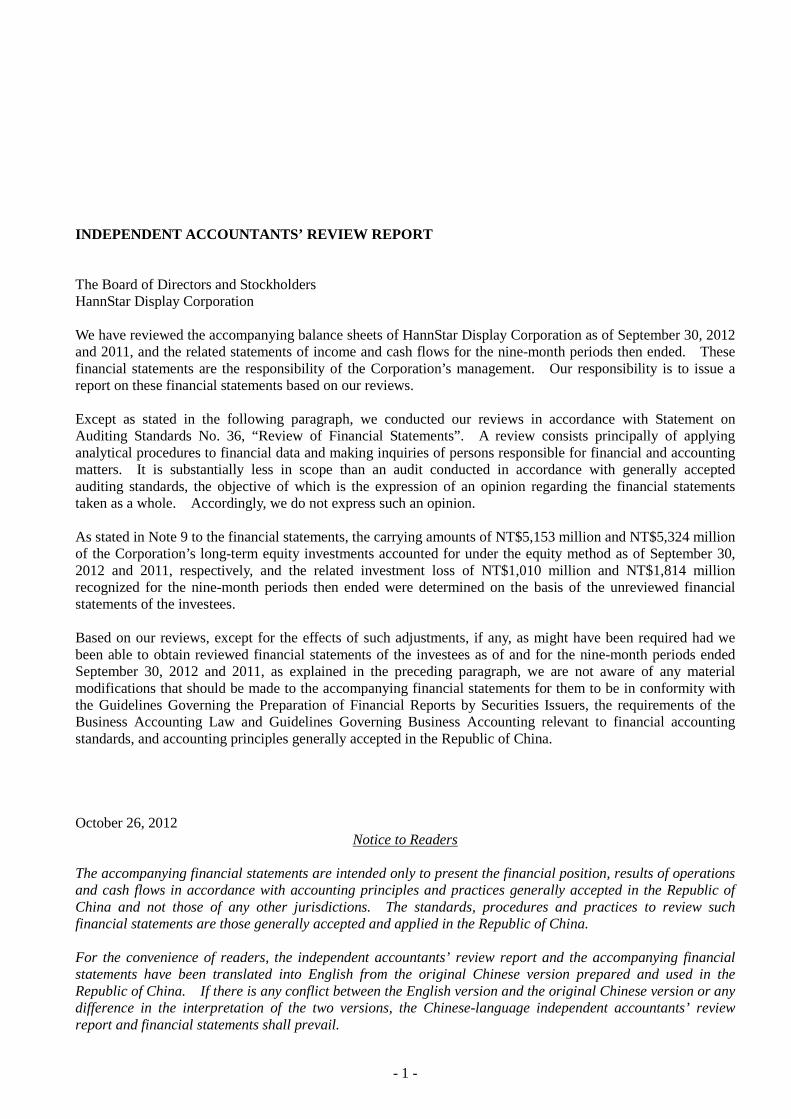
INDEPENDENT ACCOUNTANTS’ REVIEW REPORT The Board of Directors and Stockholders HannStar Display Corporation We have reviewed the accompanying balance sheets of HannStar Display Corporation as of September 30, 2012 and 2011, and the related statements of income and cash flows for the nine-month periods then ended. These financial statements are the responsibility of the Corporation’s management. Our responsibility is to issue a report on these financial statements based on our reviews. Except as stated in the following paragraph, we conducted our reviews in accordance with Statement on Auditing Standards No. 36, “Review of Financial Statements”. A review consists principally of applying analytical procedures to financial data and making inquiries of persons responsible for financial and accounting matters. It is substantially less in scope than an audit conducted in accordance with generally accepted auditing standards, the objective of which is the expression of an opinion regarding the financial statements taken as a whole. Accordingly, we do not express such an opinion. As stated in Note 9 to the financial statements, the carrying amounts of NT$5,153 million and NT$5,324 million of the Corporation’s long-term equity investments accounted for under the equity method as of September 30, 2012 and 2011, respectively, and the related investment loss of NT$1,010 million and NT$1,814 million recognized for the nine-month periods then ended were determined on the basis of the unreviewed financial statements of the investees. Based on our reviews, except for the effects of such adjustments, if any, as might have been required had we been able to obtain reviewed financial statements of the investees as of and for the nine-month periods ended September 30, 2012 and 2011, as explained in the preceding paragraph, we are not aware of any material modifications that should be made to the accompanying financial statements for them to be in conformity with the Guidelines Governing the Preparation of Financial Reports by Securities Issuers, the requirements of the Business Accounting Law and Guidelines Governing Business Accounting relevant to financial accounting standards, and accounting principles generally accepted in the Republic of China. October 26, 2012
Notice to Readers The accompanying financial statements are intended only to present the financial position, results of operations and cash flows in accordance with accounting principles and practices generally accepted in the Republic of China and not those of any other jurisdictions. The standards, procedures and practices to review such financial statements are those generally accepted and applied in the Republic of China. For the convenience of readers, the independent accountants’ review report and the accompanying financial statements have been translated into English from the original Chinese version prepared and used in the Republic of China. If there is any conflict between the English version and the original Chinese version or any difference in the interpretation of the two versions, the Chinese-language independent accountants’ review report and financial statements shall prevail.
- 2 -
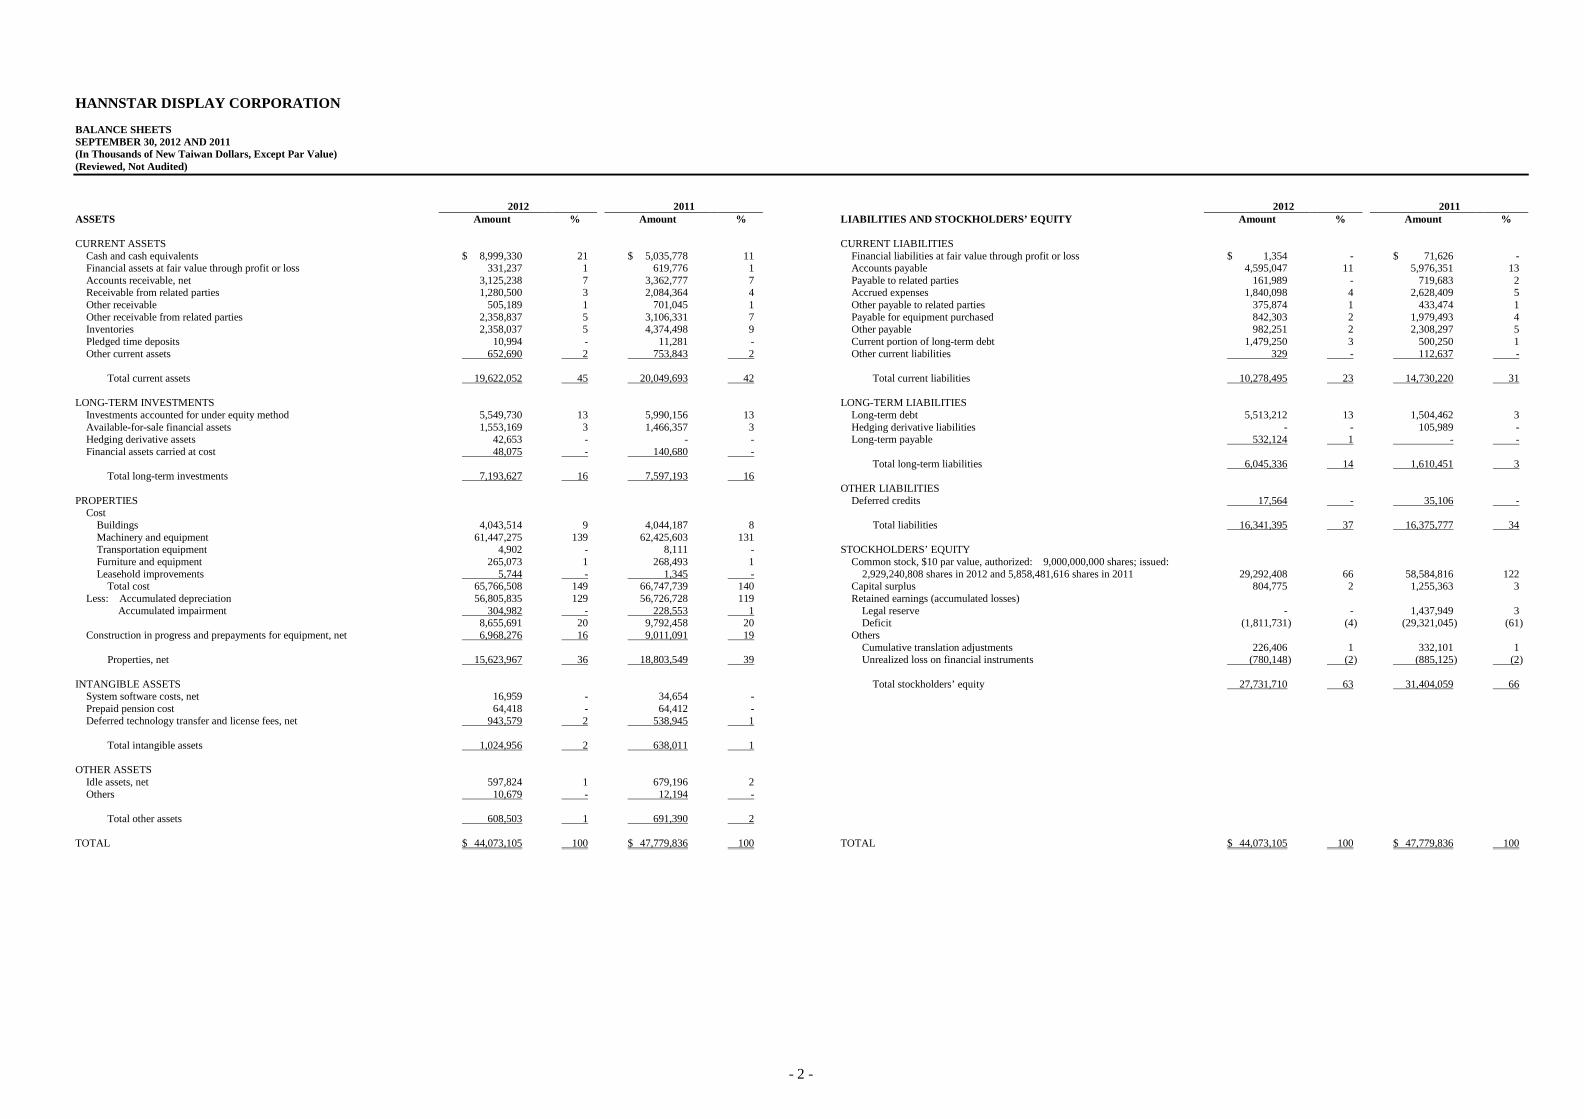
HANNSTAR DISPLAY CORPORATION BALANCE SHEETS SEPTEMBER 30, 2012 AND 2011 (In Thousands of New Taiwan Dollars, Except Par Value) (Reviewed, Not Audited) 2012 2011 2012 2011 ASSETS Amount % Amount % LIABILITIES AND STOCKHOLDERS’ EQUITY Amount % Amount % CURRENT ASSETS CURRENT LIABILITIES
Cash and cash equivalents $ 8,999,330 21 $ 5,035,778 11 Financial liabilities at fair value through profit or loss $ 1,354 - $ 71,626 - Financial assets at fair value through profit or loss 331,237 1 619,776 1 Accounts payable 4,595,047 11 5,976,351 13 Accounts receivable, net 3,125,238 7 3,362,777 7 Payable to related parties 161,989 - 719,683 2 Receivable from related parties 1,280,500 3 2,084,364 4 Accrued expenses 1,840,098 4 2,628,409 5 Other receivable 505,189 1 701,045 1 Other payable to related parties 375,874 1 433,474 1 Other receivable from related parties 2,358,837 5 3,106,331 7 Payable for equipment purchased 842,303 2 1,979,493 4 Inventories 2,358,037 5 4,374,498 9 Other payable 982,251 2 2,308,297 5 Pledged time deposits 10,994 - 11,281 - Current portion of long-term debt 1,479,250 3 500,250 1 Other current assets 652,690 2 753,843 2 Other current liabilities 329 - 112,637 -
Total current assets 19,622,052 45 20,049,693 42 Total current liabilities 10,278,495 23 14,730,220 31
LONG-TERM INVESTMENTS LONG-TERM LIABILITIES
Investments accounted for under equity method 5,549,730 13 5,990,156 13 Long-term debt 5,513,212 13 1,504,462 3 Available-for-sale financial assets 1,553,169 3 1,466,357 3 Hedging derivative liabilities - - 105,989 - Hedging derivative assets 42,653 - - - Long-term payable 532,124 1 - - Financial assets carried at cost 48,075 - 140,680 -
Total long-term liabilities 6,045,336 14 1,610,451 3 Total long-term investments 7,193,627 16 7,597,193 16
OTHER LIABILITIES PROPERTIES Deferred credits 17,564 - 35,106 -
Cost Buildings 4,043,514 9 4,044,187 8 Total liabilities 16,341,395 37 16,375,777 34 Machinery and equipment 61,447,275 139 62,425,603 131 Transportation equipment 4,902 - 8,111 - STOCKHOLDERS’ EQUITY Furniture and equipment 265,073 1 268,493 1 Common stock, $10 par value, authorized: 9,000,000,000 shares; issued: Leasehold improvements 5,744 - 1,345 - 2,929,240,808 shares in 2012 and 5,858,481,616 shares in 2011 29,292,408 66 58,584,816 122
Total cost 65,766,508 149 66,747,739 140 Capital surplus 804,775 2 1,255,363 3 Less: Accumulated depreciation 56,805,835 129 56,726,728 119 Retained earnings (accumulated losses) Accumulated impairment 304,982 - 228,553 1 Legal reserve - - 1,437,949 3
8,655,691 20 9,792,458 20 Deficit (1,811,731 ) (4 ) (29,321,045 ) (61 ) Construction in progress and prepayments for equipment, net 6,968,276 16 9,011,091 19 Others
Cumulative translation adjustments 226,406 1 332,101 1 Properties, net 15,623,967 36 18,803,549 39 Unrealized loss on financial instruments (780,148 ) (2 ) (885,125 ) (2 )
INTANGIBLE ASSETS Total stockholders’ equity 27,731,710 63 31,404,059 66
System software costs, net 16,959 - 34,654 - Prepaid pension cost 64,418 - 64,412 - Deferred technology transfer and license fees, net 943,579 2 538,945 1
Total intangible assets 1,024,956 2 638,011 1
OTHER ASSETS
Idle assets, net 597,824 1 679,196 2 Others 10,679 - 12,194 -
Total other assets 608,503 1 691,390 2
TOTAL $ 44,073,105 100 $ 47,779,836 100 TOTAL $ 44,073,105 100 $ 47,779,836 100
- 3 -
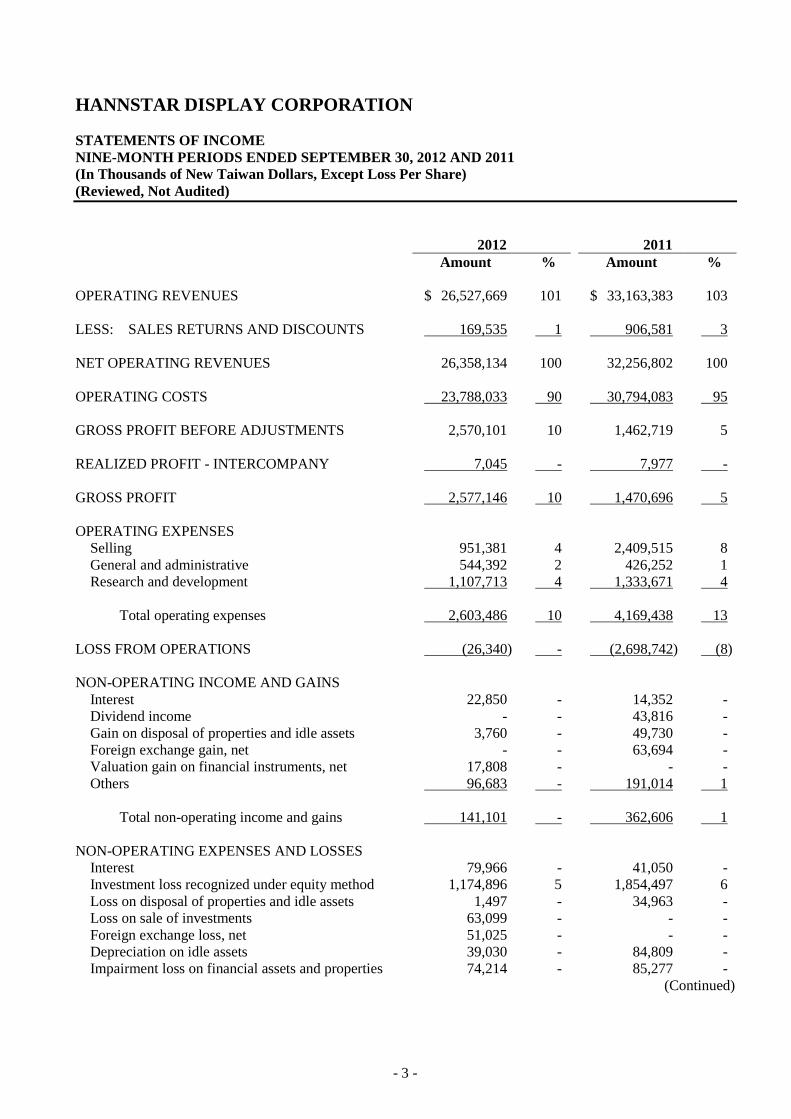
HANNSTAR DISPLAY CORPORATION STATEMENTS OF INCOME NINE-MONTH PERIODS ENDED SEPTEMBER 30, 2012 AND 2011 (In Thousands of New Taiwan Dollars, Except Loss Per Share) (Reviewed, Not Audited) 2012 2011 Amount % Amount % OPERATING REVENUES $ 26,527,669 101 $ 33,163,383 103 LESS: SALES RETURNS AND DISCOUNTS 169,535 1 906,581 3 NET OPERATING REVENUES 26,358,134 100 32,256,802 100 OPERATING COSTS 23,788,033 90 30,794,083 95 GROSS PROFIT BEFORE ADJUSTMENTS 2,570,101 10 1,462,719 5 REALIZED PROFIT - INTERCOMPANY 7,045 - 7,977 - GROSS PROFIT 2,577,146 10 1,470,696 5 OPERATING EXPENSES
Selling 951,381 4 2,409,515 8 General and administrative 544,392 2 426,252 1 Research and development 1,107,713 4 1,333,671 4
Total operating expenses 2,603,486 10 4,169,438 13
LOSS FROM OPERATIONS (26,340) - (2,698,742) (8) NON-OPERATING INCOME AND GAINS
Interest 22,850 - 14,352 - Dividend income - - 43,816 - Gain on disposal of properties and idle assets 3,760 - 49,730 - Foreign exchange gain, net - - 63,694 - Valuation gain on financial instruments, net 17,808 - - - Others 96,683 - 191,014 1
Total non-operating income and gains 141,101 - 362,606 1
NON-OPERATING EXPENSES AND LOSSES
Interest 79,966 - 41,050 - Investment loss recognized under equity method 1,174,896 5 1,854,497 6 Loss on disposal of properties and idle assets 1,497 - 34,963 - Loss on sale of investments 63,099 - - - Foreign exchange loss, net 51,025 - - - Depreciation on idle assets 39,030 - 84,809 - Impairment loss on financial assets and properties 74,214 - 85,277 -
(Continued)
- 4 -
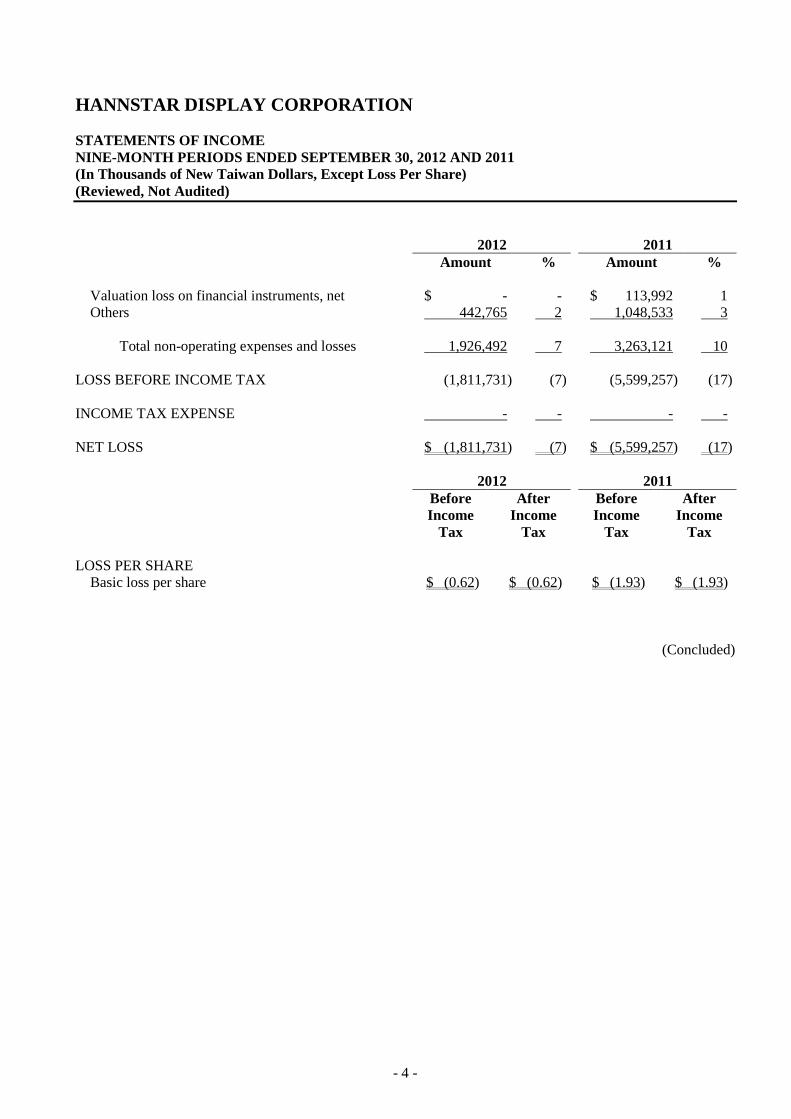
HANNSTAR DISPLAY CORPORATION STATEMENTS OF INCOME NINE-MONTH PERIODS ENDED SEPTEMBER 30, 2012 AND 2011 (In Thousands of New Taiwan Dollars, Except Loss Per Share) (Reviewed, Not Audited) 2012 2011 Amount % Amount %
Valuation loss on financial instruments, net $ - - $ 113,992 1 Others 442,765 2 1,048,533 3
Total non-operating expenses and losses 1,926,492 7 3,263,121 10
LOSS BEFORE INCOME TAX (1,811,731) (7) (5,599,257) (17) INCOME TAX EXPENSE - - - - NET LOSS $ (1,811,731) (7) $ (5,599,257) (17) 2012 2011 Before
Income Tax
After Income
Tax
Before Income
Tax
After Income
Tax LOSS PER SHARE
Basic loss per share $ (0.62) $ (0.62) $ (1.93) $ (1.93) (Concluded)
- 5 -
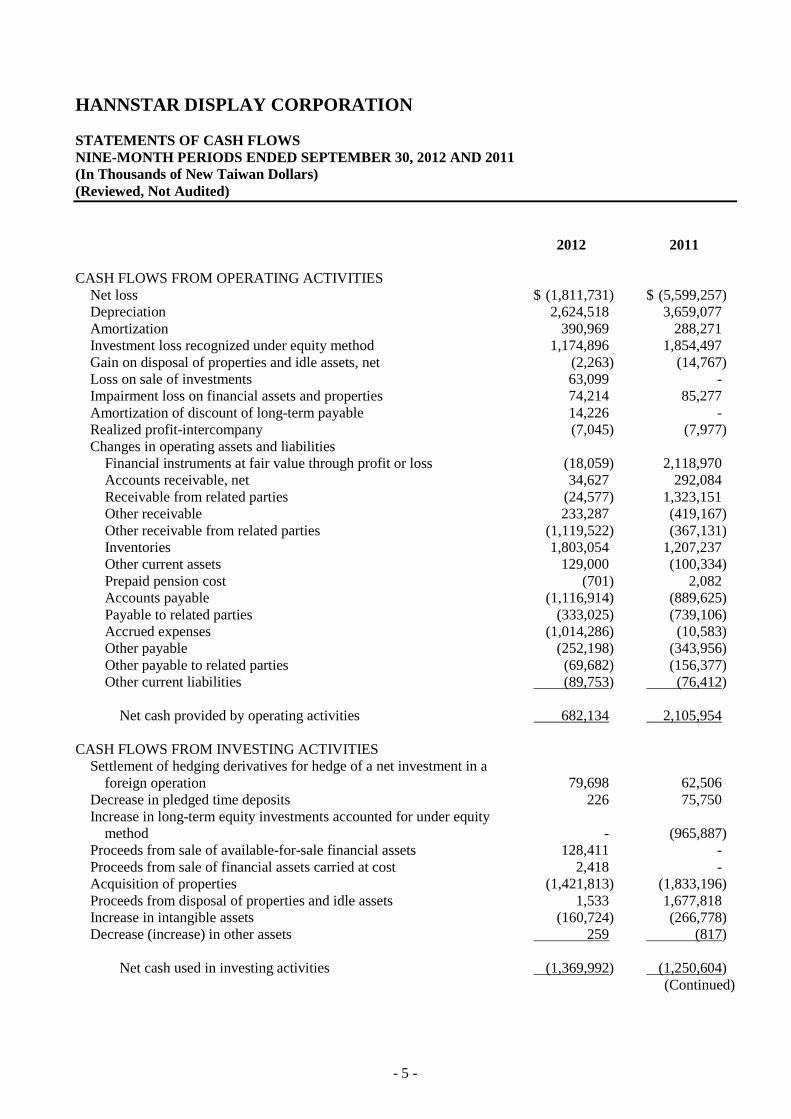
HANNSTAR DISPLAY CORPORATION STATEMENTS OF CASH FLOWS NINE-MONTH PERIODS ENDED SEPTEMBER 30, 2012 AND 2011 (In Thousands of New Taiwan Dollars) (Reviewed, Not Audited) 2012 2011 CASH FLOWS FROM OPERATING ACTIVITIES
Net loss $ (1,811,731) $ (5,599,257) Depreciation 2,624,518 3,659,077 Amortization 390,969 288,271 Investment loss recognized under equity method 1,174,896 1,854,497 Gain on disposal of properties and idle assets, net (2,263) (14,767) Loss on sale of investments 63,099 - Impairment loss on financial assets and properties 74,214 85,277 Amortization of discount of long-term payable 14,226 - Realized profit-intercompany (7,045) (7,977) Changes in operating assets and liabilities
Financial instruments at fair value through profit or loss (18,059) 2,118,970 Accounts receivable, net 34,627 292,084 Receivable from related parties (24,577) 1,323,151 Other receivable 233,287 (419,167) Other receivable from related parties (1,119,522) (367,131) Inventories 1,803,054 1,207,237 Other current assets 129,000 (100,334) Prepaid pension cost (701) 2,082 Accounts payable (1,116,914) (889,625) Payable to related parties (333,025) (739,106) Accrued expenses (1,014,286) (10,583) Other payable (252,198) (343,956) Other payable to related parties (69,682) (156,377) Other current liabilities (89,753) (76,412)
Net cash provided by operating activities 682,134 2,105,954
CASH FLOWS FROM INVESTING ACTIVITIES
Settlement of hedging derivatives for hedge of a net investment in a foreign operation
79,698 62,506
Decrease in pledged time deposits 226 75,750 Increase in long-term equity investments accounted for under equity
method - (965,887)
Proceeds from sale of available-for-sale financial assets 128,411 - Proceeds from sale of financial assets carried at cost 2,418 - Acquisition of properties (1,421,813) (1,833,196) Proceeds from disposal of properties and idle assets 1,533 1,677,818 Increase in intangible assets (160,724) (266,778) Decrease (increase) in other assets 259 (817)
Net cash used in investing activities (1,369,992) (1,250,604)
(Continued)
- 6 -
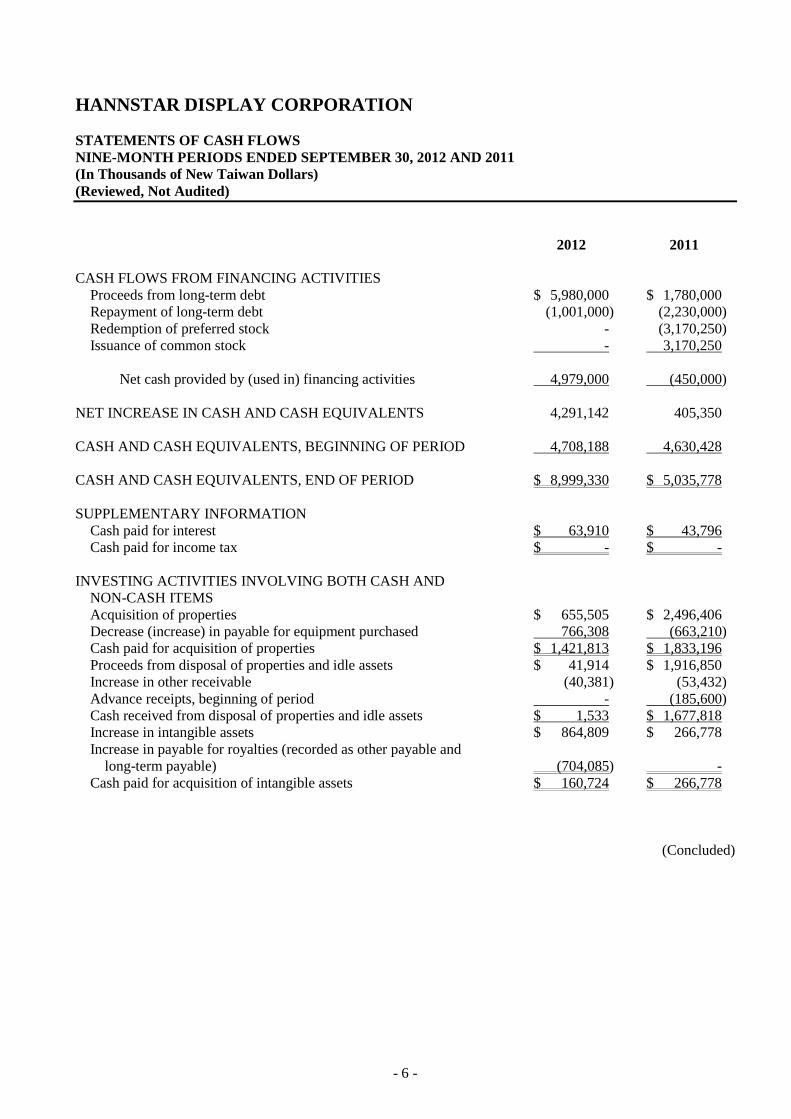
HANNSTAR DISPLAY CORPORATION STATEMENTS OF CASH FLOWS NINE-MONTH PERIODS ENDED SEPTEMBER 30, 2012 AND 2011 (In Thousands of New Taiwan Dollars) (Reviewed, Not Audited) 2012 2011 CASH FLOWS FROM FINANCING ACTIVITIES
Proceeds from long-term debt $ 5,980,000 $ 1,780,000 Repayment of long-term debt (1,001,000) (2,230,000) Redemption of preferred stock - (3,170,250) Issuance of common stock - 3,170,250
Net cash provided by (used in) financing activities 4,979,000 (450,000)
NET INCREASE IN CASH AND CASH EQUIVALENTS 4,291,142 405,350 CASH AND CASH EQUIVALENTS, BEGINNING OF PERIOD 4,708,188 4,630,428 CASH AND CASH EQUIVALENTS, END OF PERIOD $ 8,999,330 $ 5,035,778 SUPPLEMENTARY INFORMATION
Cash paid for interest $ 63,910 $ 43,796 Cash paid for income tax $ - $ -
INVESTING ACTIVITIES INVOLVING BOTH CASH AND
NON-CASH ITEMS
Acquisition of properties $ 655,505 $ 2,496,406 Decrease (increase) in payable for equipment purchased 766,308 (663,210) Cash paid for acquisition of properties $ 1,421,813 $ 1,833,196 Proceeds from disposal of properties and idle assets $ 41,914 $ 1,916,850 Increase in other receivable (40,381) (53,432) Advance receipts, beginning of period - (185,600) Cash received from disposal of properties and idle assets $ 1,533 $ 1,677,818 Increase in intangible assets $ 864,809 $ 266,778 Increase in payable for royalties (recorded as other payable and
long-term payable) (704,085) -
Cash paid for acquisition of intangible assets $ 160,724 $ 266,778 (Concluded)