Embed Size (px)
Citation preview
DPRIETI Discussion Paper Series 19-E-079
Income Stratification of Potential Care Workers amongInternal Migrants in China
OKUBO, ShokiUniversity of Tokyo
KAWATA, KeisukeUniversity of Tokyo
YIN, TingRIETI
ZHONG, RenyaoEast China Normal University
The Research Institute of Economy, Trade and Industryhttps://www.rieti.go.jp/en/
1
RIETI Discussion Paper Series 19-E-079
October 2019
Income Stratification of Potential Care Workers among Internal Migrants in China*
Shoki OKUBO (University of Tokyo)
Keisuke KAWATA (University of Tokyo)
Ting YIN (Research Institute of Economy, Trade and Industry)
Renyao ZHONG (East China Normal University)
Abstract
In China, the demand for care work is increasing with the aging of the population. Care
services are mainly provided by internal migrants and their wages are found to be particularly
low among internal migrants. However, there are few articles that have examined disparities
of potential care workers using nationally representative internal migrant data. In terms of the
different types of disparities, there are two main forms: inequality and stratification. Inequality
refers to variation in absolute levels, whereas stratification refers to segmentation of relative
ranks. This paper measures how the stratification index of potential care workers among
internal migrants has changed from 2011 to 2015. The results of a nonparametric stratification
index (NSI) shows that income stratification between care/non-care work exhibits a declining
trend. Decomposition analysis revealed that NSI in each year was apparent by between gender
stratification rather than within gender stratification. Furthermore, counterfactual analysis
shows that income stratification between care/non-care work would have risen even more than
it actually did if care/non-care work differences in educational attainment had remained at
their 2011 levels.
Keywords: stratification, inequality, elderly care, internal migration, occupation
JEL classification: J6, J4, I3,
The RIETI Discussion Papers Series aims at widely disseminating research results in the form of
professional papers, with the goal of stimulating lively discussion. The views expressed in the papers
are solely those of the author(s), and neither represent those of the organization(s) to which the
author(s) belong(s) nor the Research Institute of Economy, Trade and Industry.
* This study is conducted as a part of the Project “Economic Analysis of the Development of the Nursing Care
Industry in China and Japan” undertaken at the Research Institute of Economy, Trade and Industry (RIETI). The
author is grateful for helpful comments and suggestions by Hiroshi Ishida, Shin Arita, Sho Fujihara, Kenji
Ishida, Zheren Wu, Yuichiro Yoshida, Makoto Yano, Masayuki Morikawa, Keiichiro Kobayashi and Discussion
Paper seminar participants at RIETI.
1 Introduction
1.1 Internal Migration and Elderly Care in China
In China, the demand for care work is increasing with the aging of the population. According
to a new World Bank report (Glinskaya and Feng 2018), 26 percent of China’s population
is expected to be 65 or older, and about 8 percent will be 80 or older by 2050. To tackle
this problem, China would require a balanced mix of services across home, community, and
institutional settings that can best meet elderly people’s preferences and needs. As Glinskaya
and Feng (2018) states, China is experiencing one of the most rapid transitions to an aging
society ever witnessed. Over the next 25 years, 14 percent of China’s population will be
over 65 years of age, up from 7 percent in 2002. This transition took 115 years for France,
45 years for England, and 69 years for the United States. This rapid aging poses various
problems in informal care. Traditionally, families are the primary source of informal care
for older Chinese relatives. However, changes in family structure, economic development and
migration are making it difficult to access informal care for elderly people. These changes are
similar to what the other developed countries have experienced.
As many aging societies have already experienced, the elderly care market needs more
human resources as the population ages. Recruiting and maintaining care workers is an
urgent issue in the elderly care policy. In China, the shortage of qualified and skilled labor
in its current long-term care workforce is particularly acute. The China National Committee
on Aging reports that about 80 percent of families seeking long-term care have unmet need.
According to national research, the elder care industry needs 10 million care workers, of
which a great majority would provide care in institutional care facilities. However, by 2015,
2
China only had roughly 1 million elder care workers and among them, merely 20,000 had
received official training. These gaps have major implications for the quantity and quality of
care provided, particularly because long-term care is labor-intensive in nature (Glinskaya and
Feng 2018).
1.2 Stratification of Care Workers among Occupation in China
Most of the care workers are front-line workers who directly support the basic activities of
daily life, such as eating, bathing, changing clothes, using toilets. On the other hand, the
long-term care workers also include a group of licensed health professionals such as registered
nurses, licensed practical/vocational nurses, social workers, physical therapists, occupational
therapists, physician assistants/aides, and long-term care facility administrators, who often
assume supervising or managerial responsibilities rather than providing direct, hands-on care
(Stone and Harahan 2010). China is facing a shortage of low-skilled workers in all industries
due to a decline in the overall working-age population and rapid urbanization and industrial-
ization of the western and central regions (Glinskaya and Feng 2018).
Elderly care workers generally have a low socioeconomic status in China. Dong et al. (2017)
also shows that care workers earn about 28 percent less than other domestic workers do in
Shanghai. The reference wage set by the Shanghai Municipal Bureau of Labor in 2012 was
RMB 2,200 for elderly care workers, compared to RMB 4,600 for child care workers. These
studies shows that elderly care workers are the most disadvantaged subgroup of the domestic
worker social class. That is, the rank of care workers in social stratification is considered to
be low. However, there have been no papers that have actually examined the stratification of
care workers using large-scale survey data.
3
Also, according to recent research by the Ministry of Civil Affairs on 2,158 elder care
workers in approximately 120 care facilities across 15 provinces, these workers are mainly
older females with low levels of education, mostly from rural areas, and highly mobile (MOCA
2012)1. MOCA (2012) suggests that care work is mainly supplied by internal migrants.
China has witnessed substantial internal migration in recent decades. The latest population
census shows that internal migrants in China numbered around 221 million in 2010, which
accounts for one-sixth of the national population. Most internal migrants target urban areas,
contributing to increasing levels of urbanization. In 2011, the population of urban residents in
China surpassed the rural population for the first time in history. By the end of 2014, urban
residents accounted for around 54.8 percent of the national population (Niu and Qi 2015).
Therefore, in order to evaluate the stratification of care workers in China, it is important
to focus on internal migrant care workers. In this paper, we focus on the stratification of
internal migrant care workers. It has been said that the economic stratification status of
internal migrants and care workers are low, but few studies have examined how low they
are. We clarify the degree of stratification of potential care workers among internal migrants
compared with other occupations.
1According to MOCA (2012), the details are as follows. Around 83.5 percent of them were female. About
51 percent of them are in the 40-49 age group, and 28 percent in the 50 and older group. Very basic levels of
education and training were required to qualify as elder care workers, with about 45.2 percent of them being
junior middle school graduates. With respect to experience, 14.8 percent of these workers had less than one
year of experience, while 25.9 percent had 1-2 years of experience.
4
2 Inequality and stratification
In this paper, we measure how the stratification index of potential care workers in the internal
migrants has changed from 2011 to 2015 using national representative data. Stratification
and inequality are among the oldest, most central, and most intensely debated concepts
in sociology (e.g., Blau and Duncan 1967; Erikson and Goldthorpe 1992), and these are
representative indicators of the disparity. What are the differences between inequality and
stratification? Zhou and Wodtke (2019) summarize these differences as follows. Inequality
refers to the extent to which a valued resource is distributed unevenly across individuals
or between population subgroups. Stratification, by contrast, refers to the extent to which
population subgroups occupy separate hierarchical layers within an overall distribution of
resources (Lasswell 1965; Yitzhaki and Lerman 1991; Zhou 2012). The distinction between
inequality and stratification parallels the distinction between variation and segmentation and
the associated distinction between levels and ranks. Inequality refers to variation in absolute
levels, whereas stratification refers to segmentation of relative ranks (Zhou 2012). To illustrate
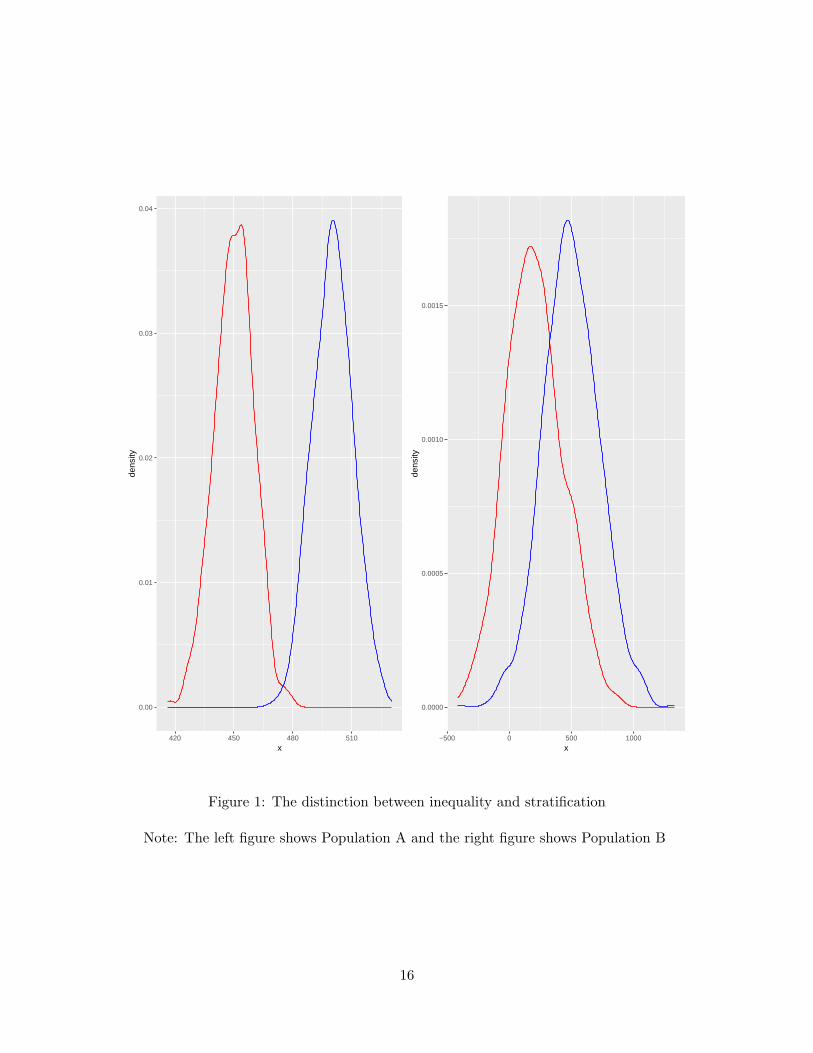
this difference, let us look at Figure 1.
[FIGURE 1 HERE]
Figure 1 shows two hypothetical populations. Two populations, A and B, are composed of
male and female workers. In population A, the average annual income of male is 5 million
yen, and that of female is 4.5 million yen, indicating that there is no major inequality. On
the other hand, there is almost no overlap in the distribution of the average annual income of
male and female. That is, even when high-income female and low-income male are compared,
the latter has a higher average annual income than the former, which means that it is a
5
society in which stratification by gender is progressing (high). In population B, the average
annual income of male is 5 million yen, and that of female is 2 million yen, indicating that
there is major inequality. However, the distribution of the average annual income of male
and female has a large variance, and the overlapping area is large. That is, when comparing
high-income female and low-income male, the latter is often lower than the former, which
means that it is a society in which stratification by gender has not progressed. Differences
between inequality and stratification are also differences between variation and segmentation.
To better understand this difference, it is important to consider the differences between levels
and ranks (Zhou 2012). To assess the magnitude of the variation (inequality), the researcher
must obtain the absolute level of all individual observations. In contrast, only ranks are
needed to assess the degree of segmentation (stratification).
3 Data and Methods
3.1 Data and Variables
To illustrate the stratification index of internal migrant potential care workers in China,
we use China Migrants Dynamic Survey (CMDS) 2011-2015, which is based on the annual
national representative survey of the migrant population conducted by the National Health
Commission of PRC since 2009. CMDS has a sample size of around 200,000, drawn from 31
provinces (autonomous regions and municipalities). The sample size for each year is 128,000
(2011), 158,556 (2012), 198,795 (2013), 200,937 (2014), 206,000 (2015). The sampling was
implemented by the stratified multistage probability proportional to size (PPS) method. In
the first stage, towns/subdistricts were selected according to the PPS method. In the second
6
phase, villages/community groups were selected from these owns/subdistricts. At the third
stage, individual participants were randomly sampled from these village/community groups.
The variables used in the analysis are as follows. We use monthly income as an outcome.
We use gender and occupation as variables to examine the relationship with income in terms
of stratification. Since CMDS can not identify the care worker as an occupation, we use a
home helper as a potential care worker here. Thus, for occupations, dummy variables for
potential care workers are created.
3.2 Methods
There were various indicators of inequality, such as the Gini coefficient, Theil index, Atkinson
index, but indicators related to the stratification have hardly been studied except for Itzhaki
and Lerman’s index (Itzhaki and Lerman 1991). In the following, we introduce nonparametric
stratification index (NSI) proposed by Zhou (2012). Below we explain NSI according to Zhou
(2012).
NSI captures the overall extent of stratification for the population with a value between 0
and 1. More important, it is fully nonparametric and thus independent of the distribution
of levels. We introduce the following three points, (1) definition and properties of NSI, (2)
decomposition of the overall NSI into pair-specific components, and (3) counterfactual trends
using decomposition weights.
We start introducing a new index from the case of two groups. Let yi be the income of
the ith man and yj the income of the jth woman and suppose a population that consists of
nM male and nF female. First, we order all the subjects (including male and female) from
the lowest to the highest in terms of income and use rMi and rFi to denote the ranks of
7
the ith male and of the jth female. Then, we calculate the average ranks both for men and
women and denote them RM and RF . For convenience, we assume RM > RF on average. We
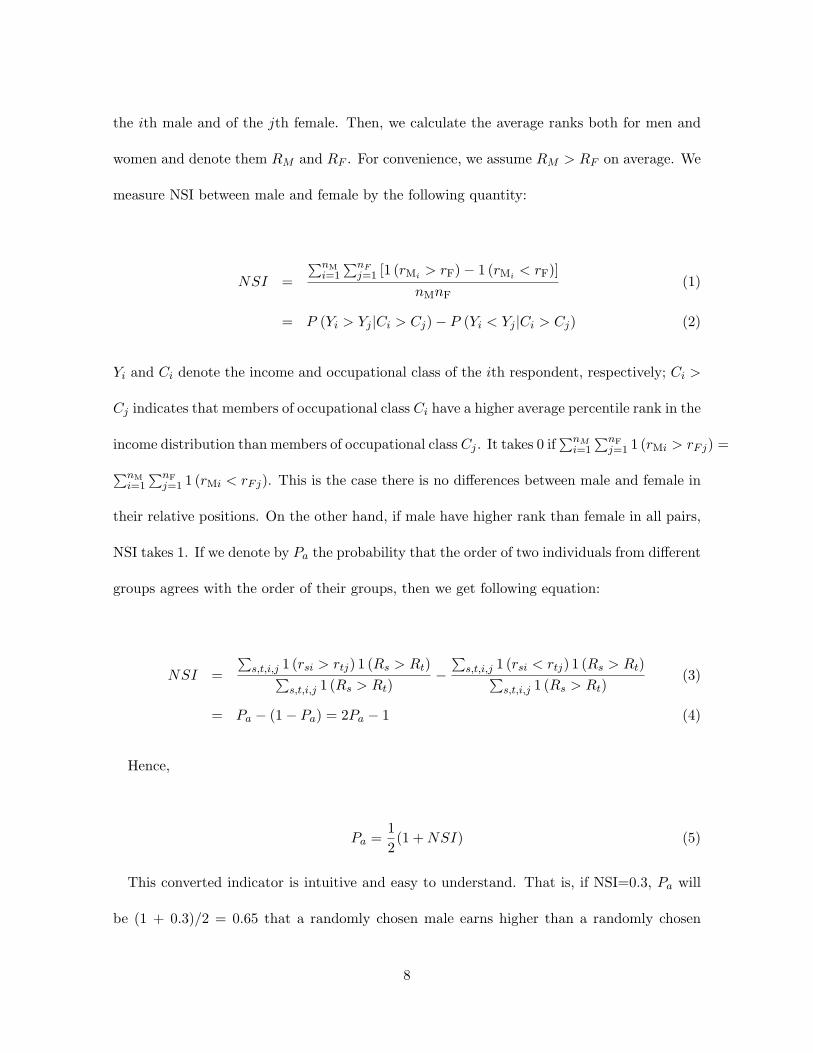
measure NSI between male and female by the following quantity:
NSI =
∑nMi=1
∑nFj=1 [1 (rMi > rF)− 1 (rMi < rF)]
nMnF(1)
= P (Yi > Yj |Ci > Cj)− P (Yi < Yj |Ci > Cj) (2)
Yi and Ci denote the income and occupational class of the ith respondent, respectively; Ci >
Cj indicates that members of occupational class Ci have a higher average percentile rank in the
income distribution than members of occupational class Cj . It takes 0 if∑nM
i=1
∑nFj=1 1 (rMi > rFj) =∑nM
i=1
∑nFj=1 1 (rMi < rFj). This is the case there is no differences between male and female in
their relative positions. On the other hand, if male have higher rank than female in all pairs,
NSI takes 1. If we denote by Pa the probability that the order of two individuals from different
groups agrees with the order of their groups, then we get following equation:
NSI =
∑s,t,i,j 1 (rsi > rtj) 1 (Rs > Rt)∑
s,t,i,j 1 (Rs > Rt)−
∑s,t,i,j 1 (rsi < rtj) 1 (Rs > Rt)∑
s,t,i,j 1 (Rs > Rt)(3)
= Pa − (1− Pa) = 2Pa − 1 (4)
Hence,
Pa =1
2(1 +NSI) (5)
This converted indicator is intuitive and easy to understand. That is, if NSI=0.3, Pa will
be (1 + 0.3)/2 = 0.65 that a randomly chosen male earns higher than a randomly chosen
8
female with a probability of 0.65. The index defined previously gauges the overall extent of
stratification pertaining to a given grouping scheme.
NSI can also be expressed as a weighted average of pair-specific components. The decom-
position into a weighted average of 2 components given grouping scheme can be expressed as
follows:
πbNSIgb + πwNSIgw (6)
where,
πb = P (Gi ̸= Gj |Ci > Cj) (7)
NSIgb = P (Yi > Yj |Ci > Cj , Gi = Gj)− P (Yi < Yj |Ci > Cj , Gi = Gj) (8)
πw = P (Gi = Gj |Ci > Cj) (9)
NSIgb = P (Yi > Yj |Ci > Cj , Gi = Gj)− P (Yi < Yj |Ci > Cj , Gi = Gj) (10)
πb is the proportion of pairwise comparisons between groups (Gi and Gj) occurring between
different gender. NSIgb is the level of gender stratification occurring between groups. πw is
the proportion of pairwise comparisons between groups occurring within gender. NSIgb is the
level of gender stratification occurring within groups. All these values can be calculated from
the data.
Finally, in the third stage of the analysis, we assess whether observed NSI changes are related
to changes in the educational attainment of the workforce and broad shifts in employment
patterns across industries. To evaluate the impact of changes in educational attainment, we
adjust the weight for each respondent in occupational classification c, education level e, and
9
year t as follows:
wcet =π2011 (Ei = e|Ci = c)
πt (Ei = e|Ci = c)(11)
where Ei denotes a respondent’s level of education and πt(Ei = e|Ci = c) denotes the pro-
portion of respondents with education level e within occupational class c in year t. Reweighting
the sample by wcet transforms the class-specific educational distributions to be the same as
those in 2011, but it does not alter the marginal distribution of respondents across classes in
any year. Then we calculate NSI with the reweighted sample and can assess how much of
the change in occupational class stratification can be attributed to class-specific changes in
educational attainment. Same methods are used to evaluate the impact of industries.
4 Results from China Migrants Dynamic Survey 2011-2015
4.1 Trends in Occupational Class Stratification, 2011-2015
First, we will confirm the income and occupational class stratification. The occupation here
is not limited to the care and non care workers but uses all occupations. This is to verify
to what extent stratification occurs when adopting all occupation classifications compared to
care work dummy indicator. Figure 2 shows the trends in occupational class stratification
from 2011 to 2015. The horizontal axis in Figure 2 represents the survey year, and the
vertical axis represents NSI for occupation. Figure 2 shows that occupational stratification
have a declining trend in NSI. In 2011, NSI is 0.33 and the probability will be (1 + 0.33)/2 =
0.67 that the order of two individuals from different occupation groups agrees with the order
of their occupation groups with a probability of 0.67. In 2015, this probability will be (1 +
10
0.23)/2 = 0.62.
[FIGURE 2 HERE]
To illuminate the distributional changes underlying these broad trends, table 1 shows the
average percentile rank of incomes for each occupation. While the professional and managerial
the average percentile rank are high, the average percentile rank of potential carer worker tends
to lower (0.284 in 2011 and 0.328 in 2015). Furthermore, table 1 can explain why the NSI of
occupations has declined. Occupational NSI has been decreased because of the decrease in
average percentile rank of professional and management occupations and the rise in average
percentile rank of sales, services, care workers occupations.
[TABLE 1 HERE]
Next we focus on potential care workers in China. Table 2 shows the difference in average
income between care workers and non-care workers, ie, inequality. We confirm that the
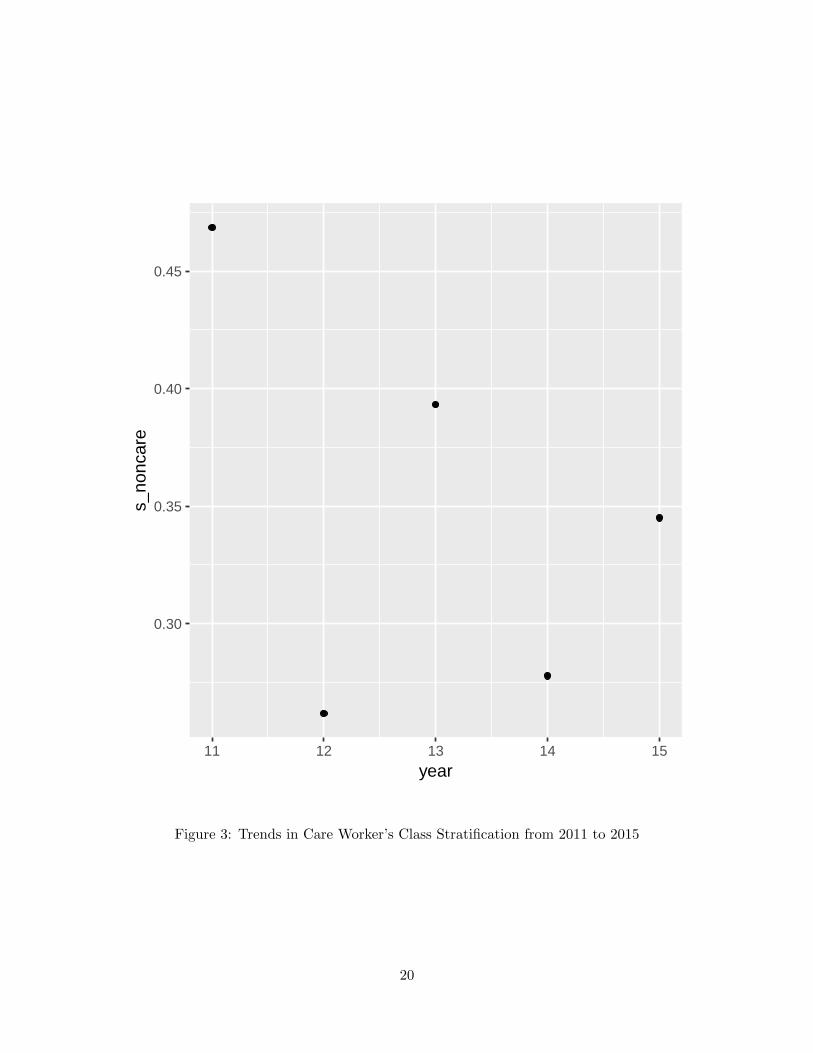
inequality is growing between care and non-care workers. Next, we check the trend of NSI
(stratification). The horizontal axis in Figure 3 represents the survey year, and the vertical
axis represents the non-care workers NSI. It can be seen from Figure 3 that non-care workers
have a declining trend in NSI. In 2011, NSI is 0.47 and the probability will be (1 + 0.47)/2
= 0.74 that a randomly chosen male earns higher than a randomly chosen female with a
probability of 0.74. In 2015, NSI is 0.35 and the probability will be (1 + 0.35)/2 = 0.68 that
a randomly chosen male earns higher than a randomly chosen female with a probability of
0.68. That is, the difference in stratification between care-workers and non-care workers is
getting smaller. From the above, we see that while inequality is increasing between care and
non-care workers, stratification is decreasing.
11
[TABLE 2 HERE]
[FIGURE 3 HERE]
4.2 Decomposition of Trends in Gender Stratification
Then we decompose the overall level of NSI into a weighted average of occupational stratifica-
tion between gender and occupational stratification within gender. Decomposition by gender
is performed both for all occupational classifications and for care work indicator classifications.
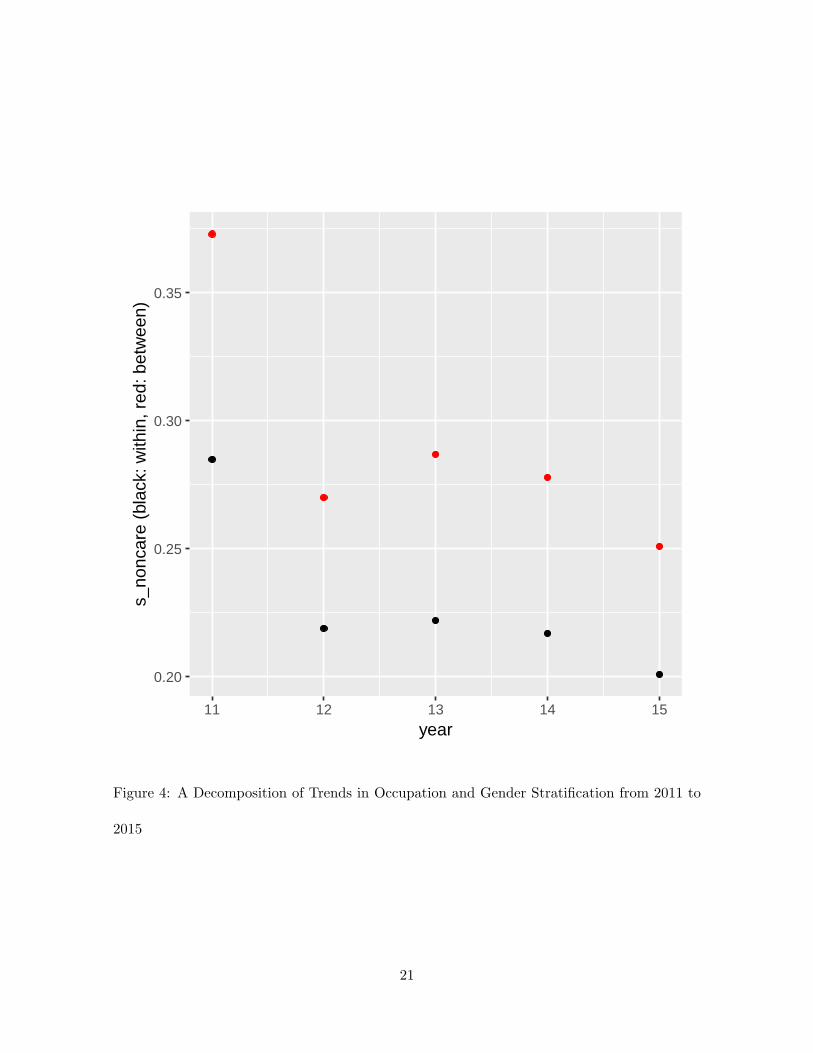
Figure 4 shows the NSI in Figure 2 decomposed into within and between gender. This
result shows that NSI between gender is higher than within gender. Occupational classes
are not highly stratified within gender. Furthermore, the between gender component slightly
increased from 2012 to 2014. By contrast, the within-gender component slightly decreased
from 2012 to 2015.
[FIGURE 4 HERE]
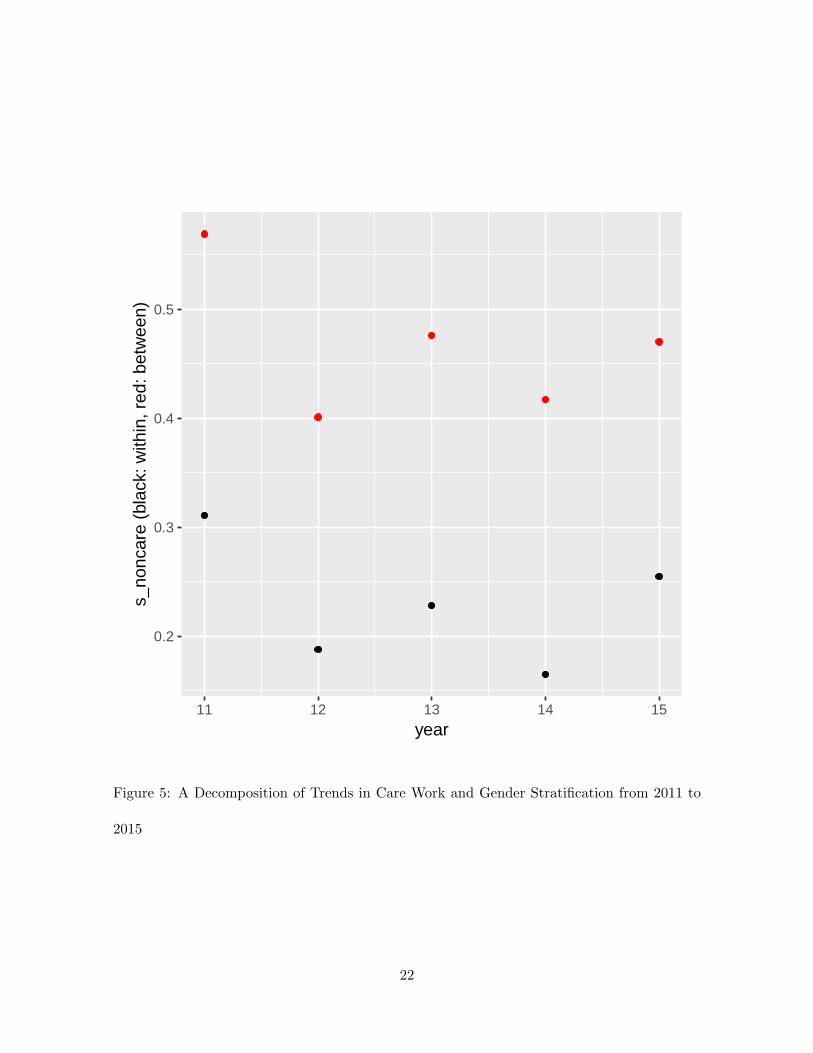
Figure 5 shows the result of decomposition when using the care worker dummy variable as an
occupation indicator.This result shows that NSI between gender is higher than within gender.
This result is the same as using all occupation classifications (Figure 4). In other words,
care workers occupational classes are not highly stratified internally by gender. Because the
decomposition accords more weight to the between rather than the within gender component
(πgb for both genders). Although the NSI tends to decline overall, the within and between
weights do not appear to change.
[FIGURE 5 HERE]
12
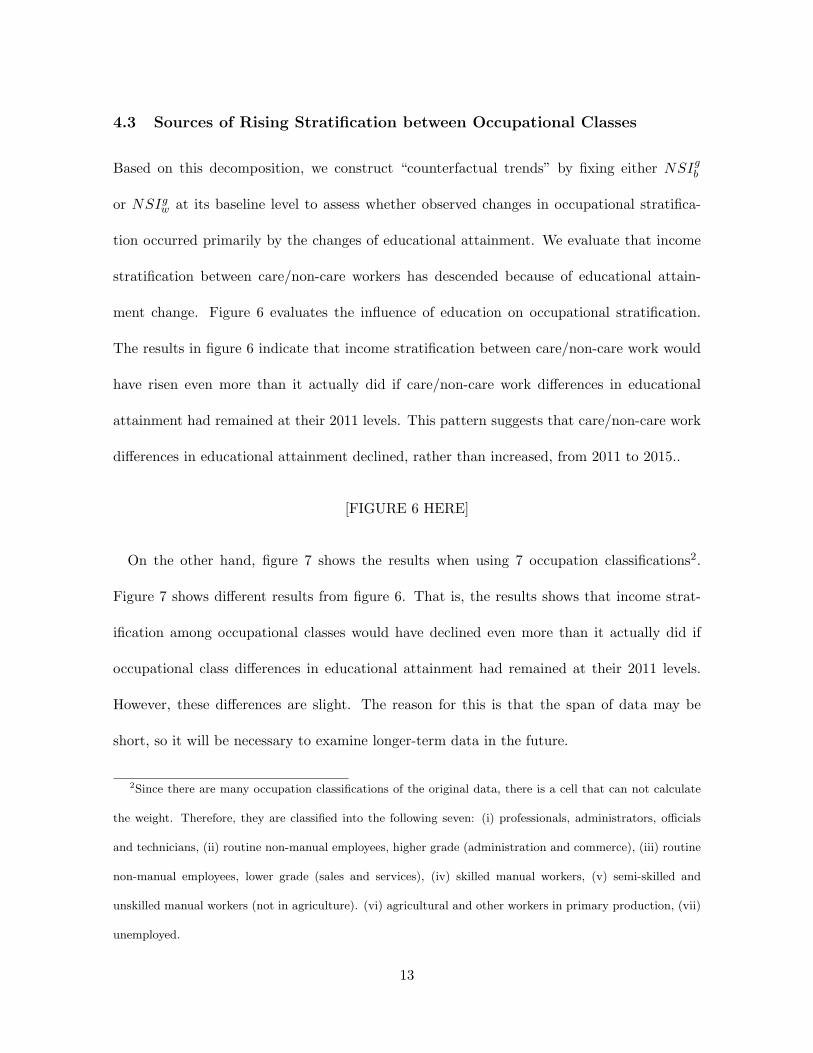
4.3 Sources of Rising Stratification between Occupational Classes
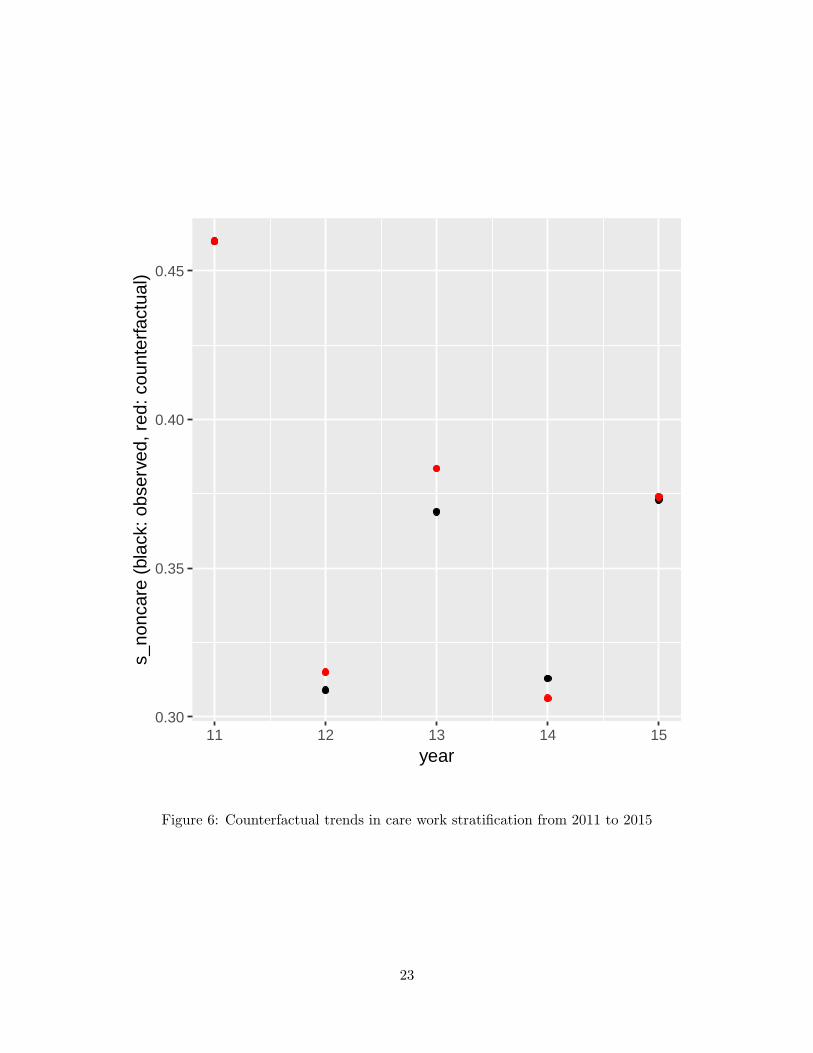
Based on this decomposition, we construct “counterfactual trends” by fixing either NSIgb
or NSIgw at its baseline level to assess whether observed changes in occupational stratifica-
tion occurred primarily by the changes of educational attainment. We evaluate that income
stratification between care/non-care workers has descended because of educational attain-
ment change. Figure 6 evaluates the influence of education on occupational stratification.
The results in figure 6 indicate that income stratification between care/non-care work would
have risen even more than it actually did if care/non-care work differences in educational
attainment had remained at their 2011 levels. This pattern suggests that care/non-care work
differences in educational attainment declined, rather than increased, from 2011 to 2015..
[FIGURE 6 HERE]
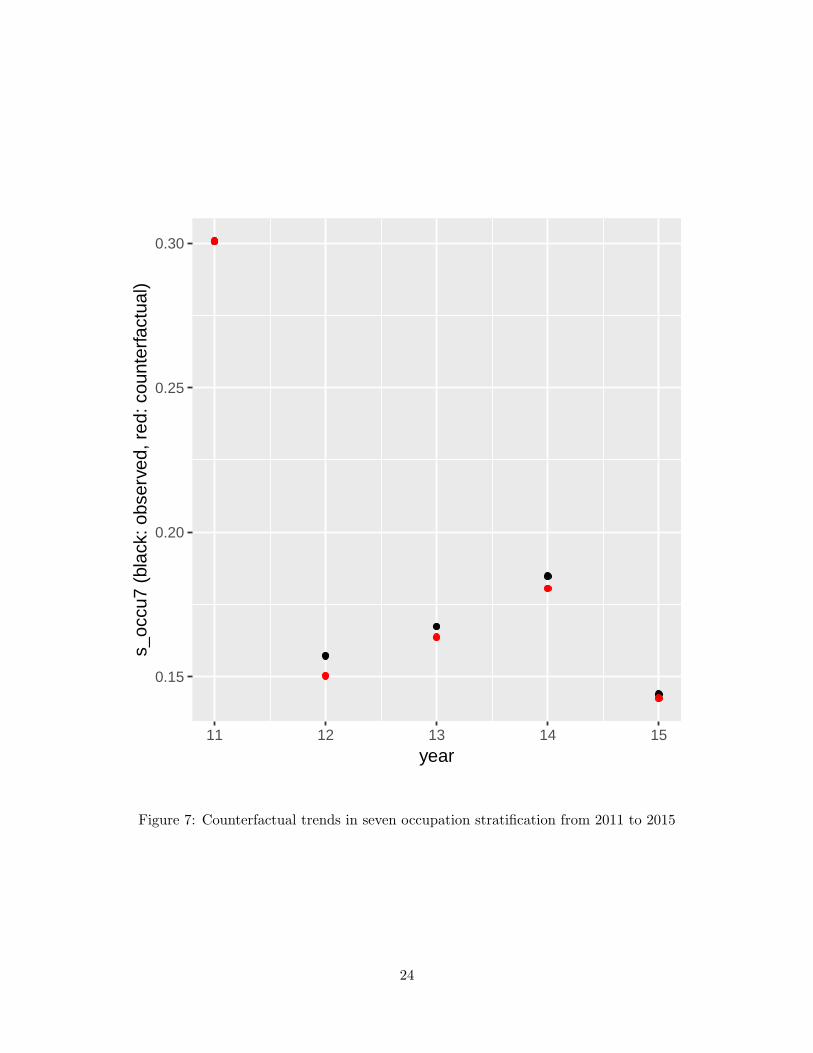
On the other hand, figure 7 shows the results when using 7 occupation classifications2.
Figure 7 shows different results from figure 6. That is, the results shows that income strat-
ification among occupational classes would have declined even more than it actually did if
occupational class differences in educational attainment had remained at their 2011 levels.
However, these differences are slight. The reason for this is that the span of data may be
short, so it will be necessary to examine longer-term data in the future.
2Since there are many occupation classifications of the original data, there is a cell that can not calculate
the weight. Therefore, they are classified into the following seven: (i) professionals, administrators, officials
and technicians, (ii) routine non-manual employees, higher grade (administration and commerce), (iii) routine
non-manual employees, lower grade (sales and services), (iv) skilled manual workers, (v) semi-skilled and
unskilled manual workers (not in agriculture). (vi) agricultural and other workers in primary production, (vii)
unemployed.
13
[FIGURE 7 HERE]
5 Conclusion
This paper measure how the stratification index of care work and occupational classes in
the internal migrants has changed from 2011 to 2015 in China. Referring to approach for
disparities, there are two concepts: inequality and stratification. Inequality refers to variation
in absolute levels, whereas stratification refers to segmentation of relative ranks. We analyse
the following three points, (1) NSI of occupational classes, (2) decomposition of the overall
NSI into pair-specific components, and (3) counterfactual trends using decomposition weights.
The results of nonparametric stratification index shows that occupational stratification have
a declining trend compared to 2011. Decomposition analysis revealed that NSI in each year
was mainly caused by between gender stratification rather than within gender stratification.
Furthermore, counterfactual analysis shows that income stratification between care/non-care
work would have risen even more than it actually did if care/non-care work differences in
educational attainment had remained at their 2011 levels.
References
[1] Blau, Peter M., and Otis Dudley Duncan. 1967. The American Occupational Structure.
New York: John Wiley & Sons.
[2] Dong, Xiao-yuan, Jin Feng, and Yangyang Yu. 2017. “Relative Pay of Domestic Elder-
care Workers in Shanghai, China.” Feminist Economics 23(1): 135-59.
14
[3] Erikson, Robert, and John H. Goldthorpe. 1992. The Constant Flux: A Study of Class
Mobility in Industrial Societies. Oxford: Oxford University Press.
[4] Glinskaya, Elena E., and Feng, Zhanlian. 2018. Options for Aged Care in China : Build-
ing an Efficient and Sustainable Aged Care System. Directions in development; human
development. Washington, D.C. : World Bank Group.
[5] Lasswell, T. 1965. Class and Stratum: An Introduction to Concepts and Research.
Boston: Houghton Mifflin.
[6] Niu, Jianlin., and Qi, Yaqiang. 2015. “Internal migration and health stratification in
urban China.” Asian and Pacific Migration Journal 24(4): 432-462.
[7] Stone, Robyn, and Mary F. Harahan. 2010. “Improving the Long-Term Care Workforce
Serving Older Adults.” Health Affairs 29: 109-15.
[8] Yitzhaki, Shlomo, and Robert I. Lerman. 1991. “Income Stratification and Income In-
equality.” Review of Income and Wealth 37: 313-29.
[9] Zhou, Xiang. 2012. “A Nonparametric Index of Stratification.” Sociological Methodology
42: 365-89.
[10] Zhou, Xian, and Geoffrey T. Wodtke. 2019. “Income Stratification among Occupational
Classes in the United States.” Social Forces 97(3): 945-972.
15
0.00
0.01
0.02
0.03
0.04
420 450 480 510
x
dens
ity
0.0000
0.0005
0.0010
0.0015
−500 0 500 1000
x
dens
ity
Figure 1: The distinction between inequality and stratification
Note: The left figure shows Population A and the right figure shows Population B
16

0.225
0.250
0.275
0.300
0.325
11 12 13 14 15
year
s_oc
cu
Figure 2: Trends in Occupational Class Stratification from 2011-2015
17
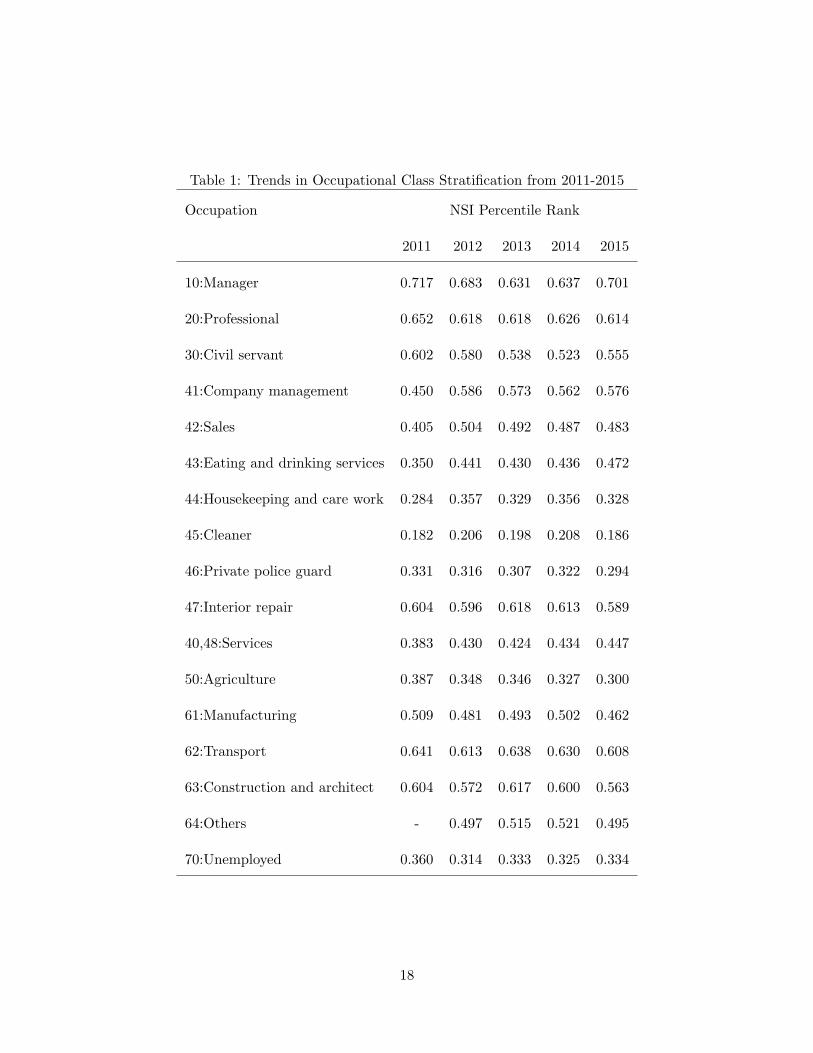
Table 1: Trends in Occupational Class Stratification from 2011-2015
Occupation NSI Percentile Rank
2011 2012 2013 2014 2015
10:Manager 0.717 0.683 0.631 0.637 0.701
20:Professional 0.652 0.618 0.618 0.626 0.614
30:Civil servant 0.602 0.580 0.538 0.523 0.555
41:Company management 0.450 0.586 0.573 0.562 0.576
42:Sales 0.405 0.504 0.492 0.487 0.483
43:Eating and drinking services 0.350 0.441 0.430 0.436 0.472
44:Housekeeping and care work 0.284 0.357 0.329 0.356 0.328
45:Cleaner 0.182 0.206 0.198 0.208 0.186
46:Private police guard 0.331 0.316 0.307 0.322 0.294
47:Interior repair 0.604 0.596 0.618 0.613 0.589
40,48:Services 0.383 0.430 0.424 0.434 0.447
50:Agriculture 0.387 0.348 0.346 0.327 0.300
61:Manufacturing 0.509 0.481 0.493 0.502 0.462
62:Transport 0.641 0.613 0.638 0.630 0.608
63:Construction and architect 0.604 0.572 0.617 0.600 0.563
64:Others - 0.497 0.515 0.521 0.495
70:Unemployed 0.360 0.314 0.333 0.325 0.334
18
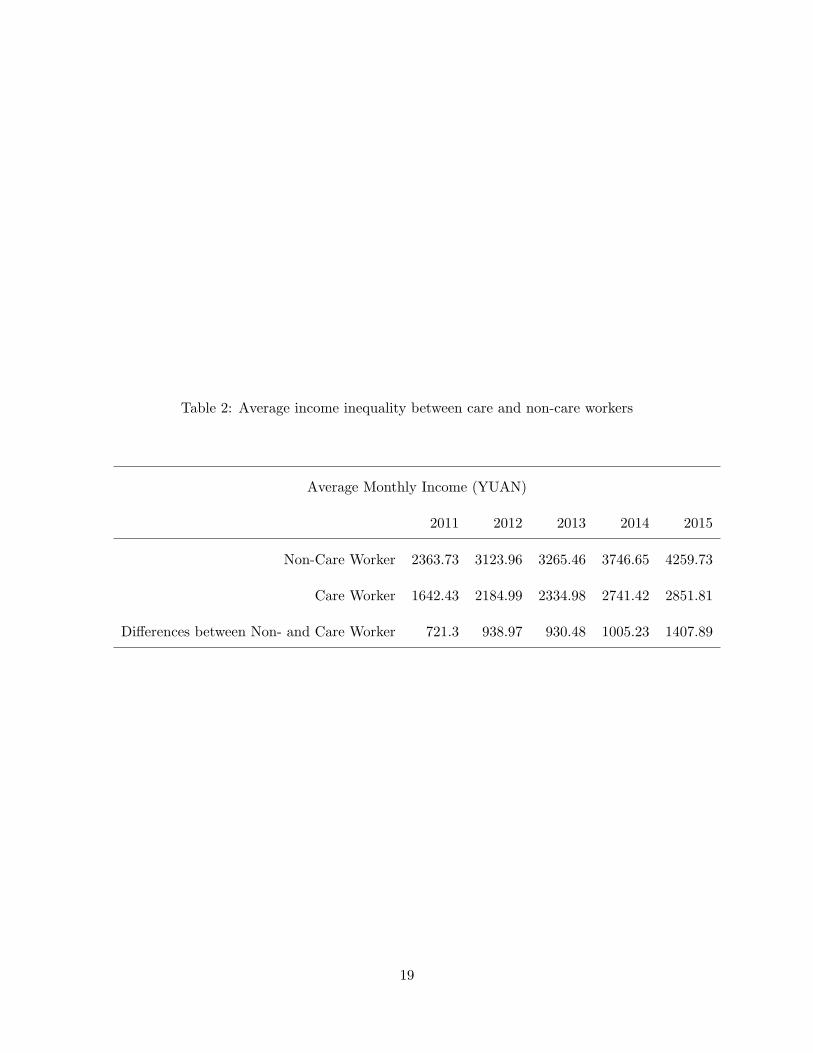
Table 2: Average income inequality between care and non-care workers
Average Monthly Income (YUAN)
2011 2012 2013 2014 2015
Non-Care Worker 2363.73 3123.96 3265.46 3746.65 4259.73
Care Worker 1642.43 2184.99 2334.98 2741.42 2851.81
Differences between Non- and Care Worker 721.3 938.97 930.48 1005.23 1407.89
19
0.30
0.35
0.40
0.45
11 12 13 14 15
year
s_no
ncar
e
Figure 3: Trends in Care Worker’s Class Stratification from 2011 to 2015
20
0.20
0.25
0.30
0.35
11 12 13 14 15
year
s_no
ncar
e (b
lack
: with
in, r
ed: b
etw
een)
Figure 4: A Decomposition of Trends in Occupation and Gender Stratification from 2011 to
2015
21
0.2
0.3
0.4
0.5
11 12 13 14 15
year
s_no
ncar
e (b
lack
: with
in, r
ed: b
etw
een)
Figure 5: A Decomposition of Trends in Care Work and Gender Stratification from 2011 to
2015
22
0.30
0.35
0.40
0.45
11 12 13 14 15
year
s_no
ncar
e (b
lack
: obs
erve
d, r
ed: c
ount
erfa
ctua
l)
Figure 6: Counterfactual trends in care work stratification from 2011 to 2015
23
0.15
0.20
0.25
0.30
11 12 13 14 15
year
s_oc
cu7
(bla
ck: o
bser
ved,
red
: cou
nter
fact
ual)
Figure 7: Counterfactual trends in seven occupation stratification from 2011 to 2015
24