Embed Size (px)
Citation preview

STRESS LEVELS AMONG CONSTRUCTION WORKERS IN KIBERA
RESETTLEMENT ACTION PLAN PROJECT IN NAIROBI CITY COUNTY,
KENYA.
RUTH KAMENE KIOKO (BACHELOR OF ENVIRONMENTAL STUDIES)
Q22/CTY/PT/27344/2014
ENVIRONMENT AND OCCUPATIONAL HEALTH
A RESEARCH THESIS SUBMITTED IN PARTIAL FULFILLMENT OF THE
REQUIREMENTS FOR THE AWARD OF THE DEGREE OF MASTER OF
SCIENCE IN OCCUPATIONAL HEALTH AND SAFETY IN THE SCHOOL OF
PUBLIC HEALTH AND APPLIED HUMAN SCIENCES KENYATTA
UNIVERSITY
NOVEMBER, 2020

ii
DECLARATION
I declare that this thesis is an original and personal work for the fulfillment of the award
of Masters degree at Kenyatta University and has not been submitted in any other
University.
Signature ………………………………….. Date …………………………………
Ruth Kamene Kioko (Q139/CTY/PT/27344/2014)
This research report has been submitted to the University for Examination with an
approval from the Supervisors.
Signature.………………………………… Date …………………………….
Eng. Dr. Fidelis Kilonzo
Department of Biosystems Engineering
Signature.………………………………… Date ……………………….…
Dr. Christine Majale
Department Environmental Planning

iii
DEDICATION
I wish to dedicate this report to my family that is my parents, husband, my friends and
colleagues for of their unending support, patience, understanding and encouragement
during the entire study.

iv
ACKNOWLEDGEMENT
I would like to pass my gratitude and appreciation to each and every person who
contributed in making this research a success. Beginning with my supervisors, Dr.
Fidelis Kilonzo, Dr. Christine Majale and Dr. Gladys Mokua for their liberal advice and
kind help, I appreciate you for all your time and important encounters that have
imparted to me with respect to this Research. Without your help, this dissertation could
have not been successful as it is.
Secondly, I would like to appreciate the respondents to my interviews during data
collection for taking time to participate in my study through sharing views, information
and encounters. I equally appreciate my friends who closely offered a helping hand in
gaining information from respondents when carrying out the project.
Lastly, my gratitude goes to my lovely family for their unending support when carrying
out this research project.

v
TABLE OF CONTENTS
DECLARATION ............................................................................................................ ii
DEDICATION ............................................................................................................... iii
ACKNOWLEDGEMENT ............................................................................................ iv
LIST OF TABLES ....................................................................................................... viii
LIST OF FIGURES ....................................................................................................... ix
ABBREVIATIONS ......................................................................................................... x
DEFINITION OF TERMS ........................................................................................... xi
ABSTRACT .................................................................................................................. xii
CHAPTER ONE: INTRODUCTION ........................................................................... 1
1.1 Background of the Study ........................................................................................ 1
1.2 Problem Statement .................................................................................................. 5
1.3 Justification ............................................................................................................. 7
1.4 Research Questions ................................................................................................. 7
1.5 Hypothesis .............................................................................................................. 8
1.6 Research Aims ........................................................................................................ 8
1.7 Significance of the study and Anticipated Output .................................................. 9
1.8 Limitations and Delimitations of the Research ....................................................... 9
1.9 Models of Stress .................................................................................................... 10
CHAPTER TWO: LITERATURE REVIEW ........................................................... 14
2.1 Introduction ........................................................................................................... 14
2.2 Potential Work Stressors ....................................................................................... 14
2.3 Consequences of Occupational pressure. .............................................................. 17
2.4 Stress Measurement Levels .................................................................................. 19

vi
2.5 Work Stress Management Strategies .................................................................... 20
2.6 Initially done studies on Work Stress .................................................................. 22
2.7 Literature Review Summary ................................................................................. 24
CHAPTER THREE: MATERIALS AND METHODS ............................................ 25
3.1 Introduction ........................................................................................................... 25
3.2 Research Design ................................................................................................... 25
3.3 Variables ............................................................................................................... 25
3.4 Area of study ......................................................................................................... 26
3.5 Study Population ................................................................................................... 26
3.6. Sample size determination ................................................................................... 27
3.7 Study Instruments ................................................................................................. 27
3.8 Data Collection Techniques .................................................................................. 28
3.9 Data Analysis ........................................................................................................ 28
3.10 Logistical and Ethical Considerations ................................................................ 29
CHAPTER FOUR: RESULTS .................................................................................... 30
4.1 Introduction ........................................................................................................... 30
4.2 Response Rate ....................................................................................................... 30
4.3 Respondents Profile .............................................................................................. 31
4.4 Causes of Work Stress .......................................................................................... 34
4.6 Stress Management ............................................................................................... 45
4.7 Inferential Statistics .............................................................................................. 48
CHAPTER FIVE: DISCUSSIONS, CONCLUSIONS AND
RECOMMENDATIONS ............................................................................................. 63
5.1 Discussions ........................................................................................................... 63

vii
5.2 Summary of the findings ....................................................................................... 66
5.3 Conclusions ........................................................................................................... 67
5.4 Recommendations ................................................................................................. 68
5.5 Further Research ................................................................................................... 69
REFERENCES ............................................................................................................. 70
APPENDICES ............................................................................................................... 78
Appendix I: Consent Letter ......................................................................................... 78
Appendix II: Questionnaire ........................................................................................ 81

viii
LIST OF TABLES
Table 2.1 Literature Findings on Work Stress ............................................................ 22
Table 4.2 Task stressors faced by workers in Kibera RAP Project ............................ 34
Table 4.3 Organizational Stressors faced by workers in Kibera RAP Project ............ 36
Table 4.4 Personal Stressors faced by workers in Kibera RAP Project ...................... 38
Table 4.5 Physical stressors faced by workers in Kibera RAP Project ....................... 39
Table 4.7 Subjective Stress Levels ............................................................................. 40
Table 4.8 Objective Stress Levels ............................................................................... 43
Table 4.9 Individual Stress Management Strategies ................................................... 45
Table 4.10 Organizational Stress Management Strategies ............................................ 47
Table 4.11 KMO and Bartlett's Test ............................................................................. 49
Table 4.12 Correlation Matrix ...................................................................................... 49
Table 4.13 Commonalities ............................................................................................ 50
Table 4.14 Factor Extraction ......................................................................................... 52
Table 4.15 Rotated Component Matrix ......................................................................... 54
Table 4.16 Subjective and Objective Stress Levels among Gender of the
Respondents ................................................................................................ 55
Table 4.17 Subjective and Objective Stress Levels among Gender of the
Respondents ................................................................................................ 56
Table 4.18 Subjective and Objective Stress Levels among the Respondents Job
Categories ................................................................................................... 57
Table 4.19 Subjective and Objective Stress Levels among the Respondents Job
Categories ................................................................................................... 58
Table 4.20 Task Stressors and Stress Levels among workers in Kibera RAP Project . 59
Table 4.21 Organizational Stressors and Stress Levels among workers in Kibera
RAP Project ................................................................................................ 60
Table 4.22 Personal Stressors and Stress Levels among workers in Kibera RAP
Project ......................................................................................................... 61
Table 4.23 Physical Stressors and Stress Levels among workers in Kibera RAP
Project ......................................................................................................... 62

ix
LIST OF FIGURES
Figure 1.1 The Conceptual Framework .......................................................................... 12
Figure 4.1 Period Worked by respondents working in Kibera RAP Project .................. 31
Figure 4.2 Age of respondents working in Kibera RAP Project .................................... 32
Figure 4.3 Number of Children per worker .................................................................... 33
Figure 4.4 Scree Plot of components extraction. ............................................................ 53

x
ABBREVIATIONS
HSE - Health Safety Executive
MBI - Maslach Burnout Inventory
OS - Objective stress
RAP - Resettlement Action Plan
SPSS - Statistical Package for Social Sciences
SS - Subjective Stress
UK - United Kingdom
RO-BO - Rust Out Burn Out
KMO - Kaiser Meyer Olkin

xi
DEFINITION OF TERMS
Resettlement action plan project- RAP is a development project that follows procedures
by ensuring mitigation of adverse effects, compensation of losses and development
benefits to the communities and people affected by the project.
Stress- Is a feeling that originate from excessive emotional and mental pressure.
Objective Stress- Is the difference between expected and real ability to handle a job
Subjective stress- The adverse response people have to unreasonable pressure or some
other sort of demands put on them.
Burn out- Is the state in which an individual experience physical, mental and emotional
exhaustion which is brought about by being overwhelmed and being emotionally
drained making it impossible to achieve demands.
Rust out- Rust out is the stress that comes up when skills are not utilized completely.

xii
ABSTRACT
Professionals engaged in the construction industry operate in highly competitive
environment as they aim to keep pace with the global and national demands of
infrastructural development. Workers engaged in the construction industry are expected
to deliver designed projects within strict time lines and defined budgets. In this regard
construction workers are subjected to emotionally and mentally demanding
circumstances that contribute towards stress levels. Different studies done in segregated
countries provide qualitative data concurrence that stress levels are high among
construction workers. In Nigeria a study established there was high stress factors among
construction workers. The contributing factors were insufficient thermal comfort, high
work load; insufficient feedback on previous and ongoing building projects, inadequate
security/ safety measures on site, and fragmentation of building work into specialized
fields. In the United Kingdom, it was discovered that construction professionals were
progressively viewing their work as being stressful. In Hong Kong, high levels of job
burnout were evident among construction professionals. This has endangered their well-
being and diminished their industrial efficiency and long-term competitiveness All
things considered, to ensure that a given task is done considering spending plan and
time, development laborers and specialists need to work for longer hours to achieve the
targets that are set hence resulting to stress levels. This research looks at levels of stress
in the construction business in Kenya with a focus on Kibera Resettlement Action Plan
Project. In particular, the research investigates on what causes stress, stress levels and
approaches to manage stress among work forces. This examination used a cross
sectional descriptive investigation plan and focused on 176 employees working with H.
Young and Company, (East Africa) Ltd to carry out the Kibera Resettlement Action
Plan Project. The findings of the study found that the principal causes of work stress
among construction workers are work overload, role conflict, complexity of roles and
feedback which fall under task and organization stressors. The finding revealed that
stress in construction firm is managed using different strategies that are either problem
or emotional focused at the individual and company level and it established that male
workers in the construction company had the highest levels of subjective stress while
female workers in this construction company had the highest levels of objective stress.
The study further found that general workers had the highest levels of subjective and
objective stress followed by skilled workers and managers. The study thus postulates
key recommendations in mitigation work stress among the construction workers.
Foremost, the study recommends that construction firm to place more emphasis on task
and organizational stressors especially with regard to role conflict, complexity of roles,
work load and feedback. The second recommendation pertains to efforts by the
management of construction firms in developing strategic ways that ensure the low
cadre employees are not overburdened with work. The third recommendation is with
regard to efforts by management of construction firm in regularly revising the company
stress management strategies in order to maintain its efficacy. Finally, the study
recommends that construction workers to form worker groups and unions in which they
can share their work-related stress and report such stressors to the management for
appropriate remedial measures.

1
CHAPTER ONE: INTRODUCTION
1.1 Background of the Study
Work stress involves poor work conditions activated by various work environment
operations that unexpectedly influences staff productivity and an individual’s overall
wellbeing (Yahaya,Noridin, Ismail, Sharif, Muhammad, Azlina, Noraffandy & Abbas,
2011). It is likewise referred to as unfavorable responses that an individual may have
due to excessive stress emanating from work demands for target achievement placed on
employees. Moreover, pressures associated to working conditions are the responses that
workers can elicit in the event that they are confronted by work stressors beyond their
capacity for accomplishment. As such, this frequently results to scenarios whereby the
workers ability is frequently challenged to adapt to toxic work environments (Mxenge,
Dywili, and Bazana, 2014).
In the contemporary world, work related pressure is not constantly viewed as an
inconsistent individual issue that can be reduced with controls. Clearly, it develops
continuously to a worldwide phenomenon affecting all work forces’ groupings, work
places and countries (Health and Safety Executive, 2007). In this manner, work related
pressure impacts the welfare and wellbeing of individuals working in the construction
industry. This is evidently perceived as an extreme pressure working environment
(Bowen, Govender, Edwards & Cattell, 2014).
Since the advent of industrialization the world has experienced massive infrastructural
development spurred by the construction industry. This has been through organizational
and institutional revolution worldwide. As such professionals engaged in the

2
construction industry operate in highly competitive environment as they aim to keep
pace with the global and national demands of infrastructural development. Workers
engaged in the construction industry are expected to deliver designed projects within
strict time lines and defined budgets. In this regard construction workers are subjected
to emotionally and mentally demanding circumstances that contribute towards stress
levels. At a global level past studies done by different researchers do not provide a
singular quantitative statistics on the global stress levels. However, different studies
done in segregated countries provide qualitative data concurrence that stress levels are
high among construction workers within the countries of study. In this regard, studies
done in countries such as Nigeria (Ibem, Anosike, Azuh& Mosaku, 2011), United
Kingdom (Campbell, 2006), Hong Kong, (Yip & Rowlinson, 2005), Taiwan (Lin &
Chan, 2009) all provide research proof of the high stress levels among construction
workers.
In Nigeria a study by Ibem et al., 2011 established there was high stress factors among
construction workers. The contributing factors were insufficient thermal comfort, high
work load; insufficient feedback on previous and ongoing building projects, inadequate
security/ safety measures on site, and fragmentation of building work into specialized
fields. Campbell (2006) discovered that in the United Kingdom, construction
professionals were progressively viewing their work as being stressful. Yip et al., 2005
discovered that in Hong Kong high levels of job burnout was evident among
construction professionals. This has endangered their well-being and diminished their
industrial efficiency and long-term competitiveness.

3
Lin and Chan (2009) noted that physically burdened construction workers were among
the most vulnerable to the negative impact of temperature on their productivity and
health. As such, they established that relative humidity above 74% and temperatures
above 30°C affected the health of construction workers in Taiwan.
In the local context, Kenya’s economy construction industry accounts for 5% of the
country’s GDP and employs about 1 million people with an estimated annual wage bill
of K.sh. 3.2 billion according to recent findings of the first quarter of 2011 by Kenya
National Bureau of Statistics (KNBS). Worldwide, the development businesses generate
high contributions to the socioeconomic improvement of many countries. As such, the
business is equipped for making explicit commitments to the economic physical
facilities basic for development, in addition to circulation of more items and services
(Sermolo, 2014). The development business produces occupation and income for a
considerable division of the populace, and manages an expansive scope of operations
together with advancements on various measures (Reem, Marwa, and Naanes, 2013).
Presently the development business has experienced real advancement and change. In
addition, the developing economy places pressure on individuals taking an interest in
the construction business (Ibem, Anosike, Azuh, & Mosaku, 2011). This change has
occurred during industrial improvement, science and innovation, sub-urbanization,
transformation, mechanization, an expanding population and unemployment (Bano and
Jha, 2012) the development business has additionally seen contentious adjustment in the
construction industry, characterized by fast paced working conditions due to increased
production demand. This is as a result of the world becoming increasingly globalized

4
due to scientific improvement as well as consumer preference change (Ibem, et al.,
2011). When all these factors are combined, it contributed to both emotionally and
mentally demanding construction work environments (Wahab, 2010; Ibem et al., 2011).
Construction industries are characterized by high ranks of work stress, mainly among
the expert workforce (Bowen et al., 2014). In this regard, work correlated pressure is a
characteristic element of the job environment and goes beyond personal existence
(Love, Edwards and Irani, 2010). The Chartered Institute of Building, (2006) posits
that among building experts, sixty eight percent of the building experts experience
anguish as a result of sadness, tension or stress.
Development organizations in continents that are developing like Africa and Asia, face
difficulties in work stress management as a result of the general state of the financial
and social burden of workers in such nations. This is further hampered by their inability
to oversee key work process related issues in those nations (Ofori, 2002). Construction
sectors in countries that are still developing ordinarily work in very aggressive
condition that are characterized by the expectation of completion of activities in tight
timetables within controlled spending budgets. To guarantee that assignments are done
on schedule, within the budget margins, and to the right specifications, specialists in
development firms in developing nations are compelled to work for longer hours
(Wong, Teo and Cheung, 2010). Consequently, in underdeveloped countries,
development experts are always exposed to stressors within the work environment. This
ultimately increased the likelihood for burn out and fatigue (Yip and Rowlinson, 2006).

5
The construction sector has a significant role to play in a country’s socio-economic
progress (Majale, Morumbasi and Mutuli, 2000). Moreover, development exercises in
developing nations have a significant influence in the strategy of financial advancement
and development, based on their infrastructure and services that emanate from the
processes of construction (Mitullah and Wachira, 2003). Foreigners, particularly the
Asians, have highly dominated the construction industry (Mitullah and Wachira, 2003).
At present, African countries have seen an inundation of Chinese development
organizations, and this has greatly upgraded business development environment.
1.2 Problem Statement
The development business has seen continuous adjustment in the construction industry,
characterized by fast paced working conditions due to increased production demand.
This has been as a result of industrialization the world has experienced which has
spurred massive infrastructural development. As such, workers engaged in the
construction industry operate in highly competitive environment as they aim to keep
pace with the global and national demands of infrastructural development. Workers
engaged in the construction industry are expected to deliver designed projects within
strict time lines and defined budgets (Ibem, et al.,2011) In this regard construction
workers are subjected to emotionally and mentally demanding circumstances that
contribute towards stress levels (Wahab, 2010; Ibem et al.,2011).
Construction industry having been marked as an amazingly stressful business in view of
heaps of work, job uncleanliness, poor operational circumstance, regulatory
organization and interpersonal relations that are complicated at the workplace (Leung,

6
Chan, & Yu, 2009). All this makes workforce in the construction industry to ceaselessly
be presented to various stressors within their working condition. Consequently,
construction experts and general laborers have persistently experienced elevated
amounts of work related pressure, prompting mental, physiological, and sociological
impacts and driving them to receiving distinctive ways of dealing with stress to relieve
their condition (Bowen, et al., 2014). Therefore, there is better need to understand
causes of stress in construction industry, levels of stress and stress coping mechanism as
it can have major implications on project productivity and achieving project objectives.
A few investigations have additionally been done on stress levels in relation to the
construction sector internationally and locally. For example, studies by Nigeria (Ibem,
Anosike, Azuh & Mosaku, 2011), United Kingdom (Campbell, 2006), Hong Kong,
(Yip & Rowlinson, 2005) , Taiwan (Lin & Chan, 2009) focused on work pressure in
the building industry. This explores were done in various nations and analyzed various
objectives subsequently and therefore their discovery may not be summed up to this
examination setting. Further to this, majority of researches under the study topic have
focused on different sectors, example (Kariuki, 2013), thus stress levels among workers
in the construction business in Kenya especially on Resettlement Action Plan (RAP)
ventures has not been widely considered, consequently, there is a gap which this
investigation means to address, by looking at levels of stress amongst workers involved
with carrying out Kibera RAP Project in Nairobi County.
7
1.3 Justification
This research was carried out on this specific area of study because unlike other
construction sites, this site is located in the midst of the Kibera slum, with a lot of
demolitions expected to happen so as to clear way for the project, delays expected and
this could make the contractor work extra hard in respect to time frame of the project.
The researcher chose this particular construction site because it could clearly highlight
levels of stress among construction workers in Kenya especially on RAP ventures since
stress in the job environment is an increasing issue globally, there is need to readily
comprehend stess levels and manage it since it can have significant impacts on the
welfare and wellbeing of people engaged in construction business (Bowen et al., 2014).
This research equally looked at causes of stress, stress levels among construction
workers and ways in which we can manage stress in the building business. The findings
will be relevant to firms in construction basing on the fact that they feature the likely
sources of stress, stress levels and the potential approaches to adapt in order to cope
with stress both at organizational and individual levels as they can get a clear
understanding on the competencies needed by the management in order to averting and
lessen the feelings of anxiety at building site and create a sound working environment.
1.4 Research Questions
The following research questions formed the basis of the study:
1. What are the main causes of stress among construction workers in Kibera RAP
project?

8
2. What are the levels of objective and subjective stress among construction
workers in the Kibera RAP project?
3. Which work stress coping strategies are employed in by both the organization
and individuals in the Kibera construction site?
1.5 Hypothesis
Null Hypothesis
There is no significant relationship linking stressors and levels of stress amongst
construction workers in Kibera RAP Project.
1.6 Research Aims
1.6.1 General Objective
General objective of the study is to determine stress levels among construction workers
in Kenya with focus on Kibera Resettlement Action Plan Project.
1.6.2 Specific Objectives
1. To identify the causes stress among construction employees in Kibera RAP
Project.
2. To determine the subjective and objective stress level amongst construction
employees based in Kibera RAP project.
3. To determine the strategies of coping up with stress at work used by both the
company and people in the Kibera construction site

9
1.7 Significance of the study and Anticipated Output
Outcome of research findings will be relevant to firms in construction based on the fact
that they feature the likely sources of stress, stress levels and the potential approaches to
adapt in order to cope with stress both at organizational and individual levels as they
can get a clear understanding on the competencies needed by the management in order
to averting and lessen the feelings of anxiety at building site hence improving efficiency
as well as performance of the organization.
Many studies concerned with work related stress in other fields both the public and
private sector have been done (Sharma, 2015, Kariuki, 2013). This particular study will
help cover the existing gap in the construction sector, although with a lot still to be done
in helping toward understanding work stress and stress levels in the construction
industry, this investigation will help significantly towards achieving this target.
1.8 Limitations and Delimitations of the Research
1.8.1 Limitations
The level of stress in construction business was a major area of concentration of the
study, hence the study findings may fail to sum up to non-associated industrial sectors
since various segments have various reasons for pressure and therefore, they apply
various kind of techniques to oversee/adapt to work related pressure. Having
Subcontractors, the examination just centered on H-young employees at the site due to
the weakening dimensions of subcontractors. During the period the research was being
carried out, general laborers 49 of them had been transferred to another construction
10
project by the company, 7 workers were on leave 11 workers were less than 3 months
employed, while 5 declined to take part in the research hence a response rate of 59%.
1.8.2 Delineations
The study aimed at examining stress associated with work at constructions sites in
Kibera. The examination was focused on Kibera RAP Project in Kibra Constituency in
Nairobi County. This examination included every one of the representatives working at
the building site. The research was conducted from October 2015 – July 2018
1.9 Models of Stress
I. Richard Lazarus Stress Model
The stress model was pioneered by Richard Lazarus .(Lazarus & Folkman, 1984) It
underlines that focus should not only be directed towards the environment or stressors
but also on the individuals who go through the stressful conditions on a daily basis
hence forcing them to adjust. The model’s notion of exploration revealed that the ability
of humans to reason and plan for the imminent days makes them susceptible to stress. In
this way the pressure impact on an individual depends on that individual’s feeling of
susceptibility and their capacity to adapt.
Significance of this model is the ability to adjust to stressful conditions. In this regard,
Lazarus & Folkman (1984) illustrate that adaptive actions can be identified based on a
number of elements arising from an unpleasant or stressful encounter that can result to
changes on an individual’s environment that is characterized by negative emotions., As
such, that is the concept of problem focused coping.

11
An individual can as well as relate to the internal elements and also attempt to lessen the
negative emotional situation. As such, this is the concept of emotional focused coping.
II. The stress model of Cox’s
As indicated by (Mackay, Cox, Burrows & Lazzerini , 1978). An individual can
become stressed when there is a difference between their recognized levels of stressful
demands along with their recognized capability to respond and cope with the demands.
In this regard, an unevenness emerges linking recognized demands and recognized
coping capabilities. The coping capabilities are dependent on an individual’s view of
the work environment and the emotional expertise of it aiding an individual to perceive
the work stressors. The Cox model further recommends that if an individual can
distinguish between the psychological and environmental call/demands placed on
him/her, through counselling he/she can learn the best resources to apply when faced
with familiar stressful demands. This consequently enables an individual to know
whether they are encountering harmful stress levels.
III. Conceptual Framework
As set by Leung et al, (2009) the organizational, task, physical and individual stress
factors makes up the major classes of work stressors. The stressors leads to escalated
stress levels both SS & OS. The various sorts of stressors and their impacts can be
controlled through utilizing different strategies of managing stress and this can be
Problem focused or emotional focused and can be at organizational or individual based
as depicted in the figure 1.1 below.

12
(Independent variables) Dependent variables)
Figure1.1 The Conceptual Framework
The framework depicts a short summary of what causes stress (independent variables).
It exhibits the probability of being impacted by dimension of pressure due to task,
which incorporates remaining task at hand (over-burden, under burden), role ambiguity
and role conflict (Leung et al, 2009). Then again, organizational factors incorporate;
lack of feedback, complexity of roles and absence of feedback to workers about the
Potential Stressors
Task stressors
Workload (excess ,
under load)
Role conflict
Role ambiguity
Organizational stressors
Complexity of rules
Bureaucracy
Lack of feedback
Personal stressors
Personal behavior (type
A behavior)
Personal problems
Life changes
Physical stressors
Poor physical conditions
High noise levels
Privacy
(Intervening variables)
Stress Management
Individual/
Organization strategies
Problem focused
(Social support
seeking, plan focused
problem solving,
confrontation coping)
Emotion focused
(avoidance, accepting
responsibilities,
positive thinking,
emotional discharge,
religious support)
Stress levels and
Symptoms
Subjective stress
Burnout
Psychological stress
Objective stress

13
state of work, which incorporates assured job security. All this are considered to make
workers get stressed.
Moreover, individual factors incorporate; person’s behavior (type A conduct), and
accentuation that type A behaviours are more affected by stress, individual issues that
an employee encounters and life transformations that may occur in the life of somebody
are additionally depicted to cause stress (Leung et al, 2009).
Additional are the physical factors which cause stress and they can include; high levels
of noise, unfavorable physical conditions and privacy. Additionally, the model shows
the dependent variables which include; Subjective stress which comprises of Burnout
and Psychological stress and Objective stress , finally, the model shows ways of coping
with stress(intervening variables), employed by both organization and employees. The
systems to manage stress include problem and emotional focused stress management
mechanism.

14
CHAPTER TWO: LITERATURE REVIEW
2.1 Introduction
Chapter two details an in-depth literature review of work/job pressure and stress levels.
The section shows the likely job stressors, the side effects/results of occupation-
associated pressure and ways to manage stress. In addition, the section delves into past
studies in relation to the study topic.
2.2 Potential Work Stressors
The stressors are the conditions that regularly result to pressure. The stressors are
depicted as demands and can be physical or psychological in nature (Mxenge, Dywili &
Bazana, 2014). Work stressors are commonly viewed as occasions that stir strain and
defined as any attributes in the work environment that can cause danger to an individual
(Shikieri & Musa, 2012). As indicated by Leung et al., (2009) four categories of
stressors exist particularly in development business, incorporating task, individual,
physical and organizational stressors.
2.2.1 Task Stressors
The task stressors pertain to under or over burden, job conflict, and job ambiguity in
everyday work of development experts (Leung, et al., 2009). Overburden implies that
requests of work are unreasonably high for an individual. Work conflict occurs
development-oriented employees are unsure or conflicted between varying work
requests. On the other hand, job ambiguity implies an absence of clarity concerning the
job and the tasks involved (Leung, et al., 2009; Enshassi & Al-Swaity, 2015). Task
stressors ordinarily emerge amid the typical course of the activity and they include work
15
under burden similarly to abundance work, clashing tasks at work, exhaustive work and
also disruptions (Nekzada and Tekeste, 2013)
As indicated by Ibem et al., (2011), task stressors allude to stress sources that emanate
from an individual’s activities. Stress is brought about by excessive work pressure to
attain deadlines, excessive number of choices and decisions to make, exhaustion due to
physical strain at the workplace environment, working for long hours, adapting to new
working conditions and costs associated with errors. Task stressors occur when it is
unclear to a worker on the type of work to be prioritized when faced with short
deadlines (Nekzada and Tekeste, 2013). Task stress issues are strengthened by lack of
job distinction in form of unclear scope of works, job objectives and lines of
responsibility. Insufficient or over abundance of work is an extra source of work stress
which often leads to despair, dismay, low confidence and a feeling of futility (Leung,
Zhang and Skitmore, 2006).
2.2.2 Organizational Stressors
These are usually viewed as pressures originating from within the business itself,
including the managerial framework such as control of freedom space given to
employees within the work space (Leung, et al., 2009). Administration perspectives in
most cases are experienced by workers in a job environment. They include issues such
as uncertainty in job roles whereby the worker lacks the ability to precisely recognize
what is expected of him/her (Nekzada and Tekeste, 2013).
As indicated by Enshassi & Al-Swaity, (2015), the existence of hierarchies and
bureaucracies leads to poor organizational structure in the building industries. Enshassi

16
& Al-Swaity, (2015) state that people working in an overly combative environment are
normally involved careless conduct, exhibit inferiority complexes at work, exhibit a bad
attitude to the work assigned, and have a low occupation gratification and commitment
levels.
2.2.3 Individual Stressors
These are identified with relational features that form foundations of uneasiness among
development experts (Enshassi & Al-Swaity, 2015). Individual stressors incorporate
how an individual behaves at the workplace as a result of strained social relationships at
home. People have various identities and behaviors and as such stress affects various
individuals in different ways. Behaviours are categorized into two according to Enshassi
& Al-Swaity, (2015). These are Type A and B behaviors. Type A behavior are
characterized by traits such as; faster, overly aggressive, very competitive, insecurity in
status, extreme impatience, time consciousness, highly intimidating behaviour and
inability to exercise composure. On the other hand, type B behavior are characterized
with high levels of tranquility.
Individual stress can be triggered by stressful issues from an individual’s family, home-
work fight and monetary issues. Worry at work environment is brought about by
various things (Greenberg, 2011). Individual stress may likewise originate from
grieving or separation with spouse. Other life events which are stress provoking
involve; sickness, joblessness, money related pressure (Health and Safety Authority,
2011).

17
Good social relationships particularly at the job environment has been recognized as a
significant capability for construction specialists and other workers to achieve perfect
work execution and enhanced sense of wellbeing (Leung, et al., 2009).
2.2.4 Physical Stressors
These are environmental related causes of stress found at the work or home
environment of construction workers (Leung, et al., 2009). This kind of environment is
characterized by work deprivation for a worker in the construction sector that can be
arise from poor illumination, extreme variations in temperatures, excessive noise levels,
untidiness, among negative environmental factors (Enshassi & Al-Swaity, 2015).
Wahab (2010), states that poor working conditions increases stress as well as affecting
the operational execution of laborers. Greenberg, (2002) states that unsafe tasks, lethal
chemicals, high noise levels, poor hygiene, unfriendly fragrances similarly to other
stressful issues can result to health ailments detrimental to workers.
2.3 Consequences of Occupational pressure.
Professional pressure has various harmful impacts to an individual and the equally
affects the whole business operation (Herbert, 2011). Stress in organizations negatively
impacts both the individual and the organization. The stress reactions can occur
immediately and spontaneously (present moment) or manifest after a long time span
(long term responses). There is a likelihood of stress to cause either positive or negative
effects. As such, if stress levels are appropriate, it will yield positive results by
increasing efficiency. Conversely, if stress levels are high, it prompts an inverse impact
on job productivity (Leung, Zhang and Skitmore, 2006).

18
This investigation will focus on two classes of pressure and they include objective and
subjective stress. Subjective Stress is brought about by the result of activities people go
through, while Organizational Stressors are brought about by external elements Leung
et al., 2007).
2.3.1 Objective stress
Objective Stress pertains to an individual’s view on their capability of accomplishing or
undertaking a certain task in the face of eminent hurdles in its achievement (Leung et
al., 2007). Objective Stress originates from the fact that there is an inherent contrast
between the expected capacity and the realistic ability to manage a specific task
productively. Components that causes of OS include: absence of self-governance,
decision making, the load of work, number of errands, job conflict, biased rewards, and
domestic strife (Leung et al., 2007).
2.3.2 Subjective stress
This kind of stress is recognized by a person via their own independent judgment.
Subjective stress is weighed by how an individual is satisfied with the environment,
degree of self-confidence with the organization and the feeling of misery or
contentment (Leung et al., 2007). There are two categories under SS. These are;
burnout and psychological stress (Leung et al., 2007).
2.3.2.1 Burnout
It is viewed as a condition of psychological, physical and emotional fatigue caused by
high levels of stress. It manifests when an individual perceives his/her incapability of

19
attaining continuous workload. It’s recognized as a principle issue in construction
industry (Leung, et al., 2008). Burnout normally emanates from job over-burden,
uncertain expectations, unfair distribution of tasks, poor employment where job does
not match skills, absence of social support and work.
2.3.2.2 Psychological stress
Construction employees experience psychological pressure more in contrast to workers
from different sectors. Psychological pressure gradually exhibits itself in the following
ways; continuous headaches, lack of appetite, insomnia, gastrointestinal issues, back
problems as well as skin irritations (Leung et al., 2008)
2.4 Stress Measurement Levels
Scales can be used to measure Levels of stress as described in the subsequent sections.
2.4.1 Objective Measurement Levels of Stress
These are the proxies for uncovering the variations linking expectations to one’s actual
capabilities. Objective Stress is usually evident when actual capacities are far less than
the foreseen capacities. The widely recognized scale in quantifying Objective Stress is
the (RO-BO) scale. The ratio is used in a no. of tasks when assessing the strain of
assignment to be completed (Leung et al., 2007). Stress levels are estimated equitably
by acquiring the deviation between an individual’s expected capabilities and the real
capabilities dependent on 7 proclamations (Leung et al., 2007). This implies that
excessive levels of stress can result to burnout while minimal work pressure results to
laxity that leads to reduced productivity.

20
2.4.2 Subjective Measurement Levels of Stress
Subjective Stress (SS) is estimated through utilization of Maslach burnout list (MBI).
MBI was first utilized by experts specializing on human services which comprised of 22
factors used in measuring burnout. These factors were further categorized into three
wholistic groups of emotional exhaustion, depersonalization and personal
accomplishment (Maslach et al., 1996). A few researches have reduced a portion of
some of the items to fit the construction industry (Leung. et al., 2008). In this
examination, the altered scale with decreased items will be used.
2.5 Work Stress Management Strategies
Strategies used to manage stress include coping strategies, reincorporation, and
recovery. These are measures are applicable to individuals experiencing work related
pressure who seek to embark on changes that ultimately lead to stress reduction
(Wahab, 2010). As indicated by Enshassi & Al-Swaity (2015), there exists two
classifications. These are problem focused and emotional focused. The principle goal of
problem focused way of managing stress is to address the situation either by changing
the condition or by acquiring basic data, capacities or assistance (self-coordinated). On
the other hand, emotional focused way of managing stress aspires to eradicate negative
emotions central to the problem through approaches such as wishful reasoning and
distraction (Enshassi & Al-Swaity, 2015).
Stress especially at working environment is mainly reduced through the use of various
methods and strategies (Love. Edwards and Irani, 2010) For example, at an individual
level this entails cognitive techniques, good relaxation and exercise. Moreover, at an

21
individual level, actions for managing work related pressure may involve taking part in
relaxations, participating in various ways of entertainment, exercising, family
gatherings and other groups, and seeking assistance from line managers, colleagues and
friends (Bowen et al.,2014). At the group level, methods may involve team building and
trainings. At an administrative dimension, strategies may emphasis on altering working
shifts, reducing physical dangers, profession ranks, innovations and work variety (Love,
Edwards & Irani, 2010).
Organizational involvement may be of numerous sorts. Examples include dimensions of
staffing, physical environment, working schedules, regulation of work, participation and
communal support (Michie, 2002).
Oladinrin, Adeniyi, & Udi, (2014) illustrate that in order to limit pressure and manage
stress, it is pertinent for an individual to adopt measures such as activity time
allocations, reducing work overtime schedules, adopting team work attitude, and
spending time with friends and family members. Kariuki (2013), similarly states that
work-related pressure can be successfully managed by offering employees preferential
work time shifts, pay increments, fairness in work appraisals and due diligence in staff
promotions. Bowen et al., (2014), advices organizations to focus on improving
managerial and complementary help for development specialists. Organizations must
depict some official programs, like programs to support workers in need of career
guidance. All the stages are aimed at addressing problems of pressure by training
workers in various pressure administration techniques like recreation and consideration
(Greenberg, 2011).

22
2.6 Initially done studies on Work Stress
Table 2.1 Literature Findings on Work Stress
Researcher Objectives Findings
Saikala and
Selvarani , 2015
To identify the key stress
factors among construction
professionals including
architects, engineers,
builders and other related
specialists involved in
building construction
industry
The study findings established that
the principal foundations of stress
were heavy volume of job, work
pressure, lack of provisions at site,
non-coordination of people from
various levels, improper
administration, lack of response
on prior and continuing
construction projects and finally
charges in choice of work in
ongoing construction projects.
Sharma , 2015 To discover the aspects
prompting occupational
stress faced by Indian army
soldiers and to evaluate the
applicability of the scale
used for measuring
occupational stressors
Exploratory Factor Analysis
established that lack of control at
work, role conflict, inadequate
awareness about profession,
workload and job pressure, and
indifferent organizational attitude
as the major occupational stressors
in the Indian army.
Bano and Jha , 2012 To explore the differences
in work-related stress
between communal and
private sector employees
based on ten role stressors.
The study too examined the
role of population variables
on the stress intensities of
both public and private
segment sets
The study findings established that
both public and private sector
workers face moderate levels of
stress. In addition, the study
established that there is no
noteworthy transformation overall
between public as well as private
sector workers in terms of total
stress echelons, confident distinct
stressors like job experience and
instructive qualifications do yield
changes.
Leung, Chan and
Olomolaiye, 2008
To investigate the impact of
stress on the performance
of Building Project
The study findings established that
objective stress decreases job
performance whereas exhaustion

23
Researcher Objectives Findings
Directors can have a constructive effect on
task performance. The study also
established that relational
performance is exploited with a
reasonable level of neutral stress
and increases in line with the
improvement of the task
performance of individuals and
that administrative performance
has U-shaped relations with both
stress and physical pressures and
is deteriorated by neutral stress.
Yip and Rowlinson ,
2006
To investigate the coping
behavior of construction
professionals in their
working environment
Factor analysis revealed that four
dimensions could satisfactorily
describe the coping behaviors
observed i.e. lucid problematic
solving, reconciled distancing,
seeking provision/ventilation and
passive hopeful thinking. Among
these 4 managing scopes, lucid
problem solving was found to be
used most regularly and to be
clarified by the most noteworthy
percentage modification.

24
Researcher Objectives Findings
Loosemore and
Waters , 2004
To investigate whether
there are alterations in
sources as well as levels of
stress amid male and
female specialists in the
building business.
The results indicate that overall,
men experience slightly higher
levels of stress than women do.
The findings further revealed that
though there are mutual bases of
stress for both males and females.
there are equally some changes
males appear to agonize more
stress in relation to hazard taking,
penal matters, and inferences of
errors, redundancy, and career
development. The study also
revealed that the factors that
reason a lot of stress for women
were prospects for individual
expansion, amounts of pay,
keeping up with new philosophies,
occupational travel, as well as the
incremental effect of minor jobs.
2.7 Literature Review Summary
Current/existing literature shows that there are various work stressors. These include
task, individual, organizational and physical stressors. Furthermore, investigations have
been done focusing on different objectives on work stress levels and mitigation of
work-related stress. As such, several strategies were utilized. Majority of the studies
have been done in different countries and focused on different objectives with a few
conducted in Kenya. In this regard, there is an evident gap within the local context in
relation to the study topic at hand that justified the investigation of stress levels amongst
construction workers in Kibera RAP development in Nairobi County, Kenya.

25
CHAPTER THREE: MATERIALS AND METHODS
3.1 Introduction
This chapter shows research design, study variables, the investigation area, population
and the sampling techniques. Similarly, the section exhibits the examination tools, the
experimental, validity and reliability and information collection techniques. This section
further presents the techniques that were used for data analysis and logistics and ethics
consideration.
3.2 Research Design
A cross sectional descriptive study design was applied to achieve the study objectives in
the study. The rationale for the design was because it allows the researcher to carry out
the research at that particular point in time, since the project would have definitely
come to an end, cross sectional design was relevant to this study (Kesmodel, 2018).
3.3 Variables
The examination sought to analyze the levels of stress among construction workers in
the Kibera RAP development venture. In this regard, the independent variable was
based on work stressors within development business. As such, the work stressors
pertained to task, organizational, individual and physical stressors whereas the
dependent factors included; potential outcomes of work-related stress which included
objective stress and subjective stress. Equally, the mediating variables analyzed
pertained to the management strategies of stress. The factors were estimated utilizing
inferential as well as descriptive statistics.

26
3.4 Area of study
The investigation was completed and it involved construction workers situated at
Gatwekera area in Kibera area; Nairobi, Kenya, working under Kibera RAP Project.
Co-ordinates of the project undertaking area were within - 1.3148818 and 36.7812489.
The construction workers had been engaged by, H. Young and Co. (E. A) Ltd.
3.5 Study Population
The investigation population involved 176 construction workers engaged by H. Young
and Co. (E.A) Ltd for development work of the Kibera RAP Project in Gatwekera
section in Kibera area. During the study, 104 workers participated in the study 49
general workers had been transferred to a new project which was starting up 7 workers
were on leave and 5 workers declined to participate in the study, 11 workers had been
employed for less than 3 months
3.5.1 Inclusion criteria
Data was collected from employees of Kibera RAP Project who consented to participate
in the research and involved workers who had been employed for more than three
months. This is because the workers employed for less than three months might not
have the real feel of the work and they may be stressed because they are not used to the
work
3.5.2 Exclusion criteria
Workers undertaking the project who did not give consent to participate in the
investigation were kept out. Those with exceptional conditions, for example, being

27
away from work because of sickness, accidents or on vacation/ leave were also kept
from the investigation.
3.6. Sample size determination
The investigation completed a census of the 176 workers at the building site. Census
was considered because the population was little, this helped in avoiding and reducing
statistical errors.
3.7 Study Instruments
The data of the study was collected using an observation checklist and questionnaires.
The observation checklist was based on a Likert scale and collected data on work load,
work under burden, job strife, job ambiguity, bureaucracy, feedback, complexity of
roles, interpersonal and physical stressors during the morning, afternoon and the
evening hours. Questionnaires on the other hand had 5 sections and which included;
background information, causes of stress, RO-BO scale, MBI and stress management
section. RO-BO scale was used to measure objective stress levels while the MBI was
used to measure subjective stress levels.
3.7.1 Pre- Testing and Pilot Study
The questionnaires were pre-tested using 10 respondents who were randomly selected
from another building site of H. Young & Co. (E.A) Ltd situated in Mlolongo. The pre-
test was done in order to ensure correctness and accuracy of the questionnaire before the
actual survey. After the respondents responded to the questionnaire, they were asked the
challenges they faced when responding to the question. The pilot study outcomes were
not used when compiling final findings.

28
3.7.2 Validity and Reliability
To ensure validity, 10 respondents were selected randomly from a site that belongs to
H. Young & Co. (E.A) based in Mlolongo so as to help test appropriateness of the tools
to be used before using them to complete the study sample, the respondents were then
asked of the challenges they faced when responding to the question for the purposes of
identifying and correcting any errors. To achieve Reliability of questionnaire
Cronbach's Alpha Coefficient was used and it yielded an Alpha estimation of 0.753
which was viewed as satisfactory since it was higher than the value recommended of
0.7.
3.8 Data Collection Techniques
Data collection was carried out through interview-administered questionnaire and
observation checklist (see appendix II). Data collection was done with the aid of 2
research assistants, degree holders with good knowledge on Occupational Health and
Safety and were also trained on how to administer the questionnaires and conduct
inspection. The principal researcher coordinated all the activities to ensure that the data
collection process was properly carried out.
3.9 Data Analysis
Accumulated data was analyzed by use of descriptive statistics, inferential statistics and
SPSS. Descriptive statistics involved the utilization of frequencies, percentages and the
mean. Inferential statistics was utilized to draw inferences. As such, socio-demographic
information was analyzed using frequencies and descriptive analysis; Factor analysis
was used to check for inter-relationship as well as decrease the number of the variables

29
into a smaller number of variable; Mann-Whitney was used to check stress level
distribution among the sex of the respondents; Kruskal Wallis tested stress levels
among the different job levels; and, Chi-square utilized to test for significant
relationship among stressors and the levels of stress among Kibera RAP Project
workers.
3.10 Logistical and Ethical Considerations
The motivation behind the research was shared by the researcher to the participants so
that the study could get informed consent from the participants. As such, each
participant was approached at an individual level and taken through the purpose of the
study and process of data collection. Verbal consent for participation was consequently
sought and attained.
The anonymity and confidentiality of participants was guaranteed by not indicating
their names in the data collection forms or study findings.
Data privacy was ensured during data collection by conducting the interviews in private
areas free from crowded areas with each participant to avoid the possibility of
discussion being heard by other people.
The ethical approval was sought and granted from Kenyatta university graduate school,
Kenyatta University Ethical Committee and NACOSTI. Prior to this approval,
permission was first pursued and from the relevant authorities of the study site in
Kibera.
.

30
CHAPTER FOUR: RESULTS
4.1 Introduction
This chapter shows study results based on the study objectives. The chapter presents the
outcomes on the response rate, respondents profile and causes of work stress. Further,
the chapter presents the results on stress levels and ways for stress management.
Finally, the chapter presents the inferential statistics which comprises of factor analysis,
Kruskal -wallis and Mann-Whitney test and finally the chi square test.
4.2 Response Rate
The research carried out census of 176 employees who had been engaged by H.-Young
and Co. (E.A) Ltd for the Kibera RAP Project in Nairobi. Eight questionnaires were
administered to the management staff, 74 to the skilled worker and 94 to the general
labourers. All the questionnaires administered to the management staff were fully
responded to while 45 and 51 questionnaires were collected from the skilled and general
labourers. Thus, complete data was obtained from 104 respondents since some of the
respondents especially skilled workers and general labourers 49 of them had been
transferred to other construction projects by the company, 7 workers were on leave 11
workers were less than 3 months employed, while 5 declined to take part in the research
hence the rate of response was at 59%. Response rate was however considered adequate
for this particular study since it was more than 50%.

31
4.3 Respondents Profile
This sought to establish gender of the respondents, period worked, respondents age
level of education, marital status and the number of children.
4.3.1 Gender of the Respondents
78% of the respondents were male while 22% were female. As such, the results
depicted that the Kibera construction project was largely dominated the male gender.
This results were useful in finding out the subjective and objective stress levels among
male and female construction workers.
4.3.2 Period Worked by respondents working in Kibera RAP Project
The results on the period the respondents had worked with the construction industry are
shown in figure 4.1
Figure 4.1 Period Worked by respondents working in Kibera RAP Project

32
The results of the period worked on figure above indicates 27.9% of respondents had
worked in the construction industry between 11-15 years. Conversely, 26.9%, 25% and
20.2% had been working for 6-10 years, for less than 5 years and for more than 16 years
respectively. On average this finding indicates that most of the respondent in the
construction firm had been working for more than 5 years, this section was important to
this study because number of years worked could have an influence on how a worker
perceives stress.
4.3.4 Age of the respondents
The results of the age of respondents who had worked with the construction industry are
shown in figure 4.2
Figure 4.2 Age of respondents working in Kibera RAP Project
The findings on figure above reveals 31.7% of respondents were aged between 30 and
40 years while 30.8% were aged between 20 and 30 years respectively. The results
likewise show that 27.9% of the respondents were between the ages of 40 and 50 years
whereas 7.70% were aged above 50 years. 1.90% of the respondents were aged less
than 20 years. Findings on the age cohorts were pertinent to this study since it would
elicit the effects of how workers perceived and responded to stress.
33
4.3.5 Education Level among workers in Kibera RAP Project
The result indicated that 45% of total respondents were secondary school graduates
whereas 40% were college graduates while 15% were university graduates. This
indicates that the respondents had education skills and none was without education.
Having high number of workers with high levels of education could be a cause of stress
because some workers may feel like their skills are not being put into use.
4.3.6 Marital Status of workers in Kibera RAP Project
Figure above clearly reveals 85% of total respondents were married while 15% were not
married hence an indication that most of the respondents had a family to take care of
which could result to stress at the work place. The workers participated in the study
despite their marital status.
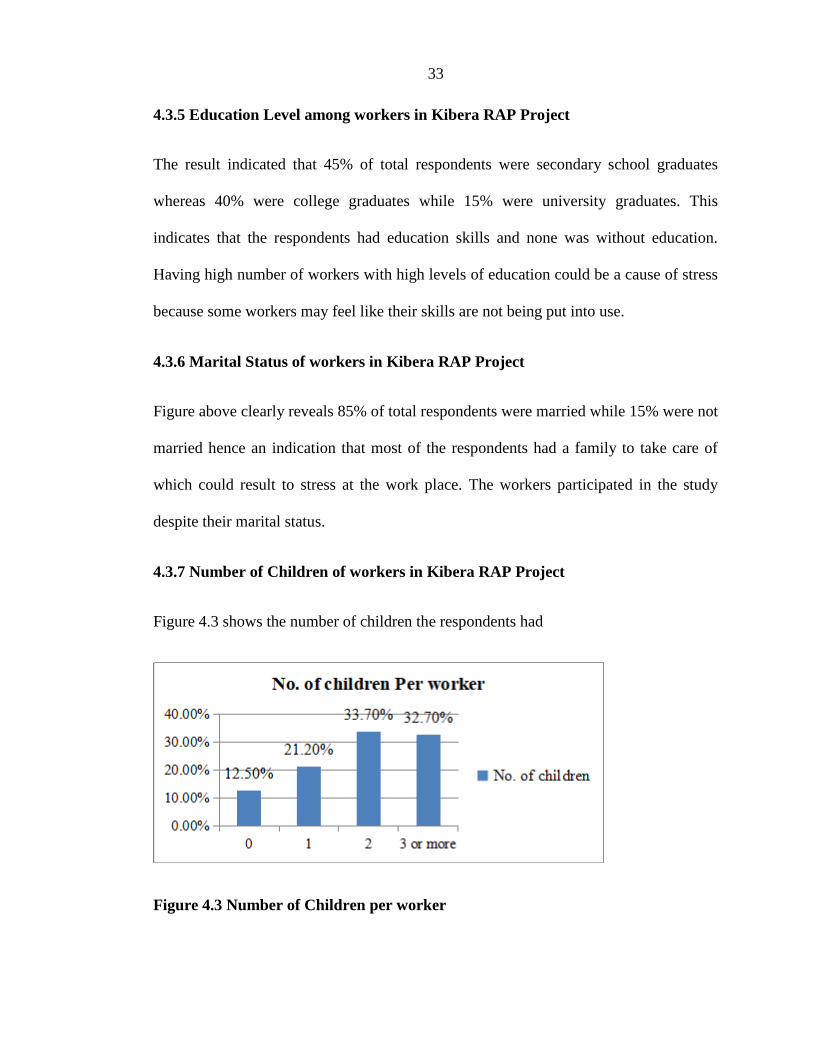
4.3.7 Number of Children of workers in Kibera RAP Project
Figure 4.3 shows the number of children the respondents had
Figure 4.3 Number of Children per worker

34
Figure above indicates that 33.7% of respondents had 2 children while 32.7 had 3 or
more children. The results further indicate that 12.2% of the respondent had 1 child
while 12.5% had no children. These results were significant to research because number
of dependents a worker has could also lead to high stress levels.
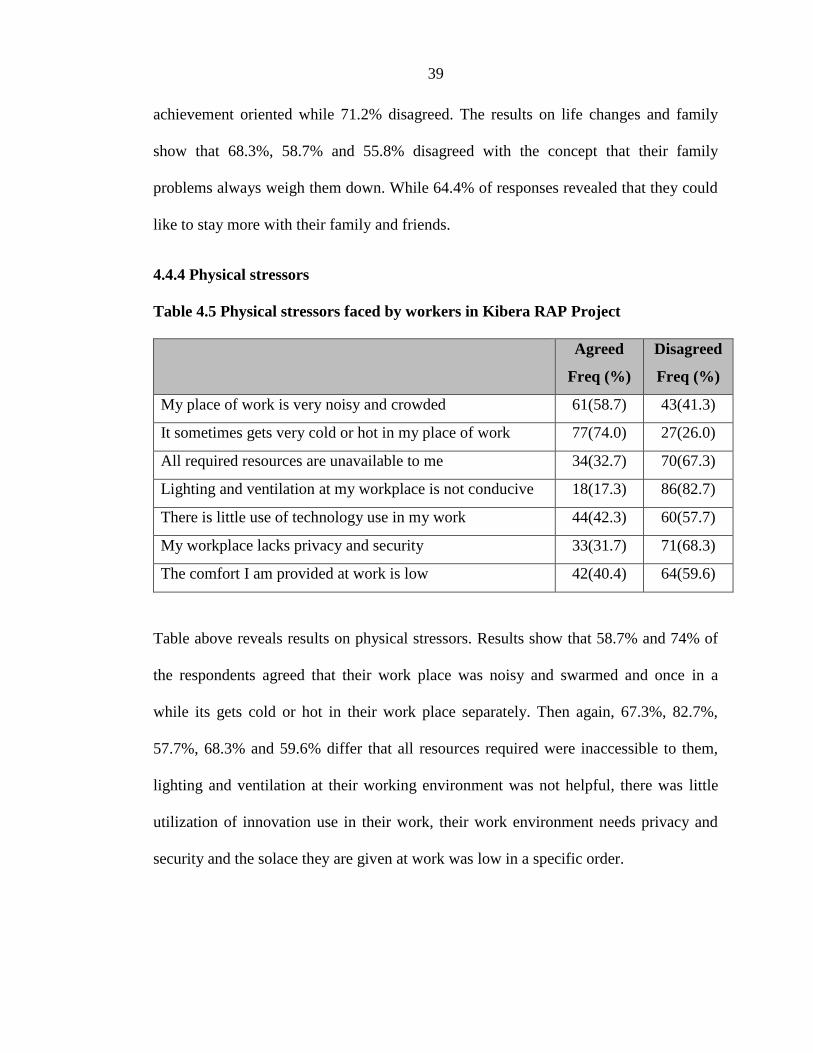
4.4 Causes of Work Stress
4.4.1 Task stressors
Table 4.2 Task stressors faced by workers in Kibera RAP Project
Work Overload Agreed
Freq
(%)
Disagreed
Freq (%)
I frequently work for long hours 71(68.3) 33(31.7)
The tasks I have to work on often have tight deadlines 66(63.5) 38(36.5)
I am always required to multi-task and make many decisions 72(69.2) 32(30.8)
I have to put much efforts in guiding my subordinates in their
work
43(41.3) 61(58.7)
Work under load
I am given very limited authorities 50(48.1) 54(51.9)
I feel my skills and abilities are not being used well 32(30.8) 72(69.2)
I frequently face unplanned delays in work 48(46.2) 56(53.8)
Role conflict
I am often caught by conflicting demands between different
parties
55(52.9) 49(47.1)
My personal and organizational goals do not match 32(30.8) 72(69.2)
I am often assigned tasks which are not part of job
specification
40(38.5) 64(61.5)
Role ambiguity
My job responsibilities are generally unclear and inconsistent 12(11.5) 92(88.5)
I have inadequate understanding of duties and responsibilities 26(25.0) 78(75.0)
My role and scope are ill-defined 37(35.6) 67(64.4)
The results on table 4.2 show the findings on task stressors comprising of work
over/under load, role conflict and role ambiguity. The results on work overload indicate

35
that most of the respondents were required to frequently work for long hours (68.3%),
adhere to tight deadline (63.5%) s and constantly required to perform multiple tasks and
decisions (69.2%). On the other hand, 58.7% of the respondents elicited disagreement
that they were required to apply more effort in guiding subordinates in carrying out their
respective work deliverables. The outcomes on work under burden depict that majority
of the respondents expressed disagreement with the following; being given limited
authorities (51.9%); lack of adequate utilization of their skills and abilities (69.2%); and
that they frequently faced unplanned delays in work ( 53.8%).
The results on role conflict showed that 52.9% of respondents agreed that they were
regularly caught in between by clashing demands among various parties. Alternatively,
69.2% of respondents expressed disagreement with the perceptive statement that their
personal goals and organizational goals were mismatched. Respondents equally did not
concur that they were usually assigned jobs that were not part of their respective job
descriptions (61.5%).
The task stressors assessed under role ambiguity elicited general disagreement among
the respondents. As such, 88.5% did not agree that their job responsibilities are
generally unclear and inconsistent, neither did they approve of having an inadequate
understanding of their jobs and responsibilities (75.0%). Furthermore, majority did not
feel that their work roles and scope are inadequately defined (64.4%).

36
4.4.2 Organizational Stressors
Table 4.3 Organizational Stressors faced by workers in Kibera RAP Project
Complexity of roles Agreed
Freq (%)
Disagreed
Freq (%)
Our organization is characterized by unclear reporting
structure
19(18.3) 85(81.7)
I have to carry out the work in complicated work procedures 37(53.6) 67(64.4)
The organization policies and procedures adequately support
employees
79(76.0) 25(24.0)
Bureaucracy
I have to consult other people before making a decision 73(70.2) 31(29.8)
Many of the rules/procedures make doing a good job difficult 38(36.5) 66(63.5)
There is adequate room for innovation and freedom to use
personal ideas
40(38.5) 64(61.5)
Feedback
I can get feedback from my supervisor on how well I am doing 64(61.5) 40(38.5)
It is hard to get information from my supervisor on my job
performance
31(29.8) 73(70.2)
It is very hard for me to know how secure my job is 26(25.0) 78(75.0)
The results on table 4.3 demonstrate the outcomes of organizational stressors which
incorporate feedback, role complexity and bureaucracy (i.e. extremely complex and
complicated management procedures). The findings on complexity nature of roles
demonstrate that 81.7% and 64.4% of the respondents disagree that their organization
was described by misty reporting structure and needed to complete the work in
complicated work techniques/procedures. Conversely, 76% differ that their policies and
procedures of their organizational are adequate when it comes to supporting employees.

37
With regard to bureaucracies which in essence are the extremely complex and
complicated management procedures, the findings show that 70.2% of the respondents
demonstrated that they needed to consult other individuals before settling on a choice
while 63.5% and 61.5% differ that numerous procedures and rules make working
superbly troublesome and that the organizations had a satisfactory space for
advancement and opportunity to utilize individual ideas. Finally, the results on feedback
show that 61.5% concurred that they get input from their heads (supervisors) on how
well they are getting along while 70.2% and 75% differ that it was difficult to get
information from their boss/heads on their activity execution and to realize how secure
their jobs were.

38
4.4.3 Personal Stressors
Table 4.4 Personal Stressors faced by workers in Kibera RAP Project
Interpersonal relationship Agreed
Freq (%)
Disagreed
Freq (%)
I have poor personal relationship with my colleagues 17(16.3) 87(83.7)
I can get along with others at work well 83(79.8) 21(20.2)
I don’t like the people I work with 12(11.5) 92(88.5)
I have respect and trust for those that I work with 92(88.5) 12(11.5)
Type A behavior
People sometimes say that I easily lose my temper 52(50.0) 52(50.0)
I enjoy competition and I feel like I always have to win 58(55.8) 46(44.2)
I am an achievement-oriented person 93(89.4) 11(10.6)
It is hard for me to focus on one activity for a long time 30(28.8) 74(71.2)
Life changes and Family
Demands of my family conflict with demands of my job 33(31.7) 71(68.3)
Losing property or a loved one makes me unwilling to work 43(41.3) 61(58.7)
Family problems always weigh me down 46(44.2) 48(55.8)
I would like to spend more time with my family and friends 67(64.4) 37(35.6)
The findings on table 4.4 show the results on personal stressors which comprise of
interpersonal relationship, type A behavior and life changes and family. The results on
interpersonal relationships show that 83.7% and 88.5% of the respondents disagreed
that their personal relationship with colleagues is poor and they dislike their workmates.
In contrast, 79.8% and 88.5% agreed that they get along with others at work well and
they have respect and trust with their workmates. The results on type A behavior
indicate that the 50% of respondents agreed and disagreed that they easily lose their
temper respectively. The results similarly show that 55.8% and 89.4% concurred that
they like competition and that they feel like they have to always win and they are
39
achievement oriented while 71.2% disagreed. The results on life changes and family
show that 68.3%, 58.7% and 55.8% disagreed with the concept that their family
problems always weigh them down. While 64.4% of responses revealed that they could
like to stay more with their family and friends.
4.4.4 Physical stressors
Table 4.5 Physical stressors faced by workers in Kibera RAP Project
Agreed
Freq (%)
Disagreed
Freq (%)
My place of work is very noisy and crowded 61(58.7) 43(41.3)
It sometimes gets very cold or hot in my place of work 77(74.0) 27(26.0)
All required resources are unavailable to me 34(32.7) 70(67.3)
Lighting and ventilation at my workplace is not conducive 18(17.3) 86(82.7)
There is little use of technology use in my work 44(42.3) 60(57.7)
My workplace lacks privacy and security 33(31.7) 71(68.3)
The comfort I am provided at work is low 42(40.4) 64(59.6)
Table above reveals results on physical stressors. Results show that 58.7% and 74% of
the respondents agreed that their work place was noisy and swarmed and once in a
while its gets cold or hot in their work place separately. Then again, 67.3%, 82.7%,
57.7%, 68.3% and 59.6% differ that all resources required were inaccessible to them,
lighting and ventilation at their working environment was not helpful, there was little
utilization of innovation use in their work, their work environment needs privacy and
security and the solace they are given at work was low in a specific order.

40
4.5.1 Subjective Stress Level
Table 4.7 Subjective Stress Levels
Emotional Exhaustion (n=104) SA
F (%)
A
F (%)
N
F (%)
D
F (%)
SD
F (%)
After my day at work I normally
feel emotionally drained
16(15.4) 39(37.5) 16(15.4) 33(31.7) 0
I always don’t feel like going to
work in the morning
0 0 0 73(70.2) 31(29.8)
I feel so much stressed working
with people directly and every
day
0 0 12(11.5) 50(48.1) 42(40.4)
I am always worried about work 0 15(14.4) 21(20.2) 45(43.3) 23(22.1)
I always feel unhappy and
frustrated by my job
0 0 14(13.5) 48(40.4) 48(46.2)
Reduced achievement
I can deal effectively with my co-
workers
45(43.3) 48(46.2) 11(10.6) 0 0
I feel like I have accomplished 18(17.3) 32(30.8) 22(21.2) 32(30.8) 0
I feel very energetic 49(47.1) 49(47.1) 6(5.8) 0 0
I feel confident that I am
effective at getting things done at
work
30(28.8) 51(49.0) 14(13.5) 9(8.7) 0
Depersonalization
I doubt the significance of my
work
0 0 15(14.4) 52(50.0) 37(35.6)
I have become less interested
with my work since I started this
job
0 9(8.7) 10(9.6) 49(49) 36(34.6)
Co-workers blame me for their 0 16(15.4) 21(20.2) 40(38.5) 27(26.0)
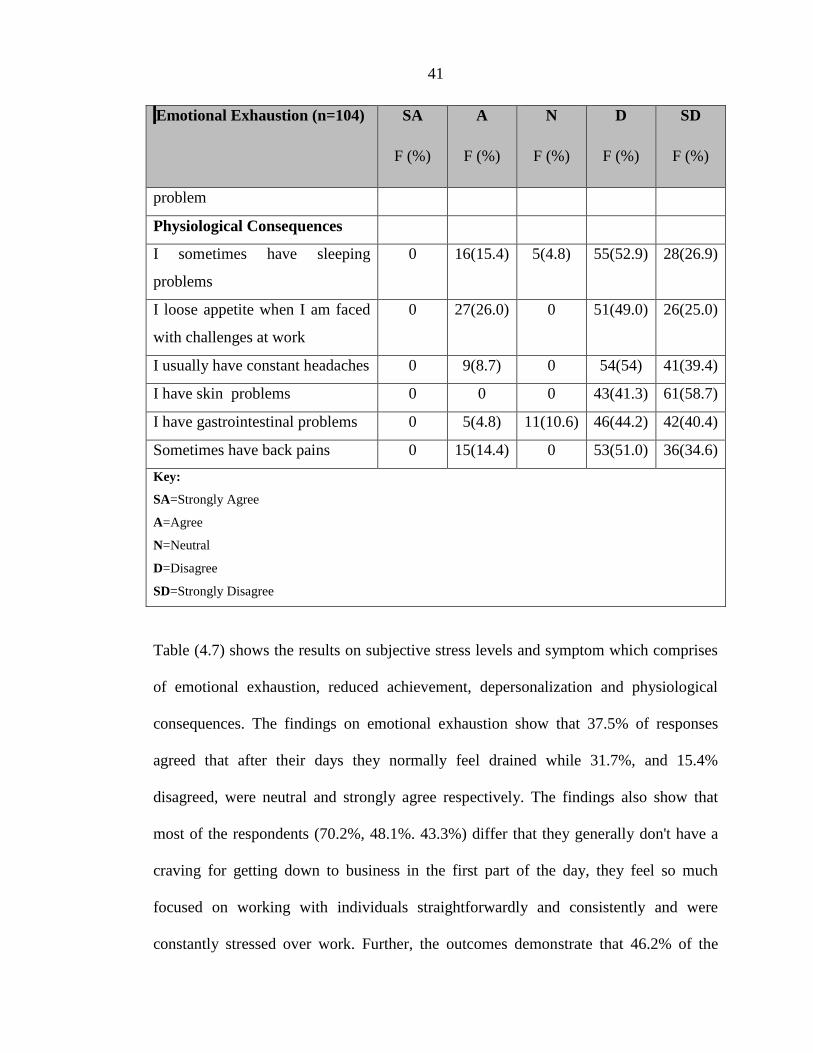
41
Emotional Exhaustion (n=104) SA
F (%)
A
F (%)
N
F (%)
D
F (%)
SD
F (%)
problem
Physiological Consequences
I sometimes have sleeping
problems
0 16(15.4) 5(4.8) 55(52.9) 28(26.9)
I loose appetite when I am faced
with challenges at work
0 27(26.0) 0 51(49.0) 26(25.0)
I usually have constant headaches 0 9(8.7) 0 54(54) 41(39.4)
I have skin problems 0 0 0 43(41.3) 61(58.7)
I have gastrointestinal problems 0 5(4.8) 11(10.6) 46(44.2) 42(40.4)
Sometimes have back pains 0 15(14.4) 0 53(51.0) 36(34.6)
Key:
SA=Strongly Agree
A=Agree
N=Neutral
D=Disagree
SD=Strongly Disagree
Table (4.7) shows the results on subjective stress levels and symptom which comprises
of emotional exhaustion, reduced achievement, depersonalization and physiological
consequences. The findings on emotional exhaustion show that 37.5% of responses
agreed that after their days they normally feel drained while 31.7%, and 15.4%
disagreed, were neutral and strongly agree respectively. The findings also show that
most of the respondents (70.2%, 48.1%. 43.3%) differ that they generally don't have a
craving for getting down to business in the first part of the day, they feel so much
focused on working with individuals straightforwardly and consistently and were
constantly stressed over work. Further, the outcomes demonstrate that 46.2% of the

42
respondents emphatically differ that they generally feel troubled and baffled by their
activity.
The findings on reduced achievement indicate that most of the respondents (46.2%,
47.1% and 49%) agreed that they effectively deal with their co –workers, are energetic
and are confident that they were effective at getting things done. The results also show
that that 30.8% of the respondents agreed and disagreed that they felt like they had
accomplished something while 21.2% were neutral while 17.3% strongly felt they had
accomplished something. The results on depersonalization show that most of the
respondents (50%, 47.1%, and 38.5%) disagreed that they doubt their significance at
work, they become less interested with work and their coworkers blame them for their
problems respectively.
The findings on physiological consequences show that most of the respondents (52.9%,
49%, 54%, 44.2% and 51%) disagreed that they sometimes experience sleeping
problems, they lose appetite when faced with work problems, have constant headaches,
gastrointestinal problems and back pains respectively. The results also show that 41.3%
and 58.7% of the total respondents didn’t agree and they strongly disagreed that they
have skin problems respectively.

43
4.5.2 Objective Stress Level
Table 4.8 Objective Stress Levels
Attribute 1
F
(%)
2
F (%)
3
F (%)
4
F (%)
5
F (%)
Number of tasks I have to meet 0 15(14.4) 39(37.5) 47(45.2) 3(2.9)
I can meet 0 9(8.7) 40(38.5) 36(34.6) 19(18.3)
Level of difficulty
in my work
I have to deal
with
2(1.9) 33(31.7) 49(47.1) 17(16.3) 3(2.9)
I can deal with 0 10(9.6) 43(41.3) 46(44.2) 5(4.8)
The quality of
work
I have to do 2(1.9) 4(3.8) 28(26.9) 44(42.3) 26(25.0)
Capable of
doing
0 0 37(35.6) 43(41.3) 24(23.1)
The degree to
which my skills
Are used 3(2.9) 15(14.4) 45(43.3) 30(28.8) 11(10.6)
Could be used 2(1.9) 4(3.8) 36(34.6) 41(39.4) 21(20.2)
The number of
projects
I have to deal
with
6(2.8) 29(27.9) 39(37.5) 27(26.0) 3(2.9)
I can deal with 0 8(7.7) 31(29.8) 62(59.6) 3(2.9)
The number of
people
I have to work
with
0 20(19.2) 21(20.2) 60(52.9) 3(2.9)
Would like to
work with
0 6(5.8) 30(28.8) 55(52.9) 13(12.5)
The scope of work I have to
handle
0 19(18.3) 36(34.6) 42(40.4) 7(6.7)
I can handle 0 6(5.8) 44(42.3) 49(47.1) 5(4.8)
Note: 1 – None, 2 – Little / Some, 3 – Average, 4 – A lot, 5 – A very great deal
The results on table 4.8 show the findings objective stress levels and symptoms. The
findings on the number tasks, 45.2% and 37.5% of the respondents indicated they had to
meet a lot and also average tasks while 38.5% and 34.6% indicated they can meet

44
average and a lot of tasks respectively. The results on the level of difficulty of the
respondents work, 47.1% and 31.7% indicated that they have to deal with average tasks
and little or some of the tasks while 44.2% and 41.3% indicate they can deal with
average and a lot of the tasks respectively. The findings on the quality of work, most of
the respondents (42.3%, 26.9% and 25%) indicated that they had to do a lot of tasks,
average tasks and a great deal of the tasks while (41.3%, 35.6% and 23.1%) indicate the
a capable of doing a lot of tasks, average task and a great deal of the tasks respectively.
The results on the degree of the respondents skills, 43.3% of the respondents indicated
that average of their skills is used while 28.8% indicated their skill are used a lot while
39.4% indicate that the can use their skill to achieve a lot of tasks. The findings on the
number of projects, most of the respondents (37.5%, 27.9% and 26%) indicate that they
have to deal with average projects, little/some and a lot projects while (29.8% and
59.6%) can deal with average and a lot of projects. On the number of people, most of
the respondents (52.9% and 20.2%) indicated that they have to work a lot and average
number of people while (52.9% and 28.8%) indicates that they would like to work a lot
or average number of people respectively. The findings on the scope of work most of
the respondents (40.4% and 34.6%) indicate that they have to handle a lot and average
tasks while (47.1% and 42.3%) indicate that they can handle a lot and average tasks
respectively.
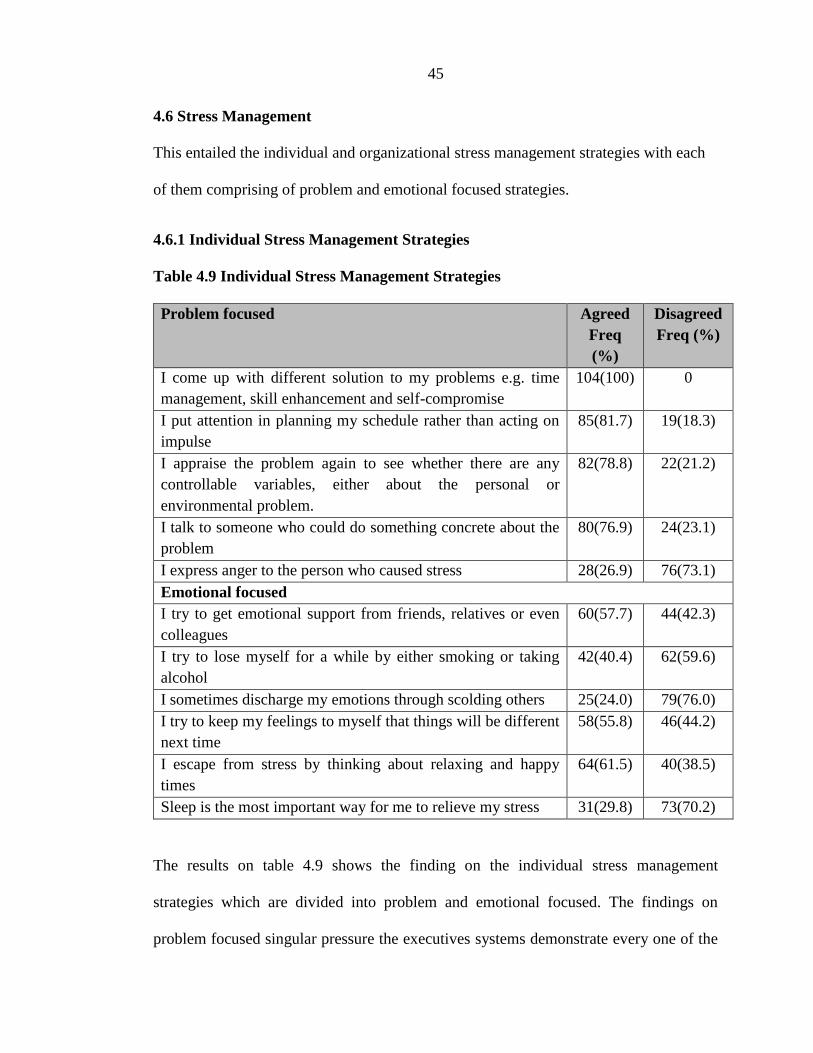
45
4.6 Stress Management
This entailed the individual and organizational stress management strategies with each
of them comprising of problem and emotional focused strategies.
4.6.1 Individual Stress Management Strategies
Table 4.9 Individual Stress Management Strategies
Problem focused Agreed
Freq
(%)
Disagreed
Freq (%)
I come up with different solution to my problems e.g. time
management, skill enhancement and self-compromise
104(100) 0
I put attention in planning my schedule rather than acting on
impulse
85(81.7) 19(18.3)
I appraise the problem again to see whether there are any
controllable variables, either about the personal or
environmental problem.
82(78.8) 22(21.2)
I talk to someone who could do something concrete about the
problem
80(76.9) 24(23.1)
I express anger to the person who caused stress 28(26.9) 76(73.1)
Emotional focused
I try to get emotional support from friends, relatives or even
colleagues
60(57.7) 44(42.3)
I try to lose myself for a while by either smoking or taking
alcohol
42(40.4) 62(59.6)
I sometimes discharge my emotions through scolding others 25(24.0) 79(76.0)
I try to keep my feelings to myself that things will be different
next time
58(55.8) 46(44.2)
I escape from stress by thinking about relaxing and happy
times
64(61.5) 40(38.5)
Sleep is the most important way for me to relieve my stress 31(29.8) 73(70.2)
The results on table 4.9 shows the finding on the individual stress management
strategies which are divided into problem and emotional focused. The findings on
problem focused singular pressure the executives systems demonstrate every one of the
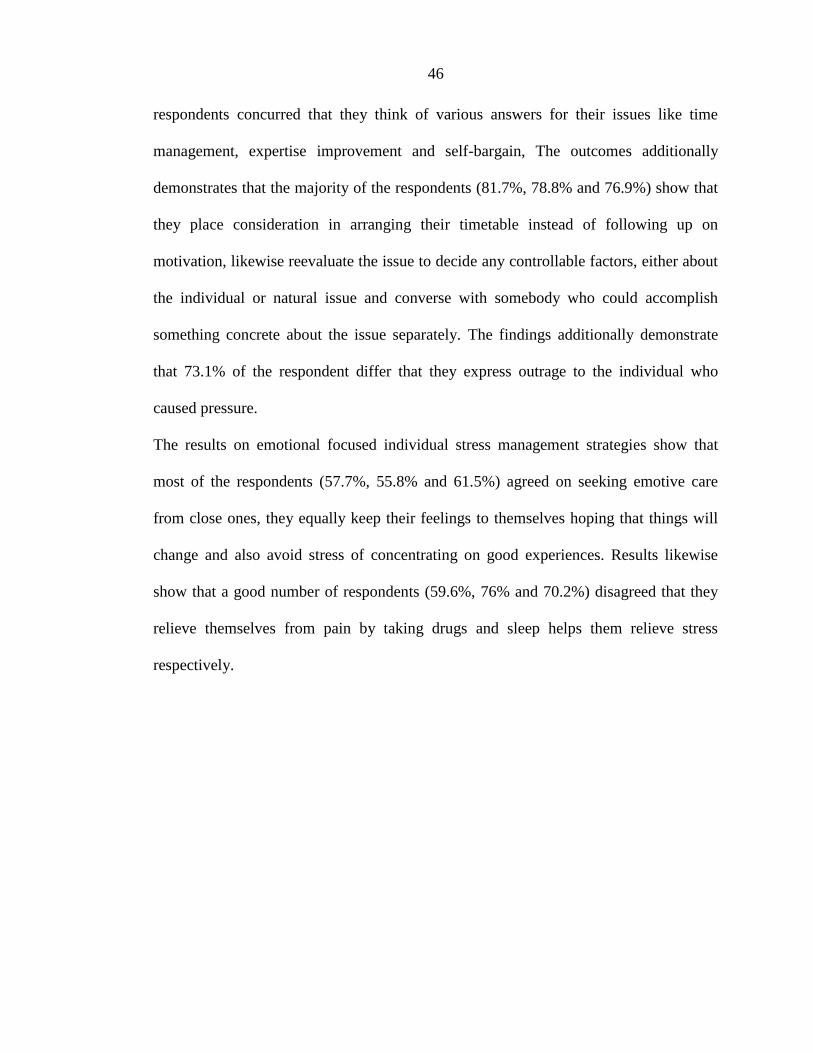
46
respondents concurred that they think of various answers for their issues like time
management, expertise improvement and self-bargain, The outcomes additionally
demonstrates that the majority of the respondents (81.7%, 78.8% and 76.9%) show that
they place consideration in arranging their timetable instead of following up on
motivation, likewise reevaluate the issue to decide any controllable factors, either about
the individual or natural issue and converse with somebody who could accomplish
something concrete about the issue separately. The findings additionally demonstrate
that 73.1% of the respondent differ that they express outrage to the individual who
caused pressure.
The results on emotional focused individual stress management strategies show that
most of the respondents (57.7%, 55.8% and 61.5%) agreed on seeking emotive care
from close ones, they equally keep their feelings to themselves hoping that things will
change and also avoid stress of concentrating on good experiences. Results likewise
show that a good number of respondents (59.6%, 76% and 70.2%) disagreed that they
relieve themselves from pain by taking drugs and sleep helps them relieve stress
respectively.

47
4.6.2 Organizational Stress Management Strategies
The results on organizational stress management strategies are shown by table 4.10
Table 4.10 Organizational Stress Management Strategies
Problem Focused Agreed
Freq
(%)
Disagreed
Freq (%)
Use of preferred shifts and time offs 58(55.8) 46(44.2)
Salary increments and prompt wages/incentives 59(56.7) 45(43.3)
Fairness when dealing with promotions 69(66.3) 35(33.7)
Increase in resources, individual competencies and skills 72(69.2) 32(30.8)
Delegation of tasks and responsibilities 94(90.4) 10(9.6)
Emotional focused
Continuous guidance and counseling 72(69.2) 32(30.8)
Social and family support 94(68.3) 10(31.7)
Regular feedback and performance recognition 68(65.4) 36(34.6)
Managerial and colleague support 79(76.0) 25(24.0)
Control over work 71(68.3) 33(31.7)
The findings on table above reveals that organizational stress management strategies
which are divided into problem and emotional focused. The findings on problem
focused organizational stress management strategies show that a higher number of
respondents (55.8%, 56.7% and 66.3%) agreed that the organization uses favored
moves and time offs, compensation additions and brief wages/motivating forces and
reasonableness when managing advancements. The findings likewise show that the vast
majority of the respondents (69.2% and 90.4%) concurred that the association expands
assets, upgrades singular skills and furthermore appointment of errands and duties.The

48
results on emotional focused organizational stress management strategies indicate that
most of the respondents (69.2%, 68.3% and 65.4%) agreed that they organization offers
continued support to family members as well as recognizing best performing workers.
Additionally, a good number of respondents (76% and 68.3%) indicate that the
organization offers managerial and colleague support to the workers.
4.7 Inferential Statistics
4.7.1 Factors Analysis
These are proxies for the observations on the study variables which can be decreased
from the many to less variables with similar variations, a factor commonly referred to as
dimensionality (Yong & Pearce, 2013). Thus, Factor analysis was used in identifying
the major causes of stress amongst Kibera RAP construction workers. To determine
whether factors analysis is viable the Kaiser-Meyer-Olkin sampling measures and
Bartlett’s test were carried out.
4.7.1.1 KMO and Bartlett's Test
KMO statistics predicts if the data produce varied consistent factors based on
correlation and partial correlation. The KMO ranges between 0 and 1 with values closer
to 1 revealing close relations an indication of good fit for analysis hence values of 0.5
and above are considered acceptable. Bartlett measure of sphericity on null hypothesis
indicates the identity correlation matrix (Yong & Pearce, 2014). The results on table
4.11 show that the KMO statistics value is 0.620 which above the recommended 0.5
value hence factor analysis is deemed fit for analysis. Similarly, the Bartlett's Test

49
statistics value is 0.000 which indicates that Bartlett’s test is highly significant since (p
< 0.05), hence factor analysis is suitable.
Table 4.11 KMO and Bartlett's Test
KMO and Bartlett's Test
Kaiser-Meyer-Olkin Measure of Sampling Adequacy. .620
Bartlett's Test of Sphericity Approx. Chi-Square 150.859
df 55
Sig. .000
4.7.1.2 Variables Correlation
Correlation indicates how each item is associated (correlated) with other variables.
Highly correlated variables indicate high relation linking 2 variables and are clustered
by through factor analysis while variables with insignificant correlation are associated
with low loading with similar factor.
Table 4.12 Correlation Matrix
Correlation Matrixa
1 2 3 4 5 6 7 8 9 10 11
1 1.000 .000 .122 .133 .264 .157 .095 -.269 .030 -.178 .044
2 .000 1.000 .260 .244 .137 .003 -.049 -.051 .384 .197 .186
3 .122 .260 1.000 .099 .150 .008 .019 .288 .046 -.028 .365
4 .133 .244 .099 1.000 .204 .016 -.135 -.114 .105 .224 .116
5 .264 .137 .150 .204 1.000 .314 -.038 .170 .120 .189 .190
6 .157 .003 .008 .016 .314 1.000 -.011 .015 -.016 .073 .045
7 .095 -.049 .019 -.135 -.038 -.011 1.000 -.133 .036 .270 -.032
8 -.269 -.051 .288 -.114 .170 .015 -.133 1.000 -.211 -.052 .125
9 .030 .384 .046 .105 .120 -.016 .036 -.211 1.000 .077 .154
10 -.178 .197 -.028 .224 .189 .073 .270 -.052 .077 1.000 .149
11 .044 .186 .365 .116 .190 .045 -.032 .125 .154 .149 1.000
a. Determinant = .216 Key: 1-Work overload, 2-Work under load, 3-Role conflict, 4-Role ambiguity, 5-Complexity of rules, 6-
Bureaucracy, 7 –Feedback, 8-Interpersonal relationship, 9 -Type A behavior, 10-Life changes and
family, 11-Physical stressors

50
Table 4.12 shows determinant of 0.216 which is greater than 0.0001 and not close to
zero which indicates that there is no collinearity among the variables. Additionally, all
the correlations among the variables are less than 0.7 which also indicates the absence
of multicollinearity among the considered items.
4.7.1.3 Commonalities
They indicate the percentage/ratio of variables variations which emanate from the
model. The original commonalities compare one variable correlation with others in the
model before rotation while the extraction values column indicate the ratio of particular
variable which is impacted by other factors outside the model which is revealed in table
4.13.
Table 4.13 Commonalities
Initial Extraction
Work overload 1.000 .818
Work under load 1.000 .611
Role conflict 1.000 .731
Role ambiguity 1.000 .512
Complexity of rules 1.000 .662
Bureaucracy 1.000 .553
Feedback 1.000 .858
Interpersonal relationship 1.000 .762
Type A behavior 1.000 .529
Life changes and family 1.000 .824
Physical stressors 1.000 .501
Extraction Method: Principal Component Analysis

51
The results on table 4.13 show that all the variables are well presented in the common
factor space since they have high extraction values range between 0.501 and 0.858. The
extraction values also indicate that high proportion of variance is explained by the
variables. For example, 81.8% of variance for the variable, “work overload” is
accounted for by the factors extracted.
4.7.1.4 Factor Extraction
In factor extraction the total number of common components or factors that could be
extracted are equal or less to variables involved. For this study 11 factors were
considered and these factors included; Work overload, Work under load, Role conflict,
Role ambiguity, Complexity of rules, Bureaucracy, Feedback, Interpersonal
relationship, Type A behavior, Life changes and family, and Physical stressors. The
factor extraction table also generates Eigen values, Extraction sums of squared loadings
and Rotation sums of squared loadings. The Eigenvalue for a given factor measures the
variance in all the components, which is accounted for by that factor and all factors that
are above the eigenvalue of 1 are normally retained (Yong & Pearce, 2013). The table
likewise generates the percentage of variance which indicates the percent of co-
variation among items accounted for by each factor before and after rotation. Table
below reveals the findings.

52
Table 4.14 Factor Extraction
Total Variance Explained
Com
pon
ent
Initial Eigenvalues Extraction Sums of Squared
Loadings
Rotation Sums of Squared
Loadings
Total % of
Variance
Cumulative
%
Total % of
Variance
Cumulative
%
Total % of
Variance
Cumulative
%
1 2.106 19.147 19.147 2.106 19.147 19.147 1.720 15.637 15.637
2 1.531 13.914 33.061 1.531 13.914 33.061 1.600 14.543 30.180
3 1.382 12.564 45.625 1.382 12.564 45.625 1.504 13.670 43.850
4 1.238 11.253 56.878 1.238 11.253 56.878 1.285 11.684 55.534
5 1.106 10.058 66.936 1.106 10.058 66.936 1.254 11.403 66.936
6 .929 8.444 75.380
7 .740 6.730 82.110
8 .682 6.197 88.307
9 .522 4.749 93.056
10 .416 3.781 96.837
11 .348 3.163 100.000
Extraction Method: Principal Component Analysis.
The results on table 4.14 demonstrated that only five components were extracted. The
five components accounted for 66.936% of the variance while 33.064% was
representative of the other components. Table 4.14 exhibited that component 1
accounted for 19.147% while component 2, 3, 4 and 5 accounted for 13.914%,
12.564%, 11.253% & 10.058% respectively. The scree plot below (Figure 4.7) depicted
a graphical presentation of greater than 1(no.) for the five components. In accordance
with the Kaiser rule, this implied that all the five components elicited a high reliability

53
since an Eigen value of less than 1(no.) would have implied a negative reliability of the
components.
Figure 4.4 Scree Plot of components extraction.
4.7.1.5 Rotated Component Matrix
Factors are normally rotated for them to be interpreted with ease hence different items
are expounded by the variables affecting the model with each explaining various
factors. Table 4.15 shows the obtained results.

54
Table 4.15 Rotated Component Matrix
Rotated Component Matrixa
Component
1 2 3 4 5
Work under load .721 .288 -.006 -.086 -.032
Type A behavior .695 .076 -.121 .131 .092
Role ambiguity .569 -.061 .358 -.072 -.226
Role conflict .078 .842 .006 .124 -.001
Physical stressors .237 .652 .114 -.033 .073
Interpersonal relationship -.424 .553 .115 -.445 -.255
Complexity of rules .125 .241 .765 .058 -.024
Bureaucracy -.125 -.042 .724 .106 .025
Work overload .068 .051 .315 .839 .088
Life changes and family .331 -.055 .343 -.565 .525
Feedback -.087 .031 -.050 .078 .917
Extraction Method: Principal Component Analysis.
Rotation Method: Varimax with Kaiser Normalization.
a. Rotation converged in 10 iterations.
Table 4.15 shows the rotated component matrix which was generated to achieve the
factor loading that were easy to interpret using a Varimax rotation which has a
differentiating effect of the original variables by factor. The effect is that it minimizes
the number of variables and leaves which had high loadings on any one given factor. By
analyzing each of the factors and their cluster variables in table 4.17, Component 1 was
regarded as “work under load”, component 2 was labeled “role conflict”, component 3
was labeled “complexity of roles”, component 4 was labeled “work overload” while
component 5 was labeled “feedback”. All the chosen variables have the highest loading
under each component; however, labeling of the components is a subjective exercise

55
and there is no guarantee that the factors chosen present the real situation and can be
challenged.
4.7.2 Mann-Whitney U Test
The Mann Whitney U test is a non-parametric test used to compare outcomes between
two independent groups. The Mann‐Whitney U test null hypothesis stipulates that the
two independent groups are homogeneous and have the same distribution. The
Mann‐Whitney U test is based on the comparison of each observation from the first
group, with each observation from the second group (Nachar, 2008). In this study, the
Mann-Whitney U test was utilized to test the distribution of subjective and objective
stress levels among the gender of the respondents. Table 4.16 and 4.17 shows the results
obtained.
Table 4.16 Subjective and Objective Stress Levels among Gender of the
Respondents
Ranks
Gender N Mean Rank Sum of Ranks
Subjective stress levels
Male 81 53.96 4370.50
Female 23 47.37 1089.50
Total 104
Objective stress levels
Male 81 51.73 4190.50
Female 23 55.20 1269.50
Total 104
Table 4.16 (column Mean Rank) provides information regarding the output of the actual
Mann-Whitney U test, and shows the mean rank and sum of ranks for the two groups

56
tested. The table shows that male workers have the highest levels of subjective stress
levels (Mean rank = 53.96). On the other hand, female workers have the highest levels
of objective stress levels (Mean rank = 55.20).
Table 4.17 Subjective and Objective Stress Levels among Gender of the
Respondents
Test Statistics
Subjective stress levels Objective stress levels
Mann-Whitney U 813.500 869.500
Wilcoxon W 1089.500 4190.500
Z -.927 -.488
Asymp. Sig. (2-tailed) .354 .626
a. Grouping Variable: Gender
Table 4.17 shows the results on the calculated z-values and the approximately
calculated statistical significance of differences between the subjective and objective
stress levels and the respondents’ gender. The Z values for subjective and objective
stress levels are -0.927 and -0.488 and the P values are 0.354 and 0.626 which are
greater than 0.05. Thus, it can be concluded that subjective and objective stress levels
among the male and female construction workers is not statistically significant.
4.7.3 Kruskal - Wallis Test
The Kruskal-Wallis Test is a non-parametric test for testing the difference between
several independent groups. The Kruskal-Wallis H test is likewise called the one-way
ANOVA (Analysis of variance) on ranks and can be used to determine if there are
statistically significant differences between two or more groups of an independent

57
variable on a continuous or ordinal dependent variable (Mehotcheva, 2008). In this
study the Kruskal - Wallis test was applied to test the distribution of stress levels among
the various job categories (Managers, skilled workers and general labourers) of the
respondents. Table 4.18 and 4.19 illustrates the results.
Table 4.18 Subjective and Objective Stress Levels among the Respondents Job
Categories
Stress Category Job category N Mean Rank
Subjective stress levels
Managers 8 49.38
Skilled workers 45 51.30
General labourers 51 54.05
Total 104
Objective stress levels
Managers 8 34.13
Skilled workers 45 53.47
General labourers 51 54.53
Total 104
Table 4.18 showed the mean rank and sum of ranks for the groups tested. As such, it
was evident that general labourers exhibited the highest levels of subjective and
objective stress (Mean ranks of 54.05 & 54.53). This was subsequently followed by
skilled workers with mean ranks of 51.30 & 53.47; and managers with mean ranks of
49.38 and 34.13. The results equally portrayed that subjective stress in managers was
higher (mean rank = 49.38) when compared to objective stress (mean rank = 34.13).

58
Table 4.19 Subjective and Objective Stress Levels among the Respondents Job
Categories
Test Statisticsa,b
Subjective stress levels Objective stress levels
Chi-Square .293 3.274
df 2 2
Asymp. Sig. .864 .195
a. Kruskal Wallis Test
b. Grouping Variable: Job Category
Table 4.19 illustrated the Kruskal Wallis test results. As such, the table showed that the
p-values for subjective and objective stress levels were 0.864 and 0.195 respectively.
The stress levels were greater than the significant value of 0.05. This implied that the
subjective and objective stress levels among the various job categories of Managers,
skilled workers and general labourers in the construction industry were not statistically
significant.
4.7.4 Chi-square
Chi-square was used to test whether there was a significant association of stress levels
between task, organizational, individual and physical stressors among construction
worker in the Kibera RAP Project. The results are presented in the subsequent sections.
4.7.4.1 Task Stressors and Stress Levels
The chi square results on the significant association between task stressors and stress
levels are depicted in Table 4.20

59
Table 4.20 Task Stressors and Stress Levels among workers in Kibera RAP
Project
Value Df Asymp. Sig. (2-
sided)
Pearson Chi-Square 2552.044a 2310 .000
Likelihood Ratio 624.740 2310 1.000
Linear-by-Linear Association 3.178 1 .075
N of Valid Cases 104
a. 2414 cells (100.0%) have expected count less than 5. The minimum expected count is
.01.
The results on Table 4.20 displayed the Chi square value as 0.000. This was less than
the significance value of 0.05 (0.000<0.005). In this regard, this implied a disregard of
the null hypothesis which theorized that there was no significant association between
task stressors and stress levels among construction workers in the Kibera RAP Project.
4.7.4.2 Organizational Stressors and Stress Levels
The results as illustrated in Table 4.21 displayed a significant association between
organizational stressors and stress levels among construction workers in the Kibera
RAP Project.
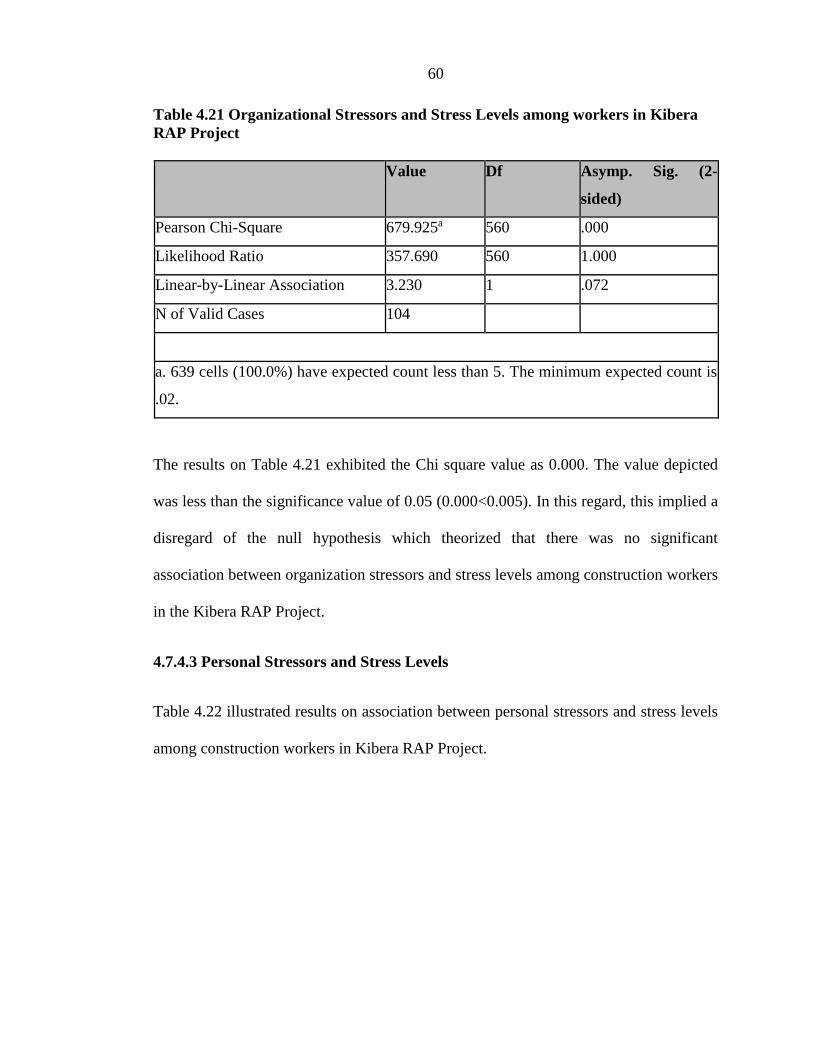
60
Table 4.21 Organizational Stressors and Stress Levels among workers in Kibera
RAP Project
Value Df Asymp. Sig. (2-
sided)
Pearson Chi-Square 679.925a 560 .000
Likelihood Ratio 357.690 560 1.000
Linear-by-Linear Association 3.230 1 .072
N of Valid Cases 104
a. 639 cells (100.0%) have expected count less than 5. The minimum expected count is
.02.
The results on Table 4.21 exhibited the Chi square value as 0.000. The value depicted
was less than the significance value of 0.05 (0.000<0.005). In this regard, this implied a
disregard of the null hypothesis which theorized that there was no significant
association between organization stressors and stress levels among construction workers
in the Kibera RAP Project.
4.7.4.3 Personal Stressors and Stress Levels
Table 4.22 illustrated results on association between personal stressors and stress levels
among construction workers in Kibera RAP Project.

61
Table 4.22 Personal Stressors and Stress Levels among workers in Kibera RAP
Project
Value Df Asymp. Sig. (2-
sided)
Pearson Chi-Square 1630.849a 1260 .000
Likelihood Ratio 536.383 1260 1.000
Linear-by-Linear Association 24.994 1 .000
N of Valid Cases 104
a. 1349 cells (100.0%) have expected count less than 5. The minimum expected count
is .02.
The results on Table 4.22 displayed the Chi square value as 0.000. The value was less
than the significance value of 0.05 (0.000<0.005). In this regard, this implied a
disregard of the null hypothesis which theorized that there was no significant
association between personal stressors and stress levels among construction workers in
the Kibera RAP Project.
4.7.4.4 Physical Stressors and Stress Levels
Table 4.23 illustrated the results on the significant association between physical
stressors and stress levels among construction workers in Kibera RAP Project.

62
Table 4.23 Physical Stressors and Stress Levels among workers in Kibera RAP
Project
Value Df Asymp. Sig. (2-
sided)
Pearson Chi-Square 557.213a 490 .019
Likelihood Ratio 316.702 490 1.000
Linear-by-Linear Association 3.439 1 .064
N of Valid Cases 104
a. 568 cells (100.0%) have expected count less than 5. The minimum expected count is
.02.
The results on Table 4.23 displayed the Chi square value as 0.019. The value was less
than the significance value of 0.05 (0.019<0.005). In this regard, this implied a
disregard of the null hypothesis which theorized that there was no significant
association between physical stressors and stress levels among construction workers in
the Kibera RAP Project.

63
CHAPTER FIVE: DISCUSSIONS, CONCLUSIONS AND
RECOMMENDATIONS
5.1 Discussions
This objective of this study was to examine stress levels among construction workers in
Kenya with focus on Kibera Resettlement Action Plan Project. The study sought to
examine the major causes of stress in the construction industry, the levels of objective
and subjective stress and the stress management strategies employed in the construction
industry.
Research question 1: What are the causes of stress among construction workers in
Kibera RAP project?
The findings on the main causes of stress among construction workers in Kibera RAP
project revealed that only five variables account for 66.936% of the variance while
33.064% is accounted by the other components. Additionally, the study identified work
under load, role conflict, complexity of roles, work overload and feedback as the major
causes of work stress in the construction industry. As such, work under load, role
conflict and work overload are under task stressors while complexity of roles and
feedback are under organizational stressors. Thus, individual and physical stressors are
not major causes of work stress among construction workers at Kibera Resettlement
Action Plan Project a finding similar to that of Enshassi and Al-Swaity (2015) who
found that physical stressors were not recognized by Gaza Strip construction
professionals as an important source of stress. These findings are similar to that of
Leung, Skitmore & Chan (2007) which established that increased levels were found to

64
be mainly associated with workload, lack of autonomy and inappropriate feedback.
Sharma (2015) also established that lack of control at work, role conflict, inadequate
awareness about profession, workload and job pressure, and indifferent organizational
attitude as the major occupational stressors.
Research question 2: What are the levels of subjective and objective stress among
construction workers in Kibera RAP project?
The findings on the levels of objective and subjective stress among construction
workers in the Kibera RAP project established that male workers had the highest levels
of subjective stress with a mean rank of 53.96 while female workers have the highest
levels of objective stress with a mean rank of 55.20. The findings further revealed that
general labourers had the highest levels of subjective and objective stress with a mean
rank of 54.53 & 54.05 followed by skilled workers with a mean rank of 51.30 & 53.47
and then managers but subjective stress was higher with a mean rank of 49.38 in
managers compared to objective stress which had a mean rank of 34.13. However,
Leung, Skitmore & Chan (2007) established that stress levels of both the professionals
and other personnel are similar, with objective stress being significantly higher than
subjective stress.
Research question 3: Which are the work stress coping strategies employed by
both the organization and individuals in the Kibera construction site
The findings on problem focused individual stress management strategies established
that most of the construction workers come up with different solutions of their
problems, plan on the schedules and talk to someone about their problem. On emotional

65
focused individual stress management strategies, the study established that most of the
construction workers sought emotional support from family and colleagues, preferred
keeping the problem to themselves with the hope it will change.
The findings on problem focused organizational stress management strategies
established that mostly construction firm use shifts that are preferable and time off,
increase in salary, motivating incentives and fairness when promoting so that stress
amongst their workers can be managed. The findings about emotional focused
organizational stress management by the company the investigation found that
development firm offer direction and guiding, social and family backing and feed backs
given on a regular basis and recognizing the performance by employees. Kariuki,
(2013) asserts that work related pressure can be managed effectively by giving preferred
shift, increase in salary, reasonableness in doing the quality evaluations and
straightforwardness when managing work promotions. (Oladinrin et al., 2014)
additionally indicates that for stress to be reduced, sharing work load with colleagues,
time off work with family and reducing extra time at work are highest positioned plans
for managing work stress.
Hypothesis Testing
There is no significant relationship between stressors and the levels of stress
amongst construction workers in Kibera RAP Project
Finally, the findings of the relationship between stressors and the levels of stress
amongst construction workers in Kibera RAP Project the study revealed that there was a
significant association between task stressors, organizational stressors, personal

66
stressors, physical stressors and stress levels among construction workers in Kibera
RAP Project. This is in line with Leung, Skitmore & Chan., (2007) whose findings
revealed that increased subjective stress was a function of the relationship between role
conflict, work underload, lack of feedback and lack of autonomy. Further, the study
found that a statistically significant relationship between stressors and stress levels
among construction workers in Kibera RAP Project.
5.2 Summary of the findings
The study aimed at measuring stress levels among construction workers in Kibera
Resettlement Action Plan Project in Nairobi County. The specific objectives were to
identify causes of stress among construction employees in Kibera RAP Project, to
determine the subjective and objective stress level amongst construction employees
based in Kibera RAP Project and to determine the strategies of coping up with stress at
work used by both the company and workers in the Kibera construction site.
The findings of the study reveal that the principal causes of work stress among
construction workers were identified work overload, role conflict, complexity of roles
and feedback as the major causes of work stress in the construction industry and they
fall under task and organization stressors.
Subjective and objective stress levels among the gender of the respondents established
that male construction workers had the highest levels of subjective stress with a mean
rank of 53.96, while female construction workers have the highest levels of objective
stress levels with a mean rank of 55.2. Stress levels among the various job categories
established that general labourers had the highest levels of subjective with a mean rank

67
of 54.05 and objective stress with a mean rank of 54.53 followed by skilled workers
with a mean rank of 51.3 & 53.47 and managers a mean rank of 49.38 & 34.13.
The study further found that stress in construction firm is managed using different
strategies either problem or emotional focused at the individual and company level.
Finally, the chi square findings established that there was a statistically significant
association between task stressors, organizational stressors, personal stressors, physical
Stressors and stress levels among construction workers at the Kibera RAP Project.
5.3 Conclusions
Therefore, this study concludes that the major causes of work stress among construction
workers are task and organization stressors while individual and physical stressors have
a minimal effect among workers in construction.
Male construction workers have low levels of gratification with their work atmosphere
and low levels of self-assurance with the company while female construction workers
have challenges in accomplishing the challenges associated with the construction jobs.
Levels of stress among the various job categories established that general labourers had
the highest levels of subjective with a mean rank of 54.05 and objective stress with a
mean rank of 54.53 followed by skilled workers with a mean rank of 51.3 & 53.47 and
managers a mean rank of 49.38 & 34.13, hence the conclusion that stress level are high
among the general labourers compared to skilled worker and managers.
The study concludes that the construction firm should use a variety of tools as well as
methods at different levels to manage stress among their workers.

68
Finally, work related stressors significantly influences stress levels among construction
workers.
5.4 Recommendations
The study concluded that major causes of work stress among construction workers are
task and organization stressors. The study thus recommends that the construction firm
should put more emphasis on task and organizational stressors especially role conflict,
complexity of roles, work load and feedback to mitigate their effect amongst workers.
The study concluded that stress levels are high among the general labourers compared
to skilled worker and managers. The study therefore recommends that the management
of the construction firm should develop strategic ways to ensure that the low cadre
employees are not overburdened with work so as to reduce their stress levels, and also
come up with effective strategies to address the various stress affecting the male and
female workers.
The findings of the study revealed that construction firm use several stress management
strategies to mitigate the stress effect among workers in the construction sector. This
leads to the recommendation that the management of construction firm should regularly
revised company stress management strategies to ensure they are effective. The study
equally revealed that employees play a part in managing their stress levels through
individual emotional and problem focused strategies. The study recommends that
construction workers should form work groups and unions in which they can share their
work related stress and report such stressors to the management for action.

69
5.5 Further Research
This study aimed at finding out the major causes of stress, levels of stress among the
construction workers and stress management strategies. However, the study did not
cover specific stress coping strategies employed by workers in different levels. The
study only aimed at establishing the stress management strategies employed by
organization and individuals to mitigate stress. However, a study on the specific
strategies of coping with stress employed by workers in different levels is recommended
so as to better understand stress management strategies employed differently within
different job categories and how this helps in reducing stress levels.

70
REFERENCES
Bano, B. & Jha, R. K. (2012). Organizational Role Stress among Public and Private
Sector Employees: A Comparative Study. The Lahore Journal of Business, 1(1),
23–36
Bloisi, W., Cook, C.W., & Hunsaker, P. L. (2007) Management and Organizational
Behaviour. 2th Edition. London. McGraw publication
Bowen, P, Govender, R, Edwards, P. & Cattell, K. (2014) Workplace stress in the
construction industry: An explanatory model In: Raiden, A B and Aboagye-
Nimo, E (Eds) Procs 30th Annual ARCOM Conference, 1-3 September 2014,
Portsmouth, UK, Association of Researchers in Construction Management, 331-
340.
Bowen, P., Edwards, P., Lingard, H. & Cattell. K. (2014). Occupational stress and job
demand, control and support factors among construction project consultants.
International Journal of Project Management, 32 (7), 1273-1284
Bowen, P., Govender, R., & Edwards, P. (2014). Structural Equation Modeling of
Occupational Stress in the Construction Industry. J. Constr. Eng. Manage., 10,
1943-7862.
Campbell, F. (2006) Occupational Stress in the Construction Industry, Berkshire, UK:
Chartered Institute of Building
Chartered Institute of Building (2006). Accessibility and Usefulness of Construction
Labor Market Statistics.CIQ,8 (3),101-178.

71
Chan, I. Y. S. & Leung, M. Y. (2011) Impact of stress on injury incidents among
construction workers In: Egbu, C. and Lou, E.C.W. (Eds.) Procs 27th Annual
ARCOM Conference, 5-7 September 2011, Bristol, UK, Association of
Researchers in Construction Management, 229-238.
Cox, Tom and Griffiths, A.(2005) The nature and measurement of work-related stress:
theory and practice. In:Wilson, J.R. and Corlett, N. (eds.) Evaluation of Human
Work, 3rd Edition. Abingdon, UK: Routledge. ISBN 9780415267571.
Enshassi, A. & Al-Swaity, E. (2015). Key Stressors Leading to Construction
Professionals' Stress in the Gaza Strip, Palestine. Journal of Construction in
Developing Countries, 20(2), 53 -79.
Greenberg, J. (2011). Behavior in Organizations. (10th Ed.). England: Pearson
Education Ltd.
Hashim, A. E., Zarina, I., Ismail, F., Nurul, A. N. & Razali, R. (2012). Occupational
Stress and Behavioural Studies of Facilities Management Employees in
Commercial Complex. Journal of Asian Behavioural Studies, 2 (6), 63-72
Health and Safety Authority. (2011). Work-Related Stress: A Guide for Employers.
Health and Safety Authority. Ireland.
Health and Safety Executive. (2007). An analysis of the prevalence and distribution of
stress in the construction industry. Health and Safety Executive

72
Health and Safety Executive. (2007). Managing the Causes of Work-Related Stress: A
step-by-step approach using the Management Standards. Health and Safety
Executive
Herbert, M. (2011). An Exploration of the Relationships between Psychological Capital
(Hope, Optimism, Self-Efficacy, Resilience), Occupational Stress, Burnout and
Employee Engagement. Unpublished Thesis, University of Stellenbosch, South
Africa.
Ibem, E. O., Anosike, M.W., Azuh, D. E. & Mosaku, T. E. (2011). Work stress among
professionals in the building construction industry in Nigeria. Australasian
Journal of Construction Economics and Building, 11 (3) 45-57
Kariuki, A. W. (2013). Employee Perception of the Effectiveness of Occupational stress
Management Programmes at the Safaricom Call Centre. Unpublished Project
Report. University of Nairobi, Kenya
Kenya National Bureau of Statistics, (2011) National population and Housing report
Kesmodel, U. (2018). Cross‐ sectional studies – what are they good for? Acta
Obstetricia et Gynecologica Scandinavica, 1.
Koradecka, D., Pośniak, M., Widerszal-Bazyl, M., Augustyńska, D. & Radkiewicz, P.
(2010). A Comparative Study of Objective and Subjective Assessment of
Occupational Risk, International Journal of Occupational Safety and
Ergonomics,

73
Lazarus, R. S., and Folkman, S. (1984). Stress, Appraisal, and Coping. New York:
Springer.
Leung, M., Chan, Y. & Olomolaiye, P. (2008). Impact of Stress on the Performance of
Construction Project Managers. J. Constr. Eng. Manage., 8(644), 644-652.
Leung, M., Chan, Y. & Yu, J. (2009). Integrated Model for the Stressors and Stresses of
Construction Project Managers in Hong Kong. Journal of Construction
Engineering and Management, 135 (2), 126–134
Leung, M., Skitmore, M. & Chan, Y. S. (2007). Subjective and objective stress in
construction cost estimation. Construction Management and Economics, 25(10),
1063-1075.
Leung, M., Zhang, H. & Skitmore, M. (2006). Effects of organizational supports on the
stress of construction estimating participants. Paper for Journal of Construction
Engineering and Management.
Lin, R and Chan, C (2009) ‘Effects of heat on workers’ health and productivity in
Taiwan’, Journal of Global Health Action, .2, 1-6, viewed 16th May, 2010
www.globalhealthaction.net/index.php/gha/article/view/2024/255
Loosemore, M. & Waters, T. (2004). Gender Differences in Occupational Stress among
Professionals in the Construction Industry.J. Manage. Eng., 20(3), 126-132.
74
Love, P. E. D. Edwards, D. J. & Irani, Z. (2010). Work Stress, Support, and Mental
Health in Construction. Journal of Construction Engineering and Management,
136 (6), 650–658
Mackay C., Cox, T. Burrows, G. Lazzerini (1978). An inventory for the measurement of
self-reported stress and arousal. British Journal of Social and Clinical
Psychology, 17, 3, 283-4
Majale, M. M., Morumbasi, J. & Mutuli, D. A. (2000). Occupational Safety and Health
in the Construction Industry in Kenya. Proceedings of the Human Factors and
Ergonomics Society Annual Meeting July 2000 vol. 44 no. 22, 666-669
Mehotcheva, T. H. (2008). The Kruskal–Walllis Test. Seminar in Methodology &
Statistics. Retrieved online on 7/4/2017 from
http://www.let.rug.nl/nerbonne/teach/rema-stats-met seminar/presentations
Michie, S. (2002). Causes and Management of Stress at Work. Occup Environ Med.,
59: 67-72
Mitullah, W. V. & Wachira, I. N. (2003). Informal Labour in the Construction Industry
in Kenya: A case study of Nairobi. Sectoral Activities Programme. Working
Paper No. 204. International Labour Office
Mxenge, S.V., Dywili, M. & Bazana, S. (2014). Organizational Stress and Employees’
Intention to Quit Amongst Administrative Personnel at the University of Fort
Hare, Eastern Cape, South Africa. International Journal of Research in Social
Sciences, 4 (5), 13-25

75
Nachar, N. (2008). The Mann‐Whitney U: A Test for Assessing Whether Two
Independent Samples Come from the Same Distribution. Tutorials in
Quantitative Methods for Psychology, 4(1), 13‐20.
Nekzada, N. & Tekeste, S. F. (2013). Stress causes and its management at the work
place -A qualitative study on the causes of stress and management mechanisms
at Volvo Trucks AB, Umea. Unpublished Thesis. UMEÅ University
Occupational Health and Safety Management. (2005). Solving the Problem: Preventing
Stress in the Workplace. Accessed online from http://cgsst.fsa.ulaval.ca on
24/01/2016
Oladinrin, T. O., Adeniyi, O. & Udi, M. O. (2014). Analysis of Stress Management
among Professionals in the Nigerian Construction Industry. International
Journal of Multidisciplinary and Current Research, 2, 21-33
Oyewobi, L. O., Adamu, A. D., Ganiyu, B. O. & Odelade, O. M. (2011). Impact of
Stress Management on the Productivity of Workers on Nigerian Construction
Sites. Built Environmental Journal, 8 (2) 1-8
Reem, A. A., Marwa, M. Z, & Nanees, S. E. G. (2013). Non-Fatal Occupational Injuries
and Safety Climate: A Cross-Sectional Study of Construction Building Workers
in Mit-Ghamr City, Dakahlia Governorate, Egypt. Open Journal of Safety
Science and Technology, 3, 69-79

76
Saikala, L. & Selvarani, A. (2015). A Study on Work Stress among Architects and
Construction Professionals in Indian Construction Industry. International
Journal of Management, 6 (1), 585-593
Sermolo, S. (2014). Study of Occupational Safety and Health in Ethiopian Construction
Industry: A Case Study on Addis Ababa and Welkite. Unpublished Project
Report. Addis Ababa University, Ethiopia
Sharma, S. (2015). Occupational stress in the armed forces: An Indian army
perspective. IIMB Management Review, 27, 185–195
Shikieri, Ahlam & Musa, Hassan. (2012). Factors Associated with Occupational Stress
and Their Effects on Organizational Performance in a Sudanese University.
Creative Education. 03. 10.4236/ce.2012.31022.
Wahab, A. B. (2010). Stress management among artisans in construction industry in
Nigeria. Global Journal of Researches in Engineering, 10(1), 93-103
Wong, J., Toe, M. & Cheng, Y. K. (2010). Cultural determinants of stress in the
construction industry’ in Proceedings of 2010 International Conference on
Construction and Real Estate Management
Yahaya, A., Noridin, Y., Ismail, J., Sharif, Z., Muhammad, S., Azlina, K., Noraffandy,
Y., & Abbas, F. (2011). Effects of personality trait, motivation factors on
performance of customer service personnel (CSP): A case of MPH
bookstores. African Journal of Business Management, 5 (11),4519-
4530.https://www.academicjournals.org/AJBM

77
Yip, B., Rowlinson, S., Kvan, T. and Lingard, H. (2005) ‘Job burnout within the Hong
Kong construction industry: A cultural perspective’ in Proceedings of the
CIB W92/T23/W107 International Symposium on Procurement Systems
held at Las Vegas, Nevada, USA
Yip, B. & Rowlinson, S. (2006). Coping Strategies among Construction Professionals:
Cognitive and Behavioural Efforts to Manage Job Stressors. Journal for
Education in the Built Environment, 1(2), 70-79
Yong, A. N. & Pearce, S. (2013). A Beginner’s Guide to Factor Analysis: Focusing on
Exploratory Factor Analysis. Tutorials in Quantitative Methods for Psychology,
9(2), 79-94.

78
APPENDICES
Appendix I: Consent Letter
79

80
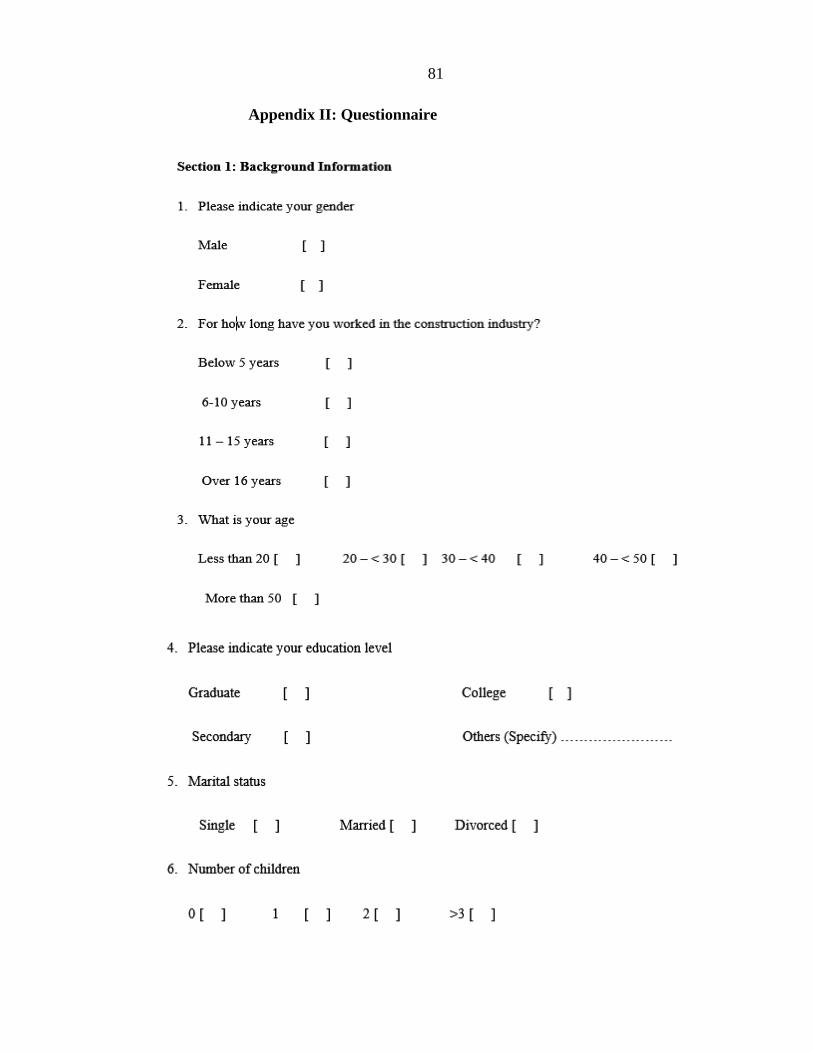
81
Appendix II: Questionnaire

82

83

84

85

86

87

88

89

90