Embed Size (px)
Citation preview

U.S. Department of CommerceEconomics and Statistics Administration
U.S. CENSUS BUREAUU S C E N S U S B U R E A UHelping You Make Informed Decisions
Public Transportation Usage AmongU.S. Workers: 2008 and 2009
American Community Survey Briefs
t
y
ByBrian S. McKenzie
ACSBR/09-5
Issued October 2010
Workers are civilians and members of the Armed Forces, 16 years and older, who were at work the previous week. Persons on vacation or not at work the prior week are not included.
Means of transportation to work refers to the principal mode of travel that the worker usually used to get from home to work during the reference week. People who used diff erent means of transporta-tion on diff erent days of the week were asked to specify the one they used most often. People who used more than one means of transportation to get to work each day were asked to report the one used for the longest distance during the work trip. Workers who worked at home are not included in this category. For more detailed defi nitions of these terms and other ACS terms, see the ACS subject defi -nitions list at <www.census.gov/acs/www/data_documentation/documentation_main/>.
INTRODUCTION
This report presents data from the 2008 and 2009 American Community Surveys (ACS) on the percentage of commuters who used public transportation to get to work in U.S. metropolitan statistical areas (metro areas).1 The percentage of workers who usually travel to work using public transportation has remained at about 5 percent since the 1990 Census.2
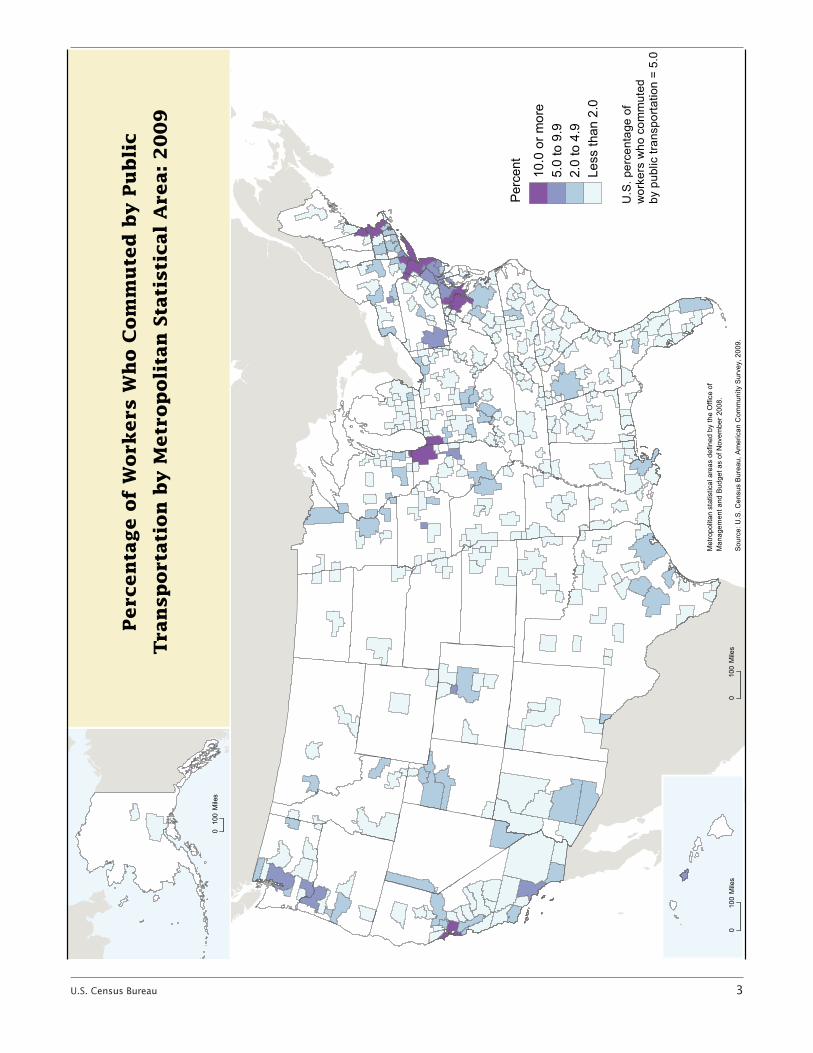
Public transportation accounts for a small percentage of commutes at the national level, but plays a more prominent role in several of the nation’s largest metro areas, especially in densely populated communities. About 39 percent of all workers who usually travel to work using public transportation live in the New York-Northern New Jersey-Long Island, NY-NJ-PA Metro Area. In an eff ort to provide more transportation choices for Americans nationwide, investment in public transportation systems has been an integral component of several major federal transportation programs in recendecades.
The ACS asks respondents about their usual means of transportation to work. “Public transportation” includes workers who used a bus, trolley, streetcar, subwaor elevated rail, railroad, or ferryboat, and did not work at home. Respondents
1 For more information on metropolitan statistical areas, please see <www.whitehouse.gov/omb/assets/omb/bulletins/fy2009/09-01.pdf>.
2 Percent public transportation usage for 1990 and 2000 was 5.12 and 4.57, respectively.
were to report their usual transportation method for the previous week, whether or not the information was consistent with their commuting activities for the majority of the year.
PUBLIC TRANSPORTATION USAGE AMONG U.S. WORKERS: 2008 AND 2009
Among the nation’s workers, 6.9 million commuted to work using public trans-portation in 2009. This is a reduction from 2008, when 7.2 million workers

2 U.S. Census Bureau
used public transportation to get to work. Table 2 lists ACS estimates of the number of workers who commuted by public transporta-tion in the 50 largest metro areas, in 2008 and 2009, as well as the change over the year.3 The national percentage of workers 16 years and over who used public transpor-tation to commute to work in 2009 (5.0 percent) was not statistically diff erent from the percentage in 2008.
The New York-Northern New Jersey-Long Island, NY-NJ-PA Metro Area had the highest percentage of workers who commuted by public transportation (30.5 per-cent). It was followed by the San Francisco-Oakland-Fremont, CA Metro Area, where 14.6 percent of workers commuted by public transportation.4 The percentage of workers who commuted by public transportation exceeded 10 percent in only 5 of the 366 metro areas in 2009.5 In Los Angeles, the nation’s second largest metro area, about 6 percent of workers commuted by public transportation. Also fall-ing within the category of 5 to 10 percent were several college towns, including Ithaca, NY, and Ames, IA. For the majority of metro areas, including several large metro areas such as Detroit-Warren-Livonia, MI, the public transportation usage rate among workers did not exceed 2 percent. The map provides a visual illustration of the percentage of
3 The margins of error for estimates in Table 2 were calculated using an unrounded standard error.
4 The percentage of public transportation commuters in the San Francisco-Oakland-Fremont, CA Metro Area was not statistically diff erent from that of the Washington-Arlington-Alexandria, DC-VA-MD-WV Metro Area.
5 For the following metro areas, the per-centage of workers who commuted by public transportation in 2009 exceeded and was statistically diff erent from 10 percent: Boston-Cambridge-Quincy, MA-NH; Chicago-Naperville-Joliet, IL-IN-WI; New York-Northern New Jersey-Long Island, NY-NJ-PA; San Francisco-Oakland-Fremont, CA; and Washington-Arlington-Alexandria, DC-VA-MD-WV.
workers who commuted by public transportation for all metro areas in 2009.
Table 2 shows comparisons between the 50 largest metro areas in 2008 and 2009. Ten experi-enced a statistically signifi cant decline in the number of public transportation commuters, and two (Seattle-Tacoma-Bellevue, WA, and Washington-Arlington-Alexandria, DC-VA-MD-WV) experienced a sta-tistically signifi cant increase in the number of public transit commut-ers.6 The 2009 estimates were not statistically diff erent from the 2008 estimates in the remainder of the metro areas. Boston-Cambridge-Quincy, MA-NH; Seattle-Tacoma-Bellevue, WA; and Washington-Arlington-Alexandria, DC-VA-MD-WV, were the only three metro areas that experienced a statistically signifi cant increase in the percent-age of workers who commuted by public transportation, and four metro areas experienced a statis-tically signifi cant decline in the percentage of public transportation commuters.7
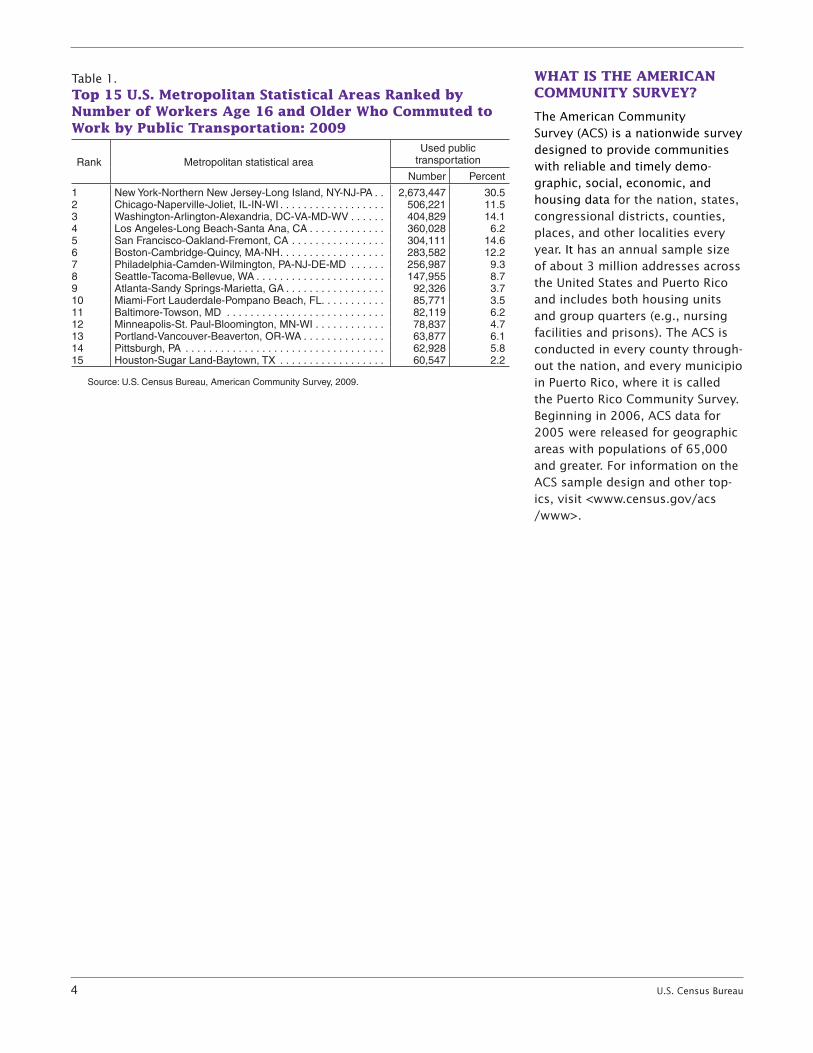
Table 1 shows the top 15 metro areas ranked by the number of workers who commuted by public transportation in 2009. The New York-Northern New Jersey-Long Island, NY-NJ-PA Metro Area had the highest number of workers who used public transportation in 2009, at 2.7 million workers. The Chicago-Naperville-Joliet, IL-IN-WI
6 The following metro areas experienced a statistically signifi cant decline in the number of public transportation commuters: Charlotte-Gastonia-Concord, NC-SC; Columbus, OH; Detroit-Warren-Livonia, MI; Houston-Sugar Land-Baytown, TX; Las Vegas-Paradise, NV; Los Angeles-Long Beach-Santa Ana, CA; New York-Northern New Jersey-Long Island, NY-NJ-PA; Phoenix-Mesa-Scottsdale, AZ; San Jose-Sunnyvale-Santa Clara, CA; and Virginia Beach-Norfolk-Newport News, VA-NC.
7 The following metro areas experienced a statistically signifi cant decline in the percent-age of public transportation commuters: Charlotte-Gastonia-Concord, NC-SC; Houston-Sugar Land-Baytown, TX; San Jose-Sunnyvale-Santa Clara, CA; and Virginia Beach-Norfolk-Newport News, VA-NC.
Metro Area and the Washington-Arlington-Alexandria, DC-VA-MD-WV Metro Area had the second and third highest number of workers who used public transportation, at 506,000 and 405,000 workers, respectively. All except 4 of the metro areas included in this list were among the 15 largest metro areas in 2009.8
SOURCE AND ACCURACY
Data presented in this report are based on people and households that responded to the ACS in 2008 and 2009. The resulting estimates are representative of the entire population. All comparisons pre-sented in this report have taken sampling error into account and are signifi cant at the 90 percent confi -dence level unless otherwise noted. Due to rounding, some details may not sum to totals. For information on sampling and estimation meth-ods, confi dentiality protection, and sampling and nonsampling errors, please see the “2009 ACS Accuracy of the Data” document located at <www.census.gov/acs/www/Downloads/data_documentation/Accuracy/ACS_Accuracy_of_Data_2009.pdf>.
For more information about the public transportation usage or other commuting characteristics of U.S. workers, go to the U.S. Census Bureau’s Journey to Work and Migration Statistics Branch Web site, at <www.census.gov/population/www/socdemo/journey.html>, or contact theJourney to Work and Migration Statistics Branch at 301-763-2454.
8 The following metro areas were not included among the 15 largest in 2009: Baltimore-Towson, MD; Minneapolis-St. Paul-Bloomington, MN-WI; Pittsburgh, PA; and Portland-Vancouver-Beaverton, OR-WA.
U.S. Census Bureau 3
010
0M
iles
Met
ropo
litan
sta
tistic
al a
reas
def
ined
by
the
Offi
ce o
f M
anag
emen
t and
Bud
get a
s of
Nov
embe
r 200
8.
Sour
ce: U
.S. C
ensu
s B
urea
u, A
mer
ican
Com
mun
ity S
urve
y, 2
009.
010
0M
iles
010
0M
iles
Perc
ent
10.0
or m
ore
5.0
to 9
.92.
0 to
4.9
Less
than
2.0
U.S
. per
cent
age
ofw
orke
rs w
ho c
omm
uted
by p
ublic
tran
spor
tatio
n =
5.0
Perc
en
tage o
f W
ork
ers
Wh
o C
om
mu
ted
by P
ub
lic
Tra
nsp
ort
ati
on
by M
etr
op
oli
tan
Sta
tisti
cal
Are
a:
20
09
4 U.S. Census Bureau
Table 1.Top 15 U.S. Metropolitan Statistical Areas Ranked by Number of Workers Age 16 and Older Who Commuted to Work by Public Transportation: 2009
Used public Rank Metropolitan statistical area transportation
Number Percent
1 New York-Northern New Jersey-Long Island, NY-NJ-PA . . 2,673,447 30.52 Chicago-Naperville-Joliet, IL-IN-WI . . . . . . . . . . . . . . . . . . 506,221 11.53 Washington-Arlington-Alexandria, DC-VA-MD-WV . . . . . . 404,829 14.14 Los Angeles-Long Beach-Santa Ana, CA . . . . . . . . . . . . . 360,028 6.25 San Francisco-Oakland-Fremont, CA . . . . . . . . . . . . . . . . 304,111 14.66 Boston-Cambridge-Quincy, MA-NH . . . . . . . . . . . . . . . . . . 283,582 12.27 Philadelphia-Camden-Wilmington, PA-NJ-DE-MD . . . . . . 256,987 9.38 Seattle-Tacoma-Bellevue, WA . . . . . . . . . . . . . . . . . . . . . . 147,955 8.79 Atlanta-Sandy Springs-Marietta, GA . . . . . . . . . . . . . . . . . 92,326 3.710 Miami-Fort Lauderdale-Pompano Beach, FL. . . . . . . . . . . 85,771 3.511 Baltimore-Towson, MD . . . . . . . . . . . . . . . . . . . . . . . . . . . 82,119 6.212 Minneapolis-St. Paul-Bloomington, MN-WI . . . . . . . . . . . . 78,837 4.713 Portland-Vancouver-Beaverton, OR-WA . . . . . . . . . . . . . . 63,877 6.114 Pittsburgh, PA . . . . . . . . . . . . . . . . . . . . . . . . . . . . . . . . . . 62,928 5.815 Houston-Sugar Land-Baytown, TX . . . . . . . . . . . . . . . . . . 60,547 2.2
Source: U.S. Census Bureau, American Community Survey, 2009.
WHAT IS THE AMERICAN COMMUNITY SURVEY?
The American Community Survey (ACS) is a nationwide survey designed to provide communities with reliable and timely demo-graphic, social, economic, and housing data for the nation, states, congressional districts, counties, places, and other localities every year. It has an annual sample size of about 3 million addresses across the United States and Puerto Rico and includes both housing units and group quarters (e.g., nursing facilities and prisons). The ACS is conducted in every county through-out the nation, and every municipio in Puerto Rico, where it is called the Puerto Rico Community Survey. Beginning in 2006, ACS data for 2005 were released for geographic areas with populations of 65,000 and greater. For information on the ACS sample design and other top-ics, visit <www.census.gov/acs/www>.

U.S. Census Bureau 5
Table 2.Public Transportation Usage for the 50 Largest Metropolitan Statistical Areas1: 2008 and 2009(Estimates and percents are for members of the Armed Forces and civilians who were at work last week and used public transpor-tation to get to work)
Change in public transportation 2008 public transportation 2009 public transportation usage (2009 less 2008)
Margin Margin Margin Margin Margin Margin Metropolitan areaof of of of of of
error1 Per- error1 error1 Per- error1 error1 Per- error1 Estimate (±) cent (±) Estimate (±) cent (±) Estimate (±) cent (±)
United States . . . . . . . . . . 7,186,530 46,249 5.0 0.1 6,922,424 42,396 5.0 0.1 –264,106 62,741 – –
Atlanta-Sandy Springs-Marietta, GA . . . . . . . . . . . . . . . . . . . . . . . . . 93,756 6,365 3.6 0.2 92,326 7,995 3.7 0.3 –1,430 10,219 0.1 0.4
Austin-Round Rock, TX . . . . . . . . . . 25,526 3,000 3.0 0.3 24,113 3,638 2.8 0.4 –1,413 4,716 –0.2 0.5Baltimore-Towson, MD . . . . . . . . . . 88,056 5,544 6.5 0.4 82,119 5,132 6.2 0.4 –5,937 7,555 –0.3 0.6Birmingham-Hoover, AL . . . . . . . . . 4,569 1,229 0.9 0.2 3,360 1,063 0.7 0.2 –1,209 1,625 –0.2 0.3Boston-Cambridge-Quincy, MA-
NH . . . . . . . . . . . . . . . . . . . . . . . . . 272,917 9,327 11.6 0.4 283,582 10,583 12.2 0.4 10,665 14,106 *0.6 0.6Buffalo-Niagara Falls, NY . . . . . . . . 18,162 2,484 3.4 0.5 18,676 2,417 3.6 0.5 514 3,466 0.2 0.6Charlotte-Gastonia-Concord,
NC-SC . . . . . . . . . . . . . . . . . . . . . . 19,800 2,823 2.3 0.3 15,417 2,246 1.9 0.3 *–4,383 3,608 *–0.4 0.4Chicago-Naperville-Joliet, IL-IN-
WI . . . . . . . . . . . . . . . . . . . . . . . . . 522,547 13,047 11.3 0.3 506,221 12,311 11.5 0.3 –16,326 17,938 0.2 0.4Cincinnati-Middletown, OH-KY-IN . . 27,069 2,968 2.6 0.3 24,649 3,022 2.4 0.3 –2,420 4,236 –0.1 0.4Cleveland-Elyria-Mentor, OH . . . . . . 38,435 3,216 3.9 0.3 35,493 3,565 3.8 0.4 –2,942 4,802 –0.1 0.5
Columbus, OH . . . . . . . . . . . . . . . . . 15,070 2,138 1.7 0.2 11,897 2,160 1.4 0.3 *–3,173 3,039 –0.3 0.3Dallas-Fort Worth-Arlington, TX . . . . 51,351 3,823 1.6 0.1 46,452 3,818 1.5 0.1 –4,899 5,403 –0.1 0.2Denver-Aurora-Broomfi eld, CO . . . . 64,420 5,296 4.9 0.4 59,240 4,326 4.6 0.3 –5,180 6,838 –0.2 0.5Detroit-Warren-Livonia, MI . . . . . . . . 34,107 3,304 1.7 0.2 28,939 3,422 1.6 0.2 *–5,168 4,757 –0.1 0.3Hartford-West Hartford-East
Hartford, CT . . . . . . . . . . . . . . . . . 15,172 2,183 2.5 0.4 16,445 2,112 2.8 0.4 1,273 3,038 0.3 0.5Houston-Sugar Land-Baytown,
TX . . . . . . . . . . . . . . . . . . . . . . . . . 71,908 5,349 2.6 0.2 60,547 4,929 2.2 0.2 *–11,361 7,274 *–0.4 0.3Indianapolis-Carmel, IN . . . . . . . . . . 10,277 2,000 1.2 0.2 8,310 1,678 1.0 0.2 –1,967 2,611 –0.2 0.3Jacksonville, FL . . . . . . . . . . . . . . . . 7,660 1,733 1.2 0.3 7,343 1,730 1.2 0.3 –317 2,449 – 0.4Kansas City, MO-KS . . . . . . . . . . . . 15,231 2,189 1.5 0.2 12,348 2,226 1.2 0.2 –2,883 3,122 –0.3 0.3Las Vegas-Paradise, NV . . . . . . . . . 33,140 4,234 3.7 0.5 27,834 2,590 3.2 0.3 *–5,306 4,963 –0.5 0.5
Los Angeles-Long Beach-Santa Ana, CA . . . . . . . . . . . . . . . . . . . . . 380,484 12,110 6.4 0.2 360,028 13,185 6.2 0.2 *–20,456 17,903 –0.2 0.3
Louisville/Jefferson County, KY-IN . . 13,066 2,113 2.2 0.3 13,724 2,520 2.4 0.4 658 3,289 0.2 0.6Memphis, TN-MS-AR . . . . . . . . . . . . 7,300 1,660 1.2 0.3 8,212 1,624 1.5 0.3 912 2,322 0.2 0.4Miami-Fort Lauderdale-Pompano
Beach, FL . . . . . . . . . . . . . . . . . . . 93,277 6,184 3.7 0.2 85,771 6,434 3.5 0.3 –7,506 8,924 –0.2 0.4Milwaukee-Waukesha-West Allis,
WI . . . . . . . . . . . . . . . . . . . . . . . . . 28,407 3,108 3.6 0.4 27,437 3,195 3.7 0.4 –970 4,457 – 0.6Minneapolis-St. Paul-Bloomington,
MN-WI . . . . . . . . . . . . . . . . . . . . . . 83,771 4,355 4.8 0.2 78,837 4,762 4.7 0.3 –4,934 6,453 –0.1 0.4Nashville-Davidson–Murfreesboro–
Franklin, TN . . . . . . . . . . . . . . . . . . 7,896 1,443 1.0 0.2 8,829 1,622 1.2 0.2 933 2,171 0.1 0.3New Orleans-Metairie-Kenner, LA . . 13,470 2,776 2.6 0.5 14,390 2,175 2.7 0.4 920 3,527 – 0.7New York-Northern New Jersey-
Long Island, NY-NJ-PA . . . . . . . . . 2,755,897 24,847 30.4 0.3 2,673,447 26,566 30.5 0.3 *–82,450 36,374 0.1 0.4Oklahoma City, OK . . . . . . . . . . . . . 2,957 1,155 0.5 0.2 2,466 921 0.4 0.2 –491 1,477 –0.1 0.3
Orlando-Kissimmee, FL . . . . . . . . . . 15,214 2,209 1.5 0.2 17,368 2,816 1.8 0.3 2,154 3,579 0.3 0.4Philadelphia-Camden-Wilmington,
PA-NJ-DE-MD . . . . . . . . . . . . . . . . 257,961 9,317 9.3 0.3 256,987 10,409 9.3 0.4 –974 13,970 – 0.5Phoenix-Mesa-Scottsdale, AZ . . . . . 50,744 5,020 2.6 0.3 42,855 4,394 2.3 0.2 *–7,889 6,671 –0.3 0.3Pittsburgh, PA . . . . . . . . . . . . . . . . . 65,071 4,227 5.8 0.4 62,928 3,767 5.8 0.3 –2,143 5,662 – 0.5Portland-Vancouver-Beaverton,
OR-WA . . . . . . . . . . . . . . . . . . . . . 68,810 4,630 6.3 0.4 63,877 4,299 6.1 0.4 –4,933 6,318 –0.2 0.6Providence-New Bedford-Fall River,
RI-MA . . . . . . . . . . . . . . . . . . . . . . 21,389 2,459 2.7 0.3 20,534 2,518 2.7 0.3 –855 3,519 – 0.5Raleigh-Cary, NC . . . . . . . . . . . . . . . 5,702 1,454 1.0 0.3 5,231 1,328 1.0 0.2 –471 1,969 –0.1 0.4Richmond, VA . . . . . . . . . . . . . . . . . 12,514 2,152 2.0 0.4 11,676 2,003 2.0 0.3 –838 2,940 – 0.5 See footnotes at end of table.
6 U.S. Census Bureau
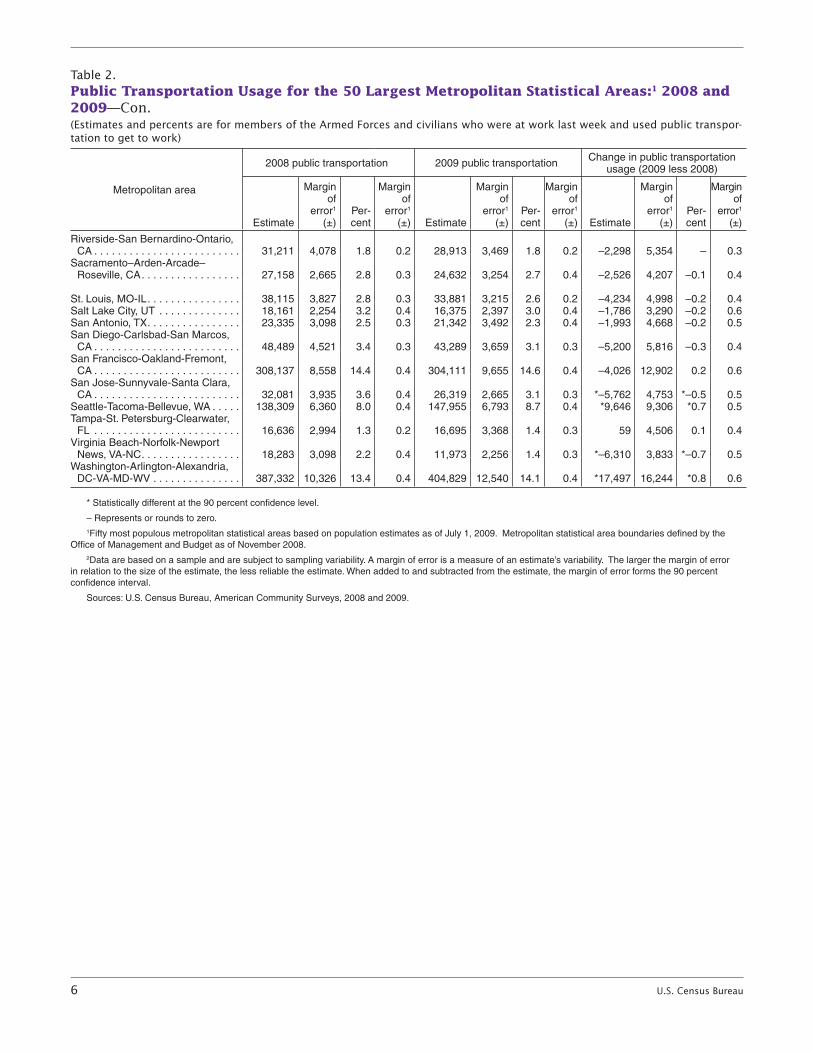
Table 2.Public Transportation Usage for the 50 Largest Metropolitan Statistical Areas:1 2008 and 2009—Con.(Estimates and percents are for members of the Armed Forces and civilians who were at work last week and used public transpor-tation to get to work)
Change in public transportation 2008 public transportation 2009 public transportation usage (2009 less 2008)
Margin Margin Margin Margin Margin Margin Metropolitan areaof of of of of of
error1 Per- error1 error1 Per- error1 error1 Per- error1 Estimate (±) cent (±) Estimate (±) cent (±) Estimate (±) cent (±)
Riverside-San Bernardino-Ontario, CA . . . . . . . . . . . . . . . . . . . . . . . . . 31,211 4,078 1.8 0.2 28,913 3,469 1.8 0.2 –2,298 5,354 – 0.3
Sacramento–Arden-Arcade–Roseville, CA . . . . . . . . . . . . . . . . . 27,158 2,665 2.8 0.3 24,632 3,254 2.7 0.4 –2,526 4,207 –0.1 0.4
St. Louis, MO-IL . . . . . . . . . . . . . . . . 38,115 3,827 2.8 0.3 33,881 3,215 2.6 0.2 –4,234 4,998 –0.2 0.4Salt Lake City, UT . . . . . . . . . . . . . . 18,161 2,254 3.2 0.4 16,375 2,397 3.0 0.4 –1,786 3,290 –0.2 0.6San Antonio, TX . . . . . . . . . . . . . . . . 23,335 3,098 2.5 0.3 21,342 3,492 2.3 0.4 –1,993 4,668 –0.2 0.5San Diego-Carlsbad-San Marcos,
CA . . . . . . . . . . . . . . . . . . . . . . . . . 48,489 4,521 3.4 0.3 43,289 3,659 3.1 0.3 –5,200 5,816 –0.3 0.4San Francisco-Oakland-Fremont,
CA . . . . . . . . . . . . . . . . . . . . . . . . . 308,137 8,558 14.4 0.4 304,111 9,655 14.6 0.4 –4,026 12,902 0.2 0.6San Jose-Sunnyvale-Santa Clara,
CA . . . . . . . . . . . . . . . . . . . . . . . . . 32,081 3,935 3.6 0.4 26,319 2,665 3.1 0.3 *–5,762 4,753 *–0.5 0.5Seattle-Tacoma-Bellevue, WA . . . . . 138,309 6,360 8.0 0.4 147,955 6,793 8.7 0.4 *9,646 9,306 *0.7 0.5Tampa-St. Petersburg-Clearwater,
FL . . . . . . . . . . . . . . . . . . . . . . . . . 16,636 2,994 1.3 0.2 16,695 3,368 1.4 0.3 59 4,506 0.1 0.4Virginia Beach-Norfolk-Newport
News, VA-NC . . . . . . . . . . . . . . . . . 18,283 3,098 2.2 0.4 11,973 2,256 1.4 0.3 *–6,310 3,833 *–0.7 0.5Washington-Arlington-Alexandria,
DC-VA-MD-WV . . . . . . . . . . . . . . . 387,332 10,326 13.4 0.4 404,829 12,540 14.1 0.4 *17,497 16,244 *0.8 0.6
* Statistically different at the 90 percent confi dence level.
– Represents or rounds to zero. 1Fifty most populous metropolitan statistical areas based on population estimates as of July 1, 2009. Metropolitan statistical area boundaries defi ned by the
Offi ce of Management and Budget as of November 2008.2Data are based on a sample and are subject to sampling variability. A margin of error is a measure of an estimate’s variability. The larger the margin of error
in relation to the size of the estimate, the less reliable the estimate. When added to and subtracted from the estimate, the margin of error forms the 90 percent confi dence interval.
Sources: U.S. Census Bureau, American Community Surveys, 2008 and 2009.