Embed Size (px)
Citation preview
20 August 2015
Office for National Statistics | 1
National Accounts articles - AlternativeMeasures of Real Household DisposableIncome and the Saving RatioCoverage: UKDate: 20 August 2015Geographical Area: UK and GBTheme: EconomyTheme: People and Places
Introduction
Authors of this report:
Real Household Disposable Income (RHDI) - Tom Evans
Saving Ratio - Nicola Curtis and Rhian Jones
This article looks at how different measures of real household disposable income (RHDI) publishedin the UK national accounts can be used to assess the economic well-being of households in theUK.
Measurement of disposable income from the national accounts can vary due to a number of factors.In this article we consider an adjusted measure of RHDI, named throughout this article as “CashRHDI”, which attempts to quantify disposable income in a way which better represents actualincome received by households. We also briefly revisit how the treatment of non-profit institutionsserving households (NPISH) can affect estimates of RHDI.
Finally we look at how adjusting the measurement of RHDI feeds through to calculating the savingratio.
We are currently exploring options for the future publication of this content and would welcomefeedback from users.
All data are presented on a Blue Book 2014 basis.
20 August 2015
Office for National Statistics | 2
What is real household disposable income?
Gross Disposable Income (GDI) refers to the money households have left over to spend, save orinvest after deductions such as taxes, national insurance and pension contributions have all beenpaid.
Within the national accounts, households GDI is calculated by aggregating a number of transactions.These transactions are categorised as a “resource” or “use”. Resources are those transactionswhich contribute to households’ income, for example, wages and salaries; uses are those whichdeduct from households’ income, for example, direct taxes. Some transactions appear as bothresource and a use, for example, interest can be paid to households on savings (resource) but it isalso paid by households on loans (use).
Taking GDI and then removing the effects of inflation, typically by applying an expenditure deflator,gives real household disposable income (RHDI). Finally, dividing RHDI by the population gives RHDIper capita, the main measure which is considered in this article.
We published a measure of RHDI within its quarterly United Kingdom economic accounts (UKEA). Ifwe take this measure and convert it to a per capita basis we can start to consider the economic well-being of households since 1997.
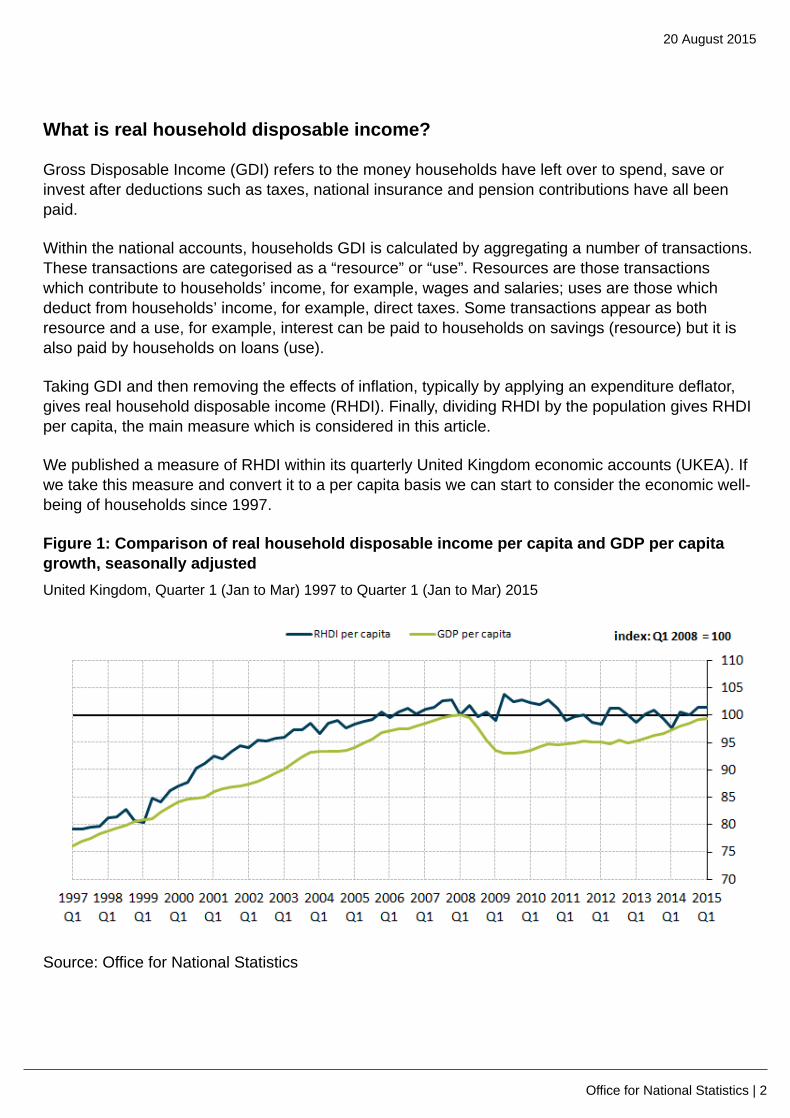
Figure 1: Comparison of real household disposable income per capita and GDP per capitagrowth, seasonally adjustedUnited Kingdom, Quarter 1 (Jan to Mar) 1997 to Quarter 1 (Jan to Mar) 2015
Source: Office for National Statistics
20 August 2015
Office for National Statistics | 3
Download chart
XLS format(31.5 Kb)
RHDI per capita grew steadily from 1997 through until 2007. Since 2008 however RHDI growth hasflat. Compared with other economic aggregates such as GDP per capita, RHDI per capita remainedrelatively resilient during the recession and in Quarter 1 (January to March) 2015 was 1.4% abovethe level it reached in Quarter 1 (January to March)2008.
Making adjustments to RHDI
The measure of RHDI published within the UKEA contains certain elements which, though they aredesirable for compiling a sequence of national accounts, are not directly observed by households.
For example, imputed rentals represent the value of housing services that owner occupiers derivefrom their homes: the amount that they would have to pay in rent to achieve the same consumptionof housing services. Whilst this concept is important when measuring economic output, it is perhapsless appropriate to include it in measures of disposable income, as imputed rental is not somethingthat a home owner directly observes.
We therefore consider “Cash RHDI”. This measure removes imputed rental and other non-cashcomponents resulting in a measure of RHDI which is a closer representation of disposable incomeas measured by social surveys. This is mainly achieved following guidance within the Organisationfor Economic Co-operation and Development Framework for Statistics on the Distribution ofHousehold Income, Consumption and Wealth and the United Nations Economic Commissionfor Europe (UNECE) Canberra Group Handbook on Household Income Statistics. Both of thesedocuments include sections on comparing income as measured within the system of nationalaccounts with income as measured by social surveys.
In essence, the move towards a more social survey-orientated measure of disposable incomeshould yield a series which is a closer representation of what households experience.
For a full list of those components which have been excluded from the cash measure please seeAnnex A.
Interest payments
Whilst many of the decisions around which transactions should be included in the calculation of cashRHDI are relatively straightforward, one transaction for which the case is easily balanced is InterestPaid (D41g) (use). This refers to the interest paid by households on loans and other forms of credit.
On the one hand interest payments are a real thing that households directly observe and so theyshould be included in the calculation of a “cash” measure of RHDI. However you can also take theview that decisions about paying interest, for example deciding whether or not to take out a loan,would be taken after knowing how much disposable income you have. Therefore throughout thefollowing analysis we present cash RHDI on 2 different bases.
20 August 2015
Office for National Statistics | 4
• net interest basis – this measure includes both interest paid and interest received by households.• gross interest basis – this measure includes only interest received by households and not
interest paid by households.
Households and non-profit institutions serving households
Existing estimates of RHDI from the UK economic accounts are comprised of 2 sectors: thehousehold sector and the non-profit institutions serving households sector (NPISH). NPISH iscomprised mainly of charities and universities but also includes entities like trade unions and politicalparties. The 2 sectors are often considered together because NPISHs are financed by householdsand their sole purpose is to serve households. However, if we want to consider the well-being ofhouseholds alone then it would be beneficial to separate out the NPISH components of RHDI so thatwe are left with a households-only estimate.
We are running an ongoing project which aims to produce separate accounts for households andNPISH by autumn 2017. Ahead of this date, the measures of RHDI presented here simply attempt toremove NPISH elements from the calculation. As these estimates are based on current compilationmethods, they may be subject to change as the project to separate the 2 sectors continues.
Deflators
The final adjustment made to estimates presented here is to change the deflator series whichis used to account for changes in prices. RHDI as published in the UKEA uses the combinedhousehold and NPISH final consumption expenditure implied deflator. For the same reason asoutlined above, we only want to consider expenditure by households, so instead we use thehousehold final consumption expenditure (HHFCE) implied deflator as published in ConsumerTrends.
To summarise, this analysis will present the following series, all on a per capita basis:
• UKEA RHDI – the measure of RHDI routinely published in the United Kingdom economicaccounts. This is on a non-cash basis, includes both the Household and NPISH sectors, and isdeflated by the combined Households and NPISH expenditure deflator
• HH and NPISH cash RHDI (net and gross interest) – based on both the HH and NPISH sectors,this takes the UKEA RHDI and strips out the “non-cash” transactions and is deflated by thecombined HH and NPISH expenditure deflator
• HH only cash RHDI (net and gross interest) – this goes one step further and tries to strip out theNPISH sector and is deflated by the HHFCE implied deflator
20 August 2015
Office for National Statistics | 5
Household-only Cash RHDI
Net interest basis
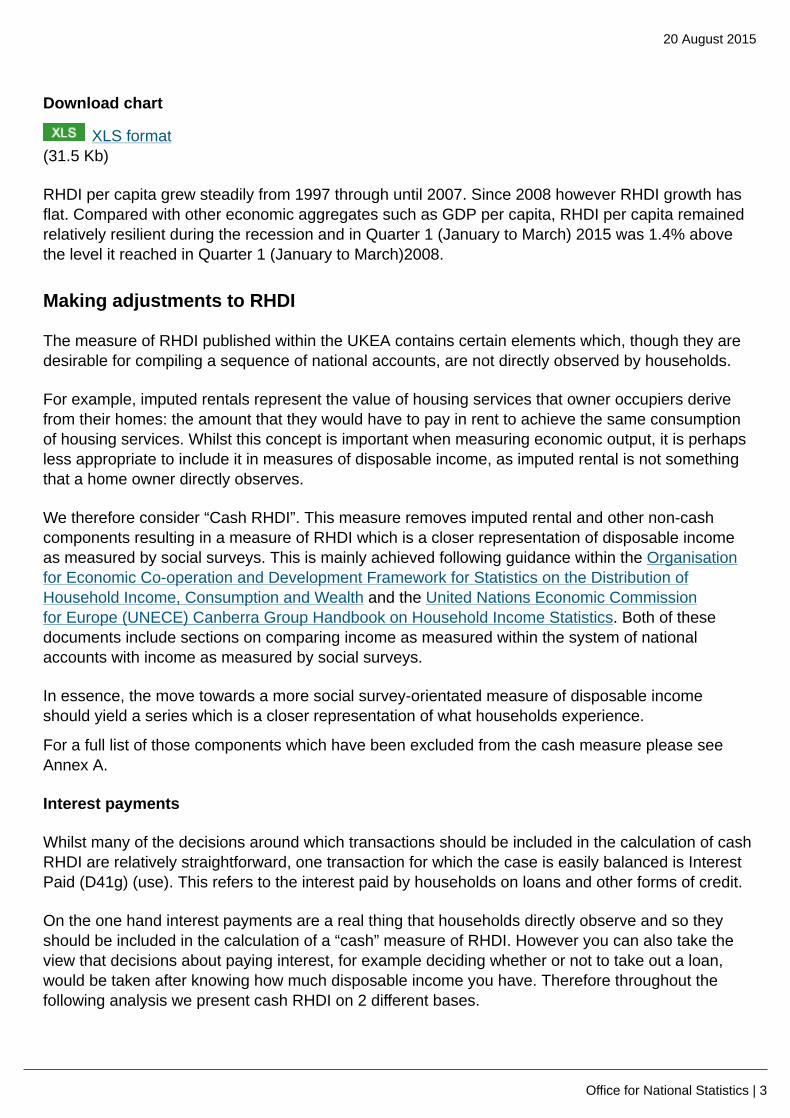
Figure 2: Comparison of various measures of real household disposable income (RHDI) percapita, net interest basis, seasonally adjustedUnited Kingdom, Quarter 1 (Jan to Mar) 1997 to Quarter 1 (Jan to Mar) 2015
Source: Office for National Statistics
Download chart
XLS format(24 Kb)
Figure 2 shows that the evolution of the new measures of RHDI per capita, on a net interest basis,is broadly similar to that of the UKEA RHDI. All three measures show strong growth from 1999 to2007, followed by a period of stable household income which, as shown in figure 1, did not suffer tothe same extent as other economic metrics such as GDP per capita during the downturn. Comparinga National Accounts consistent measure with a cash measure (black dotted to blue dashed) makeslittle difference to the growth path of RHDI. Similarly, excluding NPISH has little effect on the growthpath.
20 August 2015
Office for National Statistics | 6
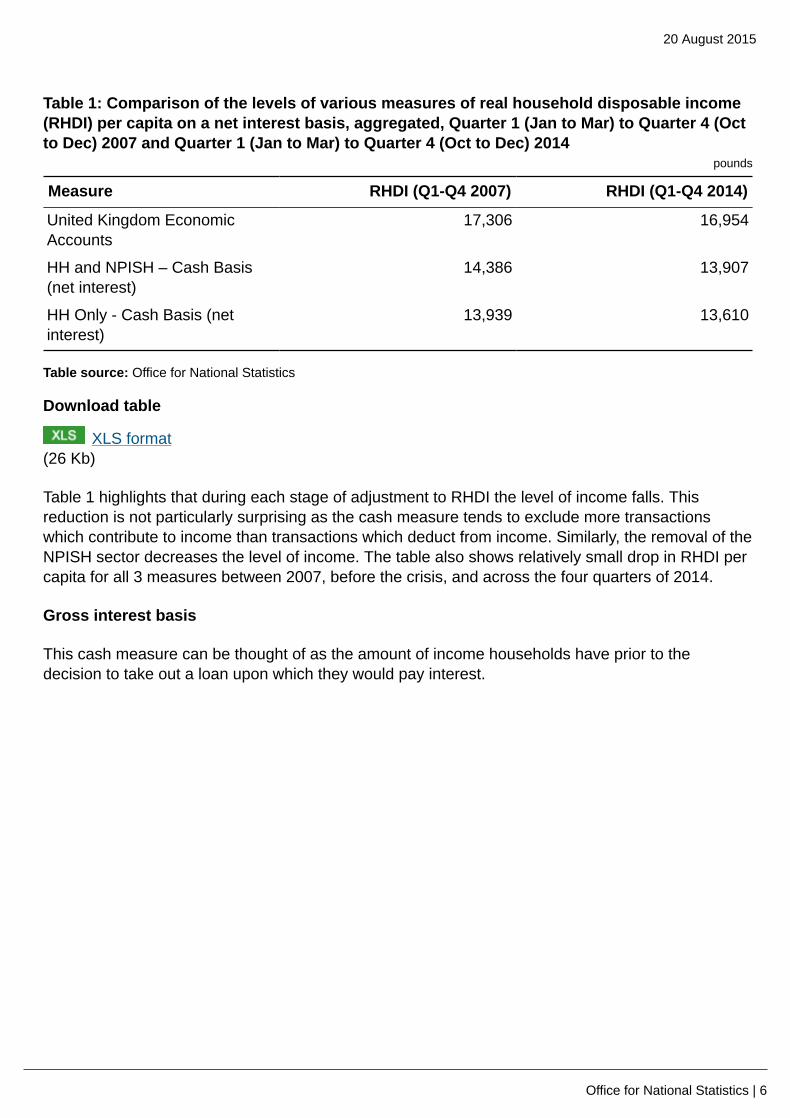
Table 1: Comparison of the levels of various measures of real household disposable income(RHDI) per capita on a net interest basis, aggregated, Quarter 1 (Jan to Mar) to Quarter 4 (Octto Dec) 2007 and Quarter 1 (Jan to Mar) to Quarter 4 (Oct to Dec) 2014
pounds
Measure RHDI (Q1-Q4 2007) RHDI (Q1-Q4 2014)
United Kingdom EconomicAccounts
17,306 16,954
HH and NPISH – Cash Basis(net interest)
14,386 13,907
HH Only - Cash Basis (netinterest)
13,939 13,610
Table source: Office for National Statistics
Download table
XLS format(26 Kb)
Table 1 highlights that during each stage of adjustment to RHDI the level of income falls. Thisreduction is not particularly surprising as the cash measure tends to exclude more transactionswhich contribute to income than transactions which deduct from income. Similarly, the removal of theNPISH sector decreases the level of income. The table also shows relatively small drop in RHDI percapita for all 3 measures between 2007, before the crisis, and across the four quarters of 2014.
Gross interest basis
This cash measure can be thought of as the amount of income households have prior to thedecision to take out a loan upon which they would pay interest.

20 August 2015
Office for National Statistics | 7
Figure 3: Comparison of various measures of real household disposable income (RHDI) percapita, gross interest basis, seasonally adjustedUnited Kingdom, Quarter 1 (Jan to Mar) 1997 to Quarter 1 (Jan to Mar) 2015
Source: Office for National Statistics
Download chart
XLS format(24 Kb)
Figure 3 highlights the effect of measuring RHDI on a gross interest basis, compared with thenational accounts consistent measure. Though the removal of the NPISH sector still only hasa minor effect on growth, the move to RHDI on a cash gross interest basis shows that incomescontracted more sharply through 2009 and 2010 since when they have been stagnant. In quarter 1(Jan to Mar) 2015 household only cash RHDI was 5% below its quarter 1 (Jan to Mar) 2008 level.We will consider the reasons for this contraction later on in the article.
Table 2: Comparison of the levels of various measures of real household disposable income(RHDI|) per capita on a gross interest basis, aggregated, Quarter 1 (Jan to Mar) to Quarter 4(Oct to Dec) 2007 and Quarter 1 (Jan to Mar) to Quarter 4 (Oct to Dec) 2014
pounds
Measure RHDI (Q1-Q4 2007) RHDI (Q1-Q4 2014)
United Kingdom EconomicAccounts
17,306 16,954
HH and NPISH – Cash Basis(gross interest)
16,143 14,780
HH Only - Cash Basis (grossinterest)
15,694 14,506
20 August 2015
Office for National Statistics | 8
Table source: Office for National Statistics
Download table
XLS format(18.5 Kb)
The levels show a similar pattern to the net interest scenario, with the move to the cash basisresulting in a larger reduction income than the reduction caused by the removal of the NPISH sector.However, compared with the net interest scenario, the level is higher for both of the cash measures.This is due to interest payments no longer being deducted. Comparing the gross interest basis withthe net interest basis you can also see the greater reduction in RHDI between 2007 and the mostrecent 4 quarters.
Contributions to growth
Figure 4 shows the contributions to the annual growth rate for Cash RHDI on a gross interest basis.
There are 21 transactions which contribute towards the calculation of Cash RHDI on a gross interestbasis. For ease of presentation these transactions have been assigned to 7 groups according to thenature of the transaction. For a full breakdown of which transaction feeds into each group, pleasesee Annex B.
20 August 2015
Office for National Statistics | 9
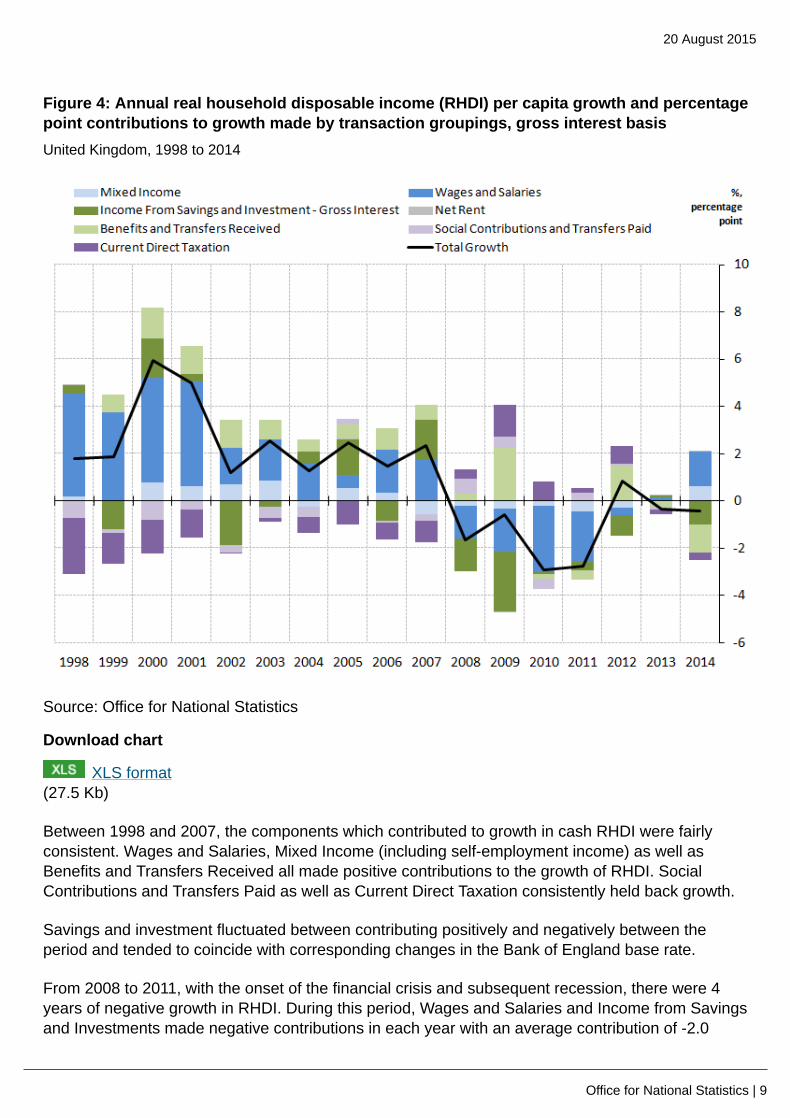
Figure 4: Annual real household disposable income (RHDI) per capita growth and percentagepoint contributions to growth made by transaction groupings, gross interest basisUnited Kingdom, 1998 to 2014
Source: Office for National Statistics
Download chart
XLS format(27.5 Kb)
Between 1998 and 2007, the components which contributed to growth in cash RHDI were fairlyconsistent. Wages and Salaries, Mixed Income (including self-employment income) as well asBenefits and Transfers Received all made positive contributions to the growth of RHDI. SocialContributions and Transfers Paid as well as Current Direct Taxation consistently held back growth.
Savings and investment fluctuated between contributing positively and negatively between theperiod and tended to coincide with corresponding changes in the Bank of England base rate.
From 2008 to 2011, with the onset of the financial crisis and subsequent recession, there were 4years of negative growth in RHDI. During this period, Wages and Salaries and Income from Savingsand Investments made negative contributions in each year with an average contribution of -2.0
20 August 2015
Office for National Statistics | 10
percentage points and -1.1 percentage points respectively. The latter fall was in part due to fallinginterest rates, though other investments would also have seen lower returns. These falls howeverwere offset by cuts in tax rates for households, notably on income. Further, in 2008 and particularlyin 2009, there were increases in the benefits and transfers received by households. This contributed0.3 and then 2.3 percentage points to growth in 2008 and 2009 respectively. However, during 2010and 2011, there was no such offset in benefits and transfers received which instead made smallnegative contributions of 0.2 and 0.4 percentage points respectively. It was during these years thatCash RHDI was falling at its fastest rate: -2.9% and -2.8% respectively.
During 2012, negative pressure from falls in Wages and Salaries and income from Savings andInvestment eased. Benefits and Transfers received returned to making a positive contribution andhouseholds also paid less in direct taxes, making a positive contribution to disposable income.Overall this combination of factors lead to RHDI growing by 0.9%.
Finally, during 2013 and 2014, the picture was more mixed, with very little change in 2013 as allgroups of transactions showed little change. In 2014, there was a return to positive contributionsfor Wages and Salaries as well as Mixed Income, however, this was held back by further negativecontributions from benefits and transfers received and from income from savings and investments.
Compared with the gross interest basis, growth in RHDI on a net interest basis is largely unchangedwith the exception of 2009. During 2009, the growth rate of Cash RHDI on a net basis was 3.0%,whereas on a gross interest basis RHDI contracted by 0.6%.
20 August 2015
Office for National Statistics | 11
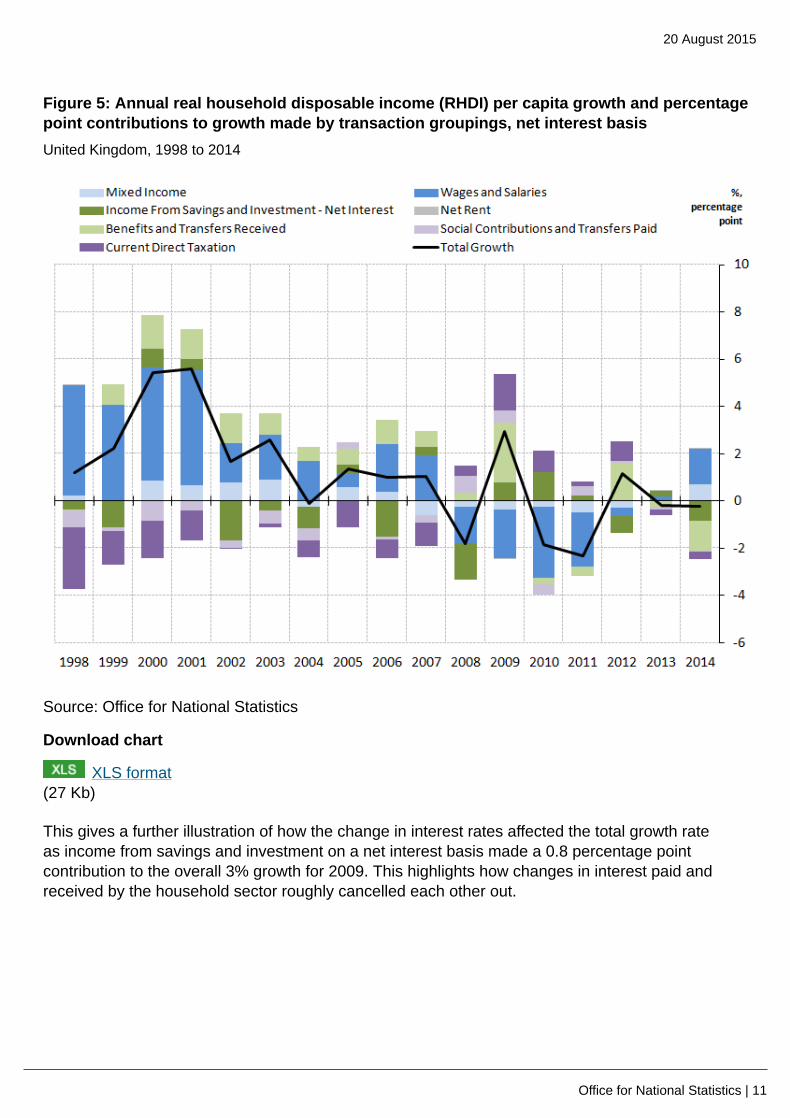
Figure 5: Annual real household disposable income (RHDI) per capita growth and percentagepoint contributions to growth made by transaction groupings, net interest basisUnited Kingdom, 1998 to 2014
Source: Office for National Statistics
Download chart
XLS format(27 Kb)
This gives a further illustration of how the change in interest rates affected the total growth rateas income from savings and investment on a net interest basis made a 0.8 percentage pointcontribution to the overall 3% growth for 2009. This highlights how changes in interest paid andreceived by the household sector roughly cancelled each other out.
20 August 2015
Office for National Statistics | 12
Potential reasons for the divergence between net and gross RHDI measures
The previous sections showed a large divergence between net and gross RHDI cash measuressince the onset of the financial crisis. Unsurprisingly the relatively poor performance of the grossmeasure reflects the evolution of interest rates over this period.
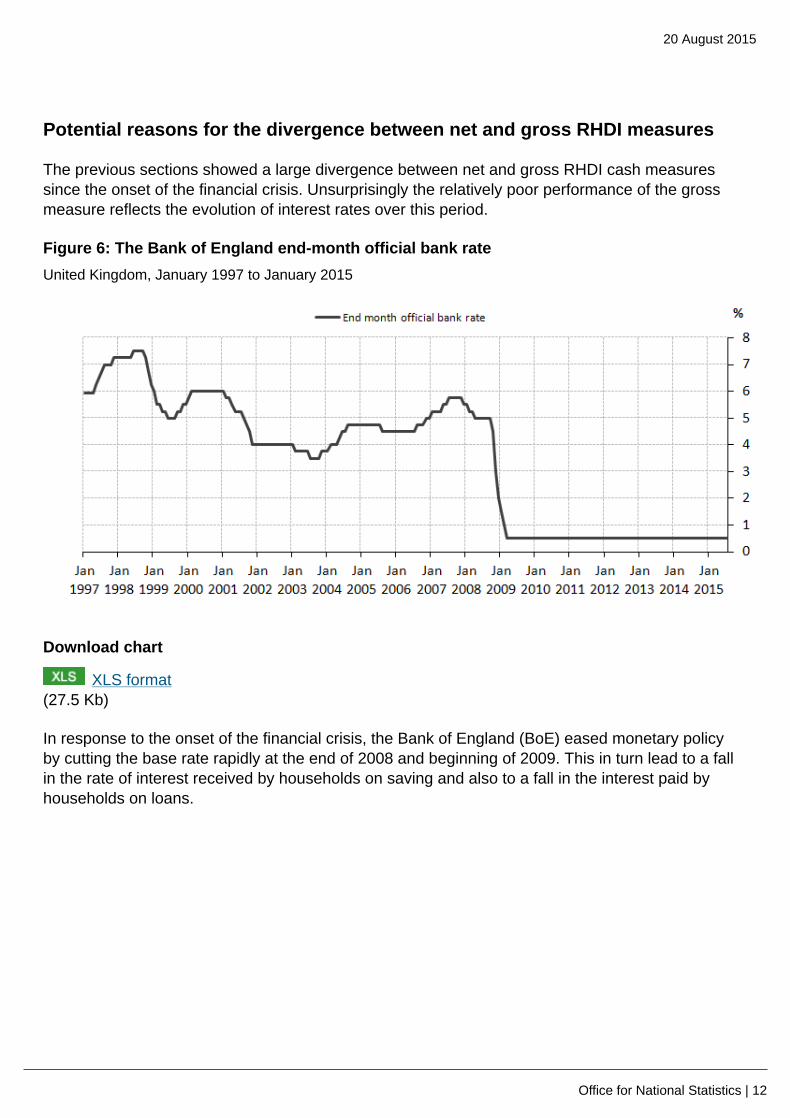
Figure 6: The Bank of England end-month official bank rateUnited Kingdom, January 1997 to January 2015
Download chart
XLS format(27.5 Kb)
In response to the onset of the financial crisis, the Bank of England (BoE) eased monetary policyby cutting the base rate rapidly at the end of 2008 and beginning of 2009. This in turn lead to a fallin the rate of interest received by households on saving and also to a fall in the interest paid byhouseholds on loans.
20 August 2015
Office for National Statistics | 13
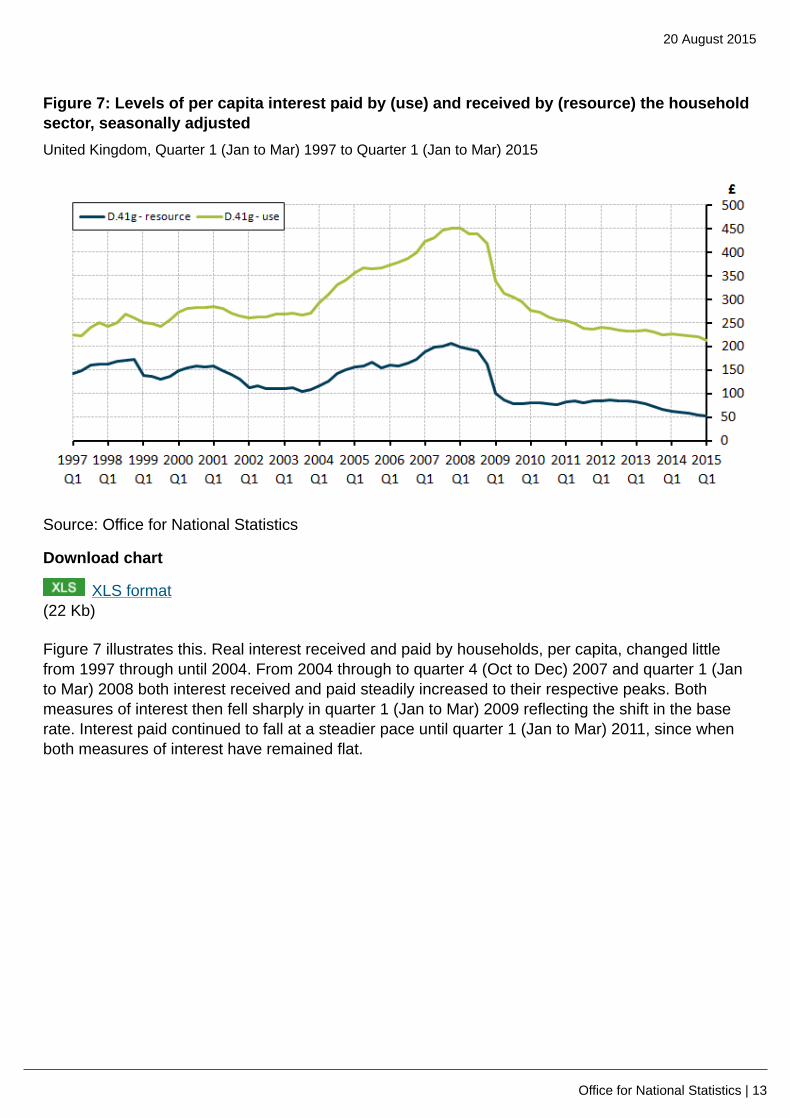
Figure 7: Levels of per capita interest paid by (use) and received by (resource) the householdsector, seasonally adjustedUnited Kingdom, Quarter 1 (Jan to Mar) 1997 to Quarter 1 (Jan to Mar) 2015
Source: Office for National Statistics
Download chart
XLS format(22 Kb)
Figure 7 illustrates this. Real interest received and paid by households, per capita, changed littlefrom 1997 through until 2004. From 2004 through to quarter 4 (Oct to Dec) 2007 and quarter 1 (Janto Mar) 2008 both interest received and paid steadily increased to their respective peaks. Bothmeasures of interest then fell sharply in quarter 1 (Jan to Mar) 2009 reflecting the shift in the baserate. Interest paid continued to fall at a steadier pace until quarter 1 (Jan to Mar) 2011, since whenboth measures of interest have remained flat.
20 August 2015
Office for National Statistics | 14
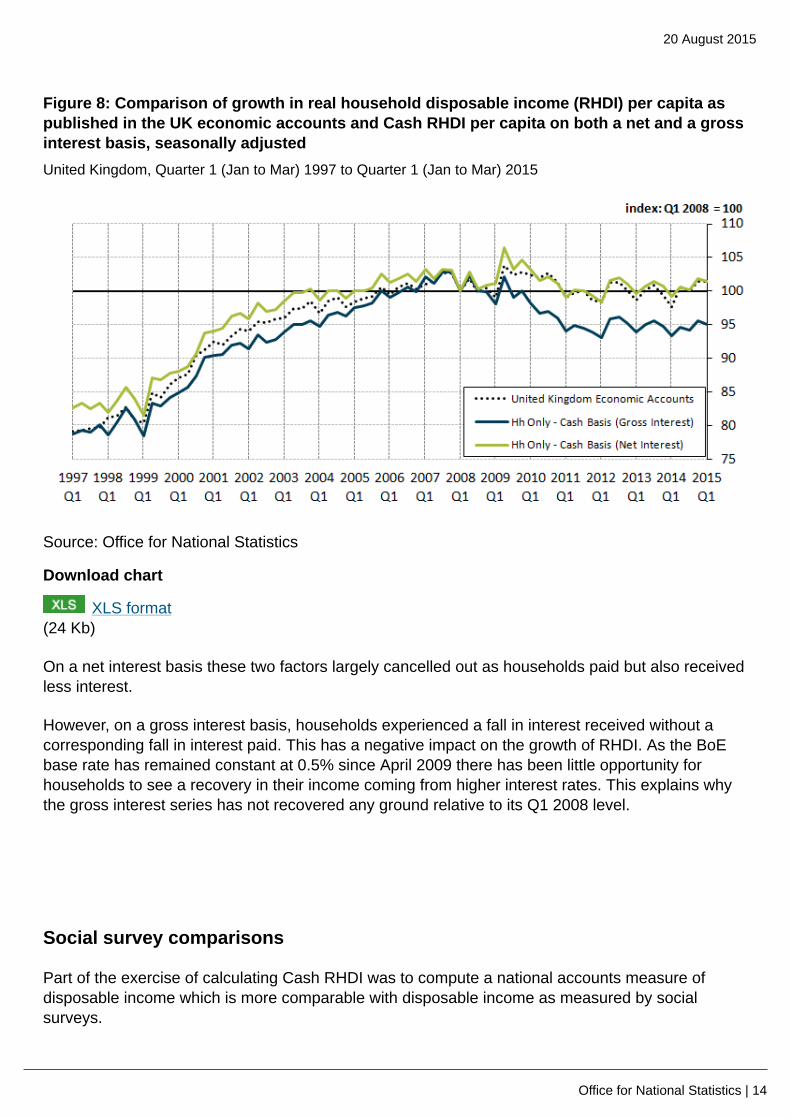
Figure 8: Comparison of growth in real household disposable income (RHDI) per capita aspublished in the UK economic accounts and Cash RHDI per capita on both a net and a grossinterest basis, seasonally adjustedUnited Kingdom, Quarter 1 (Jan to Mar) 1997 to Quarter 1 (Jan to Mar) 2015
Source: Office for National Statistics
Download chart
XLS format(24 Kb)
On a net interest basis these two factors largely cancelled out as households paid but also receivedless interest.
However, on a gross interest basis, households experienced a fall in interest received without acorresponding fall in interest paid. This has a negative impact on the growth of RHDI. As the BoEbase rate has remained constant at 0.5% since April 2009 there has been little opportunity forhouseholds to see a recovery in their income coming from higher interest rates. This explains whythe gross interest series has not recovered any ground relative to its Q1 2008 level.
Social survey comparisons
Part of the exercise of calculating Cash RHDI was to compute a national accounts measure ofdisposable income which is more comparable with disposable income as measured by socialsurveys.
20 August 2015
Office for National Statistics | 15
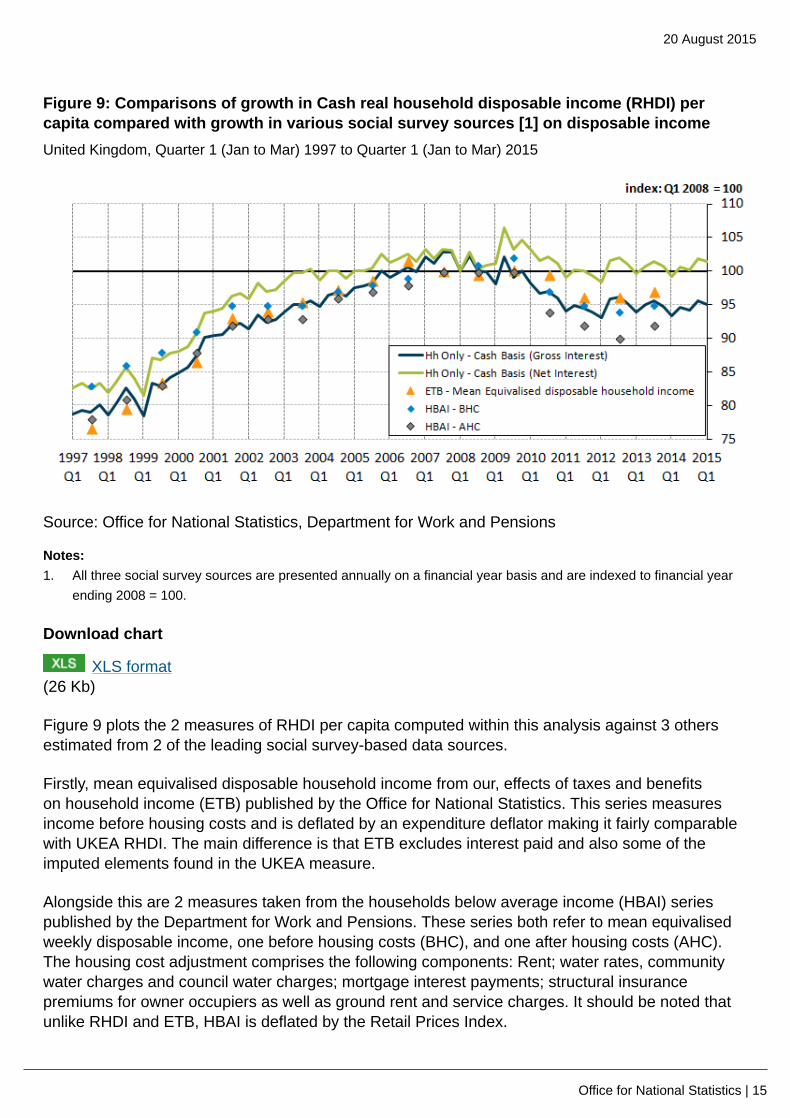
Figure 9: Comparisons of growth in Cash real household disposable income (RHDI) percapita compared with growth in various social survey sources [1] on disposable incomeUnited Kingdom, Quarter 1 (Jan to Mar) 1997 to Quarter 1 (Jan to Mar) 2015
Source: Office for National Statistics, Department for Work and Pensions
Notes:1. All three social survey sources are presented annually on a financial year basis and are indexed to financial year
ending 2008 = 100.
Download chart
XLS format(26 Kb)
Figure 9 plots the 2 measures of RHDI per capita computed within this analysis against 3 othersestimated from 2 of the leading social survey-based data sources.
Firstly, mean equivalised disposable household income from our, effects of taxes and benefitson household income (ETB) published by the Office for National Statistics. This series measuresincome before housing costs and is deflated by an expenditure deflator making it fairly comparablewith UKEA RHDI. The main difference is that ETB excludes interest paid and also some of theimputed elements found in the UKEA measure.
Alongside this are 2 measures taken from the households below average income (HBAI) seriespublished by the Department for Work and Pensions. These series both refer to mean equivalisedweekly disposable income, one before housing costs (BHC), and one after housing costs (AHC).The housing cost adjustment comprises the following components: Rent; water rates, communitywater charges and council water charges; mortgage interest payments; structural insurancepremiums for owner occupiers as well as ground rent and service charges. It should be noted thatunlike RHDI and ETB, HBAI is deflated by the Retail Prices Index.
20 August 2015
Office for National Statistics | 16
Looking at the data we can see that cash RHDI on a gross interest basis is more closely aligned withthe 3 social survey sources, compared with Cash RHDI on a net interest basis. In the case of ETBand HBAI before housing costs this is expected as both of these measures are also calculated ona gross interest basis. The HBAI after housing costs series shows a sharper and more protracteddecline in income than the other measures. This may appear at odds with the logic that mortgagerepayments would have fallen over this period which would have increased income; howevermortgage repayments are only one element of the housing costs adjustment that is made in HBAIand may have been outweighed by other factors, such as rent, which caused the level of incometo fall overall. Furthermore, RPI has grown more strongly than the household expenditure implieddeflator since 2009 which would also have the effect of depressing growth in both HBAI measurescompared with the cash RHDI and ETB disposable income.
For more information on sources and data on earnings and income (653.5 Kb Pdf) see this guide onour website.
Saving ratio
This final section extends the methodology adopted to calculate household only Cash RHDI toderive alternative cash only saving ratios.
What is the saving ratio?
The saving ratio is an estimate of the amount of money households have available to save (grosssaving) as a percentage of their total disposable income. Gross saving is estimated as the differencebetween household’s income (gross disposable income) and their spending (final consumptionexpenditure). Final consumption expenditure is money spent by households on goods and services,for example food and internet providers. It does not include investment in housing (mortgages)or purchasing financial products such as shares. Gross saving is therefore the amount of moneyhouseholds have left after spending money on goods and services.
Unobserved income measures (for example, pension contributions) feed into the saving ratiocalculation without being directly observed by households. The following section explores alternativecompilations and definitions of a household saving ratio focusing on directly observed income andexpenditure items.
Making adjustments to the saving ratio
Following the cash RHDI approach the components of the saving ratio were assessed on whetherthey would be directly observed by households and certain components were removed to create acash only saving ratio. The components removed were the adjustment for the change in pensionentitlements (D.8) and imputed rentals of owner occupiers and charges for Financial intermediationservices indirectly measured (FISIM) from household’s final consumption expenditure (P.3) (seeAnnex A).
20 August 2015
Office for National Statistics | 17
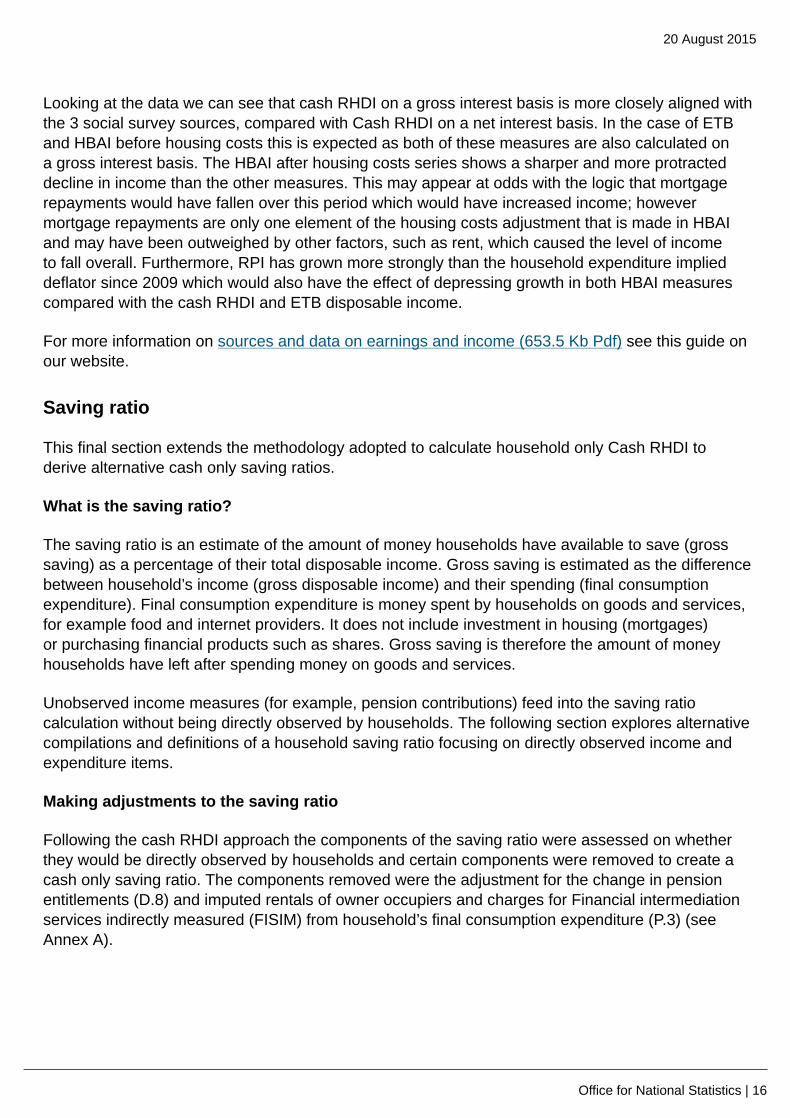
Figure 10: UK economic accounts published and cash only household saving ratios, per centUnited Kingdom, Quarter 1 (Jan to Mar) 1997 to Quarter 1 (Jan to Mar) 2015
Source: Office for National Statistics
Download chart
XLS format(31.5 Kb)
Figure 10 shows the national accounts consistent saving ratio alongside the two cash saving ratios;on a net interest basis and a gross interest basis.
All three ratios showed very similar patterns from Quarter 1 (January to March) 1997 through toQuarter 1 (January to March) 2015. From Quarter 1 (January to March) 1997 through to Quarter 1(January to March) 2008 the saving ratio declined. On a net interest basis this resulted in a negativesaving ratio between Quarter 4 (October to December) 2004 and Quarter 3 (July to September)2005 and also between Quarter 1 (January to March) 2006 and Quarter 3 (July to September)2008. During these periods expenditure exceeded income. This can occur either by drawing downexisting saving or by borrowing. We know that throughout this period there was an increase inconsumer debt and in particular mortgage debt (see ONS Economic Review – November 2014,Figure 10) and so increases in borrowing are likely to have played a significant part in falling savingratios over this period.
From the beginning Quarter 1 (January to March) 2008 to Quarter 1 (January to March) 2009, inthe beginning of the financial crisis the saving ratio then rose sharply for all three measures. Overthis period there was a great deal of economic and financial uncertainty which typically results inhouseholds cutting back on expenditure and increasing saving, particularly through the first threequarters of 2008 when interest rates were still relatively high meaning that the incentive to save wasalso still relatively high.
20 August 2015
Office for National Statistics | 18
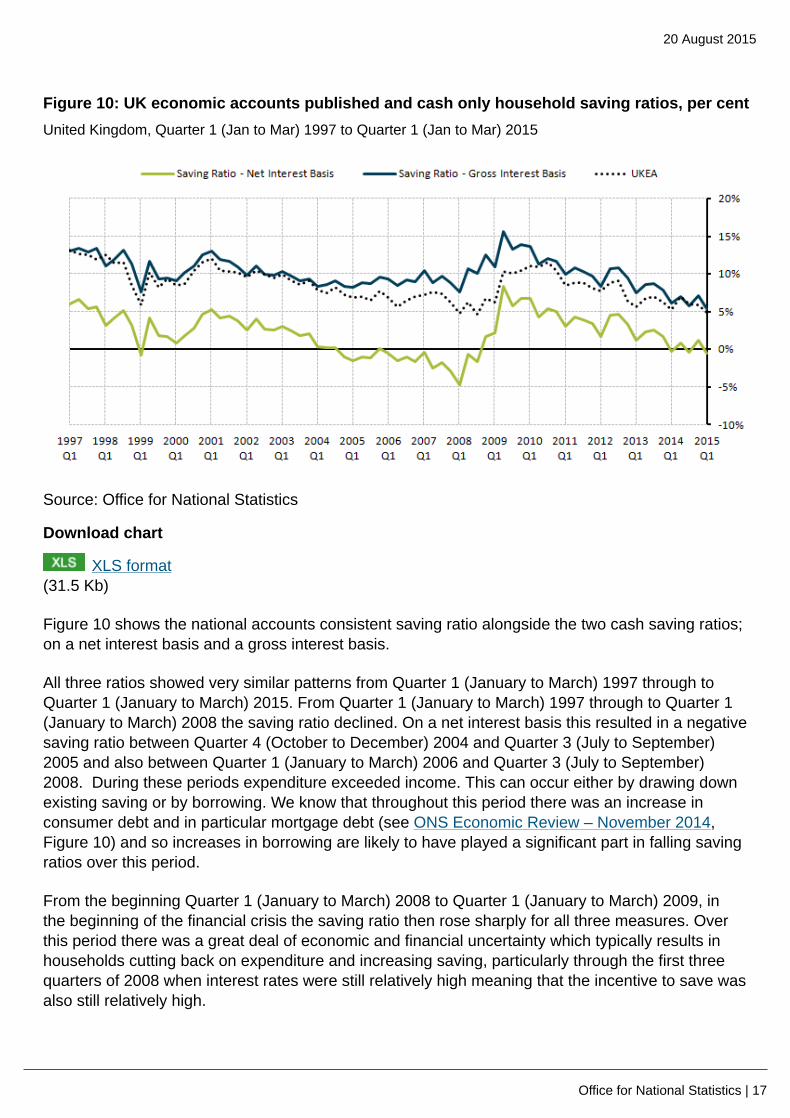
From Quarter 2 (April to June) 2009 onwards the saving ratio steadily declined for all measures.In Quarter 1 (January to March) 2015 the saving ratio had fell to 5.3% (on a gross interest basis),which was below its Quarter 1 (January to March) 2008 level of 7.7%. Part of the explanation for thisis that since Quarter 2 (April to June) 2009 the BoE base rate had been held at 0.5% which reducedthe incentive for households to save.
Figure 11: Gross disposable income on a gross and net interest basis and households’observed expenditure, index Quarter 1 (January to March) 2008=100United Kingdom, Quarter 1 (Jan to Mar) 1997 to Quarter 1 (Jan to Mar) 2015
Source: Office for National Statistics
Download chart
XLS format(33 Kb)
This reduced incentive to save is reflected in Figure 11. After contracting by 3.7% between quarter1 (Jan to Mar) 2008 and quarter 2 (Apr to Jun) 2009, households' expenditure then grew at a fasterpace than income (on both a gross and net basis) as signified by the narrowing of the gap betweenthe respective series.
As referenced above, there is also a noticeable difference between the levels of the saving ratio on anet interest basis compared with a gross interest basis.
20 August 2015
Office for National Statistics | 19
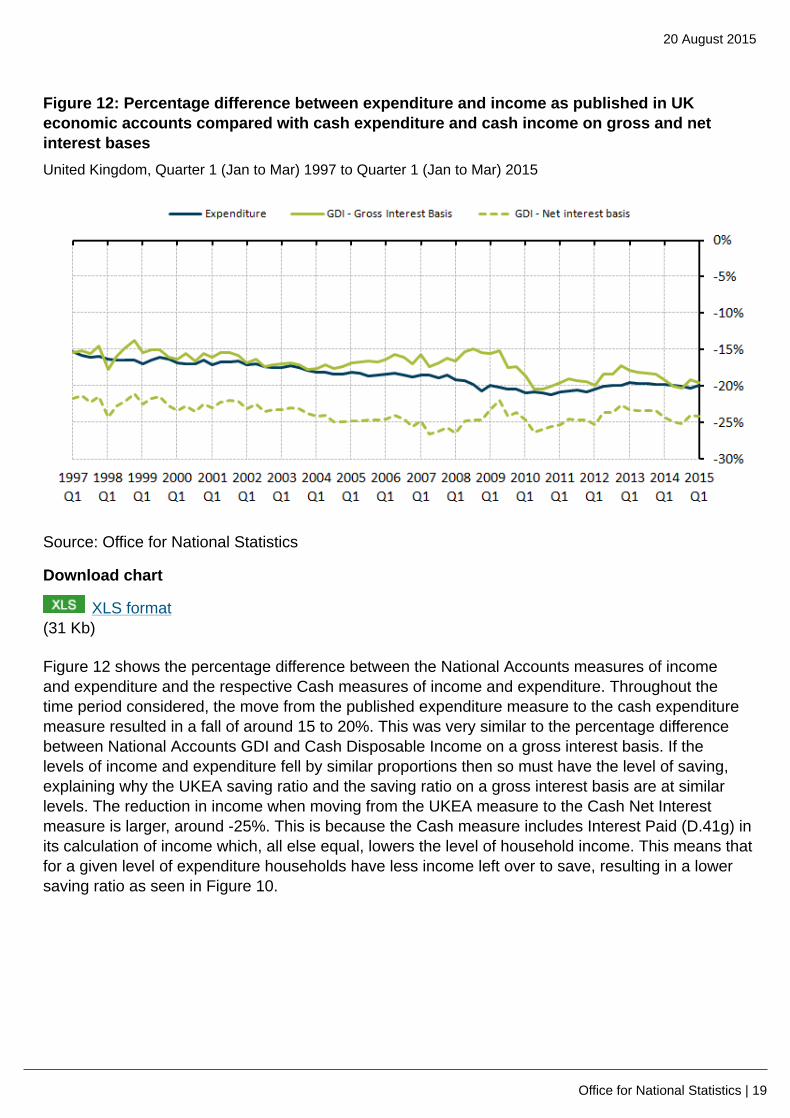
Figure 12: Percentage difference between expenditure and income as published in UKeconomic accounts compared with cash expenditure and cash income on gross and netinterest basesUnited Kingdom, Quarter 1 (Jan to Mar) 1997 to Quarter 1 (Jan to Mar) 2015
Source: Office for National Statistics
Download chart
XLS format(31 Kb)
Figure 12 shows the percentage difference between the National Accounts measures of incomeand expenditure and the respective Cash measures of income and expenditure. Throughout thetime period considered, the move from the published expenditure measure to the cash expendituremeasure resulted in a fall of around 15 to 20%. This was very similar to the percentage differencebetween National Accounts GDI and Cash Disposable Income on a gross interest basis. If thelevels of income and expenditure fell by similar proportions then so must have the level of saving,explaining why the UKEA saving ratio and the saving ratio on a gross interest basis are at similarlevels. The reduction in income when moving from the UKEA measure to the Cash Net Interestmeasure is larger, around -25%. This is because the Cash measure includes Interest Paid (D.41g) inits calculation of income which, all else equal, lowers the level of household income. This means thatfor a given level of expenditure households have less income left over to save, resulting in a lowersaving ratio as seen in Figure 10.
20 August 2015
Office for National Statistics | 20
Background notes
1. Details of the policy governing the release of new data are available by visitingwww.statisticsauthority.gov.uk/assessment/code-of-practice/index.html or from the MediaRelations Office email: [email protected]
Copyright
© Crown copyright 2015
You may use or re-use this information (not including logos) free of charge in any formator medium, under the terms of the Open Government Licence. To view this licence, visitwww.nationalarchives.gov.uk/doc/open-government-licence/ or write to the Information Policy Team,The National Archives, Kew, London TW9 4DU, or email: [email protected].
This document is also available on our website at www.ons.gov.uk.
Appendices
Annex A
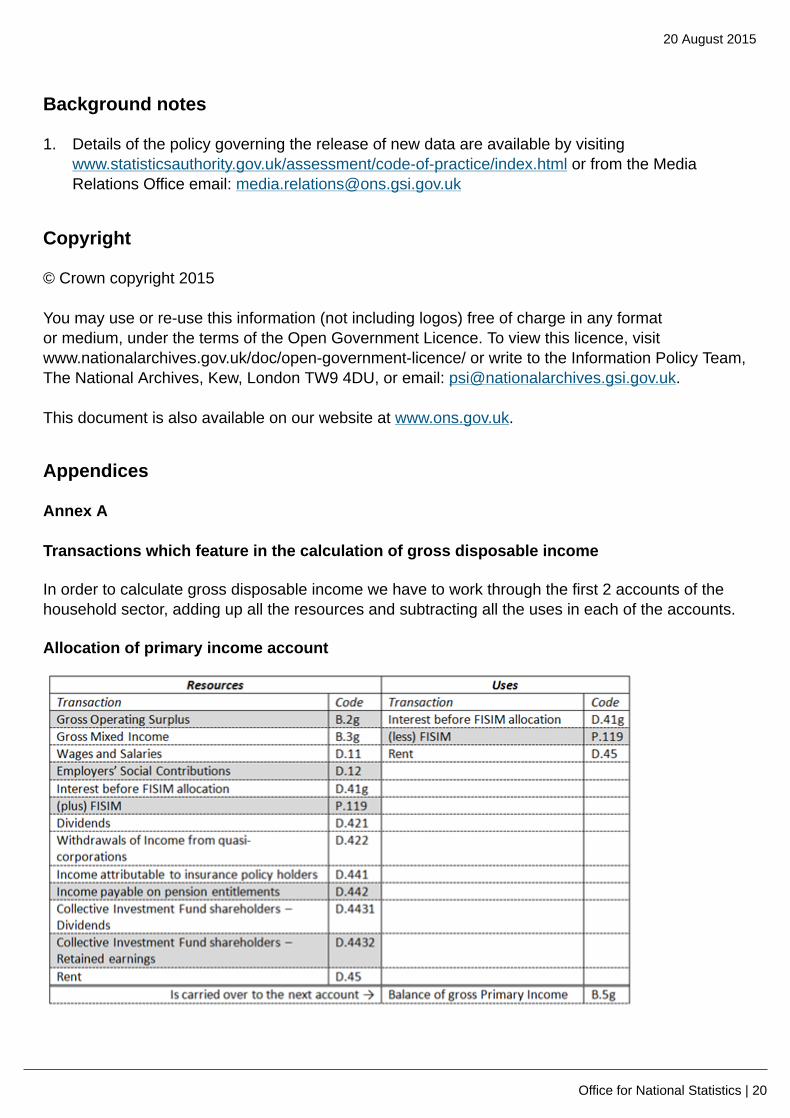
Transactions which feature in the calculation of gross disposable income
In order to calculate gross disposable income we have to work through the first 2 accounts of thehousehold sector, adding up all the resources and subtracting all the uses in each of the accounts.
Allocation of primary income account
20 August 2015
Office for National Statistics | 21
Notes:1. Click on image to view a larger version
Download chart
XLS format(19.5 Kb)
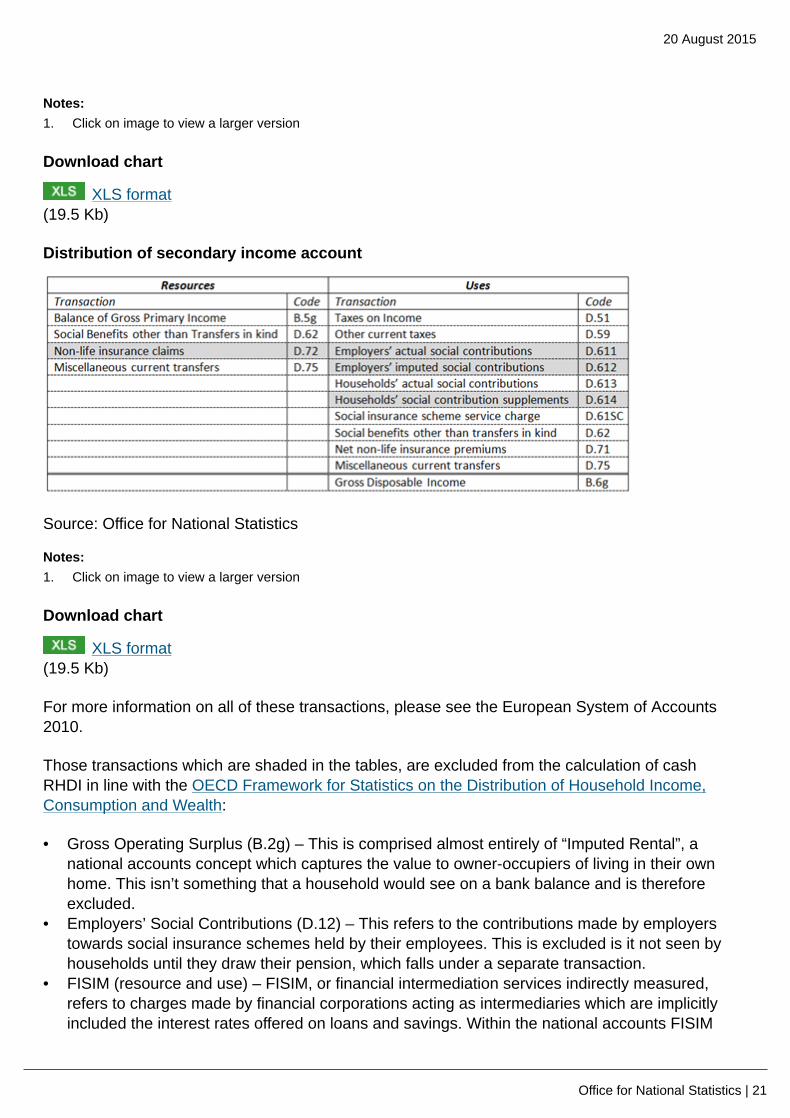
Distribution of secondary income account
Source: Office for National Statistics
Notes:1. Click on image to view a larger version
Download chart
XLS format(19.5 Kb)
For more information on all of these transactions, please see the European System of Accounts2010.
Those transactions which are shaded in the tables, are excluded from the calculation of cashRHDI in line with the OECD Framework for Statistics on the Distribution of Household Income,Consumption and Wealth:
• Gross Operating Surplus (B.2g) – This is comprised almost entirely of “Imputed Rental”, anational accounts concept which captures the value to owner-occupiers of living in their ownhome. This isn’t something that a household would see on a bank balance and is thereforeexcluded.
• Employers’ Social Contributions (D.12) – This refers to the contributions made by employerstowards social insurance schemes held by their employees. This is excluded is it not seen byhouseholds until they draw their pension, which falls under a separate transaction.
• FISIM (resource and use) – FISIM, or financial intermediation services indirectly measured,refers to charges made by financial corporations acting as intermediaries which are implicitlyincluded the interest rates offered on loans and savings. Within the national accounts FISIM
20 August 2015
Office for National Statistics | 22
adjustments are made to return these implicit charges back to households, however as thesecharges are real the adjustment is excluded from cash RHDI.
• Income Payable on Pension Entitlements (D.442), – This is comprised of the earnings whicharise from the investment of “technical funds” held by pension providers. These earnings are notactually seen by households as they are returned to the pension fund later on in the accountsand as such have been excluded from the cash measure of RHDI.
• Retained earnings attributable to collective investment fund shareholders (D.4432), – Thisrepresents the earnings made by collective investment funds which are not paid out asdividends. These are paid to households, such that the investment fund is left with no saving.These retained earnings are then paid back to the investment fund in the financial account.Again, this is a transfer which households don’t really see and as such it has been excluded fromcash RHDI
• Non-life insurance claims (D.72), – This refers to the funds received by households whenmaking claims on non-life insurance policies. Whilst within the system of national accounts theseare treated as current transfers, within social survey sources these sorts of transfers are notnormally captured as income and so have been excluded from cash RHDI. (See Canberra GroupHandbook)
• Employers’ actual social contributions (D.611) and Employers’ imputed social contributions(D.612) - Excluded as these transactions are the use counterpart to D.12 which was excludedabove
• Households’ social contribution supplements (D.614) – Excluded as this is the use counterpart toD.442 which was excluded above
Adjustments to transactions which calculate the saving ratio
• Adjustments for the change in pensions (D.8) – This adjustment adds back in the amount thathouseholds have paid into pension schemes net of any payments they have received fromthese schemes. This is because the contributions that households make to pension schemesare effectively a form of saving whilst the benefits received from these schemes are effectivelyreduce savings. The saving ratio calculated in this analysis excludes this adjustment as it is notsomething that is directly observed by households as saving.
• Households’ final consumption expenditure (P.3) – To calculate savings, households’ expenditureis deducted from households’ disposable income. To reflect some of the changes made to themeasurement of RHDI above, there are also corresponding changes which need to be made tothe measurement of households’ expenditure. Imputed rental of owner occupiers is deductedfrom expenditure as it is not directly observed by households.
• FISIM is also deducted from expenditure as this is already accounted for in the calculation ofGross Disposable Income
Annex B
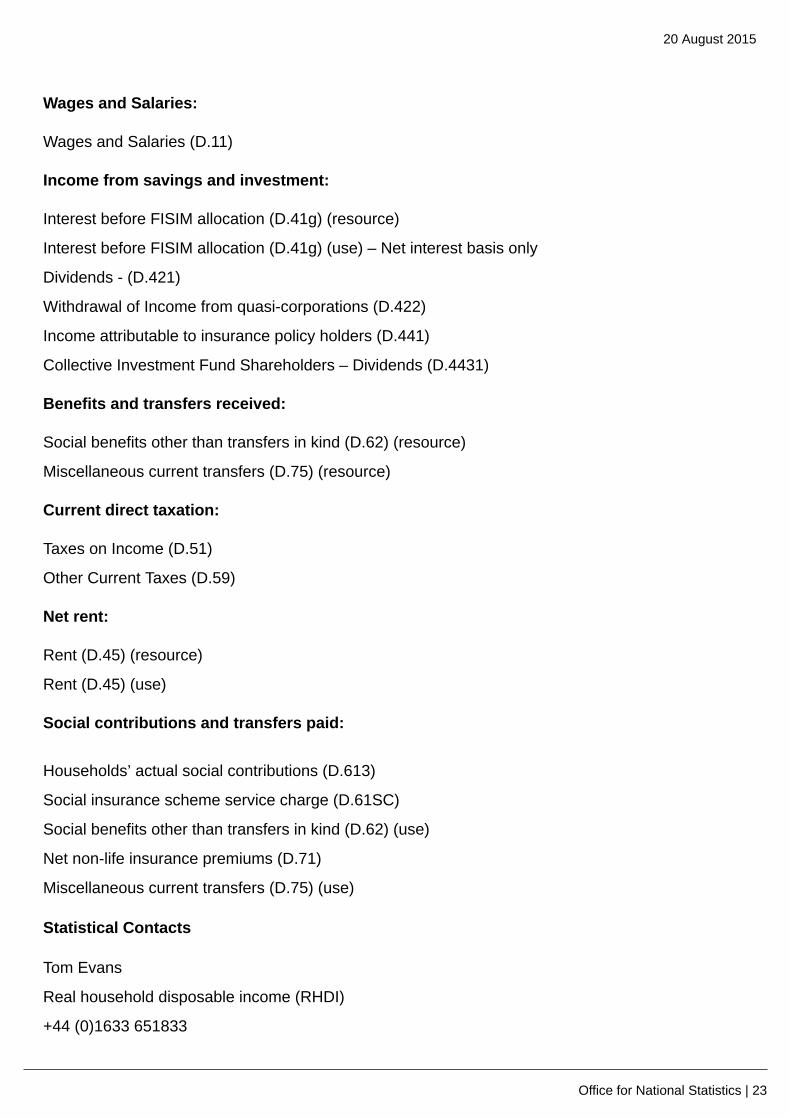
Transaction groupings for contributions chart
Mixed income:
Gross Mixed Income (B.3g)
20 August 2015
Office for National Statistics | 23
Wages and Salaries:
Wages and Salaries (D.11)
Income from savings and investment:
Interest before FISIM allocation (D.41g) (resource)
Interest before FISIM allocation (D.41g) (use) – Net interest basis only
Dividends - (D.421)
Withdrawal of Income from quasi-corporations (D.422)
Income attributable to insurance policy holders (D.441)
Collective Investment Fund Shareholders – Dividends (D.4431)
Benefits and transfers received:
Social benefits other than transfers in kind (D.62) (resource)
Miscellaneous current transfers (D.75) (resource)
Current direct taxation:
Taxes on Income (D.51)
Other Current Taxes (D.59)
Net rent:
Rent (D.45) (resource)
Rent (D.45) (use)
Social contributions and transfers paid:
Households’ actual social contributions (D.613)
Social insurance scheme service charge (D.61SC)
Social benefits other than transfers in kind (D.62) (use)
Net non-life insurance premiums (D.71)
Miscellaneous current transfers (D.75) (use)
Statistical Contacts
Tom Evans
Real household disposable income (RHDI)
+44 (0)1633 651833

20 August 2015
Office for National Statistics | 24
Household Accounts Development
Nicola Curtis
Saving ratio
+44 (0)1633 456377
Sector and Financial Accounts