Embed Size (px)
Citation preview
RESEARCH ARTICLE Open Access
Incidence of childhood CNS tumours inBritain and variation in rates by definitionof malignant behaviour: population-basedstudyCharles A. Stiller1* , Anita M. Bayne1, Aruna Chakrabarty2, Tom Kenny3 and Paul Chumas4
Abstract
Background: Intracranial and intraspinal tumours are the most numerous solid tumours in children. Some recentlydefined subtypes are relatively frequent in childhood. Many cancer registries routinely ascertain CNS tumours of allbehaviours, while others only cover malignant neoplasms. Some behaviour codes have changed between revisionsof the International Classification of Diseases for Oncology, including pilocytic astrocytoma, downgraded touncertain behaviour in ICD-O-3.
Methods: We used data from the population-based National Registry of Childhood Tumours, which routinelyincluded non-malignant CNS tumours, to document the occurrence of CNS tumours among children aged < 15years in Great Britain during 2001–2010 and to document the descriptive epidemiology of childhood CNS tumoursover the 40-year period 1971–2010, during which several new entities were accommodated in successive editionsof the WHO Classification and revisions of ICD-O. Eligible cases were all those with a diagnosis included in GroupsIII (CNS tumours) and Xa (CNS germ-cell tumours) of the International Classification of Childhood Cancer, ThirdEdition. The population at risk was derived from annual mid-year estimates by sex and single year of age compiledby the Office for National Statistics and its predecessors. Incidence rates were calculated for age groups 0, 1–4, 5–9and 10–14 years, and age-standardised rates were calculated using the weights of the world standard population.
Results: Age-standardised incidence in 2001–10 was 40.1 per million. Astrocytomas accounted for 41%, embryonaltumours for 17%, other gliomas for 10%, ependymomas for 7%, rarer subtypes for 20% and unspecified tumours for5%. Incidence of tumours classified as malignant and non-malignant by ICD-O-3 increased by 30 and 137%respectively between 1971-75 and 2006–10.
Conclusions: Total incidence was similar to that in other large western countries. Deficits of some, predominantlylow-grade, tumours or differences in their age distribution compared with the United States and Nordic countriesare compatible with delayed diagnosis. Complete registration regardless of tumour behaviour is essential forassessing burden of disease and changes over time. This is particularly important for pilocytic astrocytoma, becauseof its recent downgrading to non-malignant and time trends in the proportion of astrocytomas with specifiedsubtype.
Keywords: CNS tumours, Childhood, Incidence, Behaviour codes, Trends
* Correspondence: [email protected] Cancer Registration and Analysis Service, Public Health England,4150 Chancellor Court, Oxford Business Park South, Oxford OX4 2GX, UKFull list of author information is available at the end of the article
© The Author(s). 2019 Open Access This article is distributed under the terms of the Creative Commons Attribution 4.0International License (http://creativecommons.org/licenses/by/4.0/), which permits unrestricted use, distribution, andreproduction in any medium, provided you give appropriate credit to the original author(s) and the source, provide a link tothe Creative Commons license, and indicate if changes were made. The Creative Commons Public Domain Dedication waiver(http://creativecommons.org/publicdomain/zero/1.0/) applies to the data made available in this article, unless otherwise stated.
Stiller et al. BMC Cancer (2019) 19:139 https://doi.org/10.1186/s12885-019-5344-7
BackgroundIntracranial and intraspinal tumours are the most frequentsolid tumours in children. Age-standardised incidence at age0–14 years in industrialised countries during the 1980s–90swas typically in the range 30–40 per million [1, 2]. Successivestandard classifications of childhood cancer, while generallyrestricted to neoplasms of malignant behaviour, have also ad-mitted non-malignant tumours of the brain, spinal cord,meninges and intracranial endocrine glands because benigntumours of these sites are potentially lethal and it can be pe-culiarly difficult to determine the behaviour of some tu-mours, especially in the absence of histology [3–6]. Manypopulation-based general cancer registries, and all specialistchildren’s cancer registries, have for a long time routinelyascertained these non-malignant tumours for the same rea-sons. Other registries traditionally confined their coverage tomalignant neoplasms, however, including most of those inthe United States until they were mandated to includenon-malignant CNS tumours from 2004 onwards. In the in-terests of comparability, successive volumes of Cancer Inci-dence in Five Continents have always been restricted tomalignant neoplasms [7, 8]. By contrast, the two volumes ofInternational Incidence of Childhood Cancer [1, 9] and the
Automated Childhood Cancer Information System [2] in-cluded intracranial and intraspinal tumours regardless of be-haviour, but provided information on the proportionspecified as malignant.In the past three decades, new types of intracranial
and intraspinal neoplasms have been defined, includingseveral that are relatively frequent in childhood [10–13](Tables 1 and 2). Some are non-malignant tumours thatwould previously have been included within a less spe-cific entity that was regarded as malignant. Some entitieschanged behaviour code between revisions of the Inter-national Classification of Diseases for Oncology (ICD-O)[14–16] (Table 1). Mostly these affected only small num-bers of cases, but pilocytic or juvenile astrocytoma, themost frequent of all childhood central nervous system(CNS) tumours, was downgraded from malignant to un-certain behaviour in ICD-O-3, published in 2000 [16].There are few detailed accounts of the occurrence of
childhood CNS tumours based on large series frompopulation-based cancer registries using data coded toICD-O-3 [17, 18].This study has two principal aims. The first is to give a
detailed and up to date account of the occurrence of
Table 1 Changes and additions to morphology codes for intracranial and intraspinal tumours between ICD-O-1 (1976) [14], ICD-O-2(1990) [15] and ICD-O-3 (2000) [16]. Changes to behaviour code are in bold italics. ICCC-3: category in International Classification ofChildhood Cancer, Third Edition [6]
Entity ICD-O-1 ICD-O-2 ICD-O-3 ICCC-3
Papillary ependymoma 9393/1 9393/1 9393/3 IIIa.1
Pilocytic astrocytoma 9421/3 9421/3 9421/1 IIIb
Spongioblastoma, NOS 9422/3 9422/3 9421/1 IIIb
Pleomorphic xanthoastrocytoma – 9424/3 9424/3 IIIb
Gliofibroma – – 9442/1 IIIb
Large cell medulloblastoma – – 9474/3 IIIc.1
Primitive neuroectodermal tumour, NOS (now Embryonal CNS tumour, NOS) – 9473/3 9473/3 IIIc.2
Atypical teratoid/rhabdoid tumour – 8963/3 9508/3 IIIc.4
Chordoid glioma – – 9444/1 IIId.3
Prolactinoma – 8271/0 8271/0 IIIe.1
Pituitary adenoma, NOS 8140/0 8140/0 8272/0 IIIe.1
Pituitary carcinoma, NOS 8010/3 8010/3 8272/3 IIIe.1
Adamantinomatous craniopharyngioma – – 9351/1 IIIe.2
Papillary craniopharyngioma – – 9352/1 IIIe.2
Granular cell tumour of the sellar region 9580/0 9580/0 9582/0 IIIe.2
Desmoplastic infantile astrocytoma – – 9412/1 IIIe.4
Dysembryoplastic neuroepithelial tumour – – 9413/0 IIIe.4
Gangliocytoma – 9490/0 9492/0 IIIe.4
Dysplastic gangliocytoma of cerebellum – – 9493/0 IIIe.4
Anaplastic ganglioglioma – – 9505/3 IIIe.4
Clear cell meningioma 9538/1 IIIe.5
Papillary meningioma 9538/1 9538/1 9538/3 IIIe.5
Stiller et al. BMC Cancer (2019) 19:139 Page 2 of 15
childhood intracranial and intraspinal tumours based ondata from a large, population-based, specialist children’stumour registry, including information on subtypes thatwere not assigned specific morphology codes untilICD-O-3. The second is to use data from the same regis-try to document the descriptive epidemiology of child-hood CNS tumours over a longer period during whichnew entities were accommodated in successive editionsof the WHO Classification [10–12] and revisions ofICD-O [15, 16, 19].
MethodsThe population-based National Registry of Childhood Tu-mours (NRCT) covered the population under 15 years of agethroughout Great Britain (England, Scotland and Wales)during 1962–2010. Sources of notification varied slightlyover the years but always included the network of regionaland national cancer registries covering the population of allages in the whole of Great Britain, together with death certif-icates for children with a neoplasm as underlying cause ofdeath. Cases were also ascertained from specialist children’stumour registries in certain regions of England. Since 1977increasing numbers were notified directly from paediatriconcology principal treatment centres [20]. The NRCTalwaysincluded all malignant neoplasms and all non-malignantintracranial and intraspinal tumours. Diagnoses were codedaccording to ICD-O [14–16], with earlier data recoded retro-spectively on adoption of each new revision. Further detailsof the NRCTare published elsewhere [21]. Diagnoses for thisstudy were coded to ICD-O-3 [16] and grouped by the Inter-national Classification of Childhood Cancer, Third Edition(ICCC-3) [6]. Additional codes included in the first revisionof ICD-O-3 [19] were provisionally allocated to ICCC-3 cat-egories (Table 2). Definitions for four existing codes were ex-panded in line with the 2007 WHO Classification: 8290/0includes spindle-cell oncocytoma, 9471/3 includes medullo-blastoma with extensive nodularity, 9474/3 includes anaplas-tic medulloblastoma, and 9506/1 includes extraventricularneurocytoma and cerebellar liponeurocytoma [12, 19]. Add-itional entities in the 2016 WHO Classification, many ofthem genetically defined, could not be identified in the regis-try data, but we have adopted the preferred terminology
‘embryonal CNS tumour NOS’ to replace ‘primitive neuroec-todermal tumour (PNET)’ [13].For this study we included all children who were
under the age of 15 years and resident in Great Britainwhen diagnosed with a tumour included in ICCC-3Group III ‘Central nervous system and miscellaneousintracranial and intraspinal neoplasms’ or Subgroup Xa‘Intracranial and intraspinal germ-cell tumours’ during1971–2010. The main analyses are restricted to cases ofa first or only tumour in these ICCC-3 categories, butbrief details are also given of the small number of tu-mours diagnosed in children with a previous cancerdiagnosis where it was clear from diagnostic and otherreports that these were distinct primary tumours. Thedetailed description of incidence is based on children di-agnosed during 2001–10. Data from the full 40-yearstudy period were used to describe changes in recordedincidence and relative frequency over time and to showthe effects of restricting coverage to cases defined as ma-lignant by successive revisions of ICD-O.The population at risk was derived from annual
mid-year estimates by sex and single year of age com-piled by the Office for National Statistics and its prede-cessors. The average population at risk was 10.5 millionchildren during 2001–10 and 11.1 million children dur-ing 1971–2010.Registration rates were calculated per million child-years
at risk for age groups 0, 1–4, 5–9 and 10–14 years [1].Age-standardised rates (ASR) were calculated by the directmethod, using the world standard population which assignsweights 2.4, 9.6, 10 and 9 respectively to these age groups[1]. Cumulative risk to 15th birthday was defined as the re-ciprocal of the cumulative rate which was calculated as r0 +4r1 + 5r2 + 5r3, where r0, r1, r2 and r3 are the age-specificrates for ages 0, 1–4, 5–9 and 10–14 respectively [1].
ResultsIncidence 2001–2010Table 3 shows numbers of registrations for children di-agnosed during 2001–10, percentage recorded as micro-scopically verified (MV), annual rates per millionchildren by age group, and ASRs by sex and for bothsexes combined. Data are shown for ICCC-3 subgroups
Table 2 Additional ICD-O morphology codes proposed in the 2007 WHO Classification of Tumours of the Central Nervous Systemand included in ICD-O-3.1 [19], with provisional allocation to categories in ICCC-3
Code Entity ICCC-3
9390/1 Atypical choroid plexus papilloma IIIa.2
9395/3 Papillary tumour of the pineal region IIId.3
9425/3 Pilomyxoid astrocytoma IIIb
9431/1 Angiocentric glioma IIId.3
9432/1 Pituicytoma IIId.3
9509/1 Papillary glioneural tumour/rosette-forming glioneuronal tumour of the fourth ventricle IIIe.4
Stiller et al. BMC Cancer (2019) 19:139 Page 3 of 15
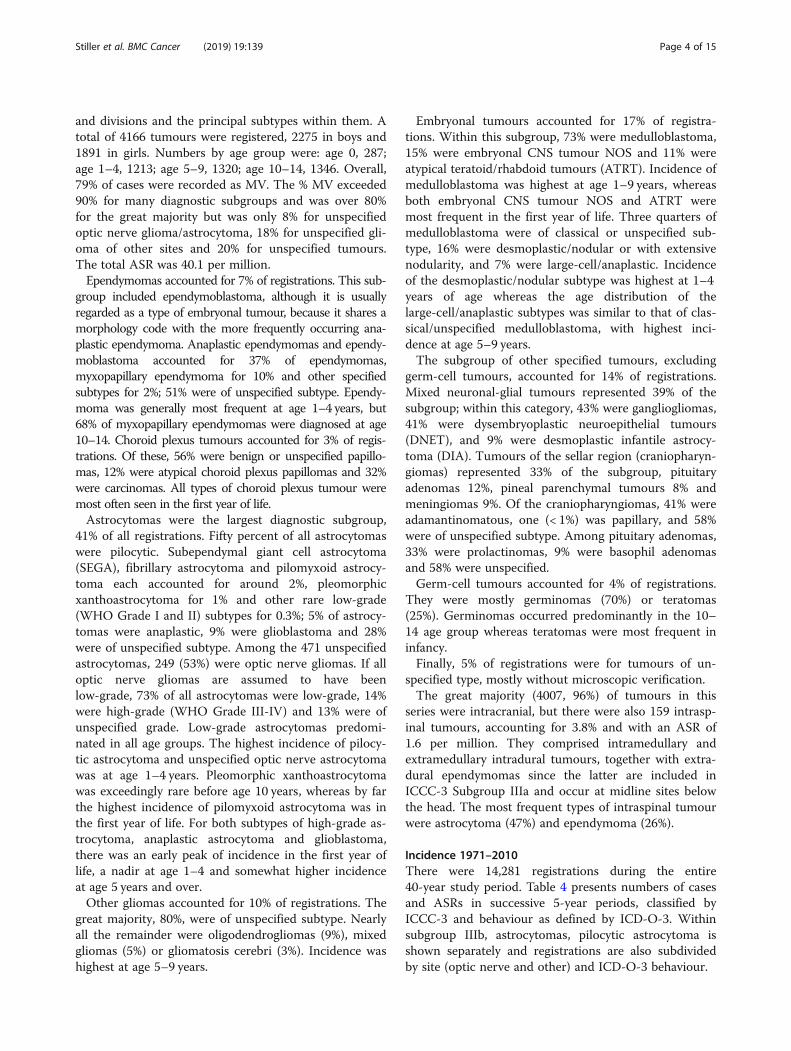
and divisions and the principal subtypes within them. Atotal of 4166 tumours were registered, 2275 in boys and1891 in girls. Numbers by age group were: age 0, 287;age 1–4, 1213; age 5–9, 1320; age 10–14, 1346. Overall,79% of cases were recorded as MV. The % MV exceeded90% for many diagnostic subgroups and was over 80%for the great majority but was only 8% for unspecifiedoptic nerve glioma/astrocytoma, 18% for unspecified gli-oma of other sites and 20% for unspecified tumours.The total ASR was 40.1 per million.Ependymomas accounted for 7% of registrations. This sub-
group included ependymoblastoma, although it is usuallyregarded as a type of embryonal tumour, because it shares amorphology code with the more frequently occurring ana-plastic ependymoma. Anaplastic ependymomas and ependy-moblastoma accounted for 37% of ependymomas,myxopapillary ependymoma for 10% and other specifiedsubtypes for 2%; 51% were of unspecified subtype. Ependy-moma was generally most frequent at age 1–4 years, but68% of myxopapillary ependymomas were diagnosed at age10–14. Choroid plexus tumours accounted for 3% of regis-trations. Of these, 56% were benign or unspecified papillo-mas, 12% were atypical choroid plexus papillomas and 32%were carcinomas. All types of choroid plexus tumour weremost often seen in the first year of life.Astrocytomas were the largest diagnostic subgroup,
41% of all registrations. Fifty percent of all astrocytomaswere pilocytic. Subependymal giant cell astrocytoma(SEGA), fibrillary astrocytoma and pilomyxoid astrocy-toma each accounted for around 2%, pleomorphicxanthoastrocytoma for 1% and other rare low-grade(WHO Grade I and II) subtypes for 0.3%; 5% of astrocy-tomas were anaplastic, 9% were glioblastoma and 28%were of unspecified subtype. Among the 471 unspecifiedastrocytomas, 249 (53%) were optic nerve gliomas. If alloptic nerve gliomas are assumed to have beenlow-grade, 73% of all astrocytomas were low-grade, 14%were high-grade (WHO Grade III-IV) and 13% were ofunspecified grade. Low-grade astrocytomas predomi-nated in all age groups. The highest incidence of pilocy-tic astrocytoma and unspecified optic nerve astrocytomawas at age 1–4 years. Pleomorphic xanthoastrocytomawas exceedingly rare before age 10 years, whereas by farthe highest incidence of pilomyxoid astrocytoma was inthe first year of life. For both subtypes of high-grade as-trocytoma, anaplastic astrocytoma and glioblastoma,there was an early peak of incidence in the first year oflife, a nadir at age 1–4 and somewhat higher incidenceat age 5 years and over.Other gliomas accounted for 10% of registrations. The
great majority, 80%, were of unspecified subtype. Nearlyall the remainder were oligodendrogliomas (9%), mixedgliomas (5%) or gliomatosis cerebri (3%). Incidence washighest at age 5–9 years.
Embryonal tumours accounted for 17% of registra-tions. Within this subgroup, 73% were medulloblastoma,15% were embryonal CNS tumour NOS and 11% wereatypical teratoid/rhabdoid tumours (ATRT). Incidence ofmedulloblastoma was highest at age 1–9 years, whereasboth embryonal CNS tumour NOS and ATRT weremost frequent in the first year of life. Three quarters ofmedulloblastoma were of classical or unspecified sub-type, 16% were desmoplastic/nodular or with extensivenodularity, and 7% were large-cell/anaplastic. Incidenceof the desmoplastic/nodular subtype was highest at 1–4years of age whereas the age distribution of thelarge-cell/anaplastic subtypes was similar to that of clas-sical/unspecified medulloblastoma, with highest inci-dence at age 5–9 years.The subgroup of other specified tumours, excluding
germ-cell tumours, accounted for 14% of registrations.Mixed neuronal-glial tumours represented 39% of thesubgroup; within this category, 43% were gangliogliomas,41% were dysembryoplastic neuroepithelial tumours(DNET), and 9% were desmoplastic infantile astrocy-toma (DIA). Tumours of the sellar region (craniopharyn-giomas) represented 33% of the subgroup, pituitaryadenomas 12%, pineal parenchymal tumours 8% andmeningiomas 9%. Of the craniopharyngiomas, 41% wereadamantinomatous, one (< 1%) was papillary, and 58%were of unspecified subtype. Among pituitary adenomas,33% were prolactinomas, 9% were basophil adenomasand 58% were unspecified.Germ-cell tumours accounted for 4% of registrations.
They were mostly germinomas (70%) or teratomas(25%). Germinomas occurred predominantly in the 10–14 age group whereas teratomas were most frequent ininfancy.Finally, 5% of registrations were for tumours of un-
specified type, mostly without microscopic verification.The great majority (4007, 96%) of tumours in this
series were intracranial, but there were also 159 intrasp-inal tumours, accounting for 3.8% and with an ASR of1.6 per million. They comprised intramedullary andextramedullary intradural tumours, together with extra-dural ependymomas since the latter are included inICCC-3 Subgroup IIIa and occur at midline sites belowthe head. The most frequent types of intraspinal tumourwere astrocytoma (47%) and ependymoma (26%).
Incidence 1971–2010There were 14,281 registrations during the entire40-year study period. Table 4 presents numbers of casesand ASRs in successive 5-year periods, classified byICCC-3 and behaviour as defined by ICD-O-3. Withinsubgroup IIIb, astrocytomas, pilocytic astrocytoma isshown separately and registrations are also subdividedby site (optic nerve and other) and ICD-O-3 behaviour.
Stiller et al. BMC Cancer (2019) 19:139 Page 4 of 15
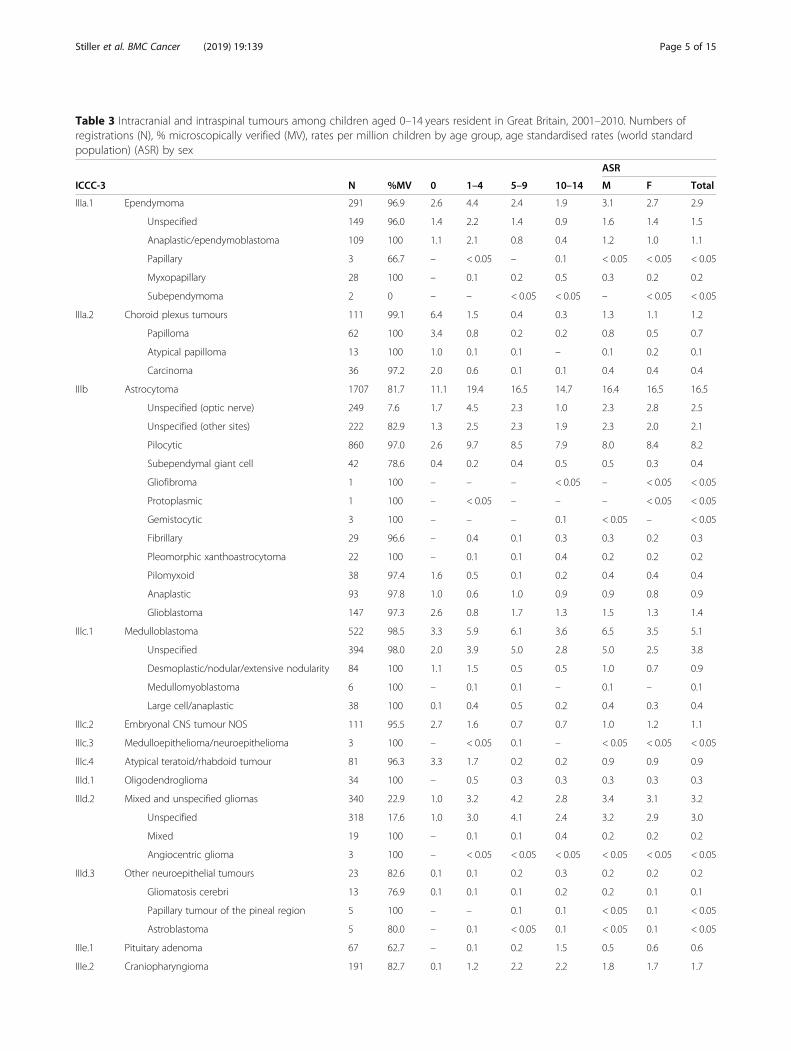
Table 3 Intracranial and intraspinal tumours among children aged 0–14 years resident in Great Britain, 2001–2010. Numbers ofregistrations (N), % microscopically verified (MV), rates per million children by age group, age standardised rates (world standardpopulation) (ASR) by sex
ASR
ICCC-3 N %MV 0 1–4 5–9 10–14 M F Total
IIIa.1 Ependymoma 291 96.9 2.6 4.4 2.4 1.9 3.1 2.7 2.9
Unspecified 149 96.0 1.4 2.2 1.4 0.9 1.6 1.4 1.5
Anaplastic/ependymoblastoma 109 100 1.1 2.1 0.8 0.4 1.2 1.0 1.1
Papillary 3 66.7 – < 0.05 – 0.1 < 0.05 < 0.05 < 0.05
Myxopapillary 28 100 – 0.1 0.2 0.5 0.3 0.2 0.2
Subependymoma 2 0 – – < 0.05 < 0.05 – < 0.05 < 0.05
IIIa.2 Choroid plexus tumours 111 99.1 6.4 1.5 0.4 0.3 1.3 1.1 1.2
Papilloma 62 100 3.4 0.8 0.2 0.2 0.8 0.5 0.7
Atypical papilloma 13 100 1.0 0.1 0.1 – 0.1 0.2 0.1
Carcinoma 36 97.2 2.0 0.6 0.1 0.1 0.4 0.4 0.4
IIIb Astrocytoma 1707 81.7 11.1 19.4 16.5 14.7 16.4 16.5 16.5
Unspecified (optic nerve) 249 7.6 1.7 4.5 2.3 1.0 2.3 2.8 2.5
Unspecified (other sites) 222 82.9 1.3 2.5 2.3 1.9 2.3 2.0 2.1
Pilocytic 860 97.0 2.6 9.7 8.5 7.9 8.0 8.4 8.2
Subependymal giant cell 42 78.6 0.4 0.2 0.4 0.5 0.5 0.3 0.4
Gliofibroma 1 100 – – – < 0.05 – < 0.05 < 0.05
Protoplasmic 1 100 – < 0.05 – – – < 0.05 < 0.05
Gemistocytic 3 100 – – – 0.1 < 0.05 – < 0.05
Fibrillary 29 96.6 – 0.4 0.1 0.3 0.3 0.2 0.3
Pleomorphic xanthoastrocytoma 22 100 – 0.1 0.1 0.4 0.2 0.2 0.2
Pilomyxoid 38 97.4 1.6 0.5 0.1 0.2 0.4 0.4 0.4
Anaplastic 93 97.8 1.0 0.6 1.0 0.9 0.9 0.8 0.9
Glioblastoma 147 97.3 2.6 0.8 1.7 1.3 1.5 1.3 1.4
IIIc.1 Medulloblastoma 522 98.5 3.3 5.9 6.1 3.6 6.5 3.5 5.1
Unspecified 394 98.0 2.0 3.9 5.0 2.8 5.0 2.5 3.8
Desmoplastic/nodular/extensive nodularity 84 100 1.1 1.5 0.5 0.5 1.0 0.7 0.9
Medullomyoblastoma 6 100 – 0.1 0.1 – 0.1 – 0.1
Large cell/anaplastic 38 100 0.1 0.4 0.5 0.2 0.4 0.3 0.4
IIIc.2 Embryonal CNS tumour NOS 111 95.5 2.7 1.6 0.7 0.7 1.0 1.2 1.1
IIIc.3 Medulloepithelioma/neuroepithelioma 3 100 – < 0.05 0.1 – < 0.05 < 0.05 < 0.05
IIIc.4 Atypical teratoid/rhabdoid tumour 81 96.3 3.3 1.7 0.2 0.2 0.9 0.9 0.9
IIId.1 Oligodendroglioma 34 100 – 0.5 0.3 0.3 0.3 0.3 0.3
IIId.2 Mixed and unspecified gliomas 340 22.9 1.0 3.2 4.2 2.8 3.4 3.1 3.2
Unspecified 318 17.6 1.0 3.0 4.1 2.4 3.2 2.9 3.0
Mixed 19 100 – 0.1 0.1 0.4 0.2 0.2 0.2
Angiocentric glioma 3 100 – < 0.05 < 0.05 < 0.05 < 0.05 < 0.05 < 0.05
IIId.3 Other neuroepithelial tumours 23 82.6 0.1 0.1 0.2 0.3 0.2 0.2 0.2
Gliomatosis cerebri 13 76.9 0.1 0.1 0.1 0.2 0.2 0.1 0.1
Papillary tumour of the pineal region 5 100 – – 0.1 0.1 < 0.05 0.1 < 0.05
Astroblastoma 5 80.0 – 0.1 < 0.05 0.1 < 0.05 0.1 < 0.05
IIIe.1 Pituitary adenoma 67 62.7 – 0.1 0.2 1.5 0.5 0.6 0.6
IIIe.2 Craniopharyngioma 191 82.7 0.1 1.2 2.2 2.2 1.8 1.7 1.7
Stiller et al. BMC Cancer (2019) 19:139 Page 5 of 15
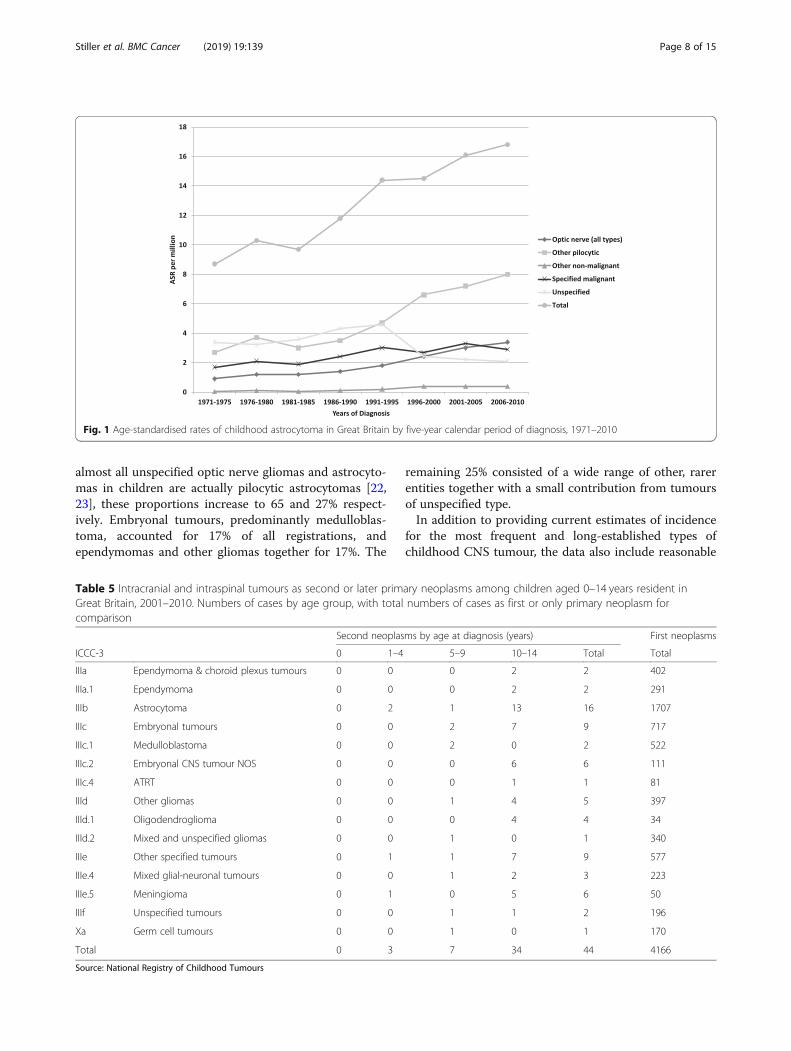
The ASR for total intracranial and intraspinal tumoursrose from 25.7 per million in 1971–75 to 41.3 per millionin 2006–10, an increase of 60% over 35 years. The corre-sponding increases in age-specific rates (not shown inTable 4) were: age 0, from 20.3 per million in 1971–75 to42.9 per million in 2006–10, 108%; age 1–4, from 28.5 permillion in 1971–75 to 44.5 per million in 2006–10, 56%;age 5–9, from 27.3 per million in 1971–75 to 40.5 per mil-lion in 2006–10, 48%; age 10–14, from 22.5 per million in1971–75 to 38.3 per million in 2006–10, 70%.Incidence patterns over time varied markedly between
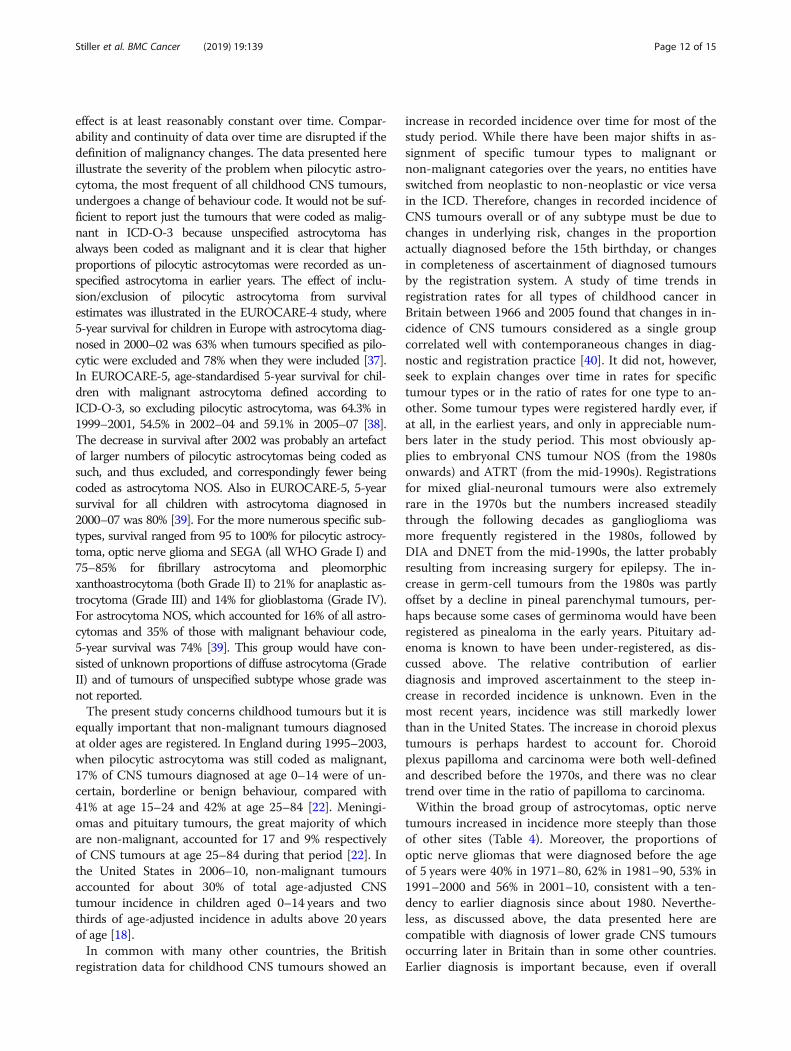
diagnostic categories. Astrocytoma was the most fre-quent tumour type throughout, and its ASR rose from8.7 per million in 1971–75 to 16.8 per million in 2006–10, an increase of 93%. Between the same two periods,the proportional increase was greater for pilocytic astro-cytoma (202%, from 2.9 per million to 8.6 per million)than for astrocytomas of other or unspecified subtype(40%, from 5.8 per million to 8.2 per million), and higherfor optic nerve astrocytomas (286%, from 0.9 per millionto 3.4 per million) than for other sites (72%, from 7.8per million to 13.4 per million). From 1991 onwards,pilocytic astrocytoma was the most frequent singlehistological type of tumour (Fig. 1).Medulloblastoma, mixed and unspecified gliomas, and
ependymoma, all had very similar ASRs in 1971–75 and2006–10, with fluctuating rates in the intervening periods.Among the remaining, rarer categories, some showed little
sign of consistent change over time, such as oligodendro-glioma and pineal parenchymal tumours. Several otherswere registered extremely rarely in the earliest years.Neuronal and mixed neuronal-glial tumours accountedfor no more than 1% of all tumours before 1991, but theirrelative frequency rose to 2.6% in 1991–95 and 5.3% in1996–2010, corresponding to increases in registrationrates initially for ganglioglioma and later for DNET andDIA. Some tumours, notably ATRT and pituitary aden-oma, were only recorded in substantial numbers in thefinal decade.When classified by ICD-O-3 behaviour code, incidence of
both non-malignant and malignant tumours increased be-tween 1971 and 75 and 2006–10 (Table 4). The ASR for tu-mours with non-malignant behaviour code increased by137%, from 7.3 to 17.2 per million. The correspondingchange for malignant tumours was 30%, from 18.5 to 24.1per million. For all tumours except ICCC-3 IIIb, astrocy-toma, the increases in ASR were: non-malignant, 4.4–8.2 permillion, 86%, and malignant, 12.7–16.3 per million, 29%.
Contribution of second primary neoplasmsIn 2001–10 there were 44 registrations for CNS tu-mours as second or later primary neoplasms amongchildren (Table 5). Ependymomas accounted for 2(5%), astrocytomas for 16 (36%), other gliomas for 5(11%), embryonal tumours for 9 (20%), meningiomasfor 6 (14%), mixed glial-neuronal tumours for 3
Table 3 Intracranial and intraspinal tumours among children aged 0–14 years resident in Great Britain, 2001–2010. Numbers ofregistrations (N), % microscopically verified (MV), rates per million children by age group, age standardised rates (world standardpopulation) (ASR) by sex (Continued)
ASR
ICCC-3 N %MV 0 1–4 5–9 10–14 M F Total
IIIe.3 Pineal parenchymal tumours 46 97.8 0.4 0.4 0.4 0.4 0.4 0.4 0.4
Pineocytoma 4 100 – < 0.05 0.1 < 0.05 < 0.05 < 0.05 < 0.05
Pineoblastoma incl. PTID 42 97.6 0.4 0.4 0.4 0.4 0.4 0.4 0.4
IIIe.4 Mixed glial-neuronal tumours 223 91.5 3.1 1.6 1.9 2.6 2.3 1.8 2.1
Desmoplastic infantile astrocytoma 21 100 2.1 0.1 0.1 < 0.05 0.3 0.1 0.2
Dysembryoplastic neuroepithelial tumour 91 86.8 0.1 0.7 0.9 1.1 1.0 0.7 0.8
Ganglioglioma 96 93.8 0.6 0.7 0.8 1.3 0.9 0.9 0.9
Central neurocytoma 6 83.3 0.1 0.1 < 0.05 0.1 0.1 – 0.1
Papillary glioneuronal tumour 3 100 – – 0.1 < 0.05 < 0.05 < 0.05 < 0.05
Gangliocytoma 6 100 0.1 0.1 0.1 < 0.05 < 0.05 0.1 0.1
IIIe.5 Meningioma 50 88.0 0.1 0.3 0.3 0.8 0.4 0.5 0.4
IIIf Unspecified tumours 196 19.9 4.5 1.6 1.5 1.9 2.0 1.8 1.9
Xa Germ cell tumours 170 77.6 2.0 0.7 1.0 2.9 1.9 1.1 1.5
Germinoma 119 76.5 0.1 < 0.05 0.8 2.4 1.3 0.7 1.0
Other 51 80.4 1.8 0.7 0.1 0.4 0.6 0.4 0.5
Total 4166 78.8 40.7 44.4 38.6 37.0 42.6 37.5 40.1
Source: National Registry of Childhood Tumours
Stiller et al. BMC Cancer (2019) 19:139 Page 6 of 15
(7%), unspecified tumours for 2 (5%) and germ-celltumours for 1 (2%). There were no choroid plexustumours, pituitary tumours, craniopharyngiomas orpineal parenchymal tumours. Thirty-four tumours(77%) were in children aged 10–14 years. Second pri-maries represented 1% of all childhood CNS tu-mours, but 11% of oligodendrogliomas andmeningiomas. The proportion of childhood CNS tu-mours that were second primaries rose from zero inthe first year of life to 0.2% at age 1–4, 0.5% at age5–9 and 2.5% at age 10–14.
DiscussionThe data presented here give up to date estimates of theincidence of intracranial and intraspinal tumours amongchildren in Great Britain. Total annual incidence during2001–10 was 40.1 per million, equivalent to a risk of 1in 1678 that a child will be diagnosed with such atumour before their 15th birthday. About 40% of inci-dence was accounted for by astrocytomas. The most fre-quent single histological type of tumour was pilocyticastrocytoma, which accounted for one half of all astrocy-tomas and 21% of all tumours. If it is assumed that
Table 4 Intracranial and intraspinal tumours among children aged 0–14 years resident in Great Britain, 1971–2010. Numbers ofregistrations (N) and age-standardised rates (world standard population) (ASR) in successive quinquennia of diagnosis, by ICCC-3category and ICD-O-3 behaviour code
ICCC-3 1971–1975 1976–1980 1981–1985 1986–1990 1991–1995 1996–2000 2001–2005 2006–2010
N ASR N ASR N ASR N ASR N ASR N ASR N ASR N ASR
IIIa.1 Ependymoma 181 2.9 164 3.0 131 2.6 121 2.4 127 2.4 134 2.6 139 2.8 152 3.0
IIIa.2 Choroid plexus tumours 13 0.2 24 0.5 31 0.7 28 0.6 43 0.9 48 1.0 54 1.2 57 1.2
IIIb Astrocytoma 563 8.7 611 10.3 518 9.7 606 11.8 780 14.4 786 14.5 842 16.1 865 16.8
Pilocytic, optic nerve 12 0.2 16 0.3 10 0.2 15 0.3 25 0.5 22 0.4 31 0.7 29 0.6
Pilocytic, other sites 173 2.7 222 3.7 162 3.0 181 3.5 256 4.7 360 6.6 382 7.2 418 8.0
Other non-malignant behaviour 2 <0.05
5 0.1 3 <0.05
5 0.1 13 0.2 23 0.4 21 0.4 21 0.4
Malignant behaviour, optic nerve 43 0.7 49 0.9 46 0.9 52 1.1 71 1.4 102 2.0 113 2.3 139 2.8
Malignant behaviour, other sites 333 5.1 319 5.3 297 5.5 353 6.8 415 7.6 279 5.1 295 5.5 258 5.0
IIIc.1 Medulloblastoma 316 5.0 306 5.3 277 5.4 237 4.6 256 4.8 254 4.7 272 5.3 252 4.9
IIIc.2 Embryonal CNS tumour NOS 2 <0.05
9 0.2 40 0.8 70 1.4 86 1.7 75 1.5 50 1.0 59 1.2
IIIc.3 Medulloepithelioma/neuroepithelioma
1 <0.05
2 <0.05
0 – 2 <0.05
5 0.1 2 <0.05
2 <0.05
1 <0.05
IIIc.4 Atypical teratoid/rhabdoidtumour
0 – 0 – 0 – 2 <0.05
2 <0.05
22 0.5 32 0.7 49 1.0
IIId.1 Oligodendroglioma 34 0.5 21 0.3 33 0.6 24 0.5 19 0.3 13 0.2 14 0.3 20 0.4
IIId.2 Mixed and unspecified gliomas 225 3.4 227 3.8 179 3.4 185 3.5 162 3.0 174 3.2 169 3.2 171 3.3
IIId.3 Other neuroepithelial tumours 3 0.1 0 – 2 <0.05
5 0.1 4 0.1 1 <0.05
6 0.1 17 0.3
IIIe.1 Pituitary adenoma 5 0.1 10 0.1 6 0.1 6 0.1 10 0.2 10 0.2 30 0.5 37 0.6
IIIe.2 Craniopharyngioma 70 1.1 91 1.5 65 1.2 77 1.4 105 1.9 98 1.7 91 1.6 100 1.9
IIIe.3 Pineal parenchymal tumours 25 0.4 31 0.6 22 0.3 17 0.3 16 0.3 23 0.4 24 0.5 22 0.4
IIIe.4 Mixed glial-neuronal tumours 5 0.1 6 0.1 10 0.2 15 0.3 48 0.9 100 1.8 104 1.9 119 2.2
IIIe.5 Meningioma 26 0.4 21 0.3 21 0.3 15 0.3 31 0.5 17 0.3 22 0.4 28 0.5
IIIf Unspecified tumours 153 2.3 61 1.1 83 1.6 86 1.7 104 1.9 67 1.3 97 1.9 99 1.9
Xa Germ cell tumours 33 0.5 50 0.8 67 1.2 56 1.1 82 1.5 85 1.5 83 1.5 87 1.6
ICD-O-3 behaviour
0,1
Non-malignant 475 7.3 481 8.2 407 7.5 429 8.3 623 11.5 746 13.6 823 15.5 903 17.2
3 Malignant 1180 18.5 1153 19.8 1078 20.5 1123 21.8 1257 23.4 1163 21.8 1208 23.5 1232 24.1
Total 1655 25.7 1634 28.0 1485 28.1 1552 30.1 1880 34.9 1909 35.4 2031 38.9 2135 41.3
Source: National Registry of Childhood Tumours
Stiller et al. BMC Cancer (2019) 19:139 Page 7 of 15
almost all unspecified optic nerve gliomas and astrocyto-mas in children are actually pilocytic astrocytomas [22,23], these proportions increase to 65 and 27% respect-ively. Embryonal tumours, predominantly medulloblas-toma, accounted for 17% of all registrations, andependymomas and other gliomas together for 17%. The
remaining 25% consisted of a wide range of other, rarerentities together with a small contribution from tumoursof unspecified type.In addition to providing current estimates of incidence
for the most frequent and long-established types ofchildhood CNS tumour, the data also include reasonable
Fig. 1 Age-standardised rates of childhood astrocytoma in Great Britain by five-year calendar period of diagnosis, 1971–2010
Table 5 Intracranial and intraspinal tumours as second or later primary neoplasms among children aged 0–14 years resident inGreat Britain, 2001–2010. Numbers of cases by age group, with total numbers of cases as first or only primary neoplasm forcomparison
Second neoplasms by age at diagnosis (years) First neoplasms
ICCC-3 0 1–4 5–9 10–14 Total Total
IIIa Ependymoma & choroid plexus tumours 0 0 0 2 2 402
IIIa.1 Ependymoma 0 0 0 2 2 291
IIIb Astrocytoma 0 2 1 13 16 1707
IIIc Embryonal tumours 0 0 2 7 9 717
IIIc.1 Medulloblastoma 0 0 2 0 2 522
IIIc.2 Embryonal CNS tumour NOS 0 0 0 6 6 111
IIIc.4 ATRT 0 0 0 1 1 81
IIId Other gliomas 0 0 1 4 5 397
IIId.1 Oligodendroglioma 0 0 0 4 4 34
IIId.2 Mixed and unspecified gliomas 0 0 1 0 1 340
IIIe Other specified tumours 0 1 1 7 9 577
IIIe.4 Mixed glial-neuronal tumours 0 0 1 2 3 223
IIIe.5 Meningioma 0 1 0 5 6 50
IIIf Unspecified tumours 0 0 1 1 2 196
Xa Germ cell tumours 0 0 1 0 1 170
Total 0 3 7 34 44 4166
Source: National Registry of Childhood Tumours
Stiller et al. BMC Cancer (2019) 19:139 Page 8 of 15
numbers of cases of several tumours that entered ICD-Oat the third edition [16]. The most numerous of these isDNET, a low-grade glioneuronal tumour whose inci-dence increases steadily with age throughout childhood.DNET has similar incidence to ganglioglioma, account-ing for about 40% of mixed glial-neuronal tumours and2% of all CNS tumours.ATRT is the third most frequent embryonal CNS tumour,
after medulloblastoma and embryonal CNS tumour NOS.It predominantly occurs in very early childhood, and in thefirst year of life its incidence is similar to that of medullo-blastoma and embryonal CNS tumour NOS. In the past,most cases would have been diagnosed as medulloblastomaor PNET, which ATRT can resemble morphologically [24].In a UK series of 42 centrally reviewed cases of embryonalCNS tumour NOS, six (14%) were reclassified as ATRT be-cause of INI1-immunonegativity and presence of rhabdoidcells [25].Pilomyxoid astrocytoma was formerly regarded as a
relatively aggressive variant of pilocytic astrocytoma. Inthe present data it accounted for 2.2% of all astrocyto-mas and 4.2% of the total of pilocytic and pilomyxoid as-trocytomas. Incidence was highest in the first year oflife, when it accounted for 14% of all astrocytomas and38% of pilocytic and pilomyxoid tumours. These relative
frequencies are probably underestimates. In a diagnosticreview of all tumours labelled pilocytic or pilomyxoid as-trocytoma over a 14-year period at one neurosurgicalcentre, 9/91 (10%) of all cases and 6/40 (15%) in childrenaged under 15 had a final diagnosis of pilomyxoid astro-cytoma [26].DIA, sometimes formerly known as desmoplastic in-
fantile ganglioglioma, is also classified as a glioneuronaltumour. As its name suggests, it is overwhelmingly atumour of very early life. About 5% of all CNS tumoursin infants were DIA in the present series. All othertumour types that were new to ICD-O with the thirdedition [16] or its first revision [19] were extremely rare,with fewer than 2 registrations per year.The patterns of incidence described here for Britain
are broadly similar to those observed in recent nationalregistration data from France [17], the United States [18]and Australia [27] (Table 6). Total age-standardised inci-dence ranged from 37.5 per million in Australia to 47per million in the United States. Astrocytoma was every-where the most common subgroup, accounting for 36–43% of total incidence, and astrocytoma plus other gli-omas accounted for 48–54%. Embryonal tumoursaccounted for 18–20% of total incidence in all fourcountries.
Table 6 Incidence of intracranial and intraspinal tumours among children aged 0–14 years in Great Britain (NRCT), France [17], theUnited States [18] and Australia [27]. Age-standardised rates (world standard population) per million; rates for United Statescalculated using case numbers and denominators from Table 8 and Appendix B respectively of reference 18
Great Britain France United States Australia
ICCC-3 2001–2010 2000–2008 2006–2010 1997–2006
IIIa Ependymoma & choroid plexus tumours 4.1 3.8 4.3 3.4
IIIa.1 Ependymoma 2.9 2.6 3.0 –
IIIa.2 Choroid plexus tumours 1.2 1.2 1.3 –
IIIb Astrocytoma 16.4 13.7 17.3 16.2
IIIc Embryonal tumours 7.1 7.7 8.4 7.2
IIIc.1 Medulloblastoma 5.1 5.4 – –
IIIc.2 Embryonal CNS tumour NOS 1.1 1.1 – –
IIIc.4 ATRT 0.9 1.1 – –
IIId Other gliomas 3.7 4.9 6.1 4.2
IIId.1 Oligodendroglioma 0.3 1.6 0.5 –
IIIe Other specified tumours 5.3 6.0 8.2 3.9
IIIe.1 Pituitary adenoma 0.5 0.2 1.7 –
IIIe.2 Craniopharyngioma 1.7 1.8 2.0 –
IIIe.3 Pineal parenchymal tumours 0.5 0.3 0.4 –
IIIe.4 Mixed glial-neuronal tumours 2.1 3.2 3.2 –
IIIe.5 Meningioma 0.4 0.6 0.8 –
IIIf Unspecified tumours 1.9 0.6 1.7 0.9
Xa Germ cell tumours 1.5 2.1 1.8 1.8
Total 40.1 38.8 47.0 37.5
Stiller et al. BMC Cancer (2019) 19:139 Page 9 of 15
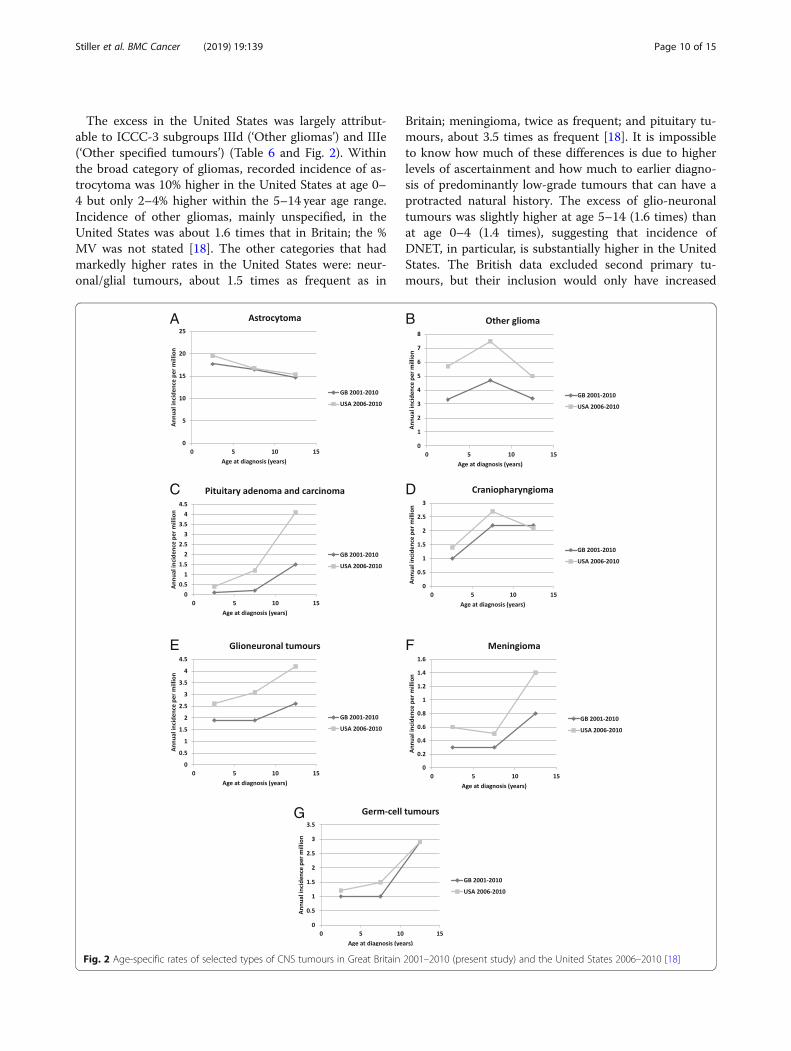
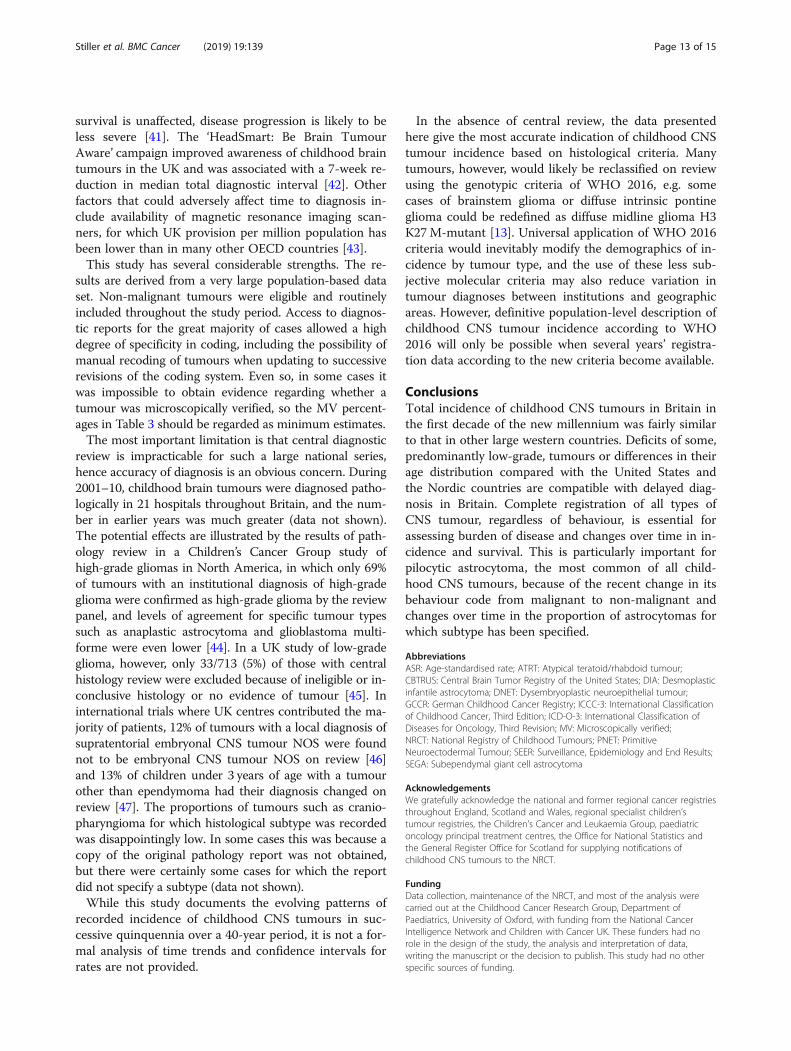
The excess in the United States was largely attribut-able to ICCC-3 subgroups IIId (‘Other gliomas’) and IIIe(‘Other specified tumours’) (Table 6 and Fig. 2). Withinthe broad category of gliomas, recorded incidence of as-trocytoma was 10% higher in the United States at age 0–4 but only 2–4% higher within the 5–14 year age range.Incidence of other gliomas, mainly unspecified, in theUnited States was about 1.6 times that in Britain; the %MV was not stated [18]. The other categories that hadmarkedly higher rates in the United States were: neur-onal/glial tumours, about 1.5 times as frequent as in
Britain; meningioma, twice as frequent; and pituitary tu-mours, about 3.5 times as frequent [18]. It is impossibleto know how much of these differences is due to higherlevels of ascertainment and how much to earlier diagno-sis of predominantly low-grade tumours that can have aprotracted natural history. The excess of glio-neuronaltumours was slightly higher at age 5–14 (1.6 times) thanat age 0–4 (1.4 times), suggesting that incidence ofDNET, in particular, is substantially higher in the UnitedStates. The British data excluded second primary tu-mours, but their inclusion would only have increased
A B
C D
E F
G
Fig. 2 Age-specific rates of selected types of CNS tumours in Great Britain 2001–2010 (present study) and the United States 2006–2010 [18]
Stiller et al. BMC Cancer (2019) 19:139 Page 10 of 15
the total number of registrations for childhood meningi-omas by 12%, a very small part of the difference betweenthe two countries. Proportionally, the largest differencein incidence was for pituitary adenoma, with ASR of 0.5per million in Britain and 1.7 in the United States. Regis-tration of this tumour was certainly incomplete in Brit-ain in the past. Published case series from two majortreatment centres in London contain sufficient informationfor a case-by-case comparison with registry data. One series[28] included 11 children diagnosed in 1982–96, of whom amaximum of 4 (36%) were registered. The other [29, 30] in-cluded 26 children diagnosed in 1983–2008 of whom nomore than 4 (15%) were registered. Thus the maximum esti-mate of the proportion registered from the combined serieswas only 8/37 (22%). The difference between the two coun-tries in incidence of craniopharyngioma was relatively smallbut age at diagnosis was younger in the United States (Fig.2), which may tend to support earlier diagnosis as an explan-ation for some of the other differences.In France, incidence of oligodendroglioma was consid-
erably higher than elsewhere and incidence of astrocy-toma correspondingly lower, perhaps because Frenchpathologists are more influenced by the St Anne classifi-cation in which some diffuse or anaplastic astrocytomasare considered as oligodendrogliomas [31]. Total inci-dence in Australia was somewhat lower than in Britain,with the deficit accounted for by ICCC-3 subgroups IIIaependymoma and choroid plexus tumours, IIIe otherspecified tumours and IIIf unspecified tumours, consist-ent with under-recording of non-malignant tumours, al-though it was stated that these were registered inAustralia [27].In the four Nordic countries of mainland Europe during
1985–2006, when incidence of childhood CNS tumourswas stable over time, the ASR for ICCC-3 group III (i.e.excluding germ-cell tumours) was 42.0 per million [32],compared with 38.6 per million in Britain during 2001–10. The excess in the Nordic countries was less pro-nounced at age 10–14 than in the first decade of life, andwas concentrated in astrocytoma (ASR 17.9 per million)and unspecified tumours (3.2 per million). In Sweden dur-ing 1984–2005, incidence rates were similar to those re-ported for the combined Nordic countries; optic nerve/chiasm gliomas had an ASR of 3.8 per million andaccounted for 17% of astrocytomas, and 67% were diag-nosed before age 5 years [33]. In Britain during 2001–10,optic nerve gliomas had an ASR of 3.2 per million andaccounted for 18% of astrocytomas; 56% were diagnosedat age under 5 years. The lower ASR and lower proportiondiagnosed at young ages indicate that diagnosis of opticnerve gliomas is delayed in Britain compared to Sweden.The German Childhood Cancer Registry (GCCR) regis-
tered 4270 tumours in ICCC-3 Group III and subgroupXa during 1998–2007 [34]. Embryonal tumours accounted
for a higher proportion of registrations (21%) than in Brit-ain (17%). Astrocytomas also had a higher relative fre-quency than in Britain (45% vs 41%), offset by lowerrelative frequencies of other gliomas (7.5% vs 9.5%) andunspecified tumours (1.4% vs 4.7%). More detailed dataon CNS tumours in the GCCR have been published forthe periods 1990–9 and 1980–99 [35]. Compared withBritain, Germany had a lower ratio of medulloblastoma toembryonal CNS tumour NOS which may be related to theexceptionally close relationship between the GCCR andnational clinical trials. The GCCR also had a lower ratioof pineoblastoma to non-malignant pineal parenchymaltumours, for which it is difficult to suggest a plausibleexplanation.Many cancer registries, while generally restricting their
coverage to malignant neoplasms, also systematically col-lect data on non-malignant tumours of certain sites be-cause of their pre-malignant status, or because they arepotentially lethal and the distinction from malignant tu-mours can be difficult and opinion as to malignancy haschanged over time. The former category is exemplified bytumours of the bladder and cervix. CNS and other intra-cranial tumours are the most important example of thelatter. Some important childhood tumours of these sites,including craniopharyngioma, have always been classed asnon-malignant, and will thus have been consistently ex-cluded from presentations of data that are limited to ma-lignant tumours. Many population-based cancer registriesin Europe, and all specialist childhood cancer registries,have traditionally registered all CNS tumours regardless ofbehaviour. By contrast, most state cancer registries in theUnited States, notably those affiliated to the Surveillance,Epidemiology and End Results (SEER) Program of the Na-tional Cancer Institute, did not systematically record orpublish data on non-malignant CNS tumours [18]. How-ever, this gap was filled following the passing of the BenignBrain Tumor Cancer Registries Amendment Act in 2002,with all population-based cancer registries in the UnitedStates ascertaining non-malignant CNS tumours diag-nosed from 2004 onwards [18]. The Central Brain TumorRegistry of the United States (CBTRUS) has aggregated datafrom an increasing number of state cancer registries to pro-vide high-quality, population-based statistical data on primarymalignant and non-malignant brain and CNS tumours; its re-port for 2006–10 assembled data from 50 state cancer regis-tries participating in the SEER Program or the NationalProgram of Cancer Registries, representing over 98% of thenational population [18]. Many major cancer registries inother world regions that formerly collected only malignant tu-mours now also register non-malignant CNS tumours, for ex-ample the Korea Central Cancer Registry as from 2005 [36].While non-registration of tumours that have always
been regarded as non-malignant leads to underestimatesof both incidence and survival for total CNS tumours, the
Stiller et al. BMC Cancer (2019) 19:139 Page 11 of 15
effect is at least reasonably constant over time. Compar-ability and continuity of data over time are disrupted if thedefinition of malignancy changes. The data presented hereillustrate the severity of the problem when pilocytic astro-cytoma, the most frequent of all childhood CNS tumours,undergoes a change of behaviour code. It would not be suf-ficient to report just the tumours that were coded as malig-nant in ICD-O-3 because unspecified astrocytoma hasalways been coded as malignant and it is clear that higherproportions of pilocytic astrocytomas were recorded as un-specified astrocytoma in earlier years. The effect of inclu-sion/exclusion of pilocytic astrocytoma from survivalestimates was illustrated in the EUROCARE-4 study, where5-year survival for children in Europe with astrocytoma diag-nosed in 2000–02 was 63% when tumours specified as pilo-cytic were excluded and 78% when they were included [37].In EUROCARE-5, age-standardised 5-year survival for chil-dren with malignant astrocytoma defined according toICD-O-3, so excluding pilocytic astrocytoma, was 64.3% in1999–2001, 54.5% in 2002–04 and 59.1% in 2005–07 [38].The decrease in survival after 2002 was probably an artefactof larger numbers of pilocytic astrocytomas being coded assuch, and thus excluded, and correspondingly fewer beingcoded as astrocytoma NOS. Also in EUROCARE-5, 5-yearsurvival for all children with astrocytoma diagnosed in2000–07 was 80% [39]. For the more numerous specific sub-types, survival ranged from 95 to 100% for pilocytic astrocy-toma, optic nerve glioma and SEGA (all WHO Grade I) and75–85% for fibrillary astrocytoma and pleomorphicxanthoastrocytoma (both Grade II) to 21% for anaplastic as-trocytoma (Grade III) and 14% for glioblastoma (Grade IV).For astrocytoma NOS, which accounted for 16% of all astro-cytomas and 35% of those with malignant behaviour code,5-year survival was 74% [39]. This group would have con-sisted of unknown proportions of diffuse astrocytoma (GradeII) and of tumours of unspecified subtype whose grade wasnot reported.The present study concerns childhood tumours but it is
equally important that non-malignant tumours diagnosedat older ages are registered. In England during 1995–2003,when pilocytic astrocytoma was still coded as malignant,17% of CNS tumours diagnosed at age 0–14 were of un-certain, borderline or benign behaviour, compared with41% at age 15–24 and 42% at age 25–84 [22]. Meningi-omas and pituitary tumours, the great majority of whichare non-malignant, accounted for 17 and 9% respectivelyof CNS tumours at age 25–84 during that period [22]. Inthe United States in 2006–10, non-malignant tumoursaccounted for about 30% of total age-adjusted CNStumour incidence in children aged 0–14 years and twothirds of age-adjusted incidence in adults above 20 yearsof age [18].In common with many other countries, the British
registration data for childhood CNS tumours showed an
increase in recorded incidence over time for most of thestudy period. While there have been major shifts in as-signment of specific tumour types to malignant ornon-malignant categories over the years, no entities haveswitched from neoplastic to non-neoplastic or vice versain the ICD. Therefore, changes in recorded incidence ofCNS tumours overall or of any subtype must be due tochanges in underlying risk, changes in the proportionactually diagnosed before the 15th birthday, or changesin completeness of ascertainment of diagnosed tumoursby the registration system. A study of time trends inregistration rates for all types of childhood cancer inBritain between 1966 and 2005 found that changes in in-cidence of CNS tumours considered as a single groupcorrelated well with contemporaneous changes in diag-nostic and registration practice [40]. It did not, however,seek to explain changes over time in rates for specifictumour types or in the ratio of rates for one type to an-other. Some tumour types were registered hardly ever, ifat all, in the earliest years, and only in appreciable num-bers later in the study period. This most obviously ap-plies to embryonal CNS tumour NOS (from the 1980sonwards) and ATRT (from the mid-1990s). Registrationsfor mixed glial-neuronal tumours were also extremelyrare in the 1970s but the numbers increased steadilythrough the following decades as ganglioglioma wasmore frequently registered in the 1980s, followed byDIA and DNET from the mid-1990s, the latter probablyresulting from increasing surgery for epilepsy. The in-crease in germ-cell tumours from the 1980s was partlyoffset by a decline in pineal parenchymal tumours, per-haps because some cases of germinoma would have beenregistered as pinealoma in the early years. Pituitary ad-enoma is known to have been under-registered, as dis-cussed above. The relative contribution of earlierdiagnosis and improved ascertainment to the steep in-crease in recorded incidence is unknown. Even in themost recent years, incidence was still markedly lowerthan in the United States. The increase in choroid plexustumours is perhaps hardest to account for. Choroidplexus papilloma and carcinoma were both well-definedand described before the 1970s, and there was no cleartrend over time in the ratio of papilloma to carcinoma.Within the broad group of astrocytomas, optic nerve
tumours increased in incidence more steeply than thoseof other sites (Table 4). Moreover, the proportions ofoptic nerve gliomas that were diagnosed before the ageof 5 years were 40% in 1971–80, 62% in 1981–90, 53% in1991–2000 and 56% in 2001–10, consistent with a ten-dency to earlier diagnosis since about 1980. Neverthe-less, as discussed above, the data presented here arecompatible with diagnosis of lower grade CNS tumoursoccurring later in Britain than in some other countries.Earlier diagnosis is important because, even if overall
Stiller et al. BMC Cancer (2019) 19:139 Page 12 of 15
survival is unaffected, disease progression is likely to beless severe [41]. The ‘HeadSmart: Be Brain TumourAware’ campaign improved awareness of childhood braintumours in the UK and was associated with a 7-week re-duction in median total diagnostic interval [42]. Otherfactors that could adversely affect time to diagnosis in-clude availability of magnetic resonance imaging scan-ners, for which UK provision per million population hasbeen lower than in many other OECD countries [43].This study has several considerable strengths. The re-
sults are derived from a very large population-based dataset. Non-malignant tumours were eligible and routinelyincluded throughout the study period. Access to diagnos-tic reports for the great majority of cases allowed a highdegree of specificity in coding, including the possibility ofmanual recoding of tumours when updating to successiverevisions of the coding system. Even so, in some cases itwas impossible to obtain evidence regarding whether atumour was microscopically verified, so the MV percent-ages in Table 3 should be regarded as minimum estimates.The most important limitation is that central diagnostic
review is impracticable for such a large national series,hence accuracy of diagnosis is an obvious concern. During2001–10, childhood brain tumours were diagnosed patho-logically in 21 hospitals throughout Britain, and the num-ber in earlier years was much greater (data not shown).The potential effects are illustrated by the results of path-ology review in a Children’s Cancer Group study ofhigh-grade gliomas in North America, in which only 69%of tumours with an institutional diagnosis of high-gradeglioma were confirmed as high-grade glioma by the reviewpanel, and levels of agreement for specific tumour typessuch as anaplastic astrocytoma and glioblastoma multi-forme were even lower [44]. In a UK study of low-gradeglioma, however, only 33/713 (5%) of those with centralhistology review were excluded because of ineligible or in-conclusive histology or no evidence of tumour [45]. Ininternational trials where UK centres contributed the ma-jority of patients, 12% of tumours with a local diagnosis ofsupratentorial embryonal CNS tumour NOS were foundnot to be embryonal CNS tumour NOS on review [46]and 13% of children under 3 years of age with a tumourother than ependymoma had their diagnosis changed onreview [47]. The proportions of tumours such as cranio-pharyngioma for which histological subtype was recordedwas disappointingly low. In some cases this was because acopy of the original pathology report was not obtained,but there were certainly some cases for which the reportdid not specify a subtype (data not shown).While this study documents the evolving patterns of
recorded incidence of childhood CNS tumours in suc-cessive quinquennia over a 40-year period, it is not a for-mal analysis of time trends and confidence intervals forrates are not provided.
In the absence of central review, the data presentedhere give the most accurate indication of childhood CNStumour incidence based on histological criteria. Manytumours, however, would likely be reclassified on reviewusing the genotypic criteria of WHO 2016, e.g. somecases of brainstem glioma or diffuse intrinsic pontineglioma could be redefined as diffuse midline glioma H3K27M-mutant [13]. Universal application of WHO 2016criteria would inevitably modify the demographics of in-cidence by tumour type, and the use of these less sub-jective molecular criteria may also reduce variation intumour diagnoses between institutions and geographicareas. However, definitive population-level description ofchildhood CNS tumour incidence according to WHO2016 will only be possible when several years’ registra-tion data according to the new criteria become available.
ConclusionsTotal incidence of childhood CNS tumours in Britain inthe first decade of the new millennium was fairly similarto that in other large western countries. Deficits of some,predominantly low-grade, tumours or differences in theirage distribution compared with the United States andthe Nordic countries are compatible with delayed diag-nosis in Britain. Complete registration of all types ofCNS tumour, regardless of behaviour, is essential forassessing burden of disease and changes over time in in-cidence and survival. This is particularly important forpilocytic astrocytoma, the most common of all child-hood CNS tumours, because of the recent change in itsbehaviour code from malignant to non-malignant andchanges over time in the proportion of astrocytomas forwhich subtype has been specified.
AbbreviationsASR: Age-standardised rate; ATRT: Atypical teratoid/rhabdoid tumour;CBTRUS: Central Brain Tumor Registry of the United States; DIA: Desmoplasticinfantile astrocytoma; DNET: Dysembryoplastic neuroepithelial tumour;GCCR: German Childhood Cancer Registry; ICCC-3: International Classificationof Childhood Cancer, Third Edition; ICD-O-3: International Classification ofDiseases for Oncology, Third Revision; MV: Microscopically verified;NRCT: National Registry of Childhood Tumours; PNET: PrimitiveNeuroectodermal Tumour; SEER: Surveillance, Epidemiology and End Results;SEGA: Subependymal giant cell astrocytoma
AcknowledgementsWe gratefully acknowledge the national and former regional cancer registriesthroughout England, Scotland and Wales, regional specialist children’stumour registries, the Children’s Cancer and Leukaemia Group, paediatriconcology principal treatment centres, the Office for National Statistics andthe General Register Office for Scotland for supplying notifications ofchildhood CNS tumours to the NRCT.
FundingData collection, maintenance of the NRCT, and most of the analysis werecarried out at the Childhood Cancer Research Group, Department ofPaediatrics, University of Oxford, with funding from the National CancerIntelligence Network and Children with Cancer UK. These funders had norole in the design of the study, the analysis and interpretation of data,writing the manuscript or the decision to publish. This study had no otherspecific sources of funding.
Stiller et al. BMC Cancer (2019) 19:139 Page 13 of 15
Availability of data and materialsThe individual level data used for this study are not publicly availablebecause of the necessity to protect the confidentiality of patients’information. The Childhood Cancer Research Group closed in 2014. A copyof the NRCT database was deposited in the Richard Doll Centenary Archive,University of Oxford, https://www.ndph.ox.ac.uk/about/richard-doll-centenary-archive.
Authors’ contributionsCAS conceived and designed the study, and drafted the manuscript. AMBand CAS collected the data. CAS, AMB, AC, TK and PC contributed tointerpretation of results and revision of the manuscript for importantintellectual content, and read and approved the final version.
Ethics approval and consent to participateUse of NRCT data reported here was approved by NRES Committee SouthCentral - Oxford B (ref. 12/SC/0532). The NRCT was a member of the UKAssociation of Cancer Registries and was thereby permitted to processidentifiable cancer registration data without patient consent according toexemption granted under the terms of Section 251 of the NHS Act 2006.
Consent for publicationNot applicable.
Competing interestsThe authors declare that they have no competing interests.
Publisher’s NoteSpringer Nature remains neutral with regard to jurisdictional claims inpublished maps and institutional affiliations.
Author details1National Cancer Registration and Analysis Service, Public Health England,4150 Chancellor Court, Oxford Business Park South, Oxford OX4 2GX, UK.2Histopathology, Leeds Teaching Hospitals NHS Trust, Leeds, UK. 3Faculty ofHealth & Social Sciences, University of Bournemouth, Bournemouth, UK.4Department of Neurosurgery, Leeds Teaching Hospitals NHS Trust, LeedsGeneral Infirmary, Leeds, UK.
Received: 18 September 2017 Accepted: 1 February 2019
References1. Parkin DM, Kramárová E, Draper GJ, Masuyer E, Michaelis J, Neglia J, et al.
International incidence of childhood Cancer, volume 2. In: IARC scientificpublications, No 144. Lyon: International Agency for Research on Cancer; 1998.
2. Peris-Bonet R, Martínez-García C, Lacour B, Petrovich S, Giner-Ripoll B,Navajas A, et al. Childhood central nervous system tumours – incidence andsurvival in Europe (1978–1997): report from automated childhood Cancerinformation system project. Eur J Cancer. 2006;42:2064–80.
3. Draper GJ, Birch JM, Bithell JF, Kinnier Wilson LM, Leck I, Marsden HB, MorrisJones PH, Stiller CA, Swindell R. Childhood Cancer in Britain: incidence,mortality and survival. OPCS studies on medical and population subjects no37. London: HMSO; 1982.
4. Birch JM, Marsden HB. A classification scheme for childhood cancer. Int JCancer. 1987;40:620–4.
5. Kramárová E, Stiller CA. The international classification of childhood cancer.Int J Cancer. 1996;68:759–65.
6. Steliarova-Foucher E, Stiller C, Lacour B, Kaatsch P. International classificationof childhood Cancer, third edition. Cancer. 2005;103:1457–67.
7. Doll R, Payne P, Waterhouse JAH, editors. Cancer incidence in fivecontinents, volume I. Geneva: union Internationale Contre le Cancer, 1966.
8. Forman D, Bray F, Brewster DH, Gombe Mbalawa C, Kohler B, Piñeros M,Steliarova-Foucher E, Swaminathan R, Ferlay J. Cancer incidence in fivecontinents, volume X. In: IARC scientific publications, no. 164. Lyon:International Agency for Research on Cancer; 2014.
9. Parkin DM, Stiller CA, Draper GJ, Bieber CA, Terracini B, Young JL.International incidence of childhood Cancer. In: IARC scientific publications,no. 87. Lyon: International Agency for Research on Cancer; 1988.
10. Kleihues P, Burger PC, Scheithauer BW. The new WHO classification of braintumours. Brain Pathol. 1993;3:255–68.
11. Kleihues P, Louis DN, Scheithauer BW, Rorke LB, Reifenberger G, Burger PC,Cavenee WK. The WHO classification of tumors of the nervous system. JNeuropathol Exp Neurol. 2002;61:215–25.
12. Louis DN, Ohgaki H, Wiestler OD, Cavenee WK, Burger PC, Jouvet A,Scheithauer BW, Kleihues P. The WHO classification of tumours of thecentral nervous system. Acta Neuropathol. 2007;114:97–109.
13. Louis DN, Perry A, Reifenberger G, von Deimling A, Figarella-Branger D,Cavenee WK, et al. The 2016 World Health Organization classification oftumors of the central nervous system: a summary. Acta Neuropathol. 2016;131:803–20.
14. International Classification of Diseases for Oncology. Geneva: World HealthOrganization, 1976.
15. Percy C, Van Holten V, Muir C, editors. International classification of diseasesfor oncology, Second Edition. Geneva: World Health Organization, 1990.
16. Fritz A, Percy C, Jack A, Shanmugaratnam K, Sobin L, Parkin DM, Whelan S,editors. International classification of diseases for oncology, Third Edition.Geneva: World Health Organization; 2000.
17. Desandes E, Guissou S, Chastagner P, Lacour B. Incidence and survival ofchildren with central nervous system primitive tumors in the French NationalRegistry of childhood solid tumors. Neuro-Oncology. 2014;16:975–83.
18. Ostrom QT, Gittleman H, Farah P, Ondracek A, Chen Y, Wolinsky Y, StroupNE, Kruchko C, Barnholtz-Sloan JS. CBTRUS statistical report: primary brainand central nervous system tumors diagnosed in the United States in 2006-2010. Neuro-Oncology. 2013;15(suppl 2):1–56.
19. Fritz A, Percy C, Jack A, Shanmugaratnam K, Sobin L, Parkin DM, Whelan S,editors. International classification of diseases for oncology, third edition,first revision. Geneva: World Health Organization; 2013.
20. Mott MG, Mann JR, Stiller CA. The United Kingdom Children's Cancer studygroup - the first 20 years of growth and development. Eur J Cancer. 1997;33:1448–52.
21. Stiller C, editor. Childhood Cancer in Britain: incidence, survival, mortality.Oxford: Oxford University Press; 2007.
22. Arora RS, Alston RD, Eden TO, Estlin EJ, Moran A, Birch JM. Age-incidencepatterns of primary CNS tumors in children, adolescents, and adults inEngland. Neuro-Oncology. 2009;11:403–13.
23. Jahraus CD, Tarbell NJ. Optic pathway gliomas. Pediatr Blood Cancer. 2006;46:586–96.
24. Burger PC, Yu IT, Tihan T, Friedman HS, Strother DR, Kepner JL, Duffner PK,Kun LE, Perlman EJ. Atypical teratoid/rhabdoid tumor of the central nervoussystem: a highly malignant tumor of infancy and childhood frequentlymistaken for medulloblastoma: a pediatric oncology group study. Am JSurg Pathol. 1998;22:1083–92.
25. Miller S, Ward JH, Rogers HA, Lowe J, Grundy RG. Loss of INI1 proteinexpression defines a subgroup of aggressive central nervous systemprimitive neuroectodermal tumors. Brain Pathol. 2013;23:19–27.
26. Bhargava D, Sinha P, Chumas P, Al-Tamimi Y, Shivane A, Chakrabarty A,et al. Occurrence and distribution of pilomyxoid astrocytoma. Br JNeurosurg. 2013;27:413–8.
27. Baade PD, Youlden DR, Valery PC, Hassall T, Ward L, Green AC, Aitken JF.Trends in incidence of childhood cancer in Australia, 1983-2006. Br J Cancer.2010;102:620–6.
28. Massoud AF, Powell M, Williams RA, Hindmarsh PC, Brook CGD.Transsphenoidal surgery for pituitary tumours. Arch Dis Child. 1997;76:398–404.
29. Storr HL, Afshar F, Matson M, Sabin I, Davies KM, Evanson J, et al. Factorsinfluencing cure by transsphenoidal selective adenomectomy in paediatricCushing's disease. Eur J Endocrinol. 2005;152:825–33.
30. Dias RP, Kumaran A, Chan LF, Martin L, Afshar F, Matson M, et al. Diagnosis,management and therapeutic outcome in prepubertal Cushing's disease.Eur J Endocrinol. 2010;162:603–9.
31. Bauchet L, Rigau V, Mathieu-Daudé H, Fabbro-Peray P, Palenzuela G,Figarella-Branger D, et al. Clinical epidemiology for childhood centralnervous system tumors. J Neuro-Oncol. 2009;92:87–98.
32. Schmidt LS, Schmiegelow K, Lahteenmaki P, Träger C, Stokland T, Grell K,et al. Incidence of childhood central nervous system tumors in the Nordiccountries. Pediatr Blood Cancer. 2011;56:65–9.
33. Lannering B, Sandström PE, Holm S, Lundgren J, Pfeifer S, Samuelsson U,Strömberg B, Gustafsson G. Swedish childhood CNS tumor working group(VCTB). Classification, incidence and survival analyses of children with CNStumours diagnosed in Sweden 1984-2005. Acta Paediatr. 2009;98:1620–7.
34. Kaatsch P. (2010) epidemiology of childhood cancer. Cancer Treat Rev. 2010;36:277–85.
Stiller et al. BMC Cancer (2019) 19:139 Page 14 of 15
35. Kaatsch P, Rickert CH, Kühl J, Schüz J, Michaelis J. Population-based epidemiologicdata on brain tumors in German children. Cancer. 2001;92:3155–64.
36. Dho YS, Jung KW, Ha J, Seo Y, Park CK, Won YJ, Yoo H. Updated nationwideepidemiology of primary brain tumors in Republic of Korea, 2013. BrainTumor Res Treat. 2017;5:16–23.
37. Gatta G, Zigon G, Capocaccia R, Coebergh JW, Desandes E, Kaatsch P, et al.Survival of European children and young adults diagnosed with cancer1995-2002. Eur J Cancer. 2009;45:992–1005.
38. Gatta G, Botta L, Rossi S, Aareleid T, Bielska-Lasota M, Clavel J, et al.Childhood cancer survival in Europe at the beginning of the newmillennium. Lancet Oncol. 2014;15:35–47.
39. Gatta G, Peris-Bonet R, Visser O, Stiller C, Marcos-Gragera R, Sánchez MJ,et al. Geographical variability in survival of European children with centralnervous system tumours. Eur J Cancer. 2017;82:137–48.
40. Kroll ME, Carpenter LM, Murphy MFG, Stiller CA. Effects of changes indiagnosis and registration on time trends in recorded childhood cancerincidence in Great Britain. Br J Cancer. 2012;107:1159–62.
41. Arnautovic A, Billups C, Gajjar A, Boop F, Qaddoumi I. Delayed diagnosis ofchildhood low-grade glioma: causes, consequences, and potential solutions.Childs Nerv Syst. 2015;31:1067–77.
42. HeadSmart. Be brain tumour aware. A new clinical guideline from the RoyalCollege of Paediatrics and Child Health with a national awareness campaignaccelerates brain tumor diagnosis in UK children - "HeadSmart: be braintumour aware". Neuro-Oncology. 2016;18:445–54.
43. Organisation for Economic Co-operation and Development. OECD Data:Magnetic resonance imaging (MRI) units. https://data.oecd.org/healtheqt/magnetic-resonance-imaging-mri-units.htm. Accessed 16 Nov 2018.
44. Pollack IF, Boyett JM, Yates AJ, et al. (2003) the influence of central reviewon outcome associations in childhood malignant gliomas: results from theCCG-945 experience. Neuro-Oncology. 2003;5:197–207.
45. Stokland T, Liu J-F, Ironside JW, Ellison DW, Taylor R, Robinson KJ, Picton SV,Walker DA. A multivariate analysis of factors determining tumor progressionin childhood low-grade glioma: a population-based cohort study (CCLGCNS9702). Neuro-Oncology. 2010;12:1257–68.
46. Pizer BL, Weston CL, Robinson KJ, Ellison DW, Ironside J, Saran F, et al.Analysis of patients with supratentorial primitive neuro-ectodermal tumoursentered into the SIOP/UKCCSG PNET 3 study. Eur J Cancer. 2006;42:1120–8.
47. Grundy RG, Wilne SH, Robinson KJ, Ironside JW, Cox T, Chong WK, et al.Primary postoperative chemotherapy without radiotherapy for treatment ofbrain tumours other than ependymoma in children under 3 years: results ofthe first UKCCSG/SIOP CNS 9204 trial. Eur J Cancer. 2010;46:120–33.
Stiller et al. BMC Cancer (2019) 19:139 Page 15 of 15
![CNS tumors1].pdf · 2019. 3. 5. · Involvement of the CNS by Systemic Cancer •Brain metastases occur in 25-35% of all cancers. –The peak incidence of brain metastases is bimodal](https://img.pdfslide.us/doc/110x75/610265c1ff275875a623b277/cns-tumors-1pdf-2019-3-5-involvement-of-the-cns-by-systemic-cancer-abrain.jpg)