Embed Size (px)
Citation preview
1
In Vivo Fluorescence Imaging of E-Selectin:
Quantitative Detection of Endothelial Activation in
Arthritis
A thesis submitted for the degree of PhD
by
Luke Gompels
August 2010
Kennedy Institute of Rheumatology
Faculty of Medicine
Imperial College
SUPERVISORS
Dr Ewa Paleolog
Prof. Dorian Haskard
2
Abstract
Rheumatoid arthritis (RA) is a chronic progressive systemic inflammatory disease,
characterized by synovial inflammation and localized destruction of cartilage and
bone. Heterogeneity in the clinical presentation of RA and uncertainty about which
patients will respond to treatment makes diagnosis and management challenging.
Fluorescent imaging in the near infrared (NIR) spectrum significantly decreases tissue
autofluorescence offering unique potential to detect specific molecular targets in vivo.
E-selectin or endothelial adhesion molecule-1 (ELAM-1), a 115kDa glycoprotein
induced on endothelial cells in response to pro-inflammatory cytokines involved in
RA, such as interleukin (IL)-1 and tumour necrosis factor (TNF. E-selectin has
been well validated as a potential biomarker of disease activity.
My study aimed to investigate whether E-selectin targeted optical imaging in vivo
could be developed as a sensitive, specific and quantifiable preclinical molecular
imaging technique, and also whether this approach could be used to delineate the
molecular effects of novel therapies. I utilised anti-E-selectin antibody labelled with
NIR fluorophore in a mouse model of paw swelling induced by intra-plantar injection
of TNFand in acute collagen-induced arthritis (CIA) in DBA/1 mice, a widely used
model of RA. E-selectin generated signal, localised to points of maximal clinical
inflammation in the inflamed mouse paw in both models with significant differences
to control antibody. Binding of anti-E-selectin antibody was also demonstrated by
immunohistochemistry in both models. The ability of E-selectin targeted imaging to
detect sub-clinical endothelial activation was also investigated, demonstrating that E-
selectin may be an excellent way of determining subclinical vascular activation in
CIA. Finally the effect of novel targeted therapy – RB200 which blocks epidermal
growth factor (EGF) signalling was investigated. This demonstrated that E-selectin
targeted signal could be absolutely abrogated to a level seen in unimmunised healthy
control animals, following combination treatment with RB200 and the TNF inhibitor
etanercept.
E-selectin targeted optical imaging is a viable in vivo imaging technique that can also
be applied to quantify disease and investigate the effects of novel molecular therapies.
It holds significant promise as a molecular imaging technique for future translation
into the clinic for patients with rheumatoid arthritis and other inflammatory diseases.
3
Table of Contents
Abstract ................................................................................................................... 2
List of Figures ............................................................................................................ 8
List of Tables ............................................................................................................ 11
List of Appendices ................................................................................................... 11
List of Abbreviations ................................................................................................ 12
Statement of Originality ........................................................................................... 14
Acknowledgements .................................................................................................. 15
CHAPTER 1 ........................................................................................... 16
1 Introduction ....................................................................................................17
1.1 Rheumatoid Arthritis ..............................................................................17
1.1.1 RA: Chronic Inflammation of The Synovium ......................................... 20
1.1.1.1 Histopathological changes to synovial architecture in RA ............... 20
1.1.1.2 Cellular and soluble mediators of joint damage in RA ..................... 21
1.1.2 Targeted Therapeutic Approaches for the Treatment of RA ................... 22
1.2 The Vascular Endothelium: An Interface for the Interaction between
Cytokines and Cell Surface Receptors....................................................24
1.2.1 The Adhesion Cascade: A Complex Multistep Process .......................... 24
1.2.2 E-Selectin: A Pivotal Endothelial Cell Adhesion Molecule for
Leukocytes .............................................................................................. 27
1.2.2.1 E-selectin expression during the inflammatory response ................. 28
1.2.2.2 E-selectin imaging in animal models of inflammatory disease ........ 29
1.2.2.3 E-selectin expression in RA .............................................................. 30
1.2.3 Angiogenesis is Central to Promoting and Maintaining RA ................... 31
1.2.4 Increased Vessel Permeability in RA: Cause or Consequence? .............. 37
1.3 In Vivo Molecular Imaging Approaches in Arthritis ..............................40
1.3.1 E-Selectin: An Excellent Target for Molecular Imaging in RA .............. 42
1.3.2 In Vivo Fluorescence Imaging And Optical Imaging ............................. 43
1.3.2.1 Principles of fluorescent imaging ..................................................... 43
1.3.2.2 Potential molecular approaches for in vivo fluorescence imaging ... 48
1.3.2.2.1 Targeted approaches for dye deposition ....................................... 48
1.3.2.2.2 Protease activity probes ................................................................ 49
1.3.2.2.3 Bioluminescence .......................................................................... 50
1.3.3 Fluorescent Imaging in Arthritis ............................................................. 51
4
1.3.3.1.1 Invasive In Vivo Optical Imaging ................................................. 51
1.3.3.1.2 Non- targeted imaging in animal models of arthritis ................... 51
1.3.3.1.3 Targeting of specific molecular changes in arthritis .................... 52
1.3.3.2 Activity-Based Probes in Arthritis .................................................... 53
1.4 Animal Models of RA and Inflammation ...............................................55
1.4.1 Collagen Induced Arthritis: A Well Validated Pre Clinical Model of RA
................................................................................................................. 55
1.4.2 Acute Models of Inflammation ............................................................... 57
1.5 Hypothesis and Objectives ......................................................................59
CHAPTER 2 ........................................................................................... 60
2 Materials and Methods ..................................................................................61
2.1 Chemical Components ............................................................................61
2.2 Cell Lines ................................................................................................61
2.3 Fluorescence Reflectance Imaging Device .............................................61
2.4 Production of Anti-E-Selectin and Anti-DNP Isotype Control Antibodies
................................................................................................................62
2.4.1 Cell Culture for Anti-E-Selectin and Anti-DNP Antibodies ................... 62
2.4.2 Affinity Purification of Cultured Antibodies .......................................... 63
2.4.3 Measurement of Antibody Concentration Following Production and
Purification to Ensure Accurate Quantification for Labelling and Imaging
................................................................................................................. 64
2.4.4 Determination of Antibody Purity by SDS PAGE Prior to Labelling ..... 65
2.4.5 Fluorescent Labelling of Anti E-Selectin and Control Antibodies.......... 65
2.4.5.1 Techniques of fluorescent labelling .................................................. 66
2.4.5.2 Measurement of the fluorescent labelling reaction ........................... 67
2.4.5.2.1 Quantification of fluorophore labelling ........................................ 67
2.4.5.2.2 Procedure for determining the dye:protein ratio .......................... 68
2.4.6 Measurement of The Immunoreactivity of DNP and E-Selectin
Antibodies Pre and Post Labelling by ELISA ......................................... 70
2.4.7 Endothelial PY4.1 Cell Culture ............................................................... 71
2.4.7.1 Measurement of reactivity for anti-E-selectin and anti-DNP
antibodies to endothelial cells before and after stimulation with
TNF ................................................................................................ 72
2.5 Animal Models of Inflammation for In Vivo Imaging Experiments .......73
2.5.1 Laboratory Animal Care and Regulatory Approval ................................ 73
5
2.5.2 Collagen Induced Arthritis ...................................................................... 74
2.5.2.1 Purification of type II collagen ......................................................... 74
2.5.2.2 Induction of arthritis ......................................................................... 75
2.5.2.3 Evaluation of arthritis ....................................................................... 75
2.5.2.4 Protocols for determining effect of therapy in CIA .......................... 76
2.5.2.4.1 Effect of etanercept in CIA .......................................................... 76
2.5.2.4.2 Effect of RB200, an EGF receptor construct, in CIA .................. 76
2.5.3 TNF Induced Paw Oedema ................................................................... 78
2.5.3.1 Protocols for determining effect of therapy in TNF induced paw
oedema .............................................................................................. 78
2.5.3.1.1 Effect of etanercept in TNF induced paw inflammation ........... 78
2.6 Histopathological Evaluation of Arthritis ...............................................78
2.6.1 Haematoxylin and Eosin (H&E) Specimen Preparation ......................... 78
2.6.2 Immunohistochemistry for Vascular Markers of Inflammation .............. 80
2.6.3 Detection Of In Vivo Injected E-Selectin Antibody by
Immunohistochemistry In Ex Vivo Specimens ........................................ 81
2.7 In Vivo Optical Imaging ..........................................................................81
2.7.1 Determination of Optimum Excitation/Emission Wavelength of
Fluorescent Dye for Excitation for In Vivo Imaging by Measurement of
Autofluorescence ..................................................................................... 83
2.8 Statistical Analysis ..................................................................................83
CHAPTER 3 ........................................................................................... 88
3 Antibody Characterisation and Labelling ...................................................89
3.1 Introduction .............................................................................................89
3.2 Objectives ...............................................................................................91
3.3 Results .....................................................................................................92
3.3.1 Determining Purity of Antibody By SDS PAGE Prior to Labelling ....... 92
3.3.2 Imaging in the Near Infrared Spectrum Leads to Reduced Levels of
Autofluorescence in A Live Mouse ......................................................... 95
3.3.3 Dye/Protein Binding: Ratio of Absorbance At 280 And 750nm ............. 97
3.3.4 Characterisation of Anti-E-Selectin Antibody Binding ........................ 100
3.3.4.1 ELISA following fluorophore conjugation ..................................... 100
3.3.4.2 Binding to mouse PY4.1 endothelial cell line following TNF
stimulation ...................................................................................... 101
6
3.3.5 Visualisation and quantification of Fluorescent Signal Using Fluorescent
Reflectance Imaging .............................................................................. 105
3.3.6 Mapping Fluorescence Levels in Paw Inflammation: Using A ROI Tool
to Accurately Quantify Signal ............................................................... 108
3.4 Discussion .............................................................................................110
CHAPTER 4 ......................................................................................... 112
4 Results: Establishing An Acute Model Of Inflammation For In Vivo
Fluorescence Imaging ..................................................................................113
4.1 Introduction ...........................................................................................113
4.2 Objectives .............................................................................................115
4.3 Results ...................................................................................................116
4.3.1 The TNFInduced Model of Acute Paw Inflammation ...................... 116
4.3.1.1 Measurement of acute paw swelling induced by TNF: a dose
dependent transient increase in paw thickness................................ 117
4.3.2 Histological Changes in TNF-Induced Paw Inflammation Model ..... 120
4.3.3 E-Selectin Targeted Fluorescence Imaging In Vivo: Quantifying
Endothelial Activation In Vivo In TNF-Induced Paw Oedema .......... 122
4.3.4 Reduction in Injected Antibody Dose Increases Signal Specificity ...... 129
4.3.5 E-Selectin Targeted Signal Can Be Abrogated By TNF Receptor
Blockade ................................................................................................ 135
4.4 Discussion .............................................................................................137
CHAPTER 5 ......................................................................................... 141
5 Results: Quantitative E-Selectin Targeted Fluorescent Imaging of CIA142
5.1 Introduction ...........................................................................................142
5.1.1 Collagen Induced Arthritis .................................................................... 142
5.1.2 RB200: A Novel EGFR Antagonist ...................................................... 144
5.2 Objectives .............................................................................................147
5.3 Results ...................................................................................................148
5.3.1 Collagen Induced Arthritis .................................................................... 148
5.3.1.1 CIA in DBA/1 mice – clinical course of the disease ...................... 148
5.3.1.2 Histological analysis of CIA ........................................................... 151
5.3.1.3 Immunohistochemistry to assess E-selectin expression and synovial
vascularisation in CIA .................................................................... 153
7
5.3.2 E-Selectin Targeted Fluorescence Imaging In Vivo: Quantifying
Endothelial Activation In Collagen Induced Arthritis........................... 161
5.3.2.1 E-selectin targeted signal detects subclinical arthritis .................... 170
5.3.2.2 Etanercept abrogates fluorescent signal in CIA .............................. 173
5.3.3 Determining The Effect of The Human HER-1:HER-3 Epidermal Growth
Factor Receptor Bispecific Ligand Trap on In Vivo E-selectin Targeted
Fluorescent Imaging in CIA .................................................................. 174
5.4 Discussion .............................................................................................182
CHAPTER 6 ......................................................................................... 189
6 General Discussion .......................................................................................190
6.1 Future Work ..........................................................................................197
6.1.1 Short Term Objectives .......................................................................... 197
6.1.1.1 Methods of intensifying E-selectin targeted signal ......................... 197
6.1.1.1.1 Investigation of altering fluorophore ratios to target moiety:
increasing specificity of E-selectin targeted signal .................... 198
6.1.1.1.2 Labeling to minimal E-selectin antibody fragment .................... 199
6.1.1.1.3 Labelling to other smaller targeted molecules – aptamer based
technology .................................................................................. 200
6.1.1.1.4 Indocyanine green (ICG) as an optical imaging agent ............... 201
6.1.1.1.5 Use of alternative imaging hardware.......................................... 202
6.1.1.2 Alternative animal models .............................................................. 202
6.1.2 Long Term Future Work and Clinical Perspectives .............................. 203
6.2 Conclusion ............................................................................................205
REFERENCES .................................................................................... 206
PUBLICATIONS AND PRIZES ........................................................ 228
8
List of Figures
Figure 1-1 Progressive joint destruction in Rheumatoid Arthritis...................19
Figure 1-2 Comparison of normal and arthritic joint architecture in rheumatoid
arthritis ...........................................................................................21
Figure 1-3 Key steps in the adhesion cascade .................................................26
Figure 1-4 Comparison of 99m
Tc-1.2B6-Fab and 99m
Tc-HDP radiolabelled
imaging in RA ................................................................................43
Figure 1-5 Absorption of light versus wavelength: tissue autofluorescence ...46
Figure 1-6 Principle of activity based probe showing quenched unquenched
state ................................................................................................49
Figure 2-1 Fluorescence Reflectance Imaging: Kodak In Vivo Imaging System
FX Pro ............................................................................................62
Figure 2-2 Cell viability and yield of anti-DNP antibody ...............................63
Figure 2-3 Phase contrast images of the PY4.1 endothelial cell line ..............72
Figure 2-4 Representative clinical scores of mice with CIA ...........................76
Figure 2-5 Decalcification of mouse paws ......................................................80
Figure 2-6 Anaesthetic device for small animal imaging ................................82
Figure 3-1 Purity of anti-E-selectin and anti-DNP antibodies produced from
cell culture ......................................................................................93
Figure 3-2 Summary of immunoglobulin components identified by mass
spectroscopy ...................................................................................94
Figure 3-3 Visual representation of autofluorescence from a live DBA/1
mouse .............................................................................................96
Figure 3-4 Autofluorescence in a live DBA/1 mouse .....................................96
Figure 3-5 Dye protein binding: ratio of absorbance at 280nm and 750nm ....98
Figure 3-6 Dye protein ratio following dialysis ..............................................99
Figure 3-7 Anti-E-selectin antibody binding before and after fluorophore
labelling........................................................................................100
Figure 3-8 Anti-E-selectin binding to endothelial cells following stimulation
with TNF ...................................................................................101
Figure 3-9 Comparison of E-selectin binding at different doses of TNF ...102
Figure 3-10 Fluorescent imaging of endothelial cells expressing E-selectin ..104
9
Figure 3-11 Visualisation of fluorescent signal using fluorescent reflectance
imaging ........................................................................................106
Figure 3-12 Quantification of fluorescent signal using fluorescent reflectance
imaging ........................................................................................107
Figure 3-13 Techniques for mapping fluorescent intensity levels in paw
inflammation ................................................................................109
Figure 4-1 Representative example of paw swelling following the intraplantar
injection of TNF ........................................................................116
Figure 4-2 TNF induced paw model: paw swelling is dependent on the dose
of TNF .......................................................................................117
Figure 4-3 Demonstration of systemic action of TNF following injection .118
Figure 4-4 Effect of pre-injection of anti-E-selectin on TNF induced paw
swelling ........................................................................................119
Figure 4-5 Comparison of paw inflammation in TNF injected and PBS
injected mouse paws following injection .....................................120
Figure 4-6 E-selectin expression in the TNF-induced paw oedema model 121
Figure 4-7 TNF-induced paw swelling can be detected by E-selectin targeted
NIR fluorescent imaging ..............................................................123
Figure 4-8 Demonstration of fluorescence images at the 8 hour time-point
following injection of TNF ........................................................124
Figure 4-9 Quantification of E-selectin targeted NIR fluorescence in the
TNF-induced paw swelling model ............................................126
Figure 4-10 Quantification of E-selectin targeted NIR fluorescent imaging over
time ..............................................................................................127
Figure 4-11 Mean fluorescence intensity following subtraction of control paw
......................................................................................................128
Figure 4-12 Effect of antibody concentration on target specificity .................130
Figure 4-13 Mean fluorescence intensity: increased specificity at 5μg antibody
......................................................................................................132
Figure 4-14 Specific anti-E-selectin targeted fluorescent signal co-registered
with X-ray imaging ......................................................................134
Figure 4-15 Etanercept abrogates TNF-induced paw swelling .....................135
10
Figure 4-16 Etanercept abrogates E-selectin specific signal in inflamed paws
......................................................................................................136
Figure 5-1 Representative structure and principle binding affinity of RB200
......................................................................................................146
Figure 5-2 Incidence of arthritis following immunisation with bovine type II
collagen ........................................................................................149
Figure 5-3 CIA: Time course of progression in DBA/1 mice .......................150
Figure 5-4 Representative clinical scores of mice with CIA .........................150
Figure 5-5 Histological characteristics of CIA ..............................................152
Figure 5-6 E-selectin is expressed in the inflamed synovium of mice with CIA
......................................................................................................153
Figure 5-7 E-selectin expression in inflamed mouse synovium: comparison
with CD31 ....................................................................................155
Figure 5-8 Comparison of anti-E-selectin and CD31 staining in non-arthritic
mouse paw ...................................................................................156
Figure 5-9 Differential binding of anti-E-selectin and anti-CD31 antibody .157
Figure 5-10 E-selectin is expressed at early, mid and late time-points in CIA158
Figure 5-11 Anti-E-selectin antibody can be detected following i.v. injection in
CIA ...............................................................................................159
Figure 5-12 CIA: clinical score and paw thickness for correlation in vivo
fluorescent imaging study ............................................................161
Figure 5-13 CIA can be detected by detected by E-selectin targeted fluorescent
imaging ........................................................................................163
Figure 5-14 E-selectin targeted signal can be detected in collagen-induced
arthritis .........................................................................................164
Figure 5-15 Matched clinical score and paw thickness for in vivo imaging of
CIA ...............................................................................................166
Figure 5-16 E-selectin targeted signal can be detected in collagen-induced
arthritis .........................................................................................167
Figure 5-17 E-selectin specific signal can be anatomically co-registered with
plain X-ray imaging in collagen-induced arthritis .......................168
Figure 5-18 E-selectin fluorescent signal correlates with mean paw thickness
......................................................................................................169
Figure 5-19 E-selectin targeted signal detects subclinical activation in CIA ..172
11
Figure 5-20 Etanercept abrogates fluorescent signal in CIA ...........................173
Figure 5-21 Low dose etanercept and RB200 exert a synergistic effect on
clinical score and paw swelling in acute collagen-induced arthritis
......................................................................................................175
Figure 5-22 Low dose etanercept and RB200 exert a synergistic effect on E-
selectin targeted in vivo fluorescent imaging in acute collagen-
induced arthritis ...........................................................................177
Figure 5-23 Low dose etanercept and RB200 exert a synergistic reduction in E-
selectin targeted signal in acute collagen-induced arthritis .........180
Figure 5-24 Low dose etanercept and RB200 exert a synergistic reduction in the
incidence and severity of E-selectin targeted signal in acute
collagen-induced arthritis.............................................................181
List of Tables
Table 1-1 Summary of fluorescence molecular reporter technologies ...........47
Table 1-2 Comparison of optical imaging techniques....................................54
List of Appendices
Appendix 2.1 Staining protocol for E-selectin, CD-31, and DNP antibodies ......84
Appendix 2.2 Procedure for Labelling Proteins with DyLight Fluorophores
(Thermofisher technologies) ..........................................................86
12
List of Abbreviations
Ab antibody
ABP activity based probe
ACPA antibodies to citrullinated protein antigens
ANOVA analysis of variance
AR amphiregulin
au arbitrary units
BCA bicinichoninic acid
bCII bovine type II collagen
BTC betacellulin
CCD charge coupled detector
CF correction factor
CFA complete Freund’s adjuvant
CIA collagen induced arthritis
CW constant wave
DMARD disease modifying antirheumatic drug
DMEM Dulbecco’s modified eagles medium
DNP dinitrophenol
DPJ distal phalangeal joint
EC endothelial cells
EGF epidermal growth factor
EGFR epidermal growth factor receptor
ELAM-1 endothelial adhesion molecule-1
ELISA enzyme Linked Immunosorbant Assay
EPG epigen
EPR epiregulin
FCS foetal calf serum
FGF fibroblast growth factor
FMT fluorescence molecular tomography
FRI fluorescence reflectance imaging
GFP green fluorescent protein
GM-CSF granulocyte-macrophage colony-stimulating factor
H&E haematoxylin and eosin
HAMA human anti-mouse antibody
HER human epidermal growth factor receptor
HRP horseradish peroxidase
HSA human serum albumin
ICAM-1 intracellular adhesion molecule-1
ICG indocyanine green
Ig immunoglobulin
IL interleukin
IL-1ra IL-1 receptor antagonist
LP left paw
13
MAC1 macrophage antigen 1
MAdCAM1 mucosal vascular addressin cell-adhesion molecule 1
MAPK mitogen activated protein kinase
MES-1 mouse E-selectin-1
MFI mean fluorescence intensity
MHC major histocompatibility complex
MoAb monoclonal antibody
MPO myeloperoxidase
MRI magnetic resonance imaging
MTX methotrexate
MW molecular weight
NADH nicotinamide adenine dinucleotide
NGF nerve growth factor
NIR near infrared
NIRF near infrared fluorophore
NRG neuregulin
OA osteoarthrtitis
PBS phosphate buffered saline
PDGF platelet derived growth factor
PECAM1 platelet/endothelial-cell adhesion molecule 1
PEG polyethelene glycol
PET positron emission tomography
PFA paraformaldehyde
PGI2 prostacyclin
PI3K phosphoinositide 3-kinase
PPJ proximal phalageal joint
PSGL1 P-selectin glycoprotein ligand 1
RA rheumatoid arthritis
RP right paw
RTK receptor tyrosine kinase
SCID severe combined immunodeficiency
SDS sodium dodecyl sulphate
sFlt-1 soluble fms-like tyrosine kinase-1
sFV single-chain variable fragment antibodies
SPECT single photon emission computed tomography
Tc technetium
TGF transforming growth factor
TNF tumour necrosis factor
Treg regulatory T-cell
TTJ tibiotarsal joint
VCAM vascular cell adhesion molecule
VEGF vascular endothelial growth factor
VLA4 very late antigen 4 (also known as 41-integrin)
vWF von Willebrand factor

14
Statement of Originality
The material in this report has not previously been submitted, and to the best of my
knowledge contains no material previously published or written by another person
except where due acknowledgement is made in the report itself.

15
Acknowledgements
I am indebted to my acting supervisor Dr Ewa Paleolog for her constant advice and
attention throughout this project.
I would also like to express my sincere gratitude to my co-supervisor Prof. Dorian
Haskard for such helpful supervisions and direction and for giving me the opportunity
to perform my PhD dissertation at both the Kennedy Institute and at the National
Heart and Lung Institute at Hammersmith Hospital.
I also thank Dr Tonia Vincent for playing an integral part in the inception of this
project.
I am grateful to numerous colleagues at the Kennedy Institute, in particular to Leigh
Madden for assistance with laboratory work, to Dr Ann Sandison and Mr David Essex
for assistance with histology on mouse paws.
I would to thank the Kennedy Institute of Rheumatology Trustees for funding this
work.
Finally I thank my wife for her continued patience before, during (and hopefully after)
this project.

Chapter 1
16
CHAPTER 1
Chapter 1
17
1 INTRODUCTION
Musculoskeletal disorders such as rheumatoid arthritis (RA) and osteoarthritis (OA)
are a common cause of pain and disability. Despite the introduction of novel
biological therapies that target tumour necrosis factor- (TNF in RA, a significant
proportion of patients do not respond positively to treatment. In addition, the pattern
of disease in patients may change over time, and alternative therapy may be required
at different times. In vivo molecular imaging techniques are therefore of paramount
importance for elucidating pathogenesis and quantifying the effects of therapy at the
preclinical stage in animal models of disease. The significant potential for translating
these techniques into patients with arthritis and other inflammatory diseases also
holds future promise.
This thesis examines the potential of in vivo optical imaging by targeting fluorescently
labelled anti-E-selectin monoclonal antibody to localise endothelial activation in
inflamed tissues in vivo. The study aimed to demonstrate that this approach is a
sensitive, specific and quantifiable preclinical molecular imaging technique for
inflammatory models of RA, and further examined whether it can be used to delineate
the specific effects of targeted biological therapy.
1.1 Rheumatoid Arthritis
RA is a chronic systemic inflammatory disease, primarily characterized by inflamed
synovial tissue in multiple joints leading to localized destruction of cartilage and bone
(Figure 1-1). It is a severe disabling disease that affects approximately 1% of the
population on a worldwide basis (Feldmann, Brennan et al. 1996). The early diagnosis
of RA is made problematic by heterogeneity in its clinical presentation and lack of
sufficiently specific and sensitive laboratory tests. Conventional imaging strategies
such as plain X-ray imaging are widely used to assess disease, and to measure
progression and response to treatment (Guillemin, Billot et al. 2005). Because X-rays
rely on relatively late features such as bone erosion and joint space narrowing, these
may only show any significant changes after many months from disease onset (van
der Heijde, van Leeuwen et al. 1995). Sensitive and specific methods of imaging are
required for the detection of early inflammatory changes to the synovium in patients
with arthritis and for monitoring treatment. Greater joint damage at baseline is
Chapter 1
18
associated
with poorer physical function and less improvement after treatment
underlying the importance of early detection and intervention to slow the progression
of joint destruction (Breedveld, Han et al. 2005). Magnetic resonance imaging (MRI)
can directly visualize the bone and soft tissues in three dimensions and has the
potential to measure inflammatory activity and joint destruction. Synovitis volume,
bone marrow oedema and bone erosions are all potentially suitable for serial
measurement (Hodgson, O'Connor et al. 2008), but none of these scoring systems is
yet in routine clinical practice. Ultrasound and bone scintigraphy are other useful
techniques for assessing RA. Ultrasound is useful for rapidly assessing multiple joints
and is well established in the clinical assessment of synovitis and tenosynovitis; it
may be combined with power Doppler ultrasound to provide further information on
disease activity (Taylor, Steuer et al. 2004). Bone scintigraphy has been used for
many years to detect inflammatory arthritis, but while it is a relatively sensitive
technique it lacks specificity, has poor anatomical resolution and cannot accurately
detect erosions (Weiss, Maxfield et al. 1965). Information on the character of the
initial destructive events in RA is limited, since the affected structures are not directly
accessible in early disease and because the above techniques do not offer insight into
the cellular and molecular processes involved early in the cause of disease
pathogenesis.
Significant advances in understanding the underlying aetiology of RA have been
made. These point to a predominant role for major histocompatibility complex (MHC)
class II dependent immune activation. This association has been brought to the fore by
powerful evidence for antibody reactivity to proteins modified by citrullination
(Klareskog, Ronnelid et al. 2008). Epidemiological and genetic studies of RA in
relation to anti-citrulline immunity have demonstrated significant differences in
subsets of patients with and without the presence of antibodies to citrullinated protein
antigens (ACPA). Antibodies to citrullinated proteins can be found in approximately
60% of RA patients but only in 2% of the normal population making them highly
specific for RA (Schellekens, Visser et al. 2000; Vincent, Nogueira et al. 2002; van
Gaalen, Linn-Rasker et al. 2004). The occurrence of ACPA is closely linked to the
HLA-DRB1 shared epitope alleles (Klareskog, Stolt et al. 2006). In addition to the
previously established risk posed by smoking (Silman, Newman et al. 1996), there are
further associations between those who are HLA-DRB1 positive and a close

Chapter 1
19
segregation with those who are anti-cyclic citrullinated peptide antibody positive
(Klareskog, Stolt et al. 2006). A recent study has demonstrated citrullinated -enolase
as a potential disease specific autoantigen in RA, although it remains unclear as to
how antibodies to a ubiquitously expressed enzyme such as -enolase may cause
inflammation localised to the joints and other organs (Mahdi, Fisher et al. 2009).
Figure 1-1 Progressive joint destruction in Rheumatoid Arthritis
Rheumatoid arthritis is characterised by progressive joint destruction. Panel a) demonstrates severe
synovitis around metacarpal-phalangeal joints (arrowed) leading to progressive joint irreversible joint
deformity and loss of joint function. Panel b): Late stage changes in RA showing severe joint
deformity.
As our understanding of the molecular basis of RA improves, it has become possible
to develop more sophisticated and sensitive techniques for imaging disease and
detecting pathological change at an early stage. In particular, molecular imaging may
also provide insight into disease mechanisms and elucidate the mode of action of
therapeutic agents. In vivo imaging in the animal model is therefore of vital
importance in developing these techniques helping to both understand the mechanism
of action of novel therapies, as well as validating their use in ameliorating arthritis by
developing reproducible objective measures of scoring disease activity and
monitoring disease activity in vivo.
a b
Chapter 1
20
1.1.1 RA: Chronic Inflammation of The Synovium
Rheumatoid synovium is characterized by hyperplasia of the synovial lining layer and
marked infiltration by lymphocytes, macrophages and plasma cells. Locally produced
inflammatory mediators and the subsequent up regulation of adhesion molecules at
sites of inflammation are pivotal to RA pathogenesis (Tak, Taylor et al. 1996). These
are discussed in the following sections.
1.1.1.1 Histopathological changes to synovial architecture in RA
Normal synovium is a highly vascular tissue that protects the joint, and provides
oxygen, and nutrients to the synovial tissue, and to the relatively avascular cartilage
(FitzGerald and Bresnihan 1995). The normal synovium consists of an intimal lining,
which is composed of macrophage- and fibroblast-like cells that are loosely
associated without a definite underlying basement membrane, and a relatively
acellular sublining, which merges with the joint capsule and contains loose connective
tissue containing fibroblasts, macrophages, adipocytes, and vascular endothelial cells
(EC) (Buch and Emery 2002). Synovial fibroblasts synthesise hyaluronic acid, the
major component of the synovial fluid, and express vascular cell adhesion molecule
(VCAM)-1, which distinguishes them from normal fibroblasts (FitzGerald and
Bresnihan 1995). Synovial macrophages are phagocytic cells that help to clear debris
from the joint space and act as sentinels for microbial encounters (Noss and Brenner
2008). In RA, the synovium is altered to a thickened and invasively growing tissue
several cell layers thick, which covers and erodes the adjacent cartilage, bone and
tendon. Histologically, the inflamed synovium shows pronounced angiogenesis,
cellular hyperplasia, and influx of inflammatory cells (Lee and Weinblatt 2001). This
is demonstrated in Figure 1-2.
Chapter 1
21
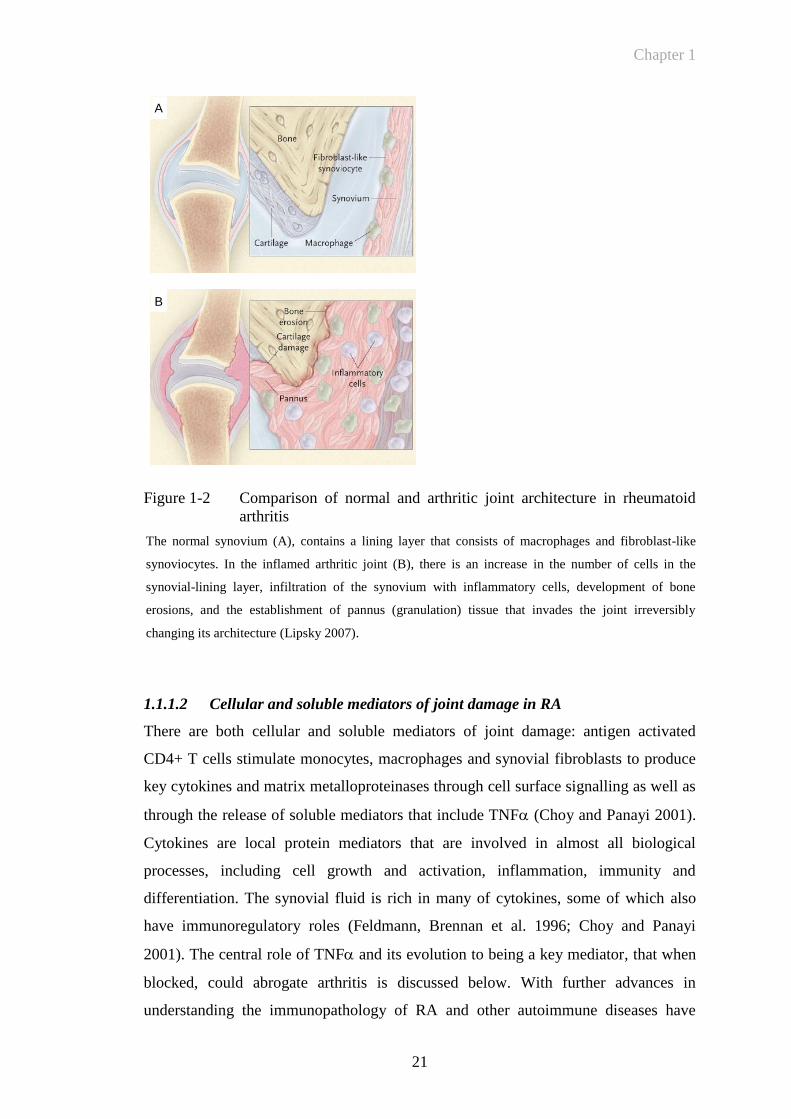
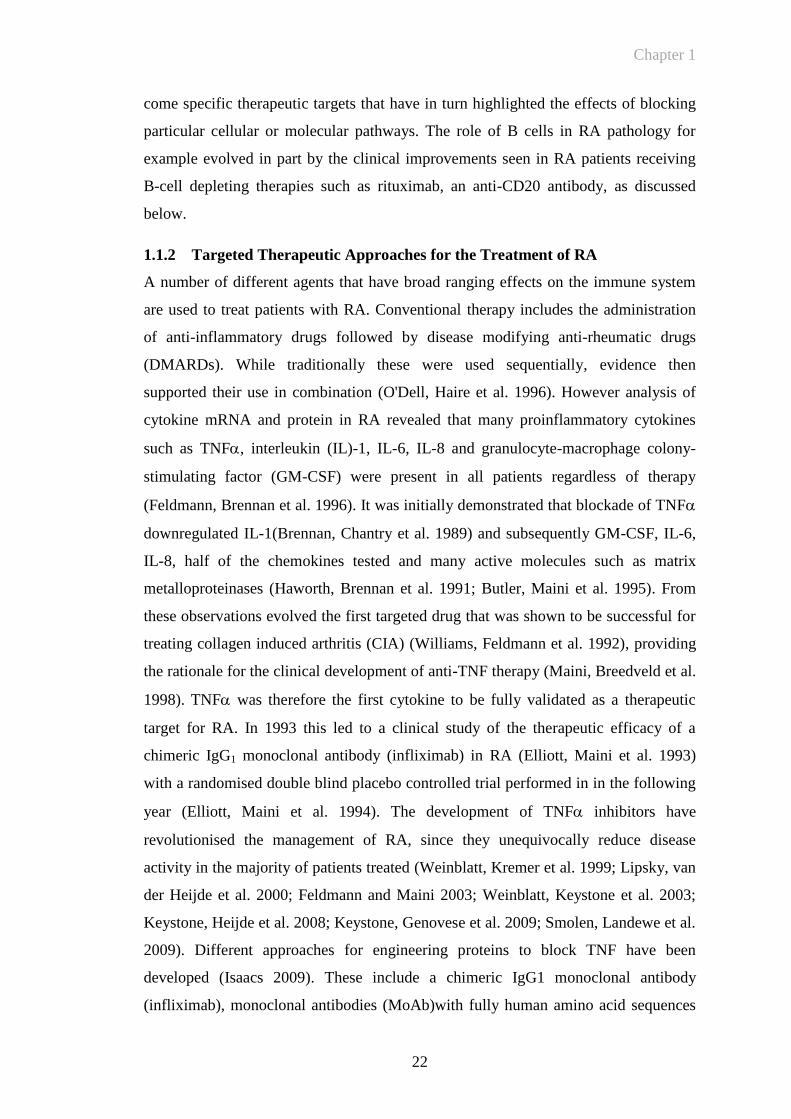
Figure 1-2 Comparison of normal and arthritic joint architecture in rheumatoid
arthritis
The normal synovium (A), contains a lining layer that consists of macrophages and fibroblast-like
synoviocytes. In the inflamed arthritic joint (B), there is an increase in the number of cells in the
synovial-lining layer, infiltration of the synovium with inflammatory cells, development of bone
erosions, and the establishment of pannus (granulation) tissue that invades the joint irreversibly
changing its architecture (Lipsky 2007).
1.1.1.2 Cellular and soluble mediators of joint damage in RA
There are both cellular and soluble mediators of joint damage: antigen activated
CD4+ T cells stimulate monocytes, macrophages and synovial fibroblasts to produce
key cytokines and matrix metalloproteinases through cell surface signalling as well as
through the release of soluble mediators that include TNF (Choy and Panayi 2001).
Cytokines are local protein mediators that are involved in almost all biological
processes, including cell growth and activation, inflammation, immunity and
differentiation. The synovial fluid is rich in many of cytokines, some of which also
have immunoregulatory roles (Feldmann, Brennan et al. 1996; Choy and Panayi
2001). The central role of TNF and its evolution to being a key mediator, that when
blocked, could abrogate arthritis is discussed below. With further advances in
understanding the immunopathology of RA and other autoimmune diseases have
A
B
Chapter 1
22
come specific therapeutic targets that have in turn highlighted the effects of blocking
particular cellular or molecular pathways. The role of B cells in RA pathology for
example evolved in part by the clinical improvements seen in RA patients receiving
B-cell depleting therapies such as rituximab, an anti-CD20 antibody, as discussed
below.
1.1.2 Targeted Therapeutic Approaches for the Treatment of RA
A number of different agents that have broad ranging effects on the immune system
are used to treat patients with RA. Conventional therapy includes the administration
of anti-inflammatory drugs followed by disease modifying anti-rheumatic drugs
(DMARDs). While traditionally these were used sequentially, evidence then
supported their use in combination (O'Dell, Haire et al. 1996). However analysis of
cytokine mRNA and protein in RA revealed that many proinflammatory cytokines
such as TNF, interleukin (IL)-1, IL-6, IL-8 and granulocyte-macrophage colony-
stimulating factor (GM-CSF) were present in all patients regardless of therapy
(Feldmann, Brennan et al. 1996). It was initially demonstrated that blockade of TNF
downregulated IL-1(Brennan, Chantry et al. 1989) and subsequently GM-CSF, IL-6,
IL-8, half of the chemokines tested and many active molecules such as matrix
metalloproteinases (Haworth, Brennan et al. 1991; Butler, Maini et al. 1995). From
these observations evolved the first targeted drug that was shown to be successful for
treating collagen induced arthritis (CIA) (Williams, Feldmann et al. 1992), providing
the rationale for the clinical development of anti-TNF therapy (Maini, Breedveld et al.
1998). TNF was therefore the first cytokine to be fully validated as a therapeutic
target for RA. In 1993 this led to a clinical study of the therapeutic efficacy of a
chimeric IgG1 monoclonal antibody (infliximab) in RA (Elliott, Maini et al. 1993)
with a randomised double blind placebo controlled trial performed in in the following
year (Elliott, Maini et al. 1994). The development of TNF inhibitors have
revolutionised the management of RA, since they unequivocally reduce disease
activity in the majority of patients treated (Weinblatt, Kremer et al. 1999; Lipsky, van
der Heijde et al. 2000; Feldmann and Maini 2003; Weinblatt, Keystone et al. 2003;
Keystone, Heijde et al. 2008; Keystone, Genovese et al. 2009; Smolen, Landewe et al.
2009). Different approaches for engineering proteins to block TNF have been
developed (Isaacs 2009). These include a chimeric IgG1 monoclonal antibody
(infliximab), monoclonal antibodies (MoAb)with fully human amino acid sequences
Chapter 1
23
produced by phage display (adalimumab) or from mice transgenic for the human
immunoglobulin locus (golimumab), an engineered P75 TNFRII dimer with a fully
human amino acid sequence linked to the Fc portion of human IgG1 (etanercept)
(Moreland, Baumgartner et al. 1997; Moreland, Schiff et al. 1999; Moreland, McCabe
et al. 2000); and a pegylated Fab’ fragment that lacks an Fc portion (certolizumab).
These agents vary in their mechanisms of action, to block free and membrane bound
TNF, induction of apoptosis, antibody and complement dependent cell lysis and
effects on secretion of pro-inflammatory cytokines from TNF-producing cells.
Despite the differences in structure of these agents, broadly similar favourable
outcomes are reported. This underscores the tenant that TNF has a central role the
network of molecular and cellular events in the pathogenesis of RA. (Tracey,
Klareskog et al. 2008).
Cytokines other than TNF have also been validated as therapeutic targets. These
include IL-1 which is targeted by anakinra, a recombinant form of naturally occurring
IL-1 receptor antagonist (IL-1ra) (Bresnihan, Alvaro-Gracia et al. 1998); however this
has shown limited efficacy in RA even in combination with methotrexate (Cohen,
Hurd et al. 2002). IL-6 has shown significant promise as a therapeutic target for the
treatment of RA, and anti-IL-6 receptor antibody tocilizumab has been given approval
for the treatment of moderate to severe RA in Europe (Maini, Taylor et al. 2006;
Genovese, McKay et al. 2008; Smolen, Beaulieu et al. 2008). Another approach is to
target cells producing the pro-inflammatory cytokines. Strong evidence for a critical
role for B-cells in the immunopathogenesis of RA came from an open label study of
Rituximab in combination with cyclophosphamide and corticosteroids (Edwards and
Cambridge 2001). Rituximab is a genetically engineered chimeric anti-CD20 MoAb
that is approved for the treatment of relapsed or refractory, low grade or follicular
CD20+ B-cell non-Hodgkin’s lymphoma. CD20 is a B-cell surface antigen that is
expressed only on pre-B and mature B cells. It is not present on stem cells and is lost
before differentiation of B cells into plasma cells. Therefore rituximab causes a
selective transient depletion of the CD20+ B-cell subpopulation. The clinical efficacy
of rituximab was confirmed in a multicentre randomised double blind controlled study
in patients with active RA. This showed that rituximab provided significant
improvement in disease (Edwards, Szczepanski et al. 2004). Despite the ongoing
success of rituximab, other observations have supported a central role for T-cells in
Chapter 1
24
the pathogenesis of RA. These include the induction of an inflammatory arthritis by
transfer of CD4+ T cells from patients with RA when they were transferred into
severe combined immunodeficient mice (Mima, Saeki et al. 1995). Clinically, drug
therapy designed to interrupt T-cell activation via a co-stimulation pathway has been
shown to be effective in RA. Abatacept is a recombinant fusion protein that blocks the
co-stimulatory signal mediated by the CD28-CD80/86 pathway which is required for
T-cell activation (Buch, Vital et al. 2008). Other targeted approaches have been
directed to the treatment of RA. These include blocking angiogenesis. Vascular
endothelial growth factor (VEGF) blockade in mice has been shown to be highly
effective (Miotla, Maciewicz et al. 2000; Sumariwalla, Cao et al. 2003) and this is
discussed further in Section 1.2.3.
1.2 The Vascular Endothelium: An Interface for the Interaction
between Cytokines and Cell Surface Receptors
The activated endothelium is central to the initial and ongoing recruitment of
inflammatory cells to sites of inflammation and it has long been recognized that
endothelial activation plays a pivotal role during inflammatory responses. The
endothelial adhesion and transendothelial migration of leukocytes is a well regulated
sequence of events that involves a multitude of adhesion molecules and chemokines.
Primarily selectins, integrins and members of the immunoglobulin superfamily of
adhesion receptors are involved in leukocyte ‘tethering’, ‘rolling’, activation and
transmigration (Sections 1.2.1 and 1.2.2). Vascular permeability and damage also
occur through other mechanisms at all stages of the arthritic process. EC secrete
several vasodilatory mediators including nitric oxide, prostacyclin (PGI2), platelet
activating factor, histamine and others (Szekanecz and Koch 2008). The vascular
permeability changes occurring in RA are described in Section 1.2.4. The neoangenic
process that both occurs as a result of these vascular changes and is ultimately the
cause of abnormal vascularity in RA is described in Section 1.2.3.
1.2.1 The Adhesion Cascade: A Complex Multistep Process
Leukocyte rolling, adhesion and transmigration through the activated endothelium
were all described as early as the 19th
century, when it was demonstrated that
leucocytes extravasted through the lining of blood vessels in response to injury. The
work of Julius Friedrich Cohnheim focused on the mechanisms involved in the
Chapter 1
25
extravasation of leukocytes from the blood vessels in the inflamed mesentery of the
frog. This work described time dependent alterations, namely dilatation of the arteries
and veins, adhesion of colourless cells to the EC and their subsequent transmigration
from capillaries and venules into the interstitial space (Cohnheim 1889). The
physiological trafficking of lymphocytes through high endothelial venules of
lymphoid organs was demonstrated in 1969 by Ford and Gowans (Ford and Gowans
1969). It was subsequently demonstrated that leukocytes could physically adhere to
lymph node high endothelial venules within frozen sections (Stamper and Woodruff
1976). L-Selectin was then discovered as a leukocyte adhesion molecule mediating
this interaction (Gallatin, Weissman et al. 1983). Following the primary culture of
human umbilical vein EC (Jaffe, Nachman et al. 1973) work centered on the notion
that EC are subject to different activation states influenced by proinflammatory
cytokines that could render them more adhesive for leukocytes. This led to the
identification of endothelial surface molecules responsible for this interaction
including E-selectin (Bevilacqua, Pober et al. 1985). As adhesion molecules were
progressively discovered that were involved in the leukocyte-EC interactions they
were classified into families based on molecular structure and function (Bevilacqua,
Butcher et al. 1991). Leukocyte extravasation was shown to be a step by step process
of initial tethering, rolling along the endothelial surface (mediated largely by selectins
and their ligands), arrest and firm adhesion (mediated by integrins and their ligands)
and finally transmigration across the endothelium. This sequence is termed the
adhesion cascade as shown in Figure 1-3. This is reviewed comprehensively in (Ley
and Kansas 2004)).
Chapter 1
26
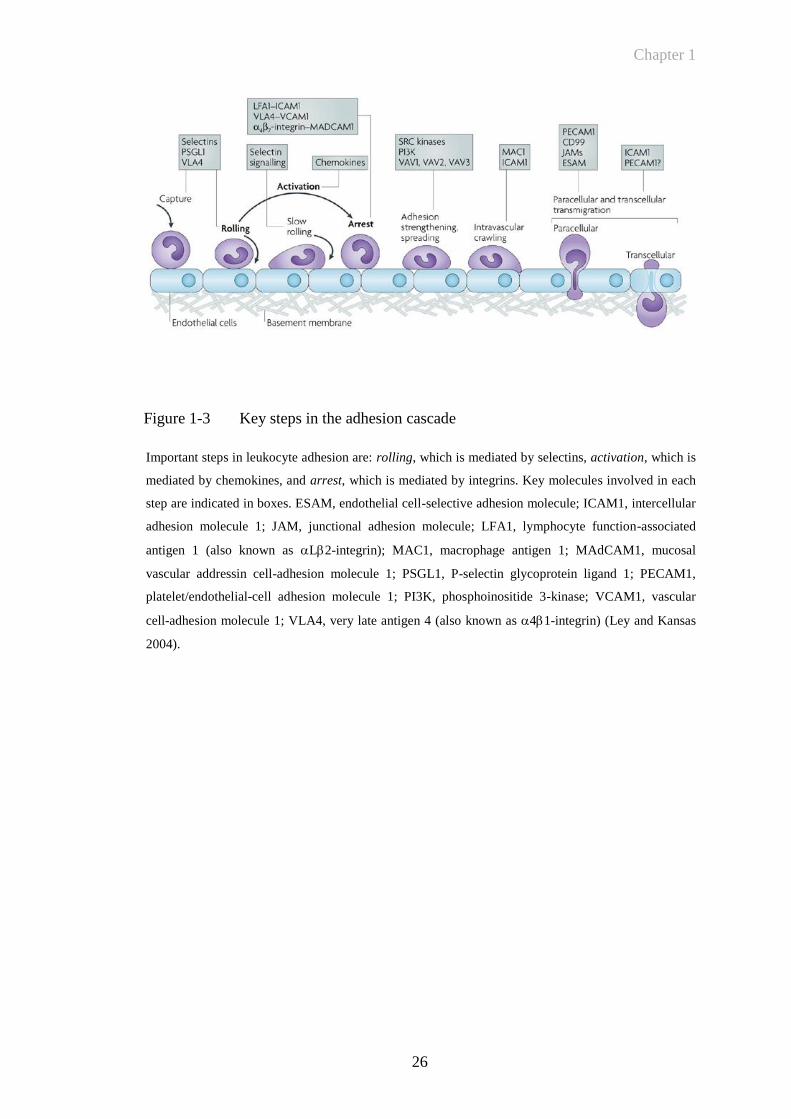
Figure 1-3 Key steps in the adhesion cascade
Important steps in leukocyte adhesion are: rolling, which is mediated by selectins, activation, which is
mediated by chemokines, and arrest, which is mediated by integrins. Key molecules involved in each
step are indicated in boxes. ESAM, endothelial cell-selective adhesion molecule; ICAM1, intercellular
adhesion molecule 1; JAM, junctional adhesion molecule; LFA1, lymphocyte function-associated
antigen 1 (also known as L2-integrin); MAC1, macrophage antigen 1; MAdCAM1, mucosal
vascular addressin cell-adhesion molecule 1; PSGL1, P-selectin glycoprotein ligand 1; PECAM1,
platelet/endothelial-cell adhesion molecule 1; PI3K, phosphoinositide 3-kinase; VCAM1, vascular
cell-adhesion molecule 1; VLA4, very late antigen 4 (also known as 41-integrin) (Ley and Kansas
2004).
Chapter 1
27
1.2.2 E-Selectin: A Pivotal Endothelial Cell Adhesion Molecule for Leukocytes
E-selectin is expressed on the luminal surface of vascular EC in response to
inflammatory stimuli including TNF and IL-1 (Pober, Gimbrone et al. 1986;
Wellicome, Thornhill et al. 1990). It acts as an adhesion molecule for the recruitment
of circulating leukocytes into tissues during inflammatory responses (Springer 1990;
Butcher 1991). As part of a complex multistep process, selectins promote the initial
attachment (tethering) and subsequent moving (rolling) of leukocytes where they
become activated as a result of locally produced chemokines (Springer 1994).
The primary sequences of three independently studied cell surface glycoproteins
found on endothelium, platelets and leukocytes were first published in 1989
(Bevilacqua, Stengelin et al. 1989; Johnston, Cook et al. 1989; Lasky, Singer et al.
1989; Siegelman, van de Rijn et al. 1989). The term selectin highlights the presence
of the lectin domain and the selectivity and function of these molecules. The selectin
is prefixed by the cell type on which it was originally identified: E-selectin
(endothelium), P-Selectin (platelets) and L-Selectin (lymphocytes) (Bevilacqua,
Butcher et al. 1991).
L-selectin was first found as the murine lymph node homing receptor or MEL-14
antigen, defined by the MEL 14 MoAb which blocked the binding of lymphocytes to
lymph node high endothelial venules in lymph node tissue (Gallatin, Weissman et al.
1983). Later, L-selectin was also found on neutrophil granulocytes and monocytes
and was found to be generally involved in leukocyte entry in sites of inflammation. E-
selectin was also found by a MoAb approach during the search for cytokine inducible
surface proteins on EC that would mediate the binding of EC (Bevilacqua, Pober et al.
1987). P-selectin was originally found as a membrane protein in platelet storage
granules that was of unknown function that was also later detected in EC (Hsu-Lin,
Berman et al. 1984).
The selectins were found to contain 3 common protein domains. The NH2 terminus of
each selectin is formed by a 120-amino acid domain which has homology with the
lectin domain of the C-type animal lectins (Drickamer 1988). This is followed by a
35-40 amino acid repeated sequence similar that was first found in epidermal growth
factor (EGF). The six cysteines in this element are located at equivalent positions to
form ‘EGF repeats’. The single EGF element is followed by a varying number of
Chapter 1
28
repetitive elements each about 60 amino acids long, resembling motifs found in
complement regulatory proteins. All 3 selectins are anchored in the cell membrane by
a single transmembrane region which is followed by a short cytoplasmic tail (Somers,
Tang et al. 2000). A truncated recombinant form of E-selectin containing only the
lectin domain and the EGF repeat has been crystallized, with the 3-dimensional
structure determined (Graves, Crowther et al. 1994).
The ligands of selectins are mainly proteins that are posttranslationally modified by
specific oligosaccharides which define physiological function (Varki 1994). The
primary bases of adhesion are relatively weak calcium dependent interactions between
the lectin domain and glycan ligands on apposing cells (Somers, Tang et al. 2000).
Selectins and their specific ligands are also known to mediate signal transduction,
besides having a direct role in leukocyte capturing (Crockett-Torabi 1998). Selectin
ligands are carbohydrate-containing molecules and a variety of glycosyltransferases
that have a role in their biosynthesis have been identified. These contribute to the
formation of the sialyl lewis x structure on P-selectin glycoprotein ligand-1 (PSGL-1).
Although E-selectin can bind PSGL-1, it does not appear to be the main E-selectin
ligand and other ligands remain poorly defined (Ley and Kansas 2004). The inducible
acquisition of selectin ligands is a key component in mediating T-cell recruitment to
extra-lymphoid sites.
1.2.2.1 E-selectin expression during the inflammatory response
E-selectin is transcriptionally induced on EC by cytokines such as IL-1, TNF and by
bacterial lipopolysacharide. Early work demonstrated that surface expression of the
protein on cultured human EC reached maximal levels 4-6 hours after stimulation and
rapidly declined to basal levels after another 12-16 hours (Pober, Lapierre et al. 1987;
Wellicome, Thornhill et al. 1990). Similar expression kinetics were also shown on
mouse endothelioma cell lines, with maximal cell surface expression at 4 hours when
stimulated with TNF (Weller, Isenmann et al. 1992; Hahne, Jager et al. 1993).
Acute and chronic disease states, in various animal models and different tissue sites
have demonstrated differing kinetics for E-selectin expression. The role of E-selectin
in leukocyte accumulation in vivo has been studied extensively in the pig (Binns,
Licence et al. 1992; Binns, Licence et al. 1996; Binns, Whyte et al. 1996),
demonstrating that in pig skin there is constitutive expression of E-selectin (not seen
Chapter 1
29
in the mouse as described below), as well as early upregulation of E-selectin levels.
These earlier studies demonstrating the dependence of leukocytes on E-selectin for
trafficking into inflamed tissue as well as the early recognition of their
interdependence on other factors for localization and transmigration.
By contrast, in the murine contact hypersensitivity model where luminal endothelial
selectin expression was quantified via radiolabelled administration of MoAb,
persistence of both E- and P-selectin upregulation has been demonstrated (Harari,
McHale et al. 1999). In this model the kinetics of selectin expression demonstrated
both an early phase of upregulation peaking at 4-6 hours as well as a later phase at 24-
48 hours. The early upregulation was distinguished by being dose dependent and
postulated to be due to an ‘irritant’ response to the effect of administering oxazolone,
with the later phase antigen specific and dependent on prior sensitization.
1.2.2.2 E-selectin imaging in animal models of inflammatory disease
The initial studies of labelled cell entry in vivo (Binns, Licence et al. 1992) and
immunohistology were followed by labelling, anti-E-selectin MoAb with indium 111
or technetium 99m. Intravenously injected 111In-labelled anti-E-selectin MoAb
(1.2B6) was taken up into inflammatory sites within pig skin stimulated with IL-1,
TNF or phytohemagglutinin (PHA), correlating with leukocyte accumulation and
endothelial expression of E-selectin observable immunohistologically (Keelan,
Harrison et al. 1994; Whyte, Haskard et al. 1994). This was further confirmed by
showing that radiolabelled anti-E-selectin MoAb 1.2B6 whole molecule can be used
to image localized endothelial activation in a porcine arthritis model induced by the
intrarticular injection of PHA (Keelan, Licence et al. 1994). Because of the potential
clinical complications with the use of a whole molecule MoAb due to non-specific
Fc-mediated reactions, radiolabelled F(Ab)2 fragments were also shown to
demonstrate the in vivo expression of E-selectin on synovial endothelium during the
evolution of crystal induced arthritis in the porcine model, again using a radiolabelled
antibody fragment (Chapman, Jamar et al. 1994). E-selectin expression on activated
vascular endothelium has also been evaluated using MRI in an in vivo mouse model
(Reynolds, Larkman et al. 2006). This study utilized the conjugation of ultra small
superparamagnetic iron oxide nanoparticles as a contrast agent on an oxazolone
induced contact hypersensitivity model and effectively depicted activated vascular
endothelium in murine inflammation in vivo with MRI. A further example is the use
Chapter 1
30
of NanoSPECT/CT imaging in the SCID mouse engrafted with human synovial
tissue,using a radiolabelled anti-E-selectin antibody to give quantifiable 3D images of
E-selectin targeted signal following stimulation with TNF (Garrood, Blades et al.
2009)
1.2.2.3 E-selectin expression in RA
The endothelium in human RA synovium is known to express E-selectin (Corkill,
Kirkham et al. 1991). Specific expression has been demonstrated in venules and
capillaries in inflamed synovia of patients with RA but not by other cell types or by
normal synovium (Koch, Burrows et al. 1991; Kriegsmann, Keyszer et al. 1995). The
endothelial expression and serum levels of E-selectin and its downregulation have
also been demonstrated in patients with RA treated with anti-TNF therapy (Paleolog,
Hunt et al. 1996; Tak, Taylor et al. 1996). These clinical data highlighted the key
importance of TNF in the inflammatory cascade, with its blockade down-regulating
cytokine inducible adhesion molecules including E-selectin as well as VCAM-1 and
being associated with a reduction in synovial infiltration.
It has previously been shown that EC induced to express E-selectin by stimulation
with cytokines (TNF and IL-1) peaked in their expression at 4-6 hours and that by
24 hours the molecule was no longer detectable on the cell surface (Pober, Bevilacqua
et al. 1986; Wellicome, Thornhill et al. 1990). This raises the possibility that a
proportion of E-selectin may be shed from the EC surface. This was confirmed in a
later study showing that EC in culture shed a small proportion of the total E-selectin
that they synthesize into the culture medium (Newman, Beall et al. 1993). These
investigators also showed that the soluble form of E-selectin is detectable in the serum
of normal individuals, suggesting a constitutive production in the vasculature. This
study also confirmed in small sample sizes elevated levels of soluble E-selectin in
patients with septic shock. Deactivation of vascular endothelium by anti-TNF
antibody in patients with RA has also been shown to decrease serum E-selectin levels,
with the earliest detectable changes on days 1-3 after anti-TNF infusion. There was
also a significant correlation between the decrease in serum levels of E-selectin and
observable clinical benefit compared with those patients who failed to show a
beneficial response to anti-TNF (Paleolog, Hunt et al. 1996) The possible in vivo
role of soluble adhesion molecules remain unclear although immobilized VCAM-1
Chapter 1
31
and E-selectin have been found to support the binding of human leukocytes and
leukocyte cell lines (Lobb, Chi-Rosso et al. 1991; Lobb, Chi-Rosso et al. 1991;
Wellicome, Kapahi et al. 1993). Soluble E-selectin is chemotactic for monocytes
(Kumar, Hosaka et al. 2001) and neutrophils (Lo, Lee et al. 1991) and increases 2
integrin mediated adhesion (Lo, Lee et al. 1991; Ruchaud-Sparagano, Drost et al.
1998; Ruchaud-Sparagano, Walker et al. 2000). Soluble E-selectin and VCAM-1 have
also been demonstrated to promote angiogenesis in rat cornea and induce chemotaxis
of human EC (Koch, Halloran et al. 1995). The levels of circulating E-selectin have
been measured prospectively in patients with early RA over a five year period
demonstrating that soluble E-selectin levels could be correlated with other markers of
inflammation as well as showing an association with the degree of joint damage
(Kuuliala, Eberhardt et al. 2002). The circulating soluble E-selectin levels in this
study, however, were almost within the normal range compared to healthy control
subjects, with other studies confirming similar results (Carson, Beall et al. 1994;
Blann, Herrick et al. 1995; Voskuyl, Martin et al. 1995; Veale, Maple et al. 1998). It
is postulated that even levels within the normal range may have a role in chronic
inflammation and have been shown to occur for example in patients with clinically
relevant atherosclerosis (Frijns, Kappelle et al. 1997; Fassbender, Bertsch et al. 1999).
1.2.3 Angiogenesis is Central to Promoting and Maintaining RA
The development of the vascular system is one of earliest events that occur during
embryogenesis. Two different processes contribute to the formation of blood vessels:
vasculogenesis and angiogenesis. The former refers to the de novo formation of
vessels from progenitor cells whereas the latter is due to the formation of capillaries
from pre-existing vessels (Carmeliet 2000). There are a number of pathological
conditions where neovessel formation is a key factor in disease pathogenesis. These
include cancer, retinopathy and RA (Carmeliet 2003). In extensive histological studies
Fassbender et al concluded that one of the earliest and most striking changes in the
rheumatoid synovium occurred in the microvasculature. The development of pannus
tissue was seen to occur in three stages: synovial lining hyperplasia, pannus formation
accompanied by the in-growth of a new vascular network, and further consolidation
of the pannus leading to a relatively avascular fibrotic tissue (Fassbender and
Simmling-Annefeld 1983). It is therefore widely accepted that angiogenesis is central
to both promoting and maintaining RA (Weber and De Bandt 2000). The increased
Chapter 1
32
tissue mass, increased endothelial surface area and disrupted architecture of
pathological new vessels are all associated with increased expression of cytokines
such as TNF, transforming growth factor (TGF)- as well as angiogenic factors such
as VEGF which are highly upregulated in the diseased synovium and peripheral blood
of RA patients (Fava, Olsen et al. 1994; Koch, Harlow et al. 1994; Paleolog, Young et
al. 1998; Ballara, Taylor et al. 2001). Other pro-angiogenic factors expressed in RA
include fibroblast growth factors (FGF) and platelet derived growth factor (PDGF)
(Sano, Forough et al. 1990; Remmers, Sano et al. 1991; Remmers, Sano et al. 1991;
Sano, Engleka et al. 1993).
VEGF is a growth factor that binds to heparin in the extracellular matrix and plays a
central role in neovascularisation. Raised serum VEGF levels have been shown to be
associated with destructive change in inflammatory arthritis with serum VEGF levels
significantly higher in patients with early RA than in patients with self limiting
arthritis. This implicates VEGF in the persistence of inflammatory arthritis and
supports the hypothesis that expansion of synovial vasculature is important for the
development of joint destruction in RA (Ballara, Taylor et al. 2001). Although it is
generally accepted that angiogenesis plays a central role in the pathogenesis of RA, it
is still debatable, whether the synovial vascular density is actually increased,
decreased or unaltered at various stages of disease. Histological analysis of blood
vessels in synovial membrane biopsy specimens revealed that tissue obtained from
patients with early RA (disease duration less than three years), who had clinical and
histological evident
knee synovitis, were characterized by prominent vascular
proliferation and an increase in the number of blood vessels per area
(390
vessels/mm2) as compared to postmortem control samples (270 vessels/mm
2)
(FitzGerald, Soden et al. 1991). Examination of the synovial microvasculature in
patients with chronic RA (mean disease duration 15 years) demonstrated that synovial
capillaries are distributed more deeply in the rheumatoid synovium. Further, these
patients exhibited a diminished capillary density within the synovium compared with
normal controls, providing an anatomic explanation for chronic hypoxia in the
rheumatoid synovium (Stevens, Blake et al. 1991). This observation further suggests
that either natural vessel regression takes place, or synovial tissue growth outpaces
neovessel formation, (although treatments might have influenced the synovial vessel
density in this study as described in a more recent study below). Nevertheless, these
Chapter 1
33
findings suggests that the synovial microvasculature in RA is reorganised, leading to
reduced vascular densities adjacent to the joint space and increased vascular densities
in the deeper synovium (Walsh 1999). Other studies demonstrate that the rate of
neovascularisation seems to be increased in RA as demonstrated by
immunohistological assessment of the synovial microvessel density using the
expression of vascular markers CD31 or von Willebrand factor (vWf) in the synovium
of arthritic joints (Giatromanolaki, Sivridis et al. 2001; Paleolog 2002). The number
of synovial blood vessels has been found to correlate with synovial cell hyperplasia,
mononuclear cell infiltration and indices of joint tenderness (Rooney, Condell et al.
1988). More recent evidence has also suggested that immature blood vessels are
selectively depleted in response to anti-TNF therapy. Synovial arthroscopic biopsies
were taken from RA, OA and normal control patients and analysed by double
labelling of the endothelium and pericytes/smooth vessel mural cells to identify and
quantify mature/immature blood vessels. In this study, a longitudinal analysis was
also performed in 25 patients with active disease rebiopsied after TNF therapy. This
demonstrated that the density of immature but not mature blood vessels were depleted
by anti-TNF therapy (Izquierdo, Canete et al. 2009). Taken together these studies
demonstrate that pathological neovascularisation occurs in RA but its phenotype may
change over the time course of disease.
Collagen induced arthritis (CIA) is a mouse model of RA that has been used
extensively to assess neovascular changes and determine the effects of vascular
targeted therapy (Peacock, Banquerigo et al. 1992; Oliver, Banquerigo et al. 1994;
Oliver and Brahn 1996). The latter study demonstrated that CIA can be suppressed by
the addition of an angiogenesis inhibitor (AGM-1470) in combination with
cyclosporine. Treatment with a soluble VEGF receptor has also been demonstrated to
reduce disease severity in murine collagen induced arthritis by decreasing both VEGF
levels, and bone and cartilage destruction as assessed by histology. A study in CIA
has demonstrated that treatment with a soluble form of the Flt-1 VEGF receptor type
1 (sFlt-1) which was polyethylene glycol (PEG) linked significantly reduced both
clinical score and paw swelling, compared with untreated or control treated animals.
This study also demonstrated that the amount of VEGF increased as arthritis
progressed and positively correlated with both clinical score and paw swelling
(Miotla, Maciewicz et al. 2000). A further study has also demonstrated that adenoviral
Chapter 1
34
delivery of Flt-1 abrogates disease activity in murine CIA. The effect of sFlt-1
expression on signs of disease was paralleled by reduced joint destruction and
decreased expression of the vascular marker vWf. This study concluded that the
actions of sFlt-1 were likely to be mediated by reduced synovial neovascularization,
supporting the concept that VEGF blockade may be an effective therapeutic adjunct
for the treatment of RA. Clinically, the most widely used drug that directly targets the
vasculature is bevacizumab – a humanised MoAb that recognises and blocks vascular
endothelial growth factor A (VEGF-A) (Los, Roodhart et al. 2007). This drug is used
for the treatment of advanced stage metastatic malignancy of the GI tract, lung and
breast. A further PEGylated anti-VEGF compound, pegaptanib, is licensed for the
treatment of age related macular degeneration. Trials of VEGF inhibitors for the
treatment of rheumatoid arthritis have thus far not generated a drug which is in routine
clinical practice.
The epidermal growth factor (EGF) ligand/receptor family has also been postulated to
play a role in RA pathogenesis (Shiozawa, Shiozawa et al. 1989; Kusada, Otsuka et
al. 1993). The human epidermal growth factor receptor family (EGFR; also known as
ErbB and human epidermal growth factor receptor, HER) belongs to the receptor
tyrosine kinase (RTK) superfamily. The RTKs are well validated targets for cancer
therapy but may also have broad therapeutic potential across a range of autoimmune
and inflammatory conditions. The first approved RTK therapeutic Herceptin™
(trastuzumab, Genentech) is a MoAb that targets HER-2 and has been highly effective
for the treatment of receptor positive breast cancer (Baselga, Tripathy et al. 1996).
The EGFR includes four members (HER-1/ErbB1, HER-2/ErbB2, HER-3/ErbB3 and
HER-4/ErbB4). The gene symbol, ErbB, is derived from the name of a viral oncogene
to which these receptors are homologous: Erythroblastic Leukemia Viral Oncogene.
Insufficient ErbB signalling in humans is associated with the development of
neurodegenerative diseases, such as multiple sclerosis and Alzheimer’s disease. In
mice, loss of signalling by any member of the ErbB family results in embryonic
lethality with defects in organs including the lungs, skin, heart and brain. Excessive
ErbB signalling is associated with the development of a wide variety of solid tumours.
ErbB-1 and ErbB-2 are found in many human cancers and their excessive signalling
may be critical factors in the development and malignancy of these tumours (Bublil
and Yarden 2007). The EGFR are bound by a large family of ligands including EGF,
Chapter 1
35
transforming growth factor- (TGF-), heparin-binding EGF like growth factor (HB-
EGF), amphiregulin (AR), betacellulin (BTC), epiregulin (EPR), epigen (EPG), and
neuregulins (NRG or heregulins) (Riese and Stern 1998). Ligand binding induces the
formation of homo- or heterodimers between the receptors and, depending on the type
of dimer formed, transphosphorylation of intracellular regions occurs and leads to the
activation of numerous downstream signalling pathways. These include the many
components of the mitogen activated protein kinase (MAPK) cascade, the
phosphoinositide 3-kinase pathway and the phospholipase C pathway, resulting in cell
proliferation, repair, survival and differentiation (Yarden and Sliwkowski 2001;
Jorissen, Walker et al. 2003; Shepard, Brdlik et al. 2008; Huang, Brdlik et al. 2009).
Mutations that lead to the dysregulation of the HER proteins and their ligands have
been discovered in many different types of cancers and malignant proliferation
(Mendelsohn and Baselga 2003; Hynes and Lane 2005). Most notable examples of
relevance clinically include the finding that HER-2 is over expressed in a proportion
of patients with breast cancer. This led to the development of the drug trastuzumab, a
MoAb that targets the extracellular domain of HER-2. This is approved for the
adjuvant treatment of HER-2-overexpressing, node-positive or node-negative breast
cancer (Slamon, Leyland-Jones et al. 2001). In contrast, cetuximab (Erbitux™,
Merck, Germany) is a MoAb that targets HER-1, and is used for metastatic colorectal
cancer and head and neck malignancies. Several others targeting HER-1, HER-2 and
HER-3 are currently in development (Johnston, Navaratnam et al. 2006). However,
resistance to agents that target single HER can occur due to compensation by or up-
regulation of other HER family members (Huang, Brdlik et al. 2009). Furthermore,
homodimerisation and heterodimerisation among members of the HER/ErbB family
of receptors has been described, thus complicating therapies directed against a single
HER receptor (Olayioye, Neve et al. 2000).
A number of studies suggest that EGFR family signalling may have a role in the
development of RA. For example, Hallbeck et al have demonstrated that one of the
primary ligands for the EGFR, TGF- has increased mRNA and levels of protein
expression in RA synovial tissue. Interestingly, in this study, TGF- was present in
knee synovial fluid samples of RA patients and levels were significantly higher
compared to post-traumatic control samples (Hallbeck, Walz et al. 2005). High levels
of another EGFR ligand, EGF, in synovial fluid samples of RA patients have also
Chapter 1
36
been demonstrated (Kusada, Otsuka et al. 1993). Expression of HER-2/ErbB2 in the
synovium of RA patients has further been described (Satoh, Kikuchi et al. 2001;
Hallbeck, Walz et al. 2005). However, another study reported the expression of AR,
but not of EGF, ERG, EPG, BTC, NRG1 or HB-EGF at the mRNA level in RA when
compared to OA tissue, but the reason for the discrepancy between this report and
other studies is unclear (Yamane, Ishida et al. 2008). The functional significance of
the EGF/EGFR pathway in RA is also at present unknown. Activation of EGFR
signalling may contribute to hyperplasia of the arthritic synovium, which is a major
pathological feature of RA that precedes clinical presentation and prevails throughout
the disease (Mor, Abramson et al. 2005). In support of this, trastuzumab, which binds
the HER-2/ErbB2 receptor, and the tyrosine kinase inhibitors genistein and imatinib,
have been shown to inhibit RA synovial cell growth (Satoh, Kikuchi et al. 2001;
Kameda, Ishigami et al. 2006). EGF, when combined with pro-inflammatory
mediators including TNF and IL-1, increased expression by RA fibroblasts of matrix
metalloproteinases such as MMP-1, MMP-3 and MMP-13, as well as release of IL-6
(Huber, Kunzler et al. 2008). Since EGF and these cytokines are all expressed in RA
synovium, these findings suggest that EGF may synergise with other cytokines in RA.
Moreover, these responses were abrogated by a small molecule inhibitor of HER-
2/ErbB2. A recent study also reported that EGF stimulated ERK1/2 MAPK and NFB
pathways to stimulate cycoloxygenase-2 and prostaglandin E2 (Nah, Won et al. 2009).
EGFR over-expression may also contribute to RA progression by increasing
angiogenesis through the production of pro-angiogenic factors such as vascular
endothelial growth factor, IL-8 and basic fibroblast growth factor (Schreiber, Winkler
et al. 1986; Goldman, Kim et al. 1993; Kumar and Yarmand-Bagheri 2001;
Ravindranath, Wion et al. 2001). Angiogenesis is significantly increased in RA and
results in the infiltration of inflammatory cells into the synovium, thus accelerating
disease (Paleolog 2009). A treatment modality that inhibits both synovial hyperplasia
and angiogenesis would be an attractive option in the immunotherapy of RA.
The highly unique compound RB200 is a bispecific ligand trap, composed of full
length extracellular domains of HER-1 and HER-3 EGF receptor. Due to its pan-HER
specificity, RB200 inhibits responses mediated by HER-1, HER-2 and HER-3 in vitro
and in vivo.
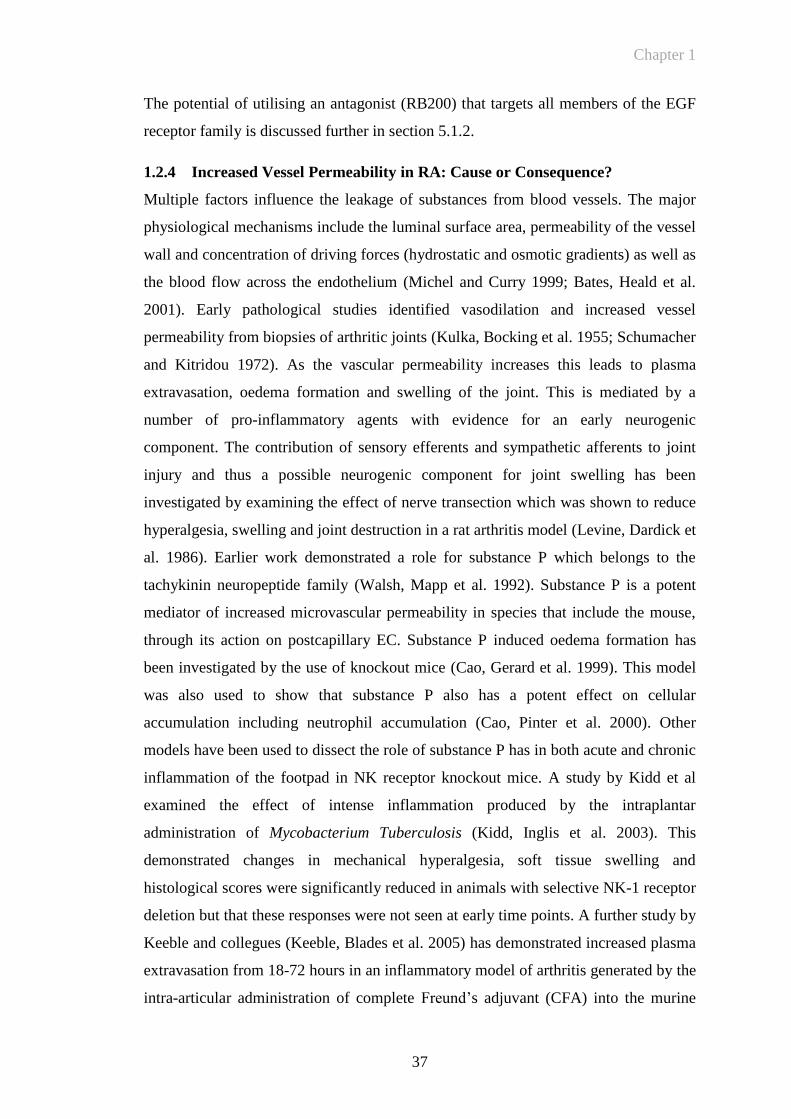
Chapter 1
37
The potential of utilising an antagonist (RB200) that targets all members of the EGF
receptor family is discussed further in section 5.1.2.
1.2.4 Increased Vessel Permeability in RA: Cause or Consequence?
Multiple factors influence the leakage of substances from blood vessels. The major
physiological mechanisms include the luminal surface area, permeability of the vessel
wall and concentration of driving forces (hydrostatic and osmotic gradients) as well as
the blood flow across the endothelium (Michel and Curry 1999; Bates, Heald et al.
2001). Early pathological studies identified vasodilation and increased vessel
permeability from biopsies of arthritic joints (Kulka, Bocking et al. 1955; Schumacher
and Kitridou 1972). As the vascular permeability increases this leads to plasma
extravasation, oedema formation and swelling of the joint. This is mediated by a
number of pro-inflammatory agents with evidence for an early neurogenic
component. The contribution of sensory efferents and sympathetic afferents to joint
injury and thus a possible neurogenic component for joint swelling has been
investigated by examining the effect of nerve transection which was shown to reduce
hyperalgesia, swelling and joint destruction in a rat arthritis model (Levine, Dardick et
al. 1986). Earlier work demonstrated a role for substance P which belongs to the
tachykinin neuropeptide family (Walsh, Mapp et al. 1992). Substance P is a potent
mediator of increased microvascular permeability in species that include the mouse,
through its action on postcapillary EC. Substance P induced oedema formation has
been investigated by the use of knockout mice (Cao, Gerard et al. 1999). This model
was also used to show that substance P also has a potent effect on cellular
accumulation including neutrophil accumulation (Cao, Pinter et al. 2000). Other
models have been used to dissect the role of substance P has in both acute and chronic
inflammation of the footpad in NK receptor knockout mice. A study by Kidd et al
examined the effect of intense inflammation produced by the intraplantar
administration of Mycobacterium Tuberculosis (Kidd, Inglis et al. 2003). This
demonstrated changes in mechanical hyperalgesia, soft tissue swelling and
histological scores were significantly reduced in animals with selective NK-1 receptor
deletion but that these responses were not seen at early time points. A further study by
Keeble and collegues (Keeble, Blades et al. 2005) has demonstrated increased plasma
extravasation from 18-72 hours in an inflammatory model of arthritis generated by the
intra-articular administration of complete Freund’s adjuvant (CFA) into the murine
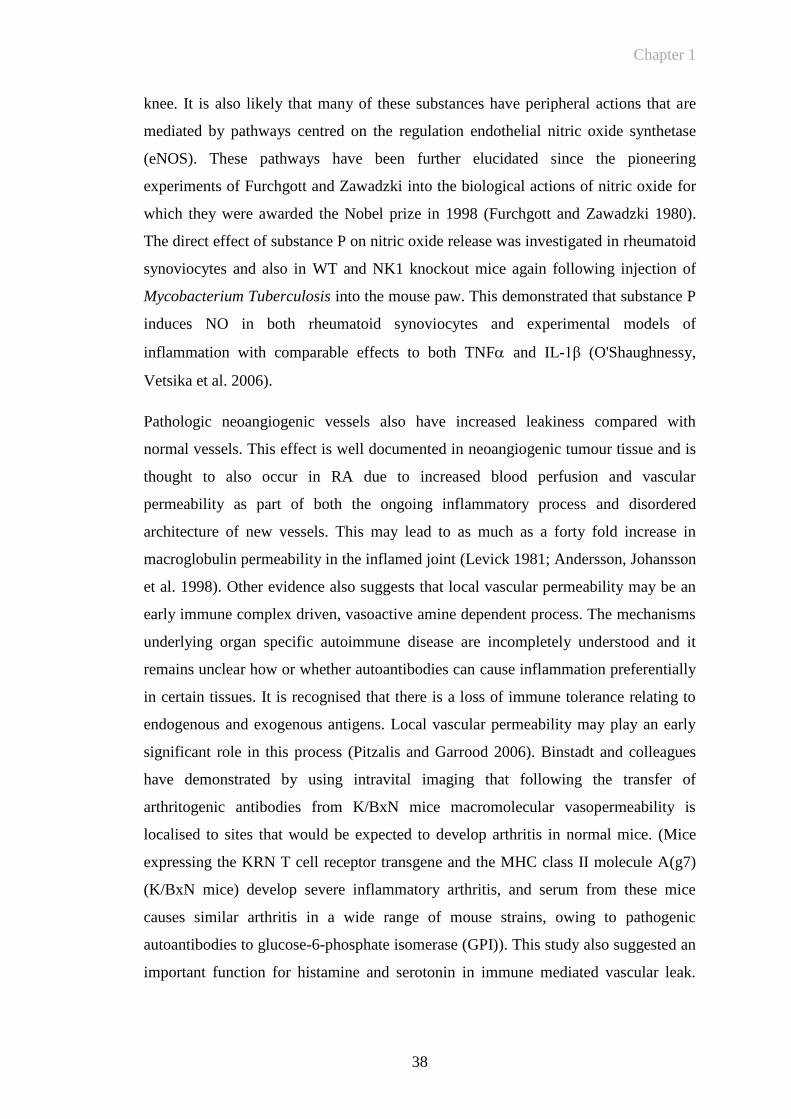
Chapter 1
38
knee. It is also likely that many of these substances have peripheral actions that are
mediated by pathways centred on the regulation endothelial nitric oxide synthetase
(eNOS). These pathways have been further elucidated since the pioneering
experiments of Furchgott and Zawadzki into the biological actions of nitric oxide for
which they were awarded the Nobel prize in 1998 (Furchgott and Zawadzki 1980).
The direct effect of substance P on nitric oxide release was investigated in rheumatoid
synoviocytes and also in WT and NK1 knockout mice again following injection of
Mycobacterium Tuberculosis into the mouse paw. This demonstrated that substance P
induces NO in both rheumatoid synoviocytes and experimental models of
inflammation with comparable effects to both TNF and IL-1β (O'Shaughnessy,
Vetsika et al. 2006).
Pathologic neoangiogenic vessels also have increased leakiness compared with
normal vessels. This effect is well documented in neoangiogenic tumour tissue and is
thought to also occur in RA due to increased blood perfusion and vascular
permeability as part of both the ongoing inflammatory process and disordered
architecture of new vessels. This may lead to as much as a forty fold increase in
macroglobulin permeability in the inflamed joint (Levick 1981; Andersson, Johansson
et al. 1998). Other evidence also suggests that local vascular permeability may be an
early immune complex driven, vasoactive amine dependent process. The mechanisms
underlying organ specific autoimmune disease are incompletely understood and it
remains unclear how or whether autoantibodies can cause inflammation preferentially
in certain tissues. It is recognised that there is a loss of immune tolerance relating to
endogenous and exogenous antigens. Local vascular permeability may play an early
significant role in this process (Pitzalis and Garrood 2006). Binstadt and colleagues
have demonstrated by using intravital imaging that following the transfer of
arthritogenic antibodies from K/BxN mice macromolecular vasopermeability is
localised to sites that would be expected to develop arthritis in normal mice. (Mice
expressing the KRN T cell receptor transgene and the MHC class II molecule A(g7)
(K/BxN mice) develop severe inflammatory arthritis, and serum from these mice
causes similar arthritis in a wide range of mouse strains, owing to pathogenic
autoantibodies to glucose-6-phosphate isomerase (GPI)). This study also suggested an
important function for histamine and serotonin in immune mediated vascular leak.
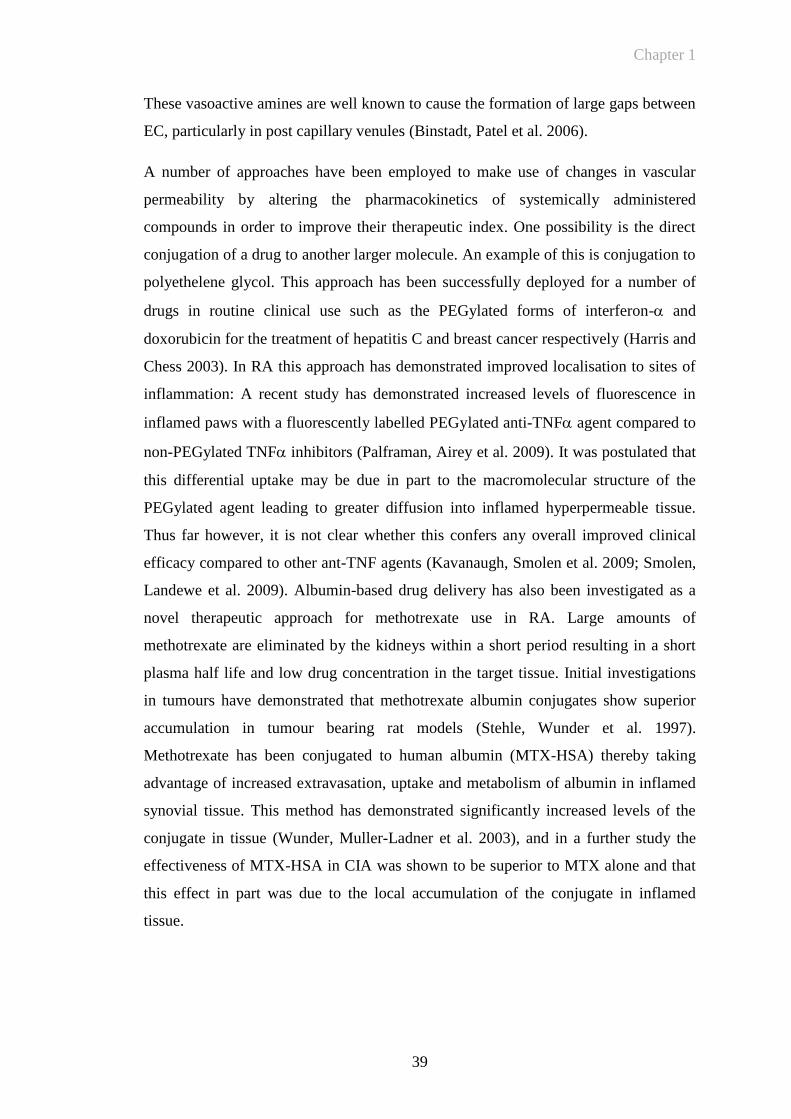
Chapter 1
39
These vasoactive amines are well known to cause the formation of large gaps between
EC, particularly in post capillary venules (Binstadt, Patel et al. 2006).
A number of approaches have been employed to make use of changes in vascular
permeability by altering the pharmacokinetics of systemically administered
compounds in order to improve their therapeutic index. One possibility is the direct
conjugation of a drug to another larger molecule. An example of this is conjugation to
polyethelene glycol. This approach has been successfully deployed for a number of
drugs in routine clinical use such as the PEGylated forms of interferon- and
doxorubicin for the treatment of hepatitis C and breast cancer respectively (Harris and
Chess 2003). In RA this approach has demonstrated improved localisation to sites of
inflammation: A recent study has demonstrated increased levels of fluorescence in
inflamed paws with a fluorescently labelled PEGylated anti-TNF agent compared to
non-PEGylated TNF inhibitors (Palframan, Airey et al. 2009). It was postulated that
this differential uptake may be due in part to the macromolecular structure of the
PEGylated agent leading to greater diffusion into inflamed hyperpermeable tissue.
Thus far however, it is not clear whether this confers any overall improved clinical
efficacy compared to other ant-TNF agents (Kavanaugh, Smolen et al. 2009; Smolen,
Landewe et al. 2009). Albumin-based drug delivery has also been investigated as a
novel therapeutic approach for methotrexate use in RA. Large amounts of
methotrexate are eliminated by the kidneys within a short period resulting in a short
plasma half life and low drug concentration in the target tissue. Initial investigations
in tumours have demonstrated that methotrexate albumin conjugates show superior
accumulation in tumour bearing rat models (Stehle, Wunder et al. 1997).
Methotrexate has been conjugated to human albumin (MTX-HSA) thereby taking
advantage of increased extravasation, uptake and metabolism of albumin in inflamed
synovial tissue. This method has demonstrated significantly increased levels of the
conjugate in tissue (Wunder, Muller-Ladner et al. 2003), and in a further study the
effectiveness of MTX-HSA in CIA was shown to be superior to MTX alone and that
this effect in part was due to the local accumulation of the conjugate in inflamed
tissue.
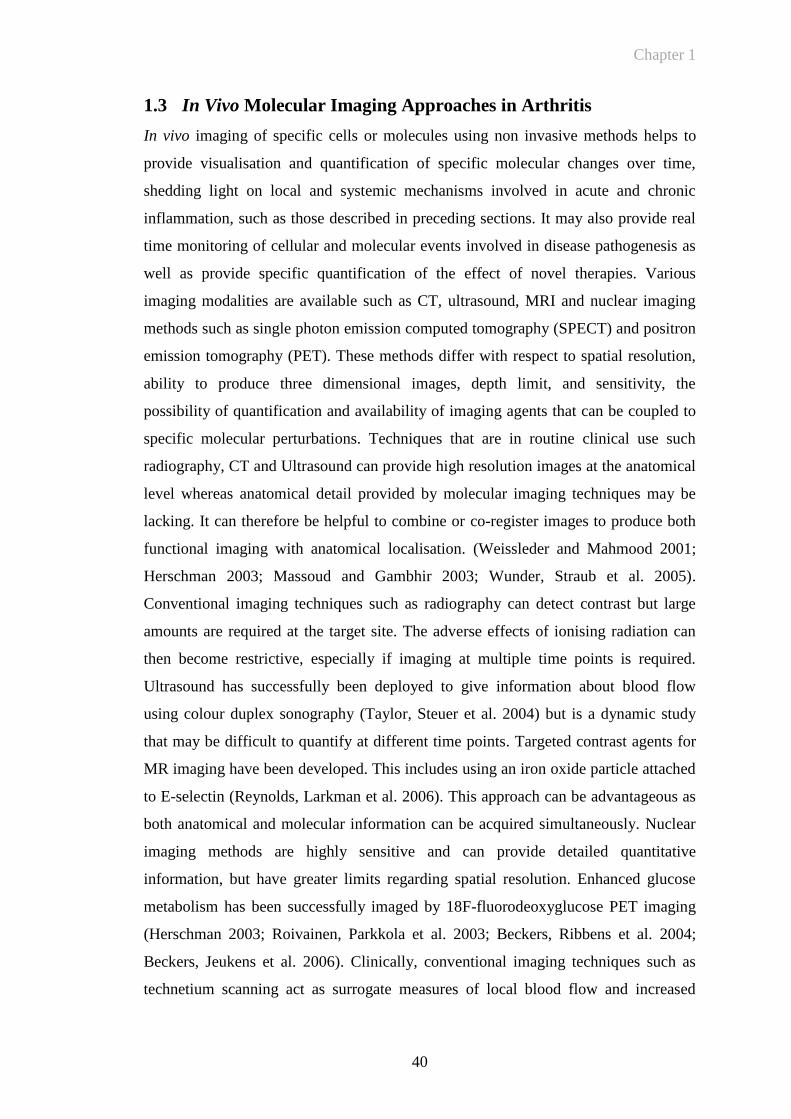
Chapter 1
40
1.3 In Vivo Molecular Imaging Approaches in Arthritis
In vivo imaging of specific cells or molecules using non invasive methods helps to
provide visualisation and quantification of specific molecular changes over time,
shedding light on local and systemic mechanisms involved in acute and chronic
inflammation, such as those described in preceding sections. It may also provide real
time monitoring of cellular and molecular events involved in disease pathogenesis as
well as provide specific quantification of the effect of novel therapies. Various
imaging modalities are available such as CT, ultrasound, MRI and nuclear imaging
methods such as single photon emission computed tomography (SPECT) and positron
emission tomography (PET). These methods differ with respect to spatial resolution,
ability to produce three dimensional images, depth limit, and sensitivity, the
possibility of quantification and availability of imaging agents that can be coupled to
specific molecular perturbations. Techniques that are in routine clinical use such
radiography, CT and Ultrasound can provide high resolution images at the anatomical
level whereas anatomical detail provided by molecular imaging techniques may be
lacking. It can therefore be helpful to combine or co-register images to produce both
functional imaging with anatomical localisation. (Weissleder and Mahmood 2001;
Herschman 2003; Massoud and Gambhir 2003; Wunder, Straub et al. 2005).
Conventional imaging techniques such as radiography can detect contrast but large
amounts are required at the target site. The adverse effects of ionising radiation can
then become restrictive, especially if imaging at multiple time points is required.
Ultrasound has successfully been deployed to give information about blood flow
using colour duplex sonography (Taylor, Steuer et al. 2004) but is a dynamic study
that may be difficult to quantify at different time points. Targeted contrast agents for
MR imaging have been developed. This includes using an iron oxide particle attached
to E-selectin (Reynolds, Larkman et al. 2006). This approach can be advantageous as
both anatomical and molecular information can be acquired simultaneously. Nuclear
imaging methods are highly sensitive and can provide detailed quantitative
information, but have greater limits regarding spatial resolution. Enhanced glucose
metabolism has been successfully imaged by 18F-fluorodeoxyglucose PET imaging
(Herschman 2003; Roivainen, Parkkola et al. 2003; Beckers, Ribbens et al. 2004;
Beckers, Jeukens et al. 2006). Clinically, conventional imaging techniques such as
technetium scanning act as surrogate measures of local blood flow and increased
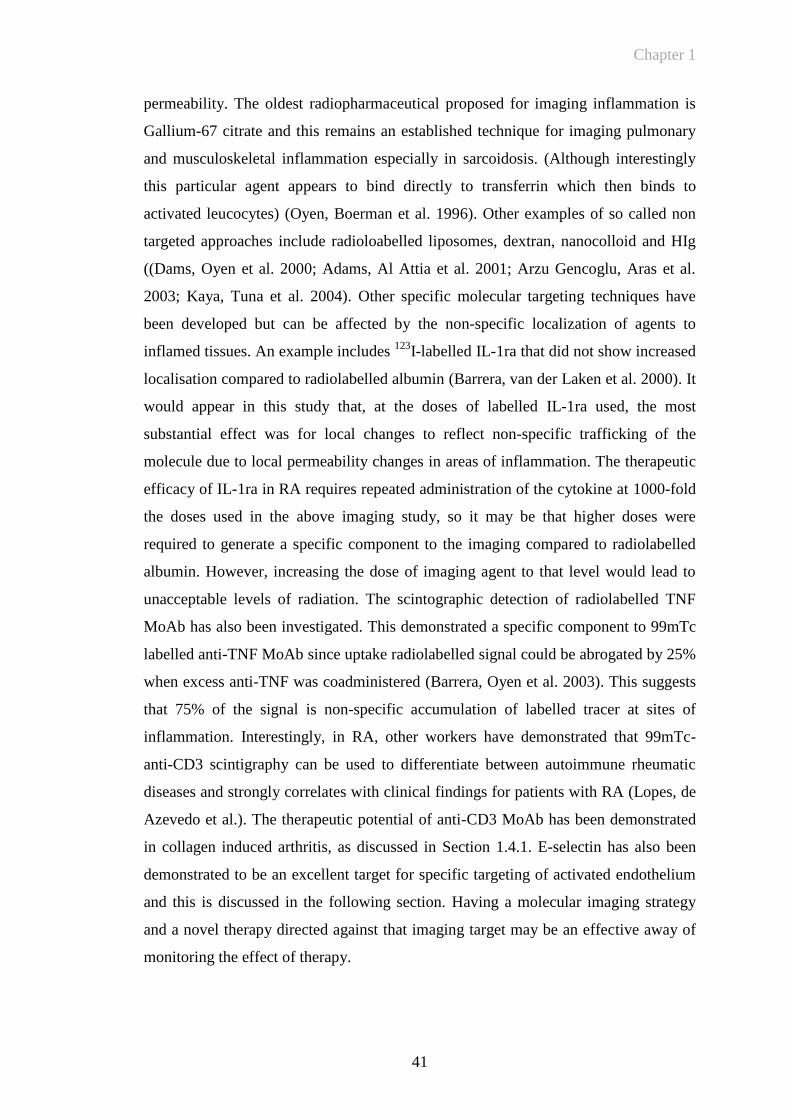
Chapter 1
41
permeability. The oldest radiopharmaceutical proposed for imaging inflammation is
Gallium-67 citrate and this remains an established technique for imaging pulmonary
and musculoskeletal inflammation especially in sarcoidosis. (Although interestingly
this particular agent appears to bind directly to transferrin which then binds to
activated leucocytes) (Oyen, Boerman et al. 1996). Other examples of so called non
targeted approaches include radioloabelled liposomes, dextran, nanocolloid and HIg
((Dams, Oyen et al. 2000; Adams, Al Attia et al. 2001; Arzu Gencoglu, Aras et al.
2003; Kaya, Tuna et al. 2004). Other specific molecular targeting techniques have
been developed but can be affected by the non-specific localization of agents to
inflamed tissues. An example includes 123
I-labelled IL-1ra that did not show increased
localisation compared to radiolabelled albumin (Barrera, van der Laken et al. 2000). It
would appear in this study that, at the doses of labelled IL-1ra used, the most
substantial effect was for local changes to reflect non-specific trafficking of the
molecule due to local permeability changes in areas of inflammation. The therapeutic
efficacy of IL-1ra in RA requires repeated administration of the cytokine at 1000-fold
the doses used in the above imaging study, so it may be that higher doses were
required to generate a specific component to the imaging compared to radiolabelled
albumin. However, increasing the dose of imaging agent to that level would lead to
unacceptable levels of radiation. The scintographic detection of radiolabelled TNF
MoAb has also been investigated. This demonstrated a specific component to 99mTc
labelled anti-TNF MoAb since uptake radiolabelled signal could be abrogated by 25%
when excess anti-TNF was coadministered (Barrera, Oyen et al. 2003). This suggests
that 75% of the signal is non-specific accumulation of labelled tracer at sites of
inflammation. Interestingly, in RA, other workers have demonstrated that 99mTc-
anti-CD3 scintigraphy can be used to differentiate between autoimmune rheumatic
diseases and strongly correlates with clinical findings for patients with RA (Lopes, de
Azevedo et al.). The therapeutic potential of anti-CD3 MoAb has been demonstrated
in collagen induced arthritis, as discussed in Section 1.4.1. E-selectin has also been
demonstrated to be an excellent target for specific targeting of activated endothelium
and this is discussed in the following section. Having a molecular imaging strategy
and a novel therapy directed against that imaging target may be an effective away of
monitoring the effect of therapy.
Chapter 1
42
1.3.1 E-Selectin: An Excellent Target for Molecular Imaging in RA
Scintigraphy utilizing a 99m
Tc-anti-E-selectin-Fab has been used to successfully image
synovitis in patients with RA, in this case demonstrating improved specificity
compared to a conventional tracer for bone and joint 99m
Tc-oxidronate (Tc-HDP),
with particular specificity for targeting active joint inflammation (Jamar, Houssiau et
al. 2002). Tc-HDP displays abnormal uptake over both currently inflamed and
chronically damaged joints and is very sensitive for the detection of joint and
subchondral bone abnormalities (Desaulniers, Fuks et al. 1974; Helfgott, Rosenthall et
al. 1982), but it cannot distinguish accurately between actively and chronically
inflamed joints (Fogelman 1980). The absence of signal uptake in normal joints by E-
selectin targeted imaging described above allows for markedly improved detection of
active joint disease in RA as shown in Figure 1-4. The MoAb described in this study
is of murine origin, which raises the possibility of host immunogenicity. However the
small amounts of MoAb required for imaging and also the use of the Fab fragment
devoid of Fc portions, which are thought to be responsible for immunisation may
reduce the likelihood of a human anti mouse antibody (HAMA) response. In this
study patients were not tested for a HAMA response, but some were imaged again
with 99m
Tc-anti-E-selectin-Fab 2-4 months later with no detectable change in the
biodistribution of labelled antibody. In a previous study of fourteen patients with RA
that received 111
In-labeled F(ab’)2 fragment of E-selectin HAMA responses were
measured by ELISA comparing blood samples taken pre and post (14 days)
immunisation. No HAMA were detectable following injection.
The endothelial expression and serum levels of E-selectin and its downregulation
have also been demonstrated in patients with RA treated with anti-TNF therapy
(Paleolog, Hunt et al. 1996; Tak, Taylor et al. 1996). This clinical data highlighted the
key importance of TNF in the inflammatory cascade, and that its blockade down-
regulates cytokine inducible adhesion molecules including E-selectin (as well as
VCAM-1) and is associated with a reduction in synovial infiltration. Hence E-selectin
may be a very effective way of monitoring specific responses to TNF blockade in RA.
Chapter 1
43
Figure 1-4 Comparison of 99m
Tc-1.2B6-Fab and 99m
Tc-HDP radiolabelled imaging
in RA
Images obtained 4hrs after injection of Tc-1.2B6 Fab (a,b) and Tc-HDP (c,d) in two patients with RA.
Demonstrating focal uptake in inflamed joints and less bone and subchondral uptake for the MoAb
compared to conventional Tc –HDP scanning (Jamar, Houssiau et al. 2002).
1.3.2 In Vivo Fluorescence Imaging And Optical Imaging
In vivo molecular optical imaging has significant potential to delineate and measure at
the macroscopic level in vivo biologic processes that are occurring at the cellular and
molecular level (Biswal, Resnick et al. 2007). Optical imaging has already been
developed for in vitro and ex vivo applications in molecular and cellular biology (e.g.
fluorescence confocal microscopy), but is still at an early stage of development as a
whole animal in vivo imaging technique, particularly in the context of arthritis. Both
sensitivity and spatial resolution remain incompletely defined (Weissleder and Pittet
2008). The future however, holds considerable promise for non invasive visualisation
of specific molecular targets which can be synergised with other imaging modalities
such CT or MRI.
1.3.2.1 Principles of fluorescent imaging
Fluorescence is the excitation of a molecule (fluorophore) by light to a higher energy
state, and its subsequent decay, resulting in emission of light at a higher wavelength.
The difference between the emission and excitation wavelengths is termed the Stokes
Shift, after Sir George Stokes who first described fluorescence in 1852. Some small
a)
b)
c)
d)
Chapter 1
44
biological molecules (e.g. Nicotinamide adenine dinucleotide (NADH) and
tryptophan) and proteins (e.g. phycoerythrin or green fluorescent protein (GFP)) are
naturally fluorescent (intrinsic fluorophores), whereas extrinsic fluorophores are
derived from many common dye families, such as xanthenes, cyanine and coumarin
derivatives. Extrinsic fluorophores may be attached to proteins of interest by chemical
modification of specific functional groups such as amino, carboxyl or thiol groups.
Fluorescence is visualised by excitation at an appropriate wavelength and capture of
the emitted photons usually by a charge coupled detector (CCD). Advances in CCD
design have enabled accurate detection of low levels of light. CCDs are constructed of
thin silicon crystal sheets that operate by converting light photons into a tiny charge
that can be measured and converted into a digital signal. Older CCD cameras had
problems with noise from thermal energy turning into electrical signal (Spibey,
Jackson et al. 2001). Thermal energy is dramatically reduced if the chip is adequately
cooled. Early fluorescence imaging in animals was invasive, with intravital
microscopy being the commonest tool. In contrast, fluorescence reflectance imaging
allows non invasive in vivo real time images of the whole animal to be taken.
However, images from a planar CCD are two dimensional and therefore lack tissue
depth information. The high degree of absorption and scattering of light by biological
samples limits the penetration of both the excitation and resulting emission signal
(Mahmood and Weissleder 2003). Studies have suggested that fluorescent signals
may be reduced by up to ten-fold per cm of depth, although this will vary with tissue
type, wavelength and dye brightness (Contag, Contag et al. 1995). Accurate image
acquisition may also be improved by either combining multiple images from different
CCDs or by rotating a single CCD (Chen, Tung et al. 2002) in a tomographic manner
allowing regions of interest to be visualised in a 3-dimensional plane. The use of
tomography and early photon detection may also be a way of increasing signal
specificity (Ntziachristos, Ripoll et al. 2005; Niedre, de Kleine et al. 2008).
In addition to the absorption and scattering of light (Mahmood and Weissleder 2003),
biological samples autofluoresce at the wavelengths used for traditional extrinsic dye
families (300-500 nm). Newer dyes better suited for in vivo studies fluoresce at higher
wavelengths, close to the infra-red range (700-900 nm) as demonstrated in Figure 1-5.
Examples include members of the Cyanine series of dyes from GE Healthcare and
some of the Alexa Fluor series of dyes from Invitrogen. The intrinsically fluorescent
Chapter 1
45
protein, GFP has a peak emission wavelength of 509nm and is therefore subject to
significant autofluorescence from surrounding tissue if used for in vivo fluorescent
imaging. However, several mutants of the monomeric red fluorescent protein that
fluoresce at wavelengths above 600 nm have been produced (Tsien 2009). These have
been used in a study by Winnard PT et al., where cancer cells labelled with the
Tomato fluorescent protein was more readily detected compared with the same cells
labelled with GFP (Winnard, Kluth et al. 2006). Advances in CCD technology and
use of near infrared fluophores (NIRFs) will therefore allow for better image
resolution. This has the potential to provide non-invasive imaging of molecular
targets, and physiological process in vivo. In vivo fluorescence imaging also has
several important advantages over other imaging techniques; there is no exposure to
harmful radiation, it is relatively cheap, and images can be acquired rapidly (Massoud
and Gambhir 2003). The following Table 1-2 is a summary of different molecular
reporter technologies.
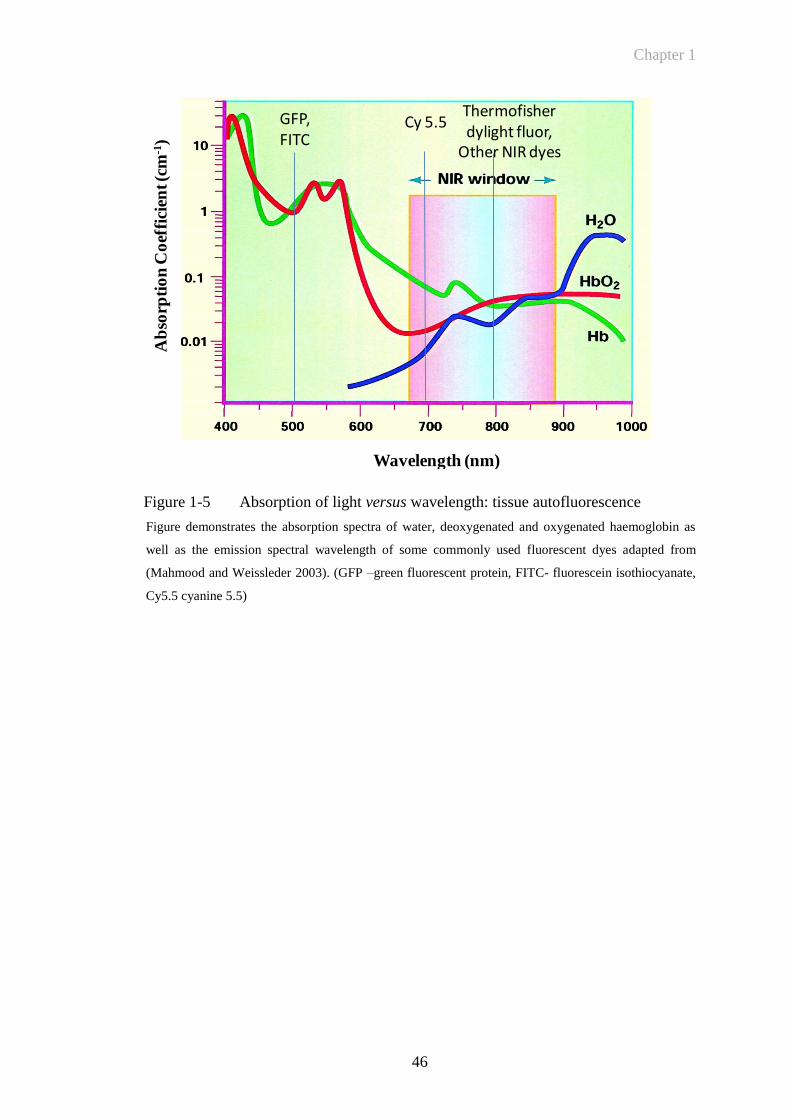
Chapter 1
46
Figure 1-5 Absorption of light versus wavelength: tissue autofluorescence
Figure demonstrates the absorption spectra of water, deoxygenated and oxygenated haemoglobin as
well as the emission spectral wavelength of some commonly used fluorescent dyes adapted from
(Mahmood and Weissleder 2003). (GFP –green fluorescent protein, FITC- fluorescein isothiocyanate,
Cy5.5 cyanine 5.5)
Thermofisherdylight fluor,
Other NIR dyes
Cy 5.5GFP, FITC
Ab
sorp
tio
n C
oef
fici
ent (c
m-1
)
Wavelength (nm)
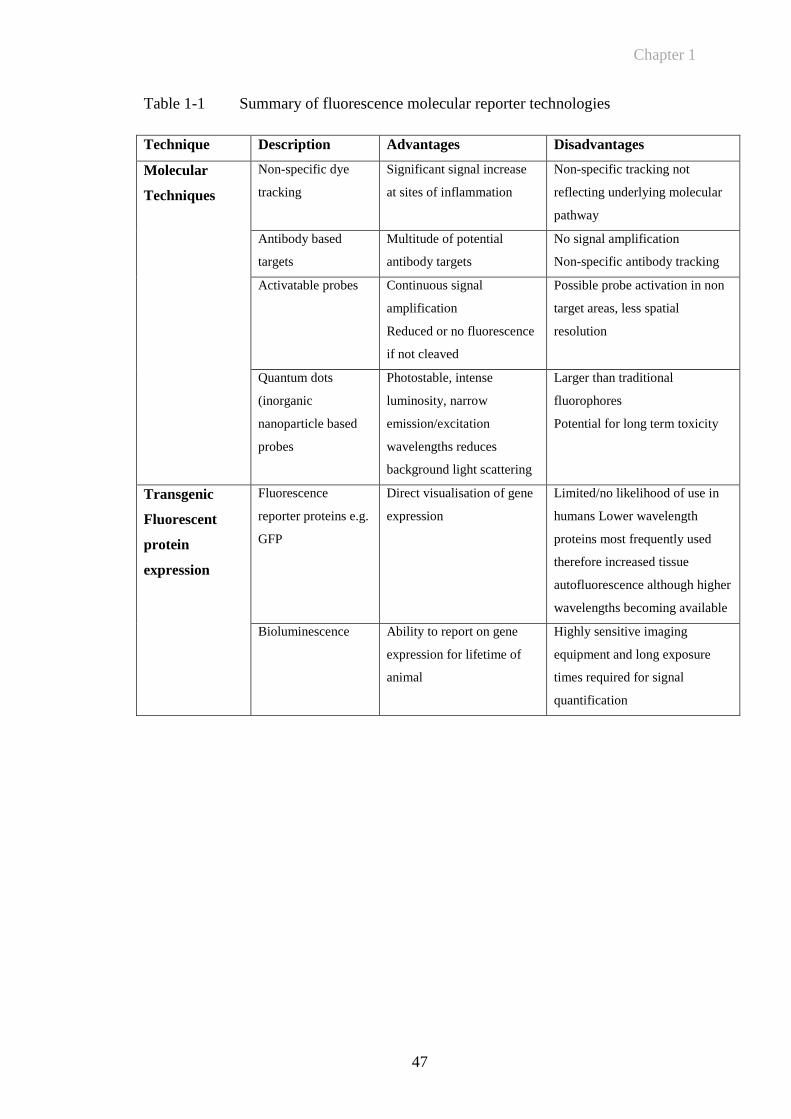
Chapter 1
47
Table 1-1 Summary of fluorescence molecular reporter technologies
Technique Description Advantages Disadvantages
Molecular
Techniques
Non-specific dye
tracking
Significant signal increase
at sites of inflammation
Non-specific tracking not
reflecting underlying molecular
pathway
Antibody based
targets
Multitude of potential
antibody targets
No signal amplification
Non-specific antibody tracking
Activatable probes Continuous signal
amplification
Reduced or no fluorescence
if not cleaved
Possible probe activation in non
target areas, less spatial
resolution
Quantum dots
(inorganic
nanoparticle based
probes
Photostable, intense
luminosity, narrow
emission/excitation
wavelengths reduces
background light scattering
Larger than traditional
fluorophores
Potential for long term toxicity
Transgenic
Fluorescent
protein
expression
Fluorescence
reporter proteins e.g.
GFP
Direct visualisation of gene
expression
Limited/no likelihood of use in
humans Lower wavelength
proteins most frequently used
therefore increased tissue
autofluorescence although higher
wavelengths becoming available
Bioluminescence
Ability to report on gene
expression for lifetime of
animal
Highly sensitive imaging
equipment and long exposure
times required for signal
quantification
Chapter 1
48
1.3.2.2 Potential molecular approaches for in vivo fluorescence imaging
Optical imaging of small animal cancer models has been the focus of a significant
proportion of optical imaging investigations (Adams, Ke et al. 2007; Kovar, Simpson
et al. 2007). A wide variety of targeted optical probes have been described in the
literature. Targets have included cell surface receptors, metabolic pathways, hormone
receptors, apoptotic markers and enzymatic activities (Kelloff, Krohn et al. 2005).
The following section highlights some instructive examples of how imaging in this
field has evolved and how these are likely to inform the use of fluorescent imaging in
other diseases, including RA and OA. A summary of potential targets for optical
imaging is included in Table 1-2
1.3.2.2.1 Targeted approaches for dye deposition
Antibodies directed against cell surface molecules which are over-expressed in cancer
cells can be tagged by fluorophores. This targets the fluorescence to the diseased
tissue. For example, specific antibody targeted resolution of tumours raised in a
mouse model was achieved using Cy5.5 labelled tumour targeting antibodies (Ballou,
Fisher et al. 1995). In a similar way tumour growth and neoplastic progression have
been quantified using a label attached to epidermal growth factor (Kovar, Johnson et
al. 2006). Other antibodies that have been used to target fluorescent signals include
those against growth factor receptors (Koyama, Hama et al. 2007; Rosenthal,
Kulbersh et al. 2007; Sampath, Kwon et al. 2007; Xu, Baidoo et al. 2007; Gleysteen,
Newman et al. 2008; Withrow, Newman et al. 2008), cancer embryonic antigen
(Fidarova, El-Emir et al. 2008; Gleysteen, Newman et al. 2008; Kaushal, McElroy et
al. 2008; Lisy, Goermar et al. 2008; Newman, Gleysteen et al. 2008; McElroy,
Hayashi et al. 2009) and cell surface receptors (Newman, Gleysteen et al. 2008;
McElroy, Hayashi et al. 2009; Zou, Xu et al. 2009).
To minimise background signal, viable cancer cells have been imaged in vivo by a
combinatorial approach of tagging antibodies with pH-activatable probes. These
probes are activated after cellular internalisation by sensing the pH change in the
lysosome (pH 5-6, compared to 7.4 of the cytoplasm). This was used in conjuction
with the MoAb trastuzumab, which targets the human epidermal growth factor
receptor type 2. Upon internalisation via the endosomal-lysosomal degradation
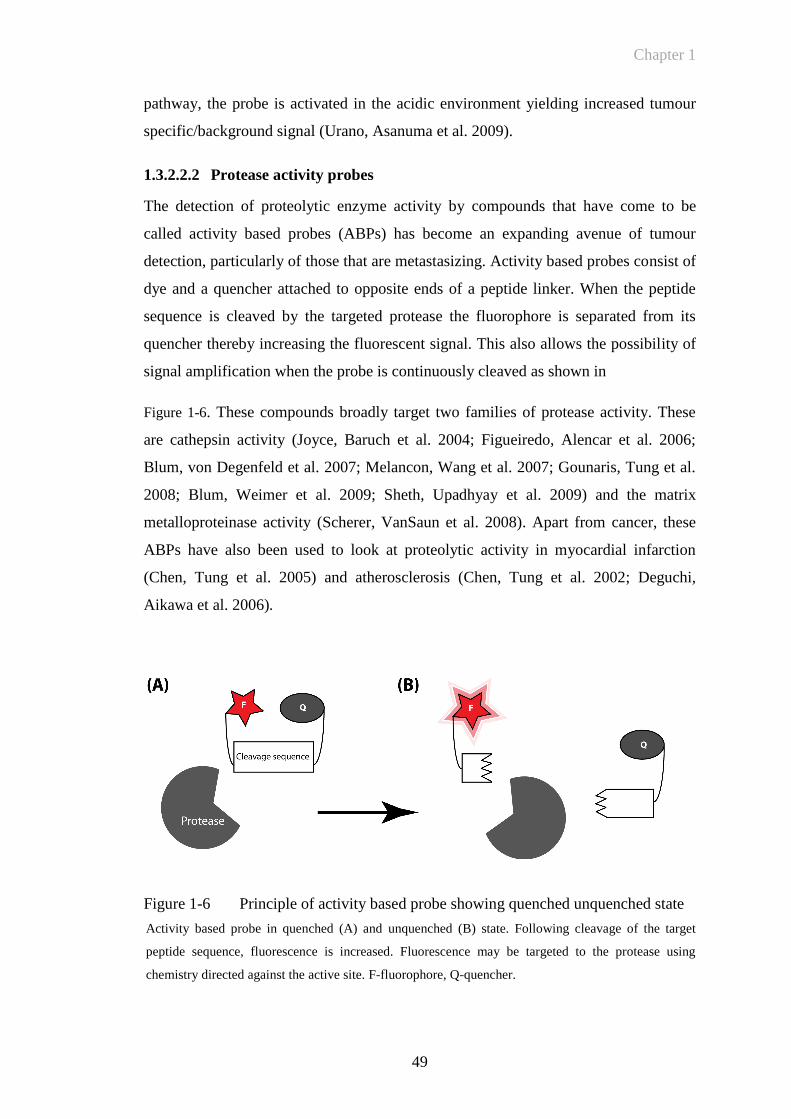
Chapter 1
49
pathway, the probe is activated in the acidic environment yielding increased tumour
specific/background signal (Urano, Asanuma et al. 2009).
1.3.2.2.2 Protease activity probes
The detection of proteolytic enzyme activity by compounds that have come to be
called activity based probes (ABPs) has become an expanding avenue of tumour
detection, particularly of those that are metastasizing. Activity based probes consist of
dye and a quencher attached to opposite ends of a peptide linker. When the peptide
sequence is cleaved by the targeted protease the fluorophore is separated from its
quencher thereby increasing the fluorescent signal. This also allows the possibility of
signal amplification when the probe is continuously cleaved as shown in
Figure 1-6. These compounds broadly target two families of protease activity. These
are cathepsin activity (Joyce, Baruch et al. 2004; Figueiredo, Alencar et al. 2006;
Blum, von Degenfeld et al. 2007; Melancon, Wang et al. 2007; Gounaris, Tung et al.
2008; Blum, Weimer et al. 2009; Sheth, Upadhyay et al. 2009) and the matrix
metalloproteinase activity (Scherer, VanSaun et al. 2008). Apart from cancer, these
ABPs have also been used to look at proteolytic activity in myocardial infarction
(Chen, Tung et al. 2005) and atherosclerosis (Chen, Tung et al. 2002; Deguchi,
Aikawa et al. 2006).
Figure 1-6 Principle of activity based probe showing quenched unquenched state
Activity based probe in quenched (A) and unquenched (B) state. Following cleavage of the target
peptide sequence, fluorescence is increased. Fluorescence may be targeted to the protease using
chemistry directed against the active site. F-fluorophore, Q-quencher.
Chapter 1
50
One problem of this technique is that following protease activity diffusion of the
cleaved ABP from the protease will occur. A method to keep the signal in close
vicinity is to utilise polycationic (negatively charged) sequences that are taken up by
cells. These have been termed cell penetrating peptides. In the absence of proteases
their association with the cell surface is prevented by a polyanionic (positively
charged) sequence that binds to the cationic sequence. The polyanionic sequence also
contains a quencher which prevents fluorescence. The two sequences are linked by a
peptide with a specific protease cleavage site. Upon cleavage by tissue proteases, the
two strands separate, causing release of the fluorescent probe (now unquenched) and
uptake by the cell (Jiang, Olson et al. 2004).
1.3.2.2.3 Bioluminescence
Bioluminescence is the conversion of chemical energy to light in living organisms.
The luciferase enzymatic system is the most commonly found biological process to
achieve this conversion. The enzymes in this pathway convert the luciferin substrate
in the presence of several co-factors and adenosine triphosphate to generate
oxyluciferin and light (Wilson and Hastings 1998). Bioluminescence has been most
widely used in reporter gene assays, where the promoters of genes under study have
been linked to the luciferase gene, and the resultant light is a direct measure of
promoter activity.
The luciferase enzyme needs to be transfected into cells, limiting its use to animal
models or transgenic animals. Its expression however, can be tightly controlled when
linked to the appropriate promoter. The most commonly used luciferase enzyme
system used comes from the firefly. The emission maximum of the firefly system is at
578 nm at 25oC in vitro, but shifts to 612 nm at 37
oC (Zhao, Doyle et al. 2005), which
may be troublesome for use in vivo due to the high levels of tissue absorption.
Mutation of another luciferase from Luciola cruciata has allowed a shift in the
emission maximum from 560nm to 613 nm and 605 nm, allowing a greater diversity
of colours (Nakatsu, Ichiyama et al. 2006). This raises the possibility of obtaining
further mutants that operate in the NIR spectrum. The luciferin substrate also needs to
be delivered to where the enzyme is expressed, which may restrict the visualisation of
certain organs. Use of different substrates with different pharmacokinetic profiles will
also yield different dynamics of light production (Bhaumik and Gambhir 2002).
Chapter 1
51
1.3.3 Fluorescent Imaging in Arthritis
Rheumatoid synovium is characterized by hyperplasia of the synovial lining layer and
marked infiltration by lymphocytes, macrophages and plasma cells. Locally produced
inflammatory mediators and the subsequent up-regulation of adhesion molecules at
sites of inflammation are pivotal to RA pathogenesis (Tak, Taylor et al. 1996).
Sensitive and specific methods of imaging are required for the detection of early
inflammatory changes to the synovium in patients with arthritis and for monitoring
response to treatment. In vivo imaging in the animal model is of vital importance in
developing these techniques. Novel therapies can be better evaluated using sensitive,
reproducible imaging of disease activity that reflects underlying molecular changes.
1.3.3.1.1 Invasive In Vivo Optical Imaging
Intravital fluorescence microscopy in inflammatory arthritis was first performed in
1993. This technique allows measurement of microhaemodynamic parameters as well
as leukocyte EC interactions (Menger and Lehr 1993). Blood vessel diameter
(Veihelmann, Szczesny et al. 1998; Veihelmann, Harris et al. 1999) and capillary
density (Schmitt-Sody, Landes et al. 2003) were measured in the synovial
microcirculation of the mouse knee joint following surgical exposure of the area of
interest. The inhibitory effect of recombinant anti-leukoproteinase, a physiological
inhibitor of granulocyte serine proteases on blocking the interactions of leukocytes on
the endothelial lining was investigated by microscopic imaging of leukocyte rolling
and adhesion in vivo (Sehnert, Gierer et al. 2006). A limitation of this technique is the
need to expose surgically the area for direct microscopy.
1.3.3.1.2 Non- targeted imaging in animal models of arthritis
Disordered new vessels have increased vascular leakiness to macromolecules
compared to normal vessels (Levick 1981) This is discussed in Section 1.2.4. Due to
these local permeability changes non-specific dye deposition was used to visualise the
arthritic joint in vivo. Enhanced localised deposition of free dye (not bound to a
disease specific antibody or other target) in the arthritic joints of animals with induced
arthritis has been examined in several studies. The NIR fluorophore Cy5.5 was
visualised in arthritic knee joints following induction of antigen induced arthritis in
mice (Hansch, Frey et al. 2004). This demonstrated an approximate 1.5 fold increase
in signal in arthritic compared to non arthritic joints. Two other NIR dyes were
Chapter 1
52
evaluated in a murine Borrelia-induced Lyme arthritis model (Fischer, Gemeinhardt
et al. 2006). These techniques rely on the generalised increased blood perfusion and
‘vascular leakiness’ that are recognised to be present around the inflamed joint
(Andersson, Johansson et al. 1998). This may lead to as much as a forty fold increase
in macroglobulin permeability in the inflamed joint (Levick 1981). In such cases
native dye most likely accumulates in the inflamed synovial membrane following
phagocytosis by activated macrophages. Another study has demonstrated increased
levels of fluorescence in inflamed paws with a fluorescently labelled PEGylated anti-
TNF agent compared to a non-PEGylated TNF inhibitor (Palframan, Airey et al.
2009). There is also a recognised non-specific autofluorescence change in the
absorption emission spectra of inflamed tissue (Hansch, Sauner et al. 2003), although
this phenomenon is likely to be more limited at wavelengths in the NIR spectrum.
1.3.3.1.3 Targeting of specific molecular changes in arthritis
In vivo targeting of specific molecules that have been identified as being key
components in the inflammatory cascade may help to increase specificity in assessing
disease activity levels and differentiating subsets of arthritis.
Specific deposition of dye in the arthritic joint of antigen-induced arthritic mice has
been achieved by targeting macrophages with Cy5.5 labelled anti-F4/80 antigen. The
F4/80 antigen is expressed on the macrophages when they accumulate in inflamed
joints (Hansch, Frey et al. 2004). There was however, a small increase in signal in the
uninflamed contralateral knee joints as well as increased uptake in inflamed knee
joints with the Cy5.5 labelled isotype control antibody. A similar study targeting
folate receptors on activated macrophages, demonstrated a 2.3-fold increase in signal
in inflamed compared to uninflamed joints (Chen, Mahmood et al. 2005). This
increase was greater than that obtained following injection of free dye. Arthritis has
also been detected with allogeneic leukocytes that were labelled ex vivo with
fluorescent dye and re injected into arthritic mice (Simon, Daldrup-Link et al. 2006).
Treatment with steroid reduced the signal intensity obtained. However, the degree of
quantitative analysis was hampered by a relatively small change in signal intensity
compared to the background signal.
Chapter 1
53
1.3.3.2 Activity-Based Probes in Arthritis
Amplification of fluorescent signal at the site of inflammation using protease
activatable probes may hold significant promise for in vivo imaging of arthritis,
especially of OA, as local perturbations in proteolytic activity may be comparatively
small. Cathepsins have been associated with arthritis and bone degeneration (Lang,
Horler et al. 2000). A cathepsin B activatable NIR fluorescent probe was used in a
mouse model of osteoarthritis and showed a 3-fold difference in signal intensity
between normal and osteoarthritic joints (Bhaumik and Gambhir 2002; Lai, Chang et
al. 2004). This particular probe has also been applied to tumour detection (Weissleder,
Tung et al. 1999) as well as the localisation of atherosclerotic plaques in vivo (Chen,
Tung et al. 2002). A similar probe was used to demonstrate that Methotrexate could
abrogate some of the increased signal found in arthritic joints (Wunder, Tung et al.
2004). A further study also demonstrated that specific signal could be reduced and
correlated with a decrease in clinical disease indices such as redness and measurable
paw swelling (Izmailova, Paz et al. 2007). However, these studies did not examine
whether an uncleavable form of peptide demonstrated similar signal or whether any
specific inhibitor of the protease could prevent cleavage in the arthritic joint.
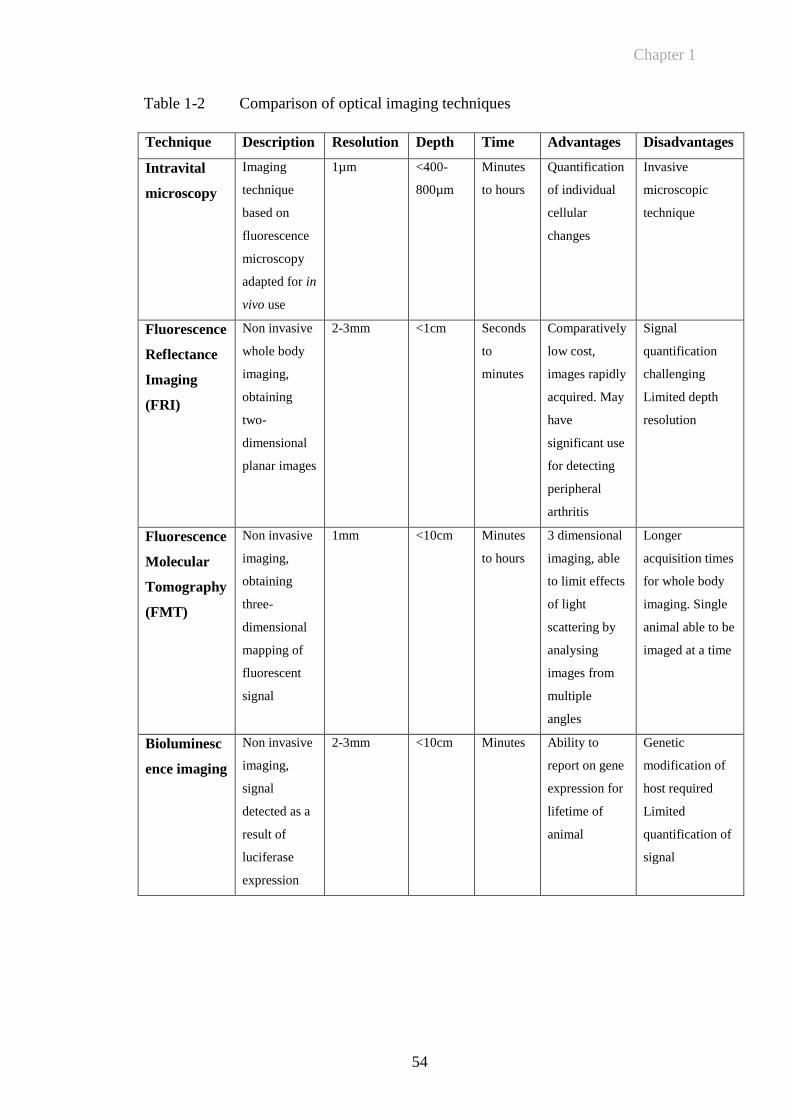
Chapter 1
54
Table 1-2 Comparison of optical imaging techniques
Technique Description Resolution Depth Time Advantages Disadvantages
Intravital
microscopy
Imaging
technique
based on
fluorescence
microscopy
adapted for in
vivo use
1µm <400-
800µm
Minutes
to hours
Quantification
of individual
cellular
changes
Invasive
microscopic
technique
Fluorescence
Reflectance
Imaging
(FRI)
Non invasive
whole body
imaging,
obtaining
two-
dimensional
planar images
2-3mm <1cm Seconds
to
minutes
Comparatively
low cost,
images rapidly
acquired. May
have
significant use
for detecting
peripheral
arthritis
Signal
quantification
challenging
Limited depth
resolution
Fluorescence
Molecular
Tomography
(FMT)
Non invasive
imaging,
obtaining
three-
dimensional
mapping of
fluorescent
signal
1mm <10cm Minutes
to hours
3 dimensional
imaging, able
to limit effects
of light
scattering by
analysing
images from
multiple
angles
Longer
acquisition times
for whole body
imaging. Single
animal able to be
imaged at a time
Bioluminesc
ence imaging
Non invasive
imaging,
signal
detected as a
result of
luciferase
expression
2-3mm <10cm Minutes Ability to
report on gene
expression for
lifetime of
animal
Genetic
modification of
host required
Limited
quantification of
signal
Chapter 1
55
1.4 Animal Models of RA and Inflammation
1.4.1 Collagen Induced Arthritis: A Well Validated Pre Clinical Model of RA
Animal models of arthritis are of paramount importance as experimental tools for
many aspects of research including the evaluation of novel therapies, searching for
markers of disease progression and evaluating novel imaging techniques, such as
those described in preceding sections. RA and other inflammatory joint disorders
remain an important target for drug development and animal models of arthritis have
been widely used in testing novel therapies. CIA is an animal model of RA, in which
disease is induced in genetically susceptible mice with type II bovine collagen. This
technique was first described in rats in 1977 (Trentham, Townes et al. 1977), and
subsequently established in mice (Courtenay, Dallman et al. 1980). Type II collagen
is a major constituent protein of cartilage in the diarthrodial joints, the predominant
site of inflammation in RA (Myers, Rosloniec et al. 1997). Intradermal immunisation
of genetic susceptible mouse strains, mainly DBA/1 or B10RIII mice, with bovine
type II collagen (CII) emulsified in CFA triggers an autoimmune response to mouse
CII that leads to inflammatory arthritis. Susceptibility to collagen-induced arthritis is
associated with MHC class II genes, although non-MHC genes also play a role. Both
B- and T-lymphocytes are important in the pathogenesis of collagen-induced arthritis.
Histologically, hallmarks of both CIA and RA are infiltration of the subsynovial
tissue by inflammatory cells, synovial hyperplasia, angiogenesis as well as erosion of
cartilage and bone by a pannus-like tissue (Trentham, Townes et al. 1977; Wooley,
Luthera et al. 1981; Lee and Weinblatt 2001). Heterologous (e.g. bovine or chicken)
CII is used for the immunisation. Arthritis tends to follow an acute, self-limiting
disease course. The arthritis starts approximately three to four weeks after
immunisation, usually in a limited number of joints and gradually spreads to multiple
joints (Holmdahl, Bockermann et al. 2002). In mice, immunisation with bovine,
chicken, or rat type II collagen usually leads to a relatively acute form of arthritis. By
contrast, immunisation with murine collagen results in a more chronic disease. This
difference may be due to the extent to which the immune response is targeted at self
collagen, as opposed to the collagen used for immunisation (Holmdahl, Jansson et al
1986; Holmdahl, Andersson et al 1989). CIA been widely used to study mechanisms
involved in the arthritic process and to identify potential new therapies for RA. Pro-
inflammatory cytokines, such as TNF and IL-1 are expressed in the arthritic joints
Chapter 1
56
of both murine CIA and RA. A number of studies initially focussed on the effects of
TNF blockade during the induction phase of CIA (Piguet, Grau et al. 1992;
Thorbecke, Shah et al. 1992) subsequently the effect of anti-TNF treatment in mice
with established CIA was demonstrated. This showed that in mice treated with
intraperitoneal injection of anti-TNF MoAb there was a dose dependent reduction in
the severity of arthritis and that joints were protected from erosive changes (Williams,
Feldmann et al. 1992). While CIA is well validated it does have some unique
components to disease pathogenesis and has classically been a strain dependent model
of arthritis, with H-2q and H-2
r stains in DBA/1 mice showing the greatest degree of
susceptibility. One issue, for example is that the T-cell proliferative response to type
II collagen in immunised DBA/1 mice peaks a significant amount of time before the
onset of arthritis and is in decline by the time of disease onset and that the disease
course is generally relatively acute, peaking at 4 to 5 weeks following immunisation
and then gradually resolving. For this reason a protocol for the induction of arthritis in
C57BL/6 mice utilising chicken type II collagen has been developed (Inglis, Simelyte
et al. 2008). The development of arthritis in this model is associated with a very
strong T-cell response to collagen that remains elevated for up to 3 months post
immunisation (Inglis, Criado et al. 2007). Interestingly this disease also has other
differences in phenotype with less swelling and a more gradual increase in clinical
score, with a later (6-8 weeks after onset) more significant inflammatory cell
infiltration compared to DBA/1 mice. A further limitation of the classic CIA model in
DBA/1 mice is that most transgenic and knockout strains of mice are on a C57BL/6
background (H-2b) hence the further usefulness of having a reliable method of
arthritis induction in BL/6 mice.
Animal models of arthritis provide a vital ongoing test bed for developing novel
molecular targets for the future treatment of inflammatory disease. For example,
several possible inhibitors of angiogenesis, including soluble VEGFR1, have been
shown to reduce disease severity in CIA (Miotla, Maciewicz et al 2000; Afuwape,
Feldmann et al 2003; Sumariwalla, Cao et al 2003). More recently it has been
demonstrated that anti-CD3 therapy is highly effective for the treatment of CIA with
the capacity to generate antiarthritic CD8+ Treg cells and expand the relative numbers
of CD4+ Treg cells (Notley, McCann et al.). These examples demonstrate the
requirement for both an effective animal model of RA and the need for targeted
Chapter 1
57
molecular therapy that can be monitored in vivo and in the future translated from the
animal model into human studies.
1.4.2 Acute Models of Inflammation
In addition to models of arthritis such as CIA, a number of different models that
induce acute paw oedema in mice or rats have been developed. Initial studies focused
on examining the nocioceptive and inflammatory alterations in rodents and
subsequently on evaluating the efficacy and mechanism of action of compounds such
as anti-inflammatory drugs. Rat paw oedema was first characterised using carageenin
induced inflammation. Carageenan derived from red algae produces a local
inflammation following local injection (Winter, Risley et al. 1962; Di Rosa 1971; Di
Rosa 1971; Di Rosa, Papadimitriou et al. 1971). It was demonstrated that carrageenan
intraplantar injection in rats produces a monophasic oedematous response in the rat
paw that is accompanied by inflammatory cell migration, marked nocioceptive
alterations and increased NO levels (Salvemini, Wang et al. 1996). In this study rat
paw oedema was found to be maximal by six hours and remained elevated by 10
hours and could be abrogated by constitutive and inducible nitric oxide synthetase
inhibitors with concomitant decreases in neutrophil infiltration. This group have
examined in more detail the participation of TNF in the inflammatory and
nocioceptive responses evoked by carrageenan injected into the mouse paw. The
intraplantar injection of carrageenan (300μg) confirmed a marked and biphasic paw
oedema with peaks at 6 hours and 72 hours with significant increases in
myeloperoxidase activity that peaked at 6 hours in C57/BL6 mice. All of this activity
was significantly abrogated in TNF p55 receptor knockout mice. The systemic
administration of anti-TNF antibody produced similar decreases in paw oedema,
allodynia and myeloperoxidase (MPO) activity. Interestingly the inflammatory
responses of carreegenan were also abrogated when mice were previously treated with
the preferential inhibitor of TNF synthesis thalidomide. Another study has examined
the role of neutrophil migration in carreegenan induced paw oedema determined by
MPO staining by examining the effect of fucoidin an inhibitor of neutrophil rolling
that binds L-selectin (Cunha, Verri et al. 2008). Another technique has been to inject
zymosan into the mouse paw (Keystone, Schorlemmer et al. 1977; Gado and Gigler
1991). Zymosan is a component of the bacterial cell wall that induces an intense
inflammatory response (Lundberg and Arfors 1983). This model has again been used
Chapter 1
58
to test the short term efficacy of anti inflammatory compounds. Gado and Gigler
injected 0.1ml of a 2% suspension of zymosan into the rat paw. This caused a 90%
increase in paw volume, with a biphasic time course. The paw swelling reached a
maximum 45 minutes after injection with a second peak of swelling after 6 hours.
Zymosan has also been used as an acute model of arthritis to examine the effects of
Tenascin C, an endogenous activator of Toll like receptor 4, that has been found to be
essential for maintaining inflammation in arthritic disease (Midwood, Sacre et al.
2009). In this model rapid paw swelling was reached after 24 hours, maintained for 24
hours, with swelling still seen at 4 days with histological evidence of arthritis
demonstrating cellular infiltration and cartilage loss. Injection of TNF into the hind
paw of the rat has also been utilised to demonstrate the role of TNF in the
development of acute inflammatory hyperalgesia (Cunha, Poole et al. 1992). This
study used doses of TNF between 0.0025 and 2.5pg in 100μl of vehicle. Paw
swelling was not measured in this study. A subsequent study by Woolf and colleagues
again in rats examined the role of TNF in contributing to inflammatory sensory
hypersensitivity by inducing IL-1β and nerve growth factor (NGF)(Woolf, Allchorne
et al. 1997). This study by comparison, used much higher doses of TNF (50-500ng).
This demonstrated that IL-1 and NGF were TNF dependent at early (6 hours) but
not late (24 hours) time points, but again paw swelling was not measured in this
study. A further study by Campos and colleagues examined the relationship between
pretreatment with TNF and injection of bradykinin (Campos, Souza et al. 1998).
This study used a dose of 5ng per paw of TNF as a pretreatment which in itself did
not cause significant increases in paw volume. Subsequent injection of bradykinin did
cause significant increases in paw swelling suggesting that the prior injection of
cytokines IL-1β or TNF into the rat paw resulted in a rapid onset and significant
upregulation of B1 receptors, characterised by marked and dose dependent oedema
formation in response to further injection of bradykinin. Colleagues at The Kennedy
Institute of Rheumatology have demonstrated that TNF induces hyperalgesia and
neutrophil migration as measured by the myeloperxidase assay following injection of
20ng of TNF in 10μl of vehicle in the paws of C57Bl/6 mice. While the injection of
higher doses of TNF was noted to cause swelling the complete dose dependence of
TNF on paw swelling had not been fully delineated. They have however shown that
IL-17 induced hyperalgesia was dependent on neutrophil migration and that TNF

Chapter 1
59
induced paw swelling could be abrogated in p55 TNF receptor knockout animals.
These effects could also be blocked by the prior administration of fucoidin
(unpublished observations).
1.5 Hypothesis and Objectives
The targeting of E-selectin on activated vascular endothelium has previously been
well validated in both animal and human studies. My hypothesis was that fluorescent
imaging utilising E-selectin as a target holds significant potential as a non invasive, in
vivo molecular imaging technique in murine arthritis.
My objectives were to:
1. To establish proof-of-principle imaging of joints of mice with inflammatory
arthritis using fluorescently labelled anti-E-selectin in vivo
2. To apply fluorescence imaging to investigate the in vivo mode of action of
vascular-targeted therapies in murine inflammatory arthritis. In particular to
determine the treatment response and changes in E-selectin targeted
fluorescent imaging following administration of a novel EGF receptor
antagonist (RB200) in CIA.

Chapter 2
60
CHAPTER 2
Chapter 2
61
2 MATERIALS AND METHODS
2.1 Chemical Components
If not otherwise specified, chemicals were obtained from VWR International Ltd
(Lutterworth, UK), Sigma Aldrich (Dorset, UK) or Merck Chemicals Ltd
(Nottingham, UK) in analytical grade quality.
2.2 Cell Lines
Hybridoma cell lines expressing rat anti-mouse E-selectin IgG2a MoAb (MES-1) and
rat IgG2a isotype control antibody against dinitrophenol (DNP) were kind gifts from
Dr Derek Brown (UCB, Slough, UK) and Professor David Gray (University of
Edinburgh). The method used for cell culture is described in Section 2.4.1.
2.3 Fluorescence Reflectance Imaging Device
Optical imaging experiments were performed using a fluorescence reflectance
imaging (FRI) device (Kodak In-vivo Multispectral System FX Pro). This utilizes a
175W Xenon illumination source coupled to an automated multi-wavelength series of
excitation filters with a range of 390-770nm and emission filters between 480-830nm.
This allows a wide range of fluorescent dyes of varying wavelengths to be tested.
Fluorescence emission is captured using a monochrome interlined cooled CCD with a
pixel density of 2048x2048 pixels (Figure 2-1). Image acquisition and analysis has
been performed using proprietary Kodak software (version 5.0).
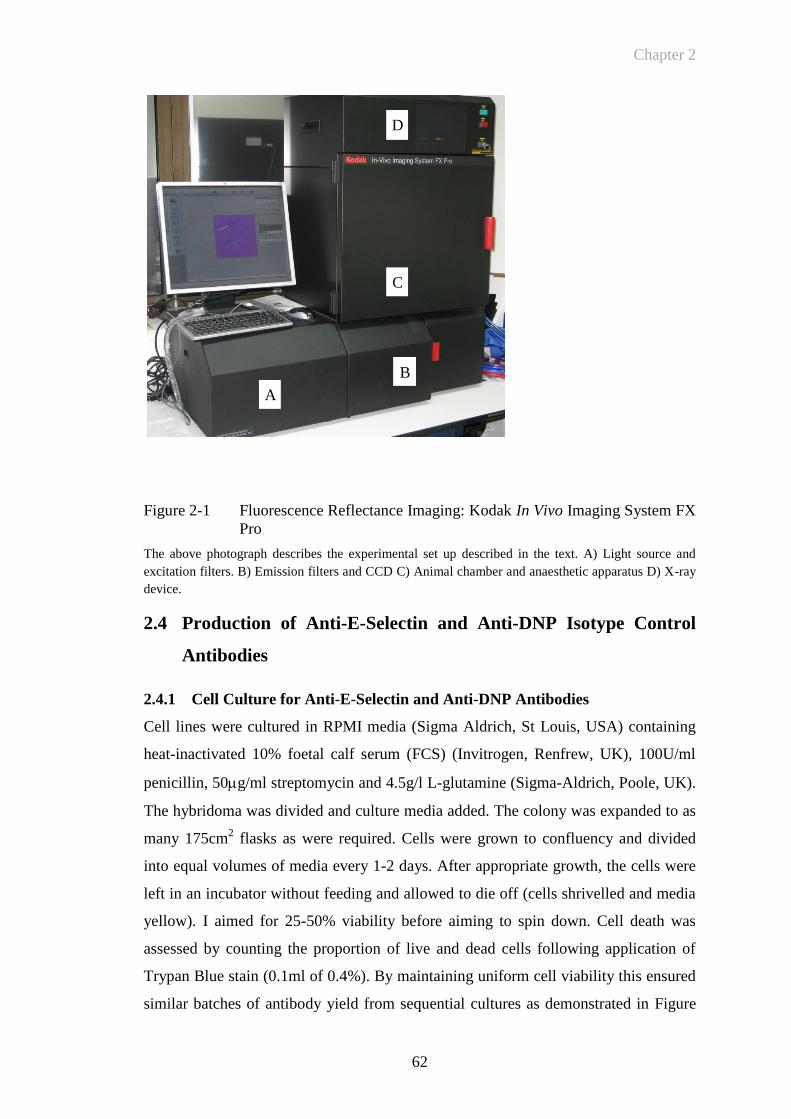
Chapter 2
62
Figure 2-1 Fluorescence Reflectance Imaging: Kodak In Vivo Imaging System FX
Pro
The above photograph describes the experimental set up described in the text. A) Light source and
excitation filters. B) Emission filters and CCD C) Animal chamber and anaesthetic apparatus D) X-ray
device.
2.4 Production of Anti-E-Selectin and Anti-DNP Isotype Control
Antibodies
2.4.1 Cell Culture for Anti-E-Selectin and Anti-DNP Antibodies
Cell lines were cultured in RPMI media (Sigma Aldrich, St Louis, USA) containing
heat-inactivated 10% foetal calf serum (FCS) (Invitrogen, Renfrew, UK), 100U/ml
penicillin, 50g/ml streptomycin and 4.5g/l L-glutamine (Sigma-Aldrich, Poole, UK).
The hybridoma was divided and culture media added. The colony was expanded to as
many 175cm2 flasks as were required. Cells were grown to confluency and divided
into equal volumes of media every 1-2 days. After appropriate growth, the cells were
left in an incubator without feeding and allowed to die off (cells shrivelled and media
yellow). I aimed for 25-50% viability before aiming to spin down. Cell death was
assessed by counting the proportion of live and dead cells following application of
Trypan Blue stain (0.1ml of 0.4%). By maintaining uniform cell viability this ensured
similar batches of antibody yield from sequential cultures as demonstrated in Figure
A
B
C
D
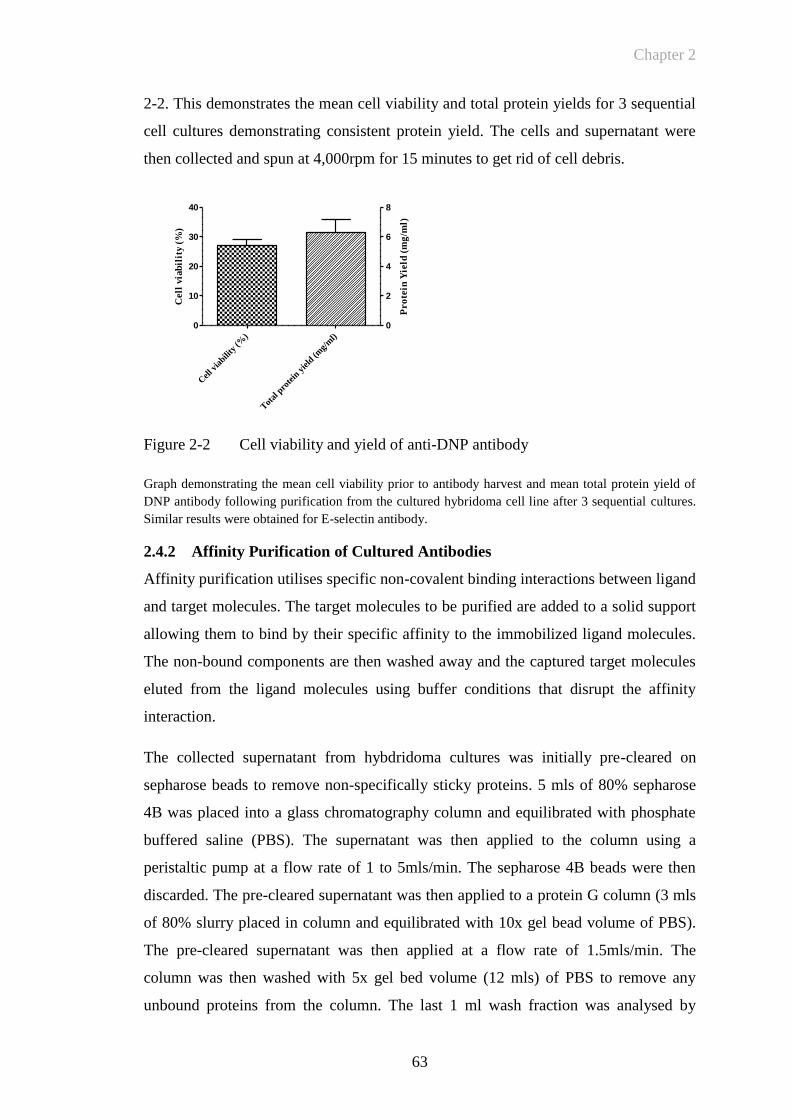
Chapter 2
63
2-2. This demonstrates the mean cell viability and total protein yields for 3 sequential
cell cultures demonstrating consistent protein yield. The cells and supernatant were
then collected and spun at 4,000rpm for 15 minutes to get rid of cell debris.
Figure 2-2 Cell viability and yield of anti-DNP antibody
Graph demonstrating the mean cell viability prior to antibody harvest and mean total protein yield of
DNP antibody following purification from the cultured hybridoma cell line after 3 sequential cultures.
Similar results were obtained for E-selectin antibody.
2.4.2 Affinity Purification of Cultured Antibodies
Affinity purification utilises specific non-covalent binding interactions between ligand
and target molecules. The target molecules to be purified are added to a solid support
allowing them to bind by their specific affinity to the immobilized ligand molecules.
The non-bound components are then washed away and the captured target molecules
eluted from the ligand molecules using buffer conditions that disrupt the affinity
interaction.
The collected supernatant from hybdridoma cultures was initially pre-cleared on
sepharose beads to remove non-specifically sticky proteins. 5 mls of 80% sepharose
4B was placed into a glass chromatography column and equilibrated with phosphate
buffered saline (PBS). The supernatant was then applied to the column using a
peristaltic pump at a flow rate of 1 to 5mls/min. The sepharose 4B beads were then
discarded. The pre-cleared supernatant was then applied to a protein G column (3 mls
of 80% slurry placed in column and equilibrated with 10x gel bead volume of PBS).
The pre-cleared supernatant was then applied at a flow rate of 1.5mls/min. The
column was then washed with 5x gel bed volume (12 mls) of PBS to remove any
unbound proteins from the column. The last 1 ml wash fraction was analysed by
Cel
l via
bility
(%)
Tot
al p
rote
in y
ield
(mg/
ml)
0
10
20
30
40
0
2
4
6
8
Cell
via
bil
ity (
%)
Pro
tein
Yie
ld (
mg
/ml)
Chapter 2
64
measuring the absorbance at 280nm (A280) to ensure all non-bound proteins were
removed, with the spectrophotometer set at zero using the same PBS used to wash the
column. If the A280 was >0.05 then the wash step was repeated until the A280 was
<0.05.
Antibodies were then eluted with 5x gel bed volume (i.e. 12 mls) of Glycine-HCl pH
2 in a tube containing 200µl of 1M tris(hydroxymethyl)aminomethane (Tris) pH 8.8
per ml of eluent. This acts to neutralize the antibodies preventing
degradation/inactivation at high pH. The last 1 ml of eluent was analysed at A280 to
ensure all bound antibodies have been eluted (spec: zero with mixture made up of 1
ml Glycine-HCl pH 2 added to 200µl 1M Tris pH 8.8 mixture, aim A280 <0.05). The
elution was repeated with one further gel bed volume of Glycine-HCl pH 2 until all
bound antibodies were eluted. All antibodies were pooled together and the yield
determined at A280 (spec: zero with mixture made up of 2 x 2.4 mls PBS added to 3x
2.4 mls Glycine-HCl pH 2 and 2.4 mls 1M Tris pH 8.8). A VivaSpin® (Sartorius,
Aubagne, France) device with molecular weight cut-off 50,000 or 100,000, buffer
exchanged with PBS was utilized to concentrate the purified antibodies. The protein
G column was washed with 10x gel bed volume (24 mls) of Glycine-HCl pH 2.
2.4.3 Measurement of Antibody Concentration Following Production and
Purification to Ensure Accurate Quantification for Labelling and
Imaging
The concentration of purified antibody was calculated by measuring absorbance at
280nm at the end of the purification process. More accurate protein concentration
measurements were also made using the Pierce BCA protein assay kit (Thermofisher,
Loughborough, UK). This method utilises the reduction of Cu2+
to Cu1+
by protein in
an alkaline medium. The subsequent detection of Cu1+
can then be made by using a
colourmetric reagent, bicinchoninic acid (BCA), the resultant complex showing
strong absorbance at 562nm. This was utilised to accurately determine the amount of
protein required for each individual labelling reaction; ensuring optimum conditions
for labelling and for optimising the dye/protein ratio and standardising protein
concentrations between target and control antibodies, in turn ensuring that comparable
amounts are used when injecting under in vivo conditions. 25μl of standard or
unknown sample was loaded onto duplicate wells of a 96 well polystyrene plate.
200μl of the working reagent, comprising of a 50:1 mixture of BCA reagent A:B were
Chapter 2
65
added to the individual wells and the plate covered and incubated at 37ºC for 30
minutes. Absorbance measurement was performed at 540nm using a plate reader and
the protein concentrations within test samples were calculated by Ascent software
(Version 2.6, Thermo Labsystems) using the 9 point standard curve as a reference.
2.4.4 Determination of Antibody Purity by SDS PAGE Prior to Labelling
The purity of anti-E-selectin and anti-DNP antibodies obtained from cell culture was
determined using sodium dodecyl sulfate polyacrylamide gel electrophoresis (SDS
PAGE; NuPAGE Novex Bis-Tris Mini Gel, Invitrogen, Paisley, UK). This is a
technique used to separate proteins according to their electrophoretic mobility. The
preparation of samples, running buffer, gel loading and running conditions were
performed according the manufacturer’s protocol. 10µl of the sample (either DNP or
E-selectin antibody at a concentration of 50µg/ml) was combined with 2.5µl of
loading buffer and 2µl of reducing agent (either NUPAGE sample reducing agent,
Invitrogen, Paisley, UK or Beta-Mercaptoethanol (2µl of 10mM solution)) and made
up to a total volume of 20μl with deionised water. Samples were then heated at 70ºC
for 10 minutes. Samples were loaded onto the gel and the gel chambers loaded with
running buffer. Electrophoresis was run at a constant 150V for 1 hour. A protein
standard molecular weight marker was used to determine the molecular weight of
component parts. 0.2% Coomasie brilliant blue stain was applied for 60 minutes. The
gel was destained, by placing in 100 mls 30% methanol. This was replaced with fresh
destain solution every half an hour for 1-2 hours. Mass spectrophotometry was
performed following excision of gel fragments (Waters Micromass Xevo QTof,
Milford, Massachusetts, USA) (courtesy of Dr Robin Wait, Kennedy Institute of
Rheumatology).
2.4.5 Fluorescent Labelling of Anti E-Selectin and Control Antibodies
Fluorescent labelling is the process of attaching a fluorophore to another molecule
such as a protein or nucleic acid. Generally, this is accomplished by using a reactive
derivative of the fluorophore that can selectively bind to a functional group on the
target molecule. Common reactive groups include amine reactive isothiocyanate
derivatives such as FITC and TRITC (derivatives of fluorescein and rhodamine)
amine reactive succinimidyl esters such as NHS-fluorescein, and sulfhydryl reactive
maleimide activated fluors such as fluorescein-5-maleimide. Reaction of any of these
Chapter 2
66
reactive dyes with another molecule results in a stable covalent bond formed between
a fluorophore and a labelled molecule.
Following a fluorescent labelling reaction, it is necessary to remove any non reacted
fluorophore from the labelled target molecule. This can be accomplished by size
exclusion chromatography, taking advantage of the size difference between
fluorophore and labelled protein, nucleic acid, etc. Fluorophores may interact with the
separation matrix and reduce the efficiency of separation. For this reason, specialized
dye removal columns that account for the hydrophobic properties of fluorescent dyes
are sometimes used. Reactive fluorescent dyes are available from many sources. They
can be obtained with different reactive groups for attachment to various functional
groups within the target molecule. They are also available in labelling kits that contain
all the components to carry out a labelling reaction. Various proprietary fluorescein
derivatives have been developed to increase signal intensity, photostability or with
different attachment groups to bind a variety of different molecules. The most
common reactive group present for antibody labelling is an active NHS ester reactive
group that will couple to primary amines forming stable conjugates. Three different
proprietary NIR dye antibody labelling kits were assessed when performing
preliminary in vivo imaging experiments. The Thermofisher DyLight 750nm dye
labelling kit was selected for further in vivo imaging experiments because it had an
efficient and reproducible conjugation reaction, confirmed effective removal of free
dye and was relatively inexpensive.
2.4.5.1 Techniques of fluorescent labelling
Anti-E-selectin and anti-DNP antibodies were prepared for conjugation according to
manufacturer’s instructions. The protocol used for fluorescent labelling of antibody
for in vivo experiments is also included in more detail in Appendix 2.2. 1mg of
protein (either anti-E-selectin or anti-DNP antibody) was used for labelling at a
concentration of 2 mg/ml. The correct concentration of protein was achieved by
adding labelling buffer. This was made by diluting Borate Buffer (0.67M) to 0.05M in
PBS: 75 μl of Borate Buffer (0.67M) was added to 925 μl of PBS. 0.5 mls of the
prepared protein was added to the vial of DyLight Fluorophore reagent and vortexed
gently. The reaction mixture was then incubated for 60 minutes at room temperature
protected from light. The samples were then mixed with purification resin and then
centrifuged for 45 seconds at ~1,000 × g to remove the storage solution.

Chapter 2
67
2.4.5.2 Measurement of the fluorescent labelling reaction
Following protein labelling and purification it is necessary to measure the fluorophore
to protein ratio. This can be calculated by measuring absorbance ratios using a
spectrophotometer. Quantification of protein: dye conjugation is essential for
predicting the amount of probe necessary to gain adequate signal intensity in an
experiment and for controlling signal intensity between experiments. While a greater
number of fluorescent molecules per target molecule may increase specific signal
intensity, over labelling can cause quenching as a result of fluorescent emissions from
one dye molecule being absorbed by neighbouring dye molecules. Over labelling may
also cause loss of biological activity of a molecule or decreased solubility. By contrast
under labelling will lead to a weakened fluorescent signal and a weakened fluorescent
probe.
2.4.5.2.1 Quantification of fluorophore labelling
The principles of absorbance are outlined below:
The ratio of the radiant power (P) transmitted to the radiant power incident (Po) on
the sample is called the transmittance, T:
Absorbance (A) is defined as the log of the reciprocal of transmittance:
A= -logT = log (1/T)
In a spectrophotometer the transmittance and absorbance of a sample depends on the
molar concentration (c), light path length in centimetres (L) and molar absorptivity (ε)
for the dissolved substance at the specified wavelength (λ) (Dean 1992).
A λ= ε c L
Beer’s Law states that molar absorbtivity is a constant (and the absorbance is
proportional to the concentration) for a given substance dissolved in a given solute
measured at a given concentration. Molar absorptivities are therefore called molar
absorption co-efficients or molar extinction co-efficients. Transmittance and
absorbance are unitless and therefore the units for molar absorptivity cancel with units
of measure in concentration and light path and have units of M-1
cm-1
. Therefore, with
a 1cm cuvette:
Chapter 2
68
A λ = ε c L = ε c when L=1cm
While there is no single correct molar extinction co-efficient for a complex molecules
such as immunoglobulins, it is possible to calculate these for the published literature
(Gill and von Hippel 1989). Differences in buffer type, pH etc can all have an effect.
Most immunoglobulins have protein extinction co-efficients (ε percent) in the range
of 12-15. Therefore in typical antibody solutions it has been assumed A2801%
= 14 or
A2800.1%
= A280 1mg/ml = 1.4 For a typical IgG, with molecular weight 150,000,
this value corresponds to a molar extinction co-efficient (ε) equal to 210,000 M-1
cm-1
2.4.5.2.2 Procedure for determining the dye:protein ratio
The maximum absorbance of the fluorescent dye molecule is described to an extent
by its extinction co-efficient (έ). Amax is the absorbance (A) of a dye solution
measured at the wavelength maximum (λmax). Together the Amax and (έ) may be
used to calculate the molar concentration of dye in a sample. Standard absorbance at
280nm (A280) is used to determine the protein concentration in a sample. However
because fluorescent dyes also absorb at 280nm a correction factor must be used to
adjust for the amount of A280 contributed by the dye. The correction factor (CF)
equals the A280 of the dye divided by its Amax. In practice this number will be very
small when dyes are used that are in the NIR range (where there will be minimal
effect from the dye on the A280 value) (Gill and von Hippel 1989; Pace, Vajdos et al.
1995).
Following removal of excess dye from the sample by dialysis as described in the
protocol the absorbance was measured at 280nm using a spectrophotometer (Perkin
Elmer lambda Bio 20, Massachusetts, USA) with a 1cm light path.
Absorbance of the protein dye conjugate was then measured at the λmax for the dye
molecule. Calculation of protein molarity and degree of labelling was measured using
the following parameters:
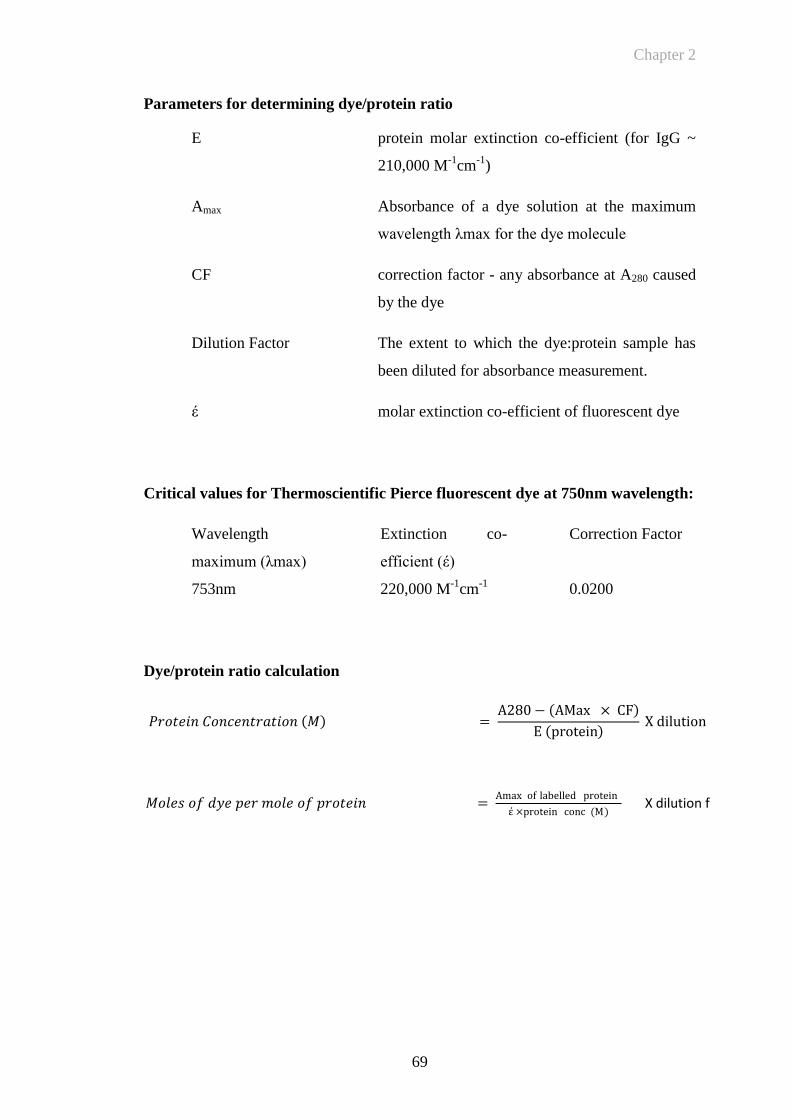
Chapter 2
69
Parameters for determining dye/protein ratio
E protein molar extinction co-efficient (for IgG ~
210,000 M-1
cm-1
)
Amax Absorbance of a dye solution at the maximum
wavelength λmax for the dye molecule
CF correction factor - any absorbance at A280 caused
by the dye
Dilution Factor The extent to which the dye:protein sample has
been diluted for absorbance measurement.
έ molar extinction co-efficient of fluorescent dye
Critical values for Thermoscientific Pierce fluorescent dye at 750nm wavelength:
Wavelength
maximum (λmax)
Extinction co-
efficient (έ)
Correction Factor
753nm 220,000 M-1
cm-1
0.0200
Dye/protein ratio calculation
𝑃𝑟𝑜𝑡𝑒𝑖𝑛 𝐶𝑜𝑛𝑐𝑒𝑛𝑡𝑟𝑎𝑡𝑖𝑜𝑛 𝑀 = A280 − AMax × CF
E protein X dilution factor
𝑀𝑜𝑙𝑒𝑠 𝑜𝑓 𝑑𝑦𝑒 𝑝𝑒𝑟 𝑚𝑜𝑙𝑒 𝑜𝑓 𝑝𝑟𝑜𝑡𝑒𝑖𝑛 = Amax of labelled protein
έ ×protein conc (M) X dilution factor
Chapter 2
70
The sample was dialysed to ensure that no free dye following dye protein conjugation
was present in the sample this is considered to be especially important because free
dye can be visualised as having tracked to sites of inflammation (Hansch, Frey et al.
2004). 50µl of sample was diluted in 450µl of PBS and placed into a 10,000MW cut-
off dialysis cassette (Pierce Slide-A-Lyzer 10K cut-off cat no 66380) and placed in 3l
of 1x PBS for 4 hours. 3l of PBS was buffer exchanged after 4 hours and then left for
12 hours in a cold room. The sample was removed from the cassette and absorbance
was remeasured at A280 and the Amax of the dye to determine whether there had
been any change in the dye-protein ratio.
2.4.6 Measurement of The Immunoreactivity of DNP and E-Selectin Antibodies
Pre and Post Labelling by ELISA
Enzyme linked immunoabsorbent assay (ELISA) is an immunoassay frequently
applied to determine the concentration of a specific protein in a sample. The method
of sandwich ELISA makes use of two antibodies that bind to epitopes that do not
overlap on the antigen of interest. During the first step, a highly purified antibody
(capture antibody) is non-covalently adsorbed onto plastic microtiter plates creating a
solid phase. Excess antibody is removed by washing and samples are applied to the
plate. Diluted standard samples of the antigen are employed to constitute a standard
curve for calculation of the antigen concentration in tissue samples. The immobilized
antibodies serve to specifically capture soluble proteins present in unknown samples.
After washing away unbound sample, the captured antigens are detected by biotin-
conjugated antibody (detection antibody) that binds to a second epitope on the
antigen. Streptavidin-labelled horseradish peroxidase (HRP) binds to the biotin which
is linked to the detection antibody. Following the addition of a chromogenic substrate,
the absorbance of coloured product generated by the bound, enzyme-linked detection
reagents is measured spectrophotometrically on an ELISA plate reader at an
appropriate optical density (OD).
ELISA was performed to confirm the immunoreactivity of anti-E-selectin antibody
before and after conjugation. Following each step the ELISA plate was washed with
0.1% PBS/Tween. The plate was coated with 100μl of recombinant mouse E-selectin
at a concentration of 3g/ml (recombinant mouse E-selectin, CD62E, Fc chimera,
R&D Systems, Minneapolis, USA). The plate was covered and left overnight. Wells
were then blocked with 200µl of 2% BSA/PBS and incubated for 1-2 hours at room
Chapter 2
71
temperature on a rotating platform. 100µl of either anti-DNP or E-selectin antibody
was added at a concentration of 2ng/ml and the plate left for 1hr at room temperature.
This was followed by the addition of 100µl of biotinylated rabbit anti-rat IgGa at a
concentration of 0.5μg/ml (Vector, Burlingame, CA, USA) and left for a further hour.
0.5g/ml of streptavidin conjugated to horseradish peroxidase (HRP; R&D Systems,
Minneapolis, USA) was left for a maximum of 1 hour. 100µl of 3,3’,5,5’-
tetramethylbenzidine (TMB) (KPL, Gaithersburg, USA) was used as substrate (equal
volumes of substrates A and B). 50µl of stop solution (2M H2S04) was then added
resulting in a colour change from turquoise to yellow. The reaction was then read at
450nm on a Multiskan Plate Reader (Thermoscientific, Loughborough, UK). Binding
was quantified using a standard curve of rat anti-mouse E-selectin IgG2a MoAb
(R&D Systems, Minneapolis, USA). This was calculated by the accompanying
computer software Ascent, version 2.6 (Thermoscientific, Waltham, MA, USA).
2.4.7 Endothelial PY4.1 Cell Culture
The endothelial cell line (EC) used in this study was PY4.1, a mouse EC line derived
from hemangiomas induced by the expression of the polyoma early region in
transgenic mice. Cells were a kind gift from Dr Victoria Bautch, University of North
Carolina, Chapel Hill, USA. The cells retain EC properties such as a characteristic
cobblestone appearance at confluency, contact-inhibited growth, and active uptake of
acetylated low density lipoprotein. Expression analysis shows that the cells express
both the polyoma transgene and the von Willebrand factor, an EC marker. These
properties confirm the endothelial nature of this cell line (Dubois, Kolpack et al.
1991; RayChaudhury, Frazier et al. 1994). In addition PY4.1 cells stimulated with
TNF demonstrate increased lymphocyte binding, following upregulation of
cytokines (Heyward, Dubois-Stringfellow et al. 1995). Cells were maintained in
Dulbecco’s modified eagles medium (DMEM) (ATCC, Teddington, UK)
supplemented with 10% FCS (Gibco, Invitrogen, Paisley, UK) and 100 U/ml
penicillin and 0.1 mg/ml streptomycin (PAA, Yeovil, UK) as recommended by
ATCC. The cell line was maintained in a humidified incubator at 37C and 5% CO2.
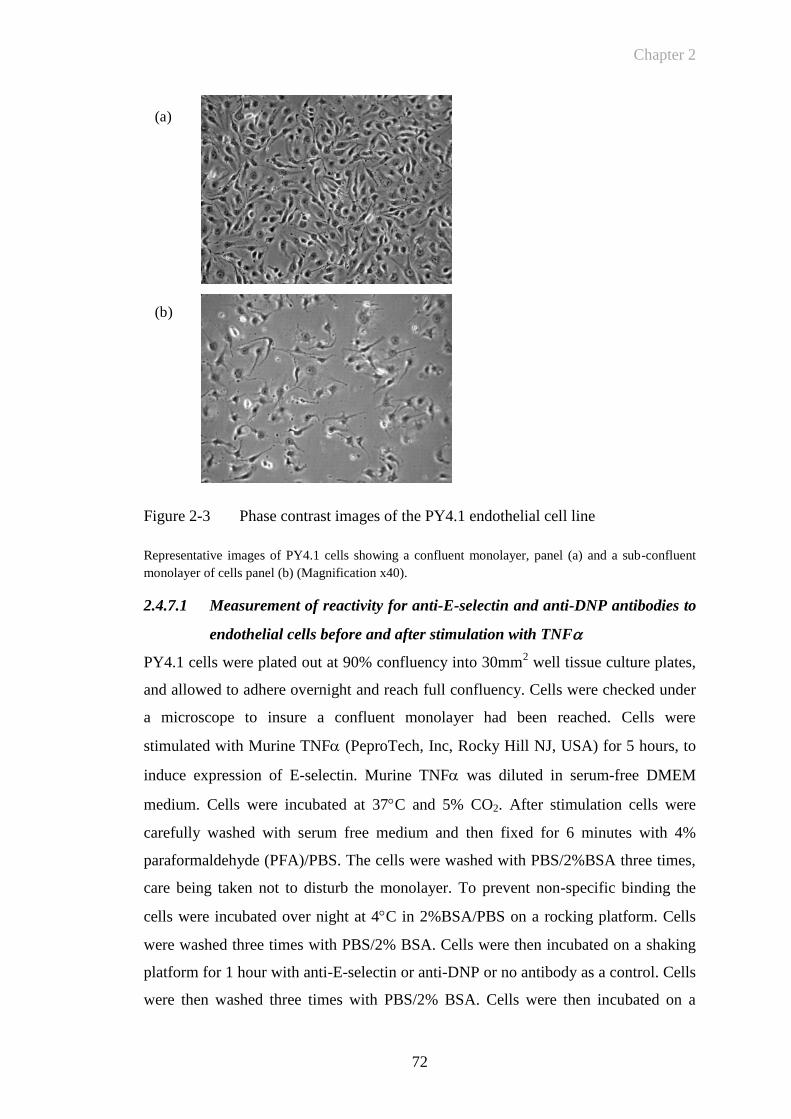
Chapter 2
72
Figure 2-3 Phase contrast images of the PY4.1 endothelial cell line
Representative images of PY4.1 cells showing a confluent monolayer, panel (a) and a sub-confluent
monolayer of cells panel (b) (Magnification x40).
2.4.7.1 Measurement of reactivity for anti-E-selectin and anti-DNP antibodies to
endothelial cells before and after stimulation with TNF
PY4.1 cells were plated out at 90% confluency into 30mm2 well tissue culture plates,
and allowed to adhere overnight and reach full confluency. Cells were checked under
a microscope to insure a confluent monolayer had been reached. Cells were
stimulated with Murine TNF (PeproTech, Inc, Rocky Hill NJ, USA) for 5 hours, to
induce expression of E-selectin. Murine TNF was diluted in serum-free DMEM
medium. Cells were incubated at 37C and 5% CO2. After stimulation cells were
carefully washed with serum free medium and then fixed for 6 minutes with 4%
paraformaldehyde (PFA)/PBS. The cells were washed with PBS/2%BSA three times,
care being taken not to disturb the monolayer. To prevent non-specific binding the
cells were incubated over night at 4C in 2%BSA/PBS on a rocking platform. Cells
were washed three times with PBS/2% BSA. Cells were then incubated on a shaking
platform for 1 hour with anti-E-selectin or anti-DNP or no antibody as a control. Cells
were then washed three times with PBS/2% BSA. Cells were then incubated on a
(a)
(b)
Chapter 2
73
shaking platform for 1 hour with biotinylated rabbit anti-rat IgGa (Vector,
Burlingame, CA, USA) at a concentration of 0.5μg/ml. Cells were washed three times
with PBS/2% BSA. Streptavidin HRP (R&D Systems, Minneapolis, MN USA)
diluted 1:400 was added to the plates and incubated for 45 minutes on a shaking
platform. Cells were washed three times with PBS/2% BSA. TMB substrate and TMB
substrate B (KPL, Gaithersburg, Maryland, USA) mixed together in equal volumes
were then added to the plate and blue colour allowed to develop. Acid Stop solution
(2M H2SO4) was added to terminate the reaction and change the plate contents to
yellow so that colouration could be read on a plate reader at 450nm.
For fluorescence imaging, cells were plated at 90% confluence onto Lab-Tek
Flaskette glass slides (Nalge Nunc, New York, USA), followed by stimulation in the
absence or presence of TNF for 5 hours. Following blocking overnight, cells were
incubated with anti-DNP or anti-E-selectin antibodies at a concentration of 2μg/ml.
Cells were washed and incubated with biotinylated rabbit anti-rat IgGa (Vector,
Burlingame, CA, USA; 0.5μg/ml) for 1 hour, followed by streptavidin Alexa Fluor
488 (0.1g/ml; Invitrogen, Renfrew, UK). Cells were mounted using VectaShield
Mounting Medium with DAPI nuclear counterstain (Vector Laboratories Inc,
Burlingame, CA, USA) and images were acquired on a Nikon T2000u microscope,
(Nikon, Belmont, CA, USA).
2.5 Animal Models of Inflammation for In Vivo Imaging
Experiments
2.5.1 Laboratory Animal Care and Regulatory Approval
Male DBA/1-Ola/Hsd mice (H-2q) aged 8-12 weeks were purchased from Harlan
Laboratories UK (Blackthorn, Bicester, UK) for the collagen induced arthritis model.
Male C57BL/6J (H-2b) mice aged 6 weeks were purchased for the TNF induced paw
oedema model. Mice were housed in groups of 6, and were maintained at 21°C ± 2°C
on a 12-hour light/dark cycle with food and water ad libitum. They were maintained
under standard conditions at the Biological Service Unit (BSU) of the Kennedy
Institute of Rheumatology. All studies were performed in accordance with the UK
Animals (Scientific Procedures) Act 1986 regulations for the handling and use of
laboratory animals and performed under PPL 70/6533: Identifying and targeting
mediators of inflammation.
Chapter 2
74
2.5.2 Collagen Induced Arthritis
The most widely used mouse model to study RA is collagen-induced arthritis (CIA).
Type II collagen-induced arthritis was first described in rats in 1977 (Trentham,
Townes et al. 1977), and subsequently established in mice (Courtenay, Dallman et al.
1980) as described in Section 1.4.1.
2.5.2.1 Purification of type II collagen
Experimental arthritis can be induced in susceptible mouse strains by immunisation
with either heterologous (e.g. bovine, chicken) or homologous type II collagen. Type
II collagen is the most abundant collagen found in hyaline cartilage (e.g. in synovial
joints, sternum, respiratory tract), comprising 80-90% of the total collagen content.
For all experiments, type II collagen was purified from bovine articular cartilage,
obtained from the femoral heads of 2-3 month old calves, following the method
originally performed by Miller (Miller 1972) and adapted from (Inglis, Simelyte et al.
2008).
The bovine articular cartilage were powdered using a liquid nitrogen freezer-mill
(Spex Industries Inc, Metuchen, NJ, USA). To remove proteoglycans, 5 volumes of
4M guanidine hydrochloride in 0.05M Tris (pH 7.5) were added to the powdered
cartilage and left stirring over night at 4°C. The cartilage was pelleted at 12,000 rpm
for 1 hour at 4ºC. The insoluble residue was washed 2-3 times by stirring in 0.5M
acetic acid followed by centrifugation. The pellet was then washed in 20 volumes of
0.5M acetic acid to eliminate the remaining guanidine. The pH was adjusted to pH 2.8
using 70% formic acid. 1g of pepsin was added for every 20g of cartilage (wet
weight). This was left stirring for 48 hours at 4ºC. The sample was then centrifuged
and the supernatant retained. To precipitate type II collagen from the supernatant
NaCl (powder) was added gradually with stirring to produce a final concentration of
0.89 M. This was left to equilibrate overnight at 4ºC and then centrifuged at 14,000g
for 1 hour at 4ºC. The pellet dissolved in 0.1M acetic acid. The residual pepsin was
inactivated by dialysing against 0.02M Na2PO4 (pH 9.4). This was then centrifuged
and then the pellet redissolved in 0.5M acetic acid. Finally this was dialysed
exhaustively (at least 10 changes of solution) against 10 litres acetic acid (0.5M). The
collagen was freeze-dryed and stored in a dessicator at 4°C or -20°C. For
immunization, collagen was dissolved at 4 mg/ml in 0.1M acetic acid overnight.
Chapter 2
75
2.5.2.2 Induction of arthritis
To induce arthritis in male DBA/1 mice, animals were administered a combination of
Isofluorane (4%) and Oxygen (1l/min) by a gaseous anaesthetic delivery device
(Vetech, UK) and shaved at the base of the tail. In-house prepared bovine type II
collagen as described above was emulsified with an equal volume of complete
Freund’s adjuvant (CFA; DIFCO, Detroit, MI, USA). Each mouse received an
intradermal injection of 200 µg bovine type II collagen (bCII) emulsified in CFA into
the base of their tail.
2.5.2.3 Evaluation of arthritis
In order to determine onset and development of arthritis in the acute CIA models,
mice were examined daily 14 days following immunisation. Arthritis was
characterised by evaluation of joint properties and inflammation of surrounding
tissues. Disease onset was considered as the day that paw swelling or erythema in the
paws could be observed. The disease severity was recorded for each paw daily using
the following scoring system based on the visual signs of arthritis: 0 = normal paw, 1
= mild swelling and/or erythema of the joint or individual digits; 2 = moderate
swelling and erythema, 3 = moderate swelling and erythema accompanied with joint
rigidity. An arthritis score (range 0 - 12) was assigned to each mouse by summing up
the score of each paw. For clinical monitoring of CIA development in conjunction
with the arthritis score, paw swelling was assessed by measuring the diameter of the
hind paws using microcallipers (Röhm BG Ltd, Kingston-upon-Thames, UK).
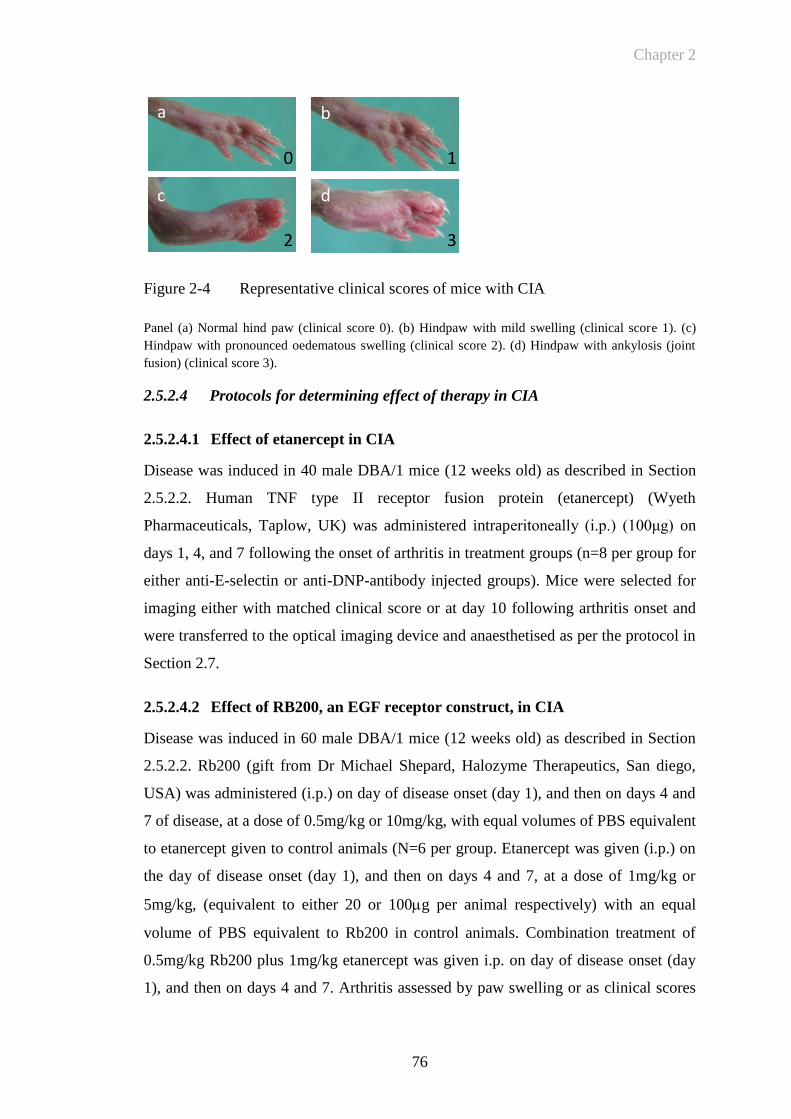
Chapter 2
76
Figure 2-4 Representative clinical scores of mice with CIA
Panel (a) Normal hind paw (clinical score 0). (b) Hindpaw with mild swelling (clinical score 1). (c)
Hindpaw with pronounced oedematous swelling (clinical score 2). (d) Hindpaw with ankylosis (joint
fusion) (clinical score 3).
2.5.2.4 Protocols for determining effect of therapy in CIA
2.5.2.4.1 Effect of etanercept in CIA
Disease was induced in 40 male DBA/1 mice (12 weeks old) as described in Section
2.5.2.2. Human TNF type II receptor fusion protein (etanercept) (Wyeth
Pharmaceuticals, Taplow, UK) was administered intraperitoneally (i.p.) (100μg) on
days 1, 4, and 7 following the onset of arthritis in treatment groups (n=8 per group for
either anti-E-selectin or anti-DNP-antibody injected groups). Mice were selected for
imaging either with matched clinical score or at day 10 following arthritis onset and
were transferred to the optical imaging device and anaesthetised as per the protocol in
Section 2.7.
2.5.2.4.2 Effect of RB200, an EGF receptor construct, in CIA
Disease was induced in 60 male DBA/1 mice (12 weeks old) as described in Section
2.5.2.2. Rb200 (gift from Dr Michael Shepard, Halozyme Therapeutics, San diego,
USA) was administered (i.p.) on day of disease onset (day 1), and then on days 4 and
7 of disease, at a dose of 0.5mg/kg or 10mg/kg, with equal volumes of PBS equivalent
to etanercept given to control animals (N=6 per group. Etanercept was given (i.p.) on
the day of disease onset (day 1), and then on days 4 and 7, at a dose of 1mg/kg or
5mg/kg, (equivalent to either 20 or 100g per animal respectively) with an equal
volume of PBS equivalent to Rb200 in control animals. Combination treatment of
0.5mg/kg Rb200 plus 1mg/kg etanercept was given i.p. on day of disease onset (day
1), and then on days 4 and 7. Arthritis assessed by paw swelling or as clinical scores
a b
c d
0 1
2 3

Chapter 2
77
based on all 4 paws. Fluorescence imaging in vivo was performed on day 10, animals
were injected with anti-mouse E-selectin MoAb labelled with Thermofisher DyLight
750nm near infrared probe (excitation/emission spectra 752nm/778nm respectively).
In vivo imaging studies were undertaken at 2-24 hours following intravenous (i.v.)
injection of labelled antibody using a near infrared optical in vivo imaging system, as
described in Section 2.7.
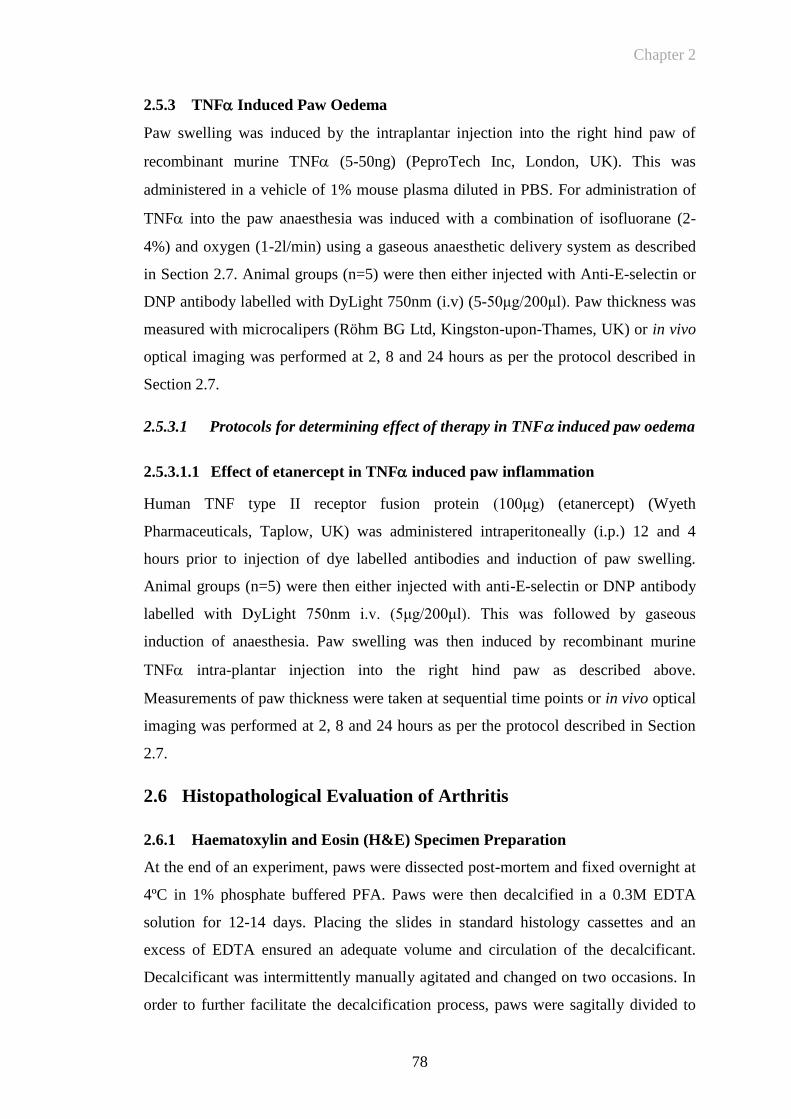
Chapter 2
78
2.5.3 TNF Induced Paw Oedema
Paw swelling was induced by the intraplantar injection into the right hind paw of
recombinant murine TNF (5-50ng) (PeproTech Inc, London, UK). This was
administered in a vehicle of 1% mouse plasma diluted in PBS. For administration of
TNF into the paw anaesthesia was induced with a combination of isofluorane (2-
4%) and oxygen (1-2l/min) using a gaseous anaesthetic delivery system as described
in Section 2.7. Animal groups (n=5) were then either injected with Anti-E-selectin or
DNP antibody labelled with DyLight 750nm (i.v) (5-50μg/200μl). Paw thickness was
measured with microcalipers (Röhm BG Ltd, Kingston-upon-Thames, UK) or in vivo
optical imaging was performed at 2, 8 and 24 hours as per the protocol described in
Section 2.7.
2.5.3.1 Protocols for determining effect of therapy in TNF induced paw oedema
2.5.3.1.1 Effect of etanercept in TNF induced paw inflammation
Human TNF type II receptor fusion protein (100μg) (etanercept) (Wyeth
Pharmaceuticals, Taplow, UK) was administered intraperitoneally (i.p.) 12 and 4
hours prior to injection of dye labelled antibodies and induction of paw swelling.
Animal groups (n=5) were then either injected with anti-E-selectin or DNP antibody
labelled with DyLight 750nm i.v. (5μg/200μl). This was followed by gaseous
induction of anaesthesia. Paw swelling was then induced by recombinant murine
TNF intra-plantar injection into the right hind paw as described above.
Measurements of paw thickness were taken at sequential time points or in vivo optical
imaging was performed at 2, 8 and 24 hours as per the protocol described in Section
2.7.
2.6 Histopathological Evaluation of Arthritis
2.6.1 Haematoxylin and Eosin (H&E) Specimen Preparation
At the end of an experiment, paws were dissected post-mortem and fixed overnight at
4ºC in 1% phosphate buffered PFA. Paws were then decalcified in a 0.3M EDTA
solution for 12-14 days. Placing the slides in standard histology cassettes and an
excess of EDTA ensured an adequate volume and circulation of the decalcificant.
Decalcificant was intermittently manually agitated and changed on two occasions. In
order to further facilitate the decalcification process, paws were sagitally divided to
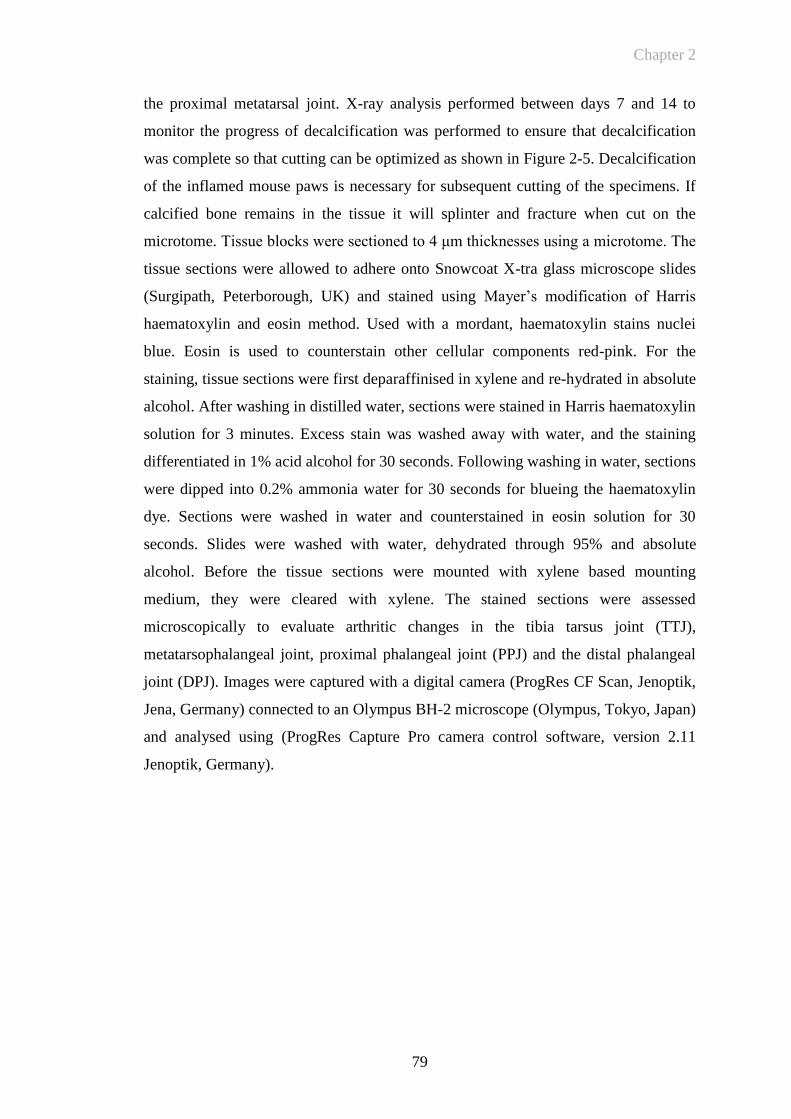
Chapter 2
79
the proximal metatarsal joint. X-ray analysis performed between days 7 and 14 to
monitor the progress of decalcification was performed to ensure that decalcification
was complete so that cutting can be optimized as shown in Figure 2-5. Decalcification
of the inflamed mouse paws is necessary for subsequent cutting of the specimens. If
calcified bone remains in the tissue it will splinter and fracture when cut on the
microtome. Tissue blocks were sectioned to 4 μm thicknesses using a microtome. The
tissue sections were allowed to adhere onto Snowcoat X-tra glass microscope slides
(Surgipath, Peterborough, UK) and stained using Mayer’s modification of Harris
haematoxylin and eosin method. Used with a mordant, haematoxylin stains nuclei
blue. Eosin is used to counterstain other cellular components red-pink. For the
staining, tissue sections were first deparaffinised in xylene and re-hydrated in absolute
alcohol. After washing in distilled water, sections were stained in Harris haematoxylin
solution for 3 minutes. Excess stain was washed away with water, and the staining
differentiated in 1% acid alcohol for 30 seconds. Following washing in water, sections
were dipped into 0.2% ammonia water for 30 seconds for blueing the haematoxylin
dye. Sections were washed in water and counterstained in eosin solution for 30
seconds. Slides were washed with water, dehydrated through 95% and absolute
alcohol. Before the tissue sections were mounted with xylene based mounting
medium, they were cleared with xylene. The stained sections were assessed
microscopically to evaluate arthritic changes in the tibia tarsus joint (TTJ),
metatarsophalangeal joint, proximal phalangeal joint (PPJ) and the distal phalangeal
joint (DPJ). Images were captured with a digital camera (ProgRes CF Scan, Jenoptik,
Jena, Germany) connected to an Olympus BH-2 microscope (Olympus, Tokyo, Japan)
and analysed using (ProgRes Capture Pro camera control software, version 2.11
Jenoptik, Germany).
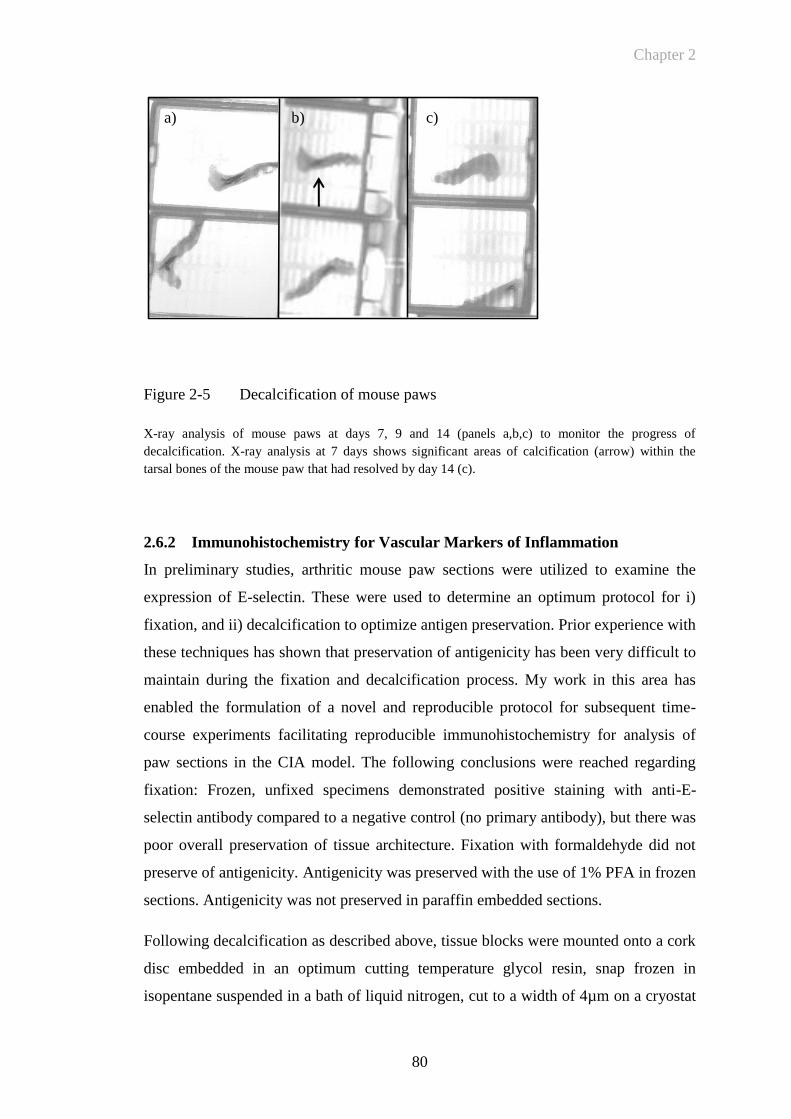
Chapter 2
80
Figure 2-5 Decalcification of mouse paws
X-ray analysis of mouse paws at days 7, 9 and 14 (panels a,b,c) to monitor the progress of
decalcification. X-ray analysis at 7 days shows significant areas of calcification (arrow) within the
tarsal bones of the mouse paw that had resolved by day 14 (c).
2.6.2 Immunohistochemistry for Vascular Markers of Inflammation
In preliminary studies, arthritic mouse paw sections were utilized to examine the
expression of E-selectin. These were used to determine an optimum protocol for i)
fixation, and ii) decalcification to optimize antigen preservation. Prior experience with
these techniques has shown that preservation of antigenicity has been very difficult to
maintain during the fixation and decalcification process. My work in this area has
enabled the formulation of a novel and reproducible protocol for subsequent time-
course experiments facilitating reproducible immunohistochemistry for analysis of
paw sections in the CIA model. The following conclusions were reached regarding
fixation: Frozen, unfixed specimens demonstrated positive staining with anti-E-
selectin antibody compared to a negative control (no primary antibody), but there was
poor overall preservation of tissue architecture. Fixation with formaldehyde did not
preserve of antigenicity. Antigenicity was preserved with the use of 1% PFA in frozen
sections. Antigenicity was not preserved in paraffin embedded sections.
Following decalcification as described above, tissue blocks were mounted onto a cork
disc embedded in an optimum cutting temperature glycol resin, snap frozen in
isopentane suspended in a bath of liquid nitrogen, cut to a width of 4µm on a cryostat
a) b) c)
Chapter 2
81
(Leica CM 1900) with a tungsten carbide blade, picked up onto glass microscope
slides (Menzel-glaser superfrost plus) and finally specimens were bonded onto the
slides by heating in an oven for 2 hours at 37°C. (Initial specimens demonstrated poor
adherence to the slide, but fixed specimens which were heat bonded onto specialised
slides for frozen sections showed improved adherence). The complete protocol for
preparation of specimens is shown in Appendix 2.1. Briefly, slides were blocked with
10% normal rat serum (Vector, Peterborough, UK) before addition of anti-E-selectin
or anti-DNP antibodies (10µg/ml) or anti- CD31 (MEC 13.3; BD Pharmingen,
Oxford, UK) (diluted 1:400), followed by 0.5g/ml biotinylated rabbit anti-rat
antibody (Vector, Peterborough, UK), avidin-biotin-peroxidase complexes and 3,3'-
diaminobenzidine (Vector, Peterborough, UK) solution. Finally slides were
counterstained with Harris Haematoxylin (Sigma-Aldrich, Poole, UK).
2.6.3 Detection Of In Vivo Injected E-Selectin Antibody by
Immunohistochemistry In Ex Vivo Specimens
In order to determine whether i.v. injected E-selectin tracks to the inflamed synovium
of the arthritic joint where E-selectin expression has been demonstrated histologically,
mice with severe arthritis (>day 10) were injected with 50ug of either anti-E-selectin
or anti-DNP antibody (n=3) per group at time points of 1,4 and 24 hours. Following
injection the mice were sacrificed and paws were then fixed and prepared (as
described in Section 2.6.2 in paraformaldehyde, decalcified in EDTA and snap frozen
in the same way as for previous optimized specimen preparation. For the staining
protocol slides were blocked with 10% normal rat serum (Vector, Peterborough, UK)
followed by 0.5g/ml biotinylated rabbit anti-rat antibody (Vector, Peterborough,
UK), avidin-biotin-peroxidase complexes and 3,3'-diaminobenzidine (Vector,
Peterborough, UK) solution. Finally slides were counterstained with Harris
Haematoxylin (Sigma-Aldrich, Poole, UK).
2.7 In Vivo Optical Imaging
The following relates to general details regarding preparation of mice for in vivo
imaging and principles of image capture. An appropriate anaesthetic regime using
isofluorane has been utilized to ensure mice can be imaged in vivo for multiple time
points and prolonged periods. The anaesthetic circuit for the Kodak imager has been
redesigned for effective and safe anaesthetic use. It was necessary to design and build
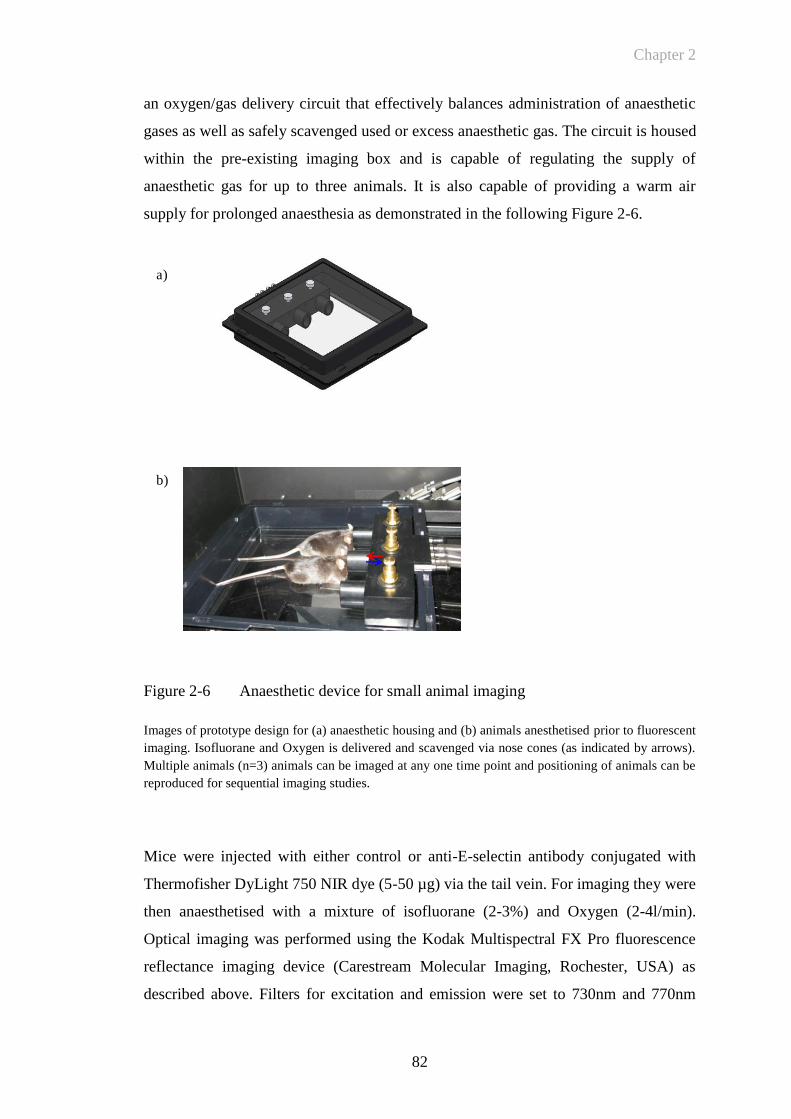
Chapter 2
82
an oxygen/gas delivery circuit that effectively balances administration of anaesthetic
gases as well as safely scavenged used or excess anaesthetic gas. The circuit is housed
within the pre-existing imaging box and is capable of regulating the supply of
anaesthetic gas for up to three animals. It is also capable of providing a warm air
supply for prolonged anaesthesia as demonstrated in the following Figure 2-6.
Figure 2-6 Anaesthetic device for small animal imaging
Images of prototype design for (a) anaesthetic housing and (b) animals anesthetised prior to fluorescent
imaging. Isofluorane and Oxygen is delivered and scavenged via nose cones (as indicated by arrows).
Multiple animals (n=3) animals can be imaged at any one time point and positioning of animals can be
reproduced for sequential imaging studies.
Mice were injected with either control or anti-E-selectin antibody conjugated with
Thermofisher DyLight 750 NIR dye (5-50 µg) via the tail vein. For imaging they were
then anaesthetised with a mixture of isofluorane (2-3%) and Oxygen (2-4l/min).
Optical imaging was performed using the Kodak Multispectral FX Pro fluorescence
reflectance imaging device (Carestream Molecular Imaging, Rochester, USA) as
described above. Filters for excitation and emission were set to 730nm and 770nm
a)
b)
Chapter 2
83
respectively. An identical imaging protocol (exposure time: 60 seconds, 4x binning, f-
stop: 2.51, field of view: 158.5, focal plane: 9.4mm) was maintained for all images.
When required comparative X-ray images were taken using the following image
settings: (exposure time: 20 seconds, 4xbinning, f-stop: 2.51 field of view: 158.5,
focal plane 9.4mm)
Images were analysed using the Kodak Molecular Imaging software program
(Version 5.0, Carestream Molecular Imaging, Rochester, USA). A region of interest
(ROI) created by an automated tool was determined around the inflamed or control
paw. Mean ROI signal intensities are expressed as arbitrary fluorescent signal
intensity units. Fluorescence gray scale images were artificially coloured for depiction
purposes according to a colour scale set to the highest and lowest levels of mean
fluorescence intensity (red and purple indicate maximum and minimum light intensity
respectively). The fluorescence images were co-registered onto X-ray images taken
concurrently, when anatomical localisation was required.
2.7.1 Determination of Optimum Excitation/Emission Wavelength of
Fluorescent Dye for Excitation for In Vivo Imaging by Measurement of
Autofluorescence
To determine the peak levels of autofluorescence a live DBA/1 mouse was
anaesthetised and imaged according to protocols described in Section 2.7. Images
were taken at sequential excitation wavelengths between 390-770nm, and the
resulting Autofluorescence emitted read between 535-830nm, using the Kodak In
Vivo FX Pro imaging system.
2.8 Statistical Analysis
Results were expressed as mean ± SEM. Data were analysed using, 1- and 2-way
analysis of variance (ANOVA) with Bonferroni post-hoc analysis, or Students t-test.
P-values of less than 0.05 were considered to be statistically significant. Data were
analysed using GraphPad Prism 5.0 (Graph Pad Software, CA, USA).
Chapter 2
84
Appendices
Appendix 2.1 Staining protocol for E-selectin, CD-31, and DNP antibodies
1. Slides placed in 37°C oven for two hours to optimize adhesion to the slide
2. Fix in acetone for 5 minutes
3. Air dry slides for ½ min. DO NOT LET SLIDES DRY AFTER THIS STEP.
4. Wash in PBS/TBS gently tip off and discard (subsequently referred to as
‘wash’)
5. Block with 10% normal serum/PBS/TBS for 60 minutes at room temperature
(RT). Normal serum is the serum of the species that the secondary biotinylated
antibody is raised in. Use heat-inactivated serum, in this case rabbit serum.
6. Wash
7. Block with Avidin solution undiluted for 15 minutes at RT in moist chamber
(Vector Blocking Kit- Catalog No. SP2001).
8. Wash
9. Block with biotin solution undiluted for 15 minutes at RT in moist chamber
(Vector Blocking Kit).
10. Wash
11. Add primary antibody (200µl per slide) (working antibody concentration of
10µg/ml) Incubate for 45 minutes at RT in moist chamber.
12. Wash in PBS for 5 min.
13. Incubate with secondary antibody (rabbit-anti rat) biotinylated for 40 minutes
at RT in a moist chamber. Dilute this antibody 1:100 with PBS/TBS to which
normal serum from the species that the tissue is from has been added at 2%.
14. (When working with mouse tissue, make sure that the secondary antibody is
not absorbed against rabbit because you get more unspecific staining for
unknown reasons).
15. Prepare the ABC complexes at this stage. Use Vector’s ABC-Elite-Standard
Kit for Peroxidase (Vector Catal. No. PK6100). To 100l of PBS add 1 l
solution A (Avidin) from the kit and mix well. Then quickly add 1l of
solution B (Biotin-Peroxidase) from the kit and mix well. Let stand 30 minutes
for the complexes to form and it is ready to be used. If it stands a little longer
it is OK but not less than ½ hour. MAKE SURE TO USE DIFFERENT
PIPETTE TIPS FOR SOLUTION A and SOLUTION B.
16. Wash
17. Inactivate slides for endogenous peroxidase by incubating them for 15 minutes
in 0.3% hydrogen peroxide/PBS/TBS at RT.
18. Wash
19. Incubate with the ABC complexes prepared for 40 minutes at RT in a moist
chamber.
20. Prepare Vector DAB: As per kit (4 drops buffer, 8 drops DAB, 4 drops
hydrogen peroxide substrate in 10mls distilled water)
21. Wash
22. Incubate in DAB solution for 4 minutes

Chapter 2
85
23. Wash in PBS for 5 min.
24. Counterstain with Harris Haematoxylin for 1minute, differentiate in i) 0.5%
acid/alcohol ii)wash tap water until nuclei blue
25. Dehydrate in graded alcohol baths (automated) – 70%/90%/absolute/absolute
26. Clear with 3 baths of xylene
27. Slides mounted with surgipath coverslips and pertex xylene based mountant
on Leica CV5000 automated coverslipper
28. Personal protective clothing and safety equipment to be used throughout all
procedures.

Chapter 2
86
Appendix 2.2 Procedure for Labelling Proteins with DyLight Fluorophores
(Thermofisher technologies)
A. Protein Preparation
Note: When labelling with the DyLight 594 Kit, prepare the protein in PBS. If the
Borate Buffer has precipitated during storage, solubilize it by warming and vortexing
the vial.
1. The optimal labelling buffer is 50 mM sodium borate, pH 8.5 (please see note
above). For best results use 1 mg of protein at ~2 mg/ml. Prepare the protein as
follows:
Proteins Lyophilized in PBS: Just before use, prepare the labelling buffer by diluting
the Borate Buffer (0.67 M) to 0.05 M in PBS or ultrapure water. Prepare only enough
labelling buffer required for the reaction (for example, to prepare 1 ml, add 75 μl of
Borate Buffer (0.67 M) to 925 μl of ultrapure water or PBS). Reconstitute 1 mg of
protein with 0.5 ml of labelling buffer.
Proteins in PBS Solution: Add 40 μl of the Borate Buffer (0.67 M) to 0.5 ml of 2
mg/ml protein in PBS. If the protein is > 2 mg/ml, adjust the concentration to 2 mg/ml
with labelling buffer (for example, 0.05 M sodium borate − see the above bullet point:
Proteins Lyophilized in PBS).
Proteins in Other Buffers: Protein must not be in a buffer containing ammonium
ions or primary amines (for example, Tris or glycine). If necessary, replace buffer
with 50 mM sodium borate (Product No. 28384), pH 8.5 by dialysis or buffer
exchange.
B. Protein Labelling
1. Tap the bottom of the DyLight Reagent vial against a hard surface to ensure the
dye is in the bottom of the tube. Add 0.5 mls of the prepared protein to the vial of
DyLight Reagent and vortex gently or invert 10 times.
2. Briefly centrifuge the vial to collect the sample in the bottom of the tube.
3. Incubate the reaction mixture for 60 minutes at room temperature protected from
light.
C. Protein Purification
1. Place two spin columns in two microcentrifuge collection tubes.
2. Mix the Purification Resin to ensure uniform suspension and add 400 μl of the
suspension into both spin columns. Centrifuge for 45 seconds at ~1,000 × g to
remove the storage solution. Discard the used collection tubes and place the
columns in new collection tubes.
3. Add 250-270 μl of the labelling reaction to each spin column and mix the sample
with the resin by pipetting up and down or briefly vortexing.

Chapter 2
87
4. Centrifuge columns for 45 seconds at ~1,000 × g to collect the purified proteins.
Combine the samples from both columns (~0.5 mls total). Discard the used
columns.
5. Store the labeled protein protected from light at 4°C for up to one month.
Alternatively, store labeled protein in single-use aliquots at -20°C. Avoid repeated
freeze/thaw cycles. If the final concentration of conjugate is < 1 mg/ml, add a
stabilizing agent, such as bovine serum albumin at 1-10 mg/ml.

Chapter 3
88
CHAPTER 3
Chapter 3
89
3 ANTIBODY CHARACTERISATION AND LABELLING
3.1 Introduction
A potential molecular target for fluorescent labelling and subsequent imaging in in
vivo models of inflammation is E-selectin (ELAM-1). It is a 115kDa glycoprotein
induced on EC in response to pro-inflammatory cytokines involved in RA such as IL-
1 and TNF (Pober, Gimbrone et al. 1986; Wellicome, Thornhill et al. 1990). As
part of a complex multistep process, selectins promote the initial attachment
(tethering) and subsequent moving (rolling) of leukocytes on endothelium, where they
become activated as a result of locally produced chemokines (Springer 1994). Locally
produced inflammatory mediators and the subsequent up-regulation of adhesion
molecules at sites of inflammation are key factors in RA pathogenesis (Tak, Taylor et
al. 1996). The vascular endothelium acts as an interface for the interaction between
cytokines and cell surface receptors, promoting the recruitment of circulating
leucocytes to sites of inflammation. The endothelium in RA synovium has been
demonstrated to express E-selectin (Corkill, Kirkham et al. 1991). Selectin:ligand
interactions are one of the first to occur during recruitment of circulating leucocytes to
sites of inflammation. E-selectin has previously been investigated as a molecule for
tracking inflammation. Scintigraphy utilizing a radiolabelled anti-E-selectin antibody
has also been used to successfully image synovitis in patients with RA, with a 99m
Tc-anti-E-selectin-Fab demonstrating improved specificity compared to a
conventional tracer for bone and joint inflammation, 99mTc-oxidronate (Chapman,
Jamar et al. 1996; Jamar, Chapman et al. 1997; Jamar, Houssiau et al. 2002). This
study also demonstrated particular specificity for targeting active joint inflammation
(Jamar, Houssiau et al. 2002). Decreased endothelial expression and reduced serum
levels of E-selectin have also been demonstrated in patients with RA treated with anti-
TNF therapy (Paleolog, Hunt et al. 1996; Tak, Taylor et al. 1996).
Production of functional, uniform E-selectin antibody was a key objective of the early
work of this project. The work in this chapter aimed to ensure that E-selectin antibody
which was produced from cell culture could bind to both E-selectin and to TNF-
stimulated EC, after labelling with fluorophore. Furthermore, selection of dye in the
near infra red (NIR) range also has been demonstrated in other studies to be at an

Chapter 3
90
optimal wavelength to delineate specific signal in the animal model. My objective
was therefore to confirm this in the live animals to be used for both a model of acute
inflammation, namely the TNF paw injection model, and for CIA, a chronic model
of inflammatory arthritis.
Determining and demonstrating that a reproducible labelling technique was also of
paramount importance prior to commencing in vivo imaging experiments. Prior
studies have clearly demonstrated that free dye can track to sites of inflammation due
to increased vessel permeability and this is discussed in detail in introductory section
1.2.4. Confirmation that free dye had been removed from labelled anti-E-selectin and
isotype control preparations is therefore presented.
Image acquisition and the parameters for digital imaging are also explored. Image
acquisition has been developed in keeping with proprietary protocols for imaging
fluorescent agents with differing emission and excitation spectra as per the
manufacturers’ guidance.
Recording a digital image involves determining an appropriate focal length for
imaging at particular wavelengths as well as calibrating the camera for artefact due to
lens refraction. Image capture time may be varied according to brightness of
fluorescent emission and size of region of interest. Pixel binning may be required to
increase the sensitivity of image capture. Pixel binning involves the summation of
detected signal from more than one pixel to one central pixel effectively decreasing
the resolution of the image. Changing the aperture (f-stop) of the camera is another
way of either allowing more or less light through the lens and hence to the sensor.
Allowing more light utilizes a larger surface of lens and hence there is likely to be
more distortion of light from the lens edges, with the converse being true if the less
light and the central portion of the lens is used. For in vivo imaging experiments a
simple protocol has been developed so that both exposure time, pixel binning, focal
length, aperture, and field of view are kept constant so that images can be compared
accurately. The parameters of image processing are therefore examined, to ensure a
reliable method of data collection is employed. A technique was developed to provide
quantification of digital signal from fluorescent images. This was so that signal
intensity between selected areas could be determined and longitudinal comparisons
made of fluorescence signal over time.

Chapter 3
91
3.2 Objectives
i. To demonstrate the adequate production from cell culture of functional
uniform, anti-E-selectin and matched isotype anti-DNP control antibodies
ii. To ensure that anti-E-selectin antibody could bind to both E-selectin and to
TNFstimulated EC before and after labelling with fluorophore
iii. To determine a reproducible fluorescent dye labelling technique with
satisfactory dye:protein ratios and with exclusion of free dye from the sample
iv. To demonstrate that imaging in the NIR spectrum optimises target fluorescent
signal intensity
v. To delineate the parameters of image quantification from the digital imaging
device
Chapter 3
92
3.3 Results
3.3.1 Determining Purity of Antibody By SDS PAGE Prior to Labelling
The purity of anti-E-selectin and anti-DNP antibodies obtained from cell culture was
determined using sodium dodecyl sulfate polyacrylamide gel electrophoresis (SDS
PAGE). This demonstrated that both anti-E-selectin antibody and control anti-DNP
antibody show major bands at 100-150kDa (G9 and G10 respectively), and at
approximately 50kDa (H5 and H6) and 25kDa (H9 and H10) as demonstrated in
Figure 3-1a. These are most likely to correspond to immunoglobulin heavy and light
chain fragments. Analysis of the bands was then performed by mass spectroscopy.
This confirmed the identity of the major bands (Figure 3-2). The minor bands are
likely to be albumin (F9 and F10), that had been carried over from the purification
process. It is possible to generate other sizes of immunoglobulin fragments if cell
culture conditions are not carefully regulated. This may in turn have implications for
the efficiency of antibody labelling and hence ability of the labelled antibody to target
E-selectin expression on activated EC in vivo. If for example there were significant
amounts of albumin contaminating the sample, this could non-specifically track to
sites of inflammation due to local permeability changes.
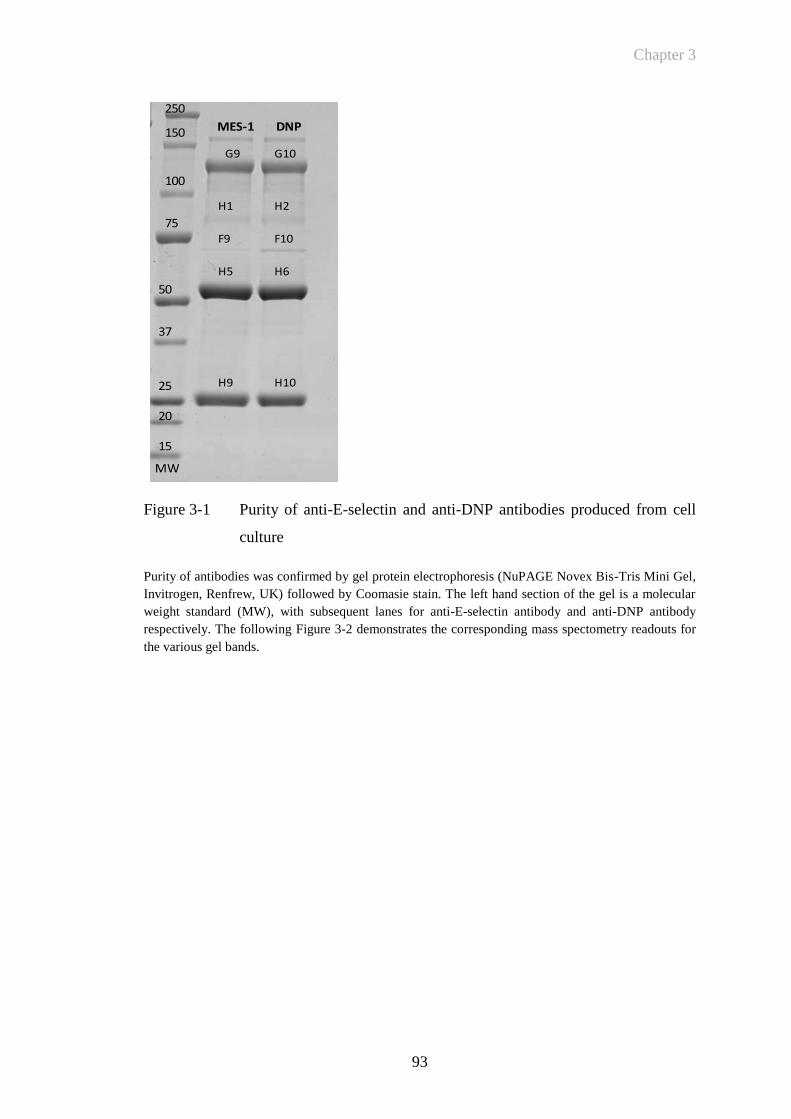
Chapter 3
93
Figure 3-1 Purity of anti-E-selectin and anti-DNP antibodies produced from cell
culture
Purity of antibodies was confirmed by gel protein electrophoresis (NuPAGE Novex Bis-Tris Mini Gel,
Invitrogen, Renfrew, UK) followed by Coomasie stain. The left hand section of the gel is a molecular
weight standard (MW), with subsequent lanes for anti-E-selectin antibody and anti-DNP antibody
respectively. The following Figure 3-2 demonstrates the corresponding mass spectometry readouts for
the various gel bands.
15
25
50
37
20
75
100
150
250
MES-1 DNP
H9 H10
F9
H5 H6
F10
G9
H2H1
G10
MW
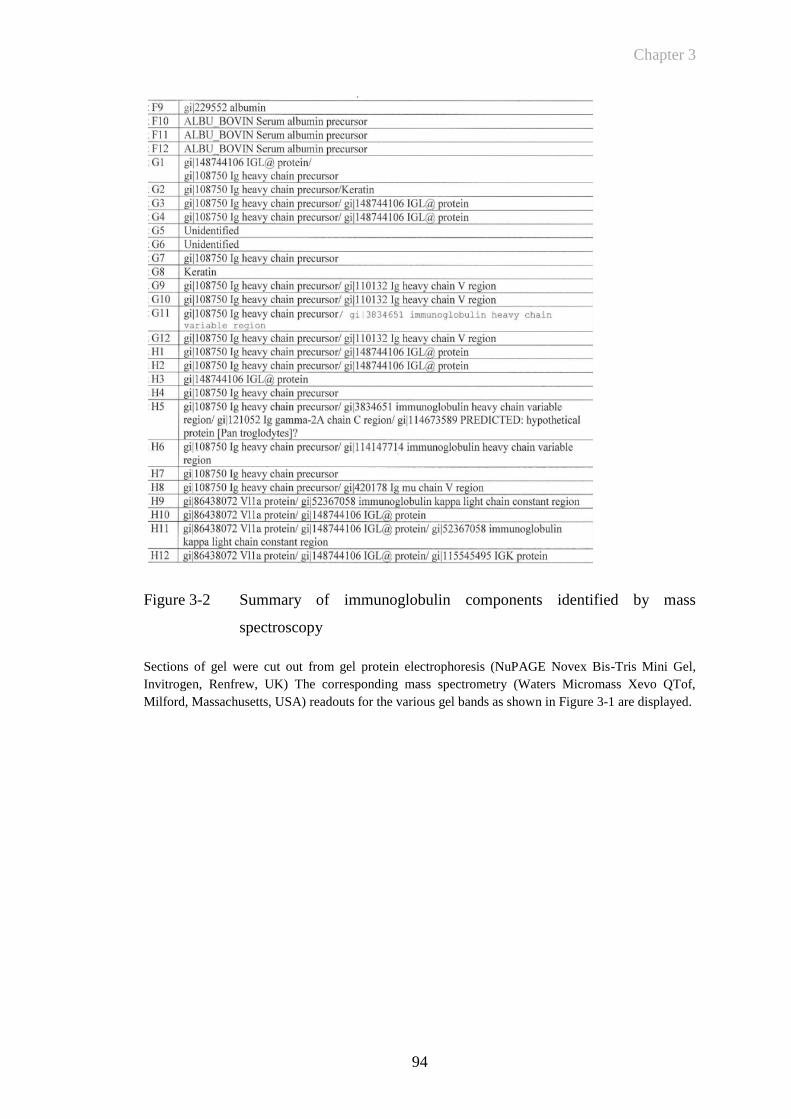
Chapter 3
94
Figure 3-2 Summary of immunoglobulin components identified by mass
spectroscopy
Sections of gel were cut out from gel protein electrophoresis (NuPAGE Novex Bis-Tris Mini Gel,
Invitrogen, Renfrew, UK) The corresponding mass spectrometry (Waters Micromass Xevo QTof,
Milford, Massachusetts, USA) readouts for the various gel bands as shown in Figure 3-1 are displayed.
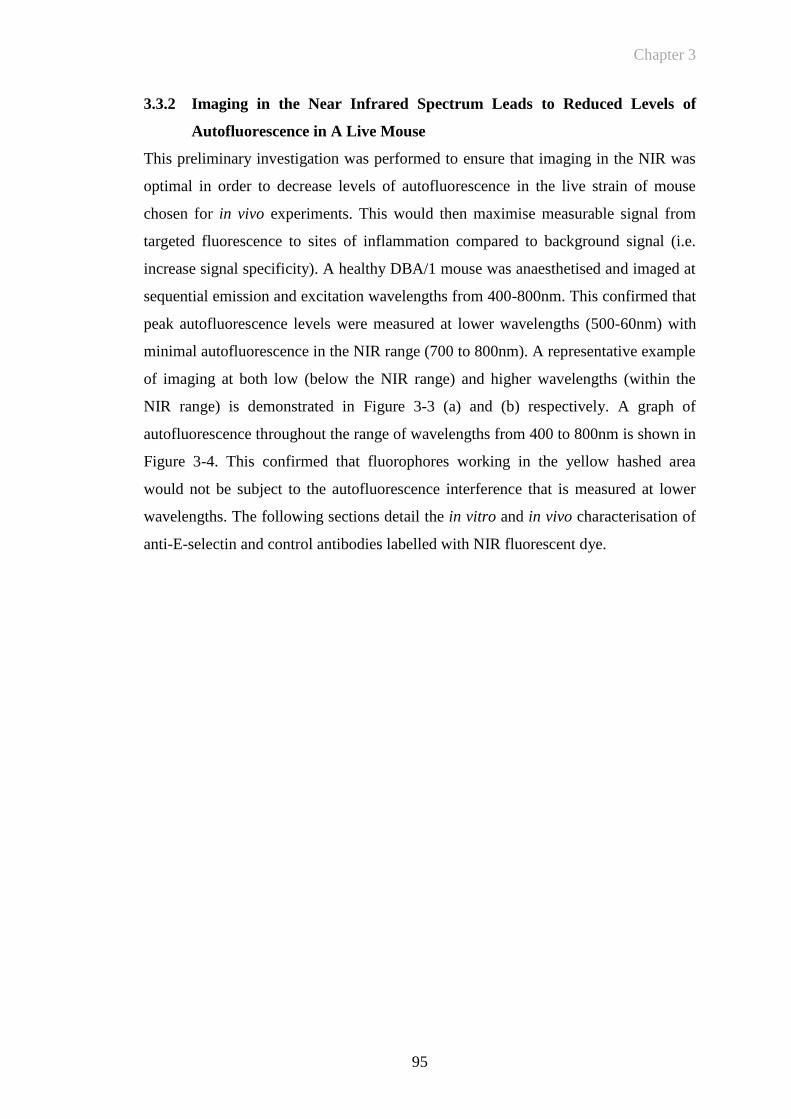
Chapter 3
95
3.3.2 Imaging in the Near Infrared Spectrum Leads to Reduced Levels of
Autofluorescence in A Live Mouse
This preliminary investigation was performed to ensure that imaging in the NIR was
optimal in order to decrease levels of autofluorescence in the live strain of mouse
chosen for in vivo experiments. This would then maximise measurable signal from
targeted fluorescence to sites of inflammation compared to background signal (i.e.
increase signal specificity). A healthy DBA/1 mouse was anaesthetised and imaged at
sequential emission and excitation wavelengths from 400-800nm. This confirmed that
peak autofluorescence levels were measured at lower wavelengths (500-60nm) with
minimal autofluorescence in the NIR range (700 to 800nm). A representative example
of imaging at both low (below the NIR range) and higher wavelengths (within the
NIR range) is demonstrated in Figure 3-3 (a) and (b) respectively. A graph of
autofluorescence throughout the range of wavelengths from 400 to 800nm is shown in
Figure 3-4. This confirmed that fluorophores working in the yellow hashed area
would not be subject to the autofluorescence interference that is measured at lower
wavelengths. The following sections detail the in vitro and in vivo characterisation of
anti-E-selectin and control antibodies labelled with NIR fluorescent dye.
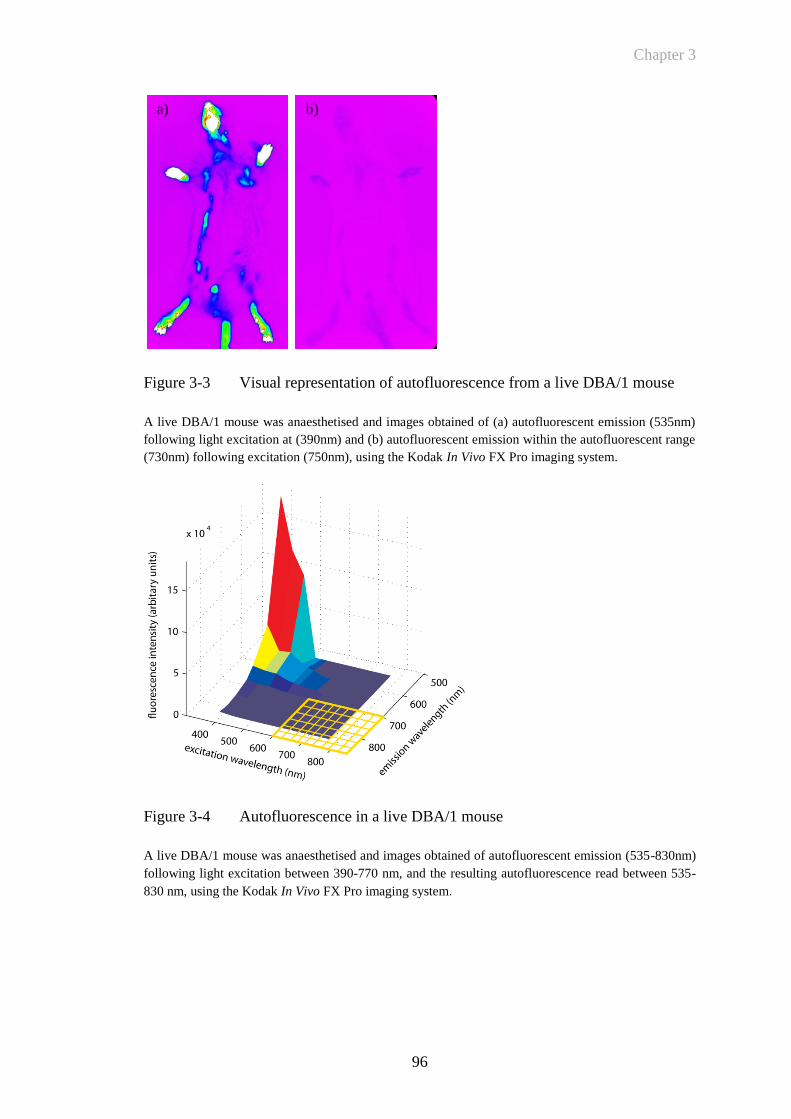
Chapter 3
96
Figure 3-3 Visual representation of autofluorescence from a live DBA/1 mouse
A live DBA/1 mouse was anaesthetised and images obtained of (a) autofluorescent emission (535nm)
following light excitation at (390nm) and (b) autofluorescent emission within the autofluorescent range
(730nm) following excitation (750nm), using the Kodak In Vivo FX Pro imaging system.
Figure 3-4 Autofluorescence in a live DBA/1 mouse
A live DBA/1 mouse was anaesthetised and images obtained of autofluorescent emission (535-830nm)
following light excitation between 390-770 nm, and the resulting autofluorescence read between 535-
830 nm, using the Kodak In Vivo FX Pro imaging system.
a) b)
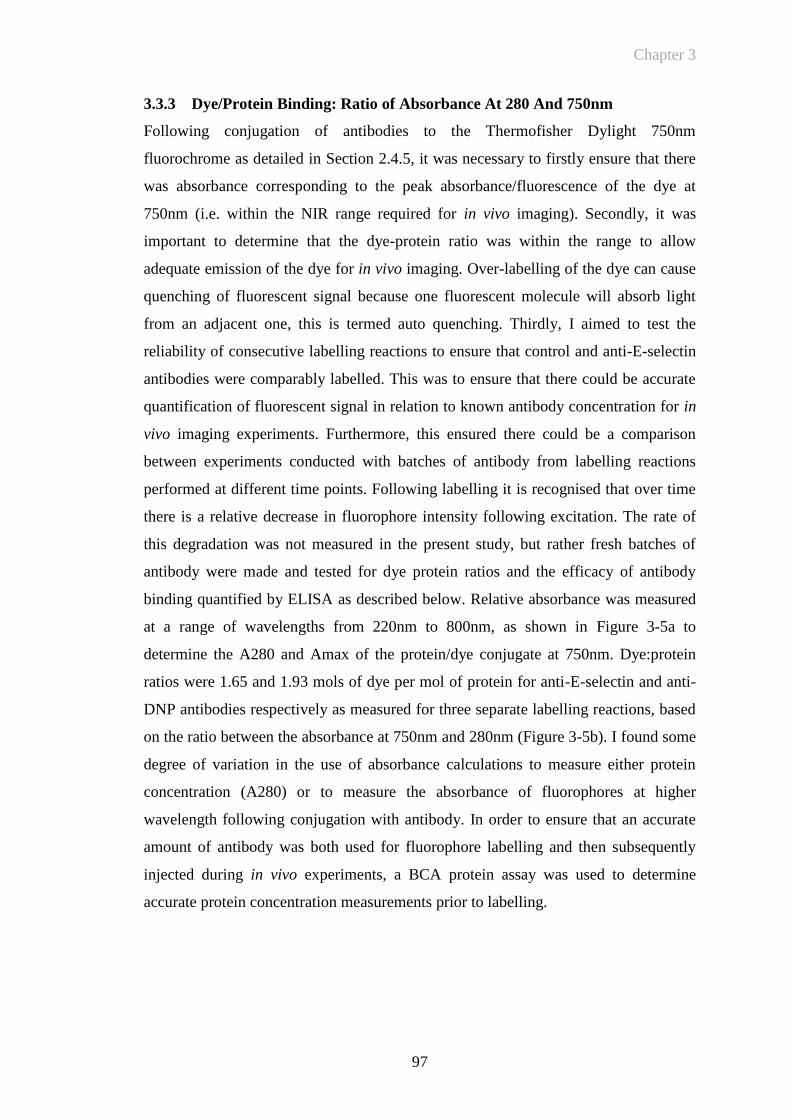
Chapter 3
97
3.3.3 Dye/Protein Binding: Ratio of Absorbance At 280 And 750nm
Following conjugation of antibodies to the Thermofisher Dylight 750nm
fluorochrome as detailed in Section 2.4.5, it was necessary to firstly ensure that there
was absorbance corresponding to the peak absorbance/fluorescence of the dye at
750nm (i.e. within the NIR range required for in vivo imaging). Secondly, it was
important to determine that the dye-protein ratio was within the range to allow
adequate emission of the dye for in vivo imaging. Over-labelling of the dye can cause
quenching of fluorescent signal because one fluorescent molecule will absorb light
from an adjacent one, this is termed auto quenching. Thirdly, I aimed to test the
reliability of consecutive labelling reactions to ensure that control and anti-E-selectin
antibodies were comparably labelled. This was to ensure that there could be accurate
quantification of fluorescent signal in relation to known antibody concentration for in
vivo imaging experiments. Furthermore, this ensured there could be a comparison
between experiments conducted with batches of antibody from labelling reactions
performed at different time points. Following labelling it is recognised that over time
there is a relative decrease in fluorophore intensity following excitation. The rate of
this degradation was not measured in the present study, but rather fresh batches of
antibody were made and tested for dye protein ratios and the efficacy of antibody
binding quantified by ELISA as described below. Relative absorbance was measured
at a range of wavelengths from 220nm to 800nm, as shown in Figure 3-5a to
determine the A280 and Amax of the protein/dye conjugate at 750nm. Dye:protein
ratios were 1.65 and 1.93 mols of dye per mol of protein for anti-E-selectin and anti-
DNP antibodies respectively as measured for three separate labelling reactions, based
on the ratio between the absorbance at 750nm and 280nm (Figure 3-5b). I found some
degree of variation in the use of absorbance calculations to measure either protein
concentration (A280) or to measure the absorbance of fluorophores at higher
wavelength following conjugation with antibody. In order to ensure that an accurate
amount of antibody was both used for fluorophore labelling and then subsequently
injected during in vivo experiments, a BCA protein assay was used to determine
accurate protein concentration measurements prior to labelling.
Chapter 3
98
Figure 3-5 Dye protein binding: ratio of absorbance at 280nm and 750nm
Panel (a) shows typical absorbance spectra of both anti-E-selectin and anti-DNP Thermofisher Dylight
750nm dye labelled antibodies at wavelengths from 200 to 800nm, showing comparable absorbance
and relative ratio of absorbance at 280nm versus the peak of dye absorbance at 750nm. Panel (b)
demonstrates that the absorbance ratios (ratio of absorbance at 750nm/280nm) have remained
consistent over three labelling reactions.
Further purification steps were also undertaken to ensure that the above measurements
did not include absorbance from dye at 750nm that was unbound to antibody (i.e. that
the labelling reaction had not been complete and there was free dye in the sample).
This is especially important because it is recognised that free dye may track to sites of
both acute and chronic inflammation due to changes in vascular permeability (as
discussed in Section 1.2.4). Specimen samples were dialysed against PBS. Figure 3-6
illustrates that pre- and post-dialysis samples exhibit comparable absorbance
characteristics. This suggests that excess free dye was not contributing to the small
difference in absorbance between DNP and E-selectin antibodies observed in Figure
200 400 600 8000.00
0.02
0.04
0.06
0.08
Anti-DNP antibody
Anti-E-Selectin Antibody
Wavelength (nm)
Ab
sorb
an
ce (a
u)
Anti-
DN
P antib
ody
Anti-
E-S
elec
tin a
ntibod
y
0
1
2
3
rati
o o
f ab
sorb
an
ce a
t 7
50
/28
0n
m
a)
b)
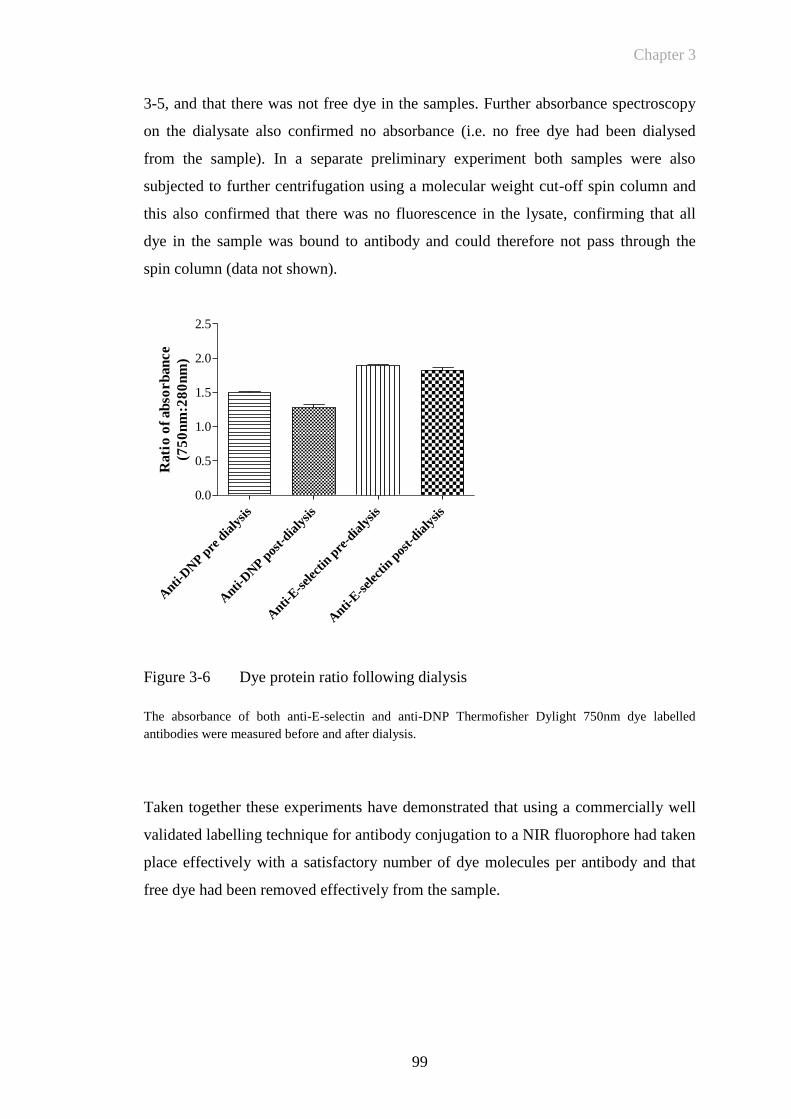
Chapter 3
99
3-5, and that there was not free dye in the samples. Further absorbance spectroscopy
on the dialysate also confirmed no absorbance (i.e. no free dye had been dialysed
from the sample). In a separate preliminary experiment both samples were also
subjected to further centrifugation using a molecular weight cut-off spin column and
this also confirmed that there was no fluorescence in the lysate, confirming that all
dye in the sample was bound to antibody and could therefore not pass through the
spin column (data not shown).
Figure 3-6 Dye protein ratio following dialysis
The absorbance of both anti-E-selectin and anti-DNP Thermofisher Dylight 750nm dye labelled
antibodies were measured before and after dialysis.
Taken together these experiments have demonstrated that using a commercially well
validated labelling technique for antibody conjugation to a NIR fluorophore had taken
place effectively with a satisfactory number of dye molecules per antibody and that
free dye had been removed effectively from the sample.
Anti-
DN
P pre
dia
lysis
Anti-
DN
P pos
t-dia
lysis
Anti-
E-s
elec
tin p
re-d
ialy
sis
Anti-
E-s
elec
tin p
ost-dia
lysis
0.0
0.5
1.0
1.5
2.0
2.5
Rati
o o
f ab
sorb
an
ce
(75
0n
m:2
80
nm
)
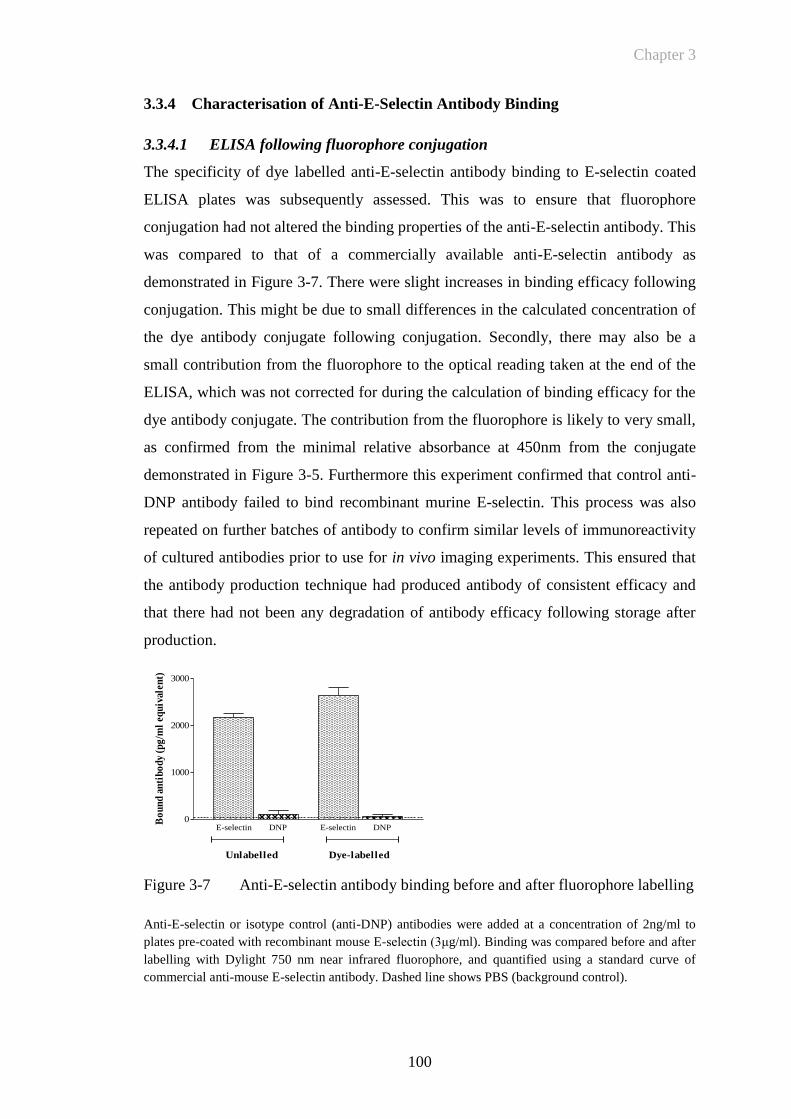
Chapter 3
100
3.3.4 Characterisation of Anti-E-Selectin Antibody Binding
3.3.4.1 ELISA following fluorophore conjugation
The specificity of dye labelled anti-E-selectin antibody binding to E-selectin coated
ELISA plates was subsequently assessed. This was to ensure that fluorophore
conjugation had not altered the binding properties of the anti-E-selectin antibody. This
was compared to that of a commercially available anti-E-selectin antibody as
demonstrated in Figure 3-7. There were slight increases in binding efficacy following
conjugation. This might be due to small differences in the calculated concentration of
the dye antibody conjugate following conjugation. Secondly, there may also be a
small contribution from the fluorophore to the optical reading taken at the end of the
ELISA, which was not corrected for during the calculation of binding efficacy for the
dye antibody conjugate. The contribution from the fluorophore is likely to very small,
as confirmed from the minimal relative absorbance at 450nm from the conjugate
demonstrated in Figure 3-5. Furthermore this experiment confirmed that control anti-
DNP antibody failed to bind recombinant murine E-selectin. This process was also
repeated on further batches of antibody to confirm similar levels of immunoreactivity
of cultured antibodies prior to use for in vivo imaging experiments. This ensured that
the antibody production technique had produced antibody of consistent efficacy and
that there had not been any degradation of antibody efficacy following storage after
production.
Figure 3-7 Anti-E-selectin antibody binding before and after fluorophore labelling
Anti-E-selectin or isotype control (anti-DNP) antibodies were added at a concentration of 2ng/ml to
plates pre-coated with recombinant mouse E-selectin (3μg/ml). Binding was compared before and after
labelling with Dylight 750 nm near infrared fluorophore, and quantified using a standard curve of
commercial anti-mouse E-selectin antibody. Dashed line shows PBS (background control).
E-selectin DNP E-selectin DNP0
1000
2000
3000
Unlabelled Dye-labelled
Bo
un
d a
nti
bo
dy
(pg
/ml
equ
ival
ent)
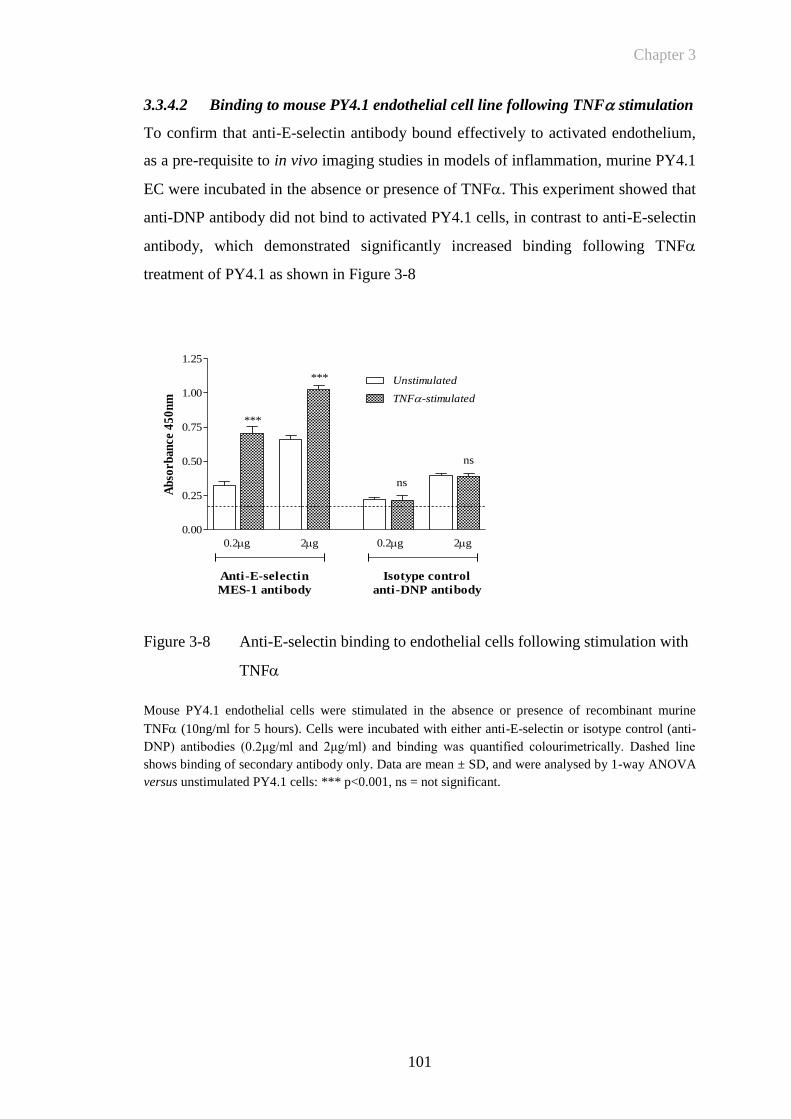
Chapter 3
101
3.3.4.2 Binding to mouse PY4.1 endothelial cell line following TNF stimulation
To confirm that anti-E-selectin antibody bound effectively to activated endothelium,
as a pre-requisite to in vivo imaging studies in models of inflammation, murine PY4.1
EC were incubated in the absence or presence of TNF. This experiment showed that
anti-DNP antibody did not bind to activated PY4.1 cells, in contrast to anti-E-selectin
antibody, which demonstrated significantly increased binding following TNF
treatment of PY4.1 as shown in Figure 3-8
Figure 3-8 Anti-E-selectin binding to endothelial cells following stimulation with
TNF
Mouse PY4.1 endothelial cells were stimulated in the absence or presence of recombinant murine
TNF (10ng/ml for 5 hours). Cells were incubated with either anti-E-selectin or isotype control (anti-
DNP) antibodies (0.2μg/ml and 2μg/ml) and binding was quantified colourimetrically. Dashed line
shows binding of secondary antibody only. Data are mean ± SD, and were analysed by 1-way ANOVA
versus unstimulated PY4.1 cells: *** p<0.001, ns = not significant.
0.00
0.25
0.50
0.75
1.00
1.25
TNF-stimulated
Unstimulated
0.2g 2g
Anti-E-selectin
MES-1 antibody
Isotype control
anti-DNP antibody
0.2g 2g
***
***
ns
ns
Ab
sorb
ance
45
0n
m
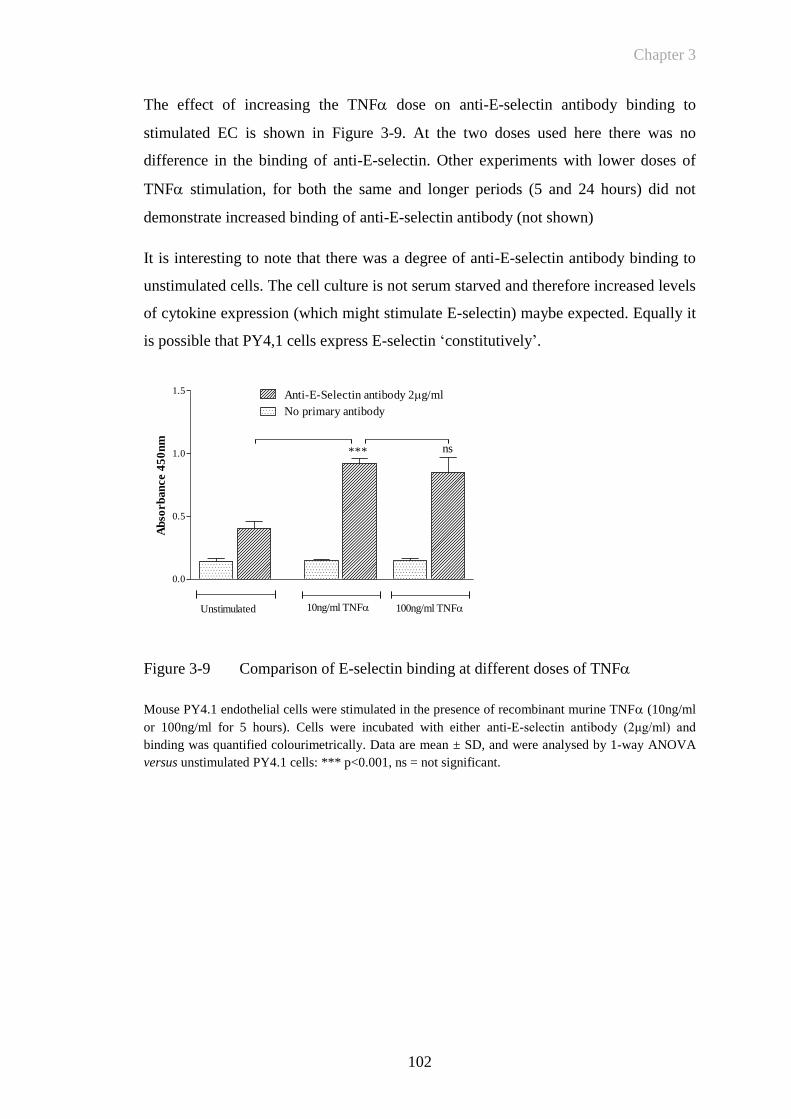
Chapter 3
102
0.0
0.5
1.0
1.5
Unstimulated 10ng/ml TNF 100ng/ml TNF
ns
Anti-E-Selectin antibody 2g/ml
No primary antibody
***
Ab
sorb
an
ce 4
50
nm
The effect of increasing the TNF dose on anti-E-selectin antibody binding to
stimulated EC is shown in Figure 3-9. At the two doses used here there was no
difference in the binding of anti-E-selectin. Other experiments with lower doses of
TNF stimulation, for both the same and longer periods (5 and 24 hours) did not
demonstrate increased binding of anti-E-selectin antibody (not shown)
It is interesting to note that there was a degree of anti-E-selectin antibody binding to
unstimulated cells. The cell culture is not serum starved and therefore increased levels
of cytokine expression (which might stimulate E-selectin) maybe expected. Equally it
is possible that PY4,1 cells express E-selectin ‘constitutively’.
Figure 3-9 Comparison of E-selectin binding at different doses of TNF
Mouse PY4.1 endothelial cells were stimulated in the presence of recombinant murine TNF (10ng/ml
or 100ng/ml for 5 hours). Cells were incubated with either anti-E-selectin antibody (2μg/ml) and
binding was quantified colourimetrically. Data are mean ± SD, and were analysed by 1-way ANOVA
versus unstimulated PY4.1 cells: *** p<0.001, ns = not significant.

Chapter 3
103
Images of EC following stimulation with TNF and binding of anti-E-selectin
antibody were also taken. This was achieved by applying an Alexa Fluor® 488
streptavidin conjugate following application of the biotinylated rabbit anti-rat
secondary antibody. A DAPI nuclear counterstain was used to delineate individual
cells as demonstrated in Figure 3-10.
.
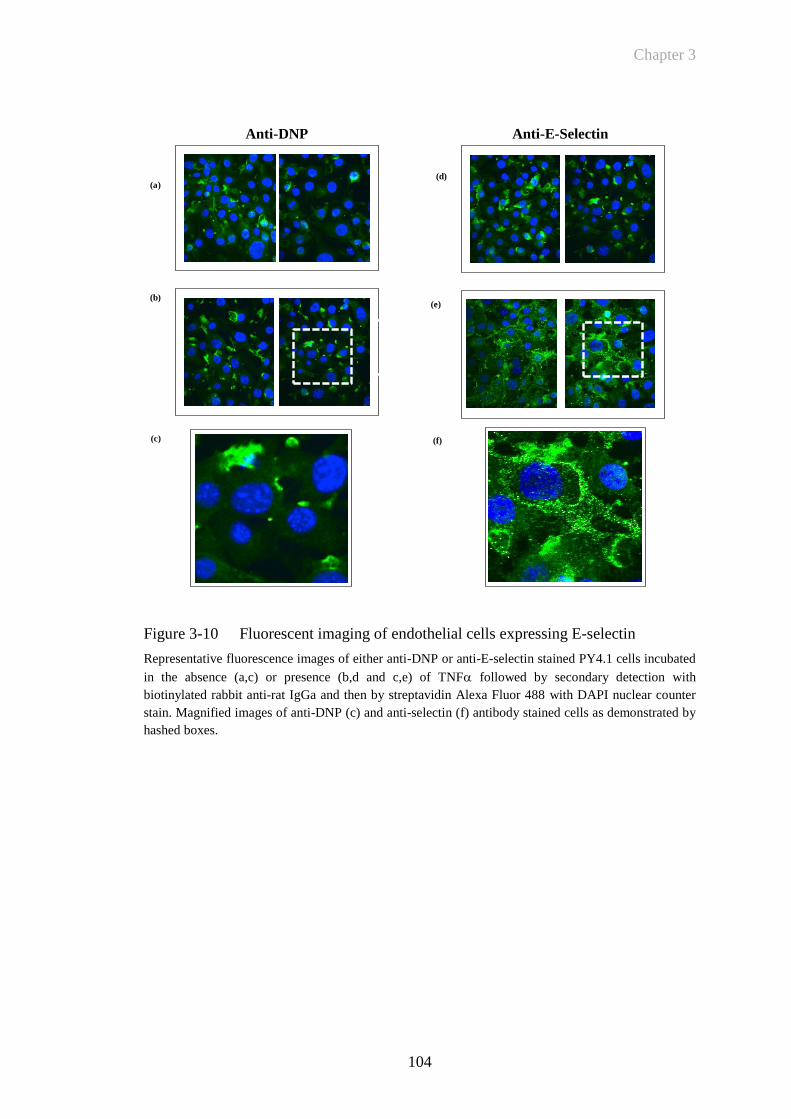
Chapter 3
104
Anti-DNP
Anti-E-Selectin
Figure 3-10 Fluorescent imaging of endothelial cells expressing E-selectin
Representative fluorescence images of either anti-DNP or anti-E-selectin stained PY4.1 cells incubated
in the absence (a,c) or presence (b,d and c,e) of TNF followed by secondary detection with
biotinylated rabbit anti-rat IgGa and then by streptavidin Alexa Fluor 488 with DAPI nuclear counter
stain. Magnified images of anti-DNP (c) and anti-selectin (f) antibody stained cells as demonstrated by
hashed boxes.
(a)
(b)
(c)
(d)
(e)
(f)
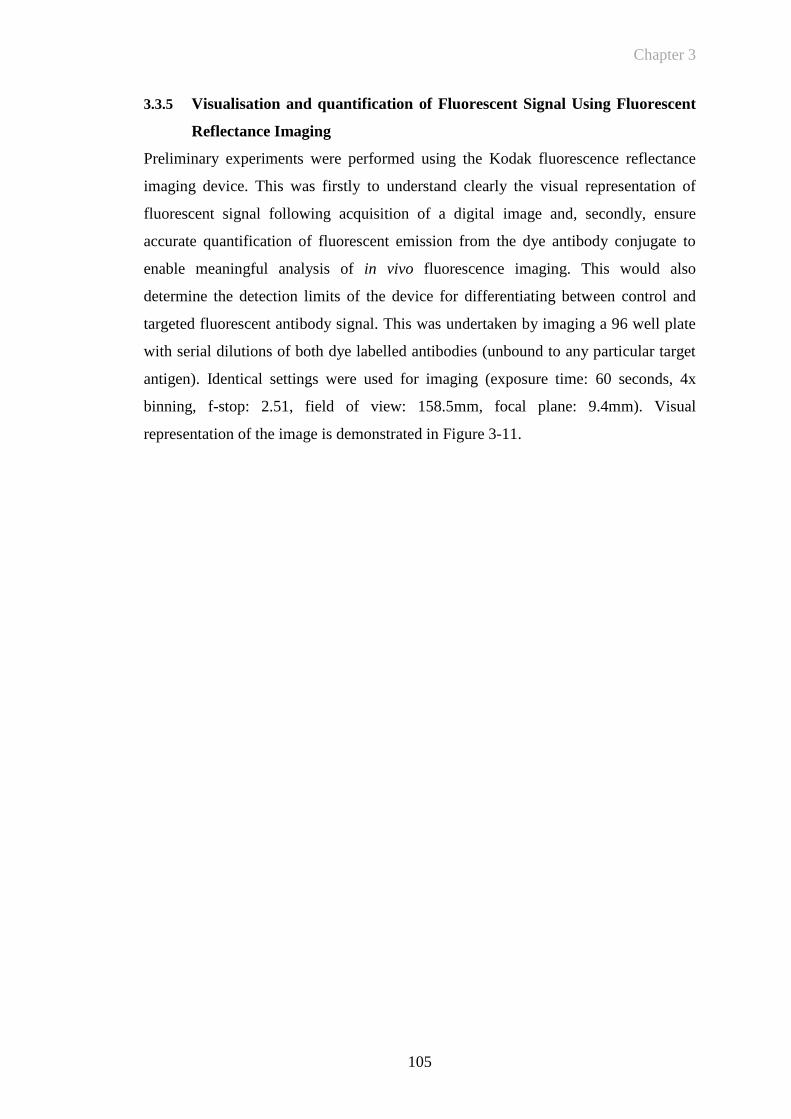
Chapter 3
105
3.3.5 Visualisation and quantification of Fluorescent Signal Using Fluorescent
Reflectance Imaging
Preliminary experiments were performed using the Kodak fluorescence reflectance
imaging device. This was firstly to understand clearly the visual representation of
fluorescent signal following acquisition of a digital image and, secondly, ensure
accurate quantification of fluorescent emission from the dye antibody conjugate to
enable meaningful analysis of in vivo fluorescence imaging. This would also
determine the detection limits of the device for differentiating between control and
targeted fluorescent antibody signal. This was undertaken by imaging a 96 well plate
with serial dilutions of both dye labelled antibodies (unbound to any particular target
antigen). Identical settings were used for imaging (exposure time: 60 seconds, 4x
binning, f-stop: 2.51, field of view: 158.5mm, focal plane: 9.4mm). Visual
representation of the image is demonstrated in Figure 3-11.
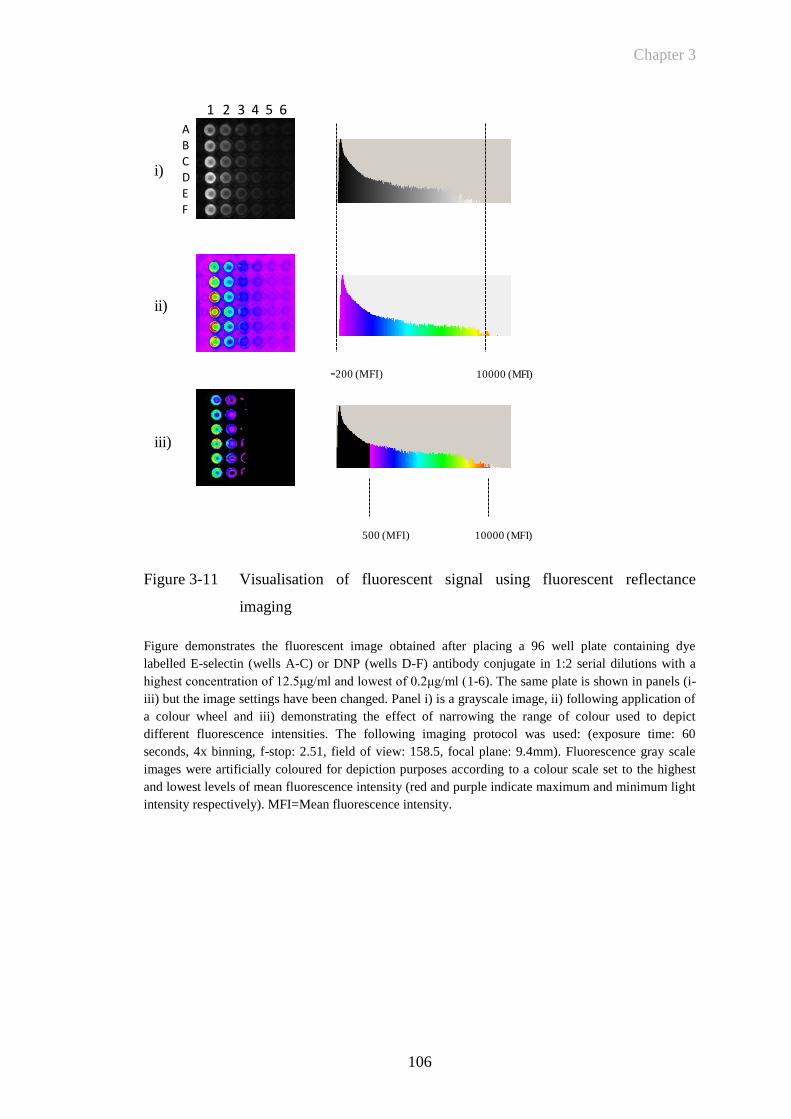
Chapter 3
106
Figure 3-11 Visualisation of fluorescent signal using fluorescent reflectance
imaging
Figure demonstrates the fluorescent image obtained after placing a 96 well plate containing dye
labelled E-selectin (wells A-C) or DNP (wells D-F) antibody conjugate in 1:2 serial dilutions with a
highest concentration of 12.5μg/ml and lowest of 0.2μg/ml (1-6). The same plate is shown in panels (i-
iii) but the image settings have been changed. Panel i) is a grayscale image, ii) following application of
a colour wheel and iii) demonstrating the effect of narrowing the range of colour used to depict
different fluorescence intensities. The following imaging protocol was used: (exposure time: 60
seconds, 4x binning, f-stop: 2.51, field of view: 158.5, focal plane: 9.4mm). Fluorescence gray scale
images were artificially coloured for depiction purposes according to a colour scale set to the highest
and lowest levels of mean fluorescence intensity (red and purple indicate maximum and minimum light
intensity respectively). MFI=Mean fluorescence intensity.
-200 (MFI) 10000 (MFI)
500 (MFI) 10000 (MFI)
ABCDEF
1 2 3 4 5 6
i)
ii)
iii)
Chapter 3
107
The fluorescence of the anti-E-selectin and DNP dye labelled conjugate relative to the
concentration of antibody using the Kodak fluorescence reflectance imaging device
was then determined by measuring the mean fluorescence intensity (MFI) of each
well taken from the digital images depicted in Figure 3-11. It is important to note that
the underlying measurement of MFI expressed as arbitrary units will remain constant.
This is irrespective of whether the image had been adjusted for either grayscale or
colour, or whether the colour wheel has been changed to represent a narrower range
of mean fluorescence intensity as depicted in Figure 3-11(iii).
Figure 3-12 Quantification of fluorescent signal using fluorescent reflectance
imaging
Figure demonstrates results of quantifying fluorescent images obtained after placing a 96 well plate
containing dye labelled anti-E-selectin or control antibody diluted in serial 1:2 dilutions with a highest
concentration of 12.5μg/ml and lowest of 0.2μg/ml. This shows a linear relationship for both samples
taken under the following settings: (Exposure time: 60 seconds, 4x binning, f-stop: 2.51, field of view:
158.5, focal plane: 9.4mm). Regions of fluorescence were quantified by taking a mean fluorescence
signal level from a circular area around each well.
The above figure demonstrates that the concentration of dye antibody conjugate
versus MFI was identical for both anti-DNP and E-selectin antibodies and that there
was a linear relationship between the concentration of either dye antibody conjugate
and emitted MFI following excitation at 730nm and measured emission at 770nm.
This data also delineates a threshold for detection of fluorophore dye/antibody
conjugate with the current image settings. The minimal concentration of
antibody/fluorescence conjugate used is 19.53ng/ml and this returned a MFI signal of
148.1 arbitrary units (au). This is well within the range of error for mapping
0 5 10 150
2000
4000
6000
8000DNP
E-selectin
Antibody/fluorescence conjugate concentration (g/ml)
MF
I (a
u)

Chapter 3
108
fluorescent images, particularly in the inflamed mouse paw as discussed in Section
3.3.6. Care was therefore taken to ensure that the parameters for imaging were kept
constant for future experiments in vivo imaging experiments for accurate comparison
of datasets.
3.3.6 Mapping Fluorescence Levels in Paw Inflammation: Using A ROI Tool to
Accurately Quantify Signal
Following the in vitro studies described above, a technique was required that could
reliably sample and quantify the degree of fluorescent signal within mouse paws in
vivo. Selecting a circular region of interest is an appropriate technique for quantifying
signal from a fixed, uniform source of emission such as from an ELISA plate as
depicted in Figure 3-12. Signal from an irregular, variably sized paw where signal
may be homogenous may require a different technique. Placement of a circular region
of interest (ROI) could either under or over estimate fluorescence signal intensity
depending on positioning and may also be affected by bias. Sequential circular, fixed
regions of interest were compared to applying regions of interest using a mapping tool
(Figure 3-13(i)). The latter technique maps a line to the point of maximal difference
between an area of increased signal intensity and lower levels as depicted in Figure
3-13(ii), in mice injected with TNF into the right paw. When quantifying signal the
intensity of light emission from each pixel can either be expressed as a mean or net
amount (with background levels of fluorescence subtracted). Figure 3-13(iii)
demonstrates that both mean and net scores return a similar distribution of signal
when taking a region of interest of the whole paw for analysis. While there may be, a
degree of variable signal throughout a mouse paw due to increases in signal from
isolated areas of E-selectin expression due vascular activation the overall value for
each paw has been used. The resolution of fluorescent imaging device may not be
sufficient to delineate changes in specific areas of the mouse joint such as individual
metatarsal joints which measure ~0.1mm. In addition since there is no method to
determine the depth of tissue from which fluorescent signal is emitted from accurate
comparisons between groups would be problematic.
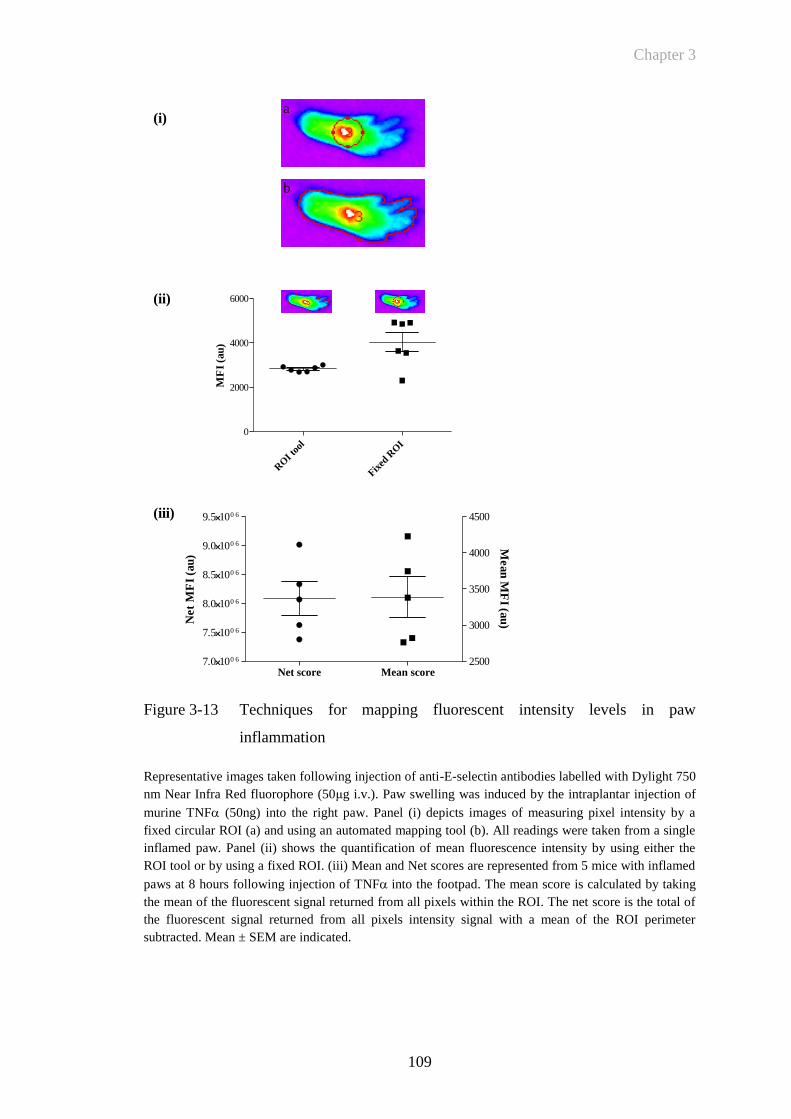
Chapter 3
109
a
b
RO
I to
ol
Fixed
RO
I
0
2000
4000
6000
MF
I (a
u)
(i)
(ii)
Net score Mean score7.0100 6
7.5100 6
8.0100 6
8.5100 6
9.0100 6
9.5100 6
2500
3000
3500
4000
4500
Net
MF
I (a
u)
Mean
MF
I (au
)
(iii)
Figure 3-13 Techniques for mapping fluorescent intensity levels in paw
inflammation
Representative images taken following injection of anti-E-selectin antibodies labelled with Dylight 750
nm Near Infra Red fluorophore (50μg i.v.). Paw swelling was induced by the intraplantar injection of
murine TNF (50ng) into the right paw. Panel (i) depicts images of measuring pixel intensity by a
fixed circular ROI (a) and using an automated mapping tool (b). All readings were taken from a single
inflamed paw. Panel (ii) shows the quantification of mean fluorescence intensity by using either the
ROI tool or by using a fixed ROI. (iii) Mean and Net scores are represented from 5 mice with inflamed
paws at 8 hours following injection of TNF into the footpad. The mean score is calculated by taking
the mean of the fluorescent signal returned from all pixels within the ROI. The net score is the total of
the fluorescent signal returned from all pixels intensity signal with a mean of the ROI perimeter
subtracted. Mean ± SEM are indicated.
Chapter 3
110
3.4 Discussion
My objectives in this chapter were to demonstrate that both anti-E-selectin and DNP
isotype control antibodies can be reproducibly produced from cell culture. My second
objective was ensure that that labelling with a NIR dye had resulted in satisfactory
dye to target ratios and that free dye has been removed from the resulting conjugate. I
have ascertained that anti-E-selectin antibody can bind to both E-selectin and to
TNF stimulated EC. Finally the parameters and potential method of quantifying
fluorescent images have been explored. NIR imaging at wavelengths of 700-800nm in
a DBA/1 mouse model is optimal to ensure auto fluorescent signal returned from
tissue is minimised. The increase in signal seen at lower wavelengths is due to
fluorescent emission from primarily deoxygenated and oxygenated haemoglobin
(Weissleder and Ntziachristos 2003). This observation has important implications for
assessing the overall sensitivity of FRI to delineate a specific molecular target. Higher
background autofluorescence levels would significantly decrease the sensitivity of the
system (i.e. the ability to detect a minimal amount of fluorescence signal returned
from a specific molecular target).
I have confirmed that a NIR fluorophore can be bound to both anti-DNP and E-
selectin antibodies reproducibly and that an appropriate ratio of fluorophore to
antibody can be achieved. This is vital to ensure that the bound fluorescently labelled
antibody will return adequate brightness following illumination for it to emit signal
that can be detected externally by the fluorescent reflectance imaging device. Over-
labelling of the antibody can cause auto quenching of the conjugate and hence
decrease fluorescence levels. While it is clearly paramount that the optical conjugate
is as bright as possible it is also interesting to note that it appears from the images of
EC that anti-E-selectin antibody is rapidly internalised and can be visualised within
the cells as discrete areas of increased fluorescence. If for example the conjugate was
internalised and then the fluorophore could be engineered to dissociate from the target
molecule the fluorescent signal would then increase and this could be an effective
way of localising the fluorophore to its intended location. This has been explored by
labelling a monoclonal antibody target with up to 7 fluorophores that were then found
to dissociate following binding, thereby increasing fluorescence at the intended target
(Ogawa, Regino et al. 2009). Anti-E-selectin labelled fluorescence labelling does not
affect epitope recognition.
Chapter 3
111
It was then necessary to ensure that the conjugation process had not affected the
binding of antibody for its intended molecular target. This was confirmed by both
ELISA and a cell based assay of EC that had been stimulated with TNF. This system
also helped to confirm the time course of E-selectin expression following stimulation
with TNF. This is of relevance particularly when investigating the parameters of E-
selectin expression following injection of TNF into the mouse footpad. The time
course of E-selectin expression also reflects that seen by previous investigators when
E-selectin is induced on EC in response to pro-inflammatory cytokines involved in
RA such as interleukin (IL)-1 and TNF(Pober, Gimbrone et al. 1986; Wellicome,
Thornhill et al. 1990). The analysis of pixel intensities returned from digitised images
and from labelled E-selectin and DNP antibodies demonstrates a linear relationship
between antibody/fluorophore concentration and Mean fluorescence intensity. The
ability to understand clearly both the composition of a digital image and how it may
be quantified, with a reproducible measuring technique was clearly vital for
performing quantification when undertaking in vivo imaging experiments.
The following chapter details how an acute model of inflammation may be used to
determine the parameters of targeted in vivo fluorescent imaging. The effects of
TNF injection into the paw are investigated. Increased E-selectin expression is
demonstrated by immunohistochemistry, and the use of in vivo fluorescent imaging to
detect specific E-selectin targeted signal is investigated.

Chapter 4
112
CHAPTER 4
Chapter 4
113
4 RESULTS: ESTABLISHING AN ACUTE MODEL OF
INFLAMMATION FOR IN VIVO FLUORESCENCE
IMAGING
4.1 Introduction
In the previous chapter I demonstrated that E-selectin could be targeted by anti-E-
selectin antibody following its conjugation to a NIR fluorophore. Following the ex
vivo fluorescence imaging described in Section 3.3.5, my subsequent aim was to use
this conjugate to quantify E-selectin expression by detecting NIR fluorescence in vivo.
Fluorescence imaging has been used previously to detect arthritis and the ability of
fluorescence imaging to detect both non-specific uptake of dye to sites of
inflammation (Hansch, Frey et al. 2004) and also detect antigen targeted dye
deposition (Hansch, Frey et al. 2004; Chen, Mahmood et al. 2005) is discussed in
Section 3.3.6. These studies have unpinned the potential use of fluorochrome imaging
in the NIR for the detection of inflammatory changes in experimental arthritis.
An acute model of inflammation was required for in vivo imaging studies to
determine whether E-selectin could be detected early in the inflammatory response,
prior to exploring the parameters of fluorescence imaging in murine CIA, which is a
complex model of arthritis characterised by significant heterogeneity in time of onset,
incidence and disease severity. Therefore, while setting up novel imaging equipment
and determining the parameters of imaging in vivo, an acute model of inflammation
would best serve this purpose. This would also ensure that appropriate numbers of
animals could be used for controls, experiments could be performed quickly and
efficiently, whilst also minimising animal redundancy because incidence would be
100%. In my preliminary work (not described in this thesis), I investigated the effect
of zymosan injections into the mouse paw. This technique is recognised to produce an
acute, intense inflammatory reaction with severe joint swelling. Prior work by Gado
and Gigler has investigated this model to explore the parameters of pain pathways.
The development of these models is discussed in Section 1.4.2. In their experiment,
the rat paw was injected with 0.1ml of a 2% suspension of zymosan and this caused a
90% increase in paw volume (Gado and Gigler 1991). My preliminary qualitative
findings also confirmed that animals develop an intense degree of paw oedema. I
therefore considered that the modulation of an inflammatory model by a single
Chapter 4
114
cytokine may generate a less complex inflammatory process that did not lead to such
significant levels of oedema. Since TNF is a central regulator in CIA as well as in
RA, I explored whether this cytokine could be used to develop an acute inflammatory
response. The role of TNF in CIA was primarily demonstrated by investigating the
effect of TNF blockade. The abrogation of arthritis in this animal model provided
the pre-clinical data demonstrating that blockade of TNF was a viable therapeutic
target for patients with RA (Williams, Inglis et al. 2005). TNF injections into the
footpad have also been used to investigate mechanisms of hyperalgesia. Prior work on
this model is discussed in the introductory Section 1.4.2.
TNF, IL-1 and bacterial lipopolysaccharide all transcriptionally induce the
expression of E-selectin, an adhesion molecule expressed in RA and the target of the
antibody characterised in Chapter 3. Work on human endothelioma cell lines has
shown expression of the protein to reach maximal levels 4-6 hours after stimulation
with TNF with a decline to basal levels at 12-16 hours (Pober, Lapierre et al. 1987;
Wellicome, Thornhill et al. 1990). Similar expression kinetics were also shown on
mouse endothelioma cell lines, with maximal cell surface expression at 4 hours when
stimulated with TNF (Weller, Isenmann et al. 1992; Hahne, Jager et al. 1993).
Furthermore, my own results described in Chapter 3 have shown that TNF
upregulates E-selectin expression in mouse PY4.1 endothelial cells. This therefore
confirms that the expression kinetics of E-selectin are well suited to investigation with
an acute inflammatory model.
A well validated target antibody, labelled to a NIR fluorophore with confirmed
binding to recombinant E-selectin and to E-selectin expressed on TNF-stimulated
EC, as well an isotype control antibody, were both now ready. These could be tested
in an acute model of inflammation to explore the parameters of in vivo imaging, as
described in Chapter 3. My objective was therefore to investigate the specificity of
localised antibody binding versus non-specific trafficking to sites of inflammation. By
utilising the above target and control antibody I aimed to delineate the sensitivity of
the system (differences between background autofluorescence and dye-labelled
antibody generated signal intensity); and the specificity of binding (differences
between anti-E-selectin versus anti-DNP generated fluorescent signal intensity).
Chapter 4
115
Finally, a number of different anti-TNF MoAbs have now been shown in clinical
trials to be effective in patients with severe RA. This mode of therapy for RA is
discussed in Section 1.1.2. In addition to chimeric or humanised monoclonal
antibodies that are in clinical use for TNF blockade in RA, various TNF receptor
based biologics have also been tested and shown to be effective. The most significant
of these in current clinical use is etanercept, a dimeric TNF receptor type II-Fc fusion
protein (Moreland, Baumgartner et al. 1997). I have investigated the use of this drug
to prevent TNF-induced paw swelling and have shown that this can also be detected
by E-selectin targeted in vivo fluorescent imaging, thereby validating this as an in vivo
molecular imaging technique.
4.2 Objectives
i. To develop a cytokine-mediated acute model of inflammation that has a 100%
incidence, an acute time course, is dose dependent and reproducible
ii. To demonstrate that TNF injection into the paw causes increased E-selectin
expression that can be detected by immunohistochemistry
iii. To investigate whether TNF injection into the paw causes increased E-
selectin expression that can be detected in vivo by fluorescently labelled anti-
E-selectin antibody
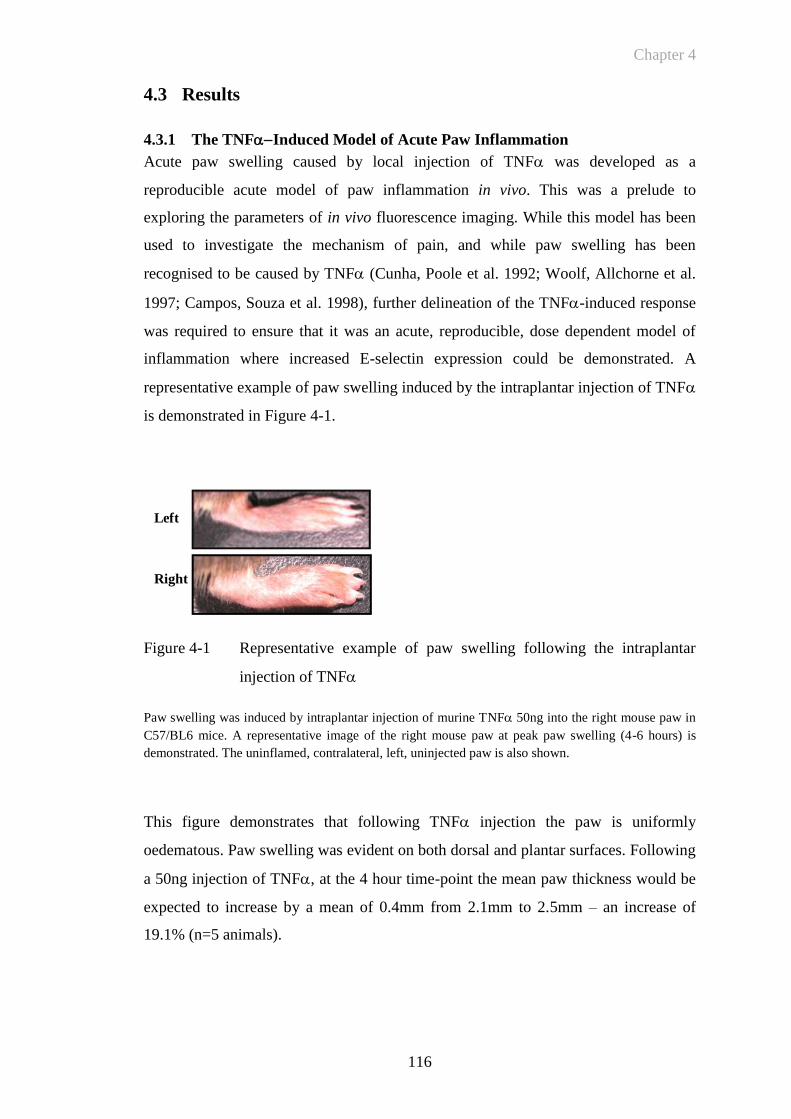
Chapter 4
116
4.3 Results
4.3.1 The TNFInduced Model of Acute Paw Inflammation
Acute paw swelling caused by local injection of TNF was developed as a
reproducible acute model of paw inflammation in vivo. This was a prelude to
exploring the parameters of in vivo fluorescence imaging. While this model has been
used to investigate the mechanism of pain, and while paw swelling has been
recognised to be caused by TNF (Cunha, Poole et al. 1992; Woolf, Allchorne et al.
1997; Campos, Souza et al. 1998), further delineation of the TNF-induced response
was required to ensure that it was an acute, reproducible, dose dependent model of
inflammation where increased E-selectin expression could be demonstrated. A
representative example of paw swelling induced by the intraplantar injection of TNF
is demonstrated in Figure 4-1.
Figure 4-1 Representative example of paw swelling following the intraplantar
injection of TNF
Paw swelling was induced by intraplantar injection of murine TNF 50ng into the right mouse paw in
C57/BL6 mice. A representative image of the right mouse paw at peak paw swelling (4-6 hours) is
demonstrated. The uninflamed, contralateral, left, uninjected paw is also shown.
This figure demonstrates that following TNF injection the paw is uniformly
oedematous. Paw swelling was evident on both dorsal and plantar surfaces. Following
a 50ng injection of TNF, at the 4 hour time-point the mean paw thickness would be
expected to increase by a mean of 0.4mm from 2.1mm to 2.5mm – an increase of
19.1% (n=5 animals).
Left
Right
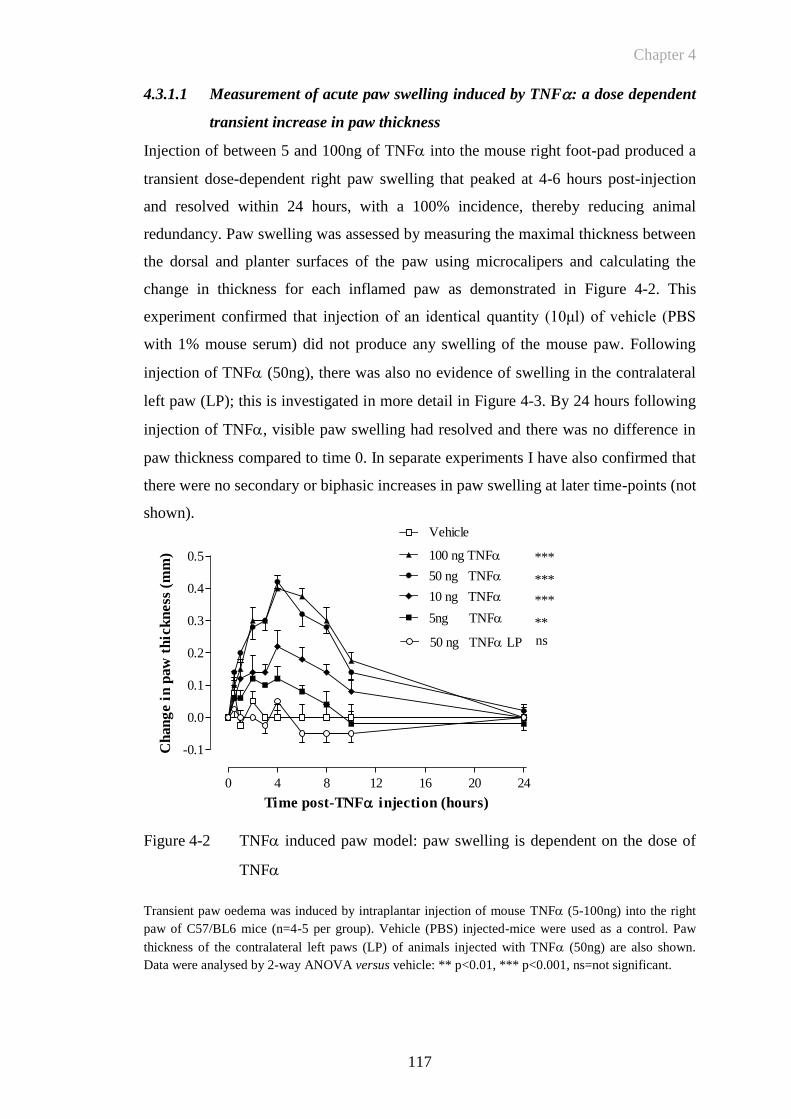
Chapter 4
117
0 4 8 12 16 20 24
-0.1
0.0
0.1
0.2
0.3
0.4
0.5 100 ng TNF
50 ng TNF
5ng TNF
Vehicle
***
***
**
10 ng TNF
50 ng TNF LP ns
***
Time post-TNF injection (hours)
Ch
an
ge i
n p
aw
th
ick
ness
(m
m)
4.3.1.1 Measurement of acute paw swelling induced by TNF: a dose dependent
transient increase in paw thickness
Injection of between 5 and 100ng of TNF into the mouse right foot-pad produced a
transient dose-dependent right paw swelling that peaked at 4-6 hours post-injection
and resolved within 24 hours, with a 100% incidence, thereby reducing animal
redundancy. Paw swelling was assessed by measuring the maximal thickness between
the dorsal and planter surfaces of the paw using microcalipers and calculating the
change in thickness for each inflamed paw as demonstrated in Figure 4-2. This
experiment confirmed that injection of an identical quantity (10μl) of vehicle (PBS
with 1% mouse serum) did not produce any swelling of the mouse paw. Following
injection of TNF (50ng), there was also no evidence of swelling in the contralateral
left paw (LP); this is investigated in more detail in Figure 4-3. By 24 hours following
injection of TNF, visible paw swelling had resolved and there was no difference in
paw thickness compared to time 0. In separate experiments I have also confirmed that
there were no secondary or biphasic increases in paw swelling at later time-points (not
shown).
Figure 4-2 TNF induced paw model: paw swelling is dependent on the dose of
TNF
Transient paw oedema was induced by intraplantar injection of mouse TNF (5-100ng) into the right
paw of C57/BL6 mice (n=4-5 per group). Vehicle (PBS) injected-mice were used as a control. Paw
thickness of the contralateral left paws (LP) of animals injected with TNF (50ng) are also shown.
Data were analysed by 2-way ANOVA versus vehicle: ** p<0.01, *** p<0.001, ns=not significant.
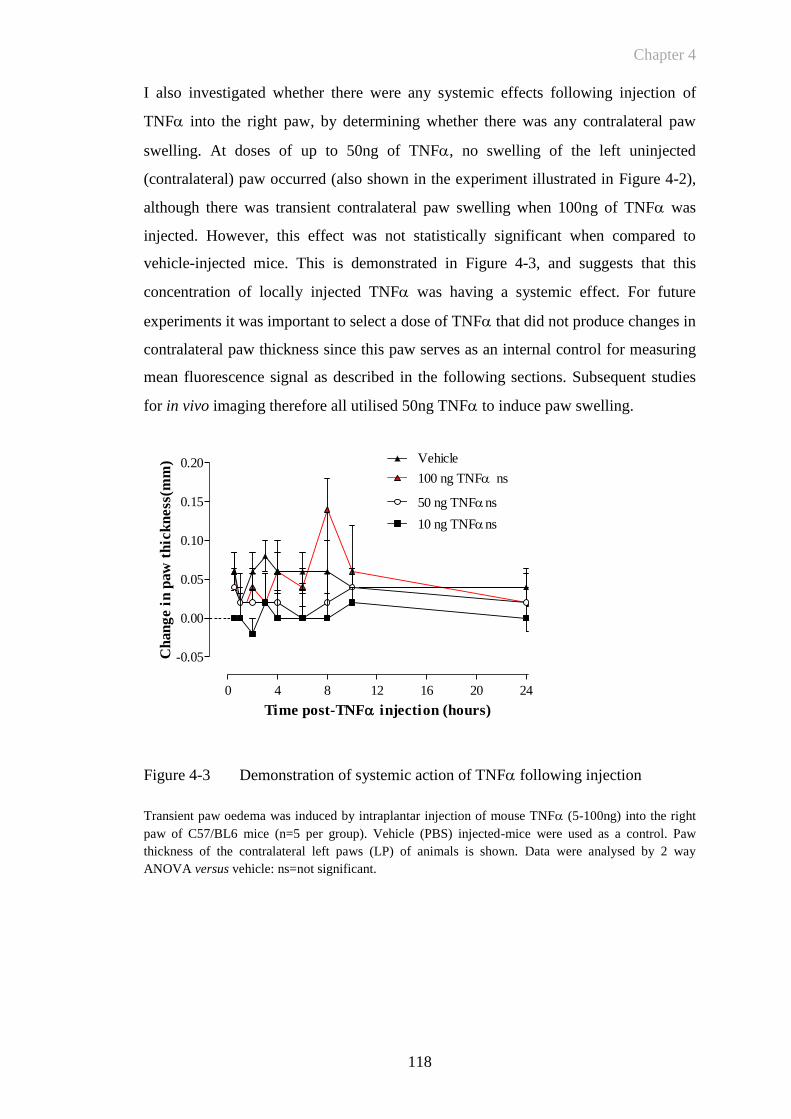
Chapter 4
118
I also investigated whether there were any systemic effects following injection of
TNF into the right paw, by determining whether there was any contralateral paw
swelling. At doses of up to 50ng of TNF, no swelling of the left uninjected
(contralateral) paw occurred (also shown in the experiment illustrated in Figure 4-2),
although there was transient contralateral paw swelling when 100ng of TNF was
injected. However, this effect was not statistically significant when compared to
vehicle-injected mice. This is demonstrated in Figure 4-3, and suggests that this
concentration of locally injected TNF was having a systemic effect. For future
experiments it was important to select a dose of TNF that did not produce changes in
contralateral paw thickness since this paw serves as an internal control for measuring
mean fluorescence signal as described in the following sections. Subsequent studies
for in vivo imaging therefore all utilised 50ng TNF to induce paw swelling.
Figure 4-3 Demonstration of systemic action of TNF following injection
Transient paw oedema was induced by intraplantar injection of mouse TNF (5-100ng) into the right
paw of C57/BL6 mice (n=5 per group). Vehicle (PBS) injected-mice were used as a control. Paw
thickness of the contralateral left paws (LP) of animals is shown. Data were analysed by 2 way
ANOVA versus vehicle: ns=not significant.
0 4 8 12 16 20 24
-0.05
0.00
0.05
0.10
0.15
0.20100 ng TNF ns
Vehicle
50 ng TNFns
10 ng TNFns
Time post-TNF injection (hours)
Ch
an
ge i
n p
aw
th
ick
ness
(mm
)
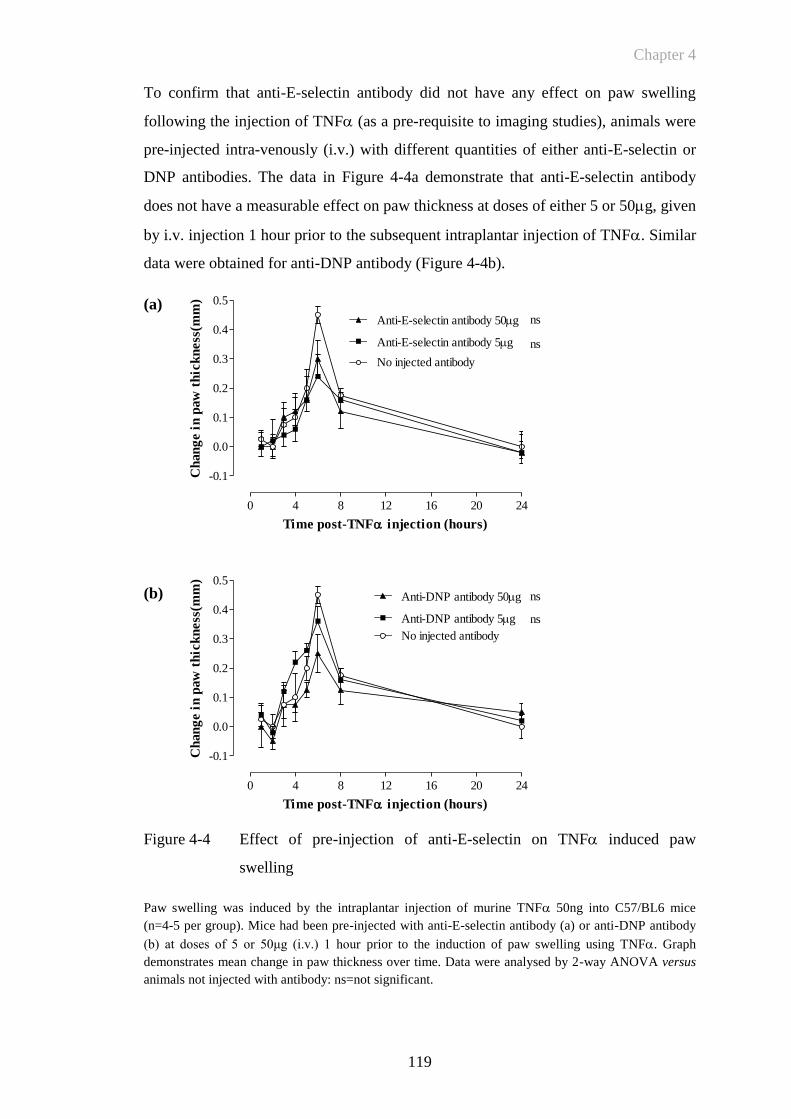
Chapter 4
119
0 4 8 12 16 20 24
-0.1
0.0
0.1
0.2
0.3
0.4
0.5
Anti-E-selectin antibody 50g
No injected antibody
Anti-E-selectin antibody 5g
ns
ns
Time post-TNF injection (hours)
Ch
an
ge i
n p
aw
th
ick
ness
(mm
)
0 4 8 12 16 20 24
-0.1
0.0
0.1
0.2
0.3
0.4
0.5
No injected antibody
Anti-DNP antibody 50g
Anti-DNP antibody 5g
ns
ns
Time post-TNF injection (hours)
Ch
an
ge i
n p
aw
th
ick
ness
(mm
)
To confirm that anti-E-selectin antibody did not have any effect on paw swelling
following the injection of TNF (as a pre-requisite to imaging studies), animals were
pre-injected intra-venously (i.v.) with different quantities of either anti-E-selectin or
DNP antibodies. The data in Figure 4-4a demonstrate that anti-E-selectin antibody
does not have a measurable effect on paw thickness at doses of either 5 or 50g, given
by i.v. injection 1 hour prior to the subsequent intraplantar injection of TNF. Similar
data were obtained for anti-DNP antibody (Figure 4-4b).
(a)
(b)
Figure 4-4 Effect of pre-injection of anti-E-selectin on TNF induced paw
swelling
Paw swelling was induced by the intraplantar injection of murine TNF 50ng into C57/BL6 mice
(n=4-5 per group). Mice had been pre-injected with anti-E-selectin antibody (a) or anti-DNP antibody
(b) at doses of 5 or 50μg (i.v.) 1 hour prior to the induction of paw swelling using TNF. Graph
demonstrates mean change in paw thickness over time. Data were analysed by 2-way ANOVA versus
animals not injected with antibody: ns=not significant.
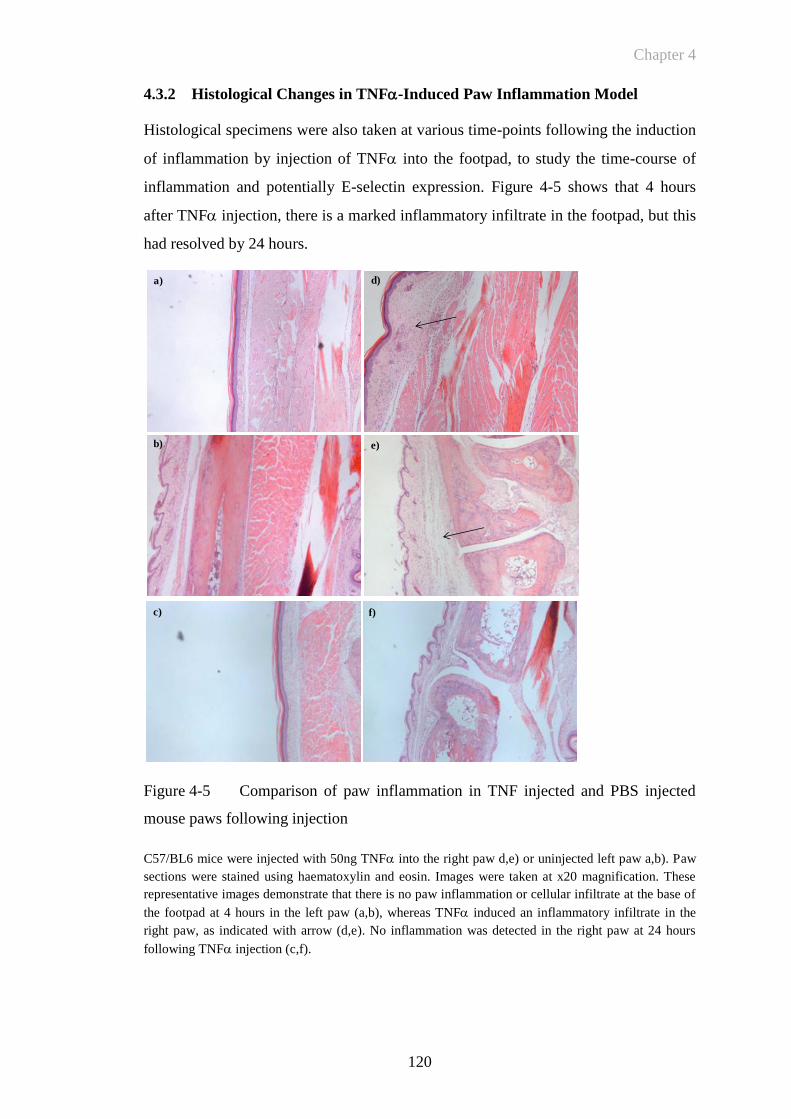
Chapter 4
120
4.3.2 Histological Changes in TNF-Induced Paw Inflammation Model
Histological specimens were also taken at various time-points following the induction
of inflammation by injection of TNF into the footpad, to study the time-course of
inflammation and potentially E-selectin expression. Figure 4-5 shows that 4 hours
after TNF injection, there is a marked inflammatory infiltrate in the footpad, but this
had resolved by 24 hours.
Figure 4-5 Comparison of paw inflammation in TNF injected and PBS injected
mouse paws following injection
C57/BL6 mice were injected with 50ng TNF into the right paw d,e) or uninjected left paw a,b). Paw
sections were stained using haematoxylin and eosin. Images were taken at x20 magnification. These
representative images demonstrate that there is no paw inflammation or cellular infiltrate at the base of
the footpad at 4 hours in the left paw (a,b), whereas TNF induced an inflammatory infiltrate in the
right paw, as indicated with arrow (d,e). No inflammation was detected in the right paw at 24 hours
following TNF injection (c,f).
a)
b)
c)
d)
e)
f)
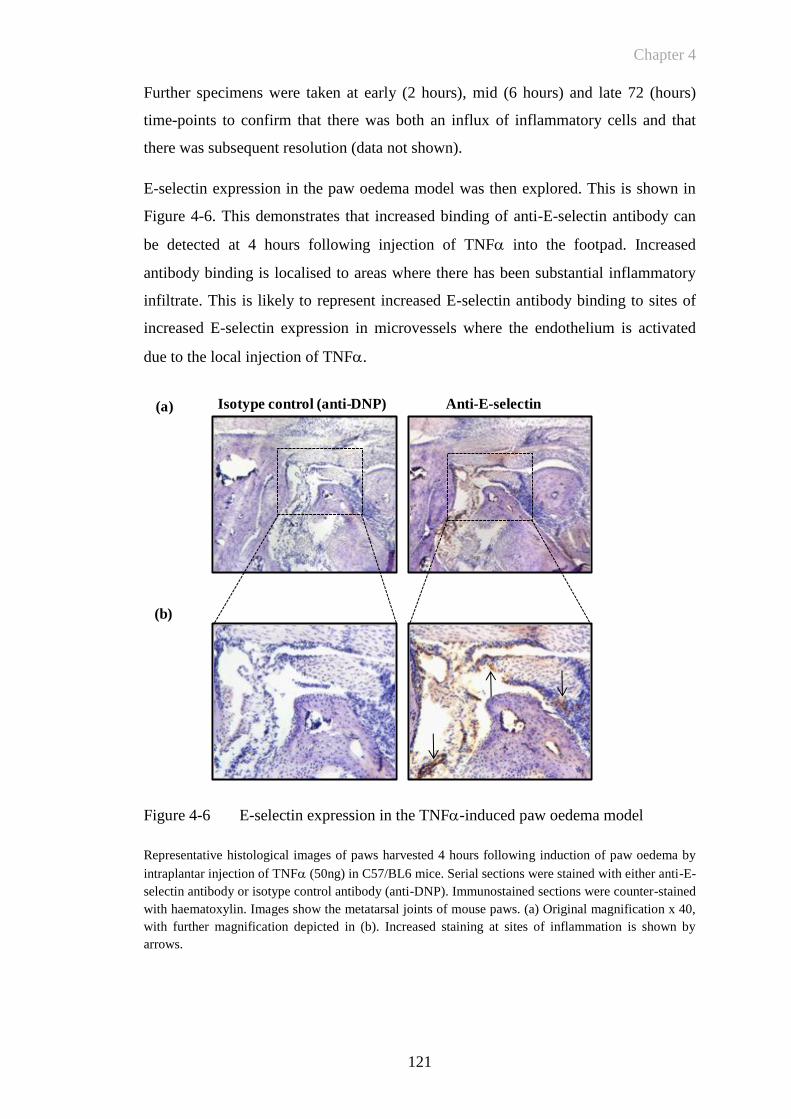
Chapter 4
121
Further specimens were taken at early (2 hours), mid (6 hours) and late 72 (hours)
time-points to confirm that there was both an influx of inflammatory cells and that
there was subsequent resolution (data not shown).
E-selectin expression in the paw oedema model was then explored. This is shown in
Figure 4-6. This demonstrates that increased binding of anti-E-selectin antibody can
be detected at 4 hours following injection of TNF into the footpad. Increased
antibody binding is localised to areas where there has been substantial inflammatory
infiltrate. This is likely to represent increased E-selectin antibody binding to sites of
increased E-selectin expression in microvessels where the endothelium is activated
due to the local injection of TNF.
Figure 4-6 E-selectin expression in the TNF-induced paw oedema model
Representative histological images of paws harvested 4 hours following induction of paw oedema by
intraplantar injection of TNF (50ng) in C57/BL6 mice. Serial sections were stained with either anti-E-
selectin antibody or isotype control antibody (anti-DNP). Immunostained sections were counter-stained
with haematoxylin. Images show the metatarsal joints of mouse paws. (a) Original magnification x 40,
with further magnification depicted in (b). Increased staining at sites of inflammation is shown by
arrows.
Isotype control (anti-DNP) Anti-E-selectin
(b)
(a)
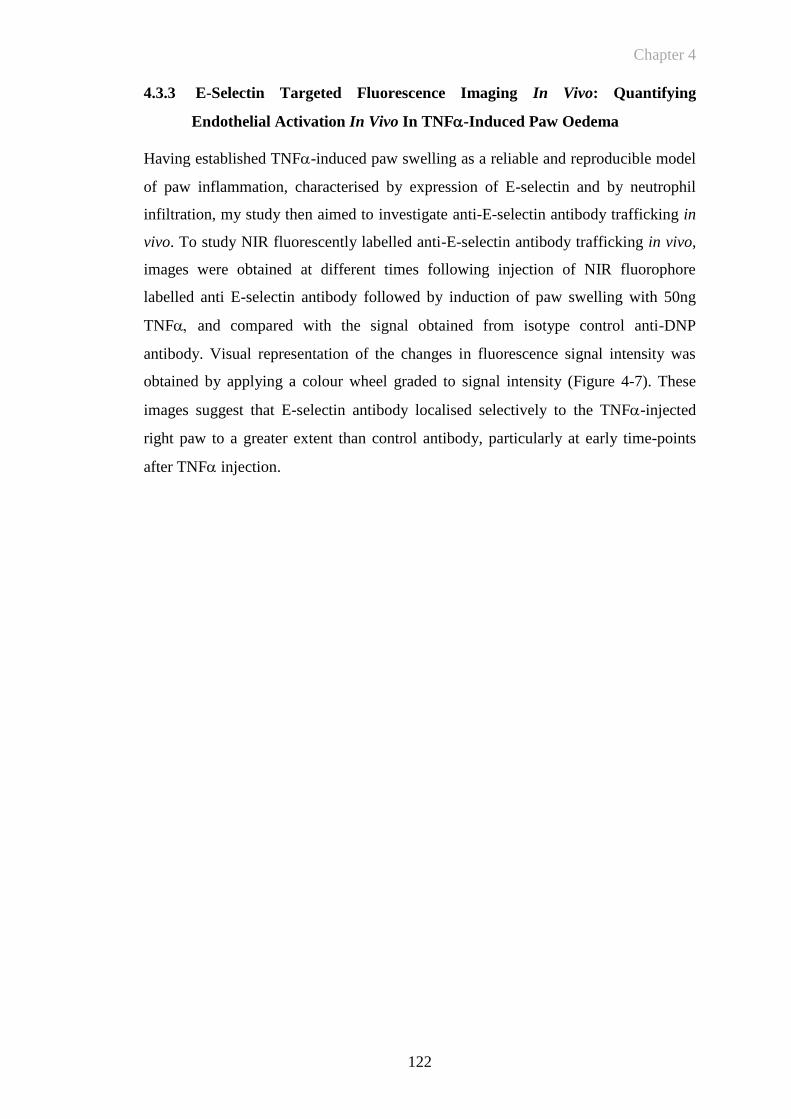
Chapter 4
122
4.3.3 E-Selectin Targeted Fluorescence Imaging In Vivo: Quantifying
Endothelial Activation In Vivo In TNF-Induced Paw Oedema
Having established TNF-induced paw swelling as a reliable and reproducible model
of paw inflammation, characterised by expression of E-selectin and by neutrophil
infiltration, my study then aimed to investigate anti-E-selectin antibody trafficking in
vivo. To study NIR fluorescently labelled anti-E-selectin antibody trafficking in vivo,
images were obtained at different times following injection of NIR fluorophore
labelled anti E-selectin antibody followed by induction of paw swelling with 50ng
TNF and compared with the signal obtained from isotype control anti-DNP
antibody. Visual representation of the changes in fluorescence signal intensity was
obtained by applying a colour wheel graded to signal intensity (Figure 4-7). These
images suggest that E-selectin antibody localised selectively to the TNF-injected
right paw to a greater extent than control antibody, particularly at early time-points
after TNF injection.
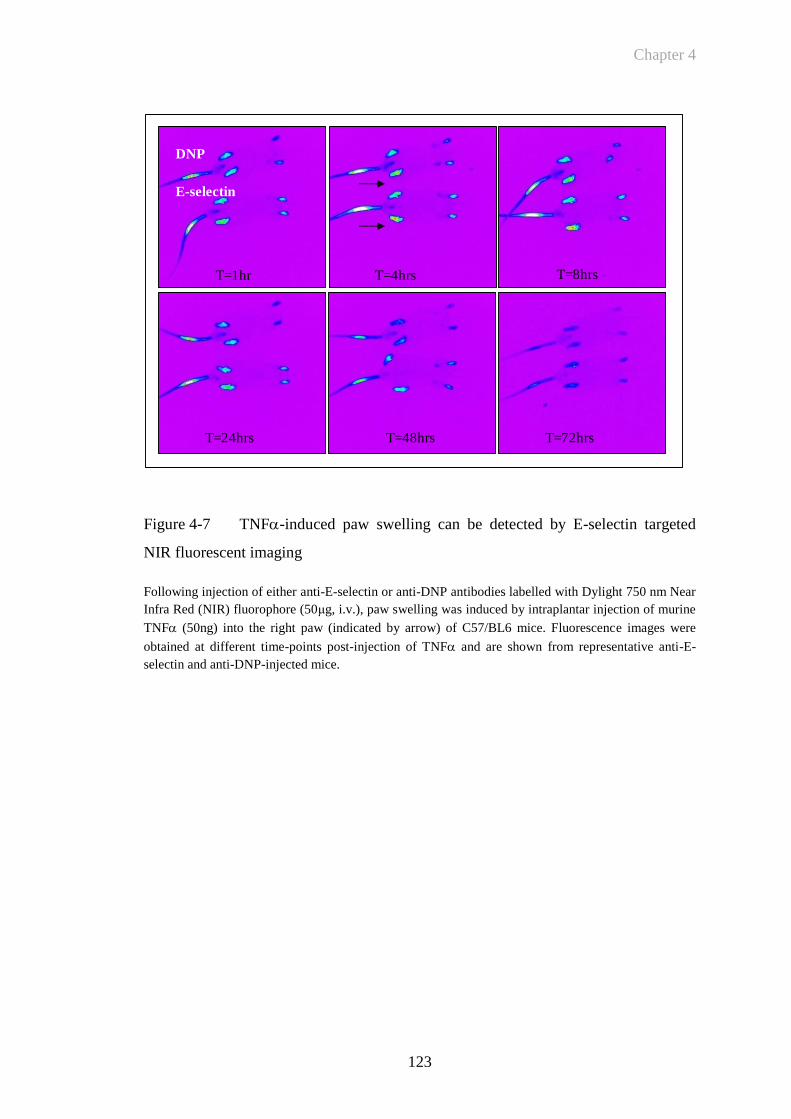
Chapter 4
123
T=8hrsT=4hrsT=1hr
T=24hrs T=48hrs T=72hrs
DNP
E-selectin
Figure 4-7 TNF-induced paw swelling can be detected by E-selectin targeted
NIR fluorescent imaging
Following injection of either anti-E-selectin or anti-DNP antibodies labelled with Dylight 750 nm Near
Infra Red (NIR) fluorophore (50μg, i.v.), paw swelling was induced by intraplantar injection of murine
TNF (50ng) into the right paw (indicated by arrow) of C57/BL6 mice. Fluorescence images were
obtained at different time-points post-injection of TNF and are shown from representative anti-E-
selectin and anti-DNP-injected mice.
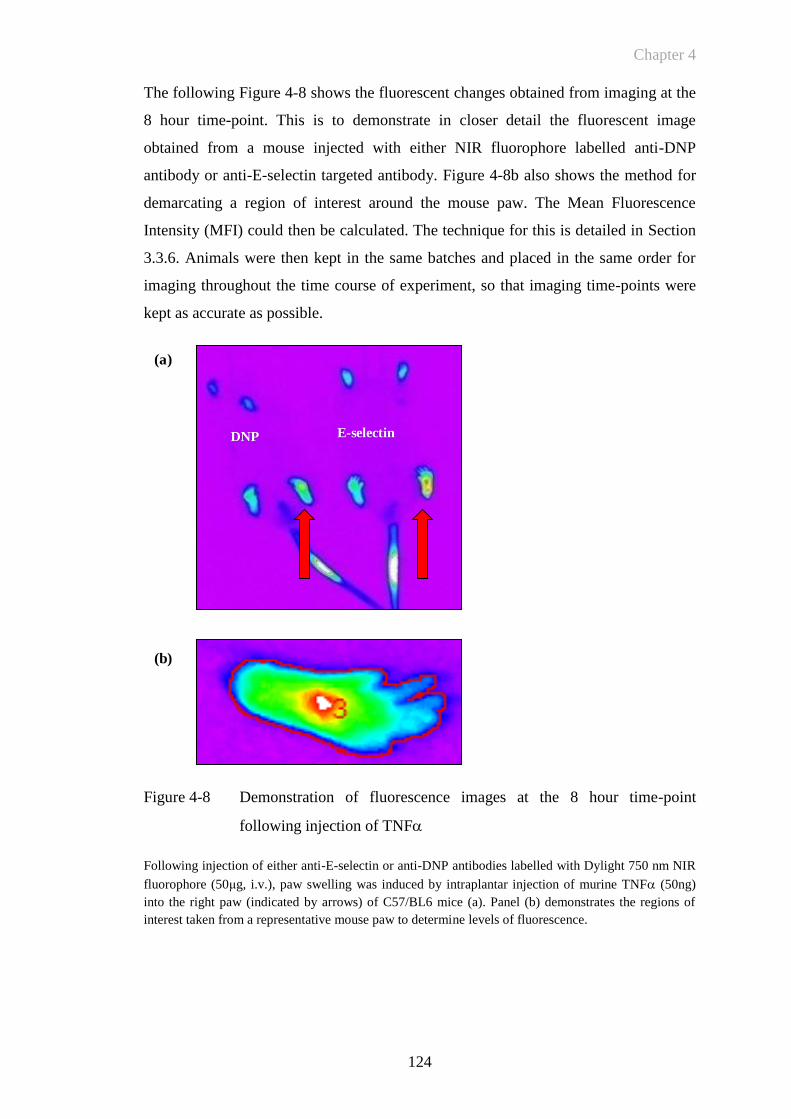
Chapter 4
124
The following Figure 4-8 shows the fluorescent changes obtained from imaging at the
8 hour time-point. This is to demonstrate in closer detail the fluorescent image
obtained from a mouse injected with either NIR fluorophore labelled anti-DNP
antibody or anti-E-selectin targeted antibody. Figure 4-8b also shows the method for
demarcating a region of interest around the mouse paw. The Mean Fluorescence
Intensity (MFI) could then be calculated. The technique for this is detailed in Section
3.3.6. Animals were then kept in the same batches and placed in the same order for
imaging throughout the time course of experiment, so that imaging time-points were
kept as accurate as possible.
Figure 4-8 Demonstration of fluorescence images at the 8 hour time-point
following injection of TNF
Following injection of either anti-E-selectin or anti-DNP antibodies labelled with Dylight 750 nm NIR
fluorophore (50μg, i.v.), paw swelling was induced by intraplantar injection of murine TNF (50ng)
into the right paw (indicated by arrows) of C57/BL6 mice (a). Panel (b) demonstrates the regions of
interest taken from a representative mouse paw to determine levels of fluorescence.
DNP E-selectin
(a)
(b)

Chapter 4
125
Quantification of fluorescence intensity levels from regions of interest (ROI) of
inflamed paws showed the dynamic changes of anti-E-selectin and anti DNP antibody
signal in eight animals injected with either target or control dye-labelled antibody and
then imaged in pairs. The signal in the right paws (RP) from both groups peaked 6-8
hours after injection and had largely returned to baseline at 72 hours following
injection of antibody (Figure 4-9). Fluorescence signal was higher for anti-E-selectin-
injected animals than for anti-DNP-injected mice. Furthermore, fluorescence signal
was lower in the contralateral left paws (LP; not injected with TNF) than in the RP
for both anti-E-selectin and anti-DNP antibody-injected mice.
Chapter 4
126
Figure 4-9 Quantification of E-selectin targeted NIR fluorescence in the TNF-
induced paw swelling model
Following injection of either anti-E-selectin or anti-DNP antibodies labelled with Dylight 750 nm NIR
fluorophore (50μg, i.v.), paw swelling was induced by intraplantar injection of murine TNF (50ng)
into the right paw (RP) of C57/BL6 mice. Fluorescence images were analysed at different time-points
post-injection of TNF for pairs of anti-E-selectin and anti-DNP-injected mice. Mean Fluorescence
Intensity (MFI) measurements in injected RP and contralateral left paws (LP) for 4 individual pairs of
mice are shown in panels (a-d).
The mean fluorescence signal from all mice was then analysed, this is shown in
Figure 4-10. These data show that there were significant differences (p<0.001)
between the anti-E-selectin and anti-DNP antibody injected animals in terms of the
fluorescence signal in the TNF-injected right paws (Figure 4-10a). There were also
significant differences between the anti-E-selectin and anti-DNP antibody injected
animals in the contralateral left paws (LP; p<0.001), and in animals that were injected
with dye-labelled antibody but did not receive any intraplantar injection of TNF
(p<0.001; Figure 4-10b). Further analysis of the control groups for this experiment is
outlined in the next paragraph.
0 12 24 36 48 60 72
0
2000
4000
6000
Anti-DNP (LP)
Anti-DNP (RP)
Anti-E-selectin (LP)
Anti-E-selectin (RP)
Time post-TNF injection (hours)
MF
I (a
u)
0 12 24 36 48 60 72
0
2000
4000
6000
Anti-DNP (LP)
Anti-DNP (RP)
Anti-E-selectin (RP)
Anti-E-selectin (RP)
Time post-TNF injection (hours)
MF
I (a
u)
0 12 24 36 48 60 72
0
2000
4000
6000
Anti-E-selectin (LP)
Anti-DNP (RP)
Anti-E-selectin (LP)
Anti-E-selectin (RP)
Time post-TNF injection (hours)
MF
I (a
u)
0 12 24 36 48 60 72
0
2000
4000
6000
Anti-DNP (LP)
Anti-DNP (RP)
Anti-E-selectin (LP)
Anti-E-selectin (RP)
Time post-TNF injection (hours)
MF
I (a
u)
(a) (b)
(d)(c)
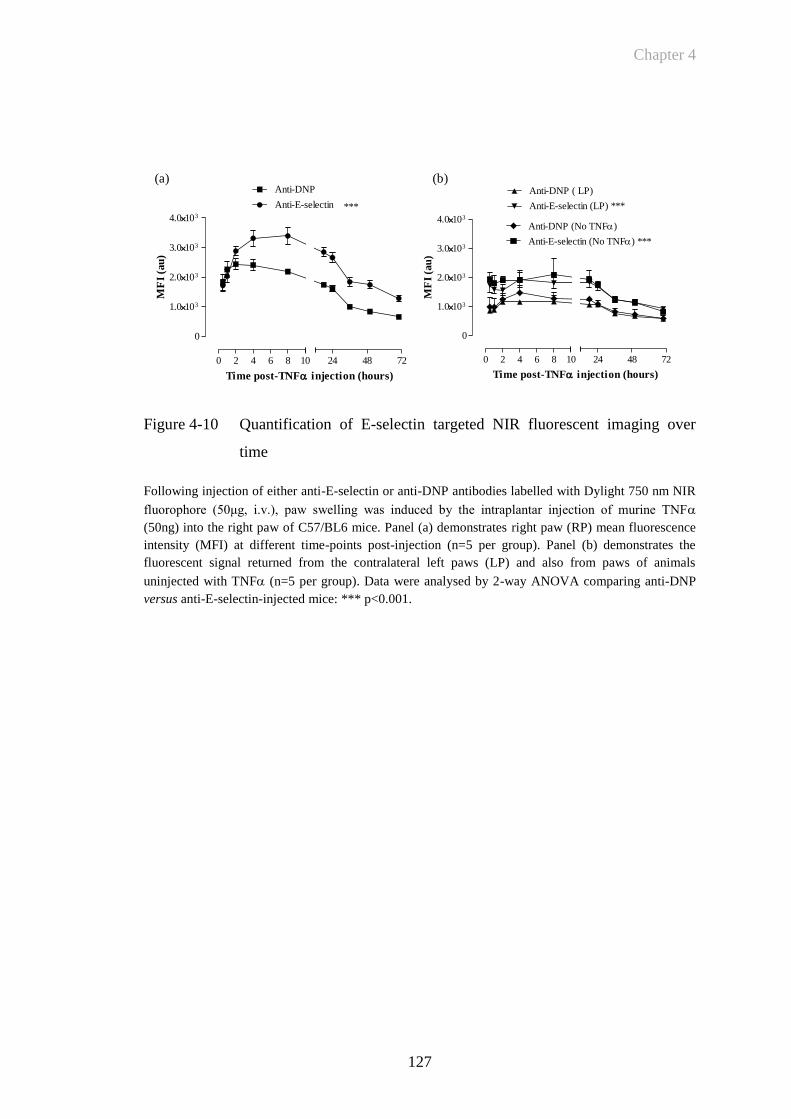
Chapter 4
127
Figure 4-10 Quantification of E-selectin targeted NIR fluorescent imaging over
time
Following injection of either anti-E-selectin or anti-DNP antibodies labelled with Dylight 750 nm NIR
fluorophore (50μg, i.v.), paw swelling was induced by the intraplantar injection of murine TNF
(50ng) into the right paw of C57/BL6 mice. Panel (a) demonstrates right paw (RP) mean fluorescence
intensity (MFI) at different time-points post-injection (n=5 per group). Panel (b) demonstrates the
fluorescent signal returned from the contralateral left paws (LP) and also from paws of animals
uninjected with TNF (n=5 per group). Data were analysed by 2-way ANOVA comparing anti-DNP
versus anti-E-selectin-injected mice: *** p<0.001.
(b)(a)
0 2 4 6 8 10
0
1.0103
2.0103
3.0103
4.0103
24 48 72
Anti-DNP
Anti-E-selectin ***
Time post-TNF injection (hours)
MF
I (a
u)
0 2 4 6 8 10
0
1.0103
2.0103
3.0103
4.0103
24 48 72
Anti-DNP ( LP)
Anti-E-selectin (LP) ***
Anti-DNP (No TNF)
Anti-E-selectin (No TNF) ***
Time post-TNF injection (hours)
MF
I (a
u)
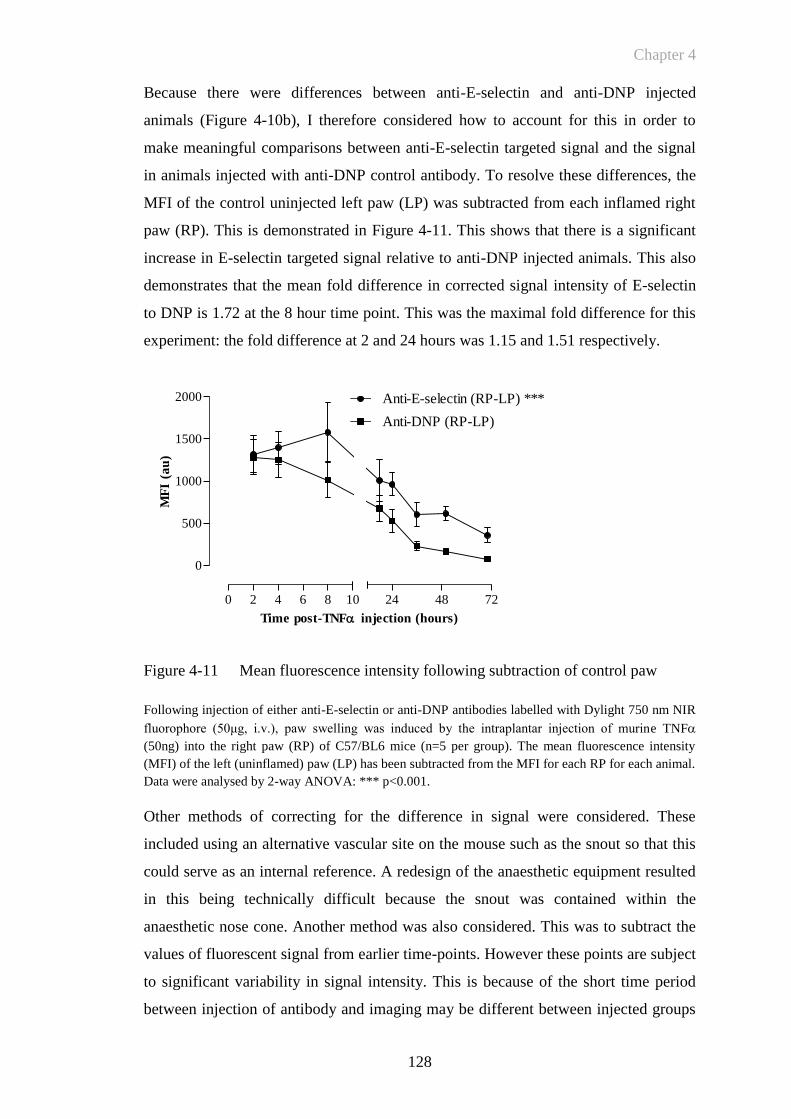
Chapter 4
128
Because there were differences between anti-E-selectin and anti-DNP injected
animals (Figure 4-10b), I therefore considered how to account for this in order to
make meaningful comparisons between anti-E-selectin targeted signal and the signal
in animals injected with anti-DNP control antibody. To resolve these differences, the
MFI of the control uninjected left paw (LP) was subtracted from each inflamed right
paw (RP). This is demonstrated in Figure 4-11. This shows that there is a significant
increase in E-selectin targeted signal relative to anti-DNP injected animals. This also
demonstrates that the mean fold difference in corrected signal intensity of E-selectin
to DNP is 1.72 at the 8 hour time point. This was the maximal fold difference for this
experiment: the fold difference at 2 and 24 hours was 1.15 and 1.51 respectively.
Figure 4-11 Mean fluorescence intensity following subtraction of control paw
Following injection of either anti-E-selectin or anti-DNP antibodies labelled with Dylight 750 nm NIR
fluorophore (50μg, i.v.), paw swelling was induced by the intraplantar injection of murine TNF
(50ng) into the right paw (RP) of C57/BL6 mice (n=5 per group). The mean fluorescence intensity
(MFI) of the left (uninflamed) paw (LP) has been subtracted from the MFI for each RP for each animal.
Data were analysed by 2-way ANOVA: *** p<0.001.
Other methods of correcting for the difference in signal were considered. These
included using an alternative vascular site on the mouse such as the snout so that this
could serve as an internal reference. A redesign of the anaesthetic equipment resulted
in this being technically difficult because the snout was contained within the
anaesthetic nose cone. Another method was also considered. This was to subtract the
values of fluorescent signal from earlier time-points. However these points are subject
to significant variability in signal intensity. This is because of the short time period
between injection of antibody and imaging may be different between injected groups
0 2 4 6 8 10
0
500
1000
1500
2000
24 48 72
Anti-DNP (RP-LP)
Anti-E-selectin (RP-LP) ***
Time post-TNF injection (hours)
MF
I (a
u)
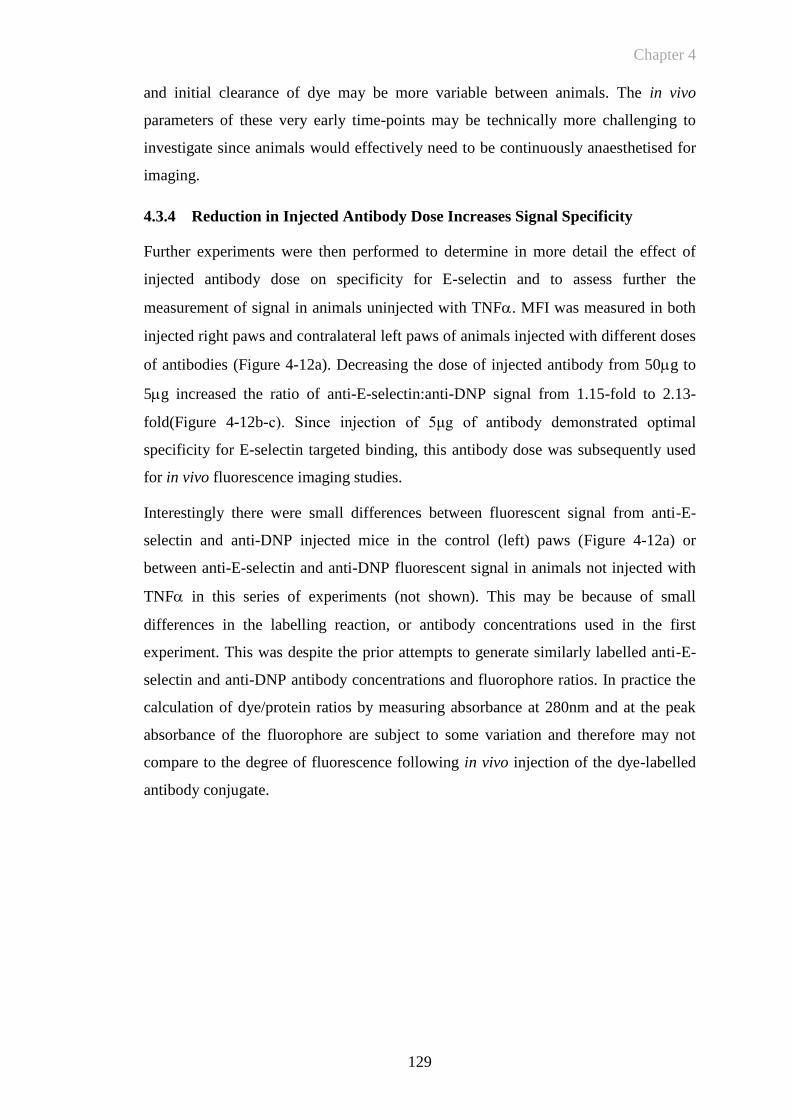
Chapter 4
129
and initial clearance of dye may be more variable between animals. The in vivo
parameters of these very early time-points may be technically more challenging to
investigate since animals would effectively need to be continuously anaesthetised for
imaging.
4.3.4 Reduction in Injected Antibody Dose Increases Signal Specificity
Further experiments were then performed to determine in more detail the effect of
injected antibody dose on specificity for E-selectin and to assess further the
measurement of signal in animals uninjected with TNF. MFI was measured in both
injected right paws and contralateral left paws of animals injected with different doses
of antibodies (Figure 4-12a). Decreasing the dose of injected antibody from 50g to
5g increased the ratio of anti-E-selectin:anti-DNP signal from 1.15-fold to 2.13-
fold(Figure 4-12b-c). Since injection of 5μg of antibody demonstrated optimal
specificity for E-selectin targeted binding, this antibody dose was subsequently used
for in vivo fluorescence imaging studies.
Interestingly there were small differences between fluorescent signal from anti-E-
selectin and anti-DNP injected mice in the control (left) paws (Figure 4-12a) or
between anti-E-selectin and anti-DNP fluorescent signal in animals not injected with
TNF in this series of experiments (not shown). This may be because of small
differences in the labelling reaction, or antibody concentrations used in the first
experiment. This was despite the prior attempts to generate similarly labelled anti-E-
selectin and anti-DNP antibody concentrations and fluorophore ratios. In practice the
calculation of dye/protein ratios by measuring absorbance at 280nm and at the peak
absorbance of the fluorophore are subject to some variation and therefore may not
compare to the degree of fluorescence following in vivo injection of the dye-labelled
antibody conjugate.
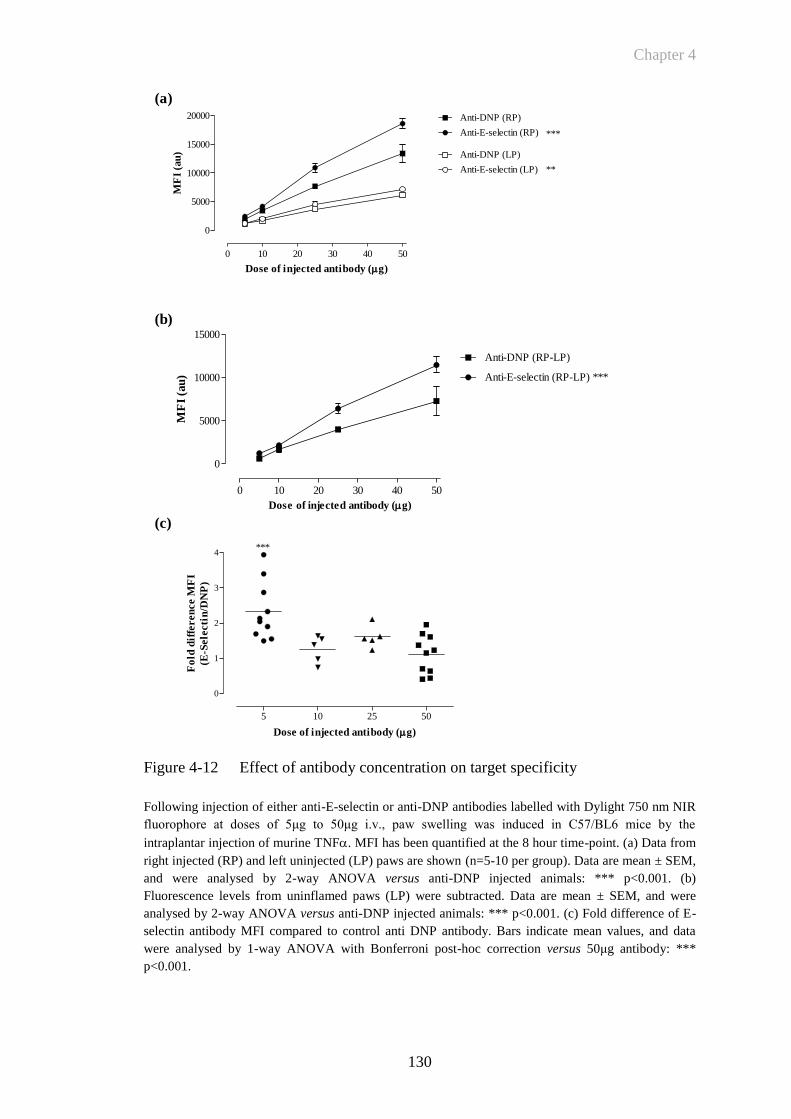
Chapter 4
130
0 10 20 30 40 50
0
5000
10000
15000
20000 Anti-DNP (RP)
Anti-E-selectin (RP)
Anti-DNP (LP)
Anti-E-selectin (LP)
***
**
Dose of injected antibody (g)
MF
I (a
u)
0 10 20 30 40 50
0
5000
10000
15000
Anti-DNP (RP-LP)
Anti-E-selectin (RP-LP) ***
Dose of injected antibody (g)
MF
I (a
u)
5 10 25 50
0
1
2
3
4***
Dose of injected antibody (g)
Fo
ld d
iffe
ren
ce M
FI
(E-S
ele
cti
n/D
NP
)
(b)
(a)
(c)
Figure 4-12 Effect of antibody concentration on target specificity
Following injection of either anti-E-selectin or anti-DNP antibodies labelled with Dylight 750 nm NIR
fluorophore at doses of 5μg to 50μg i.v., paw swelling was induced in C57/BL6 mice by the
intraplantar injection of murine TNF. MFI has been quantified at the 8 hour time-point. (a) Data from
right injected (RP) and left uninjected (LP) paws are shown (n=5-10 per group). Data are mean ± SEM,
and were analysed by 2-way ANOVA versus anti-DNP injected animals: *** p<0.001. (b)
Fluorescence levels from uninflamed paws (LP) were subtracted. Data are mean ± SEM, and were
analysed by 2-way ANOVA versus anti-DNP injected animals: *** p<0.001. (c) Fold difference of E-
selectin antibody MFI compared to control anti DNP antibody. Bars indicate mean values, and data
were analysed by 1-way ANOVA with Bonferroni post-hoc correction versus 50μg antibody: ***
p<0.001.
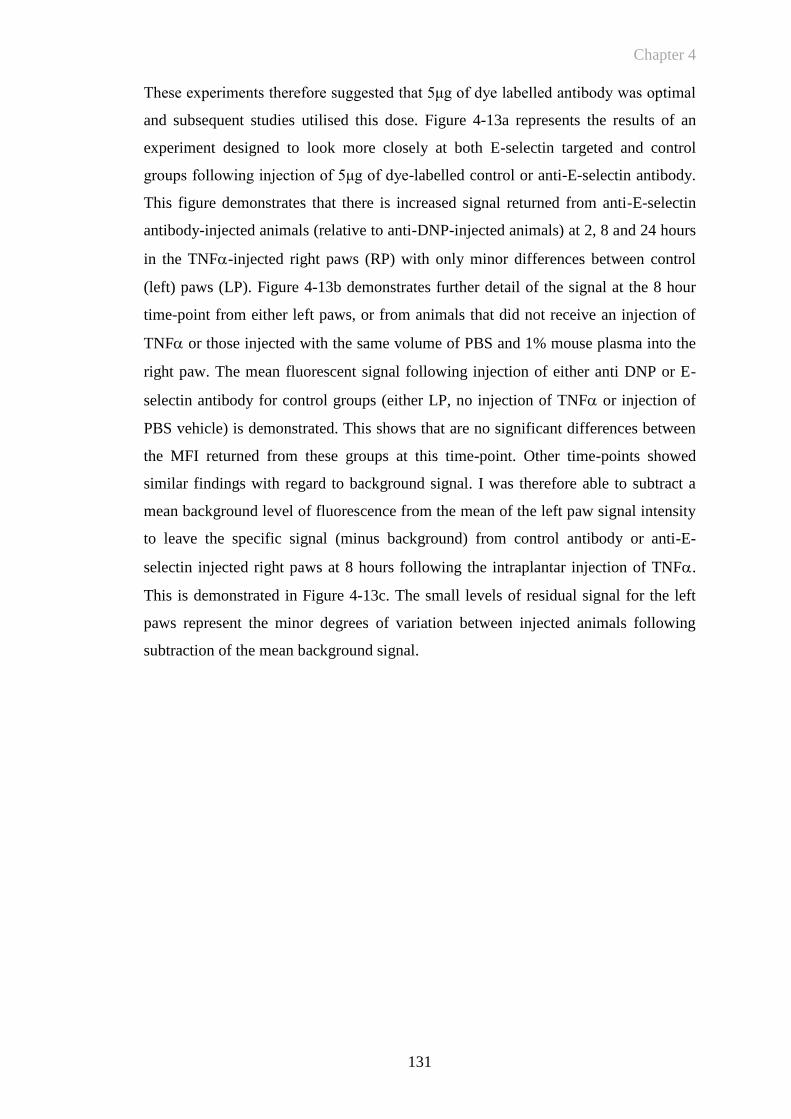
Chapter 4
131
These experiments therefore suggested that 5μg of dye labelled antibody was optimal
and subsequent studies utilised this dose. Figure 4-13a represents the results of an
experiment designed to look more closely at both E-selectin targeted and control
groups following injection of 5μg of dye-labelled control or anti-E-selectin antibody.
This figure demonstrates that there is increased signal returned from anti-E-selectin
antibody-injected animals (relative to anti-DNP-injected animals) at 2, 8 and 24 hours
in the TNF-injected right paws (RP) with only minor differences between control
(left) paws (LP). Figure 4-13b demonstrates further detail of the signal at the 8 hour
time-point from either left paws, or from animals that did not receive an injection of
TNF or those injected with the same volume of PBS and 1% mouse plasma into the
right paw. The mean fluorescent signal following injection of either anti DNP or E-
selectin antibody for control groups (either LP, no injection of TNF or injection of
PBS vehicle) is demonstrated. This shows that are no significant differences between
the MFI returned from these groups at this time-point. Other time-points showed
similar findings with regard to background signal. I was therefore able to subtract a
mean background level of fluorescence from the mean of the left paw signal intensity
to leave the specific signal (minus background) from control antibody or anti-E-
selectin injected right paws at 8 hours following the intraplantar injection of TNF.
This is demonstrated in Figure 4-13c. The small levels of residual signal for the left
paws represent the minor degrees of variation between injected animals following
subtraction of the mean background signal.

Chapter 4
132
0 4 8 12 16 20 24
0
500
1000
1500
2000
2500
Anti-DNP (LP)
Anti-DNP (RP)
Anti-E-selectin (LP)
Anti-E-selectin (RP) ***
Time post-TNF injection (hours)
MF
I (a
u)
(b)
(a)
Autofluorescence
LP RP LP RP
0
200
400
600
800
1000
Control Ab E-selectin Ab
***
ns
MF
I (a
u)
(c)
Background (MFI)
following injection of
fluorophore
Ant
i-DN
P (RP)
Ant
i E-S
elec
tin (R
P)
Ant
i-DN
P (LP)
; RP)
Ant
i-DN
P (No
TNF
PBS C
ontro
l (RP)
Ant
i-E-S
elec
tin (L
P)
; RP)
Ant
i E-S
elec
tin (N
o TN
F
PBS c
ontro
l (RP)
0
500
1000
1500
2000
2500
ns
ns
ns
ns
ns
MF
I (a
u)
Figure 4-13 Mean fluorescence intensity: increased specificity at 5μg antibody
Following injection of either anti-E-selectin or anti-DNP antibodies labelled with Dylight 750 nm NIR
fluorophore at a dose of 5μg i.v., paw swelling was induced by intraplantar injection of 50ng murine
TNF in C57/BL6 mice (n=4-6). Mean fluorescence signal (MFI) was measured between 2 and 24
hours (a). (b) Mean fluorescence signal (MFI) quantified at the 8 hour time-point is shown for right
injected (RP) and uninjected (LP), as well as for uninjected (RP) controls (no TNF or PBS control) to
highlight the relative contribution of both autofluorescence and background mean fluorescence
intensity. (c) The mean background intensity from control and anti-E-selectin targeted animals was
subtracted. Data are mean ± SEM, and were analysed by 1-way ANOVA with Bonferroni post-hoc
correction versus control antibody: *** p<0.001, ns=not significant.
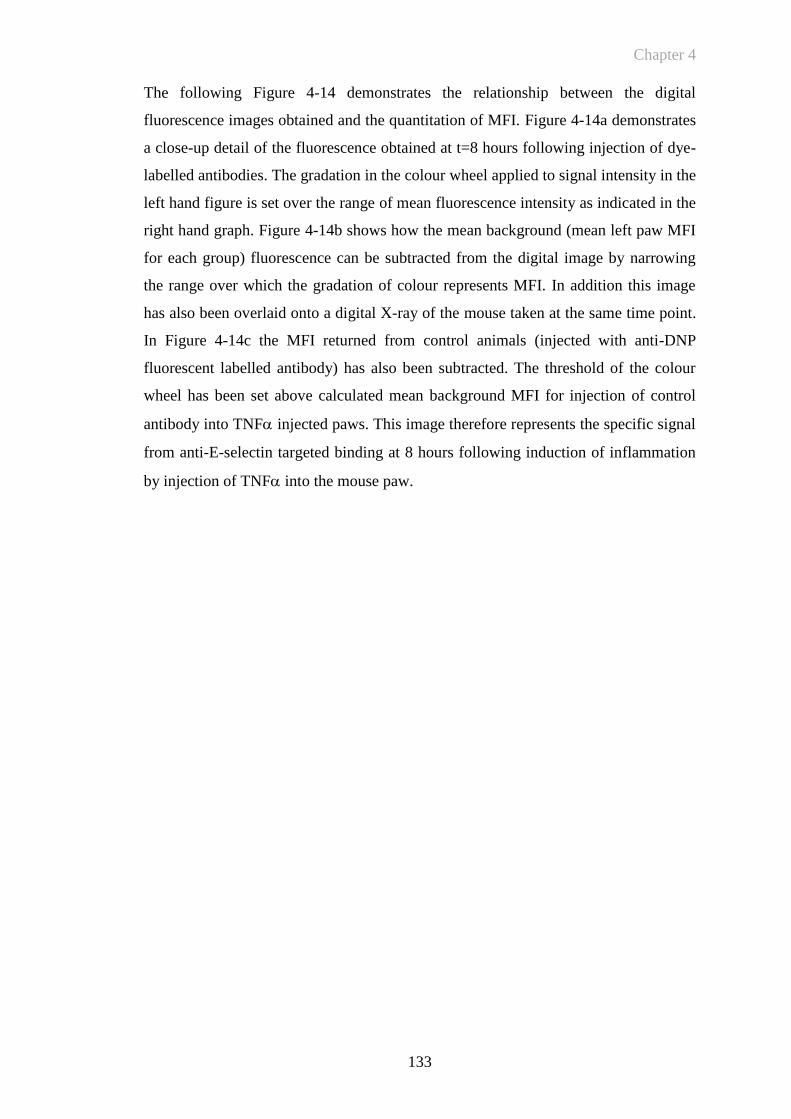
Chapter 4
133
The following Figure 4-14 demonstrates the relationship between the digital
fluorescence images obtained and the quantitation of MFI. Figure 4-14a demonstrates
a close-up detail of the fluorescence obtained at t=8 hours following injection of dye-
labelled antibodies. The gradation in the colour wheel applied to signal intensity in the
left hand figure is set over the range of mean fluorescence intensity as indicated in the
right hand graph. Figure 4-14b shows how the mean background (mean left paw MFI
for each group) fluorescence can be subtracted from the digital image by narrowing
the range over which the gradation of colour represents MFI. In addition this image
has also been overlaid onto a digital X-ray of the mouse taken at the same time point.
In Figure 4-14c the MFI returned from control animals (injected with anti-DNP
fluorescent labelled antibody) has also been subtracted. The threshold of the colour
wheel has been set above calculated mean background MFI for injection of control
antibody into TNF injected paws. This image therefore represents the specific signal
from anti-E-selectin targeted binding at 8 hours following induction of inflammation
by injection of TNF into the mouse paw.
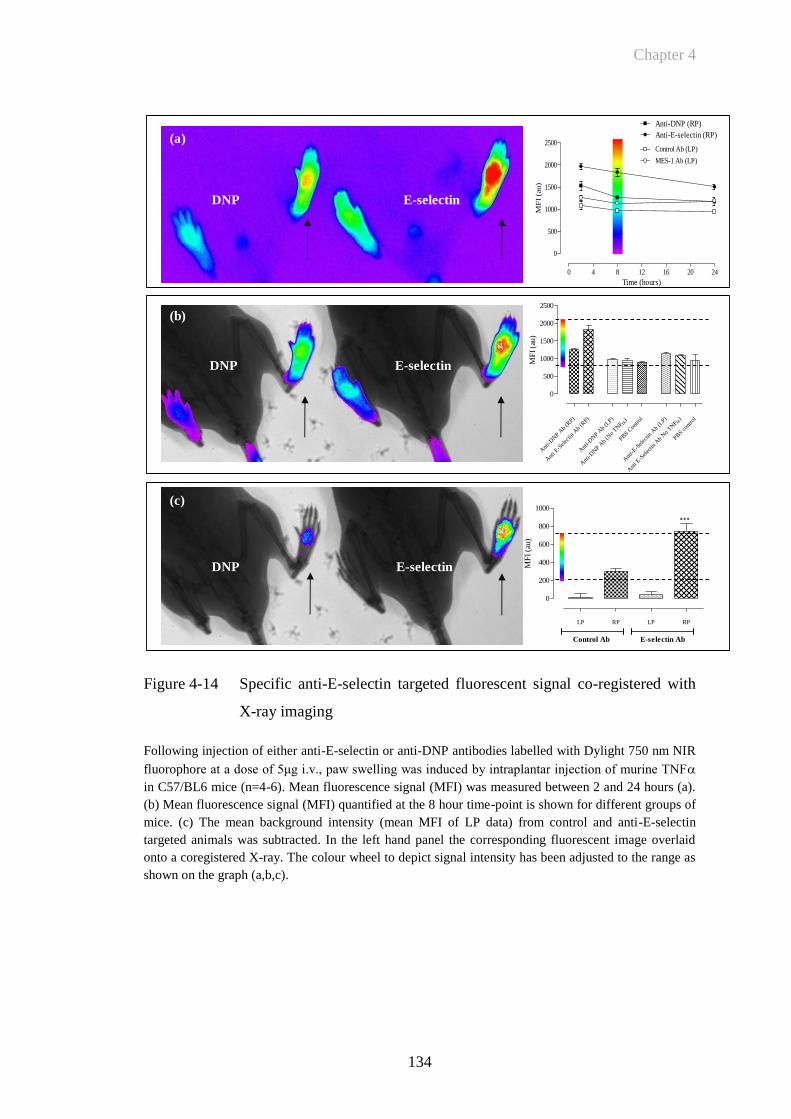
Chapter 4
134
Figure 4-14 Specific anti-E-selectin targeted fluorescent signal co-registered with
X-ray imaging
Following injection of either anti-E-selectin or anti-DNP antibodies labelled with Dylight 750 nm NIR
fluorophore at a dose of 5μg i.v., paw swelling was induced by intraplantar injection of murine TNF
in C57/BL6 mice (n=4-6). Mean fluorescence signal (MFI) was measured between 2 and 24 hours (a).
(b) Mean fluorescence signal (MFI) quantified at the 8 hour time-point is shown for different groups of
mice. (c) The mean background intensity (mean MFI of LP data) from control and anti-E-selectin
targeted animals was subtracted. In the left hand panel the corresponding fluorescent image overlaid
onto a coregistered X-ray. The colour wheel to depict signal intensity has been adjusted to the range as
shown on the graph (a,b,c).
E-selectinDNP
DNP E-selectin
0 4 8 12 16 20 24
0
500
1000
1500
2000
2500Control Ab (LP)
Anti-DNP (RP)
MES-1 Ab (LP)
Anti-E-selectin (RP)
Time (hours)
MF
I (a
u)
Ant
i-DN
P Ab
(RP)
Ant
i E-S
elec
tin A
b (R
P)
Ant
i-DN
P Ab
(LP) )
Ant
i-DN
P Ab
(No
TNF
PBS C
ontro
l
Ant
i-E-S
elec
tin A
b (L
P) )
Ant
i E-S
elec
tin A
b N
o TN
F
PBS c
ontro
l
0
500
1000
1500
2000
2500
MF
I (a
u)
LP RP LP RP
0
200
400
600
800
1000
Control Ab E-selectin Ab
***M
FI
(au)
DNP E-selectin
(a)
(b)
(c)
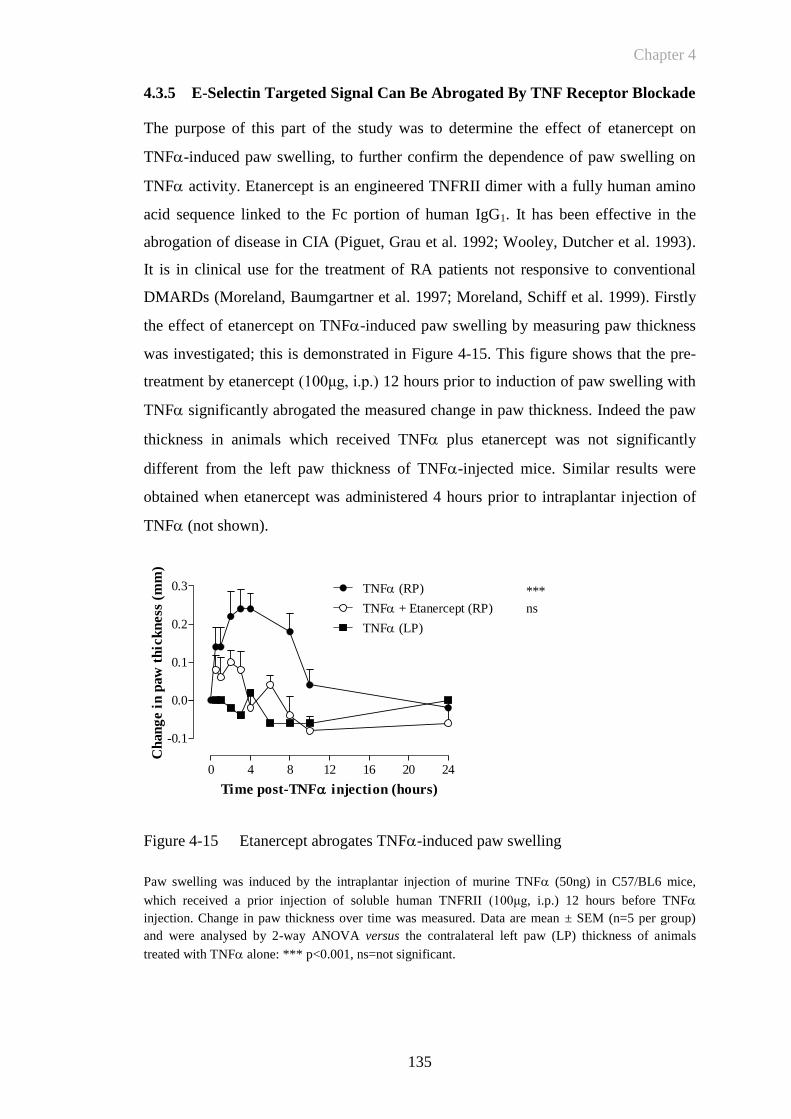
Chapter 4
135
0 4 8 12 16 20 24
-0.1
0.0
0.1
0.2
0.3 TNF (RP)
TNF + Etanercept (RP)
TNF (LP)
***
ns
Time post-TNF injection (hours)
Ch
an
ge i
n p
aw
th
ick
ness
(m
m)
4.3.5 E-Selectin Targeted Signal Can Be Abrogated By TNF Receptor Blockade
The purpose of this part of the study was to determine the effect of etanercept on
TNF-induced paw swelling, to further confirm the dependence of paw swelling on
TNF activity. Etanercept is an engineered TNFRII dimer with a fully human amino
acid sequence linked to the Fc portion of human IgG1. It has been effective in the
abrogation of disease in CIA (Piguet, Grau et al. 1992; Wooley, Dutcher et al. 1993).
It is in clinical use for the treatment of RA patients not responsive to conventional
DMARDs (Moreland, Baumgartner et al. 1997; Moreland, Schiff et al. 1999). Firstly
the effect of etanercept on TNF-induced paw swelling by measuring paw thickness
was investigated; this is demonstrated in Figure 4-15. This figure shows that the pre-
treatment by etanercept (100μg, i.p.) 12 hours prior to induction of paw swelling with
TNF significantly abrogated the measured change in paw thickness. Indeed the paw
thickness in animals which received TNF plus etanercept was not significantly
different from the left paw thickness of TNF-injected mice. Similar results were
obtained when etanercept was administered 4 hours prior to intraplantar injection of
TNF (not shown).
Figure 4-15 Etanercept abrogates TNF-induced paw swelling
Paw swelling was induced by the intraplantar injection of murine TNF (50ng) in C57/BL6 mice,
which received a prior injection of soluble human TNFRII (100μg, i.p.) 12 hours before TNF
injection. Change in paw thickness over time was measured. Data are mean ± SEM (n=5 per group)
and were analysed by 2-way ANOVA versus the contralateral left paw (LP) thickness of animals
treated with TNF alone: *** p<0.001, ns=not significant.
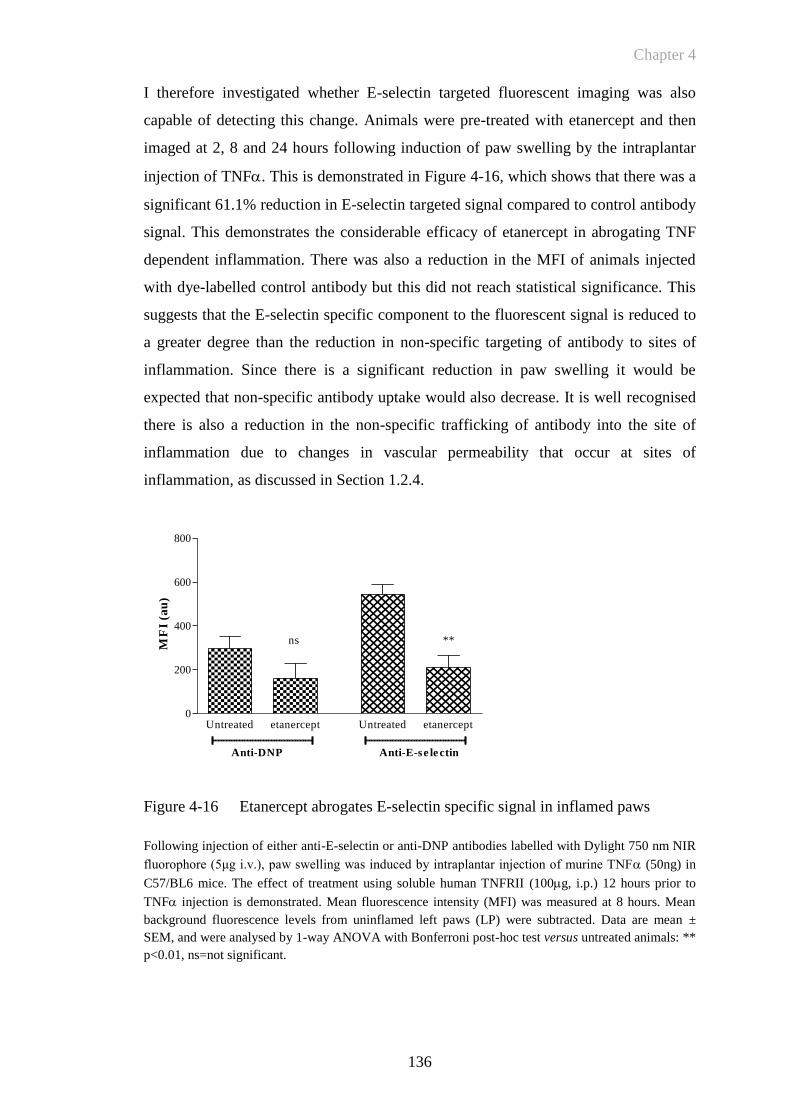
Chapter 4
136
Untreated etanercept Untreated etanercept0
200
400
600
800
Anti-DNP Anti-E-se le ctin
ns **
MF
I (a
u)
I therefore investigated whether E-selectin targeted fluorescent imaging was also
capable of detecting this change. Animals were pre-treated with etanercept and then
imaged at 2, 8 and 24 hours following induction of paw swelling by the intraplantar
injection of TNF. This is demonstrated in Figure 4-16, which shows that there was a
significant 61.1% reduction in E-selectin targeted signal compared to control antibody
signal. This demonstrates the considerable efficacy of etanercept in abrogating TNF
dependent inflammation. There was also a reduction in the MFI of animals injected
with dye-labelled control antibody but this did not reach statistical significance. This
suggests that the E-selectin specific component to the fluorescent signal is reduced to
a greater degree than the reduction in non-specific targeting of antibody to sites of
inflammation. Since there is a significant reduction in paw swelling it would be
expected that non-specific antibody uptake would also decrease. It is well recognised
there is also a reduction in the non-specific trafficking of antibody into the site of
inflammation due to changes in vascular permeability that occur at sites of
inflammation, as discussed in Section 1.2.4.
Figure 4-16 Etanercept abrogates E-selectin specific signal in inflamed paws
Following injection of either anti-E-selectin or anti-DNP antibodies labelled with Dylight 750 nm NIR
fluorophore (5μg i.v.), paw swelling was induced by intraplantar injection of murine TNF (50ng) in
C57/BL6 mice. The effect of treatment using soluble human TNFRII (100g, i.p.) 12 hours prior to
TNF injection is demonstrated. Mean fluorescence intensity (MFI) was measured at 8 hours. Mean
background fluorescence levels from uninflamed left paws (LP) were subtracted. Data are mean ±
SEM, and were analysed by 1-way ANOVA with Bonferroni post-hoc test versus untreated animals: **
p<0.01, ns=not significant.
Chapter 4
137
4.4 Discussion
In this chapter my objectives were initially to develop an acute model of inflammation
and to demonstrate E-selectin expression early in the time course of inflammation by
immunohistochemistry. The model was then used to determine the parameters of E-
selectin targeted in vivo imaging and to quantify E-selectin expression over the time
course of inflammation. Induction of acute paw inflammation by the intraplantar
injection of TNF has been utilised successfully for this purpose. I have further been
able to demonstrate that in vivo fluorescence imaging of E-selectin is a sensitive,
specific and quantifiable method of detecting endothelial activation in an acute
inflammatory model. The final objective was to determine the effect of a therapeutic
intervention in abrogating paw swelling following injection of TNF. This too has
been demonstrated and the effect of this on targeted imaging has been quantified. This
demonstrated that there was a significant decrease in E-selectin targeted imaging
following pre-treatment with the soluble TNF receptor antagonist etanercept. Acute
paw swelling caused by local injection of TNF was initially investigated as a
reproducible acute model of paw inflammation in vivo. The expression of E-selectin
was then investigated by immunohistochemistry. In order to measure cytokines or
other molecules in whole joints, sectioning of bone is required. This was technically
difficult to perform on a cryostat as the small bones in a mouse paw will often splinter
disrupting the architecture of histological specimens. Work was therefore undertaken
to refine this technique. Some investigators have reported the detection of cytokines
(IL-1β and RANKL) in paraffin fixed decalcified joint (Romas, Sims et al. 2002;
Lubberts, Koenders et al. 2004) but the ability to detect many other cytokines will be
lost following paraffin sectioning. Techniques have been developed at the Kennedy
Institute for decalcifying tissue sections and then performing fresh frozen sectioning
(Marinova-Mutafchieva, Williams et al. 1997; Gabay, Marinova-Mutafchieva et al.
2001). I therefore needed to develop a protocol for immunohistochemistry that
ensured whole paw specimens could be processed and E-selectin expression
demonstrated in the TNF induced paw model. Measurements of paw thickness
following TNF injection confirmed that the change in paw thickness over time is
reproducibly dependent on the dose TNF. Immunohistochemistry demonstrated the
expression of E-selectin following at early time points following the injection of
TNF. The application of immunohistochemistry techniques developed in this model
Chapter 4
138
could then also be used to investigate the in vivo expression of E-selectin in CIA.
Application of antibodies labelled with NIR fluorophore in the TNF-induced paw
model, allowed measurement of levels of signal from uninflamed paws to determine
signal sensitivity (E-selectin antibody signal versus background), whereas comparing
control antibody injected groups to those injected with anti-E-selectin antibody
determined signal specificity (anti-E-selectin versus anti-DNP antibodies).
Subtracting background signal (mean signal intensity of uninflamed left paws) from
the signal obtained from inflamed right paws ensured variations due to injection
differences were excluded. The time course of anti-E-selectin antibody binding over
6-8 hours in this model is in keeping with previously found kinetics for E-selectin
expression in vivo (Harari, McHale et al. 1999). Labelling anti-E-selectin antibody
with a fluorophore in the NIR range was key to the success of in vivo imaging. This
ensured specific signal from inflamed paws was not subject to the significant
autofluorescence that occurs when imaging at lower wavelengths. So that following
imaging the system was able to detect E-selectin specific signal in difference to the
signal returned from control antibody. The optimum wavelength for imaging was
determined when a DBA/1 mouse was imaged at different wavelengths below and
within the NIR as demonstrated in Section 3.3.2. This has also been recognised by
others to be a significant determinant for the ability of fluorescent imaging to
delineate target signal (Fischer, Gemeinhardt et al. 2006; Weissleder and Pittet 2008).
The facility to co-register images with digital X-ray imaging of the target region
further helped delineate anatomical localisation of fluorescence signal.
A reason for increased signal in the anti-E-selectin antibody-injected groups could be
due to systemic E-selectin expression due to a generalised effect from the intraplantar
injection of TNF. Particularly since there was a small effect on paw thickness at
higher (100ng) doses of TNF and there may therefore be a low level of E-selectin
expression at doses lower then 100ng. However in the control animals that received
intravenous injection of dye-labelled antibodies but no intraplantar injection of TNF
there were still differences between anti-E-selectin and DNP fluorescence signals.
This may indicate that there are differences in the amount of injected antibody or that
the degree of fluorophore labelling was different between the groups. Interestingly,
this difference was not demonstrated when making a comparison between
fluorescence intensity by measuring the fluorescence from serial dilutions of dye-
Chapter 4
139
labelled antibodies in vitro as shown in Section 3.3.5. Another possibility is that there
was a small degree of constitutive E-selectin expression accounting for the increased
anti-E-selectin targeted signal. E-selectin expression in vivo has been characterised in
the pig following injection of either IL-1 or TNF and constitutive expression of E-
selectin in the skin demonstrated by immunohistochemistry in this model (Keelan,
Licence et al. 1994). In initial experiments one significant limiting technical factor
was performing multiple i.v. injections within a short time period so that animals were
grouped for accurate analysis at both early, mid and late time-points. Although it may
be possible to stagger the imaging time points this would also be technically
challenging. Hence a significant additional component to this early work was
establishing efficient procedures for preparation, injection and imaging of animals.
In this study I also explored the possibility of whether E-selectin antibody had any
therapeutic effect in the TNF-induced paw inflammation model. Pre-injection of anti
E-selectin antibody at varying doses did not have any effect on TNF-induced paw
swelling. Targeting E-selectin may expected to inhibit the interactions between
leukocytes, platelets and EC within the vascular compartment, leaving tissue
leukocyte interactions intact. Some studies using E-selectin antagonists in humans
examining the effect of targeted selectin therapy on reperfusion injury have been
promising (Lefer 2000). However a carbohydrate based on Sialyl-Lewis X had no
effect in patients undergoing angioplasty for ischaemia reperfusion injury (Harari,
Marshall et al. 2001; Marshall and Haskard 2002). Intravenous administration of the
CDP850 humanised anti-E-selectin antibody reduced levels of soluble E-selectin in
plasma and of E-selectin in psoriatic plaques of patients of patients with psoriasis, but
did not affect overall clinical outcomes (Bhushan, Bleiker et al. 2002). This may be
explained in part by a degree of redundancy with regard to circulating leukocyte
attachment to the activated endothelium in humans and animal models. Furthermore
as both E- and P-selectin recognise PSGL-1 there may also be redundancy in ligand
recognition (Moore 1998). It remains possible that inhibitors of selectin function may
emerge that have higher affinity for selectins than sialyl-Lewis X analogues. For
example a recombinant soluble antagonist of PSGL-1, rPSGL-Ig has shown promise
as a cardioprotective agent by improving postischaemic flow following ischaemia
reperfusion injury in pigs (Hansen, Kumar et al. 2004). The therapeutic potential of
the rPSGL-1 was also demonstrated in established CIA in DBA/1 mice (Sumariwalla,
Malfait et al. 2004).

Chapter 4
140
The following chapter aimed to translate the refined techniques and observations from
the TNF-induced paw oedema model into the CIA model, where paw swelling and
clinical score is known to be heterogeneous and subjective. Murine heterologous CIA
has several similarities with RA, including synovitis, pannus formation, erosion of
cartilage and bone, fibrosis and joint rigidity (Holmdahl, Jansson et al. 1986;
Holmdahl, Andersson et al. 1989). Therefore a clear understanding of specific versus
non-specific fluorescent signal was required to delineate the relative effects of each in
CIA.

Chapter 5
141
CHAPTER 5
Chapter 5
142
5 RESULTS: QUANTITATIVE E-SELECTIN TARGETED
FLUORESCENT IMAGING OF CIA
5.1 Introduction
The work described in the previous chapters generated important information about
how to optimise in vivo optical imaging so that E-selectin targeted fluorescent
signalling could be utilised in a mouse model of acute inflammation in vivo. In this
chapter, I aimed to translate the studies in the TNF-induced paw swelling model into
an effective method of imaging activated endothelium in CIA by targeting E-selectin
expression. I also aimed to demonstrate how it can be used as a molecular imaging
technique to delineate the effects of therapy in CIA. Taken together with my findings
in the previous chapter this would validate in vivo visualisation of a fluorescently
labelled MoAb detecting endothelial activation as a precise, quantifiable pre-clinical
molecular imaging technique for murine arthritis.
5.1.1 Collagen Induced Arthritis
CIA is a clinically heterogeneous disease induced in genetically susceptible mice by
the intradermal injection of type II bovine collagen (CII). This is discussed in Section
1.4.1. In the present chapter the histological hallmarks of CIA and their relationship to
E-selectin expression ex vivo are investigated. The histological features of CIA are not
dissimilar from RA. In CIA there is infiltration of subsynovial tissue by inflammatory
cells, synovial hyperplasia, angiogenesis and erosion of cartilage by bone, all of
which occur in RA (Trentham, Townes et al. 1977; Wooley, Luthera et al. 1981; Lee
and Weinblatt 2001). B- and T-lymphocytes are both involved in the pathogenesis of
CIA with a peak T-cell response occurring around the time of disease onset. Although
T-cells play a role in the autoimmune response in CIA, B-cells and auto-antibodies
against CII appear to be the primary effector mechanism in this model. The
requirement for T-cells in this model is further supported by the fact that only mice
with a certain MHC class II molecule are susceptible to CIA. CD4+ T-cells can be
detected in the synovial tissue of CIA mice (Marinova-Mutafchieva, Williams et al.
2000). However, transferring CIA with CD4+ T-cells has proven to be difficult
(Taurog, Kerwar et al. 1985) and anti-CD4 treatment T-cell directed therapy of
established CIA has relatively little impact on inflammatory processes in the joint
(Marinova-Mutafchieva, Williams et al. 2000). The onset of CIA is characterised by
Chapter 5
143
high titres of anti-CII antibodies, which bind to the joint cartilage and activate the
complement cascade (Williams, Jones et al. 1998). In contrast to the transfer of CII-
reactive T-cells, passively transferred IgG anti-CII antibodies induces a severe
arthritis in naïve mice (Holmdahl, Jansson et al. 1990). The importance of B-cells has
further been shown by the fact that B-cell deficient mice are protected from CIA
(Svensson, Jirholt et al. 1998).
Pro-inflammatory cytokines such as TNF are crucial in the regulation of joint
inflammation and tissue destruction in arthritis. The administration of TNF has been
shown to accelerate severity of CIA in rats (Brahn, Peacock et al. 1992). In contrast,
disease is inhibited when mice are treated with anti-TNF antibody (Williams,
Feldmann et al. 1992). The expression of EC surface markers, however, has not been
extensively studied in CIA. One study has made a comparison of the E-selectin
expression at the mRNA and protein level in different murine models of
inflammation. E-selectin expression was determined both at the mRNA level using
RT-PCR and at the protein level using immunohistochemistry (Everts, Asgeirsdottir
et al. 2003). CIA was induced by injection of bovine collagen intradermally and mice
were given a booster of collagen at day 21. Signs of arthritis were not detected until
day 28. Mice were then sacrificed at either day 28, day 30, day 35 or day 43 to
generate knee specimens with either no, mild, moderate or severe arthritis
respectively. Hence this model differs from the CIA experiments I have described in
this chapter, being more chronic in nature. These workers did find that E-selectin
mRNA levels in synovial biopsies from the knee specimens were increased in mild,
moderate and severely diseased animals compared to those without any macroscopic
signs of inflammation. Interestingly, these workers were less successful in
demonstrating positive staining of E-selectin by immunohistochemistry in inflamed
tissue. They noted occasional E-selectin expression detectable by
immunohistochemistry in severe inflamed tissue at day 43 post immunisation but not
at other times in mild and moderate disease.
A number of prior studies have investigated fluorescent imaging in animal models of
arthritis to detect both targeted and non-specific signal change in arthritis. A Cy5.5-
labeled antibody against macrophages was used successfully to label inflammatory
changes in experimental arthritis. Between 2 and 72 hours, arthritic knee joints
showed significantly higher fluorescence levels compared with contralateral joints. In
Chapter 5
144
this study it appeared that following injection Cy5.5 bound mainly to albumin with
microscopy confirming Cy5.5 deposition in the synovial membrane it also appeared
that macrophages actively phagocytosed Cy5.5 following uptake to inflamed areas
that had occurred most likely as a result of non-specific trafficking due to enhanced
vascular permeability (Hansch, Frey et al. 2004). The same investigators targeted the
F4/80 antigen on macrophages by conjugating the Cy5.5 fluorochrome to anti-F4/80
antibody and demonstrated that signal in inflamed joints was significantly higher than
that generated by the isotype control labelled antibody. Simon et al evaluated whether
optical imaging of reinjected leukocytes labelled ex vivo with an NIR dye could detect
antigen induced arthritis (Simon, Daldrup-Link et al. 2006). This study showed that at
4 and 24 hours there was some significant accumulation in arthritic versus control
knees. The targeting of arthritis by other mechanisms is also discussed in the
introductory Section 1.3.3.2. No investigators thus far, however, have examined
whether E-selectin can be utilised as a marker of endothelial activation in CIA and
detected in vivo by utilising optical imaging of fluorescently labelled anti-E-selectin
antibody, and this is addressed in the first part of this chapter.
The following Section gives background information about a novel therapeutic
approach for CIA and how this may be tested in the CIA model using in vivo E-
selectin targeted imaging, which forms the basis for the second part of this chapter.
5.1.2 RB200: A Novel EGFR Antagonist
In addition to utilising anti-E-selectin as technique to follow arthritis in vivo, it would
be of interest to determine whether in vivo imaging can also be applied to study the
effects of therapy in CIA. An antagonist (RB200) has been developed that targets all
four members of the epidermal growth factor (EGF) receptor family. This is discussed
further in section 1.2.3. Despite the success of conventional monoclonal antibody
technology that usually targets a single molecule or receptor, there is often intricate
cooperation amongst multiple signalling pathways or a number of closely related cell
surface receptors that can lead to reduced efficacy. To circumvent this problem, a bi-
specific ligand trap, RB200, composed of the full length extracellular domain of
HER-1/ErbB1 and HER-3/ErbB3 fused with the Fc domain of human IgG1 has been
designed (Sarup, Jin et al. 2008; Jin, Zhang et al. 2009). RB200 may therefore be
expected to down-regulate responses mediated via all four HER subfamily members
due to its broad pan-HER efficacy. RB200 has been shown to bind to both HER-

Chapter 5
145
1/ErbB1 ligands (TGF-, HB-EGF) and to HER-3/ErbB3 ligands (NRG1- and
NRG1-3). Moreover, RB200 inhibited EGF- and NRG1-1stimulated tyrosine
phosphorylation of HER family proteins (HER-1, HER-2 and HER-3), and also
showed potency in a variety of cell proliferation assays (Sarup, Jin et al. 2008). In
addition RB200 has been shown to inhibit tumour growth in vivo in two human
tumour xenograft (epidermoid carcinoma and non-small cell lung cancer) nude mouse
models (Sarup, Jin et al. 2008). A representation of the structure of RB200 is
demonstrated in the following Figure 5-1.
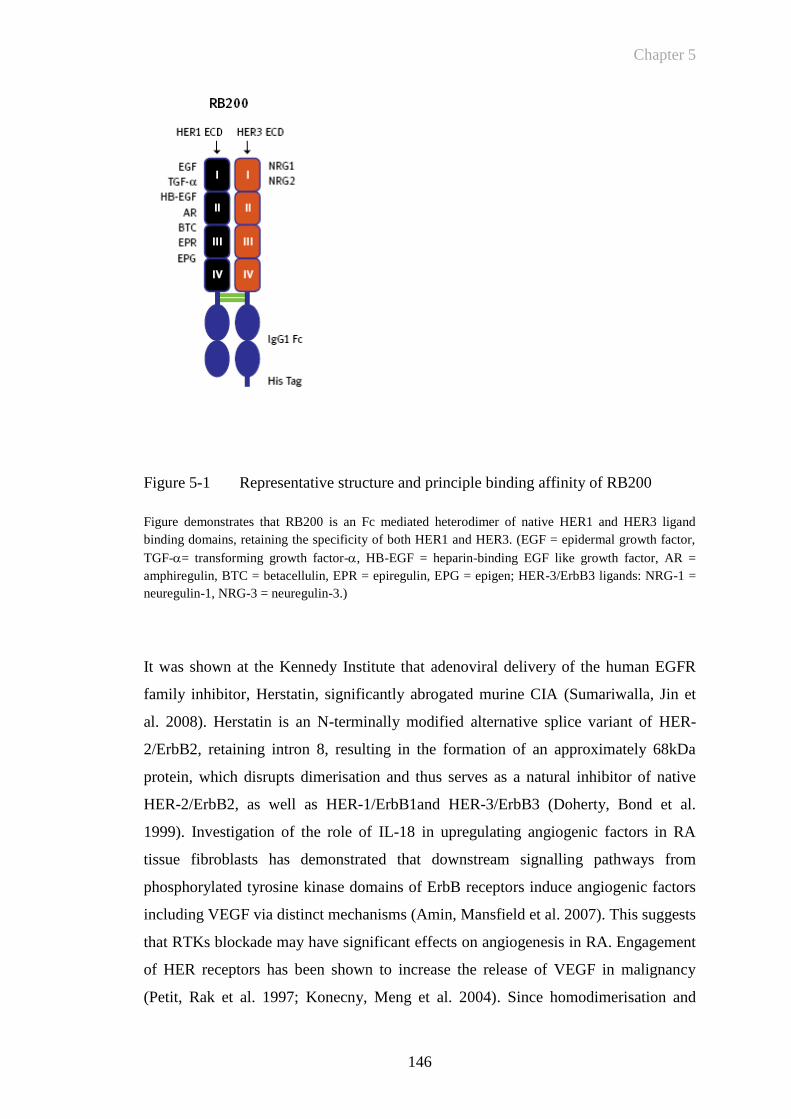
Chapter 5
146
Figure 5-1 Representative structure and principle binding affinity of RB200
Figure demonstrates that RB200 is an Fc mediated heterodimer of native HER1 and HER3 ligand
binding domains, retaining the specificity of both HER1 and HER3. (EGF = epidermal growth factor,
TGF-= transforming growth factor-, HB-EGF = heparin-binding EGF like growth factor, AR =
amphiregulin, BTC = betacellulin, EPR = epiregulin, EPG = epigen; HER-3/ErbB3 ligands: NRG-1 =
neuregulin-1, NRG-3 = neuregulin-3.)
It was shown at the Kennedy Institute that adenoviral delivery of the human EGFR
family inhibitor, Herstatin, significantly abrogated murine CIA (Sumariwalla, Jin et
al. 2008). Herstatin is an N-terminally modified alternative splice variant of HER-
2/ErbB2, retaining intron 8, resulting in the formation of an approximately 68kDa
protein, which disrupts dimerisation and thus serves as a natural inhibitor of native
HER-2/ErbB2, as well as HER-1/ErbB1and HER-3/ErbB3 (Doherty, Bond et al.
1999). Investigation of the role of IL-18 in upregulating angiogenic factors in RA
tissue fibroblasts has demonstrated that downstream signalling pathways from
phosphorylated tyrosine kinase domains of ErbB receptors induce angiogenic factors
including VEGF via distinct mechanisms (Amin, Mansfield et al. 2007). This suggests
that RTKs blockade may have significant effects on angiogenesis in RA. Engagement
of HER receptors has been shown to increase the release of VEGF in malignancy
(Petit, Rak et al. 1997; Konecny, Meng et al. 2004). Since homodimerisation and
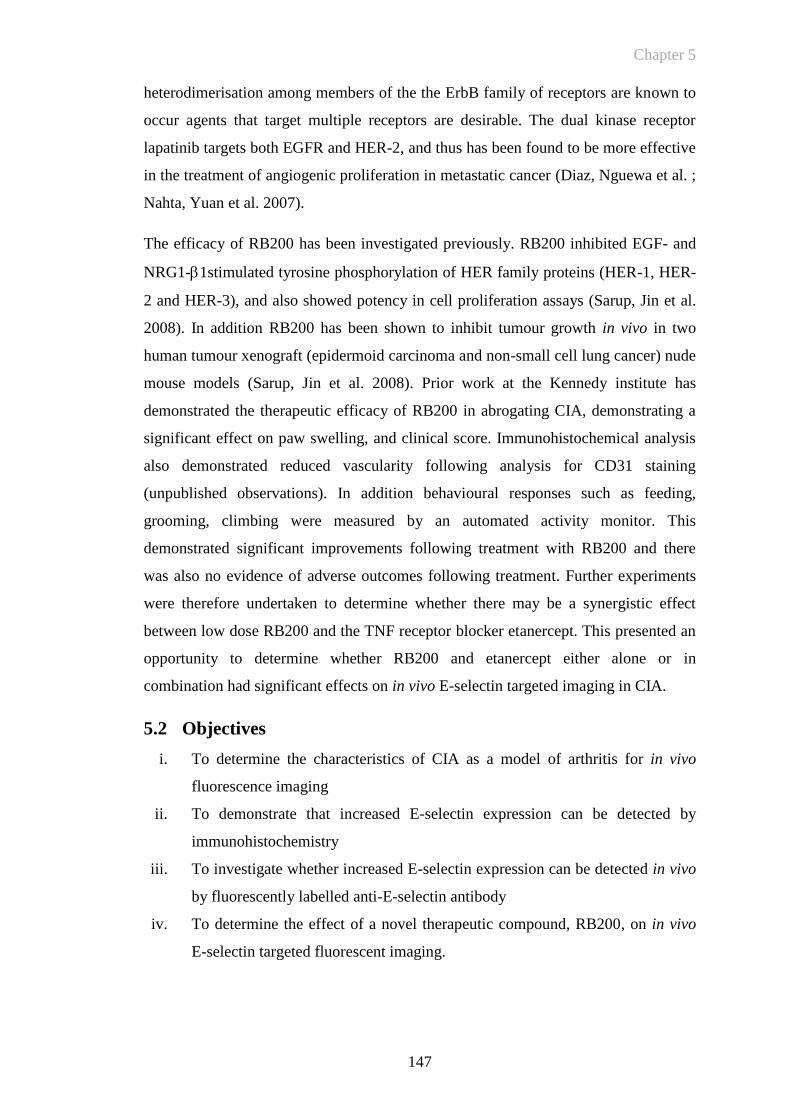
Chapter 5
147
heterodimerisation among members of the the ErbB family of receptors are known to
occur agents that target multiple receptors are desirable. The dual kinase receptor
lapatinib targets both EGFR and HER-2, and thus has been found to be more effective
in the treatment of angiogenic proliferation in metastatic cancer (Diaz, Nguewa et al. ;
Nahta, Yuan et al. 2007).
The efficacy of RB200 has been investigated previously. RB200 inhibited EGF- and
NRG1-1stimulated tyrosine phosphorylation of HER family proteins (HER-1, HER-
2 and HER-3), and also showed potency in cell proliferation assays (Sarup, Jin et al.
2008). In addition RB200 has been shown to inhibit tumour growth in vivo in two
human tumour xenograft (epidermoid carcinoma and non-small cell lung cancer) nude
mouse models (Sarup, Jin et al. 2008). Prior work at the Kennedy institute has
demonstrated the therapeutic efficacy of RB200 in abrogating CIA, demonstrating a
significant effect on paw swelling, and clinical score. Immunohistochemical analysis
also demonstrated reduced vascularity following analysis for CD31 staining
(unpublished observations). In addition behavioural responses such as feeding,
grooming, climbing were measured by an automated activity monitor. This
demonstrated significant improvements following treatment with RB200 and there
was also no evidence of adverse outcomes following treatment. Further experiments
were therefore undertaken to determine whether there may be a synergistic effect
between low dose RB200 and the TNF receptor blocker etanercept. This presented an
opportunity to determine whether RB200 and etanercept either alone or in
combination had significant effects on in vivo E-selectin targeted imaging in CIA.
5.2 Objectives
i. To determine the characteristics of CIA as a model of arthritis for in vivo
fluorescence imaging
ii. To demonstrate that increased E-selectin expression can be detected by
immunohistochemistry
iii. To investigate whether increased E-selectin expression can be detected in vivo
by fluorescently labelled anti-E-selectin antibody
iv. To determine the effect of a novel therapeutic compound, RB200, on in vivo
E-selectin targeted fluorescent imaging.
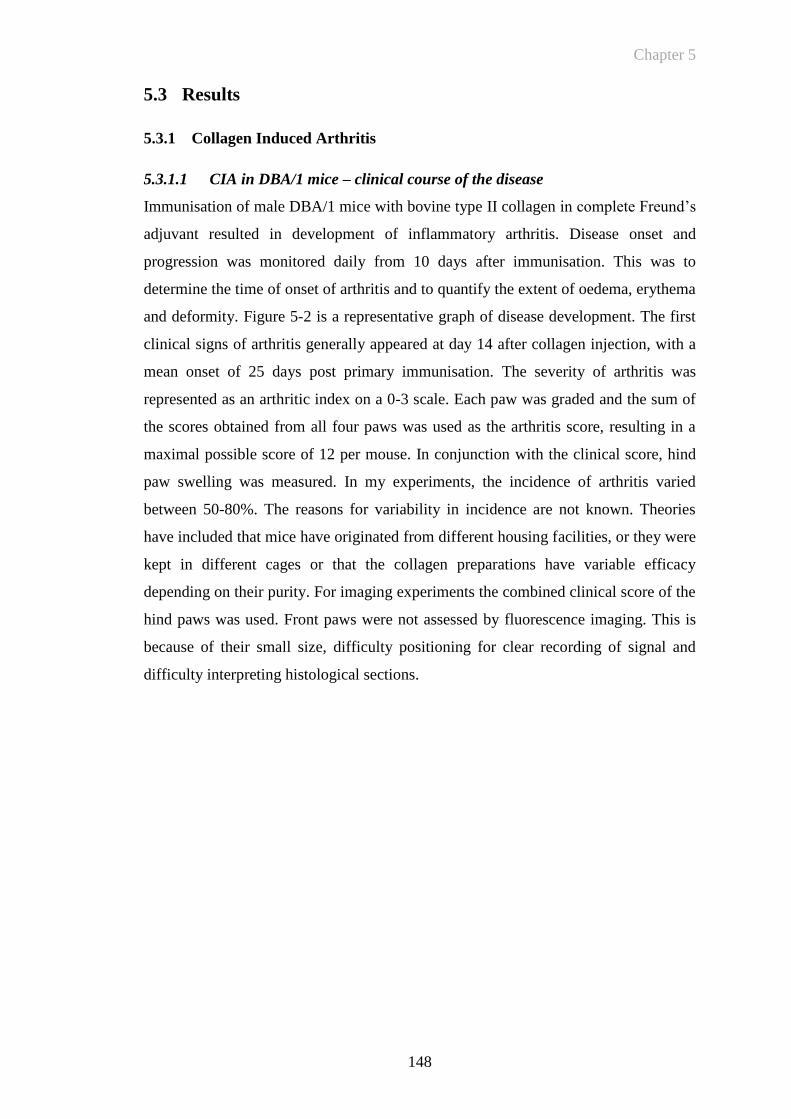
Chapter 5
148
5.3 Results
5.3.1 Collagen Induced Arthritis
5.3.1.1 CIA in DBA/1 mice – clinical course of the disease
Immunisation of male DBA/1 mice with bovine type II collagen in complete Freund’s
adjuvant resulted in development of inflammatory arthritis. Disease onset and
progression was monitored daily from 10 days after immunisation. This was to
determine the time of onset of arthritis and to quantify the extent of oedema, erythema
and deformity. Figure 5-2 is a representative graph of disease development. The first
clinical signs of arthritis generally appeared at day 14 after collagen injection, with a
mean onset of 25 days post primary immunisation. The severity of arthritis was
represented as an arthritic index on a 0-3 scale. Each paw was graded and the sum of
the scores obtained from all four paws was used as the arthritis score, resulting in a
maximal possible score of 12 per mouse. In conjunction with the clinical score, hind
paw swelling was measured. In my experiments, the incidence of arthritis varied
between 50-80%. The reasons for variability in incidence are not known. Theories
have included that mice have originated from different housing facilities, or they were
kept in different cages or that the collagen preparations have variable efficacy
depending on their purity. For imaging experiments the combined clinical score of the
hind paws was used. Front paws were not assessed by fluorescence imaging. This is
because of their small size, difficulty positioning for clear recording of signal and
difficulty interpreting histological sections.
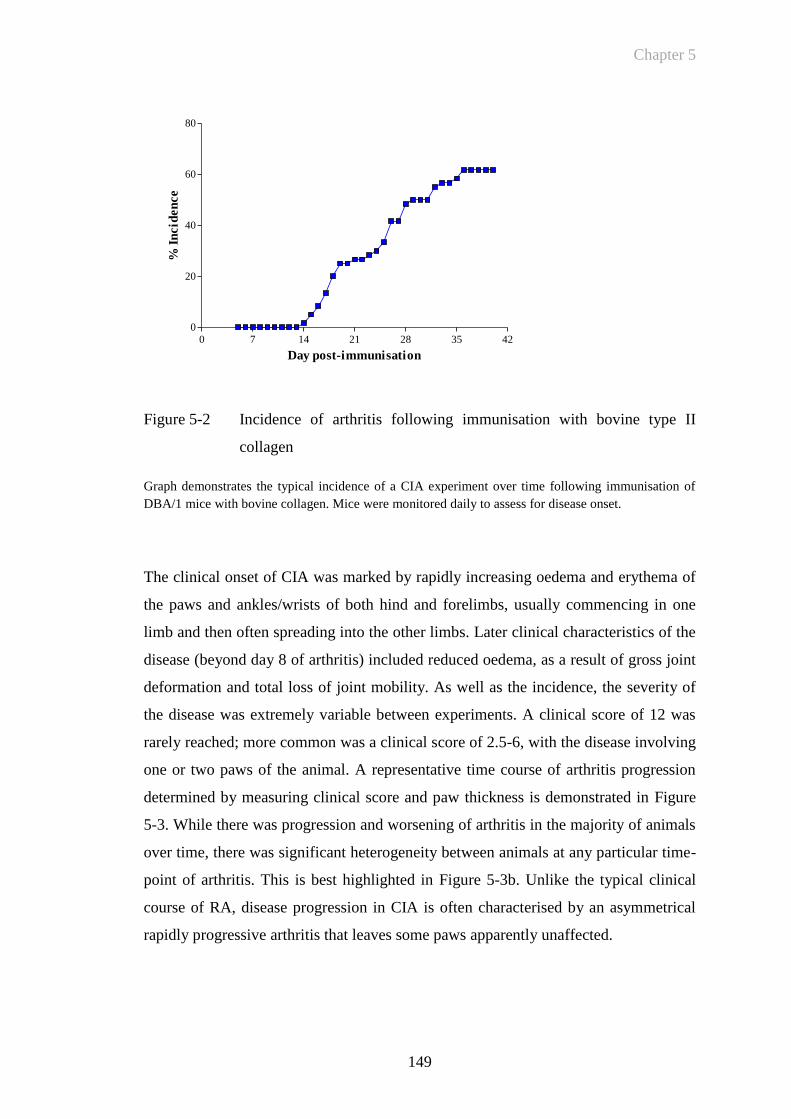
Chapter 5
149
0 7 14 21 28 35 42
0
20
40
60
80
Day post-immunisation
% I
ncid
en
ce
Figure 5-2 Incidence of arthritis following immunisation with bovine type II
collagen
Graph demonstrates the typical incidence of a CIA experiment over time following immunisation of
DBA/1 mice with bovine collagen. Mice were monitored daily to assess for disease onset.
The clinical onset of CIA was marked by rapidly increasing oedema and erythema of
the paws and ankles/wrists of both hind and forelimbs, usually commencing in one
limb and then often spreading into the other limbs. Later clinical characteristics of the
disease (beyond day 8 of arthritis) included reduced oedema, as a result of gross joint
deformation and total loss of joint mobility. As well as the incidence, the severity of
the disease was extremely variable between experiments. A clinical score of 12 was
rarely reached; more common was a clinical score of 2.5-6, with the disease involving
one or two paws of the animal. A representative time course of arthritis progression
determined by measuring clinical score and paw thickness is demonstrated in Figure
5-3. While there was progression and worsening of arthritis in the majority of animals
over time, there was significant heterogeneity between animals at any particular time-
point of arthritis. This is best highlighted in Figure 5-3b. Unlike the typical clinical
course of RA, disease progression in CIA is often characterised by an asymmetrical
rapidly progressive arthritis that leaves some paws apparently unaffected.
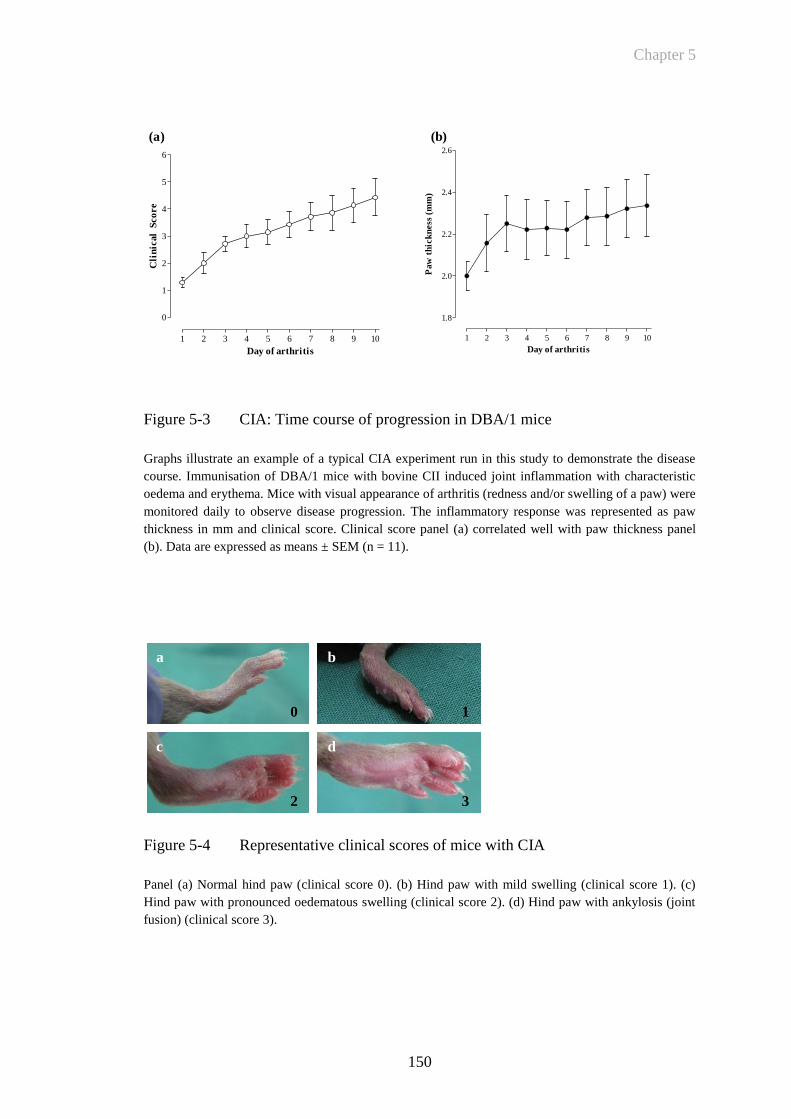
Chapter 5
150
1 2 3 4 5 6 7 8 9 10
0
1
2
3
4
5
6
Day of arthritis
Cli
nic
al
Sco
re
1 2 3 4 5 6 7 8 9 10
1.8
2.0
2.2
2.4
2.6
Day of arthritis
Paw
th
ick
ness
(m
m)
(a) (b)
Figure 5-3 CIA: Time course of progression in DBA/1 mice
Graphs illustrate an example of a typical CIA experiment run in this study to demonstrate the disease
course. Immunisation of DBA/1 mice with bovine CII induced joint inflammation with characteristic
oedema and erythema. Mice with visual appearance of arthritis (redness and/or swelling of a paw) were
monitored daily to observe disease progression. The inflammatory response was represented as paw
thickness in mm and clinical score. Clinical score panel (a) correlated well with paw thickness panel
(b). Data are expressed as means ± SEM (n = 11).
Figure 5-4 Representative clinical scores of mice with CIA
Panel (a) Normal hind paw (clinical score 0). (b) Hind paw with mild swelling (clinical score 1). (c)
Hind paw with pronounced oedematous swelling (clinical score 2). (d) Hind paw with ankylosis (joint
fusion) (clinical score 3).
a b
c d
0 1
2 3
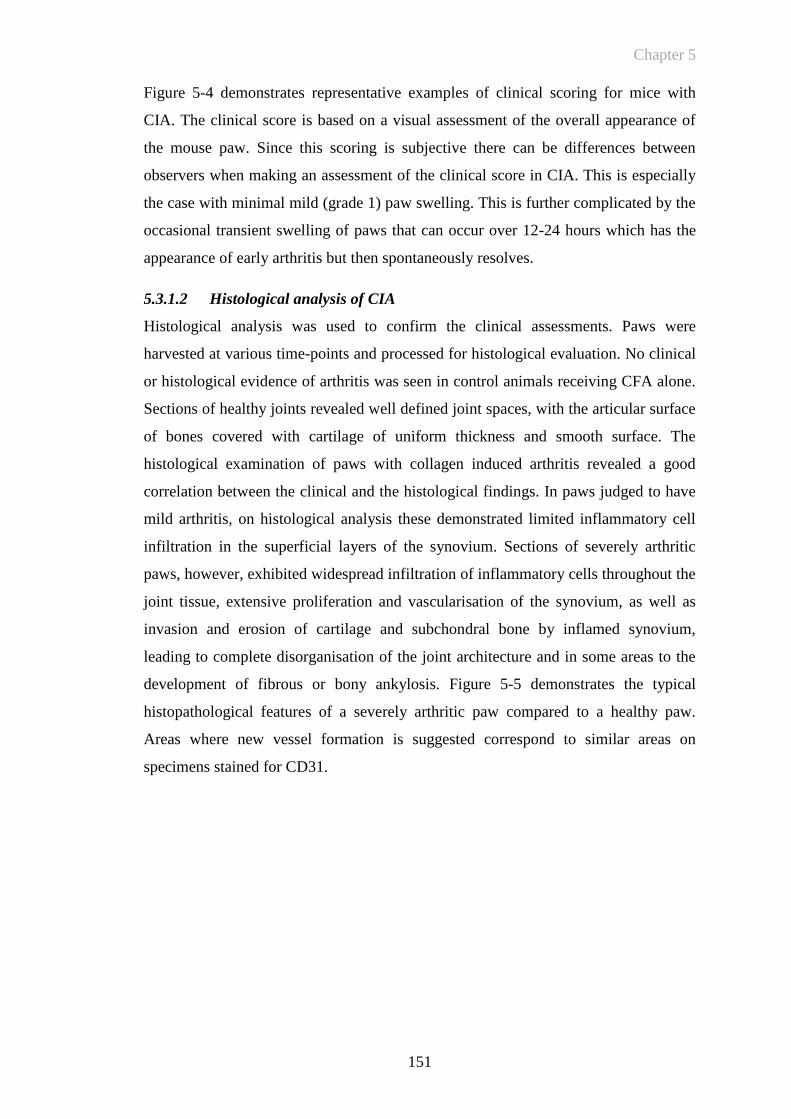
Chapter 5
151
Figure 5-4 demonstrates representative examples of clinical scoring for mice with
CIA. The clinical score is based on a visual assessment of the overall appearance of
the mouse paw. Since this scoring is subjective there can be differences between
observers when making an assessment of the clinical score in CIA. This is especially
the case with minimal mild (grade 1) paw swelling. This is further complicated by the
occasional transient swelling of paws that can occur over 12-24 hours which has the
appearance of early arthritis but then spontaneously resolves.
5.3.1.2 Histological analysis of CIA
Histological analysis was used to confirm the clinical assessments. Paws were
harvested at various time-points and processed for histological evaluation. No clinical
or histological evidence of arthritis was seen in control animals receiving CFA alone.
Sections of healthy joints revealed well defined joint spaces, with the articular surface
of bones covered with cartilage of uniform thickness and smooth surface. The
histological examination of paws with collagen induced arthritis revealed a good
correlation between the clinical and the histological findings. In paws judged to have
mild arthritis, on histological analysis these demonstrated limited inflammatory cell
infiltration in the superficial layers of the synovium. Sections of severely arthritic
paws, however, exhibited widespread infiltration of inflammatory cells throughout the
joint tissue, extensive proliferation and vascularisation of the synovium, as well as
invasion and erosion of cartilage and subchondral bone by inflamed synovium,
leading to complete disorganisation of the joint architecture and in some areas to the
development of fibrous or bony ankylosis. Figure 5-5 demonstrates the typical
histopathological features of a severely arthritic paw compared to a healthy paw.
Areas where new vessel formation is suggested correspond to similar areas on
specimens stained for CD31.
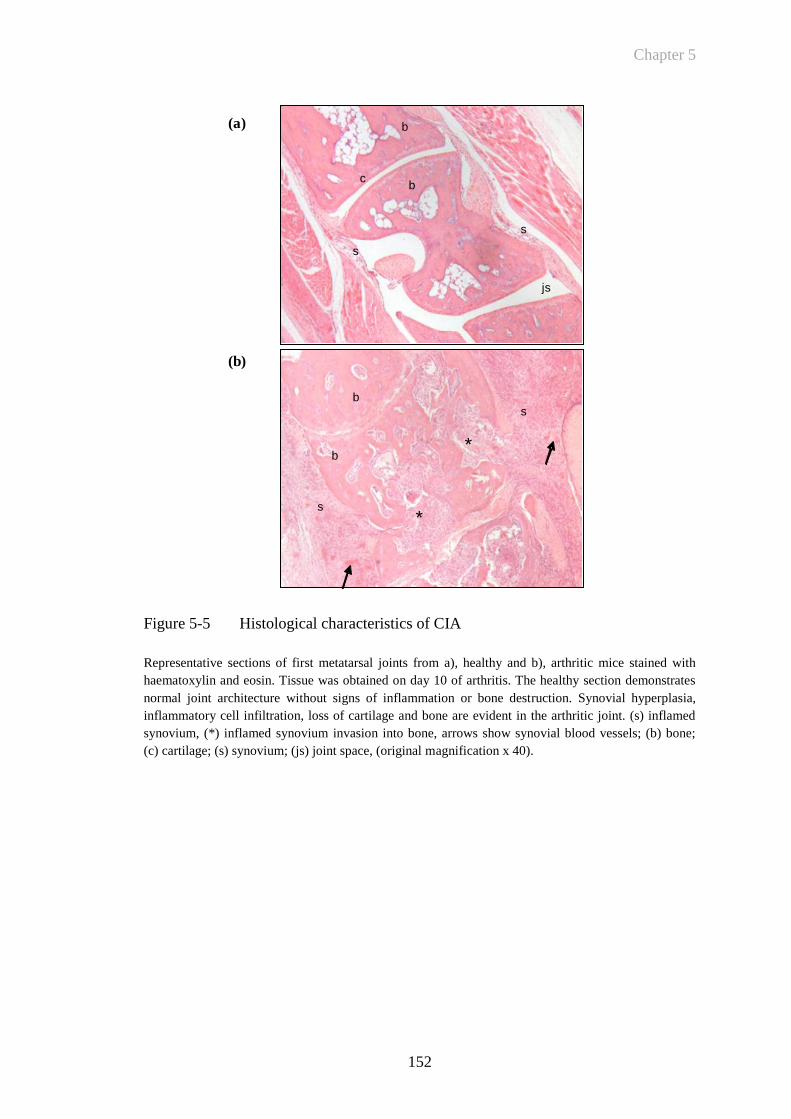
Chapter 5
152
js
s
s
bc
b
s
s
b
b
A
C
*
*
js
s
s
bc
b
s
s
b
b*
*
(a)
(b)
Figure 5-5 Histological characteristics of CIA
Representative sections of first metatarsal joints from a), healthy and b), arthritic mice stained with
haematoxylin and eosin. Tissue was obtained on day 10 of arthritis. The healthy section demonstrates
normal joint architecture without signs of inflammation or bone destruction. Synovial hyperplasia,
inflammatory cell infiltration, loss of cartilage and bone are evident in the arthritic joint. (s) inflamed
synovium, (*) inflamed synovium invasion into bone, arrows show synovial blood vessels; (b) bone;
(c) cartilage; (s) synovium; (js) joint space, (original magnification x 40).
Chapter 5
153
5.3.1.3 Immunohistochemistry to assess E-selectin expression and synovial
vascularisation in CIA
To determine whether E-selectin is expressed in the inflamed synovium of mice with
CIA, immunohistochemistry was performed. The technique used to preserve
antigenicity was identical to that used to prepare specimens when examining E-
selectin expression in the TNF-induced paw inflammation model as presented in
Section 4.3.2. Joint sections were obtained from the hind paw of an animal on day 5
following the onset of hind paw arthritis. Representative images are shown in Figure
5-6. These demonstrate that there was significant histological evidence of arthritis
within the joint (Figure 5-6a,b) and that within areas of inflamed synovium there was
positive staining for E-selectin as marked by the arrows (Figure 5-6d), but that there
was no equivalent staining for microvessels in specimens stained with the isotype
control antibody DNP (Figure 5-6c).
Figure 5-6 E-selectin is expressed in the inflamed synovium of mice with CIA
(a-c) Serial sections from a mouse paw with CIA (day 5) were stained using haematoxylin and eosin
(a,b), or with either (c) isotype control antibody or (d) anti-E-selectin antibody (magnified from area in
(b)). Arrows indicate brown precipitates demonstrating the presence of positive E-selectin binding in
inflamed microvessels. (S=synovium, B=bone, C=cartilage, *=invading synovium). (scale bar 500μm)
(b)
(c)
(d)
(a)
B
S
*
C
Chapter 5
154
Anti-E-selectin antibody binding to activated endothelium in inflamed synovium was
compared to the staining pattern obtained by using an antibody directed to Platelet
Endothelial Cell Adhesion Molecule 1 (PECAM-1/CD31). The staining process for
CD31 also involved preparing cryosections following decalcification to preserve
antigenicity as detailed in Section 2.6. The expression of CD31 by EC is well
recognized for its use in detecting EC in tissue sections. CD31 is an immunoglobulin
(Ig) superfamily member expressed on the surface of platelets and leukocytes, and is
also concentrated at the lateral junctions of EC (van Mourik, Leeksma et al. 1985;
Muller, Ratti et al. 1989; Albelda, Oliver et al. 1990). CD31 is composed of six
extracellular Ig-domains, a transmembrane domain and a cytoplasmic domain. Its
ligands include itself by homophilic interaction involving Ig-domain 1, and also vβ3
integrin and cyclic ADP ribose hydrolase (CD38) by heterophilic interaction
involving Ig-domains 1–3. Since its original cloning, much has been learned about the
role of CD31 in mediating various cellular interactions. It has been implicated in
various biological functions such as leukocyte transmigration, cell migration,
angiogenesis, cell signalling and cell adhesion (Woodfin, Voisin et al. 2007).
The staining patterns for anti-E-selectin antibody and anti-CD31 antibody are shown
in Figure 5-7. This figure demonstrates that both are targeted to the inflamed
synovium where there is likely to be new vessel formation. Anti-E-selectin antibody
bound specifically to smaller vessels within the inflamed synovium, whereas anti-
CD31 antibody bound to both large and small vessels throughout the paw in both
inflamed and uninflamed areas. The differential binding patterns for anti-E-selectin
and anti-CD31 antibody are also demonstrated in Figure 5-9.
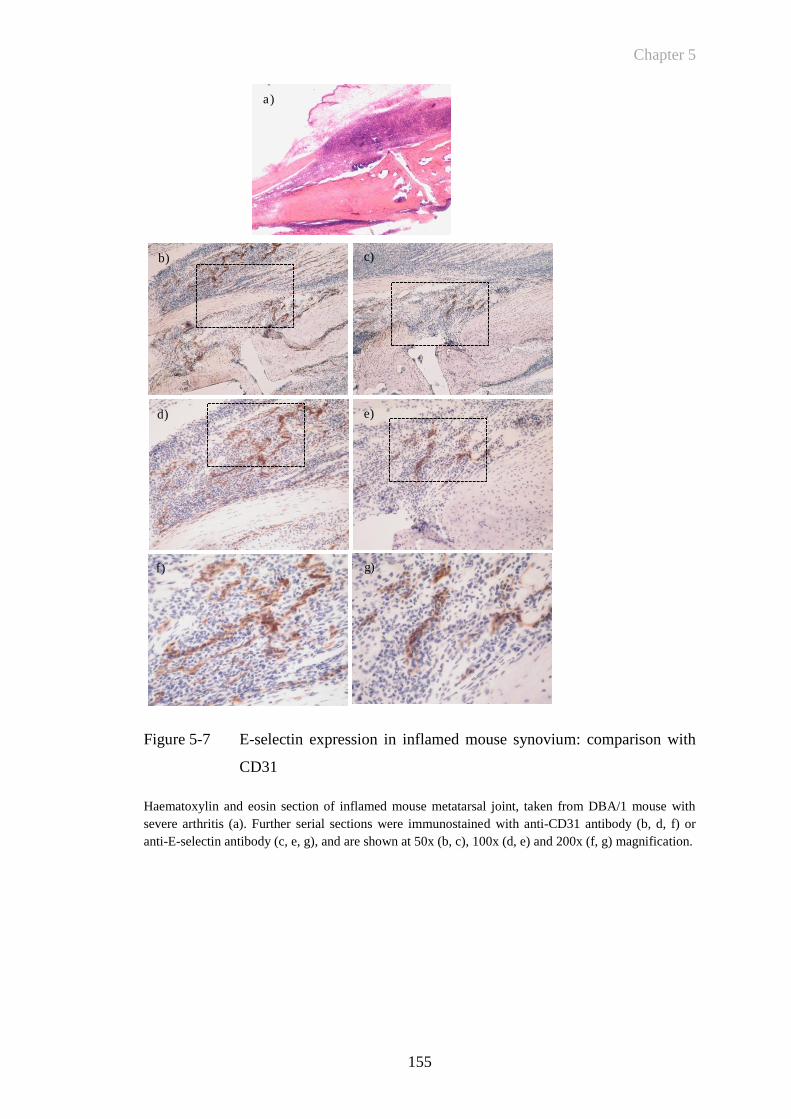
Chapter 5
155
Figure 5-7 E-selectin expression in inflamed mouse synovium: comparison with
CD31
Haematoxylin and eosin section of inflamed mouse metatarsal joint, taken from DBA/1 mouse with
severe arthritis (a). Further serial sections were immunostained with anti-CD31 antibody (b, d, f) or
anti-E-selectin antibody (c, e, g), and are shown at 50x (b, c), 100x (d, e) and 200x (f, g) magnification.
g)
a)
b) c)
d) e)
f) g)
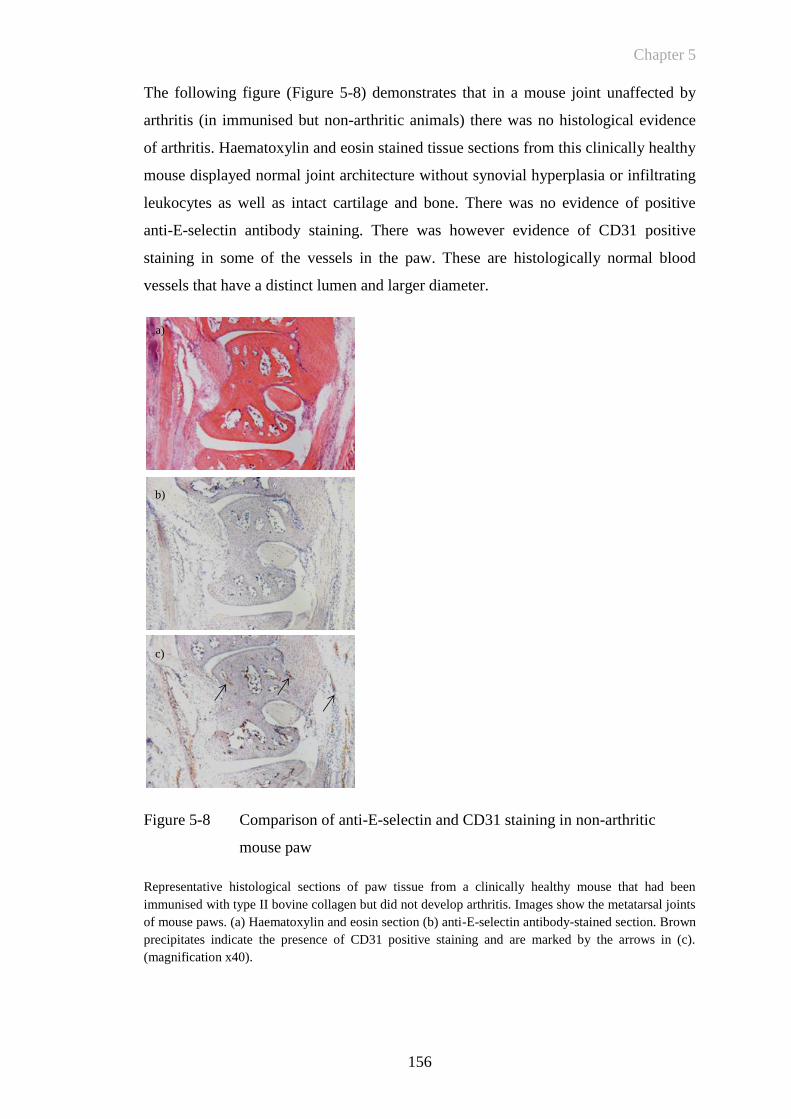
Chapter 5
156
The following figure (Figure 5-8) demonstrates that in a mouse joint unaffected by
arthritis (in immunised but non-arthritic animals) there was no histological evidence
of arthritis. Haematoxylin and eosin stained tissue sections from this clinically healthy
mouse displayed normal joint architecture without synovial hyperplasia or infiltrating
leukocytes as well as intact cartilage and bone. There was no evidence of positive
anti-E-selectin antibody staining. There was however evidence of CD31 positive
staining in some of the vessels in the paw. These are histologically normal blood
vessels that have a distinct lumen and larger diameter.
Figure 5-8 Comparison of anti-E-selectin and CD31 staining in non-arthritic
mouse paw
Representative histological sections of paw tissue from a clinically healthy mouse that had been
immunised with type II bovine collagen but did not develop arthritis. Images show the metatarsal joints
of mouse paws. (a) Haematoxylin and eosin section (b) anti-E-selectin antibody-stained section. Brown
precipitates indicate the presence of CD31 positive staining and are marked by the arrows in (c).
(magnification x40).
a)
b)
c)
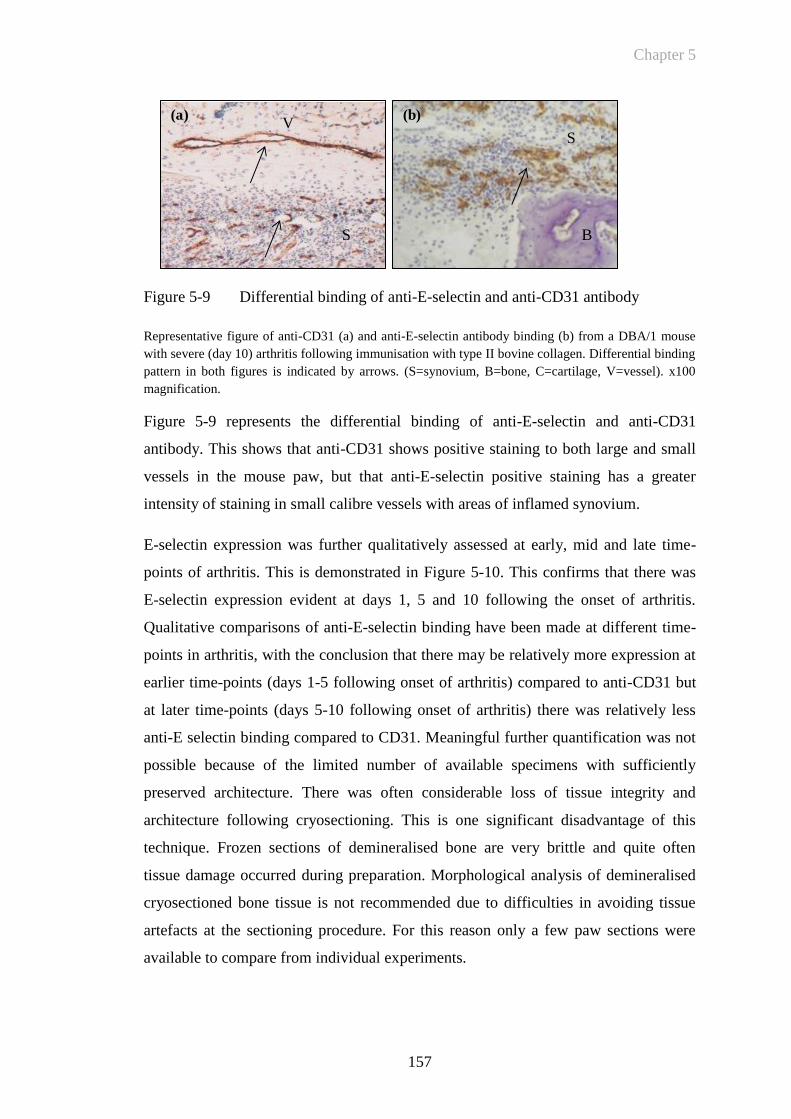
Chapter 5
157
(a) (b)
B
S
S
V
Figure 5-9 Differential binding of anti-E-selectin and anti-CD31 antibody
Representative figure of anti-CD31 (a) and anti-E-selectin antibody binding (b) from a DBA/1 mouse
with severe (day 10) arthritis following immunisation with type II bovine collagen. Differential binding
pattern in both figures is indicated by arrows. (S=synovium, B=bone, C=cartilage, V=vessel). x100
magnification.
Figure 5-9 represents the differential binding of anti-E-selectin and anti-CD31
antibody. This shows that anti-CD31 shows positive staining to both large and small
vessels in the mouse paw, but that anti-E-selectin positive staining has a greater
intensity of staining in small calibre vessels with areas of inflamed synovium.
E-selectin expression was further qualitatively assessed at early, mid and late time-
points of arthritis. This is demonstrated in Figure 5-10. This confirms that there was
E-selectin expression evident at days 1, 5 and 10 following the onset of arthritis.
Qualitative comparisons of anti-E-selectin binding have been made at different time-
points in arthritis, with the conclusion that there may be relatively more expression at
earlier time-points (days 1-5 following onset of arthritis) compared to anti-CD31 but
at later time-points (days 5-10 following onset of arthritis) there was relatively less
anti-E selectin binding compared to CD31. Meaningful further quantification was not
possible because of the limited number of available specimens with sufficiently
preserved architecture. There was often considerable loss of tissue integrity and
architecture following cryosectioning. This is one significant disadvantage of this
technique. Frozen sections of demineralised bone are very brittle and quite often
tissue damage occurred during preparation. Morphological analysis of demineralised
cryosectioned bone tissue is not recommended due to difficulties in avoiding tissue
artefacts at the sectioning procedure. For this reason only a few paw sections were
available to compare from individual experiments.
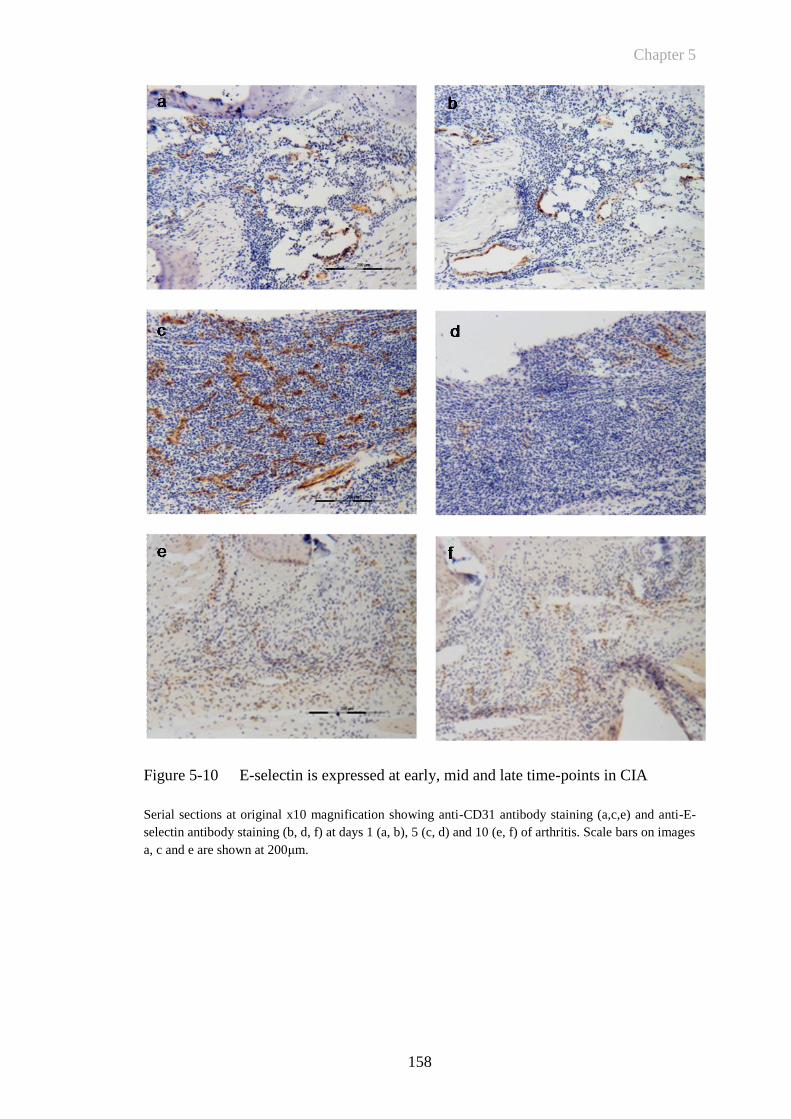
Chapter 5
158
Figure 5-10 E-selectin is expressed at early, mid and late time-points in CIA
Serial sections at original x10 magnification showing anti-CD31 antibody staining (a,c,e) and anti-E-
selectin antibody staining (b, d, f) at days 1 (a, b), 5 (c, d) and 10 (e, f) of arthritis. Scale bars on images
a, c and e are shown at 200μm.
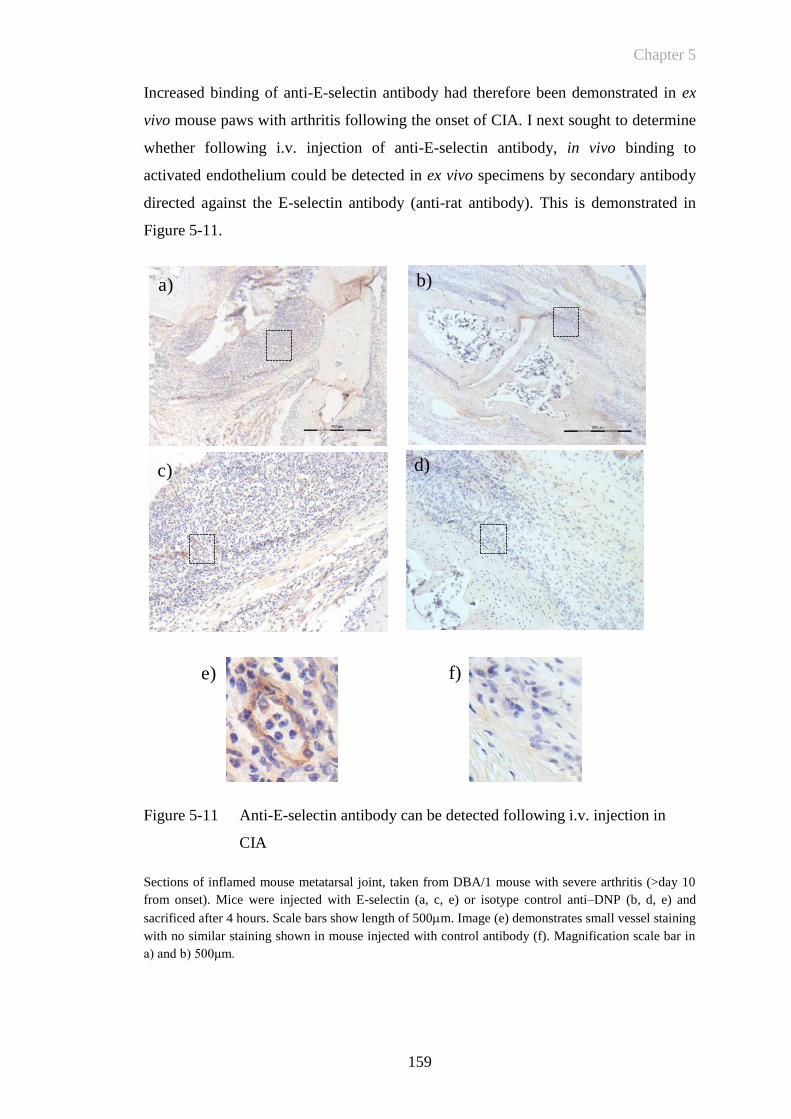
Chapter 5
159
Increased binding of anti-E-selectin antibody had therefore been demonstrated in ex
vivo mouse paws with arthritis following the onset of CIA. I next sought to determine
whether following i.v. injection of anti-E-selectin antibody, in vivo binding to
activated endothelium could be detected in ex vivo specimens by secondary antibody
directed against the E-selectin antibody (anti-rat antibody). This is demonstrated in
Figure 5-11.
Figure 5-11 Anti-E-selectin antibody can be detected following i.v. injection in
CIA
Sections of inflamed mouse metatarsal joint, taken from DBA/1 mouse with severe arthritis (>day 10
from onset). Mice were injected with E-selectin (a, c, e) or isotype control anti–DNP (b, d, e) and
sacrificed after 4 hours. Scale bars show length of 500m. Image (e) demonstrates small vessel staining
with no similar staining shown in mouse injected with control antibody (f). Magnification scale bar in
a) and b) 500μm.
a) b)
c) d)
e) f)
Chapter 5
160
The above figure shows that E-selectin antibody can be detected at sites of
inflammation in specimens that have received an injection of antibody in vivo. There
was no positive staining for the control DNP antibody. Anti- E-selectin antibody was
detected at 4 hours following i.v. injection of antibody but not at 12 or 24 hours not
shown). The absence of antibody detection at the other time-points cannot be taken
solely as evidence that detection was maximal at 4 hours since there was poor
preservation of specimens as described above and although there was a consistent
difference between anti-E-selectin and anti-DNP antibody, staining of specimens was
variable in intensity. Since in vivo imaging experiments took place over 24 hours this
made concurrent in vivo fluorescent imaging and immunohistochemical studies not
possible within the same experiment. Combined with variable morphology from
frozen sections, matching of specimens from separate experiments was also not
always possible.
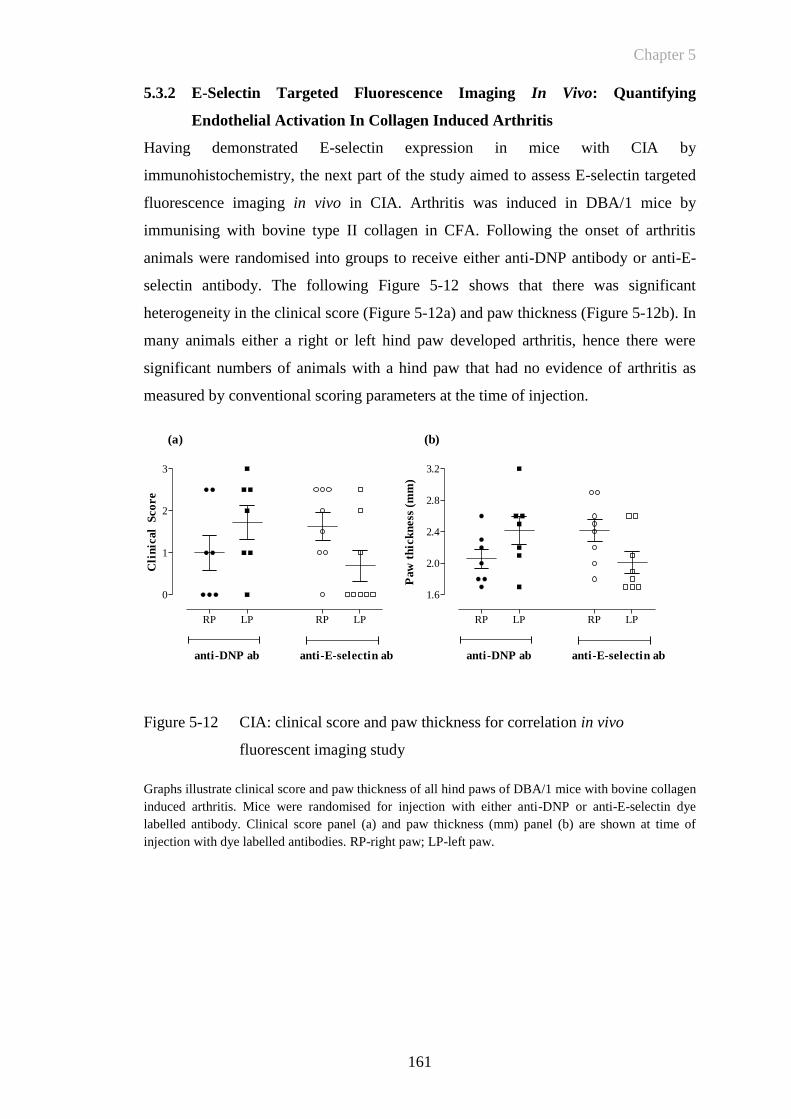
Chapter 5
161
RP LP RP LP
0
1
2
3
anti-DNP ab anti-E-selectin ab
Cli
nic
al
Sco
re
RP LP RP LP
1.6
2.0
2.4
2.8
3.2
anti-DNP ab anti-E-selectin ab
Paw
th
ick
ness
(m
m)
(a) (b)
5.3.2 E-Selectin Targeted Fluorescence Imaging In Vivo: Quantifying
Endothelial Activation In Collagen Induced Arthritis
Having demonstrated E-selectin expression in mice with CIA by
immunohistochemistry, the next part of the study aimed to assess E-selectin targeted
fluorescence imaging in vivo in CIA. Arthritis was induced in DBA/1 mice by
immunising with bovine type II collagen in CFA. Following the onset of arthritis
animals were randomised into groups to receive either anti-DNP antibody or anti-E-
selectin antibody. The following Figure 5-12 shows that there was significant
heterogeneity in the clinical score (Figure 5-12a) and paw thickness (Figure 5-12b). In
many animals either a right or left hind paw developed arthritis, hence there were
significant numbers of animals with a hind paw that had no evidence of arthritis as
measured by conventional scoring parameters at the time of injection.
Figure 5-12 CIA: clinical score and paw thickness for correlation in vivo
fluorescent imaging study
Graphs illustrate clinical score and paw thickness of all hind paws of DBA/1 mice with bovine collagen
induced arthritis. Mice were randomised for injection with either anti-DNP or anti-E-selectin dye
labelled antibody. Clinical score panel (a) and paw thickness (mm) panel (b) are shown at time of
injection with dye labelled antibodies. RP-right paw; LP-left paw.
Chapter 5
162
Mice with CIA were injected with either anti-E-selectin or anti-DNP antibodies
labelled with Dylight 750 nm Near Infra Red fluorophore (5μg i.v.) and fluorescent
images at different time-points post-injection were acquired. The following Figure
5-13 demonstrates the MFI of DBA/1 mice 5-10 days following onset of CIA. This
shows that with more severe arthritis there is increased signal in both anti-DNP and
anti-E-selectin antibody injected animals. Figure 5-13c shows that there appears to be
increased signal in the inflamed mouse paws of the anti-E-selectin injected mouse
compared to the anti-DNP control antibody injected animal. In this case both mice
(anti-E-selectin and anti-DNP injected) have a comparable clinical score and paw
diameter. However taken together the represented examples demonstrate substantial
heterogeneity in clinical score and paw diameter. This correlates with the visual
images of MFI from all animals. Figure 5-13d shows that there appear to be similar
levels of signal returned from animals for both groups that have not been immunised
with bovine collagen and received either anti-E-selectin or DNP antibody injections.
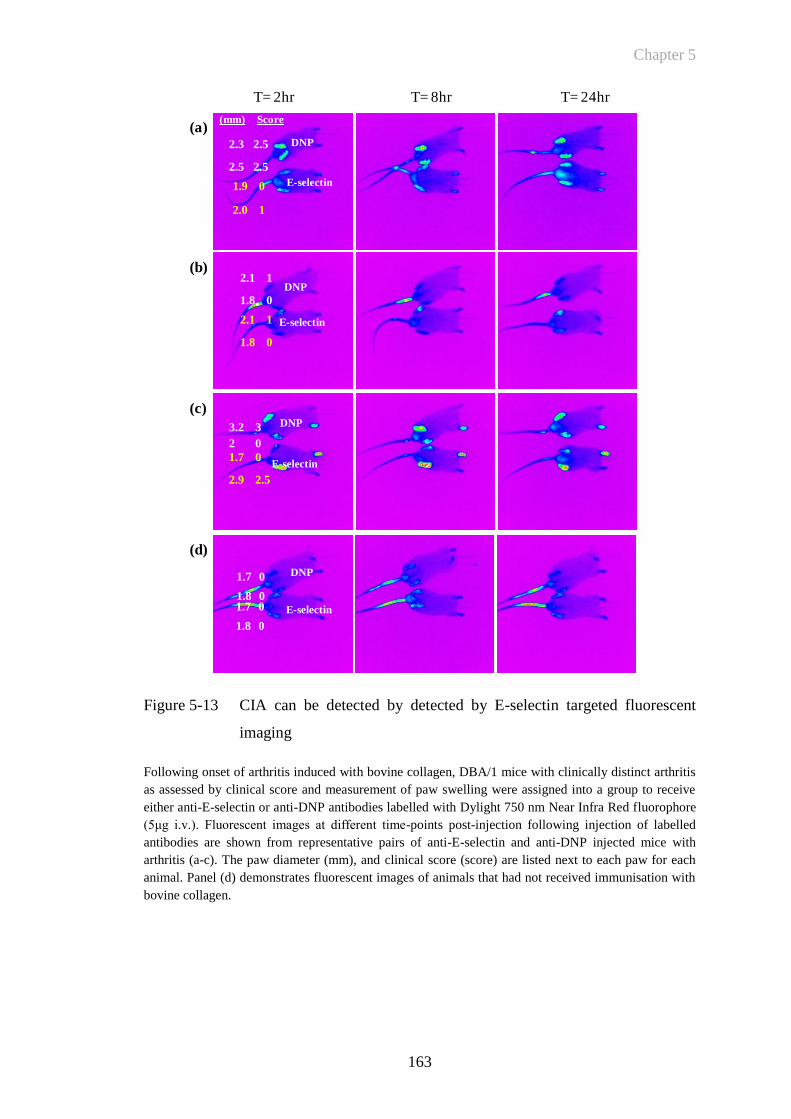
Chapter 5
163
E-selectin
DNP
E-selectin
DNP
E-selectin
DNP
1.9 0
2.0 1
2.1 1
1.8 0
2.1 1
1.8 0
3.2 3
2 0
1.7 0
2.9 2.5
2.3 2.5
2.5 2.5
2.6 2.5
2.5 2.5
2.6 2.5
2.6 2.5
T= 2hr T= 8hr T= 24hr
(a)
(b)
(c)
(d)
1.7 0
1.8 0
1.7 0
1.8 0
DNP
E-selectin
(mm) Score
Figure 5-13 CIA can be detected by detected by E-selectin targeted fluorescent
imaging
Following onset of arthritis induced with bovine collagen, DBA/1 mice with clinically distinct arthritis
as assessed by clinical score and measurement of paw swelling were assigned into a group to receive
either anti-E-selectin or anti-DNP antibodies labelled with Dylight 750 nm Near Infra Red fluorophore
(5μg i.v.). Fluorescent images at different time-points post-injection following injection of labelled
antibodies are shown from representative pairs of anti-E-selectin and anti-DNP injected mice with
arthritis (a-c). The paw diameter (mm), and clinical score (score) are listed next to each paw for each
animal. Panel (d) demonstrates fluorescent images of animals that had not received immunisation with
bovine collagen.
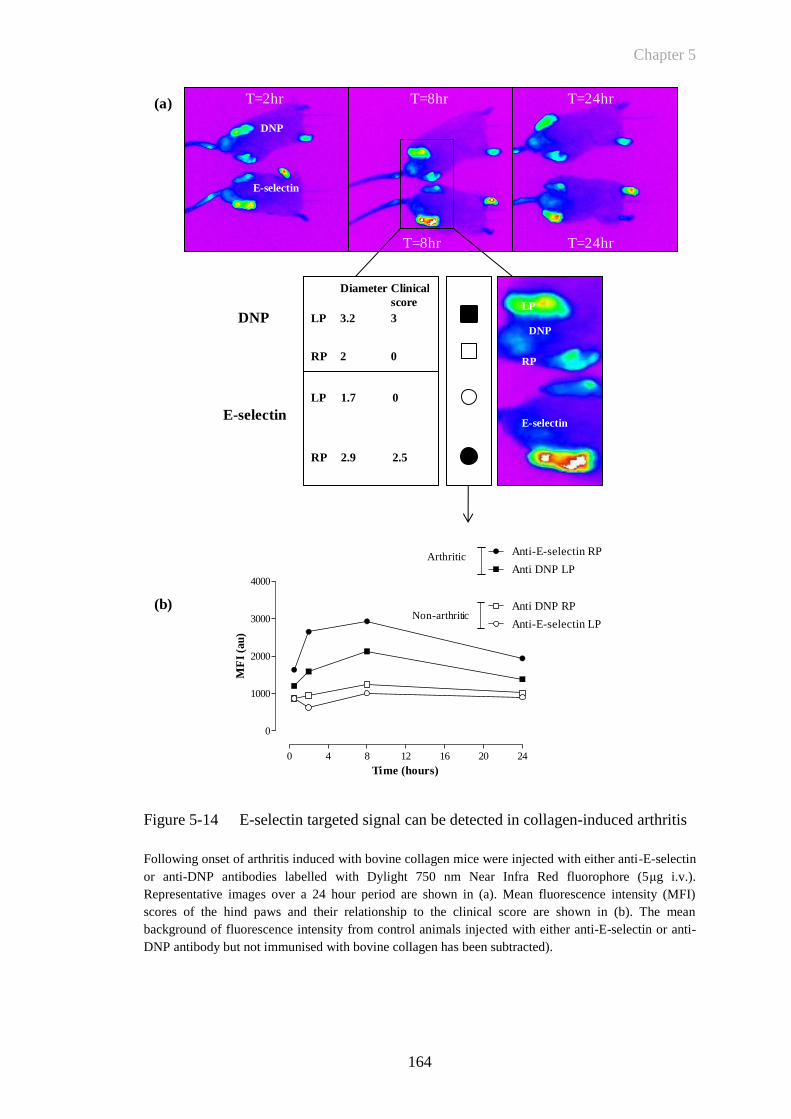
Chapter 5
164
Figure 5-14 E-selectin targeted signal can be detected in collagen-induced arthritis
Following onset of arthritis induced with bovine collagen mice were injected with either anti-E-selectin
or anti-DNP antibodies labelled with Dylight 750 nm Near Infra Red fluorophore (5μg i.v.).
Representative images over a 24 hour period are shown in (a). Mean fluorescence intensity (MFI)
scores of the hind paws and their relationship to the clinical score are shown in (b). The mean
background of fluorescence intensity from control animals injected with either anti-E-selectin or anti-
DNP antibody but not immunised with bovine collagen has been subtracted).
E-selectin
T=2hr
T=8hr T=24hr
Diameter Clinical
score
LP 3.2 3
RP 2 0
LP 1.7 0
RP 2.9 2.5
0 4 8 12 16 20 24
0
1000
2000
3000
4000Anti DNP LP
Anti DNP RP
Anti-E-selectin LP
Anti-E-selectin RP
Time (hours)
MF
I (a
u)
DNP
E-selectin
LP
RP
(a)
(b)
Arthritic
Non-arthritic
DNP
E-selectin
DNP
T=8hr T=24hr
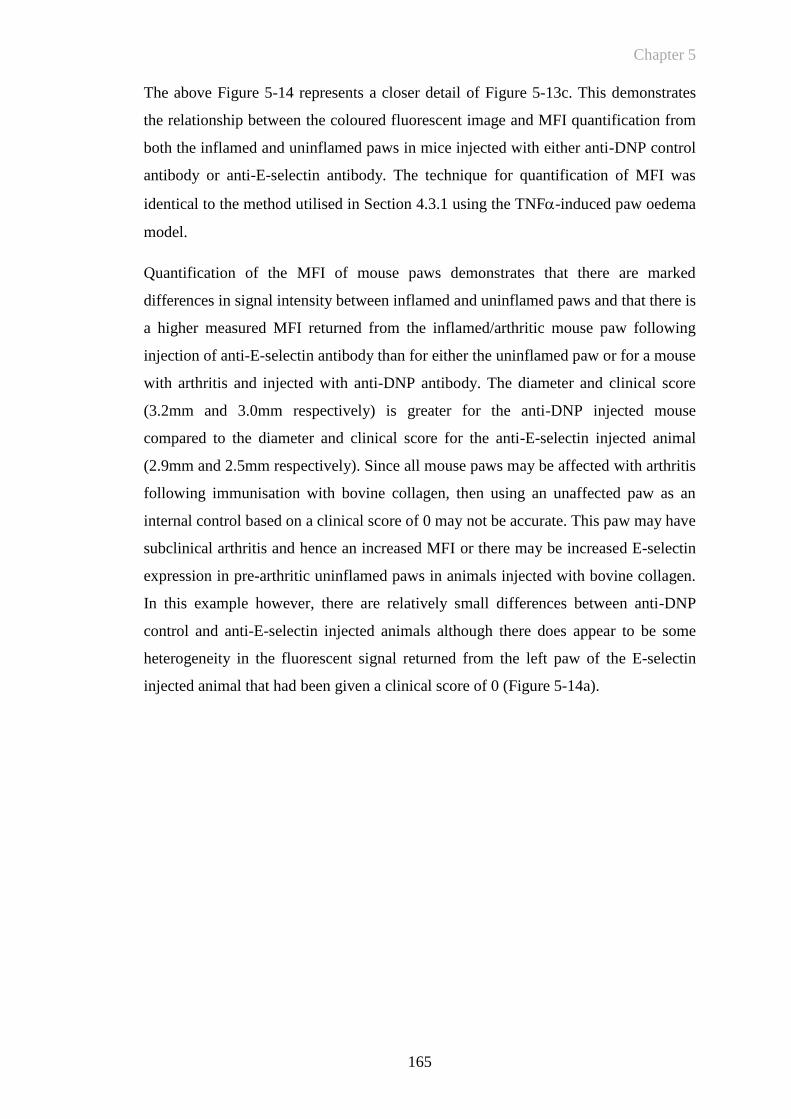
Chapter 5
165
The above Figure 5-14 represents a closer detail of Figure 5-13c. This demonstrates
the relationship between the coloured fluorescent image and MFI quantification from
both the inflamed and uninflamed paws in mice injected with either anti-DNP control
antibody or anti-E-selectin antibody. The technique for quantification of MFI was
identical to the method utilised in Section 4.3.1 using the TNF-induced paw oedema
model.
Quantification of the MFI of mouse paws demonstrates that there are marked
differences in signal intensity between inflamed and uninflamed paws and that there is
a higher measured MFI returned from the inflamed/arthritic mouse paw following
injection of anti-E-selectin antibody than for either the uninflamed paw or for a mouse
with arthritis and injected with anti-DNP antibody. The diameter and clinical score
(3.2mm and 3.0mm respectively) is greater for the anti-DNP injected mouse
compared to the diameter and clinical score for the anti-E-selectin injected animal
(2.9mm and 2.5mm respectively). Since all mouse paws may be affected with arthritis
following immunisation with bovine collagen, then using an unaffected paw as an
internal control based on a clinical score of 0 may not be accurate. This paw may have
subclinical arthritis and hence an increased MFI or there may be increased E-selectin
expression in pre-arthritic uninflamed paws in animals injected with bovine collagen.
In this example however, there are relatively small differences between anti-DNP
control and anti-E-selectin injected animals although there does appear to be some
heterogeneity in the fluorescent signal returned from the left paw of the E-selectin
injected animal that had been given a clinical score of 0 (Figure 5-14a).
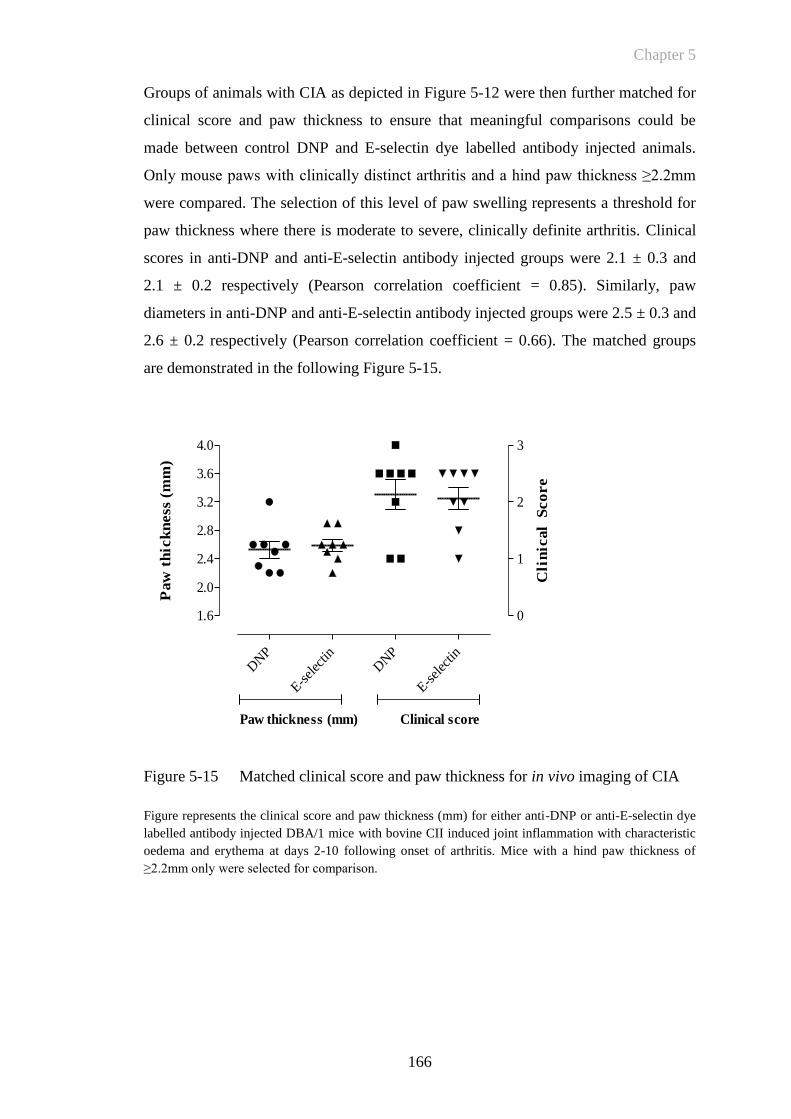
Chapter 5
166
DNP
E-sel
ectin
DNP
E-sel
ectin
1.6
2.0
2.4
2.8
3.2
3.6
4.0
0
1
2
3
Paw thickness (mm) Clinical score
Paw
th
ick
ness
(m
m)
Cli
nic
al
Sco
re
Groups of animals with CIA as depicted in Figure 5-12 were then further matched for
clinical score and paw thickness to ensure that meaningful comparisons could be
made between control DNP and E-selectin dye labelled antibody injected animals.
Only mouse paws with clinically distinct arthritis and a hind paw thickness ≥2.2mm
were compared. The selection of this level of paw swelling represents a threshold for
paw thickness where there is moderate to severe, clinically definite arthritis. Clinical
scores in anti-DNP and anti-E-selectin antibody injected groups were 2.1 ± 0.3 and
2.1 ± 0.2 respectively (Pearson correlation coefficient = 0.85). Similarly, paw
diameters in anti-DNP and anti-E-selectin antibody injected groups were 2.5 ± 0.3 and
2.6 ± 0.2 respectively (Pearson correlation coefficient = 0.66). The matched groups
are demonstrated in the following Figure 5-15.
Figure 5-15 Matched clinical score and paw thickness for in vivo imaging of CIA
Figure represents the clinical score and paw thickness (mm) for either anti-DNP or anti-E-selectin dye
labelled antibody injected DBA/1 mice with bovine CII induced joint inflammation with characteristic
oedema and erythema at days 2-10 following onset of arthritis. Mice with a hind paw thickness of
≥2.2mm only were selected for comparison.
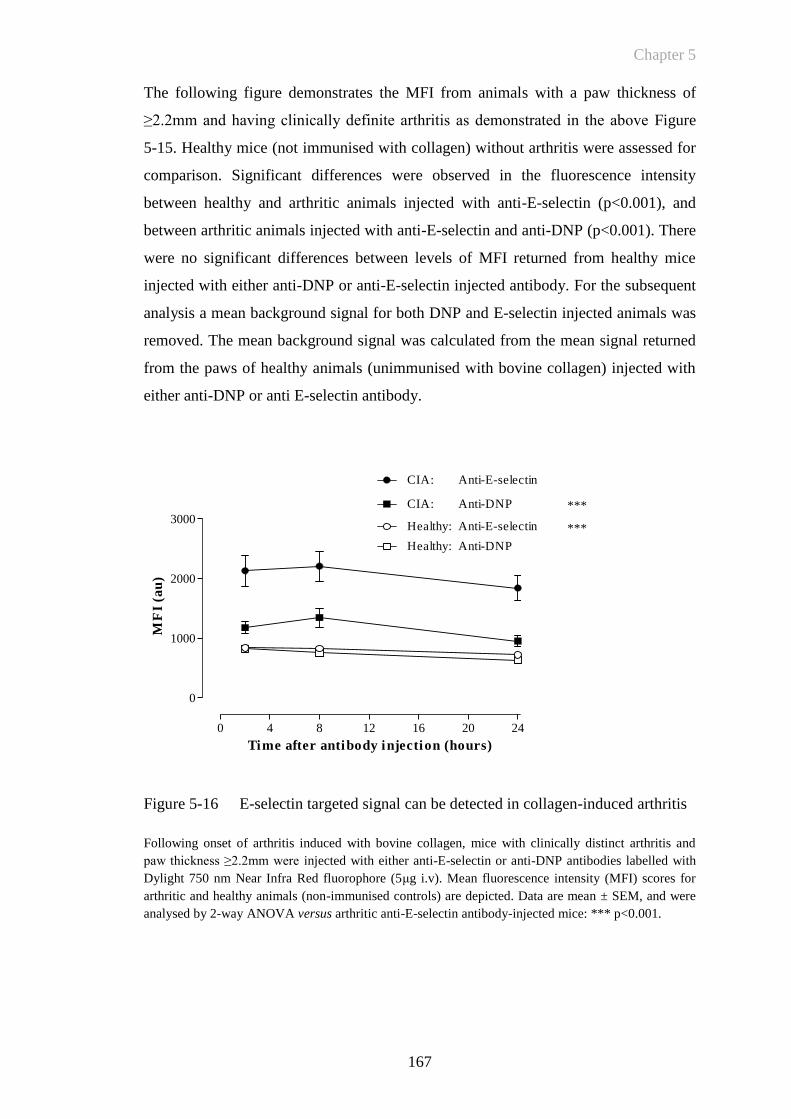
Chapter 5
167
0 4 8 12 16 20 24
0
1000
2000
3000
CIA: Anti-DNP
CIA: Anti-E-selectin
***
Healthy: Anti-DNP
Healthy: Anti-E-selectin ***
Time after antibody injection (hours)
MF
I (a
u)
The following figure demonstrates the MFI from animals with a paw thickness of
≥2.2mm and having clinically definite arthritis as demonstrated in the above Figure
5-15. Healthy mice (not immunised with collagen) without arthritis were assessed for
comparison. Significant differences were observed in the fluorescence intensity
between healthy and arthritic animals injected with anti-E-selectin (p<0.001), and
between arthritic animals injected with anti-E-selectin and anti-DNP (p<0.001). There
were no significant differences between levels of MFI returned from healthy mice
injected with either anti-DNP or anti-E-selectin injected antibody. For the subsequent
analysis a mean background signal for both DNP and E-selectin injected animals was
removed. The mean background signal was calculated from the mean signal returned
from the paws of healthy animals (unimmunised with bovine collagen) injected with
either anti-DNP or anti E-selectin antibody.
Figure 5-16 E-selectin targeted signal can be detected in collagen-induced arthritis
Following onset of arthritis induced with bovine collagen, mice with clinically distinct arthritis and
paw thickness ≥2.2mm were injected with either anti-E-selectin or anti-DNP antibodies labelled with
Dylight 750 nm Near Infra Red fluorophore (5μg i.v). Mean fluorescence intensity (MFI) scores for
arthritic and healthy animals (non-immunised controls) are depicted. Data are mean ± SEM, and were
analysed by 2-way ANOVA versus arthritic anti-E-selectin antibody-injected mice: *** p<0.001.
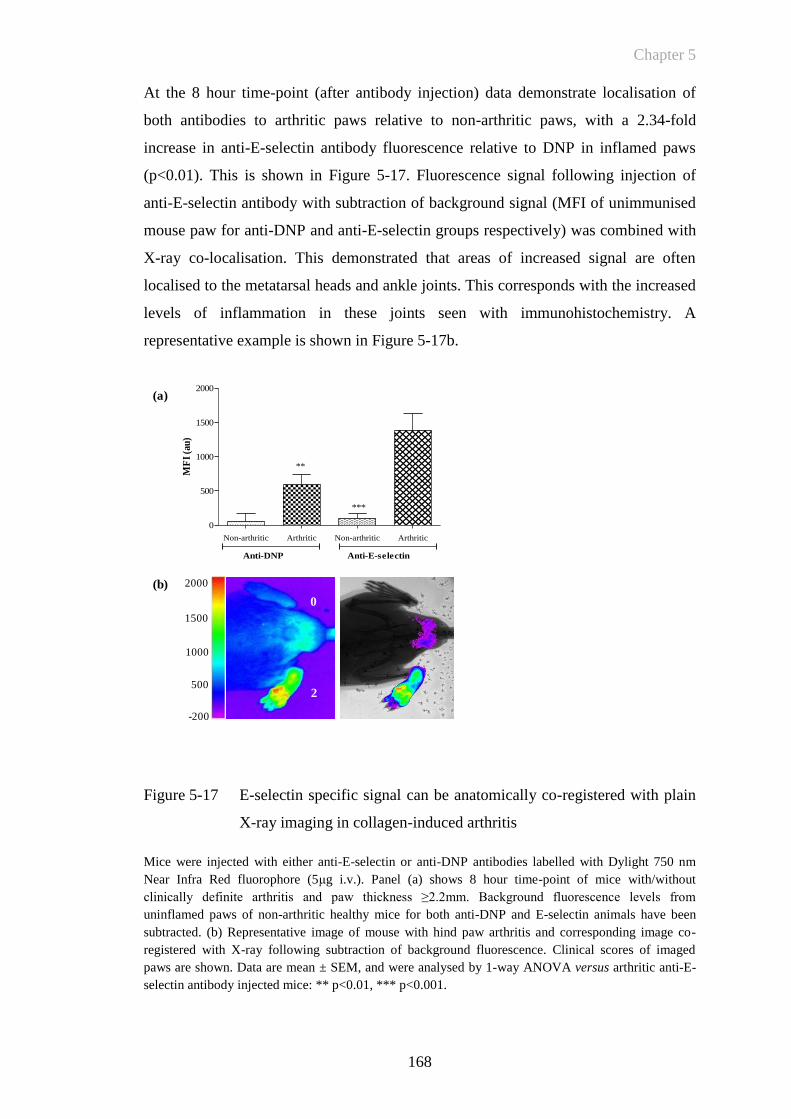
Chapter 5
168
At the 8 hour time-point (after antibody injection) data demonstrate localisation of
both antibodies to arthritic paws relative to non-arthritic paws, with a 2.34-fold
increase in anti-E-selectin antibody fluorescence relative to DNP in inflamed paws
(p<0.01). This is shown in Figure 5-17. Fluorescence signal following injection of
anti-E-selectin antibody with subtraction of background signal (MFI of unimmunised
mouse paw for anti-DNP and anti-E-selectin groups respectively) was combined with
X-ray co-localisation. This demonstrated that areas of increased signal are often
localised to the metatarsal heads and ankle joints. This corresponds with the increased
levels of inflammation in these joints seen with immunohistochemistry. A
representative example is shown in Figure 5-17b.
Figure 5-17 E-selectin specific signal can be anatomically co-registered with plain
X-ray imaging in collagen-induced arthritis
Mice were injected with either anti-E-selectin or anti-DNP antibodies labelled with Dylight 750 nm
Near Infra Red fluorophore (5μg i.v.). Panel (a) shows 8 hour time-point of mice with/without
clinically definite arthritis and paw thickness ≥2.2mm. Background fluorescence levels from
uninflamed paws of non-arthritic healthy mice for both anti-DNP and E-selectin animals have been
subtracted. (b) Representative image of mouse with hind paw arthritis and corresponding image co-
registered with X-ray following subtraction of background fluorescence. Clinical scores of imaged
paws are shown. Data are mean ± SEM, and were analysed by 1-way ANOVA versus arthritic anti-E-
selectin antibody injected mice: ** p<0.01, *** p<0.001.
(b)
(a)
Non-arthritic Arthritic Non-arthritic Arthritic
0
500
1000
1500
2000
Anti-DNP Anti-E-selectin
***
**
MF
I (a
u)
2000
1500
1000
500
-200
2
0
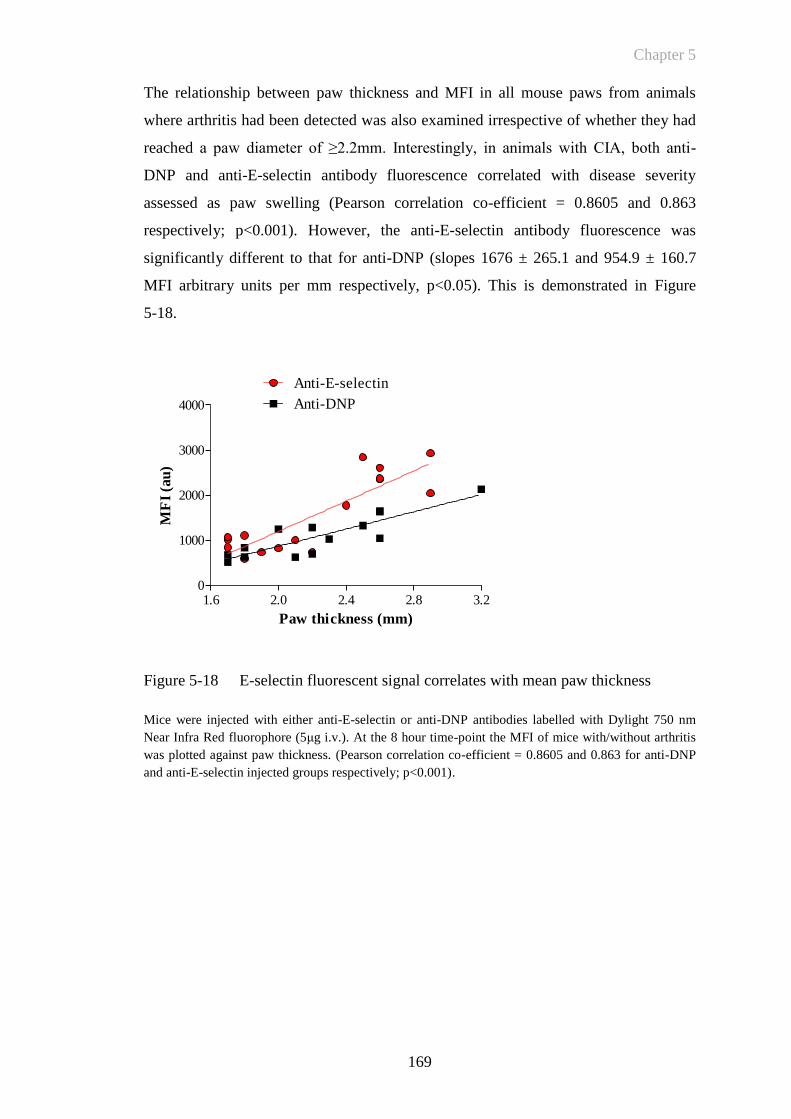
Chapter 5
169
1.6 2.0 2.4 2.8 3.20
1000
2000
3000
4000
Anti-E-selectin
Anti-DNP
Paw thickness (mm)
MF
I (a
u)
The relationship between paw thickness and MFI in all mouse paws from animals
where arthritis had been detected was also examined irrespective of whether they had
reached a paw diameter of ≥2.2mm. Interestingly, in animals with CIA, both anti-
DNP and anti-E-selectin antibody fluorescence correlated with disease severity
assessed as paw swelling (Pearson correlation co-efficient = 0.8605 and 0.863
respectively; p<0.001). However, the anti-E-selectin antibody fluorescence was
significantly different to that for anti-DNP (slopes 1676 ± 265.1 and 954.9 ± 160.7
MFI arbitrary units per mm respectively, p<0.05). This is demonstrated in Figure
5-18.
Figure 5-18 E-selectin fluorescent signal correlates with mean paw thickness
Mice were injected with either anti-E-selectin or anti-DNP antibodies labelled with Dylight 750 nm
Near Infra Red fluorophore (5μg i.v.). At the 8 hour time-point the MFI of mice with/without arthritis
was plotted against paw thickness. (Pearson correlation co-efficient = 0.8605 and 0.863 for anti-DNP
and anti-E-selectin injected groups respectively; p<0.001).
Chapter 5
170
5.3.2.1 E-selectin targeted signal detects subclinical arthritis
To analyse whether E-selectin targeted signal demonstrates increased sensitivity for
detecting subclinical arthritis, fluorescent images of paws were selected for analysis
from the above CIA experiment that had been given a clinical score of 0, but in mice
that had developed arthritis in other paws. These images were compared to the paws
of control animals that had not been immunised with collagen to induce CIA. A
representative image of a mouse with hind paw arthritis in one paw but no obvious
arthritis in the second contralateral paw is shown in Figure 5-19b. Joints with a
clinical score of 0 but with increased E-selectin signal were seen in animals that had
arthritis in other paws (Figure 5-19c). The mean signal returned from these animals
was 924 ± 37 arbitrary units. This was significantly different (p<0.01) to the mean
signal from paws of animals that had not been immunised for CIA (mean signal 795 ±
25). No significant differences were detected in the DNP signal returned from animals
immunised for CIA (660 ± 43) compared to healthy controls (751 ± 46). Animals that
had active arthritis in other paws were imaged, at between 5 and 10 days following
arthritis onset (30-40 days following immunisation). The development of further
arthritis in these paws would not be expected at this late stage of the experiment.
Imaging also marked the endpoint of the experiment.
A further experiment was performed to examine whether anti-E-selectin targeted
antibody signal was detectable prior to the onset of arthritis (data not shown).
Following injection of dye labelled antibody, imaging was undertaken at days 14 and
21 following induction of arthritis. At day 14, none of the animals imaged had any
detectable evidence of arthritis. None of the images showed any evidence of relative
increased signal in any paws. At day 21, similarly, there were no animals where
increased signal was visualised where arthritis was absent; i.e. this experiment did not
demonstrate any predictive capability for detecting increased E-selectin expression
prior to the onset of arthritis. Of the animals imaged at the day 14 time-point, 8 out of
10 in the anti-E-selectin antibody injected group developed arthritis and 6 out of 10 in
the anti-DNP antibody treated group developed arthritis. They developed arthritis
sequentially from days 16 and 18 respectively. At day 21, in the anti-E-selectin
injected group, 6 animals had no evidence of arthritis and 3 of those went on to
develop arthritis 2, 3 and 5 days following imaging. In the anti-DNP antibody treated
group imaged at day 21, 6 animals had no evidence of arthritis and 2 of these

Chapter 5
171
developed arthritis 3 and 6 days following imaging. Repeated injection of dye labelled
antibody was not considered in this experiment due to the comparatively long half life
of the antibody in vivo making detection of small differences in signal not possible.
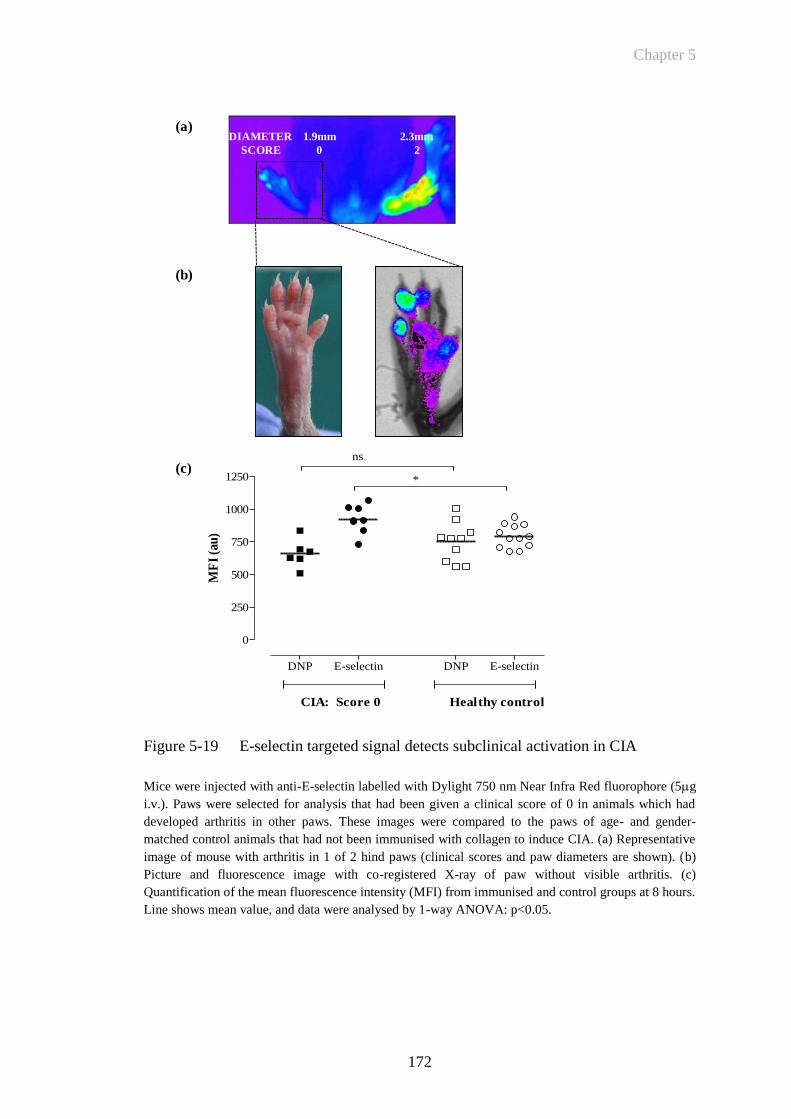
Chapter 5
172
(c)
DIAMETER 1.9mm 2.3mm
SCORE 0 2
(b)
(a)
DNP E-selectin DNP E-selectin
0
250
500
750
1000
1250
CIA: Score 0 Healthy control
*
ns
MF
I (a
u)
Figure 5-19 E-selectin targeted signal detects subclinical activation in CIA
Mice were injected with anti-E-selectin labelled with Dylight 750 nm Near Infra Red fluorophore (5g
i.v.). Paws were selected for analysis that had been given a clinical score of 0 in animals which had
developed arthritis in other paws. These images were compared to the paws of age- and gender-
matched control animals that had not been immunised with collagen to induce CIA. (a) Representative
image of mouse with arthritis in 1 of 2 hind paws (clinical scores and paw diameters are shown). (b)
Picture and fluorescence image with co-registered X-ray of paw without visible arthritis. (c)
Quantification of the mean fluorescence intensity (MFI) from immunised and control groups at 8 hours.
Line shows mean value, and data were analysed by 1-way ANOVA: p<0.05.
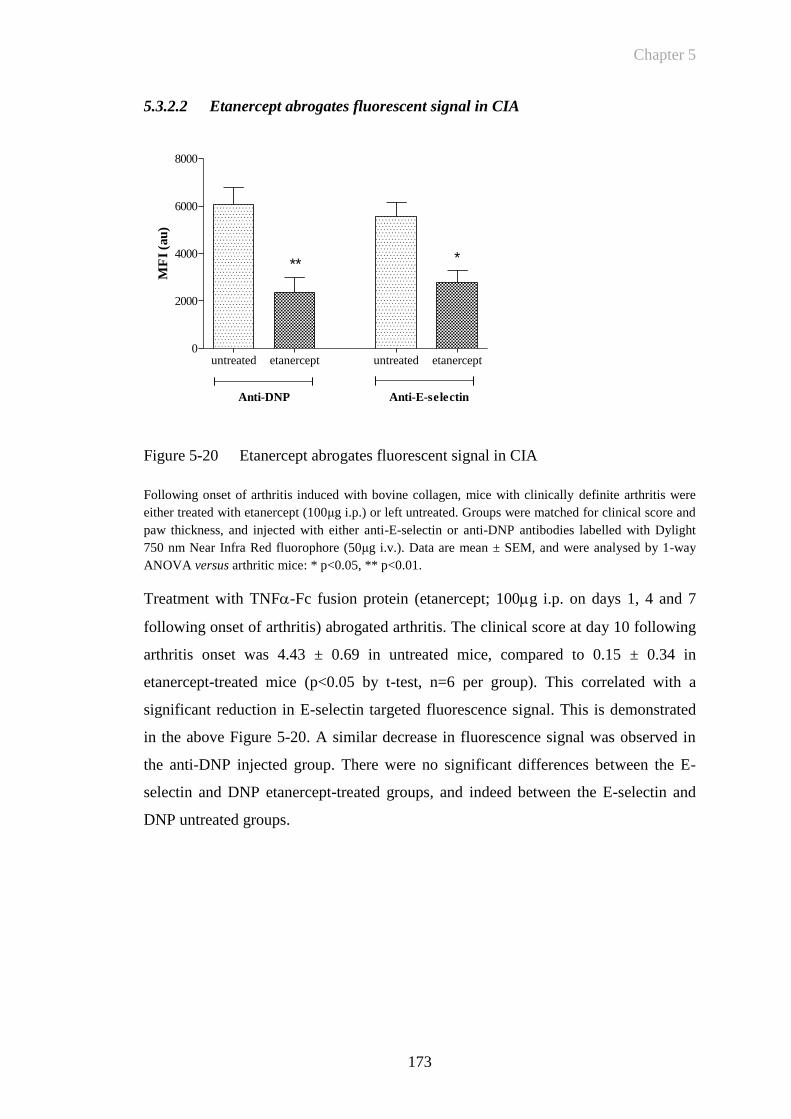
Chapter 5
173
untreated etanercept untreated etanercept0
2000
4000
6000
8000
** *
Anti-DNP Anti-E-selectin
MF
I (a
u)
5.3.2.2 Etanercept abrogates fluorescent signal in CIA
Figure 5-20 Etanercept abrogates fluorescent signal in CIA
Following onset of arthritis induced with bovine collagen, mice with clinically definite arthritis were
either treated with etanercept (100μg i.p.) or left untreated. Groups were matched for clinical score and
paw thickness, and injected with either anti-E-selectin or anti-DNP antibodies labelled with Dylight
750 nm Near Infra Red fluorophore (50μg i.v.). Data are mean ± SEM, and were analysed by 1-way
ANOVA versus arthritic mice: * p<0.05, ** p<0.01.
Treatment with TNF-Fc fusion protein (etanercept; 100g i.p. on days 1, 4 and 7
following onset of arthritis) abrogated arthritis. The clinical score at day 10 following
arthritis onset was 4.43 ± 0.69 in untreated mice, compared to 0.15 ± 0.34 in
etanercept-treated mice (p<0.05 by t-test, n=6 per group). This correlated with a
significant reduction in E-selectin targeted fluorescence signal. This is demonstrated
in the above Figure 5-20. A similar decrease in fluorescence signal was observed in
the anti-DNP injected group. There were no significant differences between the E-
selectin and DNP etanercept-treated groups, and indeed between the E-selectin and
DNP untreated groups.
Chapter 5
174
5.3.3 Determining The Effect of The Human HER-1:HER-3 Epidermal Growth
Factor Receptor Bispecific Ligand Trap on In Vivo E-selectin Targeted
Fluorescent Imaging in CIA
Studies performed at the Kennedy Institute sought to determine whether RB200 had a
therapeutic effect when used for the treatment of CIA. Initial experiments suggested
favourable results, demonstrating that the potent human EGFR extracellular domain
heterodimer RB200 abrogates CIA. This was determined by measuring the effects of
RB200 on conventional outcome measures such as paw swelling and clinical score.
Further experiments were performed to assess whether low dose RB200 and
combined blockade by the etanercept would have additional therapeutic benefit. I
therefore also sought to determine the effect that this combination treatment had on in
vivo E-selectin targeted fluorescent imaging.
Disease was induced in 60 male DBA/1 mice (12 weeks old) as described in Section
2.5.2. RB200 (gift from Dr Michael Shepard, Halozyme Therapeutics, San Diego,
USA) was administered intra-peritoneally (i.p.) on day of disease onset (day 1), and
then on days 4 and 7 of disease, at a dose of 0.5mg/kg or 10mg/kg, with equal
volumes of PBS equivalent to etanercept given to control animals (n=6 per group.
(Prior experiments performed at the Kennedy Institute had demonstrated significant
efficacy of RB200 at 10 mg/kg, minimal efficacy at 1mg/kg and no significant
difference in disease severity of CIA at 0.1mg/kg, unpublished observations).
Etanercept was given (i.p.) on the day of disease onset (day 1), and then on days 4 and
7, at a dose of 1mg/kg or 5mg/kg (equivalent to 20g and 100g per mouse
respectively), with an equal volume of PBS equivalent to RB200 in control animals.
(Similarly prior experiments had demonstrated significant abrogation of arthritis with
100g (5mg/kg) of etanercept and minimal effect with 20g (1mg/kg) of etanercept;
Kennedy Institute, unpublished observations). Combination treatment of 0.5mg/kg
RB200 plus 1mg/kg etanercept was given i.p. on day of disease onset (day 1), and
then on days 4 and 7. Arthritis was assessed by paw swelling or as clinical scores
based on all 4 paws. Fluorescence imaging in vivo was performed on day 10, animals
were injected with anti-mouse E-selectin MoAb labelled with DyLight 750nm near
infrared probe (excitation/emission spectra 752nm/778nm respectively). In vivo
imaging studies were undertaken at 2, 8 and 24 hours following i.v. injection of NIR
labelled anti-E-selectin antibody.
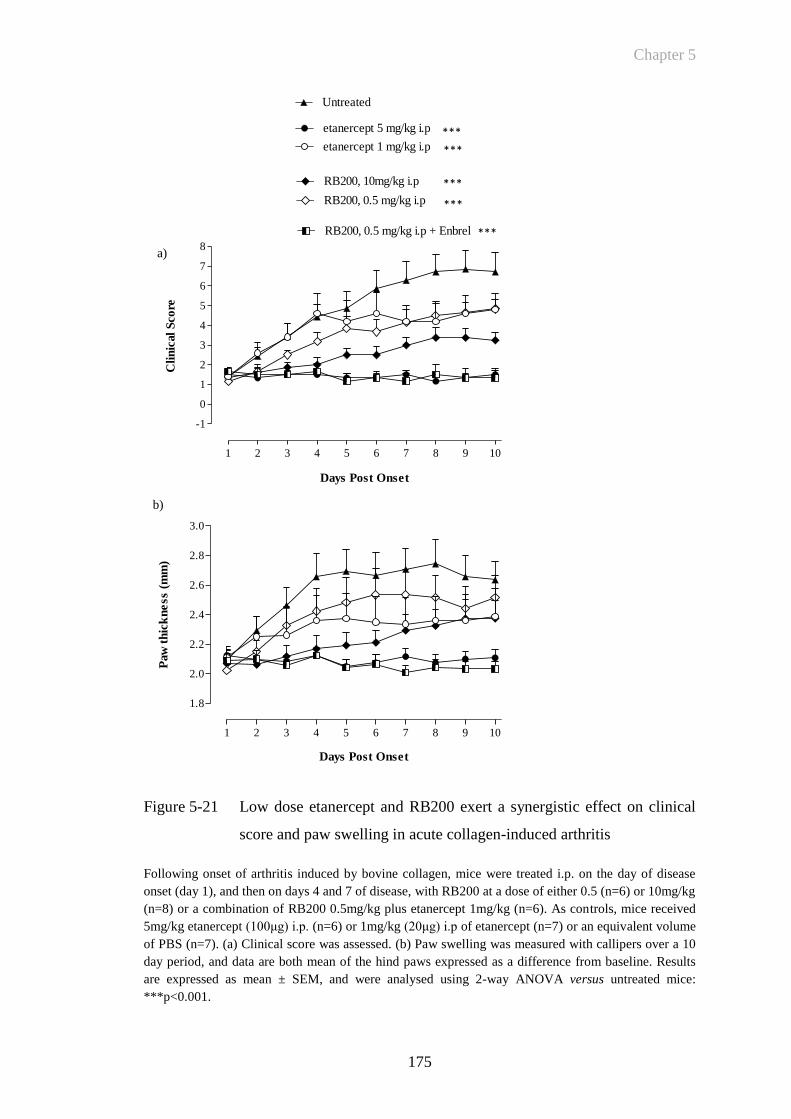
Chapter 5
175
Figure 5-21 Low dose etanercept and RB200 exert a synergistic effect on clinical
score and paw swelling in acute collagen-induced arthritis
Following onset of arthritis induced by bovine collagen, mice were treated i.p. on the day of disease
onset (day 1), and then on days 4 and 7 of disease, with RB200 at a dose of either 0.5 (n=6) or 10mg/kg
(n=8) or a combination of RB200 0.5mg/kg plus etanercept 1mg/kg (n=6). As controls, mice received
5mg/kg etanercept (100μg) i.p. (n=6) or 1mg/kg (20μg) i.p of etanercept (n=7) or an equivalent volume
of PBS (n=7). (a) Clinical score was assessed. (b) Paw swelling was measured with callipers over a 10
day period, and data are both mean of the hind paws expressed as a difference from baseline. Results
are expressed as mean ± SEM, and were analysed using 2-way ANOVA versus untreated mice:
***p<0.001.
1 2 3 4 5 6 7 8 9 10
-1
0
1
2
3
4
5
6
7
8
Untreated
etanercept 5 mg/kg i.p
RB200, 10mg/kg i.p
RB200, 0.5 mg/kg i.p
etanercept 1 mg/kg i.p
RB200, 0.5 mg/kg i.p + Enbrel
Days Post Onset
Cli
nic
al
Sco
re
1 2 3 4 5 6 7 8 9 10
1.8
2.0
2.2
2.4
2.6
2.8
3.0
Days Post Onset
Paw
th
ick
ne
ss (
mm
)
a)
b)
***
***
***
***
***

Chapter 5
176
The above figures demonstrate the effects of either RB200 or etanercept on disease in
mice with established CIA. This shows that at high dose both etanercept (5mg/kg) and
RB200 (10mg/kg) have a significant effect on both progression of clinical score and
paw swelling. Similarly low dose etanercept (1mg/kg) and RB2000 (5mg/kg)
ameliorates clinical score and paw swelling. The combination of RB200 and
etanercept at low dose has a marked effect on both measures of disease activity in
CIA. Indeed the RB200 and etanercept combination was significantly different to
either low dose etanercept alone (p<0.001 for both clinical score and paw swelling) or
low dose RB200 alone (p<0.001 for both clinical score and paw swelling).
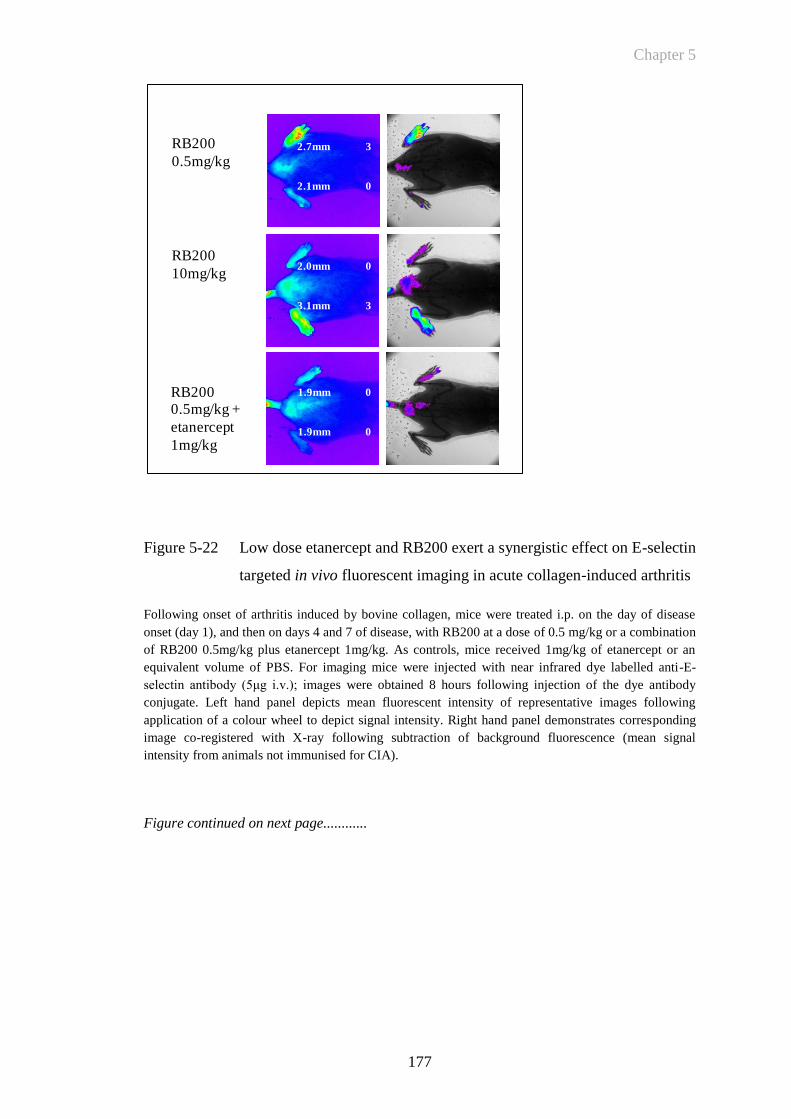
Chapter 5
177
Figure 5-22 Low dose etanercept and RB200 exert a synergistic effect on E-selectin
targeted in vivo fluorescent imaging in acute collagen-induced arthritis
Following onset of arthritis induced by bovine collagen, mice were treated i.p. on the day of disease
onset (day 1), and then on days 4 and 7 of disease, with RB200 at a dose of 0.5 mg/kg or a combination
of RB200 0.5mg/kg plus etanercept 1mg/kg. As controls, mice received 1mg/kg of etanercept or an
equivalent volume of PBS. For imaging mice were injected with near infrared dye labelled anti-E-
selectin antibody (5μg i.v.); images were obtained 8 hours following injection of the dye antibody
conjugate. Left hand panel depicts mean fluorescent intensity of representative images following
application of a colour wheel to depict signal intensity. Right hand panel demonstrates corresponding
image co-registered with X-ray following subtraction of background fluorescence (mean signal
intensity from animals not immunised for CIA).
Figure continued on next page............
RB200
0.5mg/kg
RB200
10mg/kg
RB200 0.5mg/kg +
etanercept
1mg/kg
1.9mm 0
1.9mm 0
2.0mm 0
3.1mm 3
2.7mm 3
2.1mm 0
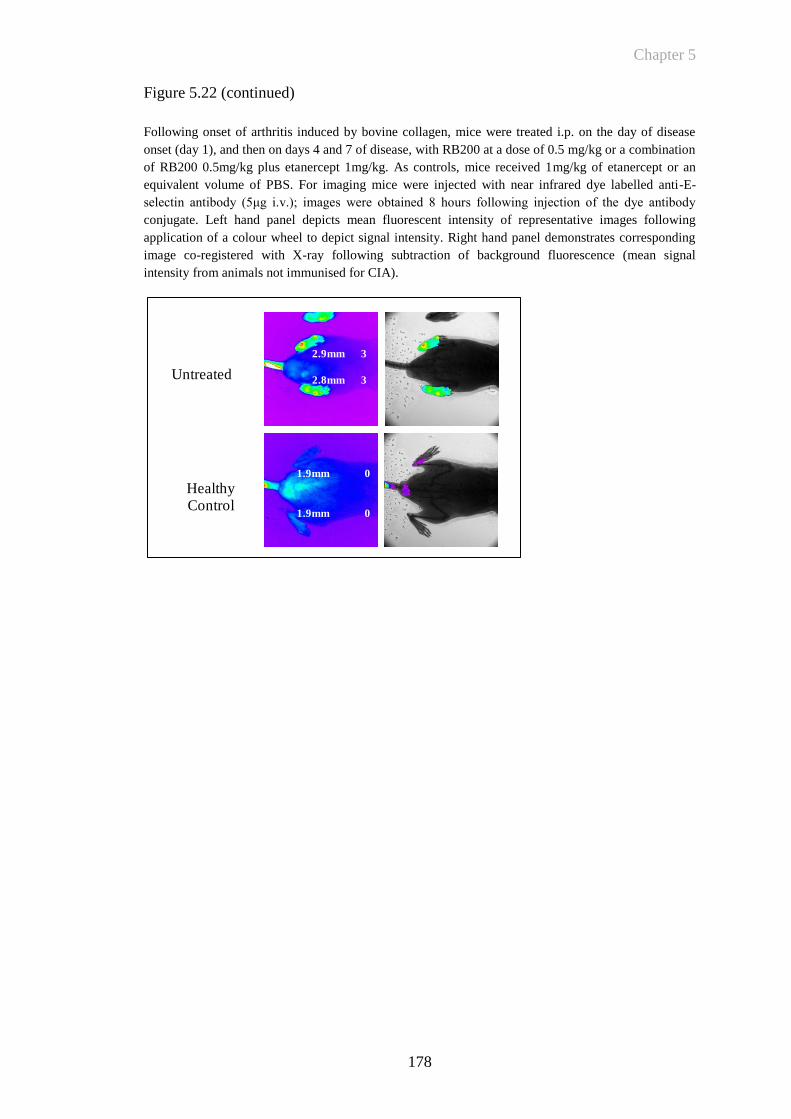
Chapter 5
178
Figure 5.22 (continued)
Following onset of arthritis induced by bovine collagen, mice were treated i.p. on the day of disease
onset (day 1), and then on days 4 and 7 of disease, with RB200 at a dose of 0.5 mg/kg or a combination
of RB200 0.5mg/kg plus etanercept 1mg/kg. As controls, mice received 1mg/kg of etanercept or an
equivalent volume of PBS. For imaging mice were injected with near infrared dye labelled anti-E-
selectin antibody (5μg i.v.); images were obtained 8 hours following injection of the dye antibody
conjugate. Left hand panel depicts mean fluorescent intensity of representative images following
application of a colour wheel to depict signal intensity. Right hand panel demonstrates corresponding
image co-registered with X-ray following subtraction of background fluorescence (mean signal
intensity from animals not immunised for CIA).
Untreated
2.9mm 3
2.8mm 3
Healthy Control
1.9mm 0
1.9mm 0
Chapter 5
179
The above representative examples of fluorescent imaging demonstrate that the
combination of low dose etanercept and RB200 apparently have a marked effect in
decreasing the E-selectin targeted signal in animals with arthritis when compared with
either treatment on its own. While both low dose etanercept (1mg/kg) and RB200
(0.5mg/kg) had some overall therapeutic efficacy on the total amount of arthritic
disease in each animal, it was only with combination treatment that there was
complete abrogation of fluorescent signal. Quantification of MFI over 24 hours in the
different treatment groups is demonstrated below. This shows that combination
treatment returns the E-selectin targeted MFI to the same levels as that seen in control
animals that have not been immunised for CIA. Comparing the effect of anti-DNP and
anti-E-selectin in the treatment groups would help to answer whether there is a
differential effect of combination treatment on E-selectin specific signal. This was not
possible in this experiment due to the sizes and diversity of treatment groups
constraining the number of animals that could be imaged. The following Figure 5-23
demonstrates that the combination of low dose RB200 and etanercept have a
significant additive effect on abrogation of E-selectin targeted fluorescent signal,
when compared to either treatment administered in isolation. The mean fluorescence
signal for each animal has been calculated by adding the mean fluorescence from both
left and right hind paws. For the purposes of clarity mean fluorescent signal returned
from animals treated with either high dose etanercept or RB200 have not been
included on this graph, but are included in the following Figure 5-24. This figure
demonstrates the mean signal returned from each paw of all animals in all treatment
groups.
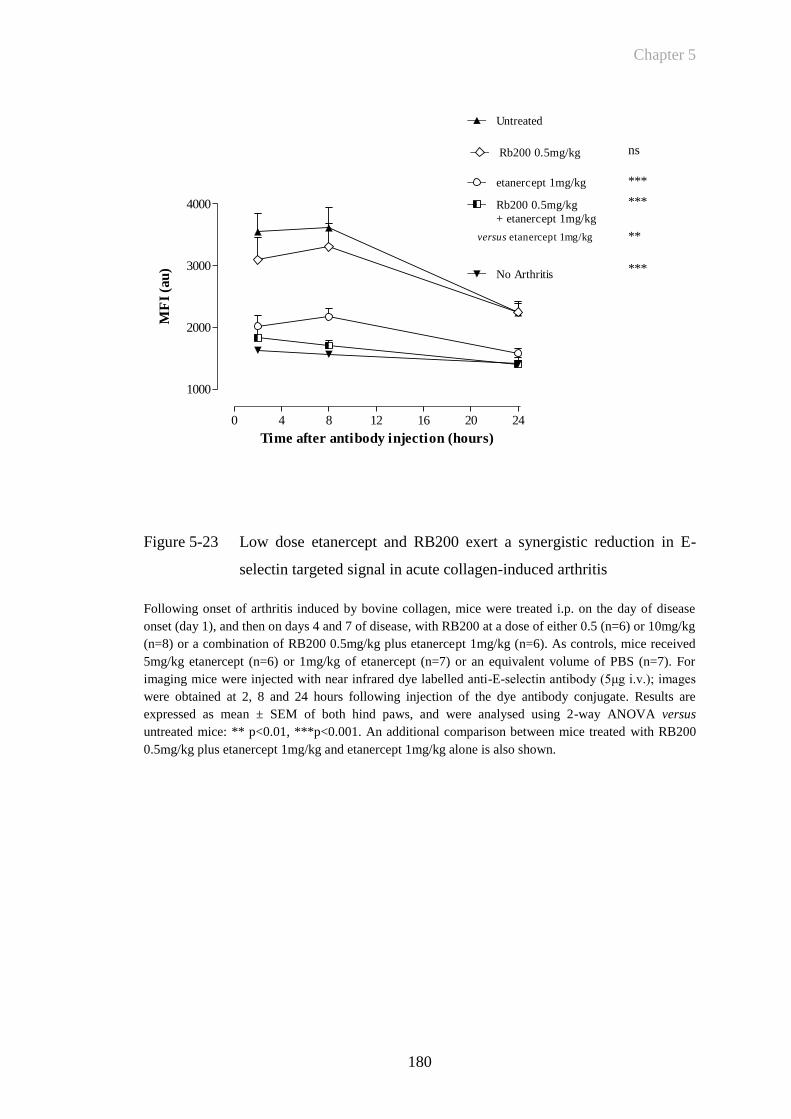
Chapter 5
180
0 4 8 12 16 20 24
1000
2000
3000
4000
Untreated
Rb200 0.5mg/kg
+ etanercept 1mg/kg
etanercept 1mg/kg
Rb200 0.5mg/kg ns
***
***
**versus etanercept 1mg/kg
No Arthritis***
Time after antibody injection (hours)
MF
I (a
u)
Figure 5-23 Low dose etanercept and RB200 exert a synergistic reduction in E-
selectin targeted signal in acute collagen-induced arthritis
Following onset of arthritis induced by bovine collagen, mice were treated i.p. on the day of disease
onset (day 1), and then on days 4 and 7 of disease, with RB200 at a dose of either 0.5 (n=6) or 10mg/kg
(n=8) or a combination of RB200 0.5mg/kg plus etanercept 1mg/kg (n=6). As controls, mice received
5mg/kg etanercept (n=6) or 1mg/kg of etanercept (n=7) or an equivalent volume of PBS (n=7). For
imaging mice were injected with near infrared dye labelled anti-E-selectin antibody (5μg i.v.); images
were obtained at 2, 8 and 24 hours following injection of the dye antibody conjugate. Results are
expressed as mean ± SEM of both hind paws, and were analysed using 2-way ANOVA versus
untreated mice: ** p<0.01, ***p<0.001. An additional comparison between mice treated with RB200
0.5mg/kg plus etanercept 1mg/kg and etanercept 1mg/kg alone is also shown.
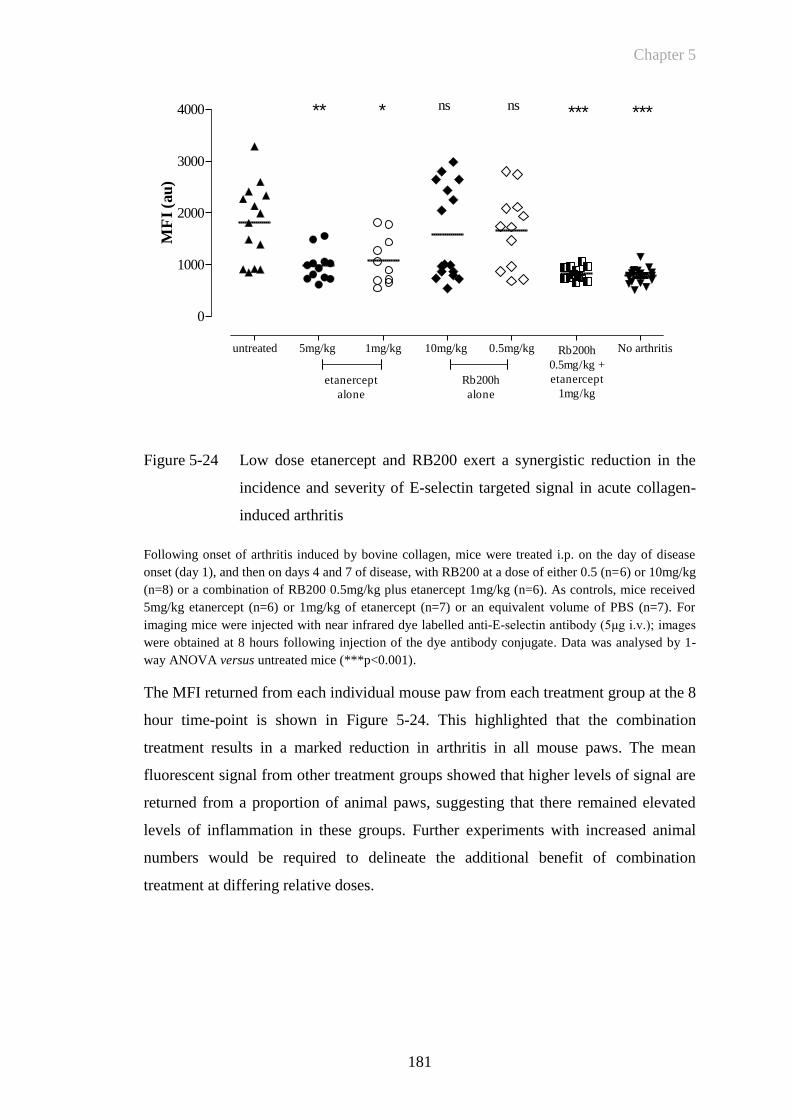
Chapter 5
181
Figure 5-24 Low dose etanercept and RB200 exert a synergistic reduction in the
incidence and severity of E-selectin targeted signal in acute collagen-
induced arthritis
Following onset of arthritis induced by bovine collagen, mice were treated i.p. on the day of disease
onset (day 1), and then on days 4 and 7 of disease, with RB200 at a dose of either 0.5 (n=6) or 10mg/kg
(n=8) or a combination of RB200 0.5mg/kg plus etanercept 1mg/kg (n=6). As controls, mice received
5mg/kg etanercept (n=6) or 1mg/kg of etanercept (n=7) or an equivalent volume of PBS (n=7). For
imaging mice were injected with near infrared dye labelled anti-E-selectin antibody (5μg i.v.); images
were obtained at 8 hours following injection of the dye antibody conjugate. Data was analysed by 1-
way ANOVA versus untreated mice (***p<0.001).
The MFI returned from each individual mouse paw from each treatment group at the 8
hour time-point is shown in Figure 5-24. This highlighted that the combination
treatment results in a marked reduction in arthritis in all mouse paws. The mean
fluorescent signal from other treatment groups showed that higher levels of signal are
returned from a proportion of animal paws, suggesting that there remained elevated
levels of inflammation in these groups. Further experiments with increased animal
numbers would be required to delineate the additional benefit of combination
treatment at differing relative doses.
untreated 5mg/kg 1mg/kg 10mg/kg 0.5mg/kg No arthritis
0
1000
2000
3000
4000
etanercept
alone
Rb200h
alone
Rb200h
0.5mg/kg +
etanercept
1mg/kg
** *** **** ns ns
MF
I (a
u)
Chapter 5
182
5.4 Discussion
CIA is an animal model that has significant similarities to RA and is characterised by
progressive joint swelling and destruction. In this chapter, I have established that
during the course of CIA, E-selectin expression on activated endothelium can be
detected by immunohistochemistry. I have then shown that NIR dye labelled anti-E-
selectin antibody can be detected by fluorescent reflectance imaging in the inflamed
paws of animals with CIA when compared to the uptake of NIR dye labelled isotype
control antibody to similar sites of inflammation within the arthritic joint.
Furthermore, subclinical levels of increased E-selectin signal are investigated. This is
a novel method for detecting and quantifying the in vivo expression of E-selectin in
CIA. Finally, I have demonstrated that NIR E-selectin targeted imaging can be used to
investigate the effects of a novel therapy in CIA. This has quantified the effect of
RB200 – a pan ligand EGFR trap - that demonstrated a significant synergistic
blockade of E-selectin targeted fluorescent signal when used in combination with low
dose etanercept.
CIA was induced by immunising male DBA/1 mice with heterologous (bovine) type
II collagen. Clinical observations and measurements of both paw swelling and clinical
score have confirmed that CIA followed a typical clinical course of disease in these
experiments. Similarly, histological analysis also confirmed the presence of arthritis
and progressive joint destruction with worsening severity of arthritis. Synovial
vascularisation was also assessed by microscopic examination of tissue sections
probed for both E-selectin and CD31 by immunohistochemistry. Angiogenesis, the
formation of new blood vessels, is one of the earliest histolopathologic findings in RA
and appears to be necessary for pannus development (Kimball and Gross 1991) and
also plays an active role in inflammation as a source of both cytokine and protease
activity due to the increased number of blood vessels and infiltrating cells brought in
by these vessels (Colville-Nash and Scott 1992). The expanded vascular bed volume
resulting from angiogenesis may be further expected to have ongoing expression of
cytokines including E-selectin. This has been confirmed by the
immunohistochemistry experiments described in this chapter that show increased
CD31 expression within areas of invading inflamed synovium around the arthritic
joint and in addition also demonstrated E-selectin expression within these areas.
Analysis of the immunohistochemistry specimens demonstrated that not all specimens
Chapter 5
183
or areas of inflamed tissue demonstrated E-selectin expression. This emphasizes the
difficulty of analysing immunoreactivity of antigens expressed on the endothelial
surface following the fixation process for mouse paws as described in Section 2.6. A
previous study that investigated the expression of E-selectin CIA noted occasional E-
selectin expression that may be due to underlying specimen preparation (Everts,
Asgeirsdottir et al. 2003). However, analysis of E-selectin expression in different
tissues in the pig following E-selectin staining showed most intense staining on the
endothelium of arteries and veins of all sizes, with less expression on capillaries
(Keelan, Licence et al. 1994). This observation indicates that there may be
heterogeneity between the EC lining of different vessels in their capacity to respond
to stimulation by inflammatory signals such as cytokines. They may therefore have a
differing ability to react to leukocytes. Differences between the pattern of
immunohistochemical staining for E-selectin expression and in vivo findings may
occur for other reasons. A component of fluorescent signal in inflamed tissue may be
due to the uptake of fluorescently labelled E-selectin antibody bound to soluble E-
selectin. Evidence does support there being a pool of soluble E-selectin and this is
discussed in Section 1.2.2.3. Attempts were made to further analyse the distribution of
E-selectin in the inflamed paw with fluorescent microscopy following injection of
NIR dye-labelled antibody. This however proved challenging since there were
limitations to the filter sets that were available in the NIR range and following
specimen preparation there were significant levels of autofluorescence in the
heterogenous tissue of the inflamed paw. The co-registration of fluorescent signal
with plain X-ray however, has helped to delineate increased in vivo signal around the
ankle and metatarsal heads. This corresponded with the sites of maximal tissue
damage observed on histological specimens. More detailed analysis of these changes
using the current imaging and X-ray device would be limited by the resolution of
digital images obtained. There are alternative macroscopic fluorescent imaging
devices that have a higher level of resolution compared to the apparatus used for these
experiments. For example, two photon-excitation microscopy is a fluorescence
imaging technique that allows imaging of living tissue up to a depth of one millimeter
(Denk, Strickler et al. 1990). Compared to a confocal microscope, photon detection is
much more effective since even scattered photons contribute to the usable signal. A
number of limitations of two-photon microscopy exist: the pulsed lasers needed for
two-photon excitation are much more expensive then the constant wave (CW) lasers
Chapter 5
184
used in confocal microscopy; the two-photon absorption spectrum of a molecule may
vary significantly from its one-photon counterpart; and for very thin objects such as
isolated cells, single-photon (confocal) microscopes can produce images with higher
optical resolution due to their shorter excitation wavelengths. In light scattering tissue,
on the other hand, the superior optical sectioning and light detection capabilities of the
two-photon microscope result in better performance. It is therefore a technique that
with appropriate adaptations may be well suited to imaging peripheral arthritis in
animal models.
One of the significant challenges of this section of work was to ensure that there were
sufficient animals within each comparator group so that levels of arthritis were closely
matched for clinical score and paw swelling. The heterogeneity of CIA is a useful
paradigm of RA, but this makes matching for changes in clinical score and paw
thickness between groups of animals very challenging. My work in the previous
chapter had shown that a significant component of the fluorescent targeting was due
to the non-specific uptake of antibody to sites of inflammation. This occurs at sites
where there is increased vessel permeability allowing leakage of macromolecules
from the circulation into the inflamed area. The initial immunohistochemistry work in
CIA had shown that E-selectin expression could be detected at both early, mid and
late time-points during the course of arthritis. Overall analysis of the control and anti-
E-selectin antibody targeted groups did also confirm that they were matched for
duration of arthritis and the time of imaging. Nevertheless this did not give precise
information about the time course of E-selectin expression during the evolution of
arthritis in the CIA model. The heterogeneity of CIA is also reflected when analysing
the fluorescent emission from both arthritic and non-arthritic paws in CIA. This
showed that there is considerable variation in signal intensity, between animals and
between paws in the same animal. This is reflected in Figure 5-20 - while there are
significant differences between etanercept treated and untreated groups there were no
differences between E-selectin and DNP targeted untreated groups. There are likely to
be a number of reasons for this. The number of animals in each of the groups was
comparatively small (n=3-4 per group) so that despite matching of groups for clinical
score there was significant heterogeneity in signal. Also, this experiment was
performed prior to the experiments detailed in Section 4.3.4 that showed an injection
of 5g dye labelled antibody had increased sensitivity for detecting differences in the
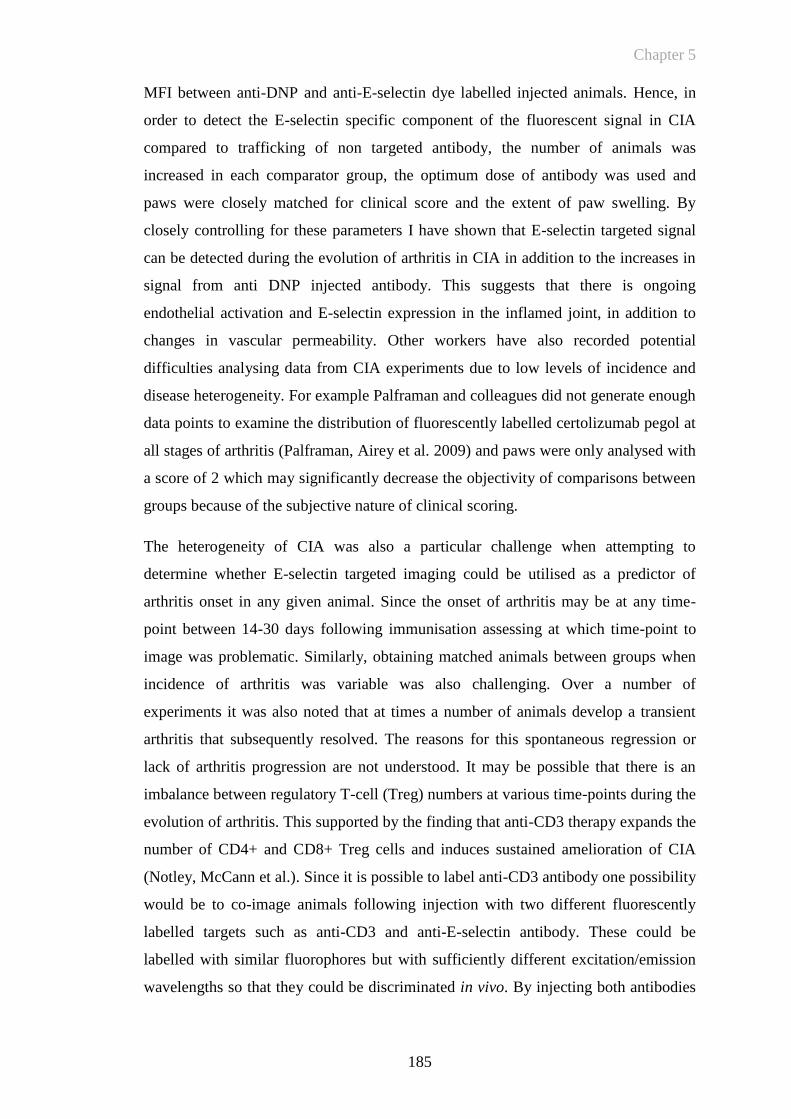
Chapter 5
185
MFI between anti-DNP and anti-E-selectin dye labelled injected animals. Hence, in
order to detect the E-selectin specific component of the fluorescent signal in CIA
compared to trafficking of non targeted antibody, the number of animals was
increased in each comparator group, the optimum dose of antibody was used and
paws were closely matched for clinical score and the extent of paw swelling. By
closely controlling for these parameters I have shown that E-selectin targeted signal
can be detected during the evolution of arthritis in CIA in addition to the increases in
signal from anti DNP injected antibody. This suggests that there is ongoing
endothelial activation and E-selectin expression in the inflamed joint, in addition to
changes in vascular permeability. Other workers have also recorded potential
difficulties analysing data from CIA experiments due to low levels of incidence and
disease heterogeneity. For example Palframan and colleagues did not generate enough
data points to examine the distribution of fluorescently labelled certolizumab pegol at
all stages of arthritis (Palframan, Airey et al. 2009) and paws were only analysed with
a score of 2 which may significantly decrease the objectivity of comparisons between
groups because of the subjective nature of clinical scoring.
The heterogeneity of CIA was also a particular challenge when attempting to
determine whether E-selectin targeted imaging could be utilised as a predictor of
arthritis onset in any given animal. Since the onset of arthritis may be at any time-
point between 14-30 days following immunisation assessing at which time-point to
image was problematic. Similarly, obtaining matched animals between groups when
incidence of arthritis was variable was also challenging. Over a number of
experiments it was also noted that at times a number of animals develop a transient
arthritis that subsequently resolved. The reasons for this spontaneous regression or
lack of arthritis progression are not understood. It may be possible that there is an
imbalance between regulatory T-cell (Treg) numbers at various time-points during the
evolution of arthritis. This supported by the finding that anti-CD3 therapy expands the
number of CD4+ and CD8+ Treg cells and induces sustained amelioration of CIA
(Notley, McCann et al.). Since it is possible to label anti-CD3 antibody one possibility
would be to co-image animals following injection with two different fluorescently
labelled targets such as anti-CD3 and anti-E-selectin antibody. These could be
labelled with similar fluorophores but with sufficiently different excitation/emission
wavelengths so that they could be discriminated in vivo. By injecting both antibodies
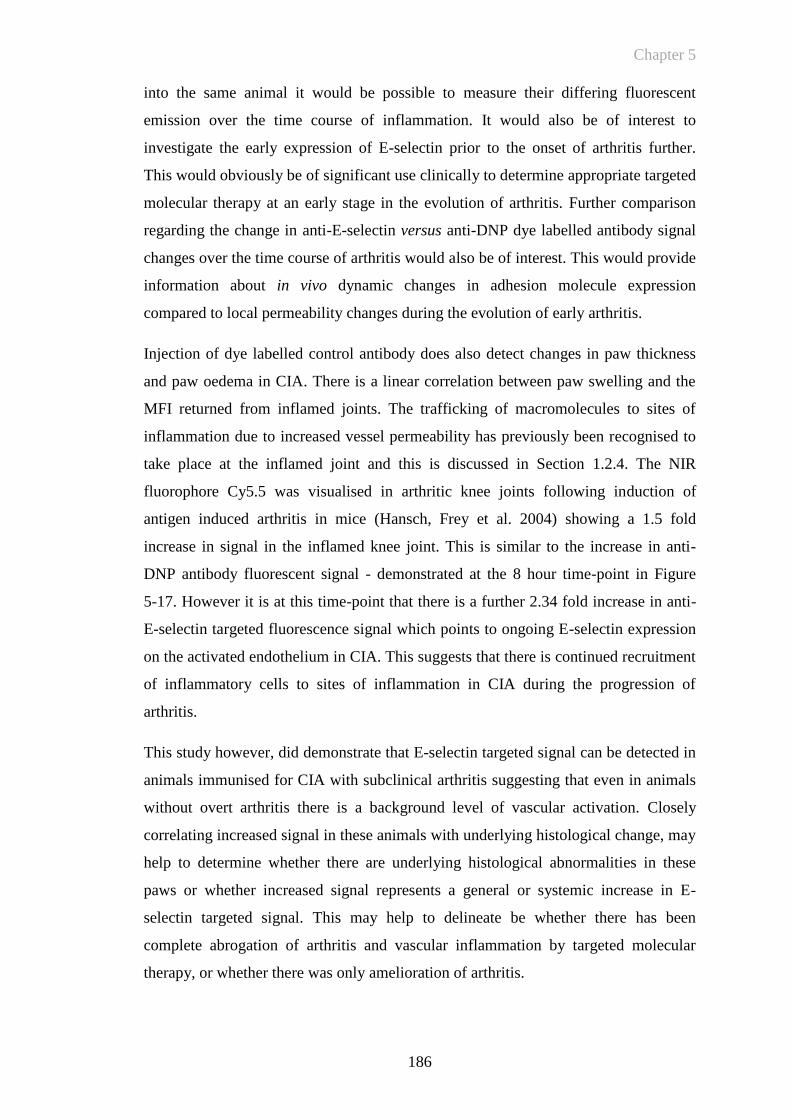
Chapter 5
186
into the same animal it would be possible to measure their differing fluorescent
emission over the time course of inflammation. It would also be of interest to
investigate the early expression of E-selectin prior to the onset of arthritis further.
This would obviously be of significant use clinically to determine appropriate targeted
molecular therapy at an early stage in the evolution of arthritis. Further comparison
regarding the change in anti-E-selectin versus anti-DNP dye labelled antibody signal
changes over the time course of arthritis would also be of interest. This would provide
information about in vivo dynamic changes in adhesion molecule expression
compared to local permeability changes during the evolution of early arthritis.
Injection of dye labelled control antibody does also detect changes in paw thickness
and paw oedema in CIA. There is a linear correlation between paw swelling and the
MFI returned from inflamed joints. The trafficking of macromolecules to sites of
inflammation due to increased vessel permeability has previously been recognised to
take place at the inflamed joint and this is discussed in Section 1.2.4. The NIR
fluorophore Cy5.5 was visualised in arthritic knee joints following induction of
antigen induced arthritis in mice (Hansch, Frey et al. 2004) showing a 1.5 fold
increase in signal in the inflamed knee joint. This is similar to the increase in anti-
DNP antibody fluorescent signal - demonstrated at the 8 hour time-point in Figure
5-17. However it is at this time-point that there is a further 2.34 fold increase in anti-
E-selectin targeted fluorescence signal which points to ongoing E-selectin expression
on the activated endothelium in CIA. This suggests that there is continued recruitment
of inflammatory cells to sites of inflammation in CIA during the progression of
arthritis.
This study however, did demonstrate that E-selectin targeted signal can be detected in
animals immunised for CIA with subclinical arthritis suggesting that even in animals
without overt arthritis there is a background level of vascular activation. Closely
correlating increased signal in these animals with underlying histological change, may
help to determine whether there are underlying histological abnormalities in these
paws or whether increased signal represents a general or systemic increase in E-
selectin targeted signal. This may help to delineate be whether there has been
complete abrogation of arthritis and vascular inflammation by targeted molecular
therapy, or whether there was only amelioration of arthritis.
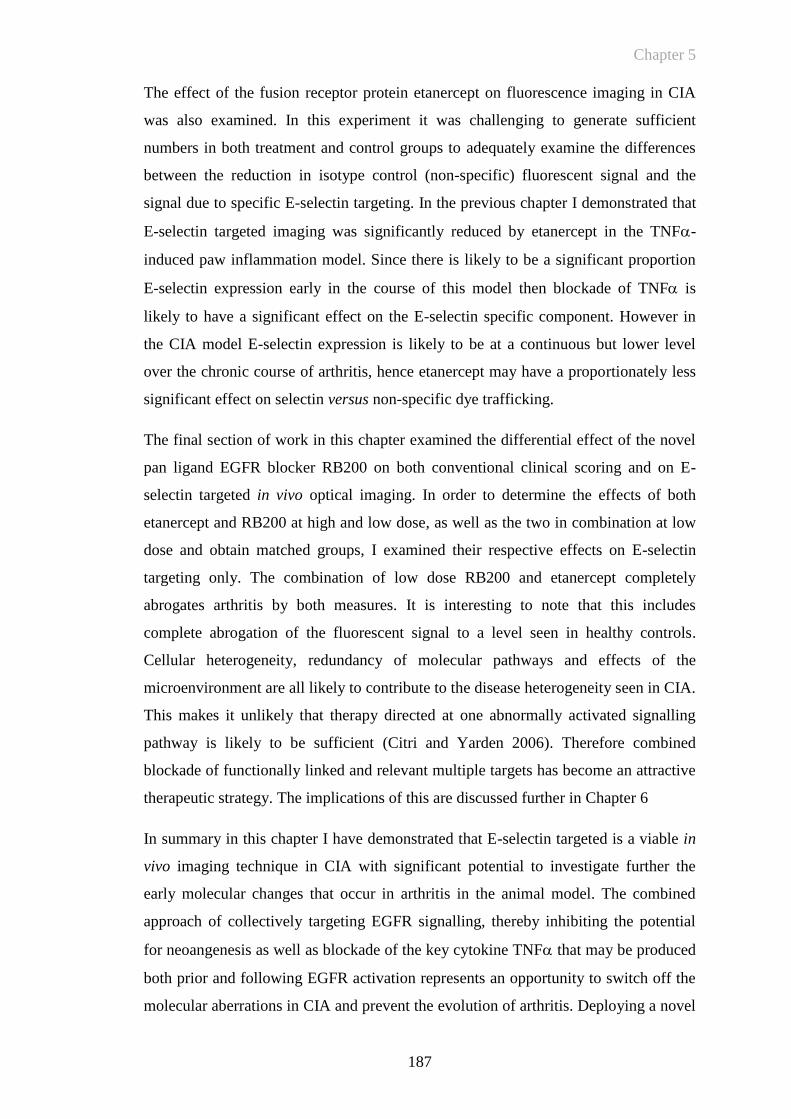
Chapter 5
187
The effect of the fusion receptor protein etanercept on fluorescence imaging in CIA
was also examined. In this experiment it was challenging to generate sufficient
numbers in both treatment and control groups to adequately examine the differences
between the reduction in isotype control (non-specific) fluorescent signal and the
signal due to specific E-selectin targeting. In the previous chapter I demonstrated that
E-selectin targeted imaging was significantly reduced by etanercept in the TNF-
induced paw inflammation model. Since there is likely to be a significant proportion
E-selectin expression early in the course of this model then blockade of TNF is
likely to have a significant effect on the E-selectin specific component. However in
the CIA model E-selectin expression is likely to be at a continuous but lower level
over the chronic course of arthritis, hence etanercept may have a proportionately less
significant effect on selectin versus non-specific dye trafficking.
The final section of work in this chapter examined the differential effect of the novel
pan ligand EGFR blocker RB200 on both conventional clinical scoring and on E-
selectin targeted in vivo optical imaging. In order to determine the effects of both
etanercept and RB200 at high and low dose, as well as the two in combination at low
dose and obtain matched groups, I examined their respective effects on E-selectin
targeting only. The combination of low dose RB200 and etanercept completely
abrogates arthritis by both measures. It is interesting to note that this includes
complete abrogation of the fluorescent signal to a level seen in healthy controls.
Cellular heterogeneity, redundancy of molecular pathways and effects of the
microenvironment are all likely to contribute to the disease heterogeneity seen in CIA.
This makes it unlikely that therapy directed at one abnormally activated signalling
pathway is likely to be sufficient (Citri and Yarden 2006). Therefore combined
blockade of functionally linked and relevant multiple targets has become an attractive
therapeutic strategy. The implications of this are discussed further in Chapter 6
In summary in this chapter I have demonstrated that E-selectin targeted is a viable in
vivo imaging technique in CIA with significant potential to investigate further the
early molecular changes that occur in arthritis in the animal model. The combined
approach of collectively targeting EGFR signalling, thereby inhibiting the potential
for neoangenesis as well as blockade of the key cytokine TNF that may be produced
both prior and following EGFR activation represents an opportunity to switch off the
molecular aberrations in CIA and prevent the evolution of arthritis. Deploying a novel

Chapter 5
188
molecular in vivo fluorescence imaging technique by targeting the endothelial
expression of E-selectin may also be a highly specific method of monitoring the
effects of dual targeted therapy.

Chapter 6
189
CHAPTER 6
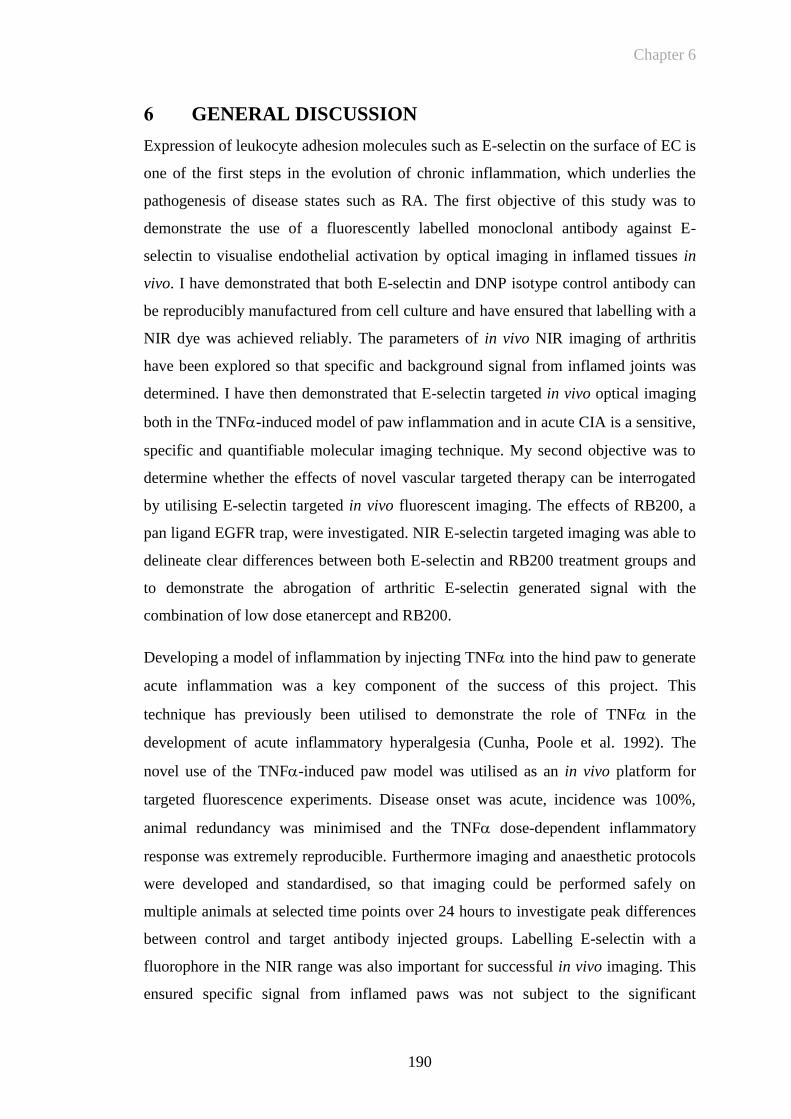
Chapter 6
190
6 GENERAL DISCUSSION
Expression of leukocyte adhesion molecules such as E-selectin on the surface of EC is
one of the first steps in the evolution of chronic inflammation, which underlies the
pathogenesis of disease states such as RA. The first objective of this study was to
demonstrate the use of a fluorescently labelled monoclonal antibody against E-
selectin to visualise endothelial activation by optical imaging in inflamed tissues in
vivo. I have demonstrated that both E-selectin and DNP isotype control antibody can
be reproducibly manufactured from cell culture and have ensured that labelling with a
NIR dye was achieved reliably. The parameters of in vivo NIR imaging of arthritis
have been explored so that specific and background signal from inflamed joints was
determined. I have then demonstrated that E-selectin targeted in vivo optical imaging
both in the TNF-induced model of paw inflammation and in acute CIA is a sensitive,
specific and quantifiable molecular imaging technique. My second objective was to
determine whether the effects of novel vascular targeted therapy can be interrogated
by utilising E-selectin targeted in vivo fluorescent imaging. The effects of RB200, a
pan ligand EGFR trap, were investigated. NIR E-selectin targeted imaging was able to
delineate clear differences between both E-selectin and RB200 treatment groups and
to demonstrate the abrogation of arthritic E-selectin generated signal with the
combination of low dose etanercept and RB200.
Developing a model of inflammation by injecting TNF into the hind paw to generate
acute inflammation was a key component of the success of this project. This
technique has previously been utilised to demonstrate the role of TNF in the
development of acute inflammatory hyperalgesia (Cunha, Poole et al. 1992). The
novel use of the TNF-induced paw model was utilised as an in vivo platform for
targeted fluorescence experiments. Disease onset was acute, incidence was 100%,
animal redundancy was minimised and the TNF dose-dependent inflammatory
response was extremely reproducible. Furthermore imaging and anaesthetic protocols
were developed and standardised, so that imaging could be performed safely on
multiple animals at selected time points over 24 hours to investigate peak differences
between control and target antibody injected groups. Labelling E-selectin with a
fluorophore in the NIR range was also important for successful in vivo imaging. This
ensured specific signal from inflamed paws was not subject to the significant
Chapter 6
191
autofluorescence that occurs when imaging at lower wavelengths (Fischer,
Gemeinhardt et al. 2006; Weissleder and Pittet 2008). Preliminary work demonstrated
that at lower wavelengths autofluorescence would be a major limiting factor in
detecting signal from a specific molecular target. Therefore imaging at higher
wavelengths e.g. in the NIR range has helped to increase the sensitivity of optical in
vivo imaging by decreasing background autofluorescence. The time course of NIR
fluorophore-labelled anti-E-selectin antibody binding over 6-8 hours in this model is
in keeping with previously found kinetics for E-selectin expression in vivo (Harari,
McHale et al. 1999). Measuring levels of signal from uninflamed paws determined
signal sensitivity (E-selectin antibody signal versus background), whereas comparing
anti-DNP control antibody injected groups to those injected with anti-E-selectin
antibody determined signal specificity. Subtracting background signal from
uninflamed paws from the signal obtained from inflamed paws was one method of
ensuring variations due to differences in injection volumes between animals were
excluded. Furthermore this refined model allowed for a considerable reduction in the
number of animals required for initial in vivo imaging techniques. Experiments could
be designed and performed rapidly and the incidence of inflammation within each
experiment was 100%. Consistent levels of paw swelling were also generated
following injection of TNFα into the footpad and this further reduced the number of
animals required. This adheres to the principles of good experimental practice for
humane experimental techniques that have been instituted and developed for
biomedical research in all specialties (Workman, Aboagye et al. 2010) This model
also provided useful information about the differences between non-specific
trafficking of dye labelled anti-DNP antibody compared to E-selectin targeted
imaging. TNF-driven acute inflammation by direct injection in the footpad is likely
to cause vascular permeability changes by upregulating a number of local pro-
inflammatory agents that lead to acute permeability changes in the vessels of the
mouse paw. Interestingly, the TNF paw injection model was originally developed
for investigating pain pathways in the foot. This is described further in Section 1.4.2.
Previous work on this and other similar models of acute inflammation in the footpad
have demonstrated that there may well be a significant neurogenic component to local
paw swelling. In particular the tachykinin neuropeptide substance P has been shown
to be a potent mediator of microvascular permeability. This is discussed further in the
introductory Section 1.2.4. It is therefore likely that both DNP and a proportion of E-
Chapter 6
192
selectin labelled antibodies have similar initial trafficking into the inflamed mouse
paw. Nevertheless, E-selectin upregulation (as demonstrated by
immunohistochemistry) leads to additional targeting of anti-E-selectin labelled
antibody as detected by fluorescence imaging. The differences between local or
regionalised specificity of dye antibody trafficking versus EC specific targeting are of
interest for both future molecular imaging as well as the potential for specific
targeting of the inflamed synovium to enhance local delivery of novel therapeutics.
The observations from the TNF-induced paw oedema model were then translated
into the murine heterologous CIA model. This has several similarities with RA,
including synovitis, pannus formation, erosion of cartilage and bone, fibrosis and joint
rigidity (Holmdahl, Jansson et al. 1986; Holmdahl, Andersson et al. 1989). Despite
much work in CIA focussing on disease pathways, the dynamic changes in leukocyte
expression remain poorly defined. Immunohistochemistry to detect expression of
antigens such as E-selectin, to inform on changes in leukocyte trafficking, can be
challenging and difficult to quantify. Hence, for this project novel techniques for paw
decalcification and specimen preparation were utilised to ensure that E-selectin and
the vascular marker CD31 could be detected. This demonstrated that E-selectin could
be detected at both early (day 2), mid (day 5), and late (day 10) of arthritis. When in
vivo imaging was applied in the CIA model, with close matching of clinical groups
for disease severity, E-selectin signal could be detected as early as 30 minutes and up
to 24 hours following antibody injection with significant correlation between E-
selectin and clinical score. In CIA, as was the case with the acute paw oedema model,
the differences between specific and non-specific trafficking of either anti-DNP or
anti-E-selectin dye labelled antibody are of interest. In the TNF-induced model,
early release of vasactive mediators following TNF injection generates acute
permeability change leading to both non-specific trafficking of antibody as well as
increased anti-E-selectin antibody binding as discussed above. However in the CIA
model, where arthritis is well established, there are also likely to be other factors as
well as expression of vasoactive substances that lead to ongoing permeability
changes. In established CIA the invading synovium is rich in neoangiogenic blood
vessels that have disordered architecture and increased vascular permeability . This is
likely to be similar to the permeability change that occurs in neoangiogenic tumour
blood vessels (McDonald and Baluk 2002). Primarily, the increased leakiness of
Chapter 6
193
pathologic neoangiogenic vessels compared to normal vessels, is therefore also likely
to play an important role in generating fluorescent signal in established CIA. The
initial investigations of E-selectin targeted in vivo optical imaging in CIA focussed on
analysing whether specific signal can be achieved compared to isotype control
antibody in animals with established arthritis. In these animals there does appear to be
ongoing E-selectin expression that can be detected by E-selectin targeted optical
imaging. However, I have also shown that there was increased E-selectin upregulation
in non-arthritic paws in these animals with no significant increase in anti-DNP
antibody targeted signal. This may suggest that there is either local or systemic
ongoing vascular activation in CIA which does not lead to substantial local
permeability change (since this change would be represented by increased levels of
control antibody signal due to non-specific macromolecular leakage into the inflamed
synovium). Further analysis of these groups including histological correlation would
be required to verify that this in vivo imaging technique could be used to investigate
the differences between E-selectin upregulation and permeability change during the
course of CIA. Analysis of anti-E-selectin binding prior to disease onset would also
provide important details about early vascular changes occurring during the inception
of arthritis. The disease heterogeneity seen in CIA to a degree reflects the complex
pattern of disease seen in RA, which is characterised by more complex patterns of
joint involvement and relative sparing of some joints, such as the distal
interphalangeal joints in the hands. The reasons for tissue specific differences in
disease expression and vascular permeability in RA or indeed in the animal model
have not been fully elucidated but could be addressed further with vascular targeted
optical imaging. More recent investigations into the mechanisms that may underlie
joint specific inflammation have indicated that there are tissue specific cell adhesion
molecules and vascular ‘addressins’, in addition to chemokine-receptor interactions
(Pitzalis and Garrood 2006). In addition other evidence suggests that arthritogenic
antibody transfer from K/BxN mice causes local macromolecular vasopermeability
(Binstadt, Patel et al. 2006). This is also discussed in Section 1.2.4 in relation to the
general permeability changes that occur due to the realease of local vasoactive amines
and due to the pathologic architecture of neoangenic vessels.
Few studies have investigated the changes in vascular permeability that occur in RA
and other inflammatory diseases. One early study performed by Jayson and colleagues
Chapter 6
194
in 1971 did analyse the rate of tissue fluid formation in the forearms of patients with
RA, demonstrating that there were increases in the rate of oedema formation that was
independent to pre-existing therapy (Jayson and Barks 1971). There are however clear
differences between CIA and RA. Arthritis in the mouse paw occurs in association
with oedema of the whole mouse paw – it is this change that is readily detected by
fluorescent imaging where there is a linear correlation between paw swelling and
mean fluorescent signal. In RA there may be localised joint swelling, but not swelling
of the whole hand or foot. RA is also characterised by significant levels of bone
marrow oedema that occurs at both early and established phases of disease.
Longitudinal MRI analysis of bone marrow oedema in the wrists of patients with RA
has been demonstrated to predict erosive progression (Palosaari, Vuotila et al. 2006).
Bone marrow oedema (i.e. increased water content in the trabecular bone) can also be
a non-specific and reversible finding that is frequently seen in patients following
trauma and other conditions such as OA. Detecting differences between non-specific
oedematous changes and those associated with progression to inflammatory joint
disease would clearly be helpful. There are limitations to the current system since
oedema from different tissues can only be viewed in two dimensions. But the facility
to co-register images with digital X-rays of the target region further helped delineate
anatomical localisation of fluorescence signal has been explored in this study. This
helped to identify signal in specific areas such as around the ankle and forefoot joints.
The ability to co-register images using different modalities such as optical and X-ray
imaging is likely to be of significant use when using novel imaging platforms to
detect underlying pathological molecular changes in arthritis. A multimodal
nanoparticle contrast agent containing embedded luminophores and surface
immobilised gadolinium chelates has been developed as a contrast agent for inflamed
synovium in CIA (Kim, An et al. 2009). Multimodal imaging in a heterogeneous
model such as CIA is likely to be of significant use so that accurate comparisons in
individual animals can be made.
The detection of subclinical activation in CIA may be useful for other reasons. Firstly,
it may be that this can be developed as a method of detecting very early arthritis.
Interestingly this compares with similar findings when radiolabelled E-selectin was
used to image endothelial activation in RA and found to image specifically some
clinically silent joints (Chapman, Jamar et al. 1996). Secondly, the detection of
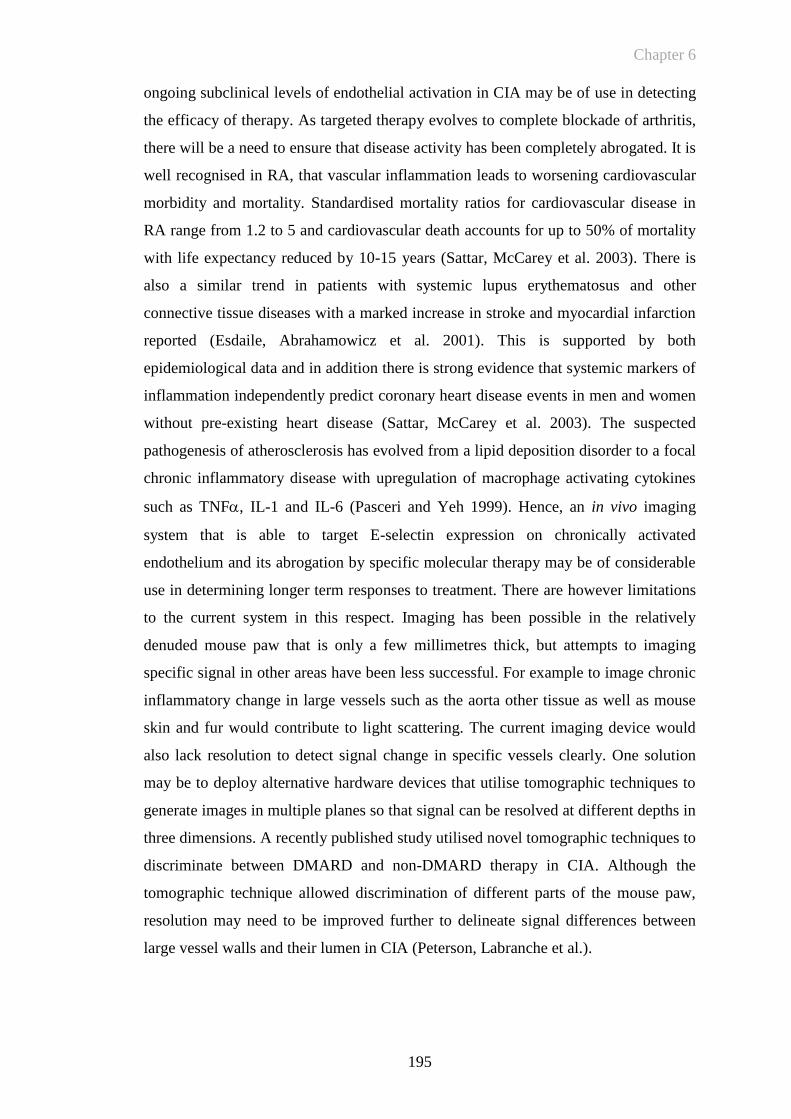
Chapter 6
195
ongoing subclinical levels of endothelial activation in CIA may be of use in detecting
the efficacy of therapy. As targeted therapy evolves to complete blockade of arthritis,
there will be a need to ensure that disease activity has been completely abrogated. It is
well recognised in RA, that vascular inflammation leads to worsening cardiovascular
morbidity and mortality. Standardised mortality ratios for cardiovascular disease in
RA range from 1.2 to 5 and cardiovascular death accounts for up to 50% of mortality
with life expectancy reduced by 10-15 years (Sattar, McCarey et al. 2003). There is
also a similar trend in patients with systemic lupus erythematosus and other
connective tissue diseases with a marked increase in stroke and myocardial infarction
reported (Esdaile, Abrahamowicz et al. 2001). This is supported by both
epidemiological data and in addition there is strong evidence that systemic markers of
inflammation independently predict coronary heart disease events in men and women
without pre-existing heart disease (Sattar, McCarey et al. 2003). The suspected
pathogenesis of atherosclerosis has evolved from a lipid deposition disorder to a focal
chronic inflammatory disease with upregulation of macrophage activating cytokines
such as TNF, IL-1 and IL-6 (Pasceri and Yeh 1999). Hence, an in vivo imaging
system that is able to target E-selectin expression on chronically activated
endothelium and its abrogation by specific molecular therapy may be of considerable
use in determining longer term responses to treatment. There are however limitations
to the current system in this respect. Imaging has been possible in the relatively
denuded mouse paw that is only a few millimetres thick, but attempts to imaging
specific signal in other areas have been less successful. For example to image chronic
inflammatory change in large vessels such as the aorta other tissue as well as mouse
skin and fur would contribute to light scattering. The current imaging device would
also lack resolution to detect signal change in specific vessels clearly. One solution
may be to deploy alternative hardware devices that utilise tomographic techniques to
generate images in multiple planes so that signal can be resolved at different depths in
three dimensions. A recently published study utilised novel tomographic techniques to
discriminate between DMARD and non-DMARD therapy in CIA. Although the
tomographic technique allowed discrimination of different parts of the mouse paw,
resolution may need to be improved further to delineate signal differences between
large vessel walls and their lumen in CIA (Peterson, Labranche et al.).
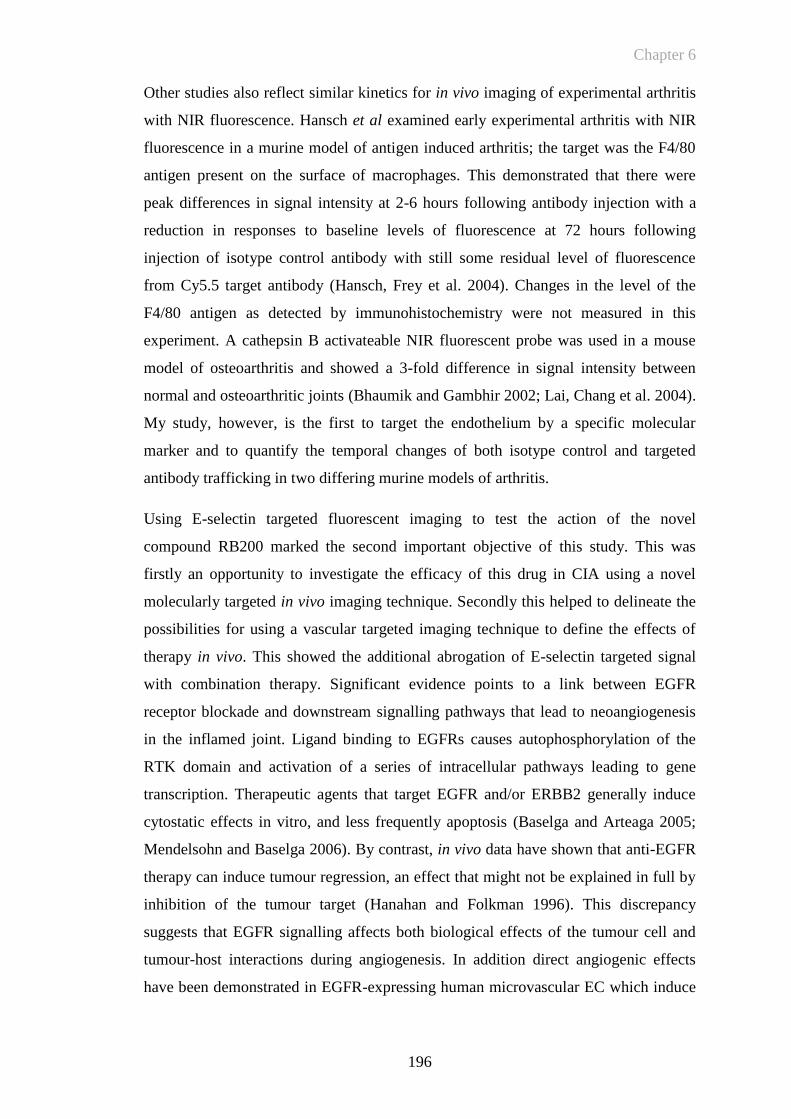
Chapter 6
196
Other studies also reflect similar kinetics for in vivo imaging of experimental arthritis
with NIR fluorescence. Hansch et al examined early experimental arthritis with NIR
fluorescence in a murine model of antigen induced arthritis; the target was the F4/80
antigen present on the surface of macrophages. This demonstrated that there were
peak differences in signal intensity at 2-6 hours following antibody injection with a
reduction in responses to baseline levels of fluorescence at 72 hours following
injection of isotype control antibody with still some residual level of fluorescence
from Cy5.5 target antibody (Hansch, Frey et al. 2004). Changes in the level of the
F4/80 antigen as detected by immunohistochemistry were not measured in this
experiment. A cathepsin B activateable NIR fluorescent probe was used in a mouse
model of osteoarthritis and showed a 3-fold difference in signal intensity between
normal and osteoarthritic joints (Bhaumik and Gambhir 2002; Lai, Chang et al. 2004).
My study, however, is the first to target the endothelium by a specific molecular
marker and to quantify the temporal changes of both isotype control and targeted
antibody trafficking in two differing murine models of arthritis.
Using E-selectin targeted fluorescent imaging to test the action of the novel
compound RB200 marked the second important objective of this study. This was
firstly an opportunity to investigate the efficacy of this drug in CIA using a novel
molecularly targeted in vivo imaging technique. Secondly this helped to delineate the
possibilities for using a vascular targeted imaging technique to define the effects of
therapy in vivo. This showed the additional abrogation of E-selectin targeted signal
with combination therapy. Significant evidence points to a link between EGFR
receptor blockade and downstream signalling pathways that lead to neoangiogenesis
in the inflamed joint. Ligand binding to EGFRs causes autophosphorylation of the
RTK domain and activation of a series of intracellular pathways leading to gene
transcription. Therapeutic agents that target EGFR and/or ERBB2 generally induce
cytostatic effects in vitro, and less frequently apoptosis (Baselga and Arteaga 2005;
Mendelsohn and Baselga 2006). By contrast, in vivo data have shown that anti-EGFR
therapy can induce tumour regression, an effect that might not be explained in full by
inhibition of the tumour target (Hanahan and Folkman 1996). This discrepancy
suggests that EGFR signalling affects both biological effects of the tumour cell and
tumour-host interactions during angiogenesis. In addition direct angiogenic effects
have been demonstrated in EGFR-expressing human microvascular EC which induce
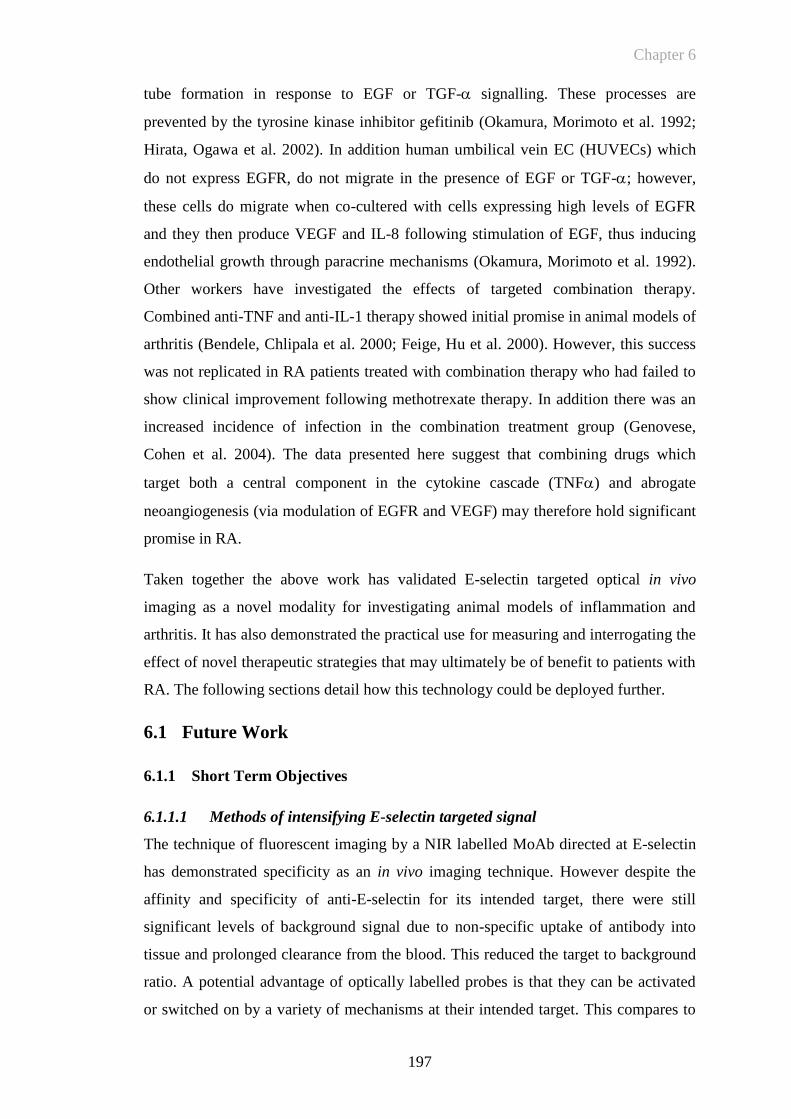
Chapter 6
197
tube formation in response to EGF or TGF- signalling. These processes are
prevented by the tyrosine kinase inhibitor gefitinib (Okamura, Morimoto et al. 1992;
Hirata, Ogawa et al. 2002). In addition human umbilical vein EC (HUVECs) which
do not express EGFR, do not migrate in the presence of EGF or TGF-; however,
these cells do migrate when co-cultered with cells expressing high levels of EGFR
and they then produce VEGF and IL-8 following stimulation of EGF, thus inducing
endothelial growth through paracrine mechanisms (Okamura, Morimoto et al. 1992).
Other workers have investigated the effects of targeted combination therapy.
Combined anti-TNF and anti-IL-1 therapy showed initial promise in animal models of
arthritis (Bendele, Chlipala et al. 2000; Feige, Hu et al. 2000). However, this success
was not replicated in RA patients treated with combination therapy who had failed to
show clinical improvement following methotrexate therapy. In addition there was an
increased incidence of infection in the combination treatment group (Genovese,
Cohen et al. 2004). The data presented here suggest that combining drugs which
target both a central component in the cytokine cascade (TNF) and abrogate
neoangiogenesis (via modulation of EGFR and VEGF) may therefore hold significant
promise in RA.
Taken together the above work has validated E-selectin targeted optical in vivo
imaging as a novel modality for investigating animal models of inflammation and
arthritis. It has also demonstrated the practical use for measuring and interrogating the
effect of novel therapeutic strategies that may ultimately be of benefit to patients with
RA. The following sections detail how this technology could be deployed further.
6.1 Future Work
6.1.1 Short Term Objectives
6.1.1.1 Methods of intensifying E-selectin targeted signal
The technique of fluorescent imaging by a NIR labelled MoAb directed at E-selectin
has demonstrated specificity as an in vivo imaging technique. However despite the
affinity and specificity of anti-E-selectin for its intended target, there were still
significant levels of background signal due to non-specific uptake of antibody into
tissue and prolonged clearance from the blood. This reduced the target to background
ratio. A potential advantage of optically labelled probes is that they can be activated
or switched on by a variety of mechanisms at their intended target. This compares to
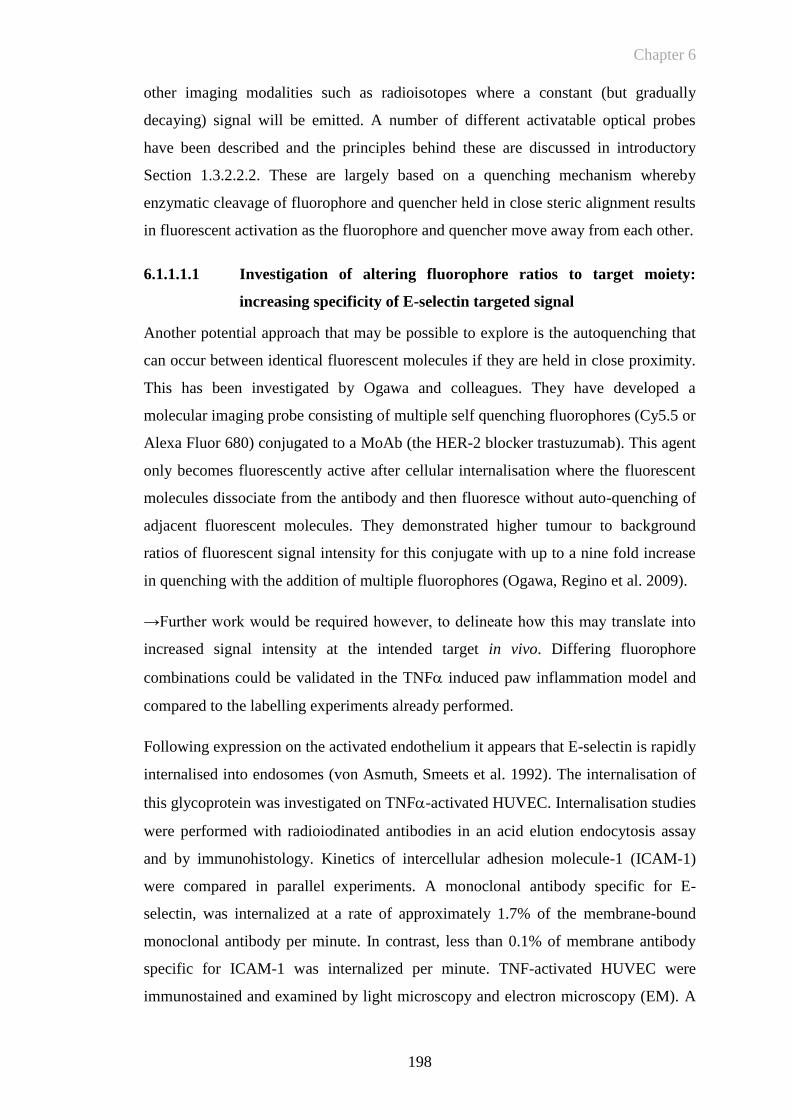
Chapter 6
198
other imaging modalities such as radioisotopes where a constant (but gradually
decaying) signal will be emitted. A number of different activatable optical probes
have been described and the principles behind these are discussed in introductory
Section 1.3.2.2.2. These are largely based on a quenching mechanism whereby
enzymatic cleavage of fluorophore and quencher held in close steric alignment results
in fluorescent activation as the fluorophore and quencher move away from each other.
6.1.1.1.1 Investigation of altering fluorophore ratios to target moiety:
increasing specificity of E-selectin targeted signal
Another potential approach that may be possible to explore is the autoquenching that
can occur between identical fluorescent molecules if they are held in close proximity.
This has been investigated by Ogawa and colleagues. They have developed a
molecular imaging probe consisting of multiple self quenching fluorophores (Cy5.5 or
Alexa Fluor 680) conjugated to a MoAb (the HER-2 blocker trastuzumab). This agent
only becomes fluorescently active after cellular internalisation where the fluorescent
molecules dissociate from the antibody and then fluoresce without auto-quenching of
adjacent fluorescent molecules. They demonstrated higher tumour to background
ratios of fluorescent signal intensity for this conjugate with up to a nine fold increase
in quenching with the addition of multiple fluorophores (Ogawa, Regino et al. 2009).
→Further work would be required however, to delineate how this may translate into
increased signal intensity at the intended target in vivo. Differing fluorophore
combinations could be validated in the TNF induced paw inflammation model and
compared to the labelling experiments already performed.
Following expression on the activated endothelium it appears that E-selectin is rapidly
internalised into endosomes (von Asmuth, Smeets et al. 1992). The internalisation of
this glycoprotein was investigated on TNF-activated HUVEC. Internalisation studies
were performed with radioiodinated antibodies in an acid elution endocytosis assay
and by immunohistology. Kinetics of intercellular adhesion molecule-1 (ICAM-1)
were compared in parallel experiments. A monoclonal antibody specific for E-
selectin, was internalized at a rate of approximately 1.7% of the membrane-bound
monoclonal antibody per minute. In contrast, less than 0.1% of membrane antibody
specific for ICAM-1 was internalized per minute. TNF-activated HUVEC were
immunostained and examined by light microscopy and electron microscopy (EM). A
Chapter 6
199
study by Subramaniam and colleagues demonstrated that P- and E-selectins are
internalised differently following their expression (Subramaniam, Koedam et al.
1993). The endocytosis pattern visualised by immunofluorescent staining in this paper
are very similar to those seen following stimulation of PY4.1 cells with TNF at 4
hours as described in Section 3.3.4.2.
→The physiological significance of E-selectin internalization compared to the
internalisation of a novel conjugated probe in the regulation of E-selectin membrane
expression and clearance of E-selectin from the circulation would require further
investigation. Similarly if multiple fluorophores were placed on the antibody the
pharmokinetics and clearance of the novel conjugate would also require verification.
6.1.1.1.2 Labeling to minimal E-selectin antibody fragment
Labelling to a fragment of antibody can have advantages since the clearance from the
blood pool may be quicker than a full sized monoclonal antibody. This may help to
increase background to target levels. In addition antibody imaging methods can be
problematic due to nonspecific adhesion, the human anti-mouse antibody (HAMA)
response and uncertainty in the labelling site, which may interfere with the
biospecificity. To investigate these properties, an anti E-selectin Fab fragment has
been utilised to demonstrate that 99m
Tc-anti-E-selectin Fab scintigraphy can be used
successfully to image synovitis with improved specificity than 99m
Tc-HDP bone
scanning (Jamar, Houssiau et al. 2002). Other approaches include using humanised or
chimeric monoclonal antibodies or smaller fragments such as single-chain variable
fragment antibodies (sFV) which can be produced by bacterial systems (Huston,
George et al. 1996). These are minimal antibody binding sites engineered as single
polypeptide chains. The sFv can be as small as 26 kDa monomers or can be
engineered as larger fusion proteins designed to self associate into dimeric or
multimeric species. They typically exhibit rapid clearance that results in high
targeting specificity within a matter of hours. In this study Huston and colleagues
compared different modes of administration (i.v. and i.p) of radiolabelled sFVs to
investigate their biodistribution and targeting properties. Administration by either the
i.p. or i.v. route showed comparable long-term retention in the circulation, but the i.v.
route showed an initially high peak blood level while i.p. injection did not. As with a
single sFv dose, repeated bolus injections of sFv attained high target-to-background
Chapter 6
200
ratios, whereas continuous sFv infusion reached a steady state level of free sFv in
blood and kidney that exceeded that in tumor xenografts.
→Investigation of the biokinetics of sFVs for fluorescent imaging in arthritis would
also warrant investigation to determine whether this conferred additional accelerated
clearance and targeting properties.
6.1.1.1.3 Labelling to other smaller targeted molecules – aptamer based
technology
As oligonucleotide ligands, aptamers are comparable to antibodies in specificity and
affinity for their target molecule, typically a protein (Gold, Polisky et al. 1995;
Famulok and Mayer 1999). At 8-15 kDa, aptamers are intermediate in size between
antibodies (150 kDa) and small peptides (15 kDa) and are slightly smaller than sFv
(25 kDa). As polyanions, aptamers are quite different in composition from sFv. As
synthetic molecules, aptamers readily support site-specific modifications that
maintain structure and activity. Aptamers can be coupled to diagnostic or therapeutic
agents and to bioconjugates, such as polyethyleneglycol (PEG) polymers, that can
alter aptamer pharmacokinetics. The parameters for the in vivo activity of aptamers
have been investigated in rats with an aptamer directed against L-selectin (Watson,
Chang et al. 2000). Previous therapeutic work with aptamers has focused on blocking
protein function; by far the most advanced work is represented by the use of a
vascular endothelial growth factor aptamer, pegaptanib sodium (Macugen; Pfizer and
Eyetech) (Ruckman, Green et al. 1998), now approved for treatment of macular
degeneration (Csaky 2003). The small size and polyanionic nature of aptamers may
lead to rapid blood clearance and tissue uptake and may minimize the residence in
liver and kidney, providing some potentially useful features for imaging and
radiotherapy. Initial experiments to address aptamer suitability for in vivo imaging
have been reported (Charlton, Sennello et al. 1997; Hicke, Stephens et al. 2006).
→Comparing the kinetics of optical in vivo targeted single chain dye labelled
molecules to alternative targets such as aptamer based technology may therefore be a
useful way of optimising inflamed/arthritic signal to background ratio thereby
maximising signal specificity.
Chapter 6
201
6.1.1.1.4 Indocyanine green (ICG) as an optical imaging agent
Another method of achieving a greater ratio of specific targeting has also been
deployed by Ogawa and colleagues. This utilises some of the unique spectral
properties of indocyanine green (ICG). This is already routinely used in the clinic for
retinal angiography (Slakter, Yannuzzi et al. 1995) and liver function testing
(Cherrick, Stein et al. 1960; Weissleder and Ntziachristos 2003). Most recently, ICG
has been tested for use during liver cancer surgery by two groups to identify small and
macroscopically unidentifiable liver cancers in real time which were confirmed
microscopically (Gotoh, Yamada et al. 2009; Ishizawa, Fukushima et al. 2009). ICG
has also been tested in the real time identification of sentinel lymph nodes in small
numbers of breast cancer patients (Sevick-Muraca, Sharma et al. 2008; Tagaya,
Yamazaki et al. 2008; Troyan, Kianzad et al. 2009). As ICG is non-targeted, however,
a small number of false positives were detected (Ishizawa, Fukushima et al. 2009).
Conjugation of ICG to a molecule that would enable tumour-specific targeting would
reduce this. However, ICG’s use as a conjugated NIR probe is limited as upon protein
binding, fluorescence is lost. In an animal model, this property was exploited by
conjugation with antibodies to CD25 which upon CD25 positive tumour cell binding
become internalised leading to catabolism in lysosomes, with release of fluorescence
from unbound ICG (Ogawa, Kosaka et al. 2009). ICG unbound to a target has been
used to detect arthritis in a rat model of arthritis. This demonstrated that native dye
was able to provide a significant increase in the fluorescent signal of arthritic joints
compared to baseline values (Meier, Krug et al. 2010). Several translational optical
imaging devices have recently been introduced to the clinic. This includes a custom
built ICG enhanced optical imaging device that has recently been shown by Fischer et
al to correlate well to MRI changes in the detection of pathological change in RA
(Fischer, Ebert et al.). Five patients and a corresponding number of normal controls
were studied using 0.1mg/kg by body weight of ICG as an unconjugated non-specific
contrast agent. Fluorescence images were acquired continuously over a 15 minute
period. Findings were also compared directly to contrast enhanced MR images taken
concurrently. This demonstrated that ICG levels were increased in inflammatory
joints although specific sensitivity and specificity was not clearly defined. They did
conclude however, that NIR imaging was limited to the finger and foot joints because
the strong scattering and absorption of light would preclude imaging beyond a few

Chapter 6
202
centimetres of tissue depth. The specificity could be amplified beyond this by
conjugating fluorescent dye to a particular target such as E-selectin.
→A possible longer term goal of this work would be to consider targeting activated
endothelium in humans by linking ICG to E-selectin and constructing the conjugate so
that it could dissociate following internalisation into endosomes where the emission
wavelength would increase into the NIR range. Because both the human E-selectin
antibody and fluorophore are approved for human administration, the likelihood of
clinical translation may be improved. The resulting conjugate may well have different
toxicities to the individual molecules, however the presence of two approved agents in
the conjugate bodes well for its eventual clearance for human use.
6.1.1.1.5 Use of alternative imaging hardware
The challenge of overcoming light scattering and propagation for the imaging of deep
joints and tissues remains to be resolved (Ntziachristos, Ripoll et al. 2002). This issue
may not pose such a great problem for imaging distal joint disease. One of the major
limitations of optical imaging is the loss of signal specificity due to light scattering.
Although this may be decreased by imaging peripheral arthritis such as the mouse
paw, this factor can potentially limit analysis of more proximal joints such as the knee
or deeper tissues. This can be overcome by use of more intense dyes or by
maximising the sensitivity of the optical imaging device. Advances in imaging
methods that offer novel ways of visualizing and quantifying fluorescent signal will
also have significant impact on fluorescent in vivo imaging techniques (Ntziachristos
2006) and many of these may be very useful for the future imaging of arthritis.
→Novel imaging techniques and systems could readily be analysed using the TNF
induced paw model for rapid turnover of experiments and validation of initial results
from novel imaging platforms. For example exploring the specific signal returned
from novel tomographic techniques for optical imaging would help to further
determine the potential of this system to generate additional in vivo molecular
information.
6.1.1.2 Alternative animal models
While CIA has served as an important model for investigating the aetiopathogenesis
of RA, and for developing new treatments, it is not identical to RA. An ideal in vivo
model of human synovitis would include human synovium but be readily available in
Chapter 6
203
an animal host for study of the cellular mechanisms of disease and for assessment of
novel molecular targets.
Investigating the in vivo action of novel conjugates on RA synovium in the animal
model is possible by examining the action of agents on rheumatoid synovial tissue
transplanted into severe combined immunodeficient (SCID) mice. The SCID model,
with defects in both humoral and cell-mediated immunity, can serve as a recipient for
grafts derived from numerous human tissues (McCune, Namikawa et al. 1988). In this
particular RA model synovial grafts are implanted subcutaneously. The transplants
remain viable and become vascularised by mouse subdermal vessels. There are
connections between the mouse and transplant vasculature, with the transplant
vasculature maintaining the ability to express human cell adhesion molecules (Wahid,
Blades et al. 2000). This model has provided direct evidence that intragraft injection
of TNF upregulates the expression of human microvascular EC adhesion molecules.
The model has also been used for investigating the use of NanoSPECT/CT imaging in
the animal model. This has demonstrated that this imaging platform can be both
sensitive and specific for the detection of 111
In-labelled anti-E-selectin or isotype
control antibody.
→Hence novel human E-selectin targeted imaging agents with differing fluorophore
combinations could be tested following direct stimulation of the grafts with TNF
over an acute time period, (similar to the way that TNF injections into the paw have
been used as an acute model of inflammation for initial optical imaging experiments).
→This model has also been used for the identification of novel synovium-specific
peptides by in vivo phage display selection (Lee, Buckley et al. 2002). It may be
possible to compare the honing of these peptides to either the E-selectin or a minimal
E-selectin fragment (sFV). With the latter being of comparable size to novel
synovium specific peptides. It would then also be possible to generate a control for
both novel fluorescently conjugated molecules for in vivo validation.
6.1.2 Long Term Future Work and Clinical Perspectives
The work suggested above has indicated that optical imaging in humans may hold
potential. As optical imaging becomes more targeted through the use of specific
antibodies, activateable probes, as well as brighter, more photostable dyes, human
targeted fluorescence optical imaging is a realistic possibility. Indeed, non-specific

Chapter 6
204
optical imaging of patients with RA has already taken place with some initial optical
imaging studies undertaken following the injection of ICG into patients with RA as
described above. The addition of TNF blockade to the therapeutic armamentarium
for patients with RA has had a revolutionary impact on the treatment of both RA and
other inflammatory diseases with differing molecular approaches used to target TNF
(Isaacs 2009). This has paved the way for many other agents other than TNF
blockade to be validated as therapeutic agents, but there still remains considerable
uncertainty about which individual patients will respond to any particular treatment
(Feldmann, Williams et al.). Increasingly as further agents become clinically available
the complexity of individual treatment plans for patients with RA is likely to increase.
Biomarkers are therefore required that enable both the early diagnosis of RA and help
to identify particular patients that may respond positively to tailored biological
therapy. Furthermore early synovitis destined to develop into RA is characterised by a
distinct and transient cytokine profile that may be different to that in established
disease (Raza, Falciani et al. 2005). There is much need therefore, to determine how
levels of cytokines and other inflammatory mediators change during the evolution of
disease both systemically and in local sites of inflammation. It is the latter that will be
most amenable to examination by novel bioimaging techniques such as optical
imaging. With the added molecular perspective to diagnosis, this may translate into
improved targeting of treatments to particular patients depending on the phenotype of
the disease thereby helping to determine appropriate treatment.
E-selectin represents an excellent molecular imaging target in humans. E-selectin can
be expressed at low levels in uninflamed tissue including synovial tissue (Fairburn,
Kunaver et al. 1993) but is upregulated in inflammatory synovitis (Kriegsmann,
Keyszer et al. 1995) and reduced following anti-TNF therapy (Paleolog, Hunt et al.
1996; Tak, Taylor et al. 1996). It is also expressed on activated endothelium of
patients with a variety of other inflammatory conditions (Bevilacqua and Nelson
1993). Understanding the kinetics of trafficking of specific versus non-specific
molecules to sites of inflammation in vivo can provide useful therapeutic information.
For example, given there is a substantial proportion of antibody that tracks to sites of
inflammation that is non targeted, it might be better to administer antibody targeted
therapy prior to other immunomodulating drugs that decrease joint swelling in order
to enhance local drug delivery to inflamed areas.
Chapter 6
205
6.2 Conclusion
In summary, I have shown that E-selectin targeted imaging of joints of mice with
inflammatory arthritis using fluorescently labelled anti-E-selectin is feasible in vivo.
Furthermore, I have applied fluorescence imaging to investigate the in vivo mode of
action of vascular-targeted therapies in murine inflammatory arthritis.
In summary E-selectin targeted in vivo optical imaging is an effective quantifiable
imaging technique that is likely to be of significant use in the animal model and has
potential to be translated into the clinic for targeted optical imaging of patients with
arthritis and other inflammatory conditions. Utilising a targeted optical imaging
technique to visualise endothelial activation during the evolution of inflammation in
conditions such as RA will further assist in understanding disease pathogenesis and
developing novel therapies.

References
206
REFERENCES
References
207
Adams, B. K., H. M. Al Attia, et al. (2001). "99Tc(m) nanocolloid scintigraphy: a
reliable way to detect active joint disease in patients with peripheral joint
pain." Nucl Med Commun 22(3): 315-8.
Adams, K. E., S. Ke, et al. (2007). "Comparison of visible and near-infrared
wavelength-excitable fluorescent dyes for molecular imaging of cancer." J
Biomed Opt 12(2): 024017.
Albelda, S. M., P. D. Oliver, et al. (1990). "EndoCAM: a novel endothelial cell-cell
adhesion molecule." J Cell Biol 110(4): 1227-37.
Amin, M. A., P. J. Mansfield, et al. (2007). "Interleukin-18 induces angiogenic factors
in rheumatoid arthritis synovial tissue fibroblasts via distinct signaling
pathways." Arthritis Rheum 56(6): 1787-97.
Andersson, S. E., A. Johansson, et al. (1998). "Physiological characterization of
mBSA antigen induced arthritis in the rat. II. Joint blood flow, glucose
metabolism, and cell proliferation." J Rheumatol 25(9): 1778-84.
Arzu Gencoglu, E., G. Aras, et al. (2003). "Comparison of Tc-99m HIG and three-
phase Tc-99m MDP bone scintigraphy for evaluating the efficacy of Yttrium-
90 silicate radionuclide synovectomy." Clin Nucl Med 28(4): 277-85.
Ballara, S., P. C. Taylor, et al. (2001). "Raised serum vascular endothelial growth
factor levels are associated with destructive change in inflammatory arthritis."
Arthritis Rheum 44(9): 2055-64.
Ballou, B., G. W. Fisher, et al. (1995). "Tumor labeling in vivo using cyanine-
conjugated monoclonal antibodies." Cancer Immunol Immunother 41(4): 257-
63.
Barrera, P., W. J. Oyen, et al. (2003). "Scintigraphic detection of tumour necrosis
factor in patients with rheumatoid arthritis." Ann Rheum Dis 62(9): 825-8.
Barrera, P., C. J. van der Laken, et al. (2000). "Radiolabelled interleukin-1 receptor
antagonist for detection of synovitis in patients with rheumatoid arthritis."
Rheumatology (Oxford) 39(8): 870-4.
Baselga, J. and C. L. Arteaga (2005). "Critical update and emerging trends in
epidermal growth factor receptor targeting in cancer." J Clin Oncol 23(11):
2445-59.
Baselga, J., D. Tripathy, et al. (1996). "Phase II study of weekly intravenous
recombinant humanized anti-p185HER2 monoclonal antibody in patients with
HER2/neu-overexpressing metastatic breast cancer." J Clin Oncol 14(3): 737-
44.
Bates, D. O., R. I. Heald, et al. (2001). "Vascular endothelial growth factor increases
Rana vascular permeability and compliance by different signalling pathways."
J Physiol 533(Pt 1): 263-72.
Beckers, C., X. Jeukens, et al. (2006). "(18)F-FDG PET imaging of rheumatoid knee
synovitis correlates with dynamic magnetic resonance and sonographic
assessments as well as with the serum level of metalloproteinase-3." Eur J
Nucl Med Mol Imaging 33(3): 275-80.
Beckers, C., C. Ribbens, et al. (2004). "Assessment of disease activity in rheumatoid
arthritis with (18)F-FDG PET." J Nucl Med 45(6): 956-64.
Bendele, A. M., E. S. Chlipala, et al. (2000). "Combination benefit of treatment with
the cytokine inhibitors interleukin-1 receptor antagonist and PEGylated
soluble tumor necrosis factor receptor type I in animal models of rheumatoid
arthritis." Arthritis Rheum 43(12): 2648-59.
Bevilacqua, M., E. Butcher, et al. (1991). "Selectins: a family of adhesion receptors."
Cell 67(2): 233.
Bevilacqua, M. P. and R. M. Nelson (1993). "Selectins." J Clin Invest 91(2): 379-87.
References
208
Bevilacqua, M. P., J. S. Pober, et al. (1987). "Identification of an inducible
endothelial-leukocyte adhesion molecule." Proc Natl Acad Sci U S A 84(24):
9238-42.
Bevilacqua, M. P., J. S. Pober, et al. (1985). "Interleukin 1 acts on cultured human
vascular endothelium to increase the adhesion of polymorphonuclear
leukocytes, monocytes, and related leukocyte cell lines." J Clin Invest 76(5):
2003-11.
Bevilacqua, M. P., S. Stengelin, et al. (1989). "Endothelial leukocyte adhesion
molecule 1: an inducible receptor for neutrophils related to complement
regulatory proteins and lectins." Science 243(4895): 1160-5.
Bhaumik, S. and S. S. Gambhir (2002). "Optical imaging of Renilla luciferase
reporter gene expression in living mice." Proc Natl Acad Sci U S A 99(1):
377-82.
Bhushan, M., T. O. Bleiker, et al. (2002). "Anti-E-selectin is ineffective in the
treatment of psoriasis: a randomized trial." Br J Dermatol 146(5): 824-31.
Binns, R. M., S. T. Licence, et al. (1996). "In vivo E-selectin upregulation correlates
early with infiltration of PMN, later with PBL entry: MAbs block both." Am J
Physiol 270(1 Pt 2): H183-93.
Binns, R. M., S. T. Licence, et al. (1992). "Active lymphocyte traffic induced in the
periphery by cytokines and phytohemagglutinin: three different mechanisms?"
Eur J Immunol 22(9): 2195-203.
Binns, R. M., A. Whyte, et al. (1996). "The role of E-selectin in lymphocyte and
polymorphonuclear cell recruitment into cutaneous delayed hypersensitivity
reactions in sensitized pigs." J Immunol 157(9): 4094-9.
Binstadt, B. A., P. R. Patel, et al. (2006). "Particularities of the vasculature can
promote the organ specificity of autoimmune attack." Nat Immunol 7(3): 284-
92.
Biswal, S., D. L. Resnick, et al. (2007). "Molecular imaging: integration of molecular
imaging into the musculoskeletal imaging practice." Radiology 244(3): 651-
71.
Blann, A. D., A. Herrick, et al. (1995). "Altered levels of soluble adhesion molecules
in rheumatoid arthritis, vasculitis and systemic sclerosis." Br J Rheumatol
34(9): 814-9.
Blum, G., G. von Degenfeld, et al. (2007). "Noninvasive optical imaging of cysteine
protease activity using fluorescently quenched activity-based probes." Nat
Chem Biol 3(10): 668-77.
Blum, G., R. M. Weimer, et al. (2009). "Comparative assessment of substrates and
activity based probes as tools for non-invasive optical imaging of cysteine
protease activity." PLoS One 4(7): e6374.
Brahn, E., D. J. Peacock, et al. (1992). "Effects of tumor necrosis factor alpha (TNF-
alpha) on collagen arthritis." Lymphokine Cytokine Res 11(5): 253-6.
Breedveld, F. C., C. Han, et al. (2005). "Association between baseline radiographic
damage and improvement in physical function after treatment of patients with
rheumatoid arthritis." Ann Rheum Dis 64(1): 52-5.
Brennan, F. M., D. Chantry, et al. (1989). "Inhibitory effect of TNF alpha antibodies
on synovial cell interleukin-1 production in rheumatoid arthritis." Lancet
2(8657): 244-7.
Bresnihan, B., J. M. Alvaro-Gracia, et al. (1998). "Treatment of rheumatoid arthritis
with recombinant human interleukin-1 receptor antagonist." Arthritis Rheum
41(12): 2196-204.
References
209
Bublil, E. M. and Y. Yarden (2007). "The EGF receptor family: spearheading a
merger of signaling and therapeutics." Curr Opin Cell Biol 19(2): 124-34.
Buch, M. and P. Emery (2002). "The aetiology and pathogenesis of rheumatoid
arthritis." Hospital Pharmacist 9: 5-10.
Buch, M. H., E. M. Vital, et al. (2008). "Abatacept in the treatment of rheumatoid
arthritis." Arthritis Res Ther 10 Suppl 1: S5.
Butcher, E. C. (1991). "Leukocyte-endothelial cell recognition: three (or more) steps
to specificity and diversity." Cell 67(6): 1033-6.
Butler, D. M., R. N. Maini, et al. (1995). "Modulation of proinflammatory cytokine
release in rheumatoid synovial membrane cell cultures. Comparison of
monoclonal anti TNF-alpha antibody with the interleukin-1 receptor
antagonist." Eur Cytokine Netw 6(4): 225-30.
Campos, M. M., G. E. Souza, et al. (1998). "Modulation of kinin B1 but not B2
receptors-mediated rat paw edema by IL-1beta and TNFalpha." Peptides
19(7): 1269-76.
Cao, T., N. P. Gerard, et al. (1999). "Use of NK(1) knockout mice to analyze
substance P-induced edema formation." Am J Physiol 277(2 Pt 2): R476-81.
Cao, T., E. Pinter, et al. (2000). "Neurokinin-1 receptor agonists are involved in
mediating neutrophil accumulation in the inflamed, but not normal, cutaneous
microvasculature: an in vivo study using neurokinin-1 receptor knockout
mice." J Immunol 164(10): 5424-9.
Carmeliet, P. (2000). "Mechanisms of angiogenesis and arteriogenesis." Nat Med
6(4): 389-95.
Carmeliet, P. (2003). "Angiogenesis in health and disease." Nat Med 9(6): 653-60.
Carson, C. W., L. D. Beall, et al. (1994). "Soluble E-selectin is increased in
inflammatory synovial fluid." J Rheumatol 21(4): 605-11.
Chapman, P. T., F. Jamar, et al. (1994). "Noninvasive imaging of E-selectin
expression by activated endothelium in urate crystal-induced arthritis."
Arthritis Rheum 37(12): 1752-6.
Chapman, P. T., F. Jamar, et al. (1996). "Use of a radiolabeled monoclonal antibody
against E-selectin for imaging of endothelial activation in rheumatoid
arthritis." Arthritis Rheum 39(8): 1371-5.
Charlton, J., J. Sennello, et al. (1997). "In vivo imaging of inflammation using an
aptamer inhibitor of human neutrophil elastase." Chem Biol 4(11): 809-16.
Chen, J., C. H. Tung, et al. (2005). "Near-infrared fluorescent imaging of matrix
metalloproteinase activity after myocardial infarction." Circulation 111(14):
1800-5.
Chen, J., C. H. Tung, et al. (2002). "In vivo imaging of proteolytic activity in
atherosclerosis." Circulation 105(23): 2766-71.
Chen, W. T., U. Mahmood, et al. (2005). "Arthritis imaging using a near-infrared
fluorescence folate-targeted probe." Arthritis Res Ther 7(2): R310-7.
Cherrick, G. R., S. W. Stein, et al. (1960). "Indocyanine green: observations on its
physical properties, plasma decay, and hepatic extraction." J Clin Invest 39:
592-600.
Choy, E. H. and G. S. Panayi (2001). "Cytokine pathways and joint inflammation in
rheumatoid arthritis." N Engl J Med 344(12): 907-16.
Citri, A. and Y. Yarden (2006). "EGF-ERBB signalling: towards the systems level."
Nat Rev Mol Cell Biol 7(7): 505-16.
Cohen, S., E. Hurd, et al. (2002). "Treatment of rheumatoid arthritis with anakinra, a
recombinant human interleukin-1 receptor antagonist, in combination with
References
210
methotrexate: results of a twenty-four-week, multicenter, randomized, double-
blind, placebo-controlled trial." Arthritis Rheum 46(3): 614-24.
Cohnheim (1889). "Lectures on General Pathology: A Handbook for Practitioners and
Students."
Colville-Nash, P. R. and D. L. Scott (1992). "Angiogenesis and rheumatoid arthritis:
pathogenic and therapeutic implications." Ann Rheum Dis 51(7): 919-25.
Contag, C. H., P. R. Contag, et al. (1995). "Photonic detection of bacterial pathogens
in living hosts." Mol Microbiol 18(4): 593-603.
Corkill, M. M., B. W. Kirkham, et al. (1991). "Gold treatment of rheumatoid arthritis
decreases synovial expression of the endothelial leukocyte adhesion receptor
ELAM-1." J Rheumatol 18(10): 1453-60.
Courtenay, J. S., M. J. Dallman, et al. (1980). "Immunisation against heterologous
type II collagen induces arthritis in mice." Nature 283(5748): 666-8.
Crockett-Torabi, E. (1998). "Selectins and mechanisms of signal transduction." J
Leukoc Biol 63(1): 1-14.
Csaky, K. (2003). "Anti-vascular endothelial growth factor therapy for neovascular
age-related macular degeneration: promises and pitfalls." Ophthalmology
110(5): 879-81.
Cunha, F. Q., S. Poole, et al. (1992). "The pivotal role of tumour necrosis factor alpha
in the development of inflammatory hyperalgesia." Br J Pharmacol 107(3):
660-4.
Cunha, T. M., W. A. Verri, Jr., et al. (2008). "Crucial role of neutrophils in the
development of mechanical inflammatory hypernociception." J Leukoc Biol
83(4): 824-32.
Dams, E. T., W. J. Oyen, et al. (2000). "99mTc-PEG liposomes for the scintigraphic
detection of infection and inflammation: clinical evaluation." J Nucl Med
41(4): 622-30.
Dean, J. A. (1992). lange's handbook of chemistry, McCraw Hill.
Deguchi, J. O., M. Aikawa, et al. (2006). "Inflammation in atherosclerosis: visualizing
matrix metalloproteinase action in macrophages in vivo." Circulation 114(1):
55-62.
Denk, W., J. H. Strickler, et al. (1990). "Two-photon laser scanning fluorescence
microscopy." Science 248(4951): 73-6.
Desaulniers, M., A. Fuks, et al. (1974). "Radiotechnetium polyphosphate joint
imaging." J Nucl Med 15(6): 417-23.
Di Rosa, M., Giroud, J.P, Willoughby, D.A (1971). "Studies of mediators of acute
inflammatory responses induced in rats in different sites by carrageenin and
turpentine." J pathol 104: 15-21.
Di Rosa, M., J. M. Papadimitriou, et al. (1971). "A histopathological and
pharmacological analysis of the mode of action of nonsteroidal anti-
inflammatory drugs." J Pathol 105(4): 239-56.
Di Rosa, M., Willoughby, D.A. (1971). "Screens for anti inflammatory drugs." J
Pharm. Pharmacol. 23: 297-300.
Diaz, R., P. A. Nguewa, et al. "Antitumor and antiangiogenic effect of the dual EGFR
and HER-2 tyrosine kinase inhibitor lapatinib in a lung cancer model." BMC
Cancer 10(1): 188.
Doherty, J. K., C. Bond, et al. (1999). "The HER-2/neu receptor tyrosine kinase gene
encodes a secreted autoinhibitor." Proc Natl Acad Sci U S A 96(19): 10869-
74.
Drickamer, K. (1988). "Two distinct classes of carbohydrate-recognition domains in
animal lectins." J Biol Chem 263(20): 9557-60.
References
211
Dubois, N. A., L. C. Kolpack, et al. (1991). "Isolation and characterization of an
established endothelial cell line from transgenic mouse hemangiomas." Exp
Cell Res 196(2): 302-13.
Edwards, J. C. and G. Cambridge (2001). "Sustained improvement in rheumatoid
arthritis following a protocol designed to deplete B lymphocytes."
Rheumatology (Oxford) 40(2): 205-11.
Edwards, J. C., L. Szczepanski, et al. (2004). "Efficacy of B-cell-targeted therapy
with rituximab in patients with rheumatoid arthritis." N Engl J Med 350(25):
2572-81.
Elliott, M. J., R. N. Maini, et al. (1994). "Randomised double-blind comparison of
chimeric monoclonal antibody to tumour necrosis factor alpha (cA2) versus
placebo in rheumatoid arthritis." Lancet 344(8930): 1105-10.
Elliott, M. J., R. N. Maini, et al. (1993). "Treatment of rheumatoid arthritis with
chimeric monoclonal antibodies to tumor necrosis factor alpha." Arthritis
Rheum 36(12): 1681-90.
Esdaile, J. M., M. Abrahamowicz, et al. (2001). "Traditional Framingham risk factors
fail to fully account for accelerated atherosclerosis in systemic lupus
erythematosus." Arthritis Rheum 44(10): 2331-7.
Everts, M., S. A. Asgeirsdottir, et al. (2003). "Comparison of E-selectin expression at
mRNA and protein levels in murine models of inflammation." Inflamm Res
52(12): 512-8.
Fairburn, K., M. Kunaver, et al. (1993). "Intercellular adhesion molecules in normal
synovium." Br J Rheumatol 32(4): 302-6.
Famulok, M. and G. Mayer (1999). "Aptamers as tools in molecular biology and
immunology." Curr Top Microbiol Immunol 243: 123-36.
Fassbender, H. G. and M. Simmling-Annefeld (1983). "The potential aggressiveness
of synovial tissue in rheumatoid arthritis." J Pathol 139(3): 399-406.
Fassbender, K., T. Bertsch, et al. (1999). "Adhesion molecules in cerebrovascular
diseases. Evidence for an inflammatory endothelial activation in cerebral
large- and small-vessel disease." Stroke 30(8): 1647-50.
Fava, R. A., N. J. Olsen, et al. (1994). "Vascular permeability factor/endothelial
growth factor (VPF/VEGF): accumulation and expression in human synovial
fluids and rheumatoid synovial tissue." J Exp Med 180(1): 341-6.
Feige, U., Y. L. Hu, et al. (2000). "Anti-interleukin-1 and anti-tumor necrosis factor-
alpha synergistically inhibit adjuvant arthritis in Lewis rats." Cell Mol Life Sci
57(10): 1457-70.
Feldmann, M., F. M. Brennan, et al. (1996). "Rheumatoid arthritis." Cell 85(3): 307-
10.
Feldmann, M., F. M. Brennan, et al. (1996). "Role of cytokines in rheumatoid
arthritis." Annu Rev Immunol 14: 397-440.
Feldmann, M. and R. N. Maini (2003). "Lasker Clinical Medical Research Award.
TNF defined as a therapeutic target for rheumatoid arthritis and other
autoimmune diseases." Nat Med 9(10): 1245-50.
Feldmann, M., R. O. Williams, et al. "What have we learnt from targeted anti-TNF
therapy?" Ann Rheum Dis 69 Suppl 1: i97-99.
Fidarova, E. F., E. El-Emir, et al. (2008). "Microdistribution of targeted, fluorescently
labeled anti-carcinoembryonic antigen antibody in metastatic colorectal
cancer: implications for radioimmunotherapy." Clin Cancer Res 14(9): 2639-
46.
References
212
Figueiredo, J. L., H. Alencar, et al. (2006). "Near infrared thoracoscopy of tumoral
protease activity for improved detection of peripheral lung cancer." Int J
Cancer 118(11): 2672-7.
Fischer, T., B. Ebert, et al. "Detection of rheumatoid arthritis using non-specific
contrast enhanced fluorescence imaging." Acad Radiol 17(3): 375-81.
Fischer, T., I. Gemeinhardt, et al. (2006). "Assessment of unspecific near-infrared
dyes in laser-induced fluorescence imaging of experimental arthritis." Acad
Radiol 13(1): 4-13.
FitzGerald, O. and B. Bresnihan (1995). "Synovial membrane cellularity and
vascularity." Annals of the Rheumatic Diseases 54 511-515.
FitzGerald, O., M. Soden, et al. (1991). "Morphometric analysis of blood vessels in
synovial membranes obtained from clinically affected and unaffected knee
joints of patients with rheumatoid arthritis." Ann Rheum Dis 50(11): 792-6.
Fogelman, I. (1980). "Skeletal uptake of diphosphonate: a review." Eur J Nucl Med
5(6): 473-6.
Ford, W. L. and J. L. Gowans (1969). "The traffic of lymphocytes." Semin Hematol
6(1): 67-83.
Frijns, C. J., L. J. Kappelle, et al. (1997). "Soluble adhesion molecules reflect
endothelial cell activation in ischemic stroke and in carotid atherosclerosis."
Stroke 28(11): 2214-8.
Furchgott, R. F. and J. V. Zawadzki (1980). "The obligatory role of endothelial cells
in the relaxation of arterial smooth muscle by acetylcholine." Nature
288(5789): 373-6.
Gabay, C., L. Marinova-Mutafchieva, et al. (2001). "Increased production of
intracellular interleukin-1 receptor antagonist type I in the synovium of mice
with collagen-induced arthritis: a possible role in the resolution of arthritis."
Arthritis Rheum 44(2): 451-62.
Gado, K. and G. Gigler (1991). "Zymosan inflammation: a new method suitable for
evaluating new antiinflammatory drugs." Agents Actions 32(1-2): 119-21.
Gallatin, W. M., I. L. Weissman, et al. (1983). "A cell-surface molecule involved in
organ-specific homing of lymphocytes." Nature 304(5921): 30-4.
Garrood, T., M. Blades, et al. (2009). "A novel model for the pre-clinical imaging of
inflamed human synovial vasculature." Rheumatology (Oxford) 48(8): 926-31.
Genovese, M. C., S. Cohen, et al. (2004). "Combination therapy with etanercept and
anakinra in the treatment of patients with rheumatoid arthritis who have been
treated unsuccessfully with methotrexate." Arthritis Rheum 50(5): 1412-9.
Genovese, M. C., J. D. McKay, et al. (2008). "Interleukin-6 receptor inhibition with
tocilizumab reduces disease activity in rheumatoid arthritis with inadequate
response to disease-modifying antirheumatic drugs: the tocilizumab in
combination with traditional disease-modifying antirheumatic drug therapy
study." Arthritis Rheum 58(10): 2968-80.
Giatromanolaki, A., E. Sivridis, et al. (2001). "The angiogenic pathway "vascular
endothelial growth factor/flk-1(KDR)-receptor" in rheumatoid arthritis and
osteoarthritis." The Journal of Pathology 194: 101-108.
Gill, S. C. and P. H. von Hippel (1989). "Calculation of protein extinction coefficients
from amino acid sequence data." Anal Biochem 182(2): 319-26.
Gleysteen, J. P., J. R. Newman, et al. (2008). "Fluorescent labeled anti-EGFR
antibody for identification of regional and distant metastasis in a preclinical
xenograft model." Head Neck 30(6): 782-9.
Gold, L., B. Polisky, et al. (1995). "Diversity of oligonucleotide functions." Annu Rev
Biochem 64: 763-97.
References
213
Goldman, C. K., J. Kim, et al. (1993). "Epidermal growth factor stimulates vascular
endothelial growth factor production by human malignant glioma cells: a
model of glioblastoma multiforme pathophysiology." Mol Biol Cell 4(1): 121-
33.
Gotoh, K., T. Yamada, et al. (2009). "A novel image-guided surgery of hepatocellular
carcinoma by indocyanine green fluorescence imaging navigation." J Surg
Oncol 100(1): 75-9.
Gounaris, E., C. H. Tung, et al. (2008). "Live imaging of cysteine-cathepsin activity
reveals dynamics of focal inflammation, angiogenesis, and polyp growth."
PLoS One 3(8): e2916.
Graves, B. J., R. L. Crowther, et al. (1994). "Insight into E-selectin/ligand interaction
from the crystal structure and mutagenesis of the lec/EGF domains." Nature
367(6463): 532-8.
Guillemin, F., L. Billot, et al. (2005). "Reproducibility and sensitivity to change of 5
methods for scoring hand radiographic damage in patients with rheumatoid
arthritis." J Rheumatol 32(5): 778-86.
Hahne, M., U. Jager, et al. (1993). "Five tumor necrosis factor-inducible cell adhesion
mechanisms on the surface of mouse endothelioma cells mediate the binding
of leukocytes." J Cell Biol 121(3): 655-64.
Hallbeck, A. L., T. M. Walz, et al. (2005). "TGF-alpha and ErbB2 production in
synovial joint tissue: increased expression in arthritic joints." Scand J
Rheumatol 34(3): 204-11.
Hanahan, D. and J. Folkman (1996). "Patterns and emerging mechanisms of the
angiogenic switch during tumorigenesis." Cell 86(3): 353-64.
Hansch, A., O. Frey, et al. (2004). "Diagnosis of arthritis using near-infrared
fluorochrome Cy5.5." Invest Radiol 39(10): 626-32.
Hansch, A., O. Frey, et al. (2004). "In vivo imaging of experimental arthritis with
near-infrared fluorescence." Arthritis Rheum 50(3): 961-7.
Hansch, A., D. Sauner, et al. (2003). "Noninvasive diagnosis of arthritis by
autofluorescence." Invest Radiol 38(9): 578-83.
Hansen, A., A. Kumar, et al. (2004). "Evaluation of cardioprotective effects of
recombinant soluble P-selectin glycoprotein ligand-immunoglobulin in
myocardial ischemia-reperfusion injury by real-time myocardial contrast
echocardiography." J Am Coll Cardiol 44(4): 887-91.
Harari, O. A., D. Marshall, et al. (2001). "Limited endothelial E- and P-selectin
expression in MRL/lpr lupus-prone mice." Rheumatology (Oxford) 40(8):
889-95.
Harari, O. A., J. F. McHale, et al. (1999). "Endothelial cell E- and P-selectin up-
regulation in murine contact sensitivity is prolonged by distinct mechanisms
occurring in sequence." J Immunol 163(12): 6860-6.
Harris, J. M. and R. B. Chess (2003). "Effect of pegylation on pharmaceuticals." Nat
Rev Drug Discov 2(3): 214-21.
Haworth, C., F. M. Brennan, et al. (1991). "Expression of granulocyte-macrophage
colony-stimulating factor in rheumatoid arthritis: regulation by tumor necrosis
factor-alpha." Eur J Immunol 21(10): 2575-9.
Helfgott, S., L. Rosenthall, et al. (1982). "Generalized skeletal response to
99mtechnetium methylene diphosphonate in rheumatoid arthritis." J
Rheumatol 9(6): 939-41.
Herschman, H. R. (2003). "Molecular imaging: looking at problems, seeing
solutions." Science 302(5645): 605-8.
References
214
Heyward, S. A., N. Dubois-Stringfellow, et al. (1995). "Expression and inducibility of
vascular adhesion receptors in development." FASEB J 9(10): 956-62.
Hicke, B. J., A. W. Stephens, et al. (2006). "Tumor targeting by an aptamer." J Nucl
Med 47(4): 668-78.
Hirata, A., S. Ogawa, et al. (2002). "ZD1839 (Iressa) induces antiangiogenic effects
through inhibition of epidermal growth factor receptor tyrosine kinase."
Cancer Res 62(9): 2554-60.
Hodgson, R. J., P. O'Connor, et al. (2008). "MRI of rheumatoid arthritis image
quantitation for the assessment of disease activity, progression and response to
therapy." Rheumatology (Oxford) 47(1): 13-21.
Holmdahl, R., M. E. Andersson, et al. (1989). "Collagen induced arthritis as an
experimental model for rheumatoid arthritis. Immunogenetics, pathogenesis
and autoimmunity." Apmis 97(7): 575-84.
Holmdahl, R., R. Bockermann, et al. (2002). "The molecular pathogenesis of
collagen-induced arthritis in mice--a model for rheumatoid arthritis." Ageing
Res Rev 1(1): 135-47.
Holmdahl, R., L. Jansson, et al. (1990). "Arthritis in DBA/1 mice induced with
passively transferred type II collagen immune serum. Immunohistopathology
and serum levels of anti-type II collagen auto-antibodies." Scand J Immunol
31(2): 147-57.
Holmdahl, R., L. Jansson, et al. (1986). "Homologous type II collagen induces
chronic and progressive arthritis in mice." Arthritis Rheum 29(1): 106-13.
Hsu-Lin, S., C. L. Berman, et al. (1984). "A platelet membrane protein expressed
during platelet activation and secretion. Studies using a monoclonal antibody
specific for thrombin-activated platelets." J Biol Chem 259(14): 9121-6.
Huang, Z., C. Brdlik, et al. (2009). "A pan-HER approach for cancer therapy:
background, current status and future development." Expert Opin Biol Ther
9(1): 97-110.
Huber, L. C., P. Kunzler, et al. (2008). "Effects of a novel tyrosine kinase inhibitor in
rheumatoid arthritis synovial fibroblasts." Ann Rheum Dis 67(3): 389-94.
Huston, J. S., A. J. George, et al. (1996). "Single-chain Fv radioimmunotargeting." Q
J Nucl Med 40(3): 320-33.
Hynes, N. E. and H. A. Lane (2005). "ERBB receptors and cancer: the complexity of
targeted inhibitors." Nat Rev Cancer 5(5): 341-54.
Inglis, J. J., G. Criado, et al. (2007). "Collagen-induced arthritis in C57BL/6 mice is
associated with a robust and sustained T-cell response to type II collagen."
Arthritis Res Ther 9(5): R113.
Inglis, J. J., E. Simelyte, et al. (2008). "Protocol for the induction of arthritis in
C57BL/6 mice." Nat Protoc 3(4): 612-8.
Isaacs, J. D. (2009). "Antibody engineering to develop new antirheumatic therapies."
Arthritis Res Ther 11(3): 225.
Ishizawa, T., N. Fukushima, et al. (2009). "Real-time identification of liver cancers by
using indocyanine green fluorescent imaging." Cancer 115(11): 2491-504.
Izmailova, E. S., N. Paz, et al. (2007). "Use of molecular imaging to quantify
response to IKK-2 inhibitor treatment in murine arthritis." Arthritis Rheum
56(1): 117-28.
Izquierdo, E., J. D. Canete, et al. (2009). "Immature blood vessels in rheumatoid
synovium are selectively depleted in response to anti-TNF therapy." PLoS
One 4(12): e8131.
References
215
Jaffe, E. A., R. L. Nachman, et al. (1973). "Culture of human endothelial cells derived
from umbilical veins. Identification by morphologic and immunologic
criteria." J Clin Invest 52(11): 2745-56.
Jamar, F., P. T. Chapman, et al. (1997). "A comparison between 111In-anti-E-selectin
mAb and 99Tcm-labelled human non-specific immunoglobulin in
radionuclide imaging of rheumatoid arthritis." Br J Radiol 70(833): 473-81.
Jamar, F., F. A. Houssiau, et al. (2002). "Scintigraphy using a technetium 99m-
labelled anti-E-selectin Fab fragment in rheumatoid arthritis." Rheumatology
(Oxford) 41(1): 53-61.
Jayson, M. I. and J. S. Barks (1971). "Oedema in rheumatoid arthritis: changes in the
coefficient of capillary filtration." Br Med J 2(5761): 555-7.
Jiang, T., E. S. Olson, et al. (2004). "Tumor imaging by means of proteolytic
activation of cell-penetrating peptides." Proc Natl Acad Sci U S A 101(51):
17867-72.
Jin, P., J. Zhang, et al. (2009). "Rational optimization of a bispecific ligand trap
targeting EGF receptor family ligands." Mol Med 15(1-2): 11-20.
Johnston, G. I., R. G. Cook, et al. (1989). "Cloning of GMP-140, a granule membrane
protein of platelets and endothelium: sequence similarity to proteins involved
in cell adhesion and inflammation." Cell 56(6): 1033-44.
Johnston, J. B., S. Navaratnam, et al. (2006). "Targeting the EGFR pathway for
cancer therapy." Curr Med Chem 13(29): 3483-92.
Jorissen, R. N., F. Walker, et al. (2003). "Epidermal growth factor receptor:
mechanisms of activation and signalling." Exp Cell Res 284(1): 31-53.
Joyce, J. A., A. Baruch, et al. (2004). "Cathepsin cysteine proteases are effectors of
invasive growth and angiogenesis during multistage tumorigenesis." Cancer
Cell 5(5): 443-53.
Kameda, H., H. Ishigami, et al. (2006). "Imatinib mesylate inhibits proliferation of
rheumatoid synovial fibroblast-like cells and phosphorylation of Gab adapter
proteins activated by platelet-derived growth factor." Clin Exp Immunol
144(2): 335-41.
Kaushal, S., M. K. McElroy, et al. (2008). "Fluorophore-conjugated anti-CEA
antibody for the intraoperative imaging of pancreatic and colorectal cancer." J
Gastrointest Surg 12(11): 1938-50.
Kavanaugh, A., J. S. Smolen, et al. (2009). "Effect of certolizumab pegol with
methotrexate on home and work place productivity and social activities in
patients with active rheumatoid arthritis." Arthritis Rheum 61(11): 1592-600.
Kaya, M., H. Tuna, et al. (2004). "(99m)Tc-dextran scintigraphy to detect disease
activity in patients with rheumatoid arthritis." Nucl Med Commun 25(6): 597-
601.
Keeble, J., M. Blades, et al. (2005). "The role of substance P in microvascular
responses in murine joint inflammation." Br J Pharmacol 144(8): 1059-66.
Keelan, E. T., A. A. Harrison, et al. (1994). "Imaging vascular endothelial activation:
an approach using radiolabeled monoclonal antibodies against the endothelial
cell adhesion molecule E-selectin." J Nucl Med 35(2): 276-81.
Keelan, E. T., S. T. Licence, et al. (1994). "Characterization of E-selectin expression
in vivo with use of a radiolabeled monoclonal antibody." Am J Physiol 266(1
Pt 2): H278-90.
Kelloff, G. J., K. A. Krohn, et al. (2005). "The progress and promise of molecular
imaging probes in oncologic drug development." Clin Cancer Res 11(22):
7967-85.
References
216
Keystone, E., D. Heijde, et al. (2008). "Certolizumab pegol plus methotrexate is
significantly more effective than placebo plus methotrexate in active
rheumatoid arthritis: findings of a fifty-two-week, phase III, multicenter,
randomized, double-blind, placebo-controlled, parallel-group study." Arthritis
Rheum 58(11): 3319-29.
Keystone, E. C., M. C. Genovese, et al. (2009). "Golimumab, a human antibody to
tumour necrosis factor {alpha} given by monthly subcutaneous injections, in
active rheumatoid arthritis despite methotrexate therapy: the GO-FORWARD
Study." Ann Rheum Dis 68(6): 789-96.
Keystone, E. C., H. U. Schorlemmer, et al. (1977). "Zymosan-induced arthritis: a
model of chronic proliferative arthritis following activation of the alternative
pathway of complement." Arthritis Rheum 20(7): 1396-1401.
Kidd, B. L., J. J. Inglis, et al. (2003). "Inhibition of inflammation and hyperalgesia in
NK-1 receptor knock-out mice." Neuroreport 14(17): 2189-92.
Kim, J. S., H. An, et al. (2009). "Multimodal optical and Gd-based nanoparticles for
imaging in inflammatory arthritis." Clin Exp Rheumatol 27(4): 580-6.
Kimball, E. S. and J. L. Gross (1991). "Angiogenesis in pannus formation." Agents
Actions 34(3-4): 329-31.
Klareskog, L., J. Ronnelid, et al. (2008). "Immunity to citrullinated proteins in
rheumatoid arthritis." Annu Rev Immunol 26: 651-75.
Klareskog, L., P. Stolt, et al. (2006). "A new model for an etiology of rheumatoid
arthritis: smoking may trigger HLA-DR (shared epitope)-restricted immune
reactions to autoantigens modified by citrullination." Arthritis Rheum 54(1):
38-46.
Koch, A. E., J. C. Burrows, et al. (1991). "Immunolocalization of endothelial and
leukocyte adhesion molecules in human rheumatoid and osteoarthritic
synovial tissues." Lab Invest 64(3): 313-20.
Koch, A. E., M. M. Halloran, et al. (1995). "Angiogenesis mediated by soluble forms
of E-selectin and vascular cell adhesion molecule-1." Nature 376(6540): 517-
9.
Koch, A. E., L. A. Harlow, et al. (1994). "Vascular endothelial growth factor. A
cytokine modulating endothelial function in rheumatoid arthritis." J Immunol
152(8): 4149-56.
Konecny, G. E., Y. G. Meng, et al. (2004). "Association between HER-2/neu and
vascular endothelial growth factor expression predicts clinical outcome in
primary breast cancer patients." Clin Cancer Res 10(5): 1706-16.
Kovar, J. L., M. A. Johnson, et al. (2006). "Hyaluronidase expression induces prostate
tumor metastasis in an orthotopic mouse model." Am J Pathol 169(4): 1415-
26.
Kovar, J. L., M. A. Simpson, et al. (2007). "A systematic approach to the
development of fluorescent contrast agents for optical imaging of mouse
cancer models." Anal Biochem 367(1): 1-12.
Koyama, Y., Y. Hama, et al. (2007). "Spectral fluorescence molecular imaging of
lung metastases targeting HER2/neu." Clin Cancer Res 13(10): 2936-45.
Kriegsmann, J., G. M. Keyszer, et al. (1995). "Expression of E-selectin messenger
RNA and protein in rheumatoid arthritis." Arthritis Rheum 38(6): 750-4.
Kulka, J. P., D. Bocking, et al. (1955). "Early joint lesions of rheumatoid arthritis;
report of eight cases, with knee biopsies of lesions of less than one year's
duration." AMA Arch Pathol 59(2): 129-50.
Kumar, P., S. Hosaka, et al. (2001). "Soluble E-selectin induces monocyte chemotaxis
through Src family tyrosine kinases." J Biol Chem 276(24): 21039-45.
References
217
Kumar, R. and R. Yarmand-Bagheri (2001). "The role of HER2 in angiogenesis."
Semin Oncol 28(5 Suppl 16): 27-32.
Kusada, J., T. Otsuka, et al. (1993). "Immuno-reactive human epidermal growth
factor (h-EGF) in rheumatoid synovial fluids." Nippon Seikeigeka Gakkai
Zasshi 67(9): 859-65.
Kuuliala, A., K. Eberhardt, et al. (2002). "Circulating soluble E-selectin in early
rheumatoid arthritis: a prospective five year study." Ann Rheum Dis 61(3):
242-6.
Lai, W. F., C. H. Chang, et al. (2004). "Early diagnosis of osteoarthritis using
cathepsin B sensitive near-infrared fluorescent probes." Osteoarthritis
Cartilage 12(3): 239-44.
Lang, A., D. Horler, et al. (2000). "The relative importance of cysteine peptidases in
osteoarthritis." J Rheumatol 27(8): 1970-9.
Lasky, L. A., M. S. Singer, et al. (1989). "Cloning of a lymphocyte homing receptor
reveals a lectin domain." Cell 56(6): 1045-55.
Lee, D. M. and M. E. Weinblatt (2001). "Rheumatoid arthritis." THE LANCET 358:
903-911.
Lee, L., C. Buckley, et al. (2002). "Identification of synovium-specific homing
peptides by in vivo phage display selection." Arthritis Rheum 46(8): 2109-20.
Lefer, D. J. (2000). "Pharmacology of selectin inhibitors in ischemia/reperfusion
states." Annu Rev Pharmacol Toxicol 40: 283-94.
Levick, J. R. (1981). "Permeability of rheumatoid and normal human synovium to
specific plasma proteins." Arthritis Rheum 24(12): 1550-60.
Levine, J. D., S. J. Dardick, et al. (1986). "Contribution of sensory afferents and
sympathetic efferents to joint injury in experimental arthritis." J Neurosci
6(12): 3423-9.
Ley, K. and G. S. Kansas (2004). "Selectins in T-cell recruitment to non-lymphoid
tissues and sites of inflammation." Nat Rev Immunol 4(5): 325-35.
Lipsky, P. E. (2007). "Why does rheumatoid arthritis involve the joints?" N Engl J
Med 356(23): 2419-20.
Lipsky, P. E., D. M. van der Heijde, et al. (2000). "Infliximab and methotrexate in the
treatment of rheumatoid arthritis. Anti-Tumor Necrosis Factor Trial in
Rheumatoid Arthritis with Concomitant Therapy Study Group." N Engl J Med
343(22): 1594-602.
Lisy, M. R., A. Goermar, et al. (2008). "In vivo near-infrared fluorescence imaging of
carcinoembryonic antigen-expressing tumor cells in mice." Radiology 247(3):
779-87.
Lo, S. K., S. Lee, et al. (1991). "Endothelial-leukocyte adhesion molecule 1 stimulates
the adhesive activity of leukocyte integrin CR3 (CD11b/CD18, Mac-1, alpha
m beta 2) on human neutrophils." J Exp Med 173(6): 1493-500.
Lobb, R., G. Chi-Rosso, et al. (1991). "Expression and functional characterization of a
soluble form of vascular cell adhesion molecule 1." Biochem Biophys Res
Commun 178(3): 1498-504.
Lobb, R. R., G. Chi-Rosso, et al. (1991). "Expression and functional characterization
of a soluble form of endothelial-leukocyte adhesion molecule 1." J Immunol
147(1): 124-9.
Lopes, F. P., M. N. de Azevedo, et al. "Use of 99mTc-anti-CD3 scintigraphy in the
differential diagnosis of rheumatic diseases." Rheumatology (Oxford) 49(5):
933-9.
References
218
Los, M., J. M. Roodhart, et al. (2007). "Target practice: lessons from phase III trials
with bevacizumab and vatalanib in the treatment of advanced colorectal
cancer." Oncologist 12(4): 443-50.
Lubberts, E., M. I. Koenders, et al. (2004). "Treatment with a neutralizing anti-murine
interleukin-17 antibody after the onset of collagen-induced arthritis reduces
joint inflammation, cartilage destruction, and bone erosion." Arthritis Rheum
50(2): 650-9.
Lundberg, C. and K. E. Arfors (1983). "Polymorphonuclear leukocyte accumulation
in inflammatory dermal sites as measured by 51Cr-labeled cells and
myeloperoxidase." Inflammation 7(3): 247-55.
Mahdi, H., B. A. Fisher, et al. (2009). "Specific interaction between genotype,
smoking and autoimmunity to citrullinated alpha-enolase in the etiology of
rheumatoid arthritis." Nat Genet 41(12): 1319-24.
Mahmood, U. and R. Weissleder (2003). "Near-infrared optical imaging of proteases
in cancer." Mol Cancer Ther 2(5): 489-96.
Maini, R. N., F. C. Breedveld, et al. (1998). "Therapeutic efficacy of multiple
intravenous infusions of anti-tumor necrosis factor alpha monoclonal antibody
combined with low-dose weekly methotrexate in rheumatoid arthritis."
Arthritis Rheum 41(9): 1552-63.
Maini, R. N., P. C. Taylor, et al. (2006). "Double-blind randomized controlled clinical
trial of the interleukin-6 receptor antagonist, tocilizumab, in European patients
with rheumatoid arthritis who had an incomplete response to methotrexate."
Arthritis Rheum 54(9): 2817-29.
Marinova-Mutafchieva, L., R. O. Williams, et al. (1997). "Dynamics of
proinflammatory cytokine expression in the joints of mice with collagen-
induced arthritis (CIA)." Clin Exp Immunol 107(3): 507-12.
Marinova-Mutafchieva, L., R. O. Williams, et al. (2000). "A comparative study into
the mechanisms of action of anti-tumor necrosis factor alpha, anti-CD4, and
combined anti-tumor necrosis factor alpha/anti-CD4 treatment in early
collagen-induced arthritis." Arthritis Rheum 43(3): 638-44.
Marshall, D. and D. O. Haskard (2002). "Clinical overview of leukocyte adhesion and
migration: where are we now?" Semin Immunol 14(2): 133-40.
Massoud, T. F. and S. S. Gambhir (2003). "Molecular imaging in living subjects:
seeing fundamental biological processes in a new light." Genes Dev 17(5):
545-80.
McCune, J. M., R. Namikawa, et al. (1988). "The SCID-hu mouse: murine model for
the analysis of human hematolymphoid differentiation and function." Science
241(4873): 1632-9.
McDonald, D. M. and P. Baluk (2002). "Significance of blood vessel leakiness in
cancer." Cancer Res 62(18): 5381-5.
McElroy, M., K. Hayashi, et al. (2009). "Fluorescent LYVE-1 antibody to image
dynamically lymphatic trafficking of cancer cells in vivo." J Surg Res 151(1):
68-73.
Meier, R., C. Krug, et al. (2010). "ICG-enhanced imaging of arthritis with an
integrated optical imaging/X-ray system." Arthritis Rheum 62(8): 2322-7.
Melancon, M. P., W. Wang, et al. (2007). "A novel method for imaging in vivo
degradation of poly(L-glutamic acid), a biodegradable drug carrier." Pharm
Res 24(6): 1217-24.
Mendelsohn, J. and J. Baselga (2003). "Status of epidermal growth factor receptor
antagonists in the biology and treatment of cancer." J Clin Oncol 21(14):
2787-99.
References
219
Mendelsohn, J. and J. Baselga (2006). "Epidermal growth factor receptor targeting in
cancer." Semin Oncol 33(4): 369-85.
Menger, M. D. and H. A. Lehr (1993). "Scope and perspectives of intravital
microscopy--bridge over from in vitro to in vivo." Immunol Today 14(11):
519-22.
Michel, C. C. and F. E. Curry (1999). "Microvascular permeability." Physiol Rev
79(3): 703-61.
Midwood, K., S. Sacre, et al. (2009). "Tenascin-C is an endogenous activator of Toll-
like receptor 4 that is essential for maintaining inflammation in arthritic joint
disease." Nat Med 15(7): 774-80.
Miller, E. J. (1972). "Structural studies on cartilage collagen employing limited
cleavage and solubilization with pepsin." Biochemistry 11(26): 4903-9.
Mima, T., Y. Saeki, et al. (1995). "Transfer of rheumatoid arthritis into severe
combined immunodeficient mice. The pathogenetic implications of T cell
populations oligoclonally expanding in the rheumatoid joints." J Clin Invest
96(4): 1746-58.
Miotla, J., R. Maciewicz, et al. (2000). "Treatment with soluble VEGF receptor
reduces disease severity in murine collagen-induced arthritis." Lab Invest
80(8): 1195-205.
Moore, K. L. (1998). "Structure and function of P-selectin glycoprotein ligand-1."
Leuk Lymphoma 29(1-2): 1-15.
Mor, A., S. B. Abramson, et al. (2005). "The fibroblast-like synovial cell in
rheumatoid arthritis: a key player in inflammation and joint destruction." Clin
Immunol 115(2): 118-28.
Moreland, L. W., S. W. Baumgartner, et al. (1997). "Treatment of rheumatoid arthritis
with a recombinant human tumor necrosis factor receptor (p75)-Fc fusion
protein." N Engl J Med 337(3): 141-7.
Moreland, L. W., D. P. McCabe, et al. (2000). "Phase I/II trial of recombinant
methionyl human tumor necrosis factor binding protein PEGylated dimer in
patients with active refractory rheumatoid arthritis." J Rheumatol 27(3): 601-9.
Moreland, L. W., M. H. Schiff, et al. (1999). "Etanercept therapy in rheumatoid
arthritis. A randomized, controlled trial." Ann Intern Med 130(6): 478-86.
Muller, W. A., C. M. Ratti, et al. (1989). "A human endothelial cell-restricted,
externally disposed plasmalemmal protein enriched in intercellular junctions."
J Exp Med 170(2): 399-414.
Myers, L. K., E. F. Rosloniec, et al. (1997). "Collagen-induced arthritis, an animal
model of autoimmunity." Life Sci 61(19): 1861-78.
Nah, S. S., H. J. Won, et al. (2009). "Epidermal growth factor increases prostaglandin
E(2) production via ERK1/2 MAPK and NF-kappaB pathway in fibroblast like
synoviocytes from patients with rheumatoid arthritis." Rheumatol Int.
Nahta, R., L. X. Yuan, et al. (2007). "Lapatinib induces apoptosis in trastuzumab-
resistant breast cancer cells: effects on insulin-like growth factor I signaling."
Mol Cancer Ther 6(2): 667-74.
Nakatsu, T., S. Ichiyama, et al. (2006). "Structural basis for the spectral difference in
luciferase bioluminescence." Nature 440(7082): 372-6.
Newman, J. R., J. P. Gleysteen, et al. (2008). "Stereomicroscopic fluorescence
imaging of head and neck cancer xenografts targeting CD147." Cancer Biol
Ther 7(7): 1063-70.
Newman, W., L. D. Beall, et al. (1993). "Soluble E-selectin is found in supernatants
of activated endothelial cells and is elevated in the serum of patients with
septic shock." J Immunol 150(2): 644-54.
References
220
Niedre, M. J., R. H. de Kleine, et al. (2008). "Early photon tomography allows
fluorescence detection of lung carcinomas and disease progression in mice in
vivo." Proc Natl Acad Sci U S A 105(49): 19126-31.
Noss, E. H. and M. B. Brenner (2008). "The role and therapeutic implications of
fibroblast-like synoviocytes in inflammation and cartilage erosion in
rheumatoid arthritis." Immunol Rev 223: 252-70.
Notley, C. A., F. E. McCann, et al. "ANTI-CD3 therapy expands the numbers of
CD4+ and CD8+ Treg cells and induces sustained amelioration of collagen-
induced arthritis." Arthritis Rheum 62(1): 171-8.
Ntziachristos, V. (2006). "Fluorescence molecular imaging." Annu Rev Biomed Eng
8: 1-33.
Ntziachristos, V., J. Ripoll, et al. (2005). "Looking and listening to light: the evolution
of whole-body photonic imaging." Nat Biotechnol 23(3): 313-20.
Ntziachristos, V., J. Ripoll, et al. (2002). "Would near-infrared fluorescence signals
propagate through large human organs for clinical studies?" Opt Lett 27(5):
333-5.
O'Dell, J. R., C. E. Haire, et al. (1996). "Treatment of rheumatoid arthritis with
methotrexate alone, sulfasalazine and hydroxychloroquine, or a combination
of all three medications." N Engl J Med 334(20): 1287-91.
O'Shaughnessy, M. C., E. K. Vetsika, et al. (2006). "The effect of substance P on
nitric oxide release in a rheumatoid arthritis model." Inflamm Res 55(6): 236-
40.
Ogawa, M., N. Kosaka, et al. (2009). "In vivo molecular imaging of cancer with a
quenching near-infrared fluorescent probe using conjugates of monoclonal
antibodies and indocyanine green." Cancer Res 69(4): 1268-72.
Ogawa, M., C. A. Regino, et al. (2009). "In vivo target-specific activatable near-
infrared optical labeling of humanized monoclonal antibodies." Mol Cancer
Ther 8(1): 232-9.
Okamura, K., A. Morimoto, et al. (1992). "A model system for tumor angiogenesis:
involvement of transforming growth factor-alpha in tube formation of human
microvascular endothelial cells induced by esophageal cancer cells." Biochem
Biophys Res Commun 186(3): 1471-9.
Olayioye, M. A., R. M. Neve, et al. (2000). "The ErbB signaling network: receptor
heterodimerization in development and cancer." EMBO J 19(13): 3159-67.
Oliver, S. J., M. L. Banquerigo, et al. (1994). "Suppression of collagen-induced
arthritis using an angiogenesis inhibitor, AGM-1470, and a microtubule
stabilizer, taxol." Cell Immunol 157(1): 291-9.
Oliver, S. J. and E. Brahn (1996). "Combination therapy in rheumatoid arthritis: the
animal model perspective." J Rheumatol Suppl 44: 56-60.
Oyen, W. J., O. C. Boerman, et al. (1996). "The uptake mechanisms of inflammation-
and infection-localizing agents." Eur J Nucl Med 23(4): 459-65.
Pace, C. N., F. Vajdos, et al. (1995). "How to measure and predict the molar
absorption coefficient of a protein." Protein Sci 4(11): 2411-23.
Paleolog, E. M. (2002). "Angiogenesis in rheumatoid arthritis." Arthritis Research
4(suppl 3): S81-S90.
Paleolog, E. M. (2009). "The vasculature in rheumatoid arthritis: cause or
consequence?" Int J Exp Pathol 90(3): 249-61.
Paleolog, E. M., M. Hunt, et al. (1996). "Deactivation of vascular endothelium by
monoclonal anti-tumor necrosis factor alpha antibody in rheumatoid arthritis."
Arthritis Rheum 39(7): 1082-91.
References
221
Paleolog, E. M., S. Young, et al. (1998). "Modulation of angiogenic vascular
endothelial growth factor by tumor necrosis factor alpha and interleukin-1 in
rheumatoid arthritis." Arthritis Rheum 41(7): 1258-65.
Palframan, R., M. Airey, et al. (2009). "Use of biofluorescence imaging to compare
the distribution of certolizumab pegol, adalimumab, and infliximab in the
inflamed paws of mice with collagen-induced arthritis." J Immunol Methods
348(1-2): 36-41.
Palosaari, K., J. Vuotila, et al. (2006). "Bone oedema predicts erosive progression on
wrist MRI in early RA--a 2-yr observational MRI and NC scintigraphy study."
Rheumatology (Oxford) 45(12): 1542-8.
Pasceri, V. and E. T. Yeh (1999). "A tale of two diseases: atherosclerosis and
rheumatoid arthritis." Circulation 100(21): 2124-6.
Peacock, D. J., M. L. Banquerigo, et al. (1992). "Angiogenesis inhibition suppresses
collagen arthritis." J Exp Med 175(4): 1135-8.
Peterson, J. D., T. P. Labranche, et al. "Optical tomographic imaging discriminates
between disease-modifying anti-rheumatic drug (DMARD) and non-DMARD
efficacy in collagen antibody-induced arthritis." Arthritis Res Ther 12(3):
R105.
Petit, A. M., J. Rak, et al. (1997). "Neutralizing antibodies against epidermal growth
factor and ErbB-2/neu receptor tyrosine kinases down-regulate vascular
endothelial growth factor production by tumor cells in vitro and in vivo:
angiogenic implications for signal transduction therapy of solid tumors." Am J
Pathol 151(6): 1523-30.
Piguet, P. F., G. E. Grau, et al. (1992). "Evolution of collagen arthritis in mice is
arrested by treatment with anti-tumour necrosis factor (TNF) antibody or a
recombinant soluble TNF receptor." Immunology 77(4): 510-4.
Pitzalis, C. and T. Garrood (2006). "From ubiquitous antigens to joint-specific
inflammation: could local vascular permeability be the missing link?" Trends
Immunol 27(7): 299-302.
Pober, J. S., M. P. Bevilacqua, et al. (1986). "Two distinct monokines, interleukin 1
and tumor necrosis factor, each independently induce biosynthesis and
transient expression of the same antigen on the surface of cultured human
vascular endothelial cells." J Immunol 136(5): 1680-7.
Pober, J. S., M. A. Gimbrone, Jr., et al. (1986). "Overlapping patterns of activation of
human endothelial cells by interleukin 1, tumor necrosis factor, and immune
interferon." J Immunol 137(6): 1893-6.
Pober, J. S., L. A. Lapierre, et al. (1987). "Activation of cultured human endothelial
cells by recombinant lymphotoxin: comparison with tumor necrosis factor and
interleukin 1 species." J Immunol 138(10): 3319-24.
Ravindranath, N., D. Wion, et al. (2001). "Epidermal growth factor modulates the
expression of vascular endothelial growth factor in the human prostate." J
Androl 22(3): 432-43.
RayChaudhury, A., W. A. Frazier, et al. (1994). "Comparison of normal and
tumorigenic endothelial cells: differences in thrombospondin production and
responses to transforming growth factor-beta." J Cell Sci 107 ( Pt 1): 39-46.
Raza, K., F. Falciani, et al. (2005). "Early rheumatoid arthritis is characterized by a
distinct and transient synovial fluid cytokine profile of T cell and stromal cell
origin." Arthritis Res Ther 7(4): R784-95.
Remmers, E. F., H. Sano, et al. (1991). "Production of platelet derived growth factor
B chain (PDGF-B/c-sis) mRNA and immunoreactive PDGF B-like
References
222
polypeptide by rheumatoid synovium: coexpression with heparin binding
acidic fibroblast growth factor-1." J Rheumatol 18(1): 7-13.
Remmers, E. F., H. Sano, et al. (1991). "Platelet-derived growth factors and heparin-
binding (fibroblast) growth factors in the synovial tissue pathology of
rheumatoid arthritis." Semin Arthritis Rheum 21(3): 191-9.
Reynolds, P. R., D. J. Larkman, et al. (2006). "Detection of vascular expression of E-
selectin in vivo with MR imaging." Radiology 241(2): 469-76.
Riese, D. J., 2nd and D. F. Stern (1998). "Specificity within the EGF family/ErbB
receptor family signaling network." Bioessays 20(1): 41-8.
Roivainen, A., R. Parkkola, et al. (2003). "Use of positron emission tomography with
methyl-11C-choline and 2-18F-fluoro-2-deoxy-D-glucose in comparison with
magnetic resonance imaging for the assessment of inflammatory proliferation
of synovium." Arthritis Rheum 48(11): 3077-84.
Romas, E., N. A. Sims, et al. (2002). "Osteoprotegerin reduces osteoclast numbers
and prevents bone erosion in collagen-induced arthritis." Am J Pathol 161(4):
1419-27.
Rooney, M., D. Condell, et al. (1988). "Analysis of the histologic variation of
synovitis in rheumatoid arthritis." Arthritis Rheum 31(8): 956-63.
Rosenthal, E. L., B. D. Kulbersh, et al. (2007). "Use of fluorescent labeled anti-
epidermal growth factor receptor antibody to image head and neck squamous
cell carcinoma xenografts." Mol Cancer Ther 6(4): 1230-8.
Ruchaud-Sparagano, M. H., E. M. Drost, et al. (1998). "Potential pro-inflammatory
effects of soluble E-selectin upon neutrophil function." Eur J Immunol 28(1):
80-9.
Ruchaud-Sparagano, M. H., T. R. Walker, et al. (2000). "Soluble E-selectin acts in
synergy with platelet-activating factor to activate neutrophil beta 2-integrins.
Role of tyrosine kinases and Ca2+ mobilization." J Biol Chem 275(21):
15758-64.
Ruckman, J., L. S. Green, et al. (1998). "2'-Fluoropyrimidine RNA-based aptamers to
the 165-amino acid form of vascular endothelial growth factor (VEGF165).
Inhibition of receptor binding and VEGF-induced vascular permeability
through interactions requiring the exon 7-encoded domain." J Biol Chem
273(32): 20556-67.
Salvemini, D., Z. Q. Wang, et al. (1996). "Nitric oxide: a key mediator in the early
and late phase of carrageenan-induced rat paw inflammation." Br J Pharmacol
118(4): 829-38.
Sampath, L., S. Kwon, et al. (2007). "Dual-labeled trastuzumab-based imaging agent
for the detection of human epidermal growth factor receptor 2 overexpression
in breast cancer." J Nucl Med 48(9): 1501-10.
Sano, H., K. Engleka, et al. (1993). "Coexpression of phosphotyrosine-containing
proteins, platelet-derived growth factor-B, and fibroblast growth factor-1 in
situ in synovial tissues of patients with rheumatoid arthritis and Lewis rats
with adjuvant or streptococcal cell wall arthritis." J Clin Invest 91(2): 553-65.
Sano, H., R. Forough, et al. (1990). "Detection of high levels of heparin binding
growth factor-1 (acidic fibroblast growth factor) in inflammatory arthritic
joints." J Cell Biol 110(4): 1417-26.
Sarup, J., P. Jin, et al. (2008). "Human epidermal growth factor receptor (HER-
1:HER-3) Fc-mediated heterodimer has broad antiproliferative activity in vitro
and in human tumor xenografts." Mol Cancer Ther 7(10): 3223-36.
Satoh, K., S. Kikuchi, et al. (2001). "Involvement of ErbB-2 in rheumatoid synovial
cell growth." Arthritis Rheum 44(2): 260-5.
References
223
Sattar, N., D. W. McCarey, et al. (2003). "Explaining how "high-grade" systemic
inflammation accelerates vascular risk in rheumatoid arthritis." Circulation
108(24): 2957-63.
Schellekens, G. A., H. Visser, et al. (2000). "The diagnostic properties of rheumatoid
arthritis antibodies recognizing a cyclic citrullinated peptide." Arthritis Rheum
43(1): 155-63.
Scherer, R. L., M. N. VanSaun, et al. (2008). "Optical imaging of matrix
metalloproteinase-7 activity in vivo using a proteolytic nanobeacon." Mol
Imaging 7(3): 118-31.
Schmitt-Sody, M., J. Landes, et al. (2003). "Quantitative assessment of angiogenesis
in murine antigen-induced arthritis by intravital fluorescence microscopy." J
Vasc Res 40(5): 460-6.
Schreiber, A. B., M. E. Winkler, et al. (1986). "Transforming growth factor-alpha: a
more potent angiogenic mediator than epidermal growth factor." Science
232(4755): 1250-3.
Schumacher, H. R. and R. C. Kitridou (1972). "Synovitis of recent onset. A
clinicopathologic study during the first month of disease." Arthritis Rheum
15(5): 465-85.
Sehnert, B., P. Gierer, et al. (2006). "Modulation of granulocyte-endothelium
interactions by antileukoproteinase: inhibition of anti-type II collagen
antibody-induced leukocyte attachment to the synovial endothelium." Arthritis
Res Ther 8(4): R95.
Sevick-Muraca, E. M., R. Sharma, et al. (2008). "Imaging of lymph flow in breast
cancer patients after microdose administration of a near-infrared fluorophore:
feasibility study." Radiology 246(3): 734-41.
Shepard, H. M., C. M. Brdlik, et al. (2008). "Signal integration: a framework for
understanding the efficacy of therapeutics targeting the human EGFR family."
J Clin Invest 118(11): 3574-81.
Sheth, R. A., R. Upadhyay, et al. (2009). "Improved detection of ovarian cancer
metastases by intraoperative quantitative fluorescence protease imaging in a
pre-clinical model." Gynecol Oncol 112(3): 616-22.
Shiozawa, S., K. Shiozawa, et al. (1989). "Human epidermal growth factor for the
stratification of synovial lining layer and neovascularisation in rheumatoid
arthritis." Ann Rheum Dis 48(10): 820-8.
Siegelman, M. H., M. van de Rijn, et al. (1989). "Mouse lymph node homing receptor
cDNA clone encodes a glycoprotein revealing tandem interaction domains."
Science 243(4895): 1165-72.
Silman, A. J., J. Newman, et al. (1996). "Cigarette smoking increases the risk of
rheumatoid arthritis. Results from a nationwide study of disease-discordant
twins." Arthritis Rheum 39(5): 732-5.
Simon, G. H., H. E. Daldrup-Link, et al. (2006). "Optical imaging of experimental
arthritis using allogeneic leukocytes labeled with a near-infrared fluorescent
probe." Eur J Nucl Med Mol Imaging 33(9): 998-1006.
Slakter, J. S., L. A. Yannuzzi, et al. (1995). "Indocyanine-green angiography." Curr
Opin Ophthalmol 6(3): 25-32.
Slamon, D. J., B. Leyland-Jones, et al. (2001). "Use of chemotherapy plus a
monoclonal antibody against HER2 for metastatic breast cancer that
overexpresses HER2." N Engl J Med 344(11): 783-92.
Smolen, J., R. B. Landewe, et al. (2009). "Efficacy and safety of certolizumab pegol
plus methotrexate in active rheumatoid arthritis: the RAPID 2 study. A
randomised controlled trial." Ann Rheum Dis 68(6): 797-804.
References
224
Smolen, J. S., A. Beaulieu, et al. (2008). "Effect of interleukin-6 receptor inhibition
with tocilizumab in patients with rheumatoid arthritis (OPTION study): a
double-blind, placebo-controlled, randomised trial." Lancet 371(9617): 987-
97.
Somers, W. S., J. Tang, et al. (2000). "Insights into the molecular basis of leukocyte
tethering and rolling revealed by structures of P- and E-selectin bound to
SLe(X) and PSGL-1." Cell 103(3): 467-79.
Spibey, C. A., P. Jackson, et al. (2001). "A unique charge-coupled device/xenon arc
lamp based imaging system for the accurate detection and quantitation of
multicolour fluorescence." Electrophoresis 22(5): 829-36.
Springer, T. A. (1990). "Adhesion receptors of the immune system." Nature
346(6283): 425-34.
Springer, T. A. (1994). "Traffic signals for lymphocyte recirculation and leukocyte
emigration: the multistep paradigm." Cell 76(2): 301-14.
Stamper, H. B., Jr. and J. J. Woodruff (1976). "Lymphocyte homing into lymph
nodes: in vitro demonstration of the selective affinity of recirculating
lymphocytes for high-endothelial venules." J Exp Med 144(3): 828-33.
Stehle, G., A. Wunder, et al. (1997). "Pharmacokinetics of methotrexate-albumin
conjugates in tumor-bearing rats." Anticancer Drugs 8(9): 835-44.
Stevens, C. R., D. R. Blake, et al. (1991). "A comparative study by morphometry of
the microvasculature in normal and rheumatoid synovium." Arthritis Rheum
34(12): 1508-13.
Subramaniam, M., J. A. Koedam, et al. (1993). "Divergent fates of P- and E-selectins
after their expression on the plasma membrane." Mol Biol Cell 4(8): 791-801.
Sumariwalla, P. F., Y. Cao, et al. (2003). "The angiogenesis inhibitor protease-
activated kringles 1-5 reduces the severity of murine collagen-induced
arthritis." Arthritis Res Ther 5(1): R32-9.
Sumariwalla, P. F., P. Jin, et al. (2008). "Antagonism of the human epidermal growth
factor receptor family controls disease severity in murine collagen-induced
arthritis." Arthritis Rheum 58(10): 3071-80.
Sumariwalla, P. F., A. M. Malfait, et al. (2004). "P-selectin glycoprotein ligand 1
therapy ameliorates established collagen-induced arthritis in DBA/1 mice
partly through the suppression of tumour necrosis factor." Clin Exp Immunol
136(1): 67-75.
Svensson, L., J. Jirholt, et al. (1998). "B cell-deficient mice do not develop type II
collagen-induced arthritis (CIA)." Clin Exp Immunol 111(3): 521-6.
Szekanecz, Z. and A. E. Koch (2008). "Vascular involvement in rheumatic diseases:
'vascular rheumatology'." Arthritis Res Ther 10(5): 224.
Tagaya, N., R. Yamazaki, et al. (2008). "Intraoperative identification of sentinel
lymph nodes by near-infrared fluorescence imaging in patients with breast
cancer." Am J Surg 195(6): 850-3.
Tak, P. P., P. C. Taylor, et al. (1996). "Decrease in cellularity and expression of
adhesion molecules by anti-tumor necrosis factor alpha monoclonal antibody
treatment in patients with rheumatoid arthritis." Arthritis Rheum 39(7): 1077-
81.
Taurog, J. D., S. S. Kerwar, et al. (1985). "Synergy between adjuvant arthritis and
collagen-induced arthritis in rats." J Exp Med 162(3): 962-78.
Taylor, P. C., A. Steuer, et al. (2004). "Comparison of ultrasonographic assessment of
synovitis and joint vascularity with radiographic evaluation in a randomized,
placebo-controlled study of infliximab therapy in early rheumatoid arthritis."
Arthritis Rheum 50(4): 1107-16.
References
225
Thorbecke, G. J., R. Shah, et al. (1992). "Involvement of endogenous tumor necrosis
factor alpha and transforming growth factor beta during induction of collagen
type II arthritis in mice." Proc Natl Acad Sci U S A 89(16): 7375-9.
Tracey, D., L. Klareskog, et al. (2008). "Tumor necrosis factor antagonist
mechanisms of action: a comprehensive review." Pharmacol Ther 117(2): 244-
79.
Trentham, D. E., A. S. Townes, et al. (1977). "Autoimmunity to type II collagen an
experimental model of arthritis." J Exp Med 146(3): 857-68.
Troyan, S. L., V. Kianzad, et al. (2009). "The FLARE() Intraoperative Near-Infrared
Fluorescence Imaging System: A First-in-Human Clinical Trial in Breast
Cancer Sentinel Lymph Node Mapping." Ann Surg Oncol.
Tsien, R. Y. (2009). "Constructing and Exploiting the Fluorescent Protein Paintbox
(Nobel Lecture)." Angew Chem Int Ed Engl.
Urano, Y., D. Asanuma, et al. (2009). "Selective molecular imaging of viable cancer
cells with pH-activatable fluorescence probes." Nat Med 15(1): 104-9.
van der Heijde, D. M., M. A. van Leeuwen, et al. (1995). "Radiographic progression
on radiographs of hands and feet during the first 3 years of rheumatoid
arthritis measured according to Sharp's method (van der Heijde
modification)." J Rheumatol 22(9): 1792-6.
van Gaalen, F. A., S. P. Linn-Rasker, et al. (2004). "Autoantibodies to cyclic
citrullinated peptides predict progression to rheumatoid arthritis in patients
with undifferentiated arthritis: a prospective cohort study." Arthritis Rheum
50(3): 709-15.
van Mourik, J. A., O. C. Leeksma, et al. (1985). "Vascular endothelial cells synthesize
a plasma membrane protein indistinguishable from the platelet membrane
glycoprotein IIa." J Biol Chem 260(20): 11300-6.
Veale, D. J., C. Maple, et al. (1998). "Soluble cell adhesion molecules--P-selectin and
ICAM-1, and disease activity in patients receiving sulphasalazine for active
rheumatoid arthritis." Scand J Rheumatol 27(4): 296-9.
Veihelmann, A., A. G. Harris, et al. (1999). "In vivo assessment of synovial
microcirculation and leukocyte-endothelial cell interaction in mouse antigen-
induced arthritis." Microcirculation 6(4): 281-90.
Veihelmann, A., G. Szczesny, et al. (1998). "A novel model for the study of synovial
microcirculation in the mouse knee joint in vivo." Res Exp Med (Berl) 198(1):
43-54.
Vincent, C., L. Nogueira, et al. (2002). "Detection of antibodies to deiminated
recombinant rat filaggrin by enzyme-linked immunosorbent assay: a highly
effective test for the diagnosis of rheumatoid arthritis." Arthritis Rheum 46(8):
2051-8.
von Asmuth, E. J., E. F. Smeets, et al. (1992). "Evidence for endocytosis of E-selectin
in human endothelial cells." Eur J Immunol 22(10): 2519-26.
Voskuyl, A. E., S. Martin, et al. (1995). "Levels of circulating intercellular adhesion
molecule-1 and -3 but not circulating endothelial leucocyte adhesion molecule
are increased in patients with rheumatoid vasculitis." Br J Rheumatol 34(4):
311-5.
Wahid, S., M. C. Blades, et al. (2000). "Tumour necrosis factor-alpha (TNF-alpha)
enhances lymphocyte migration into rheumatoid synovial tissue transplanted
into severe combined immunodeficient (SCID) mice." Clin Exp Immunol
122(1): 133-42.
Walsh, D. (1999). "Angiogenesis and arthritis." Rheumatology 38: 103–12.
References
226
Walsh, D. A., P. I. Mapp, et al. (1992). "Localisation and characterisation of
substance P binding to human synovial tissue in rheumatoid arthritis." Ann
Rheum Dis 51(3): 313-7.
Watson, S. R., Y. F. Chang, et al. (2000). "Anti-L-selectin aptamers: binding
characteristics, pharmacokinetic parameters, and activity against an
intravascular target in vivo." Antisense Nucleic Acid Drug Dev 10(2): 63-75.
Weber, A. J. and M. De Bandt (2000). "Angiogenesis: general mechanisms and
implications for rheumatoid arthritis." Joint Bone Spine 67(5): 366-83.
Weinblatt, M. E., E. C. Keystone, et al. (2003). "Adalimumab, a fully human anti-
tumor necrosis factor alpha monoclonal antibody, for the treatment of
rheumatoid arthritis in patients taking concomitant methotrexate: the
ARMADA trial." Arthritis Rheum 48(1): 35-45.
Weinblatt, M. E., J. M. Kremer, et al. (1999). "A trial of etanercept, a recombinant
tumor necrosis factor receptor:Fc fusion protein, in patients with rheumatoid
arthritis receiving methotrexate." N Engl J Med 340(4): 253-9.
Weiss, T. E., W. S. Maxfield, et al. (1965). "Iodinated human serum albumin (I-131)
localization studies of rheumatoid arthritis joints by scintillation scanning.
(Preliminary report)." Arthritis Rheum 8(5): 976-87.
Weissleder, R. and U. Mahmood (2001). "Molecular imaging." Radiology 219(2):
316-33.
Weissleder, R. and V. Ntziachristos (2003). "Shedding light onto live molecular
targets." Nat Med 9(1): 123-8.
Weissleder, R. and M. J. Pittet (2008). "Imaging in the era of molecular oncology."
Nature 452(7187): 580-9.
Weissleder, R., C. H. Tung, et al. (1999). "In vivo imaging of tumors with protease-
activated near-infrared fluorescent probes." Nat Biotechnol 17(4): 375-8.
Weller, A., S. Isenmann, et al. (1992). "Cloning of the mouse endothelial selectins.
Expression of both E- and P-selectin is inducible by tumor necrosis factor
alpha." J Biol Chem 267(21): 15176-83.
Wellicome, S. M., P. Kapahi, et al. (1993). "Detection of a circulating form of
vascular cell adhesion molecule-1: raised levels in rheumatoid arthritis and
systemic lupus erythematosus." Clin Exp Immunol 92(3): 412-8.
Wellicome, S. M., M. H. Thornhill, et al. (1990). "A monoclonal antibody that detects
a novel antigen on endothelial cells that is induced by tumor necrosis factor,
IL-1, or lipopolysaccharide." J Immunol 144(7): 2558-65.
Whyte, A., D. O. Haskard, et al. (1994). "Infiltrating gamma delta T-cells and selectin
endothelial ligands in the cutaneous phytohaemagglutinin-induced
inflammatory reaction." Vet Immunol Immunopathol 41(1-2): 31-40.
Williams, P. J., R. H. Jones, et al. (1998). "Correlation between IgG anti-type II
collagen levels and arthritic severity in murine arthritis." Autoimmunity 27(4):
201-7.
Williams, R. O., M. Feldmann, et al. (1992). "Anti-tumor necrosis factor ameliorates
joint disease in murine collagen-induced arthritis." Proc Natl Acad Sci U S A
89(20): 9784-8.
Williams, R. O., J. J. Inglis, et al. (2005). "Analysing the effect of novel therapies on
cytokine expression in experimental arthritis." Int J Exp Pathol 86(5): 267-78.
Wilson, T. and J. W. Hastings (1998). "Bioluminescence." Annu Rev Cell Dev Biol
14: 197-230.
Winnard, P. T., Jr., J. B. Kluth, et al. (2006). "Noninvasive optical tracking of red
fluorescent protein-expressing cancer cells in a model of metastatic breast
cancer." Neoplasia 8(10): 796-806.
References
227
Winter, C. A., E. A. Risley, et al. (1962). "Carrageenin-induced edema in hind paw of
the rat as an assay for antiiflammatory drugs." Proc Soc Exp Biol Med 111:
544-7.
Withrow, K. P., J. R. Newman, et al. (2008). "Assessment of bevacizumab conjugated
to Cy5.5 for detection of head and neck cancer xenografts." Technol Cancer
Res Treat 7(1): 61-6.
Woodfin, A., M. B. Voisin, et al. (2007). "PECAM-1: a multi-functional molecule in
inflammation and vascular biology." Arterioscler Thromb Vasc Biol 27(12):
2514-23.
Wooley, P., H. Luthera, et al. (1981). "Type II collagen-induced arthritis in mice I.
Major Histocompatibility Complex (I Region) Linkage and Antibody
Correlates." Jr. Exp. Med 154: 688-700.
Wooley, P. H., J. Dutcher, et al. (1993). "Influence of a recombinant human soluble
tumor necrosis factor receptor FC fusion protein on type II collagen-induced
arthritis in mice." J Immunol 151(11): 6602-7.
Woolf, C. J., A. Allchorne, et al. (1997). "Cytokines, nerve growth factor and
inflammatory hyperalgesia: the contribution of tumour necrosis factor alpha."
Br J Pharmacol 121(3): 417-24.
Workman, P., E. O. Aboagye, et al. (2010). "Guidelines for the welfare and use of
animals in cancer research." Br J Cancer 102(11): 1555-77.
Wunder, A., U. Muller-Ladner, et al. (2003). "Albumin-based drug delivery as novel
therapeutic approach for rheumatoid arthritis." J Immunol 170(9): 4793-801.
Wunder, A., R. H. Straub, et al. (2005). "Molecular imaging: novel tools in
visualizing rheumatoid arthritis." Rheumatology (Oxford) 44(11): 1341-9.
Wunder, A., C. H. Tung, et al. (2004). "In vivo imaging of protease activity in
arthritis: a novel approach for monitoring treatment response." Arthritis
Rheum 50(8): 2459-65.
Xu, H., K. Baidoo, et al. (2007). "Design, synthesis, and characterization of a dual
modality positron emission tomography and fluorescence imaging agent for
monoclonal antibody tumor-targeted imaging." J Med Chem 50(19): 4759-65.
Yamane, S., S. Ishida, et al. (2008). "Proinflammatory role of amphiregulin, an
epidermal growth factor family member whose expression is augmented in
rheumatoid arthritis patients." J Inflamm (Lond) 5: 5.
Yarden, Y. and M. X. Sliwkowski (2001). "Untangling the ErbB signalling network."
Nat Rev Mol Cell Biol 2(2): 127-37.
Zhao, H., T. C. Doyle, et al. (2005). "Emission spectra of bioluminescent reporters
and interaction with mammalian tissue determine the sensitivity of detection in
vivo." J Biomed Opt 10(4): 41210.
Zou, P., S. Xu, et al. (2009). "Near-Infrared Fluorescence Labeled Anti-TAG-72
Monoclonal Antibodies for Tumor Imaging in Colorectal Cancer Xenograft
Mice." Mol Pharm.
Publications and Prizes
228
PUBLICATIONS AND PRIZES
Abstracts
Gompels, Luke L, Inglis, Julia, Vincent, Tonia, Madden, Leigh, McNamee, Kay,
McConnell, Ellen, Haskard Dorian; Paleolog, Ewa. In Vivo Fluorescence Imaging of
TNF-Induced Endothelial Inflammation by Targeting E-Selectin [abstract]. Arthritis
Rheum 2009;60 Suppl 10 :1997. (Oral presentation of abstract, American College of
Rheumatology, Conference, November 2009)
Gompels LL; Vincent T; Madden L; Lim NH; McConnell E; Mcnamee K; Haskard
DO; Paleolog EM. QUANTIFYING IN VIVO FLUORESCENCE IMAGING IN
MURINE ARTHRITIS BY TARGETING E-SELECTIN. Annual Meeting of the
British-Society-Rheumatology/Spring Meeting of British-Health-Professional-in-
Rheumatology, 21 Apr 2010 - 23 Apr 2010. 49:I27-I27. OXFORD UNIV PRESS
(Apr 2010) (Oral presentation of abstract: Young Investigator Prize Winner, BSR,
April, 2010)
Gompels LL; Vincent T; Madden L; Lim NH; McConnell E; Mcnamee K; Haskard
DO; Paleolog EM. In Vivo Fluorescence imaging of E-Selectin: Quantitative
Detection of Endothelial Inflammation in Arthritis Models. Medical Research Society
25th
February 2010.
Publications
Gompels LL; Lim NH; Vincent T; Paleolog EM. (Aug 2010). In vivo optical imaging
in arthritis--an enlightening future?. Rheumatology (Oxford). 49:1436-1446.
Gompels LL, Paleolog EM. Molecular Imaging Techniques for Rheumatology
Practice: Offering a Window on Disease Pathogenesis and Paving the Way for Novel
Molecular Therapies. International Journal of Clinical Rheumatology (In press).
Prizes
British Society of Rheumatology Young Investigator 2010.