Embed Size (px)
Citation preview
Chlorophyll fluorescence and biomass productivity in microalgae 801
Lat. Am. J. Aquat. Res., 41(5): 801-819, 2013 DOI: 103856/vol41-issue5-fulltext-1
Review
Use of in vivo chlorophyll fluorescence to estimate photosynthetic activity and
biomass productivity in microalgae grown in different culture systems
Félix L. Figueroa1, Celia G. Jerez1 & Nathalie Korbee1
1Departamento de Ecología, Facultad de Ciencias, Universidad de Málaga Campus Universitario de Teatinos s/n, E-29071 Málaga, España
ABSTRACT. In vivo chlorophyll fluorescence associated to Photosystem II is being used to evaluate photosynthetic activity of microalgae grown in different types of photobioreactors; however, controversy on methodology is usual. Several recommendations on the use of chlorophyll fluorescence to estimate electron transport rate and productivity of microalgae grown in thin-layer cascade cultivators and methacrylate cylindrical vessels are included. Different methodologies related to the measure of photosynthetic activity in microalgae are discussed: (1) measurement of light absorption, (2) determination of electron transport rates versus irradiance and (3) use of simplified devices based on pulse amplitude modulated (PAM) fluorescence as Junior PAM or Pocket PAM with optical fiber and optical head as measuring units, respectively. Data comparisons of in vivo chlorophyll fluorescence by using these devices and other PAM fluorometers as Water-PAM in the microalga Chlorella sp. (Chlorophyta) are presented. Estimations of carbon production and productivity by transforming electron transport rate to gross photosynthetic rate (as oxygen evolution) using reported oxygen produced per photons absorbed values and carbon photosynthetic yield based on reported oxygen/carbon ratio are also shown. The limitation of ETR as estimator of photosynthetic and biomass productivity is discussed. Low cost:quality PAMs can promote monitoring of chlorophyll fluorescence in algal biotechnology to estimate the photosynthetic activity and biomass productivity. Keywords: absorptance, biomass productivity, electron transport rate, PAM fluorescence, photosynthetic yield.
Uso de la fluorescencia de la clorofila in vivo para estimar la actividad fotosintética y productividad de la biomasa en microalgas crecidas en diferentes sistemas de cultivo
RESUMEN. La fluorescencia de la clorofila in vivo asociada al Fotosistema II se emplea para la determinación de la actividad fotosintética en microalgas crecidas en distintos tipos de fotobiorreactores pero existe controversia sobre la metodología más apropiada. En este trabajo se hacen varias recomendaciones sobre su uso para estimar la tasa de transporte electrónico (ETR) y la productividad de la biomasa en algas crecidas en cultivadores de cascada de capa fina y en recipientes cilíndricos de metacrilato. Se discuten diferentes medidas asociadas a la metodología de la actividad fotosintética: (1) medidas de absorción de luz, (2) determinación de ETR versus irradiancia, y (3) uso de equipos simplificados basados en fluorescencia por pulso de amplitud modulada (PAM) como el Junior PAM o Pocket PAM, con fibra óptica o cabezal óptico como unidades de medida, respectivamente. Se comparan los datos de fluorescencia in vivo en la microalga Chlorella sp. (Chlorophyta) con los de otros fluorímetros como el Water PAM. Se estima la producción de carbono y productividad de la biomasa mediante la transformación del ETR en producción bruta de oxígeno usando valores teóricos de oxígeno producido por fotones absorbidos y la tasa de asimilación de carbono considerando la relación oxígeno producido/carbono asimilado. Se discuten las limitaciones del uso del ETR como estimador la productividad de la biomasa. Los fluorímetros con alta relación calidad:precio pueden promover la monitorización de la fluorescencia in vivo de la clorofila en biotecnología de algas para estimar la actividad fotosintética y productividad de la biomasa. Palabras clave: absorptancia, productividad de la biomasa, tasa de transporte electrónico, fluorescencia de clorofila in vivo, rendimiento fotosintético.
___________________ Corresponding author: Félix López Figueroa ([email protected])
802 Latin American Journal of Aquatic Research
INTRODUCTION
Accurate determination of algal photosynthesis presents difficulties in both short and long-term scale due to diverse photoacclimation mechanisms and complex regulation systems (MacIntyre et al., 2002). In mass algal cultivation both closed photobioreactors and open cultivation systems, difficulties to determine the photosynthetic yield increase due to high light absorption and high cell density and heterogeneity (spatial-temporal variations) in the cultivation systems (Masojídek et al., 2011). Development of non-intrusive methodologies has led to rapid and sensitive measurements of changes in the physiological status of aquatic plants subjected to light stress (Suggett et al., 2011). Pulse Amplitude Modulation (PAM) chlorophyll fluorescence of photosystem II (PSII) was primarily developed to assess photosynthetic primary reactions and quenching mechanisms in plant physiology studies of higher plants (Schreiber et al., 1986; Baker & Oxborough, 2004) and later it has been used in aquatic macrophytes and phytoplankton under different natural and artificial light conditions (Hanelt, 1992; Schreiber et al., 1995a; Flameling & Kromkamp, 1998; Figueroa et al., 2003; Wilhelm et al., 2004; Suggett et al., 2011). An optimization of the PAM instrumentation was needed to meet accurately the low chlorophyll fluorescence emission of microalgae in oligotrophic waters, i.e., Water-PAM (Korbee et al., 2012). The high diversity of phytoplankton according to the pigment composition (Johnsen & Sakshaug, 2007; Babin, 2008) requires care with the interpretation since the standard of higher plant models are not sufficient. For example, the presence of phycobilisomes in the light-harvesting system of red algae and cyanobacteria results in generally lower maximal quantum yields (Fv/Fm) than that measured in green and brown algae (Büchel & Wilhem, 1993). On the other hand, the high diversity of carotenoids and other accessory pigments in the phytoplanktonic photosyn-thetic antenna together with the high variety of photoprotectors produces high diversity fraction of absorbed quanta to PSII, package effect and consequently of irradiance acclimation capacity (Dubinsky et al., 1986; Suggett et al., 2004; Johnsen & Sakshaug, 2007).
The introduction of a simple parameter to use fluorescence for measuring photosynthetic efficiency in light by Genty et al. (1989), and subsequent findings that this parameter is related to quantum yields of other photosynthetic processes, such as O2 evolution and CO2 fixation (for algal examples, see Flameling & Kromkamp, 1998; Figueroa et al., 2003), have led to the widespread use of protocols for
converting the quantum yield of PSII into actual rates of electron flow. Electron transport rate (ETR), as originally described by Schreiber et al. (1986), can be determined in field samples by using values of ∆F/Fm’ and simultaneously measuring the incident irradiance (E) between 400 and 700 nm (photosyn-thetic active radiation, PAR) and the absorptance (A).
The usefulness of chlorophyll fluorescence as an indicator of photosynthesis has been reported as the relationship to the quantum yield of gas evolution (O2 or CO2). The relation between ETR and gross photosynthesis (as oxygen evolution) has been studied in terrestrial plants (Asada, 1999; Genty et al., 1989; Krall & Edwards, 1990), microalgae (see review of Flameling & Kromkamp, 1998; Gilbert et al., 2000b; Kromkamp et al., 2008; Suggett et al., 2009) and macroalgae by using oxygen electrodes (Hanelt & Nultsch, 1995; Beer et al., 2000; Carr & Björn, 2003; Figueroa et al., 2003) and mass spectrometry (Franklin & Badger, 2001). Therefore, extrapolations of quantum yield of PSII (ΦPSII) to the absolute photosynthetic electron transport rate (ETR) depend on the specific correlation among quantum yields of oxygen evolution (ΦO2), carbon fixation (ΦCO2) and any other competing sinks for electrons.
The excess energy can be dissipated as heat, i.e., non photochemical quenching (NPQ) caused by xanthophyll cycle via heat dissipation during transport form antenna to reaction centers of PSII (RCII) and it is caused by conformational changes in PSII complex (Horton & Ruban, 2005; Lavaud & Kroth, 2006). The excess of energy can be dissipated as heat form inactivated PSII centers indicating that the first line of defense against excess of light failed.
A linear relation between ETR and CO2 exchange can be demonstrated, as in the case of C4 and C3 plants at various irradiances under non-photorespiratory conditions (Weis & Berry, 1987; Krall & Edwards, 1990). The relationship can be curvilinear at low irradiance at normal levels of O2 and CO2 when electrons flow to O2 via the photosynthetic carbon oxidation cycle and/or Mehler-ascorbate-peroxidase reaction. This reaction competes in the water cycle with carbon fixation and confounds measurements of O2 evolution (Genty et al., 1989, 1992; Asada, 1989). Linear relation between ETR and gross photosynthesis (GP) has been found until certain growth irradiances, i.e., lower than Ek with a relation of about 4-5 electrons (associated to PSII activity) per oxygen of molecule. A loss of linearity between GP-ETR is observed at high irradiances because the decrease in ΦO2 with increasing growth irradiance is much higher than that observed for ΦPSII both in microalgae (Flameling & Kromkamp, 1998) and macroalgae
Chlorophyll fluorescence and biomass productivity in microalgae 803
(Figueroa et al., 2003). This decrease in ΦO2 can be explained, in part, as a consequence of an increase in cyclic phosphorylation with respect to non-cyclic phosphorilation under high light (Dubinsky et al., 1986). In addition, under high irradiance pseudocyclic electron transport (Mehler reaction) with the transfer of electrons from the reduced ferredoxin at the donor site of PSI to oxygen instead of NADP+ occurs (Robinson, 1988). Other explanations for the non-linearity between ΦPSII and ΦO2 can be attributed to the PSII heterogeneity (Melis, 1991), the increase of photorespiration (Raven & Johnston, 1991) and the underexplored phenomena of PSII cycling (Feikema et al., 2006). Longstaff et al. (2002) found that in situ measurements of photosynthesis in U. lactuca revealed a good correlation between ETR and O2 evolution at moderate light but at higher irradiances they found higher ETR than the expected ones. Figueroa et al. (2003) suggested applying a tangential function instead of a linear function to fit the relation between ETR and GP as for a wide range of irradiances it presents a tangential function form. In any case, the number of algal species in which both variables have been simultaneously analyzed is still scarce so far (Hartig et al., 1998; Sugget et al., 2011).
Phytoplankton studies in the laboratory have been conducted mainly by using PAM fluorescence whereas in biological oceanographic studies both PAM fluorescence and Fast Repetition Rate Fluorescence had been used (Flameling & Kromkamp, 1998; Johnsen & Sakshaug, 2007; Blache et al., 2011). These devices present different characteristics according to the quality of actinic lamps (halogen, red or blue light emitted diodes), sensitivity and measuring units (cuvettes versus fiber). On the other hand, measurements of in vivo chlorophyll fluores-cence in algal mass cultures in open or closed photobioreactors are still scarce (Vonshack et al., 1994; Torzillo et al., 1996; Masojídek et al., 1999, 2011; Kromkamp et al., 2009).
In this review, several technical aspects on the use of chlorophyll fluorescence are discussed and several recommendations are presented on: (1) Measurement of light absorption. (2) optimal procedure to determine electron transport rate. (3) use of relatively new devices based on PAM fluorescence as Junior PAM (Walz GmbH, Effeltrich Germany) or Pocket PAM (Gademann Instruments, Würzburg, Germany) with optical fiber and optical head as measuring units, respectively. Data of several experiments in culture vessels or thin-layer cascades by using these devices and the comparisons with Water-PAM are presented. (4) estimation on carbon production and biomass yield of phytoplankton by transforming electron transport rates using theoretical and empirical data on number
of photons necessary to produce an oxygen molecule and the carbon assimilated/oxygen production ratio.
In order to release general advances on the use of in vivo chlorophyll fluorescence in plants, several reports and reviews on phytoplankton have been considered (Kromkamp & Forster, 2003; Suggett et al., 2011).
Light absorption Irradiance is expressed as incident energy per unit of time and area, as energy units (W m-2), but it can be also expressed as photon units (µmol photons m-2 s-1). Irradiance is the term used when a sensor with a cosine response (2π) is used as measuring unit, in contrast to 4π sensor in which the correct term is photon fluence rate (Björn et al., 1996). Incident radiance in the 400-700 nm waveband is generally considered the photosynthetic active component of total spectral irradiance [E(λ)] and it is refer to as Photosynthetic Active Radiation (PAR or EPAR). Photosynthetic irradiance is usually denoted with the symbol I, however, as I is used for radiant intensity (W sr-1), the symbol E for irradiance is recommended by the International Union of Pure and Applied Chemistry (IUPAC) (Braslavsky, 2007). Algae can use irradiance at wavelengths as low as 350 nm for photosynthesis, however, difficulties of measuring the 350-400 nm waveband and its very small contribution (~5-7%) to total irradiance (either solar or from commonly used emission sources) means this is usually ignored (Sakshaug et al., 1997). Photosyn-thetic active radiation is generally given in units of µmol quanta m-2 s-1 or µmol photons m-2 s-1. Units of µEinsteins m-2 s-1 are also used but it is incorrect since it is not included in the IUPAC for EPAR (Kirk, 1994) whereas the irradiance of UV radiation (UVR) is usually presented as energy units (W m-2). For phytoplankton cells that collect radiant energy equally for all sides, the photosynthetically active scalar irradiance, E0
PAR, measured with a spherical (4π) sensor should be used (Kirk, 1994).
In order to obtain accurate estimations of the quantum yields of electron transport through PSII (ΦPSII), oxygen evolution (ΦO2) or carbon fixation (ΦCO2), one must know the amount of EPAR that is absorbed by the studied organism. Difficulties associated with accounting for the scattering component of attenuation in optical measurements have limited the determination of absorbed irradiance as distinct from incident irradiance (Agustí et al., 1994). Conventional spectrophotometers measure transmittance (T) and/or optical density (OD):
804 Latin American Journal of Aquatic Research
OD (λ = Log10 (Eoλ /Eλ) = -log10 T (λ) (absorbance
units) (1)
where Eoλ is the incident (prior to absorption) spectral
irradiance and Eλ is the transmitted spectral irradiance. By using techniques with negligible losses due to
scattering, such as the opal glass (Shibata et al., 1954), diffusing plate and minimal sample-detector distance (Bricaud et al., 1983), or an integrating sphere method (Bricaud et al., 1983; Maske & Haardt, 1987; Fujiki & Taguchi, 2002), absorptance (A) can be calculated as follows:
A = 1-10-OD (relative units respect to one) (2) Absorptance can be converted into absorption
coefficient (a, m-1) taking into account the path-length. The absorption coefficient is expressed as an exponential function of the optical density (OD) and the path length (l, m-1) through the suspension. Rearranging the above equations, the absorption coefficient of phytoplankton, a(λ), can be calculated directly from OD as:
a (λ) = 2.303 OD l-1 (m-1) (3)
being 2.303 the transformation factor of decimal to natural logarithm (log10/loge). when expressed per mass unit of Chl-a, the Chl-a specific absorption coefficient by phytoplankton, a (λ) is:
a (λ) = a [Chl-a]-1 m-1 mg Chl-a-1 (4)
where Chl-a is the Chl-a concentration (mg m-3). The Chl-a specific absorption coefficient varies from 0.004-0.043 m2 mg Chl-a-1 (Arbones et al., 1996).
Absorption spectra measured for aquatic particles concentrated onto glass-fiber filters require a correction for the increase in path length caused by multiple scattering in the filter. Controversy of the multiple scattering corrections has been reported (Kishino et al., 1985). Kieffer & SooHoo (1982) refined the filter methods, minimizing loss of scattered light by placing the filter close to the detector and adding a correction for the increase in effective path length caused by scatter within glass-fiber filter. This path length amplification factor (β) is defined as the ratio between optical to geometrical path length (Kieffer & SooHoo, 1982). Cleveland & Weidemann (1993) in absence of wavelength dependent effect suggested a general quadratic relationship (r2 = 0.988):
ODsusp (λ) = 0.378 * ODfilter (λ) + 0.523 [ODfilter (λ)]2
(absorbance units) (5)
Other similar equation for the amplification factor has been reported by using a great number of phytoplankton species and replicates (n = 15,600; r2 =
0.95) from natural waters but taking into account the hysteresis effect, i.e., for the same ODfilter (λ), the β value varied with the wavelength (Arbones et al., 1996) as follows: ODsusp (λ) = 0.38 * ODfilter (λ) + 0.42 [ODfilter (λ)]2
(absorbance units) (6) ODfilter (λ) only differs from ODsusp (λ) in the path
length amplification factor, β. ODsusp (λ) is determined in a integrating sphere or 1 cm cuvette modified by opal glass technique (Kieffer & SooHoo, 1982) and ODfilter by filtration phytoplankton culture onto the filter.
We suggest to conduct the filter technique by using the filter placed directly against the photomultiplier tube of the spectrophotometer. Ideally, an integrating sphere should be used but this optical accessory is expensive and not always available in laboratories dedicated to microalgal production. The filter technique is extensively used in biological oceano-graphy but not in microalgal studies with production purposes. Arbones et al. (1996) reported the determination of absorption coefficient in phyto-plankton collected from the field as follows (Equation 6): cell suspension is filtered by using a vacuum water pump under low pressure on GF/F filter taking a variable volume according to the phytoplankton concentration. The filter is placed close to the photomultiplier of the spectrophotometer, attached to the hole of the photomultiplier tube. The same volume of prefiltered culture medium or seawater is filtered also through a GF/F filter and this filter is used as a blank.
Optical density of the filter is calculated as follows: ODph(λ) = [(ODp(λ) - ODp(750)] - [(ODd(λ) ODd(750)] (absorbance units) (7)
being ODph the optical density due to phytoplankton cells, ODp the optical density of the pigmented and no pigmented fraction of particulate matter and ODd the optical density of detritus. The conversion filter to suspension used is indicated in equation 6.
Then, the conversion of OD to absorption coefficient is calculated as:
a(λ) = 2.3 * ODsusp (λ) / (V * S) (m-1) (8)
being a(λ) the spectral absorption coefficient of phytoplankton (m-1), V the volume of sample filtered and S the area of the filter.
An alternative to the use of the filter technique in microalgal production due to its difficulty and costs could be the approach reported by Figueroa et al. (2009) to determine the absorptance in laminar
Chlorophyll fluorescence and biomass productivity in microalgae 805
macroalgae. This method is based on the use of a light source (high halide pressure lamp) set perpendicularly to a cosine corrected PAR sensor. Absorptance (A) is determined as A = 1 - Et/Eo, being Et/Eo the trans-mittance (T). The transmitted irradiance by the phytoplankton suspension placed on a Petri dish situated on top of the PAR sensor is Et and Eo is the incident irradiance without any sample. Transmittance of algal suspension was conducted using the necessary volume of culture in order to have a 2 mm layer of algal suspension placed in a Petri dish all covered in black adhesive band except the area of the teflon window of the PAR sensor. Reflectance (R) is not considered since it is generally less than 5-8%, except in calcareous algae (Salles et al., 1996). This procedure has been used also to determine the absorptance of phytoplankton cultures i.e., good linear relationship between absorption coefficient determined by glass-fiber filter technique and this simplified method in Chlorella fusca cultures (Jerez et al., unpublished). A summary of the absorption and in vivo chlorophyll fluorescence terminology is indicated in Table 1.
Electron transport rate The electron transport rate (ETR) is determined according to the following formula (see Kromkamp et al., 2008):
ETR = ∆F/F’m * AbQ * FII (µmol electrons m-3 s-1) (9)
The effective quantum yield, (∆F/F’m, also noted as ΦPSII or Y(II)) was calculated according to Schreiber et al. (1995b). ∆F/F’m = (F’m - Ft)/F’m, being F’m the maximal fluorescence which is induced with a saturating white light pulse (400-800 ms, approx. 9,000 µmol m-2 s-1); Ft is the current steady-state fluorescence in light adapted algae. AbQ is the absorbed quanta calculated as the product of the integration of the spectral absorption coefficient aphλ between 400 and 700 nm and spectral irradiance of the light source (Eλ). Instead of AbQ, absorbed irradiance can be expressed as EPAR*APAR, where A isthe absorptancein the PAR region of the spectra calculated as: APAR = 1 - TPAR - RPAR (Figueroa et al., 2003) being TPAR the transmittance and RPAR the reflectance both in the PAR range. In this case the absorptance is expressed as relative units (dimensionless) and thus ETR is presented as µmol electrons m-2 s-1. APAR can be also calculated in microalgae using the filter technique or following the simplified method explained above (Jerez et al., unpublished).
FII is the fraction of cellular Chl-a in PSII and it is associated to LHCII (dimensionless). Suggett et al. (2003) estimated chlorophyll-a specific light absorption
and the proportion of total light absorbed by PSII (P, dimensionless) using both biophysical (Fast Repetition Rate Fluorescence) and optical (chlorophyll-a specific light absorption coefficient, a*) techniques on cultures of phytoplankton from diverse taxa. On the other hand, Johnsen & Sakshaug (2007) determined in vivo absorption coefficients and PSII-scaled fluorescence excitation (fl-ex) spectra of high light (HL) and low light (LL) acclimated cultures of 33 phytoplankton species that belonged to 13 different pigment groups (PGs) and thus a simple approach is presented to quantify intracellular self-shading and evaluating the impact of photoacclimation on bio-optical characteristic of the different PGs examined. In addition, Johnsen & Sakshaug (2007) discussed on the parameters used in the calculation of oxygenic photosynthesis based on Pulse Amplitude Modulated (PAM) and Fast Repetition Rate (FRRF) fluorometers in contrast to Suggett et al. (2003) that discussed only on the application of FRRF. In both reports, the ratio between light available to PSII and total absorption, essential for the calculation of the oxygen release rate (using the PSII-scaled fluorescence spectrum as a proxy) was dependent on species and photoaccli-mation state. The study of Johnsen & Sakshaug (2007) presented a greater number of phytoplankton groups and light conditions in the cultures than that of Sakshaug & Johnsen (2005) i.e., three subgroups of chromophytes exhibited 70-80%, 60-80%, and 50-60% chl-a in PSII-LHCII; two subgroups of chlorophytes, 70 or 80%; and cyanobacteria, only 12%. In contrast, the mean fraction for chromo- and chlorophytes of quanta absorbed by PSII was 73% in LL and 55% in HL acclimated cells; thus, the corresponding ratios 0.55 and 0.73 might be used as correction factors adjusting for quanta absorbed by PSII for PAM and FRRF measurements. In several phytoplankton species P values were unexpectedly lower in low compared to high grown light algae in contrast to the values of AbQPSII reported by Johnsen & Sakshaug (2007) in low light grown algae. We have preference for the FII values reported by Johnsen & Sakshaug (2007) due to their possible application both for PAM and FRR fluorometers and because of the inclusion of a greater number of phytoplankton species and photoacclimation and bio-optical state.
ETR versus irradiance curves can be fitted using different functions as hyperbolic tangent without photoinhibition as Jassby & Platt (1976) and Eilers & Peters (1988) or with photoinhibition (Platt & Gallegos, 1980) and fitting-in-line model (Ritchie, 2008) to obtain ETR parameters as maximal ETR (ETRmax), irradiance for the initial saturation of ETR
806 Latin American Journal of Aquatic Research
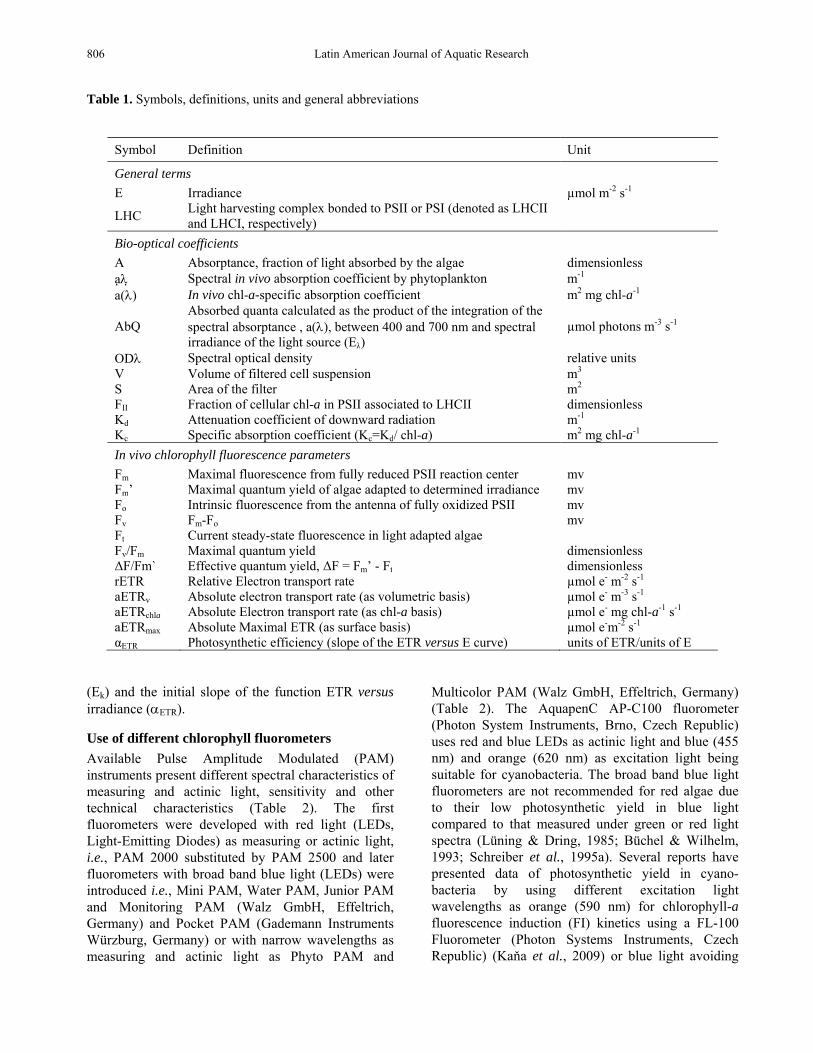
Table 1. Symbols, definitions, units and general abbreviations
Symbol Definition Unit
General terms E Irradiance µmol m-2 s-1
LHC Light harvesting complex bonded to PSII or PSI (denoted as LHCII and LHCI, respectively)
Bio-optical coefficients A Absorptance, fraction of light absorbed by the algae dimensionless aλ Spectral in vivo absorption coefficient by phytoplankton m-1 a(λ) In vivo chl-a-specific absorption coefficient m2 mg chl-a-1
AbQ Absorbed quanta calculated as the product of the integration of the spectral absorptance , a(λ), between 400 and 700 nm and spectral irradiance of the light source (Eλ)
µmol photons m-3 s-1
ODλ Spectral optical density relative units V Volume of filtered cell suspension m3 S Area of the filter m2 FII Fraction of cellular chl-a in PSII associated to LHCII dimensionless Kd Attenuation coefficient of downward radiation m-1 Kc Specific absorption coefficient (Kc=Kd/ chl-a) m2 mg chl-a-1 In vivo chlorophyll fluorescence parameters Fm Maximal fluorescence from fully reduced PSII reaction center mv Fm’ Maximal quantum yield of algae adapted to determined irradiance mv Fo Intrinsic fluorescence from the antenna of fully oxidized PSII mv Fv Fm-Fo mv Ft Current steady-state fluorescence in light adapted algae Fv/Fm Maximal quantum yield dimensionless ∆F/Fm` Effective quantum yield, ∆F = Fm’ - Ft dimensionless rETR aETRv
Relative Electron transport rate Absolute electron transport rate (as volumetric basis)
µmol e- m-2 s-1 µmol e- m-3 s-1
aETRchla Absolute Electron transport rate (as chl-a basis) µmol e- mg chl-a-1 s-1 aETRmax Absolute Maximal ETR (as surface basis) µmol e-m-2 s-1 αETR Photosynthetic efficiency (slope of the ETR versus E curve) units of ETR/units of E
(Ek) and the initial slope of the function ETR versus irradiance (αETR).
Use of different chlorophyll fluorometers Available Pulse Amplitude Modulated (PAM) instruments present different spectral characteristics of measuring and actinic light, sensitivity and other technical characteristics (Table 2). The first fluorometers were developed with red light (LEDs, Light-Emitting Diodes) as measuring or actinic light, i.e., PAM 2000 substituted by PAM 2500 and later fluorometers with broad band blue light (LEDs) were introduced i.e., Mini PAM, Water PAM, Junior PAM and Monitoring PAM (Walz GmbH, Effeltrich, Germany) and Pocket PAM (Gademann Instruments Würzburg, Germany) or with narrow wavelengths as measuring and actinic light as Phyto PAM and
Multicolor PAM (Walz GmbH, Effeltrich, Germany) (Table 2). The AquapenC AP-C100 fluorometer (Photon System Instruments, Brno, Czech Republic) uses red and blue LEDs as actinic light and blue (455 nm) and orange (620 nm) as excitation light being suitable for cyanobacteria. The broad band blue light fluorometers are not recommended for red algae due to their low photosynthetic yield in blue light compared to that measured under green or red light spectra (Lüning & Dring, 1985; Büchel & Wilhelm, 1993; Schreiber et al., 1995a). Several reports have presented data of photosynthetic yield in cyano-bacteria by using different excitation light wavelengths as orange (590 nm) for chlorophyll-a fluorescence induction (FI) kinetics using a FL-100 Fluorometer (Photon Systems Instruments, Czech Republic) (Kaňa et al., 2009) or blue light avoiding
Chlorophyll fluorescence and biomass productivity in microalgae 807
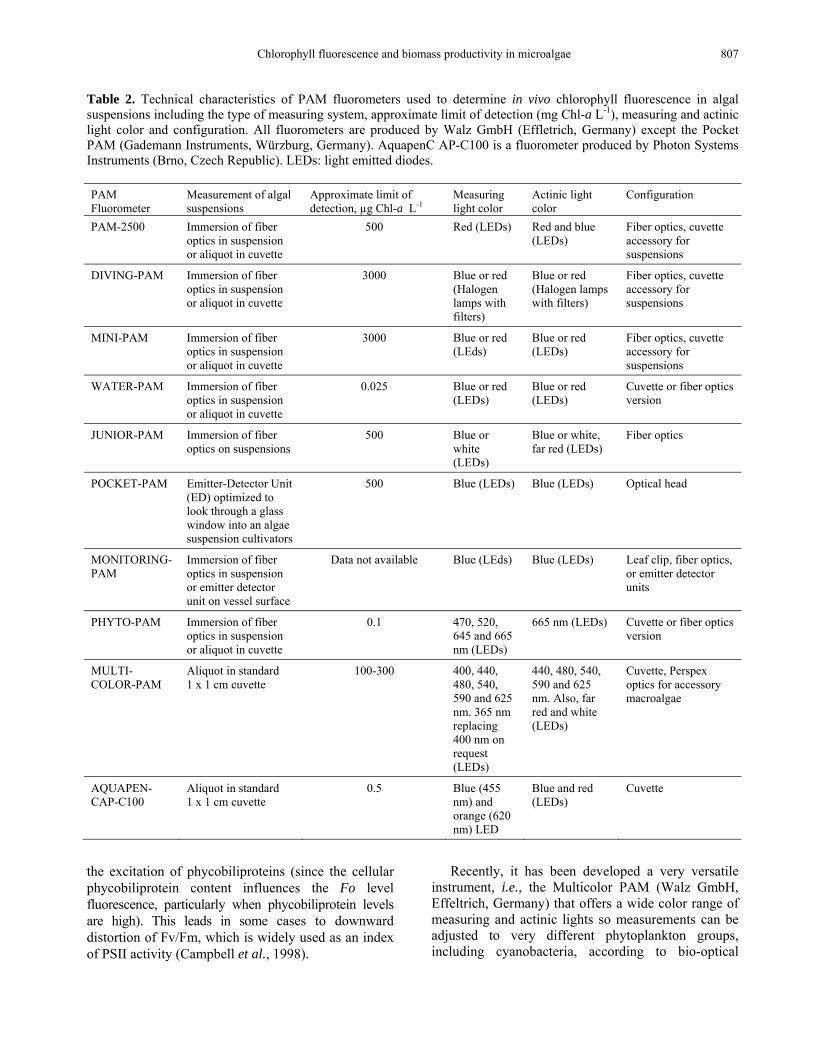
Table 2. Technical characteristics of PAM fluorometers used to determine in vivo chlorophyll fluorescence in algal suspensions including the type of measuring system, approximate limit of detection (mg Chl-a L-1), measuring and actinic light color and configuration. All fluorometers are produced by Walz GmbH (Effletrich, Germany) except the Pocket PAM (Gademann Instruments, Würzburg, Germany). AquapenC AP-C100 is a fluorometer produced by Photon Systems Instruments (Brno, Czech Republic). LEDs: light emitted diodes. PAM Fluorometer
Measurement of algal suspensions
Approximate limit of detection, µg Chl-a L-1
Measuring light color
Actinic light color
Configuration
PAM-2500 Immersion of fiber optics in suspension or aliquot in cuvette
500 Red (LEDs) Red and blue (LEDs)
Fiber optics, cuvette accessory for suspensions
DIVING-PAM Immersion of fiber optics in suspension or aliquot in cuvette
3000 Blue or red (Halogen lamps with filters)
Blue or red (Halogen lamps with filters)
Fiber optics, cuvette accessory for suspensions
MINI-PAM Immersion of fiber optics in suspension or aliquot in cuvette
3000 Blue or red (LEds)
Blue or red (LEDs)
Fiber optics, cuvette accessory for suspensions
WATER-PAM Immersion of fiber optics in suspension or aliquot in cuvette
0.025 Blue or red (LEDs)
Blue or red (LEDs)
Cuvette or fiber optics version
JUNIOR-PAM Immersion of fiber optics on suspensions
500 Blue or white (LEDs)
Blue or white, far red (LEDs)
Fiber optics
POCKET-PAM Emitter-Detector Unit (ED) optimized to look through a glass window into an algae suspension cultivators
500 Blue (LEDs) Blue (LEDs) Optical head
MONITORING-PAM
Immersion of fiber optics in suspension or emitter detector unit on vessel surface
Data not available Blue (LEds) Blue (LEDs) Leaf clip, fiber optics, or emitter detector units
PHYTO-PAM Immersion of fiber optics in suspension or aliquot in cuvette
0.1 470, 520, 645 and 665 nm (LEDs)
665 nm (LEDs) Cuvette or fiber optics version
MULTI-COLOR-PAM
Aliquot in standard 1 x 1 cm cuvette
100-300 400, 440, 480, 540, 590 and 625 nm. 365 nm replacing 400 nm on request (LEDs)
440, 480, 540, 590 and 625 nm. Also, far red and white (LEDs)
Cuvette, Perspex optics for accessory macroalgae
AQUAPEN-CAP-C100
Aliquot in standard 1 x 1 cm cuvette
0.5 Blue (455 nm) and orange (620 nm) LED
Blue and red (LEDs)
Cuvette
the excitation of phycobiliproteins (since the cellular phycobiliprotein content influences the Fo level fluorescence, particularly when phycobiliprotein levels are high). This leads in some cases to downward distortion of Fv/Fm, which is widely used as an index of PSII activity (Campbell et al., 1998).
Recently, it has been developed a very versatile instrument, i.e., the Multicolor PAM (Walz GmbH, Effeltrich, Germany) that offers a wide color range of measuring and actinic lights so measurements can be adjusted to very different phytoplankton groups, including cyanobacteria, according to bio-optical
808 Latin American Journal of Aquatic Research
characteristics including cyanobacteria. This fluoro-meter provides six colors of pulse-modulated measuring light (400, 440, 480, 540, 590 and 625 nm) and five colors of actinic light (440, 480, 540, 590, 625). In addition, it also has white (420-640 nm) and far-red (730 nm) light sources. On the other hand, the Phyto PAM allows discriminating between differently pigmented groups of algae (green algae, diatoms and cyanobacteria) by exciting the fluorescence alterna-tingly at high repetition rates by µsec pulses of 470, 520, 645 and 665 nm light originating from light emitting diodes (LED). Finally, the photosynthetic yield of the different phytoplankton groups mixed in the sample can be distinguished according to models of excitation and emission fluorescence spectra.
In this study, photosynthetic yield determined in different experimental sets by using two low cost:quality fluorometers as Junior PAM and Pocket PAM were compared to the data measured by the Water PAM in the same samples.
Pocket PAM to analyze the photosynthetic activity in Chlorella sp. growing in lecheate of urban sewage and the comparison with Water PAM (fiber configuration) In vivo chlorophyll fluorescence is a good approach to evaluate the effect of toxic substances or effluents on photosynthetic activity or physiological status of phytoplankton (Shelly et al., 2011). The measurement can be conducted directly in the experimental chamber by introducing the standard optical fiber of several PAMs, as Diving PAM or Mini PAM, but also by taking samples and measuring chlorophyll fluores-cence of cell suspension in cuvettes, as Water PAM (Büchel & Wilhelm, 1993; Figueroa et al., 1997; Kromkamp et al., 2008).
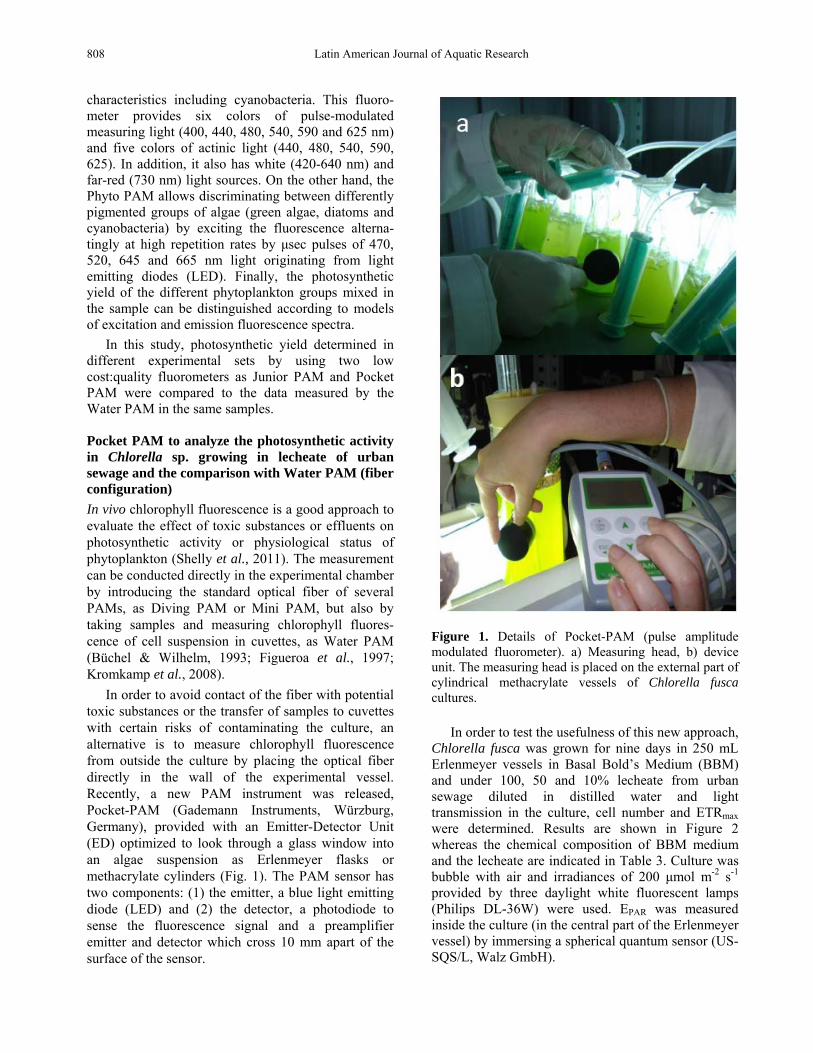
In order to avoid contact of the fiber with potential toxic substances or the transfer of samples to cuvettes with certain risks of contaminating the culture, an alternative is to measure chlorophyll fluorescence from outside the culture by placing the optical fiber directly in the wall of the experimental vessel. Recently, a new PAM instrument was released, Pocket-PAM (Gademann Instruments, Würzburg, Germany), provided with an Emitter-Detector Unit (ED) optimized to look through a glass window into an algae suspension as Erlenmeyer flasks or methacrylate cylinders (Fig. 1). The PAM sensor has two components: (1) the emitter, a blue light emitting diode (LED) and (2) the detector, a photodiode to sense the fluorescence signal and a preamplifier emitter and detector which cross 10 mm apart of the surface of the sensor.
Figure 1. Details of Pocket-PAM (pulse amplitude modulated fluorometer). a) Measuring head, b) device unit. The measuring head is placed on the external part of cylindrical methacrylate vessels of Chlorella fusca cultures.
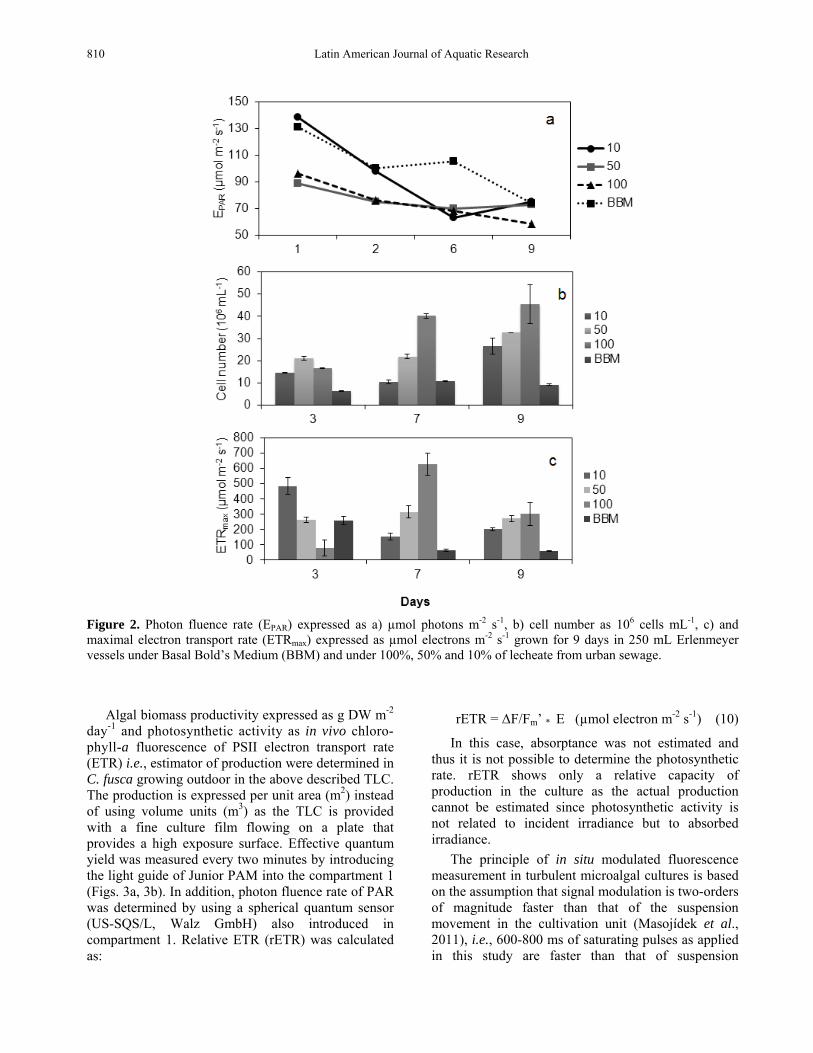
In order to test the usefulness of this new approach, Chlorella fusca was grown for nine days in 250 mL Erlenmeyer vessels in Basal Bold’s Medium (BBM) and under 100, 50 and 10% lecheate from urban sewage diluted in distilled water and light transmission in the culture, cell number and ETRmax were determined. Results are shown in Figure 2 whereas the chemical composition of BBM medium and the lecheate are indicated in Table 3. Culture was bubble with air and irradiances of 200 µmol m-2 s-1 provided by three daylight white fluorescent lamps (Philips DL-36W) were used. EPAR was measured inside the culture (in the central part of the Erlenmeyer vessel) by immersing a spherical quantum sensor (US-SQS/L, Walz GmbH).
Chlorophyll fluorescence and biomass productivity in microalgae 809
Culture samples were taken once each day (3rd, 7th and 9th) in order to determine absorption by using the absorptance technique as explained previously, i.e., absorptance determination of a cell suspension (2 mm layer) in the PAR range λ = 400-700 nm) using a cosine corrected PAR sensor.
Photon fluence rate (EPAR) in the culture decreased (Fig. 2a) as a consequence of the increase in cell densities throughout the time (Fig. 2b). The EPAR in the first two days of experiment was lower in 100% and 50% lecheate compared to 10% lecheate and BBM culture medium (Fig. 2a). This can be explained due to the absorption of light by dissolved substances present in the lecheate, what affects the turbidity of the medium. After three days, cell number was higher in lecheate treatments than in BBM. EPAR diminished after 7 days culture in lecheate because of the increase in cell density (Fig. 2b), however, in BBM, EPAR remained high after 7 days. This can be related to the low cell density and turbidity associated to BBM treatment. The lowest EPAR is reached after 9 days in 100% lecheate culture that is also the treatment with the highest cell number (about 45 million cells mL-1). The increase of the cell number throughout the time was higher under lecheate treatment than that in BBM (Fig. 2b). ETR presented similar pattern as cell number in the 7th and 9th days of culture (Figs. 2b, 2c) but not in the 3th day. ETR increased from the 3rd to the 7th day as well as the number of cells. However, ETR decreased in spite of the increase in cell number in day 9. A possible uncoupling between growth and photosynthesis, i.e., increase in the division rate without any raise of photosynthetic activity per cell could explain this result. In order to evaluate the uncoupling between growth and photosynthetic rate, the expression of growth as biomass, i.e., g DW per volume is suggested to be better than number of cells (Tredici, 2010). However, in this case it was not possible to determine g DW per volume as the sampling volume used in the experiment was too small. The positive effect of the lecheate of urban sewage on the growth of Chlorella fusca could be explained by the efficient use of the ammonium, at high concentration in lecheate medium (Table 2).
In order to assess the quality of the data obtained with the Pocket PAM fluorometer, in vivo chlorophyll fluorescence was also measured by another and more commonly used fluorometer, Water PAM (emitter-detector unit of fiber version, Water EDF). The fiber of the Water PAM (red light version) was located in the wall of the vessels, the same as for the Pocket PAM. The correlation index of the effective quantum yield by using Pocket PAM versus Water PAM was significant (r = 0.88, P < 0.01) being the values about
7.5% higher by using Water PAM compared to Pocket PAM. No significant differences (P > 0.01) were found in the effective quantum yield determined either by using the fiber version of Water PAM (unit EDF) located in the wall of the vessels or by measuring the cell suspension using a cuvette (Water ED measuring unit). Thus, possible artifacts by scattering or reabsorption of fluorescence seem not to be significant.
Junior PAM to monitor chlorophyll fluorescence in a thin-layer cascade (TLC) Junior PAM is a small PAM fluorometer (Walz GmbH, Effeltrich, Germany) with a good price-performance ratio. Modulated fluorescence excitation is produced by blue LED (maximum wavelength emission: 465 nm) under two modulation frequencies (5 and 100 Hz). Actinic light is provided by the same power LED as for modulated light. Saturating pulses are produced by the same power LED as for modulated light being the maximum photon fluence rate 10,000 µmol m-2 s-1 at 1 mm distance from the tip of the guide. The light guide is made of plastic fiber and it has 40 cm x 1.5 mm (length x diameter).
In this study, Junior PAM is used online to estimate photosynthetic activity of algae growing outdoor in a thin-layer cascade (TLC). Open systems, such as TLC, present several advantages compared to closed systems such as their higher efficiency in light absorption and operating higher biomass densities (Masojídek et al., 2011).
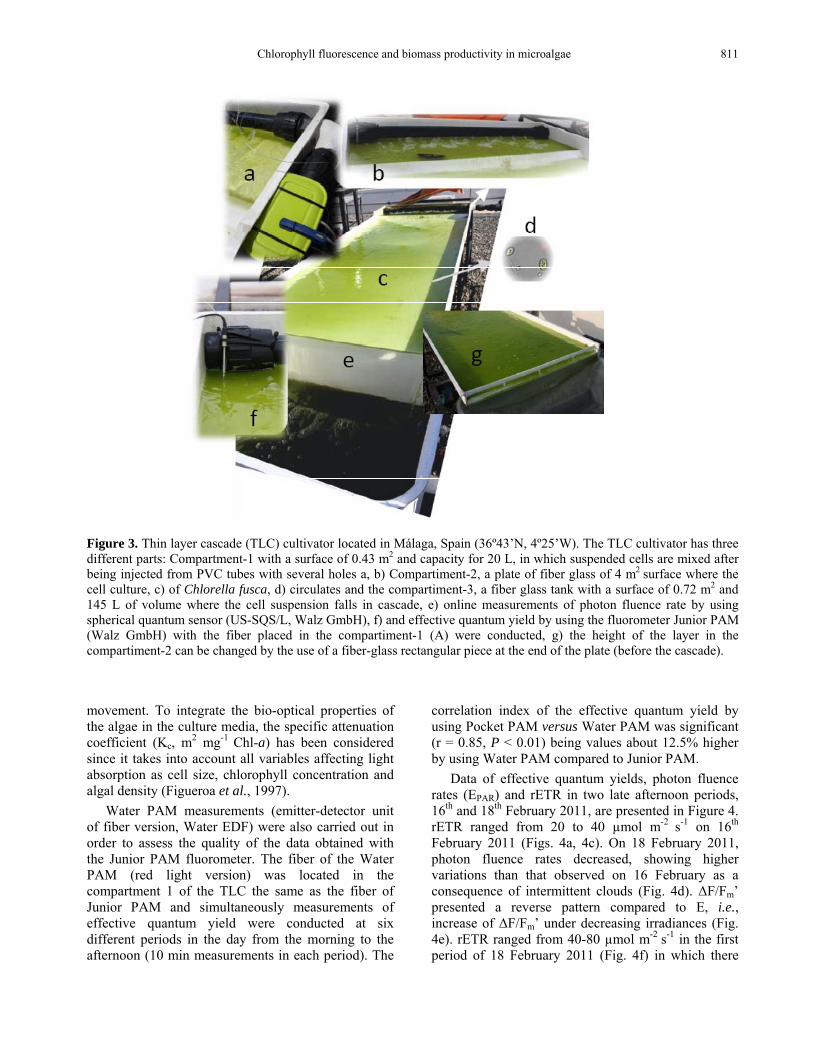
C. fusca was grown TLC cultivators with an exposure surface of 4 m2 and S/V of 27 m-1 (Table 4). The TLC located in Málaga, Spain (36º43’N, 4º25’W) has three different parts: (1) a compartment with a surface of 0.43 m2 and capacity for 20 L, where suspended cells are mixed after being injected from PVC tubes with several holes (Figs. 3a, 3b, 3f); (2) a thin-layer cascade on a plate of fiber glass of 4 m2 where cell culture circulates through (Figs. 3c, 3g) and (3) a fiber glass tank with a surface of 0.72 m2 and 145 L capacity into where cell suspension falls in cascade (Figs. 3c, 3e). The height of the layer in the thin compartment (2) can be changed by locating a fiber-glass rectangular piece at the end of the plate (before the cascade). Cells were pumped from the tank (compartment 3) through PVC tubes back again to compartment 1 (Fig. 3).
Algae were cultivated in 850 mg L-1 NaNO3, 120 mg L-1 MgSO4 and 540 mg L-1 KH2PO4. Micro-nutrients were added (60 µL L-1) using a commercial mixture (Welgro Hydroponic, Comercial Química Massó, Spain).
810 Latin American Journal of Aquatic Research
Figure 2. Photon fluence rate (EPAR) expressed as a) µmol photons m-2 s-1, b) cell number as 106 cells mL-1, c) and maximal electron transport rate (ETRmax) expressed as µmol electrons m-2 s-1 grown for 9 days in 250 mL Erlenmeyer vessels under Basal Bold’s Medium (BBM) and under 100%, 50% and 10% of lecheate from urban sewage.
Algal biomass productivity expressed as g DW m-2 day-1 and photosynthetic activity as in vivo chloro-phyll-a fluorescence of PSII electron transport rate (ETR) i.e., estimator of production were determined in C. fusca growing outdoor in the above described TLC. The production is expressed per unit area (m2) instead of using volume units (m3) as the TLC is provided with a fine culture film flowing on a plate that provides a high exposure surface. Effective quantum yield was measured every two minutes by introducing the light guide of Junior PAM into the compartment 1 (Figs. 3a, 3b). In addition, photon fluence rate of PAR was determined by using a spherical quantum sensor (US-SQS/L, Walz GmbH) also introduced in compartment 1. Relative ETR (rETR) was calculated as:
rETR = ∆F/Fm’ * E (µmol electron m-2 s-1) (10)
In this case, absorptance was not estimated and thus it is not possible to determine the photosynthetic rate. rETR shows only a relative capacity of production in the culture as the actual production cannot be estimated since photosynthetic activity is not related to incident irradiance but to absorbed irradiance.
The principle of in situ modulated fluorescence measurement in turbulent microalgal cultures is based on the assumption that signal modulation is two-orders of magnitude faster than that of the suspension movement in the cultivation unit (Masojídek et al., 2011), i.e., 600-800 ms of saturating pulses as applied in this study are faster than that of suspension
Chlorophyll fluorescence and biomass productivity in microalgae 811
Figure 3. Thin layer cascade (TLC) cultivator located in Málaga, Spain (36º43’N, 4º25’W). The TLC cultivator has three different parts: Compartment-1 with a surface of 0.43 m2 and capacity for 20 L, in which suspended cells are mixed after being injected from PVC tubes with several holes a, b) Compartiment-2, a plate of fiber glass of 4 m2 surface where the cell culture, c) of Chlorella fusca, d) circulates and the compartiment-3, a fiber glass tank with a surface of 0.72 m2 and 145 L of volume where the cell suspension falls in cascade, e) online measurements of photon fluence rate by using spherical quantum sensor (US-SQS/L, Walz GmbH), f) and effective quantum yield by using the fluorometer Junior PAM (Walz GmbH) with the fiber placed in the compartiment-1 (A) were conducted, g) the height of the layer in the compartiment-2 can be changed by the use of a fiber-glass rectangular piece at the end of the plate (before the cascade). movement. To integrate the bio-optical properties of the algae in the culture media, the specific attenuation coefficient (Kc, m2 mg-1 Chl-a) has been considered since it takes into account all variables affecting light absorption as cell size, chlorophyll concentration and algal density (Figueroa et al., 1997).
Water PAM measurements (emitter-detector unit of fiber version, Water EDF) were also carried out in order to assess the quality of the data obtained with the Junior PAM fluorometer. The fiber of the Water PAM (red light version) was located in the compartment 1 of the TLC the same as the fiber of Junior PAM and simultaneously measurements of effective quantum yield were conducted at six different periods in the day from the morning to the afternoon (10 min measurements in each period). The
correlation index of the effective quantum yield by using Pocket PAM versus Water PAM was significant (r = 0.85, P < 0.01) being values about 12.5% higher by using Water PAM compared to Junior PAM.
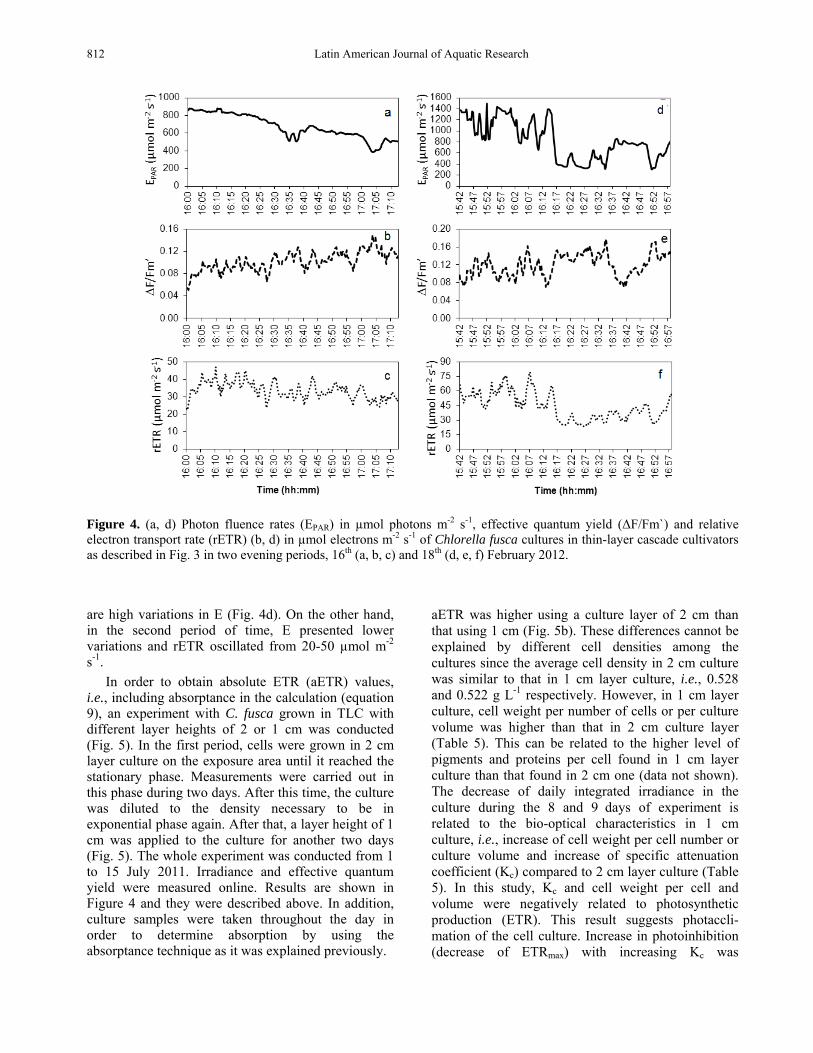
Data of effective quantum yields, photon fluence rates (EPAR) and rETR in two late afternoon periods, 16th and 18th February 2011, are presented in Figure 4. rETR ranged from 20 to 40 µmol m-2 s-1 on 16th February 2011 (Figs. 4a, 4c). On 18 February 2011, photon fluence rates decreased, showing higher variations than that observed on 16 February as a consequence of intermittent clouds (Fig. 4d). ∆F/Fm’ presented a reverse pattern compared to E, i.e., increase of ∆F/Fm’ under decreasing irradiances (Fig. 4e). rETR ranged from 40-80 µmol m-2 s-1 in the first period of 18 February 2011 (Fig. 4f) in which there
812 Latin American Journal of Aquatic Research
Figure 4. (a, d) Photon fluence rates (EPAR) in µmol photons m-2 s-1, effective quantum yield (∆F/Fm`) and relative electron transport rate (rETR) (b, d) in µmol electrons m-2 s-1 of Chlorella fusca cultures in thin-layer cascade cultivators as described in Fig. 3 in two evening periods, 16th (a, b, c) and 18th (d, e, f) February 2012. are high variations in E (Fig. 4d). On the other hand, in the second period of time, E presented lower variations and rETR oscillated from 20-50 µmol m-2
s-1. In order to obtain absolute ETR (aETR) values,
i.e., including absorptance in the calculation (equation 9), an experiment with C. fusca grown in TLC with different layer heights of 2 or 1 cm was conducted (Fig. 5). In the first period, cells were grown in 2 cm layer culture on the exposure area until it reached the stationary phase. Measurements were carried out in this phase during two days. After this time, the culture was diluted to the density necessary to be in exponential phase again. After that, a layer height of 1 cm was applied to the culture for another two days (Fig. 5). The whole experiment was conducted from 1 to 15 July 2011. Irradiance and effective quantum yield were measured online. Results are shown in Figure 4 and they were described above. In addition, culture samples were taken throughout the day in order to determine absorption by using the absorptance technique as it was explained previously.
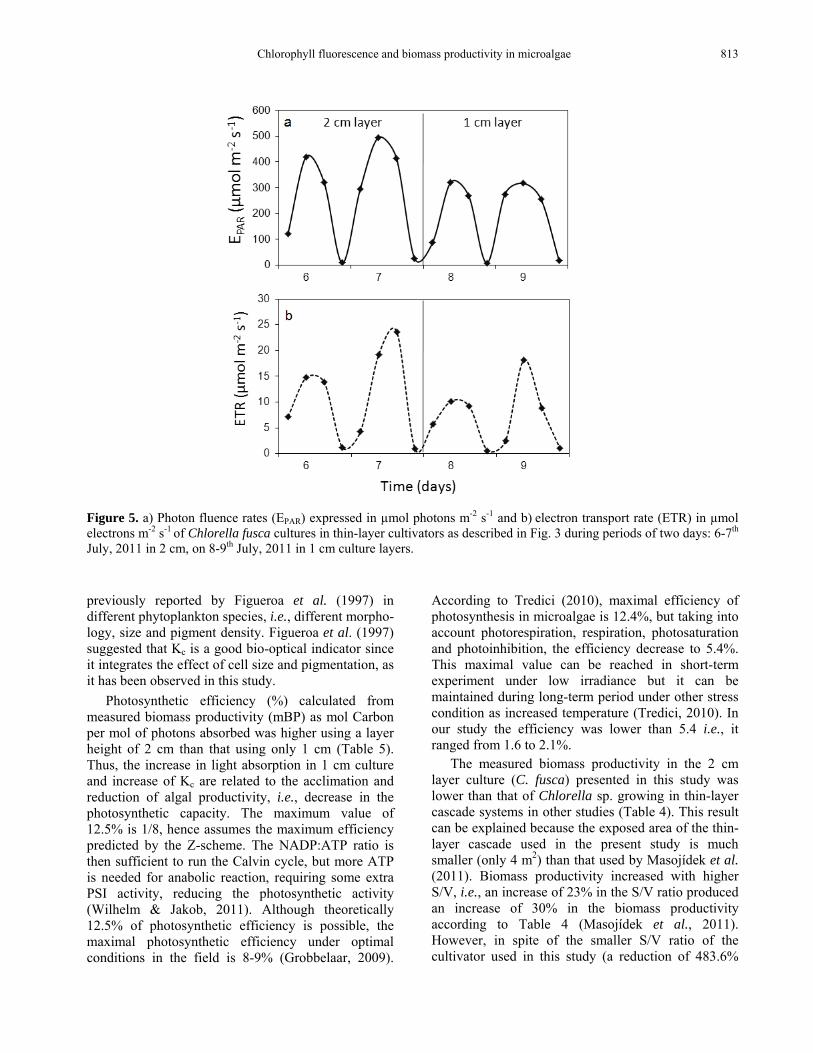
aETR was higher using a culture layer of 2 cm than that using 1 cm (Fig. 5b). These differences cannot be explained by different cell densities among the cultures since the average cell density in 2 cm culture was similar to that in 1 cm layer culture, i.e., 0.528 and 0.522 g L-1 respectively. However, in 1 cm layer culture, cell weight per number of cells or per culture volume was higher than that in 2 cm culture layer (Table 5). This can be related to the higher level of pigments and proteins per cell found in 1 cm layer culture than that found in 2 cm one (data not shown). The decrease of daily integrated irradiance in the culture during the 8 and 9 days of experiment is related to the bio-optical characteristics in 1 cm culture, i.e., increase of cell weight per cell number or culture volume and increase of specific attenuation coefficient (Kc) compared to 2 cm layer culture (Table 5). In this study, Kc and cell weight per cell and volume were negatively related to photosynthetic production (ETR). This result suggests photaccli-mation of the cell culture. Increase in photoinhibition (decrease of ETRmax) with increasing Kc was
Chlorophyll fluorescence and biomass productivity in microalgae 813
Figure 5. a) Photon fluence rates (EPAR) expressed in µmol photons m-2 s-1 and b) electron transport rate (ETR) in µmol electrons m-2 s-1 of Chlorella fusca cultures in thin-layer cultivators as described in Fig. 3 during periods of two days: 6-7th July, 2011 in 2 cm, on 8-9th July, 2011 in 1 cm culture layers. previously reported by Figueroa et al. (1997) in different phytoplankton species, i.e., different morpho-logy, size and pigment density. Figueroa et al. (1997) suggested that Kc is a good bio-optical indicator since it integrates the effect of cell size and pigmentation, as it has been observed in this study.
Photosynthetic efficiency (%) calculated from measured biomass productivity (mBP) as mol Carbon per mol of photons absorbed was higher using a layer height of 2 cm than that using only 1 cm (Table 5). Thus, the increase in light absorption in 1 cm culture and increase of Kc are related to the acclimation and reduction of algal productivity, i.e., decrease in the photosynthetic capacity. The maximum value of 12.5% is 1/8, hence assumes the maximum efficiency predicted by the Z-scheme. The NADP:ATP ratio is then sufficient to run the Calvin cycle, but more ATP is needed for anabolic reaction, requiring some extra PSI activity, reducing the photosynthetic activity (Wilhelm & Jakob, 2011). Although theoretically 12.5% of photosynthetic efficiency is possible, the maximal photosynthetic efficiency under optimal conditions in the field is 8-9% (Grobbelaar, 2009).
According to Tredici (2010), maximal efficiency of photosynthesis in microalgae is 12.4%, but taking into account photorespiration, respiration, photosaturation and photoinhibition, the efficiency decrease to 5.4%. This maximal value can be reached in short-term experiment under low irradiance but it can be maintained during long-term period under other stress condition as increased temperature (Tredici, 2010). In our study the efficiency was lower than 5.4 i.e., it ranged from 1.6 to 2.1%.
The measured biomass productivity in the 2 cm layer culture (C. fusca) presented in this study was lower than that of Chlorella sp. growing in thin-layer cascade systems in other studies (Table 4). This result can be explained because the exposed area of the thin-layer cascade used in the present study is much smaller (only 4 m2) than that used by Masojídek et al. (2011). Biomass productivity increased with higher S/V, i.e., an increase of 23% in the S/V ratio produced an increase of 30% in the biomass productivity according to Table 4 (Masojídek et al., 2011). However, in spite of the smaller S/V ratio of the cultivator used in this study (a reduction of 483.6%
814 Latin American Journal of Aquatic Research
compared to the 133 m-1 S/V ratio cultivator used by Masojídek et al. (2011), only 36.9% of reduction in the biomass productivity was observed (Table 4). The huge differences among the physical variables measured in both sites could explain this result. The daily integrated irradiance in Málaga in the algal culture (at 0.3 cm depth) in July was 9704-11685 kJ m-2 and 6094-7306 kJ m-2 in the algal culture (0.3 cm depth) of Třeboň (Southern Czech Republic) in summer time (Masojídek et al., 2011) (Table 4). In addition, the range of temperature inside the water was 20-34oC (Table 4), higher that that reported by Masojídek et al. (2011). A more productive strain, in the case of this study, under high irradiance and temperature (Table 3) compared to the Chlorella sp. used by Masojídek et al. (2011) is not excluded.
Estimation of carbon production by using chlorophyll fluorescence
ETR can be converted to oxygen evolution rates assuming that four (the theoretical minimum), or five electrons (the measured minimum), equivalent to 10 absorbed photons by both PSII and PSI (Ley & Mauzerall, 1982) are needed to produce one oxygen molecule. ΦO2 is the electron yield for oxygen (the number of charge separations in both PSII and PSI needed to produce an oxygen molecule). Although the theoretical value of ΦO2 is 0.2-0.25, most of the authors report 0.1 as a more reasonable value, i.e., there are 10 absorbed photons needed to produce one oxygen molecule (Williams & Robertson, 1991; Kromkamp et al., 2008). On the other hand, the oxygen production can be converted into carbon Table 3. Chemical composition of Basal Bold’s Medium (BBM) and lecheate of urban sewages.
Chemical characteristics BBM Lecheate Ammonium (mg L-1) - 98 Nitrate (mg L -1) 547.12 12.4 Nitrite (mg L -1) - - Phosphate (mg l-1) 153.23 303.4 Sulfates (mg L -1) 29.23 133.8 Chloride (mg L -1) 15.17 402.7 Fluorides (mg L -1) - - Sodium (mg L -1) 212.62 292 Potasium (mg L -1) 75.96 91.8 Calcium (mg L -1) 353.60 1.3 Magnesium (mg L -1) 7.39 0.02 Manganese (mg L -1) - - Conductivity (µS cm -1) - 1.5 pH 7.2 6.3 DBO5 (mg L -1) - >500
assimilation taking into account the values of the photosynthetic quotient (PQ) as reported by Kromkamp & Forster (2003). Thus, C assimilation can be estimated from ETR as follows: Carbon assimilation rate = FPSII*AbQ*FII*FO2*PQ-1 (µmol C m-2 s-1) (11)
The unit of carbon assimilation rate is expressed in terms of surface (m2) instead of volume (m3) since the productivity in thin layer cascade is better expressed in terms of area than that in volume. In this study, the considered value of ΦO2 was 0.1 (i.e., there are 10 absorbed photons needed to produce one oxygen molecule). The PQ value used was 1.4 since nitrate was the main nitrogen source in the culture (Williams & Robertson, 1991). PQ should be 1.1 mol O2 / mol CO2 in medium with ammonium as main inorganic nitrogen source since it is necessary a lower number of electrons to assimilate it than that under nitrate supply (Williams & Robertson, 1991).
The photosynthetic carbon production (Pc, µmol C m-2 day-1) of C. fusca cultures in TLC cultivators (Fig. 3) was converted into biomass productivity expressed as g DW m-2 day-1 using the total internal carbon content after its determination (n = 3) by combustion in an elemental analyzer (CNHS LECO-932, Michigan, USA). The average internal content of C in C. fusca was 40.5 ± 3.8 mg per g DW of biomass. The estimated biomass productivity (eBP) was higher in 2 cm layer culture than that under 1 cm (Table 5) as occurred with the measured biomass productivity (mBP). eBP was about 8% lower in 2 cm layer culture than the mBP whereas in 1 cm layer culture, eBP was 25.8% higher than the mBP. Thus, in 1 cm layer culture, the difference between measured and estimated values was much higher than that in 2 cm layer culture .The reason of this discrepancy cannot be explained but it could be related to the bio-optical variation in 1 cm layer culture, i.e., the increase of cell weight per number of cells and volume. Interestingly, Kc is higher in 1 cm layer culture and it has been previously shown that an increase of Kc in phytoplankton (different species, chlorophyll content and cells sizes) was related to an increase in photoinhibition (Figueroa et al., 1997). The discrepancy between measured and estimated algal productivity can be explained by assuming that the electron requirement for O2 production/C fixation is overestimated and they differ between 1 and 2 cm culture layer. Using the values of ΦO2 and PQ reported by Williams & Robertson (1991) and Kromkamp et al. (2008), an overestimation of the measured rate of C-fixation was found. However, Kromkamp et al. (2008) reported that the degree of
Chlorophyll fluorescence and biomass productivity in microalgae 815
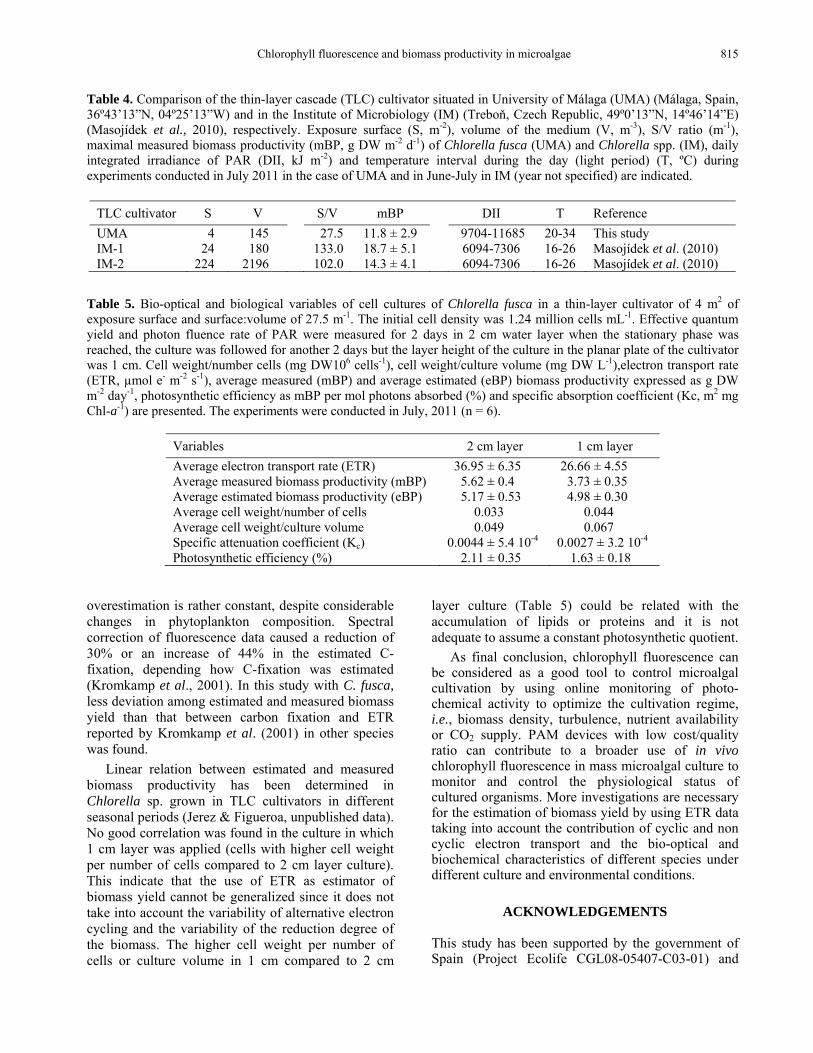
Table 4. Comparison of the thin-layer cascade (TLC) cultivator situated in University of Málaga (UMA) (Málaga, Spain, 36º43’13”N, 04º25’13”W) and in the Institute of Microbiology (IM) (Treboň, Czech Republic, 49º0’13”N, 14º46’14”E) (Masojídek et al., 2010), respectively. Exposure surface (S, m-2), volume of the medium (V, m-3), S/V ratio (m-1), maximal measured biomass productivity (mBP, g DW m-2 d-1) of Chlorella fusca (UMA) and Chlorella spp. (IM), daily integrated irradiance of PAR (DII, kJ m-2) and temperature interval during the day (light period) (T, ºC) during experiments conducted in July 2011 in the case of UMA and in June-July in IM (year not specified) are indicated.
TLC cultivator S V S/V mBP DII T Reference UMA 4 145 27.5 11.8 ± 2.9 9704-11685 20-34 This study IM-1 24 180 133.0 18.7 ± 5.1 6094-7306 16-26 Masojídek et al. (2010) IM-2 224 2196 102.0 14.3 ± 4.1 6094-7306 16-26 Masojídek et al. (2010)
Table 5. Bio-optical and biological variables of cell cultures of Chlorella fusca in a thin-layer cultivator of 4 m2 of exposure surface and surface:volume of 27.5 m-1. The initial cell density was 1.24 million cells mL-1. Effective quantum yield and photon fluence rate of PAR were measured for 2 days in 2 cm water layer when the stationary phase was reached, the culture was followed for another 2 days but the layer height of the culture in the planar plate of the cultivator was 1 cm. Cell weight/number cells (mg DW106 cells-1), cell weight/culture volume (mg DW L-1),electron transport rate (ETR, µmol e- m-2 s-1), average measured (mBP) and average estimated (eBP) biomass productivity expressed as g DW m-2 day-1, photosynthetic efficiency as mBP per mol photons absorbed (%) and specific absorption coefficient (Kc, m2 mg Chl-a-1) are presented. The experiments were conducted in July, 2011 (n = 6).
Variables 2 cm layer 1 cm layer Average electron transport rate (ETR) 36.95 ± 6.35 26.66 ± 4.55 Average measured biomass productivity (mBP) 5.62 ± 0.4 3.73 ± 0.35 Average estimated biomass productivity (eBP) 5.17 ± 0.53 4.98 ± 0.30 Average cell weight/number of cells 0.033 0.044 Average cell weight/culture volume 0.049 0.067 Specific attenuation coefficient (Kc) 0.0044 ± 5.4 10-4 0.0027 ± 3.2 10-4
Photosynthetic efficiency (%) 2.11 ± 0.35 1.63 ± 0.18
overestimation is rather constant, despite considerable changes in phytoplankton composition. Spectral correction of fluorescence data caused a reduction of 30% or an increase of 44% in the estimated C-fixation, depending how C-fixation was estimated (Kromkamp et al., 2001). In this study with C. fusca, less deviation among estimated and measured biomass yield than that between carbon fixation and ETR reported by Kromkamp et al. (2001) in other species was found.
Linear relation between estimated and measured biomass productivity has been determined in Chlorella sp. grown in TLC cultivators in different seasonal periods (Jerez & Figueroa, unpublished data). No good correlation was found in the culture in which 1 cm layer was applied (cells with higher cell weight per number of cells compared to 2 cm layer culture). This indicate that the use of ETR as estimator of biomass yield cannot be generalized since it does not take into account the variability of alternative electron cycling and the variability of the reduction degree of the biomass. The higher cell weight per number of cells or culture volume in 1 cm compared to 2 cm
layer culture (Table 5) could be related with the accumulation of lipids or proteins and it is not adequate to assume a constant photosynthetic quotient.
As final conclusion, chlorophyll fluorescence can be considered as a good tool to control microalgal cultivation by using online monitoring of photo-chemical activity to optimize the cultivation regime, i.e., biomass density, turbulence, nutrient availability or CO2 supply. PAM devices with low cost/quality ratio can contribute to a broader use of in vivo chlorophyll fluorescence in mass microalgal culture to monitor and control the physiological status of cultured organisms. More investigations are necessary for the estimation of biomass yield by using ETR data taking into account the contribution of cyclic and non cyclic electron transport and the bio-optical and biochemical characteristics of different species under different culture and environmental conditions.
ACKNOWLEDGEMENTS
This study has been supported by the government of Spain (Project Ecolife CGL08-05407-C03-01) and
816 Latin American Journal of Aquatic Research
Junta de Andalucía (research group Photobiology and Biotechnology of Aquatic Organisms, RNM-295). The publication has been financed by Complementary Action of the Ministry of Economy and Competence of Spain (CTM2011-15659E). CGJ thanks the FPU Grant of the Ministry of Education. The technical assistance of David López of the Unit of Photobiology of Málaga University, Ruxandra Stanescu from University of Brasov (Romania) and Dr. Rosa Pérez is thankful. The supply of lecheate from urban sewage by EMASA Company is also thankful.
REFERENCES
Agustí, S., S. Enríquez, H. Frostchristensen, K. Sandjensen & C.M. Duarte. 1994. Light-harvesting among photosynthetic organisms. Funct. Ecol., 8: 273-279.
Arbones, B., F.G. Figueiras & M. Zapata. 1996. Determi-nation of phytoplankton absorption coefficient in natural seawater samples: evidence of a unique equation to correct the pathlength amplification on glass-fiber filters. Mar. Ecol. Prog. Ser., 304: 293-304.
Asada, K. 1999. The water-water cycle in chloroplasts: scavenging of active oxygen and dissipation of excess photons. Ann. Rev. Plant Physiol. Plant Molec. Biol., 50: 601-639.
Babin, M. 2008. Phytoplankton fluorescence: theory, current literature and in situ measurement. In: M. Babin, C.S. Roesler & J.J. Cullen (eds.). Real-time coastal observing systems for marine ecosystem dynamics and harmful algal blooms. UNESCO Publishing, Paris, pp. 237-280.
Baker, N.R. & K. Oxborough. 2004. Chlorophyll fluorescence as a probe of photosynthetic productivity. In: G.C. Papageorgiou, G. Govindjee (eds.). Chlorophyll-a fluorescence: a signature of photosyn-thesis. Springer, Netherlands, pp. 65-82.
Beer, S., C. Larsson, O. Poryan & L. Axelsson. 2000. Photosynthetic rates of Ulva (Chlorophyta) measured by pulse amplitude modulated (PAM) fluorometry. Eur. J. Phycol., 35: 69-74.
Björn, L.O., A. Cunningham, Z. Dubinsky, M. Estrada, F.L. Figueroa, F.N. García-Pichel, D.-P. Häder, D. Hanelt, G. Levavasseur & K. Lüning. 1996. Underwater light measurement and light absorption by algae. Sci. Mar., 60(Supl. 1): 291-295.
Blache, U., T. Jakob, W. Su & C. Wilhelm. 2011. The impact of cell-specific absorption properties on the correlation of electron transport rates measured by chlorophyll fluorescence and photosynthetic oxygen
production in planktonic algae. Plant Physiol. Bioch., 49: 801-808.
Braslavsky, S.E. 2007. Glossary of terms used in photochemistry. Pure Appl. Chem., 79: 293-465.
Bricaud, A., A. Morel & L. Prieur. 1983. Optical effi-ciency factors of some phytoplankters. Limnol. Oceanogr., 28: 816-832.
Büchel, C. & C. Wilhelm. 1993. In-vivo analysis of slow chlorophyll fluorescence induction kinetics in algae - progress, problems and perspectives. Photochem. Photobio., 58: 137-148.
Campbell, D., V. Hurry, A.K. Clarke, P. Gustafsson & G. Boquist. 1998. Chlorophyll fluorescence analysis of cyanobacteria photosynthesis and acclimation. Microbiol. Mol. Biol. R., 62(3): 1092-2172.
Carr, H. & M. Bjork. 2003. A methodological compa-rison of photosynthetic oxygen evolution and estimated electron transport rate in tropical Ulva (Chlorophyceae) species under different light and inorganic carbon conditions. J. Phycol., 39: 1125-1131.
Cleveland, J.S. & A.D. Weidemann. 1993. Quantifying absorption by aquatic particles -a multiple-scattering correction for glass-fiber filters. Limnol. Oceanogr., 38: 1321-1327.
Dubinsky, Z., P.G. Falkowski & K. Wyman. 1986. Light harvesting and utilization by phytoplankton. Plant Cell Physiol., 27: 1335-1349.
Eilers, P.H.C. & J.H.C. Peters. 1988. A model for the relationship between light intensity and the rate of photosynthesis in phytoplankton. Ecol. Model., 42: 199-215.
Feikema, W.O., M.A. Marosvolgyi, J. Lavaud & H.J. van Gorkom. 2006. Cyclic electron transfer in photo-system II in the marine diatom Phaeodactylum tricornutum. BBA-Bioenergetics, 1757(7): 829-834.
Figueroa, F.L., R. Conde-Álvarez & I. Gómez. 2003. Relations between electron transport rates determined by pulse amplitude modulated chlorophyll fluorescence and oxygen evolution in macroalgae under different light conditions. Photosynth. Res., 75: 259-275.
Figueroa, F.L., J. Mercado, C. Jiménez, S. Salles, J. Aguilera, M.P. Sánchez-Saavedra, M. Lebert, D.-P. Häder, O. Montero & L. Lubián. 1997. Relationship between bio-optical characteristics and photoinhibition of phytoplankton. Aquat. Bot., 59: 237-251.
Figueroa, F.L., B. Martínez, A. Israel, A. Neori, E.J. Malta, P. Ang, S. Inken, R. Marquardt, T. Rachamim, U. Arazi, S. Frenk & N. Korbee. 2009. Acclimation of red sea macroalgae to solar radiation: photosynthesis and thallus absorptance. Aquat. Biol., 7: 159-172.
Chlorophyll fluorescence and biomass productivity in microalgae 817
Flameling, I.A. & J. Kromkamp. 1998. Light dependence of quantum yields for PSII charge separation and oxygen evolution in eukaryotic algae. Limnol. Oceanogr., 43: 284-297.
Franklin, L.A. & M.R. Badger. 2001. A comparison of photosynthetic electron transport rates in macroalgae measured by pulse amplitude modulated chlorophyll fluorometry and mass spectrometry. J. Phycol., 37: 756-767.
Fujiki, T. & S. Taguch. 2002. Variability in chlorophyll alpha specific absorption coefficient in marine phytoplankton as a function of cell size and irradiance. J. Plankton Res., 24: 859-874.
Genty, B., J.M. Briantais & N.R. Baker. 1989. The relationship between the quantum yield of photo-synthetic electron-transport and quenching of chlorophyll fluorescence. Biochim. Biophys. Acta, 990: 87-92.
Genty, B., Y. Goulas, B. Dimon, G. Peltier, J.M. Briantais & I. Moy. 1992. Modulation of efficiency of primary conversion in leaves. Photosynth. Res., 34: 106-106.
Gilbert, M., C. Wilhelm & M. Richter. 2000b. Bio-optical modelling of oxygen evolution using in vivo fluorescence: comparison of measured and calculated photosynthesis/irradiance (P-E) curves in four representative phytoplankton species. J. Plant Physiol., 157: 307-314.
Grobbelaar, J.U. 2009. Upper limits of photosynthetic productivity and problems of scaling. J. Appl. Phycol., 21: 519-522.
Hanelt, D. 1992. Photoinhibition of photosynthesis in marine macrophytes of the south China sea. Mar. Ecol. Prog. Ser., 82: 199-206.
Hanelt, D. & W. Nultsch. 1995. Field studies of photoinhibition show non-correlations between oxygen and fluorescence measurements in the arctic red-alga Palmaria palmata. J. Plant Physiol., 145: 31-38.
Hartig, P., K. Wolfstein, S. Lippemeier & F. Colijn. 1998. Photosynthetic activity of natural microphy-tobenthos populations measured by fluorescence (PAM) and 14C tracer methods: a comparison. Mar. Ecol. Prog. Ser., 166: 53-62.
Horton, P. & A. Ruban. 2005. Molecular design of the photosystem II light-harvesting antenna: photosyn-thesis and photoprotection. J. Exp. Bot., 56(411): 365-373.
Jassby, A.D. & T. Platt. 1976. Mathematical formulation of relationship between photosynthesis and light for phytoplankton. Limnol. Oceanogr., 21: 540-547.
Johnsen, G. & E. Sakshaug. 2007. Bio-optical charac-teristics of PSII and PSI in 33 species (13 pigment groups) of marine phytoplankton, and the relevance
for pulse-amplitude-modulated and fast-repetition-rate fluorometry. J. Phycol., 43: 1236-1251.
Kaňa, R., O. Prášil, O. Komárek, G. Papageorgiou & C. Govindjee. 2009. Spectral characteristic of fluorescence induction in a model cyanobacterium, Synechococcus (PCC 7942). Biochim. Biophys. Acta, 1787(2009) 1170-1178.
Kieffer, D.A. & J.B. SooHoo. 1982. Spectral absorption by marine particles of coastal waters of Baja California. Limnol. Oceanogr., 27: 492-499.
Kirk, J.T.O. 1994. Light and photosynthesis in aquatic ecosystems. Cambridge University Press, Cambridge, 509 pp.
Kishino, M., M. Takahashi, N. Okami & S. Ichimura. 1985. Estimation of the spectral absorption-coefficients of phytoplankton in the sea. Bull. Mar. Sci., 37: 634-642.
Korbee, N., P. Carrillo, M. Mata, S. Rosillo, J.M. Medina-Sánchez & F.L. Figueroa. 2012. Effects of ultraviolet radiation and nutrients on the structure-function of research phytoplankton in a high mountain lake. Photochem. Photobiol. Sci., 11: 1087-1098.
Krall, J.P. & G.E. Edwards. 1990. Quantum yields of photosystem-II electron-transport and carbondioxide fixation in C4-plants. Aust. J. Plant Phyosiol., 17: 579-588.
Kromkamp, J.C. & R.M. Forster. 2003. The use of variable fluorescence measurements in aquatic ecosystems: differences between multiple and single turnover measuring protocols and suggested terminology. Eur. J. Phycol., 38: 103-112.
Kromkamp, J.C., N.A. Dijkman, J. Peene, S.G.H. Simis & H.J. Gons. 2008. Estimating phytoplank-ton primary production in lake Ijsselmeer (The Netherlands) using variable fluorescence (PAM-FRRF) and C-uptake techniques. Eur. J. Phycol., 43: 327-344.
Kromkamp, J.C., A. Domin, Z. Dubinsky, C. Lehmann & F. Schanz. 2001. Changes in photosynthetic properties measured by oxygen evolution and variable chlorophyll fluorescence in a simulated entrainment experiment with the cyanobacterium Planktothrix rubescens. Aquat. Sci., 63: 363-382.
Kromkamp, J.C., J. Beardall, A. Sukenik, J. Kopecký, J. Masojídek, S.van Bergeijk, S. Gabai, E., Shaham & A. Yamshon. 2009. Short-term variations in photosynthetic parameters of Nannochloropsis cultures grown in two types of outdoor mass cultivation systems. Aquat. Microb. Ecol., 56(2-3): 309-322.
Lavaud, J. & P.G. Kroth. 2006. In diatoms, the transthylakoid proton gradient regulates the photo-protective non-photochemical fluorescence quen-
818 Latin American Journal of Aquatic Research
ching beyond its control on the xanthophyll cycle. Plant Cell Physiol., 47(7): 1010-1016.
Ley, A.C. & D.C. Mauzerall. 1982. Absolute absorption cross-sections for photosystem-II and the minimum quantum requirement for photosynthesis in Chlorella vulgaris. Biochim. Biophys. Acta, 680: 95-106.
Longstaff, B.J., T. Kildea, J.W. Runcie, A. Cheshire, W.C. Dennison, C. Hurd, T. Kana, J.A. Raven & A.W.D. Larkum. 2002. An in situ study of photosynthetic oxygen exchange and electron transport rate in the marine macroalga Ulva lactuca (Chlorophyta). Photosynth. Res., 74: 281-293.
Lüning, K. & M.J. Dring. 1985. Action spectra and spectral quantum yield of photosynthesis in marine macroalgae with thin and thick thalli. Mar. Biol., 87: 119-129.
MacIntyre, H.L., T.M. Kana, T. Anning & R.J. Geider 2002. Photoacclimation of photosynthesis irradiance response curves and photosynthetic pigments in microalgae and cyanobacteria. J. Phycol., 38: 17-38.
Maske, H. & H. Haardt. 1987. Quantitative in vivo absorption spectra of phytoplankton: detrital absorption and comparison with fluorescence excitation spectra. Limnol. Oceanogr., 32: 620-633.
Masojídek, J., A. Vonshak & G. Torzillo. 2011. Chlorophyll fluorescence application in microalgal mass cultures. In: D.J. Suggett, O. Prásil & M. Borowitzka (eds.). Chlorophyll-a fluorescence in aquatic sciences: methods and applications. Springer, Heidelberg-Verlag, pp. 277-292.
Masojídek, J., G. Torzillo, M. Koblizek, J. Kopecky, P. Bernardini, A. Sacchi & J. Komenda.1999. Photoa-daptation of two members of the Chlorophyta (Scenedesmus and Chlorella) in laboratory and outdoor cultures: changes in chlorophyll fluorescence quenching and the xanthophyll cycle. Planta, 209: 126-135.
Melis, A. 1991. Dynamics of photosynthetic membrane-composition and function. Biochim. Biophys. Acta, 1058: 87-106.
Platt, T. & C. Gallegos. 1980. Modelling primary production. Brookhaven Symp. Biol., 31: 339-362.
Raven, J.A. & A.M. Johnston. 1991. Mechanisms of inorganic-carbon acquisition in marine-phytoplankton and their implications for the use of other resources. Limnol. Oceanogr., 36: 1701-1714.
Ritchie, R.J. 2008. Fitting light saturation curves measured using modulated fluorometry. Photosynth. Res., 96: 201-215.
Robinson, J.M. 1988. Does O2 photoreduction occur within chloroplasts in vivo? Physiologia Plantarum, 72: 666-680.
Sakshaug, E. & G. Johnsen, 2005. Absorption, fluores-cence excitation and photoacclimation in phyto-
plankton. In: S. Rao (ed.). Algal cultures, analogues of blooms and applications. Science Press Publications, Enfield, New Hampshire, pp. 687-714.
Sakshaug, E., A. Bricaud, Y. Dandonneau, P.G. Falkowski, D.A. Kiefer, L. Legendre, A. Morel, J. Parslow & M. Takahashi. 1997. Parameters of photosynthesis: definitions, theory and interpretation of results. J. Plankton Res., 19: 1637-1670.
Salles, S., J. Aguilera & F.L. Figueroa. 1996. Light field in algal canopies: changes in spectral light ratios and growth of Porphyra leucosticta Thur In Le Jol. Sci. Mar., 60: 29-38.
Schreiber, U., U. Schliwa & W. Bilger. 1986. Continuous recording of photochemical and non photochemical chlorophyll fluorescence quenching with a new type of modulation fluorometer. Photosynth. Res., 10: 51-62.
Schreiber, U., T. Endo, H.L. Mi & K. Asada. 1995a. Quenching analysis of chlorophyll fluorescence by the saturation pulse method-particular aspects relating to the study of eukaryotic algae and cyanobacteria. Plant Cell Physiol., 36: 873-882.
Schreiber, U., H. Hormann, C. Neubauer & C. Klughammer. 1995b. Assessment of photosystem-II photochemical quantum yield by chlorophyll fluorescence quenching analysis. Aust. J. Plant Physiol., 22: 209-220.
Shelly, K., D. Holland & J. Beardall. 2011. Assessing nutrient status of microalgae using chlorophyll-a fluorescence. In: D.J. Suggett, O. Prášil & M.A. Borowitzka (eds.). Chlorophyll-a fluorescence in aquatic sciences: methods and applications. Springer-Verlag, Heidelberg, pp. 223-235.
Shibata, K., A.A. Benson & M. Calvin. 1954. The absorption spectra of suspensions of living micro-organisms. Biochim. Biophys. Acta, 15: 461-470.
Suggett, D.J, H.L. MacIntyre & R.J. Geider. 2004. Evaluation of biophysical and optical determinations of light absorption by photosystem II in phyto-plankton. Limnol. Oceanogr. Methods, 2: 316-332.
Suggett, D.J., O. Prášil & M.A. Borowitzka. 2011. Chlorophyll-a fluorescence in aquatic sciences: methods and applications. Springer-Verlag, Heidelberg, 323 pp.
Suggett, D.J., H.L. MacIntyre, T.M. Kana & R.J. Geider. 2009. Comparing electron transport with gas exchange: parameterising exchange rates between alternative photosynthetic currencies for eukaryotic phytoplankton. Aquat. Microb. Ecol., 56: 147-162.
Suggett, D.J., K. Oxborough, N.R. Baker, H.L. MacIntyre, T.M. Kana & R.J. Geider. 2003. Fast repetition rate and pulse amplitude modulation
Chlorophyll fluorescence and biomass productivity in microalgae 819
chlorophyll-a fluorescence measurements for assessment of photosynthetic electron transport in marine phytoplankton. Eur. J. Phycol., 38: 371-384.
Torzillo, G., P. Accolla, E. Pinzani & J. Masojíidek. 1996. In situ monitoring of chlorophyll fluorescence to assess the synergistic effect of low temperature and high irradiance stresses in Spirulina cultures grown outdoors in photobioreactors. J. Appl. Phycol., 8: 283-291.
Tredici, M.R. 2010. Photobiology of microalgae mass cultures: understanding the tools for the next green revolution. Biofuels, 1: 143-162.
Vonshack, A., G. Torzillo & L. Tomaseli. 1994. Use of chlorophyll fluorescence to estimate the effect of photoinhibition in outdoor cultures of Spirulina platensis. J. Appl. Phycol., 6: 31-34.
Received: 21 January 2013; Accepted: 22 August 2013
Weis, E. & J.A. Berry. 1987. Quantum efficiency of photosystem-II in relation to energy-dependent quenching of chlorophyll fluorescence. Biochim. Biophys. Acta, 894: 198-208.
Wilhelm, C. & T. Jakob. 2011. From photons to biomass and biofuels: evaluation of different strategies for the improvement of algal biotechnology based on comparative energy balances. Appl. Microbiol. Biotechnol., 92: 909-919.
Wilhelm, C., A. Becker, A.Vieler, & R. Rautenberger. 2004. Photophysiology and primary production of phytoplankton in freshwater. Physiol. Plant., 120: 47-357.
Williams, P.J.I. & J.E. Robertson. 1991. Overall planktonic oxygen and carbon dioxide metabolisms: the problem of reconciling observations and calculations of photosynthetic quotients. J. Plankton Res., 13: 153-169.